Some Aspects of the Ecology of Listeria monocytogenes in Salmonid Aquaculture by Suwunna Tienungoon M.Sc. Mahidol University, THAILAND Submitted in fulfilment of the requirements for the degree of Doctor of Philosophy University of Tasmania, /If. ... ,___'- /A 1· J (' ,.., ' 'rJ' ' \ I) I o>..{l'-e :A ..j Hobart, AUSTRALIA December, 1998

Welcome message from author
This document is posted to help you gain knowledge. Please leave a comment to let me know what you think about it! Share it to your friends and learn new things together.
Transcript
Some Aspects of the Ecology of
Listeria monocytogenes
in Salmonid Aquaculture
by
Suwunna Tienungoon
M.Sc. Mahidol University, THAILAND
Submitted in fulfilment of the requirements for the degree of
Doctor of Philosophy
University of Tasmania, /If. ... ,___'- /A 1· J (' ,.., ' 'rJ' ' \ I) I o>..{l'-e :A ..j bZ.~..t.-c< Hobart, AUSTRALIA
December, 1998

DECLARATION
I declare that this thesis contains no material which has been accepted for the award of
any other degree or diploma in any tertiary institution and, to the best of my knowledge
and belief, contains no material previously published or written by another person,
except where due reference is made in the text of the thesis.
Q. Suwunna Tienungoon
31 December 1998
This thesis may be made available for loan and limited copying in accordance with the
Copyright Act J 968.
Suwunna Tienungoon
31 December 1998
lll
ABSTRACT
In this thesis, several related aspects of the ecology of Listeria spp. especially L. mono
cytogenes in aquatic environments and foods were studied.
The ecology of the organisms in aquatic habitats was investigated in North West Bay,
southern Tasmania, over a 12 month period. Listeria spp. most frequently occurred in
effluent and river water but less often in receiving estuarine waters. Sediments and
shellfish served as a better reservoir for the organisms. Recent rainfall and the level of
faecal coliforms and E. coli were the most significant variables (P :s: 0.01) related to the
presence/absence of Listeria species and L. monocytogenes in estuarine wateL
Secondly, the relationship between the occurrence of the human pathogenic species, L.
monocytogenes, in aquatic environments and in a nearby salmon processing plant and its
products was studied. Molecular· subtyping methods (multilocus enzyme electrophoresis
and repetitive sequence element-PCR) were employed to help trace the distribution of L. (
monocytogenes strains. A high diversity of L. monocytogenes was found in the aquatic
environment but only a small group was detected in fish and the fish processing
environment.
Thirdly, to be able to understand the physiology and growth response of L. mono
cytogenes to temperature, water activity, pH, and lactic acid and which in tum may be
used to minimise the consequences of contamination by the pathogen of foods,
quantitative microbiology (predictive microbiology) studies were conducted. The results
were incorporated into 2 different types of mathematical model. The first type of model,
a kinetic model, was developed using a "sqm;tre root type model 11 which is useful for
predicting the shelf-life of foods. The second type of model, a probability model (a so
called "growth/ no growth interface" model) which is a novel model for L. mono
cytogenes growth limits was developed using a new approach, viz 11 generalised nonlinear
regression method 11• This type of model is useful for predicting the condition when
micro-organisms, especially pathogenic bacteria, might grow or might not grow.
Finally, model predictions were evaluated by comparing them to novel and literature data
broadly relevant, to the range of conditions in foods for which the models were
developed. Limited tests, involving direct addition of different levels of lactic acid onto
traditional cold-smoked salmon products were performed as an approach to non-thermal
inhibition or inactivation of L. monocytogenes and also to test the performance of the
models.

IV
ACKNOWLEDGMENTS
I would like to gratefully acknowledge the generosity and contributions of all who
supported me during this project and, in particular:
Dr. Tom Ross, my supervisor, for his knowledge, patience and guidance in getting me
through the process of making a _'thesis';
Prof. Tom McMeekin and Dr. June Olley, for their great support, constructive criticism
and enthusiasm to help at all times;
Dr. Christian Garland, my former supervisor, for his continued support and for, together
with Kanokkam Chansomritkul and Nugul Intrasungkhla, making the 1-year field trip
possible;
Dr. David Ratkowsky, for sharing his statistical knowledge to create the "models" and for
always providing great support;
Sharee McCammon, Michelle Williams, and Dr. John Bowman for practical help and
sharing their expertise in molecular biology work;
Food Safety Solutions and Peter Sutherland for sharing his knowledge and facilities
which made the MEE work possible.
Kingborough council, Mark Brinkman, Aquatas and Dr. Rodolfo Quintana, Tassa!, Dr.
Pheroze Jungalwalla and Dr. Trevor Dix for providing the oportunity to work in their
processing plant. Special thanks to Ros Skinner for her great support;
AusAID, The School of Geography and Environmental Studies, and The School of
Agricultural Science, University of Tasma~ia, for providing the opportunity, and the staff
members especially, Sally Jones, Jane Bailey, Bill Peterson, Lynne Dow, Laura
Maddock, Darren Bradford, and Adam Smolenski for the hard work and continual
support, and Jenny Kettlewell, for her technical assistance;
The Food Microbiology Group, ACAM people, my Thai friends and fellow students for
providing a very friendly environment to work in;
and finally my family whose unconditional love, endless support and encouragement was
invaluable throughout the years.
v
CONTENTS
ABSTRACT iii
ACKNOWLEDGMENTS iv
CONTENTS v
ABBREVIATIONS xi
1 INTRODUCTION AND LITERATURE REVIEW 1
1.1 INTRODUCTION 1
1.2 HISTORY OF THE GENUS LISTERIA 1
1.2.l THE GENUS LISTERIA AND RELATED ORGANISMS 1
1.3 CHARACTERISTICS, ISOLATION AND DIFFERENTIATION 3
1.3.1 CHARACTERISTICS 3
1.3.2 ISOLATION 5
1.3.2.1 Conventional methods 5
1.3.2. 2 Rapid detection metlwds 7
1.3.3 DIFFERENTIATION 8
1.3.3.i Species typing methods 8
1.3 .3 .2 Intraspecies typing methods 10
1.4 OCCURRENCE OF LISTERIA IN NATURAL ENVIRONMENTS 13
1.4.1 PLANT AND SOIL 13
1.4.2 ANIMAL FEED (SILAGE) 14
1.4.3 WASTE PRODUCTS 16
1.4.4 WATER AND SEDIMENT 18
1.5 OCCURRENCE OF LISTERIA 1-N FOOD 19
1.5.1 DAIRY PRODUCTS 19
1.5.2 MEAT PRODUCTS 21
1.5.3 FRUITS AND VEGETABLES PRODUCTS 22
2
1.5.4 SEAFOOD PRODUCTS
1.6 OUTBREAKS OF LISTERIOSIS
1.6.1 THE CYCLE OF L. MONOCYTOGENES INFECTION
1.6.2 INFECTIVE DOSE AND INCUBATION PERIOD
1.6.3 OUTBREAKS OF LISTERIOSIS IN HUMANS
1.6.4 OUTBREAKS OF LISTERIOSIS IN ANIMALS
1.7 CONTROL AND PREVENTION OF HUMAN FOODBORNE
LISTERIOSIS
1.7.l FARM
1. 7. 2 PROCESSING
1.7.3 RErAIL
1. 7.4 -CONSUMERS
THE OCCURRENCE OF LISTERIA SPP. INCLUDING L. MONO-
CYTOGENESIN NORTH WEST BAY
2.1 INTRODUCTION
2.2 MATERIALS AND METHODS
2.2.1 MATERIALS
2.2.2 METHODS
2.2.2.1 Sampling strategy and site descriptions
2.2.2.2 Sampling program
2.2.2.3 Methods for detection and identification of Listeria, faecal
coliforms and E. coli
2.2.3 METHOD FOR MULTILOCUS ENZYME ELECTROPHOSIS (MEE)
2.2.3.J Genetic relationships
2.2.4 STATISTICAL ANALYSES
2.3 RESULTS AND DISCUSSION
2.3.1 SENSITIVITY OF LISTERIA DETECTION METHOD (VALIDATED RECOVERY)
2.3.2 THE O::clJRRENCE OF LISTERIA, FAECAL COLIFORMS AND E. COLL
BY TYPE OF SAMPLES
vi
23
25
25
26
27
29
31
31
32
33
33
35
35
36
36
36
36
39
41
44
45
45
46
46
47
2. 3. 2 .1 River water and sediment (sites 8 and 9)
2.3.2.2 Effluent (sites 10to12)
2 .3. 2 .3 Inshore marine water and sediment (sites 1 to 7)
2.3.2.4 Shellfish (sites 3, 5 and 6b)
2.3.3 0ccuRRENCEOF LISTERIA IN NORTH WEST BAY AS A SYSTEM
2.3.4 GENERALDISCUSSION
3 THE OCCURRENCE OF LISTERIA SPP. INCLUDING L. MONO
CYTOGENESIN A FISH PROCESSING FACTORY
3.1 INTRODUCTION
3 .1.1 L. MONOCITOGENES AND Cow-SMOKED SALMON
3 .1.1.1 L. monocytogenes in cold-smoked salmon
3.1.1.2 L. monocytogenes in cold-smoked salmon processing
factory and related environments
3 .1.2 REP-PCR
3.2 MATERIALS AND :METHODS
3.3
3.4
3.2.1 MATERIALS
3. 2. 2 METHODS
3.2.2.1 Sample collection
3.2.2.2 Microbiological analysis
3.2.3 SUBTYPING METHOD: REP-PCR (REPETITIVE SEQUENCE ELEMENT
POLYMERASE CHAIN REACTION)
3.2.3.1 Isolates
3.2.3.2 Preparation of DNA
3.2.3.3 rep-primers and rep-PCR amplification conditions
3.2.3.4 Analysis of rep-PCR products
RESULTS
DISCUSSION
4 PREDICTIVE MICROBIOLOGY AND KINETIC MODEL FOR
Vil
47
53
56
60
62
68
70
70
72
73
75
76
77
77
77
77
79
80
80
80
81
81
82
84
LISTERIA MONOCYTOGENES 89
4.1 INTRODUCTION 89
4.1.1 PREDICTIVEMICROBIOLOGY 91
Vlll
4.1.1.1 Primary models 92 4.1.1.2 Secondary models 95
4.1.1.3 Model validation 98
4.1.1.4 Tertiary models 98
4.1.1.5 Application of predictive modelling-- 99
4.1.1.6 Existing predictive models 99
4.1.2 LACTICAao 100
4.1.2.1 Mechanism of action 100
4.2 MATERIALS AND METHODS 102
4.2.l MATERIALS 102 . '~
4.2.2 GENERAL METHODS 102
4.2.2.1 Culture preparation 102
4.2.2.2 Inoculation procedures 102 ~
4.2.2.3 Assessment of growth 103
4.2.2.4 Calculation of generation times for kinetic modelling 103
4.2.2.5 Analysis of growth responses to pH and organic acid 104
4.2.3 KINEfIC MODELLING 106
4.2.3.1 Determination of the effect of temperature on growth rate 106
4.2.3.2 Determination of the effect of water activity, pH, and
lactic acid on growth rate 107
4.2.3.3 Determination of the effect of pH and lactic acid on
growth rate 107
4.2.3.4 Model generation 108
4.3 'RESULTS' 108
4.3.1 TEMPERATURE RESPONSE 113
4.3.2 WATERACTIVITY-PH-LAcrrcAaoRESPONSE 114
4.3.3 PH RESPONSE 119
4.4 DISCUSSION 128
4.4.1 TEMPERATURE RESPONSE 129
4.4.2 WATER ACTIVITY-PH-LAcrrcAao RESPONSE 130
4.4.3 PH RESPONSE 132
4.4.4 CELL YIELD-GROWTH RATE RESPONSE OF L. MONOCYTOGENES TO THE
ENVIRONMENTAL FACTORS 136
4.4.5 INTER-S1RAIN VARIABILITY
5 GROWTH LIMITS OF LISTERIA MONOCYTOGENES
5.1 INTRODUCTION
5.2 MATERIALS AND :METHODS
5.2.1 MATERIALS
5.2.2 METHODS
5.2.2.1 Inoculationprocedures
5.2.2.2 Assessment of growth
5.2.3 PROBABILITY MODELLING
5 .2. 3 .1 Determination of effect of temperature, pH and
IX
139
140
140
141
141
141
141
141
142
concentration of lactic acid on growth limits 143
5.2.3.2 Determination of effect of water activity, pH, and
concentration of lactic acid on growth limits 143
5.2.3.3 Determination of effect of lactic acid concentrations-pH
and temperature on growth limits 143
5.2.3.4 Model generation 144
5.3 RESULTS 144
5.3.1 TEMPERATURE-PH-LACTIC ACID REsPONSE 147
5.3;2 WATERACTIVITY-PH-LACTICAaoRESPONSE 153
5.3.3 LACTicAao-PH RESPONSE 160
5.4 DISCUSSibN 163
5.4.1 TEMPERATURE-PH-LACTIC ACID REsPONSE 166
5.4.2 WATER.Acr1vITY-PH-LAcr1cAaoREsP0NsE 169
5.4.3 LAcr1cAao-PH RESPONSE 171
5.4.4 INTER-S1RAINVARIABILITY 172
6 MODELS VALIDATION 173
6.1 INTRODUCTION 173
6.2 MATERIALSANDMETHODS 174
6.2.1 MATERIALS 174
x
6.2.2 METHODS FOR VALIDATION OFKINErICMODELS 174
6.2.2.1 Validation using results from challenge tests on cold-
smoked salmon 174
6.2.2.2 Validation using Datafrom literature 176
6. 2. 2 .3 Indices of bias and accuracy 177
6. 2.3 METHODS FOR VALIDATION OF PROBABILITY MODELS 177
6.3 RESULTS 178
6.3.1 VALIDATIONOFKINEfICMODELS 178
6.3.2 VALIDATIONOFPROBABILITYMODELS 187
6.4 DISCUSSION 191
6.4.1 VALIDATIONOFKINEfICMODELS 192
6.4.2 VALIDATION OF PROBABILITY MODELS 195
7 SUMMARY AND CONCLUSIONS 198
REFERENCES 201
APPENDICES 230
A GENERAL MATERIALS AND METHODS 230
B MULTILOCUS ENZYME ELECTROPHORESIS 244
C RESULTS OF THE OCCURRENCE OF LISTERIA SPP. IN
NORTH WEST BAY 254
D RECORDED RAINFALL 267
E LOGISTIC ANALYSIS FOR NORTH WEST BAY 268
F CALIBRATION AND VALIDATION OF ECOMETRIC
TECH~IQUE 276
G DATA SETS USED FOR MODELS GENERATION 278
\
Xl
LIST OF ABBREVIATIONS
ACM
ATCC
~
BHIA BHIB
BOX
CAMP·
cfu
[D]
Dmin
DNA dNTP
E.coli EDTA ERIC
ET FB GT HBA L. innocua L. ivanovii L. monocytogenes L. murrayi L. seeligeri L. welshimeri [LAC]
LLO LTB MCP MEE
l'v1LSA MR OXF
PCR
pH1
Australian Collection of Microorganisms American Type Culture Collection water activity notional minimum water activity for growth
Brain Heart Infusion Agar
Brain Heart Infusion Broth the 154 bp interspersed repetitive DNA sequence from Streptococcus pneumoniae Christie, R., N. E. Atkins, and E. Munch-Petersen
'' , Colony Forming Unit
concentration of dissociated lactic acid notional minimum concentration of dissociated lac~ic acid for growth
inhibition
Deoxyribo Nucleic Acid
deoxyribonucleos!de triphosphate Escherichia coli Et~ylenediaminetetra acetic acid Enterobacterial Repetitive lntergenic Consensus
Electrophoretic Type
Fraser Broth Generation Time columbia blood agar with 4% horse blood added
Listeria innocua Listeria ivanovii Listeria monocytogenes Listeria murrayi including the former L. grayi Listeria seeligeri Listeria welshimeri concentration of lactic acid Listeriolysin 0
Laury! Tryptose Broth
minimum convex polyhedron Multilocus Enzyme Electrophoresis Membrane Lauryl Sulphate Agar Methyl Red Listeria selective medium; Listeria selective agar base to which is added Listeria Selective Supplement SR 140 (Oxford Formulation),
Polymerase Chain Reaction pH at inoculation (of a broth culture)
I
pHr
PHmid pHmin pKa
k .Jr R. equi rep-PCR
REP RTE
S. aureus SDS
S. faecalis
t
~T
%T
Taq
Tmax
Tmin TSA
TSA-YE
TSB
TSB-YE TSI
TVC
[UD]
Umin
UVMI
VP
final pH (of a broth culture)
pH at midpoint of exponential growth
notional minimum pH for growth dissociation constant for acid
growth rate (defined as 1/generation time in hr)
square root of growth rate
Rhodococcus equi repetitive sequence element PCR
Repetitive Extragenic Palindrome
ready-to-eat foods
Staphylococcus aureus
Sodium Dodecyl Sulphate
Streptococcus faecalis
Temperature
difference of %Tat time 0 and %Tat time t
percent transmittance
DNA polymerase enzyme extracted from Thermus species notional maximum temperature for growth
notional minimum temperature for growth
Tryptic Soy Agar , Tryptic Soy Agar with 0.6% Yeast Extract
Tryptic Soy Broth
· Tryptic Soy Broth with 0.6% Yeast Extract
Triple Sugar Iron agar
total viable counts
Concentration of undissociated lactic acid
Xll
notional minimum concentration of undissociated lactic acid for
growth inhibition
University of Vermont Listeria Enrichment broth
Voges-Proskauer
1
1 INTRODUCTION AND LITERATURE REVIEW
Cl INTRODUCTION
During the past 15 years, Listeria monocytogenes has emerged as a bacterium of
considerable public health significance. Several recent epidemics in North America,
Europe and Western Australia were linked to the consumption of ~mmercial food
products (Schlech et al., 1983; Watson et al., 1990; Zottola and Smith, 1991; Broome,
1993; Ericsson et al., 1997). These outbreaks have prompted increased interest in
understanding the epidemiology of this human pathogen and have stimulated concern over
how and when it can be transmitted from the environment and cause human illness. The
symptoms of the resulting infection, listeriosis, include severe meningitis, meningo
encephalitis, central nervous system infection, stillbirths, abortions, premature labour and
septicemia (Seeliger and Fi~ger, 1983; Lovett, 1989; Miller et al., 1990). The organism
mostly affects limited groups within the population, namely pregnant women, foetuses,
the elderly and individuals with suppressed immune systems (see review by Ryser and
Marth, 1991, pp. 45-65). Listeriosis is considered to be serious because of the high
mortality rate: approximately 30% overall, and as high as 55% in foetuses (Watson et al.,
1990; Broome, 1993).
The occurrence of L. monocytogenes in some environment, foods and foods processing
environment have been studied which lead to the improvement of methods for detection,
enumeration, identification, and differentiation including subtyping for the study of its
ecology and epidemiology purposes. Since food is the major source of listeriosis, the
control and prevention of Listeria contamination of foods is of interest. The introduction
of strategies such as HACCP and predictive microbiology, together with the good
education to consumers, could be used as the tools to improve food safety.
1. 2 HISTORY OF THE GENUS LISTERIA
1. 2.1 · THE GENUS LISTERIA AND RELATED ORGANISMS
Listeria was definitely isolated and described in detail for the first time in England by
Murray et al. (1926). A small gram positive bacillus was isolated following ,a
spontaneous epidemic infection among la~ratory rabbits and guinea-pigs. During the
illness, a typical monocytosis was observed in the diseased animals. The authors
considered this to be a case of hitherto unidentified bacterium, and therefore designated

2
the organism Bacterium monocytogenes. The following year, Pine (1927) isolated a
bacterium from the liver of infected African gerbils (African jumping mice, Tartera
lobengulae) in South Africa and named it Listerella hepatolytica. The generic name was
chosen in honour of Lord Lister who discovered antisepsis. Shortly after this, it was
established that the organisms from England and Africa were identical, and the name was
altered to Listerella monocytogenes. However, the generic name Listerella had already
been used in another branch of biology. Hence, the proposed name change by Pirie
(1940) from Listerella monocytogenes to Listeria monocytogenes was accepted in 1940.
The sixth edition of Bergey's Manual of Determinative Bacteriology (Breed et al., 1948),
as well as the seventh edition (Breed et al., 1957), ranked the genus Listeria with a single
species L. monocytogenes in the family Corynebacteriaceae. Four species of Listeria are
described in the eighth edition of Bergey's Manual (Buchanan and Gibbons, 1974; Holt,
1977) : L. monocytogenes, L. denitrificans, L. grayi and L. murrayi. Of these four
species, only L. monocytogenes is associated with diseases of man and animals.
The species monocytogenes has already been described in detail by Gray and Killinger
(1966) and Lovett (1990). In contrast to the L. monocytogenes strains isolated from
clinical infections, many of Listeria strains isolated from healthy individuals and inanimate
sources are nonhaemolytic, nonpathogenic for laboratory animals, and incapable of
evoking a monocytosis in rabbits. These organisms have been proposed by Seeliger as
L. innocua (Seeliger, 1981).
Supported by the results of deoxyribonucleic acid relatedness studies, determinations of
biochemical characteristics, and studies of pathogenicity for adult mice, Rocourt and
Grimont (1983) proposed the species name L. seeligeri and L. welshimeri which were
previously classified as nonpathogenic L. monocytogenes. In the following year,
Seeliger et al. (1984) proposed the name L. ivanovii for L. monocytogenes serovar 5
strains which are experimentally pathogenic for mice, but the 50% lethal dose of these
strains is 10 times higher than that of L. monocyto genes sensu stricto.
Subsequently in the ninth edition of Bergey's Manual of Systemic Bacteriology (Seeliger
and Jones, 1986), the genus Listeria was classified among "genera of uncertain
affiliation" and comprised of 8 species : L. monocytogenes, L. ivanovii, L. seeligeri, L.
innocua, L. welshimeri, L. grayi, L. murrayi. and L. denitrificans. However, three
Listeria spp.- namely, L. grayi, L. murrayi and L. denitrificans have been categorised as
species incertae sedis (species of uncertain position). This originated from low
percentage of DNA homology and phenotypic similarity observed by Stuart and
Welshimer (1973, 1974). The authors proposed to transfer L. grayi and L. murrayi to a
new monospecific genus Murraya which include Murraya grayi subsp. grayi (here
3
Listeria grayz) and M. grayi subsp. murrayi (here Listeria murrayz). Regardipg L.
denitrificans, Stuart and Welshimer (1973) considered it to be misclassified into the genus
Listeria.
Conseq,uently, in 1987, the 16S ribosomal ribonucleic acid oligonucleotide catalog of L.
murrayi and L. denitrificans was detemined by Rocourt et al. ( 1987a,b). L. murrayi was
found to be closely related to that of L. monocytogenes. The results provided no support
for the exclusion of L. murrayi (and the closely related species L. grayi) from the genus
Listeria. Whereas the results from L. denitrificans confirmed previous evidence that this
organism was not a member of the genus Listeria, and was proposed to be transferred to a
new genus Jonesia as Jonesia denitrificans (Rocourt et al., 1987a).
Presently in Bergey's' Manual of Determinative Bacteriology (Holt et al., 1994), there are
6 species of the genus Listeria (Table 1.1) in Group 19. The species L. denitrificans, has
been transferred to a separate genus Jonesia in Group 20. Three species; L. mono
cytogenes, L. seeligeri and L. ivanovii, produce B-haemolysis (haemolysin, LLO) on
horse and sheep blood agars. Two species; L. seeligeri and L. ivanovii are significantly
pathogenic to animals apart from man and only one; L. monocytogenes, is pathogenic to
humans and animals (Benedict, 1990).
1.3 CHARACTERISTICS, ISOLATION AND DIFFERENTIATION
1. 3 .1 CHARACTERISTICS
As described by Seeliger and Jones (1986), Listeria are short, regular rods 0.4-0.5 µm q_y
0.5-2.0 µm with rounded ends. They may be curved, occurring singly or in short chains, r
often present in a 'V' or 'Y' shape. In old or rough cultures, more filamentous forms, 6-
20 µm, may develop. Although older cultures may stain irregularly, young cultures are
Gram-positive. They are not acid-fast, not encapsulated, and are non-sporeforming.
Listeria are facultative intracellular parasites, able to survive and replicate in cells (Racz et
al., 1972). They are motile by a few peritrichous flagella, best expressed at 20-22°C.
The motility is in a characteristic tumbling or slightly rotating fashion. They are both
aerobic and facultatively anaerobic. Grown in nutrient agar, they form colonies 0.5-1.5
mm, round, translucent, dew drop in appearance, low convex with fine texture and entire /
margin. When exposed to 45° incident transmitted white light, the colony appears bluish.
A culture stab in semisolid growth medium (e.g. Bacto motility medium) produces
growth along the stab line, spreading horizontally 3-5 mm below the surface in an
, umbrella pattern. This is probably owing to a combination of motility and a preference
for micro-aerophilic conditions (Prentice and Neaves, 1992).
4
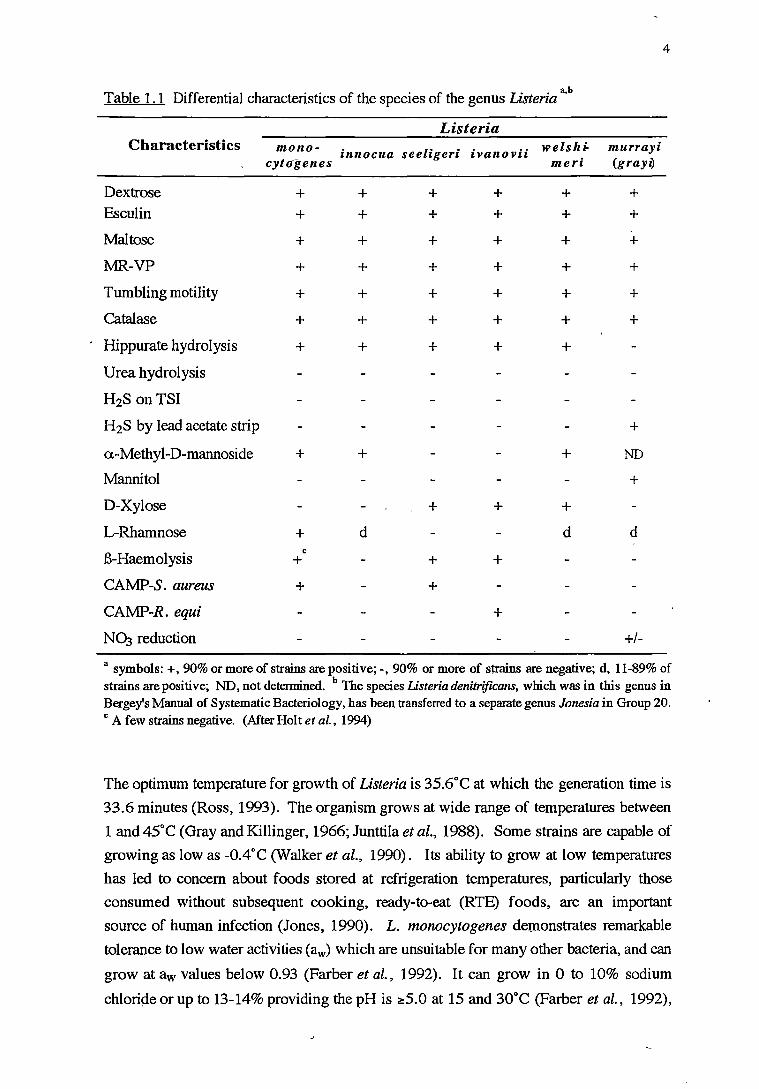
Table 1.1 Differential characteristics of the species of the genus Listeria a,b
Listeria Characteristics mono- innocua seeligeri ivanovii welshi- murrayi
cyto-genes meri (grayz)
Dextrose + + + + + + Esculin + + + + + +
Maltose + + + + + +
MR-VP + + + + + +
Tumbling motility + + + + + +
Catalase + + + + + +
Hippurate hydrolysis + + + + +
Urea hydrolysis
H1S on TSI
H2S by lead acetate strip +
a-Methyl-D-mannoside + + + ND
Mannitol +
D-Xylose + + +
L-Rhamnose + d d d
B-Haemol ysis c
+ + +
CAMP-S. aureus + +
CAMP-R. equi +
N03 reduction +/-
a symbols:+, 90% or more of strains are positive;-, 90% or more of strains are negative; d, 11-89% of strains are positive; ND, not determined. b Tue species Listeria denitrificans, which was in this genus in Bergey's Manual of Systematic Bacteriology, has been transferred to a separate genus Jonesia in Group 20. c A few strains negative. (After Holt et al., 1994)
The optimum temperature for growth of Listeria is 35.6°C at which the generation time is
33.6 minutes (Ross, 1993). The organism grows at wide range of temperatures between
1 and 45°C (Gray and Killinger, 1966; Junttila et al., 1988). Some strains are capable of
growing as low as -0.4°C (Walker et al., 1990). Its ability to grow at low temperatures
has led to concern about foods stored at refrigeration temperatures, particularly those
consumed without subsequent cooking, ready-to-eat (RTE) foods, are an important
source of human infection (Jones, 1990). L. monocytogenes demonstrates remarkable
tolerance to low water activities (aw) which are unsuitable for many other bacteria, and can
grow at aw values below 0.93 (Farber et al., 1992). It can grow in 0 to 10% sodium
chloriµe or up to 13-14% providing the pH is :a:5.0 at 15 and 30°C (Farber et al., 1992),
5
and survive for up to a year in 16-20% sodium chloride (Seeliger, 1961). L. mono
cytogenes was also reported to be a fairly acid tolerant. The mirumum pH at which L.
monocytogenes can initiate growth at 30°C was reported to be 4.3 (Farber et al., 1989b).
The maximum pH for growth of L. monocytogenes at30°C was 9.2 (Petran and Zottola,
1989). The minimum pH for growth is markedly influenced by incubation temperature
and the type of acid added to the medium. For some mstances, the minimum pH for
growth of L. monocytogenes Scott A at 4°C was 5.23 for HCl as acidulant (George et al. ,
1988), and 5.5 for lactic acid as acidulant (Farber et al., 1989b). In addition, L.
monocytogenes is claimed to'be among the most heat resistant of vegetative bacterial cells. ',
Doyle et al. ( 1987) reported the recovery of L. monocytogenes from milk which had been
treated at71.7-73.9°C for 16.4 sees. Fernandez Garayzabal et al. (1987) also found L.
monocytogenes in 71.5% of the milk samples heated at 72°C for 15 sees. Several studies
concerning the thermal resistance of listeriae .were carried out but conflicting results were
obtained by different groups of workers (Ryser and Marth, 1991).
1. 3. 2 ISOLATION
One of the immediate outcomes of the identification of food as an important epidemio
logical factor in outbreaks of listeriosis, and identification of environments as an
important reservoir of L. monocytogenes, has been heightened a'?tivity to develop
improved methods for the detection and enumeration of L. monocytogenes. Much
progress has been made since 1985 in developing both conventional and rapid methods
for detecting Listeria in foods, in particular, L. monocytogenes. A variety of conven
tional or cultural methods have been employed, and intensively evaluated by collaborative
studies aiming to provide the standard or'reference methods. However, regarding rapid
methods, none of the methods proposed has yet obtained universal acceptance to become
officially accepted as standard or reference method (WHO Working Group, 1988).
1.3.2.1 Conventionalmethods
Enrichment \
Listeria is known as a nonfastidious organism. Once isolated, the bacteria grow well on
the usual bacteriological media (e.g. Tryptose Agar, Nutrient Agar and Blood Agar)
(Jones, 1990). However, attempted isolation or reisolation of the organism from
artificially or naturally contaminated food and clinical specimyns is often unsuccessful.
The primary isolation of L. monocytogenes from nonnally sterile sites such as blood,
cerebrospinal fluid was often unsuccessful (Murray et al., 1926; Gill, 1937; Gray et al.,
1948). More difficulties are encountered when samples such as clinical specimens (tissue
6
biopsies and autopsy specimens), food or environmental which contain small numbers of
L. monocytogenes in combination with large populations of other contaminated or
indigenous microorganisms.
In 1948, Gray et al. (1948) introduced a cold enrichment technique which required
storage of the sample in nutrient broth as sole enrichment media at 4°C for several weeks.
A portion was plated onto non-selective agar such as blood agar, Tryptose agar and TSA
and incubated at 37°C for 18-24 hr and examined with obliquely transmitted illumination
as described by Henry (1933) for typical bluish-green, Listeria-like colonies. If no
Listeria is recovered further portions of the refrigerated samples are then plated at intervals
for as long as 3 months. In some instances; (e.g. Kampelmacher and van Noorle Jansen,
.J961, cited in Gray and Killinger, 1966) 6 months of refrigerated storage was necessary
before L. monocytogenes could be detected and Weis and Seeliger (1975) also reported
prolonged incubations up to 12 months.
The mechanism of the enhancmg effect at 4°C is not fully understood. Several theories
have been established to explain the success of cold enrichment. For foods samples,
some authors (Doyle and Schoeni, 1987; Donnelly, 1988) suggest that the cold
enrichment exploits-the psychrotrophic nature of Listeria and simultaneously suppresses
growth of other indigenous non-psychrotrophic micro-organisms. However, at this
temperature Listeria also multiply slowly with a generation time of 1.5 days (Rosenow
and Marth, 1987). Ryser et al. (1985) indicated that cold enrichment may play an
important role in repairing sublethally injured Listeria which may have been present in
cottage cheese manufactured from skim milk artificially contaminated with the pathogen.
Enhancement of Li~teria populations during cold enrichment proved to be· successful with
such diverse samples as oat silage (Gray, 1960b), vegetation (Welshimer, 1968), and
plants and soil (Welshimer and Donker-Voet, 1971). Enumeration of L. monocytogenes
from various environmental samples such as river water, effluents, sewage, sewage
sludge, soil (Watkins and Sleath, 1981; Fenlon, 1985) has been undertaken by Gray's
cold-holding method with a most probable number (MPN) system. However, the le~gth
of the incubation period involved in cold enrichment makf'.S this procedure impractical for
use in routine regulatory analysis of food products.
In an attempt to reduce the period of cold incubation, Gray et al. (1950) noted that
potassium tellurite gave satisfactory selectivity within 24 hours of incubation at 37°C.
However, studies by other investigators (Seeliger, 1961; Kramer and Jones, 1969) have
discouraged use of potassium tellurite as a Listeria-selective agent. Consequently, several
inhibitory substances, including antibiotics, were examined for Listeria selectivity. The
incorporation of specJfic selective agents into enrichment media has shortened the time
7
required to effectively isolate the organism. Ryser and Marth (1991) have extensively
discussed the selective agents recommended by various authors. More recently, several I
enrichment broths have been used commonly for analysis of food products include FDA
Enrichment Broth (Lovett, 1988) as well as Fraser Broth and USDA Listeria Enrichment
Broth I and II (Dennis and Lee, 1989). As yet, no single protocol has been developed
that is sufficiently sensitive to detect L. monocytogenes in all types of samples within a
reasonable time. However, the FDA and USDA methods which use primary and
secondary warm enrichment have recently been unofficially adopted as standard methods
for the isolation of L. monocytogenes from various food items (Warburton et al., 1991).
Direct Plating
Early attempts to isolate Listeria from food and environmental samples relied on clinical
laboratory experience based on- direct plating procedures and dealing with large numbers
of an organism, often growing in almost pure culture under essentially ideal conditions
(Albritton et al., 1980). However, direct plating p~ocedures generally have proven to be
unsuccessful for isolating Listeria from foods and environments due either to the ,
organism occurring in low numbers in the presence of competing microorganisms, or
being sublethally injured (Buchanan et al., 1989b) . Therefore, direct-plating does not
reliably isolate Listeria spp. and typically is used in conjunction with a prior enrichment
(Heisick et al., 1995).
1.3.2.2 Rapid detection methods
The FDA and USDA enrichment/plating procedures have been used as standard methods
to detect L. monocytogenes in dairy and meat products, respectively. Although these
methods have drastically shortened the time of analysis as compared to the traditional cold
enrichment procedure, the 3- to 6-day period needed to determine that a particular food
sample is free of L. monocytogenes is unacceptable to large segments of the food industry
which deal with highly perishable productS such as fluid milk, raw meat, poultry, and
seafood. Thus, a need exists for faster methods to detect L. monocytogenes and other
pathogens in food with a short shelf life.
Recent advances in allied fields of immunology and microbial genetics have led to
development of Enzyme Linked Immunosorbent Assays (ELISA), DNA probes, and
PCR (Farber and Perterkin, 1991) which can be used to detect L. monocytogenes from
food samples within several hours following primary and/or secondary warm enrichment
(e.g. Oladepoetal., l992;Fluitetal., 1993; Herman etal., 1995; Avoyne etal., 1997).
Several of these assays are available commercially and can be used effectively to screen
large numbers of food samples for presence of Listeria spp. However, before any of
8
these rapid methods can be adopted as "standard", scientists first must agree on a standard
enrichment/plating procedure that can be used to measure the sensitivity and selectivity of
these newly developed assays.
1.3.3 DIFFERENTIATION
1.3.3.1 Speci(!stypingmethods
Biochemical Tests
The six species of Listeria are differentiated by the physical characteristics, biochemical
reactions, haemolytic activity and CAMP test given in Table 1.1. Of the biochemical
tests, the carbohydrate fermentation patterns are essential for differentiating Listeria
species, with the exception of L. monocytogenes and L. innocua, which have identical
patterns. These two species are separated by the absence of haemolytic activity in L.
innocua, which is demonstrated by CAMP test (Christie et al., 1944).
The term "CAMP" test originally applies to the synergistic reaction between S. aureus and
group B streptococci as defined by Christie et al. (1944). Further development of CAMP
te8t for L. monocytogenes was constituted by several studies (Fraser, 1964; Groves and
Welshimer, 1977; Smola, 1989). Generally, CAMP test is performed on a sheep blood
agar plate, with cultures of Staphylococcus aureus and Rhodococcus equi streaked in
parallel in one direction. Test cultures of Listeria are streaked at right angles to those
streaks, about 2 mm apart from the S. aureus and R. equi culture lines. After incubation
at 37°C for 18 h, the plates are examined for an enhanced zone of haemolysis at either the
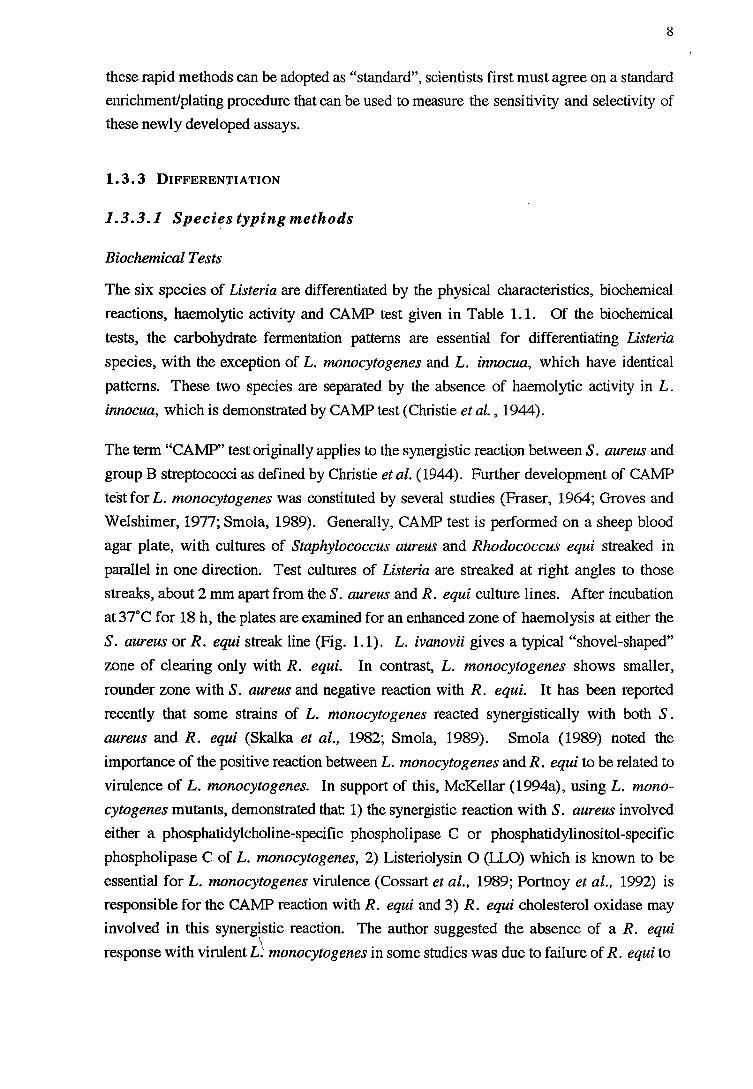
S. aureus or R. equi streak line (Fig. 1.1). L. ivanovii gives a typical "shovel-shaped"
zone of clearing only with R. equi. In contrast, L. monocytogenes shows smaller,
rounder zone with S. aureus and negative reaction with R. equi. It has been reported
recently that some strains of L. monocytogenes reacted synergistically with both S.
aureus and R. equi (Skalka et al., 1982; Smola, 1989). Smola (1989) noted the
importance of the positive reaction between L. monocytogenes and R. equi to be related to
virulence of L. monocytogenes. In support of this, McKellar (1994a), using L. mono
cytogenes mutants, demonstrated that: 1) the synergistic reaction with S. aureus involved
either a phosphatidylcholine-specific phospholipase C or phosphatidylinositol-specific
phospholipase C of L. monocytogenes, 2) Listeriolysin 0 (LLO) which is known to be
essential for L. monocytogenes virulence (Cossart et al., 1989; Portnoy et al., 1992) is
responsible for the CAMP reaction with R. equi and 3) R. equi cholesterol oxidase may
involved in this synergistic reaction. The author suggested the absence of a R. equi
response with virulent L~ monocytogenes in some studies was due to failure of R. equi to
9
Figure 1.1 The reactions of Listeria species m CAMP test. Diagram indicates the locations of haemolytic enhancement regions.
produce sufficient cholesterol oxidase. The need for standardization of R. equi to obtain a
valid reaction was also emphasized (Smola, 1989; Schuchat et al. , 1991 b).
In addition, Skalka et al. (1982) reported positive hemolysis in L. innocua on rabbit
erythrocytes which was not enhanced by R. equi. This apparent hemolysis was later
elucidated by Pongratz and Seeliger (1984), cited in McKellar (1994b) to be attributed to
lysis of erythrocytes by acid produced during growth of L. innocua.
Rapid Identification Methods
Most of the identification methods to date have only addressed the time consumption
problem of the biochemical confirmation step, as they require pure cultures. Miniaturised
biochemical tests such as MICRO-ID (Organon Teknika), RAP-ID and Minitek give
results within 48 hours, respectively. Analytab Products Incorporated (API 20 STREP
and API-zyM) can identify Listeria to genus level after 4 hours of incubation. Vitek
AMS is fully automated and computerised and can provide identification in 4 to 24 hours ,
but cannot usually be afforded by small laboratories (Ryser and Marth, 1991). By
quantitation of cellular fatty acids, gas chromatography can provide precise genera and
10
species identification within 24 hours, but again the necessary equipment is not available
in most laboratories.
Fluorescent Antibodies (FA) provide fast identification and, although only genus specific,
can also provide serotypic information and have the potential to be used directly on
clinical and food samples or in conjunction with flow cytometry (Donnelly and Baigent,
1986). This technique can detect non-viable organisms or organisms in specimens from
which culture is not possible (Vlahovic et al., 1988). Whilst this is an advantage
clinically, for exan1ple in the diagnosis of a patient already receiving antibiotics, the
implication of the presence of non-viable L. monocytogenes in foods is inconclusive in
the absence of viable organisms. Furthermore, positive FA results only serve ~
corroborative evidence in identification of Listeria and confirmation is required by pure
culture and biochemical tests (Difeo, 1984).
Various systems for detecting L. monocytogenes by using either monoclonal antibodies
or nucleic acid hybridisation probes alone or in conjunction with DNA amplification
technology have been reported (Bessesen et al., 1990). Monoclonal antibodies developed
to cell surface antigens only provide information to genus level (Fitter et al., 1992).
Probes can be designed to provide the desired level of identification (genus; for example
Gene Trak Listeria colorimetric assays, species or subspecies), but the technology lacks
sensitivity and therefore requires large numbers of target cells ( 105 -106 cfu/ml or colonies
on solid agar) in the presence of non-target background (Datta et al., 1987).
1.3.3. 2 Intraspecies typing methods
For identification of the source of clinical listeriosis and epidemiological investigations of
listeriosis including the source of distribution of L. monocytogenes in food and food
processing factories, it is necessary to type isolates beyond the species level. Therefore,
potential sources of contamination can be confirmed or excluded and appropriate action
taken. Serological and phage typing have been developed. Isolates of Listeria can also be
discriminated to strains by several molecular typing methods in some instances by:
protein-based method such as multilocus enzyme electrophoresis (MEE), nucleic acid
based methods such as ribotyping, pulse field gel electrophoresis (PFGE), and
polymerase chain reaction (PCR)-based fingerprinting etc. Each of these techniques have
inherent advantages and drawbacks. I
• Serotyping is commonly performed as a means of subtyping L. monocytogenes based
on variations in somatic (0) and flagellar (H) antigens. There are at least 16 serovars of
Listeria in the current scheme based on the serological grouping of 14 heat-stable somatic
11
(0) antigens and 4 heat-labile flagellar (H) antigens (Seeliger and Hohne; 1979). The
serotyping, however, is limited in application to epidemiological studies of L. mono
cytogenes as it lacks sufficient information and discriminatory abilities. There are only
three serotypes, 4b, 1/2a and 1/2b, that are responsible for the majority of listeriosis
outbreaks (Farber and Peterkin, 1991). However, it may be useful in combination with
another typing method.
• Phage typing has also been widely employed for typing of L. monocytogenes. The
method is based on the lytic properties of different phages. It is highly reproducible and
provides an acceptable level of discrimination, however, many strains are untypable with
the existing set of phages (McLauchlin et al., 1986; Monfort et al., 1998). In addition,
only a small number of laboratories are involved in storing and maintaining phage culture
collections against L. monocytogenes.
• Multilocus Enzyme Electrophoresis (MEE) is a protein-based method involving the
determination of the mobilities, in a starch gel matrix, of a selected set of metabolic
enzymes (Selander etal., 1986). MEE is a time consuming method but its results can be
directly correlated with the genotype (Swaminathan and Matar, 1993). Therefore,- it was
used extensively for the study of bacterial populations and evolutionary genetics and for \
epidemiology of infectious diseases including L. monocytogenes (Bibb et al., 1990;
Baxter et al., 1993; N121rrung and Skovgaard, 1993).
• Chromosomal DNA restriction analysis or restriction endonuclease analysis (REA) or
microrestriction analysis was the first of the chromosomal DNA-based typing schemes
(Farber, 1996). The method involves cutting chromosomal DNA with a fragment-cutting
restriction enzyme, and separating the DNA fragments by size using electrophoretic
techniques. Differences in the fingerprint patterns of two isolates is referred to as a
restriction~fragment length polymorphism (RFLP). REA is a rapid, reproducible,
inexpensive method and relatively simple to perform. However, the genomic restriction
fragments are usually too numerous and too closely spaced (Farber, 1996). Therefore, a
number of restriction endonucleases have to be screened before the proper enzyme and
conditions can be specified. REA typing has recently been used to demonstrate that L.
monocytogenes isolates from the 1981 Nova Scotia, 1983 Massachusetts, and 1985
California outbreaks each exhibit a unique restriction enzyqie pattern (Wesley and Ashton,
1991).
• Ribosomal DNA RFLP analysis or ribotyping refers to the use of nucleic acid probes
to recognize ribosomal RNA (rRNA) genes which are present in all bacteria
(S~aminathan and Matar, 1993). Since the genes coding for rRNA are very highly
12
conserved, a single probe can be used to subtype all eubacteria (Farber, 1996). The
method is technically demanding and time consuming. It involves dig~sted bacterial
chromosomal DNA, electrophoresed restricted DNA onto agarose gel. The restricted
DNA then is transferred onto a solid support for probing which is processed with a
labeled probe such as radioactive probes, or nonisotopic cold-labeling systems.
Ribotyping provides reproducible_pattems which are not too complex in comparison
between different strains. Recently, an automated system, the 'Riboprinter™ Microbial
Characterisation System', has been developed by E.I. DuPont. An extensive computer
database was developed for Listeria spp. including L. monocytogenes and incorporated
computer analysis of a standard so that results which vary in different runs, times and
places may be compared (Ryser, 1995).
• Pulse field gel electrophoresis (PFGE) or DNA macrorestriction analysis (Boerlin,
1995) uses restriction endonucleases that cut DNA infrequently which allows the
generation of large fragments of chromosomal DNA (Swaminathan and Matar, 1993).
Special methodology is needed to avoid shearing the bacterial DNA. The resulting DNA
fragments are separated by pulse field gel electrophoresis. PFGE is a time consuming
and technically demanding method (Farber, 1996). However, the method is very
discriminatory and reproducible and has recently been used in the investigation of
foodbome listeriosis in United States (Proctor et al., 1995).
• A major advantage of PCR-based methods, its exquisite sensitivity, is also its main
disadvantage since it is extremely sensitive to contamination by template· DNA and
preamplified PCR product. Preamplified products or amplicons are a highly concentrated
source of primer template. Contamination of assays prior to PCR by amplicons may
result in false positive results. The PCR-based method may be categorized into two
types;
a) Using the restriction fragment length polymorphism (RFLP) method, a large number of
fragments released from chromosomal DNA may cause an uneasy comparison of patterns
from different isolates. PCR-based · RFLP methods overcomes this problem by
examining RFLPs within smaller portions of the chromosome (Thomas, 1995). This
involves amplifying a known DNA sequence, followed by digestion with restriction
enzyme and comparing restriction fragments of the amplified DNA from different strains.
The method was reported to be reproducible and provide high discrimination for L.
monocytogenes strains 1/2a, but less discrimination for strains 1/2b and showed to be
identical for strains 4b (McLauchlin, 1996). The method is expensive to establish, but its
main drawback in application to L. monocytogenes is that the results are frequently too
complex for practical use in epidemiological typing, and
13
b) a PCR-based method that requires no prior knowledge of the target DNA sequence but
randomly amplifies segments of the target DNA by using a single primer e. g. random
amplification of polymorphic DNA (RAPD) and repetitive sequence element (rep) PCR.
The method is probably the simplest DNA-based subtyping method to date with simple,
reproducible fingerprints of genomic DNA generated. The RAPD-PCR uses single short
oligonucleotides of arbitrary sequence to prime DNA synthesis at low stringency from
pairs of sites to which the oligonucleotide almost matches. This generates strain-specific
arrays of anonymous amplified DNA fragments (Swaminathan and Matar, 1993). Czajka
et al. (1993) reported RAPD to be able to discriminate within and between serotypes of L.
monocytogenes. The rep-PCR, uses consensus primers in the PCR to amplify DNA
sequences located between successive repetitive elements. The high homology of
repetitive sequences of the primers allows for the use of more stringent PCR conditions
compared to RAPD which may reduce experimental variation and increase the
reproducibility of the technique (Louws et al., 1994; Jersek et al., 1996). The method
has been applied succesfully to Listeria spp. especially L. monocytogenes (Jersek et al. ,
1996).
1.4 OCCURRENCE OF LISTERIA IN NATURAL ENVIRONMENTS
Listeria is widespread in nature. This organism is frequently isolated from a large variety
of environments including plants, soil, silage, animals, sewage, and water and food
consumed by humans including vegetable, dairy, red meat, poultry and seafood (Odegard
et al., 1952; Welshimer, 1960, 1968; Seeliger, 1961; Gray and Killinger, 1966; Weis and
Seeliger, 1975; Watkins and Sleath, 1981; Schlech et al., 1983; Weagant et al., 1988;
Colburn etal., 1990; Ryser and Marth, 1991).
1.4.1 PLANT AND SOIL
The epidemiology of listeriosis is perplexing and the habitat of L. monocytogenes is
obscure. Sin~ Listeria have been isolated from many of non-clinical sources e.g. soil,
decaying vegetation and silage etc., the concept of L. monocytogenes as a "saprophytic
pathogen with an opportunistic mode of spread" now becomes increasingly attractive,
along with the hypothesis of Seeliger (1961) who commented on the resemblances of the
biochemical and cultural characteristic of L. monocytogenes to some plant-soil
inhabitants. Seeliger (1961) further speculated "that there may well be a primary
saprophytic life of Listeria", in which event the epidemiology and epizootology of many
listeric infections would be more comprehensible. In addition, Weis and, Seeliger (1975)
found that there was increasing evidence for a high incidence of Listeria in plants and soil
samples: Listeria can be isolated frequently from old faded, or mouldy plants particularly
14
from the surface soil in uncultivated fields. Many reviews (Brackett, 1988; Sutherland,
' 1989; Miller et al., 1990; Ryser and Marth, 1991) also described Listeria as being isolated
from dead and decaying plant matter.
Relatively large numbers of L. monocytogenes were isolated from samples of mud which
suggests that a moist environment favours growth of the organism (Weis and Seeliger,
1975). Welshimer and Donker-Voet (1971), could not isolate L. monocytogenes from
soil or dead green vegetation collected in early autumn, however, the organism was
detected in almost all samples of, soil and decayed vegetation the following spring.
Survival of L. monocytogenes in soil depends on type of soil and its moisture content
(Welshimer, 1960; Welshimer and Donker-Voet, 1971). Welshimer (1960) demonstrated
that L. monocytogenes could survive in soil for up to 295 days. Botzler et al. (1974)
reported that the organism survived at high concentrations in the soil for several weeks
despite cold weather during winter at average high and low temperatures of 8° and -15°C
respectively, and competition from the microbial flora. Thus, the ability of Listeria to
multiply at low temperature, its ability to survive for long periods in soil (Welshimer,
1960), and its recovery from decaying vegetation implies a saprophytic existence wherein
the plant-soil environment may serve as a reservoir. Accordingly the organism can be
contracted by humans and animals via many possible routes from many sources.
1.4.2 ANIMAL FEED {SILAGE)
Several investigators have studied extensively the relationship between listeriosis in
ruminants and silage consumption. The possible role of silage in the transmission of
listeriosis was suggested in 1922 when results of an investigation in Iceland indicated a
disease resembling listeriosis (known in Iceland as votheysveili or silage sickness) which
was relatively common in silage fed-animals (Gray, 1960a). Olafson (1940) also
observed the close relationship between silage feeding and onset of listeriosis. However,
the apparent relationship was not clarified until 1960 when Gray (1960a) demonstrated an
epidemiological relationship by isolating the same Listeria serotype from the brain of an
infected sheep and from the oat silage on which the flock was being fed. In further
investigation, Gray (1960a) also reported isolating L. monocytogenes from the viscera of
a female mouse and the foetuses of a pregnant mouse fed poor-grade silage which was
thought to have caused death and abortion in cattle because it was contaminated with L.
monocytogen'i"S. Identical serotypes of L. monocytogenes were isolated postmortem
from the mice and cow. Kampelmacher and van Noorle Jansen (1979), cited in Fenlon
(1985) that many cases of listeriosis were found in farm animals in The Netherlands
during the period 1957-1976 which showed the geographical distribution of the disease
; I
15
coincided with areas where the silage was significantly inferior in quality: when the
standard of silage-making improved the incidence of the disease decreased. In the United
Kingdom the number of incidents of listeriosis in sheep increased dramatically from 53 in
1976 to more than 230 in 1983. The pattern of listeriosis is also changing from isolated
cases to larger flock outbreaks as highlighted in a recent outbreak in Scotland among a
flock of 196 pregnant ewes fed poor quality silage (Low and Renton, 1985); L.
monocytogenes of the same serotype was isolated from silage and from various organs of
the ewes which died, thus supporting the link between silage feeding and listeriosis.
Numerous reports exist of listeriosis _outbreaks in sheep and cows resulting from
consumption of contaminated silage (Gr0nst!21l, 1979, 1980; Fenlon, 1985, 1986; Gitter et I
al., 1986; Wilesmith and Gitter, 1986).
L. monocytogenes has most frequently been associated with poor-quality silage which
had pH >4.5 (Gr0nst0l, 1979; Fenlon, 1985; Gitter et al., 1986). Gr0nst0l (1979)
isolated L. monocytogenes from 22, 37, and 56% of silage samples with pH values <4.0,
4.0-5.0, and >5.0 respectively. Perry and Donnelly (1990) also found 13 and 64% of
Listeria species in silage samples which had pH below and above 5.0 respectively, and
demonstrated that the incidence of Listeria increased concomitantly with the increasing of
pH of silage. In another survey by Fensterbank et al. (1984), cited in Ryser and Marth
(1991), L. monocytogeneswas isolated from 11of31 silages of excellent quality which
had pH values between 3.6 and 4.0. Gouet et al. (1977) showed that L. monocytogenes
failed to grow at pH <5.0 in gnotobiotic silage manufactured with a defined flora of lactic
acid bacteria. Not only did L. monocytogenes fail to grow, but the organism was
supposedly eliminated from the silage after 30 days of storage at 20°C. Ip contrast,
Dijkstra (1975) demonstrated that L. monocytogenes can survive 4-6 years in naturally
contaminated sil~ge stored at 5°C.
Fenlon (1985) suggested that low-quality silage with a pH value higher than 6.0 was
usually due to aerobic deterioration caused by mould growth. These were the silages
most likely to harbour Listeria and it is probable that in such bales no fermentation had
occurred. It is suggested that fermentation in silages by indigenous lactic acid bacteria
which is the dominant micro-organism will result in bacteriocin production and a low pH
product which will rapidly inhibit spoilage bacteria (McDonald, 1970). However, in
many silage fermentations, the lactic acid levels are too low to reduce the pH to this ·
critical point (approximate pH 4.5), allowing Listeria and other organisms to proliferate.
In some cases, Listeria will not proliferate due to other inhibitory compounds, such as
hydrogen peroxide, found in silage (Price and Lee, 1970).
The origin of Listeria in silage is still uncertain. Fenlon (1985) suggested birds as
possible sources. Gulls and rooks often forage for insects among freshly cut grass
16
wilting in fields. Gulls may act as a vector, transferring organisms in sewage sludge and
untreated sewage outfall from one place to another without becoming overtly infected and,
therefore, play a significant role in initial contamination of grasses used for silage. Faecal
specimens from seagulls feeding at sewage sites were found to have a higher rate of
carriage of Listeria spp., with no seasonal difference than those from gulls feeding
elsewhere (Fenlon, 1985). The role of other bird species is less certain. Rooks
frequently feed on pastures, but do not scavenge on sewage outfalls and this is reflected
in their faecal microflora Faecal specimens from rooks normally presented a low
incidence of Listeria species (Fenlon, 1985). Other sources of Listeria species such as
decaying plant material and soil have been suggested (see section 2.3. l).
In addition to traditional silage and less typical varieties prepared from orange peels and
artichokes, other types of animal feed were also linked to outbreaks of listeriosis
(Vizcaino et al., 1988). For more than 80 years, ranchers in Canada and the North
Western United States have recorded numerous cases of listeric-like abortion in cattle that
grazed on ponderosa pine needles. Adams et al. ( 1979) isolated L. monocytogenes from
the blood of mice fed a chow diet consisting of ground ponderosa pine needles. Injection
of the Listeria isolate into mice'caused symptoms that mimicked listeriosis in cattle, which
suggests a possible link between the bacterium and "pine needle abortion".
f. 4. 3 WASTE PRODUCTS
Regarded as a potential risk to human and animal health, waste products i.e. raw sewage,
sewage sludge and final discharge are considered to be an important reservoir in the
epidemiology of L monocytogenes. It has been reported (Watson, 1985) that of the total
sludge produced a~ sewage works in England and Wales, approximately 20% is disposed
of at sea, 40% is applied to agricultural land, and 40% is applied to other land or
incinerated. L. monocytogenes was found to be present in large numbers in sewage and
sludge (Watson, 1985). The most popular method for disposal of liquid sludge is
application to land (Miller et al., 1990).
Watkin and Sleath (1981) reported finding L. monocytogenes at levels between 700 and>
18,000 CFU/L in effluent from primary tanks of sewage treatment plants in England.
That investigation has also shown that L. monocytogenes is widely distributed in sewage I
and that the numbers contributed to the environment by sewage and sewage sludge may
well be higher and could survive for longer periods than Salmonella species. The
survival time studies carried out by those authors indicated that for sewage sludge sprayed
onto land, these. was no detectable reduction in the numbers of Listeria eight weeks after
spraying. Thus environmental persistence could represent a concern with respect to
17
public health. Likewise, Kampelmacher and van Noorle Jansen (1975) detected L.
monocytogenes from 35 (91.8%) of the 38 effluent samples in the Netherlands. Watkins
and Sleath (1981) and Dijkstra (1982) also isolated Listeria from surface waters and
suggested that waters receiving effluent may be a route for recycling Lister~a. Dijkstra
(1982) showed that such waters were contaminated up to a distance of 25 miles ( 40 kms)
from a treatment plant.
Sixty-six samples of waste water and of the effluent after the biological step (via
oxidation) in the waste water pretreatment plant of Braunschweig, West Germany, were
investigated (Geuenich and Mtiller, 1984). The authors detected 697 strams of Listeria
which 586 (84%) were L. monocytogenes. The concentration of Listeria varied between
103 and 105 cells/L. In general, there were about 10 times more Listeria in the sludge than
in the clearly filtered waste water. Furtherlnore, a multiplication of Listeria in 45% of all
cases was also observed. The authors finally pointed out that the biological oxidation
during the waste water treatment does not appear to be highly effective in reducing
populations of viable Listeria in sewage effluent.
In 1986, Al-Ghazali and Al-Azawi (1986) reported the isolation of L. monocytogenes
from a sewage treatment plant in Baghdad, Iraq. Listeria was isolated from all test
samples at each stage of treatment. Highest numbers (1,100 counts/g) were recorded in
raw sewage sludge, while the lowest ( <3 counts/g) were observed in sludge cake.
Digested sludge also showed a decrease in the number of L. monocytogenes. Low
numbers recorded in sludge cake during the summer period coincided with low moisture
content, which was less than3.7%. The pH of the sludge cake ranged from 6.1to8.6.
The same workers continued the study in the same sewage treatment plant together with a
newer one in 1988 (Al-Ghazali and Al-Azawi, 1988b). The results again showed that L.
monocytogenes survived in all stages of the treatment. However; a high reduction after
the sludge activation and sludge digestion processes in both plants were observed. It was
noted that the numbers of L. monocytogenes in incoming raw sewage, which originated
mainly from domestic waste, was relatively higher than the combined industrial and
domestic sources raw sewage.
The presence of L. monocytogenes in domestic sewage can be considered as a primary
point-source for spreading it via sewage sludge. The ability of this organism to survive
the treatment process indicates the hazards of applying sewage sludge cake to land. This
can be of epidemiological significance, particularly with respect to the infection of animals
(Al-Ghazali and Al-Azawi, 1986).
18
1. 4. 4 WATER AND SEDIMENT
Estuarine and coastal environments are continuously subjected to potential contamination
with Listeria species. Sources include sewage effluents (Al-Ghazali and Al-A:zawi,
1986), processing plant effluents (Watkins and Sleath, 1981), and agricultural runoff
(Heisick et al., 1989). Faecal coliform bacteria are routinely used to monitor the
environmental impact of many of these sources; however, their relationship to Listeria
species remains undefined. As part of a survey of sewage-impacted environments,
Watkins and Sleath (1981) investigated river water in the United Kingdom in 1981. The
results indicated that L. monocytogenes was present in all samples of river waters (n=7)
in considerable numbers (3 to > 180 counts/L), often in excess of Salmonella species.
The authors suggested it was important to determine the presence of L. monocytogenes
within the water cycle in order to assess better its epidemiological significance.
According to Dijkstra (1982), L. monocytogenes occurred in 21 % of the surface water
samples obtained from canals and lakes in northern Holland. Even though the lakes were
frequented by swimmers, no case of human listeriosis was reported. In the same study,
L. monocytogenes also was detected in 67% of the samples of sewage effluent. Although
samples of sea water were negative, the bacterium was still found in a canal 25 miles (40
kms) downstream from the sewage treatment plant at the point where the canal emptied
into the sea.
I
The occurrence of Listeria species m sediment, saltwater and freshwater tributaries
draining into Humboldt-Arcata Bay, California during winter (January-February) in
1990, was reported by Colburn et al. (1990). The results demonstrated Listeria spp.
were more prevalent in fresh water (81 %) than in marine waters (33%) and sediment
samples from Elk River, Ryan slough and McDaniel Slough (30.4%). This difference
could be due to a variety of reasons such as different levels of available nutrients,
presence of toxic compounds, and predation by other organisms (Roszak and Colwell,
198?). The effect of dilution by the large volumes of seawater in the marine environment
may also result in lower numbers of Listeria spp. in marine habitats compared with fresh
water. The incidence of Listeria spp. remained high throughout the freshwater tributaries
entering Humboldt-Arcata Bay. Furthermore, a given species or L. monocytogenes
serogroup appeared to predominate in fresh water when domesticated animals (cows,
horses) were nearby, whereas greater diversity, and no species predominance was
observed in areas with no direct animal influents. Slight variations in salinity due to tidal
action did not appear to affect the distribution of Listeria spp. in this water system.
Colburn et al. (1990) suggested that there was a consistent input of Listeria spp. from
these fresh water tributaries draining into Humboldt-Arcata Bay. Listeria spp. could also
19
be introduced to the bay via other sources such as by runoff from urban area of Eureka,
California. In addition, the influence of a large local seagull population observed there
and the presence of other marine birds was also considered to be a COJ:?.Sistent source of
Listeria spp. contaminating the marine environment (Fenlon, 1985).
The water in the US. Gulf Coast was also examined to determine the presence of Listeria
spp. (Motes, 1991). The highest occurrence (10%) of Listeria spp. from water occurred
at water temperatures s20°C. Salinity of water from ambient environments had little
effect on the recovery of listeria spp. These results suggest that the occurrence of
Listeria spp. in coastal environments is not limited by specific hydrographic parameters
and cannot be predicted.
1.5 OCCURRENCE OF LISTERIA IN FOOD
1.5.1 DAIRY PRODUCTS
The listeriosis outbreaks associated with milk and its products, including cheese are well
known. In 1983, pasteurized milk was incriminated as the vehicle of the outbreak in
Massachusetts (Fleming et al. , 1985). In Los Angeles Country, California, 142 cases of
human listeriosis were reported in 1985. A case-control study implicated Mexican-style
soft cheese as the vehicle of infection (Linnan et al., 1988). Mortality rates for both
outbreaks were approximately 30%.
Following the outbreak of human listeriosis that occurred in Massachusetts and
Connecticut during July and August 1983, Hayes et al. (1986) investigated raw milk
collected from three different sources; individual farms, the milk cooperative, and the
pasteurizing plant in USA. The authors isolated L. monocytogenes from 12% of samples
with a variety of serotypes, including la, 3b, 4b, and 4a,b. In the following year, Lovett
et al. ( 1987) investigated the incidence of L. monocyto genes in raw milk from three areas
of the United States. The incidence varied by area from 0% in California, 3.7% in Tri
state and 7.0% in Massachusetts (Table 1.2). The authors further found a low
concentration of the organism ( <1 cell/ml) in raw milk which similar to the investigations
in UK (Fenlon and Wilson, 1989; Fenlon et al., 1995). Additionally, Liewen and Plautz
(1988) determined the incidence of L. monocytogenes in raw milk obtained from bulk
storage tanks on 100 dairy farms in eastern Nebraska during 1986 (Table 1.2). L. mono
cytogenes was found in 6% and 2% of samples collected in February and July
respectively.
A seasonal variation in incidence was noted by Lovett et al. ( 1987), i. e. lowest during hot
and highest in cold weather months. On the contrary, Farber et al. (1988) reported the
20
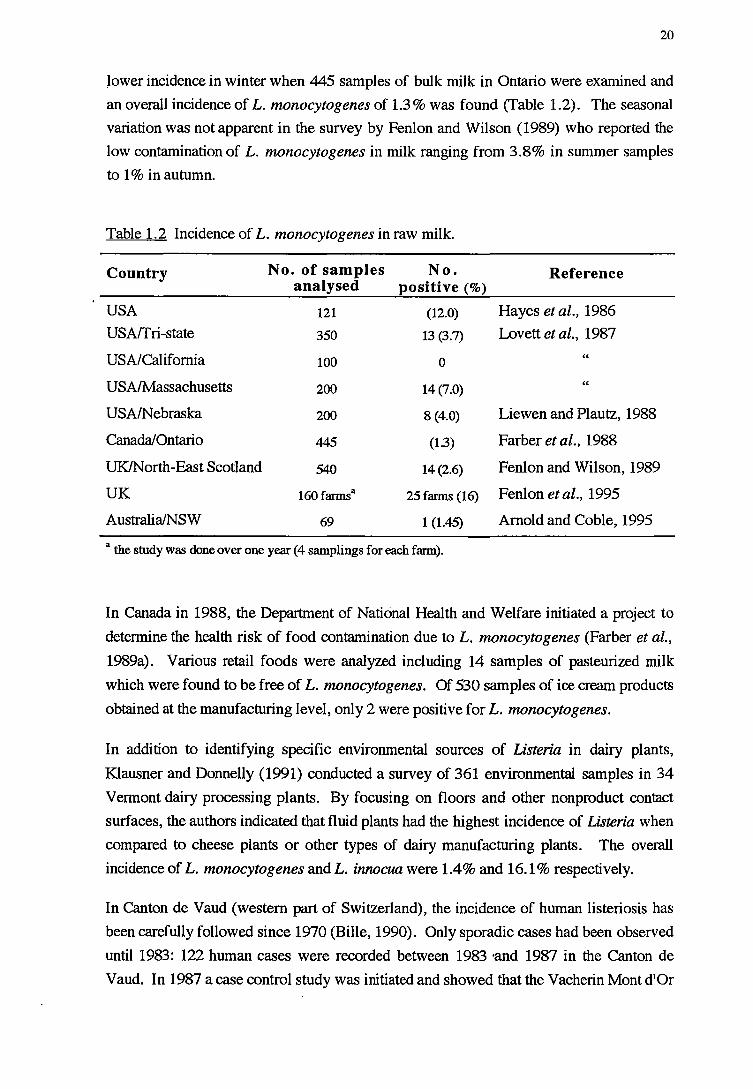
Jower incidence in winter when 445 samples of bulk milk in Ontario were examined and
an overall incidence of L. monocytogenes of 1.3% was found (Table 1.2). The seasonal
variation was not apparent in the survey by Fenlon and Wilson (1989) who reported the
low contamination of L. monocytogenes in milk ranging from 3.8% in summer samples
to 1 % in autumn.
Table 1.2 Incidence of L. monocytogenes in raw milk.
Country No. of samples No. Reference analysed positive(%)
USA 121 (12.0) Hayes et al., 1986
USArfri-state 350 13 (3.7) Lovett et al., 1987
USA/California 100 0 "
USA/Massachusetts 200 14(7.0) "
USA/Nebraska 200 8 (4.0) Liewen and Plautz, 1988
Canada/Ontario 445 (1.3) Farberetal., 1988
UK/North-East Scotland 540 14 (2.6) Fenlon and Wilson, 1989
UK 160farmsa 25 farms (16) Fenlon et al., 1995
Australia/NSW 69 1 (1.45) Arnold and Coble, 1995
a the study was done over one year (4 samplings for each farm).
In Canada in 1988, the Department of National Health and Welfare initiated a project to
determine the health risk of food contamination due to L. monocytogenes (Farber et al.,
1989a). Various retail foods were analyzed including 14 samples of pasteurized milk
which were found to be free of L. monocytogenes. Of 530 samples of ice cream products
obtained at the manufacturing level, only 2 were positive for L. monocytogenes.
In addition to identifying specific environmental sources of Listeria in dairy plants,
Klausner and Donnelly (1991) conducted a survey of 361 environmental samples in 34
Vermont dairy processing plants. By focusing on floors and other nonproduct contact
surfaces, the authors indicated that fluid plants had the highest incidence of Listeria when
compared to cheese plants or other types of dairy manufacturing plants. The overall
incidence of L. monocytogenes and L. innocua were 1.4% and 16.1 % respectively.
In Canton de Vaud (western part of Switzerland), the incidence of human listeriosis has
been carefully followed since 1970 (Bille, 1990). Only sporadic cases had been observed
until 1983: 122 human cases were recorded between 1983 and 1987 in the Canton de
Vaud. In 1987 a case control study was initiated and showed that the Vacherin Mont d'Or
21
soft-ripened cheese was the source of the disease. Thus, in late November 1987, the
authorities decided to recall the product and to stop its production. Following these
measures, the number of new cases has dropped dramatically in the area.
In Australia, the Microbiology Laboratory of the NSW Health Department Division of
Analytical Laboratories reported the investigation of the contamination in foods sold in
NSW during January 1986 to November 1993 (Arnold and Coble, 1995). The survey of
dairy products revealed the presence of Listeria in 9.4% (68 samples) and L. mono
cytogenes in 5.4% (39 samples) of 725 samples. The dairy products positive for £,.
monocytogenes were raw goat milk (1 sample), chocolate coated ice creams (23 samples)
and soft cheese (15 samples).
1. 5. 2 MEAT PRODUCTS
Recognition of L. monocytogenes as a foodborne pathogen has raised concerns about the
possible role of meat products as vehicles of listeric infections. An outbreak in Western
Australia in 1990 has been linked to a contaminated pare (Watson et al., 1990). In the
United States, a case-control study involving 82 sporadic cases of listeriosis was
undertaken by the Centers of Disease Control, victims were reported to have eaten
undercooked chicken or uncooked hot dogs (Schwartz et al., 1988). Following this
report, Genigeorgis et al. (1989) conducted a study of the skin of poultry wings, legs
(drumsticks) and whole livers purchased from supermarkets in Davis, California. The
prevalence of L. monocytogenes was 10%, 15%, and 14% respectively. The authors
also investigated 12 locations and finished poultry products within a slaughterhouse, and
isolated L. monocytogenes from skins of wings and drumsticks and whole livers at the
end of the processing line at 70.0%, 36.7% and 33.3% respectively. After 4 days of
storage of the same packages at 4°C L. monocytogenes was recovered from 40%, 52%
and 72% of the respective products. The prevalence of L. monocytogenes on the hands
and gloves of the persons hanging birds after ch~lling, cutting carc~ses, and packaging
parts was 20%, 45.5% and 59%, respectively.
,)
In January 1987, the Microbiology Division of the Food Safety and Inspection Service
(FSIS) initiated national monitoring programs to determine the incidence of L. mono
cytogenes in domestically produced raw meat (Carosella, 1990). There are approximately
1,300 beef slaughter plants operating in the U.S., from which 30% of all the samples
were investigated for L. monocytogenes. The results from the monitoring program for
raw beef showed 41 of 658 samples positives for L. monocytogenes. The monitoring
program "also provided information on seasonal distribution of L. monocytogenes which
showed a dramatic increase in the incidence of Listeria during the spring of 1988. The
22
author suggested the incidence of L. monocytogenes in raw beef may be related to the age·
of the animals.
During spring 1990, Vorster et al. (1993) monitored 134 samples of RTE food, vienna
sausages, ham and cervelat, from 17 supermarkets in the Pretoria area (South Africa).
Eleven samples (8.2%) contained Listeria species, with a higher incidence found in ham . (14.0%, n=43) than in cervelat (6.8%, n=44) or vienna sausage samples (4.3%, n=47).
In Beijing, China, the presence of L. monocytogenes in retail meats (25 pork, 10 beef, 14
lamb and 21 chicken) were analyzed by Wang et al. (1992). Seven pork and one chicken
sample contained L. monocytogenes, whereas all beef and lamb were free of L.
monocytogenes. Meanwhile, 15 (60%) pork, 11 (52%) chicken, 7 (70%) beef, and 6
(43%) lamb samples were positive for other Listeria spp.
A variety of foods from local markets in Taipei, Taiwan was examined by Wong et al.
(1990). High incidence of L. monocytogenes was found in raw meat samples e.g.
58.8% of pork samples, 50% of chicken carcaseses and 38% of turkey parts, and 34% of
frozen semiready foods i.e. various types of dumplings, fish balls and meat balls.
However, only 4.4% of frozen cooked foods (frozen dim sum) were positive for L.
monocytogenes.
1.5.3 FRUITS AND VEGETABLES PRODUCTS
Fruits and vegetables are less often mentioned as sources of L. monocytogenes than other
foods (Brackett, 1988). However, raw vegetable products, e.g. coleslaw, were
implicated in a large outbreak in the Maritime Province of Nova Scotia in 1981. There
were 34 cases of perinatal listeriosis (9 cases of abortion or stillbirth, 23 cases of live
birth but of a seriously ill infant, 2 cases of live birth of a well infant), 7 cases of
nonpregnant adult listeriosis (6 cases of meningitis, and one case of aspiration pneumonia
and sepsis). The fatality rate for infants born alive was 27%. The mortality in meningitis
cases was 33%. L. monocytogenes serotype 4b was isolated from patient's blood, from
coleslaw from the refrigerator of the patients, and from unopened packages of coleslaw
from the same processing plant.
Schlech et al. (1983) reported this outbreak may be a case of indirect transmission of
listeriosis from an animal reservoir to human beings. The cabbage used in the implicated
coleslaw was grown on a farm fertilizing with sheep manure from flocks with known
cases of listeriosis. However, some researchers pointed out that fruits and vegetables
could likely become contaminated without manure fertilizing as a causative factor because
23
of the, close relationship of L. monocytogenes and plant products and soil (Brackett,
1988; Sizmur and Walker, 1988).
Ho et al. (1986) reported other outbreak of L. monocytogenes serotype 4b in eight
Boston-area hospitals. Fresh celery, tomatoes, and lettuce were linked to listeriosis in
hospitalized, immunosuppressed patients.
Several surveillance studies have been conducted on the occurrence of L. monocytogenes
on fruits and vegetables. An 11-months survey of 1,000 samples of 10 types of fresh
produce from Minneapolis area supermarkets (Heisick et al., 1989) revealed the
occurrence of L. monocytogenes on 28 (21.2%) potato samples, 19 (14.4%) radish
samples, 2 (2.2%) of cucumbers, and 1 (1.1 %) of cabbage. The researchers indicated the
contamination especially on radishes and potatoes were found throughout the year.
However, lettuce and mushrooms were only contaminated by L. innocua, whereas
broccoli, carrots, cauliflower, and tomatoes were free of Listeria spp.
Four of 60 samples of refrigerated ready-to-eat salads of ten different varieties including
beansprouts alone, mixed vegetable salads, and salads containing nuts and fruit were
reported to be contaminated by L. monocytogenes (Sizmur and Walker, 1988). Fruits
and vegetables included in two types of those contaminated salads were cabbage, celery,
onion, carrots, lettuce, cucumber, radish, fennel, watercress, leeks, and sultanas.
A surveillance study of various retail foods in Canada was also conducted (Farber et al. ,
1989a). No L. monocytogenes was found in 110 raw vegetable samples including (
lettuce, celery, tomatoes, and radishes. However, L. ivanovii was isolated from 1 (10%)
radish.
1. 5. 4 SEAFOOD PRODUCTS
Scientists in many countries have surveyed for the occurrence of L. monocytogenes in
seafood products. Fuchs and Surendran (1989) monitored 35 fish and fishery product
samples from local retail outlets in Cochin, India. None of the samples tested was
positive for L. monocytogenes. However, L. innocua was detected in 3 of 10 fresh
samples and 5 of 14 frozen samples. No Listeria was detected in dried, salted fish.
In the study of Weagant et al. (1988) in domestic and imported frozen seafood products
from several countries, 35 of 57 samples ( 61 % ) tested positive for Listeria species and 15
of 57 samples (26%) were positive for L. monocytogenes. Listeria species were found in
samples from 9 different countries of 12 that were examined (Table 1.3).
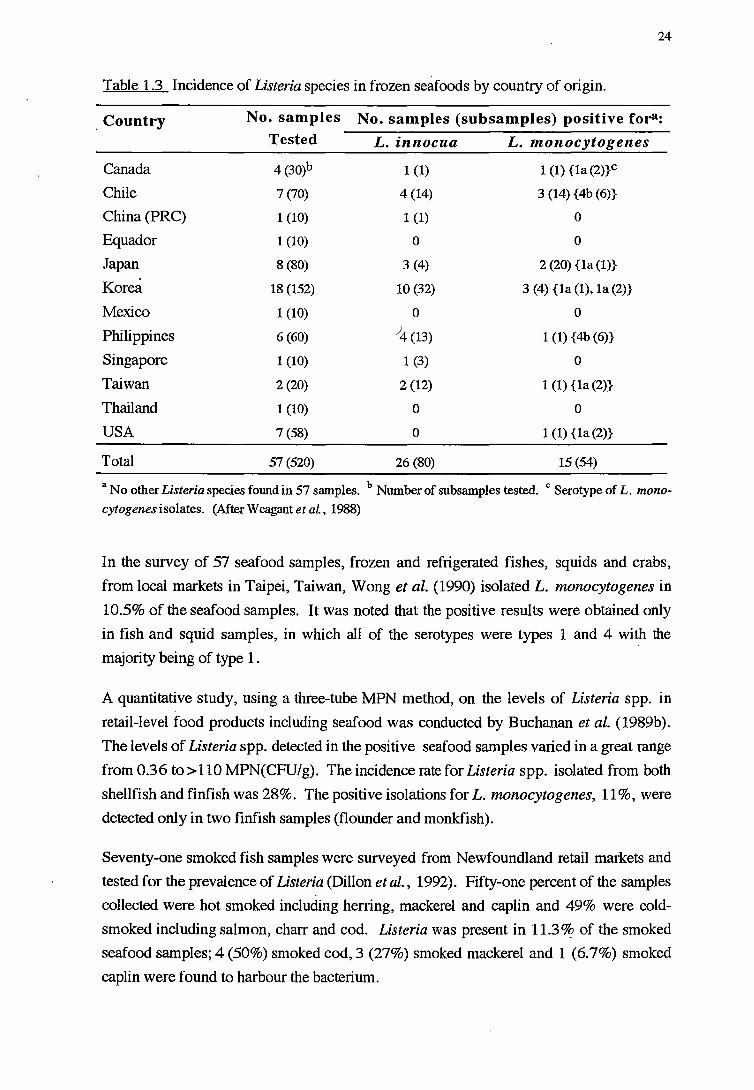
24
Table 1.3 Incidence of Listeria species in frozen seafoods by country of origin.
. Country No. samples No. samples (subsamples) positive fora: Tested L. innocua L. monocytogenes
Canada 4 (30)b 1 (1) 1 (1) {la (2)}c
Chile 7 (70) 4 (14) 3 (14) {4b (6)}
China(PRC) 1 (10) 1 (1) 0
Equador 1 (10) 0 0
Japan 8 (80) 3 (4) 2 (20) {la (l)}
Korea 18 (152) 10 (32) 3 (4) {la (1), la (2)}
Mexico 1 (10) 0 0
Philippines 6 (60) )4 (13) 1 (1) {4b (6)}
Singapore 1 (10) 1 (3) 0
Taiwan 2 (20) 2 (12) 1 (1) {la (2)}
Thailand 1 (10) 0 0
USA 7 (58) 0 1 (1) {la (2)}
Total 57 (520) 26 (80) 15 (54)
a No other Listeria species found in 57 samples. b Number of subsamples tested. c Serotype of L. mono
cytogenes isolates. (After W eagant et al, 1988)
In the survey of 57 seafood samples, frozen and refrigerated fishes, squids and crabs,
from local markets in Taipei, Taiwan, Wong et al. (1990) isolated L. monocytogenes in
10.5% of the seafood samples. It was noted that the positive results were obtained only
in fish and squid samples, in which all of the serotypes were types 1 and 4 with the
majority being of type 1.
A quantitative study, using a three-tube MPN method, on the levels of Listeria spp. in
retail-level food products including seafood was conducted by Buchanan er al. (1989b).
The levels of Listeria spp. detected in the positive seafood samples varied in a great range
from 0.36to>110 MPN(CFU/g). The incidence rate for Listeria spp. isolated from both
shellfish and finfish was 28%. The positive isolations for L. monocytogenes, 11 %, were
detected only in two finfish samples (flounder and monkfish).
Seventy-one smoked fish samples were surveyed from Newfoundland retail markets and
tested for the prevalence of Listeria (Dillon et al., 1992). Fifty-one percent of the samples
collected were hot smoked including herring, mackerel and caplin and 49% were cold
smoked including salmon, charr and cod. Listeria was present in 11.3~ of the smoked
seafood samples; 4 (50%) smoked cod, 3 (27%) smoked mackerel and 1 (6.7%) smoked
caplin were found to harbour the bacterium.
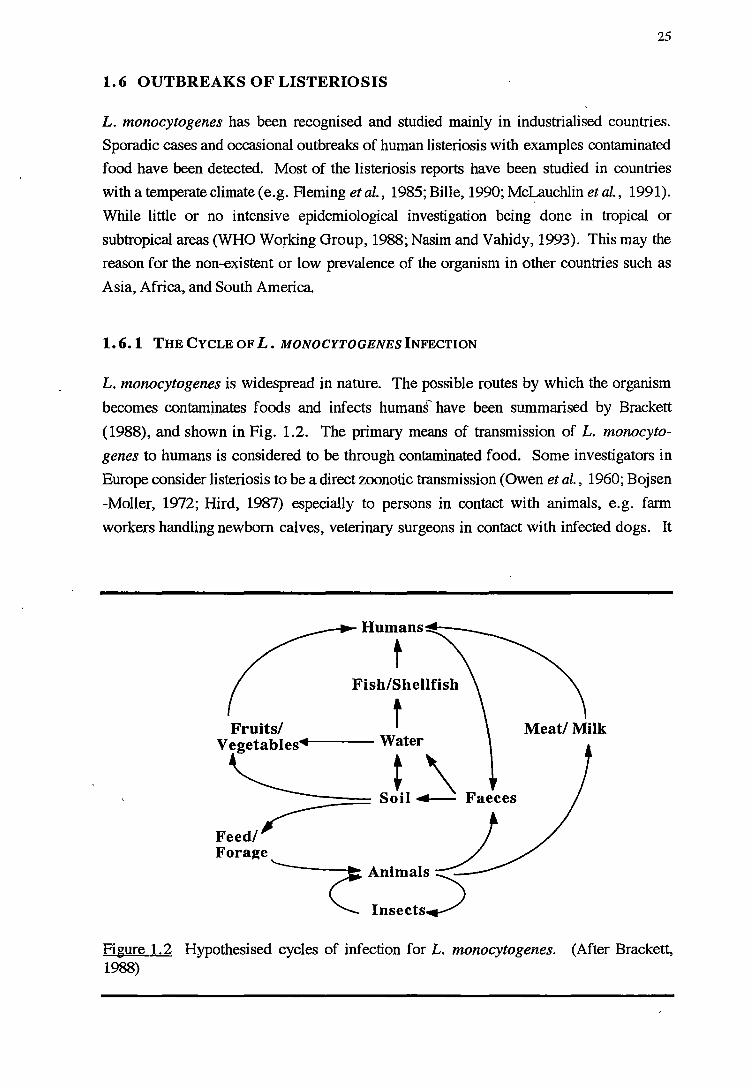
25
1. 6 OUTBREAKS OF LISTERIOSIS
L. monocytogenes has been recognised and studied mainly in industrialised countries.
Sporadic cases and occasional outbreaks of human Iisteriosis with examples contaminated
food have been detected. Most of the listeriosis reports have been studied in countries
with a temperate climate (e.g. Fleming et al., 1985; Bille, 1990; Mc~uchlin et al., 1991).
While little or no intensive epidemiological investigation being done in tropical or
subtropical areas (WHO Working Group, 1988; Nasim and Vahidy, 1993). This may the
reason for the non-existent or low prevalence of the organism in other countries such as
Asia, Africa, and South America
1. 6.1 THE CYCLE OF L. MONOCYTOGENES INFECTION
L. monocytogenes is widespread in nature. The possible routes by which the organism
becomes contaminates foods and infects humans have been summarised by Brackett
(1988), and shown in Fig. 1.2. The primary means of transmission of L. monocyto
genes to humans is considered to be through contaminated food. Some investigators in
Europe consider listeriosis to b~ a direct zoonotic transmission (Owen et al., 1960; Bojsen
-Moller, 1972; Hird, 1987) especially to persons in contact with animals, e.g. farm
workers handling newborn calves, veterinary surgeons in contact with infected dogs. It
t Fish/Shellfish
Fruits/ t Vegetables ____ Water
t\ ,--- Soil 4-- Faeces
Feed/ Fora~e
Insects
Figure 1.2 Hypothesised cycles of infection for L. monocytogenes. (After Brackett, 1988)
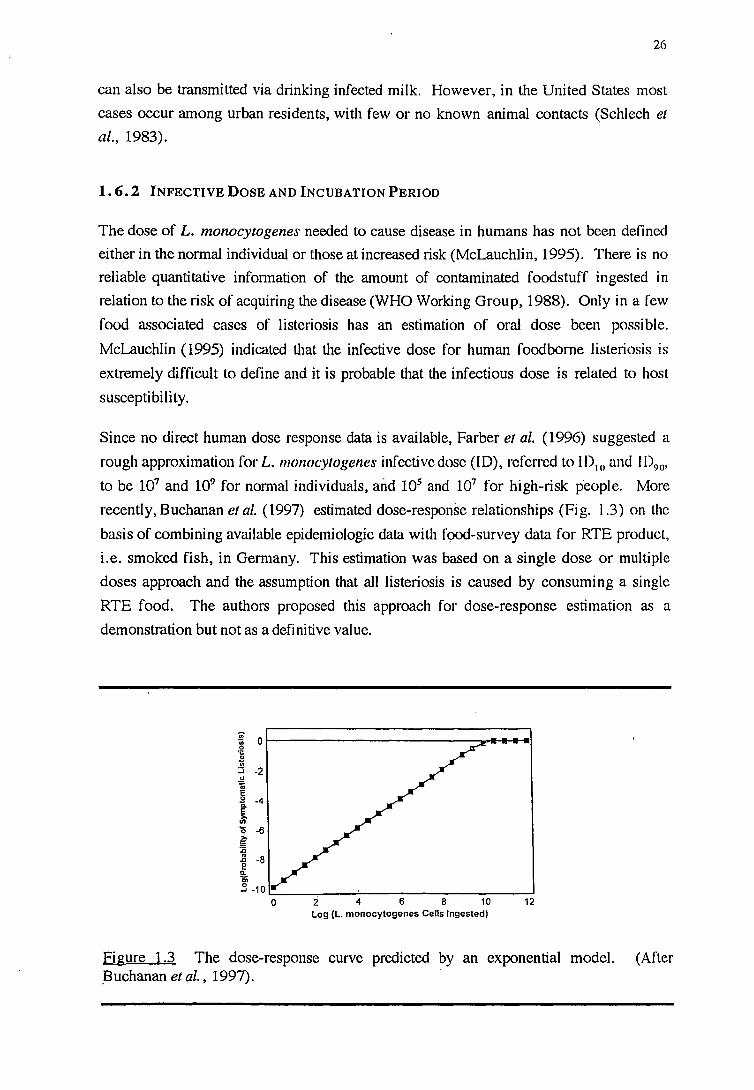
26
can also be transmitted via drinking infected milk. However, in the United States most
cases occur among urban residents, with few or no known animal contacts (Schlech et
al., 1983).
1. 6. 2 INFECTIVE DOSE AND INCUBATION PERIOD
The dose of L. monocytogenes needed to cause disease in humans has not been defined
either in the normal individual or those at increased risk (McLauchlin, 1995). There is no
reliable quantitative information of the amount of contaminated foodstuff ingested in
relation to the risk of acquiring the disease (WHO Working Group, 1988). Only in a few
food associated cases of listeriosis has an estimation of oral dose been possible.
McLauchlin (1995) indicated that the infective dose for human foodborne listeriosis is
extremely difficult to define and it is probable that the infectious dose is related to host
susceptibility.
Since no direct human dose response data is available, Farber et al. (1996) suggested a
rough approximation for L. monocytogenes infective dose (ID), referred to ID10 and ID90,
to be 107 and 109 for normal individuals, and 105 and 107 for high-risk people. More
recently, Buchanan et al. (1997) estimated dose-response relationships (Fig. 1.3) on the
basis of combining available epidemiologic data with f 9od-survey data for RTE product,
i.e. smoked fish, in Germany. This estimation was based on a single dose or multiple
doses approach and the assumption that all Iisteriosis is caused by consuming a single
RTE food. The authors proposed this approach for dose-response estimation as a
demonstration but not as a definitive value.
0 2 4 6 8 10 Log (L. monocytogenes Cells Ingested)
12
Figure 1.3 The dose-response curve predicted by an exponential model. (After _Buchanan et al. , 1997).
27
1.6.3 OUTBREAKS OF LISTERIOSIS IN HUMANS
The first report of listeriosis in humans was by Nyfeldt in 1929, who isolated L. mono
cytogenes from the blood of patients with an infectious mononucleosis-like disease (Gray ,
and Killinger, 1966). During 1933 and 1934, L. monocytogenes was established as a
cause of meningitis and perinatal infections in the United States (Bum, 1936). However,
until 1945 the organism was only isolated sporadically from humans and resulted in 36
cases of human listeric infection recorded in the medical literature (Kaplan, 1945). The
first recorded massive outbreak of human listeriosis occurred in East Germany between
1949 and 1957 and resulted in a dramatic increase in the number of stillborn infants. This
outbreak caused an awareness of listeric infections in humans, which gradually spread
from Europe to the United States (Seeliger, 1961; Schuchat et al., 1991a).
Despite increased reports of listeric infection, human listeriosis remains a rare disease
compared to other reportable illness. Sonnenwirth (1973) suggested the probability of the
disease to be more common but not recognised. The true incidence of human listeriosis is
largely unknown because of (a) variable interest in investigating probable cases of
listeriosis in different countries, (b) a general inability to detect mild listeriosis cases, and
(c) a lack of uniform reporting of the disease in different countries (Kaufmann, 1988).
Heightened awareness of L. monocytogenes caused by large-scale outbreaks of food
borne listeriosis in Maritime Provinces, Canada, in 1981 (Schlech et al., 1983); in
Boston, Massachusetts, in 1983; in southern California in 1985 (Linnan et al., 1988); in
Vaud, Switzerland, in 1984 to 1987; and in the United Kingdom in 1987 has led to
development of improved methods to detect the bacterium. Consequently, there have
been attempts to reevaluate the incidence of listeriosis in the United States.
Compilation of surveillance studies coordinated by the Centres for- Disease Control and
Prevention provides the overall rate of listeriosis in the United States as 0.7 case per
100,000 people (Broome, 1993). From this figure, Broome projected that at least 1,850
cases of bacteremia-or meningitis due to L. monocytogenes occur in the United States
each year, resulting in 425 deaths. However, in pregnant women, 12 cases per 100,000
births is a much higher rate. Disease in the mothers was generally not severe, but the
illness in the infant could be devastating, resulting in fetal death, stillbirth, or severe
neonatal sepsis. In addition, individuals with underlying immunocompromising disease
(e.g. chronic renal disease, human immuno-deficiency virus (HIV) infection, or cancer)
were at increased risk for listeriosis.

28
Data concerning prevalence of listeriosis in Canada between 1971 and 1982 reveal a dis
proportion~tely high incidence of listeric infections in Nova Scotia (2.68 cases/106
people) and Prince.Edward Island (2.61 cases/106 people) as compared to the remaining
Canadian provinces (average of 0.63 case/106 people). The higher incidence of listeriosis
in Nova Scotia is the direct result of a major foodborne outbreak in 1981 which was
linked to consumption of contaminated coleslaw (Schlech et al., 1983).
In the UK, the dramatic increase in the number of listeriosis cases, ea 290 cases/year,
during 1987-1989 was reported to be associated with imported pate from a single
manufacturer (Mclauchlin et al., 1991). However, from 1989 to 1994 the incidence has
returned to levels recorded in the early 1980s, ea. 100 cases/year (McLauchlin and
Newton, 1995). The authors indicated seasonal distribution particularly in late summer or
autumn associated with the marked peak in the numbers of listeriosis cases.
Nasim and Vahidy (1993) reported the incidence of human listeria! meningitis in Karachi,
Pakistan. Sixty patients who were suffering from symptomatic meningitis or encephalitis
were screened for the presence of L. monocytogenes. Only one out of 60 CSF samples,
but none from blood, was found to harbor L. monocytogenes, the incidence being
1.66%. The authors presumed that the consumption of Listeria contaminated food was
the most probable cause of the infection.
Souef and Walters (1981) reported the first neonatal listeriosis outbreak in Western
Australia between January 1978 and October 1979. Twelve cases of neonatal listeriosis
were recorded. The authors indicated that the reduced mortality rate for the cases, 17%,
was because the treatment was instituted promptly. A seasonal incidence was observed
with 10 of the 12 cases occurring between January and March which are the the hottest,
driest period of the year in the southern half of Western Australia No other common
epidemiological factor was identified. Additionally in 1990, an outbreak of listeriosis in
pregnant women occurred in Western Australia (Watson et al., 1990). The King Edward
Memorial Hospital for women reported 10 cases in pregnant women and 11 cases in
fetuses or infants. Watson et al. (1990) demonstrated that in healthy adults (including
pregnant women) Listeria infection is usually asymptomatic or may cause a minor illness
with a mild fever, headache, and aches and pains which are similar to acute febrile
illnesses. However, in a case where a baby was infected, the pregnant mother will suffer
a significant febrile illness. This epidemic resulted in 6 stillbirths or mid-trimester
miscarriages with a case-fatality rate of 55%. Strong circumstantial evidence indicated
that the epidemic resulted from a foodborne origin. A number of different types of food,
namely cooked diced chicken, pate, pastrami, salami and processed meats in Western
Australia were found to be. contaminated with L. monocytogenes. Furthermore, L.
monocytogenes was also detected in a sample of pate from patient's refrigerator who had
29
eaten a certain brand of pate in two weeks prior to delivery of a stillborn child. The
authors suggested that the incubation period for listeriosis is not accurately known but
probably ranges between two days and three weeks. Recently from May 1990 to July
1993, 73 cases of listeriosis were recorded in Victoria, Australia (Ng and Forsyth, 1993).
All cases have been sporadic and isolated. The infection resulted in 33 matemo-fetal
cases with 13 miscarriages and deaths (39%) and 40 non-pregnant cases with 9 deaths
(23%). This series of cases appears typical for those occurring in many countries, and
thus listeriosis in humans, although of relatively low incidence, is an extremely serious
infection of high mortality.
1.6.4 OUTBREAKS OF LISTERIOSIS IN ANIMALS
L. monocytogenes was first described by Murray (1926) in a colony of laboratory
rabbits. The organism has also been recovered from more than 50 species of animals,
including both domesticated and feral ruminants and monogastric animals (Seeliger, 1961;
Gray and Killinger, 1966; Brackett, 1988; Inoue et al., 1992).
Listeriosis in domestic livestock is being recognized particularly in developed countries
with increasing frequency around the world (Ryser and Marth, 1991). However, the
exact incidence of listeric infections in domestic livest9ck remains unknown. In eastern
Gippsland, Victoria, Australia, during winter and spring 1978, an outbreak of ovine
listerial meningo-encephalitis on sheep farms was reported (Vandegraaff et al., 1981).
Sheep of all ages and both sexes were affected, and the highest incidence was observed in
lactating ewes and weaners. The morbidity rate in affected flocks ranged from 0.2 % to
8.0%, and the case fatality rate was almost 100%. · The peak incidence of disease
followed a period of continuous heavy rain and folding of grazing pasture, and the
majority of affected flocks were located on poorly drained coastal sandy soil.
An outbreak of abortions due to L. ivanovii in a flock of 840 five-year-old Merino ewes
grazing in the north-west slopes region of New South Wales was' reported by Sergeant et
al. ( 1991). Approximately 110 lambs were either born dead, or died shortly after birth.
The authors suggested the spoiled hay was the source of the organism.
In addition to relatively small numbers of acutely infected sheep, goats, and cattle,
Seeliger (1961) suggested that there were substantjally larger proportions of animals
within a herd which may be asymptomatic carriers of L. monocytogenes and shed the
organism in faeces and milk. The role of the symptomless carrier was clearly
demonstrated in another report in which 30 of 44 listeriosis outbreaks in sheep farms
involved introduction of clinically healthy animals from known infected herds (Seeliger,
30
1961). Thus these results indicate that a substantial pool of asymptomatic carriers exists
to disseminate and perpetuate this disease.
The number of cases of animal listeriosis has often been observed to reveal seasonal
variation. In the Northern Hemisphere including England, Bulgaria, Hungary, United
States, France, and Germany, listeriosis in domestic animals generally occurs from late
November to early May and has been most prevalent during February and March (Gray
and Killinger, 1966). Climate appears to play a rather important role in listeric
encephalitis. Gray and Killinger (1966) observed an increase in the number of outbreaks
2 to 4 days after sudden drops in temperature or heavy snow falls. Gill ( 1931) reported
that, in New Zealand, the greatest incidence occurred during the dry season and
disappeared after rains. Numbers of listeriosis cases increased when animals were fed
silage during periods of extreme cqld, whereas sharp decreases in numbers of reported
cases were observed as soon as grass was available. Dijkstra (1971) noted in Ryser and
Marth (1991) that most cases of listeric abortion in cattle in The Netherlands occurred
between December and May. Approximately 40% of these cases were attributed to
consumption of contaminated silage. Recent changes in production methods have
reduced levels of L. monocytogenes in silage, which in tum had led to a considerable
decrease in the incidence of listeriosis in silage-fed animals (Ryser and Marth, 1991).
Listeriosis in aquatic animals had been speculated as early as 1957. In Romania, Stamatin
et al. (1957), cited in Gray andKillinger(1966) thatL. monocytogenes was isolated from
viscera of pond-reared rainbow trout. The fish had been fed meat from a donkey which
died of an undetermined cause. The fish showed listlessness interrupted by brief periods
of agitation, loss of appetite, apparent blindness, blackened integument, and bloody
discharge from the anus, particularly by the females. The mortality rate was approxi
mately 50%. The disease could be transmitted to trout but not to carp by intra-muscular
or intracranial inoculation.
Leung et al. (1992) examined channel catfish (Ictalurus punctatus) which is the most
widely cultured species found in the United State due to the high productivity and low
production cost. The catfish, which were grown in aquaculture ponds at Auburn
University, Auburn, Alabama had been fed diets containing 26 or 38% protein with
restricted and satiety feeding methods for 6 months. The restricted feeding method limits
the amount of feed and only one feeding time per day for catfish, while in the satiety
feeding method the feeds are available whenever the fish trigger the feeding device. The
presumptive enumeration of Listeria spp. on the fish surf ace rinse and visceral samples
showed that there was no significant difference (P<0.05) in Listeria! concentrations in
these samples due to feeding method or feed protein level. Nonetheless, it was noted that
there was an approximate 1 log reduction between Listeria found on fish skin associated
31
with the higher protein diet. However, the presumptive Listeria! counts were found to be
much higher in the fish visceral samples (mean counts 1.99 log cfu/g wet weight of
sample) and hence caution should be taking during the evisceration step in fish processing
to avoid cross-contamination.
1. 7 CONTROL AND PREVENTION OF HUMAN FOODBORNE
LISTERIOSIS
Foods are regarded as the major source of human listeriosis, the prevention of the disease
should begin at the farm and continue through food processing to selection and handling
by consumers. L. monocytogenes is ubiquitous and, together with its ability to withstand
harsh environments, it has often bee_!} detected in a variety of foods as mentioned
previously. It is known that the organism cannot always be eradicated from finish
products or environment but the risk of infection can be reduced (Farber et al., 1996).
The application of HACCP system which was originally developed in 1960's by the
Pilsbury Company, the National Aeronautics and Space Administration (NASA), and the
U.S. Army Natick Laboratories, has currently been reintroduced (Ray, 1996). The Food
Safety and Inspection Service (FSIS) of the USDA, the FDA, the International
Commission on Microbiological Specifications for Foods (ICMSF), and the FAO
advocate the HACCP system to be used in the food industries in the United States and '
other countries (FAO, 1994). Generally, HACCP is accepted as a scientific based, food
safety management system using the approach of controlling critical points in ·food
handling to prevent food safety problems which is better than end-product testing.
HA CCP has been recommended to be used from fann to consumer to minimise the risk of
listeriosis (Roberts et al., 1996).
1. 7.1 FARM
Considering the cycle of L. monocytogenes infection (see section 1.6.1), HACCP could
be applied at the farm to obtain a good quality i.e. less contamination, of raw material
such as vegetables, milk, cattle and fish: For example, animals should be raised in clean
environment. Animal feed such as1 silage (see section 1.4.2) should be controlled to
rapidly achieve the pH<4.0 which is the critical point to prevent the proliferation of L.
monocytogenes. The harvested raw material should be stored at low temperature (e.g.
<5°C) until transportation to the processing plant.
32
1. 7. 2 PROCESSING
According to WHO Working Group (1988), foods have been placed into four categories.
1. Raw foods e.g. raw vegetables and meats
2. Processed raw foods not treated listeicidally by heating e.g. coleslaw, fermented
sausages, raw-milk cheeses, cold-smoked fish
3. Processed foods treated listericidally by heating but subjected to potential recon
tamination during subsequent handling e.g .. certain cheeses and commercially ·-
processed meats that are sliced or altered after thermal processing.
4. Processed foods treated listeicidally by heating while in an intact package (e.g. cooked
ham) or which are aseptically packaged immediately after listericidal treatment (e.g.
certain dairy products).
Adequate cooking of some of these primary food sources and good food handling
practices were shown to be sufficient in eliminating and preventing post/cross
contamination. However, emphasis should be placed on high risk foods such as foods
associated with outbreaks, ready-to-eat foods (Category 2) that can support growth of L.
monocytogenes to high populations within the expected product shelf life and are
consumed without subsequent cooking.
Regarding the regulatory policy on L. monocytogenes contaminated foods, the applica
tion of 'zero tolerance' is still employed by several countries e.g. USA, Switzerland and
Hungary while the application of food group risk-based policy are accepted by some
European countries (Germany, United Kingdom, and Denmark), as well as Australia and
Canada (Ben Embarek, 1994; FAO, 1994). There was controversy that the complete
exclusion of L. monocytogenes from foods and food processing plants is unrealistic,
even by the application of the most stringent criteria (Teufel, 1994; Gilbert, 1Q95).
Recently, Canada's updated regulatory policy based on the principles of HACCP and
health risk assessment has set a compliance criteria for L. monocytogenes in RTE foods
(Farber et al., 1996). The highest priority is given to those RTE foods which have been
associated with listeriosis and those with a greater than 10 days shelflife (Table 1.4).
Processing plants should implement HACCP principles throughout the processing steps
beginning from the reception of raw material to processing, packaging and storage of end
product and distribution to ensure the absence of L. monocytogenes in foods. In
addition, several strategies can be implemented in an attempt to prevent contamination and
further outbreaks of L. monocytogenes infection. If possible, foods should be
formulated to obtain the condition that are not favourable for the growth or survival of L.
monocytogenes. Different strategies are applied to different foods aiming to adjust the
33
intrinsic (e.g. water activity, pH) or extrinsic (e.g. temperature, packaging) property
related in control or preventing outgrowth of L. monocytogenes in foods. The interactive
or synergistic effects of those factors to stabilise and ensure safe foods are well explained
by the hurdle technology of Leistner (1994).
Table 1.4 The Canadian compliance criteria for L. monocytogenes (LM) in RTE foods
Category
1. RTE foods causally linked to listeriosis (includes: soft cheese, liver pate, coleslaw mix with shelf-life> 10 days, jellied pork tongue)
2. All other RTE foods supporting growth of L. monocytogenes with refrigerated shelf-life >10 days
Action level forLM Immediate action
>O cfu/50 g Class I recall to retail level
>O cfu/25 g Consideration of public alert Appropriate follow-up at plant level Class II recall to retail level
3. RTE foods supporting growth of L. mono- s:lOO cfu/g Allow sale-Class II recall or cytogenes with refrigerated shelf-life s:lO days stop sale depends on the GMP, and all RTE foods not supporting growth status
After Farber et al., 1996.
1. 7.3 RETAIL
To maintain a good quality of a product and minimise any cross/post contamination, some
basic rules recommended by Roberts et al.(1996) to be applied at the retail section such
as: separate raw food (Category 1) from RTE foods (Categories 2-4), use an effective
method of cleaning and disinfecting the surface including equipment that contact RTE
foods, maintain proper storage and display temperatures (e.g. <5°C), and sell the
products only 'use by' or 'best by' code date.
1. 7. 4 CONSUMERS
Apart from education and training the food producers, the general public especially the
high-risk population also need to be educated about the risks associated with foodborne
listeriosis and preventative measures such as foods selection, hygiene and good food
handling practices. Educational advisory pamphlets have been published in Australia
(Anon., 1994, 1995), for some instances, which deal directly with issues related to
pregnant women. The "For pregnant women dietary advice on listeriosis" and
"Environmental Health Guide, Listeria infection and pregnancy" provide generic
information on listeriosis and also more specific information for persons at high risk,

34
including the avoidance of chilled ready-to-eat foods e.g. pate, smoked seafood, soft
cheeses, pre-prepared or stored salads, the hygiene of foods preparation etc. The h1gh
risk individuals have been informed that although listeriosis is a relatively uncommon
disease, the mortality rate is relatively high especially in foetuses and newborn babies (up
to30-50%).
2 35
THE OCCURRENCE OF LISTERIA SPP. INCLUDING
L. MONOCYTOGENES IN NORTH WEST BAY
2.1 INTRODUCTION
L. monocytogenes is widely distributed in the environment and has been isolated from a
variety of sources. The organism is frequently found in the intestinal tract of healthy and
infected warm-blooded animals and in faeces disposed to soil or septic tanks. Several
studies (Seeliger, 1961; Welshimer and Donker-Voet, 1971; Weis and Seeliger, 1975)
have suggested that L. monocytogenes also lives as a saprophyte in soil and plants. The
transmission and distribution of the organism from these reservoirs to aquatic
environments such as river water sewage, effluent and estuarine water (Watkins and
Sleath, 1981; Al-Ghazali and Al-Azawi, 1988a; Colburn et al., 1990; Motes, 1991) may
occur especially due to rainfall or ground water movement. Food is regarded as the major
source of human infections (Farber and Peterkin, 1991) and shellfish, as filter feeders
growing in such water can accumulate the pathogen (Brackett, 1988). These may, if
eaten raw or uncooked, cause listeriosis in the consumer.
Considering that listeriosis has become a major concern in recent years in Australia, there
are very few data concerning the occurrence and distribution of L. monocytogenes and
related species in aquatic environments. This chapter presents an investigation over a 12
months period in North West Bay, which is an area of considerable aquaculture activity in
southern Tasmania (see detail in 2.2.2.1). It provides excellent conditions for raising
Atlantic salmon (Salmo salar), which is currently the most commercially important
aquaculture species in Tasmania, and also for blue mussels (Mytilus edulis), an emerging
industry in this area. The increase in aquaculture activity in this area over the past 10
years has enhanced the potential for public health risks associated with consumption of L.
monocytogenes contaminated fish or shellfish which are not cooked before ingestion.
Furthermore, North West Bay may be served as an example of a small environmental
system which received input from rivers, streams, effluent from sewage treatment plant
and also from a number of factories established along the bay. Therefore, the emphasis
of this chapter is on the following aspects:
• To assess the occurrence and significance of Listeria species, especially L. mono
cytogenes, in aquatic environments e.g. inshore water, river water, sewage treatment
pond and fish factory effluents, sediments, and in edible shellfish growing in North
West Bay, Tasmania. This involved employing an extensive and modified cultural
method for the isolation of Listeria spp. in these environments.
36
• Examine the controversial use of faecaJ coliforms and E. coli as the indicators for
microbial pathogen occurrence. The study was intended to establish if a relationship
exists between the amount of faecal coliforms/ E. coli and the occurrence (presence or
absence) of L. monocytogenes in water.
• The quality of the waterway varies due to a multiplicity of factors. This study was
undertaken to investigate the relationship between, some physicochemical (i.e. pH,
temperature and salinity) and climatological factors (rainfall), and the occurrence of L.
monocytogenes.
• To use a reliable and sensitive biotyping method, Multil9CUS Enzyme Electrophoresis
(MEE), for intraspecies typing of L. monocytogenes and, if possible, to determine the
distribution of strains in the environmental system.
2.2 MATERIALS AND METHODS
2.2.1 MATERIALS
Complete details of consqmables, reagents and media, equipment and reference cultures
used are presented in Appendix A.
2.2.2 METHODS
2. 2. 2.1 Sampling strategy and site descriptions
North West Bay
North West Bay is a small trapezoidal shaped bay located in southern Tasmania, at
longitude 147° 30~ E and latitude 43° S, approximately 22 kilometres south of Hobart
(Fig. 2.1). The watershed of the bay is relatively small with 67% of its area still under
natural vegetation (Matthews and Volframs, 1978). Small urban and industrial centres are
located around the shores of the bay. Due to its close proximity to Hobart, the area offers
considerable recreational p0tential which includes a number of beaches well suited for
swimming, diving and fishing. Launching facilities are provided at a number of locations
around the bay and the best of these is at Dru Point where there is also a small reserve
developed and maintained for picnics and school activities.
The bay is sheltered by the Tasmania mainland and also Bruny Island, approximately 1-2 -
kms to the east and separated from North West Bay by the D'Entrecasteaux Channel (see
Fig. 2.1). The major contributors to inshore water in the bay are the inputs from rivers
and creeks on mainland Tasmania which cover a catchment area of approximately 260
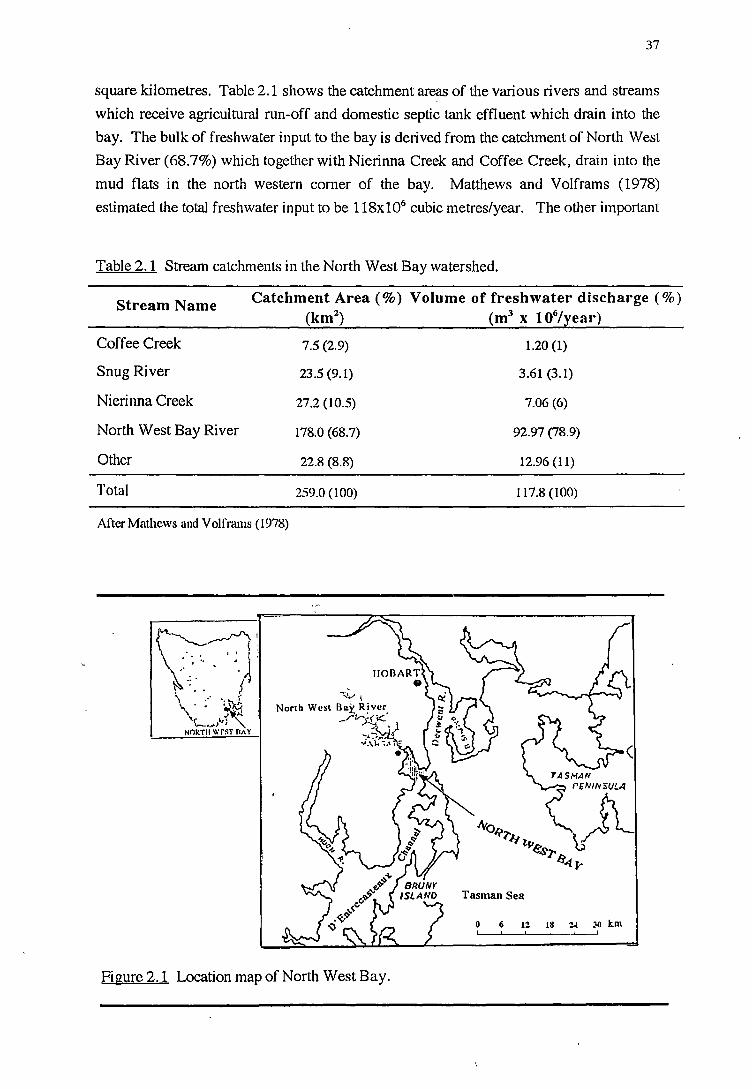
37
square kilometres. Table 2.1 shows the catchment areas of the various rivers and streams
which receive agricultural run-off and domestic septic tank effluent which drain into the
bay. The bulk of freshwater input to the bay is derived from the catchment of North West
Bay River (68.7%) which together with Nierinna Creek and Coffee Creek, drain into the
mud flats in the north western corner of the bay. Matthews and Volframs (1978)
estimated the total freshwater input to be 118xl06 cubic metres/year. The other important
Table 2.1 Stream catchments in the North West Bay watershed.
Stream Name Catchment Area(%) Volume of freshwater discharge{%) (km2
) (m3 x 106/year)
Coffee Creek 7.5 (2.9)
Snug River 23.5 (9.1)
Nierinna Creek 27.2 (10.5)
North West Bay River 178.0 (68.7)
Other 22.8 (8.8)
Total 259.0 (100)
After Mathews and V olframs ( 1978)
V~I
'' ~·: . . ·. f ~ . . .. . r
"\ .I >! '.; :~~
\r .. z' """'--•·"") ~
Nc'lkTll wrST BAY
.,, ... ~ ~
North West Ba}: R!ver. _r~~i.}<-,
Figure 2.1 Location map of North West Bay.
1.20 (1)
3.61 (3.1)
7.06 (6)
92.97 (78.9)
12.96 (11)
117.8 (100)
Tasman Sea
0 6 12 UI 24 ~ km
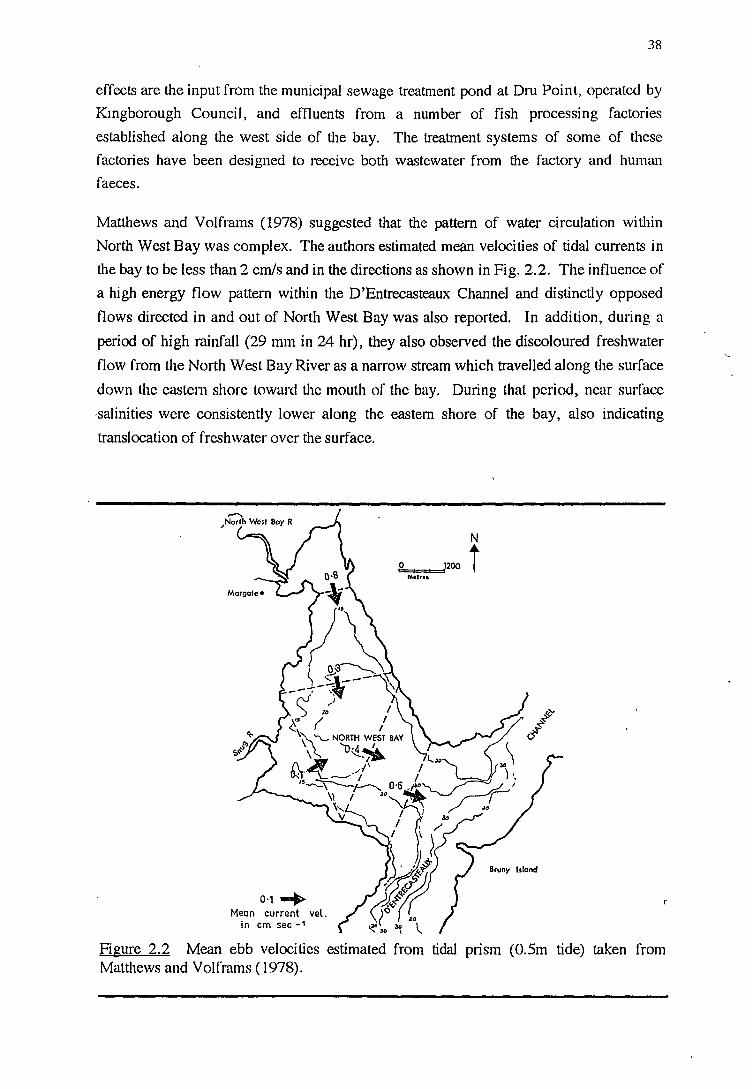
38
effects are the input from the municipal sewage treatment pond at Dru Point, operated by
Kmgborough Council, and effluents from a number of fish processing factories
established along the west side of the bay. The treatment systems of some of these
factories have been designed to receive both wastewater from the factory and human
faeces.
Matthews and Volframs (1978) suggested that the pattern of water circulation within
North West Bay was complex. The authors estimated mean velocities of tidal currents in
the bay to be less than 2 cm/sand in the directions as shown in Fig. 2.2. The influence of
a high energy flow pattern within the D'Entrecasteaux Channel and distinctly opposed
flows directed in and out of North West Bay was also reported. In addition, during a
period of high rainfall (29 mm in 24 hr), they also observed the discoloured freshwater
flow from the North West Bay River as a narrow stream which travelled along the surface
down the eastern shore toward the mouth of the bay. During that period, near surface
,salinities were consistently lower along the eastern shore of the bay, also indicating
translocation of freshwater over the surface.
0·1 ... Mean current vel.
in cm sec -1
N
=o ===='1200 t metrn
Figure 2.2 Mean ebb velocities estimated from tidal prism (0.5m tide) taken from Matthews and Volframs ( 1978).
'-
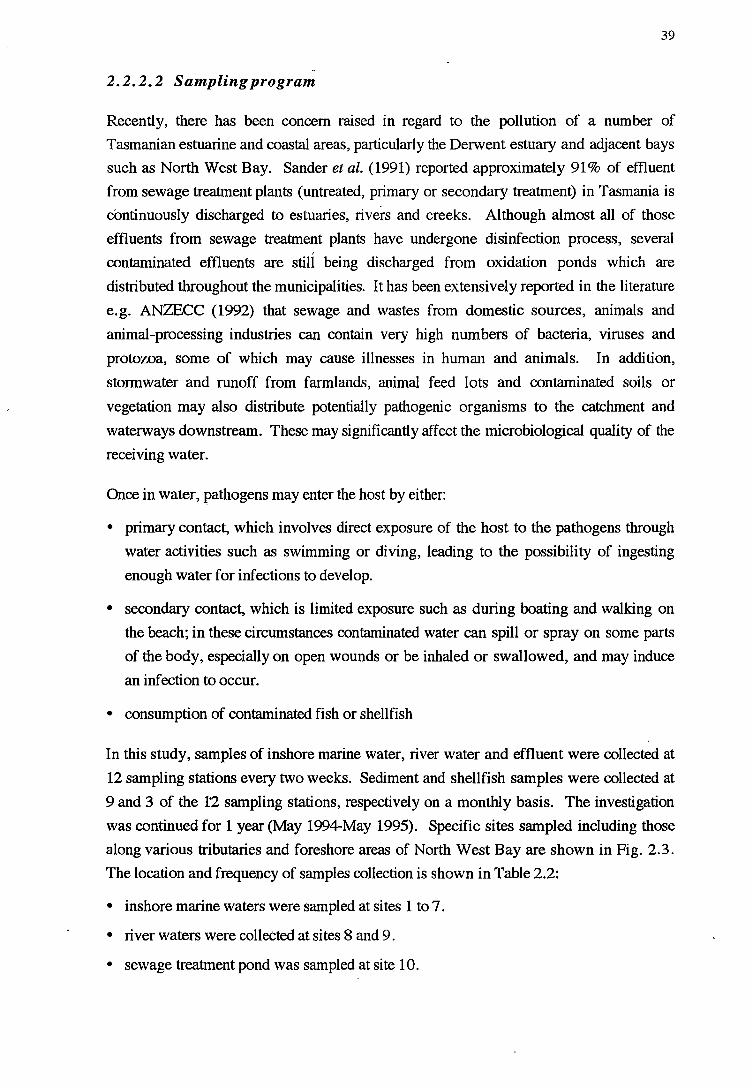
39
-2. 2. 2. 2 Sampling program
Recently, there has been concern raised in regard to the pollution of a number of
Tasmanian estuarine and coastal areas, particularly the Derwent estuary and adjacent bays
such as North West Bay. Sander et al. (1991) reported approximately 91 % of effluent
from sewage treatment plants (untreated, primary or secondary treatment) in Tasmania is
continuously discharged to estuaries, rivers and creeks. Although almost all of those
effluents from sewage treatment plants have undergone disinfection process, several
contaminated effluents are still being discharged from oxidation ponds which are
distributed throughout the municipalities. It has been extensively reported in the literature
e.g. ANZECC (1992) that sewage and wastes from domestic sources, animals and
animal-processing industries can contain very high numbers of bacteria, viruses and
protozoa, some of which may cause illnesses in human and animals. In addition,
stormwater and runoff from farmlands, animal feed lots and contaminated soils or
vegetation may also distribute potentially pathogenic organisms to the catchment and
waterways downstream. These may significantly affect the microbiological quality of the
receiving water.
Once in water, pathogens may enter the host by either:
• primary contact, which involves direct exposure of the host to the pathogens through
water activities such as swimming or diving, leading to the possibility of ingesting
enough water for infections to develop.
• secondary contact, which is limited exposure such as during boating and walking on
the beach; in these circumstances contaminated water can spill or spray on some parts
of the body, especially on open wounds or be inhaled or swallowed, and may induce
an infection to occur.
• consumption of contaminated fish or shellfish
In this study, samples of inshore marine water, river water and effluent were collected at
12 sampling stations every two weeks. Sediment and shellfish samples were collected at
9 and 3 of the 1'2 sampling stations, respectively on a monthly basis. The investigation
was continued for 1 year (May 1994-May 1995). Specific sites sampled including those
along various tributaries and foreshore areas of North West Bay are shown in Fig. 2.3.
The location and frequency of samples collection is shown in Table 2.2:
• inshore marine waters were sampled at sites 1 to 7.
• river waters were collected at sites 8 and 9.
• sewage treatment pond was sampled at site 10.
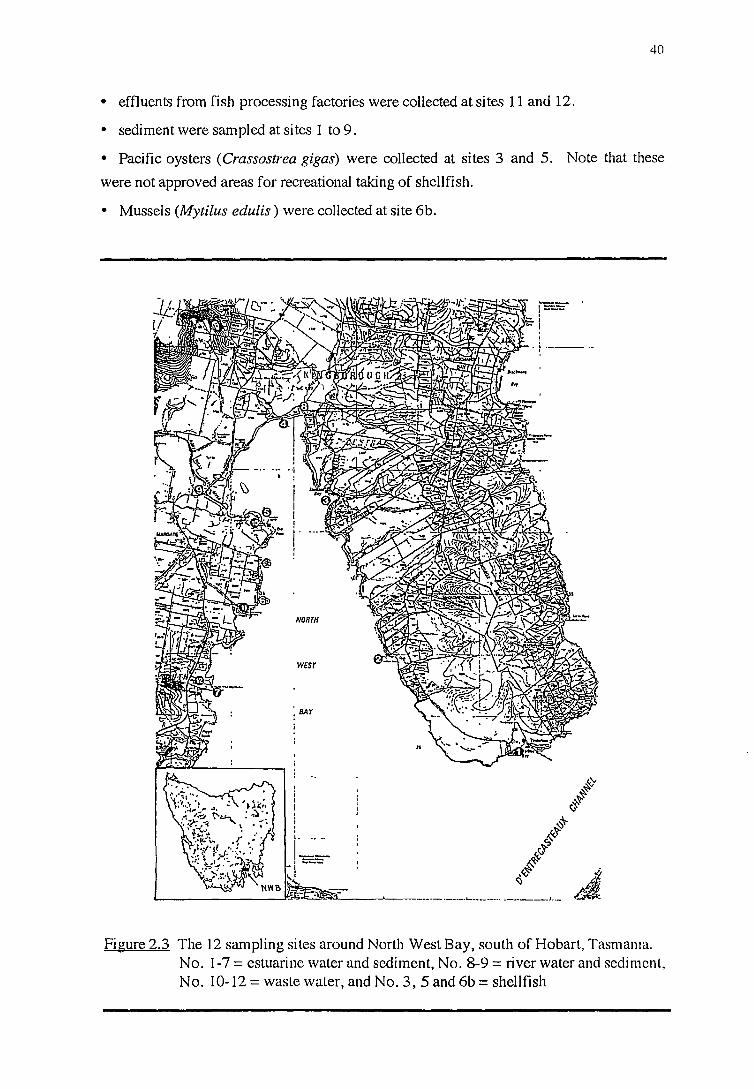
40
• effluents from fish processing factories were collected at sites 11 and 12.
• sediment were sam pied at sites 1 to 9.
• Pacific oysters (Crassostrea gigas) were collected at sites 3 and 5. Note that these
were not approved areas for recreational taking of shellfish.
• Mussels (Mytilus edulis) were collected at site 6b.
Figure 2.3 The 12 sampling sites around North West Bay, south of Hobart, Tasmama. No. 1-7 =estuarine water and sediment, No. 8-9 =river water and sediment, No. 10-12 =waste water, and No. 3, 5 and 6b =shellfish
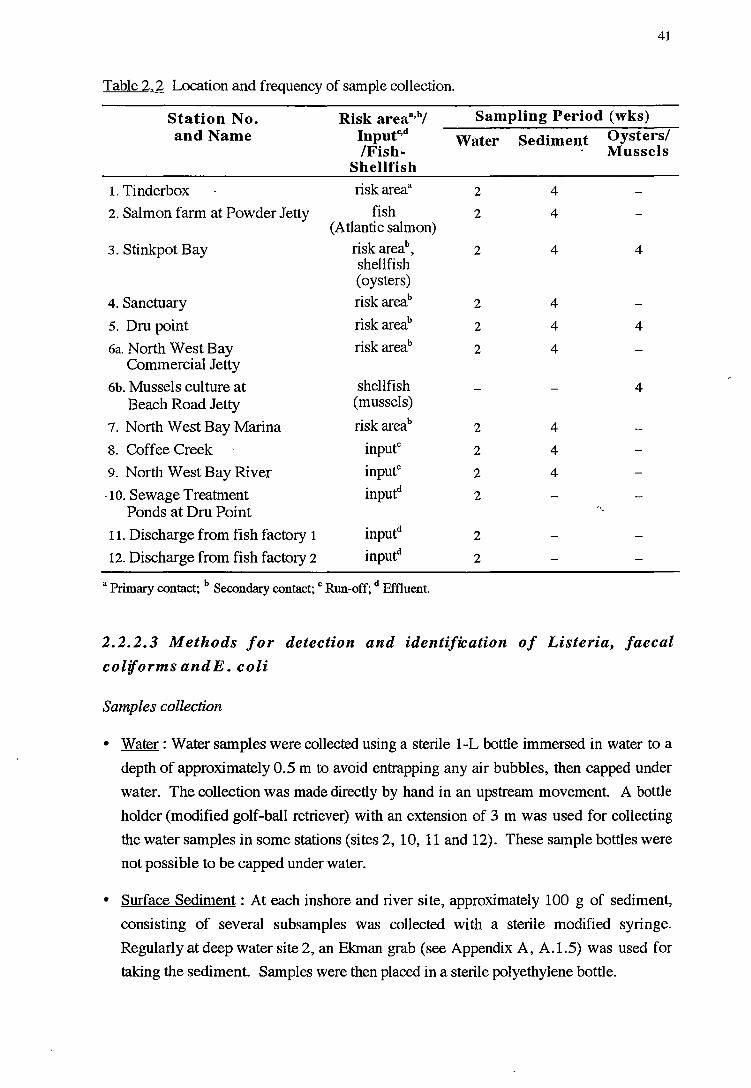
Table 2.2 Location and frequency of sample collection.
Station No. and Name
l. Tinderbox
2. Salmon farm at Powder Jetty
3. Stinkpot Bay
4. Sanctuary
5. Dru point
6a. North West Bay Commercial Jetty
6b. Mussels culture at Beach Road Jetty
7. North West Bay Marina
8. Coffee Creek
9. North West Bay River
-10. Sewage Treatment Ponds at Dru Point
11. Discharge from fish factory 1
12. Discharge from fish factory 2
Risk areaa,b/ Inputc,d /Fish
Shellfish
risk areaa
fish (Atlantic salmon)
risk areab, shellfish (oysters) risk areab
risk areab
risk areab
shellfish (mussels)
risk areab
inputc
inputc
inputd
a Primary contact; b Secondary contact; c Run-off; d Effluent.
41
Sampling Period (wks)
Water Sediment Oysters/ Mussels
2
2
2
2
2
2
2
2
2
2
2
2
4
4
4
4
4
4
4
4
4
4
4
4
2.2.2.3 Methods for detection and identification of Listeria, faecal
coliforms and E. coli
Samples collection
• Water: Water samples were collected using a sterile 1-L bottle immersed in water to a
depth of approximately 0.5 m to avoid entrapping any air bubbles, then capped under
water. The collection was made directly by hand in an upstream movement. A bottle
holder (modified golf-ball retriever) with an extension of 3 m was used for collecting
the water samples in some stations (sites 2, 10, 11 and 12). These sample bottles were
not possible to be capped under water.
• Surface Sediment: At each inshore and river site, approximately 100 g of sediment,
consisting of several subsamples was collected with a sterile modified syringe.
Regularly at deep water site 2, an Ekman grab (see Appendix A, A.1.5) was used for
taking the sediment. Samples were then placed in a sterile polyethylene bottle.
42
• Shellfish: Naturally grown oysters from shallow water (approx. 0.5 m depth) and
commercially grown mussels were collected into a plastic bag.
All samples were maintained at l0°G or lower during transport to the laboratory and were
processed within 6 h of collection. Collection of water samples was undertaken every 2
weeks and required approximately 3 hours to complete. Collection of sediment and
shellfish was undertaken every 4 weeks and required approximately 4 hours to complete.
Physicochemical parameters
Immediately after the samples at each site were collected, surface water salinity (%0), pH
and temperature (°C) were measured at 0.1 to 0.5 m depth with hand-held meters.
Between sites the meter probes and hands were cleaned using quaternary ammonium
disinfectant (Savlon) and 70% alcohol to prevent cross-contamination.
Meteorological parameters
The annual rainfall records from stations (Margate, Blackmans Bay Treatment Plant
station) that were close to the sampling sites were obtained from the Bureau of
Meteorology, Hobart, Tasmania.
Microbiological analysis
As there is no standard method for detecting L. monocytogenes in environmental
samples, currently used methods in the food industry were adapted. The USDA/FSIS
method (Dennis and Lee, 1989) was selected and evaluated for use with shellfish,
sediment and water samples including the use of filter method as shown in Fig. 2.4.
• Water : A 1 litre volume was filtered through a prefilter and membrane filter 0.45
µm-pore-size, 90 mm diameter. Both the prefilter and 0.45 µm member filter were
placed in 100 ml UVMl (Fig. 2.4) for detection of Listeria species.
The enumeration of faecal coliforms and E. coli followed the Australian Coliforms
Membrane filtration method for the examination of water and waste water (AS 4276.5)
(Australian Standard, 1995): appropriate volumes (0.1, 1, 10, 100 ml) were filtered
through 0.45 µm-pore-size, 47 mm diameter membrane filter. The filter was placed on
MLSA (Membrane lauryl sulphate agar) and incubated at 30°C for 2-4 hr, then at 44°C
for 14-18 hr. Presumptive faecal coliforms were counted on plates with 10 to 100
colonies (yellow) and representative colonies were subcultured into LTB (Lauryl
Tryptose Broth) and incubated at 44°C for 24 hr. Confirmed faecal coliforms (gas
producers) were then subcultured into tryptone water and incubated at 44°C for 24 hr.
Faecal coliforms were confirmed as E. coli by a positive indole reaction. Counts of
faecal coliforms and E. coli were expressed per 100 ml.
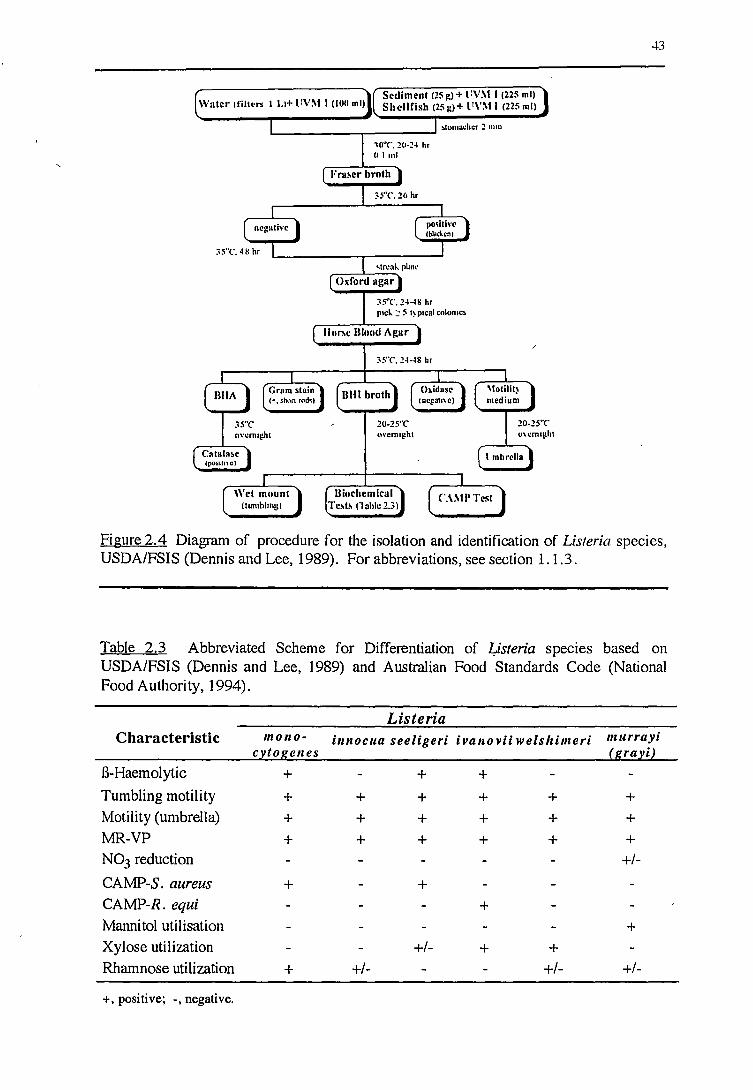
Water I filters I L1+ liV:\1 I (IOO ml) Sediment 125g)+ i:v:\11 (225 ml) Shellfish (25g)+ l 1\':\1 I (225 ml)
negnti\'e
3S"C.48hr
Gram stain , .. , shtlr1 rod.;}
35"(' O\'Cm1ght
Wet mount (lumhhnyl
10"C. 20-~4 hr II I ml
Fra~cr broth
:;s0 c. 26 hr
podth·e lblaclenl
3S"C'. 24-18 hr p1cL :: S 1~ p1cal colonic•
llor~e Hlootl Aitar
nm broth
20-2S"C ll\'Cm1g_ht
Olidase IDC!,!311\C)
20-25"C o\cm1g.ht
I mhrella
Biochemical Tc~b nahlc2.3l
C.\:\1PTcsl
..+3
Figure 2.4 Diagram of procedure for the isolation and identification of Listeria species, USDA/FSIS (Dennis and Lee, 1989). For abbreviations, see section 1.1.3.
Table 2.3 Abbreviated Scheme for Differentiation of Listeria species based on USDA/FSIS (Dennis and Lee, 1989) and Australian Food Standards Code (National Food Authority, 1994).
Listeria Characteristic lnOllO· i111zoc11a seeligeri iva1zovii welslzimeri mllrrayi
cytogenes (grayi)
B-Haemolytic + + + Tumbling motility + + + + + + Motility (umbrella) + + + + + + MR-VP + + + + + + N03 reduction +/-
CAMP-S. aureus + + CAMP-R. equi + Mannitol utilisation + Xylose utilization +/- + + Rhamnose utilization + +/- +/- +/-
+,positive; -, negative.
44
• Surface Sediment : Sediment samples in polyethylene bottles were mixed by stirring
with a sterile handheld spoon, and 25 g were added to 225 ml of UVMl (Fig. 2.4) for
detection of Listeria species.
• Shellfish: As described in the USDA/FSIS method (Dennis and Lee, 1989) for the
microbiological analysis for food, 25 g of each sample was added to 225 ml of UVMl
(Fig. 2.4) and stomached for 2 minutes for detection of Listeria species.
Preliminary study of the sensitivity of Listeria detection method (validated recovery)
To demonstrate that the methods described above were adequately sensitive for the
purpose of this project and to determine the minimum detection limit, a sensitivity test was
set up. The absolute sensitivity of the UVM 1, Fraser broth and Oxford agar warm
enrichment was evaluated by inoculation of two sterilized water samples ( 1 L) with low
inoculums of an overnight 37°C BHI broth culture of L. monocytogenes. Similar
artificial contamination with L. monocytogenes was also made with two sterilized
sediment samples (25 g) and one oyster sample (25 g). Then the samples were processed
according to the methods. A control of each type of sample was processed at the same
time. For each sensitivity test, a ten fold dilution series was made in sterile 0.1 % Peptone
Water from the same original L. monocytogenes culture. The number of organisms in
each dilution was quantified by a plate count of the dilution series after 24 hr incubation at
37°C on Tryptic Soy Agar (TSA).
2. 2. 3 METHOD FOR MULTI LOCUS ENZYME ELECTROPHOSIS (MEE)
The technique used for MEE was that described by Selander et al. ( 1986). Details of the
procedure and reagents used are given in Appendix B. MEE was performed by studying
the mobility of the following 12 enzymes: Alanine dehydrogenase (ALA), Catalase
(CAT), Fumarate hydratase (FUM), Glucose-6-phosphate dehydrogenase (G6PD),
Glyceraldehyde-3-phosphate dehydrogenase (GP), Mannose phosphate isomerase (MPI),
Nucleoside phosphorylase (NP), Peptidase-leucyl-leucyl-glycine (PLG), Phosphogluco
mutase (PGM), Phosphoglucose isomerase (PGI), 6-Phospho-gluconate dehydrogenase
(6PGD), and Superoxide dismutase (SOD). A brief diagram showing the steps in
performing MEE is shown in Fig. 2.5.
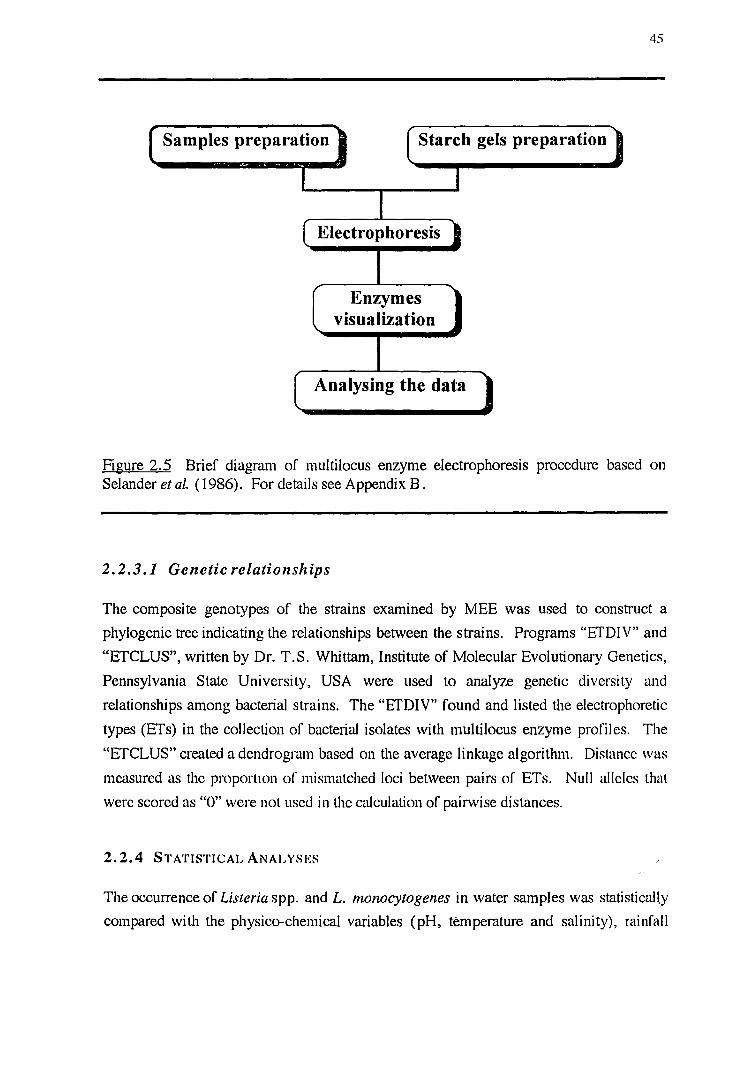
Samples preparation Starch gels preparation
Electrophoresis
Enzymes visualization
Analysing the data
45
Figure 2.5 Brief diagram of multilocus enzyme electrophoresis procedure based on Selander et al. ( 1986). For details see Appendix B.
2.2.3.1 Genetic relationships
The composite genotypes of the strains examined by MEE was used to construct a
phylogenic tree indicating the relationships between the strains. Programs "ETDIV" and
"ETCLUS", written by Dr. T.S. Whittam, Institute of Molecular Evolutionary Genetics,
Pennsylvania State University, USA were used to analyze genetic diversity and
relationships among bacterial strains. The "ETDIV" found and listed the electrophoretic
types (ETs) in the collection of bacterial isolates with multilocus enzyme profiles. The
"ETCLUS" created a dendrogram based on the average linkage algorithm. Distance was
measured as the proportion or mismatched loci between pairs or ETs. Null alleles that
were scored as "O" were not used in the calculation of pairwise distances.
2.2.4 STATISTICAL ANALYSgs
The occurrence of Listeria spp. and L. monocytogenes in water samples was statistically
compared with the physico-chemical variables (pH, temperature and salinity), rainfall
46
records and the amount of faecal coliforms and E. coli/100 ml using the SAS1 LOGISTIC
procedure. A probability model previously developed (Ratkowsky and Ross, 1995), was
used to relate growth/no growth to the explanatory variables, the model form being as
follows:
logit(P) b0 + b1 ln(T-Tmin) + b2 ln(pH-pHmin)+ b3 ln(S+l)
b4 ln(Rf24+1) + b5 ln(fc+l) + b6 ln(ec+l) (2.1)
The logit is a mathematical abbreviation such that logit (P) = ln [P/(1-P)], where P is the
probability that Listeria occurs, and ln refers to the natural logarithm. The coefficients b0 ,
b1, b2 , b3 , b4 , b5 and b6 are the parameters to be estimated by fitting the model to
experimental data. The parameters T min and pHmin are notional values of minimum
temperature and pH respectively, at which the growth rate is predicted to be zero. Both
terms were estimated from other modelling of Listeria to be -2°C and 4.5 pH unit and
were used as constants in model fitting in this study. The measured variables salinity (S)
(%0), rainfall recorded during the 24 hr preceding the sampling day (Rf24) (mm), faecal
coliforms (fc) and E.coli (ec) /100 ml have 1 added to them to avoid' having ln(O).
The model performance is assessed by determining the area c under the receiver operating
characteristic (ROC) curve which is the proportion of the total number of pairs in which
the model resulted in a higher probability for the presence of the interested organism than
the absence of it (Lemeshow and Le Gall, 1994). If c >0.70, the model is considered
satisfactory (Lemeshow and Le Gall, 1994), whereas c >0.8 is considered excellent
discrimination and c >0.9 is deemed outstanding discrimination (Lemeshow, pers.
comm.).
2.3 RESULTS AND DISCUSSION
2. 3.1 SENSITIVITY OF LISTERIA DETECTION METHOD (VALIDATED RECOVERY)
The sensitivity of the Listeria culture method used in the study was comparable with
published methods (Hayes et al., 1992; Buchanan et al., 1989b), with a minimum level of
detection of 2.8 CFU of L. monocytogenes in 25 g of sediment and in 1 L of water. In
addition, in a validated recovery experiment, artificially introduced L. monocytogenes, at
a level of 22 CFU in 25 g of oysters sample, was detected by the method (Table 2.4).
SAS (Statistical Analysis System) (1995). SAS/STAT Guide for Personal Computers, Version 6.10 Edition, SAS Institute Inc., Cary, North Carolina 27512-800, USA.
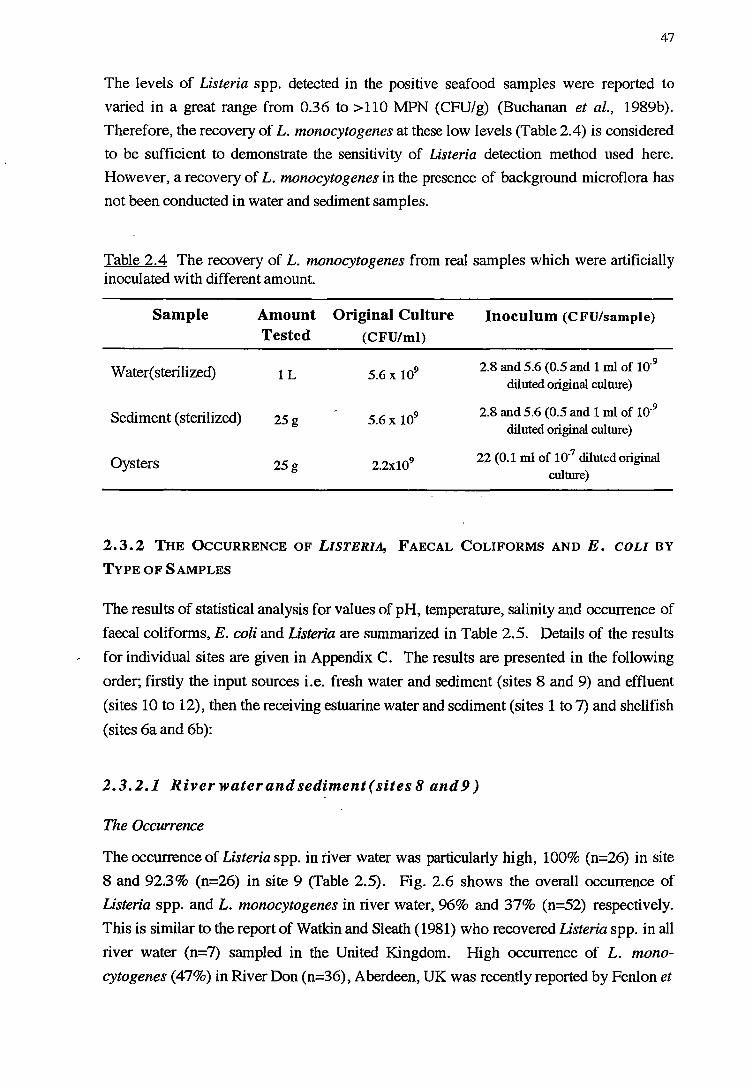
47
The levels of Listeria spp. detected in the positive seafood samples were reported to
varied in a great range from 0.36 to >110 MPN (CFU/g) (Buchanan et al., 1989b).
Therefore, the recovery of L. monocytogenes at these low levels (Table 2.4) is considered
to be sufficient to demonstrate the sensitivity of Listeria detection method used here.
However, a recovery of L. monocytogenes in the presence of background microflora has
not been conducted in water and sediment samples.
Table 2.4 The recovery of L. monocytogenes from real samples which were artificially inoculated with different amount.
Sample Amount Original Culture Inoculum (CFU/sample)
Tested (CFU/ml)
Water( sterilized) lL 5.6 x 10⁹ 2.8 and 5.6 (0.5 and 1 ml of 10-9
diluted original culture)
Sediment (sterilized) 25g 5.6 x 10⁹ 2.8 and 5.6 (0.5 and 1 ml of 10-9
diluted original culture)
Oysters 25g 2.2xl09 22 (0.1 ml of 10-7 diluted original culture)
2.3.2 THE OCCURRENCE OF LISTERIA, FAECAL COLIFORMS AND E. COLi BY
TYPE OF SAMPLES
The results of statistical analysis for values of pH, temperature, salinity and occurrence of
faecal coliforms, E.coli and Listeria are summarized in Table 2.5. Details of the results
for individual sites are given in Appendix C. The results are presented in the following
order; firstly the input sources i.e. fresh water and sediment (sites 8 and 9) and effluent
(sites 10 to 12), then the receiving estuarine water and sediment (sites 1 to 7) and shellfish
(sites 6a and 6b):
2.3.2.1 River waterandsediment(sites 8 and9)
The Occurrence
The occurrence of Listeria spp. in river water was particularly high, 100% (n=26) in site
8 and 92.3% (n=26) in site 9 (Table 2.5). Fig. 2.6 shows the overall occurrence of
Listeria spp. and L. monocytogenes in river water, 96% and 37% (n=52) respectively.
This is similar to the report of Watkin and Sleath (1981) who recovered Listeria spp. in all
river water (n=7) sampled in the United Kingdom. High occurrence of L. mono
cytogenes (47%) in River Don (n=36), Aberdeen, UK was recently reported by Fenlon et
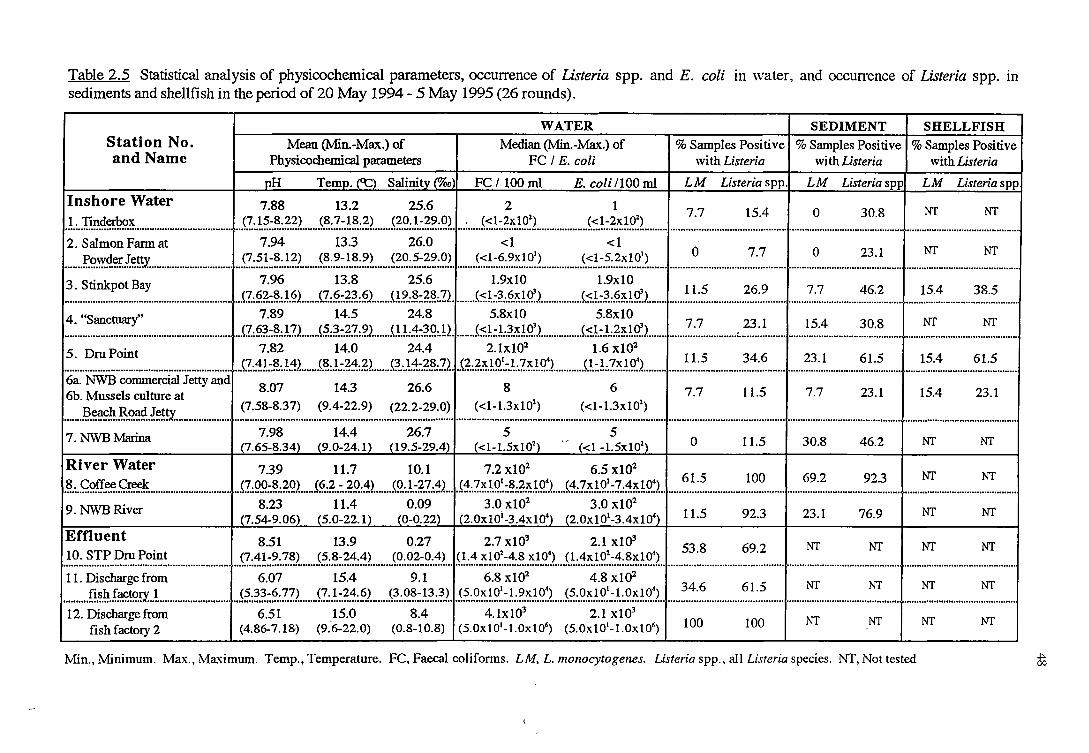
Table 2.5 Statistical analysis of physicochemical parameters, occurrence of Listeria spp. and E. coli in water, and occurrence of Listeria spp. in sediments and shellfish in the period of 20 May 1994- 5 May 1995 (26 rounds).
Station No. and Name
Inshore Water
WATER Mean (Min.-Max.) of I Median (Min.-Max.) of
Physicochemical parameters FC I E. coli
pH Temp. (<t) Salinity (%o)I FC I 100 ml E. coli 1100 ml
7.88 13.2 25.6 2 1
SEDIMENT SHELLFISH % Samples Positive I % Samples Positive I% Samples Positive
with Listeria with Listeria with Listeria
LM Listeria spp. LM Listeria spp LM Listeria spp
7.7 15.4 0 30.8 NT NT J.:.I~4.~~~...................................... JZ:.~.?..:~.:~.~L .... ~.~:Z~.~~:~~ ..... J~.?.:.~:~.?.:.?.~ .... : ... J::~:~.i::.102
> c < 1-2x 10²> 2. Salmon Farm at 7.94 13.3 26.0 <1 ................................... ~.! ........................................................................................................................................................ .
....... P.~.~~~~.!.~~-~Y. ................................. J?.:~~:~.:.~.:L .... ~~::.~.~~::.~ ....... ~:.?.:.?.::.?.:.?.2 ........ ~::=.~:~:.?..~101 ) (<1-5.2x101
) 0 7.7 0 23.1 NT NT 3. Stinkpot Bay 7.96 13.8 25.6 1.9xl0··················· ......... 1:9;!() .................................................................................................................................................. .. .................................................................. . JJ.:f?.7.:~.J.§L .... <:?.:f?.:.7.2.:f?.) ....... n.?.:.?.:7..?.:.?.>. ....... J:::.!:~ ... §.~.~.r>. ............... J~k.~=-~~.!ftL ........... ~.L~ .............. :.~:.~ .............. .7..:.7............. 46.2 15.4 38.5 4. "Sanctuary" 7.89 14.5 24.8 5.8x10 5.8x10 ................................................................ .
................................................................. . . .C!.:f?.~:~.:EL .... <:?.:2.:.7.2:2L .... H.!:.1:~.Q:.!>.. ..... J:::.!:.t~.~-~.r.1 .............. J~J.:.!:.~~.!ft>. ............. ?..:?.. ............. , . .:::.~ ............... ~.~:~ ............. ~.?.:~....... .. NT NT 5. Dru Point 7.82 14.0 24.4 2.lx102 1.6 x10² .......................................... .
................................................................. ... (!::!J.:~.:.!.1>. ...... J~:.!.:.f.:!:~L ..... (~: .. ~.1:7..~:.?.>.. (2:2xl01-l.7x10
4) (1-l.7x10
4) 11.5 34.6 23.1 61.5 j 15.4 61.5 6a. NWB commercial Jetty and ................................................................................. ············································· ......................................................................................... .
6b. Mussels culture at 8·07 143 26·6 8 6 7.7 11.5 7.7 23 1 15 4 23 1 Beach Road Jett_Y. (7.58-8.37) (9.4-22.9) (22.2-29.0) (<l-l.3xl02
) (<1-l.3x102) • • •
·;·:·~-~"OooOo OOOOOOOOOOOOOOOOOOOOOO ... OOOU0070:98"""''''''"'""""i4:40000UUOOOUOOOOU26'."7'"''"''' oOOOoOOOOoOoOooo .. SOOOO .. UOOOOOOOOOOoOo0000000000000000U50000000000000 .. 0000,0000oOoooOOoooooOoOOU0000000HOOOOOU00000001000000000"0U0000000 ... UO"OOUUoU .. OUOO .. OOOOUUU000oHOOOOOOUOOUOOUOUOUOUoOoO
(7.65-8.34) (9.0-24.1) (19.5-29.4) (<1-l.5x102) v (<1 -l.5x102) I 0 11.5 I 30.8 46.2 I NT NT
River Water 7.39 11.7 10.1 7.2 xl02 6.5 x10²
.~.:.~~!f~.~~~ .................................. .<7.:!?.9.:~.:~.QL ... (§.:7. .. : .. f..Q::!L ..... ~9.:.!.:~?..:12... .. (~.:?..~.!.9.~:.~:.7..~.~.Q~2 ... J1:.?.~J..Q'..:2::!~.!Q~). ....... ~.~.:~ ................ ~~~········ ...... ~:..? ................ :::~·······!··· NT.... .. NT 9. NWB River 8.23 11.4 0.09 3.0 x10² 3.0 x10² ...... • ............................ .
(7.54-9.06) (5.0-22.1) (0-0.22) (2.0x101-3.4x10⁴) (2.0x10'-3.4x10⁴) 11.5 92.3 23. l 76.9 NT NT
Effluent
~~~t:::=:=~:~~~j~~:.:~:~:~~;;:~l~~~t~::::.~;.::::::::::::;;:::..:::.·~·:~ .... ~ .. :::===~~t:~: .. ~:::::~ .. ~~: .... 12. Dischargefrom 6.51 15.0 8.4 4.lx103 2.1 xl03
fishfactory2 (4.86-7.18) (9."6-22.0) (0.8-10.8) (5.0x101-l.Oxl06) (5.0xl01-l.Oxl06
) I 100 100 l'<"T NT NT NT
Min., Minimum. Max., Maximum. Temp., Temperature. FC, Faecal coliforms. LM, L. morzocytogenes. Listeria spp., all Listeria species. NT, Not tested ~
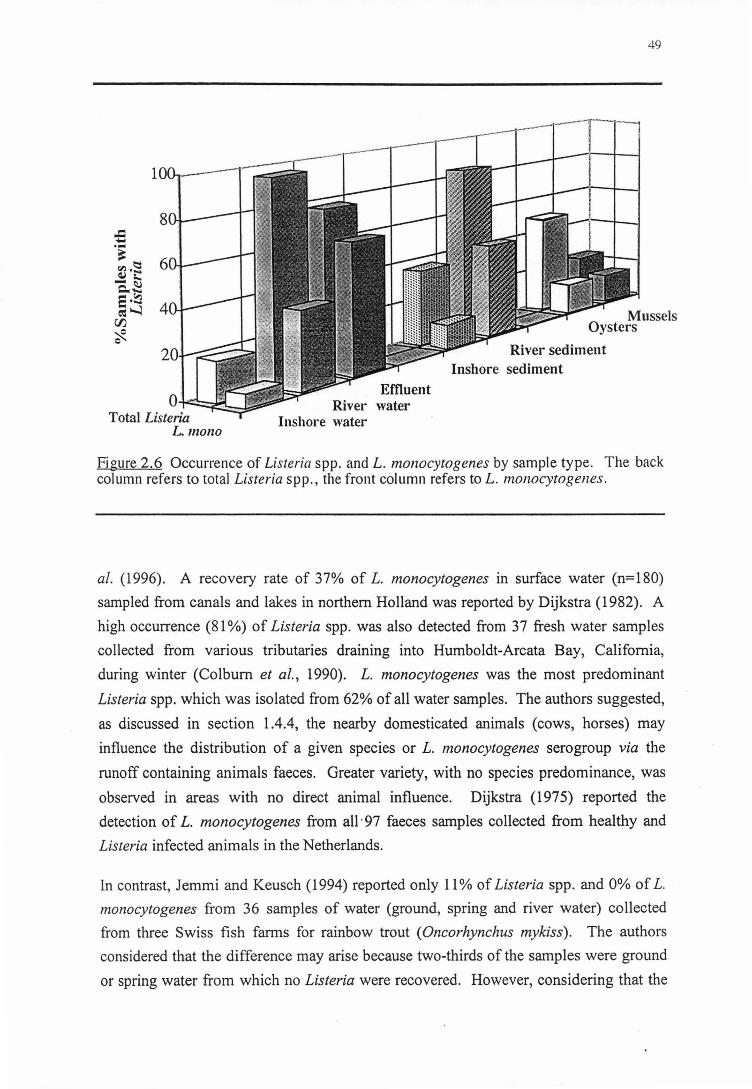
River water Inshore water
49
Mussels Oysters
River sediment Inshore sediment
Figure 2.6 Occurrence of Listeria spp. and L. monocytogenes by sample type. The back column refers to total Listeria spp., the front column refers to L. monocytogenes.
al. (1996). A recovery rate of 37% of L. monocytogenes in surface water (n=l80)
sampled from canals and lakes in northern Holland was reported by Dijkstra ( 1982). A
high occurrence (81 %) of Listeria spp. was also detected from 37 fresh water samples
collected from various tributaries draining into Humboldt-Arcata Bay, California,
during winter (Colburn et al., 1990). L. monocytogenes was the most predominant
Listeria spp. which was isolated from 62% of all water samples. The authors suggested,
as discussed in section 1.4.4, the nearby domesticated animals (cows, horses) may
influence the distribution of a given species or L. monocytogenes serogroup via the
runoff containing animals faeces. Greater variety, with no species predominance, was
observed in areas with no direct animal influence. Dijkstra (1975) reported the
detection of L. monocytogenes from all· 97 faeces samples collected from healthy and
Listeria infected animals in the Netherlands.
In contrast, Jemmi and Keusch ( 1994) reported only 11 % of Listeria spp. and 0% of L. ·
monocytogenes from 36 samples of water (ground, spring and river water) collected
from three Swiss fish farms for rainbow trout (Oncorhynchus mykiss) . The authors
considered that the difference may arise because two-thirds of the samples were ground
or spring water from which no Listeria were recovered. However, considering that the
50
, study examined only 10 ml of water sample for Listeria analysis, this may be another
reason for lower detection of the organisms.
In the present study, Listeria spp. were detected in 22 of 26 ,sediment samples (84.6%)
(Fig. 2.6) collected at the same locations as the surface river water samples (sites 8 and
9). L. monocytogenes again was frequently recovered, from 12 of 26 sediment samples
(46%). This rate was higher than found by Weis and Seeliger (1975) who recovered L.
monocytogenes in 12 of 38 (31.5%) of mud samples from creeks, rivers and ponds in
southern West Germany. A lower incidence of 30.4% and 17.4% of Listeria spp. and L.
monocytogenes respectively, was also observed in 46 samples from tributaries draining
into Humboldt-Arcata Bay, California by Colburn et al. ( 1990).
It is noted that the water level in site 8 was normally low and the sediment was mostly
vegetative litter, brown to black,colour, indicating anoxic conditions with mild sulfur
odour occasionally observed. Site 9 has the largest catchment for the bay (Table 2.1) and
the sediment consisted of sand, rocks and vegetative litter. Species identification showed
that L. monocytogenes was the most commonly isolated species of the genus in Coffee
Creek; 16 of 26 water samples (61.5%) and 9 of 13 sediment samples (69%) were found
to harbour the organism (Appendix C, Table C.8). The presence of L. monocytogenes
indicates contamination by the organism which probably results from domestic waste,
s~page of human faeces from inefficient septic tanks and run-off of animal faeces from
grazing land. It has been reported that faeces of clinical healthy human and animals were
found to have a L. monocytogenes carrier rate of 29.1 % and ~5.3%, respectively
(Kampelmacher and van Noorle Jansen, 1969). However in North West Bay river, L.
seeligeri was the most predominant species; 46.2% in water samples and 53.8% in
sediment samples.
Relationship between Listeria and environmental parameters and faecal coliforms!E. coli
This study indicates that the occurrence of Listeria spp. in river water remained high
throughout the 12 months of sampling regardless of the temperature, from 5.0°C to
22.1°C (Fig. 2. 7). The average occurrence of Listeria spp. in river water was the highest
of all types of water studied here (Fig. 2.6). However, in the case of L. mono
cytogenes, the organism ~as absent in the period of December 1994 to February 1995
(summer) which was the hottest period of the year, and the driest since 1985 (Bureau of
Meteorology, Hobart). The results suggested those conditions were not suitable for L.
monocytogenes to survive, or that it may become injured and was unrecoverable.
Additionally, there was likely to be some competitive effects between species as L.
innocua and L. seeligeri were detected in all those samples (Appendix C, Tables C.8 and
C.9). The pH of the river samples varied from 7.00 to 9.06 which did not appear to be
51
related to the occurrence of Listeria spp. The average salinity of the nver water (Fig. 2.7)
was substantially influenced by the influx of marine water into Coffee Creek which
caused the salinity of the water in this site to range from 0.1 to 27.4%0 while the salinity
of North West Bay River was in a narrow range from 0.00 to 0.22%0. The levels of
faecal coliforms and E. coli did not appear to be related to the occurrence of Listeria (Fig.
2.7).
Statistical analysis, using the logistic method, confirmed that none of the environmental
parameters (temperature, pH, salinity and rainfall) or the level of faecal coliforms and E.
coli could explain the occurrence of Listeria spp. (Appendix E, Table E.1). However, the
pH followed by the salinity of the river water appeared to have significantly affected (P
s0.01) the presence/absence of L. monocytogenes (Appendix E, Table E.2). Therefore,
using pH as the predictor the fitted value for the constant and the values for the parameters
of the presence/absence model can be added to the form of the presence/absence model:
logit (L. mono)= In {l) = 7.3906 - 6.8484 (In pH) 1-P
(2.2)
where all the terms were previously defined in Eqn 2.1 and pH is pH - 4.5. The area c
under the ROC curve obtained from the fitted model (Eqn. 2.2) is 0.779.
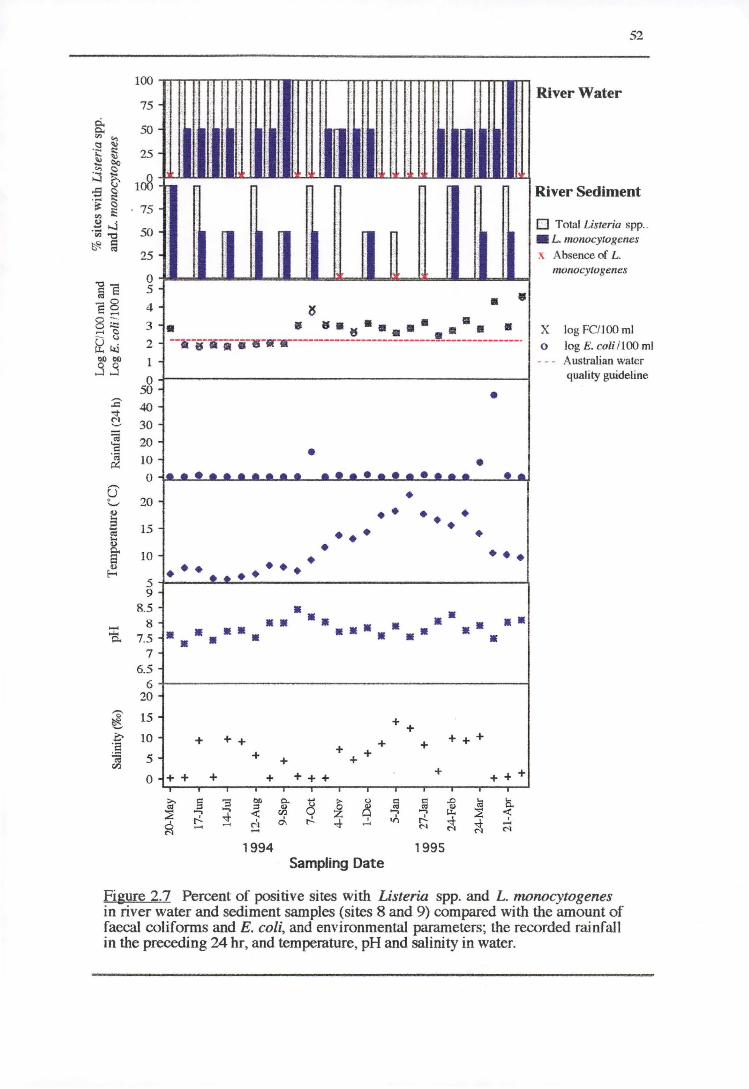
100
75
8: 50 "' .., 1::1 ..,
·;:: ::: 25 .., .., C>o -"' .2 ;.:s G' 108 ..g ~
. · ~ (;:, 75 "'
:: <I.) • . ..: ~ 50 "' "C
t>-~ ~ 25
0 5
4
3
2 1
0 50
40
30 20 10
0
20
15
10
5 9
8.5 8
7.5 7
6.5 6
20
15
10 -5 -0
:
:
c ,. ' '
:
' '
' .' ' ' '. .. •
I•
• • . . ~-~····· .. · .. -~-ti-ii""il--.-11-~----~~~-------------------------~-----·
•
• • , ......... . ••••••••••• ••
• •• • •• • • •••
••• •
• ••••• • •
• ••
•• • •• • • • • ••• • • ••• •• • •• • • • •
+ + + + + + + +++
+ + ++ + ++ + + +++ + + + + ' . >. t: '3 !>I) 0.. 8 l>
~ Cl fil .£> ta ...
~ ::I ::s Q)
~ "' it 0.. .., ..... < rF.J ..... .., ::E ~ r.!. ~ d. r:-!. •A r.!. ;:! ~ ...... ~ ""'"
.....!. ~ -...... N N
1994 1995 Sampling Date
52
River Water
River Sediment
[] Total Listeria spp .. • L. monocytogenes
x Absence of L.
x 0
mo11ocytogenes
log FC/lOOml
log E.coli 1100 ml Australian water quality guideline
Figure 2.7 Percent of positive sites with Listeria spp. and L. nwnocytogenes in river water and sediment samples (sites 8 and 9) compared with the amount of faecal coliforms and E. coli, and environmental parameters; the recorded rainfall in the preceding 24 hr, and temperature, pH and salinity in water.
- 53
2.3.2.2 Effluent(sites I 0to12)
The Occurrence
It is well known that raw municipal sewage may contain substantial numbers of various
organisms including faecal pathogens. If sewage influent undergoes mechanical,
biological and chemical treatments, most of the microflora present in the sewage should
be reduced, if not killed, during the processes. Despite these treatments however, it has
been found by many workers e.g. Gameson (1975), Kawamura and Kaneko (1986), that
the final effluents and the sewage end products usually contain many organisms,
including pathogens, which vary in number and type depending on the efficiency of
treatment and on the ability of each type to survive it. The pathogenic bacterium, L.
monocytogenes has also been reported to be recovered frequently from sewage-containing
effluents (Al-Ghazali and Al-Azawi, 1986, 1988a).
Listeria spp. in effluent samples were frequently recovered, ranging from 61.5% to 100%
(Table 2.5). Likewise, L. monocytogenes was the most frequently detected species in
site 10 and 12 while L. innocua was commonly found in site 11 (Table 2.5). Fig. 2.6
shows the overall occurrence of Listeria spp., i.e. 77% of effluent samples (n=78).
Effluent appeared to be a major contributor of L. monocytogenes to the NWB
environment as it was found to contain the highest average occurrence of the organism,
i.e. 63% (Fig. 2.6). In particular, the sewage treatment pond rece~ving municipal sewage
was shown to contain L. monocytogenes in 54% of samples (Table 2.5). The effluents
from two fish processing factories' treatment plants were found to have L. mono
cytogenes in 100% and 35% of samples (Table 2.5) respectively. Occasionally, more
than one species was isolated from each site. Less species variation was found in this
type of water, presumably due to the limited type of input.
Human faeces are likely to be the major source of the organisms (Kampelmacher and van
Noorle Jansen, 1969) in the sewage treatment system. It is noteworthy that the treatment
system of the two factories (sites 11 and 12) are very similar (activated sludge), and both
systems receive human faecal waste. However, L. monocytogenes was detected in
effluent samples at site 12 approximately 3 times more frequently than at site 11 (Table
2.5). Furthermore, the amounts of E. coli 1100 ml in effluent at site 12 were much higher
than in effluent at site 11. The substantial difference may be due to dilution resulting from
larger volumes of factory floor wastewater discharged into site 11.
The high occurrence of Listeria spp. including L. monocytogenes in these sites were
similar to the report of Kampelmacher and van NoorleJansen (1975) who recovered 92%
of L. monocytogenes from effluent samples (n=38) collected from 8 sewage treatment
plants in the Netherlands. Watkins and Sleath (1981) also reported all effluent samples
54
(n=39) to be positive for L. monocytogenes. Likewise, Al-Ghazali and Al-Azawi (1986,
1988a) isolated L. monocytogenes from all stages of the treatment, including final
discharge samples, collected from sewage treatment works in Baghdad, Iraq.
The ability of L. monocytogenes to survive and even multiply after biological treatment
(Geuenich and Mtiller, 1984) should increase awareness of the potential hazards of such
effluent. The discharge of contaminated water results in its distribution to surface
receiving water. Consequently the receiving water may become a route for recycling
these Listeria via irrigation, ~ecreational use or the foodchain. In support of this, Dijkstra
(1982) reported a recovery rate of 67% of L. monocytogenes on 33 sites along the 5 miles
(8 kms) distance from a sewage treatment plant in the Netherlands and emphasised the
survival and distribution of the organism which could be detected in fresh water at 25
miles (40 kms) downstream from the sewage treatment plant. Although in the same study
no L. monocytogenes were recovered from the seawater samples (n=43) into which the
canals and lakes emptied, it seems desirable to eliminate, where possible, the potentially
pathogenic organism before discharging to the sea and other surf ace water.
Relationship between Listeria and environmental parameters and faecal coliforms/E. coli
The study indicates effluent samples had the highest occurrence of L. monocytogenes
especially from the fish factory 2 where all samples gave positive results. From Fig. 2.8,
none of the environmental factors, or the level of faecal coliforms or E. coli is likely to be
related to the occurrence of Listeria spp. including L. monocytogenes in effluent samples.
However, the higher temperature for long periods in spring and summer displays a corre
lation with survival of Listeria in the sewage treatment pond (site 10) as the occurrence of
the organism decreased significantly in that period (Appendix C, Table C.10).
The statistical analysis using the logistic method confirmed that none of the environmental
parameters (temperature, pH, salinity and rainfall) could explain the occurrence of Listeria
(Appendix E, Tables E.3 and E.4). However, the level of faecal coliforms appeared to be
a significant factor (P s0.01) correlated to the presence/ absence of Listeria spp. (Table
E.3). In addition, both faecal coliforms and E. coli displayed a significant correlation
with the presence/absence of L. monocytogenes (Table 2.9). Adding, the fitted value for
the constant and the values for the parameters of the presence/absence model yields:
logit (Listeria) = ln ( l) = 4. 0575- 2. 2335 (ln 1) + 0. 4800 (ln fc) (2. 3) 1-P
l~git(L. mono) =ln ( l:P) = -6.0792+1.4710 (ln pH)+l.05CX5 (ln S)+ 0.5103 (ln fc) (2.4)
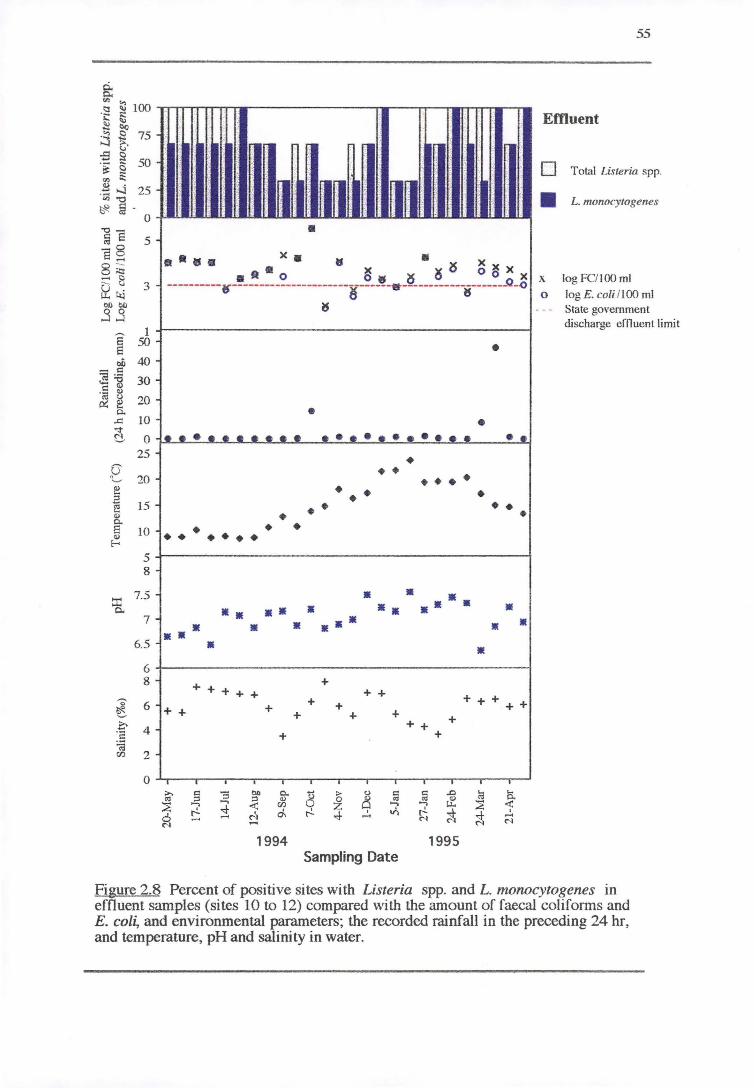
g; "' ~ 100 c::i ·;;:: ~ ~ Cl()
"' .9 75 ~ G) ~ ~ 50 ~ ~ "' -~ ..j 25 .,, "t)
~ al . 0
-g e "" e§
5
8 ;:; - c D ~ 3 ~~ Oil 1:)1)
.3 .3 1
a a 50
oO 40 - c:: "Cil ·~ 30 .... ] .s C1)
&! ~ 20 0..
..c:: 10 ~ 0 ~·
25
e 20 ~
~ 15 C1)
0.. 8 10 C1)
E-
5 8
tr: 7.5 Q..
7
6.5
6 8
~ 6 ·~
.c 4 ·2 ~ rrJ 2
0
;
' .. :
·. [I : I I~ I' tlll: ' ' :1~ ' .
II I- ;
• ••• • x. ~ • x
••• o ~w ~ ~~ o ~x x ---------"IS"-----------~---------~------tt------------~--~---Q - ()
~
•
• • ••• • • • • • • • ••••••••••• • •
- • •• • - •• • • • • • • • •• • • -.. • • • • • • •
• • • • •• •• • • •• •• - •• • • • • • • •• • • - + + + + + + ++ + + + + + + + + + + + + +
+ + + + +
. . . >. i:::: :l bQ 0. t) > 0 c:: ~ .t:l ~ ... "" ;:l ::I .,
~ ~ "' ~ 0.
~ ...... -. < rrJ 0 ..... .., ~ <t
~ ""'" °' r.!. Vi ~ ~ ' 0 ..... N ""'"
...... ~ -N C'l
1994 1995 Sampling Date
55
Effluent
D Total Listeria spp.
• L. morwcytogenes
x log FC/100 ml o log E.coli 1100 ml
State go\'emment discharge effluent limit
Figure 2.8 Percent of positive sites with Listeria spp. and L. nwnocytogenes in effluent samples (sites 10 to 12) compared with the amount of faecal coliforms and E. col~ and environmental parameters; the recorded rainfall in the preceding 24 hr, and temperature, pH and salinity in water.
56
where all the terms were previously defined in Eqn. 2.1. The areas c under the ROC
curves obtained from the fitted models, Eqn. 2.3, and Eqn. 2.4, are 0.754 and 0.745
respectively.
2.3.2.3 Inshoremarinewaterandsediment(sitesl to 7)
The Occurrence
Estuarine environments are continuously subjected to potential contamination with Listeria
from many natural and anthropogenic sources i.e. sewage effluents, processing effluents,
septic tank seepage or overflow, terrestrial run-off etc. From this study however, the
average occurrence of L. monocytogenes and total Listeria spp. in inshore waters around
North West Bay (n=182) remained low, 6.6% and 18.7%, respectively (Fig. 2.6). In
support of this, a study in the north of the Netherlands (Dijkstra, 1982) showed no
Listeria spp. in 43 seawater samples although Listeria contaminated water was found in
the effluent from a sewage treatment plant and along the canals including in the location
where this canal dr~ned into the sea. Motes (1991) also reported only 2 (2.9%) positive
for Listeria spp. from 70 estuarine water samples collected from various shellfish
growing areas along the U.S. Gulf Coast. Likewise, R!Zlrvik et al. (1995) reported the
recovery of L. monocytogenes and other Listeria spp. from 3 (9%) and 12 (36%) of 33
environmental seawater samples taken from outside a salmon slaughter house in Norway.
Additionally, the authors found no Listeria spp. in 6 samples of deep seawater. In a
limited survey (n=3), a higher recovery rate of 33% of Listeria spp. including L.
monocytogenes was found in Humboldt-Arcata Bay, California (Colburn etal., 1990). ·
The lower levels of Listeria spp. in estuarine water when compared with other types of
water or environment could be due to a variety of reasons such as:
• the effect of dilution by the large volumes of seawater in the marine environment
(Colburn etal., 1990);
• · organism die-off because of different levels of available nutrients; It has been found
that the rate of die-off of a microorganism in the low nutrient level in the sea is
approximately proportional to the number of viable cells remaining at any time - or that
the logarithm of the number decreases linearly with time (Gameson, 1975).
• organism die-off because of the presence of toxic compounds (Mitchell, 1974);
• organism die-off because of the competition or predation by other organisms (Roszak
and Colwell, 1987).
• and other factors including UV damage as it was reported by Gameson (1975) from
the Water Research Centre that the radiation damage is one of the most important
57
mechanisms contributing to the mortality of microorganisms in the sea. The rate of
radiation-induced mortality is proportional to the intensity of irradiation. In addition,
the type and the physiological state of the microorganisms may also play a role in the
lower recovery rate in this estuarine water.
A study with L. monocytogenes (Faud et al., 1989) has shown that levels of the organism
declined rapidly when it was inoculated into seawater. In addition, the survival of Listeria
in culturable form in water was reported to be temperature dependent i.e. at 30°C the
culturability of cells declined most rapidly within 24 hr when compared to 4°C and 15°C
(McKay, 1993). Loss of culturability may be a result of cell death or a transition of cells
to a viable but non-culturable form for which resuscitation becomes difficult (McKay,
·1993). Therefore, the presence of L. monocytogenes in marine water may indicate a
recent contamination.
From Fig. 2.6, Listeria spp. including L. monocytogenes appeared to survive approxi
mately two times as well in surf ace sediment than in water. The percent positive for these
organisms in the sediment samples (n=91), were 37.4% and 12. l %, respectively, while
the occurrence in water samples were 18.7% and 6.6%, respectively. The most
frequently isolated species in both inshore water and sediment samples. was L. seeligeri,
12.8%, followed by 8.1 % of L. monocytogenes from all samples (n=273).
Occasionally, more than one species was isolated from each location (Appendix C, Tables
C.l to C.7). Neither L. grayi nor L. murrayi was isolated from the inshore water in
North West Bay.
Relationship between Listeria and environmental parameters and faecal coliforms!E. coli
The study indicates that the incidence of Listeria spp. including L. monocytogenes in
inshore water throughout the 12 months of the sampling period was not very high when
compared with the input from sources (river and effluent). However, there were some
peaks of the occurrence of Listeria spp. and L. monocytogenes in October 1994 and in
April 1995 although these did not appear to be related to specific physicochemical
parameters (salinity, pH and temperature) (Fig. 2.9). However, rainfall showed some
effect on the occurrence of Listeria spp. including L. monocytogenes (Fig. 2.9).
Similarly, the amount of faecal coliforms and E. coli I 100 ml in the inshore water also
appeared to increase in parallel with the occurrence of Listeria spp. and L. mono
cytogenes (Fig. 2.9). Since the effluent were nonnally discharged directly to the bay,
although during the period of high rainfall, the overflow of the diluted sewage may occur.
Therefore, the increase in the occurrence of Listeria spp. including L. monocytogenes and
the amount of faecal coliforms may be the result of increasing runoff of animal faeces
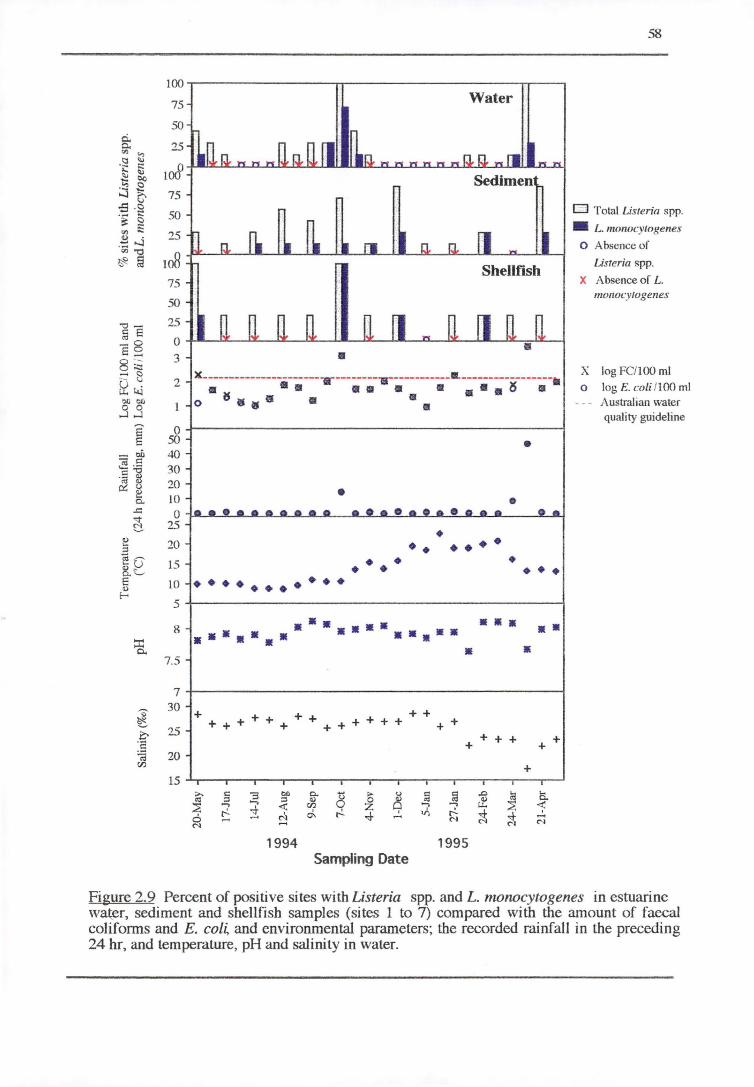
~
~ 0 :s t;j 00
ioo-.--~~~~~~~~-......-~~~~~~~~~~--.-.--~-.
75
50
25
ioJ> 75
50
25
108 75
50
25
Water
0 ..._...__..,._~.LJL.~LJ<....--l..l<....--L---~L--U,._-U~..u<-~.a...a--'IZ....----'.>r..--1
3 • 2 ~-------~-------------...---------.. ------------.. -----------------.. . .. .. . . ... ~ .
s8 40 30 20 JO
0 ~88 8 • ••
•
•
• 0 ,.....___..... ....... _______________ __...__,L....>00......:~ ........ ---.--=----------~~ ....... --i 25
20
15
JO •••••••••••
• • • • •• • •••• • •••
5 -t-~~~~~~~~~~~~~~~~~~~~~~~-1
8 •••••• • •• •• ••••••• • • •••• • • 7.5
7 30 + ++
++++++ ++ + + + + + + + + 25 + + + + + + 20
+ 15
;;.... c "3 llll 0.. ts > 0 ~ ~ .c a .... <II :l ;:I Q) 0 q ~
c.. ...., 0 ::?: ~ ~ ...... :± <C 00 z 7 ......
0 r.!. r-:i d. r.!. .Jo V) ~ ~ ~ ..... - ..... N N
1994 1995 Sampling Date
58
D Total listeria spp.
• L. monocytogenes
0 Absence of
Listeria spp.
X Ab ence of L. monocytogenes
X log FC/100 ml o log E.coli 1100 ml
A ustralian water quality guideline
Figure 2.9 Percent of positive sites with Listeria spp. and L. monocytogenes in estuarine wa~r, sediment and shellfish samples (sites 1 to 7) compared with the amount of faecal coliforms and E. col~ and environmental parameters; the recorded rainfall in the preceding 24 hr, and temperature, pH and salinity in water.
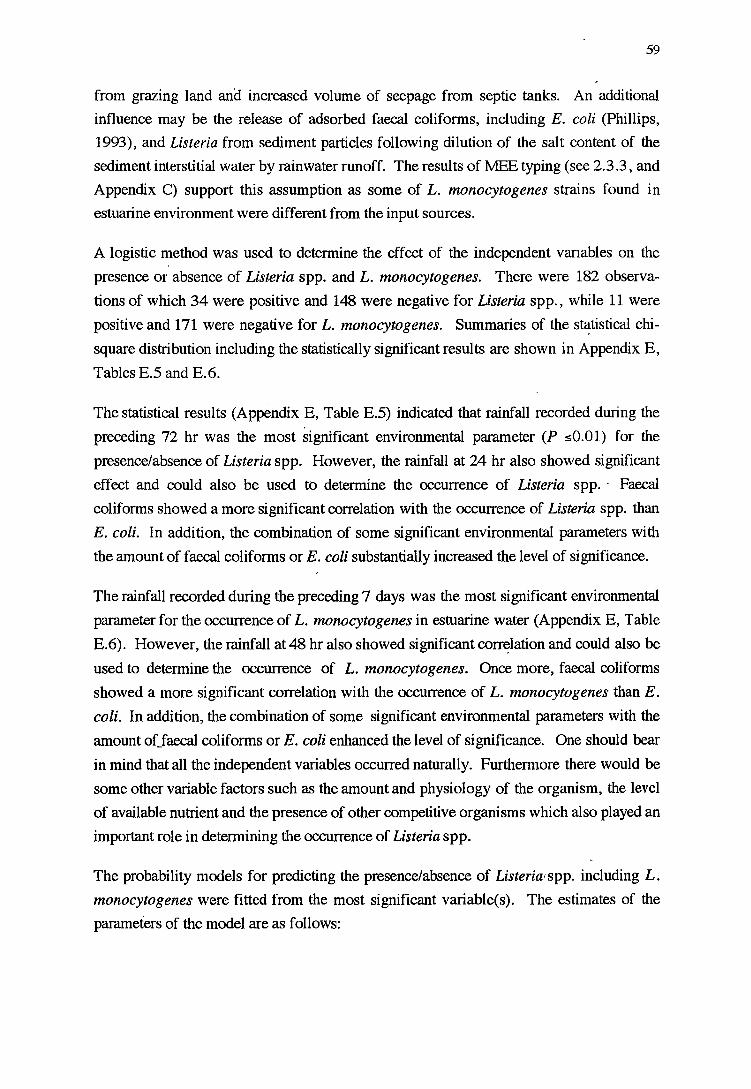
59
from grazing land and increased volume of seepage from septic tanks. An additional
influence may be the release of adsorbed faecal coliforms, including E. coli (Phillips,
1993), and Listeria from sediment particles following dilution of the salt content of the
sediment interstitial water by rainwater run off. The results of l\1EE typing (see 2.3 .3, and
Appendix C) support this assumption as some of L. monocytogenes strains found in
estuarine environment were different from the input sources.
A logistic method was used to determine the effect of the independent vanables on the
presence or absence of Listeria spp. and L. monocytogenes. There were 182 observa
tions of which 34 were positive and 148 were negative for Listeria spp., while 11 were
positive and 171 were negative for L. monocytogenes. Summaries of the s~tistical chi
square distribution including the statistically significant results are shown in Appendix E,
Tables E.5 and E. 6.
The statistical results (Appendix E, Table E.5) indicated that rainfall recorded during the
preceding 72 hr was the most significant environmental parameter (P :;;0.01) for the
presence/absence of Listeria spp. However, the rainfall at 24 hr also showed significant
effect and could also be used to determine the occurrence of Listeria spp. - Faecal
coliforms showed a more significant correlation with the occurrence of Listeria spp. than
E.coli. In addition, the combination of some significant environmental parameters with
the amount of faecal coliforms or E. coli substantially increased the level of significance.
The rainfall recorded during the preceding 7 days was the most significant environmental
parameter for the occurrence of L. monocytogenes in estuarine water (Appendix E, Table
E.6). However, the rainfall at 48 hr also showed significant corr€?lation and could also be
used to determine the occurrence of L. monocytogenes. Once more, faecal coliforms
showed a more significant correlation with the occurrence of L. monocytogenes than E.
coli. In addition, the combination of some significant environmental parameters with the
amount of_faecal coliforms or E. coli enhanced the level of significance. One should bear
in mind that all the independent variables occurred naturally. Furthermore there would be
some other variable factors such as the amount and physiology of the organism, the level
of available nutrient and the presence of other competitive organisms which also played an
important role in determining the occurrence of Listeria spp.
The probability models for predicting the presence/absence of Listeria 1spp. including L.
monocytogenes were fitted from the most significant variable(s). The estimates of the
parameters of the model are as follows:
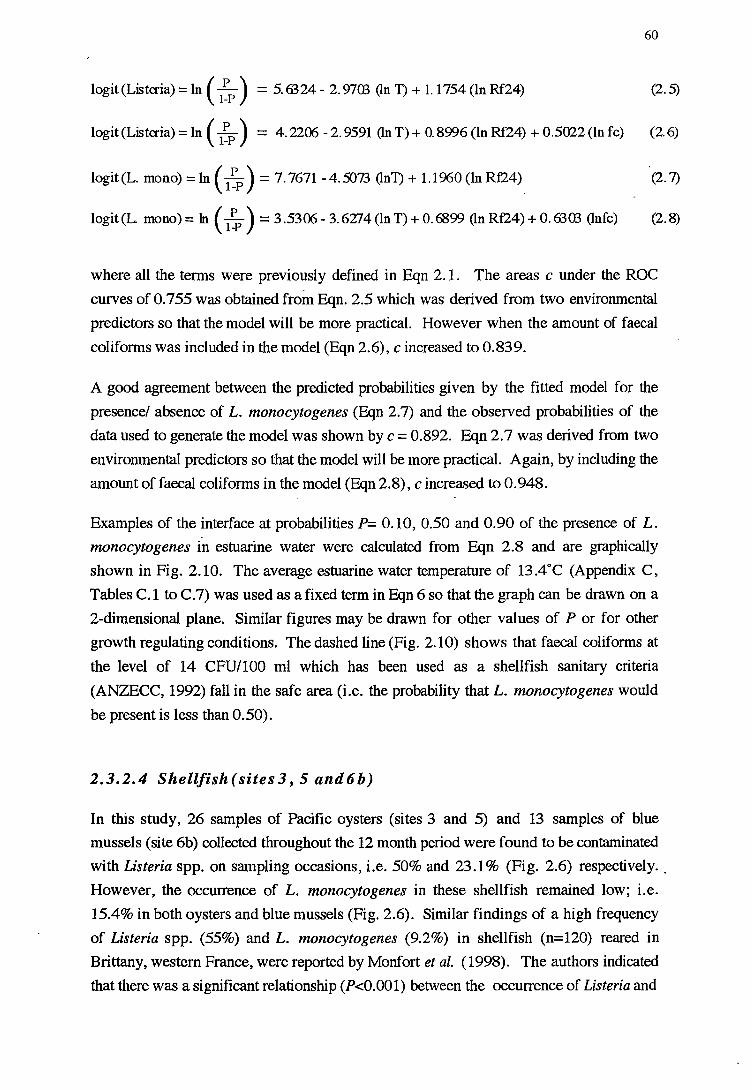
60
Iogit (Listeria)= In ( L) = 5. 63 24 - 2. 97<B (In 1) + 1. 1754 (In Rf24) (2. 5) 1-P
logit (Listeria)= In ( l~P ) = 4. 2206 - 2. 9591 (In T) + 0. 8996 (In Rf24) + 0.5022 (In fc) (2. 6)
logit (L. mono) = In { 1 ~P ) = 7. 7671 - 4. 5073 (In 1) + 1.1960 (In Rf24), (2. 7)
Iogit(L mono)= In { 1~) = 3.5306- 3. 6274 (In T) + 0. (>899 (In Rf24) + 0. 63<B (lnfc) (2. 8)
where all the terms were previously defined in Eqn 2.1. The areas c under the ROC
curves of 0. 755 was obtained from Eqn. 2.5 which was derived from two environmental
predictors so that the model will be more practical. However when the amount of faecal
coliforms was included in the model (Eqn 2.6), c increased to 0.839.
A good agreement between the predicted probabilities given by the fitted model for the
presence/ absence of L. monocytogenes (Eqn 2.7) and the observed probabilities of the
data used to generate the model was shown by c = 0.892. Eqn 2.7 was derived from two
environmental predictors so that the model will be more practical. Again, by including the
amount of faecal coliforms in the model (Eqn 2.8), c increased to 0.948.
Examples of the interface at probabilities P= 0.10, 0.50 and 0.90 of the presence of L.
monocytogenes in estuarine water were calculated from Eqn 2.8 and are graphically
shown in Fig. 2.10. The average estuarine water temperature of l3.4°C (Appendix C,
Tables C.1 to C.7) was used as a fixed term in Eqn 6 so that the graph can be drawn on a
2-dimensional plane. Similar figures may be drawn for other values of P or for other
growth regulating conditions. The dashed line (Fig. 2.10) shows that faecal coliforms at
the level of 14 CFU/100 ml which has been used as a shellfish sanitary criteria
(ANZECC, 1992) fall in the safe area (i.e. the probability that L. monocytogenes would
be present is less than 0.50).
2.3.2.4 Shellfish(sites3, 5 and6b)
In this study, 26 samples of Pacific oysters (sites 3 and 5) and 13 samples of blue
mussels (site 6b) collected throughout the 12 month period were found to be contaminated
with Listeria spp. on sampling occasions, i.e. 50% and 23.1 % (Fig. 2.6) respectively ..
However, the occurrence of L. monocytogenes in these shellfish remained low; i.e.
15.4% in both oysters and blue mussels (Fig. 2.6). Similar findings of a high frequency
of Listeria spp. (55%) and L. monocytogenes (9.2%) in shellfish (n=120) reared in
Brittany, western France, were reported by Monfort et al. (1998). The authors indicated
that there was a significant relationship (P<0.001) between the occurrence of Listeria and
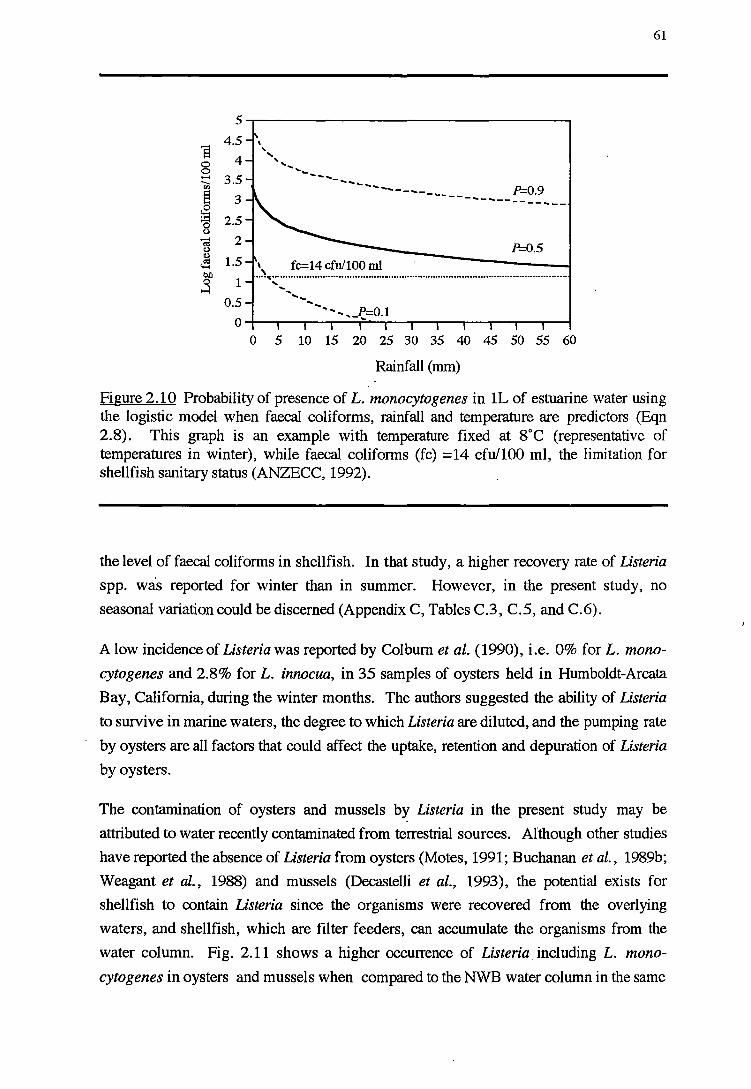
5
s 4.5
0 4 0 ...... 3.5 --"' ~ 3 ;E 2.5 0 0
';I 2 0 Q)
~ 1.5 bi)
1 0 ~
0.5
0
\
" ' " ' ........ _ -- .... _ -- ............ ........ _____ .... ______ ..,, __ P=.0.9 -------
:~--:-----------P=:-:0~.5:___J \ fc=14 cfu/100 ml OOOO'COOOOOOOOOooooooooooooooo•oOOOOOOoooOoooooo•ooooooooooououoUOOOoooooooooooooooooooooooooo•oooooooooooooooou
'--~ ...... - ............. "-e=o.1
0 5 10 15 20 25 30 35 40 45 50 55 60
Rainfall (mm)
61
Figure 2.10 Probability of presence of L. monocytogenes in lL of estuarine water using the logistic model when faecal coliforms, rainfall and temperature are predictors (Eqn 2.8). This graph is an example with temperature fixed at 8°C (representative of temperatures in winter), while faecal coliforms (fc) =14 cfu/100 ml, the limitation for shellfish sanitary status (ANZECC, 1992).
the level of faecal coliforms in shellfish. In that study, a higher recovery rate of Listeria
spp. was reported for winter than in summer. However, in the present study, no
seasonal variation could be discerned (Appendix C, Tables C.3, C.5, and C.6).
A low incidence of Listeria was reported by Colburn et al. (1990), i.e. 0% for L. mono
cytogenes and 2.8% for L. innocua, in 35 samples of oysters held in Humboldt-Arcata
Bay, California, during the winter months. The authors suggested the ability of Listeria
to survive in marine waters, the degree to which Listeria are diluted, and the pumping rate
by oysters are all factors that could affect the uptake, retention and depuration of Listeria
by oysters.
The contamination of oysters and mussels by Listeria in the present study may be
attributed to water recently contaminated from terrestrial sources. Although other studies
have reported the absence of Listeria from oysters (Motes, 1991; Buchanan et al., 1989b;
Weagant et al., 1988) and mussels (Decastelli et al., 1993), the potential exists for
shellfish to contain Listeria since the organisms were recovered from the overlying
waters, and shellfish, which are filter feeders, can accumulate the organisms from the
water column. Fig. 2.11 shows a higher occurrence of Listeria, including L. mono
cytogenes in oysters and mussels when compared to the NWB water column in the same
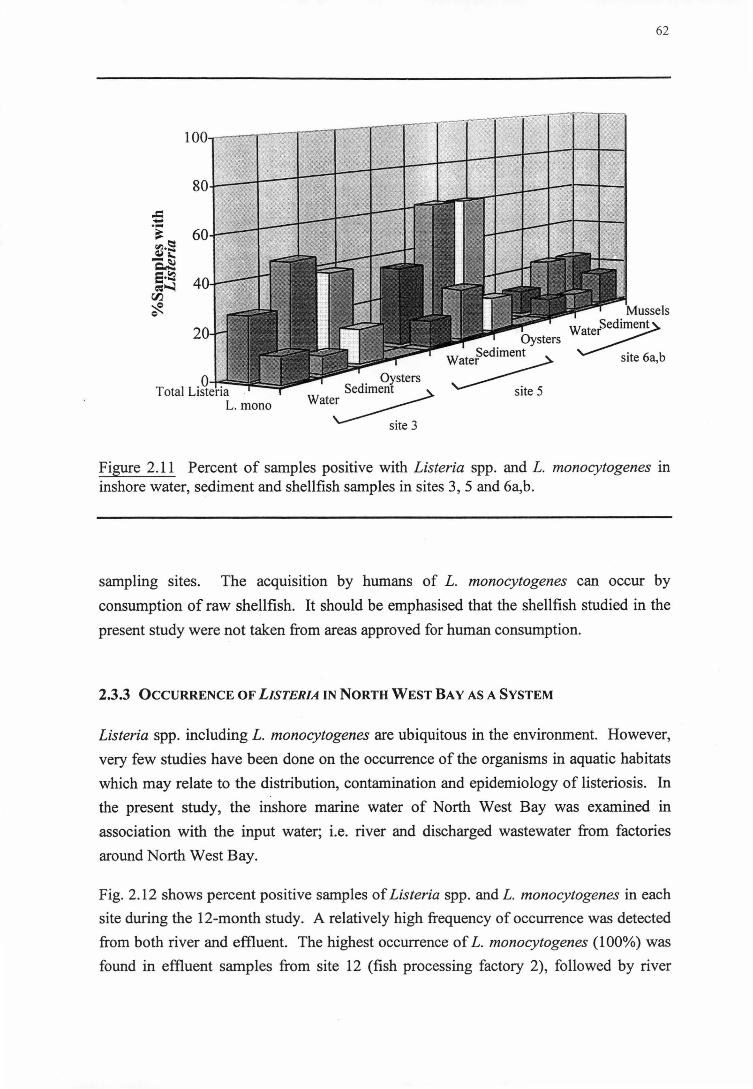
20
L. mono
Oysters :r Sediment__.->-
Wate~._ ... site 3
62
Mussels
Oysters
W'l/atefedim~
~-'•-e site 5
w~ site 6a,b
Figure 2.11 Percent of samples positive with Listeria spp. and L. monocytogenes in inshore water, sediment and shellfish samples in sites 3, 5 and 6a,b.
sampling sites. The acquisition by humans of L. monocytogenes can occur by
consumption of raw shellfish. It should be emphasised that the shellfish studied in the
present study were not taken from areas approved for human consumption.
2.3.3 OCCURRENCE OF LISTERIA IN NORTH WEST BAY AS A SYSTEM
Listeria spp. including L. monocytogenes are ubiquitous in the environment. However,
very few studies have been done on the occurrence of the organisms in aquatic habitats
which may relate to the distribution, contamination and epidemiology of listeriosis. In
the present study, the inshore marine water of North West Bay was examined in
association with the input water; i.e. river and discharged wastewater from factories
around North West Bay.
Fig. 2.12 shows percent positive samples of Listeria spp. and L. monocytogenes in each
site during the 12-month study. A relatively high frequency of occurrence was detected
from both river and effluent. The highest occurrence of L. monocytogenes (100%) was
found in effluent samples from site 12 (fish processing factory 2), followed by river
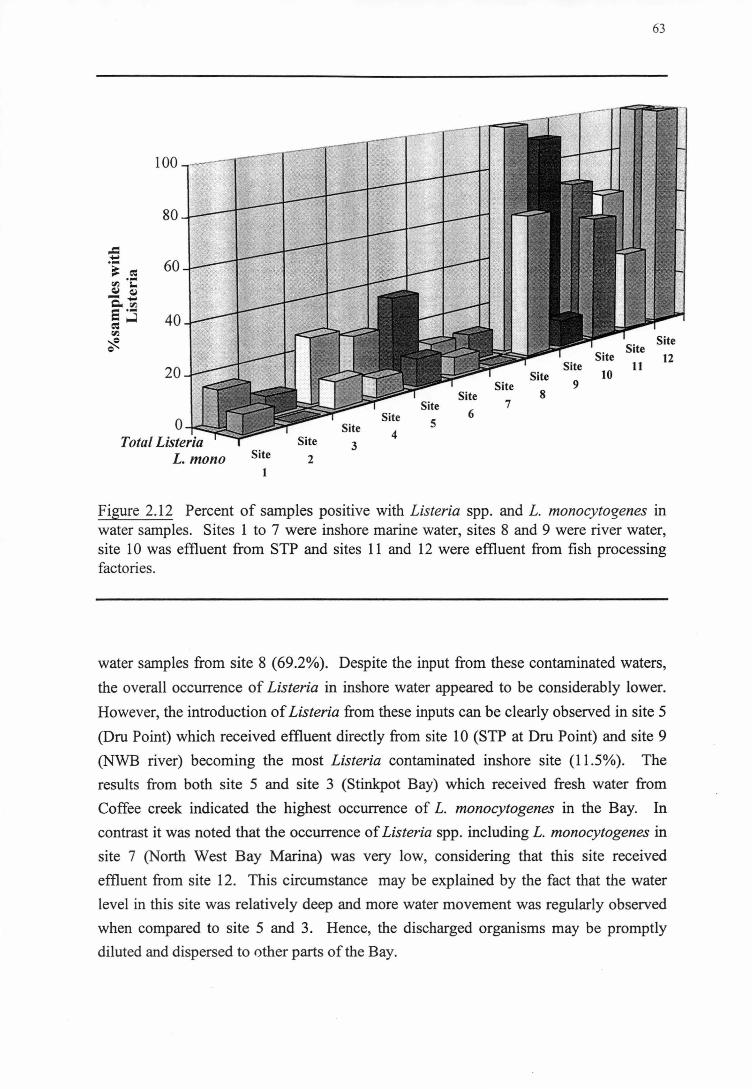
63
100
80
60
40
10 11
12 20
9 8
7 6
0 -+<:::::!a~. Total Listeria
L. mono
5 4
Site 3
2
Figure 2.12 Percent of samples positive with Listeria spp. and L. monocytogenes in water samples. Sites 1 to 7 were inshore marine water, sites 8 and 9 were river water, site 10 was effluent from STP and sites 11 and 12 were effluent from fish processing factories .
water samples from site 8 (69.2%). Despite the input from these contaminated waters,
the overall occurrence of Listeria in inshore water appeared to be considerably lower.
However, the introduction of Listeria from these inputs can be clearly observed in site 5
(Dru Point) which received effluent directly from site 10 (STP at Dru Point) and site 9
(NWB river) becoming the most Listeria contaminated inshore site (11.5%). The
results from both site 5 and site 3 (Stinkpot Bay) which received fresh water from
Coffee creek indicated the highest occurrence of L. monocytogenes in the Bay. In
contrast it was noted that the occurrence of Listeria spp. including L. monocytogenes in
site 7 (North West Bay Marina) was very low, considering that this site received
effluent from site 12. This circumstance may be explained by the fact that the water
level in this site was relatively deep and more water movement was regularly observed
when compared to site 5 and 3. Hence, the discharged organisms may be promptly
diluted and dispersed to other parts of the Bay.
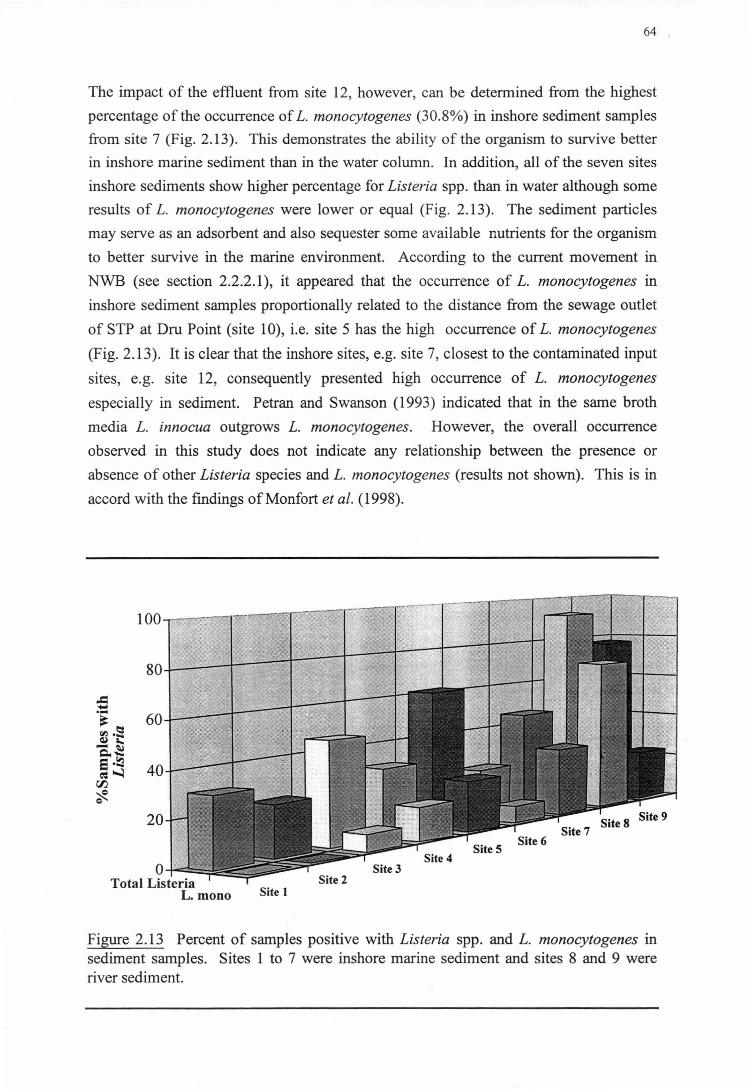
64
The impact of the effluent from site 12, however, can be determined from the highest
percentage of the occurrence of L. monocytogenes (30.8%) in inshore sediment samples
from site 7 (Fig. 2.13). This demonstrates the ability of the organism to survive better
in inshore marine sediment than in the water column. In addition, all of the seven sites
inshore sediments show higher percentage for Listeria spp. than in water although some
results of L. monocytogenes were lower or equal (Fig. 2.13). The sediment particles
may serve as an adsorbent and also sequester some available nutrients for the organism
to better survive in the marine environment. According to the current movement in
NWB (see section 2.2.2.1), it appeared that the occurrence of L. monocytogenes in
inshore sediment samples proportionally related to the distance from the sewage outlet
of STP at Dru Point (site 10), i.e. site 5 has the high occurrence of L. monocytogenes
(Fig. 2.13 ). It is clear that the inshore sites, e.g. site 7, closest to the contaminated input
sites, e.g. site 12, consequently presented high occurrence of L. monocytogenes
especially in sediment. Petran and Swanson (1993) indicated that in the same broth
media L. innocua outgrows L. monocytogenes. However, the overall occurrence
observed in this study does not indicate any relationship between the presence or
absence of other Listeria species and L. monocytogenes (results not shown). This is in
accord with the findings of Monfort et al. (1998).
100
80
..= ... ·- 60 ~ rll .!::! ~ i:! -~ c. .... 8·~ 40 =~
00 ~ Q
20
0 Site I
Figure 2.13 Percent of samples positive with Listeria spp. and L. monocytogenes in sediment samples. Sites 1 to 7 were inshore marine sediment and sites 8 and 9 were river sediment.
65
The species identification in the present study showed that L. monocytogenes occurred in
all types of samples i.e. inshore water, river, effluent, sediment and shellfish. In
addition, all 26 effluent samples collected over the 12 month penod from sewage
treatment plant of fish factory 2 were found to contain L. monocytogenes. However, it
does not indicate that the organism can survive and proliferate in the effluent throughout
the year. Occasionally, the isolated organism appeared to have a different pattern of
haemolytic activity on CAMP test. Hence, a genetic analysis of all 113 L. mono
cytogenes isolates using multilocus enzyme electrophoresis (MEE) was conducted to
determine the genomic relatedness of the organism within the same group of or between
the different types of samples and study areas. The 12 enzyme loci analysed were all
polymorphic. L. monocytogenes has been found (Boerlin et al., 1991) to have no
monomorphic loci with specific alleles (alleles not shared with other species).
The results from MEE method verify the variation of the L. monocytogenes strains in
each sampling time as the 113 isolates represented 85 distinct Electrophoretic Types (ETs)
(Table 2.6). The genetic diversity ranged from 0.864 to the highest diversity from
effluent isolates, 0.972 (Table 2.6). In particular, 17 ETs were found from the 18
isolates of L. monocytogenes collected from the sewage· treatment plant at Dru Point (site
10). Of these, two different ETs of L. monocytogenes were isolated from the same
samples (Appendix C, Table C.10). This indicates a high diversity of L. monocyto$enes
in effluent and suggests that strains of L. monocytogenes in the aquatic environment
frequently transfer and recombine chromosomal DNA, leading to randomization of
alleles. This finding is similar to N!Zirrung and Skovgaard (1993) who found that the
genetic diversity of L. monocytogenes in fish, cattle and raw meat ranged from 0.879 to
0.927. In addition, the isolates from seawater in the study of R!Zirvik et al. (1995)
showed different genetic diversity. However, other studies (Piffaretti et al., 1989; Bibb
et al., 1990; Lawrence and Gilmour, 1995) reported smaller numbers of clon~ types in
listeriosis patients, foods and industrial environments which can be· explained from the
fact that only a small fraction (often one or a few) of the existing clones are involved in
causing serious disease (Piffaretti et al., 1989) or have adapted and survived in processed
foods and industrial environments (Boerlin and Piffaretti, 1991; Fenlon et al., 1996).
The following cluster analysis and dendrogram of the 85 ETs (Fig. 2.14) presents genetic
distances between ETs.
From the 54 effluent isolates (Table 2.6), 20 ETs were found from the 26 isolates from
fish factory 2. Some consecutive isolates from this site, however, showed the same ET
(T~ble 2.7) e.g. W12/14, W12/16, W12/17, and W12/18 were ET-53, W12/20 and
W12/22 were ET-67, W12/21 and Wl2/24 were ET-68, and Wl2/25 and W12/26 were
ET-80.
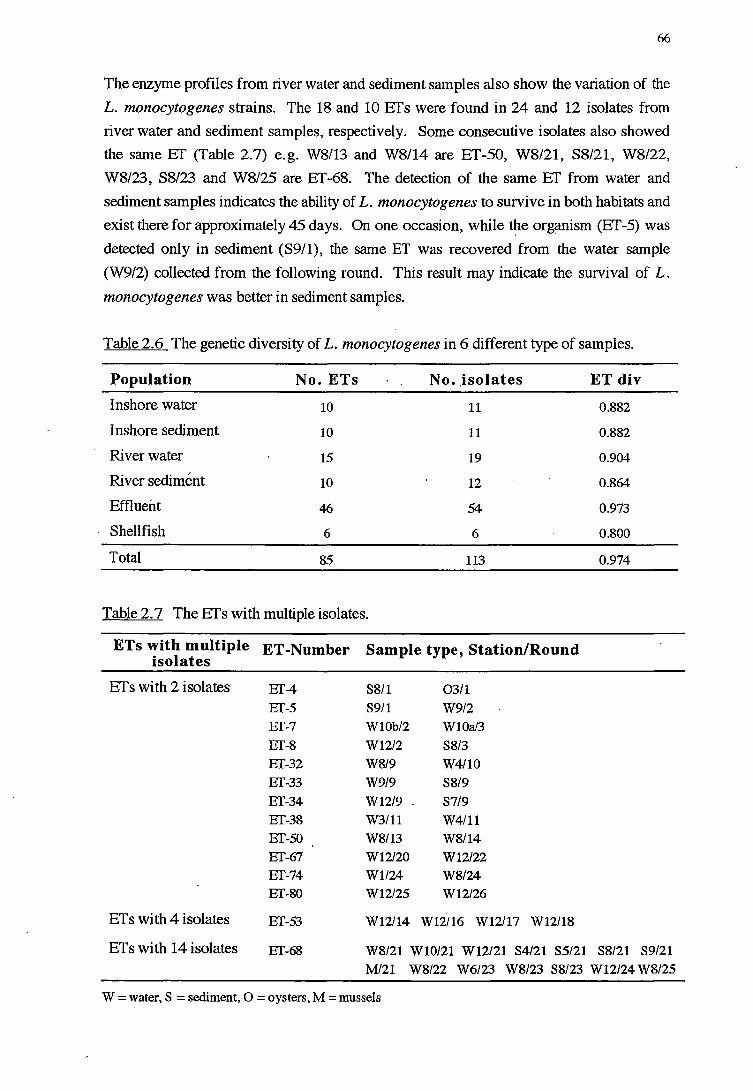
66
The enzyme profiles from river water and sediment samples also show the variation of the
L. monocytogenes strains. The 18 and 10 Efs were found in 24 and 12 isolates from
river water and sediment samples, respectively. Some consecutive isolates also showed
the same Ef (Table 2.7) e.g. W8/13 and W8/14 are ET-50, W8/21, S8/21, W8/22,
W8/23, S8/23 and W8/25 are ET-68. The detection of the same Ef from water and
sediment samples indicates the ability of L. monocytogenes to survive in both habitats and
exist there for approximately 45 days. On one occasion, while the org!lnism (ET-5) was
detected only in sediment (S9/1), the same ET was recovered from the water sample
(W9/2) collected from the following round. This result may indicate the survival of L.
monocytogenes was better in sediment samples.
Table 2.6 The genetic diversity of L. monocytogenes in 6 different type of samples.
Population No. ETs No . .isolates ET div
Inshore water 10 11 0.882
Inshore sediment 10 11 0.882
River water 15 19 0.904
River sediment 10 12 0.864
Effluent 46 54 0.973
Shellfish 6 6 0.800
Total 85 113 0.974
Table 2. 7 The Efs with multiple isolates.
ETs with multiple ET-Number Sample type, Station/Round isolates
ETs with 2 isolates ET-4 S8/1 03/1 ET-5 S9/1 W9/2 EI'-7 WlOb/2 WlOa/3 EI'-8 W12/2 S8/3 EI'-32 W8/9 W4/10 EI'-33 W9/9 S8/9 EI'-34 W12/9 S7/9 EI'-38 W3/11 W4/11 ET-50 W8/13 W8/14 EI'-67 W12/20 W12/22 EI'-74 Wl/24 W8/24 EI'-80 W12/25 W12/26
ETs with 4 isolates ET-53 W12/14 Wl2/16 W12/17 W12/18
ETs with 14 isolates EI'-68 W8/21 Wl0/21 W12/21 S4/21 S5/21 S8/21 S9/21
M/21 W8/22 W6/23 W8/23 S8/23 W12/24 W8/25
W =water, S =sediment, 0 =oysters, M =mussels

Figure 2.14 (facing page). Genetic relationships among 85 ETs of 113 L. monocytogenes isolates. The dendrogram was generated by the average-linkage method of clustering from a matrix of pairwise coefficients of genetic distances, based on electrophoretically demonstrable allelic variation at 12 enzyme loci. Ins, inshore marine water, sediment or shellfish; Riv, river water or sediment; Ef, effluent; W, water; S, sediment; 0, oysters; M, mussels; round/site.
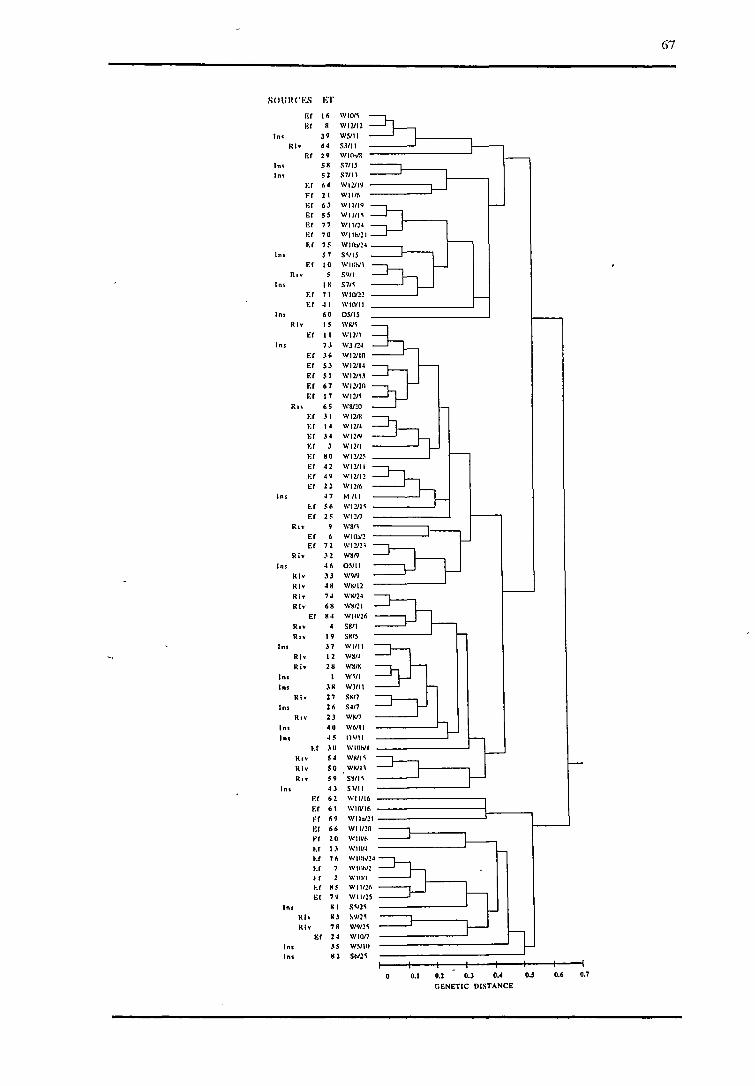
67
sounn:s 10:-1'
El 16 WIO/I
El Wl2112
In• 39 WS/11
Rlv 44 SR/II
El 2• WIOVR
In• 58 57115
In• 52 S7/ll
t:1 64 Wll119
FI 21 Wll/6
t:1 6J WI I/IQ
El SS Wll/11
Er 77 Wll/2..S El 70 w11tv21 El 75 Wllbn•
In• S7 SVl!a El I 0 WION\
Rov s 51.111
Ins 1 K 571~
El 71 Wl<Vl2 El 4 I \\'l(L'll
Ins 60 05115 R Iv IS \\'K/I
F.I II Wll/\
Ins 7 .I \VJ /24 El H Wl2JIO
t:1 5J Wl2114
El SI WllJIJ
t:1 67 \\'12/20
El 17 \\'121'
Rn 65 WR/lU El .II Wl2/K
El 14 WIU.
El H \\'12~
El .I \I'll/I
El 80 Wl2/2!a El 42 \\'12111 ,El 49 Wl2/12
El 22 \\'12/b
Ins 47 Miii
H H \\'12/l"i
El 25 w12n Rav 9 WR/I
El 6 Wlll3'2
El 72 Wl2/2l
Rlv n W8/9
Ins 46 05/11
Rlv JJ W9/9
Riv 48 WR/12
Rh H WM/2.S
Rlv 68 \\'K/21
El K4 WlfV26
Rov 4 SR/I
Rov 19 SRl5
Ins 37 WI/II
Rlv 12 Wll/J
Rlv 2K WHIM
Ins I W"i/1
Ins JK WJ/11
Rh 27 SK/l
Ins 26 S"7
Rov 23 WR/7
Ins 40 WWII
hu H 0\111
t.I .\II WlllhlH
Rov 54 WK/I<
Rlv 50 WK/J\
Rov 59 SK/II
Ins 43 S\/l 1
El 62 Wll/16
F.I 61 WICVl6
Ff 69 Wll:l/21
t:r 66 Wll/:!O
t"I 20 WllVh
t.r I.I \\'10/.S
t.1 76 WION'2J
t.r \\'lllhl2
tr \\'Hiil
t.r KS Wl112h
El 79 WlltH
Ins K I S<ll"i
Rh K.I ~W2"i
Rlv 78 W9/H
El 24 Wion
Ins .IS W!a/111
Ins 82 SfJl"i
0.1 0.2 O.J 0.4 0.5 0.6 0.7
GENETIC DISTANCE
68
The distribution of L. monocytogenes in North West Bay was shown by the detection of
the same ET from different sample types and sampling stations at the same sampling time
(Table 2.7). For example on round 1, L. monocytogenes in fresh water from Coffee
Creek (site 8) appeared to contaminate the oysters in Stinkpot Bay (site 3) as both isolates
were ET~4. The same ET (ET-32) from Coffee Creek on round 9, was also found on
round 10 in water sample from 'Sanctuary' foreshore (site 4). Moreover on round 24, an
isolate from Tinderbox was also found to be the same ET (ET-74) as from Coffee Creek.
In addition, the ET-68 isolated from the input sources i.e. Coffee Creek, NWB River
showed wide distribution to the Bay i.e. 'Sanctuary' foreshore (site 4), Dru Point (site 5),
NWB Commercial Jetty (site 6a) and mussel samples from Beach Road Jetty (site 6b).
Several differences of L. monocytogenes strains found in estuarine environment and the
studied input sources (river and effluent) revealed that other input sources such as runoff
of animal faeces from grazing land other creeks and river (see Table 2.1) may also
contribute L. monocytogenes to the NWB environmental system.
2. 3. 4 GENERAL DISCUSSION
Environmental samples (Water and sediment): The occurrence of L. monocytogenes in
the inshore_ water in North West Bay was relatively low although there were peaks in
September and October 1994 and April 1995. The overall marine waters in North West
Bay especially at deep water level were generally free of Listeria. Although there was no
report of L. monocytogenes infection from the water sources, caution is needed in areas
which are close to discharges of Listeria contaminated water i.e. sites 3, 5, 6, and 7. In
addition to the high occurrence of L. monocytogenes in river and effluent in the present
study, any activity involving these contaminated waters should be limited. Furthermore, 0
these waters may be considered as a primary point-source for distribution of this
biohazard and other pathogens. It seems desirable to eliminate, where possible, these
potentially pathogenic organisms before distribution to the sea and other surface water.
Food (Oysters and Mussels): The naturally growing intertidal oysters in Stinkpot Bay
and Dru Point (sites 3 and 5) showed 15.4% (n==26) positive for L. monocytogenes.
Concurrently, mussels which were specially grown at NWB commercially Jetty (site 6b)
for this investigation contained L. monocytogenes in 15.4% of samples (n=13). Several
studies (Motes, 1991; Chai et al., 1994) indicated that shellfish, being filter feeders, have
the ability to concentrate pathogenic micro-organisms from the water column. The
agreement was found in this investigation that oysters and mussels bioaccumulated L.
monocytogenes from NWB water column (see Fig. 2.11). However, as these areas are
not approved shellfish-growing area, the oysters and mussels are normally not taken for
human consumption. In the present study, it was noted that there was an increased

69
incidence of L. monocytogenes in the environmental samples including shellfish if there
was high rainfall in the 24 to 72 hr prior to the sampling time.
The economic importance of smoked Atlantic salmon (Salmo salar) industry for local and
exp6rt purpose for Tasmania, the rate and sources of contamination of L. mono
cytogenes in salmon, surrounding estuarine environment and salmon processing plant
will be investigated in the subsequent chapter.
3 70
THE OCCURRENCE OF LISTERIA SPP. INCLUDING L.
MONOCYTOGENESIN A FISH PROCESSING FACTORY
3.1 INTRODUCTION
Knowledge of the ecology of L. monocytogenes in the environment is important to be
able to understand the prevalence and distribution of the organism. However, how the
organism contaminates food and consequently causes the infection is of more interest for
control and prevention of sporadic cases or outbreaks of listeriosis. L. monocytogenes
has regularly been detected in variety of foods including vegetables, dairy products, meat
and seafood etc. (Weagant et al., 1988; Ryser and Marth, 1991; Dillon and Patel, 1992;
Gibson, 1992; Ben Embarek, 1994). Although the pathogen can withstand a wide range
of different treatments, applying adequate heat to foods before consumptj.on is sufficient
to eliminate it. However, public health risk has increased partly due to the changes in
consumer behaviour, particularly preference for minimally processed, ready-to-eat (RTE),
foods which require no further process or heating before consumption (Farber et al. ,
1996). Among RTE foods, cold-smoked salmon is an economically important product
for Tasmania and Australia Such food is capable of sustaining growth of L.
monocytogenes (Farber, 1991; R0rvik et al., 1991; Ben Embarek and Huss, 1992;
Hudson and Mott, 1993a). Provided that the contaminated fish might undergo merely a
cold-smoking process and will be consumed without any further cooking, a small initial
inoculum may result in a much larger dose by the time the product is consumed and may,
thus, pose a public health risk.
Although there is no evidence that cold-smoked salmon has been associated with any
outbreak of listeriosis, two sporadic cases with foetal death were reported in Victoria
(Anon., 1993c) and New South Wales, Australia (Arnold and Coble, 1995). In addition,
other smoked seafood product e.g. smoked mussels (Baker et al., 1993), and cold
smoked and gravad rainbow trout (Ericsson et al., 1997) were also reported to be
associated with sporadic and outbreak listeriosis respective! y.
The production of cold-smoked salmon includes no listericidal stage to eliminate L.
monocytogenes (Truelstrup Hansen, 1995). The products are reported to support growth
of L. monocytogenes even when stored at4°C (Farber, 1991). Some earlier studies (e.g.
Harvey and Gilmour, 1993; Fuchs and Nicolaides, 1994; R~rvik et al., 1995) have
detected L. monocytogenes from finished products and fish factory environments. Guyer
and Jemmi (1991) found that raw fish was more frequency contaminated than finished
71
products. Eklund et al. ( 1995) indicated the external surface of fresh and frozen fish to be
the primary mode of introducing L. monocytogenes into the cold-smoked fish factory.
Contamination of cold-smoked fish can occur during or after processing (R0rvik and
Yndestad, 1991; Ben Embarek, 1994). There are many possibilities for the pathogen to
come into contact with the meat surface e.g. along the processing lines, ice and water
used in the process, equipment surfaces, and handling etc. Little information on
contamination sources for L. monocytogenes within the salmon factory was determmed
by Truelstrup Hansen ( 1995).
In terms of epidemiology, infectious micro-organisms responsible for a specific outbreak
are clonal; that is, they are the progeny of a single cell and thus are genetically identical or
nearly so. Among isolates of the same species collected from different sources and sites
and at different times, there is sufficient genetic diversity to allow identification of
different clones or clonal groups (Versalovic et al., 1991). Several subtyping methods
have been developed to reveal the ecology and epidemiology of L. monocytogenes which
can help identifying potential sources of contamination and tracing the spread of the
pathogen.
It has been reported that only a limited number of strains L. monocytogenes were detected
in foods and foods processing environment, and a listeriosis patient (Piffaretti et al. ,
1989; Schuchat et al._, 1991a). Serotyping and phage typing were not sufficiently
discriminatory and left a significant number of strains untypable (Seeliger and Hohne,
1979; McLauchlin et al., 1986; Boerlin et al., 1997). Several alternative molecular
methods which show higher discriminating power have been applied to L. mono
cytogenes: multilocus enzyme electrophoresis (Bibb et al., 1990; Lawrence and Gilmour,
1995), restriction enzyme analysis (Gerner-Smidt et al., 1996), pulsed-field gel
electrophoresis (Brosch et al., 1994), restriction fragment length polymorphism (Harvey
and Gilmour, 1994). However, most of these methods are complex, time-consuming and
labour-intensive (Swaminathan and Matar, 1993). Recently, a PCR-based ~olecular
method, random amplification of polymorphic DNA (RAPD), which requires no
knowledge of DNA sequences, and is quick and easy to perform has been applied for the
typing of Listeria strains (Welsh and McClelland, 1990; Wagner et al., 1996). More
recently, the repetitive element sequence-based PCR (rep-PCR) method has been shown
to be a powerful tool in subtyping Listeria species including L. monocytogenes strains
(Jersek et al., 1996). The method uses primer sets based on repetitive elements, such as
the 35 to 40 bp repetitive extragenic palindromic (REP) sequence, the 124 to 127 bp
enterobacterial repetitive intergenic consensus (ERIC) sequence (Jersek et al., 1996) and I
I
the 154 bp BOX sequence (Martin et al., 1992) and displays high discriminating power
and reproducibility.
72
In this chapter, an investigation of the occurrence of Listeria species, especially L.
monocytogenes, in the complete process of a bat<?h of cold-smoked salmon from the fish
and the marine farm environment, through the process until being vacuum-packed was
undertaken. The 20 previous L. monocytogenes isolates (Table 3.6) collected from the
same factory processing environment and its finished products during May-August 1996
(via a collaborative laboratory) and other isolates, if any, from the recent survey are
further identified using the rep-PCR method.
3 .1.1 L. MONOCYTOGENES AND COLD- SMOKED SALMON
Cold-smoked salmon is a highly appreciated food commodity world wide, but the
product is merely lightly preserved and, traditionally, does not undergo a listericidal
process (Truelstrup Hansen, 1995). The salting is done by mechanical injection or direct
addition of dry salt or brining to obtain an even distribution of salt in the fish in the range
of 3-5% water phase salt (Huss et al., 1995). Cold-smoking is performed at ea. 26°C
and, currently, has become so mild that it is considered to be a smoke-flavouring rather
than smoke-preserving process (Horner, 1992). The smoked salmon is normally
vacuum-packed in airtight plastic bags of low oxygen permeability. Storage and
distribution of the product is at temperatures s5°C (Huss et al., 1995). Some studies
(Guyer and Jemmi, 1991; Dillon et al., 1992) have shown that brining and smoking
stages do not affect L. monocytogenes but support growth of the pathogen even stored at
4°C (Farber, 1991). Cold-smoked salmon is, therefore, considered to be a high risk
ready-to-eat food with potential to harbour and allow growth of L. monocytogenes (Huss
e_t al., 1995).
The application of the hazard analysis critical control point (HACCP) system to the
production of cold-smoked salmon has been introduced, with the final product testing
used in the verification programme (Huss et al., 1995). Two types of critical control
point (CCP) are identified: CCPl (ensures full control of the hazard), and CCP2
(minimises but does not ensure full control of the hazard) (Truelstrup Hansen, 1995). It
was, however, concluded that there is no CCPl to control the growth of L. mono
cytogenes in cold-smoked salmon (Huss et al., 1995; Truelstrup Hansen, 1995).
Therefore, Huss et al. (1995) recommended the use of good manufacturing practices
(GMP) to minimise contamination, and to limit shelf life to three weeks at 5°C for cold
smoked vacuum-packed salmon having ;::3% water phase salt (WPS). In addition, the
incorporation of additional hurdles into the product is suggested.
Recently, a risk assessment for contamination of smoked salmon with Listeria
monocytogenes during processing was reported (R~rvik et al., 1997). These authors
73
indicated that job rotation among departments in the smoked salmon processing facilities
was the strongest expressed risk factor (hazard ratio=l 1) for isolation of L. mono
cytogenes from the smoked salmon.
3.1.1.1 L. monocytogenes in cold-smoked salmon
Occurrence and Source of contamination
During the past few years, L. monocytogenes has been isolated from cold-smoked
salmon produced from several countries (Table 3.1). The contamination rate in fimshed
product ranged from 0% to 79% in a survey of 6 plants which previously had L. mono
cyto genes contamination problems (Table 3 .1).
Few studies on sources of L. monocytogenes contamination have been discussed in
section 3.1. The primary source of contamination may be the external surfaces of frozen
and fresh raw fish that came into the processing plants. However, none of typing
techniques were applied during their survey. R!Zirvik et al. (1995) investigated a smoked
salmon processing plant in Norway and the MEE technique was applied to the L. mono
cytogenes isolates. They found that one strain of L. monocytogenes (ET-6) was
predominant in the smokehouse and was the only ET (Electrophoretic Type) found in the
finished products. In addition, the authors reported that the clone colomzed in both
environmental and fish samples from smokehouse during the whole eight months
investigation period. Since the isolates from sea water and slaughtered fish were different
from the strain in finished product, ET -6, the authors concluded that the contamination of
L. monocytogenes was due to the processing plant contamination. However, the source
of contamination of the plant was not determined.
Level of L. monocytogenes contamination
The natural level of L. monocytogenes on freshly produced cold-smoked salmon are
reported to be low (Table 3.1). However, very high levels of 25,400 cfu/g was reported
by Loncarevic et al. (1996) who explained that the product might have been temperature
abused and that the proliferation of L. monocytogenes took place during storage. The
other high level of >1,100, and 1,100 MPN/g were found in cold-smoked salmon which
have been kept at 2°C and l0°C for 60 and 40 days respectively (Cortesi et al., 1997).
The level of L. monocytogenes contamination which should be tolerated in cold-smoked
salmon is subject to heated international discussion (Huss et al., 1995). Several
researchers questioned the possibility of producing L. monocytogenes-free cold-smoked
salmon (Huss et al., 1995; Truelstrup Hansen, 1995; Farber et al., 1996). In Australia,
smoked salmon products which are intended for export or local consumption must be
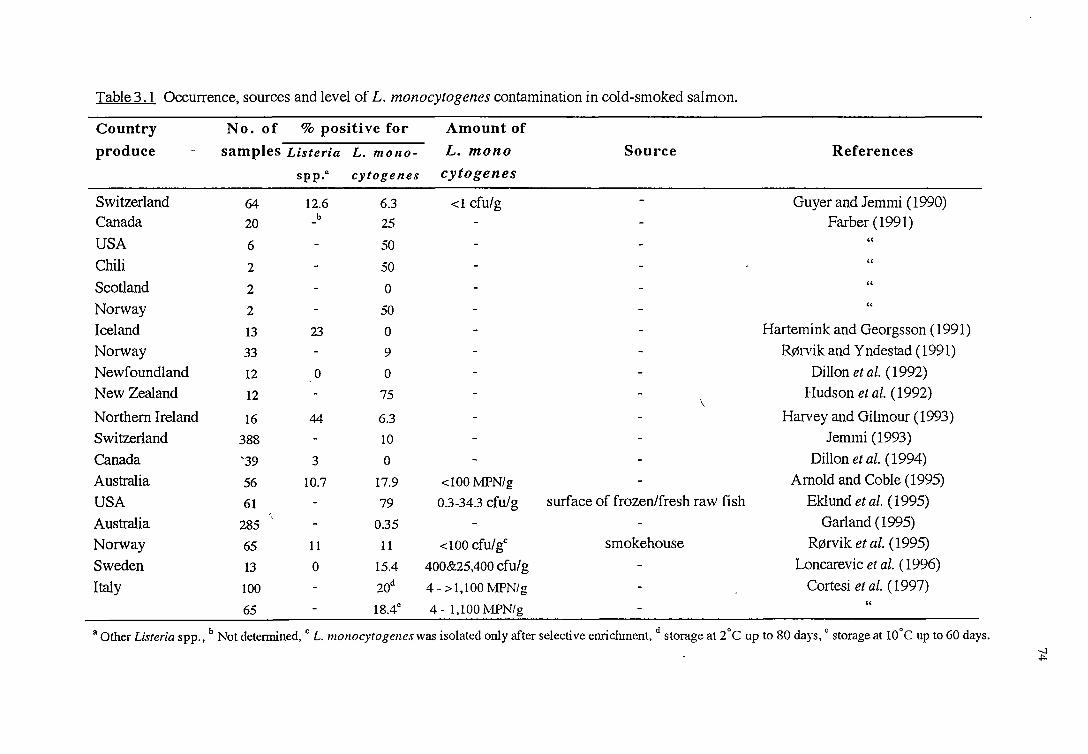
Table 3 .1 Occurrence, sources and level of L. monocytogenes contamination in cold-smoked salmon.
Country No. of % positive for Amount of
produce samples Listeria L. mono- L. mono Source References
spp.a cytogenes cytogenes
Switzerland 64 12.6 6.3 <1 cfu/g - Guyer and Jemmi (1990) Canada 20
b 25 Farber (1991) - - -
USA 6 - 50 " Chi Ii 2 - 50 " Scotland 2 - 0 " Norway 2 - 50 " Iceland 13 23 0 - - Hartemink and Georgsson (1991)
Norway 33 - 9 - - R0rvik and Y ndestad ( 1991)
Newfoundland 12 0 0 - - Dillon et al. (1992)
New Zealand 12 - 75 - - Hudson et al. (1992) \
Northern Ireland 16 44 6.3 - - Harvey and Gilmour (1993)
Switzerland 388 - 10 - - Jemmi (1993)
Canada '39 3 0 - - Dillon et al. (1994)
Australia 56 10.7 17.9 < 100 l\!IPN/ g - Arnold and Coble (1995)
USA 61 - 79 0.3-34.3 cfu/g surf ace of frozen/fresh raw fish Eklund et al. (1995)
Australia 285 - 0.35 - - Garland (1995)
Norway 65 11 11 <100 cfult smokehouse R0rvik et al. (1995)
Sweden 13 0 15.4 400&25,400 cfu/g - Loncarevic et al. ( 1996)
Italy 100 - 20d 4- >1,100 MPN/g - Cortesi et al. ( 1997)
65 - 18.4c 4 - 1,100 l\!IPN/ g " -
a Other Listeria spp., b Not determined, c L. nzonocytogenes was isolated only after selective enrichment, d storage at 2°C up to 80 days, 0 storage at l0°C up to 60 days. -..l .p.
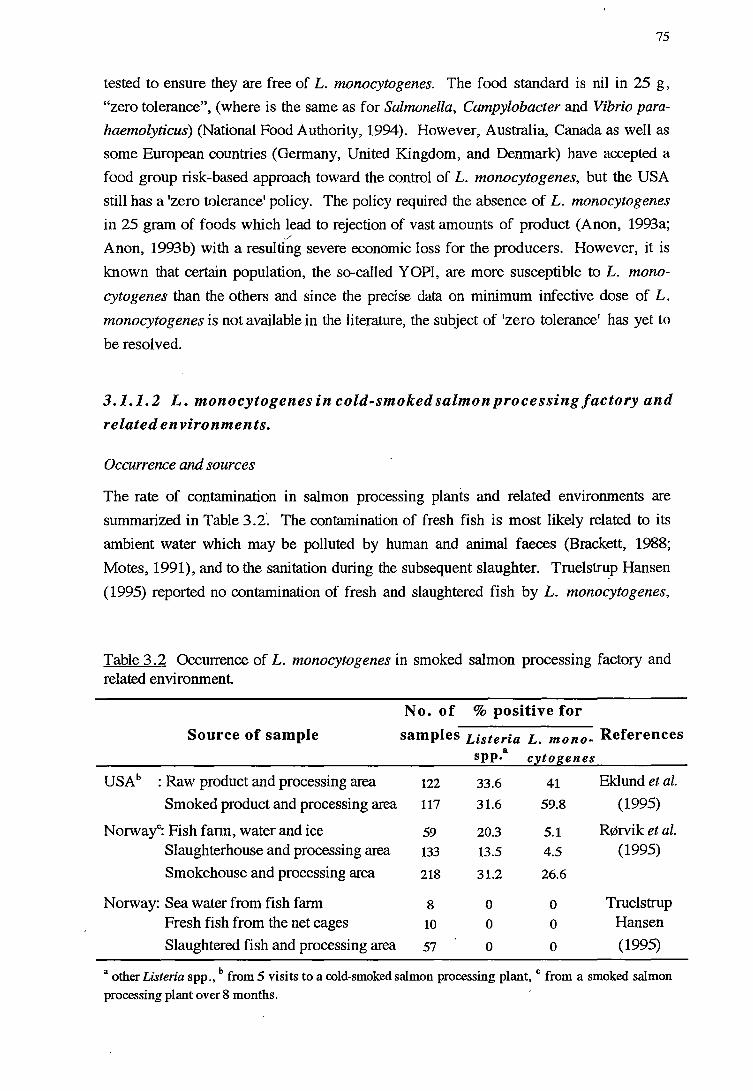
75
tested to ensure they are free of L. monocytogenes. The food standard is nil in 25 g,
"zero tolerance", (where is the same as for Salmonella, Campylobacter and Vibrio para
haemolyticus) (National Food Authority, 1994). However, Australia, Canada as well as
some European countries (Germany, United Kingdom, and Denmark) have accepted a
food group risk-based approach toward the control of L. monocytogenes, but the USA
still has a 'zero tolerance' policy. The policy required the absence of L. monocytogenes
in 25 gram of foods which lead to rejection of vast amounts of product (Anon, 1993a; J
Anon, 1993b) with a resulting severe economic loss for the producers. However, it is
known that certain population, the so-called YOPI, are more susceptible to L. mono
cytogenes than the others and since the precise data on minimum infective dose of L.
monocytogenes is not available in the literature, the subject of 'zero tolerance' has yet to
be resolved.
3.1.1. 2 L. monocytogenes in cold-smoked salmon processing factory and
related environments.
Occurrence and sources
The rate of contamination in salmon processing plants and related environments are
summarized in Table 3.2·. The contamination of fresh fish is most likely related to its
ambient water which may be polluted by human and animal faeces (Brackett, 1988;
Motes, 1991), and to the sanitation during the subsequent slaughter. Truelstrup Hansen
(1995) reported no contamination of fresh and slaughtered fish by L. monocytogenes,
Table 3.2 Occurrence of L. monocytogenes in smoked salmon processing factory and related environment.
No. of % positive for
Source of sample samples Listeria L. mono- References a spp. C'l_togenes
USAb : Raw product and processing area 122 33.6 41 Eklund et al.
Smoked product and processing area 117 31.6 59.8 (1995)
Norwayc: Fish farm, water and ice 59 20.3 5.1 Rfi'Srvik et al. Slaughterhouse and processing area 133 13.5 4.5 (1995)
Smokehouse and processing area 218 31.2 26.6
Norway: Sea water from fish farm 8 0 0 Truelstrup Fresh fish from the net cages 10 0 0 Hansen
Slaughtered fish and processing area 57 0 0 (1995)
a other Listeria spp., b from 5 visits to a cold-smoked salmon processing plant, c from a smoked salmon
processing plant over 8 months.
76
harvested from Listeria-free sea water, but . the occurrence was higher in the study of
R!Zirvik et al. (1995) (Table3.2). The same clone of L. monocytogenes, ET-11, isolated
from sea water was subsequently found in fish and environmental samples from the
smokehouse, although not in the finished product which was reported to be contammated
from the processing plant (R!Zirvik et (ll., 1995). Eklund et al. (1995) reported a much
higher occurrence in both raw and smoked products (Table 3.2). Those authors also
reported sanitation and cleanup procedures to be sufficient in eliminating L. mono
cytogenes from the processing line and equipment, but after several hours of re
processing the contamination recurred (Eklund etal., 1995). The possible sources of L.
monocytogenes may be raw fish, the personnel and the surrounding environment.
3.1.2 REP-PCR
Families of repetitive DNA sequences are present in a large number of copies and
dispersed throughout the genomes of all organisms including eukaryotic and prokaryotic
micro-organisms (Britten and Kohne, 1968; Versalovic et al., 1991; Lupski and
Weinstock, 1992; Louws et al., 1994). These repetitive sequences are located in non
coding regions and their primary structure is highly conserved (Newbury et al., 1987;
Lupski and Weinstock, 1992). Their precise function has not been determined but there
is evidence which suggests their presence to be important to th~ structure and evolution of
genomes (Britten and Kohne, 1968; Stem et al., 1984).
The first described and most intensively studied repeated sequences is the 35 to 40 bp
repetitive extragenic palindrome (REP), or palindromic unit (PU) sequence (Higgins et
al., 1982; Gilson et al., 1984) which was identified in S. typhimurium and E. coli. An
additional 124 to 127 bp repetitive intergenic consensus (ERIC), or intergenic repeat units
(IRUs) sequences was further identified in S. typhimurium and E. coli and other
enterobacterial species (Sharples and Lloyd, 1990; Hulton et al., 1991). More recently,
the 154 bp BOX elements was identified in Streptococcus pneumoniae (Martin et al.,
1992).
Recen.tly, Versalovic et al. (1991) synthesized REP- and ERIC-specific oligo-nucleotide
primers and used them for PCR with chromosomal DNA of different bacterial strains as
templates. They found that REP- and ERIC-like-sequences could be detected in a large
variety of bacterial genomes. Likewise, an additional BOX-like sequence was
synthesi~ed and used as an additional primer in PCR (Martin et al., 1992). In this
technique, collectively known as repetitive sequence element PCR (rep-PCR), the primers
bind to the repetitive sequences which are located in different positions in the prokaryotic
genome. These repeated sequences are separated by various distances depending on the
77
individual bacterial species or strain. The amplification products can be obtained if those
primer binding sites are in the proper orientation and within a distance that can be spanned
by Taq polymerase extension. The PCR products can then be size-fractionated by
agarose gel electrophoresis to reveal a specific pattern or genomic DNA fingerprint.
These fingerprints were reported to be species and strain specific in several bacterial
genera (Versalovic et al., 1991; Louws et al., 1994) including L. monocytogenes (Jersek
et al., 1996). Regarding the high homology to repetitive sequences of the primers, more
stringent PCR conditions can be used which in turn may reduce experimental variation
and PCR artefacts (Louws et al., 1994). In addition, the rep-PCR technique is very
reproducible and has good discriminatory power when compared to 1\!1EE (de Bruijn,
1992) and RAPD techniques (Jersek et al., 1996). The technique has been further
developed as 'whole cell rep-PCR' which is useful for rapid and routine diagnostic
analysis (Woods et al. , 1993).
3.2 MATERIALS AND METHODS '
3.2.1 MATERIALS
Details of consumables, reagents and media, and equipment used are presented m
Appendix A.
3.2.2 METHODS
3. 2.2.1 Sample collection
The 87 samples, i.e. 78 samples of factory products and processing sample sites and 9
environmental samples outside the factory, were collected from the fish processing
factory. The samples and sites are discussed in Table 3 .3.
Swab : A large area (30x30 cm2) of food processing equipment and environmental
surfaces was sampled using sterile gauze (5 layers of 5 cm x 5 cm). Sterile forceps were
used to hold gauze aseptically and swab the surf ace by vigorously rubbing the gauze over
the designated area. Approx. 5 ml of sterile 0.1 % peptone water was applied directly to
the flat dry surf aces and then taken up into the gauze by the rubbing action. Each swab
sample was kept in a sterile polyethylene bottle or small stomacher bag. Six layers of 10
cm xlO cm sterile gauze were prepared for drain swabs. Thf? gauze was placed at the
drain inlet for approx. 1 hr before being collected into a sterile polyethylene bottle.
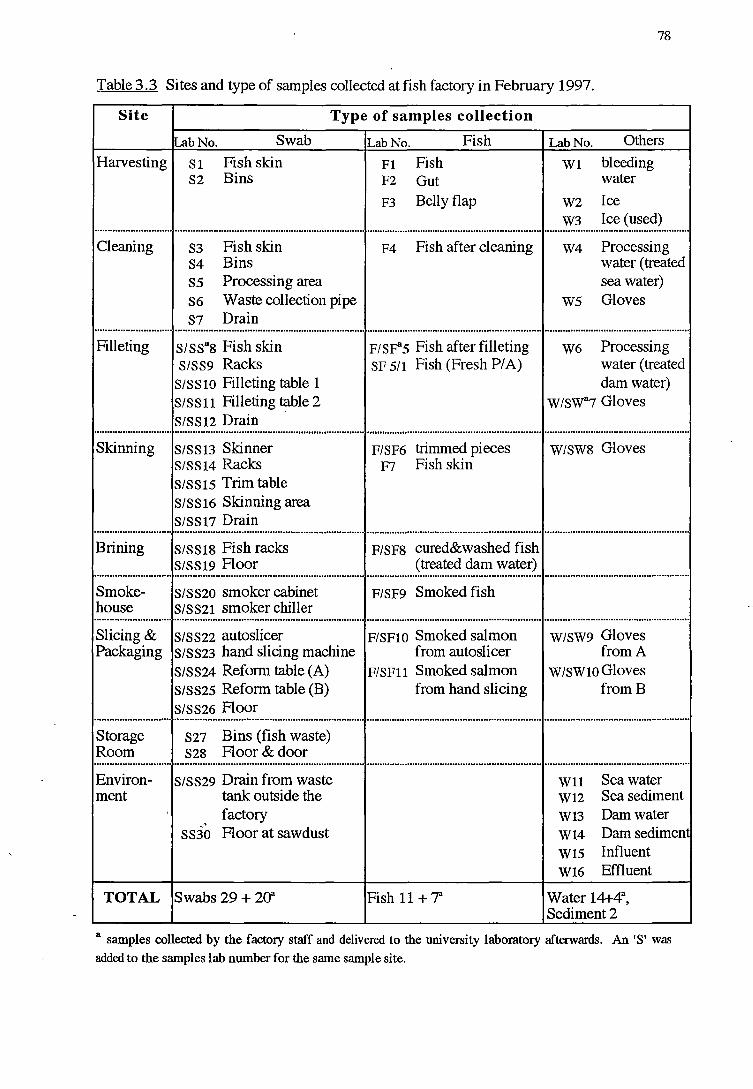
78
Table 3 .3 Sites and type of samples collected at fish factory in February 1997.
Site Type of samples collection
Lab No. Swab Lab No. Fish Lab No. Others
Harvesting Sl Fish skin Fl Fish Wl bleeding S2 Bins F2 Gut water
F3 Belly flap W2 Ice W3 Ice (used)
······························ .......................................................................... .................................................................... ......................................................... Cleaning S3 Fish skin F4 Fish after cleaning W4 Processing
S4 Bins water (treated S5 Processing area sea water) S6 Waste collection pipe ws Gloves S7 Drain .............................. .......................................................................... .................................................................... .........................................................
Filleting S/SS8 8 Fish skin F!SF"S Fish after filleting W6 Processing S/SS9 Racks SF 5/1 Fish (Fresh PI A) water (treated
S/SSlO Filleting table 1 dam water) S/SSll Filleting table 2 W/SW8 7 Gloves S/SS12 Drain .............................. .......................................................................... .................................................................... .........................................................
Skinning S/SS13 Skinner FISF6 trimmed pieces W/SW8 Gloves S/SS14 Racks F7 Fish skin S/SS15 Trim table S/SS16 Skinning area S/SS17 Drain .............................. .......................................................................... .................................................................... . ........................................................
Brining S/SS18 Fish racks F/SF8 cured&washed fish S/SS19 Floor (treated dam water) .............................. .......................................................................... .................................................................... .. .......................................................
Smoke- S/SS20 smoker cabinet F/SF9 Smoked fish house S/SS21 smoker chiller .............................. .......................................................................... ..................................................................... ......................................................... Slicing & S/SS22 autoslicer F/SFlO Smoked salmon W/SW9 Gloves Packaging S/SS23 hand slicing machine from autoslicer from A
S/SS24 Reform table (A) F/SFll Smoked salmon W/SWIO Gloves S/SS25 Reform table (B) from hand slicing fromB S/SS26 Floor .............................. .......................................................................... .................................................................... . ........................................................
Storage S27 Bins (fish waste) Room S28 Aoor&door .............................. .......................................................................... ..................................................................... ......................................................... Environ- S/SS29 Drain from waste Wll Sea water ment tank outside the Wl2 Sea sediment
. factory W13 Dam water SS30 Floor at sawdust W14 Dam sediment
W15 Influent W16 Effluent
TOTAL Swabs 29 + 20" Fish 11+7'" Water 14+4a, Sediment2
a samples collected by the factory staff and delivered to the university laboratory afterwards. An 'S' was
added to the samples lab number for the same sample site.
79
Fish : A fish weighing approx. 3-4 kg was sampled from the harvesting and cleaning
process. Pieces of fish, skin or smoked products along the processing line were sampled
into stomacher bags.
Water and ice : Water samples were collected using a sterile lor 2-L Schott bottle
(depending on type of water). The chlorine treated seawater and fresh water used in the
factory was directly collected from different outlets into sterile 2-L Schott bottles with
added 2 ml of 10% sodium thiosulphate solution (Appendix A). Approx. 500 ml of ice
was collected into a sterile polyethylene bottle with 0.4 ml of 10% sodium th1osulphate
solution added (Appendix A). For the environmental water samples, the sample was
collected in the same manner as in 2.2.2.3. A bottle holder (modified golf-ball retriever)
with an extension of 3 m was used to collect the dam water sample.
Surface Sediment : At the sea and dam sites, approximately 100 g of sediment, consisting
of several subsamples, was collected with a sterile modified syringe. Samples were then
placed in a sterile polyethylene bottle.
All 56 samples collected on 13-14 February 1997 were immediately brought to.the factory
laboratory. All swabs and sediment samples and some fish samples were processed
there. The water and some fish samples were refrigerated (4°C) before being transferred
to the University's laboratory within 18 hours. The additional 31 samples of the same
batch of fish collected by a factory staff were kept on ice and delivered to the university
laboratory on the same day of processing (18, 20, and 24 February 1997).
3.2.2.2 Microbiologicalanalysis
The USDA/FSIS method (Dennis and Lee, 1989) currently used in the food industry was
employed for isolation of Listeria spp. in this study. There were some differences in the
amount and preparation of samples but after the samples were in the primary enrichment
broth (UVMI), the methods presented in Fig. 2.4 (section 2.2.2.3) were followed.
Swab : Fifty ml of UVMI was added into each bottle of the swabbed samples. 100 ml of
UVMI was added for the drain swabs.
Fish, gut, skin and smoked products : Twenty five gram composite samples (flesh,
smoked products, and skin) were transferred into a stomacher bag. Twenty five grams of
gut and gut contents from a salmon were carefully removed and collected into a stomacher
bag. 225 ml of UVMlwas added and stomached (Colworth) for 2 min. Isolation and
identification of Listeria species including L. monocytogenes as described in Fig. 2.4
(section 2.2.2.3) were followed thereafter.
80
Water and ice: One or two litres of samples, depending on the type of water, was filtered
through a prefilter and membrane filter 0.45 µm-pore-size, 90 mm diameter. Ice (500 ml)
was filtered through a prefilter and membrane filter 0.45 µm-pore-size, 45 mm diameter.
Both the prefilter and 0.45 µm membrane filter were placed in 100 ml UVMl and the
methods described in Fig. 2.4 (section 2.2.2.3) followed
Surface Sediment: Sediment samples in polyethylene bottles were mixed by stirring with
a sterile handheld spoon, and 25 grams of sample added to 225 ml of UVMl and the
method given in Fig. 2.4 (section 2.2.2.3) followed.
In the case of presumptive Listeria positive isolates, (from the results of biochemical test:
see section 2.2.2.3, Table 2.3), the cultures were confirmed using api Listeria (bio
Merieux Vitek) test kits.
3.2.3 SUBTYPING METHOD: REP-PCR (REPETITIVE SEQUENCE ELEMENT POLY
MERASE CHAIN REACTION)
3. 2. 3.1 Isolates
Five known L. monocytogenes strains, i.e. 2 strains of ET-53 and 3 strains of ET-68,
isolated from NWB (see section 2.3.3, Table 2.7) which had been subtyped by the MEE
method were also subtyped by the BOX-PCR and REP-PCR methods in order to
compare the sensitivity of the methods. AL. monocytogenes pathogenic strain, Scott A,
and L. monocytogenes LS, an isolate from cold-smoked salmon (Table 3.5), were also
compared to these 5 NWB strains.
Twenty strains of L. monocytogenes (LS to 19, Table 3.6) isolated from a fish factory
environment and its finished products during May-August 1996 were also used in this
study. L. monocytogenes strains W12, S29 and SS29 (see Tables 3.3 and 3.4) were
isolated from the environment outside the factory. Sources of, and relevant information
on bacterial isolates, are listed in Table 3. 6.
The isolates were streaked on Listeria selective agar. A single colony was suspended in
BHI and 0.1 ml was spread on TSA-YE and incubated at 37°C for 24 hr. The methods
as outlined in sections 3.2.3.2-4 were followed.
3.2.3.2 Preparation of DNA
Genomic DNA from L. monocytogenes isolates was extracted by a modified method of
Marmur and Doty (1962) as follows. Cells were scraped from TSA-YE plates and
81
combined in a 15 ml sterile conical tube. Two ml of saline-EDT A, and 0.2 ml of
lysozyme solution were added, mixed well, and then incubated at37°C overnight. 0.1 ml
of 10% Sodium dodecyl sulphate (SDS), and 50 µl of proteinase K solution were added,
mixed well, and incubated at 60°C 'for 30 min. 0.3 ml of 10% SDS was added and
incubated at 60°C for 15 min. 1.4 ml of 70.2% sodium perchlorate was added, and
shaken using a wrist action for 4 min. Cell lysates were extracted once with 25:24: 1
phenol: chloroform:isoamyl alcohol and twice with 24: 1 chloroform: isoamyl alcohol
solution. Genomic DNA was precipitated by adding 2 volume of ice-cold 95% ethanol.
The DNA was dissolved in sterile MilliQ water. The DNA quantitation was performed by
spectrofluorim~try at excitation and emission wavelengths of 365 nm using a mini
fluorometer Model TK0-100 and a DNA-specific dye, Hoechst 33258 according to
manufacturer's instructions (Appendix A, section A.2.11).
3.2.3.3 rep-primers and rep-PCR amplification conditions
The REP-PCR primers (18-mer) are composed of REP lRI (5'-IIl-ICGICGICA
TCIGGC-3') andREP2-I (5'-ICGICTTATCIGGCCTAC-3'). The ERIC-PCR primers
(22-mer) are composed of ERIC lR (5'-ATGTAAGCTCCTGGGGATTCAC-3') and
ERIC 2 (5'-AAGTAAGTGACTGGGGTGAGCG-3'). The BOX-PCR primer, BOX
AIR (5'-CTACGGCAAGGCGACGCTGACG-3') is the same for both sides.
The polymerase chain reaction mixture was prepared as described by Versalovic et al.
(1991) as follows: each 25 µI PCR reaction contained 50 pmol each of 2 primers, 50 ng
of template genomic DNA, 1.25 mM of each of 4 dNTPs, 25 mM MgC12, lOx Reaction
Buffer, and 1 U Taq DNA polymerase. The ampl.ifications were performed in a DNA
thermocycler.
Amplification condition for REP-PCR: 1 cycle at 95°C for 3 min, 30 cycles at 90°C for
30 s, at40°C for 1 min, at 72°C for 1 min, 1 cycle at 72°C for 8 min and 4°C for 1 min.
Amplification condition/or ERIC- and BOX PCR : 1 cycle at 95°C for 5 min, 30 cycles
at 90°C for 30 s, at 50°C for 30 s, at 52°C for 1 min, at 72°C for 1 min, 1 cycle at 72°C
for 8 min and 4°C for 1 min.
3.2.3.4 Analysis of rep-PCRproducts
5-µl of gel loading buffer (Appendix A) was added to the amplified PCR products then a
12-µl portion of the suspension was separated on 1.5% agarose gel (10x15 cm) in
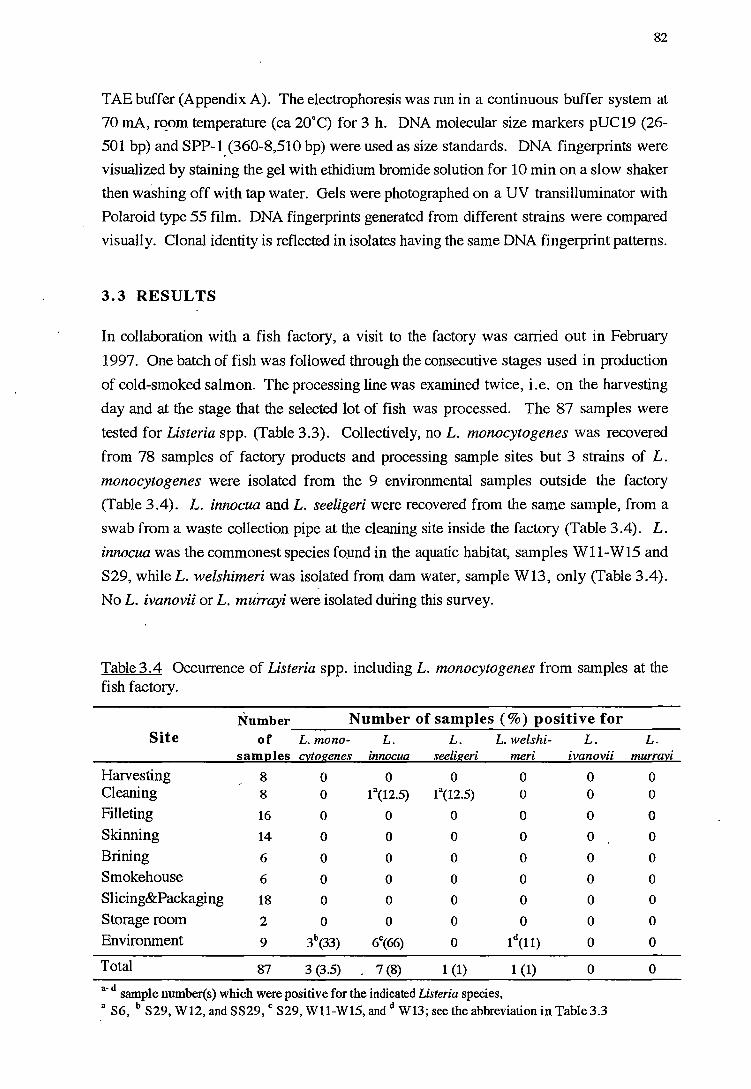
82
TAE buffer (Appendix A). The electrophoresis was run in a continuous buff er system at
70 mA, r~om temperature (ea 20°C) for 3 h. DNA molecular size markers pUC19 (26-
501 bp) and SPP-1_ (360-8,510 bp) were used as size standards. DNA fingerprints were
visualized by staining the gel with ethidium bromide solution for 10 min on a slow shaker
then washing off with tap water. Gels were photographed on a UV transilluminator with
Polaroid type 55 film. DNA fingerprints generated from different strains were compared
visually. Clonal identity is reflected in isolates having the same DNA fingerprint patterns.
3.3 RESULTS
In collaboration with a fish factory, a visit to the factory was carried out in February
1997. One batch of fish was followed through the consecutive stages used in production
of cold-smoked salmon. The processing line was examined twice, i.e. on the harvesting
day and at the stage that the selected lot of fish was processed. The 87 samples were
tested for Listeria spp. (Table 3.3). Collectively, no L. monocytogenes was recovered
from 78 samples of factory products and processing sample sites but 3 strains of L.
monocytogenes were isolated from the 9 environmental samples outside the factory
(Table 3.4). L. innocua and L. seeligeri were recovered from the same sample, from a
swab from a waste collection pipe at the cleaning site inside the factory (Table 3.4). L.
innocua was the commonest species fo.und in the aquatic habitat, samples W11-W15 and
S29, while L. welshimeri was isolated from dam water, sample W13, only (Table 3.4).
No L. ivanovii or L. mu1rayi were isolated during this survey.
Table3.4 Occurrence of Listeria spp. including L. monocytogenes from samples at the fish factory.
Number Number of samples(%) positive for Site of L. mono- L. L. L. welshi- L. L.
sam~les cy_togenes innocua seeligeri meri ivanovii murray_i
Harvesting 8 0 0 0 0 0 0 Cleaning 8 0 la(12.5) la(12.5) 0 0 0
Filleting 16 0 0 0 0 0 0
Skinning 14 0 0 0 0 0 0
Brining 6 0 0 0 0 0 0
Smokehouse 6 0 0 0 0 0 0
Slicing&Packaging 18 0 0 0 0 0 0
Storage room 2 0 0 0 0 0 0
Environment 9 3\33) 6c(66) 0 ld{ll) 0 0
Total 87 3 (3.5) 7 (8) 1 (1) 1 (1) 0 0 a-d sample number(s) which were positive for the indicated Listeria species, a S6, b S29, W12, and SS29, c S29, Wll-W15, and d W13; see the abbreviation in Table 3.3
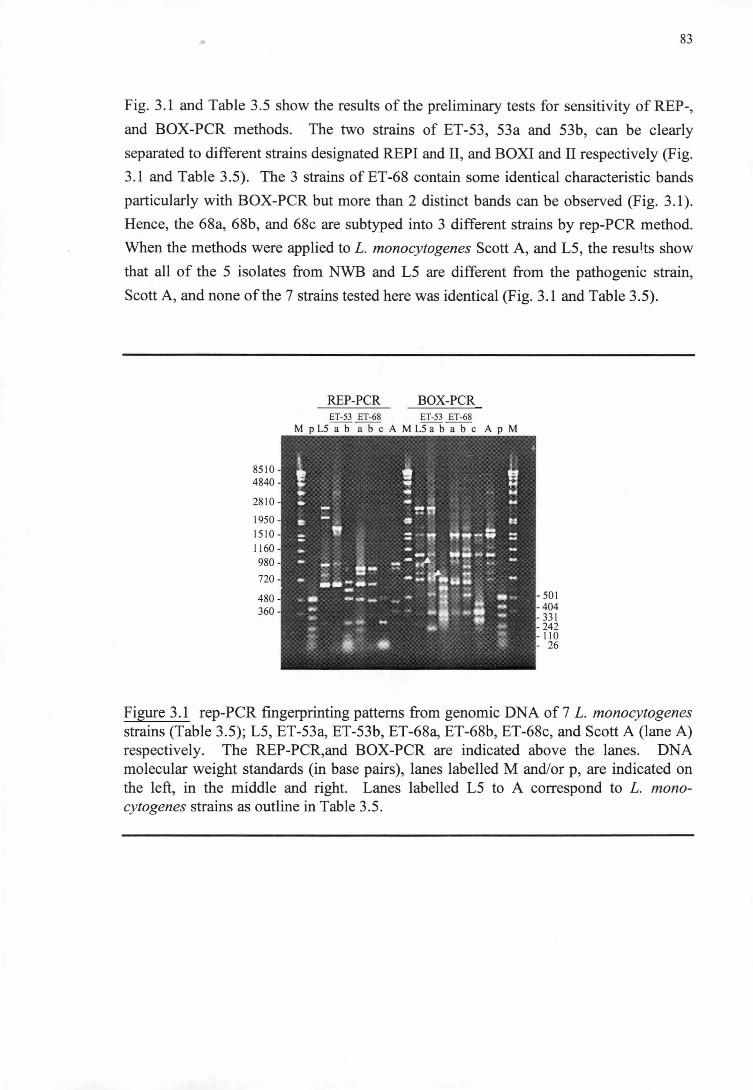
83
Fig. 3.1 and Table 3.5 show the results of the preliminary tests for sensitivity of REP-,
and BOX-PCR methods. The two strains of ET-53, 53a and 53b, can be clearly
separated to different strains designated REPI and II, and BOXI and II respectively (Fig.
3.1 and Table 3.5). The 3 strains of ET-68 contain some identical characteristic bands
particularly with BOX-PCR but more than 2 distinct bands can be observed (Fig. 3.1).
Hence, the 68a, 68b, and 68c are subtyped into 3 different strains by rep-PCR method.
When the methods were applied to L. monocytogenes Scott A, and L5, the results show
that all of the 5 isolates from NWB and L5 are different from the pathogenic strain,
Scott A, and none of the 7 strains tested here was identical (Fig. 3.1 and Table 3.5).
8510 4840
2810 -
1950 -
1510 -1160
980
720
480 360-
REP-PCR BOX-PCR ET-53 ET-68 ET-53 ET-68
M pL5ab~ AM L5a b-;J)c A p M
- 501 - 404 - 331 - 242 - 110 - 26
Figure 3.1 rep-PCR fingerprinting patterns from genomic DNA of 7 L. monocytogenes strains (Table 3.5); L5, ET-53a, ET-53b, ET-68a, ET-68b, ET-68c, and Scott A (lane A) respectively. The REP-PCR,and BOX-PCR are indicated above the lanes. DNA molecular weight standards (in base pairs), lanes labelled M and/or p, are indicated on the left, in the middle and right. Lanes labelled L5 to A correspond to L. monocytogenes strains as outline in Table 3.5.
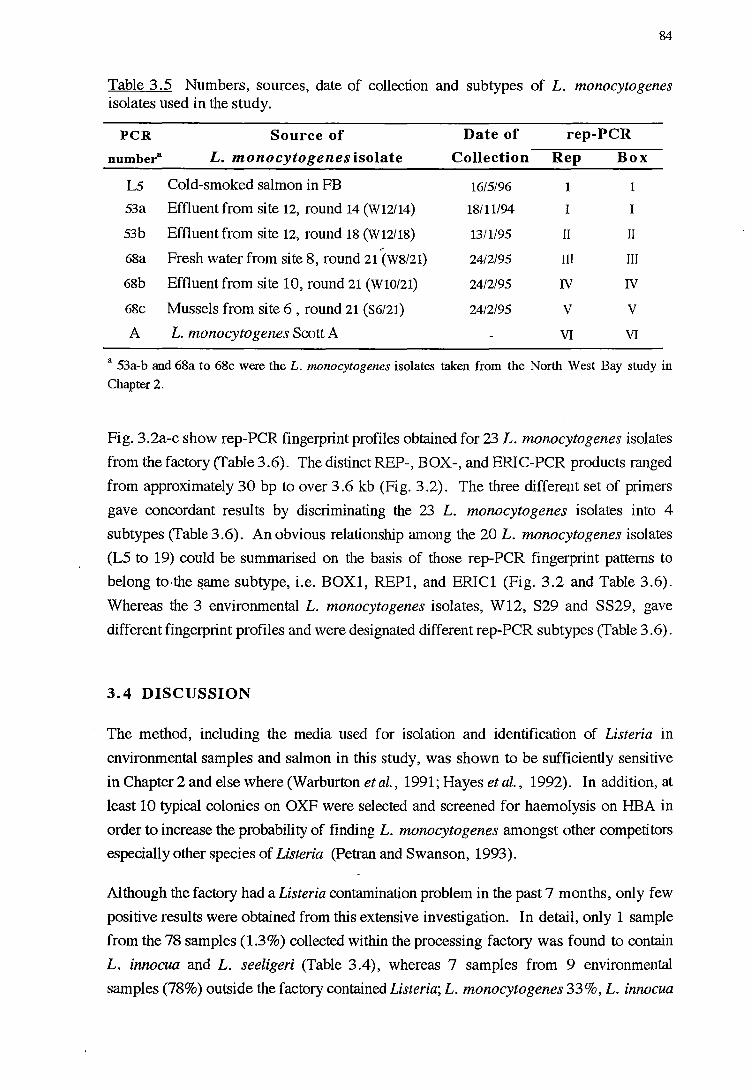
84
Table 3.5 Numbers, sources, date of collection and subtypes of L. monocytogenes isolates used in the study.
PCR Source of Date of rep-PCR
numbera L. monocytogenes isolate Collection Rep Box
LS Cold-smoked salmon in FB 16/5/96 1 1
53a Effluent from site 12, round 14 (W12/14) 18/11194 I I
53b Effluent from site 12, round 18 (Wl2/18) 13/1195 II II ,.,
68a Fresh water from site 8, round 21 (W8/21) 24/2/95 Ill III
68b Effluent from site 10, round 21 (Wl0/21) 24/2/95 IV IV
68c Mussels from site 6 , round 21 (S6/21) 24/2/95 v v A L. monocytogenes Scott A VI VI
a 53a-b and 68a to 68c were the L. monocytogenes isolates taken from the North West Bay study in
Chapter2.
Fig. 3.2a-c show rep-PCR fingerprint profiles obtained for 23 L. monocytogenes isolates
from the factory (Table 3.6). The distinct REP-, BOX-, and ERIC-PCR products ranged
from approximately 30 bp to over 3 .6 kb (Fig. 3 .2). The three different set of primers
gave concordant results by discriminating the 23 L. monocytogenes isolates into 4
subtypes (Table 3 .6). An obvious relationship among the 20 L. monocytogenes isolates
(LS to 19) could be summarised on the basis of those rep-PCR fingerprint patterns to
belong to.the ~ame subtype, i.e. BOXl, REPl, and ERICl (Fig. 3.2 and Table 3.6).
Whereas the 3 environmental L. monocytogenes isolates, W12, S29 and SS29, gave
different fingerprint profiles and were designated different rep-PCR subtypes (Table 3 .6).
3. 4 DISCUSSION
The method, including the media used for isolation and identification of Listeria in
environmental samples and salmon in this study, was shown to be sufficiently sensitive
in Chapter 2 and else where (Warburton et al., 1991; Hayes et al., 1992). In addition, at
least 10 typical colonies on OXF were selected and screened for haemolysis on HBA in
order to increase the probability of finding L. monocytogenes amongst other competitors
especially other species of Listeria (Petran and Swanson, 1993).
Although the factory had a Listeria contamination problem in the past 7 months, only few
positive results were obtained from this extensive investigation. In detail, only 1 sample
from the 78 samples (1.3%) collected within the processing factory was found to contain
L. innocua and L. seeligeri (Table 3.4), whereas 7 samples from 9 environmental
samples (78%) outside the factory contained Listeria; L. monocytogenes 33%, L. innocua
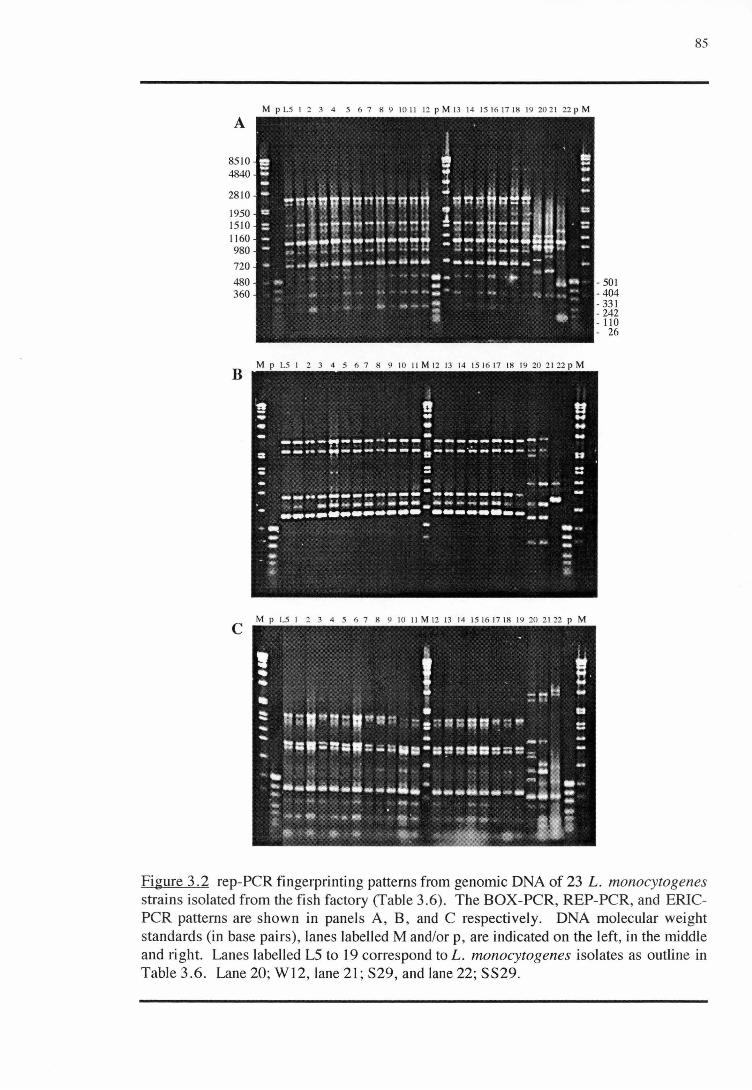
A
8510 4840
2810
1950 1510 1160 980 720 480 360
B
c
M p L5 1 2 3 4 5 6 7 8 9 1011 12 pM13 14 15161718 19 202 1 22p M
M p LS I 3 4 5 6 7 8 9 10 11M1 2 lJ 14 151617 18 19 20 2 1 22 pM
!! ... --= ;
... --• "" ..
tl .. •
. -__ .. -,, .. ~- -· --- ..................... -.. .,_,.
----"-------.---~---- =--.. .. --~~~~~~~--~-~------ -- ~ -... .. u ~ .... .... - - - - - ... - """" ... - 4i<-• .,,, .. -
------------ ----------
u .. .. ... --
• ·· ... --•• M p LS I 2 3 4 5 6 7 8 9 10 11 M 12 13 14 15 16 17 18 19 20 21 22 p M
85
- 501 -404 -331 - 242 - 110 - 26
Figure 3.2 rep-PCR fingerprinting patterns from genomic DNA of 23 L. monocytogenes strains isolated from the fish factory (fable 3.6). The BOX-PCR, REP-PCR, and ERICPCR patterns are shown in panels A, B, and C respectively. DNA molecular weight standards (in base pairs), lanes labelled Mand/or p, are indicated on the left, in the middle and right. Lanes labelled LS to I 9 correspond to L. monocytogenes isolates as outline in Table 3.6. Lane 20; Wl2, lane 21; S29, and lane 22; SS29.
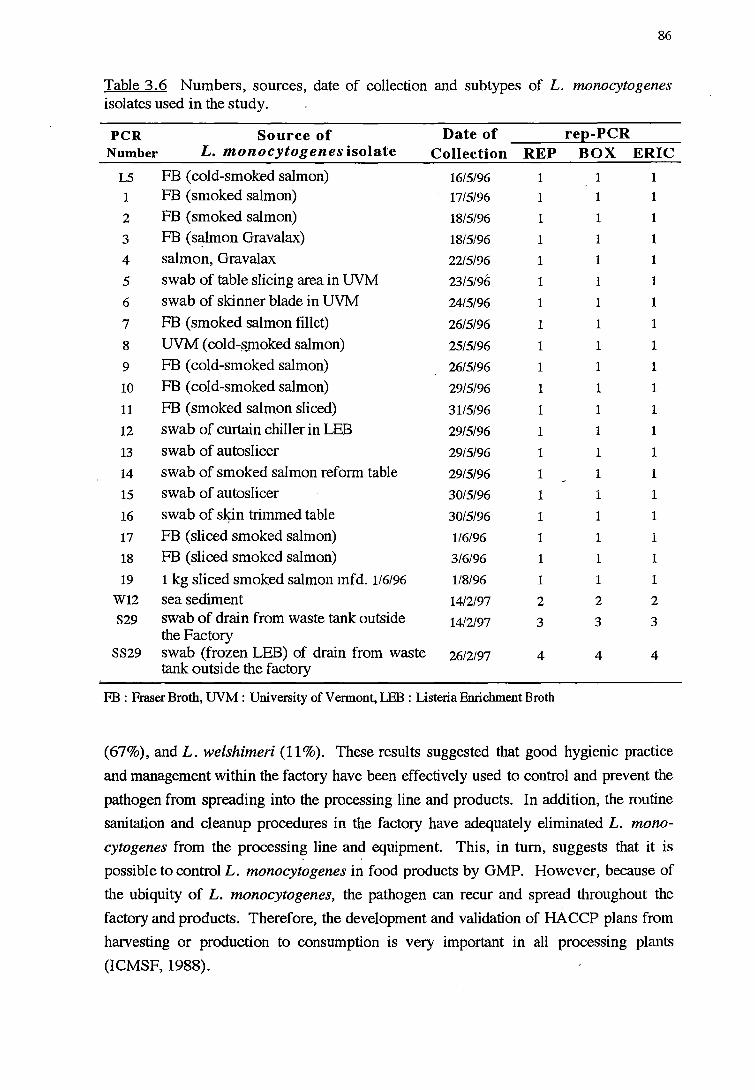
86
Table 3.6 Numbers, sources, date of collection and subtypes of L. monocytogenes isolates used in the study.
PCR Source of Date of re(!-PCR Number L. monocytogenes isolate Collection REP BOX ERIC
L5 FB (cold-smoked salmon) 16/5/96 1 1 1
1 FB (smoked salmon) 17/5/96 1 1 1
2 FB (smoked salmon) 18/5/96 1 1 1
3 FB (salmon Gravalax) 18/5/96 1 1 1
4 salmon, Gravalax 22/5/96 1 1 1
5 swab of table slicing area in UVM 23/5/96 1 1 1
6 swab of skinner blade in UVM 24/5/96 1 1 1
7 FB (smoked salmon fillet) 26/5/96 1 1 1
8 UVM ( cold-~;noked salmon) 25/5/96 1 1 1
9 FB (cold-smoked salmon) 26/5/96 1 1 1
10 FB (cold-smoked salmon) 29/5/96 1 1 1
11 FB (smoked salmon sliced) 3115196 1 1 1
12 swab of curtain chiller in LEB 2915196 1 1 1
13 swab of autoslicer 29/5/96 1 1 1
14 swab of smoked salmon reform table 2915196 1 1 1
15 swab of autoslicer 3015196 1 1 1
16 swab of sl9.n trimmed table 3015196 1 1 1
17 FB (sliced smoked salmon) 1/6/96 1 1 1
18 FB (sliced smoked salmon) 3/6/96 1 1 1
19 1 kg sliced smoked salmon mfd. 1/6/96 1/8/96 1 1 1
Wl2 sea sediment 14/2/97 2 2 2
S29 swab of drain from waste tank outside 14/2/97 3 3 3 the Factory
SS29 swab (frozen LEB) of drain from waste 26/2/97 4 4 4 tank outside the factory
FB: Fraser Broth, UVM: University ofVermont,LEB: Listeria Enrichment Broth
(67%), and L. welshimeri (11 %). These results suggested that good hygienic practice
and management within the factory have been effectively used to control and prevent the
pathogen from spreading into the processing line and products. In addition, the routine
sanitation and cleanup procedures in the factory have adequately eliminated L. mono
cytogenes from the processing line and equipment. This, in turn, suggests that it is
possible to control L. monocytogenes in food products by GMP. However, because of
the ubiquity of L. monocytogenes, the pathogen can recur and spread throughout the
factory and products. Therefore, the development and validation of HA.CCP plans from
harvesting or production to consumption is very important in all processing plants
(ICMSF, 1988).
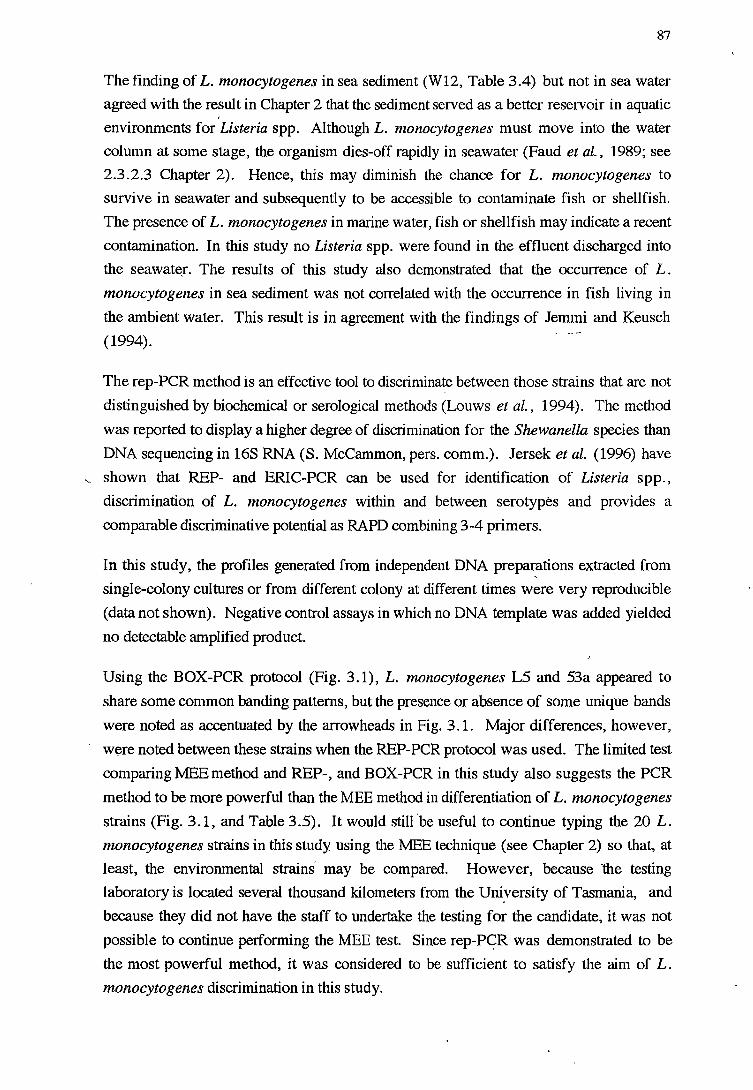
87
The finding of L. monocytogenes in sea sediment (W12, Table 3.4) but not in sea water
agreed with the result in Chapter 2 that the sediment served as a better reservoir in aquatic
environments for Listeria spp. Although L. monocytogenes must move into the water
column at some stage, the organism dies-off rapidly in seawater (Faud et al., 1989; see
2.3.2.3 Chapter 2). Hence, this may diminish the chance for L. monocytogenes to
survive in seawater and subsequently to be accessible to contaminate fish or shellfish.
The presence of L. monocytogenes in marine water, fish or shellfish may indicate a recent
contamination. In this study no Listeria spp. were found in the effluent discharged into
the seawat~r. The results of this study also demonstrated that the occurrence of L.
monocytogenes in sea sediment was not correlated with the occurrence in fish living in
the ambient water. This result is in agreement with the findings of Jemmi and Keusch
(1994).
The rep-PCR method is an effective tool to discrimina~e between those strains that are not
distinguished by biochemical or serological methods (Louws et al., 1994). The method
was reported to display a higher degree of discrimination for the Shewanella species than
DNA sequencing in 16S RNA (S. Mccammon, pers. comm.). Jersek et al. (1996) have
... shown that REP- and ERIC-PCR can be used for identification of Listeria spp.,
discrimination of L. monocytogenes within and between serotypes and provides a
comparable discriminative potential as RAPD combining 3-4 primers.
In this study, the profiles generated from independent DNA preparations extracted from
single-colony cultures or from different colony at different times were very reproducible
(data not shown). Negative control assays in which no DNA template was added yielded
no detectable amplified product.
Using the BOX-PCR protocol (Fig. 3.1), L. monocytogenes LS and 53a appeared to
share some common banding patterns, but the presence or absence of some unique bands
were noted as accentuated by the arrowheads in Fig. 3.1. Major differences, however,
were noted between these strains when the REP-PCR protocol was used. The limited test
comparing MEE method and REP-, and BOX-PCR in this study also suggests the PCR
method to be more powerful than the MEE method in differentiation of L. monocytogenes
strains (Fig. 3 .1, and Table 3 .5). It would still 'be useful to continue typing the 20 L.
monocytogenes strains in this study using the MEE technique (see Chapter 2) so that, at
least, the environmental strains- may be compared. However, because the testing
laboratory is located several thousand kilometers from the Uni_versity of Tasmania, and
because they did not have the staff to undertake the testing for the candidate, it was not
possible to continue performing the MEE test. Since rep-Pc;R was demonstrated to be
the most powerful method, it was considered to be sufficient to satisfy the aim of L.
monocytogenes discrimination in this study.
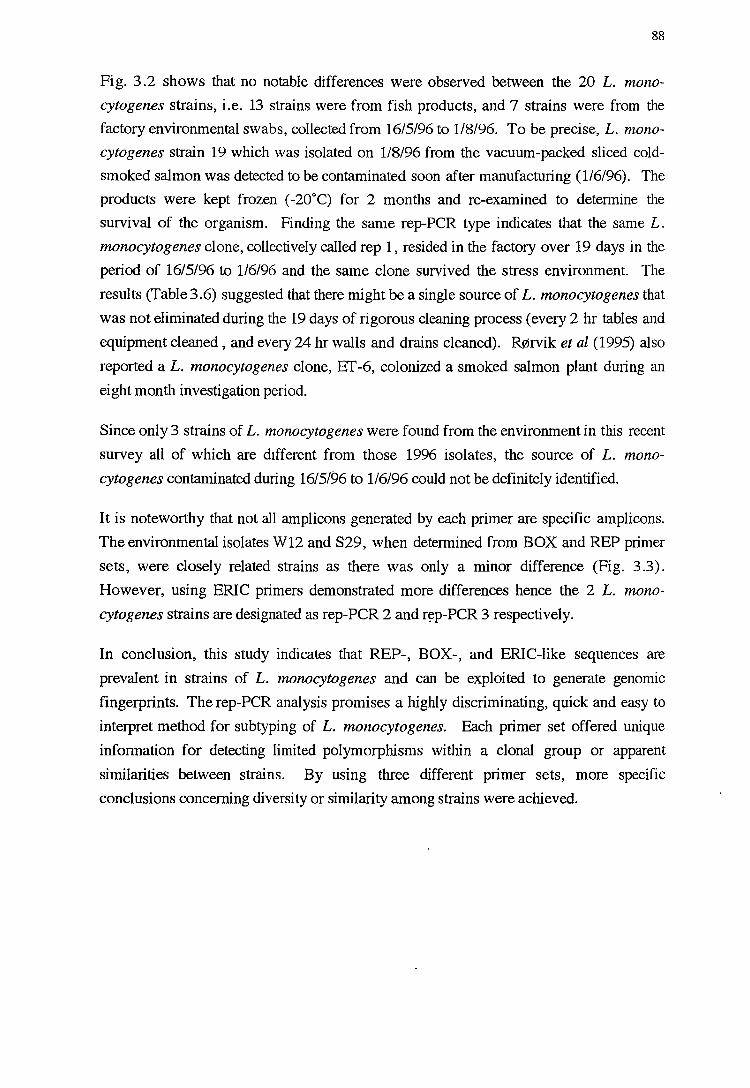
88
Fig. 3 .2 shows that no notable differences were observed between the 20 L. mono
cytogenes strains, i.e. 13 strains were from fish products, and 7 strains were from the
factory environmental swabs, collected from 16/5/96 to 1/8/96. To be precise, L. mono
cytogenes strain 19 which was isolated on 118/96 from the vacuum-packed sliced cold
smoked salmon was detected to be contaminated soon after manufacturing (1/6/96). The
products were kept frozen (-20°C) for 2 months and re-examined to determine the
survival of the organism. Finding the same rep-PCR type indicates that the same L.
monocytogenes clone, collectively called rep 1, resided in the factory over 19 days in the
period of 16/5/96 to 1/6/96 and the same clone survived the stress environment. The
results (Table3.6) suggested that there might be a single source of L. monocytogenes that
was not eliminated during the 19 days of rigorous cleaning process (every 2 hr tables and
equipment cleaned, and every 24 hr walls and drains cleaned). R0rvik et al (1995) also
reported a L. monocytogenes clone, ET-6, colonized a smoked salmon plant during an
eight month investigation period.
Since only 3 strains of L. monocytogenes were found from the environment in this recent
survey all of which are d1ff erent from those 1996 isolates, the source of L. mono
cytogenes contaminated during 16/5/96 to 116196 could not be definitely identified.
It is noteworthy that not all amplicons generated by each primer are specific amplicons.
The environmental isolates W12 and S29, when determined from BOX and REP primer
sets, were closely related strains as there was only a minor difference (Fig. 3.3).
However, using ERIC primers demonstrated more differences hence the 2 L. mono
cytogenes strains are designated as rep-PCR 2 and r~p-PCR 3 respectively.
In conclusion, this study indicates that REP-, BOX-, and ERIC-like sequences are
prevalent in strains of L. monocytogenes and can be exploited to generate genomic
fingerprints. The rep-PCR analysis promises a highly discriminating, quick and easy to
interpret method for subtyping of L. monocytogenes. Each primer set offered unique
information for detecting limited polymorphisms within a clonal group or apparent
similarities between strains. By using three different primer sets, more specific
conclusions concerning diversity or similarity among strains were achieved.
4 PREDICTIVE MICROBIOLOGY AND KINETIC
MODEL FOR LISTERIA MONOCYTOGENES
4.1 INTRODUCTION
89
In recent years, the seafood industry has become increasingly concerned with the
presence of L. monocytogenes in chilled cold-smoked salmon, a "ready-to-eat" food.
Since the traditional cold-smoking process contains no listericidal step and no CCPl to
control or eliminate any L. monocytogenes that may contaminate the p_roduct (Truelstrup
Hansen, 1995), there is currently no effective means to guarantee that cold-smoked
salmon remains free from L. rrionocytogenes. In addition, typical cold-smoked salmon
contains 3-6% salt (water activity~ 0.983-0.964), has a pH of about 6, and is stored and
distributed in vacuum packs at 5°C (Dalgaard, 1997). These conditions are suitable for
the growth of L. monocytogenes, so that if any contamination occurs, the organism may
proliferate and reach dangerous levels at the time of consumption (Huss et al. , 1995;
Dalgaard,' 1997). Considering that the minimum infective dose for human listeriosis is
still unknown, although some estimates have been suggested (Farber et al., 1996;
Buchanan et al., 1997) (see section 1.6.2), it is important to minimise both the incidence
and level of L. monocytogenes in food to improve the safety of the product. This
suggests a need to reevaluate and improve the traditional way of processing, that is, to
incorporate one or more hurdles which can inactivate L. monocytogenes in the process,
prevent its growth or eliminate it (Huss et al., 1995; Truelstrup Hansen, 1995).
The major factors controlling the fate of microbial populations in many foods are the
extrinsic factors such as temperature at which the foods are stored, and intrinsic factors
(or food environment) such as water activity and pH (Ray, 1996). L. monocytogenes is
reported to be able to grow at 1°C , with some strains growing at 0.5°C (Junttila et al.,
1988), and it can survive at -20°C for up to 2 years (Lehnert, 1960). The minimal water
activity for growth of L. monocytogenes is reported to be 0.91-0.93 for five different
strains at 15°C (Farber et al . .J 1992) and it can survive for up to a year in 16% NaCl (aw of
0.883) (Seeliger, 1961). The minimal pH for growth was found to be 4.3 at 30°C and
5.0 at 4°C (Farber et al., 1989b). The full preservation potential of an individual
constraint is restricted because of considerations related to the aesthetic, organoleptic and
nutritional properties of cold-smoked salmon. However, several constraints may be
combined to provide a desired level of stability. This concept was termed "hurdle
technology" by Leistner (1985, 1994).
90
Organic acid has been reported to provide more inactivation effect and growth inhibition
of L. monocytogenes than inorganic acids at a specified pH (Sorrells et al., 1989; Young
and Foegeding, 1993; Buchanan and Golden, 1994). Lactic acid is regarded as a GRAS
(Generally Regarded As Safe) additive for which the United States Food and Drug
Administration (US-FDA) has no limitation on the concentration used in food products.
Lactic acid is the most widely used organic acid in meat products because of its mild acid
taste (flavour enhancement), its preserving properties, its liquid form and its natural
occurrence in many foodstuffs (Houtsma, 1996). In fresh salmon muscle tissue, lactic
acid is present naturally at a level of ,...,Q.2 to' 0.6% depending on the amount of anaerobic
conversion of fish muscle glycogen to lactic acid (Cutting, 1953). Hence, lactic acid is
recognized as a potential hurdle to be combined with the other environmental factors to
inactivate L. monocytogenes. Application of a suitable level of lactic acid to the processed
fish may serve as a preliminary decontamination and a further preservative throughout the
shelf-life of the product.
To manipulate a product formulation in the past, it was necessary to perform storage trials
and microbial challenge tests to ensure the safety of the product. The outcomes,
however, cannot be extrapolated to any other situations or products and any change to the
formulation or conditions would require that new challenge tests be performed.
Predictive microbiology was introduced as a cost-effective alternative to achieve this
purpose (Dalgaard, 1997). The method involves the accumulation of knowledge on
microbial physiology and growth responses to a combination of environmental factors
(McMeekin et al., 1993). The results can be incorporated into at least two different types
of mathematical models; 1) a "kinetic model" which is useful for predicting the shelf-life
of foods (Ratkowsky et al., 1982), and 2) a "probability model" (so-called growth/ no
growth interface model) which is useful for predicting the conditions when micro
organisms, especially pathogens, might grow or might not grow (Ratkowsky and Ross,
1995). The model predictions need to be rigorously tested for applicability and validity in
foods within the range of values of data from which the model was developed (Ross,
1993).
The focus of this chapter is to examine the behaviour of L. monocytogenes Scott A, a
pathogenic strain, and LS, a wild type strain isolated from cold-smoked salmon, under
different conditions of temperature, water activity, pH, and lactic acid, solely or in
combination, in defined systems. The models describing growth rate responses of L.
monocytogenes to those factors are presented in this chapter. The probability models for
growth or no growth of L. monocytogenes as a response to those factors are presented in
subsequent chapter. The performance of both types of models are evaluated in Chapter 6.

91
4.1.1 PREDICTIVE MICROBIOLOGY
"Predictive microbiology", or "quantitative microbial ecology", was introduced as a
reasonably simple, inexpensive and rapid method for controlling microbiological food
safety and also for designing new product fommlations (McMeekin et al., 1993). The
concept has emerged as one of the most active fields of research in food microbiology
(see reviews by McMeekin etal., 1993; McClure etal., 1994; Ross and McMeekin, 1994;
McMeekin et al., 1997; Roberts, 1997; Whiting and Buchanan, 1997). Predictive
microbiology involves accumulating knowledge of the reproducible nature of micro
organism responses to environmental factors such as temperature, water activity and pH
which may then be summarized as mathematical equations or models, e.g. kinetic or
probability models (McMeekin et al., 1993).
A three-tier system of classification of models was introduced by Whiting and Buchanan
(1997), in which models are described as being primary, secondary and tertiary. Primary
models are those which describe the response of the micro-organism to a single set of
conditions over time and include growth and inactivation/survival models. Secondary
models describe the response of one or more parameters of a primary model to changes in
one or more of the environmental factors, while tertiary models involve the application of
secondary models to generate systems for providing predictions e.g., user-friendly
software and expert systems. A general approach for the development of predictive
models is summarised and presented in Table 4. 1.
Table 4.1 Summary of the general methodology for development of kinetic or probability models.
Stage of model preparation Kinetic model
Data generation Growth curves are generated in model systems; covers total range of environmental factors (temp., pH, NaCl, etc.)
Primary modelling Growth curves are fitted by sigmoidal growth models
Secondary modelling The effect of controlling factor(s)
Model validation
Tertiary modelling
on kinetic parameters is modelled (Table4.2) Predicted values of kinetic parameters are compared to values obtained in product and challenge tests Validated models are included in application software
(Adapted from Dalgaard, 1997)
Probability model
Growth or no growth are observed in model systems; covers total range of environmental factors The times (days) at which the growth occurred are recorded, no model generated The effect of controlling factors on probabilistic parameters is modelled (Table 4.2) The growth/no growth interface conditions are compared to observations on products
Validated models are included in application software
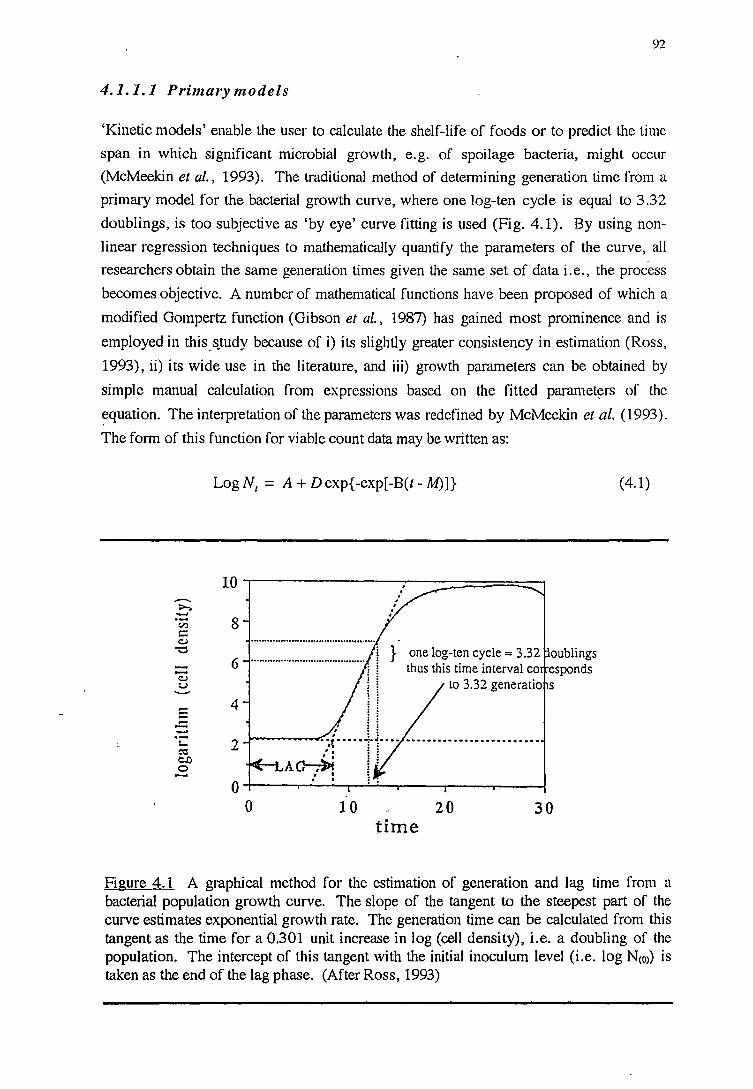
92
4.1.1.1 Primarymodels
'Kinetic models' enable the user to calculate the shelf-life of foods or to predict the time
span in which significant microbial growth, e.g. of spoilage bacteria, might occur
(McMeekin et al., 1993). The traditional method of determining generation time from a
primary model for the bacterial growth curve, where one log-ten cycle is equal to 3.32
doublings, is too subjective as 'by eye' curve fitting is used (Fig. 4.1). By using non
linear regression techniques to mathematically quantify the parameters of the curve, all
researchers obtain the same generation times given the same set of data i.e., the process
becomes objective. A number of mathematical functions have been proposed of which a
modified Gompertz function (Gibson et al., 1987) has gained most prominence and is
employed in this. s_tudy because of i) its slightly greater consistency in estimation (Ross,
1993), ii) its wide use in the literature, and iii) growth parameters can be obtained by
simple manual calculation from expressions based on the fitted paramet~rs of the
~quation. The interpretation of the parameters was redefined by McMeekin et al. (1993).
The form of this function for viable count data may be written as:
LogN1 =A+ Dexp{-exp[-B(t-M)]} (4.1)
10 ......... >-. -en 8 c: c:.J
"'O
6 c:.J u
E 4 -...... '- 2 ea e.o 0
················-························ , } one log-ten cycle== 3.32 oublings
-~~~.r.·/··---ll .... :"'_::~'.~-~~·~~~:~~ ~nds A~ i. . . . , . : .
o-r-~--,..--------.---'-~--.-~---.~~-T""~---1
0 10 20 30 time
Figure 4.1 A graphical method for the estimation of generation and lag time from a bacterial population growth curve. The slope of the tangent to the steepest part of the curve estimates exponential growth rate. The generation time can be calculated from this tangent as the time for a 0.301 unit increase in log (cell density), i.e. a doubling of the population. The intercept of this tangent with the initial inoculum level (i.e. log Ncoi) is taken as the end of the lag phase. (After Ross, 1993)
93
where Log= Log10, t = time
N, population density at time (t), e.g. CFU/g, or CFU/ml
A = value of lower asymptote or initial level of bacteria (log CFU/g)
D = difference in value of the lower and upper asymptote or number of log I ,
cycles of growth
M , = time at which rate of the exponential growth rate is maximal (h)
and B is related to the slope of the curve at M such that BD/e is the slope of the
steepest tangent, with e = exp(l).
From these parameters, various kinetic properties such as generation time and lag time
(Fig. 4.1), a period of adjustment by cells to a new environment, can be calculated.
However, several reports indicated shortcomings of the modified Gompertz function.
These include the systematic lack of fit of the function (Whiting and Cygnarowicz
Provost, 1992), the overestimation by Eqn. 4.1 of the steepest tangent to the growth
curve which leads to falsely fast generation time estimates, and biased estimates of lag 1 phase duration (Whiting and Cygnarowicz-Provost, 1992; Baranyi et al., 1993; Ross,
1993; Dalgaard et al., 1994). Therefore, a factor of 1.131 is recommended to be included
to compensate for the overestimation of the fastest rate inherent in the Gompertz function
(Whiting and Cygnarowicz-Provost, 1992; Baranyi et al., 1993; Ross, 1993; Dalgaard et
al., 1994). Thus, for log (CFU) data:
Generation time -elog2 x 1.131
BD
= 0.925 BD
Lag time = M - l~.3 {1-exp[l-exp(BM)]}
(4.2)
'(4.3)
The advantages of optical density mesurements (turbidimetric methods) are speed,
simplicity and non-invasiveness (McMeekin et al., 1993). Therefore~ the method is used
for growth rate modelling in this chapter. However, there are some limitations in their
use (McMeekin et al., 1993; Ross, 1993). The relationship between concentration and
absorbance/ turbidity is only linear over a limited range, corresponding approximately to a
tenfold increase in cell numbers. The lower sensitivity limit of detection by turbidity
measuring devices is usually such that they are unable to detect bacterial poopulations at
densities less than,..., 107 CFU/ml. Thus, under conditions permitting consistent growth to
,..., 109 CFU/ml in stationary phase, the onset of the stationary phase is not easily
measurable, and experiments to determine lag times must be specifically prepared as they
94
can only be measured on dense populations. Falsely low estimates of cell densities in
dense cultures result from a deviation from the response predicted by Beer's Law (i.e.
that absorbance is proportional to concentration)'. In order to obtain accurate estimates of
cell density, samples must have, or must be diluted so that they have absorbance <0.3
(Koch, 1981), or that the meatured absorbance be 'corrected' by reference to some
CO!fection function relating the observed to the true absorbance (Ross, 1993).
For optical density (~%T) observations, the following function was proposed (Ross,
1993) by analogy with Eqn. 4.1:
~%Tcr) = A+ Dexp{-exp[-B(t-M)]} (4.4)
where ~%T(t) = the change in %T after time t
A lower limit of detection of the spectrophotometer or % transmittance of
the initial microbial load
B = maximum rate of change of % transmittance
M time at which rate of change of % transmittance is maximal
D difference between the lower and upper limits of sensitivity of the
spectrophotometer
Thus, the minimum generation time of the %T growth curve can be ~culated from the
fitted parameters of Eqn. 4.4, with a correction factor of ·l.08 (see details in Ross, 1993):
Generation Time
=
1.08 x 20.5 x e .BD
60.2 BD
(4.5)
The generation time obtained from the above expression can be converted to the
reciprocal, referred to as growth rate (k).
In order to obtain a good fit to the data and reliable parameter estimates with this function,
the quality and quantity of the data is extremely important. That is, the points should be
spread evenly throughout the-growth curve and at least 10 to 15 measurements need to ·be
taken (McMeekin et al., 1993). In addition, reliable estimates of generation time by
nonlinear regression are indicated when values for B and D are obtained within 10
iterations (McMeekin et al., 1993).
95.
Considering that viable count (VC) methods remain the standard method of enumeration
in food microbiology, the relationship between growth rate estimates from VC and
turbidimetric (%T) methods has been investigated. Ross (1993) indicated that the
estimates of generation time obtained from VC data are smaller than those from the %T
method, and the relationship is constant. Possible explanations for the difference between
GT vc and GT %T could be that 1) non-viable cells may also contribute to the increase in
turbidity of the %T measurement, thereby displaying slower generation times than
actually occur, and 2) limitation of the spectrophotometer, which can read reliably only
within the range -107 CPU/ml to -5x10⁸ CPU/ml (Ross, 1993) where the culture is
already close to the maximum population density and growth rates may already be
declining. Thus, based on analysing numerous growth curves of several micro-organism
using both methods, the-average ratio of maximum specific growth rates (µ=_.r.) obtained
from VC data and %T,was 1.57±0.33 (SD) (Dalgaard et al., 1994). Consequently, a
simple calibration factor of 1.5 may be incorporated as:
Generation Time01C) = Generation Time<%Tl /1.5 (4.6)
4.1.1.2 Secondarymodels
The response variable obtained from the primary kinetic model is expressed in time-based
units (i.e. a rate, or the time taken for a particular response). To generate a secondary
model, there are currently several forms of mathematical model proposed by different
research groups of which four main model types are recognised and summarised in Table
4.2. Temperature is regarded as the primary factor regulating the growth of micro
organisms (Curry et al., 1978) with other environmental factors acting independently and
additively. Most of the proposed kinetic models have their origins in relationships
between temperature and growth rate, with additional factors such as water activity, pH
and antimicrobial additives being included subsequently into some of the models (Ross
and McMeekin, 1991). For example, consider the square-root type models which are
employed extensively in this chapter. Firstly, the effect of temperature was modelled
(Ratkowsky et al., 1982), followed by the incorporation of a water activity term
(McMeekin et al., 1987). More recently, pH and organic acid terms were included in the
model (Presser et al., 1997a). The model can be written as:
Jrate = b * (f-Tmin) * (1-exp(c(T-Tmax))) * J(aw-a.vmin) *
( pHmin
10 * 1 - pH 10
' I [LAC] ) 1 - pKa-pH + e
[Dmin] *(1+10 ) (4.7) 1 - pH-pKa
[Umin] * (1+ 10 )
[LAC]
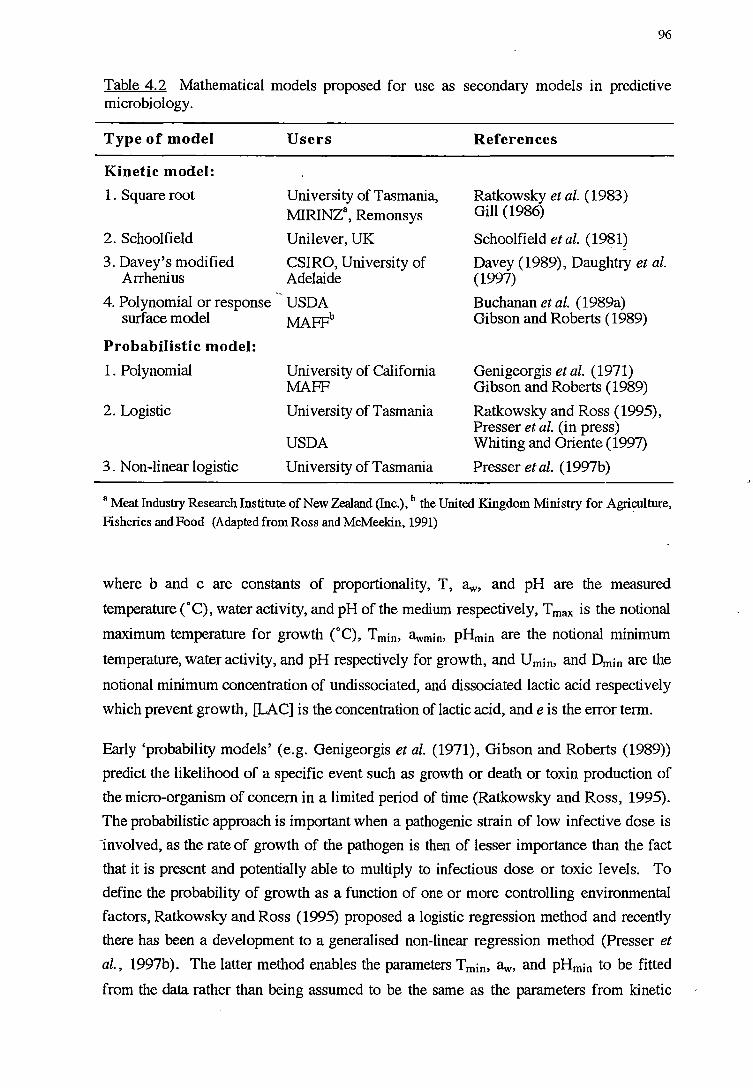
96
Table 4.2 Mathematical models proposed for use as secondary models in predictive microbiology.
Type of model
Kinetic model:
1. Square root
2. Schoolfield
3. Davey's modified Arrhenius
Users
University of Tasmania, MIRINZa, Remonsys
Unilever, UK
CSIRO, University of Adelaide
4. Polynomial or response USDA surface model MAFFb
Probabilistic model:
1. Polynomial
2. Logistic
3. Non-linear logistic
University of California MAFF
University of Tasmania
USDA
University of Tasmania
References
Ratkowsky et al. (1983) Gill (1986)
Schoolfield etal. (1981)
Davey (1989), Daughtry et al. (1997)
Buchanan et al. (1989a) Gibson and Roberts (1989)
Genigeorgis et al. ( 1971) Gibson and Roberts (1989)
Ratkowsky and Ross (1995), Presser et al. (in press) Whiting and Oriente (1997)
Presser etal. (1997b)
a Meat Industry Research Institute of New Zealand (Inc.), b the United Kingdom Ministry for Agri~lture, Fisheries and Food (Adapted from Ross and McMeekin, 1991)
where b and c are constants of proportionality, T, aw, and pH are the measured
temperature (°C), water activity, and pH of the medium respectively, T max is the notional
maximum temperature for growth (°C), Tmin, <lwmin, pHmin are the notional minimum
temperature, water activity, and pH respectively for growth, and Umin, and Dmin are the
notional minimum concentration of undissociated, and dissociated lactic acid respectively
which prevent growth, [LAC] is the concentration of lactic acid, and e is the error term.
Early 'probability models' (e.g. Genigeorgis et al. (1971), Gibson and Roberts (1989))
predict the likelihood of a specific event such as growth or death or toxin production of
the micro-organism of concern in a limited period of time (Ratkowsky and Ross, 1995).
The probabilistic approach is important when a pathogenic strain of low infective dose is
-involved, as the rate of growth of the pathogen is then of lesser importance than the fact
that it is present and potentially able to multiply to infectious dose or toxic levels. To
define the probability of growth as a function of one or more controlling environmental
factors, Ratkowsky and Ross (1995) proposed a logistic regression method and recently
there has been a development to a generalised non-linear regression method (Presser et
al., 1997b). The latter method enables the parameters T min, aw, and pHmin to be fitted
from the data rather than being assumed to be the same as the parameters from kinetic
97
modelling studies. The form of the expression of the growth limiting factors is suggested
by the kinetic model, while the response at a given combination of factors is either
presence or absence (i.e. growth/no growth) or probabilistic (employing the fraction of
positive responses in n trials). The form of the probability model is a logarithmic
transformation of a kinetic model. Eqn. 4.8 presents a probability model when lactic acid
is an additional controlling factor (Presser, 1995) which can be written as:
. pHmin-pH logit (P) = b
0 + b
1 ln(T-Tmin) + b
2 ln(aw-awmin) + b
3 In(l-10 )
+ b 4 In( 1-( [LA~H-pKa ) ) + b 5ln(1-( [LAC:Ka-pH ) ) ( 4. 8) Umin(l+lO ) Dmin(l+lO )
where: logit (P) =In (P/(1-P)), P is the probability of growth (which has values from 0 to
1), b0, bl> b2, b3 , b4 , and b5 are coefficients to be estimated, and the other terms are as
previously defined in Eqn. 4.7.
Eqn. 4.8 is the basic form of the probability model. An extended form of the model, by
incorporating quadratic term(s), e.g. ln(T-Tmin)2, and/or cross-product(s), e.g. ln(T
Tmin) * ln(aw-awmiJ, may be considered to improve the goodness-of-fit of the model.
This type of model enables the incorporation of kinetic data that were developed for other
modelling purposes to generate a growth/no growth interface model (Ratkowsky and
Ross, 1995). From the fitted model, the interface or boundary between growth and no
growth, at some chosen level of probability ( e:g. P=0.5 which is 50% probability of
growth or no growth), can be determined.
The kinetic and early probability models may·be considered as the two extremes of a
modelling approach where the distinction between the two models is an artificial one. In
the probability study, growth is observed earlier when the micro-organism is in a less
constrained condition because the organism is able to grow more quickly. Consequently,
a high probability of growth is predicted, when a high growth rate (short generation time)
is observed at the same condition in the kinetic study. The inclusion of information about
the variability of rates of growth in the probability models is also recognised by Baker et
al. (1990). However, in a more recent development of probability models (Presser et al.,
1997b; in press), the observation period was extended to a sufficient time to ensure that
either growth was observed or was not possible. Similarly, probability measurements in
the present study (Chapter 5) do not depend on the time for a response to be detectable or
~n the rate of growth of the organism, i.e. they are absolute estimates of the potential for
growth.
98
·• 4.1.1.3 Mode/validation
Following development of a model, either kinetic or probability, usually with data from
micro-organisms grown in laboratory media, scepticism may remain whether the model
can reliably predict real situations in foods. Therefore, before a model is accepted for
inclusion in adatabase (tertiary model) it must be evaluated or 'validated'. The validation
can be performed in the laboratory to determine the behaviour of the inoculated micro
organism or the natural biota in actual products. The ultimate test of a model is validation
of predictions under normal handling with fluctuating environmental conditions, such as
during processing, distribution, and storage of product (McMeekin and Ross, 1996). A
different approach to validation is taken for data extracted from the literature, allowing a
wider validation exercise to be carried out (McClure et al., 1994).
Indices of goodness-of-fit of a model, the "bias" and "accuracy" factors, were introduced
by Ross (1996). The bias factor provides an indication of the ave;rage deviation of the
model from the data, taking account of the signs of the differences, and is described by
Eqn. 4.9. A bias factor of 1.0 indicates lack of systematic error and factors of greater and
less than 1.0 indicate over- and under-prediction respectively. The accuracy factor
provides a measure of absolute difference between the observed and predicted values and
is described by Eqn. 4.10. The larger the accuracy factor, the less precise is the average
estimate.
(L log(GT /GT . ))In BIAS factor = 10 observed predicted (4.9)
ACCURACY factor = 10 (L I Iog(GT observeiGT predicted) I )/n (4.10)
where GT observed is the observed generation time (h), GT predicted is the predicted genera
tion time (h), and n is the number of observations used in the calculation.
4.1.1.4 Tertiary models
Once a fully validated model has been developed, it can be included in user-friendly
application software, allowing the information summarised from large amounts of data to
become easily accessible and the models to be conveniently applied by many different
users (Dalgaard, 1997). Several application software programmes have been developed
(see reviews by McMeekin and Ross, 1996; Dalgaard, 1997) e.g., 'Pathogen Modelling
Program' developed by the Microbial Food Safety Research Unit of the USDA, USA
(Buchanan, 1993) and 'Food Micromodel' developed by MAFF (McClure et al., 1994),
99
which contain models for several pathogenic micro-organisms and allow growth and
thermal death to be predicted for constant environmental conditions input by the user.
Integration of a temperature function (e.g. secondary model) with the time/temperature
history by devices such as chemical and physical indicators, electronic temperature
integrators or loggers enables the model to analyse the effect of those environmental
conditions on the behaviour over time of the organism in question (McMeekin and Ross,
1996). 'Pseudomonas Predictor' developed at the University of Tasmania (Neumeyer et
al., 1997a,b) is an example of application software that has the facility to read and
interpret temperature profiles collected by temperature loggers in terms of the potential for
growth of psychrotrophic Pseudomonads.
4.1.1. 5 Application of predictive modelling
Quantitative information regarding microbial behaviour, obtained using the predictive
microbiology approach, may be used in various applications (see review by McMeekin
and Ross, 1996) including:
• Development of rational quantitative criteria for HACCP (Hazard Analysis Critical
Control Point) or other quality assurance procedures,
• Determination of product shelf-life, i.e. the time taken for spoilage micro-organism or
pathogens to reach unacceptable levels,
• Formulation and reformulation of products e.g. for determination of optimal
combinations of controlling factors that inhibit growth of pathogens or spoilage
organisms or eliminate them,
• Technology transfer can be achieved by model simulations where the user may
conveniently answer "what-if' questions and which can be presented as an educational
tool for food handlers, food scientists or microbiologists.
4.1.1. 6 Existing predictive models
Predictive models for the growth of L. monocytogenes have been published by several
researchers. Those include cubic and quadratic response surface models (Hudson, 1994;
Buchanan and Golden, 1995; Buchanan et al., 1997), and square-root type models
(Ross, 1993). A probability type model for the survival and growth of L. mono
cytogenes using a polynomial model was also generated (Cole et al., 1990). In this
model, however, the time to visible turbidity was presented rather than the probability of
100
growth. These models and their published observations provide useful information to
evaluate.the models generated in this chapter.
4.1. 2 LACTIC ACID
Lactic acid is a short chain organic acid (C~CHOHCOOH, MW = 90.08) which is
produced naturally by controlled fermentation by homofermentative lactic acid bacteria
using refined sucrose or other carbohydrate sources or synthetically by hydrolysis of
lactonitrile (Shelef, 1994). Lactic acid exists in 2 forms; the D(-) form, and L( +) form.
The natural L(+) lactic acid is one of the most widely employed preservative in foods,
especially meat products, as discussed in section 4.1. Growth of both Gram-positive and
Gram-negative.,bacteria were reported to be inhibited by lactic acid (Brown and Booth,
1991; Ray, 1996). However, yeasts and moulds were found to be less sensitive than
bacteria (Lueck, 1980; Houstma, 1996).
As a weak organic acid, in aqueous solutions, lactic acid is partially dissociated to ionised
forms. The equilibrium of the dissociation of a weak acid is dependent on pH as
described by the Henderson-Hasselbalch equation:
(4.11)
The dissociation constant of lactic acid is l.38x 104 at 22°C (pKa = 3.86) (Ray, 1996).
4.1.2.1 Mechanism of action
Bacteriostasis or bacteriocide can, in principle, be the results of inactivation of, or
interference with, one or more of the functional subcellular target groups such as cell
components, metabolic enzymes, protein synthesis system, genetic material etc. (Gould,
1989). Normal function of a microbial cell depends on a certain stability of the internal
chemical environment. Microbes have developed systems to maintain fluctuations in their
cytoplasmic pH, the so-called pH homeosta~c process (Booth, 1985). The systems are
active mechanisms ranging from use of cell energy provided by ATP and the proton
motive force (PMF) to control the permeability of the cell membrane to protons
(Montville, 1997). ATP and the PMF are fundamental to cellular energetics and are
interconvertible by a membrane-bound BF0FcATPase that can use ATP to generate a
proton gradient and vice versa (Montville, 1997). A study of the effect of sodium lactate
on acid adaptation of Listeria indicated that the proton translocating A TPase played a
major role in regulating its intracellular pH (Houstma, 1996).
101
Lactic acid, as a lipophilic organic acid, has the ability to penetrate the bacterial cell
membrane in its undissociated form (Freese et al., 1973; Gould, 1989). On entering the
cell, where the pH is higher, the acid dissociates in the cytoplasm, releases protons, and
reduces intracellular pH (pHi). The homeostatic mechanisms of cells overcome this by
extruding protons through the proton pump. However, dissociation of the acid within the
cell will continue until it reaches equilibrium of dissociated and undissociated acid which
is determined by pKa of the acid and the pHi (Gould, 1989). These processes can cause
depletion in energy and even~ally a decrease in pf-\ (Ray, 1996).
Low cytoplasmic pH can adversely affect the ionic bonds of the macromolecules in cells
and disrupt their three-dimensional structures and some functions (Ray, 1996). These
changes can also interfere with nutrient transport and energy generation and consequently
reduce the growth yield, extend the lag phase, and decrease the growth rate (Freese et al. ,
1973; Corlett and Brown, 1980; de Wit and Rombouts, 1990). In addition, low pH can
reversibly and irreversibly damage cellular macromolecules such as membrane-bound
enzymes that subsequently can inflict sublethal-injury as well as lethal injury to cells
(Ray, 1996).
A study on the change of intracellular pH of L. monocytogenes has demonstrated that the
inhibitory effect of various types of weak acids were different even at the same level of
pHi (Young and Foegeding, 1993). Thus, the growth inhibition by acids is not caused by
a decrease in pH;, per se, but also involves specific acids effects which may influence
metabolic or other physiological activity (lta and Hutkins, 1991; Young and Foegeding,
1993). On the basis of equimolar total acid, the relative inhibition effect was generally
acetic>lactic>citric (Young and Foegeding, 199'.?).
The above mechanism of weak acid action is supported by several observations in that,
lowering the external pH, the proportion of undissociated acid increased, reducing the
internal pH; and enhancing the antimicrobial effectiveness of the acids (Gould, 1989; Ita
and Hutkins, 1991; Young and Foegeding, 1993). The effectiveness of the weak acid
preservatives against L. monocytogenes is also predictably influenced by pH (Petran and
Zottola, 1989). Therefore, it has been generally considered that the antimicrobial activity
is directly related to the concentration of undissociated acid (Baird-Parker, 1980).
However, dissociated acid was also reported to be involved· iff the antimicrobial activity
although less effectively (Eklund, 1983). Very high concentration of lactate anion was
suggested to influence metabolic pathways of Listeria, particularly when lactate is an
intermediate or end-product of metabolism (Houstma, 1996).
The ability of organic acids to induce cell acidification is reported to be greater than
inorganic acids which rely only on lowering the external pH (Gould, 1989). The
·,
102
mechanisms of organic acid inhibition determine their higher antimicrobial effect than
inorganic acids. Strong inorganic acids may only exert their influence by the denaturing
effect of low pH on enzymes present on the cell surface and on lowering of the
cytoplasmic pH due to increased proton permeability when the pH gradient is very large
(Corlett and Brown, 1980).
4. 2 MATERIALS AND METHODS
4.2. l MATERIALS
Details of consumables, reagents and media, and equipment used are presented m
Appendix A.
4. 2. 2 GENERAL METHODS
4. 2. 2.1 Culture preparation
Two strains of L. monocytogenes, Scott A and LS, a wild type isolated from cold
smoked salmon, were used over a series of experiments. Stock cultures were maintained
at -80°C (Appendix A, A.2.5). To prepare for an experiment, one carrier bead was
removed from the -80°C-stored culture, rubbed over the surface of an OXF plate and
incubated at 30°C overnight. A single colony of that culture was then transferred to 50 ml
TSB-YE in a 250 ml side-arm flask. This was incubated for 18 hr at 30°C with shaking
(50±2 rpm). Fifty µl of that culture was transferred to fresh TSB-YE and the incubation
repeated. The broth culture was held at l0°C for 1 hr before commencement of the
experiment in order to minimise changes in cell density during the inoculation procedure.
4. 2. 2. 2 Inoculation procedures
The amount of inoculum has been reported to have no effect on growth rate (Buchanan
and Phillips, 1990), but it may affect the lag phase (Gay et al., 1996). Although lag
phase was not studied in these experiments, to maintain reproducibility within the
experiment the volume of inoculum was kept constant. The inoculation was prepared by
pipetting 0.35-0.40 ml of prepared culture (section 4.2.2.1) into an L-tube (see Appendix
A, A.1.6) containing 15 ml TSB-YE. This reduces the %T of media to between 80 and
90%T at 540 nm. The 100%T was set with a sterile TSB-YE blank and periodically
checked against the same blank as the experiment progressed. Each inoculated tube was
placed in the shaking incubator for ea. 15 sec to mix thoroughly, and then 0.3 ml of the
103
broth was aseptically dispensed to a well-plate, and the initial pH (pH1) determined using
a surface probe pH-meter.
4.2.2.3 Assessment of growth
Cultures were incubated in L-tubes containing 15 ml of TSB-YE on a shaking (33±1 rpm)
incubator, i.e. temperature gradient incubator operated normally or isothermally, in a
20°C constant-temperature room. Growth was assessed by measuring the turbidity as
%Tat 540 nm. Measurement times were chosen to correspond to %T changes of 5-
10%T between consecutive readings. This was continued until the %T fell below 5%, or
until the rate of change of the %T was zero. The change in pH over time including the
final pH was also recorded at every ea. 10%T change using a surface probe pH-meter as
previously described for measuring pH1 (see section 4.2.2.2).
In each experiment, monitoring was ~ntinued for up to 3 weeks to verify that growth did
not occur, enabling the growth rate data to be used and included in the growth/no growth
data set (section 4.2.4). At the conclusion of each experiment the final %T was recorded.
The %T values were transformed to final optical density (OD) (see Appendix A, A.2.12)
to enhance the magnitude when plotted on graph. This enabled the 'cell yield' response to
be observed.
Note that 'cell yield' refers to the increase in biomass proportional to a known amount of
energy substrate provided (Russell and Cook, 1995). The actual 'cell yield' study is
normally prepared µsing a substra~-limited culture to manipulate the maximum growth to
be within the linear range of turbidity measuring device (Krist, 1997). In this study, only
"apparent" cell yield was recorded as a final change in OD in an enriched nutrient
medium. In some cases, the "apparent" cell yield was "corrected" by a correction
function (see Appendix A, A.2.3) to compensate for the non-linearity of the OD
concentration relationship (Koch, 1981) and to provide assurance that the observed
"apparent" cell yield is reliable.
At the completion of incubations, the temperature of each tube was measured 5 times over
_a number of hours with an el~tronic thermometer. The average of the 5 temperatures
was taken as the incubation temperature for calculations and further analysis.
4. 2. 2. 4 Calculation of generation times/ or kinetic modelling
Percent transmittance readings from kinetic modelling studies were converted to change of
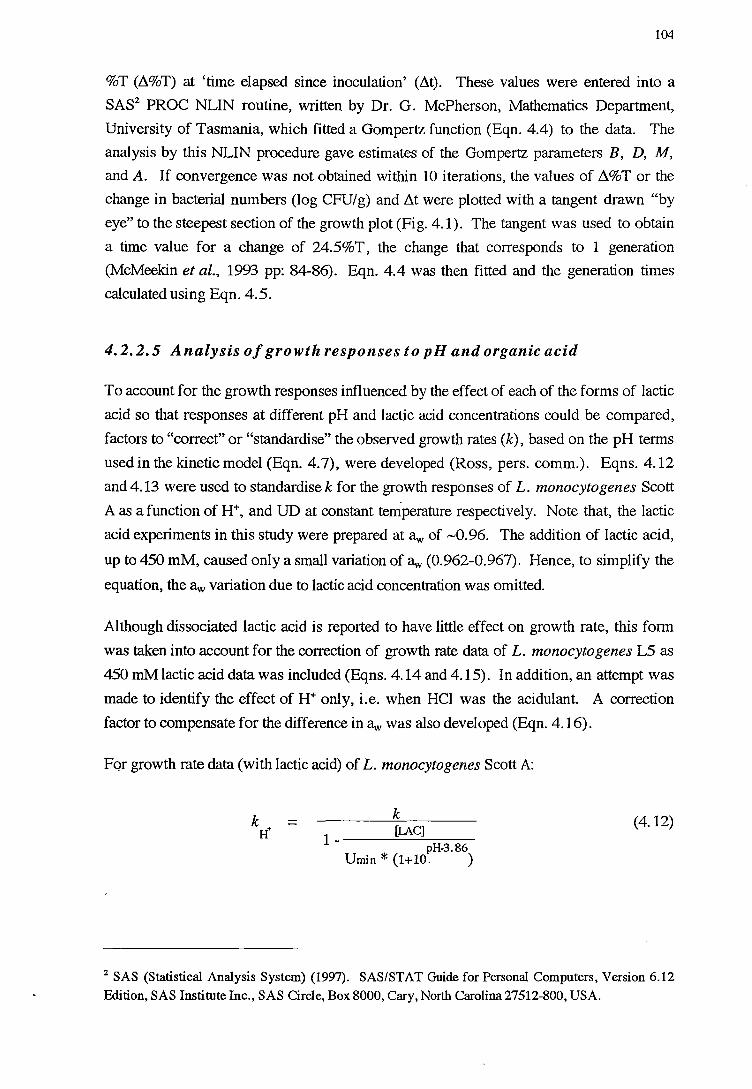
104
%T (~%T) at 'time elapsed since inoculation' (~t). These values were entered into a
SAS2 PROC NUN routine, written by Dr. G. McPherson, Mathematics Department,
University of Tasmania, which fitted a Gompertz function (Eqn. 4.4) to the data. The
analysis by this NUN procedure gave estimates of the Gompertz parameters B, D, M,
and A. If convergence was not obtained within 10 iterations, the values of ~%Tor the
change in bacterial numbers (log CFU/g) and b.t were plotted with a tangent drawn "by
eye" to the steepest section of the growth plot (Fig. 4.1). The tangent was used to obtain
a time value for a change of 24.5%T, the change that corresponds to 1 generation
(McMeek:in et al., 1993 pp: 84-86). Eqn. 4.4 was then fitted and the generation times
calculated using Eqn. 4.5.
4. 2. 2. 5 Analysis of growth responses to pH and organic acid
To account for the growth responses influenced by the effect of each of the forms of lactic
acid so that responses at different pH and lactic acid concentrations could be compared,
factors to "correct" or "standardise" the observed growth rates (k), based on the pH terms
used in the kinetic model (Eqn. 4.7), were developed (Ross, pers. comm.). Eqns. 4.12
and 4.13 were used to standardise k for the growth responses of L. monocytogenes Scott
A as a function of H+, and UD at constant temperature respectively. Note that, the lactic
acid experiments in this study were prepared at aw of ,...,Q.96. The addition of lactic acid,
up to 450 mM, caused only a small variation of~ (0.962-0.967). Hence, to simplify the
equation, the aw variation due to lactic acid concentration was omitted.
Although dissociated lactic acid is reported to have little effect on growth rate, this form
was taken into account for the correction of growth rate data of L. monocyto genes LS as
450 mM lactic acid data was included (Eqns. 4.14 and 4.15). In addition, an attempt was
made to identify the effect of H+ only, i.e. when HCl was the acidulant. A correction
factor to compensate for the difference in aw was also developed (Eqn. 4.16).
Fqr growth rate data (with lactic acid) of L. monocytogenes Scott A:
k (4.12) 1 - (lAC]
pH-3.86 Umin* (1+10. )
2 SAS (Statistical Analysis System) (1997). SAS/STAT Guide for Personal Computers, Version 6.12
Edition, SAS Institute Inc., SAS Circle, Box 8000, Cary, North Carolina 27512-800, USA.
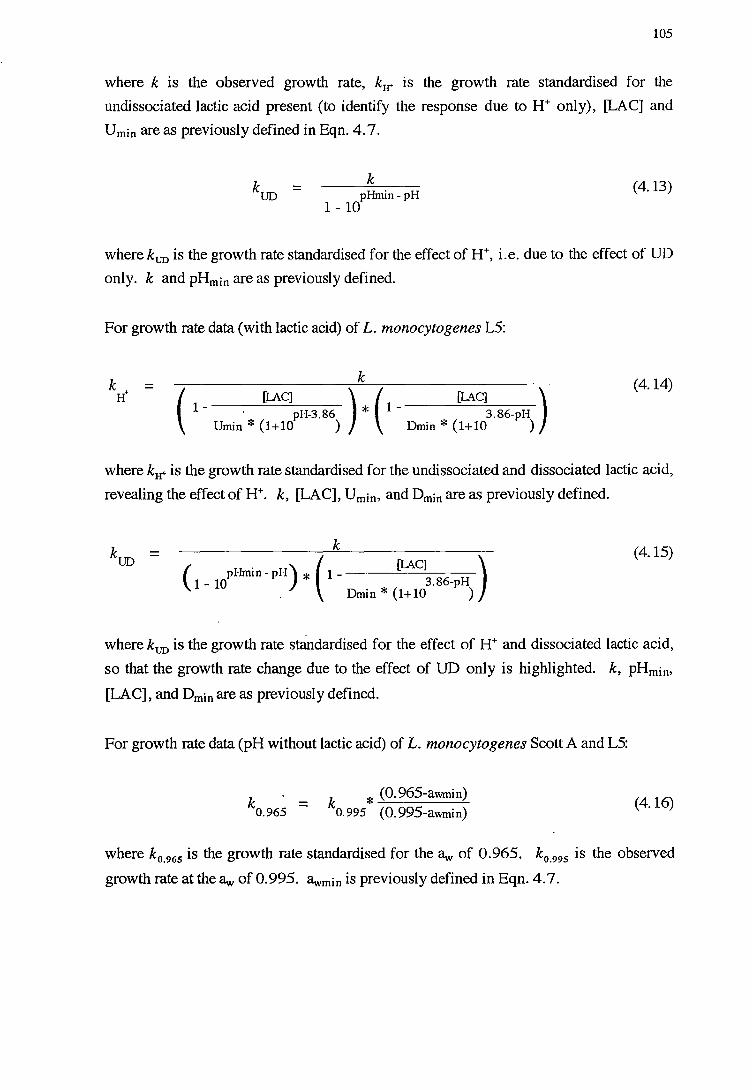
105
where k is the observed growth rate, k'H'" is the growth rate standardised for the
undissociated lactic acid present (to identify the response due to H+ only), [LAC] and
Umin are as previously defined in Eqn. 4. 7.
kUD = k pHmin-pH
1- 10 (4.13)
where kuo is the growth rate standardised for the effect of H+, i.e. due to the effect of UD
only. k and pHmin are as previously defined.
For growth rate data (with lactic acid) of L. monocytogenes LS:
k + = H
k
( [LA.C] ) ( [LA.C] )
l - · pH-3.86 * l - 3.86-pH Umin * (1+10 ) Dmin * (1+10 )
(4.14)
where kw is the growth rate standardised for the undissociated and dissociated lactic acid,
revealing the effect of H+. k, [LAC], Umin' and Dmin are as previously defined.
k (4.15)
( pHmin-pH) * (1- [LAC] ) 1 - 10 3.86-pH . Dmin * (1+10 )
where kuo is the growth rate standardised for the effect of H+ and dissociated lactic acid,
so that the growth rate change due to the effect of UD only is highlighted. k, pHmin,
[LAC], and Dmin are as previously defined.
For growth rate data (pH without lactic acid) of L. monocytogenes Scott A and LS:
k * (0.965-awmin) 0. 995 (0. 995-awmin)
(4.16)
where k0 _965 is the growth rate standardised for the 1lw of 0.965. k0 _995 is the observed
growth rate at the 1lw of 0.995. llwmin is previously defined in Eqn. 4.7.
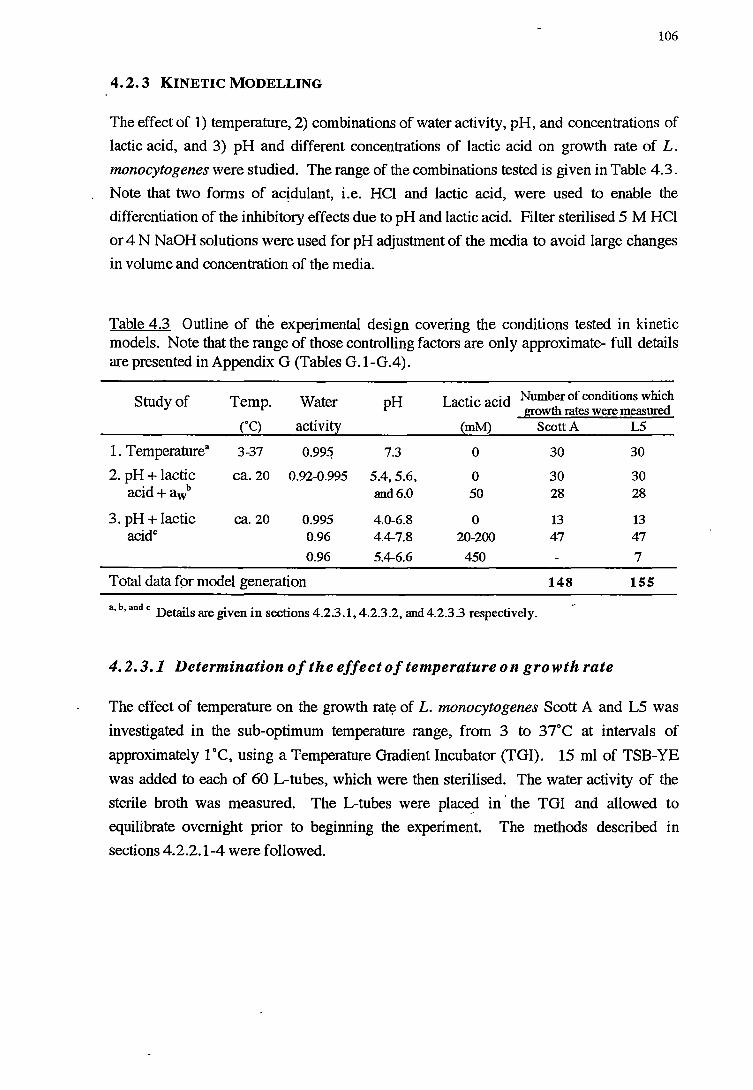
106
4. 2. 3 KINETIC MODELLING
The effect of 1) temperature, 2) combinations of water activity, pH, and concentrations of
lactic acid, and 3) pH and different concentrations of lactic acid on growth rate of L.
monocytogenes were studied. The range of the combinations tested is given in Table 4.3.
Note that two forms of ac~dulant, i.e. HCl and lactic acid, were used to enable the
differentiation of the inhibitory effects due to pH and lactic acid. Filter sterilised 5 M HCl
or 4 N NaOH solutions were used for pH adjustment of the media to avoid large changes
in volume and concentration of the media.
Table 4.3 Outline of the experimental design covering the conditions tested in kinetic models. Note that the range of those controlling factors are only approximate- full details are presented in Appendix G (Tables G.1-G.4).
Study of Temp. Water pH Lactic acid Number of conditions which growth rates were measured
(°C) activit~ (mM) Scott A LS
1. Temperaturea 3-37 0.99~ 7.3 0 30 30
2. pH + lactic ca.20 0.92-0.995 5.4,5.6, 0 30 30 acid+awb and6.0 50 28 28
3. pH+ lactic ca.20 0.995 4.0-6.8 0 13 13 acidc 0.96 4.4-7.8 20-200 47 47
0.96 5.4-6.6 450 7
Total data fpr model generation 148 155
a, b, and c Details are given in sections 4.2.3.1, 4.2.3.2, and4.2.3.3 respectively.
4.2.3.1 Determination of the effect of temperature on growth rate
The effect of temperature on the growth ra~ of L. monocytogenes Scott A and LS was
investigated in the sub-optimum temperature range, from 3 to 37°C at intervals of
approximately 1°C, using a Temperature Gradient Incubator (TGI). 15 ml of TSB-YE
was added to each of 60 L-tubes, which were then sterilised. The water activity of the
sterile broth was measured. The L-tubes were pla~ in · the TOI and allowed to
equilibrate overnight prior to beginning the experiment. The methods described in
sections 4.2.2.1-4 were followed.
107
4.2.3.2 Determination of the effect of water activity, pH, and lactic acid
on growth rate
A series of over-strength broths of different aw were prepared by the inclusion of NaCl to
the desired level. Due to the volume changes upon addition of large amounts of NaCl, a
volumetric flask was used to ensure that final concentrations of the growth medium
constituents in aw adjusted media were the same as in normal_ preparations. The over
strength media were autoclaved at 105°C for 30 minutes to prevent turbidity of the broths
due to formation of precipitates. In a study of the additional effect of lactic acid, 50 mM
lactic acid (0.512 g/100 ml) was included as acidulant to the sterile aw adjusted media in
volumetric flask then made up to volume with sterile distilled water. At each water
activity level, pH was adjusted to ea. 5.4, 5.7, and 6.1, a~d then 15 ml of the broth was
dispensed into 2 L-tubes for each L. monocytogenes strains. The first set of 60 L-tubes
were placed in a 20°C constant-temperature room and allowed to equilibrate to the
temperature overnight prior to beginning the experiment. The methods as outlined in
sections 4.2.2.1-4 were followed.
4.2.3.3 Determination of the effect of pH and lactic acid on growth rate
For the pH-lactic acid study, the experiment was also designed to mimic the water activity
of cold-smoked salmon which is -0.96. Therefore, 4.5% NaCl was also included in the
media used.
Sterile over-strength TSB-YE + 4.5% NaCl was prepared in a volumetric flask and made
up to final volume with sterile distilled water and filter sterilised lactic acid (88% w/w) to
concentrations of 20 mM (1.024 g/500 ml), 50 mM (2.559 g/500 ml), 100 mM (5.118
g/500 ml), and 200 mM (10.236 g/500 ml). In order to determine the growth response of
L. monocytogenes LS at high levels of lactic acid, the addition of 450 mM (11.516 g/250
ml) lactic acid was also tested.
In the study of pH without lactic acid, however, no NaCl was added to the medium which
already contained 0.5% NaCl. Thus, the water activity was near optimal at :::::0.995. This
was intended to enable the bacteria to achieve growth at th,e lowest pH possible so that
pHmin could be estimated directly.
For each concentration of lactic acid, the sterile broth was separated equally by weight
into two flasks and pH was adjusted to the lowest and highest pH required for each acid
concentration. A pH gradient of 15 pH values was prepared aseptically by combining the
two broths in varying proportions in sterile containers. The pH of the mixture was
108
rechecked and adjusted to the desired pH, and then lS ml was dispensed into 2 L-tubes
for each L. monocyto genes strain.
The L-tubes were placed in a 20°C constant temperature room and allowed to equilibrate
to the temperature overnight prior to beginning the experiment. This also allowed time for
any contamination to become apparent, and those tubes to be replaced. The methods
outlined in sections 4.2.2.1-4 were followed.
4.2.3.4 Model generation
The kinetic models for L. monocytogenes Scott A, and LS, were based on 148 and lSS
growth curves respectively, covering the range of sub-optt_mum conditions. The variables
combinations tested are represented diagrammatically in Appendix G, Fig. G .1. Details
are presented in Tables G.1 and G.2 for strain Scott A and Tables G.3 and G.4 for strain
LS. Growth curves were fitted by PROC NLIN to Eqn. 4.4 and growth rates calculated
using Eqn. 4.S.
The model for the temperature-aw-pH-lactic acid response used in this study, Eqn. 4. 7, is
a square-root type model and was derived by Ross (1993). A new pH-term, based on the
assumption that the growth rate is linearly proportional to hydrogen ion concentration and
to undissociated lactic acid concentration, was recently introduced (Presser et al., 1997a).
These kinetic models were fitted using a SAS2 PROC NLIN, a generalised non-linear
regression procedure written by Dr. D. Ratkowsky, School of Agricultural _Science,
University of Tasmania. Goodness-of-fit of the model to the observed data was assessed
by root mean square error (RMSE) (Box and Draper, 1987).
4.3 RESULTS
A total of 148 and 1S5 growth curves were generated for L. monocytogenes Scott A and
L5 respectively. The fitted models for the combined effects of temperature-water activity
pH-lactic acid on growth rates of L. monocytogenes Scott A (Eqn. 4.17a) and LS (Eqn.
4.18a) are as follows:
)rate =0.148 * (f-1.4) *J(aw--0.925)* J1-104
"228
·pH* 1- [LAC] pH-3.86
3. 70 * (1+10 )
(4.17a)
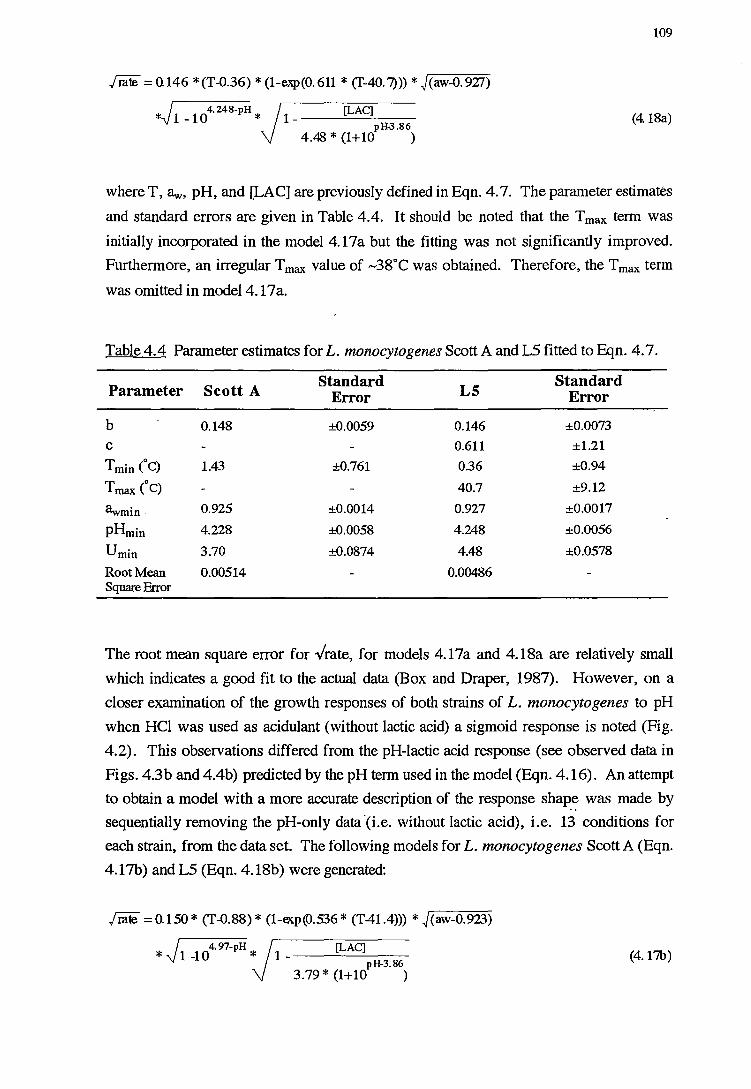
109
)rate = Q146 *(T-0.36) * (1-exp(0.611*(f-40.7))) * J(aw-0. 9Z7)
I 4. 248-pH 1 - [LAC] *-Vl-10 *
pH-3.86 4.48 * (1+10 )
(4.18a)
where T, aw, pH, and [LAC] are previously defined in Eqn. 4.7. The parameter estimates
and standard errors are given in Table 4.4. It should be noted that the T max term was
initially incorporated in the model 4. l 7a but the fitting was not significantly improved.
Furthermore, an irregular T max value of ,...,3g"c was obtained. Therefore, the T max term
was omitted in model 4. l 7a.
Table 4.4 Parameter estimates for L. monocytogenes Scott A and L5 fitted to Eqn. 4. 7.
Parameter Scott A Standard
LS Standard
Error Error
b 0.148 ±0.0059 0.146 ±0.0073
c 0.611 ±1.21
Tmin (°c) 1.43 ±0.761 0.36 ±0.94
Tmax (°c) 40.7 ±9.12
Clwmin. 0.925 ±0.0014 0.927 ±0.0017
pHmin 4.228 ±0.0058 4.248 ±0.0056
Umin 3.70 ±0.0874 4.48 ±0.0578
Root Mean 0.00514 0.00486 Square Error
The root mean square error for -v'rate, for models 4. l 7a and 4.18a are relatively small
which indicates a good fit to the actual data (Box and Draper, 1987). However, on a
closer examination of the growth responses of both strains of L. monocytogenes to pH
when HCl was used as acidulant (without lactic acid) a sigmoid response is noted (Fig.
4.2). This observations differed from the pH-lactic acid response (see observed data in
Figs. 4.3b and 4.4b) predicted by the pH term used in the model (Eqn. 4.16). An attempt
to obtain a model with a more accurate description of the response sha~~ was made by
sequentially removing the pH-only data.(i.e. without lactic acid), i.e. 13 conditions for
each strain, from the data set. The following models for L. monocytogenes Scott A (Eqn.
4. l 7b) and LS (Eqn. 4.18b) were generated:
)rate = 0.150 * (T-0.88) * (1-~p(0.536 * (T41.4))) * j(aw-0.923)
J 4. 97-pH l _ [LAC] * 1 -10 *
pH-3.86 3.79 * (1+10 )
(4.17b)
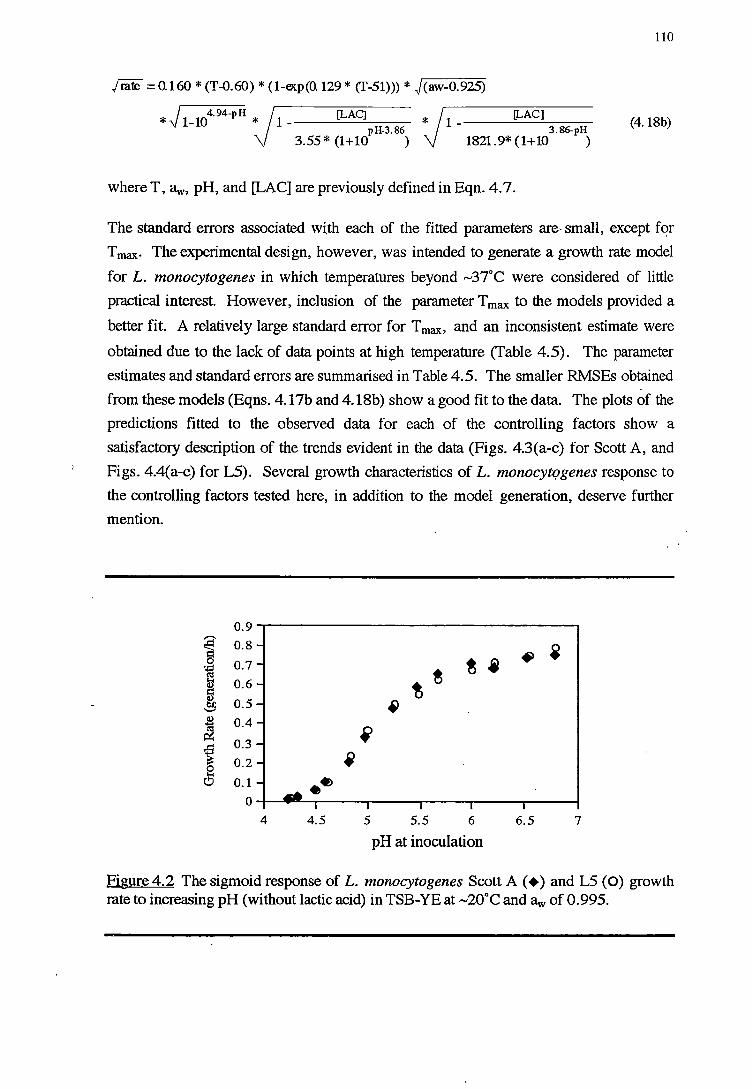
110
Jrate = 0.160 * (T-0.60) * (1-e11.p(0.129 * (f-51))) * J(aw-0.925)
I 4.94-pH *v 1-10 *
[LAC] 1 ----"-----
pH-3.86 3.55 * (1+10 )
* [LAC]
1--------3.86-pH
1821.9* (1+10 )
(4.18b)
where T, aw, pH, and [LAC] are previously defined in Eqn. 4. 7.
The standard errors associated with each of the fitted parameters are- small, except fqr
Tmax· The experimental design, however, was intended to generate a growth rate model
for L. monocytogenes in which temperatures beyond -37°C were considered of little
practical interest. However, inclusion of the parameter T max to the models provided a
better fit. A relatively large standard error for T max. and an inconsistent estimate were
obtained due to the lack of data points at high temperature (Table 4.5). The parameter
estimates and standard errors are summarised in Table 4.5. The smaller RMSEs obtained
from these models (Eqns. 4.17b and 4.18b) show a good fit to the data. The plots of the
predictions fitted to the observed data for each of the controlling factors show a
satisfactory description of the trends evident in the data (Figs. 4.3(a-c) for Scott A, and
Figs. 4.4(a-c) for L5). Several growth characteristics of L. monocytqgenes response to
the controlling factors tested here, in addition to the model generation, deserve further
mention.
0.9
~ 0.8 i 0 0.7 ~ j ~
-~
t ~ t 0.6 5 ~ 0.5 ~ Cl) 0.4 ~
~ ~ 0.3
~ 0.2 ~ ~ 0.1 . .,
0 4 4.5 5 5.5 6 6.5 7
pH at inoculation
Figure 4.2 The sigmoid response of L. monocytogenes Scott A ( +) and L5 (0) growth rate to increasing pH (without lactic acid) in TSB-YE at -20°C and aw of 0.995.
Figure 4.3 (facing page). The observed growth rate of L. monocytogenes Scott A compared to the growth rate predicted from the model (Eqn. 4.17b) in:
a) the sub-optimum temperature range from 3 to 37°C,
b) the range of ~v of 0.929-0.995 (NaCl as humectant) in the absence and presence of 50 mM lactic acid, and
c) the range of pH of 4.9-7.8 in the presence of 5.0% NaCl and different levels of lactic acid.
The predicted lines were fitted directly to the observed data without a standardisation for slight difference in pH in b) or temperature in c).
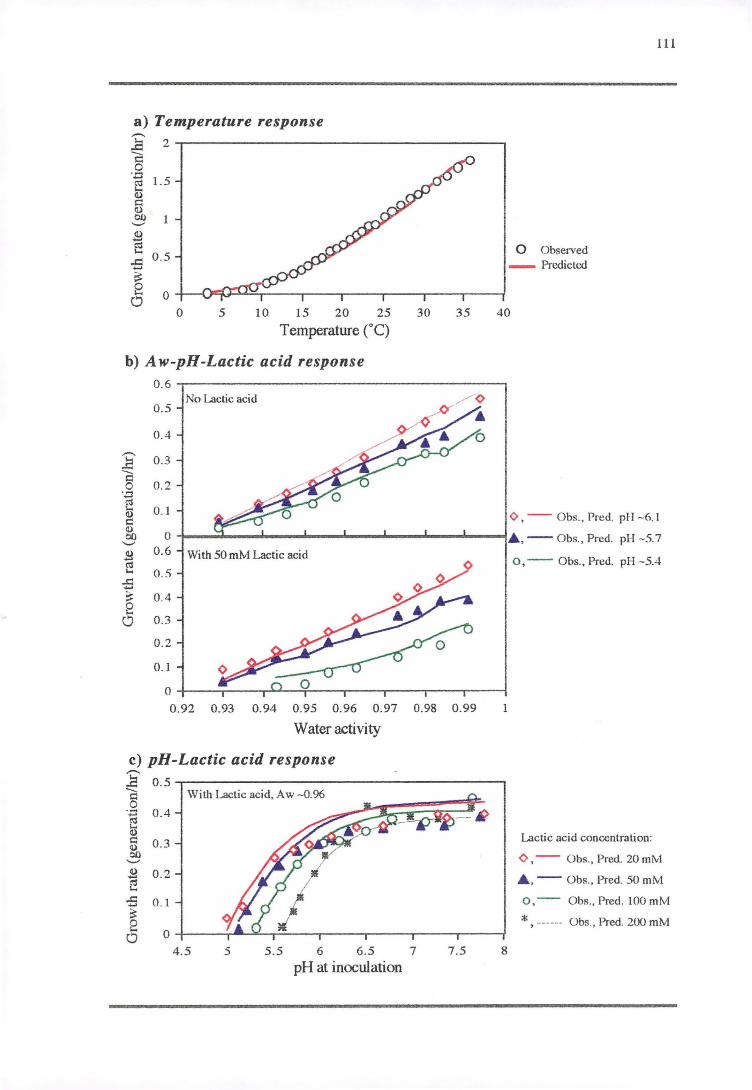
a) Temperature response 13' 2 -r----------------------. § ·~ 1.5 (!)
~ OJ) ._,
~ ...... 0 .5 ~ ~ 8 0
0 Observed - Predicled
111
0 5 10 I 5 20 25 30 35 40
Temperature (°C)
b) Aw-pH-Lactic acid response 0.6 -----------------------.
No Lactic acid 0.5
0.4 ,,..... .E 0.3 ...._
c:: 0.2 .Q .....
ell :... CU c:: (!)
00 ..._,
0. I
0
0 , -- Obs., Pred. pH -6. 1
;---------------------4.A., -- Obs., Pred. pH - 5.7 0.6 ~ With 50mM Lactic acid
ro i.. 0.5
<> o ,-- Obs., Pred. pH-5.4
...c:: ..... ~ 0.4 e d 0.3
0.2
0. 1
0 +----.--......-....... -r----.---..----r---r----t
0.92 0.93 0.94 0.95 0.96 0.97 0.98 0.99
Water activity
c) pH-Lactic acid response ,,..... .E 0.5-----------------------. § With Lactic acid, Aw - 0.%
·~ 0.4 Q)
~ 0 .3 ..._,
2 0.2 ~ .s 0 . 1 ::: ~ 0
4 .5 5 5 .5 6 6 .5 7 7.5 8
pH at inoculation
Lactic acid concenlration:
<> , -- Obs., Pred. 20 mM
A , -- Obs., Pred. 50 mM
o,- Obs., Pred. 100 mM
*, ------ Obs., Pred. 200 mM
F1gure4.4 (facing page). The observed growth rate of L. monocytogenes LS compared to the growth rate predicted from the model (Eqn. 4. i8b) in:
a) the sub-optimum temperature range from 3 to 37°C,
b) the range of aw of 0.929-0.995 (NaCl as humectant) in the absence and presence of 50 mM lactic acid, and
c) the range of pH of 4.9-7.8 in the presence of 5.5% NaCl and different levels of lactic acid.
The predicted lines were fitted directly to the observed data without a standardisation for slight difference in pH m b) or temperature in c).
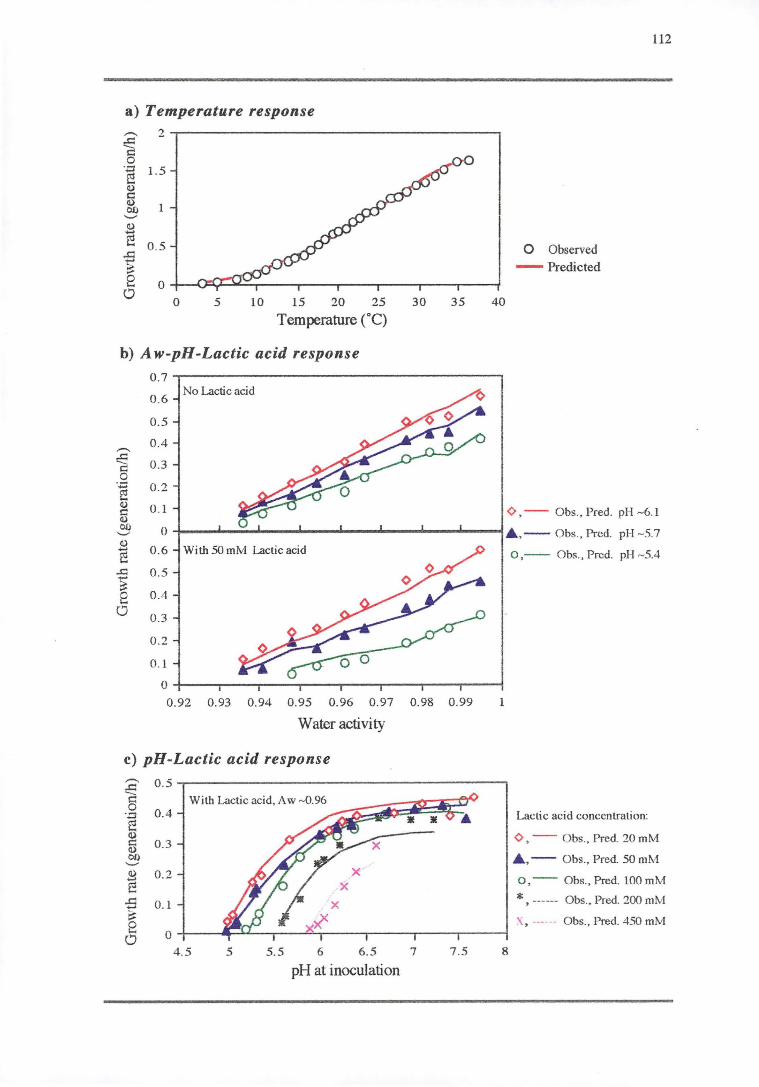
a) Temperature response ,-... ...c: 2
1:3 0 ·a 1.5 ~ Q)
fi 1 OI) '-' Q)
~ 0 .5 ...i::: ..... ~ e 0 0
0 5 10 15 20 25
Temperature (°C)
b) Aw-pH-Lactic acid response 0 .7
0.6 No Lactic acid
0.5
0.4 ,....... ce 0.3 i:::: .2
0.2 -f:!
30 35 40
0 Observed - Predicted
112
Q) c Q) Ol) '-'
0 .1
0
<> , -- Obs., Pred. pH ~6.1
....,_ _ __..._.-..~_...,.i.... _ _,_ __ ..._ _ _.. __ ...__"""'A,-- Obs., Prcd. pH - 5.7
2 0.6 ~
With 50 mM Lactic acid
..c 0 .5 -?$ e 0 .4
0 0 .3
0 .2
0 .1
0 -+-~--.r--~-.-~--..--~-.-~~.--~-r~~.--~-t
0.92 0.93 0.94 0.95 0.96 0.97 0.98 0 .99
Water activity
c) pH-Lactic acid response ,-... 0 .5 ...i::: -- With Lactic acid, Aw ~.96 s:= 0 0.4 ·a e Q)
5 0.3 OI) ........ 2 0.2 x ~ x
...c: 0 . 1 x ....... :::: x.0 e 0 0
4 .5 5 5.5 6 6.5 7 7.5 8
pH at inoculation
o ,-- Obs., Pred. pH -5.4
Lactic acid concentration:
<> , -- Obs., Pred. 20 mM
A , -- Obs., Pred. 50 mM
o ,-- Obs., Pred. 100 mM
*, ------ Obs., Pred. 200 mM
X, --- -- Obs., Pred. 450 mM
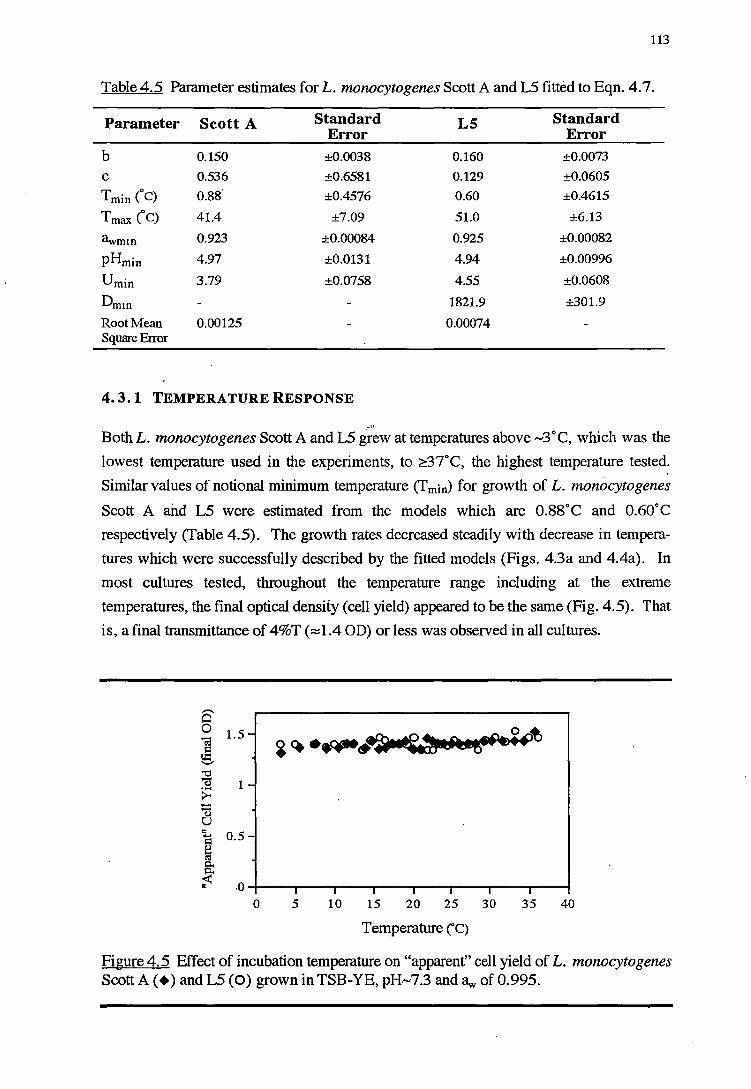
113
Table 4.5 Parameter estimates for L. monocytogenes Scott A and L5 fitted to Eqn. 4. 7.
Parameter Scott A Standard LS Standard Error Error
b 0.150 ±0.0038 0.160 ±0.0073
c 0.536 ±0.6581 0.129 ±0.0605
Tmin (°c) 0.88 ±0.4576 0.60 ±0.4615
Tmax (°c) 41.4 ±7.09 51.0 ±6.13
<lwmm 0.923 ±0.00084 0.925 ±0.00082
pHmin 4.97 ±0.0131 4.94 ±0.00996
Umin 3.79 ±0.0758 4.55 ±0.0608
Dmm 1821.9 ±301.9
Root Mean 0.00125 0.00074 Square Error
4. 3. 1 TEMPERATURE RESPONSE
,.., Both L. monocytogenes Scott A and L5 grew at temperatures above .-.3°C, which was the
lowest temperature used in the experiments, to ?:.37°C, the highest temperature tested. I
Similar values of notional minimum temperature (T min) for growth of L. monocytogenes
Scott A and LS were estimated from the models which are 0.88°C and 0.60°C
respectively (Table 4.5). The growth rates decreased steadily with decrease in tempera
tures which were successfully described by the fitted models (Figs. 4.3a and 4.4a). In
most cultures tested, throughout the temperature range including at the extreme
temperatures, the final optical density (cell yield) appeared to be the same (Fig. 4.5). That
is, a final transmittance of 4%T (::::::1.4 OD) or less was observed in all cultures.
l 0.5
~ 0 5 10 15 20 25 30 35 40
Temperature (°C)
Figure 4.5 Effect of incubation temperature on "apparent" cell yield of L. monocytogenes Scott A (+)and L5 (0) grown in TSB-YE, pH.-.7.3 and aw of 0.995.
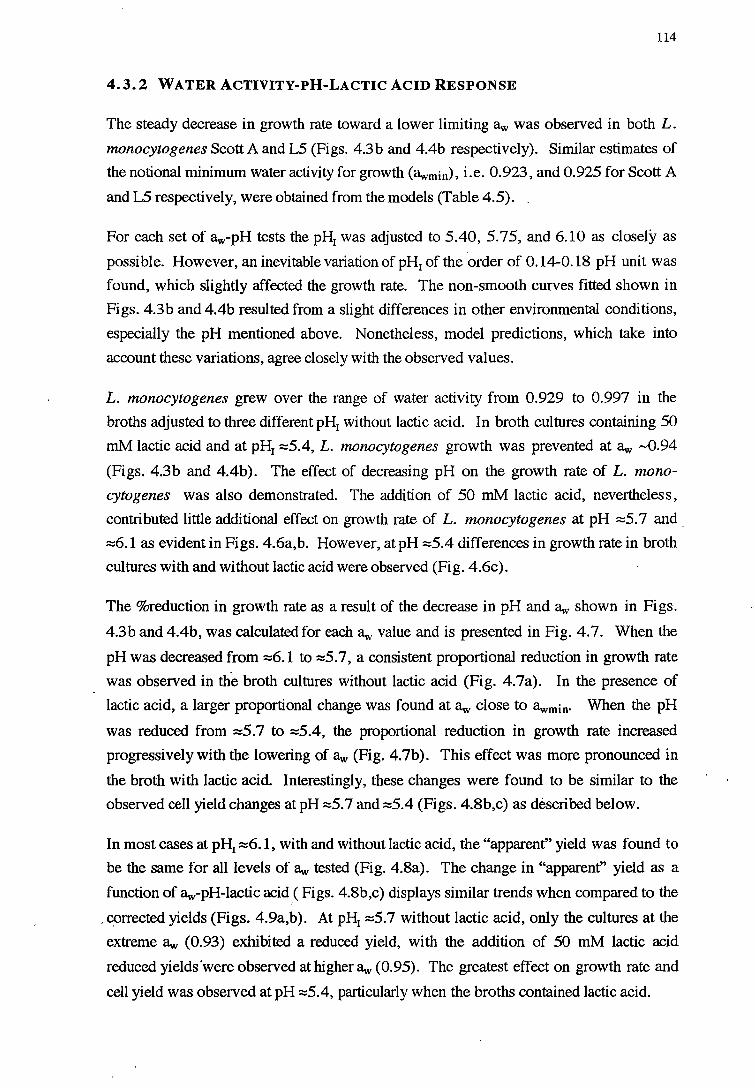
114
4.3.2 WATER ACTIVITY-PH-LACTIC ACID RESPONSE
The steady decrease in growth rate toward a lower limiting aw was observed in both L.
monocytogenes Scott A and LS (Figs. 4.3b and 4.4b respectively). Similar estimates of
the notional minimum water activity for growth (awmin), i.e. 0.923, and 0.925 for Scott A
and L5 respectively, were obtained from the models (Table 4.5).
For each set of aw-pH tests the pH1 was adjusted to 5.40, 5.75, and 6.10 as closely as
possible. However, an inevitable variation of pH1 of the order of 0.14-0.18 pH unit was
found, which slightly affected the growth rate. The non-smooth curves fitted shown in
Figs. 4.3b and 4.4b resulted from a slight differences in other environmental conditions,
especially the pH mentioned above. Nonetheless, model predictions, which take into
account these variations, agree closely with the observed values.
L. monocytogenes grew over the range of water activity from 0.929 to 0.997 in the
broths adjusted to three different pH1 without lactic acid. In broth cultures containing 50
mM lactic acid and at pH1 :::::5.4, L. monocytogenes growth was prevented at aw -0.94
(Figs. 4.3b and 4.4b). The effect of decreasing pH on the growth rate of L. mono
cytogenes Was also demonstrated. The addition of 50 mM lactic acid, nevertheless,
contributed little additional effect on growth rate of L. monocytogenes at pH :::::5. 7 and.
:::::6.1 as evident in Figs. 4.6a,b. However, at pH :::::5.4 differences in growth rate in broth
cultures with and witQ.out lactic acid were observed (Fig. 4.6c).
The %reduction in growth rate as a result of the decrease in pH and aw shown in Figs.
4.3 band 4.4b, was calculated for each aw value and is presented in Fig. 4. 7. When the
pH was decreased from :::::6.1 to :::::5. 7, a consistent proportional reduction in growth rate
was observed in the broth cultures without lactic acid (Fig. 4.7a). In the presence of
lactic acid, a larger proportional change was found at aw close to '1wmin· When the pH
was reduced from :::::5.7 to :::::5.4, the proportional reduction in growth rate increased
progressively with the lowering of aw (Fig. 4.7b). This effect was more pronounced in
the broth with lactic acid. Interestingly, these changes were found to be similar to the
observed cell yield changes at pH :::::5.7 and :::::5.4 (Figs. 4.8b,c) as described below.
In most cases at pH1 :::::6.1, with and without lactic acid, the "apparent" yield was found to
be the same for all levels of aw tested (Fig. 4.8a). The change in "apparent" yield as a
function of aw-pH-lactic acid .C Figs. 4.8b,c) displays similar trends when compared to the
. corrected yields (Figs. 4.9a,b). At pH1 :::::5.7 without lactic acid, only the cultures at the
extreme aw (0.93) exhibited a reduced yield, with the addition of 50 mM lactic acid
reduced yields'were observed at higher aw (0.95). The greatest effect on growth rate and
cell yield was observed at pH :::::5.4, particularly when the broths contained lactic acid.
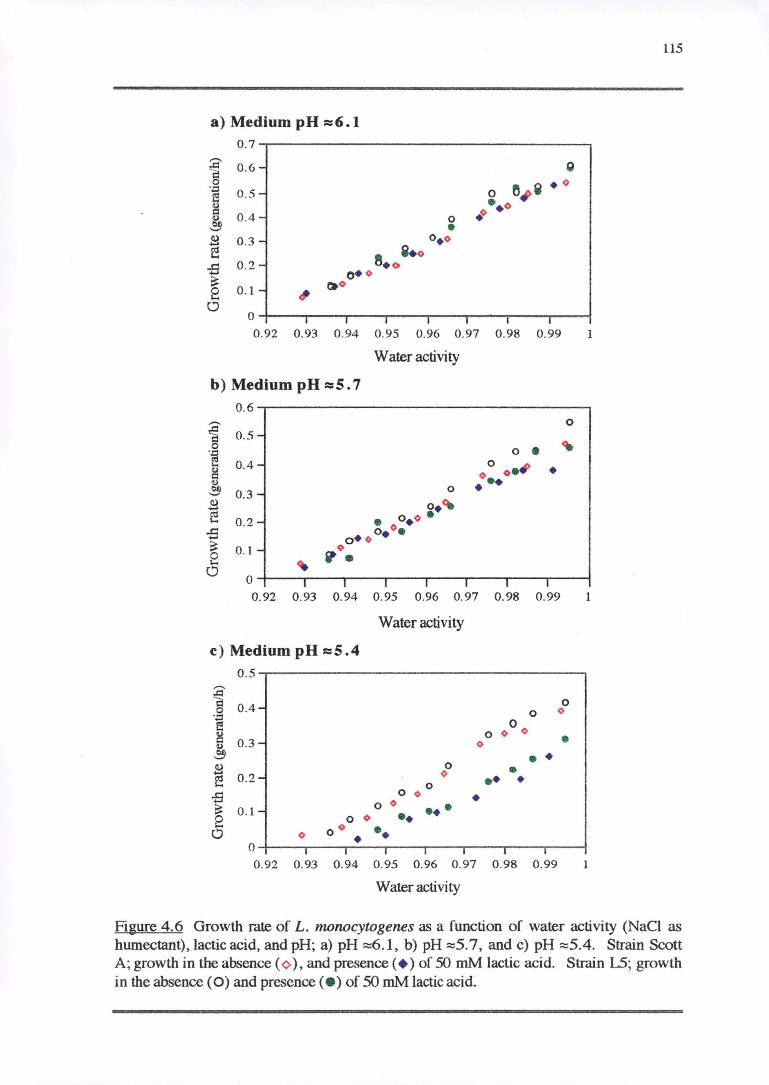
115
a) Medium pH :::::6.1 0.7-.-~~~~~~~~~~~~~~~~~~~
;a- 0.6- g c 0
"~ ~ . o ·.o
~ 0 .5- 0
:!:! •.o Q) 0.4- 0 . 0 ~ • ll) 0.3 - o. o ...... l'1 Q• o '"" e. <> ...c:: 0 .2 -...... o• o :::
0.1- ~o 8 , 0
o--~--.,~~~,~~..-,~ ....... ,~~...-,~-,.--~-...-,~~ 0.92 0 .93 0 .94 0 .95 0.96 0 .97 0 .98 0 .99
Water activity
b) Medium pH :::::5. 7 0 .6-.-~~~~~~~~~~~~~~~~~~~
....... 0
1 0.5
·.o 0 • ~
~ 0 .4 0 o• # c o • • •
Q)
~ 0.3 0 • ll) o.~ ...... ~ • 0.2 • o. o
...c:: <> • o • • ...... 0 0 ~ 0. 1 0 e '# • 0
0
0 .92 0.93 0.94 0 .95 0.96 0.97 0.98 0 .99
Water activity
c) Medium pH :::::5 .4 0 .5
~ 0.4- 0 .g 0 0
e 0 0 0 Q) 0 • c 0.3- 0 Q)
~ • • ll) 0 • ~ 0.2- 0 •• • '"" 0
.s 0 0 • ~ 0 .1-
0 0 ••• e 0 0 •• 0 0
0 0 •• • 0 I I I I I I I
0.92 0.93 0.94 0.95 0.96 0 .97 0 .98 0 .99
Water activity
Figure 4.6 Growth rate of L. nwnocytogenes as a function of water activity (NaCl as humectant), lactic acid, and pH; a) pH ~6.1, b) pH ~s.7 , and c) pH ~s.4. Strain Scott A; growth in the absence ( o.), and presence ( + ) of 50 mM lactic acid. Strain LS; growth in the absence (0) and presence(• ) of 50 mM lactic acid.
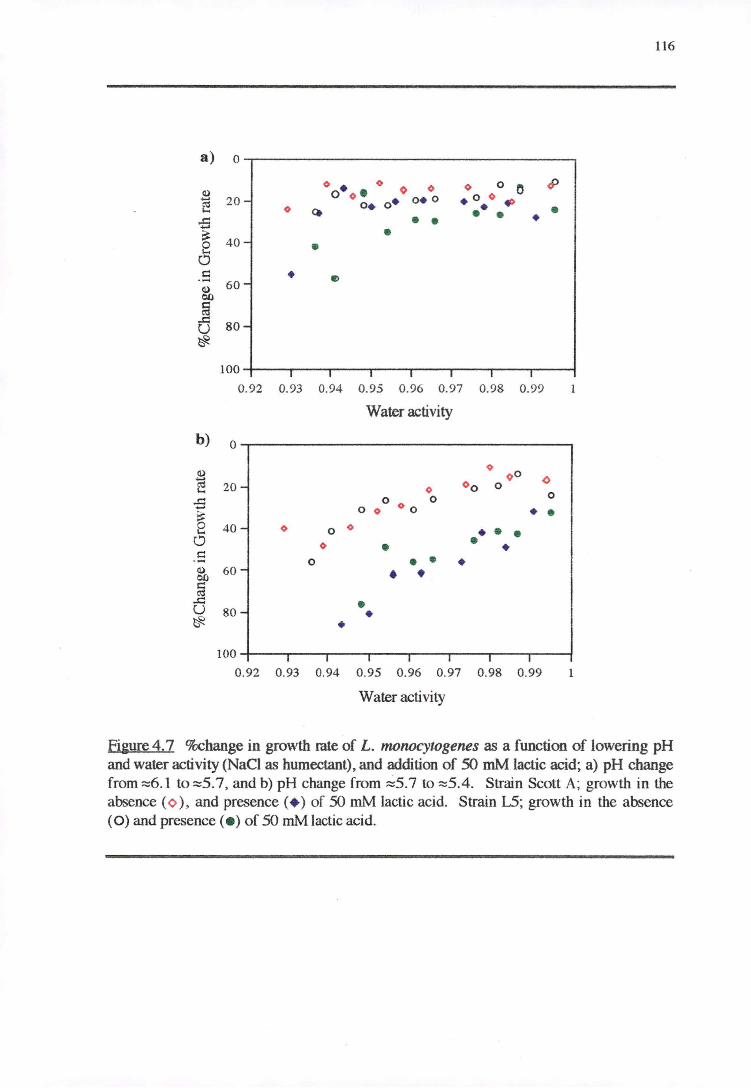
116
a) 0
0 <> 0 0 0 0 ~ (1) o•o• 0
. o <> ~ ..... 20- o• o !::! 0 ~
O• o• •• • • '5 • • • :::t • ~
40- • i:: • ., ·- 60-(1) 00 a ~ 80-u ~
100 I I I I I I I
0.92 0.93 0.94 0.95 0.96 0.97 0.98 0.99
Water activity
b) 0
(1) <> 0 0 () ta 20- <>o 0
'"" <> ~ 0 0 0 ...... o o <> o • • § 40- <> 0 <> • • d • •
0 • • c:: • 0 • • (1) 60- • • 00 i:: ~ ~ • u 80- • ~ •
100 I I I I I I I
0 .92 0.93 0.94 0.95 0.96 0.97 0.98 0.99
Water activity
Figure 4. 7 %change in growth rate of L. monocytogenes as a function of lowering pH and water activity (NaCl as humectant), and addition of 50 mM lactic acid; a) pH change from ~6.1 to ~s.7, and b) pH change from ;,5_7 to ~s.4. Strain Scott A; growth in the absence ( <> ), and presence ( + ) of 50 mM lactic acid. Strain LS; growth in the absence ( 0) and presence ( • ) of 50 mM lactic acid.
117
a) Medium pH -6. l 1.5
0 .... o. 0 i : o • <i q. o• • o o • o"• o o•og ,..... 0. 0
0 1= ] I -
~s Q.. '1:S Q..'U < .... = ;;... 0 .5 -
1S CJ
0 I I I I I ' I
0.92 0.93 0.94 0.95 0.96 0.97 0.98 0.99 1
Water activity
b) Medium pH =5. 7 1.5
0 0 0 ~ 0 0 <O
6 o e o •• •• •oi • o•oe 0 0 • • 0 0 •
'L ~ 1 - • E tEl 0 • • !ii ........ • Q.. '1:S • 0.. 'U < ·-:: > 0.5 --a
0 I I I I ' I I
0.92 0.93 0.94 0.95 0.96 0.97 0.98 0.99
Water activity
c) Medium pH =5.4 1.5
0 ~ 0 00 0 ° 0 0 ,.....
0 0 ° 0 0 0 •• • •• •
~] 1 - 0 0 • 0 • • ~s • • 0 0 • Q.. '1:S • Q.. 'U 0 • ~~ 0.5 - • • == Q,)
CJ
x -f< + 0 I I I I I I I
0 .92 0.93 0.94 0.95 0.96 0.97 0 .98 0.99 1
Water activity
Figure 4.8 "Apparent" cell yield of L. monocytogenes as a function of water activity (NaCl as humectant), lactic acid, and pH; a) pH ::::6.1, b) pH ::::5.7, and c) pH ::::5.4. Strain Scon A; growth in the absence of lactic acid ( o ), and growth ( + ) and no growth (x) in the presence of 50 mM lactic acid. Strain LS; growth in the absence of lactic acid (0), and growth(• ) and no growth(+) in the presence of 50 mM lactic acid.
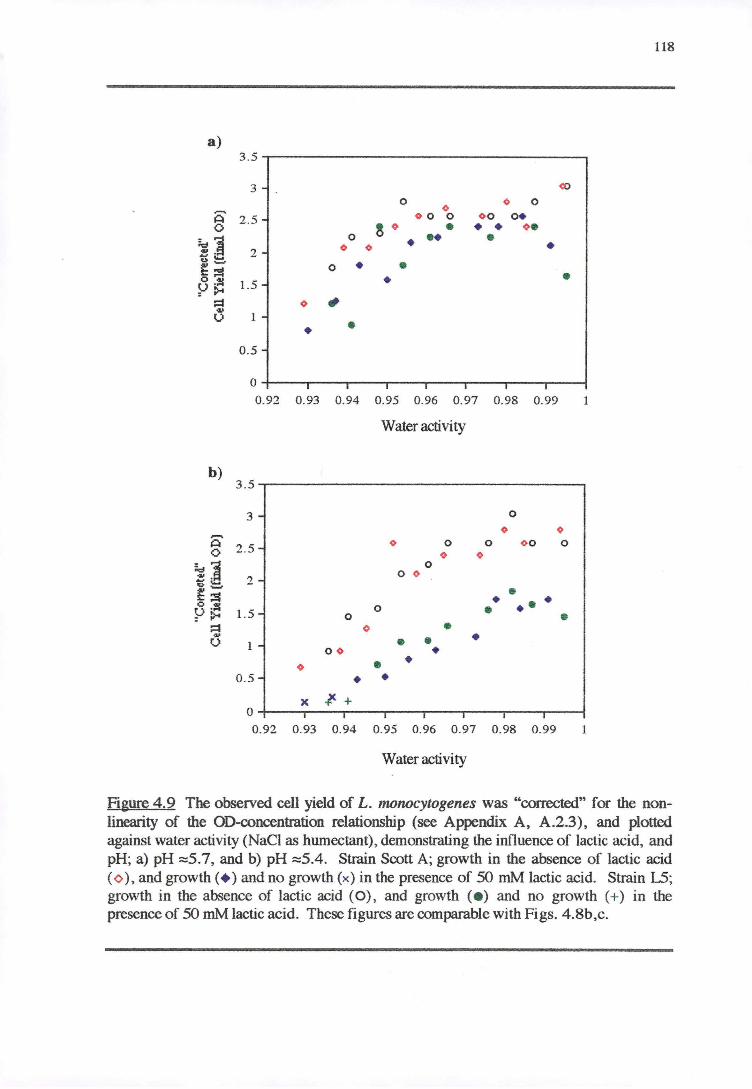
118
a) 3.5
3 - co 0 0 0
A' 0
2 .5 - 0 0 0 0 0 O• 0 g 0 • • • o•
0 •• • ~1 0 0 • • ~ '6... 2 -... _ • • ~~ 0
• • 8 -~ 1.5 -: >' :=I 0 " ..... u 1 -
• • 0.5 -
0 I I I I I I I
0.92 0.93 0.94 0.95 0.96 0.97 0 .98 0.99
Water activity
b) 3 .5
3 - 0
0 0 ,.....,. A 2 .5 -
0 0 0 0 0 0 0 0 0
~:a 0 "". 2 -
0 0 ~ ..... ... ......, ~ :s • • •• • 8·:il 1.5 - 0 • : >' 0 • :=I () • .., • • u 1 - • 0 0 • • • 0
0 .5- • • x ..,. +
0 I I I I I I I
0.92 0.93 0.94 0.95 0.96 0 .97 0.98 0.99
Water activity
Figure 4.9 The observed cell yield of L. monocytogenes was "corrected" for the nonlinearity of the OD-concentration relationship (see Appendix A, A.2.3), and plotted against water activity (NaCl as humectant), demonstrating the influence of lactic acid, and pH; a) pH ::::5.7, and b) pH ::::5.4. Strain Scott A; growth in the absence of lactic acid ( o ), and growth (+ )and no growth (x) in the presence of 50 mM lactic acid. Strain 15; growth in the absence of lactic acid (0), and growth (• ) and no growth (+) in the presence of 50 mM lactic acid. These figures are comparable with Figs. 4.8b,c.
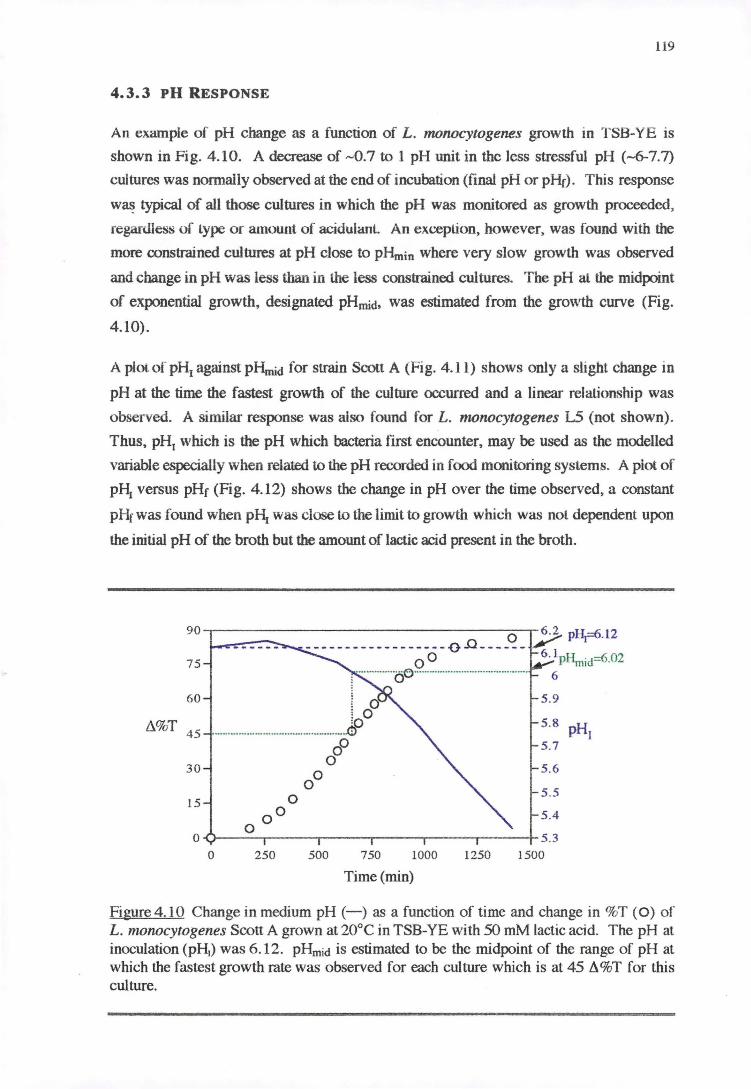
119
4.3.3 PH RESPONSE
An example of pH change as a function of L. monoeytogenes growth in TSB-YE is
shown in Fig. 4.10. A decrease of ,...Q.7 to 1 pH unit in the less stressful pH (-6-7.7)
cultures was normally observed at the end of incubation (final pH or pHr). This response
w~ typical of all those cultures in which the pH was monitored as growth proceeded,
regardless of Lype or amount of acidulanl. An ex.ceplion, however, was found with the
more constrained cultures at pH close to pHmin where very slow growth was observed
and change in pH was less than in the less constrained cultures. The pH al the midpoint
of exponential growth. designated pHmid· was estimated from the growth curve (Fig.
4.10).
A plot of pH1 against pHmid for strain Scott A (Fig. 4.11) shows only a slight change in
pH at the time the fastest growth of the culture occurred and a linear relationship was
observed. A similar response was also found for L. monocytogenes LS (not shown).
Thus, pH1 which is the pH which bacteria first encounter, may be used as the modelled
variable especially when related to the pH recorded in food monitoring systems. A plot of
pH1 versus pHr (Fig. 4.12) shows the change in pH over the time observed, a constant
pHr was found when pf\ was close to the limit to growth which was nol dependent upon
the initial pH of the broth but the amount of lactic acid present in the broth.
90.....-----------------0-..- 6.2 pHr=6.l2
------------------ -0.0 ______ ,/ 75
60
Li%T 45
30
15
0 0 6.1P8mid=6.02 ...... -... -···50····"""'""""'--······.............. 6
5.9 l a lO =o
................................................. ..(!5 5.8 pH1
0
0 00
0 250
00
00 0
500 1000 750
Time(min)
5.7
5.6
5 .5
5.4
5.3 1250 1500
Figure4. IO Change in medium pH(- ) as a function of time and change in %T (O) of L. monocytogenes Scott A grown at 20°C in TSB-YE with 50 mM lactic acid. The pH at inoculation (pH1) was 6.12. pHmid is estimated to be the midpoint of the range of pH al
which the fastest growth rate was observed for each culture which is at 45 Li%T for this culture.
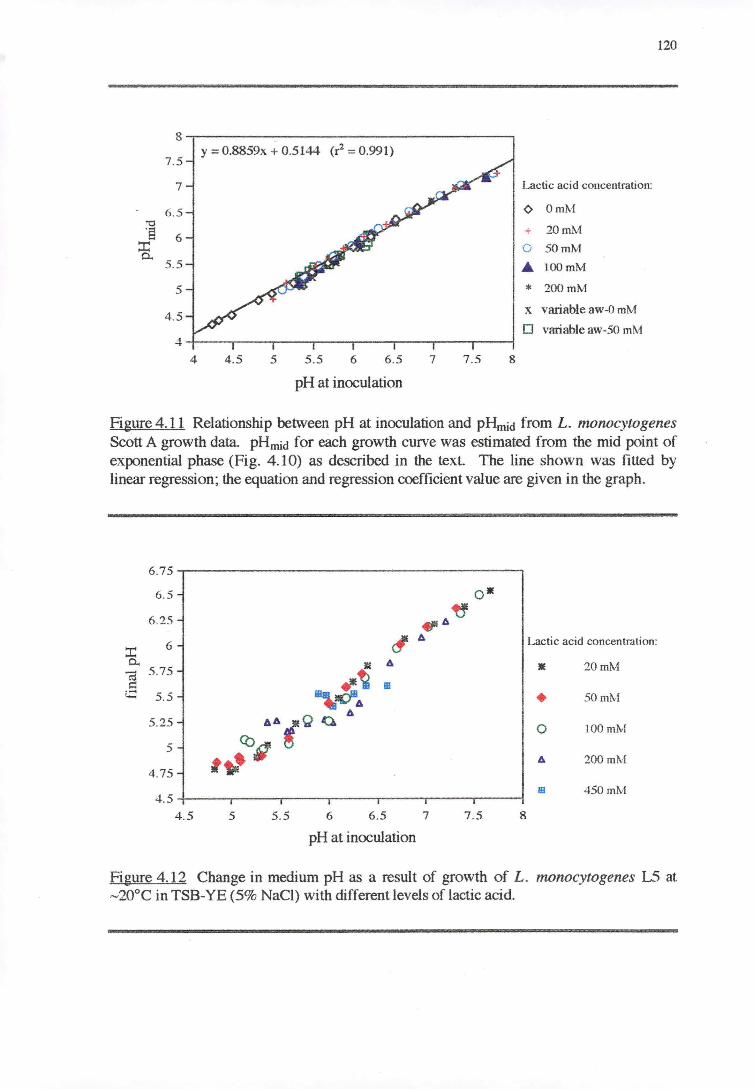
8
7.5
7
6.5 "O ·9 6 ::r:
0... 5.5
5
4 .5
4
4
y = 0.8859x + 0.5144 (r2 = 0.991)
4.5 5 5.5 6 6.5 7
pH at inoculation
7.5 8
Lactic acid concentration:
<> OmM
+ 20mM
0 50mM
A lOOmM
* 200mM
x variable aw-0 mM
D variable aw-50 mtvt
120
Figure 4.11 Relationship between pH at inoculation and pHmid from L. monocytogenes Scott A growth data. pHmid for each growth curve was estimated from the mid point of exponential phase (Fig. 4.10) as described in the text. The line shown was fitted by linear regression; the equation and regression coefficient value are given in the graph.
6.75
6.5 -
6 .25 -
:r: 6 - Lactic acid concentration:
0... (ii 5.75 - • 20mM
s:: ;..:: 5.5 - • 50 mtv!
5.25 - 0 lOOmM
5 -A 200mM
4.75 -
4.5 I I I I I I
HI 450mM
4.5 5 5.5 6 6.5 7 7.5 8
pH at inoculation
Figure 4.12 Change in medium pH as a result of growth of L. monocytogenes L5 at ,..,20°c in TSB-YE (5% NaCl) with different levels of lactic acid.
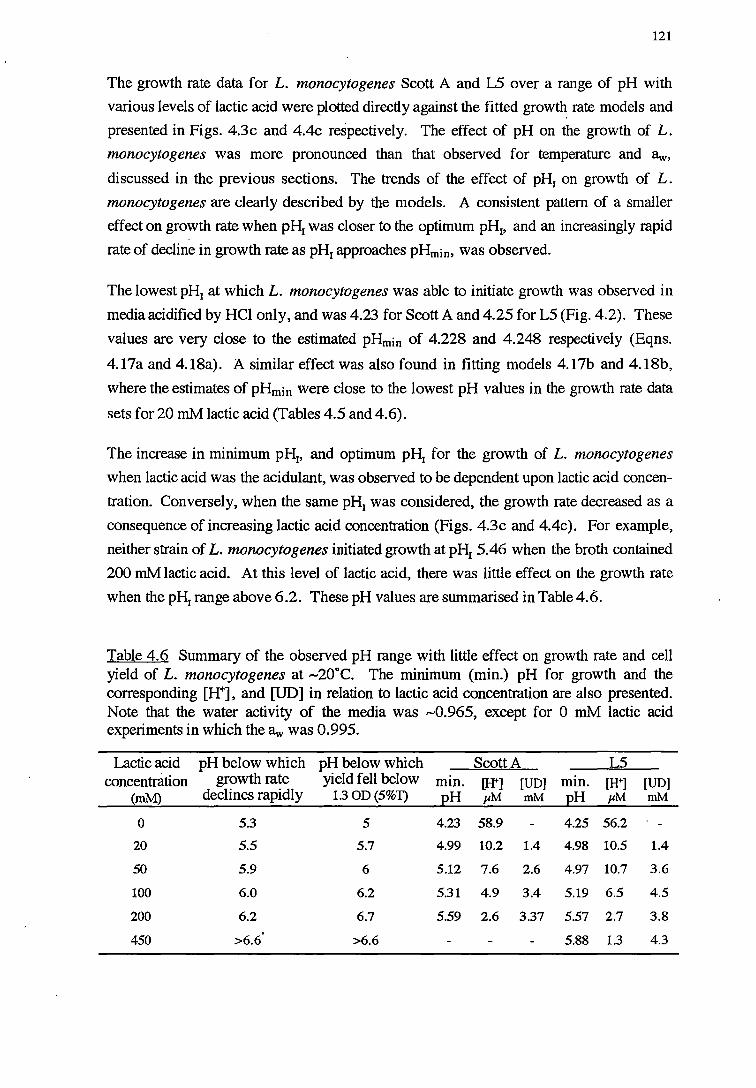
121
The growth rate data for L. monocytogenes Scott A and L5 over a range of pH with
various levels of lactic acid were plotted directly against the fitted growth rate models and
presented in Figs. 4.3c and 4.4c respectively. The effect of pH on the growth of L.
monocytogenes was more pronounced than that observed for temperature and aw, discussed in the previous sections. The trends of the effect of pH1 on growth of L.
monocytogenes are clearly described by the models. A consistent pattern of a smaller
effect on growth rate when pH1 was closer to the optimum pH1, and an increasingly rapid
rate of decline in growth rate as pH1 approaches pHmin, was observed.
The lowest pH1 at which L. monocytogenes was able to initiate growth was observed in
media acidified by HCl only, and was 4.23 for Scott A and 4.2S for LS (Fig. 4.2). These
values are very close to the estimated pHmin of 4.228 and 4.248 respectively (Eqns.
4.17a and 4.18a). A similar effect was also found in fitting models 4.17b and 4.18b,
where the estimates of pHmin were close to the lowest pH values in the growth rate data
sets for 20 mM lactic acid (Tables 4.S and 4.6).
The increase in minimum pH1, and optimum pH1 for the growth of L. monocytogenes
when lactic acid was the acidulant, was observed to be dependent upon lactic acid concen
tration. Conversely, when the same pH1 was considered, the growth rate decreased as a
consequence of increasing lactic acid concentration (Figs. 4.3c and 4.4c). For example,
neither strain of L. monocytogenes initiated growth at pH1 S.46 when the broth contained
200 mM lactic acid. At this level of lactic acid, there was little effect on the growth rate
when the pH1 range above 6.2. These pH values are summarised in Table 4.6.
Table 4.6 Summary of the observed pH range with little effect on growth rate and cell yield of L. monocytogenes at -20°C. The minimum (min.) pH for growth and the corresponding [H+], and [UD] in relation to lactic acid concentration are also presented. Note that the water activity of the media was -0.96S, except for 0 mM lactic acid experiments in which the aw was 0.99S.
Lactic acid pH below which pH below which Scott A LS concentration growth rate yield fell below min. LH+J [UD] mm. [W] [UD]
(mM) declines rapidly 1.3 OD (5%T) EH µM mM EH µM mM
0 5.3 5 4.23 58.9 4.25 56.2
20 5.5 5.7 4.99 10.2 1.4 4.98 10.5 1.4
50 5.9 6 5.12 7.6 2.6 4.97 10.7 3.6
100 6.0 6.2 5.31 4.9 3.4 5.19 6.5 4.5
200 6.2 6.7 5.59 2.6 3.37 5.57 2.7 3.8 . 450 >6.6 >6.6 5.88 1.3 4.3
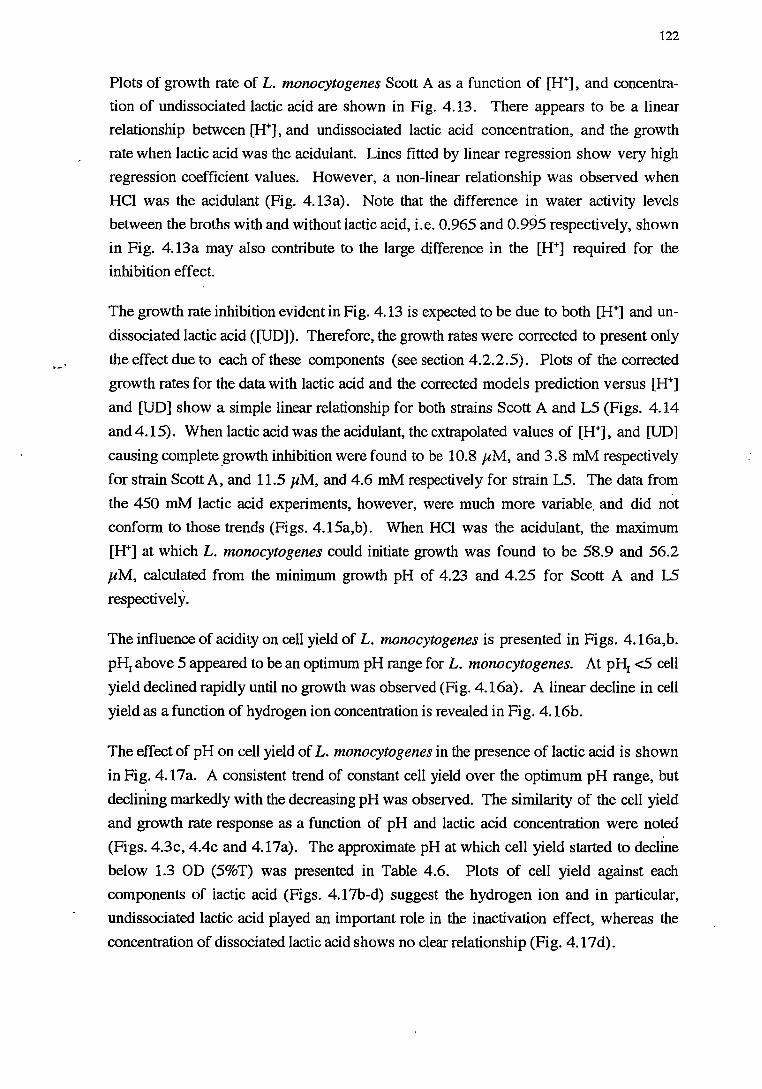
122
Plots of growth rate of L. monocytogenes Scott A as a function of [H+], and concentra
tion of undissociated lactic acid are shown in Fig. 4.13. There appears to be a linear
relationship between [H+], and undissociated lactic acid concentration, and the growth
rate when lactic acid was the acidulant. Lines fitted by linear regression show very high
regression coefficient values. However, a non-linear relationship was observed when
HCl was the acidulant (Fig. 4.13a). Note that the difference in water activity levels
between the broths with and without lactic acid, i.e. 0.96S and 0.99S respectively, shown
in Fig. 4.13a may also contribute to the large difference in the [H+] required for the
inhibition effect.
The growth rate inhibition evident in Fig. 4.13 is expected to be due to both [H+] and un
dissociated lactic acid ([UD]). Therefore, the growth rates were corrected to present only
the effect due to each of these components (see section 4.2.2.S). Plots of the corrected
growth rates for the data with lactic acid and the corrected models prediction versus [H+]
and [UD] show a simple linear relationship for both strains Scott A and LS (Figs. 4.14
and 4. lS). When lactic acid was the acidulant, the extrapolated values of [H+], and [UD]
causing complete _growth inhibition were found to be 10.8 µM, and 3 .8 mM respectively
for strain Scott A, and 11.S µM, and 4.6 mM respectively for strain LS. The data from
the 4SO mM lactic acid experiments, however, were much more variable, and did not
conform to those trends (Figs. 4.lSa,b). When HCl was the acidulant, the maximum
[H+] at which L. monocytogenes could initiate growth was found to be S8.9 and S6.2
µM, calculated from the minimum growth pH of 4.23 and 4.2S for Scott A and LS
respectively.
The influence of acidity on cell yield of L. monocytogenes is presented in Figs. 4.16a,b.
pH1 above S appeared to be an optimum pH range for L. monocytogenes. At pH1 <.5 cell
yield declined rapidly until no growth was observed (Fig. 4.16a). A linear decline in cell
yield as a function of hydrogen ion concentration is revealed in Fig. 4.16b.
The effect of pH on cell yield of L. monocytogenes in the presence of lactic acid is shown
in Fig. 4. l 7a. A consistent trend of constant cell yield over the optimum pH range, but
declining markedly with the decreasing pH was observed. The similarity of the cell yield
and growth rate response as a function of pH and lactic acid concentration were noted
(Figs. 4.3c, 4.4c and 4.17a). The approximate pH at which cell yield started to decline
below 1.3 OD (S%T) was presented in Table 4.6. Plots of cell yield against each
components of iactic acid (Figs. 4.17b-d) suggest the hydrogen ion and in particular,
undissociated lactic acid played an important role in the inactivation effect, whereas the
concentration of dissociated lactic acid shows no clear relationship (Fig. 4.17 d).
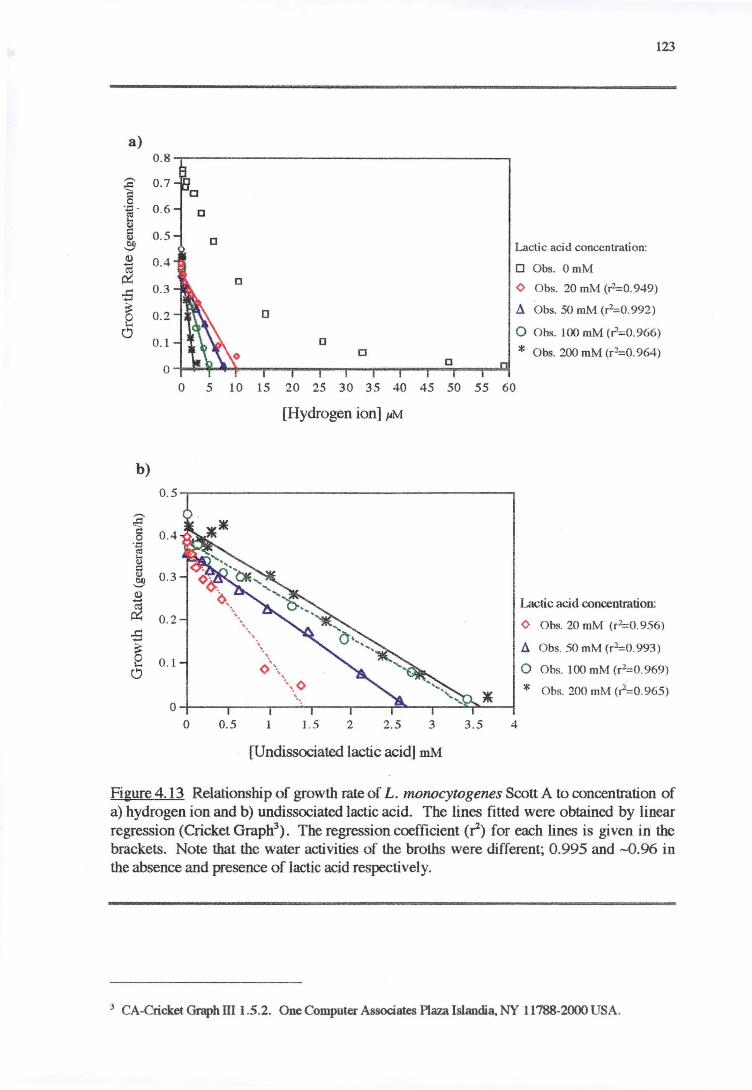
123
a) 0.8
~ 0.7
·.::1-
tl 0.6 a
d 0.5 Q.I a ~ Lactic acid concentration: Q) 0.4 ~ 0 Obs. OmM ~ <> Obs. 20 mM (r2=0. 949) ..r:: 0.3 ..... ~
0.2 a ll. Obs. 50 mM (r2=0.992) e d a
0 Obs. l 00 mM (i2=0. 966) 0.1 * Obs. 200 mM (r2=0. 964) a
0 a
0 5 10 15 20 25 30 35 40 45 50 55 60
[Hydrogen ion] µM
b)
0.5
.-.. ~ § 0.4
·::i al ~ d Q.I 0.3 ~ Q) ...... Lactic acid concentration: ~ 0. 2 <> Obs. 20 mM (r2=0.956) -B ::= ' b. Obs. 50 mM (r2=0.993) e ' 0 . l <>"·, 0 Obs. 100 mM (r2=0. 969) d
'\.\ (> * Ohs. 200 mM (r=0.965)
' ~ .. 0
0 0.5 1 1.5 2 2.5 3 3.5 4
[Undissociated lactic acid] mM
Figure 4.13 Relationship of growth rate of L. monocytogenes Scott A to concentration of a) hydrogen ion and b) undissociated lactic acid. The lines fitted were obtained by linear regression (Cricket Graph3
). The regression coefficient (r2) for each lines is given in the brackets. Note that the water activities of the broths were different; 0.995 and ,..,,0.96 in the absence and presence of lactic acid respectively.
3 CA-Cricket Graph ill 1.5.2. One Computer Associates Plaz.a Islandia. NY 11788-2000 USA.
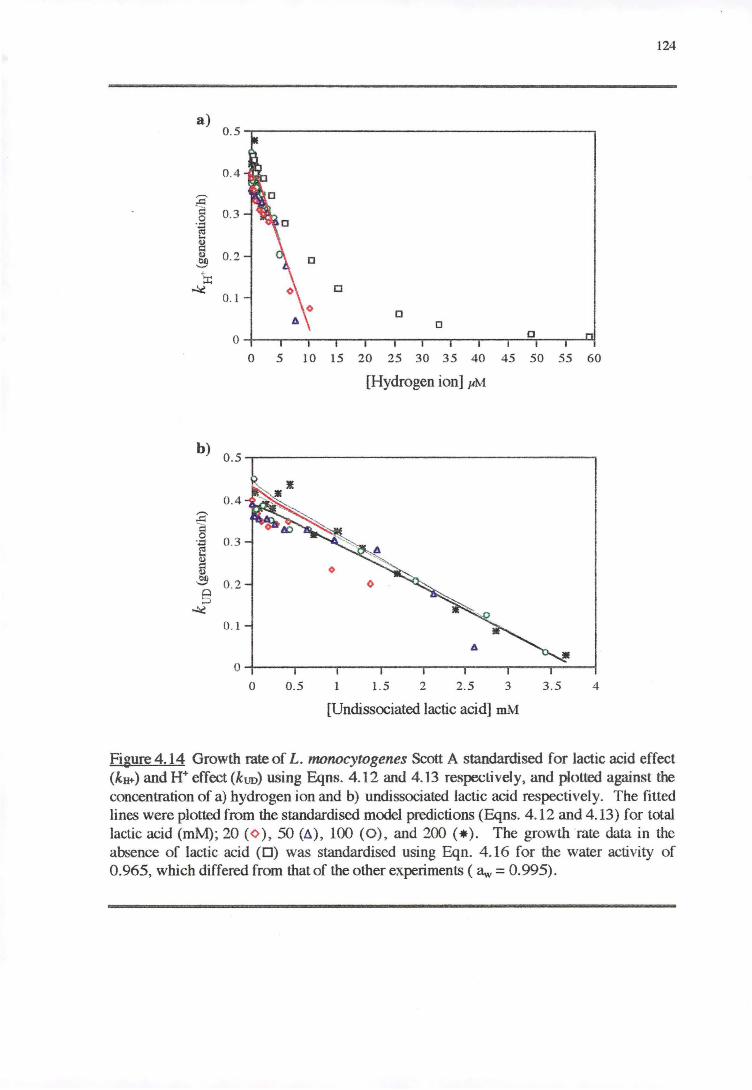
124
a) o.s.....-~~~~~~~~~~~~~~~~~~--.
0.4
~ § 0.3
·.::1
i ~
0.2
Cl 0.1
a a
0 a
0 5 10 15 20 25 30 35 40 45 50 55 60
[Hydrogen ion] 1,M
0.4
3 §
0.3 ·.::1 ctl
~ ~ §
0.2
~
0. 1
0
0 0.5 1 1.5 2 2.5 3 3.5 4
[Undissociated lactic acid] mM
Figure 4.14 Growth rate of L. 1oonocytogenes Scott A standardised for lactic acid effect (ke+) and H+ effect (kuo) using Eqns. 4.12 and 4.13 respectively, and plotted against the concentration of a) hydrogen ion and b) undissociated lactic acid respectively. The fitted lines were plotted from the standardised model predictions (Eqns. 4.12 and 4.13) for total lactic acid (mM); 20 (<> ), 50 (A), 100 (0), and 200 (•). The growth rate data in the absence of lactic acid (D) was standardised using Eqn. 4.16 for the water activity of 0.965, which differed from that of the other experiments ( aw = 0.995).
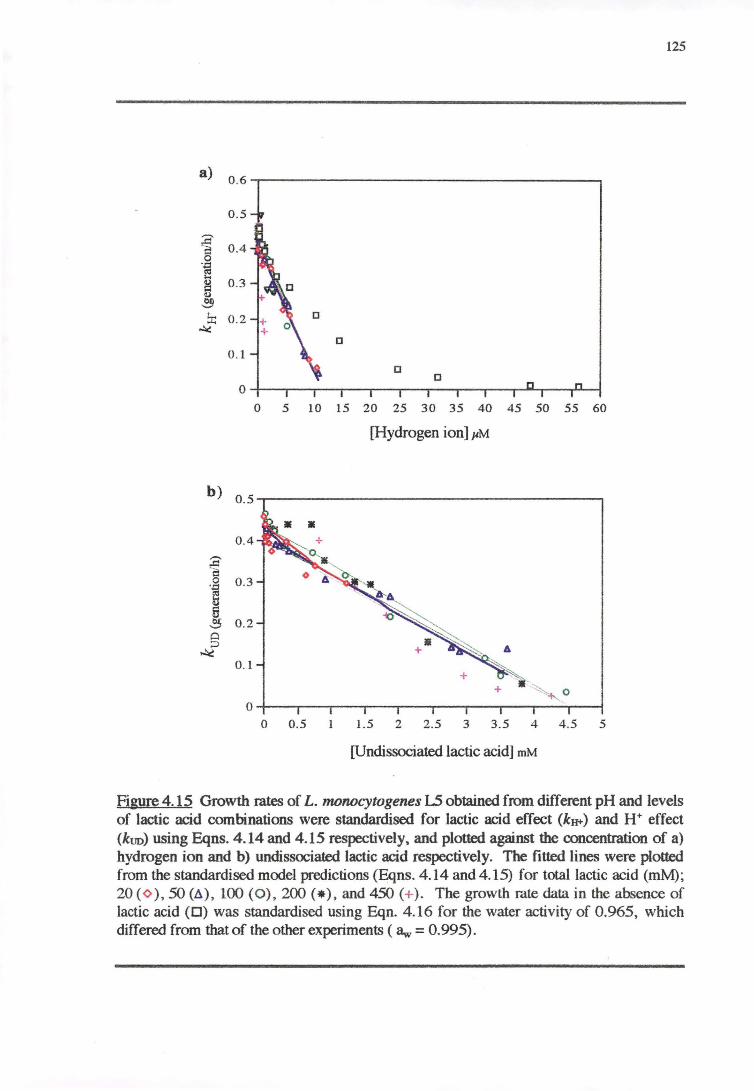
0 .5
~ 0.4 0
·~ 1 0 .3
b:: 0 . 2 ~
0.1
b) 0.5
0 .4
:a-Cl 0 0 .3 •::J
~ a ~ 0.2 0 0
-.!:C 0 . 1
0
a
a a
0 5 10 15 20 25 30 35 40 45 50 55 60
[Hydrogen ion] µM
+
0 0 .5 1.5 2 2.5 3 3.5 4 4 .5 5
[Undissociated lactic acid] mM
125
Figure 4.15 Growth rates of L. monocytogenes LS obtained from different pH and levels of lactic acid combinations were standardised for lactic acid effect (k11+) and H+ effect (kuo) using Eqns. 4.14 and 4.15 respectively. and plotted against the concentration of a) hydrogen ion and b) undissociated lactic acid respectively. The fitted lines were plotted from the standardised model predictions (Eqns. 4.14 and 4.15) for total lactic acid (mM); 20 (<> ) , 50 (.L\ ) , 100 (0) , 200 (•),and 450 (+ ). The growth rate data in the absence of lactic acid (D) was standardised using Eqn. 4.16 for the water activity of 0.965, which differed from that of the other experiments ( 3w = 0.995).
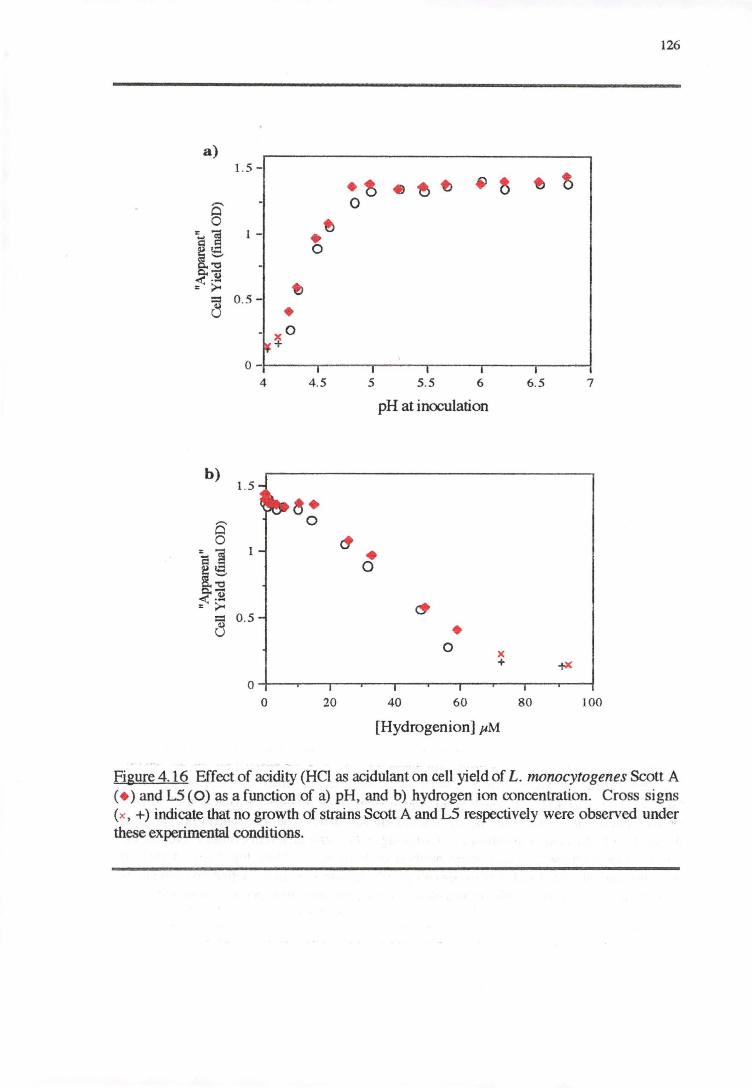
a) 1.5 -
......._ Q 0 ~
~g I - • 0
Q., "'O o.-~ -~
f) : ;::....
= 0.5 -d •
- X O f +
o-4
b) 1.5
I
4.5
~ · 0
· ~ 0
I
5
• 0
• ~ f) 6)
I I
5.5 6
pH at inoculation
• 0
~
x +
t>
I
6.5
~
7
o-+-~..---.~~~--~...---.~--....~--~~--
o 20 40 60 80 100
[Hydrogenion] µM
126
Figure 4.16 Effect of acidity (HCl as acidulant on cell yield of L. monocytogenes Scott A (• )and L5 (O) as a function of a) pH. and b) hydrogen ion concentration. Cross signs (x, +)indicate that no growth of strains Scott A and LS respectively were observed under these experimental conditions.

Figure 4.17 (facing page). Fifect oflactic acid concentration (mM); 20 (D), 50 ( 0 ), 100 (+ ), 200 (• ), and450 (<> )on cell yield of L. monocytogenes L5 as a function of a) pH, b) hydrogen ion concentration, c) undissociated lactic acid concentration, and d) dissociated lactic acid concentration. Cross signs (x) with different colours refer to the observed of no growth at each concentration of lactic acid. Note that Figs. 4.16(b-d) demonstrate only relationship between cell yield response and single active component of lactic acid. The combined effect from other components must also be taken into account.
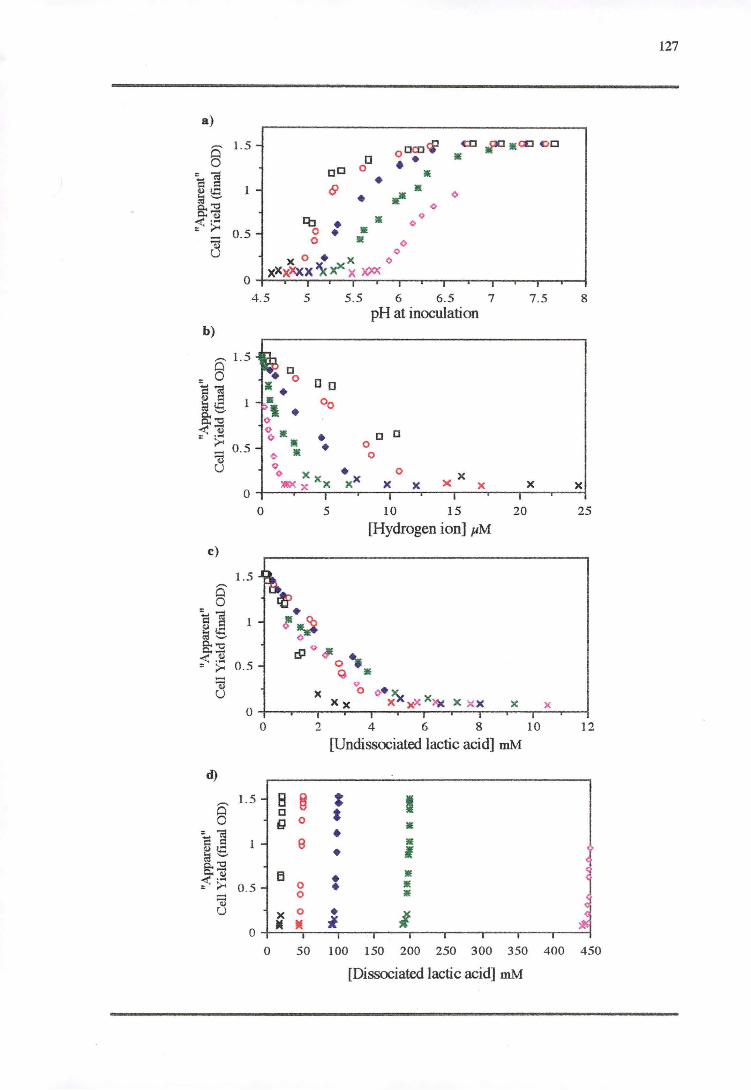
a)
,..._ 0 0
= (ij i:l = ~i.:: !ii "-' IS:~ ~~ ~ u
b)
c)
-Qj u
d)
§
...... Qj u
1. 5 -
1 -
0 .5 -
a aC 0
• •
<>
4 .5 5 5.5 6 6.5 7 7 .5 8
• a 11 ° a a • ·, • Oo ()
i · • II • <> •
Q
pH at inoculation
a a 0
0
• 0 XX X <> Xx X X X x ll'Xx x >< x 0 -t-~-.-~..--~..--~..------,.-------,.-------,.-----.----,--r.----1
1.5
1
0.5
1.5
1
0 .5
0
8 ~ a g 0
0
0 0
5 10 15 20
[Hydrogen ion] µM
2 4 6 8 10
[Undissociated lactic acid] mM
i
* • • • • • *
I • • ' • • • l
25
12
x 0 M M
o -1-~~~~----,~~____,.--.--~.--~~~r---~.----1
0 50 100 150 200 250 300 350 400 450
[Dissociated lactic acid] mM
127
128
4. 4 DISCUSSION
Mathematical models to predict the growth rate of L. monocytogenes Scott A and 1..5
when temperature, water activity, pH, and lactic acid are the controlling factors were
developed in this chapter. The models are square-root type models (McMeekin et al. ,
1993) with the incorporation of pH and organic acid terms recently introduced by Presser
et al. (1997a). The square-root models describing the effects of temperature and water
activity terms are well established in the literatures (Ratkowsky et al., 1982; McMeekin et
al., 1987; Ross and McMeekin, 1991; Ross, 1993). The novel pH and organic acid
terms were also reported to accurately describe the shape of the growth rate response of
E.coli, i.e. steeply rising from pHmin to an asymptote and exhibiting a plateau at a range
of pH near optimum (Presser et al., 1997a). This pH term has been compared, and found
to perform better, than those of previous_ square-root models (Adams et al., 1991; Wijtzes
et al., 1993) which were derived simply by substituting pH terms to the prototype form of
temperature (Ratkowsky et al., 1982) or water activity (McMeekin et al., 1987) terms in
the square-root model.
Other types of model such as polynomial models having pH and organic ~id as one of
the controlling factors have also been dev'eloped for L. mo_nocytogenes (McClure et al.,
1991; Buchanan and Golden, 1995; Buchanan etal., 1997). Although all models for pH
are empirical, polynomial models generally employ a high number of parameters and are
too complex to allow determination of the response shape from the terms given by the
equation. In addition, the use of high order polynomial's tends to generate more errors of
the measured values (Baranyi and Roberts, 1995). Lower accuracy of the model
prediction when compared to·the analogous square-root model prediction was also
pointed out by Delignette-Muller et al. (1995). Considering all these aspects, square-root
models enable an intuitive understanding of the basis of the mathematical function
describing the response to each factor. Further, they may be used to clarify the cause of
inhibition (Presser et al., 1997a) as demonstrated by the separate influence of each
component of lactic acid in this chapter (section 4.2.2.5).
A good description of growth responses by the square-root type models for L. mono-. -
cytogenes Scott A and L5 (Eqns. 4. l 7b and 4.18b respectively) demonstrated by the
simultaneous plotting of observed and predicted response indicate the appropriateness of
the models (see Figs. 4.3 and 4.4 respectively). The parameter estimates derived from
the models for the growth rate response of L. monocytogenes to temperature, water
activity, and pH were compared to the literature and are separately discussed in the
subsequent sections ( 4.4.2.1-4.4.2.3 ). The cell yield response of L. monocytogenes for
all controlling factors tested in this chapter are discussed later (section 4.4.2.4).
129
The heightened awareness of the practical limitations of the models generated have been
discussed extensively (McMeekin et al., 1993; Baranyi et al., 1996). The model
predictiqns should be generated only by interpolation, i.e. within the data range used to
generate a model. This 'interpolation region' is des-cribed by Baranyi et al. (1996) as a
'minimum convex polyhedron' which encloses all the combinations tested. A
conservative design which measures the full range of each variable at two or more values
of each other variable is required to accomplish this purpose.
The methodology of minimum experimental design proposed by Ross (1993) was
employed in this study for the development of growth models for the combined effects of
temperature-water activity-pH-lactic acid for L. monocytogenes Scott A and LS. The full
data sets cover a range of the 4 parameters (see Appendix G, Fig. Gl). Considering the
interpolation region, the models generated are, thus, subjected to the limitation of smaller
variables space. Nonetheless, the plotting of predicted and observed responses
demonstrate the appropriateness of models to be used for prediction within the data range
used to generate the models.
4. 4.1 TEMPERATURE RESPONSE
The growth response of L. monocytogenes Scott A and LS over the sub-optimum
temperatures (Figs. 4.3a and 4.4a) were consistent with the published reports (Duh and
Schaffner, 1993; Bajard et al., 1996). Under the conditions tested here, the fastest
growth of L. monocytogenes Scott A and L5 were found to be 33.6 and 36.6 minutes at
3S.8°C and 36.2°C respectively. The values are consistent with the report by Ross
(1993) of 33.6 and 34.8 minutes at3S.6 °C and 37.2 °C for strains Scott A and Murray B
respectively.
In laboratory media broth, L. monocytogenes was reported to exhibit growth at _tempe~
tures of -2°C and 0°C (Bajard et al., 1996). A range of minimum temperature for growth
from -0.4 to -0.1°C and O.S°C was observed by Walker et al. {1990). Other reports of
the minimum growth temperature for L. monocytogenes range from 0.5°C to 3.0°C
{Junttila et al;, 1988), l.84°C (Duh and Schaffner, 1993), >2°C (Gill et al., 1997), and
3.3 °C (Wilkins et al., 1972) in various media broth.
The estimates of the notional minimum temperature (T miiJ were reported to range from -
2.SS to -l.7S°C (Wijtzes et al., 1993), -2.2 to -2.4°C (Grau and Vanderlinde, 1993), -
1.16 to -O. l6°C (Duh and Schaffner, 1993), and l.2°C (Gill et al., 1997).
In this study, the minimum temperature for growth of 3°C and the estimated T min derived
for L. monocytogenes Scott A and LS (Tables 4.4 and 4.5) are higher than some of the
130
literature values cited above. The reason for the relatively high estimates is unknown.
This discrepancy may affect the performance of the models when applied to independent
data sets for L. monocytogenes, especially when the reported temperature is close to 3°C
which is the observed lowest temperature. The inferior performance of a model when I
extrapolated beyond the range of data used for model generation is recognised (Ross,
1993; Baranyi et al., 1996). An attempt to obtain additional growth data of L. mono
cytogenes at lower temperatures was made but resulted in a similar minimum temperature
for growth of 3°C (J. Kettlewell, unpublished). A method of growing the inoculum at
low temperature, used by Walker et al. (1990), may help lower this minimum growth
temperature and consequently produce a lower value of T min· [
The other possible reason for the "high" estimate was recently suggested by Bajard et al.
(1996). Those authors indicated an unexpected behaviour of L. monocytogenes that its
growth at sub-optimum temperature did not obey the square-root model, i.e. that a
straight line is obtained when the square-root of growth rate is plotted against sup
optimum temperature. The authors described a change in slope of the square-root plot
caused by a faster growth of L. monocytogenes than expected at the temperature :S:l5°C.
Thus, those authors proposed two straight lines to be fitted to the square-root plot which
gave a lowerTmin of -5°C instead of 4°C. The suitability of the square-root type model to
predict-growth responses of L. monocytogenes is also questioned by other researcher (T.
Ross, pers. comm.). However, the good fit of the square-root models to the observed
data evident in Figs. 4.3 and 4.4 indicates that the models is sufficient to describe the
kinetic behaviour of L. monocytogenes to within the ranges tested of the respective
environmental factors.
The models predictions, especially at the highest temperature tested in this study (-36°C),
were found to be improved when T max term was included. Apart from this, a relatively
similar performance of the models, with or without T max, was observed. Therefore, the
inconsistent estimates of _T max compared with literature reports (-46°C) are not anticipated
to affect the model performance when applied to foods in the interpolation region, i.e.
temperature up to 36°C.
4. 4. 2 WATER ACTIVITY RESPONSE
Several researchers (Tapia de Daza et al., 1991; Nolan et al., 1992) reported the value of
minimum water activity (NaCl a~ the humectant) for growth of L. monocytogenes to be
0.92 or 0.91-0.93 by Farber et al. (1992). The estimates of the notional minimum water
activity (awmiJ was 0.912-0.916 (Wijtzes et al., 1993), and 0.92-0.93 (Ross, 1993).
131 .
In this study, the minimum water activity for growth of L. monocytogenes Scott A and
LS were found to be 0.929 and 0.936 respectively (Figs. 4.3b and 4.4b) which were the
lowest aw used in the experiments. The awmin of 0.923-0.927 (Tables 4.4 and 4.5)
obtained here are generally consistent with the above literature values.
Similar growth responses of L. monocytogenes to water activity were reported by Ross
(1993). It should be noted that the growth rate data for the effect of water activity were
used directly in the model generation and fitted without standardisation for the pH
differences in each set of the experiments. Despite a slight variation in pH in each block
of experiments, a proIJ?rtiona~ decrease in growth rate with the lowered pH in relation to
lower water activity can be observed (Figs. 4.3b and 4.4b). The inclusion of 50 mM
lactic acid to the broth cultures enhanced the growth inhibitory effect at pH :::::5.4 (Fig.
4.6c) but the effect could not be discerned at pH :::::5.-7 and :::::6.1 (Figs. 4.6a,b). This is
because at pH 5.7 and 6.1, there is very little [UD]. At pH 5.4, the [UD] becomes
relatively large in comparison to Umin and produces a measurable growth rate reduction
(Table 4. 7).
Table 4. 7 Comparison of the amount of undissociated lactic acid in the broth cultures at different pH with the presence of 50 mM lactic acid.
pH of broth cultures with 50 mM lactic acid
5.4
5.7 6.1
undissociated lactic acid (mM)
1.4
0.7 0.3
The increase in th_e proportional reduction in growth rate, especially at water activity levels
approaching the limit (Fig. 4.7), suggests there is an interaction, in a synergistic manner
(Gould and Jones, 1989), between the low pH and osmotic stress. This finding is
contrary to the report of Cole etal. (1990) who suggested, on the basis of the form of the
polynomial model used in that study, the effect between salt concentration and [H+] was
completely additive and not synergistic or interactive. However, a synergistic effect may
be found in the responses they reported, e.g. at [H+] of 0.1 µmol/L growth occurred at all
levels of 0 to 10%NaCl, but became slower to be detected with the increasing [H+], and
was completely inhibited at 10%NaCl when [H+] ?:.7.3 µmol/L (Fig. 3 in Cole et al.,
1990).
The synergistic effect between water activity and [H+] in growth rate reduction reported
here was more pronounced when lactic acid was the acidulant (Fig. 4.7). A similar
explanation may apply to this observation in that the undissociated lactic acid has a
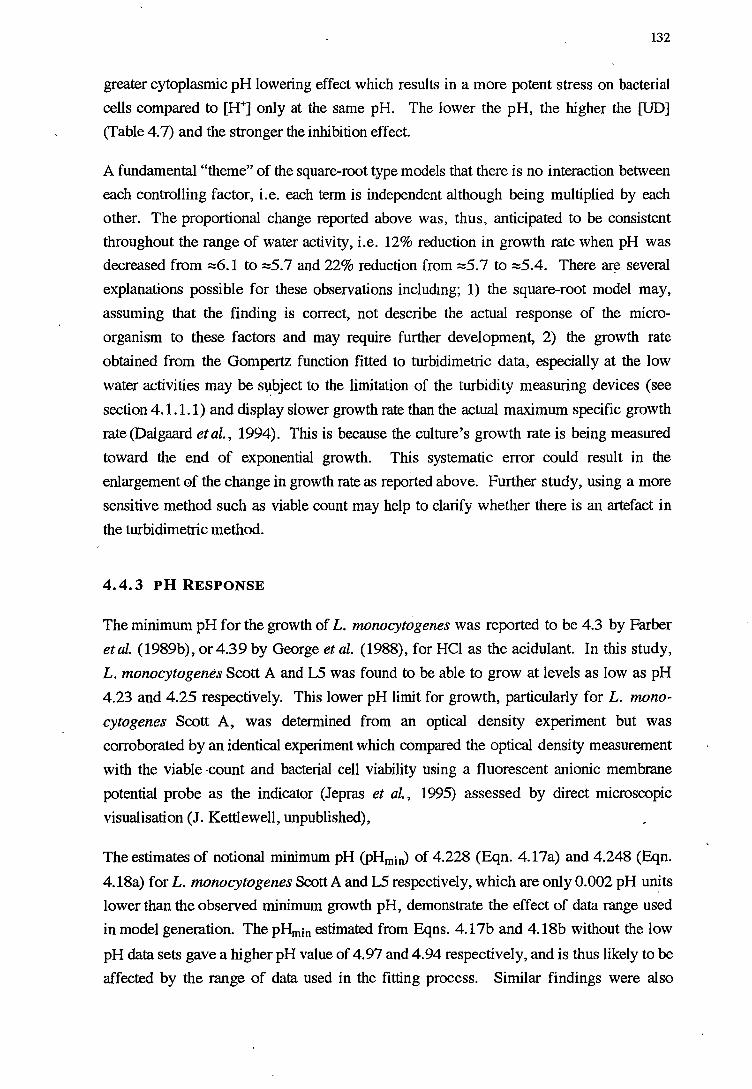
132
greater cytoplasmic pH lowering effect which results in a more potent stress on bacterial
cells compared to [H+] only at the same pH. The lower the pH, the higher the [UD]
(Table 4.7) and the stronger the inhibition effect.
A fundamental "theme" of the square-root type models that there is no interaction between
each controlling factor, i.e. each term is independent although being multiplied by each
other. The proportional change reported above was, thus, anticipated to be consistent
throughout the range of water activity, i.e. 12% reduction in growth rate when pH was
decreased from ::::6.1 to ::::5.7 and 22% reduction from ::::5.7 to ::::5.4. There ar~ several
explanations possible for these observations includmg; 1) the square-root model may,
assuming that the finding is correct, not describe the actual response of the micro
organism to these factors and may require further development, 2) the growth rate
obtained from the Gompertz function fitted to turbidimetric data, especially at the low
water activities may be s~bject to the limitation of the turbidity measuring devices (see
section 4.1.1.1) and display slower growth rate than the actual maximum specific growth
rate(Dalgaard etal., 1994). This is because the culture's growth rate is being measured
toward the end of exponential growth. This systematic error could result in the
enlargement of the change in growth rate as reported above. Further study, using a more
sensitive method such as viable count may help to clarify whether there is an artefact in
the turbidimetric method.
4.4.3 PH RESPONSE
The minimum pH for the growth of L. monocytogenes was reported to be 4.3 by Farber
et al. (1989b), or4.39 by George et al. (1988), for HCl as the acidulant. In this study,
L. monocytogenes Scott A and L5 was found to be able to grow at levels as low as pH
4.23 and 4.25 respectively. This lower pH limit for growth, particularly for L. mono
cytogenes Scott A, was determined from an optical density experiment but was
corroborated by an identical experiment which compared the optical density measurement
with the viable -count and bacterial cell viability using a fluorescent anionic membrane
potential probe as the indicator (Jepras et al., 1995) assessed by direct microscopic
visualisation (J. Kettlewell, unpublished),
The estimates of notional minimum pH (pHmiJ of 4.228 (Eqn. 4.17a) and 4.248 (Eqn.
4.18a) for L. monocytogenes Scott A and LS respectively, which are only 0.002 pH un~ts
lower than the observed minimum growth pH, demonstrate the effect of data range used
in model generation. The pHmin estimated from Eqns. 4.17b and 4.18b without the low
pH data sets gave a higher pH value of 4.97 and 4.94 respectively, and is thus likely to be
affected by the range of data used in the fitting process. Similar findings were also
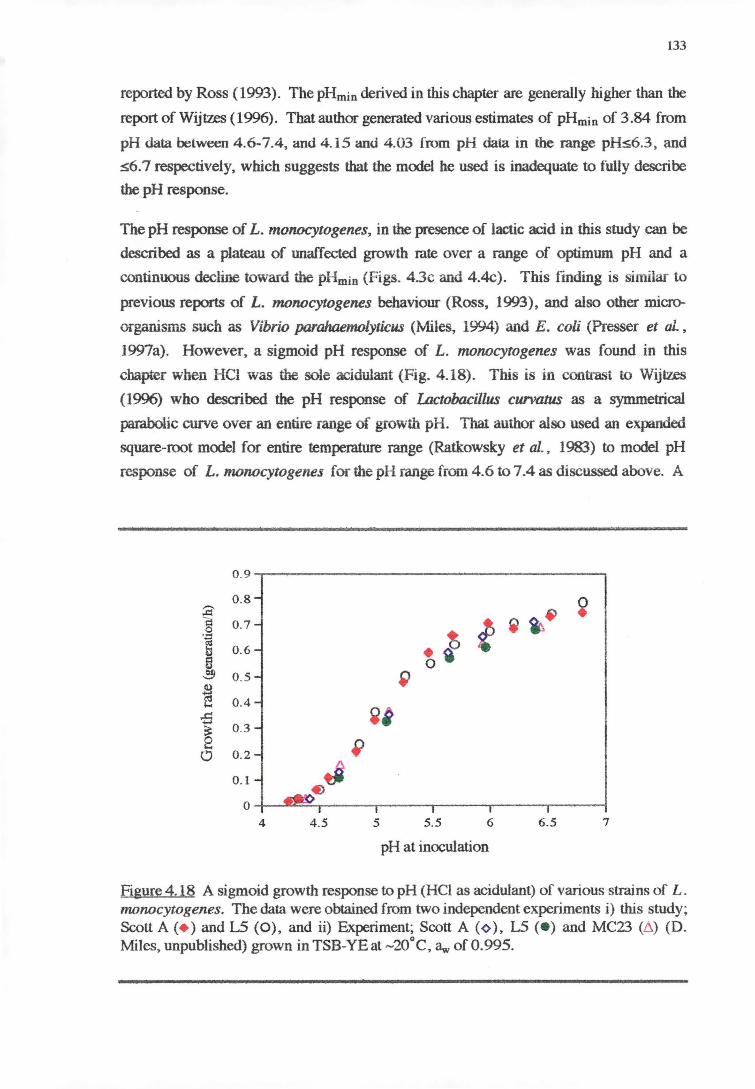
133
reported by Ross (1993). The pHmin derived in this chapter are generally higher than the
report of Wijtzes (1996). That author generated various estimates of pHmin of 3.84 from
pH data between 4. 6-7.4, and 4.15 and 4. 03 from pH data in the range pH:s6.3, and
s.6.7 respectively, which suggests that the model he used is inadequate to fully describe
the pH response.
The pH response of L. monocytogenes, in the presence of lactic acid in this study can be
deocribed as a plateau of unaffected growth rate over a range of optimum pH and a
continuous decline toward the pHmio (Figs. 4.3c and 4.4c). This finding is similar to
previous reports of L. monocytogenes behaviour (Ross, 1993), and also other micro
organisms such as Vibrio parahaemolyticus (Miles, 1994) and E. coli (Presser et al.,
1997a). However, a sigmoid pH response of L. monocytogenes was found in this
chapter when HCI was the sole acidulant (Fig. 4.18). This is in contrast to Wijtzes
(1996) who described the pH response of l.actobacillus curvatus as a symmetrical
parabolic curve over an entire range of growth pH. That author also used an expanded
square-root model for entire temperature range (Ratkowsky et al., 1983) to model pH
response of L. monocytogenes for the pH range from 4.6 to 7.4 as discussed above. A
0 .9
0.8 ~ :a i ~., ~ 0.7 l 0
• f •;j
b 0.6 e 0 ~ 0.5 ~ ! 0.4 ...c:: ~~ .....
0.3 ~ i... ~ 0 0.2
0.1 .,.# 0
4 4.5 5 5.5 6 6.5 7
pH at inoculation
Figure 4.18 A sigmoid growth response to pH (HCl as acidulant) of various strains of L. monocytogenes. The data were obtained from two independent experiments i) this study; Scott A(+ ) and I.5 (O), and ii) Experiment; Scott A(<> ). L5 (• )and MC23 (L\) (D. Miles, unpublished) grown in TSB-YEat -20°C, aw of 0.995.
134
similar, sigmoid, pH-growth rate response, with HCl as the acidulant, is evident in the
data of Petran and Zottola (1989) (not shown). In addition, an independent experiment in
this laboratory using L. monocytogenes Scott A, and L5 and strain MC23 also exhibited a
similar sigmoid response (Fig. 4.18) (D. Miles, unpublished). Thus, this sigmoid
response of L. monocytogenes to pH in the absence of lactic acid requires further
investigation in order to understand the actual underlying response and to be able to
develop a kinetic model which accurately describes all pH responses.
An inherent problem of modelling pH is that it changes over the period of bacterial growth
as shown in Fig. 4.10. The ability of the organism to maintain pH homeostasis within
the limit suitable for growth or survival is well documented (Booth, 1985; Eklund, 1989;
Montville, 1997). In the broth cultures at the optimum pH range, a decrease in pH of -1
pH unit by the end of the growth of L. monocytogenes was recorded. In more
constrained conditions, i.e. lower pH1; a smaller change in pH to a somewhat constant
levels of pHr at a range of pH1 (Fig. 4.12) was observed. These pHr values were
anticipated not to be below the minimum pH1 that L. monocytogenes can initiate growth
for each lactic acid concentration. However, slightly lower values of pHr were found at
all levels of lactic acid. A possible explanation is that the growth of the organism had
already ceased at the pH close to its minimum pH prior to the measured pHr, but that cells
were still metabolically active (Brown and Booth, 1991) and reduced the pH to lower than
the pH limits for growth appropriate to that concentration of lactic acid (Fig. 4.12).
Organic acids are generally more inhibitory to micro-organisms than inorganic acids due
to their lipophilic nature (Gould, 1989). In this study, in the presence of even low
concentration of lactic acid, e.g. 20 mM, L. monocytogenes was unable to grow to the
minimum pH for growth (pH 4.23) in the absence of lactic acid, i.e. the limiting pH for
growth of L. monocytogenes increased as a function of lactic acid concentration. Similar
, findings for L. monocytogenes. have been noted before (Ahamad and Marth, 1989;
Sorrells et al., 1989; Conner et al., 1990). Increasing inhibition due to pH as the lactic
acid concentration increases was also reported for E. coli (Presser, 1995). In the
presence of 200 mM lactic acid, the pH value for complete growth inhibition at -20°C
was 5.46 which is consistent with the finding by Ross (1993). In other studies where
lactic acid was the acidulant (Ahamad and Marth, 1989; Sorrells et al. , 1989), insufficient
information regarding the pH or the total concentration of lactic acid employed was given
to enable comparison with those reports.
Weak organic acid, in aqueous solution, dissociates corresponding to its pKa (Corlett and
Brown, 1980; Gould, 1989). The effectiveness of weak acid is, therefore, assumed to be
proportional to the concentrations of each components present which are strongly pH
dependent. Several reports suggest that growth inhibition is not prii;narily due to
135
hydrogen ions but to the concentration of undissociated molecule (Baird-Parker, 1980;
Ahamad and Marth, 1989). The dissociated molecule, however, was reported to be a far
less effective inhibitor, i.e. 10-600 times less inhibitory than the undissociated acid
(Eklund, 1983), so thaJ, in this study, it was considered to have a measurable effect only
when a very large amount (450 mM) was applied to L. monocytogenes LS.
The data reported here have shown that both [H+] and [UD] have inhibitory effects on the
growth rate of L. monocytogenes and the effe~ts of both are linear (Fig. 4.13). The
amount of eac1:1 component required to exhibit equal growth rate inhibition varied in
according to the concentration of lactic acid and pH. This is as predicted by the model,
but is contrary to the finding of Presser et al. (1997a) who reported that the inhibition of
growth rate of E. coli was equal for equal for equal undissociated lactic acid concentra
tion, regardless of pH or lactic acid concentration (0 to 100 mM).
The reduced growth rate in relation to [H+] or [UD] shown in Figs. 4.13 should not be
misinterpreted to be the effect from single component only. The growth rate was affected
by several variables (see Eqn. 4.7) of which temperature and ciw are considered to be
almost constant in these experiments. The calculated growth rate for each concentration
of lactic acid varied according to the pH, and [UD]. This indicates the need to be able to
understand the underlying influence of each component of lactic acid. -
The advantages of the square-root type model, especially its modular form, enabled a
separate calculation for the growth inhibition effect caused by each component of lactic
acid, either kH+ (growth rate standardised for- lactic acid effect) or kun (growth rate
standardised for [H+] effect) to be clarified. In this way, the combination effect on the
growth rate inhibition contributed by each of the components of lactic acid can be
perceived more clearly (Figs. 4.14 and 4.15). For example, the minimum pH1 for growth
of L. monocytogenes Scott A increased to 5.12 when 50 mM lactic acid was added. Thus
7 .6 µM of hydrogen ions or 2.6 mM of undissociated lactic acid exhibited an equal
inhibitory effect on growth rate of L. monocytogenes as kH+:kun equal to 0.049: 0.046
(1: 1) generation/h respectively (Figs. 4.14a,b). Increasing the concentration of lactic acid
appeared to increase the ratio of the inhibition effect caused by [UD] at the lower extremes
pH1 for growth, e.g. for strain Scott A kH+:kun in the brot~ with 100 and 200 mM lactic
acid were 0.2:0.036 (1:5.6) and 0.29:0.029 (1:10) respectively. This emphasizes the
dominant effect of the undissociated lactic acid in relation to the inhibition due to lactic
acid. The models (also being standardised) satisfactorily predicted the apparent linear
relationship between these standardised growth rates and the [H+] and [UD]. Extrapola
tion of this relationship generates the values for complete growth inhibition which
suggested that strain LS (4.6 mM) was slightly more tolerant of lactic acid than Scott A
136
(3.8 mM). This may be related to the origin of the strain L5 (cold-smoked salmon) which
has been reported to naturally contain up to 100 mM of lactic acid; (Dalgaard and
JSZirgensen, 1998).
The standardised growth rate at 450 mM lactic acid shows a slower growth rate than
predicted, especially for [H+], where only small amount of [H+] exhibited great influence
on growth rate (Fig. 4.15). A similar anomaly was reported by Presser et al. (1997a)
who suggested there may be a synergistic or additional inhibitory effect occurring under
conditions of very high lactic acid concentration.
The growth rate inhibition related to [H+] in the absence of lactic acid observed in this
study indicates a non-linear relationship which is different from that due to lactic acid
(Fig. 4.13a). Standardisation for the differences in water activity between each block of
experiments in the absence or presence of lactic acid have been made (Figs. 4.14a and
4.15a) but did not help explaining this non-linear response. This finding is inconsistent
with the linear response previously reported (Buchanan et al., 1993; Presser et al.,
1997a). Again, this suggests a need for further investigation to resolve these differences.
4.4.4 CELL YIELD-GROWTH RATE RESPONSE OF L. MONOCYTOGENES TO
THE ENVIRONMENT AL FACTORS
A comprehensive study of cell yield in L. monocytogenes was not attemp~ed in this
chapter but an understanding of the mechanisms underlying these responses may be
advantageous, in particular for the growth or no growth response experiments described
in Chapter 5. Thus, it is useful to reiterate that 'cell yield' used here is only a general
observation of the increase in OD of broth cultures as a function of environmental factors.
The limitation of the turbidity measuring device is recognized (McMeekin et al., 1993).
However, modification of the observed "apparent" yield using a correction function
(Dalgaard et al., 1994) (Fig. 4.9) demonstrated similar trends to the "apparent" yields
(Figs. 4.8b,c). Furthermore, the lack of effect on "apparent'' _cell yield over a range of
sup-optimum temperature (Fig. 4.5) is also identical to a specific study of cell yield of L.
monocytogenes Scott A as shown in Fig. 4.19 (J. Kettlewell, unpublished). The
"apparent" yield reported here was also compared to the cell yield study of E. coli (Krist,
1997). A similar response, i.e. a constant yield over a range of temperature (Fig. 4.5)
and water activity (Fig. 4.8a), and a continuous drop of yield a.S the effect of pH (Fig.
4.16) were found. Therefore, the information obtained from cell yield responses reported
here is comparable and appropriate to consider.
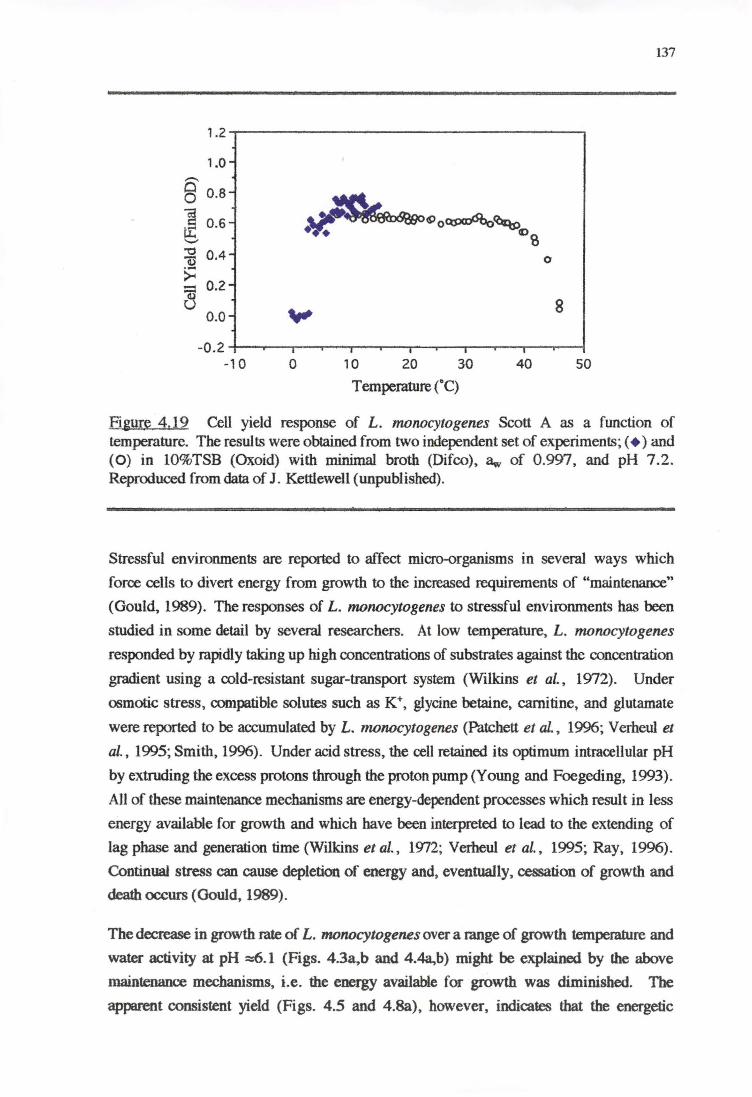
137
1.0--8 0.8-~ tf 0.6--~ 0.4- 0
8
~ - 0.2-e .
0.0-
-0.2-----~~.~----.~----.,--~~.~-----.~----_, 0 0 1 0 20 30 40 50
Temperature ("C)
Figun; 4.19 Cell yield response of L. monocytogenes Scott A as a function of temperature. The results were obtained from two independent set of experiments; ( + ) and (0) in 10%TSB (Oxoid) with minimal broth (Difeo), av,, of 0.997, and pH 7.2. Reproduced from data of J. Kettlewell (unpublished).
Stressful environments are reported to affect micro-organisms in several ways which
force cells to divert energy from growth to the increased requirements of "maintenance"
(Gould, 1989). The responses of L. monocytogenes to stressful environments has been
studied in some detail by several researchers. At low temperature, L. monocytogenes
responded by rapidly taking up high concentrations of substrates against the concentration
gradient using a cold-resistant sugar-transport system (Wilkins et al., 1972). Under
osmotic stress, compatible solutes such as K+, glycine betaine, camitine, and glutamate
were reported to be accumulated by L. monocytogenes (Patchett et al. , 1996; Verheul et
al., 1995; Smith, 1996). Under acid stress, the cell retained its optimum intracellular pH
by extruding the excess protons through the proton pump (Young and Foegeding, 1993).
All of these maintenance mechanisms are energy-dependent processes which result in less
energy available for growth and which have been interpreted to lead to the extending of
lag phase and generation time (Wilkins et al. , 1972; Verheul et al., 1995; Ray, 1996).
Continual stress can cause depletion of energy and. eventually, ~tion of growth and
death occurs (Gould, 1989).
The decrease in growth rate of L. monocytogenes over a range of growth temperab.lre and
water activity at pH ::::6.1 (Figs. 4 .3a,b and 4.4a.,b) might be explained by the above
maintenance mechanisms, i.e. the energy available for growth was diminished. The
apparent consistent yield (Figs. 4 .5 and 4.8a}, however, indicates that the energetic
138
efficiency of growth (biosynthesis) was unaffected by both factors although it occurred at
a slower rate. A study by Wilkins et al. (1972) also indicated a slow uptake and
incorporation of L-leucine in protein synthesis as a result of low temperature. Similar
findings were reported by ter Steeg _et al. (1995) for L. innocua and Krist (1997) for E.
coli. The changes in growth rate and cell yield, as the responses to temperature or water
activity, were suggested by Krist (1997) to be non-coupled mechanisms, i.e. change in
one does not of necessity relate to the change of the other. That author also indicated
there were critical values at the temperature or water activity close to their respective limits
to growth, where a rapid decline in cell yield was observed (Krist, 1997). The critical
values concept also applies to L. monocytogenes as was confirmed by J. Kettlewell
(unpublished) who observed a sharp drop in cell yields at temperatures b~low 3°C and a
more gradual drop above -37°C (Fig. 4.19).
Unlike the effect of temperature or water activity, increasing acidity not only reduced
growth rate (Figs. 4.3c and 4.4c) but also cell yield (Fig. 4.15). The increasing energy
demand for maintenance functions within the cell under acid stress, when HCl was the
only acidulant, is shown by the linear decline in yield of L. monocytogenes with
increasing hydrogen ion concentration. The str01.~g yield-reducing effect of pH on L.
innocua has been reported (ter Steeg et al., 1995). Reduced yield of. acid stressed E. coli
was also found by Krist (1997). In the presence of lactic acid, the yield response of L.
monocytogenes was found to be related to the combined effect of hydrogen ions and
undissociated acid while the dissociated acid did not appear to exert any effect on yield I
(Fig. 4.16).
A similar trend of rapid decline in yield at the edge of the optimum pH range, when
plotted against pH, was found in both absence or presence of lactic acid. A parallel
change in yield with the growth rate (Figs. 4.4c and 4.16a) was also observed in the
cultures with lactic acid present. However, the sigmoid response of growth rate when
HCl was the sole acidulant, as discussed previously, did not parallel with the reduced
yield (Figs. 4.2 and 4.15). These observaitions may imply a specific effect of
undissociated acid from the hydrogen ion on pH homeostatic disturbance.
In Fig. 4.8 or 4.19, the reduced yield, at the lower pH ~5.7 and ~5.4, especially when
approaching the water activity limit may be explained by the combined effect of increasing
acidity and osmotic stress on bacterial cells. This was also enhanced by the addition of
lactic acid of which the greatest effect was found at pH ~5.4 where the concentration of )
undissociated acid is highest (Table 4. 7). The trends of these changes in cell yield were
analogous with the proportional changes in growth rate (Fig. 4.7) which may imply that
there exists a very close relationship between these properties, and perhaps the reliability
of turbidity-based growth rate measurements under severely growth rate limiting
139
conditions, i.e. reduced yield is likely to cause the turbidimetric growth rate
measurements to be made later in the exponential phase when the growth rate is much
slower than the maximum specific growth rate. To reiterate, further study with a specific
design to verify these responses, is required.
4. 4. 5 INTER· STRAIN VARIABILITY
In this study, 2 strains of L. monocytogenes were used for the purpose of; investigating
the responses to the controlling factors of~ pathogenic straii:i, Scott A, which is known to
be able to grow in foods, inparticular cheese, and cause outbreaks. Also this strain is
generally been employing by several researchers, thus, for a comparison of the studies.,
The responses of a strain originated from cold-smoked salmon, L5, although has never
been associated with any outbreaks is also of interest to investigate whether there is any or
substantial different in the responses in relation to its origin. Also, if possible, a strategy
to inactivate this type strain may be found.
The overall responses of both strains to temperature, water activity, and pH (HCl was the
acidulant) were generally similar. In the presence of lactic acid of 50 and 100 mM,
however, the strain L5 was able to grow to a somewhat lower pH (-0.1 pH unit) than
strain Scott A. This resulted in a higher undissociated lactic acid concentration of ,.., 1 mM
(see Appendix G, Tables G.1 and G.3), and a higher estimate of parameter Umin (r-0.8
mM) for strain L5. Apart from this small difference, the similarity between the estimates
of the parameter~ T min, awmin, and pHmin for both strains were obtained which suggests
that a single model may be sufficient for this species for a given temperature, humectant,
and acidulant
140
5 GROWTH LIMITS OF LISTERIA MONOCYTOGENES
5.1 INTRODUCTION
The application of predictive microbiology provides insight concerning the responses of
micro-organisms to their environment. The kinetic behaviour of L. monocytogenes was
described in CHapter 4. While the infective dose of the potentially fatal foodborne
pathogen L. monocytogenes is still unknown, an understanding of how to prevent its
growth or, preferably, eliminate it from foods is more of interest. Another approach of
predictive microbiology, a probabilistic sttJ.dy, can be applied to gain information about
the combination of conditions that prevent growth of L. monocytogenes. The
probabilistic study gathers qualitative data, i.e .. growth or no growth, generating a
'probability model' and defining the boundary between conditions which permit growth
and those which do not.
The data employed in an earlier probability model were time-limited kinetic data
(Ratkowsky and Ross, 1995). Genuine growth and no growth data, i.e. with a sufficient
time allowed for any possible growth to occur, were employed in the study of Presser et
al. (in press). The probability model was initially generated using a logistic regression
method in which the parameter estimates, e.g. T min, awmin, pHmin, and Umin were fixed
constants with the values obtained from kinetic modelling studies (Presser, 1995;
Ratkowsky and Ross, 1995; Presser et al., in press). The development of the method to
a generalised non-linear (NLIN) regression was recently proposed (Presser et al. ,
1997b). This method enables the parameters to be estimated from the observed data.
The concept of using several constraints, including lactic acid, was described in Chapter 4
(section 4.1) and is continued in this chapter. The limits to growth of L. monocytogenes
Scott A and LS were examined over a range of pH, sub-optimum temperature and water
activity, and lactic acid concentrations. The data sets were combined with the kinetic data
in Chapter 4 and probability models, using the NLIN procedure, were generated. The
model will enable one to predict the effects of single, or combinations of, controlling
factors that can inactivate or prevent growth of L. monocytogenes.
141
5.2 MATERIALS AND METHODS
5. 2. 1 MATERIALS
Details of consumables, reagents and media, and equipment used are presented m
Appendix A.
5. 2. 2 METHODS
5.2.2.1 Inoculationprocedures
L. monocytogenes Scott A or LS inoculum W3:S prepared as described in 4.2.2.1. The
optical density of the culture at 540 nm was measured and adjusted with fresh media to
give an absorbance of 0.8. This density was observed in the previous growth study
(section 4.2.2.1) to correspond to bacterial cells in the late exponential phase of growth.
The inoculum was occasionally kept in an ice, bath (4°C) to stabilise the concentration of
the inoculum during the inoculation of the multiwell plates.
Under aseptic conditions, 100 µl of inoculum 'Yas added into each 50 ml TSB-YE, mixed
well and pH immediately measured. An Electronic Digital Pipette was used to facilitate
dispensing two ml of each broth into 4 wells of each of 4 24-well plates (4x6 wells).
Two wells were prepared for negative, (sterile TSB-YE, pH 7.2) and another 2 for
,positive (TSB-YE, pH 7.2 containing 100 µl of the inoculum), controls in each well
plate. In this manner, 2 well-plates were used for each of 10 pH levels for each lactic
acid C<?ncentration and six replicates were incubated at4°C, l0°C and 20°C using constant
, temperature rooms, at 6°C and 8°C in waterbaths, and at 30°C in an incubator.
In a comparative study of the effect of water activity, pH, and lactic acid, duplicates were
prepared to be incubated at near optimal temperatures for growth yield, i.e. 20°C
(constant temperature room), and 30°C (incubator). Duplicate plates, using a standard
ised ecometric technique (Mossel et al., 1980; 1983), were prepared with the positive
control broth for each set of the experiments for each level of lactic acid to serve as an
estimate of the initial inoculum density. This standardised ecometric technique was
calibrated to viable counts. The results are presented in Appendix F.
5.2.2. 2 Assessment of growth
The well plates were examined daily. Each set of experiments was observed for up to 90
days. Growth was judged from the visible increase in turbidity of the broths. The day
on which growth was first observed was recorded. The broth then was aseptically mixed
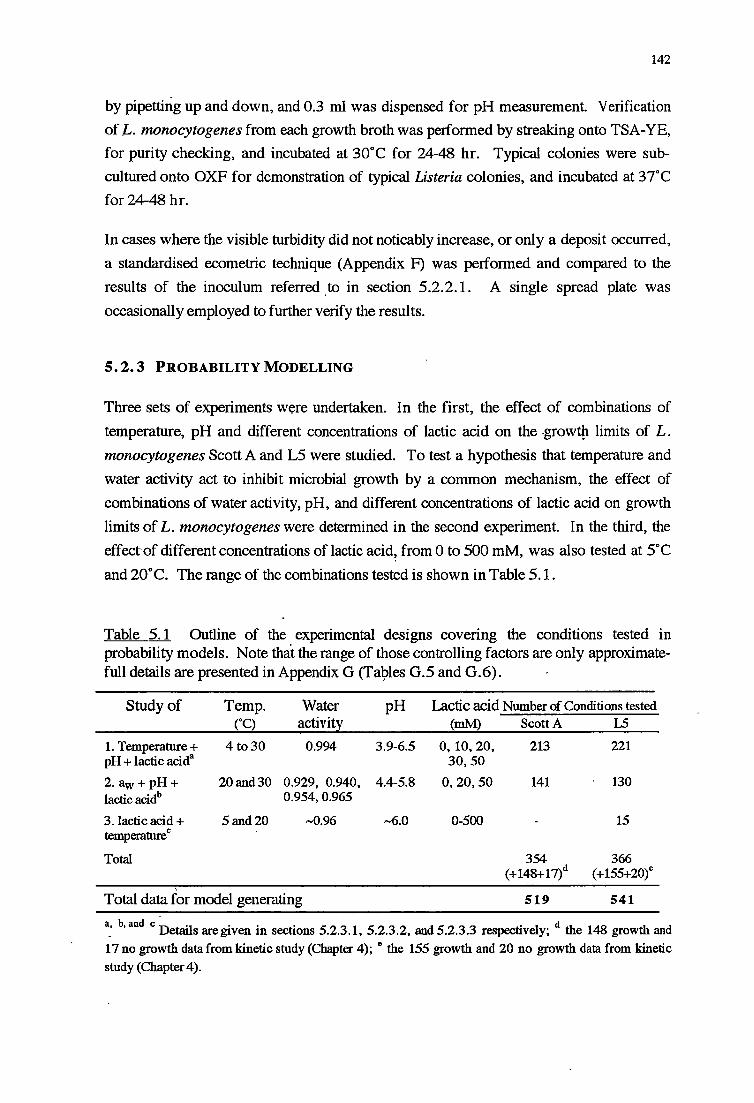
142
by pipetting up and down, and 0.3 ml was dispensed for pH measurement Verification
of L. monocytogenes from each growth broth was performed by streaking onto TSA-YE,
for purity checking, and incubated at 30°C for 24-48 hr. Typical colonies were sub
cultured onto OXF for demonstration of typical Listeria colonies, and incubated at 37°C
for 24-48 hr.
In cases where the visible turbidity did not noticably increase, or only a deposit occurred,
a standardised ecometric technique (Appendix F) was performed and compared to the
results of the inoculum referred to in section 5.2.2.1. A single spread plate was
occasionally employed to further verify the results.
5. 2. 3 PROBABILITY MODELLING
Three sets of experiments were undertaken. In the first, the effect of combinations of
temperature, pH and different concentrations of lactic acid on the growtµ limits of L.
monocytogenes Scott A and LS were studied. To test a hypothesis that temperature and
water activity act to inhibit microbial growth by a common mechanism, the effect of
combinations of water activity, pH, and different concentrations of lactic acid on growth
limits of L. monocytogenes were determined in the second experiment. In the third, the
effect of different concentrations of lactic acid, from 0 to 500 mM, was also tested at 5°C
and 20°C. The range of the combinations tested is shown in Table 5.1.
Table 5.1 Outline of the experimental designs covering the conditions tested in probability models. Note that the range of those controlling factors are only approximatefull details are presented in Appendix G (Ta9les G.5 and G.6).
Study of Temp. Water pH Lactic acid Number of Conditions tested (°C) activitl'. (mM) Scott A LS
1. Temperature+ 4to30 0.994 3.9-6.5 0, 10, 20, 213 221 pH+ lactic acida 30,50
2. aw+ pH+ 20and30 0.929, 0.940, 4.4-5.8 0,20,50 141 130 lactic acidb 0.954, 0.965
3. lactic acid+ 5and20 --0.96 -6.0 0-500 15 temperature c
Total 354 366 (+148+17)d (+155+20t
Total data for model generating 519 541
a_, b, and c Details are given in sections 5.2.3.1, 5.2.3.2, and 5.2.3.3 respectively; d the 148 growth and
17 no growth data from kinetic study (Chapter 4); e the 155 growth and 20 no growth data from kinetic study (Chapter 4).
143
It should be noted that two forms of acidulant (similar to the studies in Chapter 4), i.e.
HCl and lactic acid, were used so that the inhibitory effect due to pH or lactic acid could
be distinguished. Filter sterilised 5 M HCl or 4 N NaOH solutions were used for pH
adjustment of the media.
5.2.3.1 Determination of effect of temperature, pH and concentration of
lactic acid on growth limits
Sterile over-strength TSB-YE was prepared in a 1 L volumetric flask and made up to final
volume with sterile distilled water and filter sterilised lactic acid (88% w/w) to
concentrations of 10 mM (1.026 g/L), 20 mM (2.053 g/L), 30 mM (3.079 g/L), and 50
mM (5.118 g/L). TSB-YE with no lactic acid was also prepared in the same manner.
Each medium was aseptically dispensed to 10 screw-cap bottles and adjusted to 10
different pH levels. Broths were kept for a week at room temperature to help reveal any
contamina-tion. The methods described in sections 5.2.2.1-2 were followed.
5.2.3.2 Deter~ination of effect of water activity, pH, and concentration
of lactic acid on growth limits
The potential effect of temperature and 8w in combination with pH and different levels of
lactic acid was studied. Three levels of lactic acid, i.e. 0, 20 and 50 mM, and four levels
of water activity, 0.929, _0.940, 0.954, and 0.965 were selected. 200 ml of each
combination was prepared as described in 4.2.3 .2. The methods as outlined in sections
5.2.2.1-2 were followed.
5.2.3.3 Determination of effect of lactic acid concentrations-pH and
temperature on growth limits
In additional to the lactic acid-pH responses tested in Chapter 4, a preliminary deter
mination of the effect of different levels of lactic acid, at 5°C and 20°C, on L. mono
cytogenes L5 at conditions close to that typical of cold-smoked salmon, i.e. pH ,..,6.0 and
water activity of '""'0.96 was also studied. Sterile over-strength TSB-YE+4.5% NaCl was
prepared in a volumetric flask and made up to final volume with sterile distilled water and
filter sterilised lactic acid (88% w/w) to concentrations of 0 to 400 at 50 mM intervals,
and 500 mM for the experiment at 5°C, and from 200 to 400 at 50 mM intervals for the
experiment at 20°C. Fifty ml of the TSB-YE adjusted to each concentration of lactic acid,
at pH ,..,6.0, was dispensed into separate 250 ml side-arm flasks. Broths were kept
overnight at room temperature to help reveal any contamination. 100 µl of inoculum was
144
added into each SO ml TSB-YE as described in section S.2.2.1. The media were
incubated at S°C and 20°C in water baths shaking at -33±1 rpm. Growth was assessed
by measuring the turbidity as %T ,at 540 nm in addition to the methods described in
section S.2.2.2.
5.2.3.4 Modelgeneration
The data from the kinetic studies in Chapter 4 combined with the data from the probability
studies were used to generate "probability o~ growth" models based on Eqn. 4.8 using
SAS2 PROC NLIN. This generalised non-linear regression procedure is an advanced
form of the LOGISTIC procedure employed in earlier model development (Presser et al.,
in press). In this procedure, the parameters Tmin, awmin, pHmin, and Umin were allowed
to be estimated rather than being fixed co~stants. However, a fixed val.ue for one or more
of these parameters may sometimes be necessary to obtain a good fit (D. Ratkowsky,
pers. comm.).
For evaluation of the goodness-of-fit of the model, the parameter estimates obtained from
the PROC NLIN . procedure were used as fixed constants and processed by PROC
LOGISTIC. The area 'c' under the receiver operating characteristic (ROC) obtained from
the latter method was set as a criteria for goodness-of-fit, e.g. c > 0.9 is considered
outstanding discrimination (see details in section 2.2.4). In addition, the model
performance was assessed from the Hosmer and Lemeshow Goodness-of-Fit value
generated from the PROC LOGISTIC. A model with p>O.OS ~s considered ·satisfactory
(Lemeshow and Le Gall, 1994).
Probabilities of growth predicted by the models were compared to the observed growth or
no growth data. The growth/no growth interface at P=0.5 or 0.1, which is SO% or 10%
probability of growth was calculated using the 'Solver' routine of Microsoft Excel4•
5.3 RESULTS
The growth and no growth data for L. ·monocytogenes Scott A and LS consisted of 519
and 541 conditions of temperatures, aw, pH, and lactic acid.(Appendix G, Tables G.S and
G.6 respectively). The variables combinations tested cover the entire sub-optimum
2 SAS (Statistical Analysis System) (1997). SAS/STAT Guide for Personal Computers, Version 6.12
Edition, SAS Institute Inc., SAS Circle, Box 8000, Cary, North Carolina 27512-800, USA.
4. Microsofte Excel (1997). User Guide 2, Version 5.0, Microsoft Corporation, One Microsoft Way,
Redmond, WA 98052-6399 USA.
145
ranges for growth of L. monocytogenes and are represented diagrammatically in
Appendix G, Fig. G.2. Approximately l,S60 and 1,380 observations (numbering
between 1 and 4 replicates at each condition) were made for Scott A and LS respectively.
The parameter estimates of the probability models were initially obtained from the full
data sets (S19 and 541 conditions for Scott A af\d LS respectively). However, it was
noted that the estimates of Umin obtained by fitting Eqn. 4.8 were always very close to
the highest [UD] at which the data were available ( 16.18 and lS.19 mM for strains Scott
A and L5 respectively). Attempts were made to estimate Umin, without encountering this
problem, by removing from the full data sets the high [UD] data for no growth and which
had a very low predicted probability of growth (::;;; O.OOS). Thus, the remaining 483 and
488 conditions, respectively were employed in the .model generation for strains Scott A
and LS. The probability models presented here are the extended forms of Eqn. 4.8 for
which the coefficients and parameter estimates and their associated standard errors are
given in Table S.2. The fitted growth/no growth interface models for L. monocytogenes
Scott A and LS which will be referred to as Eqns. S.1 and S.2 respectively are as follows:
logitP = -112.176 +42.857*Ln(f+2)-39.489*Ln(aw-0.913)-146.326*Ln(l-103·65 pH)+ 6.821*
Ln(l-LAC/(5.83*(1+ 10PH-3.s6))) - 7.517*Ln(f +2)2 - 6.027*Ln(aw-0.913)2- 113.241 *
Ln(aw-0.913)*(Ln(l-103·65-pH) - 31.629*Ln(f +2)*Ln(l-103·65-pH) + 16.695*
Ln(l-LAC/(5.83* (l+lOpH-3.s6)))*Ln(l-103·65-PH) (5.1)
logit P = '-49.614 + 50.738*Ln(f +2) + l.814*Ln(aw-0.927) + 77.326*Ln(l-103·66-pH) + 19.990*
Ln(l-LAC/(5.84*(1+10PH-3.s6))) - 9.166*Ln(f +2)2 - 47.960*Ln(aw-0.927)*Ln(l-103·66-pH)
- 43.459*Ln(f +2)*Ln(l-103·66-pH) - 3.951*Ln(l-LAC/(5.84*(1+10PH-3.s6>))*Ln(f +2) (5.2)
where all the terms are as previously defined in section 4.1.1.2, Eqn. 4.8.
In the process of model development, it was found that T min had to be fixed to a constant
value to facilitate the model fitting and this also yielded a somewhat better fitting model.
The T min values of 0.88 and 0.60 obtained from the kinetic modelling for L. mono
cytogenes Scott A (Eqn.4.17b) and L5 (Eqn. 4.18b) respectively were initially used as
the constants. However, better models (smaller weighted SS) were obtained when a T min
of -2°C (representative of literature values) was used as a constant.
The T min• and the converged values for 3wmin• pHmin• and Umin for strains Scott A and
LS (Table S.2) obtained from PROC NLIN were fixed as the constants for the models
evaluation using PROC LOGISTIC, and identical values of the coefficients were found.
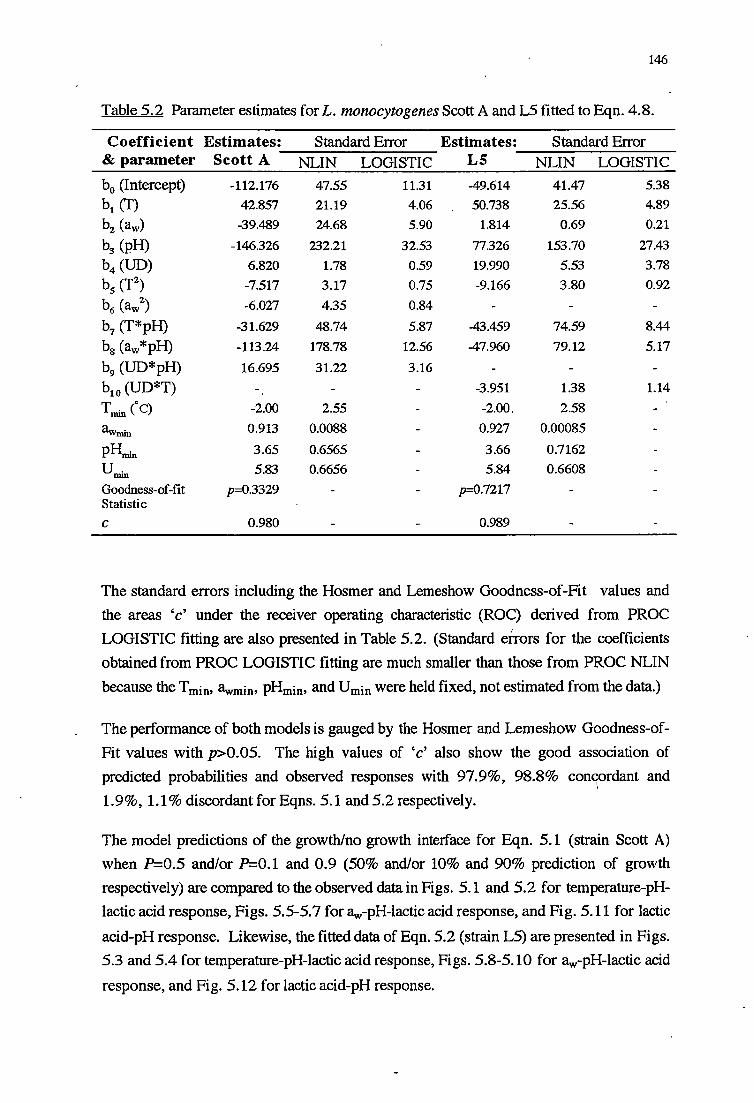
146
Table 5.2 Parameter estimates for L. monocytogenes Scott A and L5 fitted to Eqn. 4.8.
Coefficient Estimates: Standard Error Estimates: Standard Error & parameter Scott A NLIN LOGISTIC LS NLIN LOGISTIC
b0 (Intercept) -112.176 47.55 11.31 -49.614 41.47 5.38
bl (T) 42.857 21.19 4.06 50.738 25.56 4.89
b2 (aw) -39.489 24.68 5.90 1.814 0.69 0.21
b3 (pH) -146.326 232.21 32.53 77.326 153.70 27.43
b4 (UD) 6.820 1.78 0.59 19.990 5.53 3.78
hs (T2) -7.517 3.17 0.75 -9.166 3.80 0.92
b6 (aw2) -6.027 4.35 0.84
b7 (T*pH) -31.629 48.74 5.87 -43.459 74.59 8.44
b8 (aw*pH) -113.24 178.78 12.56 -47.960 79.12 5.17
b9 (UD*pH) 16.695 31.22 3.16
b10 (UD*T) -3.951 1.38 1.14
Tmin (°c) -2.00 2.55 -2.00, 2.58
awmin 0.913 0.0088 0.927 0.00085
p~ 3.65 0.6565 3.66 0.7162
Umin 5.83 0.6656 5.84 0.6608
Goodness-of-fit p=0.3329 p=0.7217 Statistic
c 0.980 0.989
The standard errors including the Hosmer and Lemeshow Goodness-of-Fit values and
the areas 'c' under the receiver operating characteristic (ROC) derived from PROC
LOGISTIC fitting are also presented in Table 5.2. (Standard errors for the coefficients
obtained from PROC LOGISTIC fitting are much smaller than those from PROC NLIN
because the T min• awmin• pHmin• and Umin were held fixed, not estimated from the data.)
The performance of both models is gauged by the Hosmer and Lemeshow Goodness-of
Fit values with p>0.05. The high values of 'c' also show the good association of
predicted probabilities and observed responses with 97.9%, 98.8% concprdant and
1.9%, 1.1% discordantforEqns. 5.1 and5.2respectively.
The model predictions of the growth/no growth interface for Eqn. 5.1 (strain Scott A)
when P=0.5 and/or P=0.1 and 0.9 (50% and/or 10% and 90% prediction of growth
respectively) are compared to the observed data in Figs. 5.1 and 5.2 for temperature-pH
lactic acid response, Figs. 5.5-5. 7 for aw-pH-lactic acid response, and Fig. 5.11 for lactic
acid-pH response. Likewise, the fitted data of Eqn. 5.2 (strain LS) are presented in Figs.
5.3 and 5.4 for temperature-pH-lactic acid response, Figs. 5.8-5.10 for aw-pH-lactic acid
response, and Fig. 5.12 for lactic acid-pH response.
147
The standardised ecometric method used for growth determination, especially at the
conditions close to the growth limits, was a reliable assessment and indicated whether the
numbers of cells in the culture had increased or decreased. For cultures at near optimum
pH in which growth was observed there was always a decrease in pH of 1-2 pH units.
At pH close to its growth limits, L. monocytogenes appeared to increase pH to neutralise
its environment. It is noteworthy that the growth that occurred at near limiting pH
appeared to achieve a lower final turbidity when compared to positive controls or cultures
grown at more moderate pH.
5.3. l TEMPERATURE-PH-LACTIC ACID RESPONSE
The anticipated pH range of the media prepared in the experiments for each concentration
of lactic acid covered the growth/no growth interface well except at 4°C where growth
occurred only in the higher pH media (Figs. 5.1 and 5.3).
The growth/no growth interfaces at P=0.5 fitted by Eqns. 5.1 and 5.2 accurately describe
the interface between conditions at which growth is, or is not, observed. Similar trends
of the temperature-pH1 effect on the growth limits were observed at all levels of lactic acid
tested for both strains. At temperatures from 10 to 30°C similar values of minimum pH1
for growth were observed, with the optimum temperature that supported pH tolerance
revealed to be -20°C. A rise of the limiting pH1 of -1 pH unit, occurred when the
incubation temperature was 4 °C. The minimum pH1 for growth at 20°C in the absence of
lactic acid were 4.36 and 4.35 (from the probability experiments) for L. monocytogenes
Scott A and L5 respectively. Note that the next lowest pH values tested at which growth
was not observed, were 4.18 and 4.23 respectively. The lowest pH which permitted
growth, obtained from the growth rate experiment without lactic acid, also demonstrated
that-20°C was the optimum temperature for growth.
At all temperatures, there was an increase in the minimum pH1 at which growt~ occurred,
related to the lactic acid concentration (Figs. 5. la and 5.3a). In the presence of 30 mM
lactic acid at 10°C and 30°C neither L. monocytogenes Scott A nor L5 behaviour was
well described by the fitted growth/no growth interface (Figs. 5. le and 5.3e
respectively). An example of the growth/no growth interface at P= 0.1 is presented in
Fig. 5.lc. The model prediction displayed a shift of the interface toward more stringent
conditions when the 10% probability of growth level was selected. A small difference of
p.f:I (0.1 pH unit) between the 50% probability of growth to 10% or 90% of growth was
noted (Figs. 5.le).
Plots of temperatures versus concentration of hydrogen ion and undissociated lactic acid
are presented in Figs. 5.2a,b and 5.4a,b for Scott A and L5 respectively. The highest

148
20. 7°C were obtained from the growth rate experiment data in Chapter 4 of 58.9 µM and
56.2 µM for Scott A and LS respectively. The combined effects of LH+] and [UD] on
growth rate in broth cultures with lactic acid were demonstrated in Chapter 4. Similar
variation was observed in this growth/no growth intetface study, in that increasin~ lactic
acid concentration resulted in an increase of the pH1 at the intetface correspondi~g to
lower [H+] and increase of [UD J. For example, at 20 mM lactic acid, the values of pH,
[H+] and [UDl predicted from model 5.1 at the intetface (P=0.5) were 4.54, 28.8 µM and
3.45 mM respectively. At 50 mM lactic acid, the predict~d inte1face (P=0.5) was at pH
4.90 which corresponds to 12.6 µM [H+] and4.17 mM [UD].
Figure 5.1 (facing page). Growth/no growth interfaces at P=0.5 for L. monocytogenes Scott A (Eqn. 5.1), showing interaction between pH and temperature in determining minimum conditions for growth at water activity of -0.993 and in the presence of 0, 10, 20, 30, and 50 mM lactic acid (a). Comparison between the observation of growth (e , 0) and no growth (x, +) from the probabilistic and kinetic experiments respectively and the predicted interface at b) 0 mM, c) 10 mM, d) 20 mM, e) 30 mM, and f) 50 mM lactic acid. Predicted g/ng interfaces at P=O. l are shown as black lines in c) and e), and at P=0.9 as a green line in e) to illustrate the abruptness of the transition from high to low probability of growth.
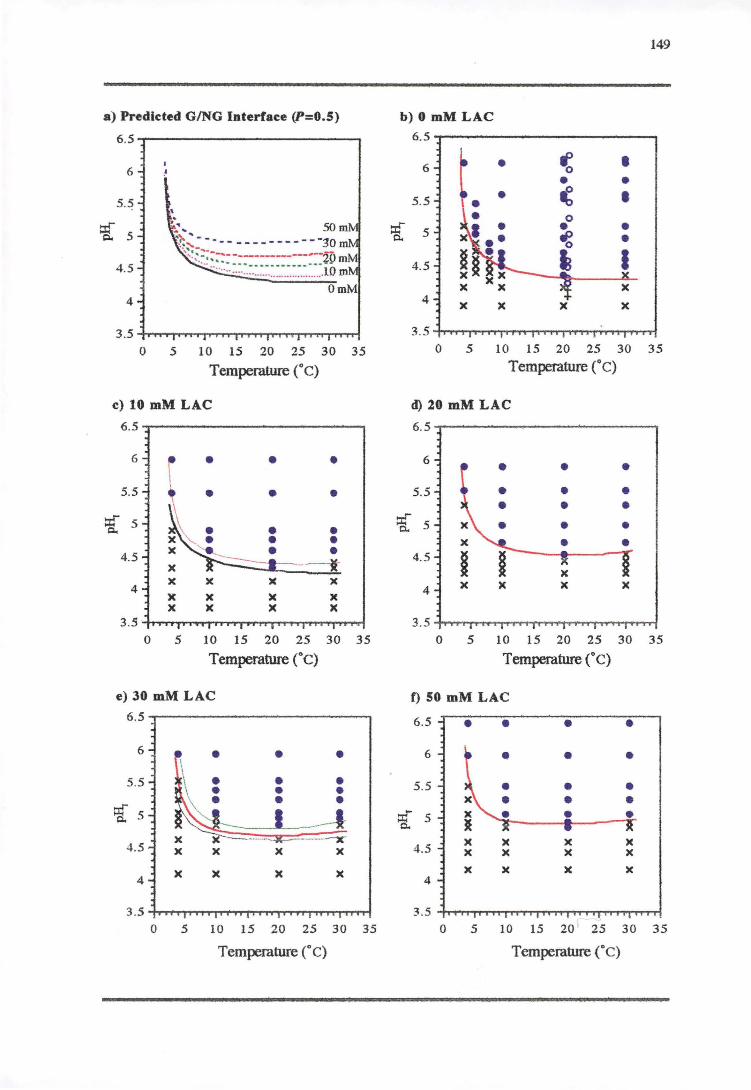
a) Predicted GING Interface (P=O.S)
6 .5
6
5 .5
:a- 5
4.5
4
A.. 50m ~.::: • - - - - - - - - - - - - - · 30 ,, . .... _ -.:-., -----------------"'r! M
··-· ··---·--·----------... •vm ·· ....... .......................... .10 m
0 5 10 15 20 25 30 35
Temperature (°C)
c) 10 mM LAC
6 .5
6
5.5
a- 5
4.5
4
)(
)(
x x )(
• •
x x x
• •
)(
)(
)(
• •
)(
)(
)(
0 5 10 15 20 25 30 35
Temperature (°C)
e) JO mM LAC
6.5 ------------...
4 )( x )( )(
0 5 10 15 20 25 30 35
Temperature (° C)
149
b) 0 mM LAC
6.5
6
5.5
=§:" 5
4.5
4 x x
• •
)(
( • (
)(
• • • • •
x
3.5-+.-......,.. ........ ..,...,...,........,...-;-......,..,........,.......,..,..,..,......,...T"l'T.....-rf
0 5 10 15 20 25 30 35
Temperature (°C)
d) 20 mM LAC
6.5
6
5.5
( 5
4.5
4
0 5 10 15 20 25 30 35
Temperature (°C)
f) 50 mM LAC
6.5
6
5 .5
=§:" 5
4.5
4
•
)( )(
)(
•
)( )(
)(
•
x )(
)(
•
)( )(
x
0 5 10 15 20 25 30 35
Temperature (°c)
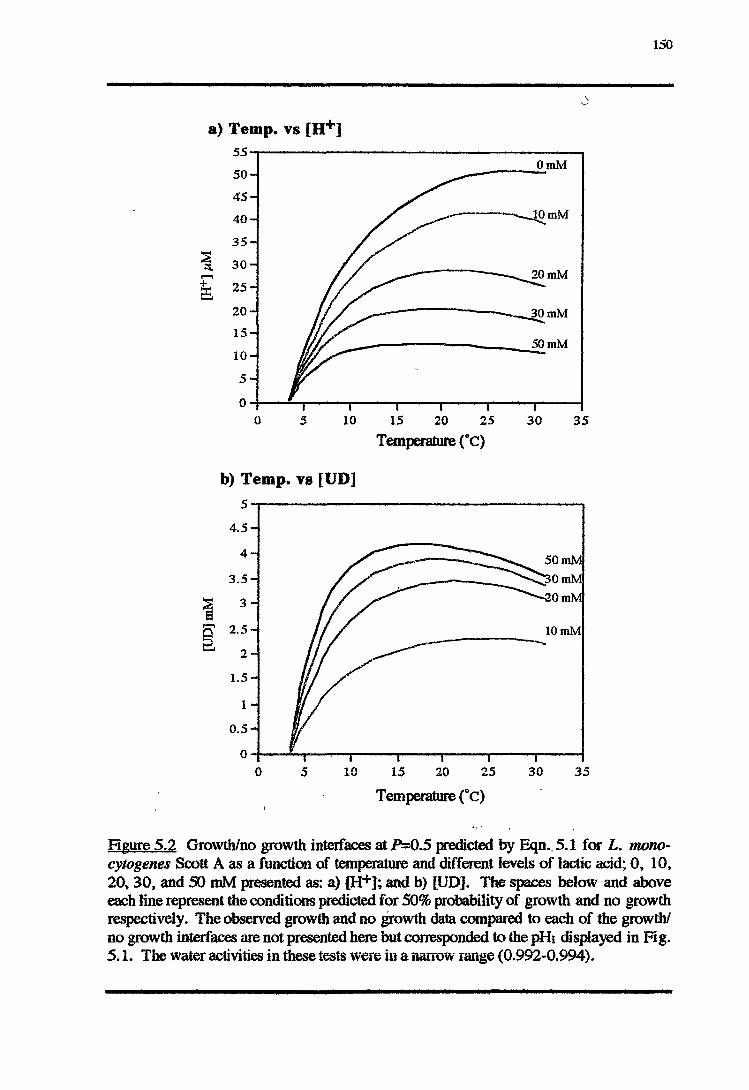
150
0
a) Temp. vs [H+] 55
50 OmM
45
40 lOmM
35 ~ 30 :t. ...., + 25 :I: ._.
20
15 SOmM
10
5
0 0 5 10 15 20 25 30 35
Temperature ("c)
b) Temp. vs [UD]
5
4.5
4
3.5
1 3 Orn
~ 2.5
2
1.5
1
o.s 0
0 5 10 15 20 25 30 35
Temperature {°c)
Figure 5.2 Growth/no growth interfaces at P=0.5 predicted by Eqn._ 5.1 for L. monocytogenes Scott A as a function of temperature and different levels of lactic acid; 0, I 0, 20, 30, and .50 mM presented as: a) {H+J; and b) [UD]. The spaces below and above each line represent the conditions predicted for 50% probability of growth and no growth respectively. The observed growth and no growth data compared to each of the growth/ no growth interfaces are not presented here but corresponded to the pHr displayed in Fig. 5.1. The water acti"ities in these tests were in a narrow range (0.992-0.994).

Figure 5.3 (facing page). Predicted growth/no growth interfaces at P=0.5 for L. nwnocytogenes L5 (Eqn. 5.2), showing interaction between pH and temperature in determining minimum conditions for growth at water activity of --0.993 and in the presence of 0, 10, 20, 30, and 50 mM lactic acid (a). Comparison between observed growth(• , 0 ) and no growth (x, +) data from the probabilistic and kinetic experiments respectively and the predicted interface at b) 0 mM, c) 10 mM, d) 20 mM, e) 30 mM, and f) .SO mM lactic acid. ·
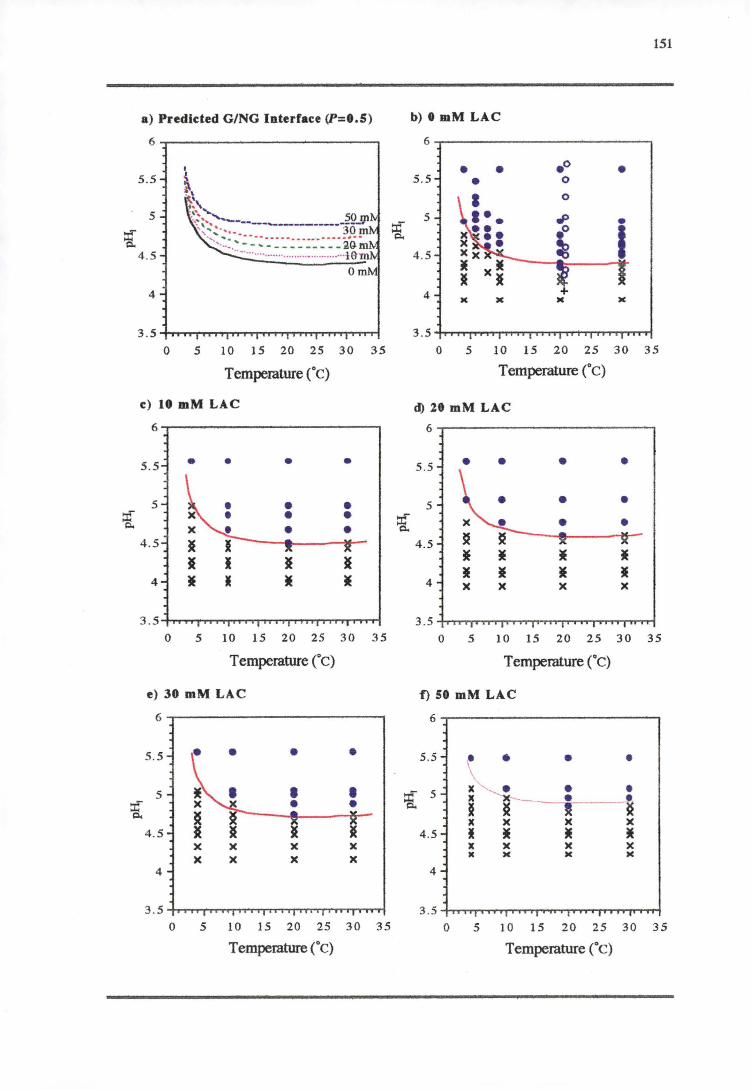
151
a) Predicted GING Interface (P=O.S) b) 0 mM LAC
6 6
I • • .o • 5.5 ~\ 5.5 • 0
~\ 5 ··· :----.. 5 . ;~~ ... ......_ _____ ._,_ ________ ~Q.91
::I!" :& •. '· :~:~= -~~~-~~.:.:~.~- ~~-~.:~.::~.~. :~.~1~ ~ Q..
4.5 4 .5
4 4 + JC )( JC
3 .5 3 .5
0 5 10 15 20 25 3 0 35 0 5 10 15 20 25 3 0 3 5
Temperature (°c) Temperature (°c)
c) 10 mM LAC d) 20 mM LAC
6 6
5 .5 • • • • 5.5 • • • • 5 5 • • a :t"
Q.. • • 4 .5 4 .5
I )E • • * • 4 • • 4 )( )( x x
3. 5 3.5 0 5 10 15 20 25 3 0 35 0 5 10 15 20 2 5 30 35
Temperature (°c) Temperature (°c)
e) 30 mM LAC f) SO mM LAC
6 6
5.5 5.5 • • • • 5 ~ 5 x • • • x • .. a I ~ ~
x x )( )(
4. 5 I 4.5 • * • • x x )( )( x )( )( )(
x x x x x )( )( )(
4 4
3 .5 3 .5 0 5 10 15 20 25 30 35 0 5 10 15 2 0 25 3 0 35
Temperature (°c) Temperature (°c)
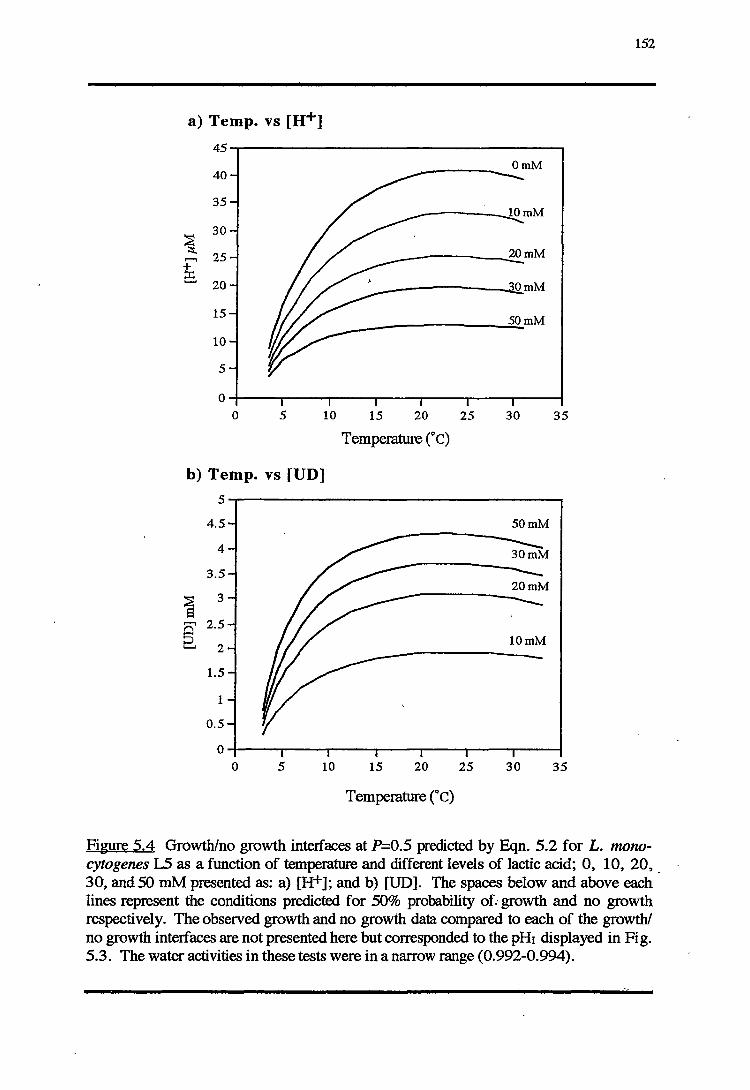
152
a) Temp. vs [H+]
45 OmM
40
35 lOmM
~ 30
::::!. 25 20mM ,......,
+ t5. 20 OmM
15 50mM
10
5
0 0 5 10 15 20 25 30 35
Temperature (°C)
b) Temp. vs [UD]
5
4.5 50mM
4 30mM
3.5 20mM
~ 3 s
~ 2.5
2 lOmM
1.5
1
0.5
0 0 5 10 15 20 25 30 35
Temperature (°c)
Figure 5.4 Growth/no growth intetf aces at P=0.5 predicted by Eqn. 5.2 for L. monocytogenes L5 as a function of temperature and different levels of lactic acid; 0, 10, 20,. 30, and SO mM presented as: a) [H+]; and b) [UD]. The spaces below and above each lines represent the conditions predicted for 50% probability of.. growth and no growth respectively. The observed growth and no growth data compared to each of the growth/ no growth interfaces are not presented here but corresponded to the pH1 displayed in Fig. 5.3. The water activities in these tests were in a narrow range (0.992-0.994).
153
5.3.2 WATER ACTIVITY-PH-LACTIC ACID RESPONSE
The potential of reduced water activity (NaCl as humectant) to increase the minimum pH1
·at which L. monocytogenes can initiate growth is demonstrated in Figs. 5.5-5.7 for Scott
A and 5.8-5.10 for LS. The optimum water activity for growth, in the broths without
lactic acid, was found to be 0.995. For both strains, when HCl was the acidulant, the
effect of water activity appears to increase gradually with the decrease in water activity.
This effect was more pronounced for water activity close to the aw limit, especially at
30°C.
An increase in pH of growth/no growth interface was found with the addition of lactic
acid. This effect, however, appeared to be constant over the range of aw ~0.95, i.e.
similar values of the minimum pH1 for growth were observed, but increased gradually
when aw was less than 0.95. When the water activity approached the aw limit, an
immediate rise in pH at the growth/no growth interface, especially at 30°C was observed,
similar to that observed in the absence of lactic acid.
Anomalous results were found from the data obtained from the kinetic studies, where
growth· at 20°C, in the presence of lactic acid, occurred at higher pH1 _than in growth/no
growth experiments (Figs. 5.Sc,d and S.8c,d for Scott A and LS respectively). These
differences of 0.2-0.3 pH units were found especially in the broth cultures with SO mM
lactic acid at aw< 0.94.
At20°C L. monocytogenes appeared to be more tolerant to pH1 than at 30°C (Figs. S.Sa I
.and S.6a, and S.8a and S.9a). Plots of the growth/no growth interface as a function of
[H+] and [UD] are presented in Figs. S.7 and S.10 for Scott A and LS respectively. The
fitted models, which satisfactorily describe, the growth/no growth interface of the
observed data, also demonstrate the higher C?ncentrations of [H+] and [UD] at which
growth occurred at 20°C than at 30°C .. The linear decline in the amount of [H+] and [UD]
required for growth inhibition as water activity is reduced was predicted by the probability
models both for Scott A and LS.
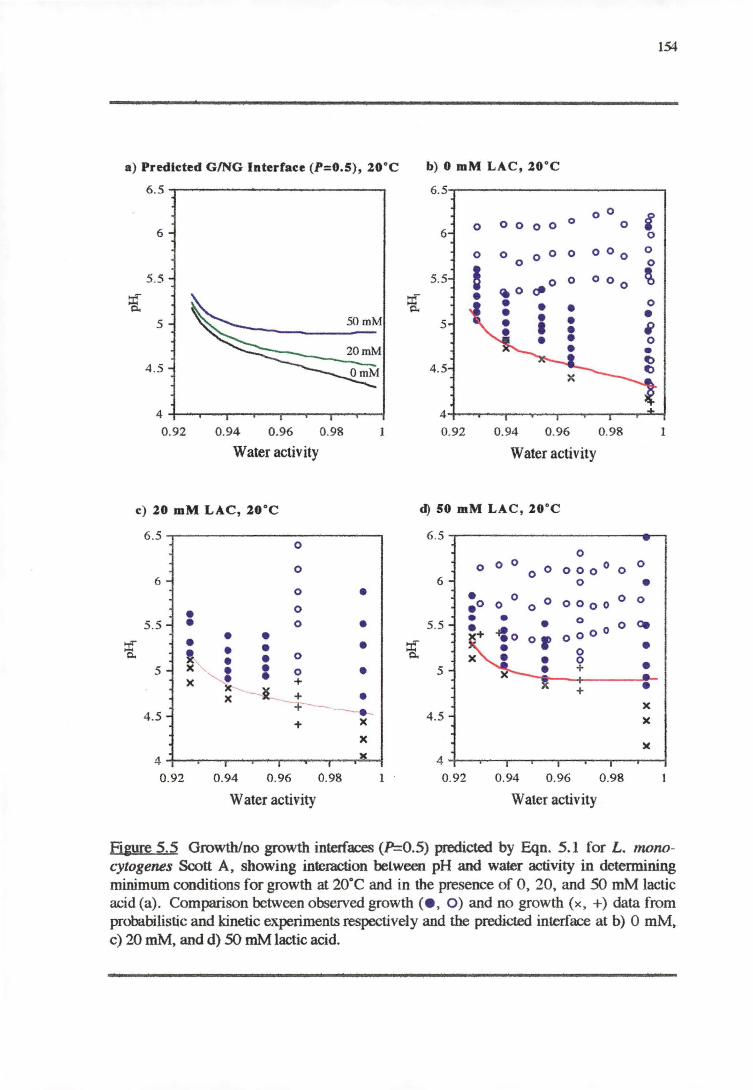
154
a) Predicted GING Interface (P=O.S), 2o·c b) 0 mM LAC, 20°C
6.5 -------------. 6 .5~-------------.
6 6 0 0 0 0 0
5 .5
:t' p,.
5
0 0 0 0 0 ooo 0 0 0
5.5 ! cJj 0 0 00 0 ~
:t' • • 0 p,. • 5 I 6 0
4 .5 4.5
4 -t-~~....-....... .---.---..---.---.~ .... 4
0.92 0.94 0.96 0.98 1 0.92 0.94 0.96 0.98
Water activity Water activity
c) 20 mM LAC, 20°C d) so mM LAC, zo·c
6 .5 6 .5 0
0
0 0 0 0 0 0 0 0 0 ° 0
0
6 6 0 • 0 • • 0 0 .o 0 0 0 oo 0 o 0 0 • • • 0 5.5 • 0 • 5.5 • 0 Qt
• • • + or oooo
:g: • • :t' • • • 0 1, • • 0 p,. 0
5 x '-. . : 0 • 5 + • x ..... + • )(---.., + ··-L_ + • x + ---- x
4.5 )( 4 .5 )( + >C
)(
4 >C 4
0 .92 0.94 0.96 0.98 1 0.92 0.94 0.96 0.98
Water activity Water activity
Figure 5.5 Growth/no growth interfaces (P=0.5) predicted by Eqn. 5.1 for L. monocytogenes Scott A, showing interaction between pH and water activity in determining minimum conditions for growth at 20°C and in the presence of 0, 20, and 50 mM lactic acid (a). Comparison between observed growth (e , O) and no growth (x , +) data from probabilistic and kinetic experiments respectively and the predict.ed interface at b) 0 mM, c) 20 mM, and d) 50 mM lactic acid.
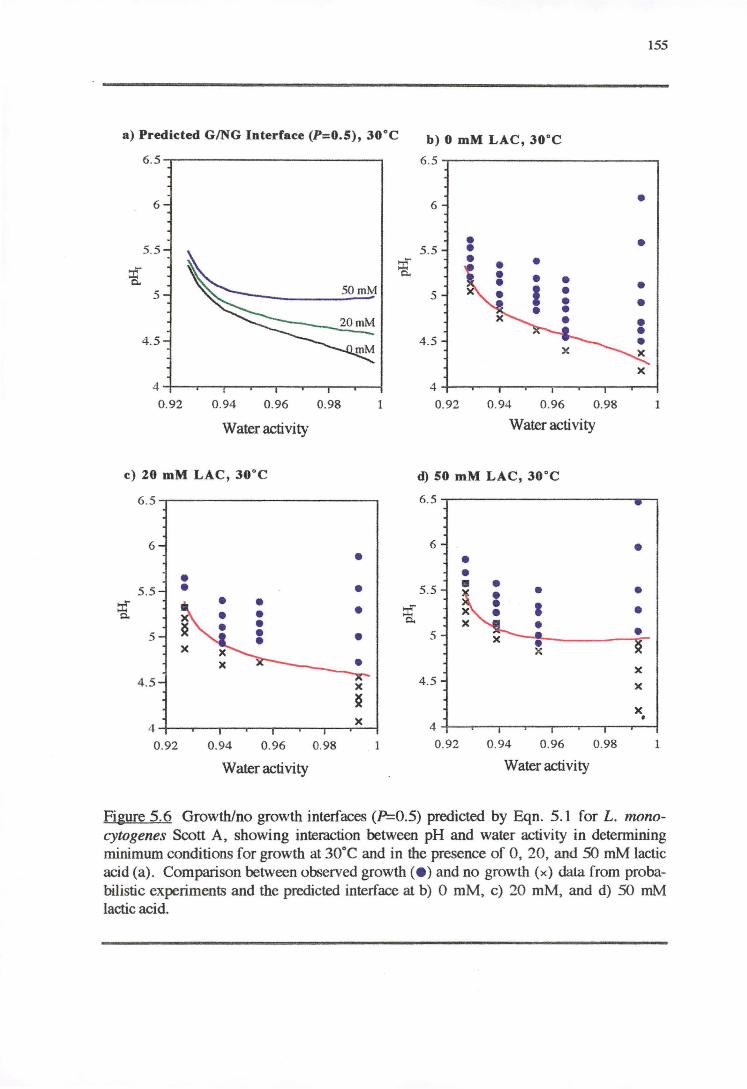
155
a) Predicted GING Interface (P=O.S), J0°C b) o mM LAC, 30°c
6.5 6.5 ....------------~
6 6 •
• • 5. 5 5.5 • i •
i 5 5
4.5 4 .5
x 4 4
0.92 0.94 0.96 0.98 1 0.92 0.94 0 .96 0.98 1
Water activity Water activity
c) 20 mM LAC, J0°C d) SO mM LAC, J0°C
6 .5 6 .5
6 6 • • • • •
5 .5 • • 5.5 • • • ::t" ::t" I • 0.. 0.. • 5 5 • • x
x 4 .5 )( 4. 5 )(
~ x x •
4 4
0 .92 0.94 0.96 0.98 0.92 0 .94 0.96 0.98 1
Water activity Water activity
Figure 5.6 Growth/no growth intetfaces (P=0.5) predicted by Eqn. 5.1 for L. monocytogenes Scott A, showing interaction between pH and water activity in determining minimum conditions for growth at 30°C and in the presence of 0, 20, and 50 mM lactic acid (a) . Comparison between observed growth(• ) and no growth (x) data from probabilistic experiments and the predicted interface at b) 0 mM, c) 20 mM, and d) 50 mM lactic acid.
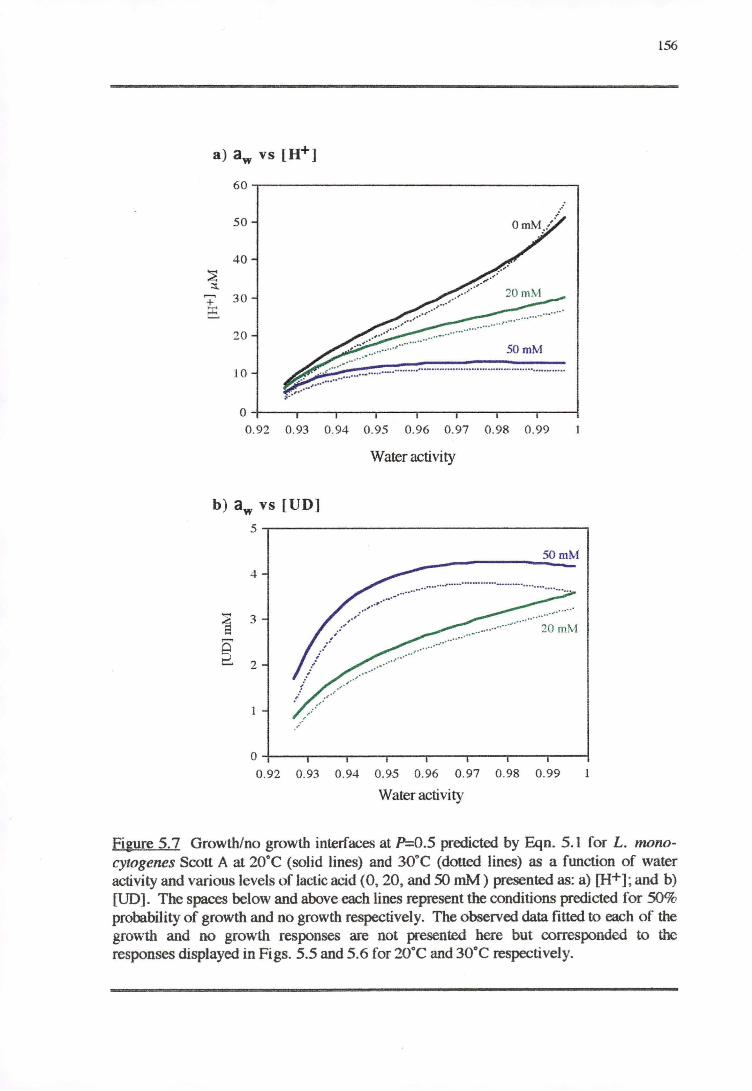
156
50
40
20 50mM
10 ~ .............................................................................. ..
0-+-~~~~~~~~~~~~~~~~---1
0.92 0.93 0.94 0.95 0.96 0.97 0.98 0.99
Water activity
b) aw vs [UD]
50mM
4
04-~~~~~~~~~~~~~~~~--1
0 .92 0.93 0.94 0.95 0.96 0.97 0.98 0.99 l
Water activity
Figure 5. 7 Growth/no growth interfaces at P=0.5 predicted by Eqn. 5.1 for L. monocytogenes Scott A at 20°C (solid lines) and 30°C (dotted lines) as a function of water activity and various levels of lactic acid (0, 20, and 50 mM) presented as: a) [H+]; and b) [UD]. The spaces below and above each lines represent the conditions predicted for 50% probability of growth and no growth respectively. The observed data fitted to each of the growth and no growth responses are not presented here but corresponded to the responses displayed in Figs. 5.5 and 5.6 for 20°C and 30°C respectively.
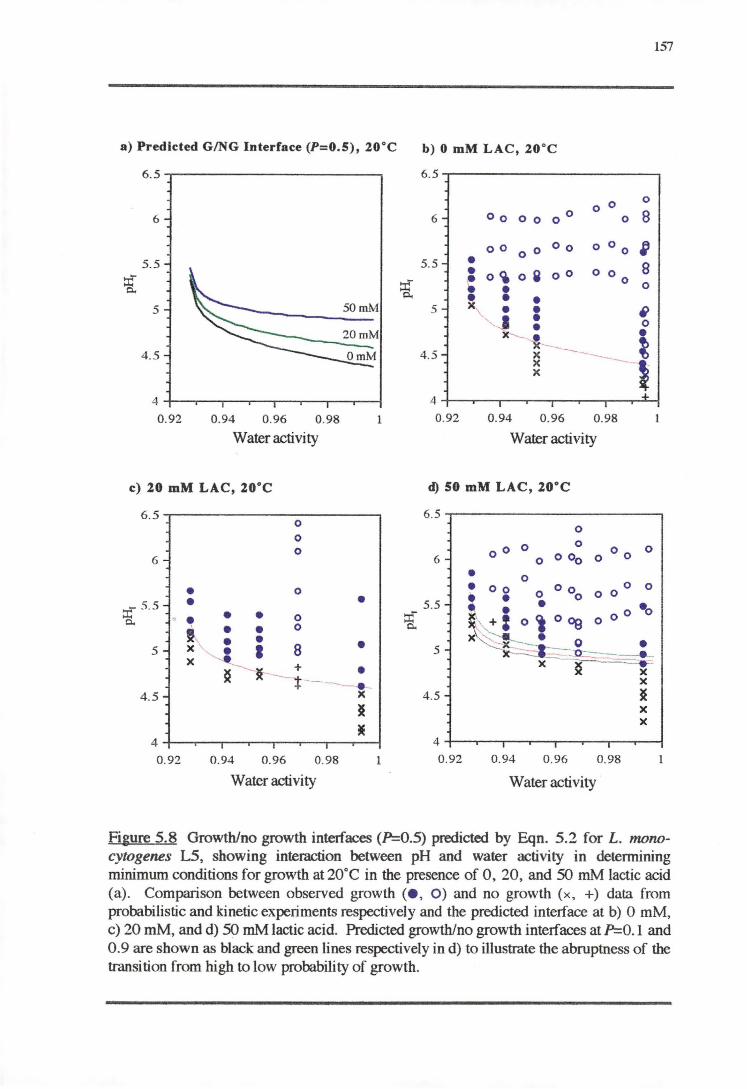
157
a) Predicted GING Interface (P=O.S), 20°C b) o mM LAC, 20°c
6.5 6.5 ....-------------~
6
5.5
£ Q..
5
4 .5
4 -+-----.--.---....---~--_,,
0.92 0.94 0.96 0.98
Water activity
c) 20 mM LAC, 20°c
1
6 .5 ....-------------......
6
0
0 0
0
£5.5 • • • 0 0
• Q..
5
4.5
I 8 • l--- + •
-i----... )(
I
• 4 -+---.--r--r---r----i.---.--...---t
0.92 0.94 0.96 0.98
Warer activity
:i"" Q..
~ 0..
0 0 0
6 Oo 0 0 00 0 B
oO oO Oo 0 0 0 ~ 5.5 • 8 • 0 ~ 0 Q oO 0 0 : 0 0 • • • • 5 x • • ~ ' '-.J : 0
x--..._ • • 4.5
)(....__ ___ ~ x - --·--... x 1 x
4
0.92 0.94 0.96 0.98 1
Warer activity
d) 50 mM LAC, 20°C
6.5 0
oO 0 0 0 0 0 0
6 0 0 o0
• 0 • Oo Oo 0 0
• • 0 0 0 0 5.5 • • • o •o ~= 0 <a 0 °8 0 0
5 ~_:_o ___ :_ x--~--- -
~ x x
4.5 I x x
4
0.92 0.94 0.96 0.98 1
Warer activity
Figure 5.8 Growth/no growth inrerfaces (P=0.5) predicted by Eqn. 5.2 for L. monocytogenes LS, showing inreraction between pH and warer activity in detennining minimum conditions for growth at 20°C in the presence of O. 20, and 50 mM lactic acid (a). Comparison between observed growth (e , 0 ) and no growth {x, +) data from probabilistic and kinetic experiments respectively and the predicted interface at b) 0 mM. c) 20 mM, and d) 50 mM lactic acid. Predicted growth/no growth interfaces at P=:O. l and 0.9 are shown as black and green lines respectively in d) to illustrate the abruptness of the transition from high to low probability of growth.
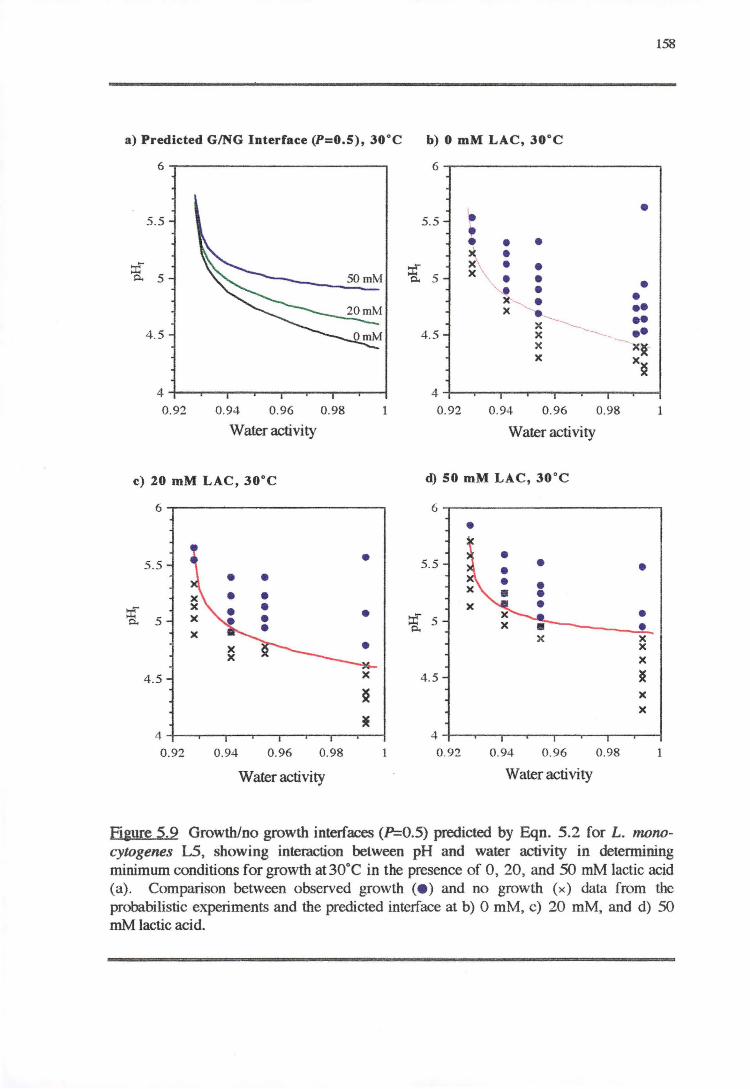
158
a) Predicted GING Interface (P=O.S), 30°C b) 0 mM LAC, 30°C
6 6---~-~~~~~~~~-
5.5
4.5
4-+---..---.--.---.--..----..---f
0.92 0.94 0.96 0.98
Water activity
c) 20 mM LAC, 30°C
6.......--------------.
5 .5
4 .5 x
4 -+---.-......--.---.--...---.--..----t
0.92 0.94 0.96 0.98
Water activity
5.5-
4.5 -
4 -+----..-.... ,-....---., ....... -.--.--,-.---1 0.92 0.94 0.96 0.98
Water activity
d) SO mM LAC, 30°C
• 5.5
x
4 .5
•
• • x x x ~ )(
)(
1
4-+----.--.----.--.--..---..--...----t
0.92 0.94 0.96 0.98
Water activity
Figure 5.9 Growth/no growth interfaces (P=0.5) predicted by Eqn. 5.2 for L. monocytogenes L5, showing interaction between pH and water activity in detennining minimum conditions for growth at30°C in the presence of 0, 20, and 50 mM lactic acid (a) . Comparison between observed growth (• ) and no growth (x) data from the probabilistic experiments and the predicted interface at b) 0 mM, c) 20 mM, and d) 50 mM lactic acid.
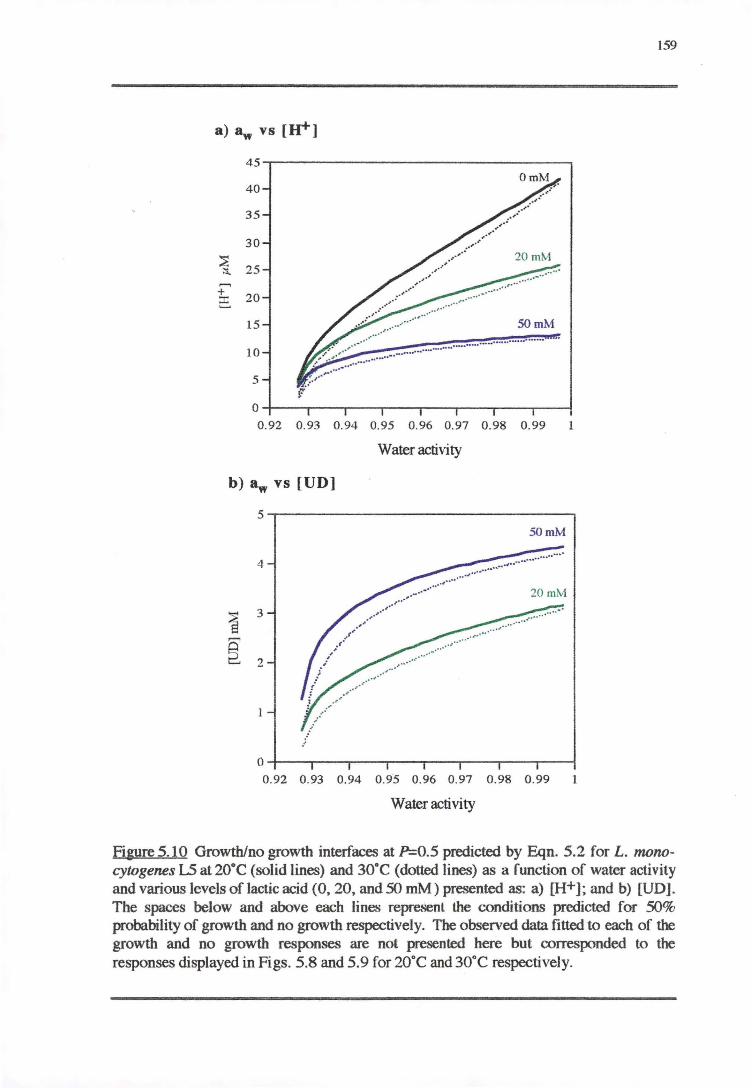
a) 8w vs cu+J
40
35
30
~ 25 ~
+ 2:. 20
15 50mM
10 ,., ...... -··········-··-·-···-·--··--··--·····-····-·········-·········· 5
(
0.92 0.93 0.94 0.95 0.96 0.97 0.98 0.99 1
Water activity
b) 8w vs [UD]
50mM
4
0--~--~--~~~~~--~~~~~-1
0.92 0.93 0.94 0.9·5 0.96 0.97 0 .98 0 .99 I
Water activity
159
Figure 5.10 Growth/no growth interfaces at P=0.5 predicted by Eqn. 5.2 for L. monocytogenes l5 at 20°C (solid lines) and 30°C (dotted Jines) as a function of water activity and various levels of lactic acid (0, 20, and 50 mM) presented as: a) [H+]; and b) [UD]. The spaces below and above each lines represenl lhe conditions predicted for 50% probability of growth and no growth respectively. The observed data fitted to each of the growth and no growth responses are not presented here but corresponded to the responses displayed in Figs. 5.8 and 5.9 for 20°C and 30°C respectively.
160
5.3.3 LACTIC ACID-PH RESPONSE
Plots of the change in pH1 at which growth could occur, including the corresponding
[Ir] and [UD] as a function of lactic acid concentrations, were prepared for a range of
lactic acid concentrations at a fixed temperature (~21 cc) and aw (~0.96) (Figs. S.11 and
S.12 for Scott A and LS respectively). Similar trends of an increase in pH limits with
the increase in lactic acid concentration were found in both strains. The lowest pH1 at
which growth was observed in broth without lactic acid was 4.54 for L. monocytogenes
Scott A (Fig. S.l la). The critical pH1 below which growth was not observed at 4SO mM
lactic acid was S.88 for L. monocytogenes LS (Fig. S.12a).
Figs. S.lla, b and S.12a,b show the amount of each component, i.e. [H+] or [UD],
presented at the growth/no growth interfaces. It should be noted that the observed
growth and no growth, and the predicted growth/no growth interfaces depicted in those
Figures are not standardised to reveal the effect of only one component. The apparent
responses, therefore, result from the combined effect of both [H+] and [UD] which are
co-dependent and must be taken into account when considering the effect of lactic acid.
The lowest amount of [H+] required for growth inhibition of L. monocytogenes, in the
absence of lactic acid, was ~30 µM (at ~21 cc and aw of 0.96). The lowest amount of
[UD] required for growth inhibition of L. monocytogenes was "'4.S mM. '','
Figure 5.11 (facing page). Growth/no growth interface of L. monocytogenes Scott A at 3w of ---0.96 and 22°C (an average of the temperatures for this set of data) as a function of lactic acid concentration and a) pH at inoculation, b) [H+], and c) [UD]. Comparison between the observed growth(• , O) and no growth (x, +)data from the probabilistic and kinetic experiments respectively. Note that Figs. 5.6 b,c demonstrate only the fitted growth/no growth interface and each active eomponent of lactic acid. The combined effect from other components must also be taken into account. The black, red and green lines are the fitted models (Eqn. 5.1) for P=O. l, 0.5, and 0.9 respectively to illustrate the abruptness of the transition from high to low probability of growth.
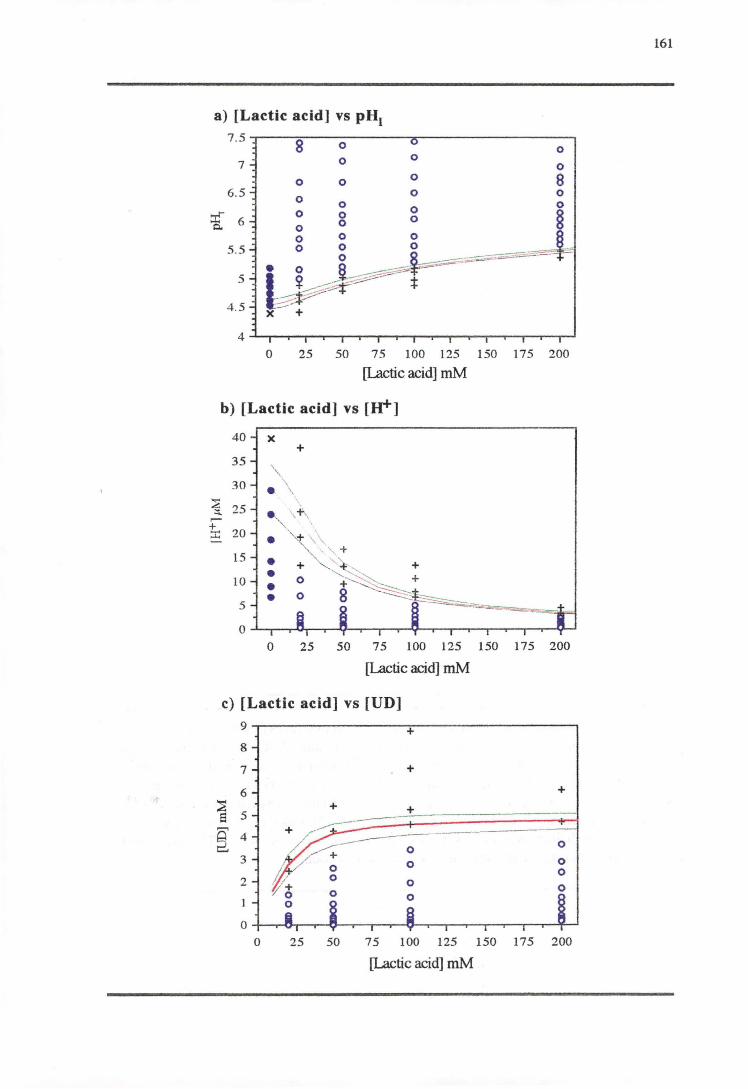
a) [Lactic acid] vs pH1 7.5
8 0 0
7 0 0 0
0 0 0 8 6.5
0 0 0
0 0
~ 0 0 0 § 6 0 0 0 0 0 0
5 .5 0 0 0 .. ::;;;::=-- -=···--==- -0
• 0 '-"" 5 l~~- ;
4 .5 x +
4
0 25 50 75 100 125 150 175 200
[Lactic acid] mM
b) [Lactic acid] vs [W]
40 x +
35 \ ,, 30 •
~ 25 ::s.. ~- ,-t\ ..-+ 20 ::c • ~ \ \
15 ·- ·,, +
• + '--, ):. + • 0 '+,:':~ + 10 • • 0 8 --· ---5
0
0 25 50 75 100 125 150 175 200
[Lactic acid] mM
c) [Lactic acid] vs [UD] 9-r-~~~~~~~~~+~~~~~~~~----.
8
7
6 ~ El 5
~ 4 3
2
0 0 25
+
0
50
+
+
0
0 0
0
75 100 125 150 175 200
[Lactic acid] mM
161
Figure 5.12 (facing page). Predicted growth/no growth interfaces (P=0.5) from Eqn. 5.2 for L. morwcytogenes L5 at water activity of .....Q.96 and 21°C (an average of the temperatures for this set of data) as a function of concentration of lactic acid and a) pH at inoculation, b) [H+], and c) [UD]. Comparison between the observed for growth ( • , O) and no growth (x, +) data from the probabilistic and kinetic experiments respectively showing the good.n_ess of model fit. Note that Figs. 5.12b,c demonstrate only the fitted growth/no growth interface and each active component of lactic acid. The combined effect from other components must also be taken into account
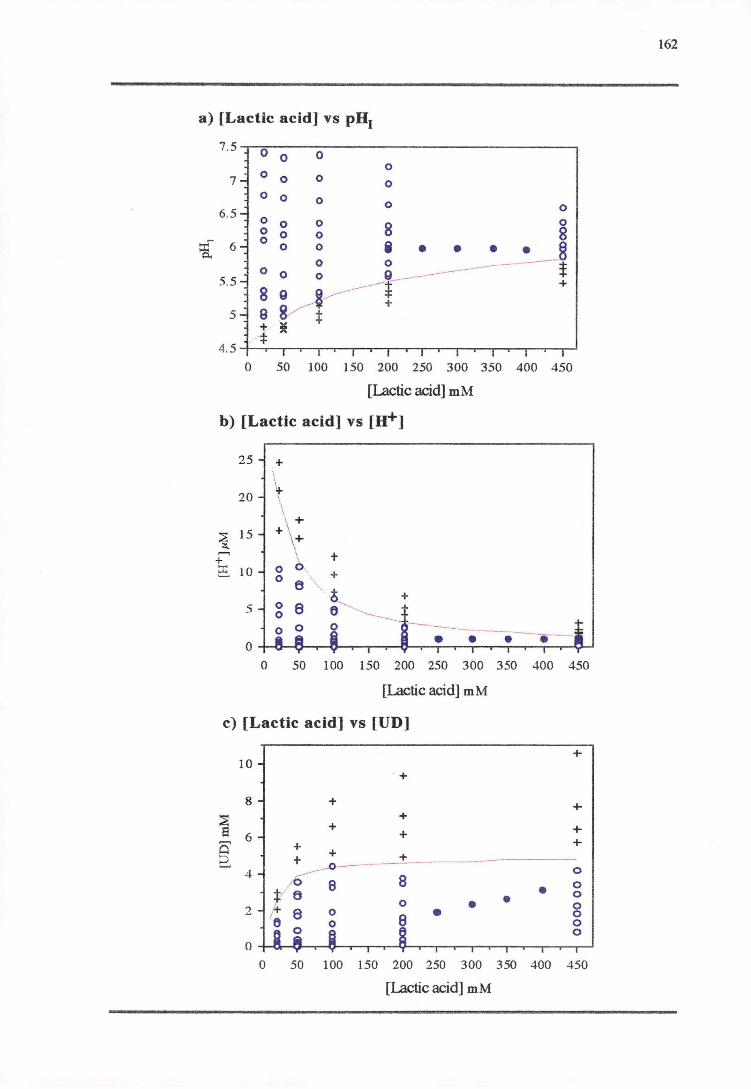
a) [Lactic acid] vs pH1
=&
7.5 0 0 0 0
7 0 0 0 0
0 0 0 0 0 6.5 0 0 0 0 8 0 0 0 8 0
6 0 0 i • • • • 8 0 0 -------------0
0 0 0 --------- * 5.5 vr----r + 8 5 9
+ ~ + 4.5
.. --:j:
0 50 100 150 200 250 300 350 400 450
[Lactic acid] mM
b) [Lactic acid] vs [It+]
25
20
~ 15 ~ ...-.
+ t:S. 10
5
+ \ t \ \ +
+ I \+ I
0 6. o e 0 8 0
+ +
+
0 50 100 150 200 250 300 350 400 450
[Lactic acid] mM
c) [Lactic acid] vs [UD]
+ 10
· +
8 + + ~ + a + +
6 + ...-. + 0 + + 2. + -<>-- +
0 4 ~ 8 ;V 6 a • 0 0
0 • • 0 2 ~ 8 0 • 0 6 0 0
0
0
0 50 100 150 200 250 300 350 400 450
[Lactic acid] mM
162
163
5.4 DISCUSSION
The "probability" or "growth/no growth interface" models developed in this chapter
demonstrate a different approach of predictive microbiology where the rate and extent of
growth, especially for pathogens, is of less interest than the possibility of growth. For
pathogens like L. monocytogenes the infective dose of which is still unknown, small
numbers in foods may present a hazard, especially to susceptible consumers. In
particular:, in foods that support growth of L. monocytogenes, especially if there is
temperature abuse, there is potential for the orgcµlism to proliferate. Understanding its
growth limits due to stressful environmental conditions would identify conditions for
controlling its growth in foods and may serve as a built-in CCP throughout the shelf-life
of products.
The probability models presented here are based on a binary response, i.e. growth or no
growth, within a limit of time (90 days) sufficient to ensure any possible growth wou~d
be detected. The growth, as defined, was assessed by visual determination and verified
by a standardised ecometric technique (Appendix F). The methods proved to be reliable
and convenient for screening for growth in relatively large numbers of combinations of
inhibitory factors. The reading of absorbance, especially in automated systems, was
reported to face some sensitivity limitations (McClure et al., 1991). The quadruplicate
cultures prepared for nearly all conditions also served as a rigorous assessment to help
confirm the likelihood of growth. A high degree of ,replication is considered favourable
for the generation of datasets for probability models, especially at the stressful conditions.
Generally, similar occurrence in all replicates were observed except at the conditions close
to the interfaces where the growth, no growth (survival) or death are more variable (T.
Ross, pers. comm.).
The experimenal design covered more than 500 different environmental conditions for L.
monocytogenes. The probability models (Eqns 5.1 and 5.2) were generated using the
SAS2 NLIN procedure instead of the LOGISTIC procedure as previously employed
(Ratkowsky and Ross, 1995; Presser et al., in press). With this procedure, the
parameters were allowed to be estimated from data, instead of being fixed to constant
values. The models, however, appeared to perform better when Tmin was fixed as -2°C.
The reason for this is unclear but may be related to the large amount of growth and no
growth data at temperatures ~4°C and only one growth condition at temperature of 3°C.
T_he range of temperature and water activities tested was not extended beyond growth
limits. However, pH values lower than the anticipated minimum growth pH for each
level of lactic acid were i1?-cluded. Some of these extreme pH conditions, however, were
found to substantially affect the estimate of the parameter Umin, resulting in a value
' '
164
markedly different from the estimate obtained from the kinetic study (Chapter 4) and also
from the observations. If the definition of Umin, i.e. the notional minimum concentration
of undissociated lactic acid which prevents growth (see section 4.1.1.2) is appropriate,
then the Umin values from different experiments are expected to be consistent. However,
observations from L. monocytogenes, for example strain LS, show no growth at UD
~4.6 mM, but using all the extreme pH conditions Umin was estimated to be lS.2 mM.
This is simply a consequence of the arithmetic fact that one cannot take the logarithmic of
zero or of a negative number. The general form of the expression is Ln(l-[UD]/UmiJ.
As lS.19 mM was the highest [UD] used in the study for L. monocytogenes LS, then
Umin must be greater than this value to prevent this mathematical problem. To overcome
this limitation, the data for very high undissociated acid values where no growth could
possibly occur were systematically removed (see section S.3). This resulted in a Umin of
S.84 mM (Table S.2 and Eqn. S.2), a more consistent estimate, without affecting the
performance of the model in any perceptible way. The Umin derived from these proba-' bility models were only slightly higher than the values obtained from kinetic models in
Chapter 4. It should be noted that no other probability models for L. monocytogenes
exist in literature, thus all of the parameter estimates being compared were derived from
kinetic studies (see section 4.4.1). The '1wmin estimated from the models were consistent
with the kinetic models and published reports (see section 4.4.1.2).
The growth or no growth boundary has been successfully defined and modelled using
only kinetic data (Ratkowsky and Ross, 199S). In this study, the good fit to the kinetic
data by the probability model is evident (Fig. S.12) which del1,lonstrates a success not
only in incorporation of the kinetic data to generating a probability model, but also the
ability of the probability model to describe accurately the conditions under which growth
rate could not possibly be measured. This may represent an integration of the two
extremes, kinetic and probabilistic aspects, of predictive microbiology. Consider the
interpolation region described by Baranyi et al. (1996) as the so-called 'minimum convex
polyhedron' (MCP), of the combinations tested in a kinetic study. The defined growth/
no growth boundaries, at SO% probability of growth, present in this study may be
envisaged as a bigger multidimensional 'tent' covering the MCP where 100% probability
of growth occurred. This 'tent.' may provide a rational criteria for a modeller to design an
experiment such that the MCP is maximized to cover all the possible growth domain, so
that prediction by extrapolation can be avoided. In addition, the probability model may
also provides an indication of the probability of growth which is useful when the kinetic
model predictions are made for extreme conditions. Conversely, knowing the conditions
where growth rate is very slow a no growth condition can be anticipated if the conditions
are made slightly less favourable to growth.
165
- The conditions of growth or no growth in kinetic and probabilistic studies are considered
to be similar. In the kinetic study, the growth was considered unlikely to occur if the
8%T <25 of which the corresponding cell yield was <0.23 OD. In most instances, the
no growth conditions, confirmed by ecometric method, coincided with conditions in ,
which there was no increase in turbidity. Also, under the less optimum conditions, a
smaller increase in turbidity was found. As previously discussed in Chapter 4, the
energy diversion of the micro-organism to maintenance functions under stressful
conditions, in particular acid stress, may result in reduced cell yield. This concept can
explain those turbidity changes in this growth/no growth study caused by either acid
stress or combinations of acid-low temperature stress and acid-osmotic stress. The
notion of similarity of both predictive models is in accord with Presser (1995) who
suggested that the difference is only in the approach of modelling the effect of the
response, rather than a difference in the response itself in extreme conditions under which
growth rate is unable to be measured and the growth/no growth boundary occurs.
It is noteworthy that although the growth/no growth interface was clearly defined,
extreme growth variation near this ,growth limit is recognised (Ratkowsky et al., 1991).
Under extreme conditions close to the limit of growth, Wijtzes (1996) assumed that the
microbial population consisted of two sub-populations. The first group was considered to
die immediately under the stress conditions, while the second group experiences a lag
time, adapts to the stress condition, and can survive or grow under those extreme
conditions. The level of each group in a microbial population may vary depending on the
\ ability of microbes to repair and perform maintenance functions, which may be explain
the variation in responses of microbial populations at near gr~wth-limiting conditions.
Different population densities (McClure et al., 1989) or incubation history of cultures
(Patchett et al., 1996) were also reported to play a role in the different responses of
microbial populations at the extreme conditions.
The variation from "highly likely to grow" conditions (P=0.9 or 90% likelihood of
growth) to "highly unlikely to grow" conditiop.s (P=0.1 or 10% likelihood of growth)
was predicted from the studies of the potential effect of combinations of pH and
temperatures (Fig. 5. le), water activities (Fig. 5.8d), or concentrations of lactic acid
(Fig. 5.11) to be within a narrow range of pH (-0.1-0.2 pH units). This demonstrates
the abruptness of the transition between growth or no growth conditions influenced by
pH. Similar findings were reported by Presser et al. (in press). Beyond these range of
probabilities, the model predicts the probability of almost 100% or 0% probability of
growth which indicates that the response is an absolute, i.e. growth or no growth is not
time dependent.
166
Despite of the qualitative nature of the data, the growth no growth interfaces depicted in
this chapter have proven to be a convenient means of judging the probability that L.
monocytogenes would grow at the given conditions of the pH value and levels of lactic
acid and NaCl, and storage temperature. The growth or no growth responses of L.
monocytogenes Scott A and LS to the combinations of controlling factors are discussed in
the following sections (5.4.1-5.4.3).
A convergence of predictive microbiology and the 'hurdle concept' (Leistner, 1994) is
also demonstrated in this study. The clearly defined growth/no growth boundaries may
represent a quantification of the hurdle concept with a tangible understanding of the
combined effect of controlling factors. This may provide a criteria for a product formula
tion so that only necessary levels of controlling factors will be applied in order to obtain a
s~fe product at a reasonable cost, or to satisfy consumer preferences for the minimal level
of processing which achieves the required safety and shelf-life.
5.4. l TEMPERATURE-PH-LACTIC ACID RESPONSE
The interaction between temperature and acidity in both absence and presence of various
levels of lactic acid demonstrated in Figs. 5.1 and 5.3, for strains Scott A and LS
respectively, suggests there is a synergistic effect between low temperature and pH on the
limits to growth of L. monocytogenes. Similar influences of incubation temperature on
the ability of L. monocytogenes to grow at low pH levels are also reported by several
researchers (Ingram and Mackey, 1976; Sorrells etal., 1989; McClure et al., 1991). The
addition of lactic acid enhanced the inactivation effect on L. monocytogenes, i.e. growth .,.,
inhibited at a higher pH value, may be explained by the finding from Chapter 4 that
increasing [UD] is more effective than [H+] in lowering the cytop~asmic pH. Similar
trend responses and predictions were found with the increasing lactic acid concentration
from 0 to 50 mM. The combined effect of [UD] and [H+] on growth limits, under the
conditions tested, can be determined from Figs. 5.2 and 5.4. At any concentration of
lactic acid, the pH at the growth/no growth interface dictates the amount of [UD] and [H+]
which, in tum, dictates the chance for L. monocytogenes to initiate growth. For
example, the pH at the growth limit was always higher in the presence of highers level of
lactic acid. This reinforces the finding in Chapter 4 of the dominant effect of [UD] in
preventing growth at the higher concentration of lactic acid.
In these growth/no growth experiments, the lowest pH values which permitted growth of
strains Scott A and L5 ( 4.36 and 4.35 respectively) was found at 20°C in the absence of
lactic acid. These low pH values coincide with the findings from kinetic experiments
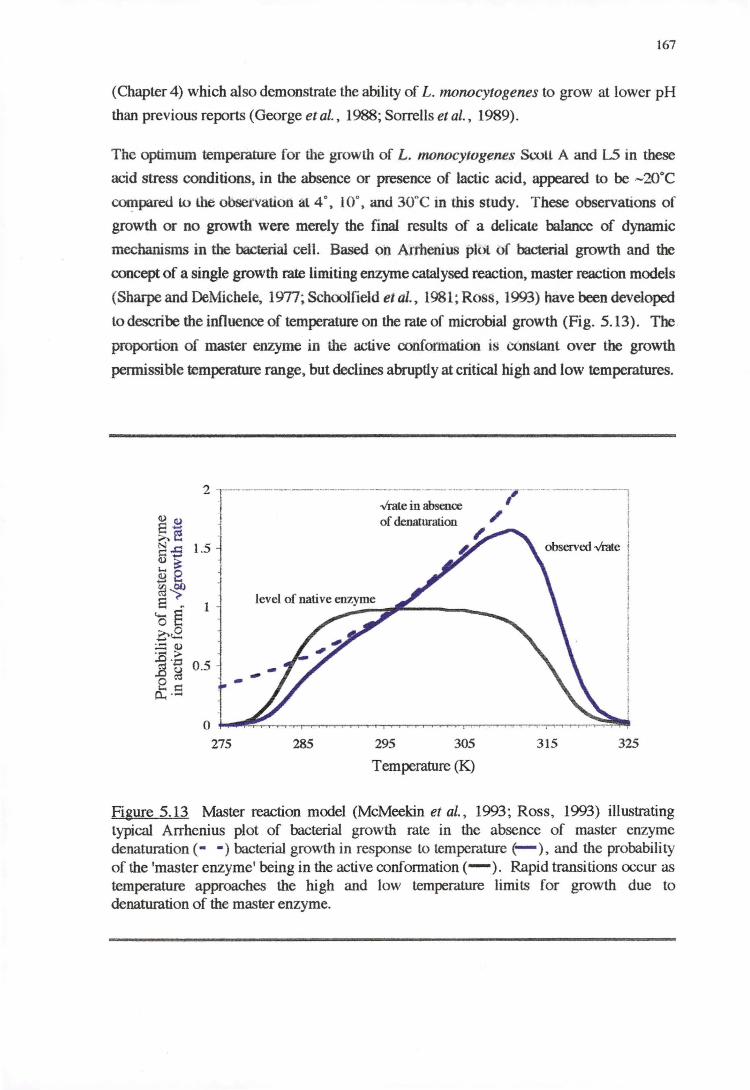
167
(Chapter 4) which also demonstrate the ability of L. monocytogenes to grow at lower pH
than previous reports (George et al., 1988; Sorrells et al., 1989).
The optimum temperature for the growlh of L. monocytogenes Scott A and l..5 in these
acid stress conditions, in the absence or presence of lactic acid, appeared to be .-2Q°C
COJ!lpared Lo the obsetvatlort at 4°, 10°, and 30nC in this study. These observations of
growth or no growth were merely the final results of a delicate balance of dynamic
mechanisms in the bacterial cell. Based on Arrhenius plot of bacterial growth and the
concept of a single growth rate limiting enzyme catalysed reaction, master reaction models
(Sharpe and DeMichele, l<n7; Schoolfield et al., 1981; Ross, 1993) have been developed
to describe the influence of temperature on the rate of microbial growth (Fig. 5.13). The
proportion of master enzyme in the active conformation. is constant over the growth
permissible temperature range, but declines abruptly at critical high and low temperatures.
275 285 295 305
Temperature (K)
315 325
Figure 5.13 Master reaction model (McMeekin et al., 1993; Ross, 1993) illustrating typical Arrhenius plot of bacterial growth rate in the absence of master enzyme denaturation (- • )bacterial growth in response to temperature(- ), and the probability of the 'master enzyme' being in the active confonnation (-). Rapid transitions occur as temperature approaches the high and low temperature limits for growth due to denaturation of the master enzyme.
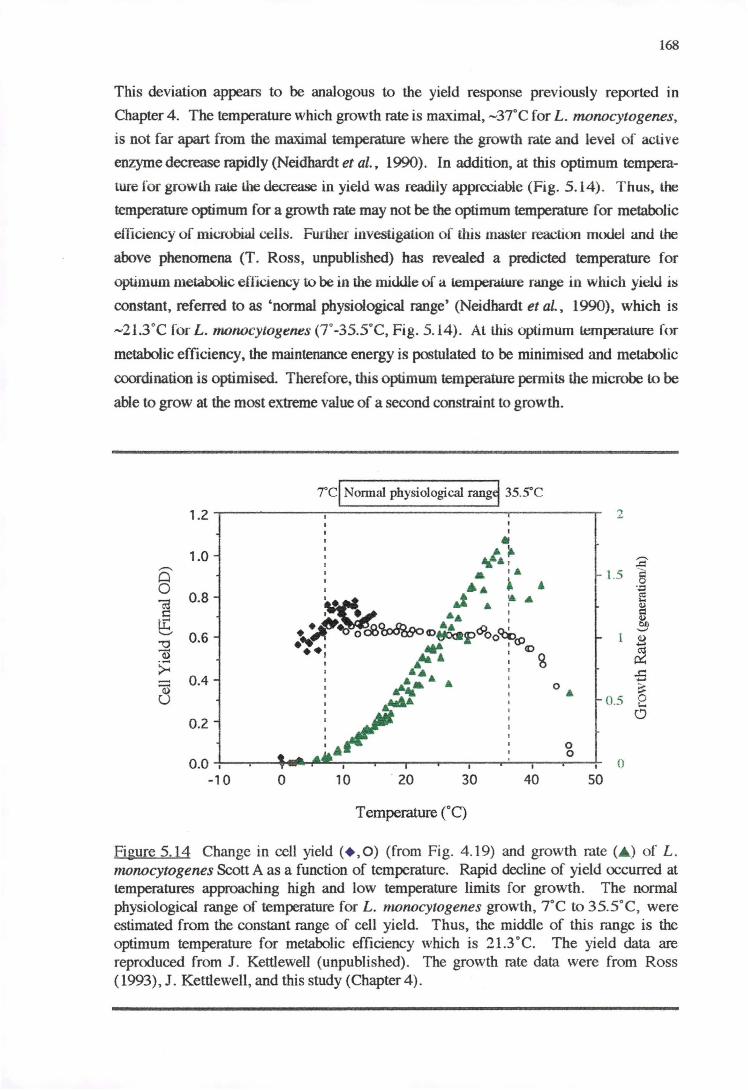
168
This deviation appears to be analogous to the yield response previously reported in
Chapter 4. The temperature which growth rate is marjmal, -37°C for L. monocytogenes,
is not far apart from the maximal temperature where the growth rate and level of active
enzyme decrease rapidly (Neidhardt et al .• 1990). In addition, at this optimum tempera
ture for growth r.11.e U1e de<..Tease in yield was readily appreciable (Fig. 5.14). Thus, the
temperature optimum for a growth rate may not be the optimum temperature for metabolic
efficiency of microbial cells. Further investigation of this master reaction model an<l Lhe
above phenomena (T. Ross, unpublished) has revealed a predicted temperature for
optimum metabolic efficiency to be in the middle of a lempen:ll.ure range in which yield is
constant, referred to as 'normal physiological range' (Neidhardt et al., 1990), which is
-21.3°C for L. monocytogenes (T-35.S°C, Fig. 5.14). At this optimum tempemlure for
metabolic efficiency, the maintenance energy is postulated to be minimised and metabolic
coordination is optimised. Therefore, this optimum temperature permits the microbe to be
able to grow at the most extreme value of a second constraint to growth.
/Cl Normal physiological rang1 35.5°C
1.2 " .:.. I
I • 1.0 ,/ .. ~ 2 ,....._
Q & . .. 1.5 8 0 : .... . . -~
0.8 ~ .t A ~A ro
~ ... 0
c= I • •• I d
~ 0
• ;tt•~ ~~«> ..... ~ ~ C>O ......... ......... 0.6 N o ~i' Oo ti:> l Q.) "O • •' ,.. «> ~ Q) . .. ~ ~ ..... ..i::
~ 0.4 ..... A ......
Si o ,. ~ u 0.5 e
0.2 ./ tJ
0 0
0.0 I 0 -10 0 10 . 20 30 40 50
Temperature (° C)
Figure 5.14 Change in cell yield (+ ,O) (from Fig. 4.19) and growth rate (A.) of L. monocytogenes Scott A as a function of temperature. Rapid decline of yield occurred at temperatures approaching high and low temperature limits for growth. The normal physiological range of temperature for L. monocytogenes growth, 7°C to 35.5°C, were estimated from the constant range of cell yield. Thus, the middle of this range is the optimum temperature for metabolic efficiency which is 21.3°C. The yield data are reproduced from J . Kettlewell (unpublished). The growth rate data were from Ross (1993), J. Kettlewell, and this study (Chapter 4) .
169
Several lines of experimental evidence lend support to this hypothesis. For some
instances, Sorrells et al. (1989) reported growth of several strains of L. monocytogenes
in TSB acidified by HCl, lactic acid or other acidulants occurred in lower pH at 25°C but
not at 10° and 35°C. Several reports of the greatest antimicrobial effect of acidity on L.
monocytogenes occurred at temperature of 35°C when compared to at 7°, 13 °, and 21°C
(Ahamad and Marth, 1989; 1990). In addition, temperature at 25°C was also reported
(Salter, 1998) to provide an increase in osmotic tolerance for E. coli which its optimum
temperature for growth rate is ... 4o·c.
5.4.2 WATER ACTIVITY-PH-LACTIC ACID RESPONSE
The growth limits for L. monocytogenes determined by the interaction between water
activity, and pH, in the absence or presence of lactic acid, reveals a synergistic effect,
especially at the low water activity levels. When HCl was the acidulant, the optimum
water activity for growth was shown to be -0.995, however, when lactic acid was added,
this optimum aw appeared to shift toward a lower value of water activity, between 0.95 to
0.995. At this range of aw, the pH limit to growth appeared to be less sensitive to water
activity as the lactic acid concentration increased. The increase in pH sensitivity by lactic
acid was apparent at high aw. While the physiological basis for this is unknown, Cole et
al. (1990) reported that low concentrations of salt, 4-6% NaCl (aw of 0.977-0.964),
provided a slight protective effect agrunst inactivation of L. monocytogenes at low pH
values and 4-8% NaCl (aw of 0.977-0.950) provided a rapid recovery for pH-injured
cells than in the absence of salt. Other workers (de Martinis et al., 1997) also reported a
low level of salt (2-3.5% NaCl equal aw of 0.989-0.980) to be an optimum level in
supporting L. monocytogenes to tolerate other type of food preservatives including nisin.
Similar to the finding reported in the previous section that -21°C is the optimum
temperature for metabolic efficiency, in the combination effect of water activity and pH,
L. monocytogenes was also found to tolerate low pH better at temperature of 20°C than at
30°C. This emphasizes the essential role of incubation temperature on the tolerance of L.
monocytogenes, in particular in studies of the potential effect of a preservative on
microbial growth or survival.
Reduced aw enhanced L. monocytogenes inhibition as Ca.n be noticed from a steady
decrease in amount of [H+] required at the growth/no growth interfaces (Figs. 5.7a and
5.lOa) as aw decreases. The decrease in slopes of [H+] when lactic acid was added results
from the additional inhibitory effect of [UD].
170
The cause of the different results from kinetic and probability experiments at extreme aw level (Figs. 5.3c,d and 5.9c,d) which occurred in both strains is not obvious. For these
anomalies (8 conditions), growth occurred at a lower pH values in the probability
experiments while did not occur in the kinetic studies. There were some variations in
performing the experiments; 1) aeration: the kinetic experiment was processed on the TGI
operating with shaking (,..,33±1 rpm) while the growth/no growth experiments were
incubated statically. The increase in amount of oxygen was not reported to pose any
more inhibition of Listeria (ter Steeg et al., 1995), although there was no i:eport on the
effect of rocking, 2) amount of inoculum: McClure et al. (1989) reported on the effect of
inoculum size on NaCl inhibition for L. monocytogenes, i.e. the higher inoculum size the
higher probability for survival. In these studies, higher inoculum size {"'9x 10⁷ cfu/ml)
was used in kinetic studies to provide sufficient turbidity for the upper sensitivity of the
spectrophotometer when compared to -6x 10⁶ cfu/ml used in probability studies. Thus,
this is not the reason for the no growth observed in kinetic studies, 3) amount of nutrient
15 ml TSB-YE was prepared for kinetic experiments while 2 ml_ of similar broth
(quadruplicate) was used in probability experiments. Again, this is not likely to be the
reason, and 4) time for observation: in probability studies growth at those supporting
conditions was always observed within 3 weeks which was the incubation time for
kinetic studies,thus, sufficient time for any growth in the kinetic experiments to be
observed. Viable counts of the broth cultures were also performed to confirm the no
growth result. However, as several positive results were found from the probability
studies, there may be some unknown factors in the kinetic studies which caused these
erratic .growth/no growth results. There may be fluctuation in temperature which at the
very limit for growth, may be very significant. Apart from these anomalies, the data
obtained from kinetic studies agree with the results from probability studies and, thus, the
integration of data from both studies for generation of the probability model is supported.
To summarize; the increase in low temperature stress or osmotic stress caused an increase
in the pH sensitivity which demonstrates a synergistic effect of both, especially at extreme
conditions. Although the temperature and aw units are different and can not be compared,
the trends in pH-sensitivity in combination with lowered temperature or reduced aw over 1
the permissible range can be noticed. For pH-temperature stress; there is, in general a
consistent pH value which prevents growth in the temperature range of 10-30°C with
optimum temperature at ,..,20°C, both in the absence and presence of lactic acid.
However, in the pH-aw stress experiments, when HCI was the acidulant, there was a
s~eady increase in the pH which prevented growth in the range of aw from 0.995-0.95.
The addition of lactic acid appeared to change the inhibitory characteristic in that less
sensitivity to pH occurred in this range of aw. The differences between the effects of pH
temperature stress (Figs. 5.2 and 5.4) and pH-aw stress (Figs. 5. 7 and 5.10) can be seen
171
more clearly with the trends effect of [H+] and [UD] discussed above. Thus, these
observations suggest that temperature and aw may exert their effects on cellular functions
by different mechanism.
5.4.3 LACTIC ACID-PH'RESPONSE
At a constant temperature (-21°C) and aw (-0.96) the increase in pH sensitivity_ was
observed with the increase in concentration of lactic acid (Figs. 5.11 and 5.12). The
minimum pH1 at which growth occurred was found to increase as the. lactic acid
concentrations increased. For example, a 10-fold increase in lactic acid concentration
(e.g. from 20 mM to 200 mM) resulted in an increase of -0.6 pH unit at the growth limit.
Similar findings that the rate of inactivation was dependent on pH, type and concentration
of acidulant were reported for L. monocytogenes (Sorrells et al., 1989; Buchanan and
Golden, 1994), Yersinia enterocolitica (Adams et al., 1991), and Vibrio paraheamolyticus
(Miles, 1994).
Figs. 5.11 b and 5.12b illustrate the predominant effect of [H+] in the absence and in the
low level of lactic acid. This pH effect decreased rapidly with the addition of small
am_ount of lactic acid. Above -50 mM lactic acid, a steady decrease in the effect of [H+]
was observed. This effect occurred correspondingly with the effect of [UD] in that, at
low concentrations of lactic acid less [UD] was observed at the inhibitory conditions
(Figs. 5.llc and 5.12c) as greater inhibitory effect was caused by [H+]. The [UD]
effects became more profound with the increase of lactic acid concentration as shown by
the rise of the growth/no growth interface. Above ,..,50 mM a consistent level of [UD],
-4.5 mM, was observed at the interface of 50% probability for growth. The combination
effect of [H+] and [UD] on the inhibition of L. monocytogenes is in agreement with the
finding in Chapter 4 where the rate of inactivation caused by each component was
separately calculated (see section 4.4.1.3).
The decrease of [H+] and increase of [UD] at the growth/no growth interface following
the increase of lactic acid concentration and the minimum pH1 for growth were clearly
explained by the models underlying hypotheses (Figs. 5.11 and 5.12). This illustrates
the good performance of the predicted growth/no growth interface obtained from the
probability model.~ (Eqns. 5.1 and 5.2) including the data from kinetic studies.
The water activity in the lactic acid concentration studies was -0.96 which is a typical
water activity of cold-smoked salmon. Figs. 5.11 and 5.12 demonstrate that at -20°C
(represents a temperature abuse) none of the levels of lactic acid tested (up to 450 mM)
could inhibit growth of L. monocytogenes in cold-smoked salmon at its typical pH of
"'"'6.0. At 5°C, aw -0.96 and pH -6.0 (data not shown graphically, see Appendix G,
172
Table G. 6), :850 mM lactic acid was required to inhibit growth of L. monocytogenes.
Although <;me of the main functions of lactic acid used in food products, apart from the
preservation, is flavour enhancement, and the use of lactic acid in foods is not limited (see
section 4.1), a change in organoleptic properties may be caused by the use of such a high
level of lactic acid. Alternatively, the pH of cold-smoked salmon could be manipulated
by lactic acid. This possibility was investigated, as a part of validation, described in
Chapter 6. It is noteworthy that the high .inoculum of L. monocytogenes used in
preparing the data for the predictive models represents a worse case scenario. Naturally
contaminated cold-smoked salmon was generally reported to have <10-100 cfu L. mono
cytogenes lg (see section 3.1.1.1).
5. 4. 4 INTER· STRAIN VARIABILITY
A high degree of similarity of the levels of pH, in com)Jination with temperature, aw, or
lactic acid required to prevent growth of L. monocytogenes was found for the two strains
investigated. Similar parameter estimates, <lwmin' pHmin, and Umin, were -generated from
both probability models (Eqns. 5.1 and 5.2). Good performance observed when fitting
both models to the observed data indicate the validity of the methodology used in
modelling and in predictions for both strains. Thus, this sug-gests there were no
substantial differences between the strains of L. monocytogenes (Scott A and L5)
employed in this study, and a single model may be sufficient for this -species for the
conditions tested in this study.
' '
173
6 MODELS VALIDATION
6.1 INTRODUCTION
Predictive models, whether kinetic or probabilistic, (as demonstrated in Chapters 4 and 5
respectively) are developed typically from observations of growth and/or no growth of
microbes in well-defined liquid substrates and under well-controlled environmental
conditions. Although good fit of the models to the data used to generate them was
demonstrated in the previous chapter, before the models can be used in practice it is
necessary also to test their performance in foods, which are heterogeneous and ill-defined
environments. This is the so-called 'validation' process (Ross, 1993).
As there are numerous types of foods available, it is well documented (WHO Working
Group, 1988; Mackey and Bratchell, 1989) that L. monocytogenes can be eliminated by
adequate cooking. Therefore, in this study the models were developed with intended
application to ready-to-eat foods which are consumed without any subsequent heating. In
particular, cold-smoked salmon, a lightly preserved RTE food which is sliced, reformed
and handled without any listericidal process and, additionally, can support growth of L.
monocytogenes (see review in section 3.1.1) was considered. In addition to temperature,
water activity, and acidity as major factors controlling growth of microbes in foods, the
models also contain lactic acid concentrations as variable which is of interest as another
factor for non-thermal inactivation of L. monocytogenes.
A number of validation methods can be used to assess the predictive ability of a model
(see details in McMeekin et al., 1993, pp. '59-60). In this study challenge tests involving
direct addition of different levels of lactic acid onto traditional cold-smoked salmon
products were performed as an approach to non-thermal inhibition or inactivation of L.
monocytogenes and also to test the performance of the models. In addition, to assess the
potential for the model to be used generally, the models prediction to different types of
foods supporting growth of different strains of L. monocytogenes reported in literature
were also evaluated. The bias and accuracy factors described earlier (see section 4.1.1.3)
were employed as an indication of the reliability of the models.' ·
174
6.2 MATERIALS AND METHODS
6.2. l MATERIALS
Details of consumables, reagents and media, and equipment used are presented m
Appendix A.
6. 2. 2 METHODS FOR VALIDATION OF KINETIC MODELS
Predicted growth rates from the models developed in Chapter 4 were corrected, using
Eqn. 4.6, for the systematic difference between the estimates from turbidity and viable
count data (see section 4.1.1. l). The corrected growth rate was compared to independent
growth rate data obtained from: 1) challenge test results for the traditional or lactic acid
modified cold-smoked salmon, and 2) published data for the growth rates of L. mono
cytogenes in various foods, using bias (Eqn. 4.9) and accuracy (Eqn. 4.10) factors.
6.2.2.1 Validation using results from challenge tests on cold-smoked
salmon
L. monocytogenes LS, a cold-smoked salmon wild type strain, was employed in a series
of experiments on traditional cold-smoked salmon and that product modified by the
addition of various concentration of L-lactic acid.
Preliminary tests
Two batches of thin sliced (-3 mm thickness) cold-smoked salmon (Salmo salar)
produced in two different processing runs were obtained from a local commercial
producer. The first batch of the product was used in the 'study of 'aerobic incubation
without lactic acid treatment' described below. The second batch was used for all the
other challenge tests, i.e~ 'vacuum-packed with and without lactic acid treatment'. To
ensure the absence of Listeria spp. in the products prior to the inoculation of L. mono
cytogenes LS, the product was tested using the method described in section 3.2.2.2.
Growth rate detenninations on cold-smoked salmon I
• .Sample Preparation and Inoculation L. monocytogenes LS was grown as described in
section 4.2.2.1. To minimise changes in aw, washed cells were suspended in 100 ml of
chilled (4°C) 5.S% NaCl, to obtain approximately lxl05 cfu/ml. Ross (1993) found that
7% NaCl, had no effect on viability of cells during a similar inoculation process. The
inoculum was kept in an ice water bath before and during the inoculation process.
175
Water activity in various parts of the product was measured, and sites with consistent aw were cut into 4 cm x 4 cm pieces ready for the two sets of experiments described below.
All sample preparation and inoculation procedures were performed in a laminar flow
cabinet to prevent extraneous contaminants.
a) Aerobic incubation without lactic acid treatment:
The behaviour of L. monocytogenes on traditional commercial cold-smoked salmon
incubated at 5°C, and 20°C in aerobic packages was determined. Each of 40 pieces was
dipped into -25 ml of prepared culture suspension for 15 sec, removed and placed onto a
sterile stainless steel mesh to drain off excess liquid. After dipping -20 pieces, the
inoculum was replaced with a new culture suspension from cold stock. Each of the
inoculated pieces was placed in a 100x160 mm stomacher bag (Disposable Products).
Excess air was squeezed out by hand, and the bags were folded in half several times, and
secured with _adhesive tape. All samples were kept on ice before and after the inoculation,
until incubations were commenced.
b) Anaerobic (i.e. vacuum-packed) incubation with and without lactic acid treatment:
With lactic acid treatment. In order to minimise changes in water activity of the product
after immersion ~nto lactic acid, each concentration of lactic acid, i.e. 200, 250, 300, 350,
and 450 mM, was also prepared by adding filter sterilised lactic acid into sterile 5.5%
NaCl to match the aw of the product in a 100 ml volumetric flask. Each piece was dipped
in the prepared concentration of lactic acid for 15 seconds and th~n left on a sterile
stainless steal mesh to drain off excess liquid. After dipping -; 15 pieces, a fresh, lactic
acid suspension was used. To mimic the oxygen permeability of the vacuum-packed
retail product, each piece of sample was placed separately in a 172x253 mm plastic bag as
used by the processor to packag~ products for retail display and sale, and weighed. All
samples were kept on ice before and after lactic acid application. To avoid changes in
lactic acid concentration during sample preparation, the process was started from the
-lowest concentration of lactic acid, 200 mM, and the stainless steel mesh was dried with a
sterile paper towel and sprayed with alcohol between each concentration of lactic acid. \
Samples were inoculated as described below:
Without lactic acid treatment. Each piece was kept separately in the retail package used by
the processor, and weighed. The samples were inoculated as described below: ·
Approximately lx 105 cfu/ml L. monocytogenes culture was prepared in the same manner
as described above. 25 µl of the culture was spread onto each side of cold-smoked
salmon piece to obtain approximately 103 cfu/g or 104 cfu/piece. aw of the inoculated
products were measured. The product was kept on ice, and immediately vacuum-packed
176
using a chamber vacuum packaging machine operated at vacuum (0.5 mbar) and 60% heat
welding power.
Incubation of product
Batches of 20-36 samples individually packaged were then placed in water-tight plastic
bags and immersed in 5°C or 20°C water baths. To ensure complete temperature control,
all bags were weighted down so that samples were incubated below the level of water in
the water bath.
Assessment of growth
Duplicate samples were withdrawn at 10 to 18 sampling intervals. For the trials with high
levels of lactic acid where L. monocytogenes was anticipated to be inhibited or grow very
slowly, monitoring was continued for up to 26 days which is the recommended shelf-life
of the retail product at 5°C. Chilled diluent (0:·1 % peptone+0.85% NaCl) was added in
the ratio of 4 mls or 9 mls per gram of product (preinoculation weight). The sample was
stomached for , ... 2 min. Serial tenfold dilutions of the homogenate were then prepared in
0.1 % peptone+0.85% NaCl (ambient temperature). Spread plates of three dilutions were
performed on Listeria selective agar base with Listeria Selective Supplement (Oxford
Formulation) (OXF, Oxoid), in duplicate, and on TSA-YE (replicated in some dilutions).
The plates were incubated for 36-48 hr at 30°C. After completion of the enumeration
process, the pH of the homogenate was measured. Two samples from each block of
experiments were withheld at the commencement of incubations. These samples were
immediately processed as described above to provide estimates of 'zero time' counts for
incubations at all levels of lactic acid in that block. The number of L. monocytogenes LS
was determined from the number of typical colonies on OXF. Total viable counts (fVC)
were determined from the numbers on TSA-YE. Colony counting methods are described
in Appendix A, section A.2.2.
Growth rate estimation
Growth rate, estimated from colony counts, were calculated from the fitted parameters of
Eqn. 4.1 using Eqn. 4.2. Generation time was calculated as the reciprocal of the growth
rate.
6.2.2.2 Validation using Datafrom literature
GI:"owth data of L. monocytogenes from a range of published challenge tests with cold
smoked salmon, fish products and various foods were compiled. Comparison of those
generation times with the predictions calculated from four different models were made. In
cases when there was no direct report of generation time in the literature, it was manually
177
Calculated (see Fig. 4.1) from ·a plot of the growth curve data. In cases when the relevant
values were reported as a range or were not documented, representative or estimated
Values appropriate to the product were used. Alternatively, values cited in other
publications (Buchanan et al., 1993; Ross, 1993; Dalgaard and J!Zlrgensen, 1998) in
which literature values were compared to model predictions, were adopted.
Natural accumulatiop. of lactic acid in fish flesh generated from anaerobic conversion of its
glycogen reserves during rigor mortis is reported (Partmann, 1965; Sikorski et al., 1990).
In fresh salmon muscle, values were reported to range from 0.6 to 1.0% (Partmann,
1965). Approximate 5000 ppm (0.5%) and 5000-10000 ppm (0.5-1 %) lactate were also
found in cold-smoked salmon produced in Denmark (Dalgaard, 1997) and Canadian cold
smoked salmon (Truelstrup Hansen et al., 1995) respectively. The average level of 8,000
ppm water phase lactate (-89 mM) (Truelstrup Hansen et al., 1995; Dalgaard and
J!Zlrgensen, 1998) was, therefore, also included in the comparisons of the models
predictions for 'fish' in this study (Table 6.1-6.3).
Note that predictions were obtained only by interpolation within the ranges covered by the
models (Chapter 4, Tables 4.4 and 4.5). Data for which one or more factors exceeded the
range of the model, could result in the need, to calculate the logarithm of a negative
number, which is not possible. This is indicated as "not done" (ND) in the results.
6.2.2.3 Indices of bias and accuracy.
The indices of goodness-of-fit of a kinetic model to the observed data introduced by Ross
( 1996) are the "bias" and "accuracy" factors. These indices are employed in the validation
of kinetic models in this chapter to serve as an assessment of the models performance. To
'avoid reiteration (see section 4.1.1.3), only the equations are re-presented here.
BIAS factor = 10 (~: log(GTobserveiGTpredicted))/n (4.9)
ACCURACY factor = 10 U: I Iog(GT observe/GT predicted) I )In (4.10)
where GT observed is the observed generation time (h), GT predicted is the predicted genera
tion time (h), and n is the number of observations used in the calculation.
6:2.3 METHODS FOR VALIDATION OF PROBABILITY MODELS
Data reported in the literature were transformed to "growth" or "no growth" and compared
to the probability models (Eqns. 5.1 and 5.2) predictions, using two methods: 1) a
178
graphical method; comparisons were made with the growth/no growth interfaces predicted
by the models corresponding to the conditions reported in the literature, 2) a tabular
method comparing percentage of probability for growth; the no growth conditions (0%
probability for growth) from the published data were compared to the predicted percent
probability for growth A predicted probability for growth of ~50% (P ~0.5) was
considered a correct prediction of no growth. These comparisons were combined and
presented as percentage correct predictions.
6.3 RESULTS
6. 3.1 VALIDATION OF KINETIC MODELS
Table 6.1 presents comparisons of the generation times of L. monocytogenes L5 from the
novel challenge tests on cold-smoked salmon and the predicted values from Eqns.
4.17a,b and 4.18a,b developed for L. monocytogenes Scott A and LS respectively.
Comparison of predicted generation times from those equations versus published
generation times of various strains of L. monocytogenes on cold-smoked salmon and fish
products is presented in, Table 6.2. Reported generation times in laboratory media and
food which contained lactic acid were also compared to the predictions (Table 6.3).
Published generation times of L. monocytogenes Scott A, and other strains on various
foods compared to predicted values are presented in Table 6.4, and 6.5(a-c) respectively.
Table 6.6 compares those equations to generation times determined in naturally
contaminated cold-smoked salmon. The bias and accuracy factors, indicating the models\
performance, are also given in each Table and summarised in Tabfe 6. 7.
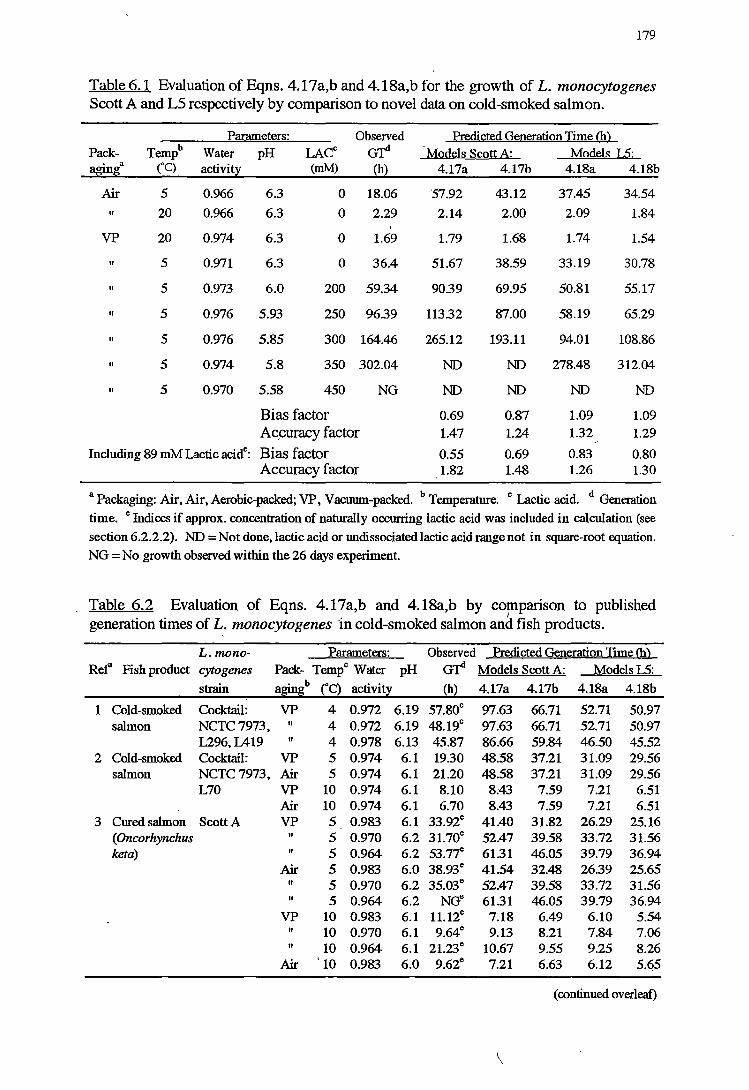
179
Table 6.1 Evaluation of Eqns. 4.17a,b and 4.18a,b for the growth of L. monocytogenes Scott A and LS respectively by comparison to novel data on cold-smoked salmon.
Pack-• a agmg
Air II
VP
II
II
II
II
II
II
5
20
20
5
5
5
5
5
5
Parameters: Water pH activity
0.966 6.3
0.966 6.3
0.974 6.3
0.971 6.3
0.973 6.0
0.976 5.93
0.976 5.85
0.974 5.8
0.970 5.58
LAC (mM)
Observed G'J"1 (h)
0 18.06
0 2.29
0 1.69
0 36.4
200 59.34
250 96.39
300 164.46
350 302.04
450 NG
Bias factor Ac,curacy factor
Including 89 mM Lactic acide: Bias factor Accuracy factor
Predicted Generation Time OU Models Scott A: Models 15:
4.17a 4.l'lb 4.18a 4.18b
'57.92
2.14
1.79
51.67
90.39
113.32
265.12
ND
ND
0.69
1.47
0.55 1.82
43.12
2.00
1.68
38.59
69.95
87.00
193.11
ND
ND
0.87 1.24
0.69 1.48
37.45
2.09
1.74
33.19
50.81
58.19
94.01
278.48
ND
1.09
1.32
0.83 1.26
34.54
1.84
1.54
30.78
55.17
65.29
108.86
312.04
ND
1.09 1.29
0.80 1.30
a Packaging: Air, Air, Aerobic-packed; VP, Vacuum-packed. b Temperature. c Lactic acid. d Generation
time. e Indices if approx. concentration of naturally occurring lactic acid was included in calculation (see
section 6.2.2.2). ND = Not done, lactic acid or undissociated lactic acid range not in square-root equation.
NG =No growth observed within the 26 days experiment.
Table 6.2 Evaluation of Eqns. 4.17a,b and 4.18a,b by comparison to published generation times of L. monocytogenes in cold-smoked salmon and fish products.
L. mono- Parameters: Observed Predicted Generation Time(!!) Ref" Fish product cytogenes Pack- Tempe Water pH G'J"1 Models Scott A: Models LS:
strain . b
a~~ (°C) activit~ (h) 4.17a 4.17b 4.18a 4.18b
1 Cold-smoked Cocktail: VP 4 0.972 6.19 57.80e 97.63 66.71 52.71 50.97 salmon NCTC7973, II 4 0.972 6.19 48.19e 97.63 66.71 52.71 50.97
L296,L419 II 4 0.978 6.13 45.87 86.66 59.84 46.50 45.52 2 Cold-smoked Cocktail: VP 5 0.974 6.1 19.30 48:58 37.21 31.09 29.56
salmon NCTC7973, Air 5 0.974 6.1 21.20 48.58 37.21 31.09 29.56 L70 VP 10 0.974 6.1 8.10 8:43 7.59 7.21 6.51
Air 10 0.974 6.1 6.70 8.43 7.59 7.21 6.51 3 Cured salmon Scott A VP 5 0.983 6.1 33.92e 41.40 31.82 26.29 25.16
(Oncorhynchus II 5 0.970 6.2 31.70e 52.47 39.58 33.72 31.56 keta) II 5 0.964 6.2 53.77e 61.31 46.05 39.79 36.94
Air 5 0.983 6.0 38.93e 41.54 32.48 26.39 25.65 II 5 0.970 6.2 35.03e 52.47 39.58 33.72 31.56 II 5 0.964 6.2 NGe 61.31 46.05 39.79 36.94
VP 10 0.983 6.1 11.12e 7.18 6.49 6.10 5.54 II 10 0.970 6.1 9.64e 9.13 8.21 7.84 7.06 II 10 0.964 6.1 21.23e 10.67 9.55 9.25 8.26
Air '10 0.983 6.0 9.62e 7.21 6.63 6.12 5.(?5
(continued overleaf)
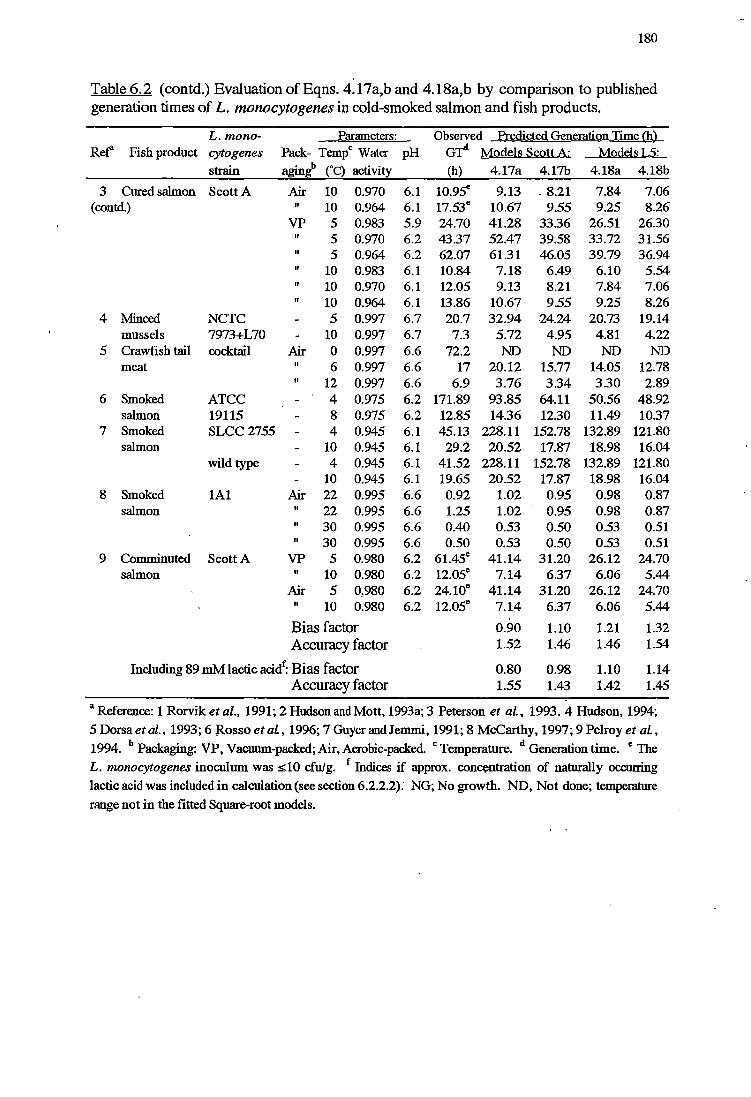
180
Table 6.2 (contd.) Evaluation of Eqns. 4.17a,b and 4.18a,b by comparison to published generation times of L. monocytogenes in cold-smoked salmon and fish products.
L. mono- Parameters: Observed Predicted Generation Time (h) Ref' Fish product cytogenes Pack- Tempe Water pH Gr Models Scott A: Models LS:
strain aginl {°C) activity (h) 4.17a 4.17b 4.18a 4.18b
3 Cured salmon Scott A Air 10 0.970 6.1 10.95e 9.13 . 8.21 7.84 7.06 (contd.) II 10 0.964 6.1 17.53e 10.67 9.55 9.25 8.26
VP 5 0.983 5.9 24.70 41.28 33.36 26.51 26.30 II 5 0.970 6.2 43.37 52.47 39.58 33.72 31.56 II 5 0.964 6.2 62.07 61.31 46.05 39.79 36.94 II 10 0.983 6.1 10.84 7.18 6.49 6.10 5.54 II 10 0.970 6.1 12.05 9.13 8.21 7.84 7.06 II 10 0.964 6.1 13.86 10.67 9.55 9.25 8.26
4 Minced NCTC 5 0.997 6.7 20.7 32.94 -24.24 20.73 19.14 mussels 7973+L70 10 0.997 6.7 7.3 5.72 4.95 4.81 4.22
5 Crawfish tail cocktail Air 0 0.997 6.6 72.2 ND ND ND ND meat II 6 0.997 6.6 17 20.12 15.77 14.05 12.78
II 12 0.997 6.6 6.9 3.76 3.34 3.30 2.89 6 Smoked ATCC 4 0.975 6.2 171.89 93.85 64.11 50.56 48.92
salmon 19115 8 0.975 6.2 12.85 14.36 12.30 11.49 10.37 7 Smoked SLCC2755 4 0.945 6.1 45.13 228.11 152.78 132.89 121.80
salmon 10 0.945 6.1 29.2 20.52 17.87 18.98 16.04 wild type 4 0.945 6.1 41.52 228.11 152.78 132.89 121.80
10 0.945 6.1 19.65 20.52 17.87 18.98 16.04 8 Smoked lAl Air 22 0.995 6.6 0.92 1.02 0.95 0.98 0.87
salmon II 22 0.995 6.6 1.25 1.02 0.95 0.98 0.87 II 30 0.995 6.6 0.40 0.53 0.50 0.53 0.51 II 30 0.995 6.6 0.50 0.53 0.50 0.53 0.51
9 Comminuted Scott A VP 5 0.980 6.2 61.45e 41.14 31.20 26.12 24.70 salmon II 10 0.980 6.2 12.ose 7.14 6.37 6.06 5.44
Air 5 0,980 6.2 24.lOe 41.14 31.20 26.12 24.70 II 10 0.980 6.2 12.05e 7.14 6.37 6.06 5.44
Bias factor 0.90 1.10 1.21 1.32 Accuracy factor 1.52 1.46 1.46 1.54
Including 89 mM lactic acil: Bias factor 0.80 0.98 1.10 1.14 Accuracy factor 1.55 1.43 1.42 1.45
a Reference: 1 Rorvik et al., 1991; 2 Hudson and Mott, 1993a; 3 Peterson et al, 1993. 4 Hudson, 1994;
5 Dorsa et al., 1993; 6 Rosso et al, 1996; 7 Guyer andJemmi, 1991; 8 McCarthy, 1997; 9 Pelroy et al, 1994. b Packaging: VP, Vacuum-packed; Air, Aerobic-packed. c Temperature. d Generation time. e The
L. monocytogenes inoculum was :s;;lO cfu/g. c Indices if approx. concentration of naturally occuning
lactic acid was included in calculation (see section 6.2.2.2).' NG; No growth. ND, Not done; temperature
range not in the fitted Square-root models.
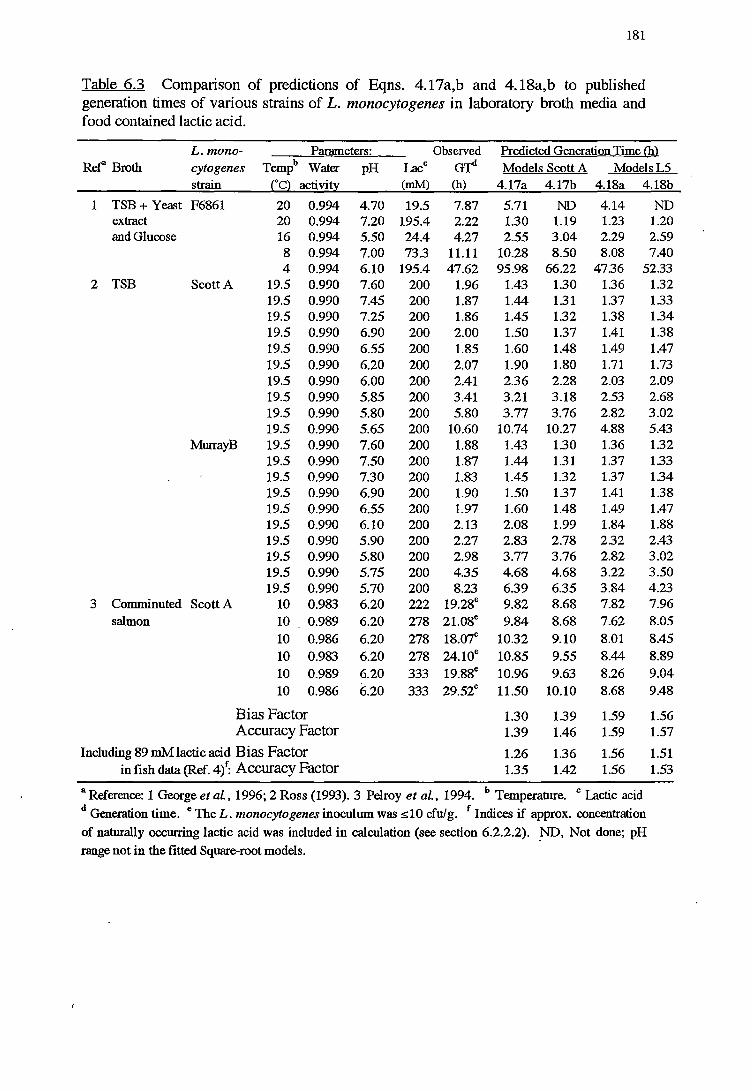
181
Table 6.3 Comparison of predictions of Eqns. 4.17a,b and 4.18a,b to published generation times of various strains of L. monocytogenes in laboratory broth media and food contained lactic acid.
L. mono- Parameters: Observed Predicted Generation Time (h) Ref" Broth cytogenes Tempb Water pH Lace G'J"1 Models Scott A Models LS
strain (°q activitr (mM) (h) 4.17a 4.17b 4.18a 4.18b
1 TSB +Yeast F6861 20 0.994 4.70 19.5 7.87 5.71 ND 4.14 ND extract 20 0.994 7.20 195.4 2.22 1.30 1.19 1.23 1.20 and Glucose 16 0.994 5.50 24.4 4.27 2.55 3.04 2.29 2.59
8 0.994 7.00 73.3 11.11 10.28 8.50 8.08 7.40 4 0.994 6.10 195.4 47.62 95.98 66.22 47.36 52.33
2 TSB Scott A 19.5 0.990 7.60 200 1.96 1.43 1.30 1.36 1.32 19.5 0.990 7.45 200 1.87 1.44 1.31 1.37 1.33 19.5 0.990 7.25 200 1.86 1.45 1.32 1.38 1.34 19.5 0.990 6.90 200 2.00 1.50 1.37 1.41 1.38 19.5 0.990 6.55 200 1.85 1.60 1.48 1.49 1.47 19.5 0.990 6.20 200 2.07 1.90 1.80 1.71 1.73 19.5 0.990 6.00 200 2.41 2.36 2.28 2.03 2.09 19.5 0.990 5.85 200 3.41 3.21 3.18 2.53 2.68 19.5 0.990 5.80 200 5.80 3.77 3.76 2.82 3.02 19.5 0.990 5.65 200 10.60 10.74 10.27 4.88 5.43
MurrayB 19.5 0.990 7.60 200 1.88 1.43 1.30 1.36 1.32 19.5 0.990 7.50 200 1.87 1.44 1.31 1.37 1.33 19.5 0.990 7.30 200 1.83 1.45 1.32 1.37 1.34 19.5 0.990 6.90 200 1.90 1.50 1.37 1.41 1.38 19.5 0.990 6.55 200 1.97 1.60 1.48 1.49 1.47 19.5 0.990 6.10 200 2.13 2.08 1.99 1.84 1.88 19.5 0.990 5.90 200 2.27 2.83 2.78 232 2.43 19.5 0.990 5.80 200 2.98 3.77 3.76 2.82 3.02 19.5 0.990 5.75 200 4.35 4.68 4.68 3.22 3.50 19.5 0.990 5.70 200 8.23 6.39 6.35 3.84 4.23
3 Comminuted Scott A 10 0.983 6.20 222 19.28e 9.82 8.68 7.82 7.96 salmon 10 0.989 6.20 278 21.08e 9.84 8.68 7.62 8.05
10 0.986 6.20 278 18.07e 10.32 9.10 8.01 8.45 10 0.983 6.20 278 24.lOe 10.85 9.55 8.44 8.89 10 0.989 6.20 333 19.88e 10.96 9.63 8.26 9.04 10 0.986 6.20 333 29.52e 11.50 10.10 8.68 9.48
Bias Factor 1.30 1.39 1.59 1.56 Accuracy Factor 1.39 1.46 1.59 1.57
Including 89 mM lactic acid Bias Factor 1.26 1.36 1.56 1.51 in fish data (Ref. 4l Accuracy Factor 1.35 1.42 1.56 1.53
a Reference: 1 George et al, 1996; 2 Ross (1993). 3 Pelroy et al., 1994. b Temperature. c lactic acid
d Generation time. e The L. monocytogenes inoculum was ::;;10 cfu/g. r Indices if approx. concentration
of naturally occurring lactic acid was included in calculation (see section 6.2.2.2). _ND, Not done; pH
range not in the fitted Square-root models.
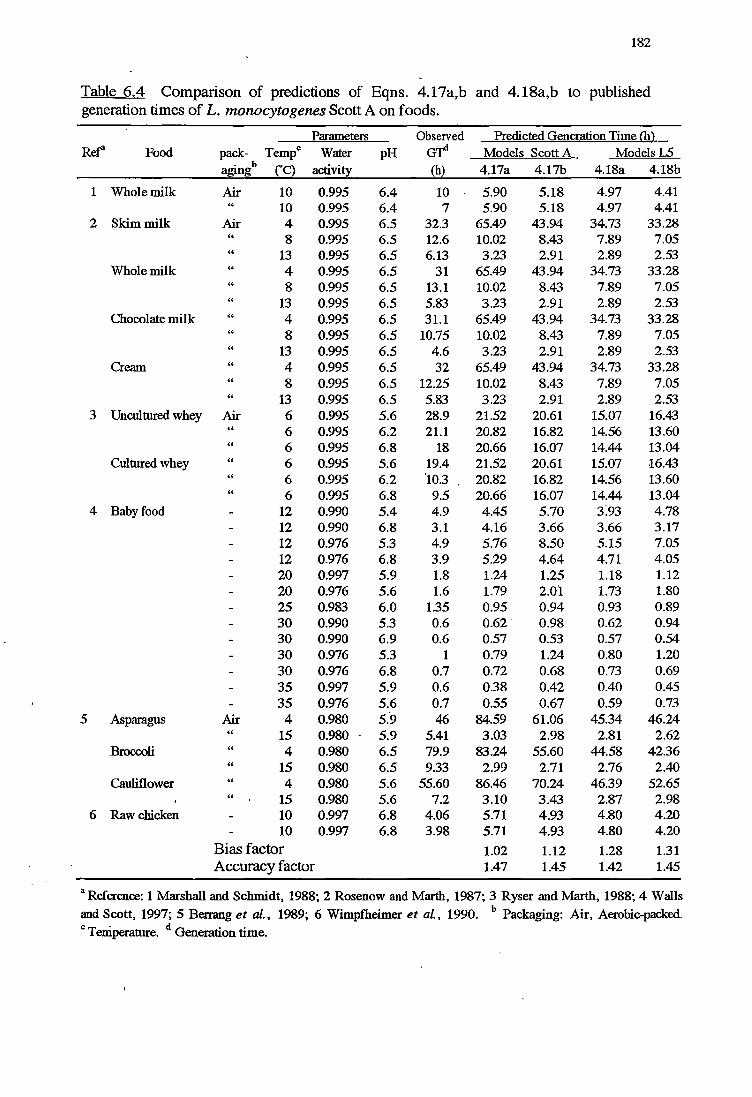
182
Table 6.4 Comparison of predictions of Eqns. 4. l 7a,b and 4.18a,b to published generation times of L. monocytogenes Scott A on foods.
Parameters Observed Predicted Generation Time (h) Ref' Food pack- Tempe Water pH G'f'1 Models Scott A Models LS
b agi.ng (°C) activity (h) 4.17a 4.17b 4.18a 4.18b
1 Whole milk Air 10 0.995 6.4 10 5.90 5.18 4.97 4.41 10 0.995 6.4 7 5.90 5.18 4.97 4.41
2 Skim milk Air 4 0.995 6.5 32.3 65.49 43.94 34.73 33.28 8 0.995 6.5 12.6 10.02 8.43 7.89 7.05
" 13 0.995 6.5 6.13 3.23 2.91 2.89 2.53 Whole milk " 4 0.995 6.5 31 65.49 43.94 34.73 33.28
" 8 0.995 6.5 13.1 10.02 8.43 7.89 7.05 13 0.995 6.5 5.83 3.23 2.91 2.89 2.53
Chocolate milk " 4 0.995 6.5 31.1 65.49 43.94 34.73 33.28 8 0.995 6.5 10.75 10.02 8.43 7.89 7.05
" 13 0.995 6.5 4.6 3.23 2.91 2.89 2.53 Cream " 4 0.995 6.5 32 65.49 43.94 34.73 33.28
" 8 0.995 6.5 12.25 10.02 8.43 7.89 7.05 " 13 0.995 6.5 5.83 3.23 2.91 2.89 2.53
3 Uncultured whey Air 6 0.995 5.6 28.9 21.52 20.61 15.07 16.43 6 0.995 6.2 21.1 20.82 16.82 14.56 13.60 6 0.995 6.8 18 20.66 16.07 14.44 13.04
Cultured whey " 6 0.995 5.6 19.4 21.52 20.61 15.07 16.43 6 0.995 6.2 '10.3 ' 20.82 16.82 14.56 13.60
" 6 0.995 6.8 9.5 20.66 16.07 14.44 13.04 4 Baby food 12 0.990 5.4 4.9 4.45 5.70 3~93 4.78
12 0.990 6.8 3.1 4.16 3.66 3.66 3.17 12 0.976 5.3 4.9 5.76 8.50 5.15 7.05 12 0.976 6.8 3.9 5.29 4.64 4.71 4.05 20 0.997 5.9 1.8 1.24 1.25 1.18 1.12 20 0.976 5.6 1.6 1.79 2.01 1.73 1.80 25 0.983 6.0 1.35 0.95 0.94 0.93 0.89 30 0.990 5.3 0.6 0.62' 0.98 0.62 0.94 30 0.990 6.9 0.6 0.57 0.53 0.57 0.54 30 0.976 5.3 1 0.79 1.24 0.80 1.20 30 0.976 6.8 0.7 0.72 0.68 0.73 0.69 35 0.997 5.9 0.6 0.38 0.42 0.40 0.45 35 0.976 5.6 0.7 0.55 0.67 0.59 0.73
5 Asparagus Air 4 0.980 5.'9 46 84.59 61.06 45.34 46.24 15 0.980 5.9 5.41 3.03 2.98 2.81 2.62
Broccoli 4 0.980 6.5 79.9 83.24 55.60 44.58 42.36 " 15 0.980 6.5 9.33 2.99 2.71 2.76 2.40
Cauliflower " 4 0.980 5.6 55.60 86.46 70.24 46.39 52.65 " 15 0.980 5.6 7.2 3.10 3.43 2.87 2.98
6 Raw chicken 10 0.997 6.8 4.06 5.71 4.93 4.80 4.20 10 0.997 6.8 3.98 5.71 4.93 4.80 4.20
Bias factor 1.02 1.12 1.28 1.31 Accuracy factor 1.47 1.45 1.42 1.45
a Reference: 1 Marshall and Schmidt, 1988; 2 Rosenow and Marth, 1987; 3 Ryser and Marth, 1988; 4 Walls and Scott, 1997; 5 Berrang et al., 1989; 6 Wimpfheimer et al., 1990. b Packaging: Air, Aerobic-packed. c Temperature. d Generation time.
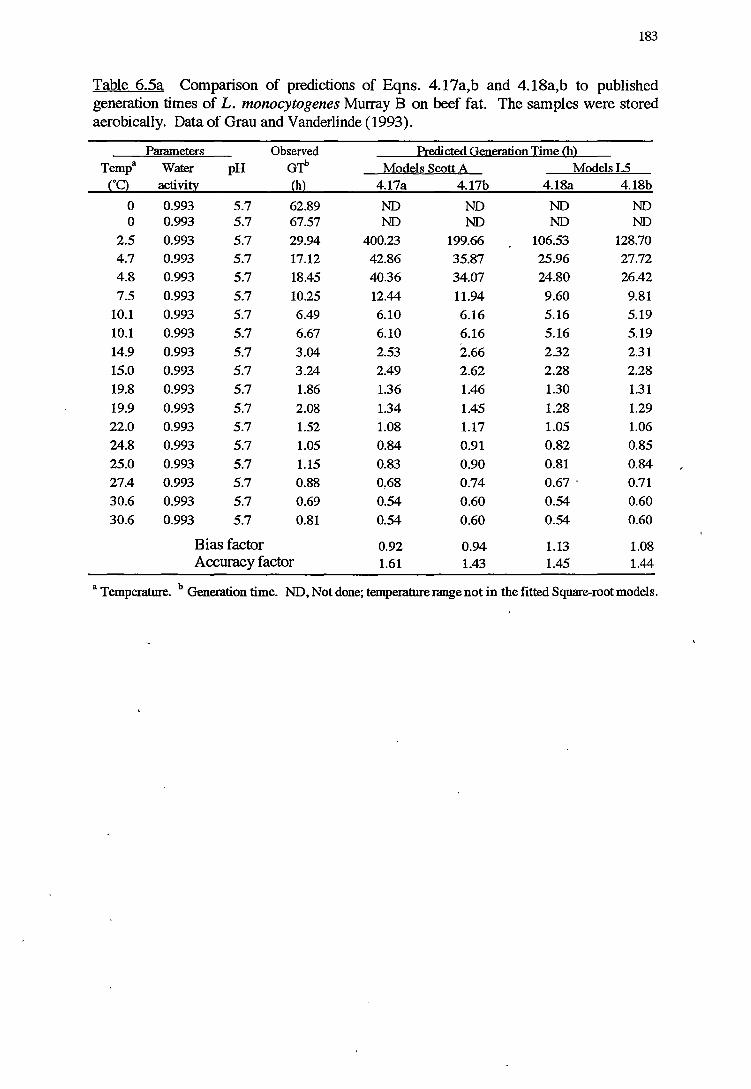
183
Table 6.5a Comparison of predictions of Eqns. 4.17a,b and 4.18a,b to published generation times of L. monocytogenes Murray B on beef fat. The samples were stored aerobically. Data of Grau and Vanderlinde (1993).
Parameters Observed Predicted Generation Time@ Temp a Water pH GT" Models Scott A ModelsL5
rq activitl'. (hl 4.17a 4.17b 4.18a 4.18b
0 0.993 5.7 62.89 ND ND ND ND 0 0.993 5.7 67.57 ND ND ND ND
2.5 0.993 5.7 29.94 400.23 199.66 106.53 128.70
4.7 0.993 5.7 17.12 42.86 35.87 25.96 27.72
4.8 0.993 5.7 18.45 40.36 34.07 24.80 26.42
7.5 0.993 5.7 10.25 12.44 11.94 9.60 9.81
10.1 0.993 5.7 6.49 6.10 6.16 5.16 5.19
10.1 0.993 5.7 6.67 6.10 6.16 5.16 5.19
14.9 0.993 5.7 3.04 2.53 2.66 2.32 2.31
15.0 0.993 5.7 3.24 2.49 2.62 2.28 2.28
19.8 0.993 5.7 1.86 1.36 1.46 1.30 1.31
19.9 0.993 5.7 2.08 1.34 1.45 1.28 1.29
22.0 0.993 5.7 1.52 1.08 1.17 1.05 1.06
24.8 0.993 5.7 1.05 0.84 0.91 0.82 0.85
25.0 0.993 5.7 1.15 0.83 0.90 0.81 0.84
27.4 0.993 5.7 0.88 0,68 0.74 0.67. 0.71
30.6 0.993 5.7 0.69 0.54 0.60 0.54 0.60
30.6 0.993 5.7 0.81 0.54 0.60 0.54 0.60
Bias factor 0.92 0.94 1.13 1.08 Accuracy factor 1.61 1.43 1.45 1.44
a Temperature. b Generation time. ND, Not done; temperature range not in the fitted Square-root models.
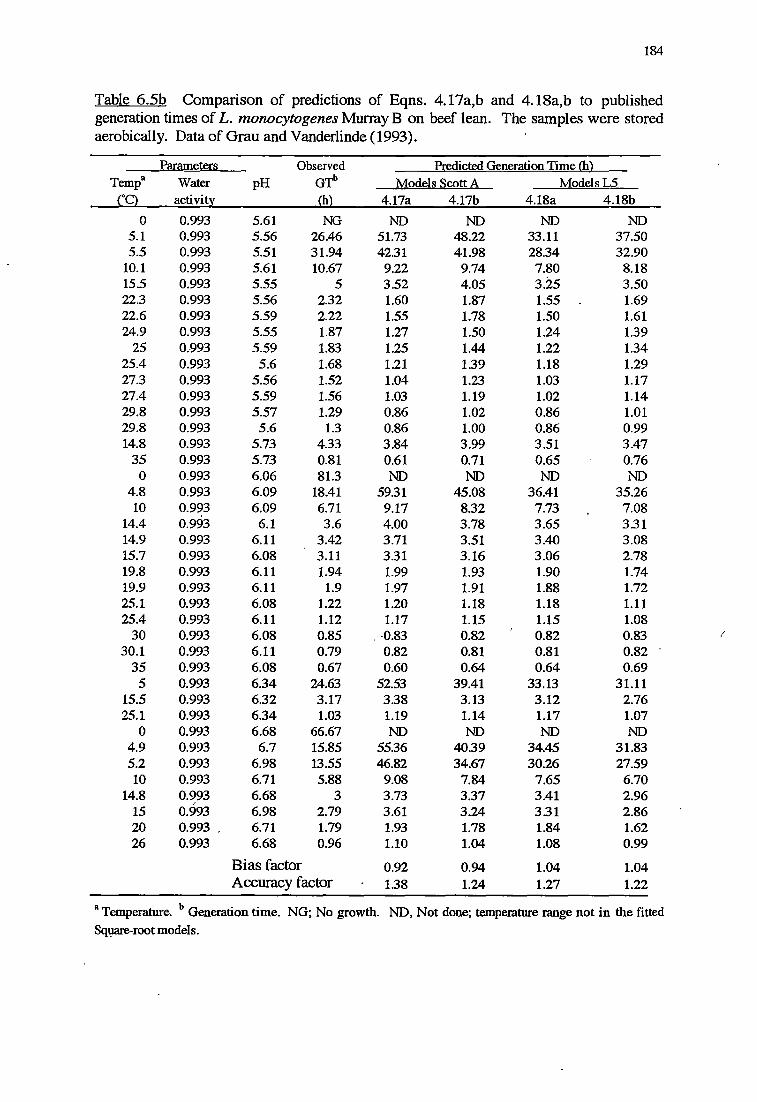
184
Table 6.5b Comparison of predictions of Eqns. 4.17a,b and 4.18a,b to published generation times of L. monocytogenes Murray B on beef lean. The samples were stored aerobically. Data of Grau and Vanderlinde (1993).
Parameters Observed Predicted Generation Time OD Temp a Water pH GTb Models Scott A ModelsL5
{°C) activit~ {h) 4.17a 4.17b 4.18a 4.18b
0 0.993 5.61 NG ND ND ND ND 5.1 0.993 5.56 26.46 51.73 48.22 33.11 37.50 5.5 0.993 5.51 31.94 42.31 41.98 28.34 32.90
10.1 0.993 5.61 10.67 9.22 9.74 7.80 8.18 15.5 0.993 5.55 5 3.52 4.05 3.25 3.50 22.3 0.993 5.56 2.32 1.60 1.87 1.55 1.69 22.6 0.993 5.59 2.22 1.55 1.78 1.50 1.61 24.9 0.993 5.55 1.87 1.27 1.50 1.24 1.39
25 0.993 5.59 1.83 1.25 1.44 1.22 1.34 25.4 0.993 5.6 1.68 1.21 1.39 1.18 1.29 27.3 0.993 5.56 1.52 1.04 1.23 1.03 1.17 27.4 0.993 5.59 1.56 1.03 1.19 1.02 1.14 29.8 0.993 5.57 1.29 0.86 1.02 0.86 1.01 29.8 0.993 5.6 1.3 0.86 1.00 0.86 0.99 14.8 0.993 5.73 4.33 3.84 3.99 3.51 3.47
35 0.993 5.73 0.81 0.61 0.71 0.65 0.76 0 0.993 6.06 81.3 ND ND ND ND
4.8 0.993 6.09 18.41 59.31 45.08 36.41 35.26 10 0.993 6.09 6.71 9.17 8.32 7.73 7.08
14.4 0.993 6.1 3.6 4.00 3.78 3.65 3.31 14.9 0.993 6.11 3.42 3.71 3.51 3.40 3.08 15.7 0.993 6.08 3.11 3.31 3.16 3.06 2.78 19.8 0.993 6.11 1.94 1.99 1.93 1.90 1.74 19.9 0.993 6.11 1.9 1.97 1.91 1.88 1.72 25.1 0.993 6.08 1.22 1.20 1.18 1.18 1.11 25.4 0.993 6.11 1.12 1.17 1.15 1.15 1.08
30 0.993 6.08 0.85 - -0.83 0.82 0.82 0.83 I
30.1 0.993 6.11 0.79 0.82 0.81 0.81 0.82 35 0.993 6.08 0.67 0.60 0.64 0.64 0.69
5 0.993 6.34 24.63 52.53 39.41 33.13 31.11 15.5 0.993 6.32 3.17 3.38 3.13 3.12 2.76 25.1 0.993 6.34 1.03 1.19 1.14 1.17 1.07
0 0.993 6.68 66.67 ND ND ND ND 4.9 0.993 6.7 15.85 55.36 40.39 34.45 31.83 5.2 0.993 6.98 13.55 46.82 34.67 30.26 27.59 10 0.993 6.71 5.88 9.08 7.84 7.65 6.70
14.8 o.~93 6.68 3 3.73 3.37 3.41 2.96 15 0.993 6.98 2.79 3.61 3.24 331 2.86 20 0.993 6.71 1.79 1.93 1.78 1.84 1.62 26 0.993 6.68 0.96 1.10 1.04 1.08 0.99
Bias factor 0.92 0.94 1.04 1.04 Accuracy factor 1.38 1.24 1.27 1.22
a Temperature. b Generation time. NG; No growth. ND, Not done; temperature range not in the fitted Square-root models.
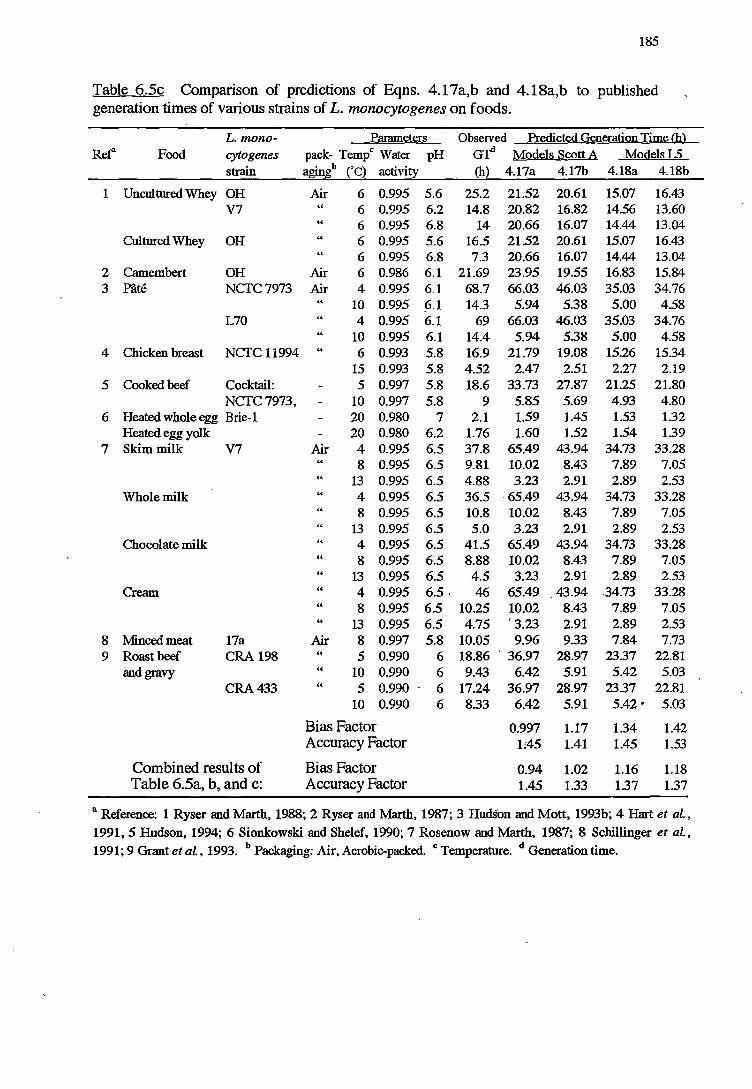
185
Table 6.5c Comparison of predictions of Eqns. 4. l 7a,b and 4.18a,b to published generation times of various strains of L. monocytogenes on foods.
L. mono- Parameters Observed Predicted Generation Time (b) Ref" Food cytogenes pack- Tempe Water pH G'f'1 Models Scott A ModelsL5
strain aginl (°C) activity (h) 4.17a 4.17b 4.18a 4.18b
1 Uncultured Whey OH Air 6 0.995 5.6 25.2 21.52 20.61 15.07 16.43 V7 " 6 0.995 6.2 14.8 20.82 16.82 14.56 13.60
6 0.995 6.8 14 20.66 16.07 14.44 13.04 Cultured Whey OH 6 0.995 5.6 16.5 21.52 20.61 15.07 16.43
6 0.995 6.8 7.3 20.66 16.07 14.44 13.04 2 Camembert OH Air 6 0.986 6.1 21.69 23.95 19.55 16.83 15.84 3 Pate NCTC7973 Air 4 0.995 6.1 68.7 66.03 46.03 35.03 34.76
" 10 0.995 ~.l 14.3 5.94 5.38 5.00 4.58 L70 4 0.995 6.1 69 66.03 46.03 35.03 34.76
10 0.995 6.1 14.4 5.94 5.38 5.00 4.58 4 Chicken breast NCTC 11994 " 6 0.993 5.8 16.9 21.79 19.08 15.26 15.34
15 0.993 5.8 4.52 2.47 2.51 2.27 2.19 5 Cooked beef Cocktail: 5 0.997 5.8 18.6 33.73 27.87 21.25 21.80
NCTC7973, 10 0.997 5.8 9 5.85 5.69 4.93 4.80 6 Heated whole egg Brie-1 20 0.980 7 2.1 1.59 1.45 1.53 1.32
Heated egg yolk 20 0.980 6.2 1.76 1.60 1.52 1.54 1.39 7 Skim milk V7 Air 4 0.995 6.5 37.8 65.49 43.94 34.73 33.28
8 0.995 6.5 9.81 10.02 8.43 7.89 7.05 " 13 0.995 6.5 4.88 3.23 2.91 2.89 2.53
Whole milk 4 0.995 6.5 36.5 '65.49 43.94 34.73 33.28 8 0.995 6.5 10.8 10.02 8.43 7.89 7.05
13 0.995 6.5 5.0 3.23 2.91 2.89 2.53 Chocolate milk " 4 0.995 6.5 41.5 65.49 43.94 34.73 33.28
8 0.995 6.5 8.88 10.02 8.43 7.89 7.05 " 13 0.995 6.5 4.5 3.23 2.91 2.89 2.53
Cream " 4 0.995 6.5' 46 65.49 43.94 .34.73 33.28 " 8 0.995 6.5 10.25 10.02 8.43 7.89 7.05
13 0.995 6.5 4.75 '3.23 2.91 2.89 2.53 8 Minced meat 17a Air 8 0.997 5.8 10.05 9.96 9.33 7.84 7.73 9 Roast beef CRA 198 " 5 0.990 6 18.86 . 36.97 28.97 23.37 22.81
and gravy 10 0.990 6 9.43 6.42 5.91 5.42 5.03 CRA433 " 5 0.990 . 6 17.24 36.97 28.97 23.37 22.81
10 0.990 6 8.33 6.42 5.91 5.42¥ 5.03
Bias Factor 0.997 1.17 1.34 1.42 Accuracy Factor 1:45 1.41 1.45 1.53
Combined results of Bias Factor 0.94 1.02 1.16 1.18 Table 6.5a, b, and c: Accuracy Factor 1.45 1.33 1.37 1.37
a Reference: 1 Ryser and Marth, 1988; 2 Ryser and Marth, 1987; 3 HudSon and Mott, 1993b; 4 Hart et al.,
1991, 5 Hudson, 1994; 6 Sionkowski and Shelef, 1990; 7 Rosenow and Marth, 1987; 8 Schillinger et al, 1991; 9 Grant et al, 1993. b Packaging: Air, Aerobic-packed. c Temperature. d Generation time.
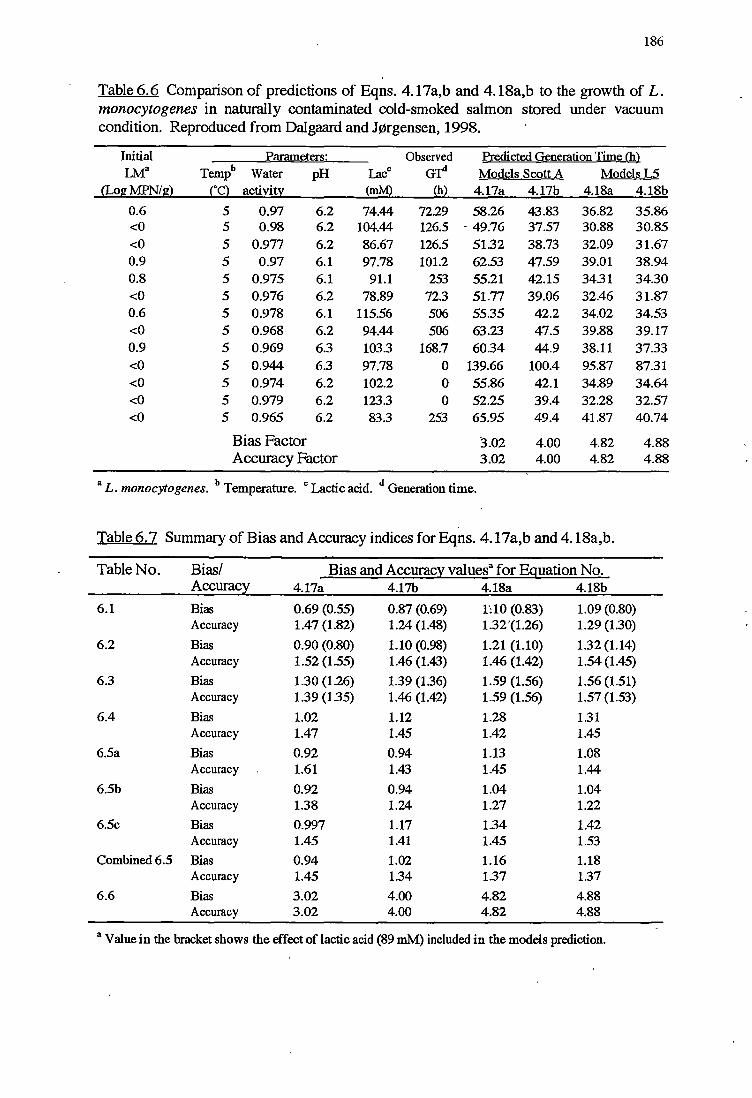
186
Table 6.6 Comparison of predictions of Eqns. 4. l 7a,b and 4.18a,b to the growth of L. monocytogenes in naturally contaminated cold-smoked salmon stored under vacuum condition. Reproduced from Dalgaard and J~rgensen, 1998.
Initial Parameters: Observed Predicted Generation Time (h) !Ma Temph Water pH Lace G'f'1 Models Scott A Models L5
(LogMPN/g) (°C) activin'. (mM) (h) 4.17a 4.17b 4.18a 4.18b
0.6 5 0.97 6.2 74.44 72.29 58.26 43.83 36.82 35.86 <0 5 0.98 6.2 104.44 126.5 - 49.76 37.57 30.88 30.85 <0 5 0.977 6.2 86.67 126.5 51.32 38.73 32.09 31.67 0.9 5 0.97 6.1 97.78 101.2 62.53 47.59 39.01 38.94 0.8 5 0.975 6.1 91.1 253 55.21 42.15 34.31 34.30 <0 5 0.976 6.2 78.89 72.3 51.77 39.06 32.46 31.87 0.6 5 0.978 6.1 115.56 506 55.35 42.2 34.02 34.53 <0 5 0.968 6.2 94.44 506 63.23 47.5 39.88 39.17 0.9 5 0.969 6.3 103.3 168.7 60.34 44.9 38.11 37.33 <0 5 0.944 6.3 97.78 0 139.66 100.4 95.87 87.31 <0 5 0.974 6.2 102.2 0 55.86 42.l 34.89 34.64 <0 5 0.979 6.2 123.3 0 52.25 39.4 32.28 32.57 <0 5 0.965 6.2 83.3 253 65.95 49.4 41.87 40.74
Bias Factor 3.02 4.00 4.82 4.88 Accuracy Factor 3.02 4.00 4.82 4.88
aL bT cl.a. "d dGe . . . monocytogenes. emperature. ct.Icaci . nerat.Ion time.
Table 6. 7 Summary of Bias and Accuracy indices for Eqns. 4.17a,b and 4.18a,b.
Table No. Bias/ Bias and Accuracy valuesa for Equation No. Accuracy 4.17a 4.17b 4.18a 4.18b
6.1 Bias 0.69 (0.55) 0.87 (0.69) 1':10 (0.83) 1.09 (0.80) Accuracy 1.47 (1.82) 1.24 (1.48) 1.32'(1.26) 1.29 (1.30)
6.2 Bias 0.90 (0.80) 1.10 (0.98) 1.21 (l.10) 1.32 (l.14) Accuracy 1.52 (1.55) 1.46 (l.43) 1.46 (1.42) 1.54 (1.45)
6.3 Bias 1.30 (l.26) 1.39 (1.36) 1.59 (1.56) 1.56 (l.51) Accuracy 1.39 (1.35) 1.46 (1.42) 1.59 (1.56) 1.57 (1.53)
6.4 Bias 1.02 1.12 1.28 1.31 Accuracy 1.47 1.45 1.42 1.45
6.5a Bias 0.92 0.94 1.13 1.08 Accuracy 1.61 1.43 1.45 1.44
6.5b Bias 0.92 0.94 1.04 1.04 Accuracy 1.38 1.24 1.27 1.22
6.5c Bias 0.997 1.17 1.34 1.42 Accuracy 1.45 1.41 1.45 1.53
Combined 6.5 Bias 0.94 1.02 1.16 1.18 Accuracy 1.45 1.34 1.37 1.37
6.6 Bias 3.02 4.00 4.82 4.88 Accuracy 3.02 4.00 4.82 4.88
a Value in the bracket shows the effect of lactic acid (89 mM) included in the models prediction.
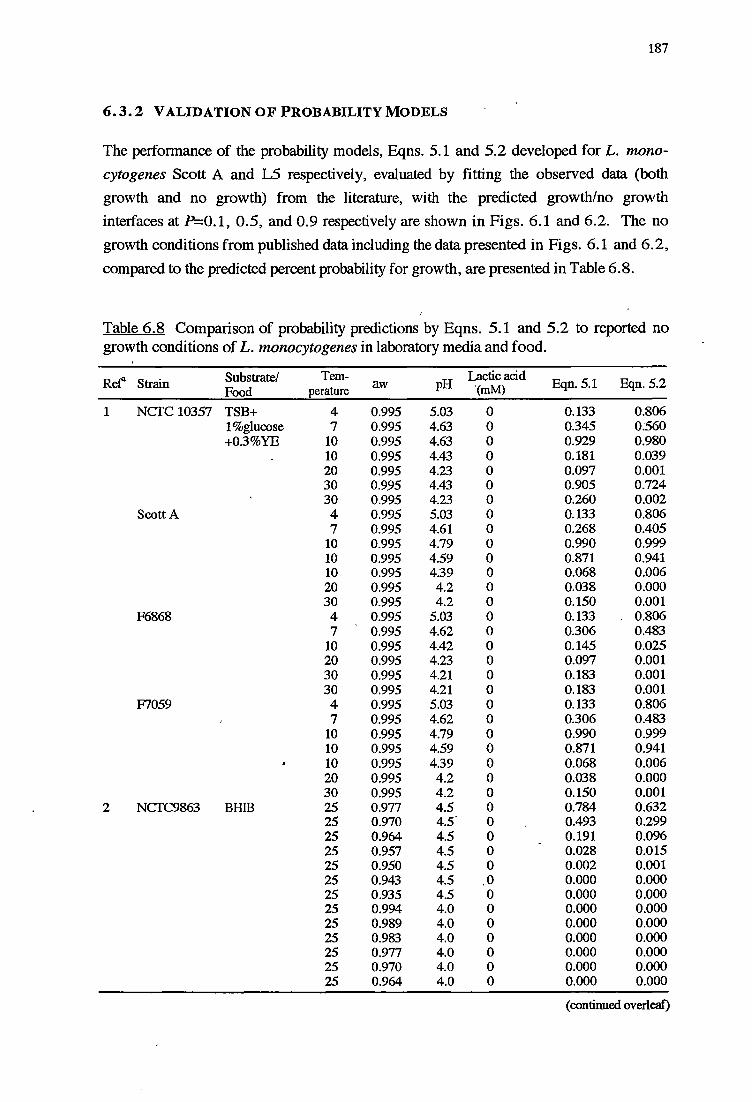
187
6.3.2 VALIDATION OF PROBABILITY MODELS
The performance of the probability models, Eqns. 5.1 and 5.2 developed for L. mono
cytogenes Scott A and LS respectively, evaluated by fitting the observed data (both
growth and no growth) from the literature, with the predicted growth/no growth
interfaces at P=0.1, 0.5, and 0.9 respectively are shown in Figs. 6.1 and 6.2. The no
growth conditions from published data including the data presented in Figs. 6.1 and 6.2,
compared to the predicted percent probability for growth, are presented in Table 6.8.
Table 6.8 Comparison of probability predictions by Eqns. 5.1 and 5.2 to reported no growth conditions of L. monocytogenes in laboratory media and food.
Ret'1 Strain Substrate/ Tem-pH
Lactic acid Eqn. 5.1 Eqn. 5.2
Food perature aw '(mM)
1 NCTC 10357 TSB+ 4 0.995 5.03 0 0.133 0.806 1%glucose 7 0.995 4.63 0 0.345 0.560 +0.3%YE 10 0.995 4.63 0 0.929 0.980
10 0.995 4.43 0 0.181 0.039 20 0.995 4.23 0 0.097 0.001 30 0.995 4.43 0 0.905 0.724 30 0.995 4.23 0 0.260 0.002
Scott A 4 0.995 5.03 0 0.133 0.806 7 0.995 4.61 0 0.268 0.405
10 0.995 4.79 0 0.990 0.999 10 0.995 4.59 0 0.871 0.941 10 0.995 4.39 0 0.068 0.006 20 0.995 4.2 0 0.038 0.000 30 0.995 4.2 0 0.150 0.001
F6868 4 0.995 5.03 0 0.133 0.806 7 0.995 4.62 0 0.306 0.483
10 0.995 4.42 0 0.145 0.025 20 0.995 4.23 0 0.097 0.001 30 0.995 4.21 0 0.183 0.001 30 0.995 4.21 0 0.183 0.001
F7059 4 0.995 5.03 0 0.133 0.806 7 0.995 4.62 0 0.306 0.483
10 0.995 4.79 0 0.990 0.999 10 0.995 4.59 0 0.871 0.941 10 0.995 4.39 0 0.068 0.006 20 0.995 4.2 0 0.038 0.000 30 0.995 4.2 0 0.150 0.001
2 NCTC9863 BHIB 25 0.977 4.5 0 0.784 0.632 25 0.970 4.5' 0 0.493 0.299 25 0.964 4.5 0 0.191 0.096 25 0.957 4.5 0 0.028 0.015 25 0.950 4.5 0 0.002 0.001 25 0.943 4.5 ,0 0.000 0.000 25 0.935 4.5 0 0.000 0.000 25 0.994 4.0 0 0.000 0.000 25 0.989 4.0 0 0.000 0.000 25 0.983 4.0 0 0.000 0.000 25 0.977 4.0 0 0.000 0.000 25 0.970 4.0 0 0.000 0.000 25 0.964 4.0 0 0.000 0.000
(continued overleaf)
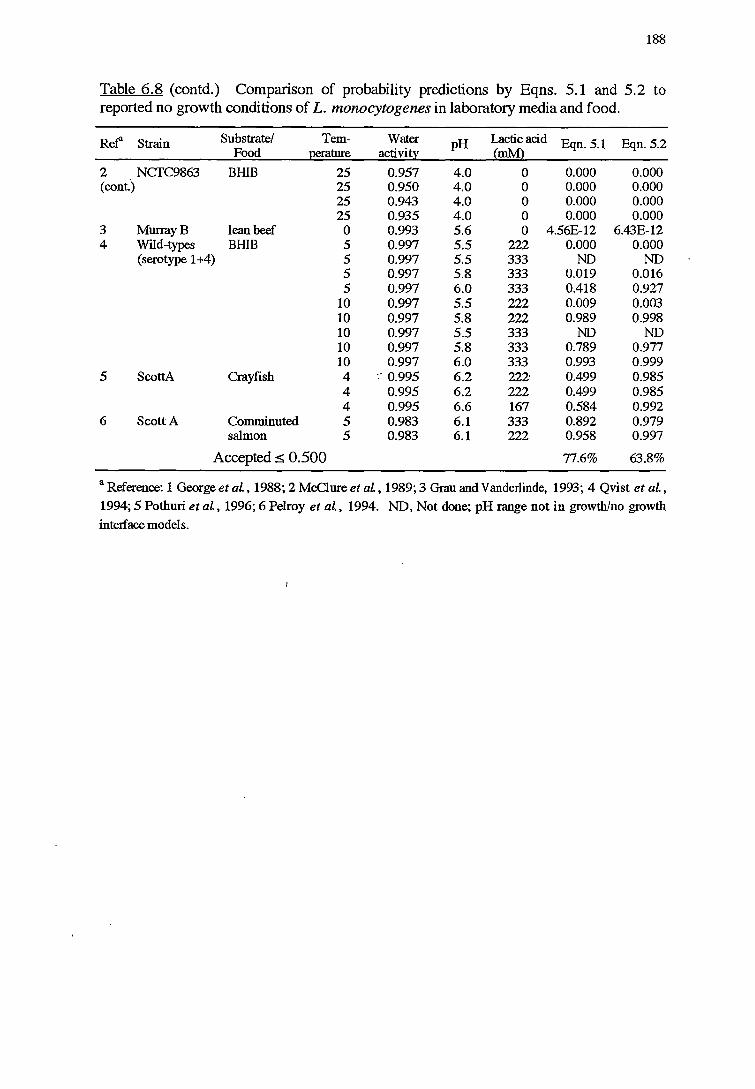
188
Table 6.8 (contd.) Comparison of probability predictions by Eqns. 5.1 and 5.2 to reported no growth conditions of L. monocytogenes in laboratory media and food.
Ref' Strain Substrate/ Tern- Water pH Lactic acid Eqn. 5.1 Eqn. 5.2 Food perature activity (mM)
2 NCTC9863 BHIB 25 0.957 4.0 0 0.000 0.000 (cont.) 25 0.950 4.0 0 0.000 0.000
25 0.943 4.0 0 0.000 0.000 25 0.935 4.0 0 0.000 0.000
3 MurrayB lean beef 0 0.993 5.6 0 4.56E-12 6.43E-12 4 Wild-types BHIB 5 0.997 5.5 222 0.000 0.000
(serotype 1 +4) 5 0.997 5.5 333 ND ND 5 0.997 5.8 333 0.019 0.016 5 0.997 6.0 333 0.418 0.927
10 0.997 5.5 222 0.009 0.003 10 0.997 5.8 222 0.989 0.998 10 0.997 5.5 333 ND ND 10 0.997 5.8 333 0.789 0.977 10 0.997 6.0 333 0.993 0.999
5 ScottA Crayfish 4 :· 0.995 6.2 222· 0.499 0.985 4 0.995 6.2 222 0.499 0.985 4 0.995 6.6 167 0.584 0.992
6 Scott A Comminuted 5 0.983 6.1 333 0.892 0.979 salmon 5 0.983 6.1 222 0.958 0.997
Accepted s 0.500 77.6% 63.8%
a Reference: 1 George et al, 1988; 2 McClure et al, 1989; 3 Grau and Vanderlinde, 1993; 4 Qvist et al.,
1994; 5 Pothuri et al, 1996; 6 Pelroy et al, 1994. ND, Not done; pH range not in growth/no growth
interface models.
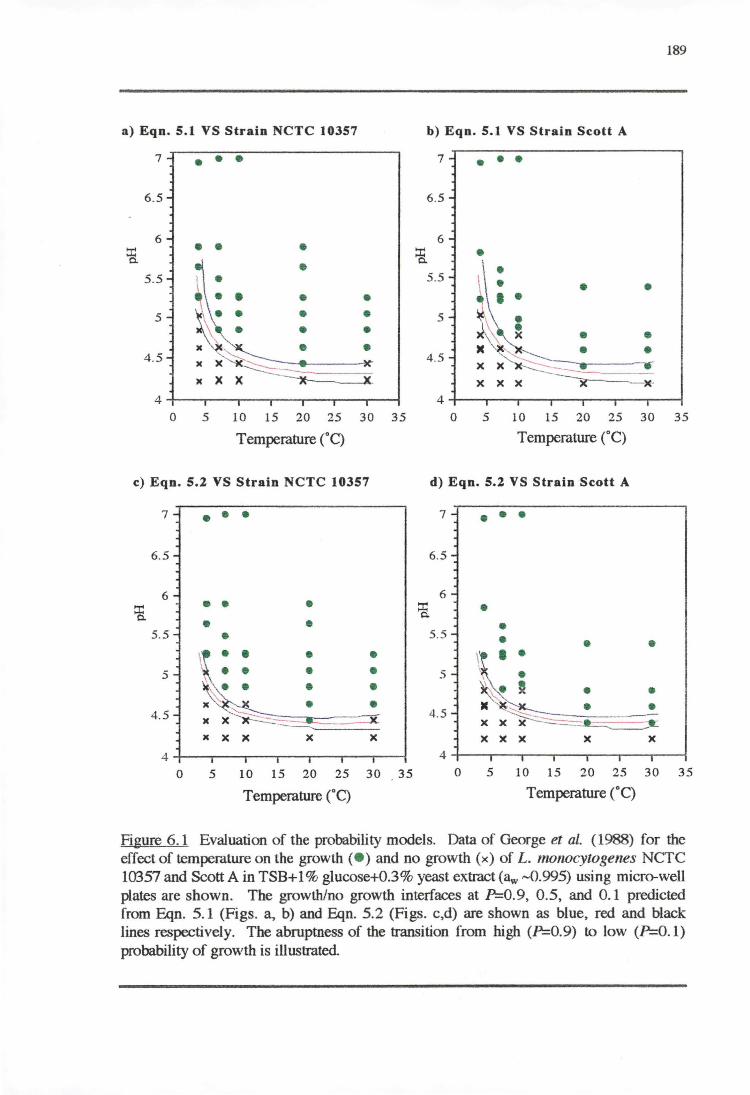
a) Eqn. 5.1 VS Strain NCTC 10357
7
6.5
6
5.5
5
4 .5
• • •
• • • • • • • • • •
·:::---::: . . >eX ~ )( x x --x---..._x_
0 5 10 15 20 25 30 35
Temperature ("C)
c) Eqn. 5.2 VS Strain NCTC 10357
7
6.5
6
5.5
5
4. 5
•••
• • • •
• • • •
)( x x
• • • •
x
• • • • x
0 5 10 15 20 25 30 35
Temperature (°C)
189
b) Eqn. 5.1 VS Strain Scott A
7 • •• 6.5
6
:a • 5.5
4 .5
•
5
I • ~ .. \';\ \ . ~\\'"'\ ~ . . llC ~" • •
::~
• •
4-+-~..--...~-.-~-.-~.....-~..-~
0 5 10 15 20 25 30 35
Temperature (°C)
d) Eqn. 5.2 VS Strain Scott A
7
6.5
6
:a 5.5
5
4.5
• • •
• • • • • • •
• ~I • • 11c'~ • • xx~ x x )( )( x
0 5 10 15 20 25 30 35
Temperature (°C)
Figure 6.1 Evaluation of the probability models. Data of George et al. ( 1988) for the effect of temperature on the growth(• ) and no growth (x) of L. monocytogelles NCTC 10357 and Scott A in TSB+ 1 % glucose+0.3% yeast extract (aw -0.995) using micro-well plates are shown. The growth/no growth interfaces at P=0.9, 0.5, and 0.1 predicted from Eqn. 5.1 (Figs. a, b) and Eqn. 5.2 (Figs. c,d) are shown as blue, red and black lines respectively. The abruptness of the transition from high (P=0.9) to low (P=O. l) probability of growth is illustrated.
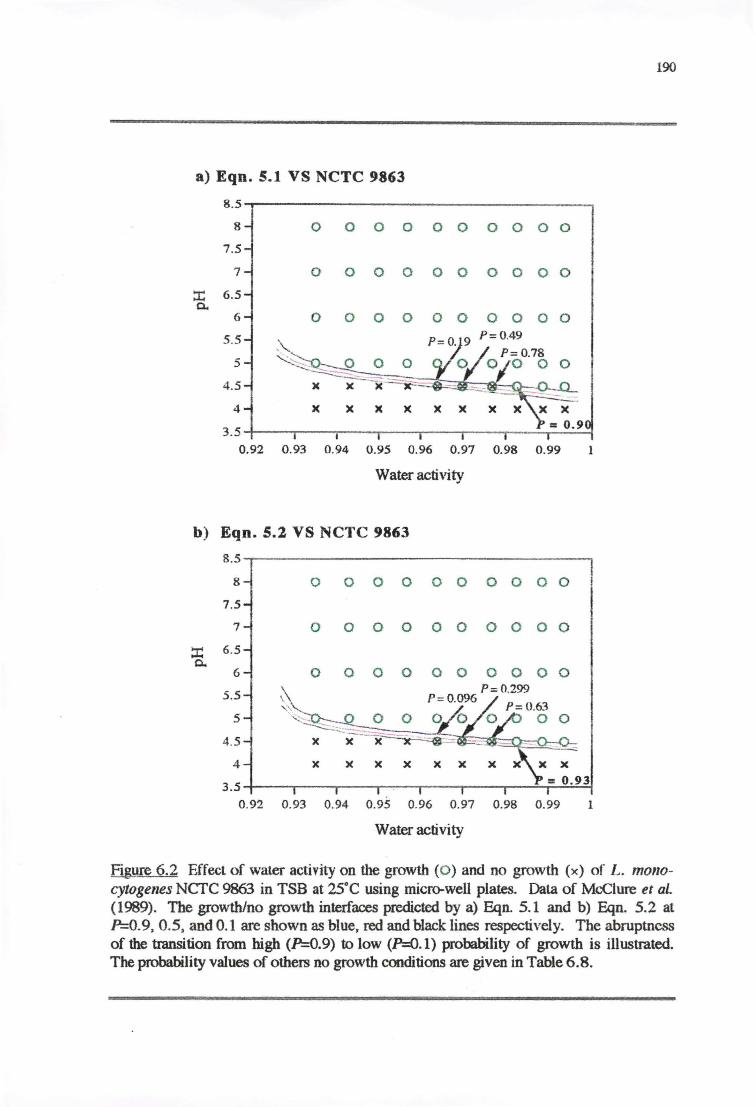
190
a) Eqn. 5.1 VS NCTC 9863
8.5
8 0 0 0 0 0 0 0 0 0 0
7.5
7 0 0 0 0 0 0 0 0 0 0
x 6.5 c..
6 0 0 0 0 0 0 0 0 0 0
5.5 ,\.,_ 5 .:.......:::::-.. 0 0 0 --~-
4.5 x x x-~
4 )( x )( )( x )(
3.5 0.92 0 .93 0 .94 0.95 0.96 0.97 0.98 0.99 1
Water activity
b) Eqn. 5.2 VS NCTC 9863
8.5
8 0 0 0 0 0 0 0 0 0 0
7.5
7 0 0 0 0 0 0 0 0 0 0
::I: 6.5 c..
6 0 0 0 0 0 0 0 0 0 0
5.5 ~ P:0.299 \ P= 0.096 P= 0.63
5 ~~~ o o 0
4.5 xxx~-= _
4 x )( )( )( )( x
3.5 0.92 0.93 0.94 0.95 0.96 0.97 0.98 0.99 1
Water activity
Figure 6 .2 Effect of water activity on the growth (0 ) and no growth (x) of L. mo110-cytoge11es NCTC 9863 in TSB at 25°C using micro-well plates. Data of McClure et al. (1989). The growth/no growth interfaces predicted by a) Eqn. 5.1 and b) Eqn. 5.2 at P=0.9, 0.5, and 0.1 are shown as blue, red and black lines respectively. The abruptness of the transition from high (P=0.9) to low (P=0.1) probability of growth is illustrated. The probability values of others no growth conditions are given in Table 6.8.
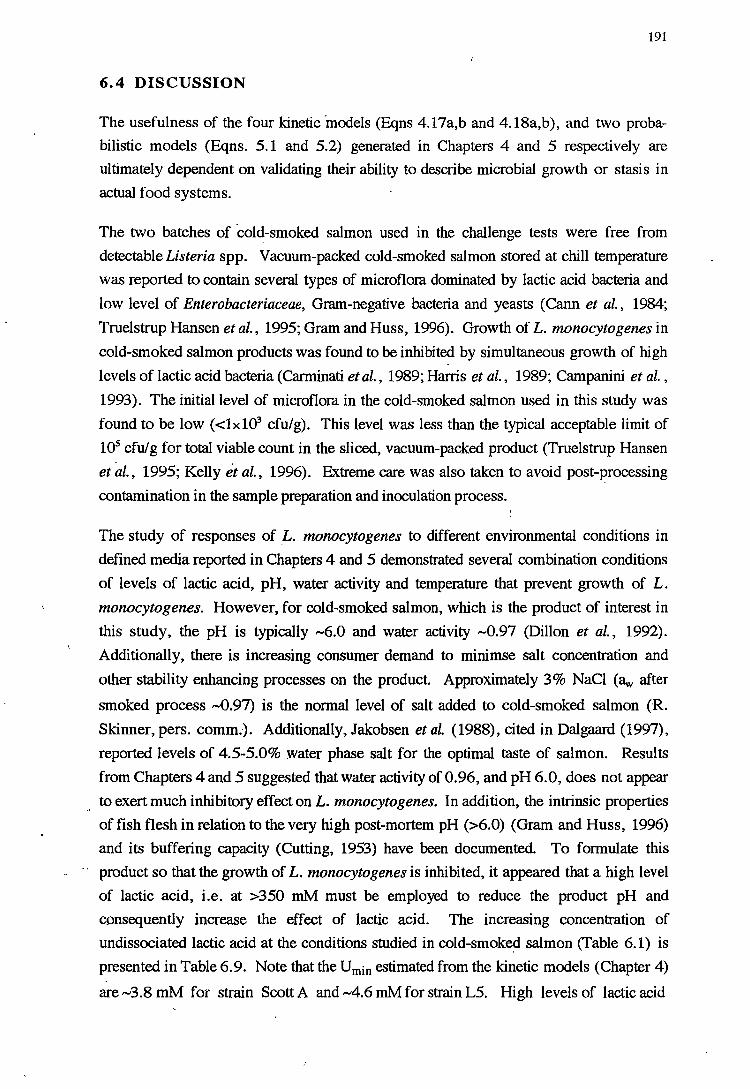
191
6. 4 DISCUSSION
The usefulness of the four kinetic ·models (Eqns 4.17a,b and 4.18a,b), and two proba
bilistic models (Eqns. 5.1 and 5.2) generated in Chapters 4 and 5 respectively are
ultimately dependent on validating their ability to describe microbial growth or stasis in
actual food systems.
The two batches of ·cold-smoked salmon used in the challenge tests were free from
detectable Listeria spp. Vacuum-packed cold-smoked salmon stored at chill temperature
was reported to contain several types of microflora dominated by lactic acid bacteria and
low level of Enterobacteriaceae, Gram-negative bacteria and yeasts (Cann et al., 1984;
Truelstrup Hansen et al., 1995; Gram and Huss, 1996). Growth of L. monocytogenes in
cold-smoked salmon products was found to be inhibited by simultaneous growth of high
levels of lactic acid bacteria (Carminati et al., 1989; Harris et al., 1989; Campanini et al.,
1993). The initial level of microflora in the cold-smoked salmon used in this study was
found to be low ( <lx la3 cfu/g). This level was less than the typical acceptable limit of
105 cfu/g for total viable count in the sliced, vacuum-packed product (Truelstrup Hansen
et al., 1995; Kelly et al., 1996). Extreme care was also taken to avoid post-processing
contamination in the sample preparation and inoculation process.
The study of responses of L monocytogenes to different environmental conditions in
defined media reported in Chapters 4 and 5 demonstrated several combination conditions
of levels of lactic acid, pH, water activity and temperature that prevent growth of L.
monocytogenes. However, for cold-smoked salmon, which is the product of interest in
this study, the pH is typically -6.0 and water activity -0.97 (Dillon et al., 1992).
Additionally, there is increasing consumer demand to minimse salt concentration and
other stability enhancing processes on the product. Approximately 3% NaCl (aw after
smoked process -0.97) is the normal level of salt added to cold-smoked salmon (R.
Skinner, pers. comm.). Additionally, Jakobsen et al. (1988), cited in Dalgaard (1997),
reported levels of 4.5-5.0% water phase salt for the optimal taste of salmon. Results
from Chapters 4 and 5 suggested that water activity of 0.96, and pH 6.0, does not appear
to exert much inhibitory effect on L. monocytogenes. In addition, the intrinsic properties
of fish flesh in relation to the very high post-mortem pH (>6.0) (Gram and Huss, 1996)
and its buffering capacity (Cutting, 1953) have been documented. To formulate this
· · product so that the growth of L. monocytogenes is inhibited, it appeared that a high level
of lactic acid, i.e. at >350 mM must be employed to reduce the product pH and
consequently increase the effect of lactic acid. The increasing concentration of
undissociated lactic acid at the conditions studied in cold-smoke? salmon (Table 6.1) is
presented in Table 6.9. Note that the Umin estimated from the kinetic models (Chapter 4)
are -3.8 mM for strain Scott A and -4.6 mM for strain LS. High levels of lactic acid
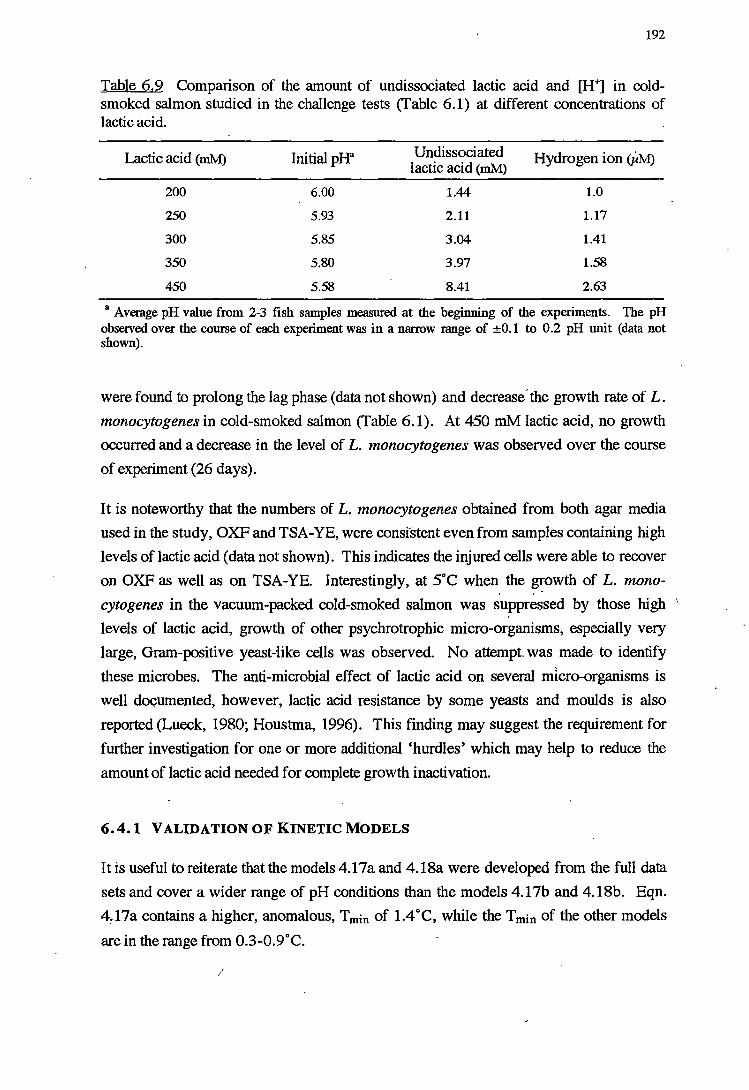
192
Table 6.9 Comparison of the amount of undissociated lactic acid and [H+] in coldsmoked salmon studied in the challenge tests (Table 6.1) at different concentrations of lactic acid.
Lactic acid {mM) Initial pH' Un dissociated Hydrogen ion {,lM) lactic acid (mM)
200 6.00 1.44 1.0
250 5.93 2.11 1.17
300 5.85 3.04 1.41
350 5.80 3.97 1.58
450 5.58 8.41 2.63
a Average pH value from 2-3 fish samples measured at the beginning of the experiments. The pH observed over the course of each experiment was in a narrow range of ±0.1 to 0.2 pH unit (data not shown).
were found to prolong the lag phase (data not shown) and decrease· the growth rate of L.
monocytogenes in cold-smoked salmon (Table 6.1). At 450 mM lactic acid, no growth
occurred and a decrease in the level of L. monocytogenes was observed over the course
of experiment (26 days).
It is noteworthy that the numbers of L. monocytogenes obtained from both agar media
used in the study, OXF and TSA-YE, were consistent even from samples containing high
levels of lactic acid (data not shown). This indicates the injured cells were able to recover
on OXF as well as on TSA-YE. Interestingly, at 5°C when the growth of L. mono
cytogenes in the vacuum-packed cold-smoked salmon was suppressed by those high 1
, levels of lactic acid, growth of other psychrotrophic micro-organisms, especially very
large, Gram-positive yeast-"like cells was observed. No attempt. was made to identify
these microbes. The anti-microbial effect of lactic acid on several micro-organisms is
well doyumented, however, lactic acid resistance by some yeasts and moulds is also
reported (Lueck, 1980; Houstma, 1996). This finding may suggest the requirement for
farther investigation for one or more additional 'hurdles' which may help to reduce the
amount of lactic acid needed for complete growth inactivation.
6.4. l VALIDATION OF KINETIC MODELS
It is useful to reiterate that the models 4. l 7a and 4.18a were developed from the full data
sets and cover a wider range of pH conditions than the models 4.17b and 4.18b. Eqn.
4)7a contains a higher, anomalous, Tmin of 1.4°C, while the Tmin of the other models
are in the range from 0.3-0.9°C.
I
193
The effect of atmosphere (packaging method) is not included in the models. L. mono
cytogenes is a facultative anaerobic micro-organism, and Buchanan et al. (1989a)
reported generally equivalent growth rates of L. monocytogenes Scott A in response to
either condition in laboratory broth media. At low temperature (S°C), those authors
found a tendency of _anaerobic incubation to favor growth of L. monocytogenes.
However, in Bologna-type sausages, Houstma (1996) found that L. monocytogenes
preferred aerobic to anaerobic conditions for growth. Similar results were found in the
limited tests on aerobic and anaerobic (vacuum) packaged cold-smoked salmon performed
in this study, i.e. faster growth of L. monocytogenes occurred in aerobic condition (in the
absence of lactic acid). Variation of the effects of oxygen on growth of L.
monocytogenes in meat procucts are reported (Garcia de Fernando et al., 199S). The
models performance for the anaerobic conditions presented in this study, however, '
appeared to be as satisfactory as for the aerobic conditions (Table 6.2).
A relatively high inoculum of L. monocytogenes Scott A and LS (106-107 cfu/ml) was
used in the model generation to mimic "worse case" circumstances. However, only strain
LS which is a wild-type strain isolated from cold-smoked salmon was used as the
challenge organism. Comparisons of model predictions on the basis of generation times
of L. monocytogenes L5 (103,cfu/g or 104 cfu/piece) in cold-smoked salmon under well
controlled conditions (Table 6.1), indicate small bias for both the Eqns 4.18a and 4.18b.
The accuracy of the models is ±30%. The Eqns~ 4.17a and 4.17b, models for strain
Scott A, are seen to over-predict generation times in cold-smoked salmon especially for
the extrapolated predictions at level of lactic acid >200 mM.
The limitations in model validation using data from published reports is recognised
(Ross, 1993). It is not always possible to obtain all the relevant information from
literature to enable an appropriate prediction from the models. Additionally, a full range
of the modelled parameters especially 8w and pH are not always available in published
reports. The validations presented in this chapter attempted to cover as wide a range of
the controlling factors as possible, e.g. temperature from 0 to 3S°C (Table 6.Sb), aw from
0.94S to 0.997 (Table 6.2), pH from 4.7 to 7.6 and lactic acid from 19.5 to 333 mM
(Table 6.3). Various single or mixtures of strains of L. monocytogenes growing in a
variety of foods such -as vegetables, and fish, meat and dairy products were included in
the validation process. In addition to comparing the models predictions to the artificial
inoculation tests, growth of a- naturally occurring Listeria contaminant on cold-smoked
salmon, reported by Dalgaard and Jf1Srgensen (1998), was also evaluated (Table 6.6).
The candidate is aware of the practical limitations of applying the proposed equations
within the range of the present experimental data, the so-called 'interpolation region' or
'minimum convex polyhedron' (McMeekin et al., 1993; Baranyi et al., 1996). However,
\
194
there is no resource readily available for calculation for the precise MCP of the models
developed. Validations of the models prediction in this chapter for each combination,
however, may be estimated from the variable combinations diagrams present in Fig. G.1, I_
Appendix G. Some comparisons between the combinations reported and the models
prediction presented here were extrapolated beyond the previously defined limits.
The summary of the models prediction to various strains of L. monocytogenes and
various foods on the basis of bias and accuracy factors presented in Table 6. 7 indicates a
resonably good accuracy performance range from ±24 to ±61 % for models 4.17a and
4. l 7b, and from 22 to 59% for models 4.18a and 4.18b (Table 6.6 is not included). 'In
agreement with these findings, Ross (1993) suggested there may 'be a limitation of the
accuracy of model predictions to independent data especially in heterogeneous and ill
defined environments such as foods. The highest degree of accuracy found in that study
when the models were applied to well-controlled challenge tests and published data were
reported to be -25% and -35% respectively.
In most instances, however, the models developed in this study conservatively predicted
as 'fail safe'. While the models correctly predicted the combined effects of temperature
aw-pH-lactic acid concentrations, some discrepancies between the reported values and the
predictions were found at the conditions close to the growth boundaries, i.e. minimum
temperature, minimum aw, minimum pH and minimum [UD]. These may be caused by
the problem of detection of growth itself at conditions near growth extremes as lag time
increases and growth rate decreases. Another possible reason is that microbial responses
at the conditions close to the minimum theoretical value(s) are highly variable (Ratkowsky
et al., 1991). The influence of an anomalous Tmin, in Eqn. 4:-17a in particular, on
reducing the models performance is noticed for model predictions at temperatures close to
T min, e.g. the prediction at 2.5°C shown in Table 6.5a, which caused a high difference in
predicted generation time.
The inclusion of a 89 mM lactic acid (the suggested average level of natural occurrence of
lactic acid in fish) in the models prediction (Tables 6.1-6.3) generally improved the
performance of the models. It is noteworthy that, in the range of foods of pH ~6.0
reported in Tables 6.1-6.3, only small amount of undissociated lactic acid (~0.64 mM)
and hydrogen ion (~1 µM) were calculated from the 89 mM lactic acid, which caused
only slightly reduced predicted growth rate. Nontheless the models always predicted
faster growth rate than the observation in foods.
Large differences between the observed and predicted generation times with very high
bias and accuracy factors were only obtained when the models were applied to naturally
contaminated cold-smoked salmon with a low number of initial contaminations ( <0 to 0.9
195
Log MPN/g) (Table 6.6). In most instances, the models predicted a faster growth rate
than was observed. Similar results of over estimation of growth rates were also obtained
from the 'Food MicroModel' predictions with lactate, i.e. bias and accuracy factors ~f 5.2
(Dalgaard and Jji>jrgensen, 1998). The models developed in this study performed well
when applied to the reported challenge tests in vacuum-packed cold-smoked salmon using
very low inoculum, i.e. 6-10 cfu L. monocytogeneslg (Table 6.2). Thus, the dis
crepancies between the observed and predicted generation times in Table 6.6 may reflect
the effect of factors not included in the predictive model, e.g. smoke component,
microbial interaction.
While both LS models (4.18a,b) gave similar predictions, the models 4.17a and 4.17b
appeared to perform differently. This, again, may be caused by the high T min in Eqn.
4. l 7a as discussed ,above. The overall performance of the models presented here suggest
the models 4.18a and 4.18b always predicted a faster growth than the models 4.17a and
4.17b especially at the extereme conditions of temperature or [UD]. Generally, good
performances with similar predictions were found in the optimum growth conditions.
6.4.2 VALIDATION OF PROBABILITY MODELS
Probability models provide predictions of the chance that L. monocytogenes would be
able to proliferate in various conditions in foods, without considering time. The
abruptness of the transitions between the occurrence of growth or no growth over a
narrow change of'pH (0.1 to 0.2 pH units) was shown and discussed in Chapter 5. In
other word, the conditions which resulted in the probability of growth at 90% or 10% are
actually not "far apart". If the conditions are made slightly less favourable to growth the
probability of growth could rapidly drop from likely (>90%) to highly unlkiely ( <10%).
Presentation of the models evaluation in terms of percent probabilities of growth may
confuse the analysis of the influences of those controlling factors and the models
performance and value. Thus, in this chapter, the evaluation of probability models is
presented as both percentage agreement (Table 6.8) and by graphical (Figs. 6.1 and 6.2)
methods.
Published reports on the growth limits of L. monocytogenes covering a range of
temperatures (George et al., 1S~88), or water activities (McClure et al., 1989) were
compared to the growth/no growth interface predicted by the models 5.1 and 5.2.
Sixteen different strains of L. monocytogenes were studied by George etal. (1988) and 4
representative strains were reported. The growth/no growth interfaces predicted by both
equations show a good fit to the published observations (strains NCTC 10357 and Scott
A) (Figs. 6.la-d). However, it should be noted that at low temperature (<.5°C) and
196
especially at P=0.9, Eqn. 5.1 (Scott A model) generated an erratic prediction for both
reported strains (Figs. 6.la,b). The cause of this is unclear. Nontheless, good
performance was obtained from the model prediction at P=O. l and 0.5 which are more of
relevance to the analyst or food industry. Eqn. 5.2 appeared to perform better for both
strains even though the model was generated from a different strain (LS). Variation of the
responses of various strains of L. monocytogenes especially at the conditions close to the
growth/no growth interface can be discerned in Fig. 6.1, e.g. at 30°C strain Scott A
initiated growth at pH 4.39 but strain NCTC 10357 could not. A similar predicted
probability for growth for strains F6868 and F7059 was reported in Table 6.8 (Ref. 1).
The abruptness of the fall in predicted probability of growth can be seen in both Figs. 6.1
and 6.2. As previouly discussed in Chapter 5 (section 5.4), an extreme variation in
microbial growth occurrs especially at the conditions close to the growth/no growth
boundary (Ratkowsky et al., 1991). Additionally, a higher population density is
anticipated to exhibit a higher probability for ,growth under the extreme conditions (see
section 5.4). This notion is ~upported by the results of McClure et al. (1989) who
reported the variation in the growth response of L. monocytogenes was influenced by the
inoculum size. This effect is in accord with the explaination by the predicted probability
values presented in Fig. 6.2 (indicated by the arrows) and Table 6.8 (Ref. 2). For
example using Eqn. 5.1 (Fig. 6.2a), at the condition with a probability for growth of_
h0.90, growth was observed from all of the tested inoculum sizes, i.e. low, medium
and high concentrations (5.2x1G3, 5.2xla4 and 5.2xl05 cells/ml respectively). At the
predicted lower probability for growth, i.e. P=0.78 and 0.49, growth was detected from
the medium and high concentrations but no growth was found in' the low inoculum broth.
At the probability for growth of 0.19, only growth from the high concentration inoculum
was observed. No growth was observed in any of the inocula levels tested when the
predicted probability was lower than 0.19 (Table 6.8, Ref. 2).
Very low probabilities for growth were predicted by both Eqns. 5.1 and 5.2 (see Table
6.8, Ref. 3) for the observed no growth data (within 13 weeks at 0°C, pH 5.6) reported
by Grau and Vanderlinde (1993). However, some of the no growth conditions reported
in broth media and foods in the presence of lactic acid (Refs. 4-6) show a likelihood
(P>0.9) for growth to occur. This may be a result of insufficient time in observation (20
days to 46 days) 01: other factms such as microbial interaction which may suppress the
growth of L. monocytogenes in those studies.
To generate a 'fail-safe' prediction, the growth limits of L. monocytogenes may be
defined by the probability for growth of Ps,, 0.05 (i.e. 95% confidence). The growth/no
growth interface models presented here may help to design safety into product by
manipulation of the controlling factor(s) such as temperature, pH, lactic acid

197
concentration etc. to conditions unfavourable for growth of L. monocytogenes. Using
the same approach, other 'hurdles' such as nisin, monolaurin, Glucono-delta-lactone etc.
can be further studied and included in the models. From this, appropriate combinations
of condition(s) for each type of food product, which maintain the appearance and
organoleptic acceptability of the products, but which inhibit or inactivate L. mono
cytogenes, may be derived.
198
7 SUMMARY AND CONCLUSIONS
Recognition of L. monocytogenes as a foodbome pathogen has raised concerns about the
possible sources and routes of contamination in food processing factories and foods, and
spawned the search for strategies to control or prevent its growth in food products.
L. monocytogenes is widely distributed in the environment and has been isolated from a
variety of sources. However, few studies have considered the aquatic environment and
its relationship to contamination of fish and seafood. In Chapter 2, a high recovery rate
of Listeria spp. including L. monocytogenes in various aquatic habitats, and in particular ;
rivers and effluents was reported. However, L. monocytogenes appeared to "die-off'
when it reached the estuarine environment, which indicates that the estuarine water
column may not serve as a natural habitat for the organisms. Nonetheless, estuarine
sediment and shellfish appeared to serve as better reservoir for Listeria spp. than estuarine
water.
Statistical analysis using a logistic method suggested th~ sanitary indicators, i.e. faecal
coliforms and E. coli , and recent rainfall were the most significant variables related to the
occurrence of Listeria spp. and L. monocytogenes in estuarine water. Multilocus enzyme
electrophoresis of the 113 L. monocytogenes isolates from the North West Bay study
revealed that wide range of electrophoretic types (ETs) present iri the natural environment.
Additionally, the distribution throughout the aquatic system studied and revealed the
t~ansmission of the organism to shellfish growing in those contaminated waters.
The microbial quality of fish, depends on the quality of the ambient environment (i.e.
marine farm), which could be a source of contamination of the processing lines and
finished products. In an investigation (Chapter 3) of consecutive stages in the production
of cold-smoked salmon, i.e. from harvesting to packaging, including the environment
outside the processing factory, L. monocytogenes was recovered only from the
environmental samples. This suggests the possibility to be able to control and prevent
recurrence of earli.er L. monocytogenes contamination in the factory and food products.
The identification, using rep-PCR, of the 19 L. monocytogenes. isolates collected from
the previous contamination event indicated a single clone consistently contaminated the
processing lines, equipment and products. Further comparisons of this clone with the
isolates from the factory's environments, and some of the ETs more frequently isolated in
the North West Bay study, demonstrated different genomic fingerprints in all of the
\
199
isolates. There was insufficient information to reveal the source and route of that
contamination incident.
L. monocytogeiies is notable for its ·ability to withstand adverse environmental
conditions. These characteristics have made it challenging to control its survival and
growth in many foods, especially in minimally thermal processed refrigerated products.
The predictive microbiology approach taken in this study has revealed the ecology and
physiological responses of L. monocytogenes to various controlling factors including
temperature, water activity, pH, and lactic acid. Several combinations of those environ
mental factors could be used as a non-thermal treatment to prevent growth of L. mono
cytogenes. Results in this study indicate that it is possible to suppress growth of L.
monocytogenes in chilled cold-smoked salmon by high amounts of lactic acid combined
with lowering of pH. Further study of the appearance and organoleptic acceptability of
the modified product is, however, required. The addition of one or more "hurdles" such
as nisin, monolaurin etc. may be further studied and incorporated if required.
The studies of the effect of lactic acid on L. monocytogenes growth rate inhibition
revealed the co-operative effects of hydrogen ions and undissociated lactic a_cid. The
predominant effect of hydrogen ion was found at low lactic acid concentrations, with the
undissociated acid effects becoming more profound as concentrations increased.
Synergistic effects among the variables, i.e. pH-temperature, and pH-aw were described
in this study (sections 4.4.2 and 5.4.1-2).
The development of kinetic, square-root type models, using PROC NLIN for the
combined effects of temperature-aw-pH-lactic acid was also succesfully demonstrated in
this study. Although, the puzzle of the sigmoid pH response remains to be solved
(section 4.4.1.3), good performance of the models when validated with "real foods" were
achieved.
Integration of the kinetic and probability modelling approaches, and modelling using
NLIN procedure were demonstrated in this study. The novel "growth/no growth
interface" models for L. monocytogenes Scott A and LS demonstrated their practical uses
as they were able to accurately predict the growth/no growth interface for other L. mono
cytogenes strains (section 6.3.2). The abruptness of the transition between the
conditions of "highly likely to grow" (~0% probability for growth) and the "highly
unlikely to grow" (10% probability for growth) was discussed in Chapter 5 and
supported by independent data (Chapter 6). For this type of model to be applied to food
safety problems, conditions that lead to a probability of growth of 5% or less may be
required to ensure that growth of L. monocytogenes does not occur throughout the shelf
life of the product.

(
200
Predictive microbiology is not "the sole answer to foodbome illness" but it is a promising
tool providing rational understanding and strategies to enable those problems to be
identified and finally eliminated. An understanding of the ecology of pathogens both in
the natural, factory and food environments would add substantially to a farm-to-table
approach for microbial food safety.
201
REFERENCES
Adams, C.J., T.E. Neff, and L.L. Jackson. 1979. Induction of Listeria monocytogenes infection by the consumption of ponderosa pine needles. Infect. Immune. 25:117-120.
Adams, M.R., C.L. Little, and M.C. Easter. 1991. Modelling the effect of pH, acidulant and temperature on the growth rate of Yersinia enterocolitica. J. Appl. Bacterial. 71:65-71.
Ahamad, N., and E.H. Marth. 1989. Behaviour of Listeria monocytogenes at 7, 13, 21, and 35°C in tryptose broth acidified with acetic, citric, or lactic acid. J. Food Prot. 5 2:688-695.
Ahamad, N., and E.H. Marth. 1990. Acid-injury of Listeria monocytogenes. J. Food Prot. 5 3:26-29.
Al-Ghazali, M.R., and S .K. Al-Azawi. 1986. Detection an enumeration of Listeria monocytogenes in a sewage treatment plant in Iraq. J. Appl. Bacterial. 6 0:251-254.
Al-Ghazali, M.R., and S.K. Al-Azawi. 1988a. Effect of sewage treatment on the removal of Listeria monocytogenes. J. Appl. Bacterial. 6 5:203-208.
Al-Ghazali, M.R., and S.K. Al-Azawi. 1988b. Storage effects of sewage sludge cake on the survival of Listeria monocytogenes. J. Appl. Bacterial. 6 5:209-213.
Albritton, W.L., G.L. Wiggins, W.E. DeWitt, and J.C. ·Feeley. 1980. Listeria monocytogenes. In E.H. Lennette, A. Balows, W.J. Hausler, Jr., and J.P. Truant (Eds.), Manual of Clinical Microbiology, 3rd edition, American Society for Microbiology, Washington, D.C., pp. 139-142.
Anonymous. 1993a. Cheese, seafood subject to Class I recalls due to Listeria contamination. Food Chem. News. 35:13, 16-17.
Anonymous. 1993b. FDA places import alert on cooked seafood, surimi products. Food Chem. News. 35:10, 51-52.
Anonymous. 1993c. Listeria check on NZ seafood. The Daily Telegraph Mirror, 13 August 1993, Sydney, NSW, p. 17.
Anonymous. 1994. For pregnant women dietary advice on listeriosis. National Food Authority, Australia. Pamphlet.
Anonymous. 1995. Environmental Health Guide, Listeria infection and pregnancy. Health Department of Western Australia, Western Australia. Pamphlet.
202
ANZECC (Australian and New Zealand Environment and Conservartion Council). 1992. National Water Quality Guidelines for Fresh and Marine Waters. Department of Arts, Sport, Environment, Tourism and Territories, Canberra.
Arnold, G.J., and J. Coble. 1995. Incidence of Listeria species in foods in NSW. Food Australia. 47:71-75.
Australian Standard. 1995. Water Microbiology Method 5: Coliforms-Membrane Filtration Method. Standards Australia. NSW, AS 4276.5.
Avoyne, C., M. Butin, J. Delaval, and J-L_,_ Bind. 1997. Detection of Listeria spp. in food samples by imunomagnetic capture: ListerScreen method. J. Food Prot. 60:377-384.
Baird-Parker, A.C. 1980. Organic acids. In J.H. Siliker, R.P. Elliott, A.C. Baird-Parker, F.L. Bryan, J.H.B. Christian, D.S. Clark, J.C. Olson, Jr., and T.A. Roberts (Eds.), Microbial Ecology of Foods, Vol.L Factors Affecting the Life and Death o/Microorganisms, Academic Press, London, pp. 126-135.
Bajard, S., L. Rosso, G. Fardel, and J.P. Flandrois. 1996. The particular behaviour of Listeria monocytogenes under sub-optimal conditions. Int. J. Food Microbiol. 29:201-211.
Baker, D., C. Genigeorgis, J. Glover, and V. Razavilar. 1990. Growth and toxigenesis of C. botulinum type E,in fishes packaged under modified atmospheres. Int. J. Food Microbiol. 10:269-290.
Baker, M., M. Brett, P. Short, L. Calder, and R. Thornton. 1993. Listeriosis and mussels. CDNZ 93:13-14.
Baranyi, J., and T.A. Roberts. 1995. Mathematics of predictive food microbiology. lnt: J. FoodMicrobiol. 26:199-218.
Baranyi, J., T. Ross, T.A. McMeekin, and T.A. Roberts. 1996. Effects ofparameterization on the performance of empirical models used in 'predictive microbiology'. Food Microbiol. 13:83-91.
Baranyi, J., T.A., Roberts, and P. McClure. 1993. A non-autonomous differential equation to model bacterial growth. Food Microbiol. 10:43-59.
Baxter, F., F. Wright, R.M. Chalmers, J.C. Low, and W. Donachie. 1993. Characterization by multilocus enzyme electrophoresis of Listeria monocytogenes isolates involved in ovine listeriosis outbreaks in Scotland from 1989 to 1991. Appl. Env. Microbiol. 59:3126-3129.
Ben Embarek, P.K. 1994. Presence, detection and growth of Listeria monocytogenes in seafood~: a review. Int. J. FoodMicrobiol. 23:17-34.
203
Ben Embarek~ P.K., and H.H. Huss. 1992. Growth of Listeria monocytogenes in lightly preserved fish products. In H.H. Huss, M. Jakobsen, and J. Liston (Eds.), Quality Assurance in the Fish Industry, Elsivier Science Publishers B. V., Amsterdam, pp. 293-303.
Benedict, R.C. 1990. Listeria monocytogenes: physiology and metabolism. In A.L. Miller, J.L. Smith, and G.A. Somkuti (Eds.), Foodborne Listeriosis. Elsevier Science Publishers B. V., Amsterdam, pp. 13-22.
Berrang, M.E., R.E. Brackett, and L.R. Beuchat. 1989. Growth of Listeria monocytogenes on fresh vegetables stored under controlled atmosphere. J. Food Prot. 5 2:702-705.
Bessesen, M.T., Q. Luo, H.A. Rotbart, M.J. Blaser, and RT.Ellison Ill. 1990. Detection of Listeria monocytogenes by using the polymerase chain reaction. Appl. Environ. Microbiol. 5 6:2930-2932.
Bibb, W.F., B.G. Gellin, R. Weaver, B. Schwartz, B.D. Plikaytis, M.W. Reeves, R.W. Pfoner, and C.V. Broome. 1990. Analysis of clinical and food-boame isolates of Listeria monocytogenes in the United States by multilocus enzyme electrophoresis and application of the method to epidemiologic investigations. Appl. Env. Microbiol. 5 6:2133-2141. -
Bille, J. 1990. Epidemiology of human listeriosis in Europe, with special reference to the Swiss outbreak. In A.L. Miller, J.L. Smith, and G.A. Somkuti (Eds.), Foodborne Listeriosis, Elsevier Science Publishers B.V ., Amsterdam, pp. 71-74.
Boerlin, P., and J~c. Piffaretti. 1991. Typing of human, animal, food, and environmental isolates of Listeria monocytogenes by multilocus enzyme electrophoresis. Appl. Environ. Microbiol. 57:1624-1629.
Boerlin, P., F. Boerlin-Petzold, E. Bannerman, J. Bille, and T. Jemmi. 1997. Typing Listeria monocytogenes isolates from fish products and human listeriosis cases. Appl. Environ. Microbiol. 63:1338-1343.
Boerlin, P., J. Rocourt, and J-C. Piffaretti. 1991. Taxonomy of the .genus Listeria by using multilocus enzyme electrophoresis. Int. J. Syst. Bacteriol. 41:59-64.
Bojsen-Moller, J. 1972. Human listeriosis. Diagnostic, epidemiological and clinical studies. Acta Path. Microbiol. Scand. Sec. B Suppl. 229:72-155.
Booth, l.R. 1985. Regulation of cytoplkasmic pH in bacteria. Microbiol. Reviews 4 9:359-378.
Botzler, R.G., A.B. Cowan, and T.F. Wetzler .. 1974. Survival of Listeria monocytogenes in soil and water. J. Wildlife Dis. 10:204-212.
Box, G.E.P., and N.R. Draper. 1987. Least Squares for Response Surface Work: Empirical Model-Building and Response Surfaces. John Wiley, New York.
204
Brackett, R.E. 1988. Presence and persistence of Listeria monocytogenes in food and water. FoodTechnol. 42:162-164.
Breed, R.S., EG.D. Murray, and A.P. Hitchens. 1948. Bergey's Manual of Determinative Bacteriology, 6th edition. Williams and Wilkins, Baltimore.
Breed, R.S., EG.D. Murray, and N.R. Smith. 1957. Bergey's Manual of Determinative Bacteriology, 7th edition. Williams and Wilkins, Baltimore.
Britten, R.J., and D.E. Kohne. 1968. Repeated sequences in DNA. Science. 161:529-540.
Broome C. V. 1993. Listeriosis: Can we prevent it? New monitoring techniques are helping to prevent this relatively eye but frequently fatal fopd-bome disease. ASM News. 59:444-446.
Brosch, R., J. Chen, and J.B. Luchansky. 1994. Pulsed-field fingerprinting of Listeriae: identification of genomic divisions for Listeria monocytogenes and their correlation with serovar. Appl. Environ. Microbial. 6 0:2584-2592.
Brown, M.H., and I.R. Booth. 1991. Acidulants and low pH. In N.J. Russell, and G.W. Gould (Eds.), Food Preservatives, Blackie and Son, New York, pp. 22-43.
Buchanan, R., M.H. Golden, and R.C. Whiting. 1993. Differentiation of the effects of pH and lactic or acetic acid concentration on the kinetics of Listeria monocytogenes inactivation. J. Ff!od Prot. S 6:474-478.
Buchanan, R.E., and N.E. Gibbons. 1974. Burgey's Manual of Determinative . Bacteriology, Williams and Wilkins, Baltimore.
Buchanan, R.L., 1993. Developing and distributing user-friendly application software. J. · Industrial Microbial. 12:251-255.
Buchanan, R.L., and J.G. Phillips. 1990. Response surface model for predicting the effects of temperature pH:, sodium chloride content, sodium nitrite concentration and atmosphere on the growth of Listeria monocytogenes. J. Food Prot. S 3:370-376.
Buchanan, R.L., and M.H. Golden. 1994. Interaction of citric acid concentration and pH on the kinetics of Listeria monocytogenes inactivation. J. Food Prot. S 7:567-570. ·
Buchanan, R.L., and M.H. Golden. 1995. Model for the non-thermal inactivation of Listeria monocytogenes in a reduced oxygen environment Food Microbial. 12:203-212.
Buchanan, R.L., H.G. Stahl, and R.C. Whiting. 1989a. Effects and interactions of temperature, pH, atmosphere, sodium chloride, and sodium nitrite on the growth of Listeria monocytogenes. J. Food Prot. S 2:844-851.

205
Buchanan, R.L., H.G. Stahl, M.M. Bencivenga, and F.D. Corral. 1989b. Comparison of lithium chloride-phenylethanol-moxalactam and modified Vogel Johnson agars for detection of Listeria spp. in retail-level meats, poultry, and seafood. Appl. Environ. Microbial. 5 5:599-603.
Buchanan, R.L., W.G. Damert, R.C. Whiting, and M. van Schothorst. 1997. Use of epidemiologic and food survey data to estimate a purposefully dose-response relationship for Listeria monocytogenes levels and incidence of listeriosis. J. Food Prot. 6 0:918-922.
Burn, C.G. 1936. Clinical and pathological features of an infection caused by a new pathogen of the genus Listerella. Amer. J. Pathol. 12:341-348.
Campanini, M., I. Pedrazzoni, S. Barbuti, and P. Baldini. 1993. Behaviour of Listeria monocytogenes during the maturation of naturally and artificially contaminated salami: effect of lactic-acid bacteria starter cultures. Int. J. Food Microbial. 20: 169-175.
Cann, D.C., N.C. Houston, L.Y. Taylor, G.L. Smith, A.B. Smith, and A. Craig. 1984. Studies of Salmonids Packed and Stored under a Modified Atmosphere. Torry Research Station, Ministry of Agriculture, Fisheries and Food, Aberdeen, Scotland.
Carminati, D., G. Giraffa, and M.G. Bossi. 1989. Bacteriocin-like inhibitors of Streptococcus lactis against Listeria monocytogenes. J. Food Prot. 5 2:614-617.
Carosella, J.M. 1990. Occurrence of Listeria monocytogenes in meat and poultry. In A.L Miller, J.L. Smith, and G.A. Somkuti (Eds.), Foodborne Listeriosis. Elsevier Science Publishers B. V., Amsterdam, pp. 165-173.
Chai, T.J., T.J. Han, and R.R. Cockey. 1994. MicrobiologiCal quality of shellfishgrowing waters in Chesapeake bay. J. Food Prot. 5 7:229-234.
Christie, R., N.E. Atkins, and E. Munch-Petersen. 1944. A note on a lytic phenomenon shown by group b streptococci.Aust. J. Exp. Biol. Med. Sci. 22:197-200.
Colburn, K.G., C.A. Kaysner, C. Abeyta, and M.M. Wejekk. 1990. Listeria species in a California coast estuarine environment. Appl. Env. Microbial. 5 6:2007-2011.
Cole, M.B., M.V. Jones, and C. Holyoak. 1990. The effect of pH, salt concentration and temperature on the survival and growth of Listeria monocytogenes. J. Appl. Bacterial. 6 9:63-72.
Conner, D.E., V.N. Scott, and D.T. Bernard. 1990. Growth, inhibition, and survival of Listeria monocytogenes as affected by acidic conditions. J. Food Prot. 5 3:652-655.
Corlett, D~A., and M.H. Brown. 1980. pH and acidity. In J.H. Siliker, R.P. Elliott, A.C. Baird-Parker, F.L. Bryan, J.H.B. Christian, D.S. Clark, J.C. Olson, Jr., and T.A. Roberts (Eds), Microbial Ecology of Foods, Vol./, Factors Affecting the Life and Death of Microorganisms, Academic Press, London, pp. 92-111.
206
Cortesi, M.L., T. Sarli, A. Santoro, N. Murru, and T. Pepe. 1997. Distribution and behaviour of Listeria monocytogenes in three lots of naturally-contaminated vacuum-packaged smoked salmon stored at 2 and 10°C. Int. J. Food Microbial. 3 7:209-214.
Cossart, P., M.F.Vicente, J. Mengaud, F. Baquero, J.C. Perez-Diaz, and P. Berche. 1989. Listeriolysin 0 is essential for virulence of Listeria monocytogenes: direct evidence obtained by gene complementation. Infect. Immun. 5 7:3629-3636.
Curry, G.I., R.M. Feldman, and P.J.H. Sharpe. 1978. Foundations of stochastic development. J. Theor. Biol. 7 4:397-410.
Cutting, C.L. 1953. Changes in the pH and buffering capacity of fish during spoilage. J. Sci. Food Agric. 4:597-603.
Czajka, J., N. Bsat, M. Pani, W. Russ, K. Sultana, M. Wiedmann, R. Whitaker, and C.A. Batt. 1993. Differentiation of Listeria monocytogenes and Listeria innocua by 16S rRNA and intraspecies discrimination of 'Listeria monocytogenes strains by random amplified polymorphic DNA polymorphisms. Appl. Environ. Microbial. 5 9:304-308.
Dalgaard, P. 1997. Predictive microbiological modelling and seafood quality. In J: Luten, T. Bf{jrresen, and J. Oel}lenschlager (Eds.), Proceedings of the International (WEFTA) Seafood Conjerence on Seafood from Producer to Consumer, Integrated Approach to Quality, Noord-wijkerhout, The Netherlands, 13-16 November, pp. 431-433.
Dalgaard, P., and L.V. Jf{jrgensen. 1998. Predicted and observed growth of Listeria monocytogenes in seafood challenge testes and in naturally contaminated coldsmoked salmon. Int. J. Food Microbial. 40:105-115.
Dalgaard, P., T. Ross, L. Kamperman, K. Neumeyer, and T.A. McMeekin. 1994. Estimation of bacterial growth rates from turbidimetric and viable count data. lnt. J. Food Microbial. 2 3:391-404.
--Datta, A.R., B.A. Wentz, and W.E. Hill. 1987. Detection of hemolytic Listeria
monocytogenes by using DNA colony hybridization. Appl. Environ. Microbial. 5 3:2256-2259.
Daughtry, B.J., K.R. Davey, andK.D. King. 1997. Temperature dependence of growth kinetics of food bacteria. Food Microbial. 14:21-30.
Davey, K.R. 1989. A predictive model for combined temperature and water activity on microbial growth during the growth phase. J. Appl. Bacterial. 6 7:483-488.
de Bruijn, F.J. 1992. Use of repetitive (repetitive extragenic palindromic and enterobacterial repetitive intergeneric consensus) sequences and the polymerase chain reaction to fingerprint the genomes of Rhizabium meliloti isolates and other soil bacteria Appl. Environ. Microbial. 5 8:2180-2187.
207
de Martinis, E.C.P., A.D. Crandall,A.S. Mazzotta, and T.J. Montville. 1997. Influence of pH, salt, and temperature on nisin resistance in Listeria monocytogenes. J. Food Prot. 6 0:420-423.
de Wit, J.C. and F.M., Rombouts. 1990. Antimicrobial activity of sodium lactate. Food Microbiol. 7: 113-120.
Decastelli, L., C. Ereolini, S. Fisiichella, C. Bianchi. 1993. Incidenza di Listeria spp. in mitili (Mytilus galloprovincialis) di allevamento. Microbiologie-AlimentsNutrition. 11:51-56.
Delignette-Muller, M.L., L. Rosso, and J.P. Aandrois. 1995. Accuracy of microbial growth predictions with square root and polynomial models. Int. J. Food Microbiol. 27:139-146
Dennis, M., and W.H. Lee. 1989. FSIS Method for the Isolation and Identification of Listeria monocytogenes from Processed Meat and Poultry Products. Laboratory Communication No.57. USDA, FSIS, Microbiology Division, Beltsville.
Difeo. 1984. Difeo Manual: Dehydrated Culture Media and Reagents, Bacto FA Listeria Poly. Difeo Laboratories, Detroit, Michigan.
Dijkstra, R.G. 1975. Recent experiences of the survival times of Listeria bacteria in suspension of brain tissue, silage, faeces and in milk. In M. Woodbine (Ed.), Problems of Listeriosis, Leicester University Press, Leicester, pp. 71-74.
Dijkstra, R.G. 1982. The occurrence of Listeria monocytogenes in surface water of canals and lakes, in ditches of one big polder and in the effluents of canals of a sewage treatment plant. Zentbl. Bakt. Parasite. Infekt. Hyg. Abts. I. Orig. B. 176:202-205.
Dillon, R., T. Patel, S. Ratnam. 1994. Occurrence of Listeria in hot and cold smoked seafood products. lnt. J. FoodMicrobiol. 22:73-77.
Dillon, R.M., and T.R. Patel. 1992. Listeria in seafoods: a review. J. Food Prot. 55:1009-1015.
Dillon, R.M., T.R. Patel, and S. Ratnam. 1992. Prevalence of Listeria in smoked fish. J. Food Prot. 5 5:866-870.
Donelly, C.W., and G.J. Baigent. 1986. Methods for flow cytometric detection of Listeria monocytogenes in milk. Appl. Environ. Microbiol. 5 2:689-695.
Donnelly, C. W. 1988. Historical perspectives on methodology to detect Listeria monocytogenes. J. Assoc. Off. Anal. Chem. 7 1:644-646.
Dorsa, W.J., D.L. Marshall, M.W. Moody, and C.R. Hackney. 1993. Low temperature growth and thermal inactivation of Listeria monocytogenes in precooked crawfish tail meat. J. Food Prot. 56:106-109.
208
Doyle, M.P., and J.L. Schoeni. 1987. Comparison of soft, surface-ripened cheese. J. Food Prot. 5 0:4-6.
Doyle, M.P., K.A. Glass, J.T. Beery, G.A. Garcia, D.J. Pollard, and R.D. Schultz. 1987. Survival of Listeria monocytogenes in milk during high-temperature, shorttime pasteurization. Appl. Environ. Microbiol. 53:1433-1438.
Duh, Yeu-Hsin, and D.W. Schaffner. 1993. Modelling the effect of temperature on the growth rate arid lag time of Listeria innocua and Listeria monocyto genes. J. Food Prot. 5 6:205-210.
Eklund, M.W., F.T. Poysky, R.N. Paranjpye, L.C. Lashbrook, M.E. Peterson, and G.A. Pelroy. ·1995. Incidence and sources of Listeria monocytogenes in coldsmoked fishery products and processing plants. J. Food Prot. 5 8:502-508.
Eklund, T. 1983. The antimicrobial effect of dissociated and undissociated sorbic acid at different pH levels. J. Appl. Bacteriol. 5 4:383-389.
Eklund, T. 1989. Organic acids and esters. In G. W. Gould (Ed.), Mechanisms of Action of Food Preservation Procedures, Elsivier Science Publishers, New York, pp. 161-200.
Ericsson, H., A. Eklow, M.L. Danielsson-tham, S. Loncarevic, L.O. Mentzing, I. Persson, H. Unnerstad, and W. Tham. 1997. An outbreak of listeriosis suspected. tQ have been caused by rinbow trout. J. Clin. Microbiol. 3 5:2904-2907.
FAO. 1994. The Use of Hazard Analysis Critical Control Point (HACCP) Principles in Food Control. Food and Nutrition paper 58, Report of an FAO Expert Technical Meeting, Vancouver, Canada, 12-16 December.
Farber, J.M. 1991. Listeriamonocytogenes in fish products. J. Food Prot. 54:922-934.
Farber, J.M. 1993. Current research on Listeria monocytogenes in foods: an overview. J. Food Prot. S 6:640-643.
Farber, J.M. 1996. An introduction to the hows and whys of molecular typing. J. Food Prot. 59:1091-1101.
Farber, J.M., and P.1. Peterkin. 1991. Listeria monocytogenes, a food-borne pathogen. Microbiol. Reviews. 5 5:476-511.
Farber, J.M., F. Coates, and E. Daley. 1992. Minimum water activity i:equirements for the growth of Listeriamonocytogenes. Lett. Appl. Microbiol. 15:103-105.
Farber, J.M., G.W. Sanders, and M.A. Johnston. 1989a. A survey of various foods for the presence of Listeria species. J. Food Prot. 5 2:456-458.
Farber, J.M., G.W. Sanders, and S. A. Malcom. 1988. The presence of Listeria spp. in raw milk in Ontario. Canadian J. Microbiol. 34:95-100.
209
Farber, J.M., G. W. Sanders, S. Dunfield, and R. Prescott. 1989b. The effect of various acidulants on the growth of Listeria monocytogenes. Lett. Appl. Microbial. 9:181-183.
Farber, J.M., W.H. Ross, and J. Harwig. 1996. Health risk assessment of L. monocyto genes in Canada. I nt. J. Food Micro biol. 3 0: 145-146.
Farmiloe, F.J., S.J. Cornford, J.B.M. Copock, and M. Ingram. 1954. The survival of Bacillus subtilis spores in the baking of bread. J. Science Food and Agriculture 5:292-304.
Faud, A.T., S.D. Weagant, M.M. Wekell, and J. Liston. 1989. Survival of Listeria monocytogenes in the estuarine environment. In Annu. Meet. Am. Soc. Microbial. Abstr. Q243.
Fenlon, D.R. 1985. Wild birds and silage as reservoirs of Listeria in the agricultural environment. J. Appl. Bacterial. 5 9:537-543.
Fenlon, D.R. 1986. Rapid quantitative assessment.of the distribution of Listeria in silage implicated in a suspected outbreak of listeriosis in calves. Vet. Ree. 118:240-242.
Fenlon, D.R., and J. Wilson. 1989. The incidence of Listeria monocytogenes in raw milk from farm bulk tanks in North-East Scotland. J. Appl. Bacterial. 66:191-196.
Fenlon, D.R., J. Wilson, and W. Donachie. 1996. The incidence and level of Listeria monocytogenes contamination of food sources at primary production and initial processing. J. Appl. Bacterial. 81:641-650.
Fenlon, D.R., T. Stewart, and W. Donachie. 1995. The incidence, numbers and types of Listeria monocytogenes isolated from farm bulk tank milks. Lett. Appl. Microbial. 20:57-60. '
Fernandez Garayzabal, J.F., L. Domonguez Rodriguez, J.A. Vazquez Boland, E.F. Rodriguez Ferri, V. Briones Dieste, J.L. Blanco Cancelo, and G. Suarez Fernandez. 1987. Survival of Listeria monocytogenes in raw milk treated in a pilot plant pasteurizer. J. Appl. Bacterial. 6 3:533-537.
Fitter, S., M. Heuzenroder, and C.J. Thomas. 1992.- A combined PCR and selective eiirichment method fo~ rapid detection of Listeria monocytogenes. J. Appl. Bacterial. 7 3:53-59.
Fleming, D.W., S.L. Cochi, K.L. MacDonald, J. Brondum, P.S. Hayes, B.D. Plikaytis, M.B. Holmes, A. Audurier, C.V. Broome, and A.L. Reingold. 1985. Pasteurised milk as a vehicle of infection in an outbreak of listeriosis. N. Engl. J. Med. 312:404-407.
Fluit, A.C., R. Torensma, M.J.C. Visser, C.J.M. Aarsman, M.J.J.G. Poppelier, B.H.I. Keller, P. Klapwijk, and J. Verhoef. 1993. Detection of Listeria monocytogenes in cheese with the magnetic imuno-polymerase chain reaction assay. Appl. Environ. Micr<;ibiol. 59:1289-1293.
210
Fraser, G. 1964. The effect of animal erythrocytes of combinations of diffusible substances produced by bacteria. J. pathol. bacteriol. 8 8:43-53.
Freese, E., C. W. Sheu, and E. Galliers. 1973. Function of lipophilic acids as antimicrobial food additives. Nature. 241 :321-325.
Fuchs, R.S., and L. Nicolaides. 1994. Incidence of Listeria in hot- and cold-smoked fish. Lett. Appl. Microbiol. 19:394-396.
Fuchs, R.S., and P.J.A. Reilly. 1992. The incidence and significance of Listeria monocytogenes in seafoods. In H.H. Huss, M. Jakobsen, and J. Liston (Eds.), Quality Assurance in the Fish Industry, Elsevier Science Publishers B. V ., Amsterdam, pp. 217-229.
Fuchs, R.S., and P.K. Surendran. 1989. Incidence of Listeria in tropical fish and fishery products. Lett. Appl. Microbiol. 9:49-51.
Gameson, A. L. H. 1975 .. Discharge of sewage from sea outfalls. In Proceedings of International Symposium Progress in Water Technology, Church House, London, 27 August to 2 September 1974.
Garcfade Fernando, G.D., G.J.E. Nychas, M.W. Peck, J.A. Ordonez. 1995. Growth/ survival of psychrotrophic pathogens on meat packed under modified atmospheres. Int. J. Food Microbiol. 2 8:221-231.
Garland, C.D. 1995. Microbiological quality of aquaculture products with special reference to Listeria monocytogenes in Atlantic salmon. Food Aust. 47 :559-563.
Gay, M., 0. Cerf, and K.R. Davey. 1996. Significance of pre-incubation temperature and inoculum concentration on subsequent growth of Listeria monocytogenes at 14°C. J. Appl. Bacteriol. 81:433-438. ·
Genigeorgis, C., S. Martin, C.E. Franti, and H. Riemann. 1971. Initiation of Staphylococcal growth in laboratory media. Appl. Microbiol. 21:934-939.
Genigeorgis, C.A., D. Dutulescu, and J.F. Garayzabal. 1989. Prevalence of Listeria spp. in poultry meat at the supermarket and slaughterhouse level. J. Food Prot. s 2:618-624.
George, S.M., B.M., Lund, and T.F. Brocklehurst. 1988. The effect of pH and temperature on initiation of growth of Listeria monocytogenes. Lett. Appl. Microbiol. <6: 153-156.
George, S.M., L.C.C. Richardson,-and M.W. Peck. 1996. Predictive models of the effect of temperature, pH and acetic and lactic acids on the growth of Listeria monocytogenes. Int. J. Food Microbiol. 3 2:73-90.
Gerner-Smidt, P., P. Boerlin, F. Ischer, and J. Schmidt. 1996. High-frequency endonuclease (REA) typing: results from the WHO collaborative study group on subtyping of Listeria monocytogenes. Int. J. Food Microbiol. 32:313-324.
211
Geunich, H-H., H.B. Mtiller. 1984. Isolation and quantitative determination of Listeria · monocytogenes in raw and biologically treated wasted water. Zbl. Bakt. Hyg. I. Abt. Orig. B. 179:266-273.
Gibson, A.M., and T.A. Roberts. 1989. Predicting microbial growth: development of a mathematical model to predict bacterial growth responses. Food Aust. 12: 1075-1079. '
Gibson, A.M., N. Bratchell, and T.A. Roberts. 1987. The effects of sodium chloride and temperature on the rate and extent of growth of Clostridium botulinum type A in pasteurized pork slurry. J. Appl. Bacterial. 6 2:479-490.
Gibson, D.M. 1992. Pathogenic microorganisms of importance in seafood. In H.H. Huss, M. Jakobsen, and J. Liston (Eds.), Quality Assurance in the Fish Industry. Elsevier Science Publishers B. V ., Amsterdam, pp.197-209.
Gilbert, R.J. 1995. '.Zero tolerance for Listeria monocytogenes in foods-is it necessary or realistic? In Proceedings of the XII International Symposium on Problems of Listeriosis, Perth, Australia, 2-6 October, pp. 351-356.
Gill, ~.O. 1986. Temperature function integration for hygiene evaluation. of food processing procedures. Food Technol. Aust. 3 8:203-204.
Gill, C.O., G.G. Greer, and B.D. Dilts. 1997. The aerobic growth of Aeromonas hydrophila and Listeria monocytogenes in broths and .on pork. Int. J. Food Microbiol. 3 5:67-74.
Gill, D.A. 1931. Circling disease of sheep in New Zealand. Vet. J. 87:60-74.
Gill, D.A~ 1937. ·Ovine bacterial encephalitis (Circling Disease) and the bacterial genus Listerella Aust. Vet. J. 13:46-:56.
Gilot, P., and P. Andre. 1995. Characterization of five esterases from Listeria monocytogenes and use of their electrophoretic polymorphism for strain typing. Appl. Env. Microbial. 61: 1661-1665.
Gilson, E., J.M. Clement, D. Brutlag, and M. Hofnung. 1984. A family of dispersed repetitive extra.genie palindromic DNA sequences in E. coli. EMBO J. 3:1417-1421.
Gitter, M., R.StJ. Stebbings, J.A. Morris, D. Hannam, and C. Harris. 1986. Relationship between ovine listeriosis and silage feeding. Vet. Ree. 118:207-208.
Gouet, P., J.P. Girardeau, and Y. Riou. 1977. Inhibition of Listeria monocytogenes by defined lactic microflora in gnotobiotic silages of luceme, fescue, ryegrass and maize-influence of dry matter and temperature. Anim. Feed. Sci. Technol. 2:297-305.
Gould, G. W. 1989. Mechanisms of action of food preservation procedures. Elsivier Science Publishers, New York.
212
Gould, G.W., and M.V. Jones. 1989. Combination and synergistic effects. In G.W., Gould (Ed.), Mechanisms of Action of Food Preservation Procedures, Elsivier Science Publishers, New York, pp. 401-421.
Gram, L., and H.H. Huss. 1996. Microbiological spoilage of fish and fish products. Int. J. FoodMicrobiol. 33:121-137.
Grant, I.R., C.R. Nixon, and M.F. Patterson. 1993. Comparison of the growth of Listeria monocytogenes in unirradiated and irradiated cook-chill roast beef and gravy at refrigeration temperatures. Lett. Appl. Microbiol. 1 7:55-57.
Grau, F.H., and P.B. Vanderlinde. 1993. Aerobic growth of Listeria monocytogenes on beef lean and fatty tissue: equations describing the effects of temperature and pH. J. Food Prot. 5 6: 96-101.
Gray, M.L. 1960a. A possible link in the relationship between silage feeding and listeriosis. J. Amer. Vet. Med. Assoc. 136:205-208.
Gray, M.L. 1960b. Isolation of Listeria monocytogenes from oat silage. Science. 132: 1767-1768.
Gray, M.L., and A.H. Killinger. 1966. Listeria monocytogenes and Listeric infections. Bacteriol. Rev. 3 0:309-382.
Gray, M.L., H.J. Stafseth, and F.JR. Thorp. 1950. Note: the use of potassium tellurite, sodium azide, and acetic acid in a selective medium for the isolation of Listeria monocytogenes. J. Bacteriol. 5 9:443-444.
Gray, M.L., H.J. Stafseth, F. Thorp Jr. , L.B. Sholl, and W.F. Riley Jr. 1948. A new technique for isolating listerellae from the bovine brain. J. Bacteriol. 5 5:471-476.
Gr!ZSnstlZSI, H. 1979. Listeriosis in sheep- Listeria monocytogenes excretion and immunological state in sheep in flocks with clinical listeriosis. Acta Vet. Scand. 20:417-428.
Groves, R.D., and H.J. Welshimer. 1977. Separation of pathogenic from apathogenic Listeria monocytogenes by three in vitro reactions. J. Clin. Microbiol. 5:559-563.
Guyer, S., and T. Jemmi. 1990. Betriebsuntersuchungen zum Vorkommen von Listeria monocytogenes in gerauchertem Lachs. (Analysis of the occurrence of Listeria monocytogenes in smoked salmon from a processing plant). Arch. Lebensmittelhyg 41: 144-146.
Guyer, S., and T. Jemmi. 1991. Behavior of Listeria monocytogenes during fabrication and storage of experimentally contaminated smoked salmon. Appl. Environ. Microbiol. 57:1523-1527.
Hansen, L.T ., T. Gill, and H.H. Huss. 1995. Effects of salt and storage temperature on chemical. microbiological and sensory changes in cold-smoked salmon. Food Res. Int. 28:123-130.
213
Harris, L.J., M.A. Daeschel, M.E. Stiles, and T.R. Klaenhammer. 1989. Antimicrobial activity of lactic acid bacteria against Listeria monocytogenes. J. Food Prot. 5 2:384-387.
Hart, C.D., G.C. Mead, and A.P. Norris. 1991. Effects of gaseous environment and · temperature on the storge behaviour of Listeria monocytogenes on chicken breast meat. J. Appl. Bacteriol. 7 0:40-46.
Hartemink, R., and F. Georgsson. 1991. Incidence of Listeria species in seafood and seafood salads. Int. J. Food Microbiol. 12: 189-196.
Harvey, J. and A. Gilmour. 1994. Application of multilocus enzyme electrophoresis and restricton fragment length polymorphism analysis to the typing of Listeria monocytqgenes strains isolated from raw milk, nondairy foods, and clinical and veterinary sources. Appl. Env. Microbiol. 60:1547-1553.
Harvey, J., and A. Gilmour. 1993. Occurrence and characteristics of Listeria in foods produced in Northern Ireland. Int. J. Food Microbiol. 19: 193-205.
Hayes, P.S., J.C. Feeley, L.M. Graves, G.W. Ajello, and D.W. Fleming. 1986. Isolation of Listeria monocytogenes from raw milk. Appl. Environ. Microbiol. 5 1:438-440.
Hayes, P.S., L.M. Graves, B. Swaminathan, G.W. Ajello, G.B. Malcolm, R.E. Weaver, R. Ransom, K. Deaver, B.D. Plikaytis, A. Schuchat, J. D. Wener, R. W. Pinner, C. V. Broome, and The Listeria study group. 1992. Comparison of . three selective enrichment methods for the isolation of Listeria monocytogenes from naturally contaminated foods. J. Food Prot. 5 5:952-959.
Heisick, J.E., D.E. Wagner, M.L. Nierman, and J.T. Peeler. 1989. Listeria spp. found on fresh market produce. Appl. Env. Microbiol. 55:1925-1927.
Heisick, J.E., L.I. Rosas-Marty, and S.R. Tatini. 1995. Enumeration of vialble Listeria species and Listeria monocytogenes in foods. J. Food Prot. 5 8:733-736.
Henry, B .S. 1933. Dissociation in the genus Brucella. J. Infect. Diseases 5 2:374-402.
Herman, L.M.F., J.H.G. Block, and R.J.B. Moermans. 1995. Direct detection of Listeria monocytogenes in 25 milliliters of raw milk by a two-step PCR with nested primers. Appl. Environ. Microbiol. 61:817-819.
Higgins, C.F., G.F. Ames, W.M. Barnes, J.M. Clement, and M. Hofnung. 1982. A novel intercistronic regulatory element of prokaryotic operons. Nature. 29 8 :760-762.
Hird, D.W. 1987. Review of evidence for zoonotic Listeriosis. J. Food Prot. 50:429-433.
Ho, J.L., K.N. Shands, G. Friedland, P. Ecklind, and D.W. Fraser. 1986. An outbreak of type 4b Listeria monocytogenes infection involving patients from eight Boston hospitals. Arch. Intern. Med. 146:520-524.
214
Holt, J.G. 1977. The Shorter Bergey's Manual of Determinative Bacteriology, Part 16: Non-Sporing, Rod-Shaped Bacteria. Williams and Wilkins, Baltimore.
Holt, J.G., N.R. Krieg, P.H.A. Sneath, J.T. Staley, and S.T. Williams. 1994. Bergey's Manual of Determinative Bacteriology, Group 19: Regular, Nonsporing GramPositive Rods. Williams and Wilkins, Baltimore.
Horner, B. 1992. Fish smoking: ancient and modem. Food Sci. Technol. Today. 6:166-171.
Houtsma, P.C. 1996. The antimicrobial activity of sodium lactate. PhD. Thesis, Agricultural University, Wageningen, The Netherlands.
Hudson, J. A., S.J. Mott, K.M. Delacy, and A.L. Edridge. 1992. Incidence and coincidence of Listeria spp., motile aeromonads and Y ersinia enterocolitica on ready-to-eat fleshfoods. Int. J. Food Micro biol. 1 6: 99-108.
Hudson, J.A. 1994. Comparison of response surface models for Listeria monocytogenes strains under aerobic conditions. Food Res. Int. 2 7:53-59.
Hudson, J.A., and S.J. Mott. 1993a. Growth of Listeria monocytogenes, Aeromonas hydrophila and Yersinia enterocolitica on cold-smoked salmon under refrigeration and mild temperature abuse. Food Micro biol. 1 0: 61-68.'
Hudson, J.A., and S.J. Mott. 1993b. Growth of Listeria monocytogenes, Aeromonas hydrophila and Y ersinia enterocolitica in pate and a comparison with predictive models. Int. J. Food Microbial. 20:1-11.
Hulton, C.S.J., C.F Higgins, and P.M. Sharp. 1991. ERIC sequences: a novel family of repetitive elements in the genomes of Escherichia coli, Salmonella typhimurium and other enterobacteria Mol. Micorbiol. 5 :825-834.
Huss, H.H., P. Karim Ben Embarek, and V. From Jeppesen. 1995. Control of biological hazards in cold smoked salmon production. Food Control. 6:335-340.
ICMSF. 1988. Microorganisms in Food 4: Application of the Hazard Analysis Critical Control Point (HACCP) System to Ensure Microbiological Safety and Quality. Blackwell Scientific Publ., Oxford.
Ingram, M., and B.M. Mackey. 1976. Inactivation by cold. In F.A. Skinner, and W.B. Hugo (Eds.), Inhibition and Inactivation of Vagetative Microbes, Academic Press, New York, pp. 111-151.
Inoue, S., T. Tanikawa, J. Kawaguchi, T. Iida, and C. Morita. 1992. Prevalence of Listeria (spp.) in wild rats captured in the Kanto area of Japan. J. Vet. Med. Sci. 5 4:461-463.
Ita, P.S., and R.W. Hutkins. 1991. Intracellular pH and survival of Listeria monocytogenes Scott A in tryptic soy broth containing acetic, lactic, citric, and hydrochloric acids. J. Food Prot. 54:15-19.
215
Jemmi, T. 1993. Listeria monocytogenes in smoked fish: an overview. Arch. Lebensmittelhyg 44:10-13.
Jemmi, T., and A. Keusch. 1994. Occurrence of Listeria monocytogenes in freshwater fish farms and fish-smoking plants. Food Microbial. 11:309-316.
Jepras, R.I., J. Carter, S.C., F.E. Paul,.and M.J. Wilkinson. 1995. Development of a robust flow cytometric assay for determining numbers of viable bacteria. Appl. Environ. Microbiol. 61:2696-2701.
Jersek, B., E. Tchemeva, N. Tijpens, and L. Herman. 1996. Repetitive element sequence-based PCR for species and strain discrimination in the genus Listeria. Lett. Appl. Microbiol. 23 :55-60.
Jones, D. 1990. Foodbome listeriosis. Lancet336:1171-1174.
Junttila, J. T., S .I. Niemela, and J. Him. 1988. Minimum growth temperatures of Listeria monocytogenes and non-haemolytic listeria. J. Appl. Bacteriol. 6 5:321-327.
Kampelmacher, E.H., and L.M. van Noorle Jansen. 1969. Isolation of Listeria monocytogenes from faeces of clinically healthy humans and animals. Zbl. Bakteriol. Abt. I. Orig. 211:353-359.
Kampelmacher, E.H., and L.M. van NoorleJansen. 1975. Occurrence of Listeria monocytogenes in effluents. In M. Woodbine (Ed.), Problems of Listeriosis, Leicester University Press, Leicester, England.
Kaplan, M.M. 1945. Listerellosis. N. Eng. J. Med. 232:755-759.
Kaufmann, S.H.E. 1988. Listeriosis: new findii:igs-current concerns. Microb. Pathogenesis. 5:225-231.
Kawamura, K., and M. Kaneko. 1986. Microbial quality of human wastes and treatment plant effluent. Water Science and Technology. 18:257-265.
Kelly, W.J., R.V. Asmundson, and C.M. Huang.1996. Isolation and characterization of bacteriocin-producing lactic acid bacteria from ready-to-eat food products. Int. J. Food Microbiol. 3 3:209-218.
Klausner, R.B., and C.W. Donnelly. 1991. Environmental ~ources of Listeria and Yersinia in Vermont dairy plants. J. Food Prot. 5 4:607-611.
Koch, A.L. 1981. Growth measurement. In P. Gerhardt, R.G.E. Murray, and R.N. Costello et al. (Eds.) Methods for General Bacteriology, American Society for Microbiology, Washington, pp. 179-207.
Kramer, P.A., and D. Jones. 1969. Media selective for Listeria monocytogenes. J. Appl. Bacteriol. 3 2:381-394.
Krist, K. 1997. Description and mechanisms of bacterial growth responses to water activity and compatible solutes. PhD. Thesis, University of Tasmania, Hobart, Australia.
216
Lawrence, L.M., and A. Gilmour. 1995. Characterization of Listeria monocytogenes isolated from poultry products and from the poultry-processing environment by random amplification of polymorphic DNA and multilocus enzyme electrophoresis. Appl. Environ. Microbial. 61 :2139-2144.
Lehnert, C. 1960. Die Tenezitat von Listeria monocytogenes in der Aussenwelt. Zentralbl. Bakt. ParasitKde. Abt. I. Originate. 18 0:350-356.
Leistner, L. 1985. Hurdle technology applied to meat products of the shelf stable and intermediate moisture food types. In D. Simatos, and J.L. Multon (Eds.), Properties of Water in Foods in Relation to Quality and Stability, Martinus Nijhoff Publishers, Dorrecht, The Netherlands, pp. 309-329.
Leistner, L. 1994. Further developments in the utilization of hurdle technology for food preservation. J. Food Engineering. ~2:421-432.
Le mes how, S ., and J-R Le Gall. 1994. Mode ling the severity of illness of I CU patients. JAMA. 272:1049-1055. ~--
Leung, C-K., Y-W. Huang, and O.C. Pancorbo. 1992. Bacterial pathogens and indicators in catfish and pond environments. J. Food Prot. 5 5:424-427.
Liewen, M.B., and M.W. Plautz. 1988. Occurrence of Listeria monocytogenes in raw milk in Nebraska. J. Food Prot. 5 2:618-624.
Linnan, M., L. Mascola, X.D. Low, B. Goulet, S. May, C. Salminen, D. Hird, L. Yonekura, P. Hayes, R. Weaver, A. Andurier, B.D. Plikaytis, S.L. Fannin, A. Kleks, and C.V. Broome. 1988. Epidemic listeriosis associated with Mexicanstyle cheese. N. Eng. J. Med. 319:823-828.
Loncarevic, S., W. Tham, and M.-L. Danielsson-Tham. 1996. Prevalence of Listeria monocytogenes and other listeria spp. in smoked and "gravad" fish. Ada Vet. Scand. 37:13-18.
Louws, F .J., F. W. -Fulbright, C. T. Stephens, and F .J. de Bruijn. 1994. Specific genomic fingerprints of phytopatogenic Xanthomonas and Pseudomonas pathovars and strains generated with repetitive sequences and PCR. Appl. Environ. Microbiol. 60:2286-2295.
Lovett, J. 1988. Isolation and identification of Listeria monocytogenes in dairy products. J. Assoc. Off. Anal. Chem. 71:658-660.
Lovett, J. 1989. Listeria monocytogenes. In M.P. Doyle (Ed.), Foodborne Bacterial Pathogens, Marcel Dekker, New York, pp. 283-310.
Lovett, J.' 1990. Taxonomy and general characteristics of Listeria spp. In A.L. Miller, J.L. Smith, and Q.A. Somkuti (Eds.), Foodborne Listeriosis, Elsevier Science Publishers B. V ., Amsterdam, pp. 9-12.
I
Lovett, J., D.W. Francis, and J.M. Hunt. 1987. Listeria monocytogenes in raw milk: detection, incidence, and pathogenicity. J. Food Prot. 50:188-192.
217
Low, J.C., and C.P. Renton. 1985. Septicemia, encephalitis and abortions in a housed flock of sheep caused by Listeria monocytogenes type 1/2. Vet. Ree. 116:147-150.
Lueck, E. 1980. Antimicrobial Food Additives: Characteristics, Uses, Effects. SpringerVerlag, Berlin.
Lupski, J.R., and G.M. WeinstQck. 1992. Short, interspersed repetitive DNA sequences in prokaryotic genomes. J. Bacteriol. 174 :4525-4529.
Mackey, B.M., and N. Bratchell. 1989. The heat resistance of Listeria monocytogenes. Lett. Appl. Microbial. 9:89-94.
Marmur, J., and P. Doty. 1962. Determination of the base composition of deoxyribonucleic acid from its thermal denaturation temperature. J. Mol. Biol. 5:109-118.
Marshall, D.L., and R.H. Schmidt. 1988. Growth of Listeria monocytogenes at l0°C in milk preincubated with selected Pseudomonads. J. Food Prot. 51:277-282.
Martin, B., 0. Humbert, M. Camara, E. guenzi, H. Walker, T. Mitchell, P. Andrew, M. Prudhomme, G. Alloing, R. Hakenbeck, D.A. Morrison,.G.J. Boulais, and J.-P. Clavrys. 1992. A highly conserved repeated DNA element located in the chromosome of Streptococcus pneumoniae. Nucl. Acids Res. 20:3479-3483.
Matthews, H.H., and A. Volframs. 1978. Investigating the physical aspects of bays and estuaries: a study of the hydrology and hydrodynamics of North West Bay. Board of Environmental Studies, U~versity of Tasmania, Hobart, Australia.
McCarthy, S.A. 1997. Incidence and survival of Listeria monocytogenes in ready-to-eat seafood products. J. Food Prot. 6 0:372-376.
McClure, P.J., C. de W. Blackbum, M.B. Cole, P.S. Curtis, J.E. Jones, J.D. Legan, l.D. Ogden, M.W. Peck, T.A. Roberts, J.P. Sutherland, and S.J. Walker. 1994. Modelling the growth, survival and death of microorganisms in foods: the UK Food Micromodel approach. Int. J. Food Microbial. 23:265-275.
McClure, P.J., T.A. Robert, and P. Otto Oguru. 1989. Comparison of the effects of sodium chloride, pH and temperature on the growth of Listeria monocytogenes on gradient plates and in liquid medium. Lett. Appl. Microbial. 9:95-99.
McClure, P.J., T.M. Kelly, and T.A. Roberts. 1991. The effects of temperature, pH, sodium chloride and sodium nitrite on the growth of Listeria monocytogenes. lnt. J. Food Microbiol.14:11-92.
McDonald, P. 1970.Trends in silage making. In F.A. Skinner, and J.G. Carr (Eds.), Microbiology in Agriculture, Fisheries and Food, Academic Press, London, pp. 109-123.
McKay, A.M. 1993. The effect of temperature on culturability and detection of Listeria innocua in water. Lett. Appl. Microbial. 17 :185-187.
218
McKellar, R.C. 1994a. Identification of the Listeria monocytogenes virulence factors involved in the CAMP reaction. Lett. Appl. Microbial. 18:79-81.
McKellar, R.C. 1994b. Minireview: use of the CAMP test for identification of Listeria monocytogenes. Appl. Environ. Microbial. 6 0:4219-4225.
McLauchlin, J. 1995. What is the infective dose for human listeriosis?. In Proceedings of the XII International Symposium on Problems of Listeriosis, Perth, Australia, 2-6 October, pp. 365-369.
McLauchlin, J. 1~96. Molecular conventional typing methods for Listeria monocytogenes: the UK approach. J. FoodProt. 59:1102-1105.
McLauchlin, J., A. Audurier, and A.G. Taylor. 1986. The evaluation of a phage-typing system for Listeria monocytogenes for use in epidemiological studies. J. Med. -Microbial. 22:357-365.
McLauchlin, J., and L. Newton. 1995. Human listeriosis in England, Wales and northern Ireland: a changing pattern of infection. In Proceedings of the XII International Symposium on Problems of Listeriosis, Perth, Australia, 2-6 October, pp.177-179.
McLauchlin,J., S.M. Hall, S.K. Velani, and R.J. Gilbert. 1991. Human listeriosis and pate: a possible association. Brit Med J. 303:773-775.
McMeekin, T.A., and T. Ross. 1996. Shelf life prediction: status and future possibilities. Int. J. Food Microbial. 3 3:65-83.
McMeekin, T.A., J. Brown, K. Krist, D. Miles, K. Neumeyer, D.S. Nichols, J. Olley, K. Presser, D.A. Ratkowsky, T. Ross, M. Salter, and S. Soontranon. 1997. Quantitative microbiology: a basis for food safety. Emerging Infectious Diseases. 3:541-549.
McMeekin, T.A., J.N. Olley, T. Ross, and D.A. Ratkowsky. 1993. Predictive Microbiology: Theory and Application. Research Studies Press, Taunton, UK.
McMeekin, T.A., R.E. Chandler, P.E. Koe, C.D. Garland, J. Olley, S. Putro, and D.A. Ratkowsky. 1987. Model for the combined effect of temperature and water activity on the growth rate of Staphylococcus xylosus. J. Appl. Bacterial. 6 2:543-550.
Miles, D. 1994. Predicting the growth of Vibrio parahaemolyticus. B.Sc.(Hons.) Thesis, University of Tasmania, Hobart, Australia
Miller, _A.J., J.L. Smith, and G.A. Somkuti. 1990. Foodbome listeriosis. Elsevier · Science Publishers B. V., Amsterdam.
Mitchell, R. 1974. Introduction to environmental microbiology. Prentice-Hall, Inc., New Jersey.
219
Monfort, P., J. Minet, J. Rocourt, G. Piclet, and M. Cormier. 1998. Incidence of Listeria spp. in Breton live shellfish. Lett. Appl. Microbiol. 26:205-208.
Montville, T.J. 1997. Principles which influence microbial growth, survival, and death in foods. In M.P. Doyle, L.T. Beuchat, and T.J. Montville (Eds.), Food Microbilogy: Fundamentals and Frontiers, ASM Press,Washington, D.C., pp. 13-29.
Mossel, D.A.A., F. V. Rossem, M. Doopmans, M. Hendriks, M. Verouden and I. Eelderink. 1980. Quality control of solid culture media: a comparison of the classic and the so-called ecometric technique. J. Appl. Bacterial. 4 9:439-454.
Mossel, D.A.A., M. Jansma and J. De Waart. 1981. Growth potential of 114 strains of epidemiologically most common Salmonellae and Arizonae between 3 and 17°C. In T.A. Roberts, G. Hobbs, J.H.B. Christian, and N. Skovgaard (Eds), Growth Potential of 114 Sstrains of Epidemiologically Most Common Salmonellae and Arizonae between 3and17°C, Aalborg, Denmark, pp. 29-37.
Mossel, D.A.A., T.M.G.B-V. uiarhoven, A.M.Th. Ligtenberg-Merdus, and M.E.B. Werdler. 1983. Quality asssurance of selective culture media for bacteria, moulds and, yeasts: £1.n attempt at .standardization at the international level. J. Appl. Bacterial. 5 4:313-327.
\ Motes, M.L., Jr. 1991. Incidence of Listeria spp. in shrimp, oysters, and estuarine
waters. J. Food Prot. 5 4:170-173.
Munday, B.L.~ F.B. Ryan, S.J. King, and A. Corbould. 1966. Preparturient infections and other causes of foetal loss in sheep and cattle in Tasmania. Aus. Vet. J. 42:189-193. \
Murray, EG.D., R.A. Webb, and M.B.R. Swann. 1926. A disease of rabbits characterised by a large mononuclear leucocytosis, caused by a hitherto undescribed bacillus Bacterium monocytogenes (n.sp.). J. Pathol. Bacterial. 29:407-439.
Nasim R. B., and R. Vahidy. 1993. Human Listeria! meningitis: reported from Karachi, Pakistan. J. Islamic Academy Sciences. 6:253-258.
National Food Authority. 1994. Food Standards Code Incorporating Amendments up to and Including Amendment 22 October 1994. The Australian Government Publishing Service, Canberra.
Neidhardt, F.C., J.L. Ingraham, and M. Schaechter. 1990. Physiology of the Bacterial Cell. Sinauer Associates Inc., Sunderland., USA.
Neumeyer, K., T. Ross, and T.A. McMeekin. 1997a. Development of a predictive model to describe the effects of temperature and water activity on the growth of spoilage · pseudomonads. /nt. J. Food Microbiol. 3 8:45-54. ,
Neumeyer, K., T. Ross, 0. Thomson, and T.A. McMeekin. 1997b. Validation of a model describing the effects of temperature and water activity on the growth of psychrotrophic pseudomonads. Int. J. Food Microbial. 3 8:55-63.
220
Newbury, S.F., N.H. Smith, E.C. Robinson, l.D. Hiles, and C.f. Higgins. 1987. Stabilization of translationally active mRNA by prokaryotic REP sequences. Cell, 48:297-310.
Ng, S., and J.R.L. Forsyth. 1993. Listeriosis in Victoria. Comm. Dis. Intell. 17:422-423.
Nolan, D.A., D.C. Chamblin, and J.A. Troller. 1992. Minimal water activity levels for growth and survival of Listeria monocytogenes and Listeria innocua. Int. J. Food Microbial. 16:323-335.
N0rrung, B., and N. Skovgaard. 1993. Application of multilocus enzyme electrophoresis in studies of the epidemiology of Listeria monocytogenes in Denmark. Appl. Environ. Microbial. 5 9:2817-2822.
Odegard, B., R. Grelland, and R.L. Hendrikwen. 1952. A case of Listeria-infection in man, transmitted from sheep. Acta. Med. Scand. 142:231-238.
Oladepo, D.K., A.A.G. Candlish, and W.J. Stimson. 1992. Detection of Listeria monocytogenes using polyclonal antibody. Lett. Appl. Microbiol. 14:26-29.
Olafson, P. 1940. Listerella encephalitis (circling disease) in sheep, cattle, and goats. Cornell Bet. 30:141-150.
Owen, C.R., A. Meis, J.W. Jackson, and H.G. Stoenner. 1960. A case of primary cutaneous listeriosis. N. Eng. J. Med. 262:1026-1028.
Partmann, W. 1965. Changes in proteins, nucleotides and carbohydrates during rigor mortis. In the Technology of Fish Utilization, International Symposium, Husum (Schleswig-Holstein) May 1964, Fishing News, London.
Patchett, R.A., N. Watson, P.S. Fernandez, and R.G. Kroll. 1996. The effect of temperature and growth rate on the susceptibility of Listeria monocytogenes to environmental stress conditions. Lett. Appl. Microbiol. 22:121-124.
Pelroy, G.A., M.E. Peterson, P.J. Holland, and M.W. Eklund. 1994. Inhibition of Listeria monocytogenes in cold-process (smoked) salmon by sodium lactate. J. Food Prot. 57:108-113.
Perry, C.M., and C.W. Donnelly. 1990. Incidence of Listeria monocytogenes in silage and its subsequent control by specific and nonspecific antagonism. J. Food Prot. 5 3:642-647.
Peterson, M.E., G.A. Pelroy, R.N. Paranjpye, F.T. Poysky, J.S. Almond, and M.W. Eklund. 1993. Parameters for control of Listeria monocytogenes in smoked fishery produucts: sodium chloride and packaging method. J. Food Prot. 5 6:938-943.
Petran, R.L., and E.A. Zottola. 1989. A study of factors affecting growth and recovery of Listeria monocytogenes Scott A. J. Food Sci. 5 4:458-460.
221
Petran, R.L., and K.M.J. Swanson. 1993. Simultaneous growth of Listeria monocytogenes and Listeria innocua. J. Food Prot. 5 6:616-618.
Phillips, C. 1993. Factors effecting water quality on oyster leases. B.Sc.(Hons.) Thesis, University of Tasmania, Hobart, Australia
Piffaretti, J-C., H. Kressebuch, M. Aeschbacher, J. Bille, E. Bannerman, J.M. Musser, R.K. Selander, and J. Rocourt. 1989. Genetic characterization of clones of the bacterium Listeria monocytogenes causing epidemic disease. Proc. Natl. Acad. Sci. USA. 8 6:3818-3822.
Pirie, J.H.H. 1927. A new disease of veld rodents "Tiger Tiver Disease". Publications of the South Africa Institute for Medical Research. 3: 163-186.
Pirie, J.H.H. 1940. Listeria: change of name for a genus of bacteria. Nature. 145:264.
Portnoy, D.A., T. Chakraborty, W. Goebel, and P. Cossart. 1992. Molecular determinants of Listeria monocytogenes pathogenesis. Infect. Immun. 60:1263-1267.
Pothuri, P., D.L. Marshall, and K.W. McMillin. 1996. Combined effects of packaging atmosphere and lactic acid on growth and survival of Listeria monocytogenes in crayfish tail meat at 4oC. J. Food Prot. 5 9:253-256.
Prentice, G.A., and P. Neaves. 1992. The identification of E,isteria species. In R.G. Board, D. Jones, and P.A. Skinner (Eds.), Identification Methods in Applied and Environmental Microbiology, Blackwell scientific Publications, Melbourne, pp. 283-296.
Presser, K.A. 1995. Modelling the growth response of E. coli to pH and lactic acid. B.Sc.(Hons.) Thesis, University of Tasmania, Hobart, Australia.
' Presser, K.A., D.A. Ratkowsky, and T. Ross. 1997a. Modelling the growth rate of Escherichia coli as a function of pH and lactic acid concentration. Appl. Environ. Microbiol. 6 3:2355-2360.
Presser, K.A., D.A. Ratkowsky, M.A. Salter, and S. Soontranon. 1997b. A new approach for modelling the interface between growth and no growht for E. coli and Listeria monocytogenes using .generalised nonlinear regression. Poster presented at the 9th Annual Australian Food Microbiology Conference, Sydney 20-23July1997.
Presser, K.A., T. Ross, and D.A. Ratkowsky. 1998. Modelling the growth limits (growth/no growth interface) of Escherichia coli as a function of temperature, pH, lactic acid concentration, and water activity. Appl. Environ. Microbiol. 64(5):in press.
Price, T.J., and J.S. Lee. 1970. Inhibition of "Pseudomonas species by hydrogen peroxide producing lactobacilli. J. Milk Food Technol. 3: 13-18.
222
Proctor, M.E., R. Brosch, H.W. Mellen, L.A. Garrett, C.W. Kaspar, and J.B. Luchansky. 1995. Use of pulsed-field gel electrophoresis to link sporadic cases of invasive listeriosis with recalled chocolate milk. Appl. Environ. Microbiol. 61:3177-3179.
Qvist, S., K. Sehested, and P. Zeuthen. 1994. Growth suppression of Listeria monocytogenes in a meat product. Int. J. Food Microbiol. 2 4:283-293.
Racz, P., K. Tenner, and E. Mero. 1972. Experimental Listeria enteritis. I. An electron microscopic study of the epithelial phase in experimental Listeria infection. Lab Invest. 2 6:694-700.
Ratkowsky, D.A., and T. Ross. 1995. Modelling the bacterial growth/no growth interface. Lett. Appl. Microbiol. 20:29-33.
Ratkowsky, D.A., J. Olley, T.A. McMeekin, and A. Ball. 1982. Relationship between temperature and growth rate of bacterial cultures. J. Bacteriol. 149:1-5.
Ratkowsky, D.A., R.K. Lowry, T.A. McMeekin, A.N. Stokes, and R.E. Chandler. , 1983. Model for bacterial culture growth rate throughout the entire biokinetic
temperature range. J. Bacterial. 154:1222-1226.
Ratkowsky, b.A., T. Ross, T.A. McMeekin, and J. Olley. 1991. Comparison of Arrhenius-type and Belehradek-type models for prediction of bacterial growth in foods. J. Appl. Bacterial. 71:452-459.
Ray, B., 1996. Fundamental Food Microbiology. CRC Press, New York.
Roberts, T.A. 1997. Microbial growth and survival: developments m predictive modeling. Food Technol. 51:88-90.
Roberts, T.A., A.C. Baird-Parker,andR.B. Tompkin. 1996. Micro-organisms in Foods 5: Microbiological Specifications of Food Pathogens. Blackie Academic and Professional, London.
Rocourt, J., and --P.A.D. Grimont. 1983. Listeria welshimeri sp. nov. and Listeria seeligeri sp. nov. Int. J. Syst. Bacterial. 3 3:866-869.
Rocourt, J., U. Wehmeyer, P. Cossart, and E. Stackebrandt. 1987a. Transfer of Listeria denitrificans to a new genus, Jonesia gen. nov., as Jonesia denitrificans comb. nov. Int. J. Syst. Bacteriol.-31:266-270.
Rocourt, J., U. Wehmeyer, P. Cossart, and E. Stackebrandt. 1987b. Proposal to retain Listeria murrayi and Listeria grayi in the genus Listeria. Int. J. Syst. Bacterial. 3 7:298-300. -
R!ZSrvik, L.M., and M. Yndesta~. 1991. Listeria monocytogenes in foods in Norway. Int. J. FoodMicrobiol.13:97-104.
223
RS11rvik, L.M., D.A. Caugant, and M. Yndestad. 1995. Contamination pattern of Listeria monocytogenes and other Listeria spp. in a salmon slaught'erhouse and smoked salmon processing plant. Int. J. Food Microbial. 25: 19-27.
RSZirvik, L.M., E. Skjerve, B.R. Knudsen, and M. Yndestad. 1997. Risk factors for contamination of smoked salmon with Listeria monocytogenes during processing. Int. J. Food Microbial. 3 7:215-219.
RSZirvik, L.M., M. Yndestad, and E. Skjerve. 1991. Growth of Listeria monocytogenes in vacuum-packed, smoked salmon, during storage at 4°C. Int. J. Food Microbial. 14: 111-118.
Rosenow, E.M., and E.H. Marth. 1987. Growth of Listeria monocytogenes in skim, whole and chocolate milk, and in whipping cream during incubation at 4, 8, 13, 21 and 35°C. J. Food Prot. 5 0:452-459.
Ross, T. 1993. A philosophy for development of kinetic models in predictive microbiology. PhD. Thesis, University of Tasmania, Hobart, Australia~
Ross, T. 1996. Indices for performance evaluation of predictive models m food microbiology.). Appl. Bacterial. 81:501-508.
Ross, T., and T.A. McMeekin. 1991. Pedictive microbiology: Applications of a square root model. Food Australia 43:202-207. "
Ross, T., and T.A. McMeekin. 1994. Review paper: predictive microbiology. Int. J. Food Microbial. 23:241-264.
Rosso, L., S. Bajard, J.P. Flandrois, C. Lahellec, J. Fournaud, and P. Vett. 1996. Differential growth of Listeria monocytogenes at 4 and 8°C: consequences for the shelf life of chilled products. J. Food Prot. 5 9:944-949.
Roszak, D.B., and R.R. Colwell. 1987. Survival strategies of bacteria in the natural environment. Microbial. Rev. 51:365-379.
Russell, N.J., and G.M. Cook. 1995. Energetic of bacterial growth: balance of anabolic and catabolic reactions. Microbial. Reviews. 5 9:48-62.
Ryser, E.T. 1995. Newly developed automated ribotyping system for Listeria. In Proceedings of the XII International Symposium on Problems of Listeriosis: Listeria Methods Workshop Manual: Detection, Identification and Typing of Listeria monocytogenes in Foods, Perth, Australia, 1-2 October, pp. 71-74.
Ryser, E.T., and E.H. Marth. 1988. Growth of Listeria monocytogenes at different pH values in uncultured whey or whey cultured with Penicillium camemberti. Can. J. · Microbial. 3 4:730-734.
Ryser, E.T., and E.H. Marth. 1991. Listeria, Listeriosis, and food safety. Marcel Dekker, New York.
224
Ryser, E.T., E.H. Marth, and M.P. Doyle. 1985. Survival of Listeria monocytogenes during manufacture and storage of cottage cheese. J. Food Prot. 4 8:746-750,753.
Salter, M. 1998. Effects of temperature and water activity on Escherichia coli in relation to beef carcasses. PhD. Thesis, University of Tas'rnania, Hobart, Australia.
Sanders, B., P. Manoel, K. Levey, G. Klamus, C. Bell, and A. Ford. 1991. Review of Effluent Disposal Practices. Australian Water Resources Council Water Management Series No. 20, Department of Primary Industries and Energy, Australian Government Publishing Service, Canberra.
Schilling, U., M. Kaya, and F.-K. Lticke. 1991. Behaviour of Listeria monocytogenes in meat and its control by a bacteriocin-producing ~train of Lactobacillus sake. J. Appl. Bacterial. 7 0:473-478.
Schlech, W.F., P.M. Lavigne, T.A. Bortolussi, A.C. Allen, E.V. Haldane, A.J. Wort, A.W. Heightower, S.E. Johson, S.H. King, E.S. Nicholls, and C.V. Broome. 1983. Epidemic listeriosis_evidence for transmission by food. N. Eng. J. Med. 308:203-206.
Schoolfield, R.M., P.J.H. Sharpe, and C.E. Magnuson. 1981. Non-linear regression of biological temperature-dependent rate models based on absolute reaction rate theory. J. Theor. Biol. 88:719-731.
Schuchat, A., B. Swaminathan, and C.V. Broome. 1991a. Epidemiology of human listeriosis. Clin. Microbial. Rev. 4: 169-183.
Schuchat, A., B. Swaminathan, and C.V. Broome. 199lb. Listeria monocytogenes CAMP reaction. Clin. Microbial. Rev. 4:396.
Schwartz, B., C.V. Broome, G.R. Brown, A.W. Lightower, C.A. Ciesielski, S. Gaventa, B. G. Gellin, and L. Mascola. 1988. Association of sporadic listeriosis with consumption of uncooked hot dogs and undercooked chicken. Lancet. I 1:779-782.
Seeliger, H.P.R. 1961. Listeriosis. Hafner Publishing Co., New York.
Seeliger, H.P.R. 1981. Apathogenic Listeria: L. innocua sp. n. (Seeliger and Schoop, 1977). Zbl. Bakt. Hyg., I. Abt. Orig. A 249:487-493.
Seeliger, H.P.R. and K. Hahne. 1979. Serotyping of Listeria monocytogenes and related species. Academic Press, New York.
Seeliger, H.P.R., and D. Jones. 1986. Genus Listeria. In P.H.A. Sneath, N.S. Mair, M.E. Sharpe, and J.G. Holt (Eds.), Bergey's Manual of Systemic Bacteriology, vol. 2. Williams and Wilkins Co., Baltimore, pp. 1235-1245.
Seeliger, H.P.R., and H. Finger. 1983. Listeriosis, In J.S. Remington, and J.O. Klein (Eds.), Infectious Diseases of the Fetus and Newborn Infant. W.B. Saunders Co., P~iladelphia, pp. 264-289.
225
Seeliger, H.P.R., J. Rocourt, A. Schrettenbrunner, P.A.D. Grimont, and D. Jones. 1984. Listeria ivanovii sp. nov. Int. J. Syst. Bacterial. 3 4:336-337.
Selander, R.K., D.A. Caugant, H. Ochman, J.M. Musser, M.N. Gilmour, and T.S. Whittam. 1986. Methods of multilocus enzyme electrophoresis for bacterial population genetics and systematics. Appl. Environ. Microbial. 51:873-884.
Sergeant, E.S.G., S.C.J. Love, and A. Mcinnes. 1991. Abortions in sheep due to Listeria ivanovii. Aust. Vet. J. 68:39.
~Sharpe, P.J.H., and D.W. DeMichele. 1977. Reaction kinetics and poikilotherm development. J. Theoretical Biol. 6 4:649-970.
Sharples, G.J., and R.G. Lloyd. 1990. A novel repeated DNA sequence located in the ir1ctergenic regions of bacterial chromosomes. Nucl. Acids Res., 18:6503-6508.
Shelef, L.A. 1994. Antimicrobial effects of lactates: a review. J. Food Prot. 5 7:445-450.
Sikorski, Z.E., A. Kolakowska, and J.R. Burt. 1990. Postharvest biochemical and microbial changes. In Z.E. Skikorski (Ed.), Seafood: Resifrces, Nutritional Composition, and Preservation, CRC Press Inc., Florida, pp. 55-75.
Sionkowski, P.J., and L.A. Shelef. 1990. Viability of Listeria monocytogenes strain Brie-1 in the avian egg. J. Food Prot. 53:15-17.
Sizmur,K., and C.W. Walker.1988. Listeriainprepacked salads. Lancet. 21:1167.
Skalka, B., J. Smola, and K. Elischerova. 1982. Routine test for in vitro differentiation of pathogenic and apathogenic Listeria monocytogenes strains. J. clin. Microbial. 15:503-507.
Smith, L.T. 1996. Role of osmolytes in adaptation of osmotically stressed and chillstressed Listeria monocytogenes growth in liquid media and on processed meat surfaces. Appl. Environ. Microbial. 6 2:3088-3093.
Smola,? J. 1989. Possiblilties of differentiation of listeria! hemolysins by synergistic hemolytic reactions (CAMP r~ctions). Int. J. Food Microbial. 8:265-267.
Sonnenwirth,A.C. 1973. Other pathogenic bacteria. In B.D. Davis, R. Dulbecco, H.N. Eisen, H.'S. Ginsberg, W.B. Wood, and M. McCarty (Eds.), Microbiology, 2nd edition, Harper and Row Publishers, New York, pp. 946-947.
Sorrells, K.M., D.C. Enigl, al}.d J.R. Hatfield. 1989. Effect of pH, acidulant, time, and temperature on the growth and survival of Listeria monocytogenes. J. Food Prot. 5 2:571-573.
Souef, P.N.L., and B.N.J. Walters. 1981. Neonatal listeriosis a summer outbreak. Med. J. Aust. 2: 188-191.
Stern, M.J., G.F-L. Smes, N.H. Smith, E.C. Robinson, and C.F. Higgins. 1984. Repetitive extragenic palindromic sequences: a major component of the bacterial genome. Cell 3 7: 1015-1026.
226
Stuart, S.E., and H.J. Welshimer. 1973. Intrageneric relatedness of Listeria Pirie. Int. J. Syst. bacteriol. 23:8-14.
Stuart, S.E., and H.J. Welshimer. 1974. Taxonomic reexamination of Listeria Pirie and transfer of Listeria grayi and Listeria murrayi to a new genus, Murraya. Int. J. Syst. bacteriol. 24:177-185.
Sutherland, P.S. 1989. Listeria monocytogenes. In K.A. Buckle, J.A. Davey, M.J. Eyles, A.O. Hocking, K'.G. Newton, and E.J. Stuttard (Eds.), Foodborne Microorganisms of Public Health Significance, 4th edition, J.M. Executive Printing Service, Australia, pp. 287-311.
Swaminathan, B., and G.M. Matar. 1993. Molecular typing methods. In D.H. Persing, T.F. Smith, F.C. Tenover, and T.J. White (Eds.), Diagnostic Molecula.r Microbiology Principles and Applications, ASM Press, Washington, D.C., pp. -26-50.
Tapia de Daza, M.S., Y. Villegas, and A. Martinez. 1991. Minimal water activity for growth of Listeria monocytogenes as affected by solute and temperature. Int. J. Food Microbiol. 14:333.-337.
ter Steeg, P.F., F.H., Pieterman, and J.C. Hellemons. 1995. Effects of air/nitrogen, temperature and pH on energy-dependent growth and sur\rival of Listeria innocua in continuous culture and water-in-oil emulsions. Food Microbiol. 12:471-485.
Teufel, P. 1994. European perspectives on Listeria monocytogenes. Dairy, food and environmental sanitation. 14:212-214.
Thomas, C.J. 1995. PCR, RAPD and PFGE methods for screening isolates of Listeria monocytogenes. In Proceedings of the XII International Symposium on Problems of Listeriosis: Listeria Methods Workshop Manual: Detection, Identification and Typing of Listeria monocytogenes in Foods, Perth, Australia, 1-2 October, pp. 84-100.
Towner, K.J., and A. Cockayne. 1993. Molecular Methods for Microbial Identification and Typing. Chapan and Hall, London.
Truelstrup Hansen, L. 1995. Quality of chilled, vacuum packed cold-smoked salmon. Industrial PhD. Thesis, Technical University, Denmark.
Truelstrup Hansen, L., T. Gill, and H.H. Huss. 1995. Effects of salt and storage temperature on chemical, microbiological and sensory changes in cold-smoked salmon. FoodRes. Int. 28:123-130.
Vandegraaff, R., N.A. Borland, and J.W. Browning. 1981. An outbreak of listeria! meningo-encephalitis in sheep. Aust. Vet. J. 57:94-96.
Verheul, A., F.M. Rombouts, R.R. Beumer, arid T. Abee. 1995. An ATP-dependent LCarnitine transporter in Listeria monocytogenes Scott A is involved in osmoprotection. J. Bacteriol. 177:3205-3212.
227
Versalovic, J., T. Koeuth, and J.R. Lupski. 1991. Distribution of repetitive DNA sequences in eubacteria and application to fingerprinting of bacterial genomes. Nucl. Acids Res. 19:6823-6831.
Vizcaino, L.L., M.-J. Cubero, and A. Contreras. 1988. Listeric abortions in ewes and cows associated to orange peel and artichoke silage feeding. In the 1 Oth International Symposium on Listeriosis, Pees, Hungary, 22-26 August, Abstr. 29.
Vlahovic, M.S., I. Kovincic, M. Mrdjan, L.J. Maslovaric, V. Pupavac, S. Bobos, and B. Trbic. 1988. The possibility of identification of Listeria monocytogenes in naturally infected cow's milk using fluorescent technic. In the lOth International Symposium on Listeriosis, Pees, Hungary, 22-26 August, Abstr. p. 71.
Vorster, S.M., R.P. Greebe, and G.L. Nortje. 1993. The incidence of Listeria m processed meats in South Africa. J. Food Prot. 56:169-172.
Wagner, M., A. Maderner, and E. Brandl. 1996. Random amplification of polymotphic DNA for tracing and molecular epidemiology of Listeria contamination in a cheese plant. J. Food Prot. 5 9:384-389. · - '
Walker, S .J., P. Archer, and J. G. Banks. 1990. Growth of Listeria monocyto genes at refrigeration temperatures. J. Appl. Bacteriol. 68:157-162.
Walls, I., and V.N. Scott. 1997. Validation of predictive mathematical models describing the growth of Listeria monocytogenes. J. Food Prot. 60:1142-1145.
Wang,,Guang-Hua, Ke-Ting Yan, Xiao-Ming Feng, Su-Ming Chen, Ai-Ping Lui, and Yataro Kodubo. 1992. Isolation and identific;ation of Listeria monocytogenes from retail meats in Beijing. J. Food Prot. 5 5:56-58.
Warburton, D.W., J.M. Farber, A. Armstrong, R. Caldeira, T. Hunt, S. Messier, R. Plante, N.P. Tiwari, and J. Vinet. 1991. A comparative study of the 'FDA' and 'USDA' methods for the detection of Listeria monocytogenes in foods. Int. J. Food Micro biol. 13: 105-118.
Watkins, J., and K.P. Sleath. 1981. Isolation and enumeration of Listeria monocytogenes from sewage, sewage sludge and river water. J. Appl. Bacteriol. 50:1-9.
Watson, C., M. Jackson, H. Kelly, K. Ott, S. Knowles, and J. Wells. 1990. Listeria outbreak in Western Australia. Comm. Dis. Intell. 24:9-12.
,Watson, D.C. 1985. Potential risks to human and animal health arising from land disposal of sewage sludge. J. Appl. Bacteriol. 5 9:95s-103s.
Weagant, S.D., P.N. Sado, K.G. Colburn, J.D. Torkelson, F.A, Stanley, M.H. Krane, S.C. Shields, and C.F. Thayer. 1988. The incidence of Listeria species in frozen seafood products. J. Food Prot. 51:655-657.
228
Weis, J., and H.P.R. Seeliger. 1975. Incidence of Listeria monocytogenes in nature. Appl. Microbiol. 3.0:29-32.
Welsh, J., and M. McClelland. 1990. Fingerprinting genomes using PCR with arbitrary primers. Nucl. Acids Res. 18:7213-7218.
Welshimer, H.J. ~960. Survival of Listeria monocytogenes in soil. J. Bacteriol. 8 0:316-320.
Welshimer, H.J. 1968. Isolation of Listeria monocytogenes from vegetation. J. Bacteriol. 9 5:300-303.
Welshimer, H.J., and J. Donker-Voet. 1971. Listeria monocytogenes in nature. Appl. Microbiol. 21:516-519.
Wesley, 1.V., and F. Ashton. 1991. Restriction enzyme analysis of Listeria monocytogenes strains associated with foodbome epidemics. Appl. Environ. Microbiol. 57:969-975
Whiting, R.C., and J.C. Oriente. 1997. Time-to-turbidity model for non-proteolytic type B Clostridium botulinum. Int. J. Food Microbiol. 3 5:49-60.
Whiting, R.C., and M. Cygnarowicz-Provost. 1992. A quantitative model for bacterial growth and decline. Food Microbiol. 9 :269-277.
Whiting, R.C., and R.L.B. Buchanan. 1997. Predictive modeling. In M.P. Doyle, L.R. Beuchat, and' T.J. Montville (Eds.), Food Microbiology Fundamentals and Frontiers, American Society for Microbiology Press, Washington, D.C., pp. 728-739.
WHO Working Group. 1988. Foodborne Listeriosis. Bulletin of the World Health Organization. 6 6:421-428.
Wijtzes, T. 1996. Modelling the microbial quality and safety of foods. PhD. Thesis, Agricultural University; Department of Food Science, Wageningen, The Netherlands.
Wijtzes, T., P.J. McClure, M:H. Zwietering, and T.A. Roberts. 1993. Modelling bacterial growth of Listeria monocytogenes as a function of water activity, pH and temperature. Int. J. Food Microbiol. 18: 139-149.
Wilesmith, H.W., and M. Gitter. 1986. Epidemiology of ovine listeriosis in Great Britain. Vet. Ree. 119:467-470.
Wilkins, P.O., R. Bourgeois, and R.G.E. Murray. 1972. Psychrotrophic properties of Listeria monocytogenes. Can. J. Microbiol. 18:543-551.
Wimpfheimer, L., N.S. Altman, and J.H. Hotchkiss. 1990. Growth of Listeria monocytogenes Scott A, serotype 4 and competitive spoilage organisms in raw chicken packaged under modified atmospheres and in air. Int. J. Food Microbiol. 11:205-214.

229
Wong, H-C, W-L Chao, and S-J Lee. 1990. Incidence and characterization of Listeria monocytogenes in foods available in Taiwan. Appl. Environ. Microbial. 5 6:3101-3104.
Woods, C.R., J. Versalovic, T. Koeuth, and J.R. Lupski. 1993. Whole-cell repetitive element sequence-based polymerase chain reaction allows rapid assessment of clonal relationships of bacterial isolates. J. Clin. Microbiol 31: 1927-1931.
Young, K.M., and P.M. Foegeding. 1993. Acetic, lactic and citric -acids and pH inhibition of Listeria monocytogen~s Scott A and the effect on intracellular pH. J. Appl. Bacterial. 7 4:515-520.
Zottola, E.A., and L.B. Smith. 1991. The microbiology of foodborne disease outbreaks: an update. J. Food Safety. 11:13-29.
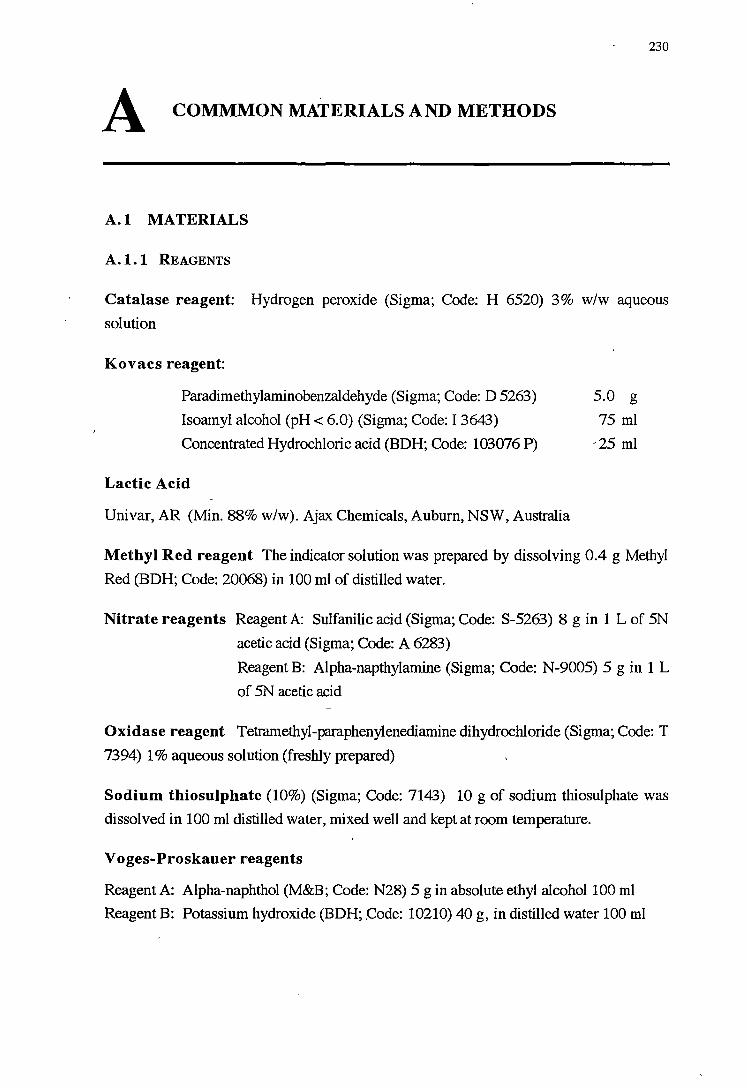
230
A COMMMON MATERIALS AND METHODS
A.1 MATERIALS
A. l. 1 REAGENTS
Catalase reagent: Hydrogen peroxide (Sigma; Code: H 6S20) 3% w/w aqueous
solution
Kovacs reagent:
Paradimethylaminobenzaldehyde (Sigma; Code: D S263)
Isoamyl alcohol (pH< 6.0) (Sigma; Code: I 3643)
Concentrated Hydrochloric acid (BDH; Code: 103076 P)
Lactic Acid
Univar, AR (Min. 88% w/w). Ajax Chemicals, Auburn, NSW, Australia
s.o g
7S ml
,2S ml
Methyl Red reagent The indicator solution was prepared by dissolving 0.4 g Methyl
Red (BDH; Code: 20068) in 100 ml of distilled water.
Nitrate reagents Reagent A: Sulfanilic acid (Sigma; Code: S-S263) 8 g in 1 L of SN
acetic acid (Sigma; Code: A 6283)
Reagent B: Alpha-napthylamine (Sigma; Code: N-900S) S g in 1 L
of SN acetic acid
Oxidase reagent Tetramethyl-paraphenylenediamine dihydrochloride (Sigma; Code: T
7394) 1 % aqueous solution (freshly prepared)
Sodium thiosulphate (10%) (Sigma; Code: 7143) 10 g of sodium thiosulphate was
dissolved in 100 ml distilled water, mixed well and kept at room temperature.
Voges-Proskauer reagents
Reagent A: Alpha-naphthol (M&B; Code: N28) S gin absolute ethyl alcohol 100 ml
Reagent B: Potassium hydroxide (BDH; .Code: 10210) 40 g, in distilled water 100 ml
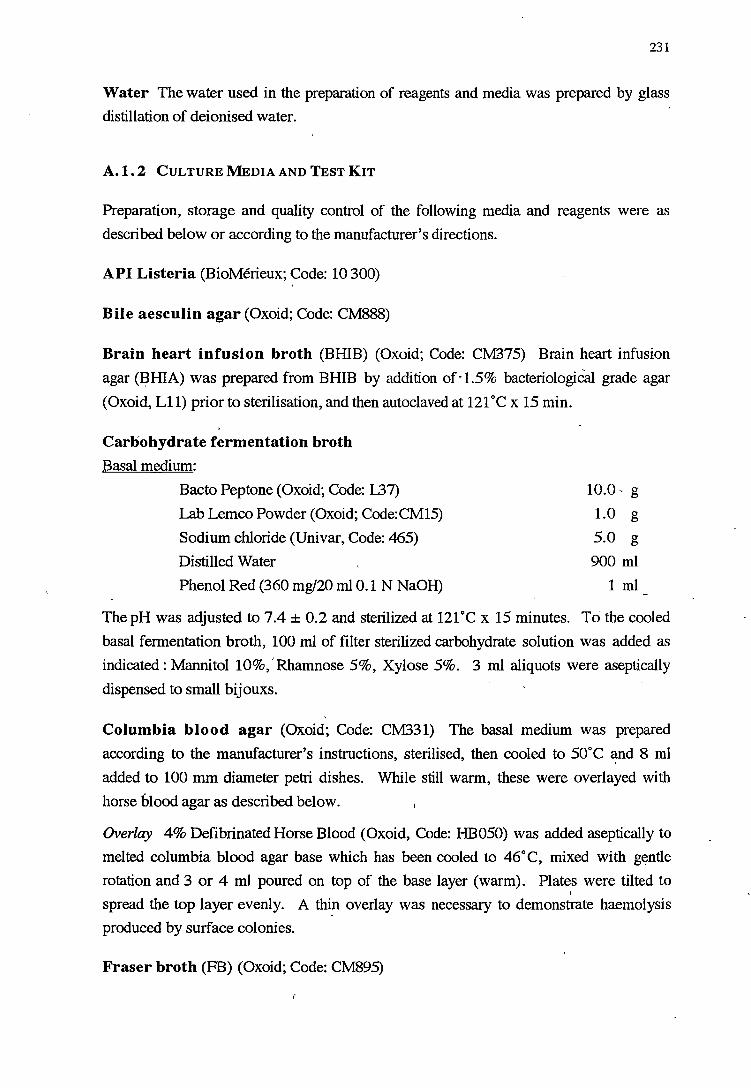
231
Water The water used in the preparation of reagents and media was prepared by glass
distillation of deionised water.
A.1. 2 CULTURE MEDIA AND TEST KIT
Preparation, storage and quality control of the following media and reagents were as
described below or according to the manufacturer's directions.
API Listeria (BioMerieux; Code: 10 300)
Bile aesculin agar (Oxoid; Code: CM888)
Brain heart infusion broth (BHIB) (Oxoid; Code: CM375) Brain heart infusion
agar (BHIA) was prepared from BHIB by addition of· l.5% bacteriologiCal grade agar
(Oxoid, Ll 1) prior to sterilisation, and then autoclaved at 121°C x 15 min.
Carbohydrate fermentation broth
Basal medium:
Bacto Peptone (Oxoid; Code: 137)
Lab Lemco Powder (Oxoid; Code:CM15)
Sodium chloride (Univar, Code: 465)
Distilled Water
Phenol Red (360 mg/20 ml 0.1 N NaOH)
10.0' g
1.0 g
5.0 g
900 ml
1 ml
The pH was adjusted to 7.4 ± 0.2 and sterilized at 121°C x 15 minutes. To the cooled
basal fermentation broth, 100 ml of filter sterilized carbohydrate solution was added as
indicated: Mannitol 10%,'Rhamnose 5%, Xylose 5%. 3 ml aliquots were aseptically
dispensed to small bijouxs.
Columbia blood agar (Oxoid; Code: CM331) The basal medium was prepared
according to the manufacturer's instructions, sterilised, then cooled to 50°C ~nd 8 ml
added to 100 mm diameter petri dishes. While still warm, these were overlayed with
horse blood agar as described below.
Overlay 4% Defibrinated Horse Blood (Oxoid, Code: HB050) was added aseptically to
melted columbia blood agar base which has been cooled to 46°C, mixed with g~ntle
rotation and 3 or 4 ml poured on top of the base layer (warm). Plates were tilted to I
spread the top layer evenly. A thin overlay was necessary to demonstrate haemolysis
produced by surface colonies.
Fraser broth (FB) (Oxoid; Code: CM895)
232
Lauryl tryptose broth (LTB) (Oxoid; Code: CM451)
~isteria enrichment broth base (UVM Formulation) (Oxoid; Code: CM863)
500 ml basal medium was prepared, sterilisedby_ autoclaving and cooled to 50°C. The
contents of one vial of Listeria Primary Selective Enrichment Supplement (UVM I) Code
SR 142 reconstituted with 2 ml of sterile distilled water was added aseptically. The media
was mixed well and distributed into sterile containers.
Listeria selective agar base (Oxford formulation, OXF) (Oxoid; Code: CM856)
500 ml basal medium was sterilised by autoclaving and cooled to 50°C. The contents of
one vial of Listeria Selective Supplement (Oxford Formulation) Code SR- 140 recon
stituted with 5 ml of ethanot/sterile distilled water (1: 1) was added aseptically. The media
was mixed well and poured into sterile petridishes.
Membrane lauryl sulphate agar (MLSA) The media was prepared by adding 1.5%
bacteriological grade agar- (Oxoid, Code: Ll 1) to Membrane Lauryl Sulphate broth
(Oxoid; Code: :MM615) prior to sterilisation.
Motility test medium (Difeo, Code: 0105-01-3)
MRVP medium (Oxoid; Code: CM43)
Nitrate broth:
Bacto Beef Extract (Oxoid; Code: 0126-01)
Bacto Peptone
Potasium nitrate (Sigma; Code: P 8394)
Distilled water
Adjust final pH to 7.0 ± 0.2 at 25°C
3-.0 g
5.0 g
1.0 g
1 L
Sheep blood agar (SBA, CAMP Test agar) (Oxoid; Code: CM8.54) The basal medium
was prepared and sterilised .according to the manufacturer's iristructions, then cooled to
50°C and 8 ml poured to 100 mm diameter ~tri dish. The media was allowed to solidify
and, while- still warm, overlayed with sheep blood as described below.
Overlay 5% Defibrinated Sheep Blood (Oxoid, Code: SB50) was aseptically added to
melted sheep blood agar base which had been cooled to 46°C. Media was mixed with
gentle rotation and 3 or 4 ml poured on top of the base layer (warm). Plates were tilted to
spread the top layer evenly. A thin overlay was necessary to demonstrate haemolysis
produced by surface colonies.
Tryptone Soya Broth (TSB), (Oxoid, Code: CM 129)
233
Tryptone Soya Agar-Yeast Extract (TSA-YE) was prepared from TSB by the
addition of 0.6% yeast extract (Oxoid, Code: L21) and 1.5% bacteriological grade agar
(Oxoid, Code: Ll 1) prior to sterilisation.
Tryptone Soya Broth-Yeast Extract (TSB-YE) was prepared from TSB by the
addition of 0.6% yeast extract (Oxoid, Code: L21) prior to sterilisation. Media were
sterilised by autoclaving at 121°C x 15 min.
Tryptone water (Oxoid; Code: CM87) containing 0.1 % bacteriological peptone
(Oxoid; Code: 137) and 0.85% NaCl was used for serial dilution and for suspension of
food samples for homogenisation. It was sterilised by autoclaving at 121°C x 15 min.
Final pH 7.2 ± 0.2 at 25°C.
A.1.3 PCR REAGENTS, REAGENTS, AND PRIMERS
1.5 % Agarose gel (GibcoBRL; Code: 15510-027) 1.5 g agarose gel was dissolved in
100 ml of T AE buffer (see below), and heated until boiling so that the gel completely
dissolved. It was cooled to ea. 60°C before pouring onto a gel mould.
Chloroform: Isoamyl alcohol 24: 1 (Sigma; Code: C 0549)
DNA Molecular Weight Markers:
1. pUC19 DNA/Hpa II (Bresatec, Adelaide, Australia): The Hpa II digest of plasmid
pUC19 DNA produces low molecular weight DNA fragments ranging from 26 bp to 501
bp which were used as DNA molecular weight markers for the lower register.
2. SPP-1 (Bresatec, Adelaide, Australia): The double-stranded DNA isolated from bacte
riophage SPP-1 which was digested with Eco RI was used as a DNA molecular weight
marker. It produces 15 DNA fragments in different sizes range from 360 bp to 8,510 bp.
Ethidium Bromide (10 mg/ml) (Sigma; Code: E-1510) The gel staining solution
was freshly prepared by adding 15 µ1 of Ethidium bromide solution to 400 ml of T AE
buffer.
6x Gel Loading Buffer:
Bromphenol blue (Sigma; Code: B8026)
Sucrose (Sigma; Code: S 2395)
Distilled water
0.125 g
20.0 g
50 ml
234
Lyso'zyme (Sigma, Code: L-7001)
40 mg lysozyme was dissolved in 2 ml saline EDTA, shaken vigorously and dispensed to
1 ml aliquots which were kept at -l8°C until required.
Phenol: chloroform:isoamyl alcohol 25:24: 1 (Sigma; Code: P-3803)
Primers: The REP-PCR, ERIC-PCR, and BOX-PCR primers were synthesized by Life
Technologies Inc., Melbourne, Australia.
Proteinase K
ProteinaseK (amRESCO; Code: E634)
Tris-EDTA
Saline-EDT A
Sodium chloride
EDTA, disodium salt (amRESCO; Code: 0105)
Distilled water
Mixed and adjusted the pH to 8.0 with NaOH.
10.0 mg
1 ml ,-
8.75 g
37.2 g
1 L
Sodium dodecyl sulphate (SDS, 10%) (GibcoBRL; Code: 5525UB) 10 g of SDS
were dissolved in 100 ml distilled water, mixed well and the pH adjusted to 7.0 with
O.lMNaOH.
70.2% Sodium perchlorate (Sigma; Code: S-1401)
Solutions for Calf thymus DNA ca,libration
1. lOx TNE Buffer (Standard fluorometer assay solution)
Tris (hydroxymethyl) aminomethane (Sigma, Code: T-8524) 6.06 g
Potasium nitrate 1.0 g
Distilled water 500 ml
The pH was adjusted to 7.4 with cone. HCl. Buffer was filtered before use (0.45 µm)
and stored at 4°C for up to 3 months.
2. Calf thymus DNA- 1: 10 dilution for low range assay (lOOµg/ml)
100 µl calf thymus DNA standard
100 µl lOx TNE
800 µl distilled water
The DNA soulution was shaken to mix thoroughly and stored at 4°C for up to 3 months.
3. DNA-specific dye (Hoechst 33258): stock dye solution
H 33258 (Hoefer TKO 310) 1.000 mg/ml '
235
Distilled water was added to make 10.00 ml of stock solution which was stored at4°C for
up to 6 months in an amber bottle.
4. Dye solution A - for low. range DNA assay (10-500 ng/ml final cone.)
H 33258 stock solution
lOxTNE
Distilled filtered water
10 µl
10.0 ml
90.0 ml
Dye solution was freshly prepared on the day required and kept at room temperature.
Thermostable DNA Polymeras~ Reaction Buffer I (lOx) (Taq_ DNA poly
merase, Reaction buffer, and MgC12 Solution) (Advanced Biotechnologies; Code: AB-
0194} These PCR reagents consist of 3 separate vials:
1. 250 units Taq: The enzyme is extracted from Thermus species and prepared at a
concentration of 5 Units/µl. The enzyme has 5' to 3' polymerisation-dependent
exonuclease replacement activity but lacks a 3' to 5' exonuclease activity.
2. 1.25 ml of lOx Reaction buffer consisting of lOOmM Tris-HCl (pH 8.3 at 25°C),
500mMKCl.
3. l.25ml of MgC12
TAE buffer
Tris (hydroxymethyl) aminomethane (Sigma; Code: T 1378)
Glacial acetic acid (Sigma; Code: A6283)
0.5M EDT A (pH 8)
Distilled water to final volume
Tris-EDTA
Tris (hydroxymethyl) methylamine (UNILAB; Code: 563)
Disodium EDT A
Distilled water to final volume
48.4 g
11.42 ml
20 ml
900 ml
0.121 g
0.074 g
100 ml
Reagents were mixed and the pH adjusted to 8. ~ with NaOH. Tris-EDTA sloution was ,
kept refrigerated.
Milli-Q Water (Distilled filtered water)
The water used to dissolve bacterial DNA, and prepare some solutions was prepared by a
distilled filtered water machine model Milli-Q PLUS (MILLIPORE S.A., France).
236
A.1.4 SOURCES OF ORGANISMS
The cultures with ACM label were obtained from Australian Collection of Micro
organisms, University of Queensland, St. Lucia, Brisbane, Australia. The cultures with
ATCC label were obtained from Dr. C.D. Garland, Aquahealth, University of Tasmania,
Hobart, Tasmania.
Escherichia coli A TCC 25922
Listeria innocua ACM 3178
Listeria ivarwvii A CM 3179
Listeria monocytogenes ACM 98
Rhodococcus equi ACM 702
Staphylococcus aureus ATCC 25923
Streptococcus faecalis A TCC 19433
L. monocytogenes strain Scott A was obtained from Dr. F. Grau, CSIRO Division of
Food Processing, Brisbane, Queensland.
L. monocytogenes strain LS, isolated from commercially prepared cold smoked salmon
was also obtained from Dr. C.D. Garland.
A.1. s EQUIPMENT
Anaerobic Jars:
Polycarbonate anaerobic jars 3.5 L model 60627 (BBL) and model HPO 1 lA (Oxoid)
were used.
Balances
1. Mettler PJ 3600 DeltaRange®.± 0.01 g precision. Mettler Instrumente AG, Zurich,
·Switzerland.
2. MCI Analytic AC210P (Sartorius Australia Pty Ltd, PO Box 84 Chadstone, Vic 3148,
Aus). Precision± 0.0001 g.
Conductance Meter
Conduktometer, LF 191 WfW
DNA Fluorometer
The DNA fluorometer model TK0-100 (Hoefer Scientific Instruments, USA). ii.ex = 365
nm, ii.em = 460 nm.
237
DNA Thermocycler
A FTS-960 Fast Thermal Sequencer (Corbett Research, Australia) was used. The unit
cycles 96 well polycarbonate microplates, or 0.2 ml microtubes in _strips of eight, and
operates from 4°C to 96°C and incorporates an 'Active Thermoelectric Module' (Patent
Pending).
Ekman Grab
Similar to that depicted in Figure 10500:7 page 10-102 in APHA (1989).
Electronic Temperature Loggers :
Delphi loggers with a teflon freezer probe (MIRINZ, Hamilton, New Zealand). Quotefi
accuracy ± 0.25°C over the operating range (-20°C to +40°C).
Filter Housing
Diameter 47 mm.(Nalgene) and 90 mm (Schott Glaswerke, Duran-Screw Filters).
Gel Electrophoresis Apparatus
A horizontal gel electrophoresis apparatus (Horizon® 58, GibcoBRL, Life Technologies,
USA). Current range: 4-360 mA, Voltage Range: 200 VDC Max.
Incubators
A range of Qualtex incubators were used (Manufactured by Watson Victor Ltd., Aus).
Laminar Flow Cabinet
A laminar flow cabinet model CF43S (Gelman Sciences, Aus) and model DF-44 (Clemco
Contamminaton Control, Clemco Ultra-Violet Products Pty. Ltd., 71 Dickson Ave.,
Artarmon, N.S.W.) were used.
pH Metering
1. General: Microprocessor pH-temperature Meter (portable), pH 196 WTW. I
2. pH - measurement of cultures: Orion Model 250A (portable) with calomel sealed flat
tip probe (AEP433). Orion Research Inc., Boston, Mass., USA.
Pipettors
A range of fixed and variable volume pipettors were used throughout this study.
1. 'Tr~.nsferpette ', Germany: 100 µl, 1 ml
2. 'Pipetman': 1-20 µl, 1-100 µl, 1-200 µland 200-1000 µl. Gilson Medical Electronics
(France) S.A., B.P. 45-95400 Villiers-le-Bel, France.
3. 'Oxford Macro-set': 5-10 ml, 'Oxford Adjustable': 40-200 µl. Oxford Laboratories,
Inc., California. USA.
4. 'Eppendorf': 0.5-10 µland 10-100 µl.
5. Electronic Digital Pipette 'EDP-Plus Motorized Microliter Pipette' (Rainin Instrument
Co, Inc., Mack Road, Wobum, MA 0188-4026 USA).
\ 238
Dispensed volume of fixed volume pipettors was checked periodically by weighing of
water at room temperature, and was typically found to be within ±1 % of nominal volume.
Variable volume pipettors were calibrated, by weighing of water, before use.
Spectroplwtometer
Spectronic 20 (analogue display), Milton Roy Co., USA.
Stomacher
Colworth, Stomacher 400, Model BA6021, Single Phase, A.J. Seward, UAC House,
Blackfriars Road, London, SEl 9UG
Temperature Gradient Incubator
Model TN3; Advantec, Toyo Roshi International, California, USA.
Timer
An alarm clock-timer (Model 870A, Jadco, China) was used for all growth rate
experiments. At the commencement of inoculation, the timer was set to zero, and the real
time recorded in case of timer failure.
Triple~-Outlet Filter Manifold
The equipment (Nalgene) was connected with a 10 L liquid reservoir, water trap and 240
volt vacuum pump, Clements.
Chamber Vacuum Paddng Machine
BUSCH type 100-132 (Boss 6380 Bad Homburg 6, West Germany), vacuum 0.5 .mbar,
motor oil type SAE 30, Timer: second (manual) or automatic.
Vortex Mixer
Model MT19 (Chiltern Scientific). Variable speed control from 300 to 2,200 rpm.
Water Activity Meter
Aqualab CX2 (Decagon Devices, Inc. PO Box 835, P~llman, Washington 99163, USA).
Quoted acuracy ± 0.003. The instrument was checked on each occasion before use by
distilled water and satuated NaCl.
Water Baths
1. A range of Lauda waterbaths (Lauda DR.R. Wobser GMBH & Co. K.G., Lauda
Konighofen, West Germany) was used; Models RC20, RM20 (R denotes refrigerated,
the number indicates the bath capacity in litres).
2. Shaking waterbath Model SWB20 (Ratek instruments, 1/3 Wadhurst Drive Boronia,
Aus 3155).
A. l. 6 CONSUMABLES
Anaerobic Gas Generating Kit: Anaerogen (Oxoid Code: AN 035A).
Centrifuge Tubes
239
1. Conical Tubes: 15 ml and 50 ml sterile/Gamma irradiated graduated conical tube
(Opticul™ Polypropylene) with cap (Falcon, Becton Dickson Labware, 2 Bridgewater
Lane, Lincoln Park, New Jersey USA).
2. Microcentrifuge tubes: 0.5 and 1.5 ml microcentrifuge tube with cap graduated
(Kartell) made ih Italy.
Filtering
1. Gellulose acetate membrane filter pore size 0.45 µm, diameter47 mm (GN-6, Gelman
Sciences) and diameter 90 mm (Supor®-450, GelmanSciences).
2. Cellulose ester prefilter, diameter 90 mm (A W06 90 25, Millipore).
3. Filter paper, Whatman No. 3.
4. Sterile filter unit pore size 0.45 µm hydrophilic cellulose acetate membrane, diameter
25 mm, acrylic Housing (PRO-X™, Lida Manufacturing Corp.).
Gauze Pads
Conforming cotton gauze bandage width3 and 10 cm were used.
L-Tubes
L-shaped glass tube, 150 mm diameter, ~pacity approximately 25 ml. Topped with ,_
metal cap.
Petri Dishes
Sterile plastic Petri dishes 150x860 mm (LABSERV, Australia), and 150x560 mm
(Disposable Products, South Australia). / Plastic Bags
Stomacher bags 100x160 mm (Disposable Products, Australia), and 172x253 mm
factory's plastic bags used for packaging its retail product.
Sterile Well Plates
Linbro® Tissue Culture multi-well plate with cover, 24 flat bottom wells l.7xl.6 cm
approx., Well capacity: 3.5 ml approx. Area per well: 2.0 cm2 approx. (ICN
Biomedicals, Inc. 1263 South Chillicothe Road Aurora, Ohio 44202).
240
A.2 METHODS
A.2.1 CATALASE TEST
The cata.lase reagent was dropped onto a slide, then smeared with the bacterial culture.
Gas bubbles observed from the smear constitutes a positive catalase test. No gas bubbles
constitutes a negative test. AS. aureus culture was used as a positive-control test and
Pseudomonas aeruginosa was used as a negative-control test.
A. 2. 2 COLONY COUNTING METHODS
Three appropriate dilutions of samples w~re mutinely plated. For growth rate
determination experiments, numbers of organisms at each sampling time were predicted
on the basis of models developed in broth systems. From this prediction, the sample
dilution expected to yield 30-300 colonies on a 0.1 ml spread plate, and the tenfold higher
and tenfold lower dilutions w~re plated. Duplicate spread plates of each dilution were
usually prepared.
The colonies on all plates were counted and recorded, except iri the case of very high
numbers, for which an estimate based on the number of colonies within a subsection of
the plate was used. All plates having between 30 and 300 colonies were included in the
calculation of the number of organisms pr~sent in the sample, using the method of
Farmiloe et al. (1954).
A.2.3 CORRECTION FUNCTION FOR NON-LINEARITY OF ABSORBANCE (CELL
YIELD) DATA
The deviation of the OD response from the cell density is reported to be non-linear when
the OD value is above 0.3 (Koch, 1981). The observed absorbance for the "apparent"
cell yield at the maximum growth of L. monocytogenes in an enriched nutrient used in
Chapter 4 may be well above the upper sensitivity limit of the instrument (McMeekin et
al., 1993). Therefore, the "apparent" yield was corrected for the non-linearity of the OD
concentration relationship, using the correction function derived by Dalgaard et al.
(1994). The equation can be written as:
where ABS is the corrected absorbance, ABSobs is the observed absorbance, k1 and k2 are
the consta.nt values of 0.51 an~ 2.49 respectively.
241
A. 2. 4 INDOLE TEST
0.2 ml of Kovacs reagent was added to inoculated Tryptone Water after incubation at
35°C for 24-48 hr. The culture was shaken, then allowed to stand for 10 min. A dark
red colour in the amyl alcohol surf ace layer constitutes a positive indole, test; no change in
the original colour of the reagent constitutes a negative test.
A.2.5 MAINTENANCE OF CULTURES AT ·80°C {LONG TERM STORAGE)
All cultures were maintained in triplicate. One was used for routine recovery, while the
others were held in reserve.
Plastic beads (3 mm) were washed in tap water with detergent, followed by dilute HCI to
neutralise alkalinity. The beads were washed several times in tap water, then in distilled
water and dried. Approximate 20 beads were placed in each small bijoux, which was
then autoclaved at 121°C x 15 min.
A single colony from each strain of bacteria was grown overnight on appropriate agar
plates at the optimum temperature for each bacterial strain. Approximately 1 ml of sterile
(autoclaved: 121°C x 15 min) 15% (v/v) glycerol in NB was dispensed onto the plate.
Using a wire loop the growth was emulsified to make a thick suspension. The bacterial
suspension was aseptically transferred into the prepared vials. The suspension was
aspirated several times to ensure the air bubbles inside the bead were displaced. Excess
suspension was removed to prevent the beads sticking together when frozen. Vials were
placed on their sides (to facilitate removal of beads when frozen) and stored overnight at -
20°C before being transferred to-80°C.
The recovery was done by removing a bead and rubbing over the surface of a suitable
solid medium and also selective medium (to check the purity and identity), which were
then incubated appropriately.
A. 2. 6 MAINTENANCE OF CULTURES AT 4 ° C (SHORT TERM STORAGE)
The cultures used routinely as the reference cultures in CAMP test and other reagents tests
were maintained aerobically on BHIA slopes at 4°C and periodically subcultured. Purity
and identity of the culture was checked at subculture by gram reaction and colony
morphology on selective media.
'--242
A. 2. 7 METHYL RED TEST
To 5 ml of MRVP medium culture (after incubation at 35°C for not less than 48 hr) was
added a few drops of methyl red solution and the colour on the surface of the medium
read immediately. A positive reaction is indicated by a distinct red colour, showing the
presence of acid. A negative reaction is indicated by a yellow colour.
A. 2. 8 NITRATE TEST
A few drops of each nitrate reagent were added to inoculated nitrate broth after incubation
at 35°C for 24 hr. A distinct red or pink colour indicates the presence of nitrite reduced ' I
from original nitrate. The test was controlled by comparing with an uninoculated tube of
the medium which had been kept under the same conditions as the inoculated tubes. The
evolution of gas in nitrate meduim containing no sugar or fermentable substance is a
definite indication of reduction to free nitrogen.
A.2.9 OXIDASE TEST
A filter paper was soaked with a few drops of the freshly prepared reagent. A bacterial
colony was picked and streaked on the soaked filter paper. A distinct purple colour on the
streak line constitutes a positive test. No change in colour constitutes a negative test.
Note that the reagent oxidizes rapidly which makes the colour change from transparent to
purple, leading to possible false ositive results.
A. 2.10 PREPARATION OF CHLORINATED WATERS AMPLE BOTTLES
Sample bottles used for collecting chlorinated water and ice were added with sodium
thiosulphate (10% w/v) at a rate of 0.4 ml per 500 ml expected sample volume. The
bottles were then autoclaved at 121°C x 15 min.
A.2.11 QUANTITATION o.F BACTERIAL DNA
The DNA fluorometer, TK0-100, was calibrated with the Calf thymus DNA standard
before use.:
1. Two ml of dye solution A (see section A.1.3) was added into the glass cuvette and
used as a blank solution (set the instrument to zero).
2. 2 µl of Calf thymus DNA (see section A.1.3) was added and the solution mixed
(without introducing bubbles into the solution). The scale was set to 100%.
243
3. Steps 1 to 2 were repeated at least once to verify that the results were reproducible.
The cuvette was rinsed with distilled filtered water and drained between each
measurement.
The bacterial DNA concentration was measured by following the above steps but in ·step
2, 2 µl of bacterial DNA solution was used instead. The DNA concentration was read
directly as ng/µl.
A.2.12 RELATIONSHIP BETWEEN ABSORBANCE AND PERCENT TRANSMITTANCE
Transmittance and absorbance are defined:
absorbance = log10 Oincident/ltransmitted)
transmittance = log10 Otransmitted/lincidenJ
therefore: absorbance = log10 (I/transmittance)
= -log10 (transmittance)
by adding and subtracting log10 100
= (log10 100-log10 lOOk log10 (transmittance)
and rearranging and evaluating log10 100
2- {log10 100 + log10 (transmittance)}
= 2- log10 (100 x transmittance)
2- log10 (percent transmittance)
= 2- log10 (%T)
A.2.13 VOGES-PROSKAUER TEST
To 5 ml of MRVP medium culture (after incubation at 35°C for 24 hr) was added 0.6 ml
of reagent A and 0.2 ml of reagent B. The culture was shaken well, allowed to s~nd
exposed to the air, and observed at intervals of 2, 12, and 24 hr. A positive test was
indicated by the development of an eosin pink colour.
244
B MULTILOCUS ENZYME ELECTROPHORESIS
B.1 MATERIALS AND METHODS
The multilocus enzyme electrophoresis tests in this section were performed at The Food
Safety Solutions, Sydney, NSW. All the materials and equipment used were provided by
P. Sutherland, The Food Safety Solutions.
B.1.1 SAMPLE PREPARATION
100 ml of BHI was inoculated with L. monocytogenes and incubated at37°C on a shaker
for 24 hrs. Cells were harvested by spinning at 2,500 rpm for 15 mins in a Clements
2000 bench centrifuge. The supernatant was discarded and the pellet was resuspended in
2.4 ml of Breaking buff er, pH 6.8, and transferred into a 5 ml screw cap polyethylene
tube in readiness for sonication.
Breaking Buffer pH 6.8
Tris (Sigma 7-9)
Disodium EDT A (Boehringer:808 270)
NADP (Sigma:N0505)
Distilled Water
Adjusted to pH 6.8. Kept refrigerated (4°C).
120 mg
37 mg
37 mg
100 ml
Cells were lysed using a sonicator with microtip (Branson Sonifer 450, Branson Sonic
Power Comp~ny, USA) operating at an output of 2.5 and a 90% duty cycle for a total of
4 mins, made up of periods 'of 60 seconds. The sample was chilled well on ice between
bursts to reduce any possible loss of enzyme activity.
1.5 ml of the resulting lysate was transferred into a LS ml microcentrifuge tube and spun
at 9,000 g (10,000 rpm) for 5 min using a Centra M-2 microcentrifuge. This process
removed whole cells and cell wall fractions that could interfere with electrophoresis. The
clarified cell lysate (supernatant) fraction was kept in a microcentrifuge tube and 60 µl
aliquots (at least 3) were also distributed into separate microcentrifuge tubes to avoid
repeated thawing and refreezing of the original sample in each electrophoresis run.
Lysates were stored in a freezer (--20°C) for up to a month (short-term stprage) or below
-50°C for long-term storage.
245
B.1.2 STARCH GELS PREPARATION
Starch gels were prepared from commercially available potato starch (Sigma, USA).
30.8 or 57 g of starch was weighed and suspended in the volume of 270 ml or 500 ml
(11.4% starch gel solution) of appropriate buffer for small or large gel plate, respectively.
The starch suspension was heated until dissolved, and then degassed with suction for
approximately 30 sec, until there were no bubbles visible in the solution. The solution
was gently swirled until thetemperature was reduced to 70°C, and then poured into a gel
tray with a continuous action.
The gel was left at room temperature for 5 min and a perspex plate was then placed on top
of the gel, taking care not to trap any air bubbles. The covered gel was left at room
temperature for at least an hour before placing in a refrigerator. Gels were not stored for
longer than 24 hours.
Gel Buffer Preparation
1. Tris-citrate pH 8 (TC 8 ): Tris (Sigma 7-9) 83.20 g and Citric acid monohydrate
(BDH: 10081) 33.09 g were dissolved in 1 L of distilled water, and the pH was adjusted
to 8.0 using HCl (cone.). The buffer was stored at 0-5°C and used neat for electrode
buffer or diluted 1:29 with distilled water for gels.
2. Tris-maleate pH 8.2 (TM 8.2): Tris (Sigma 7-9) 12.10 g, Maleic acid (Sigma:
M9138) 11.60 g, Disodium EDT A 3.72 g, and MgCl2.6H20 2.03 g were dissolved in 1
L of distilled water, and the pH adjusted to 8.2 using NaOH (approx. 7 g). The buff er
was stored at 0-5°C, and used neat for electrode buffer or diluted 1:9 with distilled water
for gels.
B.1.3 ELECTROPHORESIS
B.1.3.1 Sampleapplication
Sample lysates were removed from the freezer and kept on ice. The sample solution was
soaked with a sample insert (4x8 mm of Whatman No.3 filter paper), and allowed to
thaw on the bench while preparing gels.
The excess edges were removed from the gel tray and a cut made across the gel about 3
cm from and parallel to the shorter end. Excess liquid was blotted from inserts and lined
up along the exposed cut using a template. At least 1 mm was left between samples. The
forceps used were rinsed in deionised water and wiped dry between successive uses.
Bromophenol Blue was used as a migration marker in each electrophoretic run. In
246
addition, to ensure good contact between cut surfaces and inserts, a spacer was placed at
the end of the gel so that there were no gaps in the cut.
B .1. 3. 2 Electrophoresis
A continuous buffer system (i.e. the buffer in the gel and in the electrode were the same)
was used in the study. In each chamber, approximately 300 ml of suitable buffer was
added. Each gel was run in a 4°C refrigerator at an initial current of 30 mA~ and a voltage
limit of 120 V. After electrophoresis, three or four horizontal slices per small or large gel
were cut in preparation for enzyme staining.
B.1. 4 ENZYME VISUALISATION
Enzyme assays were performed essentially m accordance with those described by
Selander et al. (1986). The substrates, coenzymes, reagents and mechanisms of the 12
different enzymes are given below: Alanine dehydrogenase (ALA), Catalase (CAT),
Fumarate hydratase (FUM), Glucose-6-phosphate dehydrogenase (G6PD), Glyceral
dehyde-3-phos-phate dehydrogenase (GP), Mannose phosphate isomerase (MPI),
Nucleoside phospho-rylase (NP), Peptidase-leucyl-leucyl-glycine (PLG), Phosphogluco
mutase (PGM), Phos-phoglucose isomerase (PGI), 6-Phosphogluconate dehydrogenase
(6PGD), and Super-oxide dismutase (SOD).
B.1.4.1 Solutions/or stains
1.) 0.2 M Tris-HCl pH 8 buffer: Tris (Sigma 7-9) 24.2 g in 1 L of distilled water.
Adjusted to pH 8.2 using HCl (cone.). Stored at 0-5°C.
2.) Phosphate buffer pH 7: NaHzP04.2H20; 0.62 g and NaHP04 ; 0.56 g in 1 L of
distilled water. Stored at 0-5°C.
3.) 1 % Phenazine methosulfate (PMS): Phenazine methosulfate (Sigma: P9625) 0.2 g in
20 ml of distilled water. Protected from light and kept refrigerated.
4.) 1 % Dimethylthiazol tetrazolium (MIT): Dimethylthiazol tetrazolium (Sigma: M2128)
0.2 g in 20 ml of distilled· water. (n.b. the solution did not dissolve completely).
Protected from light and kept refrigerated. .
5.) 2% MgC12: MgC12.6H20 (Sigma: M0250) 2 g in 100 ml of distilled water.
6.) 2% Agar: Bacteriological agar (Oxoid) 4 g in 200 ml 0.2 M Tris-HCl buffer. Boiled
to completely dissolve, then cooled to 60°C and kept in a waterbath at 60°C.
7.) 1 % a-Napthyl propionate: a-Napthyl propionate (Sigma: N0376) 0.2 g_in 20 ml of
distilled water.
247
B.1.4.2 Stainformulae
For all stains components were added in the order that they appear. All ingredients were
dissolved before adding PMS or other catalysts. Agar based stains were poured over gel
immediately after agar was added. For liquid stains, a gel slice was transferred to a
suitable tray and stain.solution poured over the gel. All stains were allowed to develop in
the dark at 37°C. Staining solutions will react to light.
NB: Rate= rate of travel of enzyme relative to bromophenol blue marker. Bromophenol
blue travels approximately 15 cm, at 140 volts after 6 hours in a 9 mm thick starch gel.
1.) Alanine Dehydrogenase (ALA)
Buffer: Rate: Staining:
TC8;pH8.0 54%
D,L-alanine NAD phosphate buff er MTT PMS Agar
35 mg 4 mg
12 ml 400 µl
60 µl 12 ml
2.) Catalase (CAT)
Buffer: Rate:
TM8.2; pH 8.2 70%
Staining : S,tage 1. Distilled water 100 ml 100 vol. H2 0 2 100 µl
Poured on gel and incubated at 25°C for 15 minutes. Stage 2. Poured off solution and rinsed gel well in tap water. Immersed in
fresh 50:50 mixtures of 2% potassium ferricyanide and 2% Iron
(III) chloride. Mixed gently. Removed stain as yellow zones
appeared on blue background (approx. 30 sees).
3.) Fumarate Hydratase (FUM)
Buffer: Rate: Staining:
TM 8.2; pH 8.2 44%
Fumaric acid (K salt) NAD Tris-HCl pH 8 buffer MTT PMS Malic dehydrogenase
Staining time : 1-2 hours
100 mg 20 mg 50 ml
1 ml 400 µl
50 units
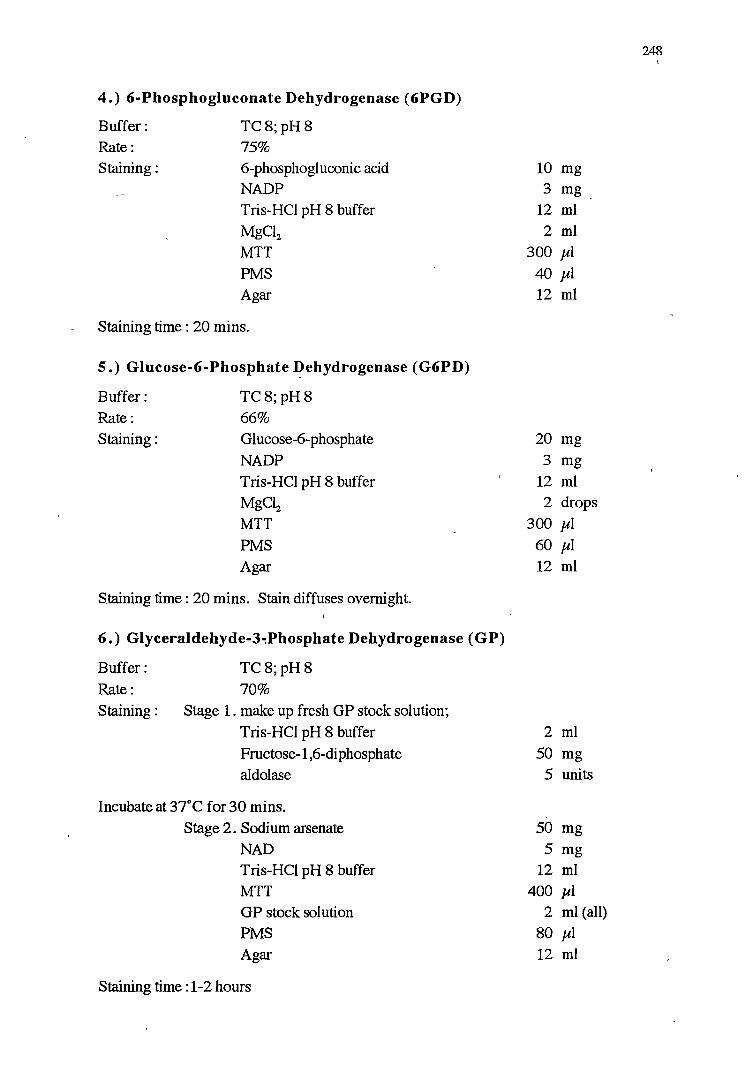
4.) 6-Phosphogluconate Dehydrogenase (6PGD)
Buffer: Rate: Staining:
TC8;pH8 75% 6-phosphogluconic acid NADP Tris-HCl pH 8 buffer
MgC12
MTT PMS Agar
Staining time : 20 mins.
5 .) Glucose-6-Phosphate Dehydrogenase (G6PD)
Buffer:
Rate: Staining:
TC8;pH8 66%
Glucose-6-phosphate
NADP Tris-HCl pH 8 buffer MgC12
MTT PMS Agar
Staining time : 20 mins. Stain diffuses overnight.
6.) Glyceraldehyde-3-:Phosphate Dehydrogenase (GP)
Buffer:
Rate:
TC8;pH8
70%
Staining : Stage 1. make up fresh GP stock solution;
Tris-HCI pH 8 buff er
Fructose-1,6-di phosphate aldolase
Incubate at 37°C for 30 mins.
Stage 2. Sodium arsenate
NAD Tris-HCl pH 8 buffer MTT GP stock solution PMS
Agar
Staining time : 1-2 hours
10 mg 3 mg
12 ml
2 ml 300 µl
40 µl 12 ml
20 mg
3 mg
12 ml 2 drops
300 µl 60 µI 12 ml
2 ml
50 mg 5 units
50 mg 5 mg
12 ml 400 µI
2 ml (all)
80 µl 12 ml
248 I
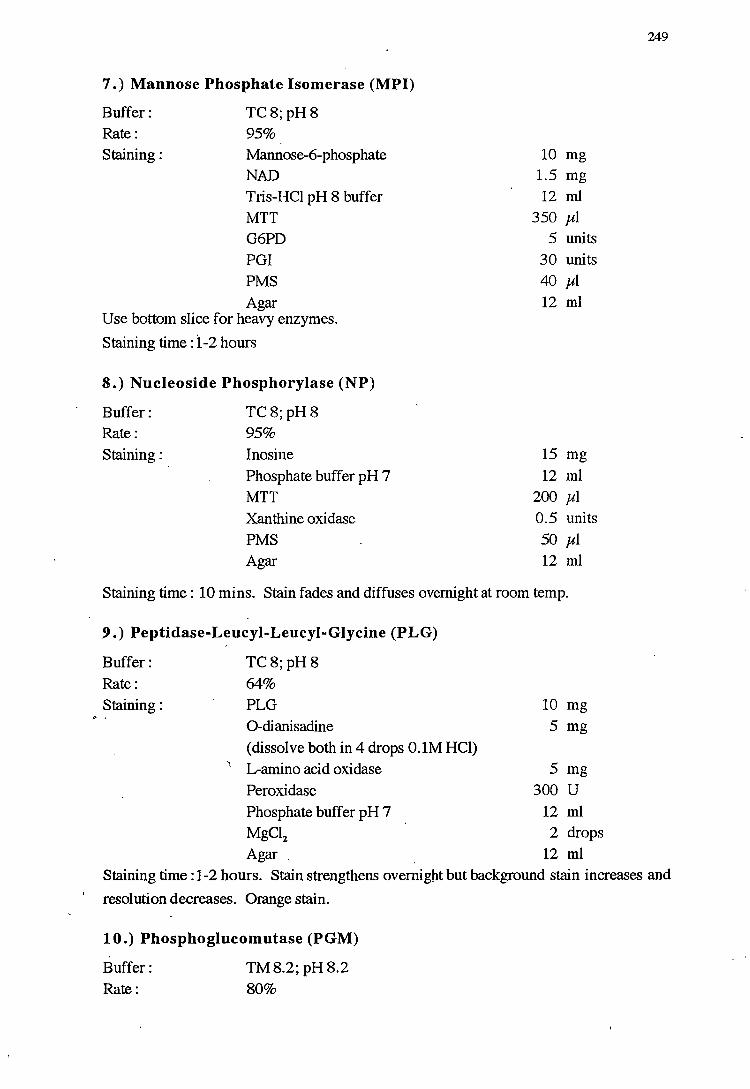
7.) Mannose Phosphate Isom erase (MPI)
Buffer: Rate: Staining:
TC8;pH8 95%
Mannose-6-phosphate NAD Tris-HCl pH 8 buffer MTT G6PD PGI PMS Agar
Use bottom slice for heavy enzymes.
Staining time: l-2 hours
8.) Nucleoside Phosphorylase (NP)
Buffer: Rate: Staining:
TC8;pH8 95%
Inosine Phosphate buff er pH 7 MTT Xanthine oxidase PMS Agar
10 mg 1.5 mg 12 ml
350 µ1 5 units
30 units 40 µl 12 ml
15 mg
12 ml 200 µl 0.5 units
50 µ1 12 ml
Staining time: 10 mins. Stain fades and diffuses overnight at room temp.
9.) Peptidase-Leucyl-Leucyl-Glycine (PLG)
Buffer: TC8;pH8 Rate: 64%
Staining: PLO 10 mg
0-dianisadine 5 mg
(dissolve both in 4 drops O.lM HCl)
' L-amino acid oxidase 5 mg
Peroxidase 300 u Phosphate buff er pH 7 12 ml MgCl2 2 drops
Agar , 12 ml
249
Staining time: 1-2 hours. Stain strengthens overnight but background stain increases and
resolution decreases. Orange stain.
10.) Phosphoglucomutase (PGM)
Buffer: Rate:
TM8.2;pH8.2 80%
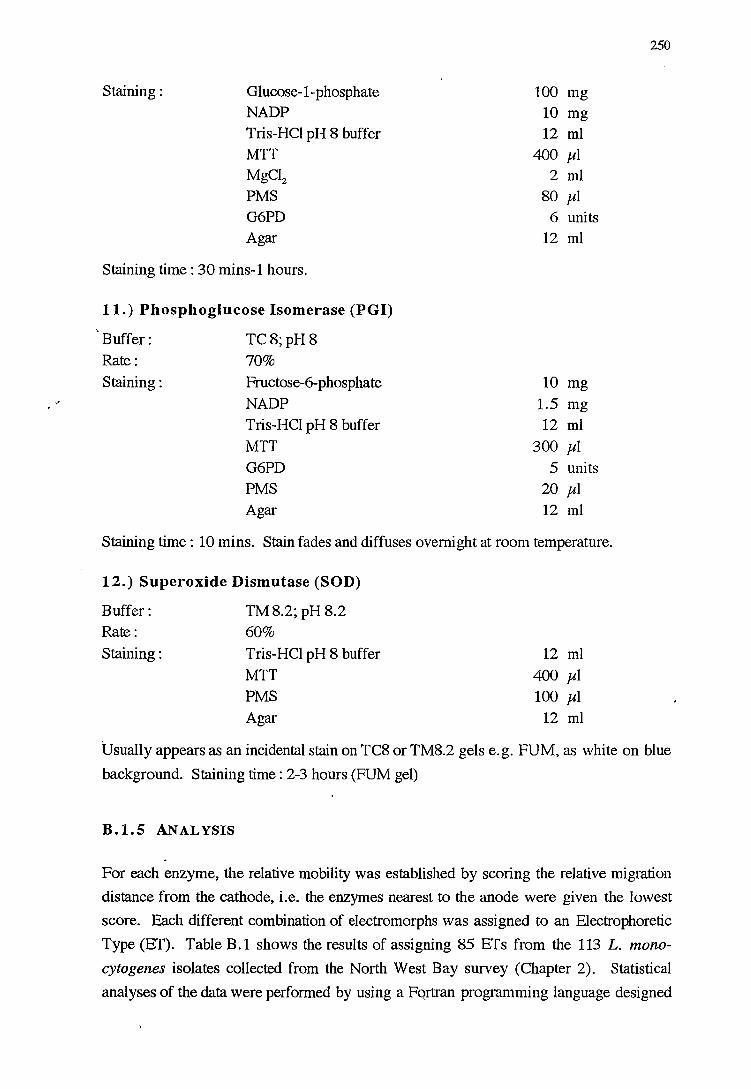
Staining: Gl ucose-1-phosphate NADP Tris-HCl pH 8 buffer MTT MgC12
PMS G6PD Agar
Staining time : 30 mins-1 hours.
11.) Phosphoglucose Isomerase (PGI)
Buffer: Rate: Staining:
TC8;pH8 70%
Fructose-6-phosphate NADP Tris-HCl pH 8 buffer MTT G6PD PMS Agar
100 mg 10 mg 12 ml
400 µl 2 ml
80 µl 6 units
12 ml
10 mg 1.5 mg 12 ml
300 µl 5 units
20 µl 12 ml
Staining time : 10 mins. Stain fades and diffuses overnight at room temperature.
12.) Superoxide Dismutase (SOD)
Buffer: Rate: Staining:
TM8.2; pH 8.2 60%
Tris-HCl pH 8 buffer MTT PMS Agar
12 ml 400 µl 100 µl
12 ml
250
'usually appears as an incidental stain on TC8 or TM8.2 gels e.g. FUM, as white on blue
background. Staining time: 2-3 hours (FUM gel)
B.1.5 ANALYSIS
For each enzyme, the relative mobility was established by scoring the relative migration
distance from the cathode, i.e. the enzymes nearest to the anode were given the lowest
score. Each different combination of electromorphs was assigned to an Electrophoretic
Type {ET). Table B.1 shows the results of assigning 85 ETs from the 113 L. mono
cytogenes isolates collected from the North West Bay survey (Chapter 2). Statistical
analyses of the data were performed by using a Fqrtran programming language designed
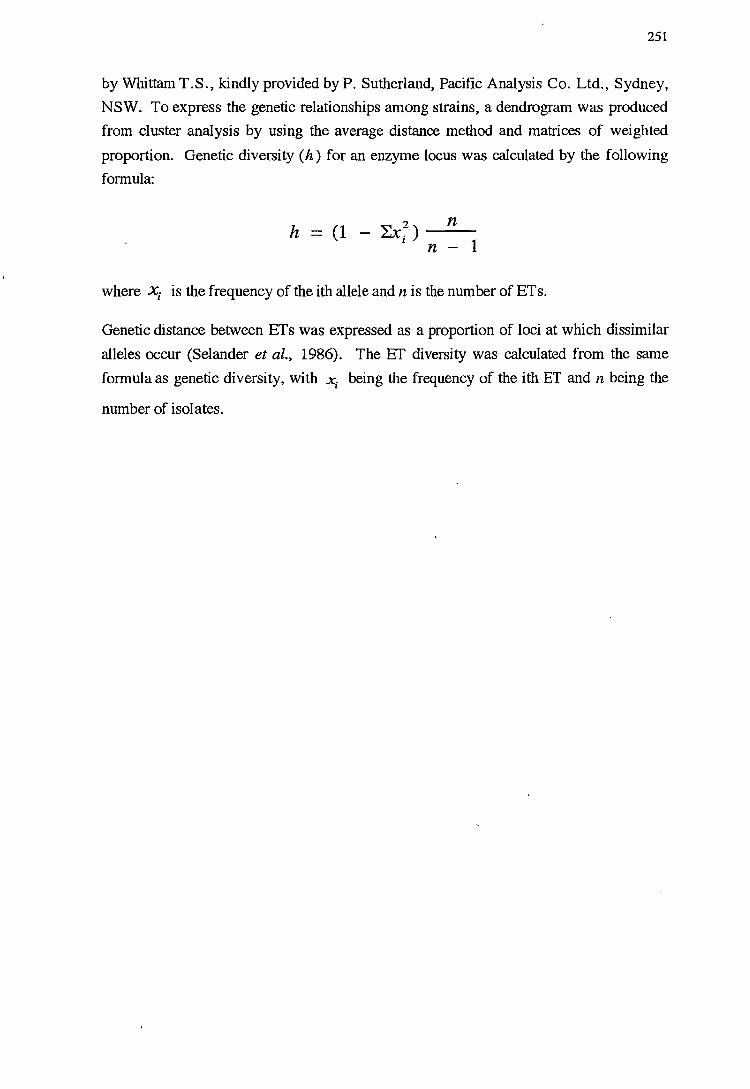
251
by Whittam T.S., kindly provided by P. Sutherland, Pacific Analysis Co. Ltd., Sydney,
NSW. To express the genetic relationships among strains, a dendrogram was produced
from cluster analysis by using the average distance method and matrices of weighted
proportion. Genetic diversity (h) for an enzyme locus was calculated by the following
formula:
h
where xi is the frequency of the ith allele and n is the number of ETs.
Genetic distance between ETs was expressed as a proportion of loci at which dissimilar
alleles occur (Selander et al., 1986). The Er diversity was calculated from the same
formula as genetic diversity, with xi being the frequency of the ith ET and n being the
number of isolates.
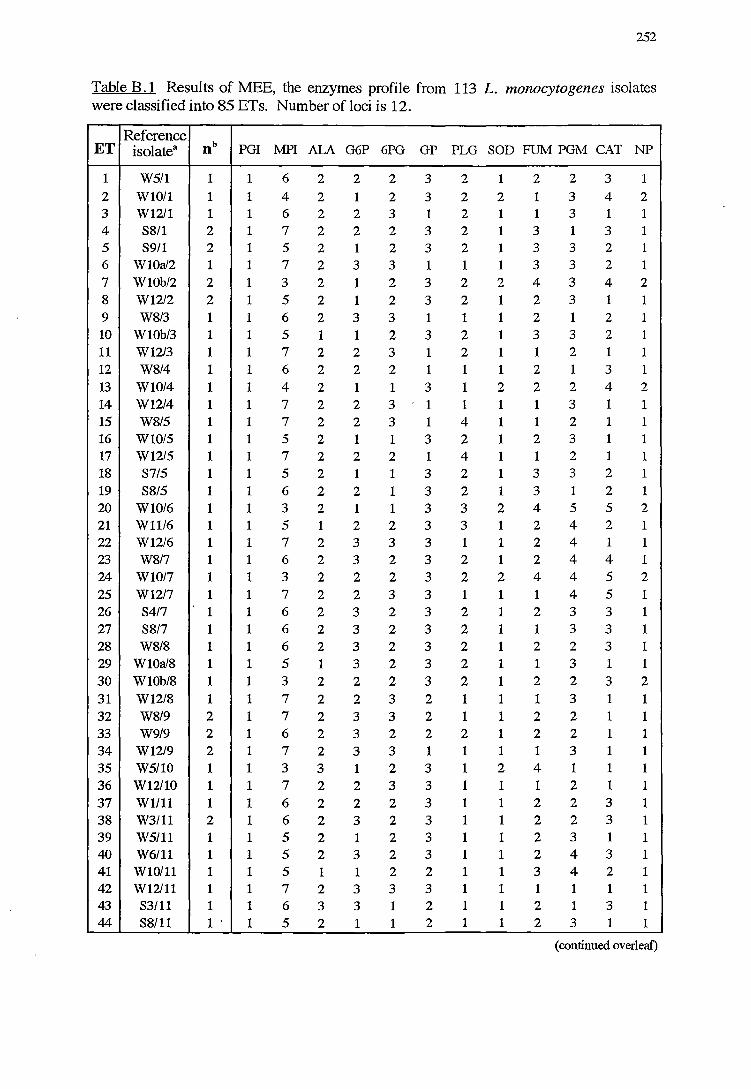
252
Table B .1 Results of MEE, the enzymes profile from 113 L. monocytogenes isolates were classified into 85 ETs. Number of loci is 12.
Reference ET isolate a nb PGI .MPI ALA G6P 6PG GP PLG SOD FUM PGM CAT NP
1 WS/1 1 1 6 2 2 2 3 2 1 2 2 3 1 2 Wl0/1 1 1 4 2 1 2 3 2 2 1 3 4 2 3 W12/1 1 1 6 2 2 3 1 2 1 1 3 1 1 4 S8/1 2 1 7 2 2 2 3 2 1 3 1 3 1 5 S9/l 2 1 5 2 1 2 3 2 1 3 3 2 1 6 WlOa/2 1 1 7 2 3 3 1 1 1 3 3 2 1 7 WlOb/2 2 1 3 2 1 2 3 2 2 4 3 4 2 8 W12/2 2 1 5 2 1 2 3 2 1 2 3 1 1 9 W8/3 1 1 6 2 3 3 1 1 1 2 1 2 1 10 WlOb/3 1 1 5 1 1 2 3 2 1 3 3 2 1 11 Wl2/3 1 1 7 2 2 3 1 2 1 1 2 1 1 12 W8/4 1 1 6 2 2 2 1 1 1 2 1 3 1 13 Wl0/4 1 1 4 2 1 1 3 1 2 2 2 4 2 14 W12/4 1 1 7 2 2 3 1 1 1 1 3 1 1 15 W8/5 1 1 7 2 2 3 1 4 1 1 2 1 1 16 Wl0/5 1 1 5 2 1 1 3 2 1 2 3 1 1 17 W12/5 1 1 7 2 2 2 1 4 1 1 2 1 1 18 S7/5 1 1 5 2 1 1 3 2 1 3 3 2 1 19 S8/5 1 1 6 2 2 1 3 2 1 3 1 2 1 20 Wl0/6 1 1 3 2 1 1 3 3 2 4 5 5 2 21 Wll/6 1 1 5 1 2 2 3 3 1 2 4 2 1 22 W12/6 1 1 7 2 3 3 3 1 1 2 4 1 1 23 W8/7 1 1 6 2 3 2 3 2 1 2 4 4 1 24 Wl0/7 1 1 3 2 2 2 3 2 2 4 4 5 2 25 W12/7 1 1 7 2 2 3 3 1 1 1 4 5 1 26 S4/7 1 1 6 2 3 2 3 2 1 2 3 3 1 27 S8/7 1 1 6 2 3 2 3 2 1 1 3 3 1 28 W8/8 1 1 6 2 3 2 3 2 1 2 2 3 1 29 WlOa/8 1 1 5 1 3 2 3 2 1 1 3 1 1 30 WlOb/8 1 1 3 2 2 2 3 2 1 2 2 3 2 31 W12/8 1 1 7 2 2 3 2 1 1 1 3 1 1 32 W8/9 2 1 7 2 3 3 2 1 1 2 2 1 1 33 W9/9 2 1 6 2 3 2 2 2 1 2 2 1 1 34 W12/9 2 1 7 2 3 3 1 1 1 1 3 1 1 35 WS/10 1 1 3 3 1 2 3 1 2 4 1 1 1 36 W12/10 1 1 7 2 2 3 3 1 1 1 2 1 1 37 Wl/11 1 1 6 2 2 2 3 1 1 2 2 3 1 38 W3/ll 2 1 6 2 3 2 3 1 1 2 2 3 1 39 WS/11 1 1 5 2 1 2 3 1 1 2 3 1 1 40 W6/ll 1 1 5 2 3 2 3 1 1 2 4 3 1 41 Wl0/11 1 1 5 1 1 2 2 1 1 3 4 2 1 42 Wl2/11 1 1 7 2 3 3 3 1 1 1 1 1 1 43 S3/11 1 1 6 3 3 1 2 1 1 2 1 3 1 44 S8/ll 1 , 1 5 2 1 1 2 1 1 2 3 1 1
(continued overleaf)
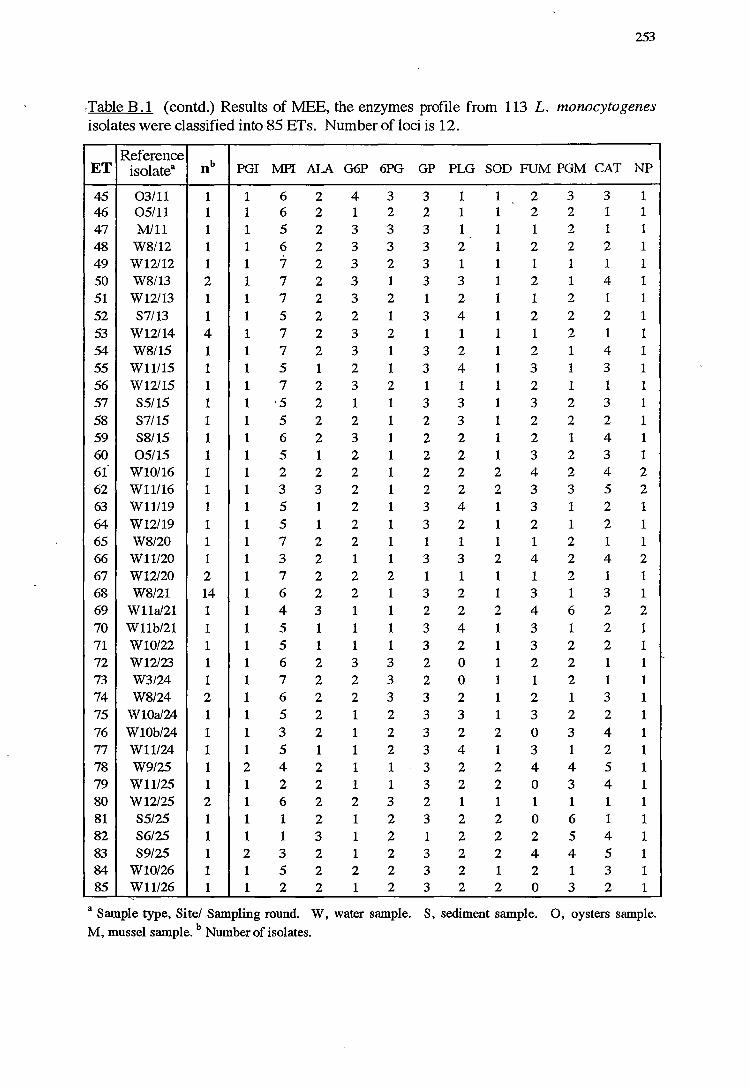
253
,Table B.1 (contd.) Results of MEE, the enzymes profile from 113 L. monocytogenes isolates were classified into 85 ETs. Number of loci is 12.
Reference nb ET isolatea PGI MPI ALA G6P 6PG GP PLG SOD FUM PGM CAT NP
45 03/11 1 1 6 2 4 3 3 1 1 2 3 3 1 46 05/11 1 1 6 2 1 2 2 1 1 2 2 1 1 47 Mill 1 1 5 2 3 3 3 1 1 1 2 1 1 48 W8/12 1 1 6 2 3 3 3 2 1 2 2 2 1 49 W12/12 1 1 7 2 3 2 3 1 1 1 1 1 1 50 W8/13 2 1 7 2 3 1 3 3 1 2 1 4 1 51 W12/13 1 1 7 2 3 2 1 2 1 1 2 1 1 52 S7/13 1 1 5 2 2 1 3 4 1 2 2 2 1 53 W12/14 4 1 7 2 3 2 1 1 1 1 2 1 1 54 W8/15 1 1 7 2 3 1 3 2 1 2 1 4 1 55 Wll/15 1 1 5 1 2 1 3 4 1 3 1 3 1 56 W12/15 1 1 7 2 3 2 1 1 1 2 1 1 1 57 S5/15 1 1 ·5 2 1 1 3 3 1 3 2 3 1 58 S7/15 1 1 5 2 2 1 2 3 1 2 2 2 1 59 S8/15 1 1 6 2 3 1 2 2 1 2 1 4 1 60 05/15 1 1 5 1 2 1 2 2 1 3 2 3 1 61 Wl0/16 1 1 2 2 2 1 2 2 2 4 2 4 2 62 Wll/16 1 1 3 3 2 1 2 2 2 3 3 5 2 63 Wll/19 1 1 5 1 2 1 3 4 1 3 1 2 1 64 W12/19 1 1 5 1 2 1 3 2 1 2 1 2 1 65 W8/20 1 1 7 2 2 1 1 1 1 1 2 1 1 66 Wll/20 1 1 3 2 1 1 3 3 2 4 2 4 2 67 W12/20 2 1 7 2 2 2 1 1 1 1 2 1 1 68 W8/21 14 1 6 2 2 1 3 2 1 3 1 3 1 69 Wlla/21 1 1 4 3 1 1 2 2 2 4 6 2 2 70 Wllb/21 1 1 5 1 1 1 3 4 1 3 1 2 1 71 Wl0/22 1 1 5 1 1 1 3 2 1 3 2 2 1 72 Wl2/23 1 1 6 2 3 3 2 0 1 2 2 1 1 73 W3/24 1 1 7 2 2 3 2 0 1 1 2 1 1 74 W8/24 2 1 6 2 2 3 3 2 1 2 1 3 1 75 WlOa/24 1 1 5 2 1 2 3 3 1 3 2 2 1 76 WlOb/24 1 1 3 2 1 2 3 2 2 0 3 4 1 77 Wll/24 1 1 5 1 1 2 3 4 1 3 1 2 1 78 W9/25 1 2 4 2 1 1 3 2 2 4 4 5 1 79 Wll/25 1 1 2 2 1 1 3 2 2 0 3 4 1 80 W12/25 2 1 6 2 2 3 2 1 1 1 1 1 1 81 S5!25 1 1 1 2 1 2 3 2 2 0 6 1 1 82 S6/25 1 1 1 3 1 2 1 2 2 2 5 4 1 83 S9/25 1 2 3 2 1 2 3 2 2 4 4 5 1 84 Wl0/26 1 1 5 2 2 2 3 2 1 2 1 3 1 85 Wll/26 1 1 2 2 1 2 3 2 2 0 3 2 1
~
a Sample type, Site/ Sampling round. W, water sample. S, sediment sample. 0, oysters sample.
M, mussel sample. b Number of isolates.
c
254
RESULTS OF THE OCCURRENCE OF LISTERIA SPP. IN NORTHWEST BAY
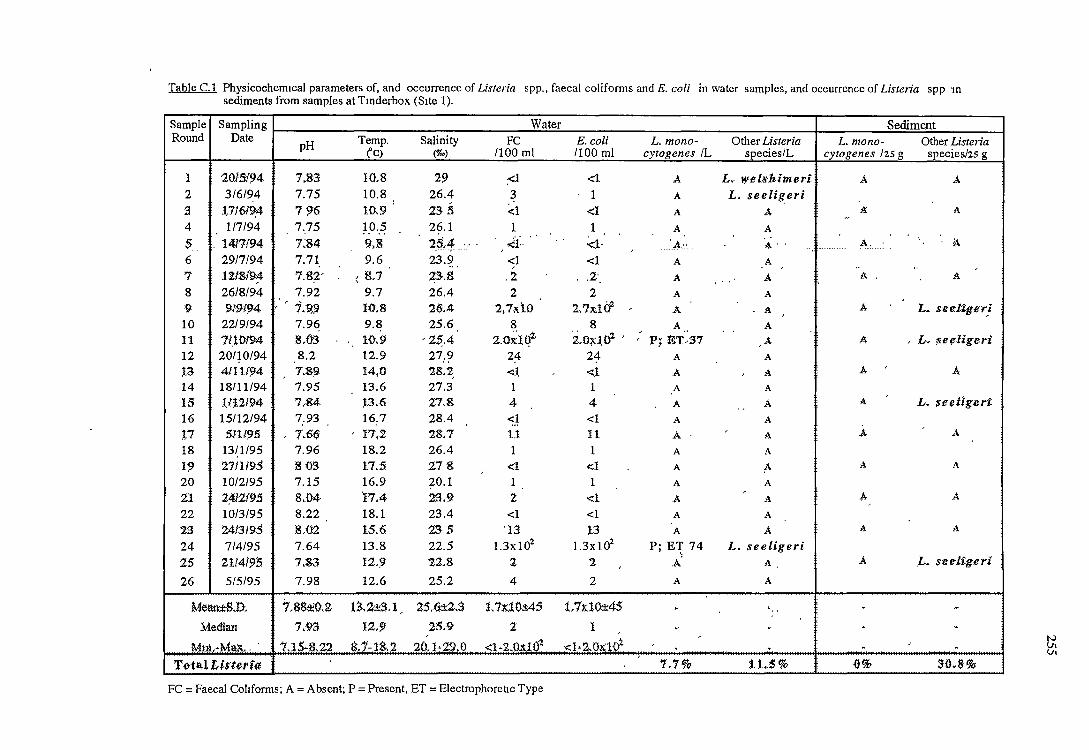
Table C.1 Physicochem1cal parameters of, and occurrence of Listeria spp., faecal coliforms and E. coli in water samples, and occurrence of Listeria spp rn sediments from samples at Tinderbox (Site 1).
Sample Sampling Water Sediment Round Date
pH Temp. Salinity FC E.coli L. mono- Other Listeria L. mono- Other Listeria ('C) (%0) /100 ml /100 ml cytogenes IL species/L cytogenes '25 g species/25 g
l 2015194 7,83 10.8 29 ;<1 <1 A L. welshimeri A A
2 316194 7.75 10.8 26.4 3 1 A L. seeli~eri : <1 :3 .l,.7161~4 796 10.9 23.5. <l A A Jr. A ,,
4 117/94 7.75 10.5 26.1 1 1 A A
$ . 1417!94 7:84 9,8 25,4 .... . «ii· " . . <:1. 'A-· . .
A .. ·A -------..- A .. " . . .
6 2917/94 7.71 9.6 23.9 <1 <1 A A " "
7 12/8194 7.8;2" ( 8-,7 ~3.8. .2 .. 2· A ... A A. A
8 26/8/94 7.92 9.7 26.4 2 2 A A
9 919194 " " 1.Q9 10,8 26.4 2+7Kl0 2..7x.102 " A . A A L. see:liger .. i
10 22/9/94 7.96 9.8 25.6 8 8 A A
2.o~iq1· 'io:;rdO.i " .. . .
11 71,10194 8,03 .. 10.9 "~.4 " J?; ET .. 37 A A .. L. ~eeligeri 12 20/10/94 8.2 12.9 27.9 24 24 A A
13 4111194 " 7.89 14,0 28.2 .. <1 <1 A " A A A 14 18111194 7.95 13.6 27.3 1 1 A A
15 lll2194 7,84 13.6 27,& 4 4 A A A L. ~eeltgeri .. 16 15112/94 7.93 16.7 28.4 <1 <1 A A
:t7 51119.5 " 7.66 " 17,2 28.7 11 11 A· A ./!. A
18 13/1/95 7.96 18.2 26.4 1 1 A A
19 '2.711195 803 17.5 278. <:1 <l A A A A
20 10/2/95 7.15 16.9 20.1 1 1 A A
21 2:4J2f9.5 8.04 '17.4 2:3,9 2 <1 A " A ./!. A
22 10/3/95 8.22 18.1 23.4 <1 <1 A A
2:3 2413195 8,02 15.6 23 .5 ·13 13 A A A A
24 714195 7.64 13.8 22.5 1.3xl02 1.3xl02 P; E~ 74 L. seeligeri
25 '211419:5 7.83 12,9 22.8 2 2 A A, A J.,. see:ligeri
26 515195 7.98 12.6 25.2 4 2 A A
Mean±SJ), 7 .. 88~0.2 1:3.2i:S.l, 25,<li:Z.S t 7:x.10±45 L7x1<li:45 ' . .. . -Median 7.9~ 12,9 25.9 2 l . . . ~
" <l·2..0X1if
,
Mni.·Max ... · "l.15·8-22 8,1-18.2 2.0 .. 1·29.0 <1·2.0x101 . . " . . T~tal Li¥tcrf4 1.1% 11+5% {)% '.HU~%
FC =Faecal Cohforms; A= Absent; P =Present, ET = Electrophorellc Type
N VI U1
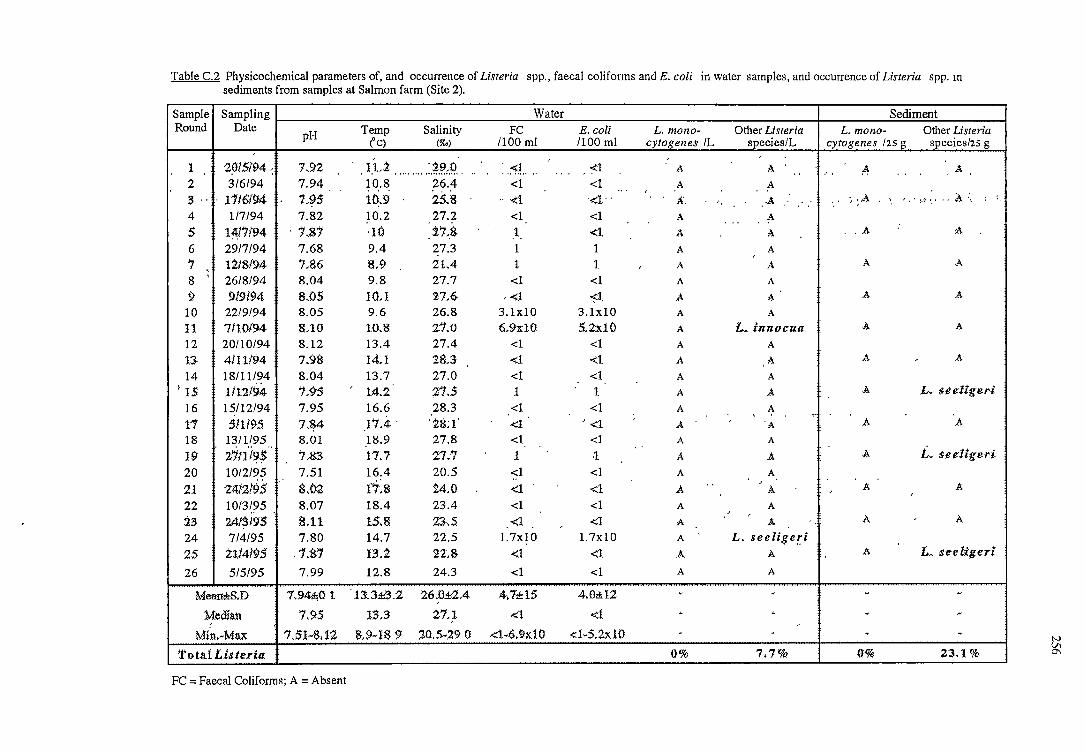
Table C.2 Physicochemical parameters of, and occurrence of Listeria spp., faecal coliforms and E. coli in water samples, and occurrence of Listeria spp. m sediments from samples at Salmon farm (Site 2).
Sample Sampling Water Sediment Round Date
pH Temp Salinity FC E.coli L. mono- Other Listeria L. mono- Other Listeria (C) (%0) /100 ml /100 ml cytogenes IL species/L cytogenes 12s g species/zs g
. l.l,i "
l 2015194" 7.92 .......... :.~.~~.9. . " . :.:"it" . . . . ~1 'A A . " . A A . . .. . .
2 3/6/94 7.94 10.8 26.4 <1 <1 A A .. 25.8 ". " ". :. ;·A . ". " .. , .. ,. ',' .. A .... .3 " . 1116194 1 .. ~s H\9 "<1 ·<I·. ..
A'. .. A .: .·: : :, . ...
4 117/94 7.82 10.2 27.2 <1 <1 A A ... 5 l~!il94 . 1.81 ·IO 27 •. S ,1, <1 A A .. A : A
6 2917194 7.68 9.4 27.3 1 1 A A .., li/8/94 7 .. 86 8,9 21.4 l 1 " A A A A
8 ;
26/8/94 8.04 9.8 27.7 <1 <1 A A
9 919194 8J)S 10,l 27.6 .. <l ~1 A A A A
10 22/9/94 8.05 9.6 26.8 3. lxlO 3.lxlO A A
11 7110194 lUO 10.8 21.0 6 .. 9xl0 5.2xl0 A L. innocrta A A
12 20/10/94 8.12 13.4 27.4 <1 <1 A A
13 4111194 7.98 14.l 28.3 <l <1 A A A " A
14 18/11/94 8.04 13.7 27.0 <1 <1 A A
I 15 111'2/94 1 .. 9S 14.2 21.5 l 1 A A A L. seeltgeri 16 15/12/94 7.95 16.6 28.3 <1 <1 A A
17.4. ; "
,.
11 SJ119$ 7J}4 '28;1' <l "<1 A . 'A A A
18 13/1195 8.01 18.9 27.8 <1 <1 A A " .. i. seeltgeri 19 21111':!$ 7 .. 83 17.7 2."'l}J l 1 A A A
20 10/2/95 7.51 16.4 20.5 <1 <1 A A " ri~s . . " A A 21 2412195 8.02 24.0 <l . <1 A A " "
22 10/3/95 8.07 18.4 23.4 <1 <1 A A
23 2.41$195 s .. 11 1.S.8 23 . .5 <1 <l " A A "
A A
24 7/4/95 7.80 14.7 22.5 l.7x10 l.7x10 A L. seeliger,i 2.S il/4195 .1:81 13.i 2Z.8 <l <1 A A A l.. see ligeri
26 515195 7.99 12.8 24.3 <1 <1 A A
Mean±S,D 7.94::!:i01 '13,3~:3.2 26.0±2.4 4,7±1:5 4.0±12 . . w -Median 7.~5 1:S,3 Z.7.1 <l <:1 . . . -
Min,-Max 7,5l-$;12 8.9-l$ 9 :io . .s-.29 o <lw6,9l\JO <l-:5,2.xW . . . -Total listeria. ()% 7.7% 0% 23.1%
FC =Faecal Coliforms; A =Absent
N Vt
°'
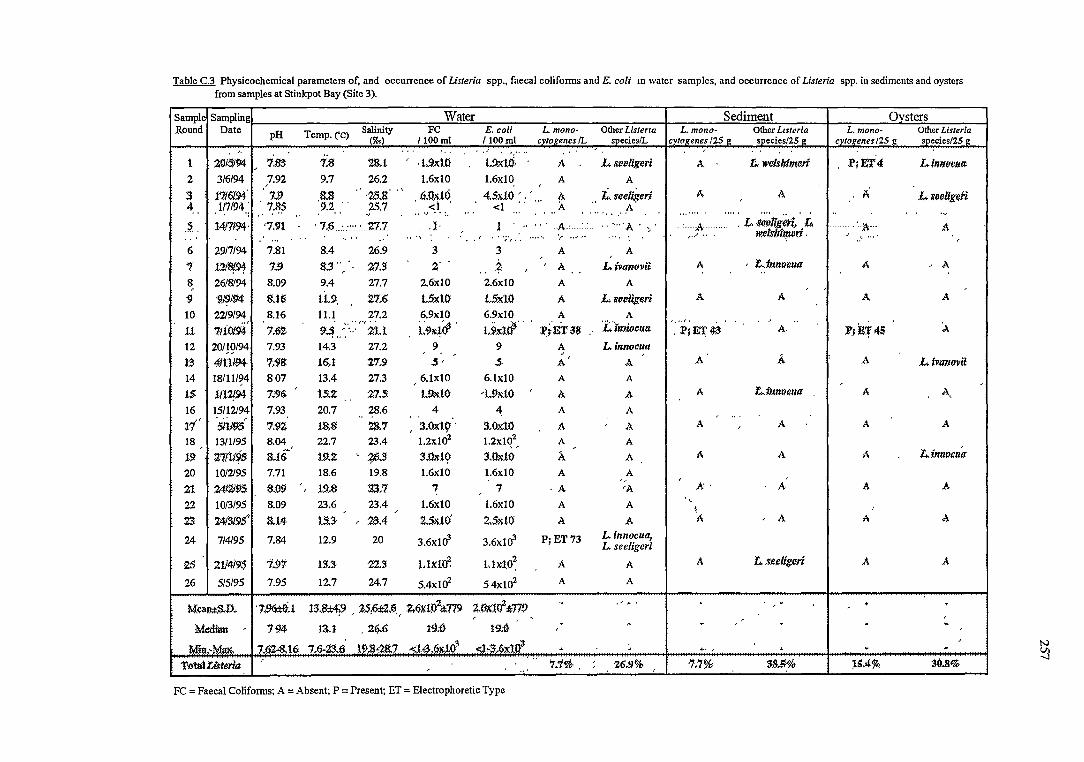
Table C.3 Physicochemical parameters of, and occurrence of Listeria spp., faecal coliforms and E.coli m water samples, and occurrence of Listeria spp. in sediments and oysters from samples at Stinkpot Bay (Site 3).
Sample Sampling Water Sediment Ovsters Round Date pH Temp.("c) Salinity FC E.coli L. mono- Other Listeria L. mono- Other Listeria L. mono- Other Listeria
(P'oc) / 100 ml / 100 ml cvtovenes /L snecies/L cvto!lenes 125 !? soecies/25 !? cvtounes 125 " soecies/25 " . ... .. . .. . . ·" . . . .. .. . . . .
1 20!5194 .. 7J53 7J5 'Z!U ·1'9x10 L9;1(( .. A L ifccligeri A L wel~mmeri . P;ET4 Limloc:M«: 2 3/6/94 7.92 9.7 26.2 I.6x10 1.6x10 A A
3 17161.94' . 7/) .as ..
·"25.& . ...
. 6.~~.1~ . 4,S:dO '. : " ... .. i, ~edhJeri A. A . p.: A L ifceligefi 4 117!94. 7.SS 9.1 .. Z5.7 <1 A. A .. . . ·: •' ... .. .. ... .. ... ··:. ... ... . ... . ... '•• .· . . ....... . .... . ... . . .. .. .. .. -~ 1417194· "7-91 . 7,()······ -ZJ.1 - . l · l .. __ . __ ._. A-'--- .. ··"·"A.,· 'A . L- :$-rJ:fllig~ L. ';A;--- A .. . ... . .. " .. .. .. ... : . . . ·" . ··;· .......... ........... •"• . . . ......... w.ets-11tqwri . .. ··" .... .. 6 2911194 7.81 8.4 26.9 3 3 A A
S.3 .... " 2· . ~ ..
.. L .. mnruma 7 12f8f-9t 7/) 27.3 .. A Livano'Vl'i A A .. .A .. .. . . .. 8 26/8/94 8.09 9.4 27.7 2.6x10 2.6xl0 A A
9- -9}~194 8-16 U .. 9. 17.6 t5x10 t5x10 A L ifcclig:t1ri A A A A
10 22/9/94 8.16 11.1 27.2 6.9x10 6.9xl0 A A
7110/94-" . ............
i:9ic~&. t9.x1cf · · ~i.E-T S8 .. l.."imiocua ........ .... . .. ..
A 1.1 7.~2- $>',~ ......... 21.l . P;~4.3 A. P; E'.f 45 12 201!9194 7.93 14.3 27.2 9 9 A L. innocua .. ;., .. ..
.A A u 4J11/94. 7,98: 16 .. t 27.') 5 .. S- A .A L inmO'Vii 14 18/11/~4 807 13.4 27.3 6.lxlO 6.lxlO A A
.15 U12(94 7.'96- .. ts.Z 27,S l.9.ic10 "l.9N10 .. A .A A L.. fu.nruma . A A, ..
16 15/12/94 7.93 20.7 28.6 4 ~ A A .... . .. .. . . ...
17 511195 7/J2- 18 .. S 28'7 .. 3 .. 0xtg' 3 .. 0xlO A .. A .A A A A
18 13/1195 8.04 22.7 23.4 l.2xla2 1.2xlq2, A A .. ..... ..
L.innruma 19- Z7(U~5 S.16- 19..Z ' ~6.3 3.0icW 3.0ic10 A A A A A
20 1012195 7.71 18.6 19.8 l.6xl0 l.6x10 A A .. ....
.A' . A 21 2412195 ~W9 .. W.8 23.7 7 7 ·A "A A A .. 22 1013195 8.09 23.6 23.4 1.6xl0 1.6xl0 A A '•
.. / I I
23 2413195"" S • .14 15.3- .. 23.4 2.Sdif 2.S11W A A A .. A A A
24 114195 7.84 12.9 20 3.6xla3 3.6xla3 P;ET73 L. innocua, L. seeligeri
::zs 211419$ 1.91 13.3- 22.3 J.1xm~ LM.O~ A A A Lseetigeri .A A
26 515195 7.95 12.7 24.7 5.4xla2 54xl02 A A
M<:an;:t;S,D. '7.96ili.1 13$;1;4~9 .. is,6~,6 ... :2.6xHf!~m ~.r,'j(_irhm!> . ....... .. . + .
.. .. Medhm 1-94 t:U . ~Q.6 1-9.-f} 19.-G
. ' . .. . . ~ ..
l9.8·2S-.7 <.1~.6x.103 ..:::l•3.6x10~ ~ ..
Mfu.·Max. 7.62..S.16 7.6-23.6 + +• .. + . ~
l'o'btl~tsrla . ..
7.1<lJ& . '26.9% 17.7% 38.547'& 15.4% Af)J1% ; ... ..
FC =Faecal Coliforms; A =Absent; P =Present; ET= Electrophoretic Type
~
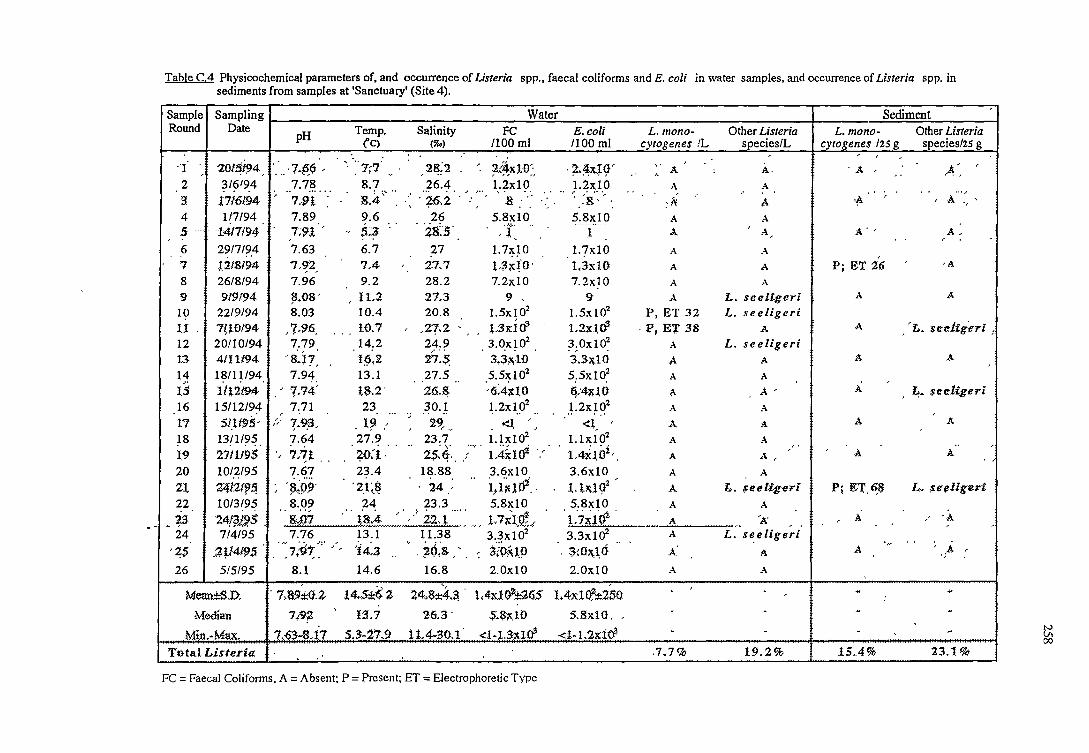
Table C.4 Physicochemical parameters of, and occurrence of Listeria spp., faecal coliforms and E. coli in water samples, and occurrence of Listeria spp. in sediments from samples at 'Sanctuary' (Site 4).
Sample I Sampling Water Sediment 1 Round Date H Temp. Salinity FC E.coli L. mono- Other Listeria L. mono- Other Listeria
p (C) (~ .. ) /100 ml /100 ml cytogenes !L _ species/L cytogenes 125 g species/25 g
·] ·.12014i94. 1--· ... 7.P,(;, .. 2 ~'~'~4 . J.7'§_ ... 3 J,7/6194 .. 7 -~t
7;7 .. .2~;2 8.7 26.4 &.4 ,.. ... < . 'i6 .. 2 ........
!<4;~J.D'.: l.2xl0
s 5.8x10 4 I 117/94 . . t.
.5 ... 1417194 .
2917/94 . .. l2/8/94 26/8/94 919194
22/9/94 7(J,0194 20/10/94 41Ilf94 18/11/94 llf2l94 15/12/94 51,lf9fl' , ....
7.89 1;n· ..
7.63
7 .. ~2. 7.96
?+08' 8.03
.. ? .. 96, 7.79
-gj7: 7.91.
.. 7,74'
7.71
?·~3 ..
9.6 26 . .. ~-~ · ·is'.s··
6.7 7,4 9.2 ll.2 10.4 10.7 14.2 1§,2 13.1 ts .. 2·
27 27 .. 7 28.2 27.3 20.8
.. 27.2 .. 24.9 2i~ 27.5 .. 26.~
23 30.1
..r 1.1Ji)O Uicfo· 7.2x10
9 .. I.5x102
.t .. 3xl-<f 3.0xla2 3.31!1.·lD 5.5xI02
'u:4:irlO l.2xl a2
. i~· ...... ·; . '2i.... , <l .... 7.64 27.9 23.7 l.lx102
7 .. ti . . . ~o:i .' · .. 25:~'.. _; .... · t,4boi · .. 7.67 23.4 18.88 3.6x10
6 7 8 9 10
u 12 13 14
u 16
17 18 i9 20 2]..
22 2:3 24
1311/95 271119$ 1012195
24121?~ 1013195
.. .. ~~9~· ·2.i;_$ · 24,: .. 1 .• 1-~uf.
'~5
26
24!1'JPS. 114195
.:Z~14f95
515195
8.09 24 23.3 5.8x10 .. .... .. . . .. . _, . .... . .. l 8.·.,J},7 t&.4 " 22, t lv 7d "(),. ' 7.76 13 ... l-- 11.38 ·-- ... 3.3x1'(ji"
· .... 1;iJ··(" .... .. 'l4:z .. ·· . i6:s .. .. . '. 3jo~w
8.1 14.6 16.8 2.0xlO
. ;2-~'IJ9' l.2x10 '. .:&·~ · .. 5.8x10
l I.7x10 1,3x10: 7.2x10
9 1.5xl02
1.2:itl& 3.0x10²
3.3)1.lG
5.5x10²
(i:4~l0
l.2x102
<l l.lxl02
1.4;l(}i ... 3.6xl0
l-hJ<!2
5.8x10 · i.-.7~1·oz · 3.3x10²
. ~~OJl:~O 2.0xlO
Mean±S,D. . 7,:89:t:(}.2 l4S:t:6 2 M+8:i:4.~ . L4x10i±1.65 l+4d~;1;2SO Median
Min.-Max.
T:otal Listeria
Ul·f,
7,-63-fU7
13.7
S.3-27,9
2-6.3.
H.4-30,1
s.~;i1.rn
<:1-1.Sxlcf
FC = Faecal Coliforms, A= Absent; P = Present; ET= Electrophoretic Type
5.SdO.
<l-t.2xHt
... A
A
.. {>;,
A
A
A
A
A
A
P, ET 32 . l?, El' 38
A
A A
A A
A
A
A
A
A
A
A
A.
A
A A
A,
A
A
A
L. see-ligeri L. seeligeri
A
L. seeligeri A
A
A
A
A
A
A ..
A
L. $e:e:ligeri A
'A' ·-·-·· A L's~eligeri
A. A
A A
.7.7% 19.2%
. A .. A .. ..
-~ A.,
A., A,
P; ET 26 •A
A A
A 'L. $ee:iigeri:
A A
A
A
A
P; E1'.~6
A
A .....
15.4%
~· sedigeri
A
A
L. ~eeligeri
_... 'A
, A ·;
23.1%
~ 00
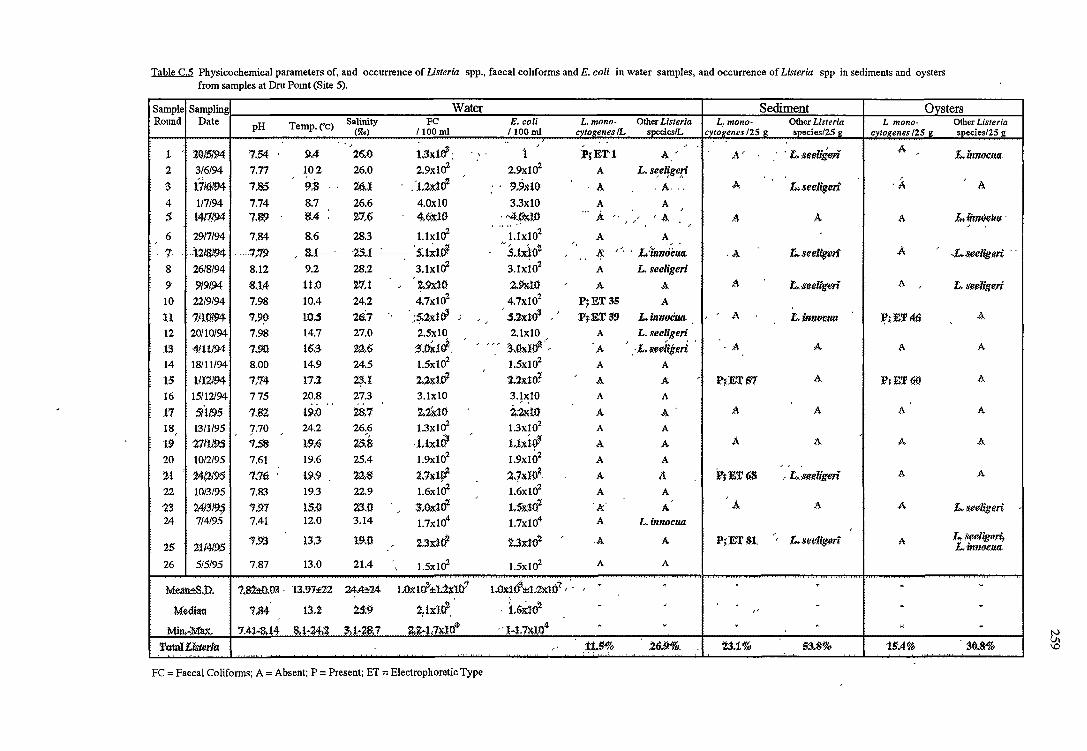
Table C.5 Physicochemical parameters of, and occurrence of Listeria spp., faecal cohforms and E. coli in water samples, and occurrence of Listeria spp in sediments and oysters from samples at Dru Pomt (Site 5).
Sample Sampling Water Sediment Ovsters Round Date pH Temp.('C) Salinity FC E. co/i L. mono· Other Listeria L, mono- Other Listeria L mono- Other Listeria
Ci"co) / lOOml / 100 ml cv/ol!enes /L soecies/L cytogenes 125 I? species/25 g cytogenes 125 g species/25 g . ... .. " . .
1.3x!Ef: " " . A, 1 " 2015194 7.54 . 9.4 26.0 . ". t P;ET·l A." A" .' · L. :Sttiif.illii L. iimocn.«.
2 3/6/94 7.77 102 26.0 2.9xla2 2.9xl02 A L- s~elf ge[i ,,
. .'.L2xl0~ " s 1716194 1,SS 9,S .. 26-..l : · '9.9dO ·A . A ... A L. seeli';f!ri "A A
4 117/94 7.74 8.7 26.6 4.0xlO 3.3xl0 A A
5 1417194 7.89 S.4 : 2-7,6 4,6:ld(} . "·"h5~.l0 ... A ... "A . A A L+mrwcu(l ·
"" " <\. .......
" " 6 29/7/94 7.84 8.6 28.3 ux1<>2 l.lxl02 A A . . . ~ "" i.ti't-0~ "· " ". · L·fn1:10~~«-7- - -'l2181!J4 - 7,79 -.. -8.1-- - : -- :2S .. 1- : S.1x10: 4 .A L+ -see1i$:eri -A -L:s.ceU11m · ·
3.1x1<>2 3.1xio2 ..
8 26/8/94 8.12 9.2 28.2 A L. seeligeri
9- 919194 K14 11--0 2-7,l " 2-.9xlG :2.9d0 " A A A L,:S-edfl!llii <\. " L. se-e'ligeri
10 22/9/94 7.98 10.4 24.2 4.7xla2 4.7xl02 P;ET 35 A
1l 7110194 7,9~ ltl.5 26.1 · ·S.2xlo'.! ; ""
.Uxl-0'.! , " P;ET39 L.in1:1ocn«. A L.intw~ua J!.; ET 46 A "•
12 20/10/94 7.98 14.7 27.0 2.5x10 2.lxlO A L. seeligeri
13 -4111194 7.90 1M 2-2..6 ~-0~1 ~.. .. .. .. ... .. ~.ai.ur ..... " : L • .s.eelij'11rl · ·A A. <\. A A
14 18/11194 8.00 14.9 24.5 1.5x10²
1.5xl02 A A
15 1112194 7,74 17.l 2~.I 2-.2x1& -Z.2-x:l-O~ " A A " P;ETS7 A P;ET® A
16 15/12/94 775 20.8 27.3 3.lxlO 3.lxlO A A
17 5{1195 7.82 19.-0 28,7 Z.2il(} i2d0 A A' A A <\. A
18 13/1/95 7.70 24.2 26.6 1.3xla2 1.3xl02 A A
" " " .... ·Uxltf Ux:t:# 19 2-1tll9-S 7.58 19.~ 25.S A A A A A A
20 10/2/95 7.61 19.6 25.4 1.9xla2 1.9x10² A A
2.7x1, :2.7id-O~. "" .
2-1 W,2195 7.76 . 19.9 . 2-2,S A A P;ET6S " f.,, :S-e-elig-eri <\. A
22 10/3/95 7.83 19.3 22.9 1.6xla2 1.6x1a2 A A
-23 241319~ 7,9.7 15.-0 23.0 s.0;i:1w .1.Sx:l-0-z '.!i:.' A A A. A L. ~eeli!J11ri "
24 7/4/95 7.41 12.0 3.14 l.7xl04 1.7xl04 A L. innocua
7.9-3 133 1~.o 2.3x:t& "2.3x:l-0"2 " -A A P;ET8-1 ",. L.$eet1g:eri A L+ ~eellgeri;. 25 2114195 , Linnocua-
26 515195 7.87 13.0 21.4 1.5xla2 1.5xl02 A A
" Mean±S.:t1 7,82:t{},{B. 13,97~22 i4,4±'24 L0x103-±l.i1'lil-1 LOx1&::1::1,2:d07 " '. "
. " . . . . Median '7,$4 13,2 25:9 2~ix1& . ~.&~t-0"2 - J J - . .
"'
Min.-:M'ax, 7.4MU4 S-l·24.2 3.1·2&1 Z.24JXHl_,.. . 'l•l.7li.l04 . . . ' H . Tolal £15wria. ,. .~~s~,, .U.9%. %3.1% S3,3% 1s.4% . 3().-8!!11>
FC =Faecal Coliforms; A= Absent; P = Present; ET = Electrophoretic Type
N u-. 'D
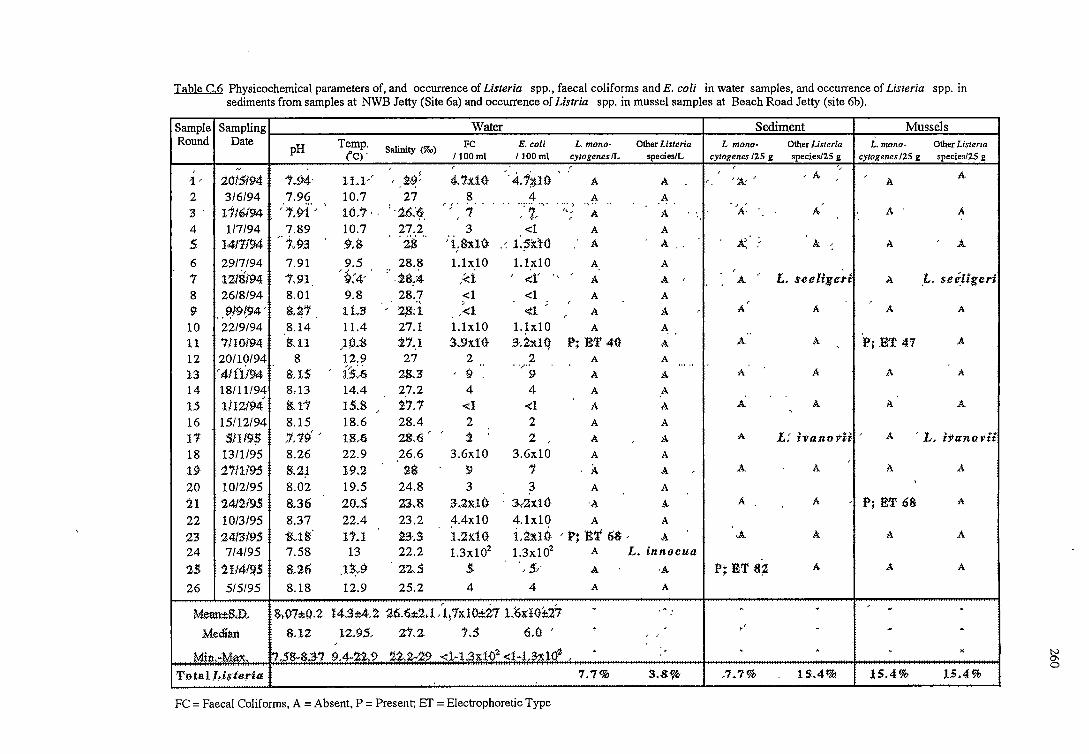
Table C.6 Physicochemical parameters of, and occurrence of Listeria spp., faecal coliforms and E. coli in water samples, and occurrence of Listeria spp. in sediments from samples at NWB Jetty (Site 6a) and occurrence of Listria spp. in mussel samples at Beach Road Jetty (site 6b).
Sample Sampling Water Sediment Mussels Round Date
pH Temp. FC E.coli L. mono- Other Listeria L mono- Other Listeria L. mono- Other Listeria (C). Salinity (9'00)
/ lOOml / 100 ml cytogenes /L species/L cytogenes 125 g species/25 g cytogenes 125 g species/25 g u " . " ....
"l" :iot:5f94 1.94· lLl"" ".2~; 4.1x1Q ","d~io'. A A " 'k" " A " A A
2 3/6/94 7.96 10.7 27 8 4 A A
1116194 . ;7,91°" .. 10 .. 7. . : . 26:~. ":. 1· .... "''1 .... ";:: '"A. .. . .. . .. p.'. " . " 3 . A ... A .A . A .. .. ..... ..
4 1/7/94 7.89 10.7 27.2 3 <1 A A
5 1411194 ... 7.9.3 9,S · ·2s ·· \8:UO: . '. l~;Sk.10 A A .. x_' .; A '. A A
6 2917/94 7.91 9.5 28.8 l.lxlO l. lxlO A A
1 1218;94 1.91 '9:4" . ·28~4 :<1 " <1" ., " " A A " A " l. s-teliger~ A .L. se~ligeri
8 26/8/94 8.01 9.8 28.7 <1 <1 A A . . . .. ' ; " " 9 .. ~19~94" 8,~7 1L3 " 2,8; 1 ... <l <1 A A " A A .A A "
10 22/9/94 8.14 11.4 27.1 1.lxlO 1.lxlO A A .. 11 7/IOf-94 $.11 .. HtS 21,) 3.9X1Q 3-.i:iaQ P; ET 41l A A A ~;ET 47 A
" 12 20/10/94 8 12.9 27 2 2 A A
"4/flf94 , i"S:6 ....... ... "
13 !US 2.$3 , 9. 9- A A A A .A A
14 18/11/94 8,13 14.4 27.2 4 4 A A
1.5 1112(94 iU1 IS.S .. i7,1 <I <I A A A A A A "
16 15/12/94 8.15 18.6 28.4 2 2 A A
11 Silf9$ 1.19"" lS .. 6 28.6" " i 2 " A A A L: hana:YU ' .A ' L. ifana vtt "
18 13/1/95 8.26 22.9 26.6 3.6x10 3.6x10 A A
19 2111195 8.2.~ 19:2 i8 9 1 ·A A " A A A A
20 10/2/95 8.02 19.5 24.8 3 3 A A '
21 24fil95 8.S6 20.5 23.g_ .3-.2xl0: · 3(2X10 ·A A A . A .. P; ET 68 A
22 10/3/95 8.37 22.4 23.2 4.4x10 4.lxlO A A
23 24/3195 '8.18' 17.l 2.3-.S I.2x1G i.2:x10 .. t>; 'E:T 68 .. A .A A A A
24 7/4/95 7.58 13 22.2 l.3x102 l.3x102 A L. innocua
25 2Il41~S 8.i6 .1~.9 2.2 . .S s · .. 5 .. · A ·A P~ nT 8;2 A .A A
26 515195 8.18 12.9 25.2 4 4 A A
Mean:t::SJ), $,07*0.2 l4,:3=4.2 1.6.~*2.1 .. "i~7id0d::i7 1.t~!Q-'.d7 . 'A '
, . " - . " Median 8.12 12.95 .. 21 .. 2. 7.S 6.0 , + , > - - -
" " "
Min .. -Max .. 7.5$-8.:3-7 9A.,2:2..9 n .. 2-29 <1-1.'.3x10-z-<1-1.3-d<f .. . , . ~ "
To ta l l.ti.$ Jeri.a. 7.7% 3.8-%- ,7.7% lS.4% ~S.4% ).S.4%
FC =Faecal Coliforms, A =Absent, P =Present; ET = Electrophoretic Type
N
°' 0
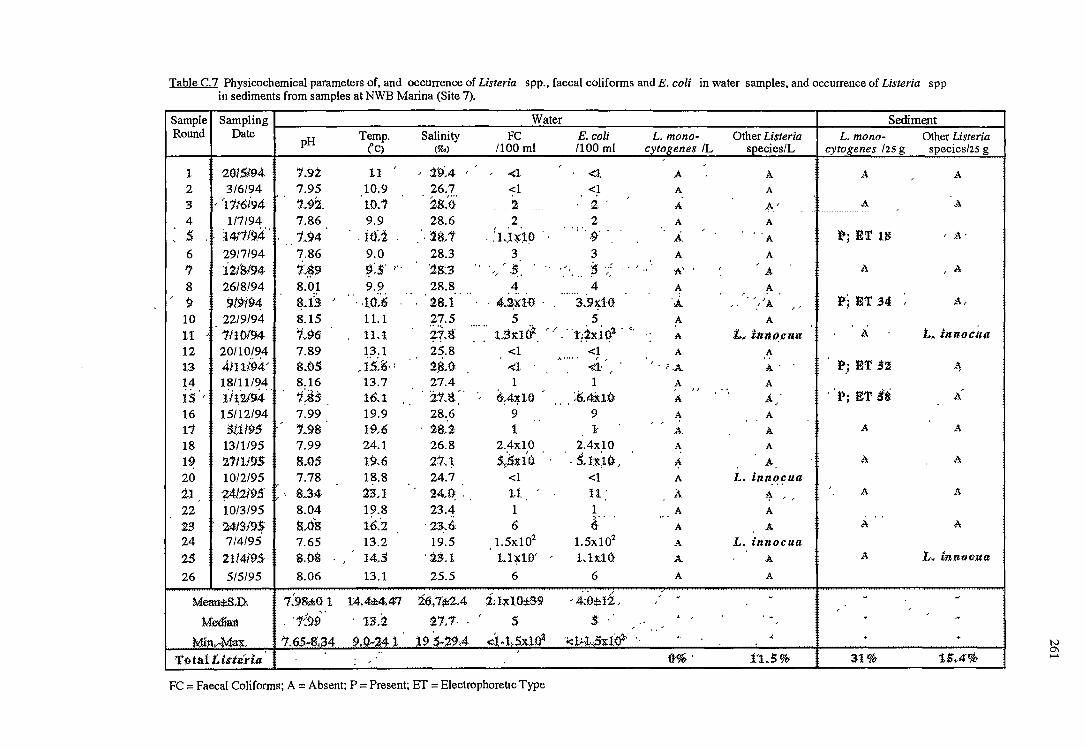
Table C.7 Physicochemical parameters of, and occurrence of Listeria spp., faecal coliforms and E. coli in water samples, and occurrence of Listeria spp in sediments from samples at NWB Marina (Site 7).
Sample I Sampling Water Sediment Round Date H Temp. Salinity FC E. coli L. mono- Other Listeria L. mono- Other Listeria
P (C) (P'oo) /100 ml /100 ml cytogenes IL species/L cytogenes lzs g species/25 g
1 2 3
201SJ94 3/6/94
.. "11J6i94 4 117/94 5 . . i 4/119.4' . 6 2917/94 7 iZJSl94 8 26/8/94 9 919l94 10 22/9/94
7.92 7.95
.. 1.9'.L
7.86 1.94 7.86
'~~9
11 ..
10.9 10.1 9.9
. itt2 9.0 ~:.s- , ..
8.01 9.9 ~.13 .. 1.0~·6
.. ~t9:4 26.7
. 2.s_"ci' 28.6
"~8,1 28.3 ·2s:·3 28.8 28,1 27.5
<l <1 2 2 ....
. .'L.I~H>
<1 <1 2. .
2 . ''".~·
3 3 .. · ...... ~" ........... ~ ·;; .... ..
4 4 · 4.:2;Xl-0 · ....... 3.'9;1-G
5 5
A
A
A
A
.A A
·A"
A
':A
11 .. 1110194 8.15 1.96 7.89 8.0S 8.16
11.1 11.l ~1-g ·: .. :· i.gx1(f. ·· /. · ·1j1ti~i · '· ..
A
A
12 13 14 is· ..
20/10/94 4tufo4 .. 18/11/94 i'i(21!14'. 15/12/94 SlH95 13/1/95 21JlJ!15
1~~B 16 11 18
l~ 20 21 22 2.3 24
10/2/95 ;412195 1 ....
7.99 7.98 7.99 $,OS 7.78 8.34 8.04 s.ds 7.65 8.08 8.06
2S 26
10/3/95 2413/9$ 7/4/95
Zl/4195 515195
Mean::!:,SJ) ..
Median
Mi:n.NMa'.11'. .. Total Li&teri.a
7:98::!::01
. ·1~9i/ 7,6.SNe~34
13.1 25.8 <1 <1 .. i5~'3·: 2 .. 8.0: <l <1_." 13.7 27.4 1 1 16.1 . 2.1Jl... ·.. 6~4:po ... :K4i10 19.9 28.6 9 9 19.6 · '.i!U 1 1 24.1 26.8 19.6 21.i 18.8 z:u 19.8 16:2 13.2 14,S
13.1
1:4,4±4,47
1:3.2
9,QN241
24.7 24,~.
23.4 . 23;.6: 19.5
. 23,1
25.5
2(l.7:;j::2.4
21,1·
19 .5N29A
2.4x10 s~5Jdo
<1 t.1 1 6
l.5x102
1.1¥10"
6
i;l~l0~39
s <i-ts~1oa
2.4x10 . 5. l:lt~o ..
<1
11: 1 6"
l.5x102
1.lUO
6
.. ,4:0:!::Ii .. s
·;.ct;.J,.5'.11'.1:&'
FC =Faecal Coliforms; A= Absent; P =Present; ET= Electrophoretlc Type
A
.. "'·A A
A
A .... A. A
~ A
.A A
A
A
A
A
1)%..
A
A
A"
A
A
A
A
A
.... " ... "A
A
.. ..
L, lhno,cu:a A
A'
A
A A
A
A
A
L. innocua
4 .... A
A
L. innocua A
A
~
.h.~%
A
A
~, ~r 1s
A
~; ~1' 34
A
~.; £1' 52
. 'p; ET SS
A
A
A
A
A
31%
A
A
.. A·
.. A
A ..
t. in11ottta
Pi
A
A
A
A
A
L. fo.nac.rta
iSA% ~ ......
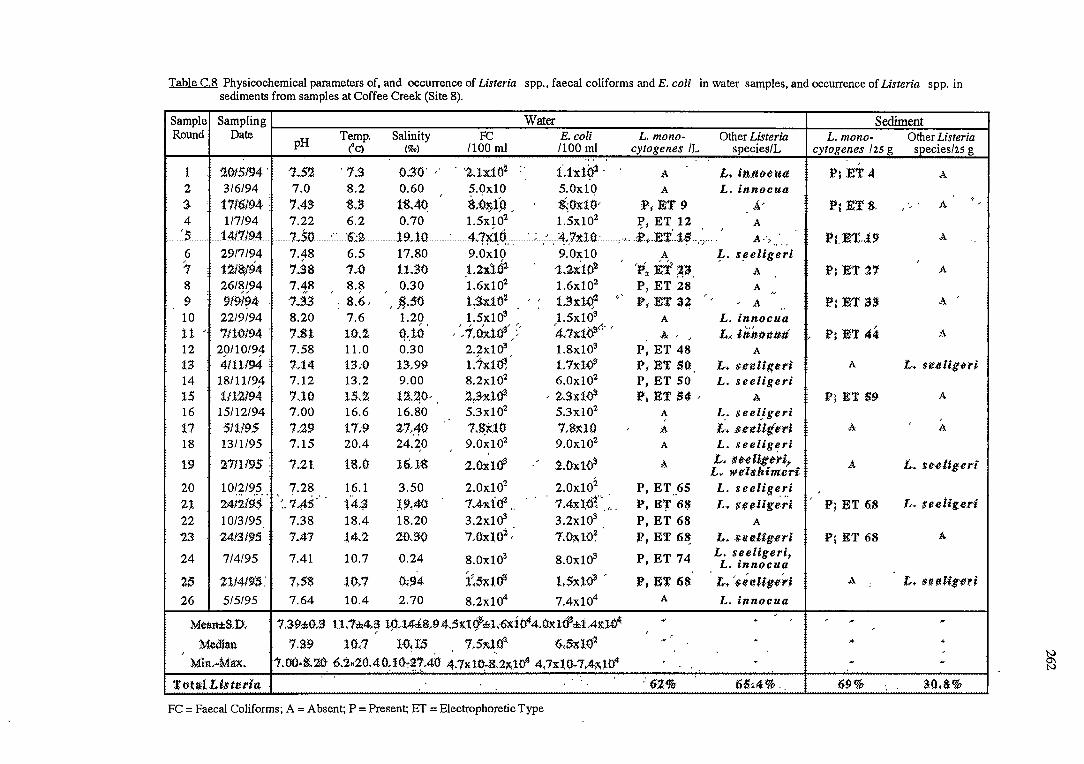
Table C.8 Physicochemical parameters of, and occurrence of Listeria spp., faecal coliforms and E.coli in water samples, and occurrence of Listeria spp. in sediments from samples at Coffee Creek (Site 8).
Sample Sampling Water Sediment Round Date
pH Temp. Salinity FC E.coli L. mono- Other Listeria L. mono- Other Listeria
(c) (%0) /100 ml /lOOml cytogenes /L species/L cytogenes lzs g species/zs g .... . . t ~015194. 1S2 . 7,S o.~o· .. · . "2-.l:x.10~ :· 1°.td~1 · A L. i~.ttoc (ta P;ET4 A 2 316194 7.0 8.2 0.60 5.0xlO 5.0xlQ A L. innocua
" a . .ol}-i:o .. :8:0:t10" ,,
3 1716/94 7A3 S.3 tS.4~ f\ ET 9 k P1 ETS. " A
4 117194 7.22 6.2 0.70 l.5x102 i.5x102 J?, ET. 12 . A
... "5 .... 1411194 ... 7¥50 ," '6~i 4.?i~~ .. " 19.10 . ; ." .4-.111:10· . .. ,£>,.Err .. t-$ .... _, .. A·» P:,E'l'. .. 19 .A .... 6 2917/94 7.48 6.5 17.80 9.0xlO 9.0xlO A -!-· S!Jeligeri
12JSJ94 L2X:ici1- "1:2-:t.1'0~ " "¥!~ £>f· ~·~. 7 7.38 7v0 11.:SO A P; ET 27 A
8 26/8/94 7.48 8.8 0.30 l.6x102 l.6x102 P, ET 28 A "
1.S:dO~ L3d:Q1 ...... " u
9 9191~4 1v33 : 8,Q .. .. $.SO " " P1 ET 3~ " " A P1 E'l' ~~ A "
1:5xla3 ..
10 22/9/94 8.20 7.6 1.29. l.5x103 A L. innocua
H" 7110194 7JH 10.:2. tpo .. ":i.O~Hf} "4,7xi&"'1"" A " " L, tiilt o tuut " P; ET 44 A
12 20/10/94 7.58 11.0 0.30 2.2xla3 l.8x103 P, ET 48 A
13 4111194 7v14 13:0 13-, 99 .... ;g"
L7:x:1~ P; ET SO. L. settllger:i A L. sttJtlig-eri 1.7d0 .. 14 18/11/9;'1- 7.12 13.2 9.00 8.2x10² 6.0x10² P, ET 50 L. seeligeri 15 111:2.194 7,10 15.2 12.~p .. .2..3-d& .. 2-.Sd~ P1 E'f 54 .. A P; gr S9 A
16 15/12/94 7.00 16.6 16.80 5~3xl02 5.3xl02 A L_. seel,igeri
17 511195 7.:29 17.9 Z-7..,40 7.8i10 7.8,;:10 A L. u t Utf'1 ri A A
18 13/1/95 7.15 20.4 24.20 9.0~102 9.0x10² A L. seelig~ri
"
"
19 'J.11119$ 1.21 18.0 16 .. 18 2.ono-3 " i.oxt<f A L. ~ tt Ug-t rt_,. A £. seeligeri L. welsJiim:cri 20 10/2/95 7.28 16.1 3.50 2.0x10² 2.0x10² P, ET .. 65 L. seelige.r:.i ,
24ji19$ . .. '..7As··· . 2 . . . '1'" . 2~ l4,S ~9.40 7Ad0 .. 7Airl,:O, ..... P, ET 66 L. ~11elige.ri P; ~T 68 L. ~e~tige.ri 22 10/3/95 7.38 18.4 18.20 3.2xla3 3.2x10³ P, ET 68 A
23 24/g/"1.5 7.47 l4.2 2R30 7,0xI.o:i..." 7.0IK.lif. J!, ET 6~ L. :see:tigeri P; ET 68 A
24 7/4/95 7.41 10.7 0.24 8.0x10³ 8.0x10³ P, ET 74 L. seeligeri, L. innocua
2.;S 211419:5-." 7.$8 l0,7 {);94 ii,5::d0~ LS:dlf" P, ET t!8 L. ".s.edit?ff ri A : L. Uf!.U_fff'(i
26 515195 7.64 10.4 2.70 8.2x10⁴ 7.4x10⁴ A L. innocua
1.39±0.9 11.1::!::4..~ 1.~.14±8 .. 94.Sx.1<}~<£::1.'6xio44.01tl6'3::1::1.4li:lif " Meilil±S.!X .... + " - -
" "
M~dian 7.:39 10,7 l-0, !5 7.5Jt10'2. t;.,5dQ2 - . .+ . " . . . " " Min.~Ma:K. 7.00·S.20 6.2"20.40'.I0~~?°.40 4.7xlQ;..K2;d04 4,7xl.0v7,4;d04 . ¥ - -..
TtHjj;l Li.ft.t1rfo. . . .. :6Z%- 65~4% .. 69~ $0,8% . . . .
FC =Faecal Coliforms; A= Absent; P =Present; ET = Electrophoretic Type
~ N
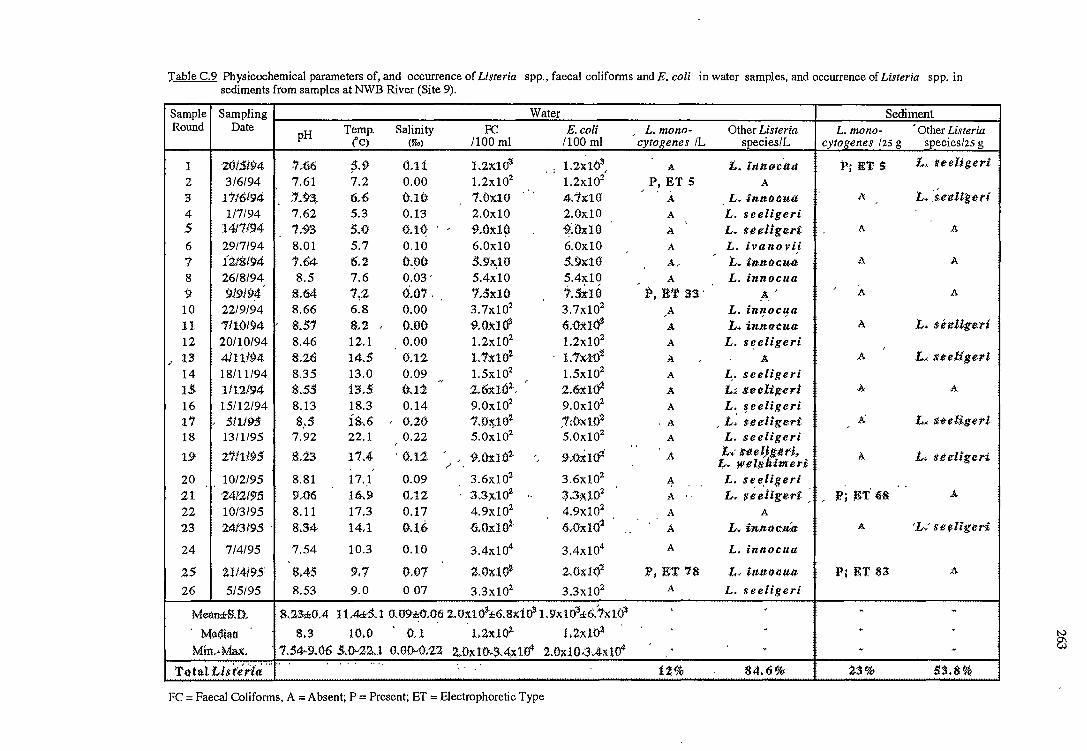
Table C.9 Physicochemical parameters of, and occurrence of Listeria spp., faecal coliforms and E. coli in water samples, and occurrence of Listeria spp. in sediments from samples at NWB River (Site 9).
Sample Sampling Water Sediment Round Date
pH Temp. Salinity FC E.coli , L. mono- Other Listeria L. mono- ' Other Listeria (C) {P'oo) /100 ml /100 ml cytogenes /L species/L cytogenes lzs g species/zs g
l Z0/5194 7.66 $.9 0.11 1.2.XlO;i . , L2~H>~. A 1... t rttuFc 'aa P; ET s L, oeligeri
2 3/6/94 7.61 7.2 0.00 l.2x102 1.2x10² P, ET 5 A .. ' ·' 3 1116194 . 7.~3, 6.6 0.10 7.0XlO 4.7x:10 .A L. inn o e:ua ./'i L. _$,erttigui 4 1/7/94 7.62 5.3 0.13 2.0xlO 2.0xlO A L. seeligeri 5 1411194 7.93 :5.0 0.1~ . ' 9.0:li:l9 9,~0xH) " L. seeltgeri A A A
6 29/7/94 8.01 5.7 0.10 6.0xlO 6.0xlO A L. ivanovi} ' ' 1 1218194 7.64 6.2 0.90 .5.9x,10 5.9x10 .A' 'L. innoc.ua A A
8 26/8/94 8.5 7.6 0.03' 5.4x10 5.4x10 A L. innocua 9 91919~ 8.64 112 0.07. 1.5:UO ts~10 P, ET 33· !'.' ' A A
10 22/9/94 8.66 6.8 0.00 3.7x10² 3.7x10² A L. inlJOClfa
11 7/10/94 ' 8 • .51 8.2 ' 0:.00 9.0:itl& 6.:0xHf .A L. inn o C:ua A L. $etttigeti 12 20/10/94 8.46 12.1 0.00 l.2x102 1.2x10²
A L. si:eligeri
•· 13 4/11194 s.2e 14.S 0.12 l.1X10~ · 1."lX·to~ A ' .A A £, seeUgeri 14 18/11/94 8.35 13.0 0.09 l.5x102 l.5x102
A L,. seeligeri " 2.6:itHi2-. , IS 1112194 8.55 13.S 0.12 2.6Xl& .A L;, Seelif:ert A A
16 15/12/94 8.13 18.3 0.14 9.0x10² 9.0x10² A L. s e elige ri
is.6 7.0:i).10~ .1~ox10'2 . '
A L, ueligeri 17 , S!W>S s .. s ' 0.20 .A, , L. $eeltge.ri '
18 13/1/95 7.92 22.1 0.22 5.0xl02 5.0x10² A L. seeligeri
' .. L+ S-"1.e~tgiU't, 19 Z1!H95 lt:i3 11.4 . 0.11 ' ' 9.0:itl01. ', 9.0~102' .A A L. seeltgeri
/ . I,.. wel:diimeri 20 1012195 8.81 17.1 0.09 3.6x10² 3.6x10²
A . . L. see,ligeri . . l;.3;KJ02 . , J,>; ~T· 6:8 .. 21 241219.5 lHl6 16.9 0.12 . 3.3.x.102 .. A .. L. ~~eligui · A
22 10/3/95 8.11 17.3 0.17 4.9x10² 4.9x10² A A
23 2413195 . 8.34 14.1 o.~6 6.0xlO:i. 6.0xl01 ...... A L. innoe:u..a A 'L: seellgeri
24 7/4/95 7.54 10.3 0.10 3.4x10⁴ 3.4x10⁴ A L. innocua
2$ ll/4195 8.45 9,1 0.07 2,0:x10~ Z,{)11:10~ Pi ET 78 L- innQc:ua Pl ET 83 A
26 515195 8.53 9.0 0 07 3.3x10² 3.3x10² A L. seeligeri
Mean::£:-S.D. 8.23±0.4 11.4::£:-S. l 0.09-:1::0.:06 2.ox.163.::£:6.Bd~ I.9xlO;i::£:-6.1xHY ' , - -· M~oian 8,3 10,0 (),l .LlxtOl l ,2xJ.()~
, . . Mi:rt.·Max:. 1.S4·9.06 S.Ou22..l 0.00"0,22 2.,01(10-~.4}';10" 2.0"1(.l(l.::}.4xt04 ~ - -
T~Hat us't~·rtti ... " . .... "'• ... U-% 84,6% :Z.$% 53.8%
FC =Faecal Coliforms, A =Absent; P =Present; ET= Electrophoretic Type
83
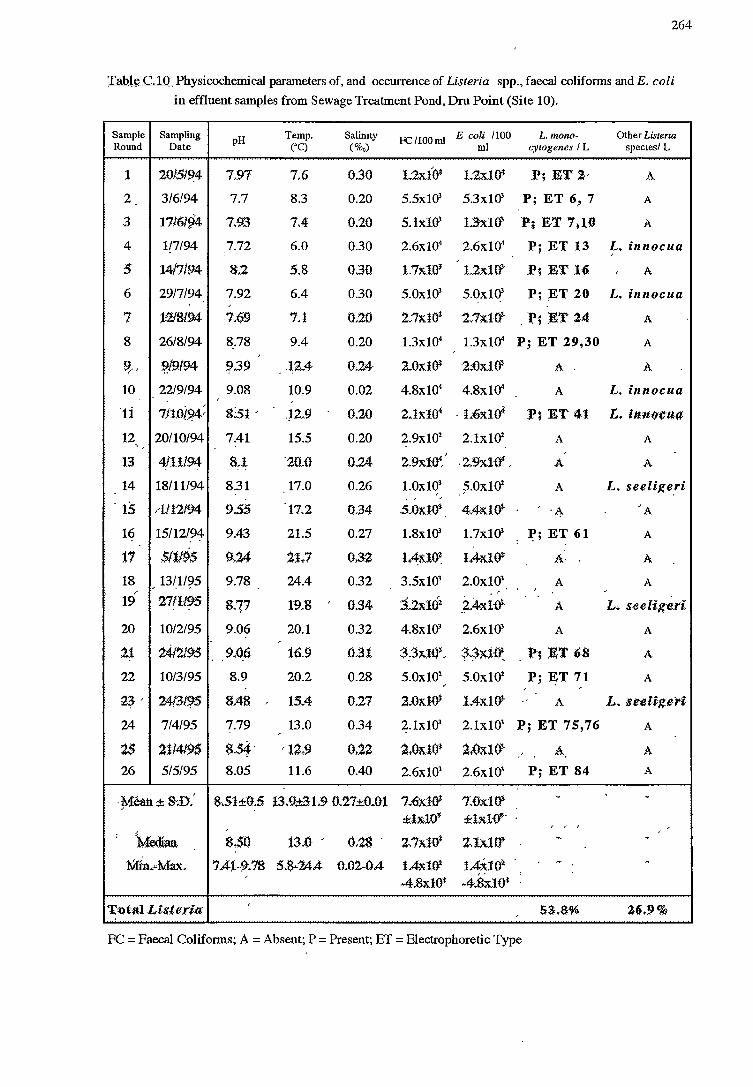
264
Table C.10 Physicochemical parameters of, and occurrence of Listeria spp., faecal coliforms and E. coli
in effluent samples from Sewage Treatment Pond, Dru Point (Site 10).
Sample Sampling pH Temp. Salimty FC/lOOml E coli 1100 L.mono- Other Listeria Round Date ('C) (%,) ml cytogenes I L species/ L
1 20151~4 7.97 7.6 0.30 lT2x.t-O~ L2x.1()!t .P; ET :z., A
2 3/6/94 7.7 8.3 0.20 5.5x10' 5.3x10' P; ET 6) 7 A
3 1716194 7.9.3 7.4 0.20 5, lxlO" L3:x:Ief Pi ET 7~Hl A
4 1/7/94 7.72 6.0 0.30 2.6xl04 2.6xla4 P; ET 13 L. innocua ,
5 1417/94 8.2 5.8 0.30 1.7x10~ 1.2xHf .P; ET 1:6 , A
6 29/7/94 7.92 6.4 0.30 5.0xlO' 5.0xlO' P; ~T 20 L. innocua ,
7 :1218194 7.69 7.1 0.2-0 2..1xl0-t 2..7x1.ft . p, ET 24 A
8 26/8/94 8.78 9.4 0.20 l.3xl04 l.3xla4 P; ET 29,30 A ,
~,, W9/94 9.39 -~2A 0.24 2TOx.1(f 2~ox.1<fl A A
10 22/9/94 9.08 10.9 0.02 4.8xl04 4.8xla4 A L. innocua
'1i 7/10i~4; s:s1, .12.9- 0.20 2.i:x:104 . L6:x:1& :J>~ ET 4:1 L. imttTcua
12 20/10/94 7.41 15.5 0.20 2.9x10² 2.lxl02 A A ' ,
2-.9xl-O( ,
13 4/11/94 8.1 ·zn.o 0.24 · 2-.'9xHf , A A
14 18/11/94 8.31 17.0 0.26 l.Oxl03 ?.Oxl02 A L. seelixeri . , ,
1.5 /1!12194 9.55 17.2 Q.34 5T0xl~ 4T4x.1<1 -~ , A
16 15/12/94 9.43 21.5 0.27 l.8x10' l.7x10' 1;1; ET 61 A :
17 Sllf95 9,24 21.7 O.S2 tA;JtJJ)~ l.4-x.loi A- A
18 13/1/95 9.78 24.4 0.32 3.5x10' 2.0x1Q3 A A ,. , , , ,
19 271l195 8.7,7 19.& , 0.34 :3..2xl0:2 2.4xltf A L. seeligeri
20 10/2/95 9.06 20.1 0.32 4.8x1Q3 2.6x1Q3 A A ,
11 z4t219S 9.06 16.9 ().31 3_.'.3xJO', $-~x.1-0:. 'P; ET 6S A
22 10/3/95 8.9 20.2 0.28 5.0x10² 5.0x1Q2 P; ~T 71 A , , ,
13, 24131'!5 8,48 , 15A 0.27 2T-Oxl-O-t lAx.1<1 A L. seeltgeri
24 7/4/95 7.79 13.0 , 0.34 2.lxlO' 2.lx1Q3 P; ET 75,76 A
2S 2114195 s.54· : .. '12.9 0.22 'l.Ox.1CJ$ 2.(l~lef , A A
26 515195 8.05 11.6 0.40 2.6xl03 2.6x1Q3 P; ET 84 A
.
. ~ean ~ s'.D, 8-.51±0.5 l.3.9.;!31.9 D-'27±0.01 1T<idff 7,-0x.1(1 . . ±b.10s ±lx.Ws.
•, , , , , : i~
,
8.50: tHl, (}.28 . 2-.7xJd Z.tx1i1 - . :tVIfu..~Mrut. 7.41-~.78 5.8~24.4 {l-.02-0.4 L4::d0.2 L4irn~ ~ ~
4~~104 : ,
-4.8xl0*
Tutal Listeria •
, S3:T8% 2-6.9% . ,
FC = Faecal Coliforms; A = Absent; P = Present; ET = Electrophoretic Type
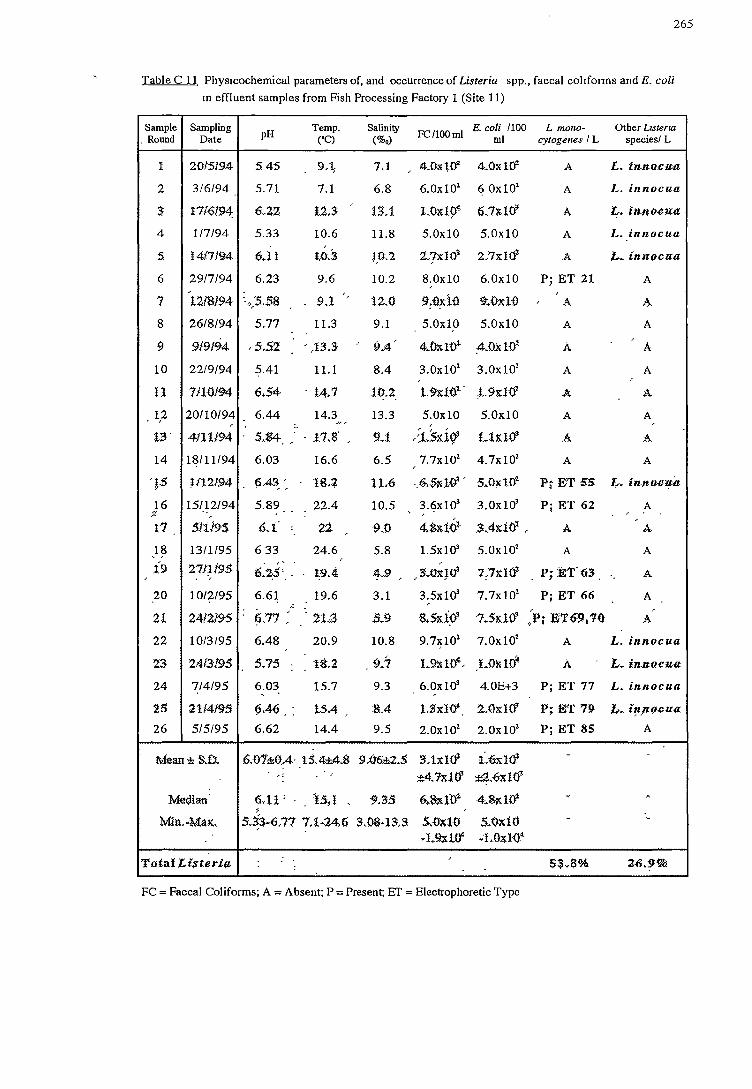
265
Table C 11 Phys1cochemical parameters of, and occurrence of Listeria spp., faecal colt forms and E. coli
m effluent samples from Fish Processing Factory 1 (Site 11)
Sample Sampling pH
Temp. Salinity FC/lOOml
E.coli 1100 L mono- Other Lrsterra . Round Date ('C) (%0) ml cytogenes I L species/ L
I 201-Sl94 5 4:5 9,\ 7.1 , 4.0:KH)'' 4.0:KHJ' A L. iu1uu:u.a
2 3/6/94 5.71 7.1 6.8 6.0xl01 6 Oxl01 A L. innocua
s 11{{)/94 6.2.2 t.2.S 13.1 LOll'.194 6,1~1(/ A ~· in.nocua
4 1/7/94 5.33 10.6 11.8 5.0xlO 5.0xlO A L. innocua ,
:5 l4f7194 6.H w.3 l,0:.2 2.7x:101 2,7x:IOt A f,.. innocua
6 29/7/94 6.23 9.6 10.2 8.0xlO 6.0xlO , P; ET 21 A ,,
9:-0?'i-0 ,
7 l.21-8194 ·-,,)i.SS 9,l ,
12-,-0 9+0d-O A A-,
8 26/8/94 5.77 11.3 9.1 5.0xlO 5.0xlO A A
9 9.f919-4 , 5.52 , ,1.3.3 , 9.4 4.())1,H)~ ;4.0.XHt
, A A
10 22/9/94 5.41 11.1 8.4 3.0xl01 3.0xl01 A A ,
H 7J1-0194 6+54 . l.4,7 1~.2 . 1.9:d01" )..9~Hl A A
1,2 20/10/94 6.44 14.3 13.3 5.0xlO 5.0xlO A A , .. ,,, ,
1:3-" 4111194 SJ~4 . , - 11J:r , -~u ,:i.sxi~ L1:Ud A A
14 18/11/94 6.03 16.6 6.5 7.7xl01 4.7xl01 A A ,
-is Ul2:/94 6.43-, 18.2 ll.6 ._6.sdoi · 5.0;d<f P;- ET 55 I,,-. iuna·!H!'lt . , ,
16 15/12/94 5.89 .. 22.4 10.5 3.6xl03 3.0xl03 P; ET 62 A /· , ' , ,
1.1 5!1195 6,f : 2:2. , f>J) 4J~doi SA:d~, ,
A A
18 13/1/95 6 33 24.6 5.8 l.5xl03 5.0xl01 A A
l9 ..... ,
, 27!~195 6.2;5'_. 1.9.4 4.9 , , 3.0x:Jo"l 7 .?x:Iot _ P; E'l.-U-3. A
20 10/2/95 6.61 19.6 3.1 3.5xl03 7.7xl01 P; ET 66 A ,; ,
~,77: ·.
S+Si;.i~ 1+5x1<f )i ET69,7(): ,
21 241219-5 21.:3 .5.9 A
22 10/3/95 6.48 20.9 10.8 9.7xl01 7.0xl01 A L. innocua ,
23 2413·!95 S.75 18.2 9.7 L9)(1Q4, LOi>lO~ A 'L. in.nocua
24 7/4/95 6.03 15.7 9.3 6.0xl03 4.0E+3 P; ET 77 L. innocua '
25 21f4/95 §.46 , . 15-4 :&A :LSx:I04 2.0x:Id P; ET 79 ft. i!J.fff!CUa.
26 515195 6.62 14.4 9.5 2.0xl01 2.0xl01 P; ET 85 A
Mean±S.0. 6.-01±0:.4· lS,4±4.S. 9.06±:2.5 3.lxl03 i~:6xHi - -
,; ;:t4, 7d0' ::t-Z,-6~103
Median 6,H' · . l5~l 9.3.5 6.&.ld 4.8;K.Hf . ~
' ~
MiitwMal(, 5.3_3~6.77 7.1.::M.6 S.-OS·lS,3 S-,-Od-0 S-.O:d-0 - '
.I.~l.0'1 .1.04l{)4.
Total l.i$t~ria ,
S~L8% Z-6.9% :
FC =Faecal Coliforms; A =Absent; P =Present; EI'= Electrophoretic Type
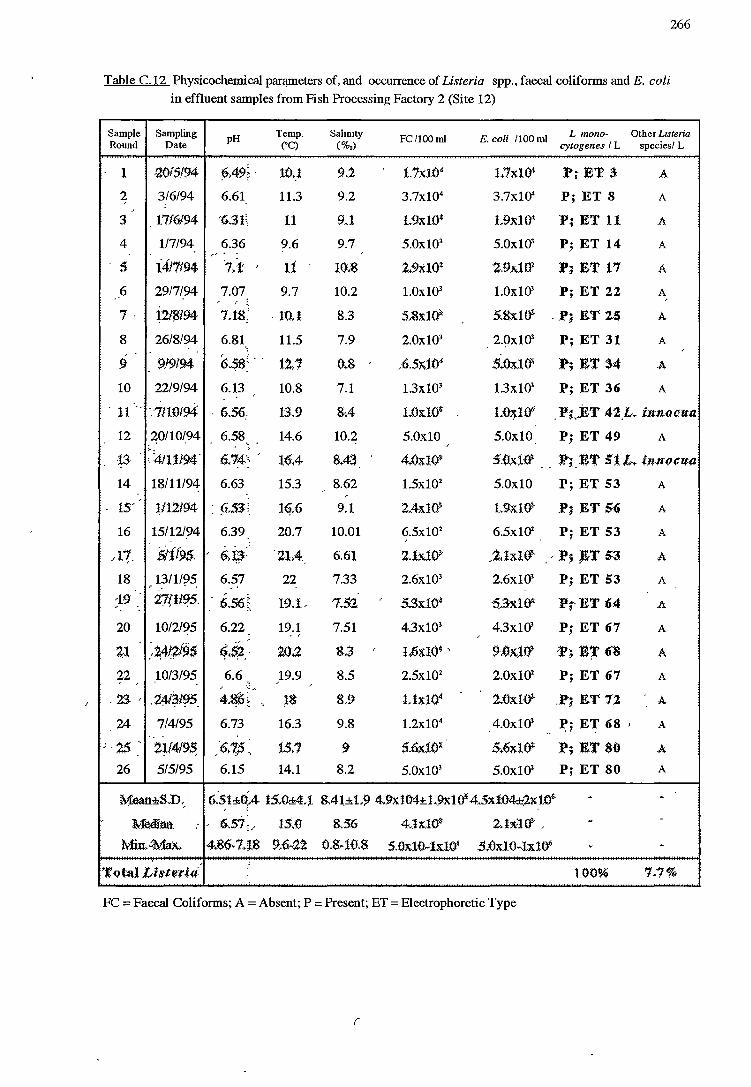
266
Table C.12 Physicochemical panµneters of, and occurrence of Listeria spp., faecal colifonns and E. coli
in effluent samples from Fish Processing Factory 2 (Site 12)
Sample Sampling pH Temp. Sahmty FC/lOOml E. coli 1100 ml L mono- Other Lrsteria
Round Date (°C) (%,) cytogenes I L species/ L
l ,zoJSf94 ~A9~, · lt»l 9.2 1.7xl04 l+7:xl04 l!; ET 3: A
2 3/6/94 6.61 11.3 9.2 3.7xl04 3.7x10' P; ET 8 A : ,
3 1716/94 '6.3f 11 9.1 L9x10* L9xlot P; ET 11 A
4 117/94 6.36 9.6 9.7 5.0x101 5.0x101 P; ET 14 A ,, . ,
5 i4n194 ·1;t , li JQ,$ 2+9:itl02 Z.9.dO~ P; ET 17 A
6 2917/94 7.07 9.7 10.2 l.Oxl01 l.Ox101 P; ET 22 A , .. :.
,
7· ~~194 7.ts; . 10,1 8.3 5.8x10~ 5.8xlef . P; ET 25 A
8 26/8/94 6.81 11.5 7.9 2.0x101 2.0x101 P; ET 31 A ,
9 91919:4 6.$s:·· · 1Z.1 0+8 , ;6.Sx.104 S+O:x.l!Y P; ET $4 A
10 22/9/94 6.13 10.8 7.1 l.3xl01 l.3x101 P; ET 36 A
. 11 ... ·.7110/Q-4: . 6.56. 13-.9 SA 1.-0x.10$ LO~l06 . P;)£.T 42.L. imwcua
12 20/10/94 6.58 14.6 10.2 5.0xlO 5.0xlO P; ET 49 A .. ;. >
,
-13 . =.4JUl94. 6,14·:. ,
l6A· 8+43 4+0::d0~ 5.0xHY :P; ET StL. i1mfltl(;a ..
14 18/11194 6.63 15.3 8.62 l.5x102 5.0xlO P; ET 53 A , ,
15' 1!12194 : ft.SS~. lq,6 9.1 2,4x10³ 1.9xl01" P; ET 5:6 A
16 15/12/94 6.39 20.7 10.01 6.5x101 6.5x10² P; ET 53 A
siif9s. .. :
/rr , 6,~?: ·21A. t'i.6l 2-. .tx10~ ,l+hllY" . , P; ;ET 53 A
18 13/1195. 6.57 22 7.33 2.6x101 2.6x101 P; ET 53 A , ..
;19 27fH~. 6.s6t 19.1, 7.5'2 ,
5..Sx.104 ·6/3x1Qt P;-ET 64 A
20 10/2/95 6.22 19.1 7.51 4.3x101 4.3x101 P; ET 67 A . , ,
-~~4f#95 .... ·
~l ti.S~ .. 10,2 &,3 U)~l04 ' !).0x.1rt 'l'; Er 6~ A
22 10/3/95 6.6 19.9 8.5 2.5x101 2.0x10² P; ET 67 A , , -:: ... ,
. 23- , .24~1~. 4-~~: ·. ,8 8.9 Ux104 2.0xl-01" .P; ET 72 A
24 7/4/95 6.73 16.3 9.8 l.2xl04 4.0x101 .. ~i E~ 68 I A
; ·25 ·. 2V4t9$ ,"6.1,5 :. 1S.1 9 5.6d0~ S+~:xloi :P; ET St'J A
26 515195 6.15 14.l 8.2 5.0x101 5.0x101 P; ET 80 A
Mean±S.D., 6:St±Q~4 15.0±4.1 8.4l±L9 4.9xlG4±L9xlet'4~5:d-04±:2x10-s. . . , ·!
, :Median. 6.57;, 15.-0 8.56 4.lx.10* 2-.lx1Cf , - -
M:iu,~Max. • 4.86~7+f8 !),u-22 0.8"1-0-8 S.Gx.10-lxl~ .5.-0x.l Q~lx 1~ . .
T<.>td Listrrr~a 100% 7.1%
FC =Faecal Colifonns; A =Absent; P =Present; ET= Electrophoretic Type
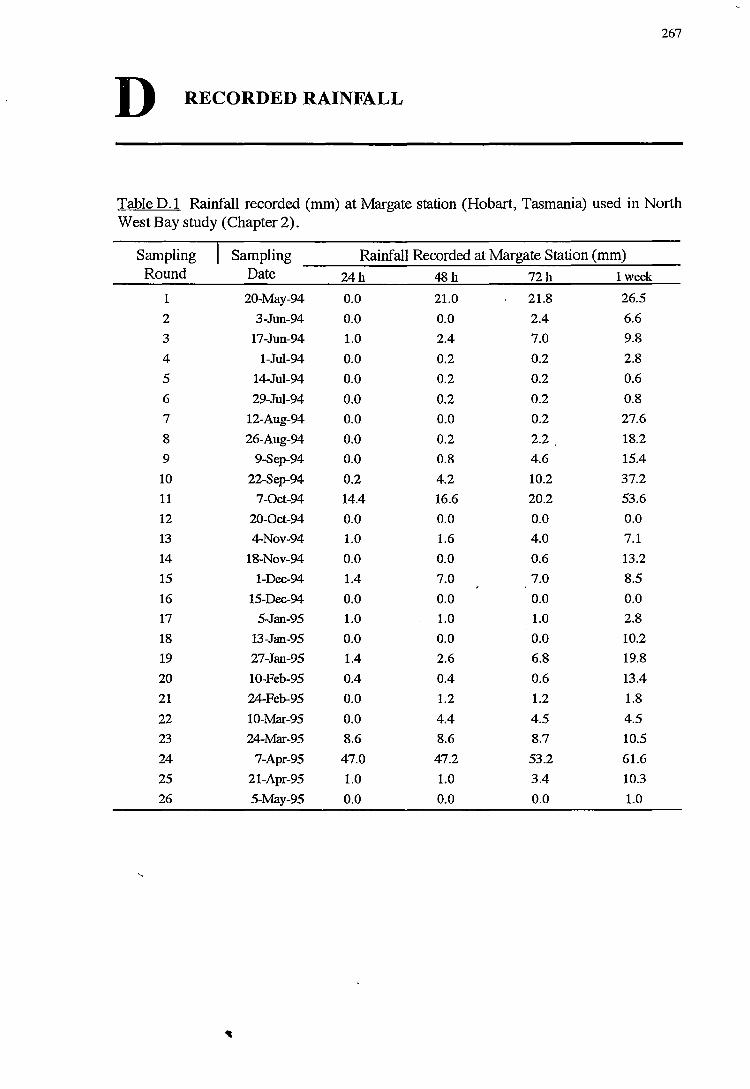
267
D RECORDED RAINFALL
Table D.1 Rainfall recorded (mm) at Margate station (Hobart, Tasmania) used in North West Bay study (Chapter 2).
Sampling Sampling Rainfall Recorded at Margate Station (mm) Round Date 24h 48h 72h 1 week
1 20-May-94 0.0 21.0 21.8 26.5
2 3-Jun-94 0.0 0.0 2.4 6.6
3 17-Jun-94 1.0 2.4 7.0 9.8
4 1-Jul-94 0.0 0.2 0.2 2.8
5 14-Jul-94 0.0 0.2 0.2 0.6
6 29-Jul-94 0.0 0.2 0.2 0.8
7 12-Aug-94 0.0 0.0 0.2 27.6
8 26-Aug-94 0.0 0.2 2.2 18.2
9 9-Sep-94 0.0 0.8 4.6 15.4
10 22-Sep-94 0.2 4.2 10.2 37.2
11 7-0ct-94 14.4 16.6 20.2 53.6
12 20-0ct-94 0.0 0.0 0.0 0.0
13 4-Nov-94 1.0 1.6 4.0 7.1
14 18-Nov-94 0.0 0.0 0.6 13.2
15 l-Dec-94 1.4 7.0 7.0 8.5
16 15-Dec-94 0.0 0.0 0.0 0.0
17 5-Jan-95 1.0 1.0 1.0 2.8
18 13-Jan-95 0.0 0.0 0.0 10.2
19 27-Jan-95 1.4 2.6 6.8 19.8
20 10-Feb-95 0.4 0.4 0.6 13.4
21 24-Feb-95 0.0 1.2 1.2 1.8
22 10-Mar-95 0.0 4.4 4.5 4.5
23 24-Mar-95 8.6 8.6 8.7 10.5
24 7-Apr-95 47.0 47.2 53.2 61.6
25 21-Apr-95 1.0 1.0 3.4 10.3
26 5-May-95 0.0 0.0 0.0 1.0
•
268
E LOGISTIC ANALYSIS FOR NORTH WEST BAY
E.1 THE LOGISTIC PROCEDURE
The presence or absence data of Listeria spp. or L. monocytogenes were grouped by the
type of samples; river water, effluent and inshore marine water, and analysed using the
SAS1 LOGISTIC procedure (Release 6.10 SAS Institute Inc. Cary USA, 1995) by
having Listeria spp. and L. monocytogenes as the response variables, and the
environmental factors (temperature, pH, salinity and rainfall) and the level of faecal
coliforms and E. coli as the independent variables. Examples of the results of the
analysis for inshore marine water with L. monocytogenes as the response variables using
1, 2, and 3 independent variable(s) respectively are shown below. An increase in the
Chi-Square for covariates statistic (-2 LOG L) of more than 3.84 for a single added
independent variable is considered to be significant (a = 0.05). For 2 independent
variables, the critical value is 5.99; for 3 independent variables, it is 7.81, etc. The
parameter estimates for the 3 independent variable cases shown here were fitted to Eqn.
2.1 and presented as Eqn.2.8 (see Chapter 2). The agreement between the predicted
probabilities given by the fitted model and the observed responses used to generate the
model is determined from the area 'c' under the receiver operating characteristic (ROC)
curve as discussed in Chapter 2, section 2.2.4. Summary of the logistic analysis of 52
river water samples, 78 effluent samples, and 182 inshore water samples when Listeria
spp. or L. monocytogenes was the dependent variable are given in Tables E.1-2, E.3-4,
and E.5-6 respectively.
Examples of the results of the analysis for inshore marine water with L. monocyto genes
as the response variables using SAS1 LOGISTIC procedure.
The LOGISTIC Procedure Response Profile
Ordered Value L_MONO Count 1 1 11 2 0 171
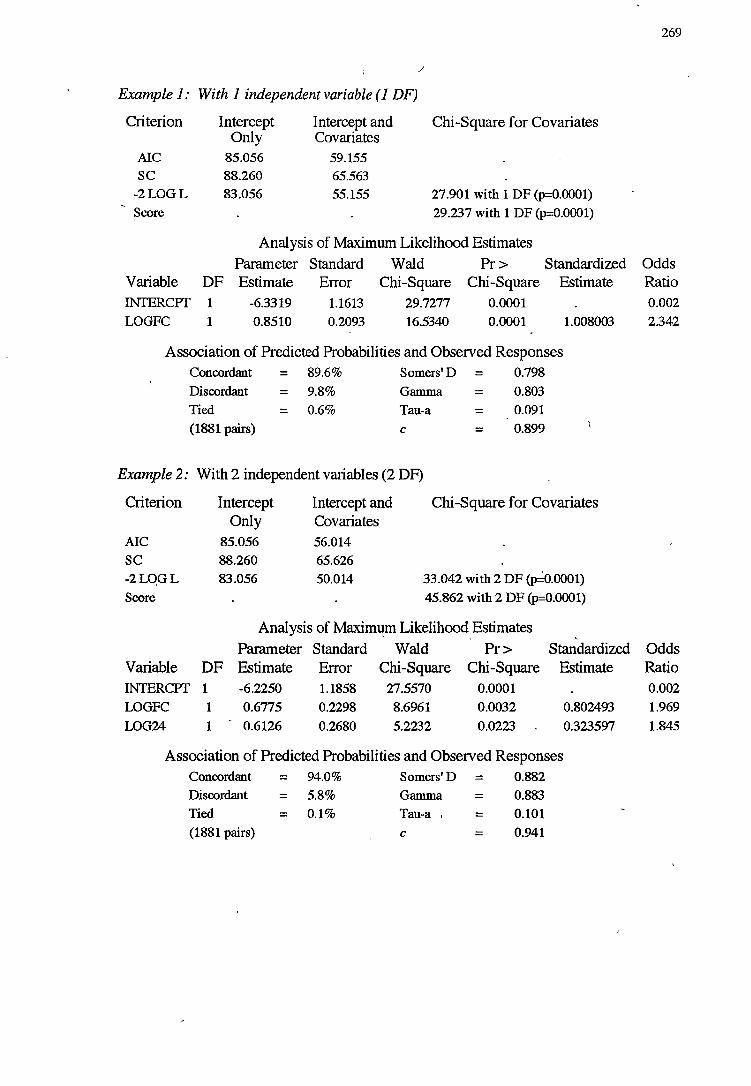
/
Example 1: With 1 independent variable ( 1 DF)
Criterion
AIC
SC
-2LOGL
Score
Variable
Intercept Only
85.056
88.260
83.056
Intercept and Covariates
59.155
65.563
55.155
Chi-Square for Covariates
27.901 with 1 DF (p=0.0001)
29.237 with 1 DF (p=0.0001)
Analysis of Maximum Likelihood Estimates Parameter Standard Wald Pr> Standardized
DF Estimate Error Chi-Square Chi-Square Estimate INTERCPf 1 -6.3319 1.1613 29.7277 0.0001
LOGFC 1 0.8510 0.2093 16.5340 0.0001 1.008003
Association of Predicted Probabilities and Observed Responses Concordant = 89.6% Somers' D = 0.798
Discordant
Tied
(1881 pairs)
= 9.8%
= 0.6%
Gamma
Tau-a
c
= = =
0.803
0.091
0.899
Example 2: With 2 independent variables (2 DF)
Criterion
AIC
SC
-2LO,GL
Score
Variable
Intercept Intercept and Chi-Square for Covariates Only
85.056
88.260
83.056
Covariates 56.014
65.626
50.014 33.042 with 2 DF ~.0001)
45.862 with 2 DF (p=0.0001)
Analysis of Maximum Likelihood Estimates . ' ' Parameter Standard Wald Pr> Standardized
DF Estimate Error Chi-Square Chi-Square Estimate INTERCPf 1 -6.2250 1.1858 27.5570 0.0001
LOGFC 1 0.6775 0.2298 8.6961 0.0032
LOG24 1 - 0.6126 0.2680 5.2232 0.0223
Association of Predicted Probabilities and Observed Responses Concordant = 94.0% Somers' D = 0.882
Discordant = 5.8%
Tied = 0.1 % (1881 pairs)
Gamma
Tau-a
c
= = =
0.883
0.101
0.941
0.802493
0.323597
269
Odds Ratio 0.002
2.342
Odds Ratio 0.002
1.969
1.845
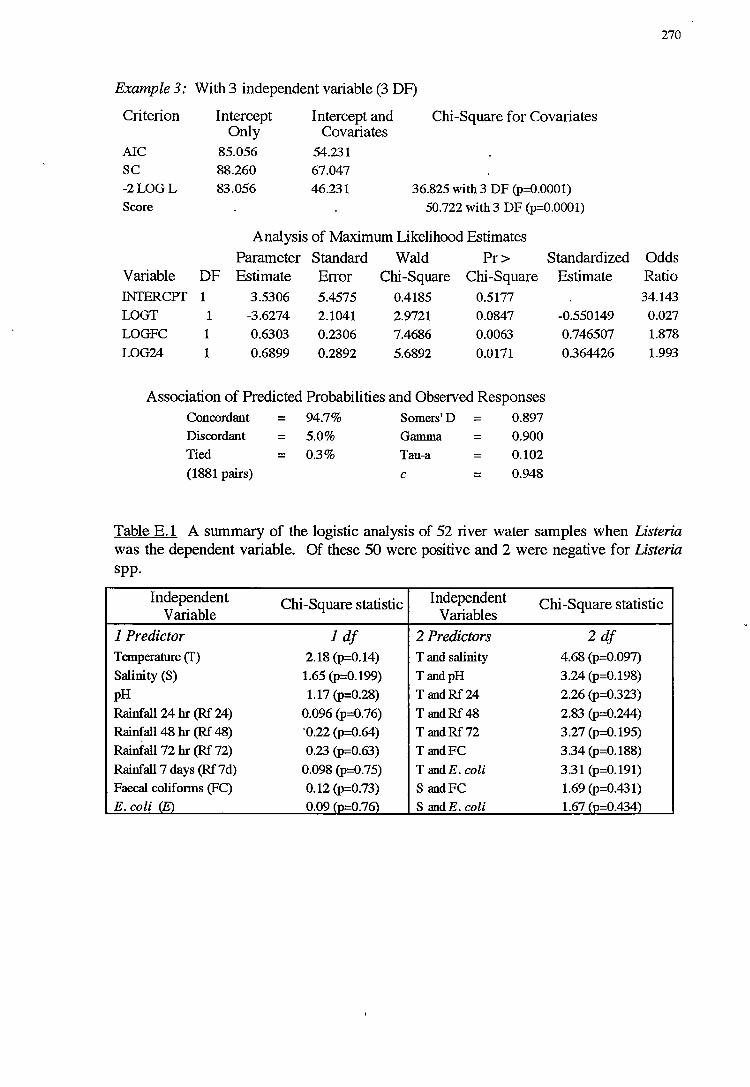
Example 3: With 3 independent variable (3 DF)
Criterion
AIC SC -2LOGL Score
Variable
Intercept Only
85.056 88.260 83.056
Intercept and Covariates
54.231 67.047 46.231
Chi-Square for Covariates
36.825 with 3 DF (p=<WOOl) 50.722 with 3 DF (p=0.0001)
Analysis of Maximum Likelihood Estimates Parameter Standard Wald Pr> Standardized
DF Estimate Error Chi-Square Chi-Square Estimate INTERCPT 1 3.5306 5.4575 0.4185 0.5177 LOGT 1 -3.6274 2.1041 2.9721 0.0847 -0.550149 LOGFC 1 0.6303 0.2306 7.4686 0.0063 0.746507 LOG24 1 0.6899 0.2892 5.6892 0.0171 0.364426
Association of Predicted Probabilities and Observed Responses Concordant = 94.7% Somers' D = 0.897 Discordant = 5.0% Gamma = 0.900
Tied = 0.3% Tau-a = 0.102
(1881 pairs) c = 0.948
270
Odds Ratio 34.143
0.027 1.878
1.993
Table E.1 A summary of the logistic analysis of 52 river water samples when Listeria was the dependent variable. Of these 50 were positive and 2 were negative for Listeria spp.
Independent Chi-Square statistic Independent Chi-Square statistic Variable Variables
1 Predictor 1 df 2 Predictors 2df Temperature (f) 2.18 (p=0.14) T and salinity 4.68 (p=0.097) Salinity (S) 1.65 (p=0.199) TandpH 3.24 (p=0.198)
pH 1.17 (p=0.28) T andRf24 2.26 (p=0.323)
Rainfall 24 hr (Rf 24) 0.096 (p=0.76) T andRf 48 2.83 (p=0.244)
Rai~all 48 hr (Rf 48) ·0.22 (p=0.64) T andRf72 3.27 (p=0.195) Rainfall 72hr(Rf72) 0.23 (p=0.63) T andFC 3.34 (p=0.188) Rainfall 7days(Rf7d) 0.098 (p=0.75) T and E.coli 3.31 (p=0.191) Faecal coliforms (FC) 0.12 (p=0.73) S andFC 1.69 (p=0.431) E.coli (El 0.09 (p=0.76) S and E.coli 1.67 (p=0.434)
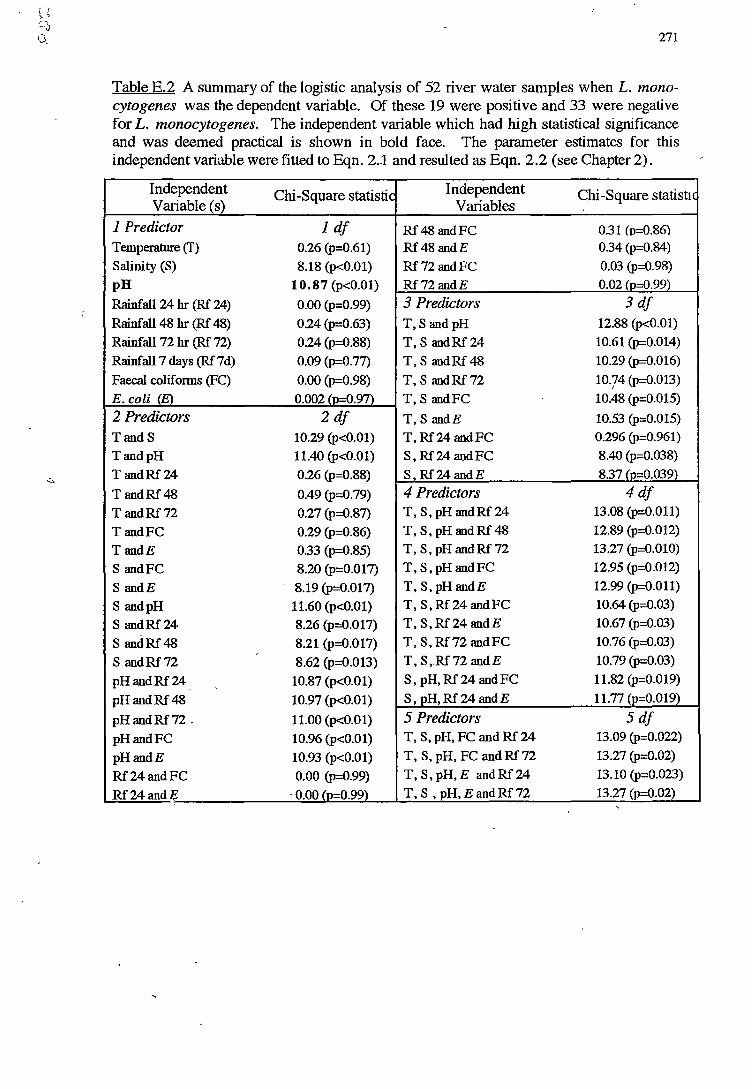
271
Table E.2 A summary of the logistic analysis of 52 river water samples when L. monocytogenes was the dependent variable. Of these 19 were positive and 33 were negative for L. monocytogenes. The independent variable which had high statistical significance and was deemed practical is shown in bold face. The parameter estimates for this independent variable were fitted to Eqn. 2.-1 and resulted as Eqn. 2.2 (see Chapter 2).
Independent Chi-Square statistic Independent Chi-Square statistu Variable (s) Variables
1 Predictor 1 df Rf48andFC 0.31 (p=0.86) Temperature (f) 0.26 (p=0.61) Rf48andE 0.34 (p=0.84)
Salinity (S) 8.18 (p<0.01) Rf72andFC 0.03 (p=0.98)
pH 10.87 (p<0.01) Rf72andE 0.02 fo=0.99)
Rainfall 24 hr (Rf 24) 0.00 (p=0.99) 3 Predictors 3df Rainfall 48 hr (Rf 48) 0.24 (p=0.63) T,S and pH 12.88 (p<0.01)
Rainfall 72 hr (Rf 72) 0.24 (p=0.88) T, S andRf24 10.61 (p=0.014)
Rainfall 7days(Rf7d) 0.09 (p=0.77) T, Sand Rf 48 10.29 (p=0.016)
Faecal coliforms (FC) 0.00 (p=0.98) T, S andRf72 10}4 (p=0.013)
E.coli (F.\ 0.002 (n=0.97) T, S andFC 10.48 (p=0.015)
2 Predictors 2df T, S andE 10.53 (p=0.015)
TandS 10.29 (p<0.01) T, Rf 24 andFC 0.296 (p=0.961)
TandpH 11.40 (p<0.01) S, Rf24 andFC 8.40 (p=0.038)
T andRf24 0.26 (p=0.88) S.Rf24andE 8.37 fn=0.039)
T andRf48 0.49 (p=0.79) 4 Predictors 4df T andRf72 0.27 (p=0.87) T, S, pH andRf24 13.08 (p=0.011)
T andFC 0.29 (p=0.86) T, S, pH and Rf 48 12.89 (p=0.012)
TandE 0.33 (p=0.85) T, S, pH andRf72 13.27 (p=0.010)
S andFC 8.20 (p=0.017) T, S, pH andFC 12.95 (p=0.012)
S andE 8.19 (p=0.017) T,S,pHandE 12.99 (p=0.011)
S andpH 11.60 (p<0.01) T, S, Rf24andFC 10.64 (p=0.03)
S andRf24 8.26 (p=0.017) T,S,Rf24andE 10.67 (p=0.03)
S andRf48 8.21 (p=0.017) T, S, Rf72 andFC 10.76 (p=0.03) ,
S andRf72 8.62 (p=0.013) T, S,.Rf72 andE 10.79 (p=0.03)
pHandRf24 10.87 (p<0.01) S, pH,Rf24andFC 11.82 (p=0.019) "
pHandRf48 10.97 (p<0.01) S, oH,Rf24andE 11.77 (o=0.019)
pHandRf72. 11.00 (p<0.01) 5 Predictors 5df pHandFC 10.96 (p<0.01) T, S, pH, FC and Rf 24 13.09 (p=0.022)
pHandE 10.93 (p<0.01) T, S, pH, FC andRf72 13.27 (p=0.02)
Rf24andFC 0.00 (p=0.99) T, S, pH, E andRf24 13.10 (p=0.023)
Rf24andE . 0.00 fo=0.99) '
T, S, pH, E andRf72 13.27 (p=0.02)
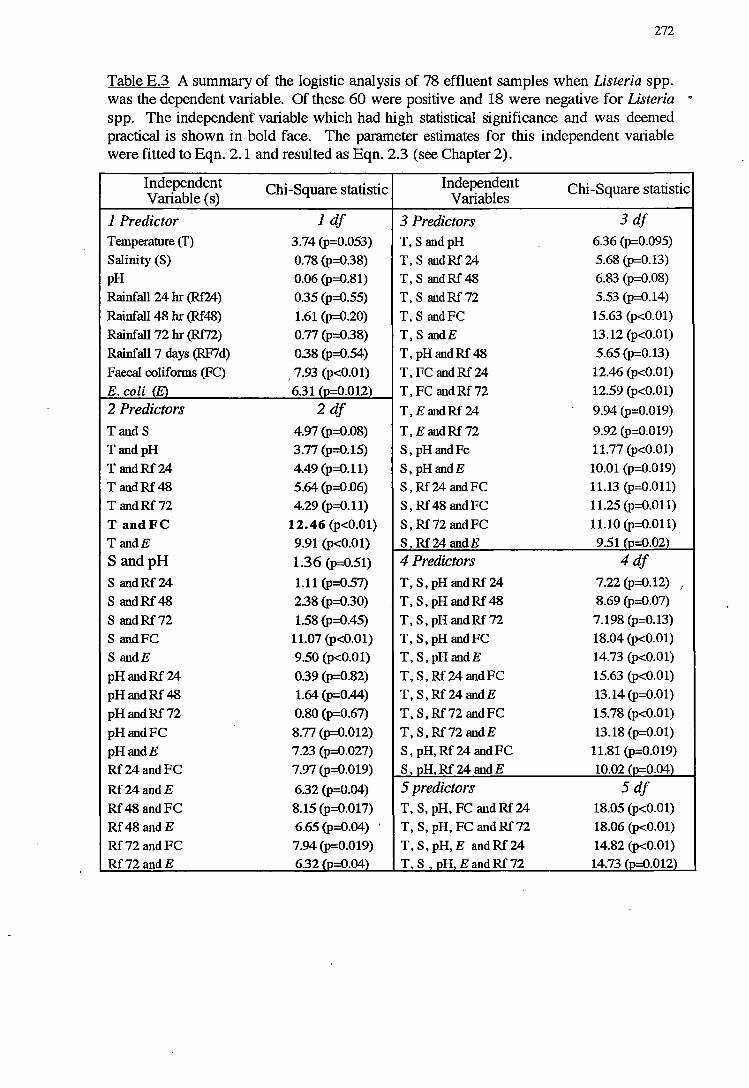
272
Table E.3 A summary of the logistic analysis of 78 effluent samples when Listeria spp. was the dependent variable. Of these 60 were positive and 18 were negative for Listeria 0
spp. The independent variable which had high statistical significance and was deemed practical is shown in bold face. The parameter estimates for this independent variable were fitted to Eqn. 2.1 and resulted as Eqn. 2.3 (see Chapter 2).
Independent Chi-Square statistic Independent Chi-Square statistic Variable (s) Variables
1 Predictor 1 df 3 Predictors 3df
Temperature (T) 3.74 (p=0.053) T,S and pH 6.36 (p=0.095) Salinity (S) 0.78 (p=0.38) T, S andRf24 5.68 (p=0.13) pH 0.06 (p=0.81) T, S andRf48 6.83 (p=0.08)
Rainfall 24 hr (Rf24) 0.35 (p=0.55) T, S andRf72 5.53 (p=0.14)
Rainfall 48 hr (Rf 48) 1.61 (p=0.20) T, S andFC 15.63 (p<0.01)
Rainfall 72 hr (Rf72) 0.77 (p=0.38) T, S andE 13.12 (p<0.01)
Rainfall 7 days (RF7d) 0.38 (p=0.54) T, pH and Rf 48 5.65 (p=0.13)
Faecal coliforms (FC) I 7.93 (p<0.01) T,FC andRf24 12.46 (p<0.01)
E.coli <El 6.31 (p=0.012) T, FC andRf72 12.59 (p<0.01)
2 Predictors 2df T, EandRf24 9.94 (p=0.019)
TandS 4.97 (p=0.08) T, EandRf72 9.92 (p=0.019)
TandpH 3.77 (p=0.15) S, pHandFc 11.77 (p<0.01)
T andRf24 4.49 (p=0.11) S, pHandE 10.01 (p=0.019)
T andRf48 5.64 (p=0.06) S , Rf 24 and FC 11.13 (p=0.011)
T andRf72 4.29 (p=0.11) S, Rf 48 andFC 11.25 (p=0.011)
T andFC 12.46 (p<0.01) S, Rf72 andFC 11.10 (p=0.011)
TandE 9.91 (p<0.01) S,Rf24andE 9.51 (o=0.02)
Sand pH 1.36 (p--0.51) 4 Predictors 4df
S andRf24 1.11 (p=0.57) T, S, pH andRf24 7.22 (p=0.12) J
S andRf48 2.38 (p=0.30) T, S, pH and Rf 48 8.69 (p=0.07)
S andRf72 1.58 (p=0.45) T, S, pH andRf72 7.198 (p=0.13)
S andFC 11.07 (p<0.01) T, S, pH and FC 18.04 (p<0.01)
S andE 9.50 (p<0.01) T, S,pHandE 14.73 (p<0.01)
pHandRf24 0.39 (p=0.82) T, S, Rf24 andFC 15.63 (p<0.01)
pHandRf48 1.64 (p=0.44) T,S,Rf24andE 13.14 (p=0.01)
pHandRf72 0.80 (p=0.67) T, S, Rf 72 andFC 15.78 (p<0.01)
pHandFC 8.77 (p=0.012) T,S,Rf72andE 13.18 (p=0.01)
pHandE 7.23 (p=0.027) S, pH,Rf24 andFC 11.81 (p=0.019)
Rf24andFC 7.97 (p=0.019) S, oH,Rf24andE 10.02 <o=0.04)
Rf24andE 6.32 (p=0.04) 5 predictors 5df Rf48andFC 8.15 (p=0.017) T, S, pH, FC andRf24 18.05 (p<0.01)
Rf48andE 6.65 (p=0.04) . T, S, pH, FC andRf72 18.06 (p<0.01)
Rf72andFC 7.94 (p=0.019) T, S, pH, E and Rf 24 14.82 (p<0.01)
Rf72andE 6.32 <o=0.04) T S , oH, E and Rf 72 14.73 (o=0.012)
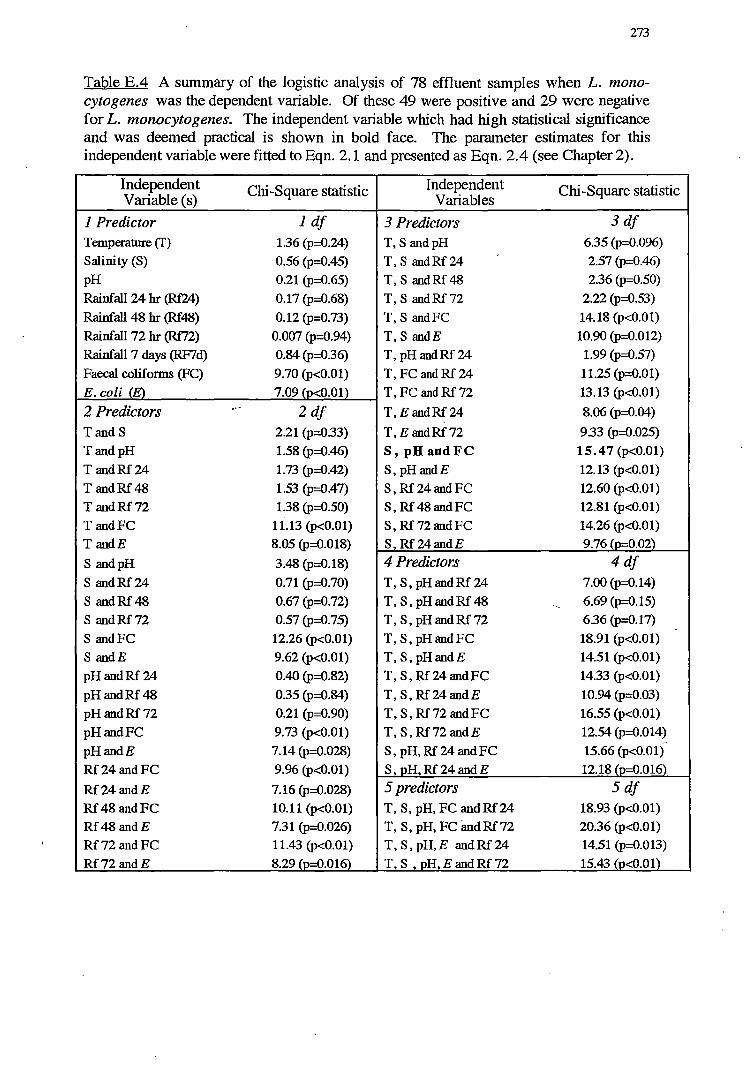
273
Table E.4 A summary of the logistic analysis of 78 effluent samples when L. monocytogenes was the dependent variable. Of these 49 were positive and 29 were negative for L. monocytogenes. The independent variable which had high statistical significance and was deemed practical is shown in bold face. The parameter estimates for this independent variable were fitted to Eqn. 2.1 and presented as Eqn. 2.4 (see Chapter 2).
Independent Chi-Square statistic Independent Chi-Square statistic Variable (s) Variables
1 Predictor 1 df 3 Predictors 3df Temperature (T) 1.36 (p=0.24) T, Sand pH 6.35 {p=0.096)
Salinity (S) 0.56 (p=0.45) T, S andRf24 2.57 (p=0.46)
pH 0.21 (p=0.65) T, Sand Rf 48 2.36 (p=0.50)
Rainfall 24 hr (Rf24) 0.17 (p=0.68) T, S andRf72 2.22 (p=0.53)
Rainfall 48 hr (Rf 48) 0.12 (p=0.73) T, S andFC 14.18 (p<0.01)
Rainfall 72 hr (Rf72) 0.007 (p=0.94) T, S andE 10.90 (p=0.012)
Rainfall 7 days (RF7d) 0.84 (p=0.36) T, pHandRf24 1.99 (p=0.57)
Faecal coliforms (FC) 9.70 (p<0.01) T, FC and Rf 24 11.25 (p=0.01)
E.coli (E\ 7.09 (o<0.01) T, FC and Rf 72 13.13 (p<0.01)
2 Predictors ... 2df T, E andRf24 8.06 {p=0.04)
TandS 2.21 (p=0.33) T,EandRf72 933 (p=0.025)
TandpH 1.58 (p=0.46) S, pH andFC 15.47 (p<0.01)
T andRf24 1.73 (p=0.42) S, pHandE 12.13 (p<0.01)
T andRf48 1.53 (p--0.47) S, Rf 24andFC 12.60 (p<0.01)
T andRf72 1.38 (p=0.50) S, Rf 48 andFC 12.81 (p<0.01)
T andFC 11.13 (p<0.01) S, Rf72 andFC 14.26 (p<0.01)
TandE 8.05 (p=0.018) S,Rf24andE 9.76 fo=0.02)
S andpH 3.48 (p=0.18) 4 Predictors 4df S andRf24 0.71 (p=0.70) T, S, pHandRf24 7.00 {p=0.14)
S andRf48 0.67 (p=0.72) T, S, pHandRf48 ~
6.69 {p=0.15)
S andRf72 0.57 (p=0.75) T, S, pHandRf72 6.36 (p=0.17)
S andFC 12.26 (p<0.01) T, S, pH and FC 18.91 (p<0.01)
S andE 9.62 (p<0.01) T, S, pHandE 14.51 (p<0.01)
pHandRf24 0.40 (p=0.82) T, S, Rf24andFC 14.33 (p<0.01)
pHandRf48 0.35 (p=0.84) T, S, Rf24 andE 10.94 (p=0.03)
pHandRf72 0.21 (p=0.90) T, S, Rf72andFC 16.55 (p<0.01)
pHandFC 9.73 (p<0.01) T, S, Rf72 andE 12.54 (p=0.014)
pHandE 7.14 (p=0.028) S, pH,Rf24andFC 15.66 (p<0.01)
Rf24andFC 9.96 (p<0.01) S, oH,Rf24andE 12.18 (o=0.016)
Rf24andE 7.16 (p=0.028) 5 predictors 5df Rf48andFC 10.11 (p<0.01) T, S, pH, FC andRf24 18.93 (p<0.01)
Rf48andE 7.31 (p=0.026) T, S, pH, FC andRf72 20.36 (p<0.01)
Rf72andFC 11.43 (p<0.01) T, S, pH, E and Rf 24 14.51 {p=0.013)
Rf72andE 8.29 (o=0.016) T, S , oH, E and Rf 72 15.43 (o<0.01)
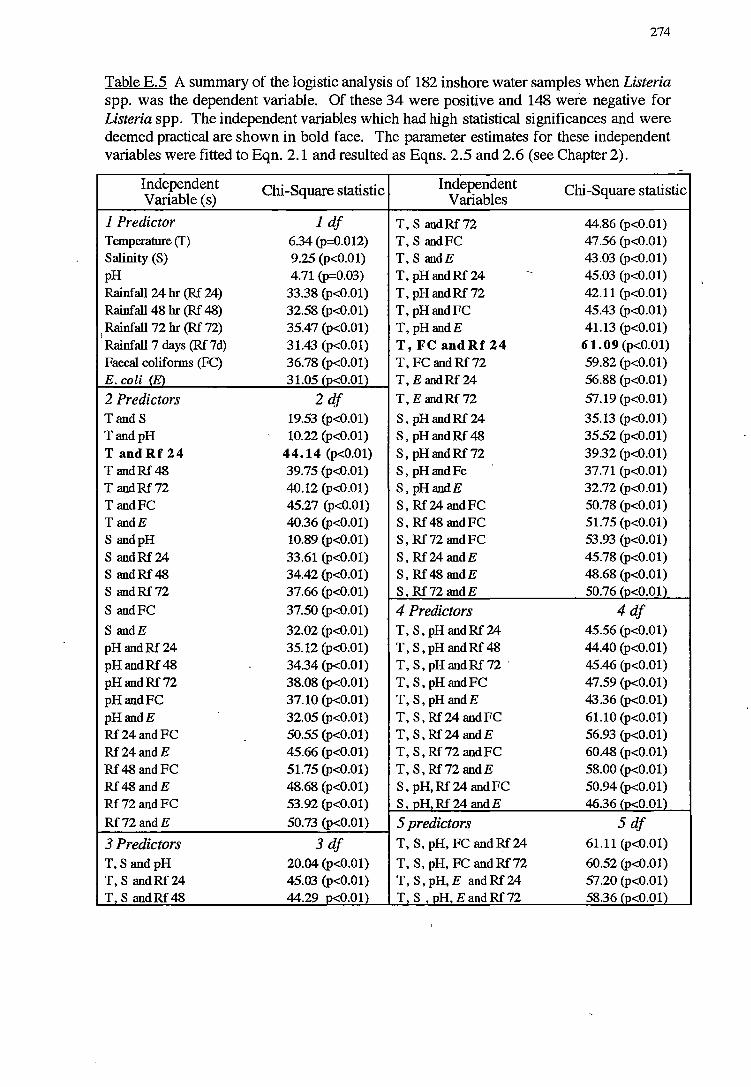
t
274
Table E.5 A summary of the logistic analysis of 182 inshore water samples when Listeria spp. was the dependent variable. Of these 34 were positive and 148 were negative for Listeria spp. The independent variables which had high statistical significances and were deemed practical are shown in bold face. The parameter estimates for these independent variables were fitted to Eqn. 2.1 and resulted as Eqns. 2.5 and 2.6 (see Chapter 2).
-
Independent Chi-Square statistic Independent Chi-Square statistic Variable (s) Variables
1 Predictor 1 df T, S andRf72 44.86 (p<0.01) Temperature (T) 6.34 (p=0.012) T, S andFC 47.56 (p<0.01) Salinity (S) 9.25 (p<0.01) T, S andE 43.03 (p<0.01) pH 4.71 (p=0.03) T, pH and Rf 24 - 45.03 (p<0.01) Rainfall 24 hr (Rf 24) 33.38 (p<0.01) T, pHandRf72 42.11 (p<0.01) Rainfall 48 hr (Rf 48) 32.58 (p<0.01) T,pHandFC 45.43 (p<0.01) Rainfall 72hr(Rf72) 35.47 (p<0.01) T,pHandE 41.13 (p<0.01) Rainfall 7 days (Rf 7d) 31.43 (p<0.01) T, FC and Rf 24 61.09 (p<0.01) Faecal coliforms (FC) 36.78 (p<0.01) T, FC andRf72 59.82 (p<0.01) E.coli (E) 31.05 (p<0.01) T, E andRf24 56.88 (p<0.01)
2 Predictors 2df T, E andRf72 57.19 (p<0.01)
TandS 19.53 (p<0.01) S, pHandRf24 35.13 (p<0.01) TandpH 10.22 (p<0.01) S, pH and Rf 48 35.52 (p<0.01) T and Rf 24 44.14 (p<0.01) S, pHandRf72 39.32 (p<0.01) T andRf48 39.75 (p<0.01) S, pHandFc 37.71 (p<0.01) T andRf72 40.12 (p<0.01) S, pHandE 32.72 (p<0.01) T andFC 45.27 (p<0.01) S, Rf24 andFC 50.78 (p<0.01) TandE 40.36 (p<0.01) S, Rf 48 andFC 51.75 (p<0.01) S andpH 10.89 (p<0.01) S, Rf72 andFC 53.93 (p<0.01) S andRf24 33.61 (p<0.01) S, Rf24andE 45.78 (p<0.01) S andRf48 34.42 (p<0.01) S, Rf48 andE 48.68 (p<0.01) S andRf72 37.66 (p<0.01) S, Rf72andE 50.76 (p<0.01)
S andFC 37.50 (p<0.01) 4 Predictors 4df S andE 32.02 (p<0.01) T, S, pH andRf24 45.56 (p<0.01) pHandRf24 35.12 (p<0.01) T, S,pHandRf 48 44.40 (p<0.01) pHandRf48 34.34 (p<0.01) T, S, pH andRf72 · 45.46 (p<0.01) pHandRf72 38.08 (p<0.01) T, S, pH and FC 47.59 (p<0.01) pHandFC 37.10 (p<0.01) T, S,pHandE 43.36 (p<0.01) pHandE 32.05 (p<0.01) T, S, Rf24 andFC 61.10 (p<0.01) Rf24andFC - 50.55 (p<0.01) T, S, Rf24 andE 56.93 (p<0.01) Rf24andE 45.66 (p<0.01) T, S, Rf72 andFC 60.48 (p<0.01) Rf48andFC 51.75 (p<0.01) T, S, Rf72 andE 58.00 (p<0.01) Rf48andE 48.68 (p<0.01) S, pH,Rf24 andFC 50.94 (p<0.01) Rf72andFC 53.92 (p<0.01) S, PH,Rf24 andE 46.36 (p<0.01)
Rf72andE 50.73 (p<0.01) 5 predictors 5 df
3 Predictors 3df T, S, pH, FC and~24 61.11 (p<0.01)
T,S and pH 20.04 (p<0.01) T, S, pH, FC andRf72 60.52 (p<0.01) T, S andRf24 45.03 (p<0.01) T, S, pH, E andRf24 57.20 (p<0.01) T, S andRf48 44.29 0<0.01) T, S , pH, E and Rf 72 58.36 (p<0.01)
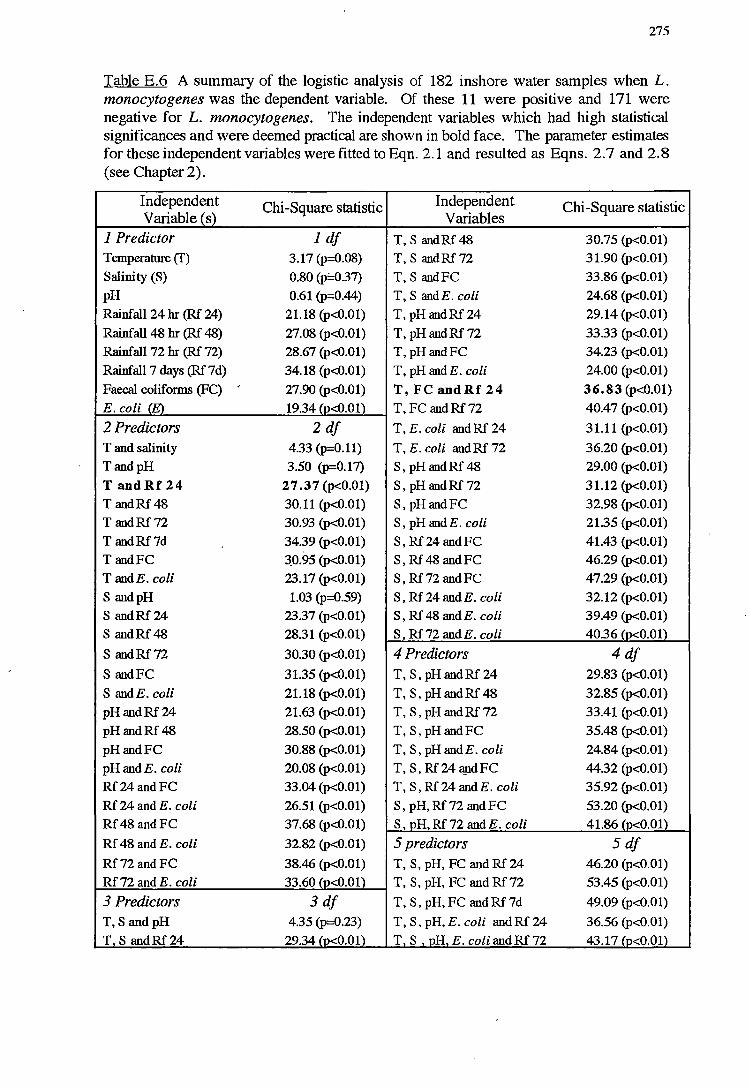
275
Table E.6 A summary of the logistic analysis of 182 inshore water samples when L. monocytogenes was the dependent variable. Of these 11 were positive and 171 were negative for L. monocytogenes. The independent variables which had high statistical significances and were deemed practical are shown in bold face. The parameter estimates for these independent variables were fitted to Eqn. 2.1 and resulted as Eqns. 2.7 and 2.8 (see Chapter 2).
Independent Chi-Square statistic Independent Chi-Square statistic Variable (s) Variables
I Predictor 1 df T, S andRf 48 30.75 (p<0.01) Temperature (T) 3.17 (p=0.08) T, S andRf72 31.90 (p<0.01)
Salinity (S) 0.80 (p=0.37) T, S andFC 33.86 (p<0.01) pH 0.61 (p=0.44) T, S andE. coli 24.68 (p<0.01) Rainfall 24 hr (Rf 24) 21.18 (p<0.01) T, pH and Rf 24 29.14 (p<0.01)
Rainfall 48 hr (Rf 48) 27.08 (p<0.01) T, pHandRf72 33.33 (p<0.01) Rainfall 72hr(Rf72) 28.67 (p<0.01) T, pHandFC 34.23 (p<0.01) Rainfall? days (Rf7d) 34.18 (p<0.01) T, pH and E.coli 24.00 (p<0.01)
Faecal colifonns (FC) 27.90 (p<0.01) T, FC andRf 24 36.83 (p<0.01) E.coli (El 19.34 (p<0.01) T, FC andRf72 40.47 (p<0.01)
2 Predictors 2df T, E.coli andRf 24 31.11 (p<0.01)
T and salinity 4.33 (p=0.11) T, E.coli andRf 72 36.20 (p<0.01) TandpH 3.50 (p=0.17) S, pH and Rf 48 29.00 (p<0.01)
T and Rf 24 2 7 .37 (p<0.01) S, pH and Rf 72 31.12 (p<0.01) T andRf48 30.11 (p<0.01) S, pH andFC 32.98 (p<0.01)
T andRf72 30.93 (p<0.01) S, pH and E.coli 21.35 (p<0.01)
T andRf7d 34.39 (p<0.01) S, Rf24 andFC 41.43 (p<0.01) TandFC 3_0.95 (p<0.01) S, Rf 48 andFC 46.29 (p<0.01) T and E.coli 23.17 (p<0.01) S, Rf72 andFC 47.29 (p<0.01)
S andpH 1.03 (p=0.59) S, Rf 24 and E. coli 32.12 (p<0.01) S andRf24 23.37 (p<0.01) S, Rf 48 and E. coli 39.49 (p<0.01) S andRf48 28.31 (p<0.01) S, Rf 72 and E.coli 40.36 (p<0.01)
S andRf72 30.30 (p<0.01) 4 Predictors 4df S andFC 31.35 (p<0.01) T, S, pHandRf24 29.83 (p<0.01)
S and E.coli 21.18 (p<0.01) T, S, pH and Rf 48 32.85 (p<0.01)
pHandRf24 21.63 (p<0.01) T, S, pH and Rf 72 33.41 (p<0.01)
pHandRf48 28.50 (p<0.01) T, S, pH and FC 35.48 (p<0.01)
pHandFC 30.88 (p<0.01) T, S, pH and E.coli 24.84 (p<0.01) pHandE. coli 20.08 (p<0.01) T, S, Rf24~dFC 44.32 (p<0.01) Rf24andFC 33.04 (p<0.01) T, S, Rf24 and E.coli 35.92 (p<0.01) Rf 24 and E. coli 26.51 (p<0.01) S, pH, Rf72 andFC 53.20 (p<0.01) Rf48andFC 37.68 (p<0.01) S, pH,Rf72 and E.coli 41.86 (P<0.01)
Rf 48 and E. coli 32.82 (p<0.01) 5 predictors 5df Rf72andFC 38.46 (p<0.01) T, S, pH, FC andRf24 46.20 (p<0.01) Rf 72 and E. coli 33.60 (p<0.01) T, S, pH, FC andRf72 53.45 (p<0.01)
3 Predictors 3df T, S, pH, FC and Rf 7d 49.09 (p<0.01)
T,S and pH 4.35 (p=0.23) T, S, pH, E.coli andRf24 36.56 (p<0.01)
T S andRf24 29.34 (o<0.01) T S . oH. E.coli and Rf 72 43.17 fo<0.01)
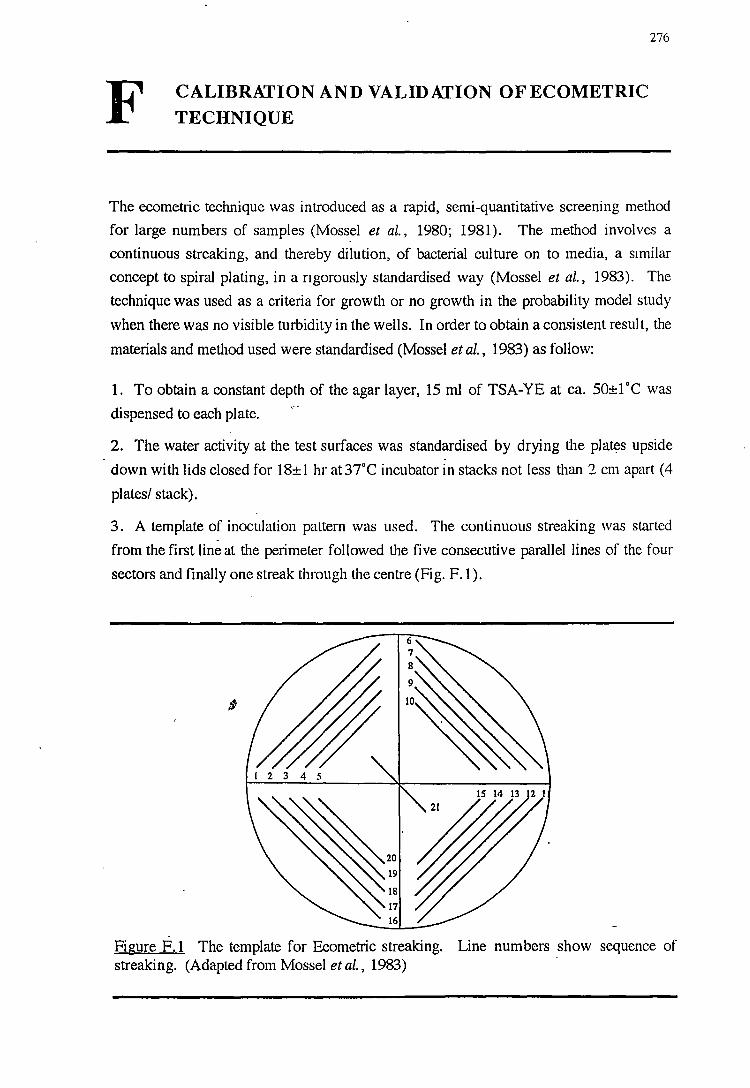
F CALIBRATION AND VALIDATION OFECOMETRIC TECHNIQUE
276
The ecometric technique was introduced as a rapid, semi-quantitative screening method
for large numbers of samples (Mossel et al., 1980; 1981). The method involves a
continuous streaking, and thereby dilution, of bacterial culture on to media, a similar
concept to spiral plating, in a ngorously standardised way (Mossel et al., 1983). The
technique was used as a criteria for growth or no growth in the probability model study
when there was no visible turbidity in the wells. In order to obtain a consistent result, the
materials and method used were standardised (Mossel et al., 1983) as follow:
1. To obtain a constant depth of the agar layer, 15 ml of TSA-YE at ea. 50±1°C was
dispensed to each plate.
2. The water activity at the test surfaces was standardised by drying the plat~s upside
down with lids closed for 18±1 hr at37°C incubator in stacks not less than 2 cm apart (4
plates/ stack).
3. A template of inoculation pattern was used. The continuous streaking was started
from the first line at the perimeter followed the five consecutive parallel lines of the four
sectors and finally one streak through the centre (Fig. F.1 ).
Figure F.1 The template for Ecometric streaking. Line numbers show sequence of streaking. (Adapted from Mossel et al., 1983)
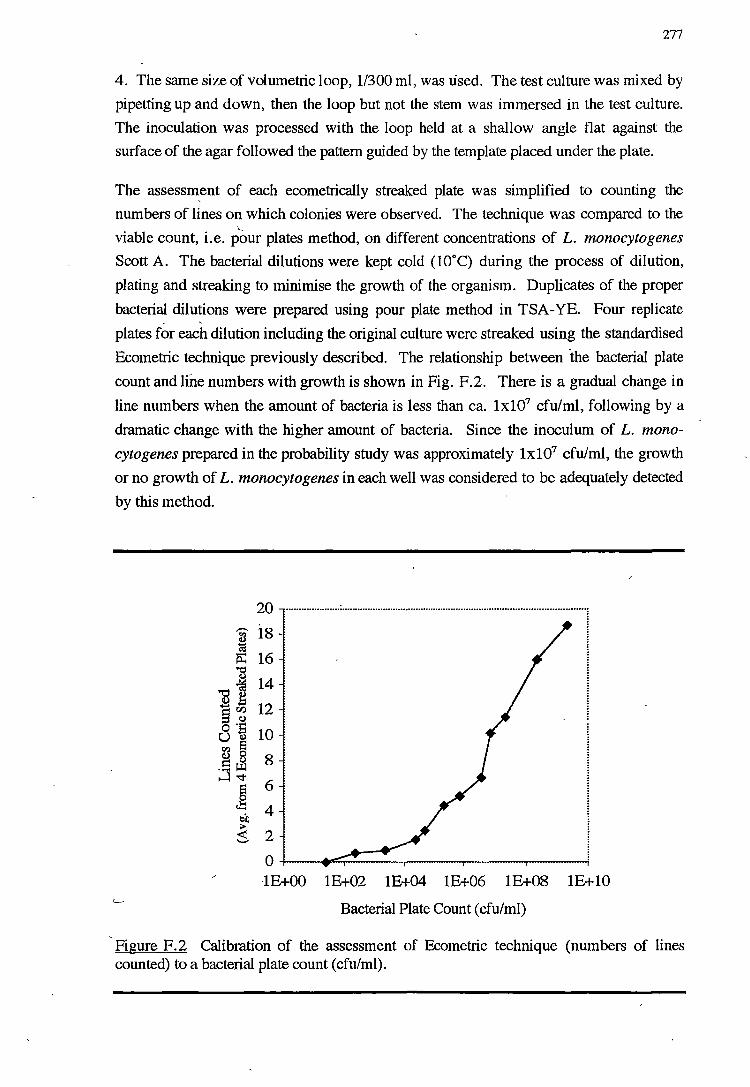
277
4. The same size of volumetric loop, 1/300 ml, was used. The test culture was mixed by
pipetting up and down, then the loop but not the stem was immersed in the test culture.
The inoculation was processed with the loop held at a shallow angle flat against the
surf ace of the agar followed the pattern guided by the template placed under the plate.
The assessm_ent of each ecometrically streaked plate was simplified to counting the
numbers of lines on which colonies were observed. The technique was compared to the \...
viable count, i.e. pour plates method, on different concentrations of L. monocytogenes
Scott A. The bacterial dilutions were kept cold (l0°C) during the process of dilution,
plating and streaking to minimise the growth of the organism. Duplicates of the proper
bacterial dilutions were prepared using pour plate method in TSA-YE. Four replicate
plates for each dilution including the original culture were streaked using the standardised
Ecometric technique previously described. The relationship between -the bacterial plate
count and lfo.e numbers with growth is shown in Fig. F.2. There is a gradual change in
line numbers when the amount of bacteria is less than ea. lxl07 cfu/ml, following by a
dramatic change with the higher amount of bacteria. Since the inoculum of L. mono
cytogenes prepared in the probability study was approximately lxl07 cfu/ml, the growth
or no growth of L. monocytogenes in each well was considered to be adequately detected
by this method.
20 ................................................................................................................... .
1E+OO 1E+02 1E+04 1E+06 1E+08 lE+ 10
Bacterial Plate Count ( cfu/ml)
Figure F.2 Calibration of the assessment of Ecometric technique (numbers of lines counted) to a bacterial plate count (cfu/ml).
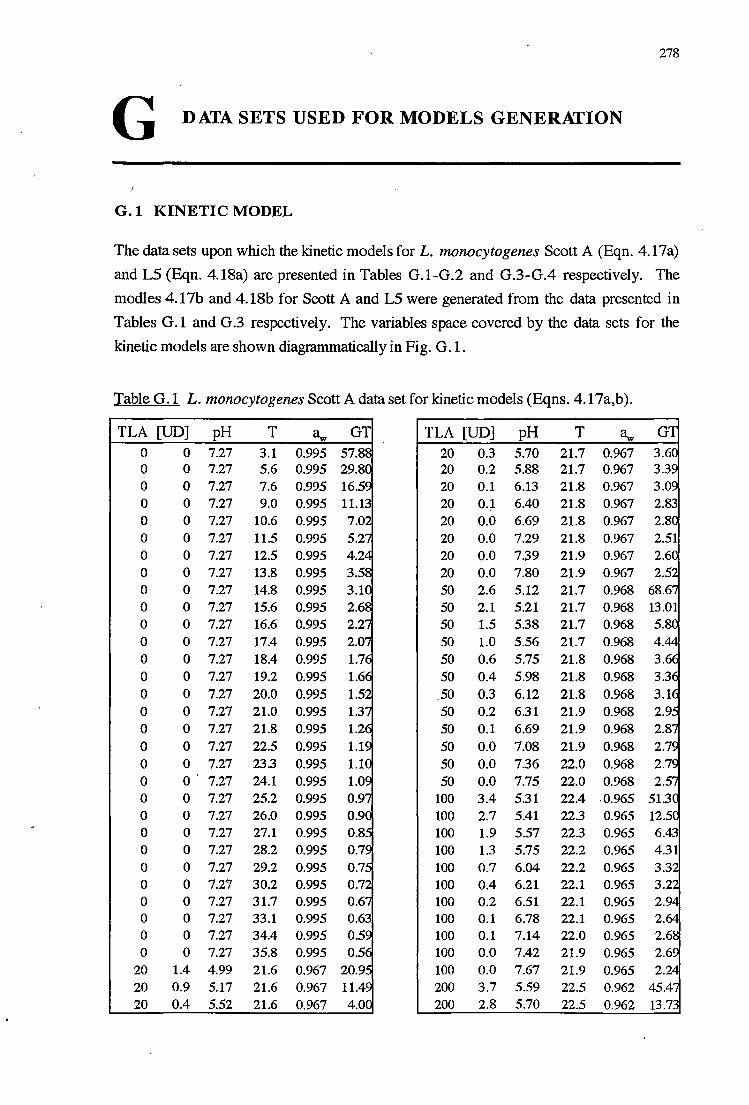
278
G DATA SETS USED FOR MODELS GENERXl'ION
G.1 KINETIC MODEL
The data sets upon which the kinetic models for L. monocytogenes Scott A (Eqn. 4. l 7a)
and LS (Eqn. 4.18a) are presented in Tables G.1-G.2 and G.3-G.4 respectively. The
modles 4. l 7b and 4.18b for Scott A and LS were generated from the data presented in
Tables G.1 and G.3 respectively. The variables space covered by the data sets for the
kinetic models are shown diagrammatically in Fig. G. 1.
Table G.1 L. monocytogenes Scott A data set for kinetic models (Eqns. 4. l 7a,b).
TLA [UD] pH T 0 0 0 0 0 0 0 0 0 0 0 0 0 0 0 0 0 0 0 0 0 0 0 0 0 0 0 0 0 0
20 20 20
0 7.27 0 7.27 0 7.27 0 7.27 0 7.27
3.1 0.995 57.8 5.6 0.995 29.8 7.6 0.995 16.5 9.0 0.995
10.6 0.995 0 7.27 11.5 0.995 5.2 0 7.27 12.5 0.995 4.2 0 7.27 13.8 0.995 3.5 0 7.27 14.8 0.995 3.1 0 7.27 15.6 0.995 2.6 0 7.27 16.6 0.995 2.2 0 7.27 17.4 0.995 2.0 0 7.27 18.4 0.995 1.7 0 7.27 19.2 0.995 1.6 0 7.27 20.0 0.995 1.5 0 7.27 21.0 0.995 1.3 0 7.27 21.8 0.995 1.2 0 7.27 22.5 0.995 1.1 0 7.27 23.3 0.995 1.1 0 7.27 24.l 0.995 1.0 0 7.27 25.2 0.995 0.9 0 7.27 26.0 0.995 0.9 0 7.27 27.1 0.995 0.8 0 7.27 28.2 0.995 0.7 0 7.27 29.2 0.995 0.7 0 7.27 30.2 0.995 0.7 0 7.27 31.7 0.995 0.6 0 7.27 0 7.27 0 7.27
1.4 4.99 0.9 5.17 0.4 5.52
33.1 0.995 34.4 0.995 35.8 0.995 21.6 0.967 21.6 0.967 21.6 0.967 4.0
TLA [UD] pH T 20 20 20 20 20
0.3 5.70 21.7 0.967 0.2 5.88 21.7 0.967 0.1 6.13 21.8 0.967 0.1 6.40 21.8 0.967 0.0 6.69 21.8 0.967
20 0.0 7.29 21.8 0.967 20 0.0 7.39 21.9 0.967 20 0.0 7.80 21.9 0.967 50 2.6 5.12 21.7 0.968 50 2.1 5.21 21.7 0.968 50 1.5 5.38 21.7 0.968 50 1.0 5.56 21.7 0.968 4. 50 0.6 5.75 21.8 0.968 50 0.4 5.98 21.8 0.968
_50 0.3 6.12 21.8 0.968 50 0.2 6.31 21.9 0.968 50 0.1 6.69 21.9 0.968 50 0.0 7.08 21.9 0.968 50 0.0 7.36 22.0 0.968 50 0.0 7.75 22.0 0.968
100 3.4 5.31 22.4 ,0.965 100 2.7 5.41 22.3 0.965 100 1.9 5.57 22.3 0.965 100 1.3 5.75 22.2 0.965 100 0.7 6.04 22.2 0.965 100 0.4 6.21 22.1 0.965 100 0.2 6.51 22.1 0.965 100 100 100 100 200 200
0.1 6.78 0.1 7.14 0.0 7.42 0.0 7.67 3.7 5.59 2.8 5.70
22.1 0.965 22.0 0.965 21.9 0.965 21.9 0.965 22.5 0.962 22.5 0.962
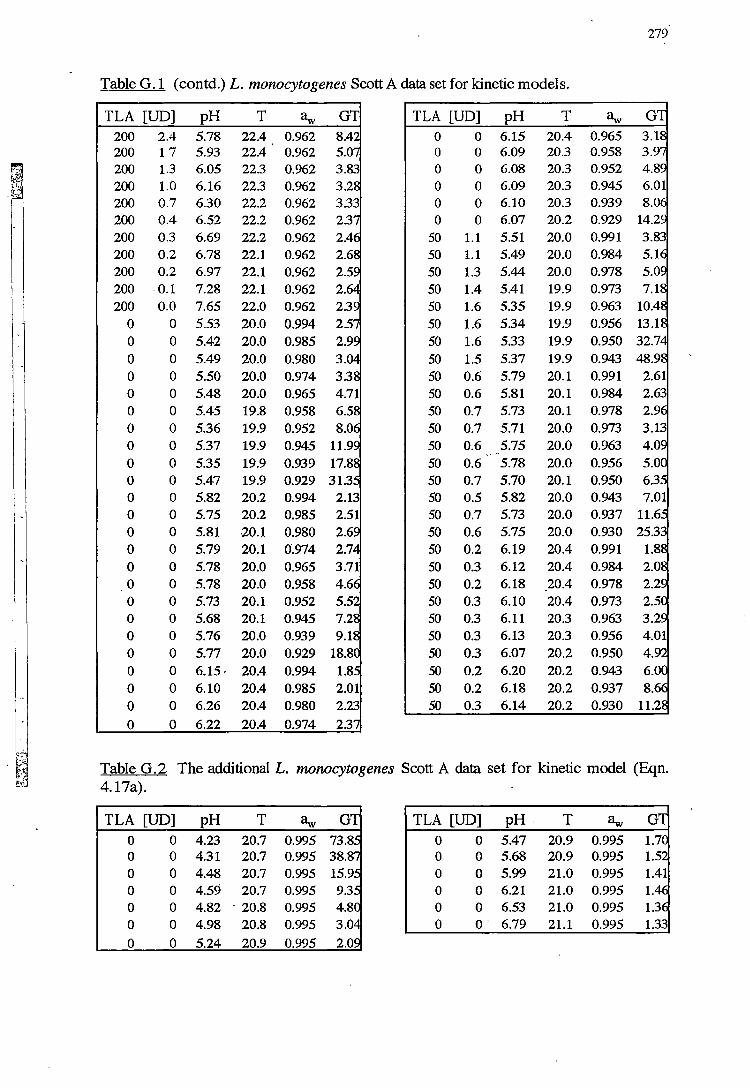
Table G .1 (contd.) L. monocytogenes Scott A data set for kinetic models.
TLA [UD] pH T ~ GT 200 2.4 5.78 22.4 0.962 200 1 7 5.93 22.4 0.962 200 1.3 6.05 22.3 0.962 200 1.0 6.16 22.3 0.962 200 0.7 6.30 200 0.4 6.52 200 0.3 6.69 200 0.2 6.78 200 0.2 6.97 200 -0.1 7.28 200 0.0 7.65
0 0 5.53 0 0 5.42 0 0 5.49 0 0 5.50
0 0 5.48 0 0 5.45 0 0 5.36
0 0 5.37 0 0 5.35 0 0 5.47 0 0 5.82 0 0 5.75 0 0 5.81 0 0 5.79 0 0 5.78 0 0 5.78 0 0 5.73
22.2 0.962 22.2 0.962 22.2 0.962 22.1 0.962 22.l 0.962 22.1 0.962 22.0 0.962 20.0 0.994 20.0 0.985 20.0 0.980 20.0 0.974 20.0 0.965 19.8 0.958 19.9 0.952 19.9 0.945 19.9 0.939 19.9 0.929 20.2 0.994 20.2 0.985 -20.1 0.980 20.1 0:974 20.0 0.965 20.0 0.958 20.l 0.952
0 0 0 0 0 0
0 5.68 20.l 0.945 0 5.76 20.0 0.939 9.1 0 5.77 20.0 0.929 0 6.15. 20.4 0.994 0 6.10 20.4 0.985 2.01 0 6.26 20.4 0.980 2.23
0 0 6.22 20.4 0.974 2.3
TLA [UD] pH T 0 0 0 0 0 0
50 50 50 50 50
50 50
50 50 50 50 50 50 50 50 50 50 50 50 50 50 50
0 6.15 20.4 0.965 0 6.09 20.3 0.958 0 6.08 20.3 0.952 0 6.09 20.3 0.945 0 6.10 0 6.07
1.1 5.51 1.1 5.49 1.3 5.44 1.4 5.41 1.6 5.35
1.6 5.34 1.6 5.33 1.5 5.37 0.6 5.79 0.6 5.81 0.7 5.73 0.7 5.71 0.6 5.75 0.6 5.78 0.7 5.70 0.5 5.82 0.7 5.73 0.6 5.75 0.2 6.19 0.3 6.12 0.2 6.18 0.3 6.10
20.3 0.939 20.2 0.929 20.0 0.991 20.0 0.984 20.0 0.978 19.9 0.973 19.9 0.963 19.9 0.956 19.9 0.950
19.9 0.943 20.1 0.991 20.1 0.984 20.1 0.978 20.0 0.973 20.0 0.963 20.0 0.956 20.1 0.950 20.0 0.943 20.0 0.937 20.0 0.930 20.4 0.991 20.4 0.984 20.4 0.978 20.4 0.973
50 0.3 6.11 20.3 0.963 50 0.3 6.13 20.3 0.956 50 0.3 6.07 20.2 0.950
50 0.2 6.20 20.2 0.943 50 0.2 6.18 20.2 0.937 50 0.3 6.14 20.2 0.930
Table G.2 The additional L. monocytogenes Scott A data set for kinetic model (Eqn. 4.17a).
TLA [UD] pH T 0 0 0 0 0 0 0
0 4.23 20.7 0.995 0 4.31 20.7 0.995 0 4.48 20.7 0.995 0 4.59 20.7 0.995 0 4.82 - 20.8 0.995 0 4.98 20.8 0.995
0 5.24 20.9 0.995
TLA [UD] pH - T 0 0 0 0 0 0
0 5.47 20.9 0.995 0 5.68 20.9 0.995 0 5.99 21.0 0.995 0 6.21 21.0 0.995 0 6.53 21.0 0.995 0 ' 6.79 21.1 0.995 1.33
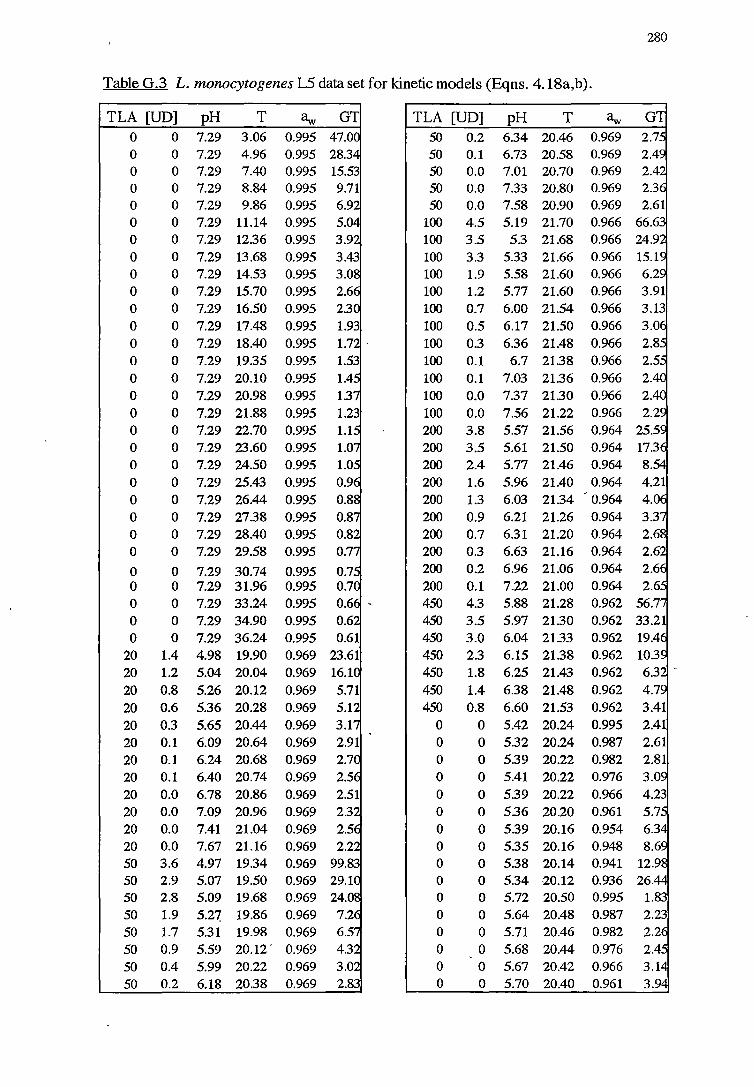
280
Table G.3 L. monocytogenes L5 data set for kinetic models (Eqns. 4.18a,b).
TLA [UD] pH T <lw GT 0 0 0 0 0 0 0 0 0 0 0 0 0 0 0 0 0 0 0 0 0 0 0 0 0
0 7.29 3.06 0.995 47.0 0 7.29 4.96 0.995 28.3 0 7.29 7.40 0.995 0 7.29 8.84 0.995 0 7.29 9.86 0.995 0 7.29 11.14 0.995 5.0 0 7.29 12.36 0.995 3.9 0 7.29 13.68 0.995 0 7.29 14.53 0.995 3.0 0 7.29 15.70 0.995 2.6 0 7.29 16.50 0.995 2.3 0 7.29 17.48 0.995 0 7.29 18.40 0.995 0 7.29 19.35 0.995 0 7.29 20.10 0.995 1.4 0 7.29 20.98 0.995 0 7.29 21.88 0.995 0 7.29 22.70 0.995 1.1 0 7.29 23.60 0.995 1.0 0 7.29 24.50 0.995 1.0 0 7.29 25.43 0.995 0.9 0 7.29 26.44 0.995 0.8 0 7.29 27.38 0.995 0.8 0 7.29 28.40 0.995 0.8 0 7.29 29.58 0.995 0.7
0 0 7.29 30.74 0.995 0.7 0 0 7.29 31.96 0.995 0.7 0 0, 7.29 33.24 0.995 0.6 -0 0 7.29 34.90 0.995 0.6 0 0 7.29 36.24 0.995
20 1.4 4.98 19.90 0.969 23.61 20 1.2 5.04 20.04 0.969 16.1 20 0.8 5.26 20.12 0.969 20 0.6 5.36 20.28 0.969 5.1 20 0.3 5.65 20.44 0.969 3.1 20 0.1 6.09 20.64 0.969 20 0.1 6.24 20.68 0.969 2.7 20 0.1 6.40 20.74 0.969 2.5 20 0.0 6.78 20.86 0.969 20 0.0 7.09 20.96 0.969 2.3 20 0.0 7.41 21.04 0.969 2.5 20 0.0 7.67 21.16 0.969 50 3.6 4.97 19.34 0.969 50 2.9 5.07 19.50 0.969 29.1 50 2.8 5.09 19.68 0.969 50 1.9 5.27, 19.86 0.969 50 1.7 5.31 19.98 0.969 6.5 50 0.9 5.59 20.12, 0.969 4.3 50 0.4 5.99 20.22 0.969 3.0 50 0.2 6.18 20.38 0.969 2.83
TLA [UD] pH T 50 0.2 6.34 20.46 0.969 50 0.1 6.73 20.58 0.969 50 0.0 7.01 20.70 0.969 50 0.0 7.33 20.80 0.969 50 0.0 7.58 20.90 0.969
100 4.5 5.19 21.70 0.966 100 3.5 5.3 21.68 0.966 100 3.3 5.33 21.66 0.966 100 1.9 5.58 21.60 0.966 100 1.2 5.77 21.60 0.966 100 0.7 6.00 21.54 0.966 100 0.5 6.17 21.50 0.966 100 0.3 6.36 21.48 0.966 100 0.1 6.7 21.38 0.966 100 0.1 7.03 21.36 0.966 2. 100 0.0 7.37 21.30 0.966 2. 100 0.0 7.56 21.22 0.966 200 3.8 5.57 21.56 0.964 200 3.5 5.61 21.50 0.964 200 2.4 5.77 21.46 0.964 8. 200 1.6 5.96 21.40 0.964 200 1.3 6.03 21.34 0.964 200 0.9 6.21 21.26 0.964 200 0.7 6.31 21.20 0.964 200 0.3 6.63 21.16 0.964 200 0.2 6.96 21.06 0.964 200 0.1 7.22 21.00 0.964 450 4.3 5.88 21.28 0.962 450 3.5 5.97 21.30 0.962 450 3.0 6.04 21.33 0.962 450 2.3 6.15 21.38 0.962 450 1.8 6.25 21.43 0.962 450 1.4 6.38 21.48 0.962 450 0.8 6.60 21.53 0.962 3.41
0 0 5.42 20.24 0.995 2.41 0 0 0 0 0 0 0 0 0 0 0 0 0 0 0
0 5.32 20.24 0.987 2.61 0 5.39 20.22 0.982 0 5.41 20.22 0.976 0 5.39 20.22 0.966 0 5.36 20.20 0.961 0 5.39 20.16 0.954 0 5.35 20.16 0.948 0 5.38 20.14 0.941 0 5.34 20.12 0.936 26. 0 5.72 20.50 0.995 0 5.64 20.48 0.987 0 5.71 20.46 0.982 0 5.68 20.44 0.976 0 5.67 20.42 0.966 0 5.70 20.40 0.961 3.9
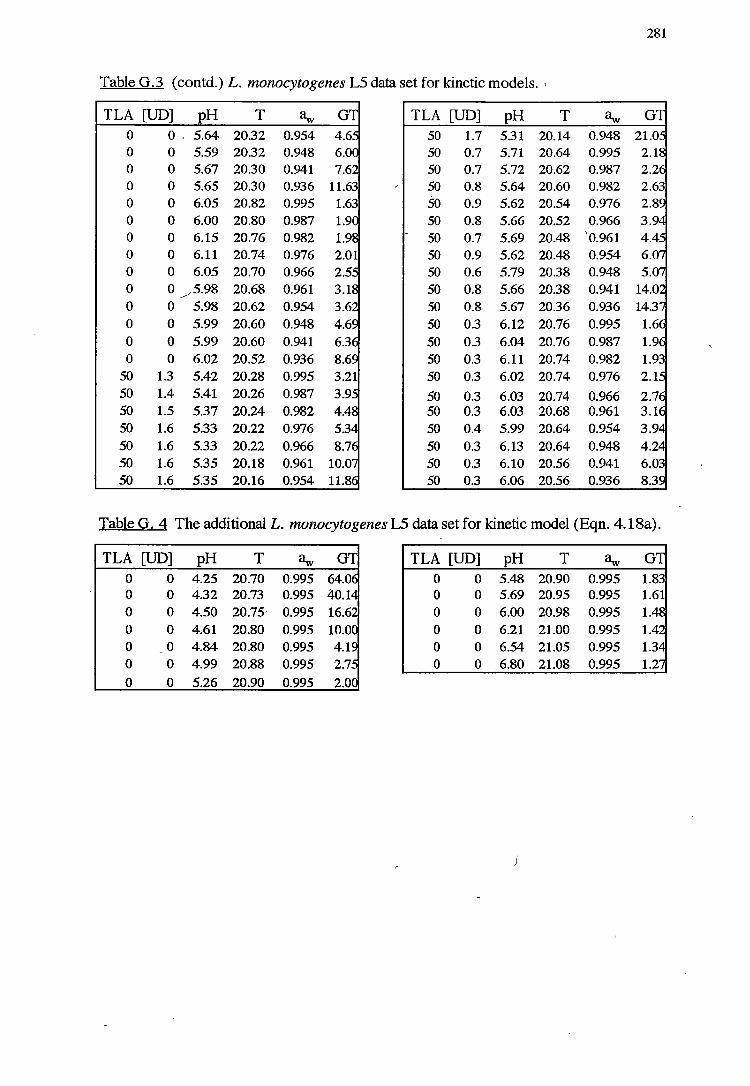
281
Table G.3 (contd.) L. monocytogenes LS data set for kinetic models. ,
TLA [UD] pH T ~ TLA [UD] pH T ~ G 0 0, 5.64 20.32 0.954 50 1.7 5.31 20.14 0.948 0 0 5.59 20.32 0.948 50 0.7 5.71 20.64 0.995 0 0 5.67 20.30 0.941 50 0.7 5.72 20.62 0.987 0 0 5.65 20.30 0.936 50 0.8 5.64 20.60 0.982 0 0 6.05 20.82 0.995 so 0.9 5.62 20.54 0.976 0 0 6.00 20.80 0.987 50 0.8 5.66 20.52 0.966 0 0 6.15 20.76 0.982 50 0.7 5.69 20.48 '0.961 0 0 6.11 20.74 0.976 50 0.9 5.62 20.48 0.954 0 0 6.05 20.70 0.966 50 0.6 5.79 20.38 0.948 0 0 /5.98 20.68 0.961 50 0.8 5.66 20.38 0.941 0 0 5.98 20.62 0.954 50 0.8 5.67 20.36 0.936 0 0 5.99 20.60 0.948 50 0.3 6.12 20.76 0.995 0 0 5.99 20.60 0.941 50 0.3 6.04 20.76 0.987 0 0 6.02 20.52 0.936 50 0.3 6.11 20.74 0.982
50 1.3 5.42 20.28 0.995 50 0.3 6.02 20.74 o.976 50 1.4 5.41 20.26 0.987 50 0.3 6.03 20.74 0.966 50 1.5 5.37 20.24 0.982 50 0.3 6.03 20.68 0.961 50 1.6 5.33 20.22 0.976 50 0.4 5.99 20.64 0.954 50 1.6 5.33 20.22 0.966 50 0.3 6.13 20.64 0.948 50 1.6 5.35 20.18 0.961 50 0.3 6.10 20.56 0.941 50 1.6 5.35 20.16 0.954 50 0.3 6.06 20.56 0.936
Table G. 4 The additional L. monocytogenes L5 data set for kinetic model (Eqn. 4.18a).
TLA [UD] pH T ~ TLA [UD] pH T ~ 0 0 4.25 20.70 0.995 0 0 5.48 20.90 0.995 0 0 4.32 20.73 0.995 0 0 5.69 20.95 0.995 0 0 4.50 20.75, 0.995 0 0 6.00 20.98 0.995 0 0 4.61 20.80 0.995 0 0 6.21 21.00 0.995 0 0 4.84 20.80 0.995 0 0 6.54 21.05 0.995 0 0 4.99 20.88 0.995 0 0 6.80 21.08 0.995 0 0 5.26 20.90 0.995
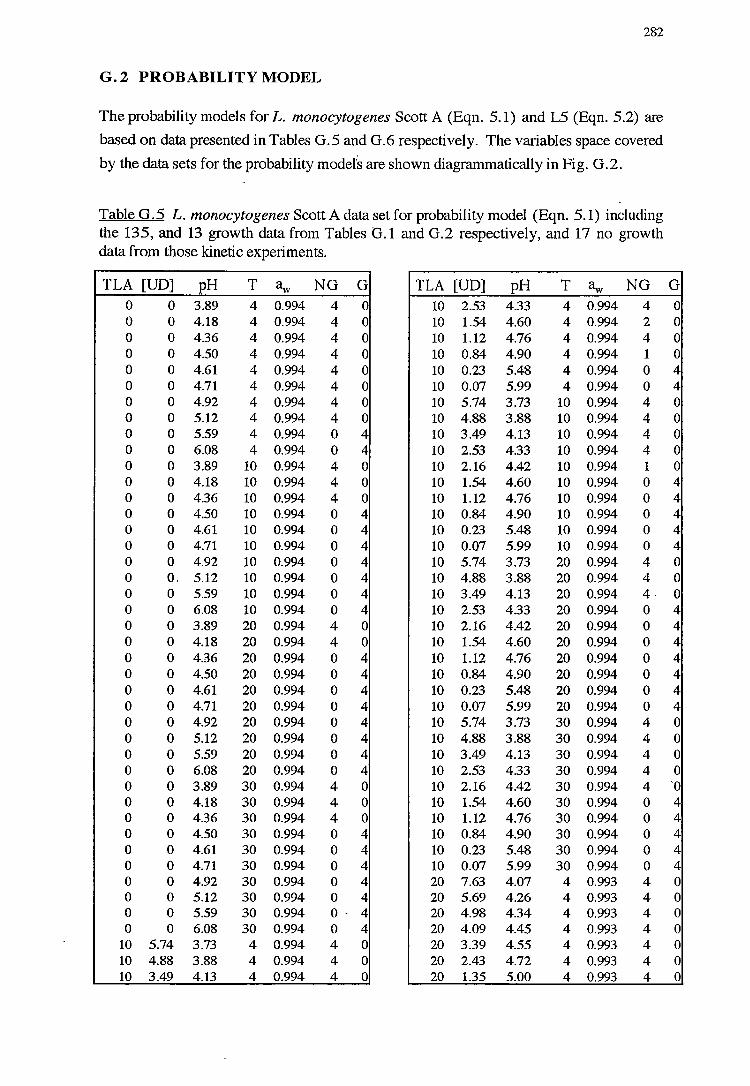
282
G. 2 PROBABILITY MODEL
The probability models for L. monocytogenes Scott A (Eqn. 5.1) and LS (Eqn. 5.2) are
based on data presented in Tables G.5 and G.6 respectively. The variables space covered
by the data sets for the probability models are shown diagrammatically in Fig. G.2.
Table G.5 L. monocytogenes Scott A data set for probability model (Eqn. 5.1) including the 135, and 13 growth data from Tables G.1 and G.2 respectively, and 17 no growth data from those kinetic experiments.
TLA [UD] pH T <lw NG G TLA [UD] pH T <lw NG 0 0 3.89 4 0.994 4 0 10 2.53 4.33 4 0.994 4 0 0 4.18 4 0.994 4 0 10 1.54 4.60 4 0.994 2 0 0 4.36 4 0.994 4 0 10 1.12 4.76 4 0.994 4 0 0 4.50 4 0.994 4 0 10 0.84 4.90 4 0.994 1 0 0 4.61 4 0.994 4 0 10 0.23 5.48 4 0.994 0 0 0 4.71 4 0.994 4 0 10 0.07 5.99 4 0.994 0 0 0 4.92 4 0.994 4 0 10 5.74 3.73 10 0.994 4 0 0 5.12 4 0.994 4 0 10 4.88 3.88 10 0.994 4 0 0 5.59 4 0.994 0 4 10 3.49 4.13 10 0.994 4 0 0 6.08 4 0.994 0 4 10 2.53 4.33 10 0.994 4 0 0 3.89 10 0.994 4 0 10 2.16 4.42 10 0.994 1 0 0 4.18 10 0.994 4 0 10 1.54 4.60 10 0.994 0 0 0 4.36 10 0.994 4 0 10 1.12 4.76 10 0.994 0 0 0 4.50 10 0.994 0 4 10 0.84 4.90 10 0.994 0 0 0 4.61 10 0.994 0 4 10 0.23 5.48 10 0.994 0 0 0 4.71 10 0.994 0 4 10 0.07 5.99 10 0.994 0 0 0 4.92 10 0.994 0 4 10 5.74 3.73 20 0.994 4 0 o. 5.12 10 0.994 0 4 10 4.88 3.88 20 0.994 4 0 0 5.59 10 0.994 0 4 10 3.49 4.13 20 0.994 4-0 0 6.08 10 0.994 0 4 10 2.53 4.33 20 0.994 0 0 0 3.89 20 0.994 4 0 10 2.16 4.42 20 0.994 0 0 0 4.18 20 0.994 4 0 10 1.54 4.60 20 0.994 0 0 0 4.36 20 0.994 0 4 10 1.12 4.76 20 0.994 0 0 0 4.50 20 0.994 0 4 10 0.84 4.90 20 0.994 0 0 0 4.61 20 0.994 0 4 10 0.23 5.48 20 0.994 0 0 0 4.71 20 0.994 0 4 10 0.07 5.99 20 0.994 0 0 0 4.92 20 0.994 0 4 10 5.74 3.73 30 0.994 4 0 0 5.12 20 0.994 0 4 10 4.88 3.88 30 0.994 4 0 0 5.59 20 0.994 0 4 10 3.49 4.13 30 0.994 4 0 0 6.08 20 0.994 0 4 10 2.53 4.33 30 0.994 4 0 0 3.89 30 0.994 4 0 10 2.16 4.42 30 0.994 4 0 0 4.18 30 0.994 4 0 10 1.54 4.60 30 0.994 0 0 0 4.36 30 0.994 4 0 10 1.12 4.76 30 0.994 0 0 0 4.50 30 0.994 0 4 10 0.84 4.90 30 0.994 0 0 0 4.61 30 0.994 0 4 10 0.23 5.48 30 0.994 0 0 0 4.71 30 0.994 0 4 10 0.07 5.99 30 0.994 0 0 0 4.92 30 0.994 0 4 20 7.63 4.07 4 0.993 4 0 0 5.12 30 0.994 0 4 20 5.69 4.26 4 0.993 4 0 0 5.59 30 0.994 0 - 4 20 4.98 4.34 4 0.993 4 0 0 6.08 30 0.994 0 4 20 4.09 4.45 4 0.993 4
10 5.74 3.73 4 0.994 4 0 20 3.39 4.55 4 0.993 4 10 4.88 3.88 4 0.994 4 0 20 2.43 4.72 4 0.993 4 10 3.49 4.13 4 0.994 4 0 20 1.35 5.00 4 0.993 4
G 0 0 0 0 4 4 0 0 0 0 0 4 4 4 4 4 0 0 0 4 4 4 4 4 4 4 0 0 0 0
·o 4 4 4 4 4 0 0 0 0 0 0 0
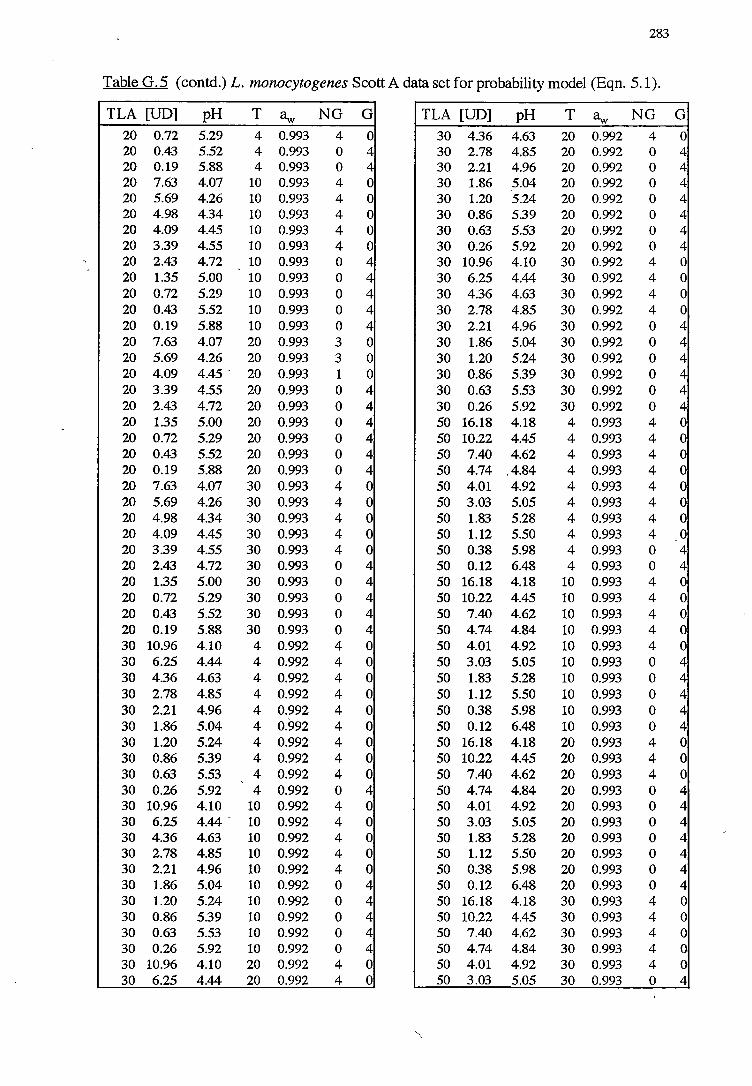
283
Table G.5 (contd.) L. monocytogenes Scott A data set for probability model (Eqn. 5.1).
TLA [UD] pH T <lw NG G TLA [UD] pH T <lw NG G 20 0.72 5.29 4 0.993 4 0 30 4.36 4.63 20 0,992 4 0 20 0.43 5.52 4 0.993 0 4 30 2.78 4.85 20 0.992 0 4 20 0.19 5.88 4 0.993 0 4 30 2.21 4.96 20 0.992 0 4 20 7.63 4.07 10 0.993 4 0 30 1.86 5.04 20 0.992 0 4 20 5.69 4.26 10 0.993 4 0 30 1.20 5.24 20 0.992 0 4 20 4.98 4.34 10 0.993 4 0 30 0.86 5.39 20 0.992 0 4 20 4.09 4.45 10 0.993 4 0 30 0.63 5.53 20 0.992 0 4 20 3.39 4.55 10 0.993 4 0 30 0.26 5.92 20 0.992 0 4 20 2.43 4.72 10 0.993 0 4 30 10.96 4.10 30 0.992 4 0 20 1.35 5.00 10 0.993 0 4 30 6.25 4.44 30 0.992 4 0 20 0.72 5.29 10 0.993 0 4 30 4.36 4.63 30 0.992 4 0 20 0.43 5.52 10 0.993 0 4 30 2.78 4.85 30 0.992 4 0 20 0.19 5.88 10 0.993 0 4 30 2.21 4.96 30 0.992 0 4 20 7.63 4.07 20 0.993 3 0 30 1.86 5.04 30 0.992 0 4 20 5.69 4.26 20 0.993 3 0 30 1.20 5.24 30 0.992 0 4 20 4.09 4.45 - 20 0.993 1 0 30 0.86 5.39 30 0.992 0 4 20 3.39 4.55 20 0.993 0 4 30 0.63 5.53 30 0.992 0 4 20 2.43 4.72 20 0.993 0 4 30 0.26 5.92 30 0.992 0 4 20 1.35 5.00 20 0.993 0 4 50 16.18 4.18 4 0.993 4 0 20 0.72 5.29 20 0.993 0 4 50 10.22 4.45 4 0.993 4 0 20 0.43 5.52 20 0.993 0 4 50 7.40 4.62 4 0.993 4 0 20 0.19 5.88 20 0.993 0 4 50 4.74 .4.84 4 0.993 4 0 20 7.63 4.07 30 0.993 4 0 50 4.01 4.92 4 0.993 4 0 20 5.69 4.26 30 0.993 4 0 50 3.03 5.05 4 0.993 4 0 20 4.98 4.34 30 0.993 4 0 50 1.83 5.28 4 0.993 4 0 20 4.09 4.45 30 0.993 4 0 50 1.12 5.50 4 0.993 4 0 20 3.39 4.55 30 0.993 4 0 50 0.38 5.98 4 0.993 0 4 20 2.43 4.72 30 0.993 0 4 50 0.12 6.48 4 0.993 0 4 20 1.35 5.00 30 0.993 0 4 50 16.18 4.18 10 0.993 4 0 20 0.72 5.29 30 0.993 0 4 50 10.22 4.45 10 0.993 4 0 20 0.43 5.52 30 0.993 0 4 50 7.40 4.62 10 0.993 4 0 20 0.19 5.88 30 0.993 0 4 50 4.74 4.84 10 0.993 4 0 30 10.96 4.10 4 0.992 4 0 50 4.01 4.92 10 0.993 4 0 30 6.25 4.44 4 0.992 4 0 50 3.03 5.05 10 0.993 0 4 30 4.36 4.63 4 0.992 4 0 50 1.83 5.28 10 0.993 0 4 30 2.78 4.85 4 0.992 4 0 50 1.12 5.50 10 0.993 0 4 30 2.21 4.96 4 0.992 4 0 50 0.38 5.98 10 0.993 0 4 30 1.86 5.04 4 o.992 4 0 50 0.12 6.48 10 0.993 0 4 30 1.20 5.24 4 0.992 4 0 50 16.18 4.18 20 0.993 4 0 30 0.86 5.39 4 0.992 4 0 50 10.22 4.45 20 0.993 4 0 30 0.63 5.53 4 0.992 4 0 50 7.40 4.62 20 0.993 4 0 30 0.26 5.92 4 0.992 0 4 50 4.74 4.84 20 0.993 0 4 30 10.96 4.10 10 0.992 4 0 50 4.01 4.92 20 0.993 0 4 30 6.25 4.44 - 10 0.992 4 0 50 3.03 5.05 20 0.993 0 4 30 4.36 4.63 10 0.992 4 0 50 1.83 5.28 20 0.993 0 4 30 2.78 4.85 10 0.992 4 0 50 1.12 5.50 20 0.993 0 4 30 2.21 4.96 10 0.992 4 0 50 0.38 5.98 20 0.993 0 4 30 1.86 5.04 10 0.992 0 4 50 0.12 6.48 20 0.993 0 4 30 1.20 5.24 10 0.992 0 4 50 16.18 4.18 30 0.993 4 0 30 0.86 5.39 10 0.992 0 4 50 10.22 4.45 30 0.993 4 0 30 0.63 5.53 10 0.992 0 4 50 7.40 4.62 30 0.993 4 0 30 0.26 5.92 10 0.992 0 4 50 4.74 4.84 30 0.993 4 0 30 10.96 4.10 20 0.992 4 0 50 4.01 4.92 30 0.993 4 0 30 6.25 4.44 20 0.992 4 0 50 3.03 5.05 30 0.993 0 4
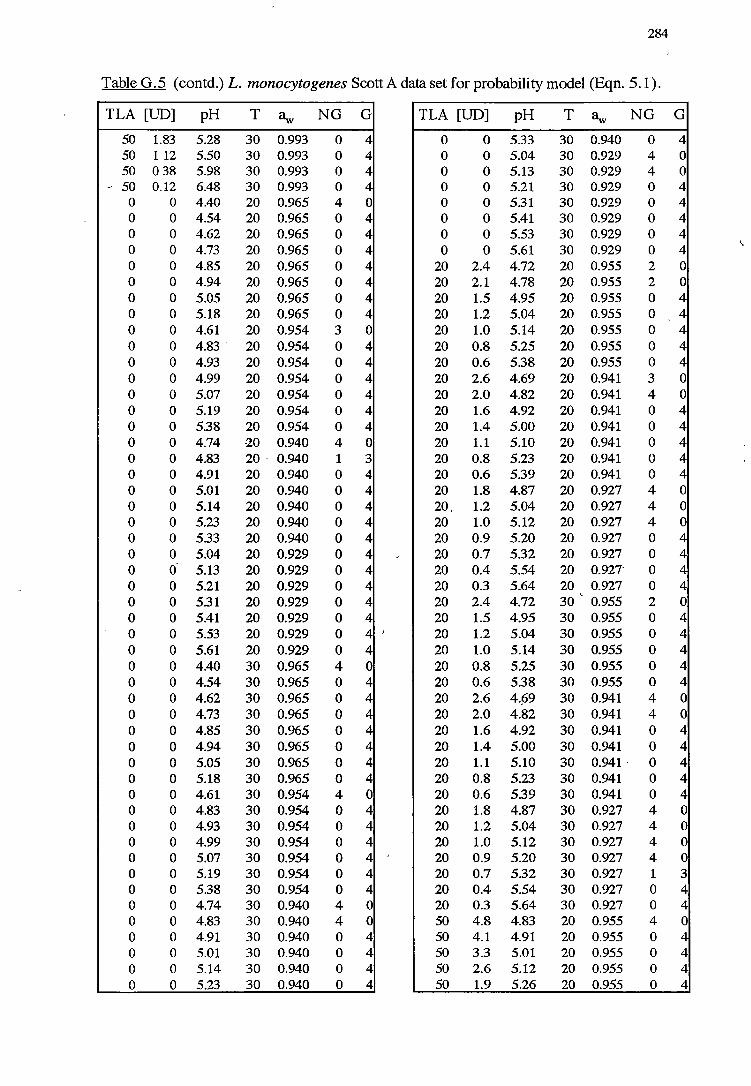
284
Table G.5 (contd.) L. monocytogenes Scott A dataset for probability model (Eqn. 5.1).
TLA [UD] pH T ~ NG G TLA [UD] pH T ~ NG G
50 1.83 5.28 30 0.993 0 4 0 0 5.33 30 0.940 0 4 50 1 12 5.50 30 0.993 0 4 0 0 5.04 30 0.929 4 0 50 0 38 5.98 30 0.993 0 4 0 0 5.13 30 0.929 4 0
- 50 0.12 6.48 30 0.993 0 4 0 0 5.21 30 0.929 0 4 0 0 4.40 20 0.965 4 0 0 0 5.31 30 0.929 0 4 0 0 4.54 20 0.965 0 4 0 0 5.41 30 0.929 0 4 0 0 4.62 20 0.965 0 4 0 0 5.53 30 0.929 0 4 0 0 4.73 20 0.965 0 4 0 0 5.61 30 0.929 0 4
\.
0 0 4.85 20 0.965 0 4 20 2.4 4.72 20 0.955 2 0 0 0 4.94 20 0.965 0 4 20 2.1 4.78 20 0.955 2 0 0 0 5.05 20 0.965 0 4 20 1.5 4.95 20 0.955 0 4 0 0 5.18 20 0.965 0 4 20 1.2 5.04 20 0.955 0 4 0 0 4.61 20 0.954 3 0 20 1.0 5.14 20 0.955 0 4 0 0 4.83 - 20 0.954 0 4 20 0.8 5.25 20 0.955 0 4 0 0 4.93 20 0.954 0 4 20 0.6 5.38 20 0.955 0 4 0 0 4.99 20 0.954 0 4 20 2.6 4.69 20 0.941 3 0 0 0 5.07 20 0.954 0 4 20 2.0 4.82 20 0.941 4 0 0 0 5.19 20 0.954 0 4 20 1.6 4.92 20 0.941 0 4 0 0 5.38 20 0.954 0 4 20 1.4 5.00 20 0.941 0 4 0 0 4.74 ·20 0.940 4 0 20 1.1 5.10 20 0.941 0 4 0 0 4.83 20. 0.940 1 3 20 0.8 5.23 20 0.941 0 4 0 0 4.91 20 0.940 0 4 20 0.6 5.39 20 0.941 0 4 0 0 5.01 20 0.940 0 4 20 1.8 4.87 20 0.927 4 0 0 0 5.14 20 0.940 0 4 20. 1.2 5.04 20 0.927 4 0 0 0 5.23 20 0.940 0 4 20 1.0 5.12 20 0.927 4 0 0 0 5.33 20 0.940 0 4 20 0.9 5.20 20 0.927 0 4 0 0 5.04 20 0.929 0 4 20 0.7 5.32 20 0.927 0 4 0 0 5.13 20 0.929 0 4 20 0.4 5.54 20 0.927• 0 4 0 0 5.21 20 0.929 0 4 20 0.3 5.64 20 0.927 0 4
' 0 0 5.31 20 0.929 0 4 20 2.4 4.72 30 0.955 2 0 0 0 5.41 20 0.929 0 4 20 1.5 4.95 30 0.955 0 4 0 0 5.53 20 0.929 0 4 20 1.2 5.04 30 0.955 0 4 0 0 5.61 20 0.929 0 4 20 1.0 5.14 30 0.955 0 4 0 0 4.40 30 0.965 4 0 20 0.8 5.25 30 0.955 0 4 0 0 4.54 30 0.965 0 4 20 0.6 5.38 30 0.955 0 4 0 0 4.62 30 0.965 0 4 20 2.6 4.f>9 30 0.941 4 0 0 0 4.73 30 0.965 0 4 20 2.0 4.82 30 0.941 4 0 0 0 4.85 30 0.965 0 4 20 1.6 4.92 30 0.941 0 4 0 0 4.94 30 0.965 0 4 20 1.4 5.00 30 0.941 0 4 0 0 5.05 30 0.965 0 4 20 1.1 5.10 30 0.941, 0 4 0 0 5.18 30 0.965 0 4 20 0.8 5.23 30 0.941 0 4 0 0 4.61 30 0.954 4 0 20 0.6 5.39 30 0.941 0 4 0 0 4.83 30 0.954 0 4 20 1.8 4.87 30 0.927 4 0 0 0 4.93 30 0.954 0 4 20 1.2 5.04 30 0.927 4 0 0 0 4.99 30 0.954 0 4 20 1.0 5.12 30 0.927 4 0 0 0 5.07 30 0.954 0 4 20 0.9 5.20 30 0.927 4 0 0 0 5.19 30 0.954 0 4 20 0.7 5.32 30 0.927 1 3 0 0 5.38 30 0.954 0 4 20 0.4 5.54 30 0.927 0 4 0 0 4.74 30 0.940 4 0 20 0.3 5.64 30 0.927 0 4 0 0 4.83 30 0.940 4 0 50 4.8 4.83 20 0.955 4 0 0 0 4.91 30 0.940 0 4 50 4.1 4.91 20 0.955 0 4 0 0 5.01 30 0.940 0 4 50 3.3 5.01 20 0.955 0 4 0 0 5.14 30 0.940 0 4 50 2.6 5.12 20 0.955 0 4 0 0 5.23 30 0.940 0 4 50 1.9 5.26 20 0.955 0 4
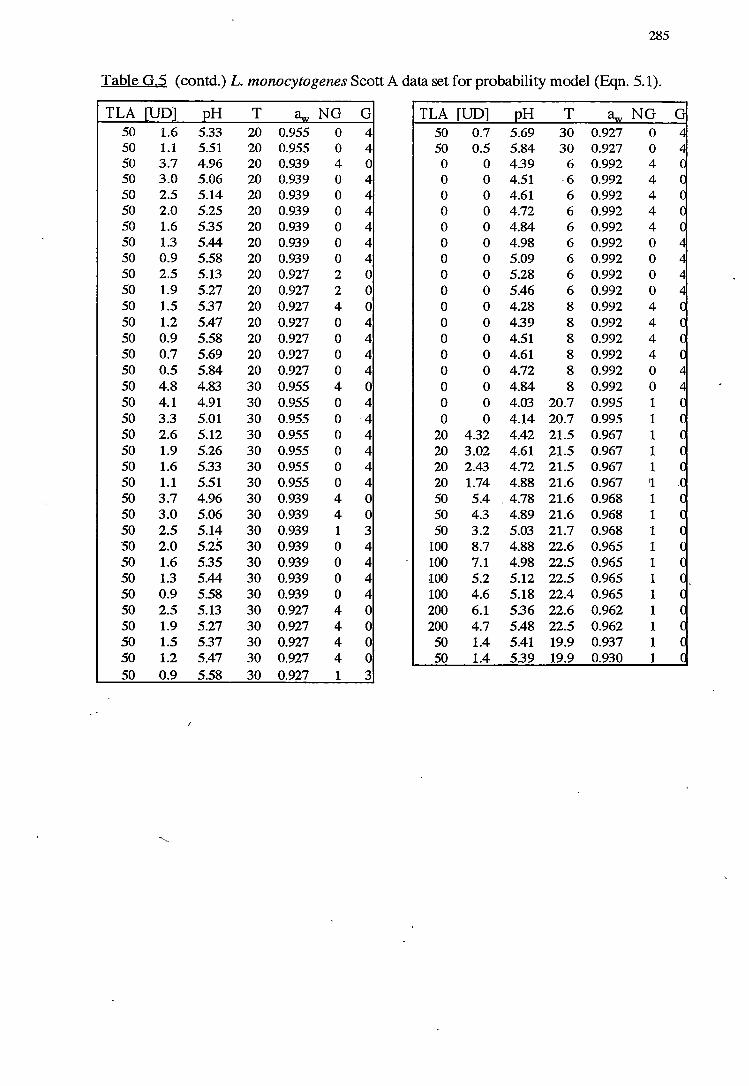
285
Table G.5 (contd.) L. monocytogenes Scott A data set for probability model (Eqn. 5.1).
ILA [UD] pH T a .. NG G TLA [UD] H T 50 1.6 5.33 20 0.955 0 4 50 0.7 5.69 30 0.927 50 1.1 5.51 20 0.955 0 4 50 0.5 5.84 30 0.927 0 50 3.7 4.96 20 0.939 4 0 0 0 4.39 6 0.992 4 50 3.0 5.06 20 0.939 0 4 0 0 4.51 -6 0.992 4 50 2.5 5.14 20 0.939 0 4 0 0 4.61 6 0.992 4 50 2.0 5.25 20 0.939 0 4 0 0 4.72 6 0.992 4 50 1.6 5.35 20 0.939 0 4 0 0 4.84 6 0.992 4 50 1.3 5.44 20 0.939 0 4 0 0 4.98 6 0.992 0 50 0.9 5.58 20 0.939 0 4 0 0 5.09 6 0.992 0 50 2.5 5.13 20 0.927 2 0 0 0 5.28 6 0.992 0 50 1.9 5.27 20 0.927 2 0 0 0 5.46 6 0.992 0 50 1.5 5.37 20 0.927 4 0 0 0 4.28 8 0.992 4 50 1.2 5.47 20 0.927 0 4 0 0 4.39 8 0.992 4 50 0.9 5.58 20 0.927 0 4 0 0 4.51 8 0.992 4 50 0.7 5.69 20 0.927 0 4 0 0 4.61 8 0.992 4 50 0.5 5.84 20 0.927 0 4 0 0 4.72 8 0.992 0 50 4.8 4.83 30 0.955 4 0 0 0 4.84 8 0.992 0 50 4.1 4.91 30 0.955 0 4 0 0 4.03 20.7 0.995 1 50 3.3 5.01 30 0.955 0 4 0 0 4.14 20.7 0.995 1 50 2.6 5.12 30 0.955 0 4 20 4.32 4.42 21.5 0.967 1 50 1.9 5.26 30 0.955 0 4 20 3.02 4.61 2.1.5 0.967 1 50 1.6 5.33 30 0.955 0 4 20 2.43 4.72 21.5 0.967 1 50 1.1 5.51 30 0.955 0 4 20 1.74 4.88 21.6 0.967 11 50 3.7 4.96 30 0.939 4 0 50 5.4 '4.78 21.6 0.968 1 50 3.0 5.06 30 0.939 4 0 50 4.3 4.89 21.6 0.968 1 50 2.5 5.14 30 0.939 1 3 50 3.2 5.03 21.7 0.968 1 50 2.0 5.25 30 0.939 0 4 100 8.7 4.88 22.6 0.965 1 50 1.6 5.35 30 0.939 0 4 100 7.1 4.98 22.5 0.965 1 50 1.3 5.44 30 0.939 0 4 100 5.2 5.12 22.5 0.965 1 50 0.9 5.58 30 0.939 0 4 100 4.6 5.18 22.4 0.965 1 50 2.5 5.13 30 0.927 4 0 200 6.1 5.36 22.6 0.962 1 50 1.9 5.27 30 0.927 4 0 200 4.7 5.48 22.5 0.962 1 50 1.5 5.37 30 0.927 4 0 50 1.4 5.41 19.9 0.937 1 50 1.2 5.47 30 0.927 4 0 50 1.4 5.39 19.9 0.930 1 50 0.9 5.58 30 0.927 1 3
/
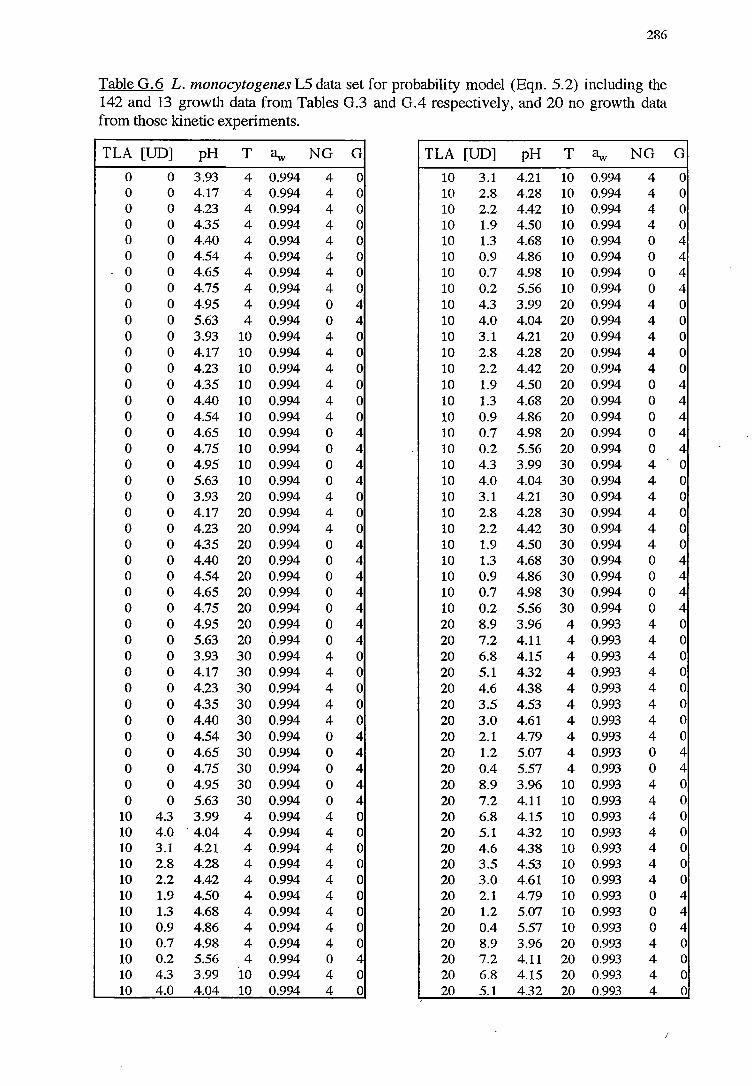
286
Table G.6 L. monocytogenes L5 data set for probability model (Eqn. 5.2) including the 142 and 13 growth data from Tables G.3 and G.4 respectively, and 20 no growth data from those kinetic experiments.
ILA [UD] pH T ~ NG G ILA [UD] pH T ~ NG 0 0 3.93 4 0.994 4 0 10 3.1 4.21 10 0.994 4 0 0 4.17 "4 0.994 4 0 10 2.8 4.28 10 0.994 4 0 0 4.23 4 0.994 4 0 10 2.2 4.42 10 0.994 4 0 0 4.35 4 0.994 4 0 10 1.9 4.50 10 0.994 4 0 0 4.40 4 0.994 4 0 10 1.3 4.68 10 0.994 0 0 0 4.54 4 0.994 4 0 10 0.9 4.86 10 0.994 0 0 0 4.65 4 0.994 4 0 10 0.7 4.98 10 0.994 0 0 0 4.75 4 0.994 4 0 10 0.2 5.56 10 0.994 0 0 0 4.95 4 0.994 0 4 10 4.3 3.99 20 0.994 4 0 0 5.63 4 0.994 0 4 10 4.0 4.04 20 0.994 4 0 0 3.93 10 0.994 4 0 10 3.1 4.21 20 0.994 4 0 0 4.17 10 0.994 4 0 10 2.8 4.28 20 0.994 4 0 0 4.23 10 0.994 4 0 10 2.2 4.42 20 0.994 4 0 0 4.35 10 0.994 4 0 10 1.9 4.50 20 0.994 0 0 0 4.40 10 0.994 4 0 10 1.3 4.68 20 0.994 0 0 0 4.54 10 0.994 4 0 10 0.9 4.86 20 0.994 0 0 0 4.65 10 0.994 0 4 10 0.7 4.98 20 0.994 0 0 0 4.75 10 0.994 0 4 10 0.2 5.56 20 0.994 0 0 0 4.95 10 0.994 0 4 10 4.3 3.99 30 0.994 4 0 0 5.63 10 0.994 0 4 10 4.0 4.04 30 0.994 4 0 0 3.93 20 0.994 4 0 10 3.1 4.21 30 0.994 4 0 0 4.17 20 0.994 4 0 10 2.8 4.28 30 0.994 4 0 0 4.23 20 0.994 4 0 10 2.2 4.42 30 0.994 4 0 0 4.35 20 0.994 0 4 10 1.9 4.50 30 0.994 4 0 0 4.40 20 0.994 0 4 10 1.3 4.68 30 0.994 0 0 0 4.54 20 0.994 0 4 10 0.9 4.86 30 0.994 0 0 0 4.65 20 0.994 0 4 10 0.7 4.98 30 0.994 0 0 0 4.75 20 0.994 0 4 10 0.2 5.56 30 0.994 0 0 0 4.95 20 0.994 0 4 20 8.9 3.96 4 0.993 4 0 0 5.63 20 0.994 0 4 20 7.2 4.11 4 0.993 4 0 0 3.93 30 0.994 4 0 20 6.8 4.15 4 0.993 4 0 0 4.17 30 0.994 4 0 20 5.1 4.32 4 0.993 4 0 0 4.23 30 0.994 4 0 20 4.6 4.38 4 0.993 4 0 0 4.35 30 0.994 4 0 20 3.5 4.53 4 0.993 4 0 0 4.40 30 0.994 4 0 20 3.0 4.61 4 0.993 4 0 0 4.54 30 0.994 0 4 20 2.1 4.79 4 0.993 4 0 0 4.65 30 0.994 0 4 20 1.2 5.07 4 0.993 0 0 0 4.75 30 0.994 0 4 20 0.4 5.57 4 0.993 0 0 0 4.95 30 0.994 0 4 20 8.9 3.96 10 0.993 4 0 0 5.63 30 0.994 0 4 20 7.2 4.11 10 0.993 4
10 4.3 3.99 4 0.994 4 0 20 6.8 4.15 10 0.993 4 10 4.0 '4.04 4 0.994 4 0 20 5.1 4.32 10 0.993 4 10 3.1 4.21 4 0.994 4 0 20 4.6 4.38 10 0.993 4 10 2.8 4.28 4 0.994 4 0 20 3.5 4.53 10 0.993 4 10 2.2 4.42 4 0.994 4 0 20 3.0 4.61 10 0.993 4 10 1.9 4.50 4 0.994 4 0 20 2.1 4.79 10 0.993 0 10 1.3 4.68 4 0.994 4 0 20 1.2 5.07 10 0.993 0 10 0.9 4.86 4 0.994 4 0 20 0.4 5.57 10 0.993 0 10 0.7 4.98 4 0.994 4 0 20 8.9 3.96 20 0.993 4 10 0.2 5.56 4 0.994 0 4 20 7.2 4.11 20 0.993 4 10 4.3 3.99 10 0.994 4 0 20 6.8 4.15 20 0.993 4 10 4.0 4.04 10 0.994 4 0 20 5.1 4.32 20 0.993 4
j
G
0 0 0 0 4 4 4 4 0 0 0 0 0 4 4 4 4 4 0 0 0 0 0 0 4 4 4 4 0 0 0 0 0 0 0 0 4 4 0 0 0 0 0 0 0 4 4 4 0 0 0 0
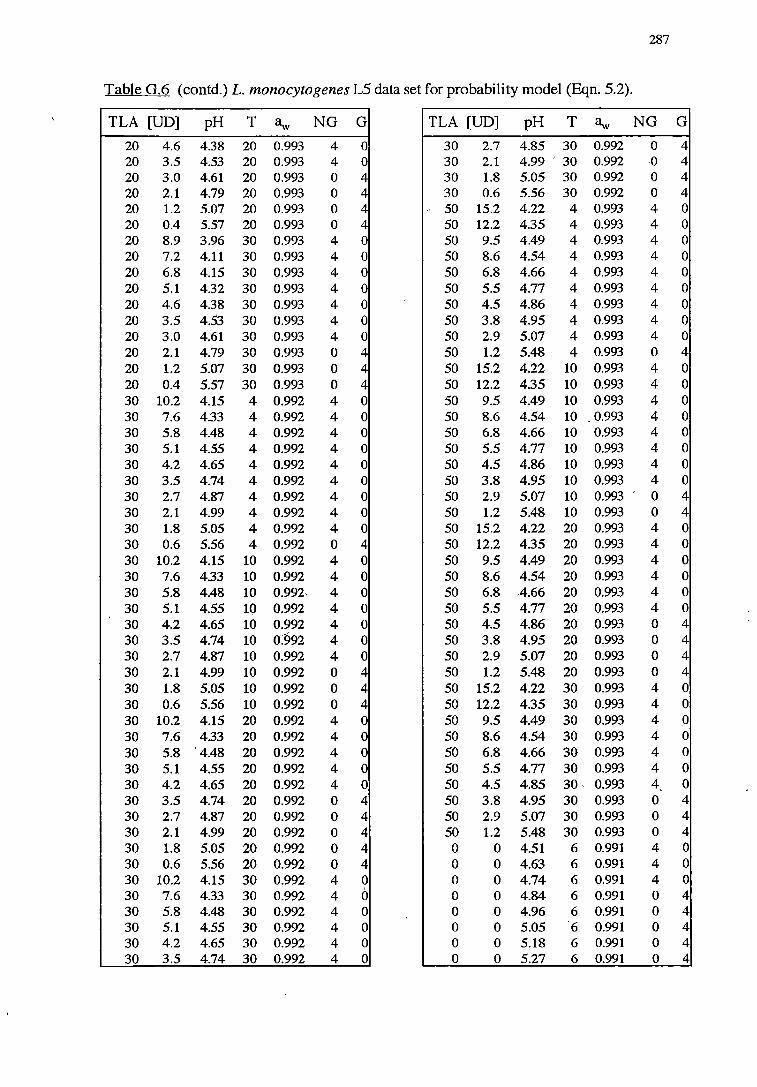
287
Table G.6 (contd.) L. monocytogenes LS data set for probability model (Eqn. 5.2).
TLA [UD] pH T ~ NG G TLA [UD] pH T ~ NG G 20 4.6 4.38 20 0.993 4 0 30 2.7 4.85 30 0.992 0 4 20 3.5 4.53 20 0.993 4 0 30 2.1 4.99 ' 30 0.992 .o 4 20 3.0 4.61 20 0.993 0 4 30 1.8 5.05 30 0.992 0 4 20 2.1 4.79 20 ,0.993 0 4 30 0.6 5.56 30 0.992 0 4 20 1.2 5.07 20 0.993 0 4 .. 50 15.2 4.22 4 0.993 4 0 20 0.4 5.57 20 0.993 0 4 50 12.2 4.35 4 0.993 4 0 20 8.9 3.96 30 0.993 4 0 50 9.5 4.49 4 0.993 4 0 20 7.2 4.11 30 0.993 4 0 50 8.6 4.54 4 0.993 4 0 20 6.8 4.15 30 0.993 4 0 50 6.8 4.66 4 0.993 4 0 20 5.1 4.32 30 0.993 4 0 50 5.5 4.77 4 0.993 4 0 20 4.6 4.38 30 0.993 4 0 50 4.5 4.86 4 0.993 4 0 20 3.5 4.53 30 0.993 4 0 50 3.8 4.95 4 0.993 4 0 20 3.0 4.61 30 0.993 4 0 50 2.9 5.07 4 0.993 4 0 20 2.1 4.79 30 0.993 0 4 50 1.2 5.48 4 0.993 0 4 20 1.2 5.07 30 0.993 0 4 50 15.2 4.22 10 0.993 4 0 20 0.4 5.57 30 0.993 0 4 50 12.2 4.35 10 0.993 4 0 30 10.2 4.15 4 0.992 4 0 50 9.5 4.49 10 0.993 4 0 30 7.6 4.33 4 0.992 4 0 50 8.6 4.54 10 0.993 4 0 30 5.8 4.48 4 0.992 4 0 50 6.8 4.66 10 0.993 4 0 30 5.1 4.55 4 0.992 4 0 50 5.5 4.77 10 0.993 4 0 30 4.2 4.65 4 0.992 4 0 50 4.5 4.86 10 0.993 4 0 30 3.5 4.74 4 0.992 4 0 50 3.8 4.95 10 0.993 4 0 30 2.7 4.87 4 0.992 4 0 50 2.9 5.07 10 0.993 0 4 30 2.1 4.99 4 0.992 4 0 50 1.2 5.48 10 0.993 0 4 30 1.8 5.05 4 0.992 4 0 50 15.2 4.22 20 0.993 4 0 30 0.6 5.56 4 0.992 0 4 50 12.2 4.35 20 0.993 4 0 30 10.2 4.15 10 0.992 4 0 50 9.5 4.49 20 0.993 4 0 30 7.6 4.33 10 0.992 4 0 50 8.6 4.54 20 0.993 4 0 30 5.8 4.48 10 0.992, 4 0 50 6.8 .4.66 20 0.993 4 0 30 5.1 4.55 10 0.992 4 0 50 5.5 4.77 20 0.993 4 0 30 4.2 4.65 10 0.992 4 0 so 4.5 4.86 20 0.993 0 4 30 3.5 4.74 10 0:§92 4 0 50 3.8 4.95 20 0.993 0 4 30 2.7 4.87 10 0.992 4 0 50 2.9 5.07 20 0.993 0 4 30 2.1 4.99 10 0.992 0 4 50 1.2 5.48 20 0.993 0 4 30 1.8 5.05 10 0.992 0 4 50 15.2 4.22 30 0.993 4 0 30 0.6 5.56 10 0.992 0 4 50 12.2 4.35 30 0.993 4 0 30 10.2 4.15 20 0.992 4 0 50 9.5 4.49 30 0.993 4 0 30 7.6 4.33 20 0.992 4 0 50 8.6 4.54 30 0.993 4 0 30 5.8 '4.48 20 0.992 4 0 50 6.8 4.66 30 0.993 4 0 30 5.1 4.55 20 0.992 4 0 50 5.5 4.77 30 0.993 4 0 30 4.2 4.65 20 0.992 4 0 50 4.5 4.85 30. 0.993 4 0 30 3.5 4.74 20 0.992 0 4 50 3.8 4.95 30 0.993 0 4 30 2.7 4.87 20 0.992 0 4 50 2.9 5.07 30 0.993 0 4 30 2.1 4.99 20 0.992 0 4 50 1.2 5.48 30 0.993 0 4 30 1.8 5.05 20 0.992 0 4 0 0 4.51 6 0.991 4 0 30 0.6 5.56 20 0.992 0 4 0 0 4.63 6 0.991 4 0 30 10.2 4.15 30 0.992 4 0 0 0 4.74 6 0.991 4 0 30 7.6 4.33 30 0.992 4 0 0 0 4.84 6 0.991 0 4 30 5.8 4.48 30 0.992 4 0 0 0 4.96 6 0.991 0 4 30 5.1 4.55 30 0.992 4 0 0 0 5.05 '6 0.991 0 4 30 4.2 4.65 30 0.992 4 0 0 0 5.18 6 0.991 0 4 30 3.5 4.74 30 0.992 4 0 0 0 5.27 6 0.991 0 4
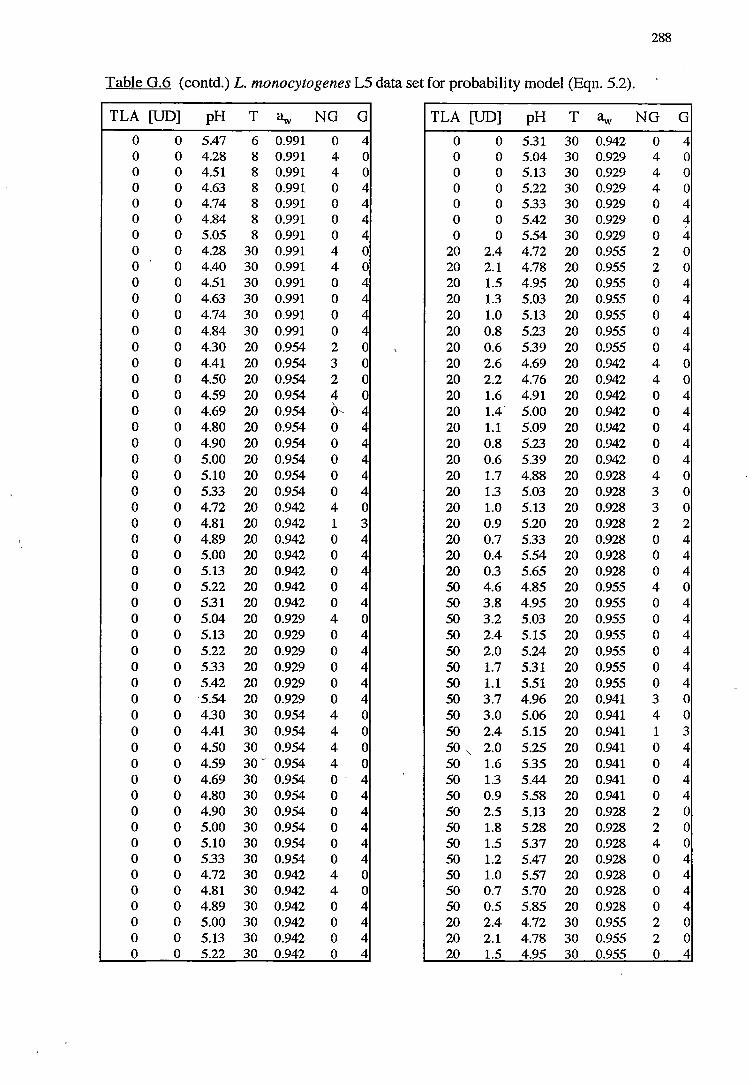
288
Table G.6 (contd.) L. monocytogenes LS data set for probability model (Eqn. 5.2).
TLA [UD] pH T ~ NG G TLA [UD] pH T <lw NG G 0 0 5.47 6 0.991 0 4 0 0 5.31 30 0.942 0 4 0 0 4.28 8 0.991 4 0 0 0 5.04 30 0.929 4 0 0 0 4.51 8 0.991 4 0 0 0 5.13 30 0.929 4 0 0 0 4.63 8 0.991 0 4 0 0 5.22 30 0.929 4 0 0 0 4.74 8 0.991 0 4 0 0 5.33 30 0.929 0 4 0 0 4.84 8 0.991 0 4 0 0 5.42 30 0.929 0 4 0 0 5.05 8 0.991 0 4 0 0 5.54 30 0.929 0 4 0 0 4.28 30 0.991 4 0 20 2.4 4.72 20 0.955 2 0 0 ' 0 4.40 30 0.991 4 0 20 2.1 4.78 20 0.955 2 0 0 0 4.51 30 0.991 0 4 20 1.5 4.95 20 0.955 0 4 0 0 4.63 30 0.991 0 4 20 1.3 5.03 20 0.955 0 4 0 0 4.74 30 0.991 0 4 20 1.0 5.13 20 0.955 0 4 0 0 4.84 30 0.991 0 4 20 0.8 5.23 20 0.955 0 4 0 0 4.30 20 0.954 2 0 20 0.6 5.39 20 0.955 0 4 0 0 4.41 20 0.954 3 0 20 2.6 4.69 20 0.942 4 0 0 0 4.50 20 0.954 2 0 20 2.2 4.76 20 0.942 4 0 0 0 4.59 20 0.954 4 0 20 1.6 4.91 20 0.942 0 4
\
0 0 4.69 20 0.954 o-- 4 20 1.4' 5.00 20 0.942 0 4 0 0 4.80 20 0.954 0 4 20 1.1 5.09 20 0.942 0 4 0 0 4.90 20 0.954 0 4 20 0.8 5.23 20 0.942 0 4 0 0 5.00 20 0.954 0 4 20 0.6 5.39 20 0.942 0 4 0 0 5.10 20 0.954 0 4 20 1.7 4.88 20 0.928 4 0 0 0 5.33 20 0.954 0 4 20 1.3 5.03 20 0.928 3 0 0 0 4.72 20 0.942 4 0 20 1.0 5.13 20 0.928 3 0 0 0 4.81 20 0.942 1 3 20 0.9 5.20 20 0.928 2 2 0 0 4.89 20 0.942 0 4 20 0.7 5.33 20 0.928 0 4 0 0 5.00 20 0.942 0 4 20 0.4 5.54 20 0.928 0 4 0 0 5.13 20 0.942 0 4 20 0.3 5.65 20 0.928 0 4 0 0 5.22 20 0.942 0 4 50 4.6 4.85 20 0.955 4 0 0 0 5.31 20 0.942 0 4 50 3.8 4.95 20 0.955 0 4 0 0 5.04 20 0.929 4 0 50 3.2 5.03 20 0.955 0 4 0 0 5.13 20 0.929 0 4 50 2.4 5.15 20 0.955 0 4 0 0 5.22 20 0.929 0 4 50 2.0 5.24 20 0.955 0 4 0 0 5.33 20 0.929 0 4 50 1.7 5.31 20 0.955 0 4 0 0 5.42 20 0.929 0 4 50 1.1 5.51 20 0.955 0 4 0 0 '5.54 20 0.929 0 4 50 3.7 4.96 20 0.941 3 0 0 0 4.30 30 0.954 4 0 50 3.0 5.06 20 0.941 4 0 0 0 4.41 30 0.954 4 0 50 2.4 5.15 20 0.941 1 3 0 0 4.50 30 0.954 4 0 50 ', 2.0 5.25 20 0.941 0 4 0 0 4.59 30 ~ 0.954 4 0 50 1.6 5.35 20 0.941 0 4 0 0 4.69 30 0.954 0 . 4 50 1.3 5.44 20 0.941 0 4 0 0 4.80 30 0.954 0 4 50 0.9 5.58 20 0.941 0 4 0 0 4.90 30 0.954 0 4 50 2.5 5.13 20 0.928 2 0 0 0 5.00 30 0.954 0 4 50 1.8 5.28 20 0.928 2 0 0 0 5.10 30 0.954 0 4 50 1.5 5.37 20 0.928 4 0 0 0 5.33 30 0.954 0 4 50 1.2 5.47 20 0.928 0 4 0 0 4.72 30 0.942 4 0 50 1.0 5.57 20 0.928 0 4 0 0 4.81 30 0.942 4 0 50 0.7 5.70 20 0.928 0 4 0 0 4.89 30 0.942 0 4 50 0.5 5.85 20 0.928 0 4 0 0 5.00 30 0.942 0 4 20 2.4 4.72 30 0.955 2 0 0 0 5.13 30 0.942 0 4 20 2.1 4.78 30 0.955 2 0 0 0 5.22 30 0.942 0 4 20 1.5 4.95 30 0.955 0 4
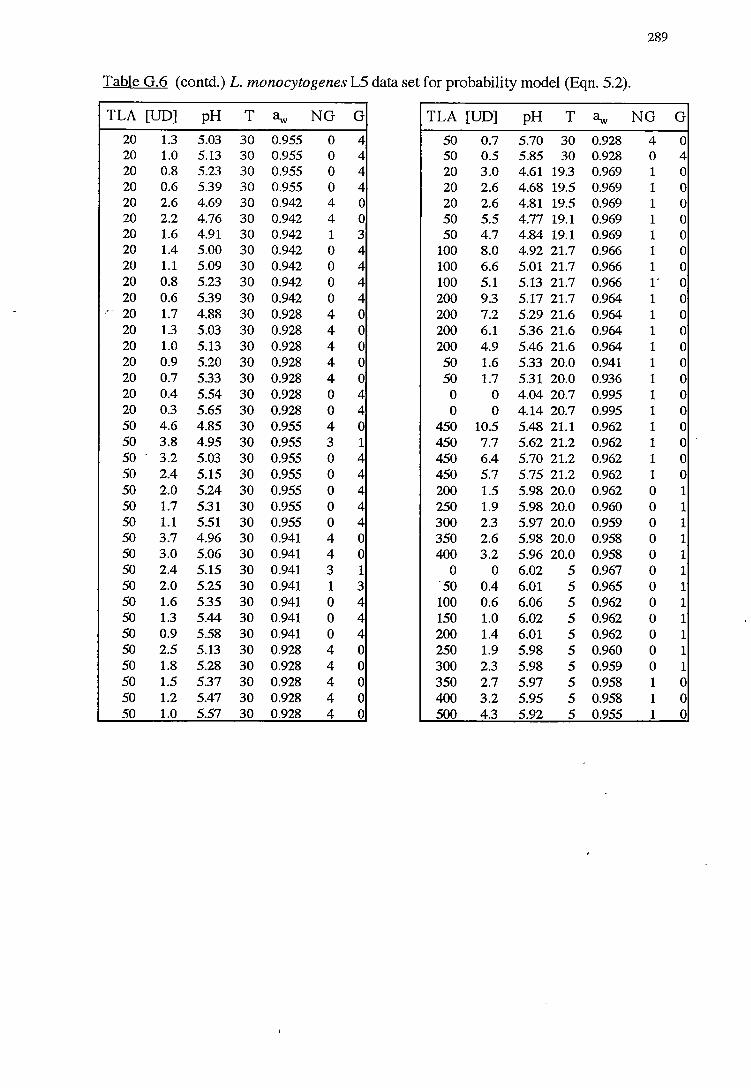
289
Table G.6 (contd.) L. monocytogenes LS data set for probability model (Eqn. 5.2).
TLA [UD] pH T ~ NG G TLA [UD] pH T ~ NG G 20 1.3 5.03 30 0.955 0 4 50 0.7 5.70 30 0.928 4 0 20 1.0 5.13 30 0.955 0 4 50 0.5 5.85 30 0.928 0 4 20 0.8 5.23 30 0.955 0 4 20 3.0 4.61 19.3 0.969 1 0 20 0.6 5.39 30 0.955 0 4 20 2.6 4.68 19.5 0.969 1 0 20 2.6 4.69 30 0.942 4 0 20 2.6 4.81 19.5 0.969 1 0 20 2.2 4.76 30 0.942 4 0 50 5.5 4.77 19.1 0.969 1 0 20 1.6 4.91 30 0.942 1 3 50 4.7 4.84 19.1 0.969 1 0 20 1.4 5.00 30 0.942 0 4 100 8.0 4.92 21.7 0.966 1 0 20 1.1 5.09 30 0.942 0 4 100 6.6 5.01 21.7 0.966 1 0 20 0.8 5.23 30 0.942 0 4 100 5.1 5.13 21.7 0.966 1· 0 20 0.6 5.39 30 0.942 0 4 200 9.3 5.17 21.7 0.964 1 0
- 20 1.7 4.88 30 0.928 4 0 200 7.2 5.29 21.6 0.964 1 0 20 1.3 5.03 30 0.928 4 0 200 6.1 5.36 21.6 0.964 1 0 20 1.0 5.13 30 0.928 4 0 200 4.9 5.46 21.6 0.964 1 0 20 0.9 5.20 30 0.928 4 0 50 1.6 5.33 20.0 0.941 1 0 20 0.7 5.33 30 0.928 4 0 50 1.7 5.31 20.0 0.936 1 0 20 0.4 5.54 30 0.928 0 4 0 0 4.04 20.7 0.995 1 0 20 0.3 5.65 30 0.928 0 4 0 0 4.14 20.7 0.995 1 0 50 4.6 4.85 30 0.955 4 0 450 10.5 5.48 21.1 0.962 1 0 50 3.8 4.95 30 0.955 3 1 450 7.7 5.62 21.2 0.962 1 0 50 3.2 5.03 30 0.955 0 4 450 6.4 5.70 21.2 0.962 1 0 50 2.4 5.15 30 0.955 0 4 450 5.7 5.75 21.2 0.962 1 0 50 2.0 5.24 30 0.955 0 4 200 1.5 5.98 20.0 0.962 0 1 50 1.7 5.31 30 0.955 0 4 250 1.9 5.98 20.0 0.960 0 1 50 1.1 5.51 30 0.955 0 4 300 2.3 5.97 20.0 0.959 0 1 50 3.7 4.96 30 0.941 4 0 350 2.6 5.98 20.0 0.958 0 1 50 3.0 5.06 30 0.941 4 0 400 3.2 5.96 20.0 0.958 0 1 50 2.4 5.15 30 0.941 3 1 0 0 6.02 5 0.967 0 1 50 2.0 5.25 30 0.941 1 3 -so 0.4 6.01 5 0.965 0 1 50 1.6 5.35 30 0.941 0 4 100 0.6 6.06 5 0.962 0 1 50 1.3 5.44 30 0.941 0 4 150 1.0 6.02 5 0.962 0 1 50 0.9 5.58 30 0.941 0 4 200 1.4 6.01 5 0.962 0 1 50 2.5 5.13 30 0.928 4 0 250 1.9 5.98 5 0.960 0 1 50 1.8 5.28 30 0.928 4 0 300 2.3 5.98 5 0.959 0 1 50 1.5 5.37 30 0.928 4 0 350 2.7 5.97 5 0.958 1 0 50 1.2 5.47 30 0.928 4 0 400 3.2 5.95 5 0.958 1 0 50 1.0 5.57 30 0.928 4 0 500 4.3 5.92 5 0.955 1 0
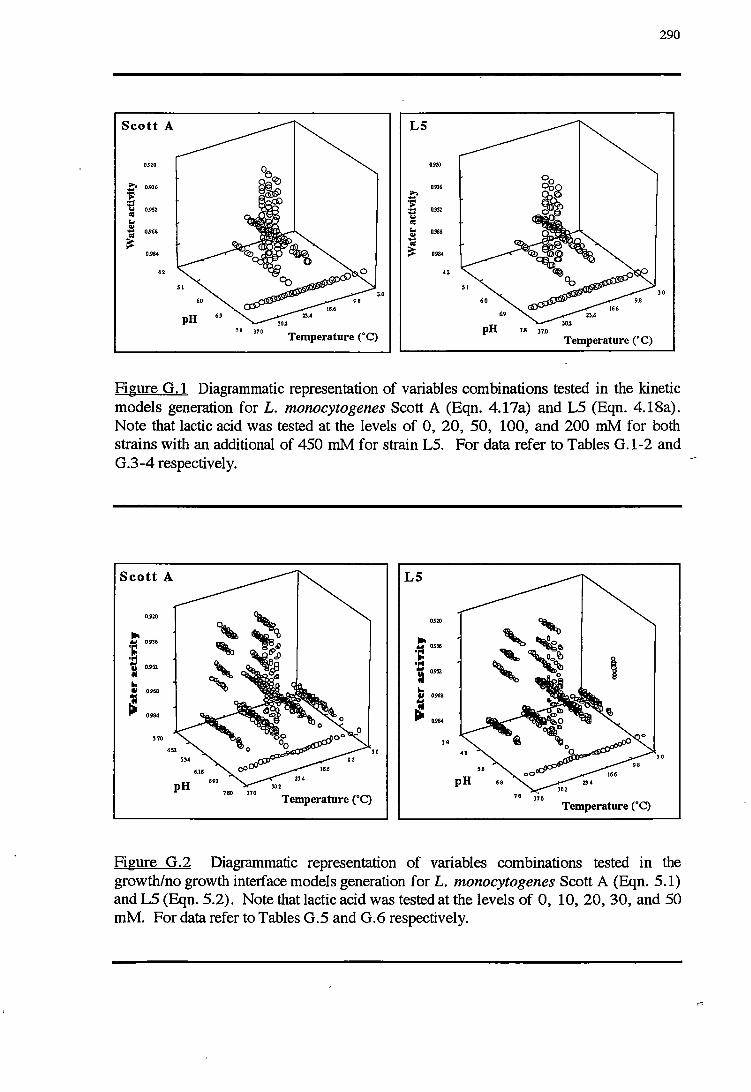
290
Scott A LS
.... 09W
~ 0.936
·i: i 0.952
D.936 ,e. :E 0352 tl
~ ··~ 0984
"' s... 11.968 .. ";ij ::-; 0984
42
'l'S 310 Temperature ('C)
7.8 37.0
Temperature ('C)
Figure G.1 Diagrammatic representation of variables combinations tested in the kinetic models generation for L. monocytogenes Scott A (Eqn. 4.17a) and LS (Eqn. 4.18a). Note that lactic acid was tested at the levels of 0, 20, SO, 100, and 200 mM for both strains with an additional of 4SO mM for strain LS. For data refer to Tables G.1-2 and G.3-4 respectively.
Scott A LS
09W .. ,,, ·i .. ,. •PI i 0.912 ..
.... ,. ·~ '"' i 0.9>2
II 0968
i 0984
.. 11 0968
~ ~ 0984
!70 ,.
'780 310 Temperature (°C) 1s :no
Temperature (°C)
Figure G.2 Diagrammatic representation of variables combinations tested in the growth/no growth interface models generation for L. monocytogenes Scott A (Eqn. S.1) and L5 (Eqn. S.2). Note that lactic acid was tested at the levels of 0, 10, 20, 30, and SO mM. For data refer to Tables G.S and G.6 respectively.
Related Documents