118111? RI ED 167 088 ATTBOR Lindquist,' Mats G. TITLE The Dynamics of Inf _ma,ticr Search Services. INSTITUTION Royal Inst, of TeCh Stockhclm (Sweden). REPORT.NO TRITA-LIB-6012 PUB DATE Feb 78 NOTE 186p..: Ph.D. Stockholm Unitersitl, weden4 ONE II. 006 164 EDRS PRICE DESCRIPTORS IDENTIFIERS ABSTRACT MF-S0.83 HC-$10.03 PluA pbstage. Bibliographies; Decisitn Making:. Defin tions; Graphs; IUustrations;:*information Retrieval; Marketing; *Models; *On Line systems; Research Methodology,(, *Systems Analysis -Computer, Based Informaticn Search Services computer-based information search services (ISSs) cf the type that provide online literature searches are analyzed from a systems viewpoint using a continuous simulation model. The methodology applied is "system dynamics," and the system language is DYNAMO. The analysis reveals that the cbserved. growth and stagnation of a typical ISS can be explained as a natural cOnsegUence cf market responses to the service together tith a business' orientation on the part of the funder. An analysigof managerial decisicn-making is also presented, and implications for the aggregate information search market ara explored. It is cl4imed that the growth pctential has been overPstimatrd and tHat a decline'in the aggregate growth rate is likely, though not inevitable. (Author) * * * * * ****_* **44*.****** ************ ** * * ***** eProductions supplied by EDRS are the best that can be made from the original document. ************************** * ** * * * *,* ** * * * * * * * * *.* * * *4 * * * *_ * * *

Welcome message from author
This document is posted to help you gain knowledge. Please leave a comment to let me know what you think about it! Share it to your friends and learn new things together.
Transcript

118111? RI
ED 167 088
ATTBOR Lindquist,' Mats G.TITLE The Dynamics of Inf _ma,ticr Search Services.INSTITUTION Royal Inst, of TeCh Stockhclm (Sweden).REPORT.NO TRITA-LIB-6012PUB DATE Feb 78NOTE 186p..: Ph.D. Stockholm Unitersitl, weden4
ONE
II. 006 164
EDRS PRICEDESCRIPTORS
IDENTIFIERS
ABSTRACT
MF-S0.83 HC-$10.03 PluA pbstage.Bibliographies; Decisitn Making:. Defin tions; Graphs;IUustrations;:*information Retrieval; Marketing;*Models; *On Line systems; Research Methodology,(,*Systems Analysis-Computer, Based Informaticn Search Services
computer-based information search services (ISSs) cfthe type that provide online literature searches are analyzed from asystems viewpoint using a continuous simulation model. Themethodology applied is "system dynamics," and the system language isDYNAMO. The analysis reveals that the cbserved. growth and stagnationof a typical ISS can be explained as a natural cOnsegUence cf marketresponses to the service together tith a business' orientation on thepart of the funder. An analysigof managerial decisicn-making is alsopresented, and implications for the aggregate information searchmarket ara explored. It is cl4imed that the growth pctential has beenoverPstimatrd and tHat a decline'in the aggregate growth rate islikely, though not inevitable. (Author)
* * * * * ****_* **44*.****** ************ ** * * *****eProductions supplied by EDRS are the best that can be made
from the original document.************************** * ** * * * *,* ** * * * * * * * * *.* * * *4 * * * *_
* **

. 3 a
InPARTMONT OP NIA TN,IDLIEATION L INOLPANO
NATIONAL INSTITUT! 01"ODUCATIONI
PHIS DOCUMENT HAS BEEN REPRO-DUCED EXACTLY AS RECEIVED FROMTHE PERSON OR 0179ANIIATIONATINO IT POINTS de VIEW OR OPINIONSSTATED 00 NOT NECESSARILY REPRE-SENT OFFICIAL NATIONAL INSTITUTE OFEC)UCATI.ON POSITION OR PILL ICY
REPORT TR TA-L1B-6012
THE DYNAMICS flf-INFORMATION'qARCH SERVICES
Mats G. L indqUist
ttk
Swedish. Council fOr ScientificInformation and Documentation,Stockholm
-PERMISSION TO REPROouc THIS
MATERIAL HA5-BEENGRANTED ST
Stephan Schwarz
TO THE EDIJcATIoNAL RESOURCES
INFORMATION CENTER(ERIC) AND
USERS OF THE ERIC tiYSTEM
TABLE OF CONT ENT
FOREWORD
CHARTER . =ONE
DESCRIPTION OF THE RESEARCH PROJECT
I.
_
InforMatiorP Search Services 11.
II. Thearetical FOundations and 21Methodology \
III Analysis of growth of ISVs 39
IV. Implications for the Aggregate 46Information Sea'rch Market
V. General Con lusions from theStudy
CHAPTER TWOGROWTH DYNAMICS OF INFORMATI ON SEARCH SERVICES
I. Introduction 53
II. Problem Stateutent 56
III.' Boundary for the Study 58
IV. ,System-Description 61
V. The Simulation.Model'and 68BehaVior of an ISS
VI. Further Analysis of Managerial 84Decision Taking for An ISS'
VII. Conclusions from the Simulation 91Ekpe'riments
-CHAPTERTHREE18S2 MODEL DESCRIPTION A THEORY OF ISS GROWTH
I. 'Modeling .'Idol. 95
11. Description of I9S2 108-
III. Model E tinge 151
IV. MoOel Testing 170

CHAKER FOURAN EXPLANATION ,OF THE COMING STAGNATION --
OF INFORMATION SEARCH SERVICES
I. Intrqduction 177
II. Nsconceptions Regarding , 178_Oper4tional ISS°s
III. AnalYsis of ISS Growth 180
IV. ImplicAtions of the Analysis 181
V. SuMmary 184
BIBLIOGRAPHY 185

FOR WORD
This reports the account of .a aiMed'at.inVest-
igating marketing aspects and managerial-decision making
for information, services of the kind that. .provide on-
line searching of scientific and technical bibliographic
information. These services. will henceforth be called
information search services, or ISS-s.
The project has been supported by the Swedish Council
Scientific .Information and Documentation (SINFDOK
Findings from the project have been presented in the
following reports and pdpers (acronyms to'beU-se in
this report =are given in parentheses) :
(NMI) Lindquist,.M. G., "Dynamic Modeling ofInformation Search Services A SimpleRe Source Allocation Model", WP 852 -76,Sloan School of 'Management, M.I.T., Cam-bridge, Mass., June 1976. Also availableas report 7132063, The Swedish Council _for=Scientific Information and Documentation,Stockholm, 1976.
tjpIss) Lindquist, M. G., "Growth Dynamics of In-formation Search Services", report TRITA-LIB-6009, The Royal Institute of Techno-logy Library, Stockholm, November 1976.(Abridged version to appear in JASIS).
(ECSIS ) Lindquist, M. G., "An Explanation of theComing Stagnation of Information SearchServices",-On-line Review, v. 1, n. 2,(June 1977), pp. 109-116.
In addition, an overview of.the.project has bees pre-
sented atthe 1975 annual meeting of the American Soci-.
ety for Information Science, ASIS:-
Lindquist, M. G.,,"Dynamic Modeling ofInformation Services - Project OvervieW"Proc. ASIS, v. 12, pp. 43-44.

The present rep- consists of four Chapters:
Chapter one; ,Description of the Research Project,gives the background for the study and a discus -ion about theoFetical foundations and methodol-The main results are presented, and general conclusions from the 'study are drawn,
Chapter two, Growth Dynamics of Information SearchServices, is a revised ,version of GDISS, pp. 1-32.
Chapter three, ISS2.Model Description r A Theoryof 155 Growth, is a rewritten model descriptionthat builds on the description in GDISS (pp.35-62).
Chapter_four, An Explanation of the Coming Stagna-tiOn of Information Search Services, is the paperECSISS, reprinted by permission.
Many people have helped me-in many ways to bring th
study to a conclusion. 'it is my pleasure to thank.
them
,.My first thanks go to the Swedish Council for Scienti-'-
fiC Information and DoclimeritatiOn, SINFDOK, and the
people there who have supported my-work and made fund-
ing possible.
While .at the Sloan School of Management. of the. Massa-
chusetts institute of Technology my initial-modeling
efforts w e guided by.professor Edward B.. Roberts. His
help and encouragement are appreciated,
For.te t e-7System Dynamics- Friday Morning Group" was
a unique source of inspiration and support. The compe-k
tent criticism and the continous encouragement from the
group have been invaluable, andany expression of
thanks will be inadequate. I can'only acklowledge my
debt to David AndeeSen,.Mike.Garet,'Ali Mashayekhi,,
and George Richardson.

have received much cooperation_ nd help from the staffof'existing ISS's which have'bee: valuable for.the m6del,formUlation-.''I want to thank.RolandHjerppe of the RITL-IDC StockhOlm) and Mary Pensyl of.NASit/MTT-esPeoialAy.
In stockholm professor Barje Langefoxs has been my_:
thesis advisor. His persistence in not letting me g_.$
lth-haIf-thaughtideaa, has improved. my dissertati nsignificantly..I appreciate this guidance.
1.Since I. started the wfite-up of the project I nave bene-.
fitted from my interactions with the 3RIP-group, laterto form theParalog.AB company; I Want' to 'hank Mats
LI5fstrom,.hrister Bryntesson, and Rolf Lar o Thegeneral support and 'BA bestmmer vi det's h ve notbeen without effect.
'To Jan HuItgren .1 acknowledge the linguisticf- 1 ical,.moral, and practical assistance he has given 'me. du ingthe past year.
I owe special thanks to In er Johansson for her* gener ushelp and quality work:with the preparation of the manu-script
Stockholm 1978-02-27'
M. G. L.

CHAPTER ONE
DESCRIPTION OF THE RESEARCH PROJECT

INFORMATION SEARCH SERVICES,
IndroduCtion and 6aolt round
The growth in the volume of scientific and technical
information has followed an exponential path since the
middle of the eighteenth century and hhs now reached
a level 6f over 100 000 published journals. The need
for efficient procedures for searching and accessing
the body of recorded knowledge has increased accordingly
and resulted in a number of changes in these procedures.
The traditional depositories for literatu are lib-
raries arid the traditional access tools are the
library catalogs. As long as the volume of the lit-.
ewture in a particular scientific ,field was small
it was poslble for a special library to have a com-
prehensive collection and a search' in the local cata-
loge could give satisfactory answers to "what and
where" questions about scientific information. The.
fikst attempts to cope with the growth of information
volume therefore, naturally, -involved changes in the
cataloging proceduresAs-early as the middle ages
catalogi g procedures began to change towards control
of the lal documents, whereas before that, the r
nary goal was to provide control of their content
(Battacharyya, 1973)-- a change that seem: to be a
response 'to an increase in volume. _ , whenwhere it
became impossible for one library to acquire all the
relevant literature in a field, cooc-ative agreements,$)
between libraries were developed, and union catalogs
provided the answers to "what and where° questions.
Library cooperation was, however, not sufficient to
cope whith the growing volume of lit(e
rature, and*V
patrons of the' cooperatives could not get exhaustive
answers to their "what and where" questions. One part,
of the problem is that library collections ingeneral
12fi
are i nct si the literature: a typical
doubling time.for tbrary collectfons is close tO 20
years (flaumol & Ma CUA, 1973) whereas that for the
scientific ii -urn iii 15.,The other part is due
structural changes in the scientific literatut
Frc m earliest days to the present there has been a,
nd towards more specialtzation which has boon
reflected In a more detailed subdivinfon of the lite-
rature. The nce for the 1 i t r.i rion ha.'; b enV
that two librarion whith a nliqh y 4i f ferr'nt s
orientation !an
I ( 7 I
d up haVinq nubstantlally different"
collection-A whith in
trons to l' wa
dIll tint( 1!;
I difficulties toT theIAt- toeliterature ol ihte
tion there in also a tr
lowarw; 111()T-(.,
d tc w a r is int ei 11 sci nar i It y
(Hozsa, 19/i) wllicch I11rt h rdw t hr, chances any
library beinq )1, ip (jive exha stivo answers
"what and wit YO" 1!1 0n1;.
wohlem of loqiral accon!--; to t lit Ito
further enhanee hy t ho I ti( anod r inee
journal arLicl is the vetlicle fo- din:ieminatin(
scientific ktuwledg :,;ince the tT,Adit Iona) iihla
cataloqn not qo (Ter than 01-43
tia n,voluilles. Secondary j urnaln, ahr;tr;
wore' published !;porine t need. Thos'' linaln
uhl i!;ti lea/ tit sot: I ; pi Thi
ons0LAations and toined ahstraet!; and 11 111-
formationob article-0
intor(rnt. They heqan
their number has hen q
same rate an the numher
1 ittei }tart. of the nine
t 0 mill)'
ptimaty 1 !_;
r around am;
ixl )114 .11 I i .11 I
prima join nal i nee the
rlt III- t' 1 ) .

Numbof units 100+11,01-3
FIiti
`foie
0
(:r()wth (t1 pr Imo amt :Jou-And 1, kotr_ i9, at'inwth yt hs 1t1t kifft.
PrIt-tt, 1'061)
n»nb1 r 11(1 ; ht. ,1 IC I 11 !;(` I flt
that t I 1 Cd I i
ary aV b j uI t
tho
'tml-
Mhoho n)-
lie int (II
sww nd.try .l3
(hp 411
ttfi/- lit rnt:tro. At 5r
pf (;och(h;
t to,Thn I (Knc)x,
tmhti,u) mo,shint.-4-oodo
Hats nr Hollytoirling hl; 1 ; it ;no
I Ito,,
ond -t iP
13

6
of content rnnyinij from -keywords to abntracts. The
lervice provided by these "Information search servites",
u1S-s,intopr94p. a iist of literature references,
sometimes with an abstrat7t of nummary, in re.X5ponse to
a query from a user.
in tJte ideal t'.i'u1 IS S provides access to "the
i../Orldns" scientific-and technical literature but in,
reality the cove'rago of tThe. literature is constrained.
in many waym. Of fen an LSS is set up With a particular
market in'mind, either 'On the basis of subject Specia-
lization or otganizatiotial constraints.
From about 1%460 to the early 1970's the main function
el thy 1S:1-!; was to provide a:,urrent awareness" s('r'-
vice, also called Selective iiiiiemination of Tnforma-,,
SDI), primarily based,,i'on printed secondary lour-.t
The umer!; of theme sprvice!-J subsOri;bed to soda--
chi by ,iuhmittinot 4n interest profile which was mat-
nlwd the periodically fs5-;ued'data bas6. The
ft Inc; list ot references was then Mailed to the
User. The ielative !aiccess of the SDI-services, to-
with the triei fhat maehine-r(1,,adable in
baf,ys wvore motiVAted attempts to Two
9." I lit. ret r(Th For the uSers
Cl Incant that a now Lntorost n search proiilo,
could he matched dq.lim;t the accOmulatea data ..base
and it only aetain!-:t lorthcominu Additions. The,
main
pLobeini \ - . 1 i t ; t- y Li nd econOin i c-..1 i I. y 1 0 1 1. 3 i b 1 o , ayts ofpi 'cowl 1 lit! I hi! ..,, , turn i to 'I IS 1 t) I ormat: ion,. Dqc-- -oi_r---; int]
cf )!i t :. t oi '- I nt (with-, t- ion ;t.,11-ilgt, gind hie telecommuni-
cations made it possibie Jo experiment and develop .
syYdem tot- thtwrcLros- -.ctive search services. Ta-
day the principal effort in the documentation field
is to devolop further the retrospective search capa-'

15'
bility ,using on-line computing technology and t6- find
economically and organizationally reasible structures
for:ISS7s'
V
There are paralleIS between the development of I's
and the introduction of secondary journals in the
1840-s, and it iS interesting to note the symmetry
in Figure 1. It is still to early to make projec-
tions for long term growth since the number of ISS7s
is dependent -on many other factors, such as compu-
ting. and communication hardware, library networking,
and,the structure of the publishing industry.
anizational Settings
Information search services are costly. Development
costs for a comprehensive search system is of the
order 1 3 million dollars. The generation of the
data bases requires much intellectual work: evalua-
tion, sifting, analysis, and sometimes indexing. Data
base maintenance is a complex operation since indices
have to be updated at e same time as the data hasp
itself. Access to the ISS requires terminals and other
communication equipment, and although its cost is
rapidly declining it is- still high.
The cost structure is --zcteri, lti cth fixed cost
and low variable cost. The former' is due to the advan-
ced technology required and the size of the databases;
typically more than half the total compute- charges
is for data lso nraintenattce and storage (barsscm.eL
al. 1,176 ) . The low variable cost i . due to the
trinsic et t iciency of mode rn computing nnd
c
ressit cnpabilitien or humaiu0. With H i cc,!:t :;truc-
oquipment (compared Lo the informut

16
Lure it is natural that "utilization", or "business
volume", is central to any study of ISS-s.
utilization of ISSTh is growing but is still not
high enough considering the high costs. There is a
substantial reliance on subsidies of various kinds.
The typical ISS is part of a larger organization,
e.g. a library, and receives revenue through the bud-.
geting process of that organization.
The'economi-,-, of information-- search services has con-.
tributed to the development of a market structure
which consists of relatively few service suppliers,
or wholesalers, and a larger number of ISS s, or
retailers, (Gardner, et al., 1974) . The "users" of an
ISS are the end-users of the information, e.g. an
individual scientist or engineer. In some cases, how-
ever, the service supplier "sells" his service to an
organization as a whole for in-house use. We can de-
sign two ideal models for the delivery of information
search services: the "public" service and the "in-.
house" service. To clarify the organizatior CI setting
for the typical ISS it can be useful to di seuss the
diff=erent e=i between the two ideal models. It should
he noted that not the n [ormation. search ser-
vi e per Organizational context which do-
t.ermiiines wh ich is the appropriate model for studying
the utilization of the system.
For an in -ho0,e service the number of users is more
or less fixed and the growth crit ti-on is the number
(It queries accoest_ to the system) . The primary
-mance constiaint is
the doe j s i on La ac:wire t:
mAdo And fin.re i . nor hop
trictly economic since
right to Access has been
or l t-#uting the costs to

other accounts. There is, however, an implicit costconsideration in the assessment of the utility gainfrom the system.
F9r a public service, i.e. the ISS's that are theobject of this study, the growth criterion is ,the
number of users since this is the prime determinantof the volume business. There is usually an eco-
"PULIC" IN HOUSE"
SERVICE'SUPPLIER
SERVICESUPPLIER
uuuuu uul u uu
AL.:ill/IC:hi 1,f SerS
t h
Own
.-lettillos for
-1 uses:
17
18
nomic performance constraint (Schwarz, 1976, and
Gardner et al., 1974), which can be explained by
the fact that the users,normallyare frome outside
the' department retailing the service, even though
they typically belong to the same sperordinate organi-
zation.'
The two models are illustrated in Figure 2.
The Structure of an ISS
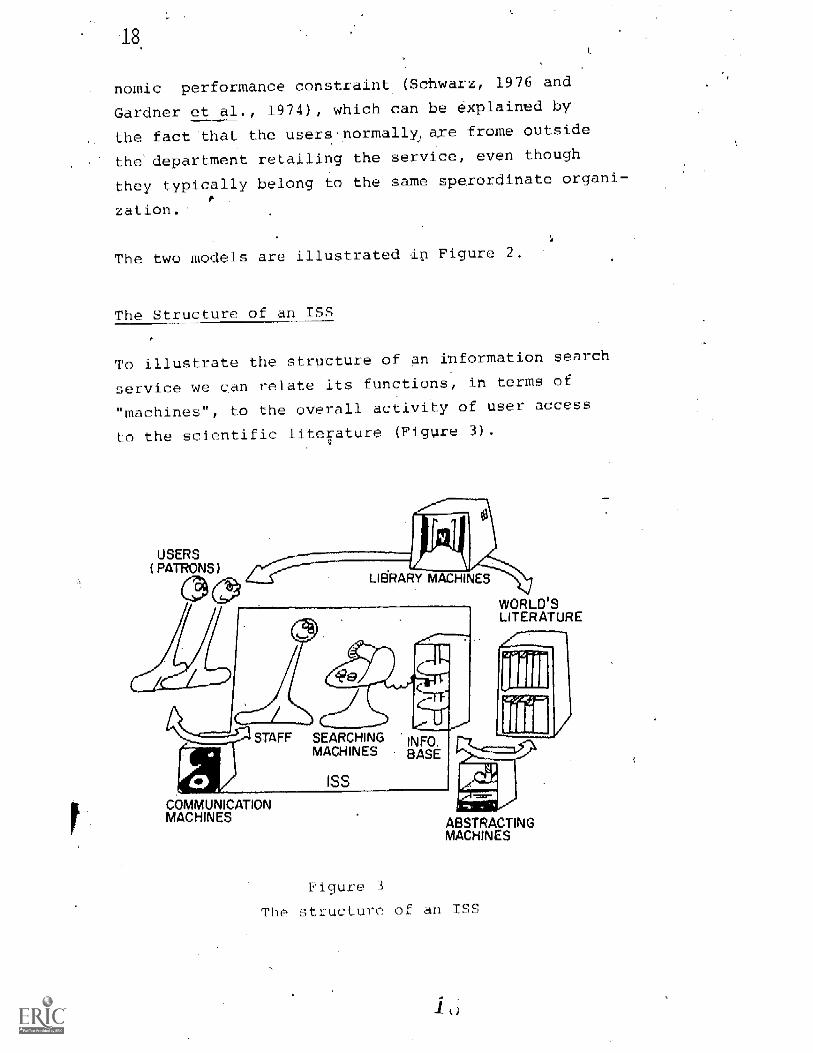
To illustrate the structure of an information search
service we can relate its functions, in terms of
"machines", to the overall activity of user access
to the scientific literature (Figure 3
USERS( PATRONS)
.HIKES
WORLD'SLITERATURE
SEARCHINGMACHINES
COMMUNICATIONMACHINES ABSTRACTING
MACHINES
Figure 3
The structure of an ISS

The ftinction of the library machines isto locate aspecific document and make it available to the user.The function of the abstraCting.machinesis to cratea- machine-readable description of documentslAnclu-ding-a description of the content, For the purposesof this study we assume that'the operation of thesetwo types of machines is done by organizations otherthan information search'services.
The function of an ISS is to respond to a query, or
search request, from a user by performing a compu-
terized seardh in the information base to locate
literature references of relevance to that reqUest.
The language used {by the abstracting machines is
different from. that. of the typical user and the first
task for the ISS staff is to translate the user's
search request into the appropriate query language.
This process can be described as finding the appro-
priate key-words dr search terms. In an on-line envi-
ronment this process is usually done in stages, sothat intermediate search results are, at least parti-
ally, displayed and evaluated and on basis of this
evaluation the search statement is modified. It is,
however, important to have the user be specific about
his search request, and typically he is asked to sub-mit his request in writing. These written search re-
quests are analogous to orders in a manufacturing
firm, and:they are subject to two primary scheduling
delays: the subject specialty of the request is mat-
ched with the subject competency of the ISS staff and
with the coverage Of the available data base. The
latter matching introduces a delay since, because, of
storage limitations on part of the information supp-
lier, it is common to make only part of the total

20
information base available at any one time. System
-down-time adds to this delay.
in all on-line!information Search services the delays
due to scheduling and distribution exceed the actual
search time at the computer terminal by several orders
of magnitude.
The actual role of the ISS staff varies: in some cases
the staff carries out the searches, either with the
user present or alone, and in other the user does the
actual searching with the staff member coaching. InI
either Case the output-of the I "i dependent onthe
Staff resources Available.

THEORETICAL FOUNDATIONS AND METHODOLOGY
Underlying theories
21
A study of information Search services and their growth
must, like any other study that involves customers andtheir interactions with the service or,business reston theories of customer behaviour. In the following adiscussionwill be given' that explores the two., factors
that attract users to the service and. how the usersrespond to a decline in the quality of the service.
To describe the factors that attract users to the sevice the needed.theory is one of the determinants of
sales. Price and quality are the two most commonly
studied determinantsbuein dynamic analyses deliverydelay is'often studied explicitly. It is posSible to
-include delivery delay in either price (by introducing
out-of-stoCk cost) or quality (by having "speed" or"availability" as a dimension of quality) but some-times this is not desirable.*
The problems relating to pricing of information and
documentation services have received some attention inthe literature and in policy making bodies. There is,
however, evidence that price is not a primary deter-minant of sales.
In a Swedish study of price as a policy tool for tech-
nical information and documentation services (Gustafs-son, 1976) it was found that price is likely to be ofsecondary importance provided. the service is seen asuseful by the consumers.
There has been little direct experimentation with pricechanges but indirect evidence can be found in analyses
of the effects of changes in price for SDI-services.

22
Hje6pe (1977). reports that when the price o the iDC
service was raised 50%' subscriptions dropped only 8%
.whic indicates a low, price elasticity. The same con-
clusion can be drawn from 4dISE (1976). thesis, where
an example is cited (p 91): for the Dow Current Aware-
ness Service- theprice elasticity of demand was found
to-be 0.19. The ,elasticitymeasure.used was the per-
centage change in quantity resulting froth a 1 percent
change in price.
For on -line services :there is no evidence to .indicate
that Price should bd4 crucial factior (Tomberg 1977 b);
when the American corporations Systems Development
Corporation (SDC) andockheed Informations Systems
IS) could make their services readily available in
*Europe they experienced, n increased demand even though
they introduced a significantly higher price.
A further illumination of the influence from price on
buying can be obtained by looking in more detail on the
findings from a Wharton School study (Wind et al., 1976).
This study was conducted to assess the relative im-=
portance of various characteristics for systems pro-
viding informations search aervices, as perceived by
.274 scientists, information specialists and managers.
The implicit decision situation for the persons inter-
viewed was acquisition of service, which is not equiVa-4
lent to the decision to use the serVIce but the study
can give some general indication of the importance of
price.
One of the results from the study was: "Price is the
most important determinant of the purchase of an STI
system. Yet, the major disutility is associated with
the very high pribe level. The move from the cheapest
level to the medium-low level- (for example, from $ 30
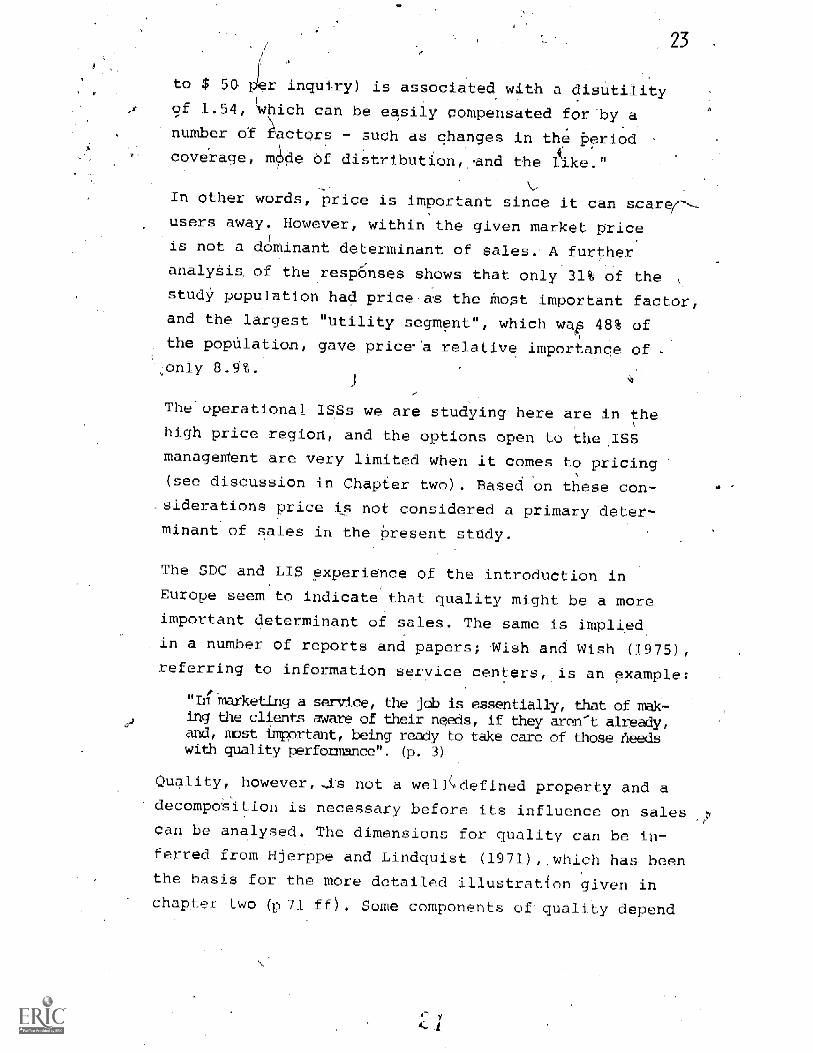
23
to $ 5G per inquiry) is associated with a disUtiliof 1.54, 'which can be easily compensated for -by anumber of actors - such as changes in the period
coverage, me Of distribution,.nd the like. " "_
In other words, price is important since it can scare(---
users away, However, within the given market priceis not a dominant determinant of sales. A further
analySis of the responses shows- that only 31% of thestudy population had price-as the Most important factor,
and the largest "utility segment", which wa 48% ofthe population, gave price.'a relative importance of -
only 8.9%
The operational ISSs we are studying here are in the
high price region,and the options open to the I58
management are very limited when it comes to pricing
(see discussion in Chapter two). Based on these con-
.siderationsprice is not considered a primary deter-minant of sales in the present study.
The SDC and LIS experience of the introduction in
Europe seem to indicate that quality might be a more
important determinant of sales. The same is implied,
in a number of reports and papers; -Wish and Wish (197
referring to information service centers, is an example:
"Irinarketing a service, the job is essentially, that of nek-the clients aware of their needs, if they aren't already,
and, most important, being ready to take care of those needswith quality performance ". (p. 3)
Quality, however, is not a well',,defined property and a
decomposition is necessary before its influence on sales
can be analysed. The dimensions for quality can be in-ferred from Hjerppe and-Lindquist (1971),which has beenthe basis for the more detailed illustration given inchapter two (p 71 ff). Some components of quality depend
. C-
4,-

24
on the machinery used, i e search systems, data bases,
and telecommunications equipment, while others depehd
.on -how the service is delivered locally, i,e how the
staff interacts with the users.
For the present study it is important to distinguish
between components of* quality that can be assumed
constant and those that are variable, since they re-
quire different representations:, the effect ofa con-
stant quality compenent can be accounteL,for by some
kind of parameter whereas the 'effect of a varying
quality component must be represented in a more-complex
way.
As discusSed lin chapter two (p.84) the ISS managers
have,limited possibilities to affect the quality of the
service as far content of data b§ses and form of out-
put goes beca se of the retailing character of ISSs. For
the establ services the system.changes that would
affect the!!', quality components are relatively slow.
The contribution to quality provided by the staff in
its interaction with the customers is important,
especially when the customer has no previous experience
from an ISS (Benenfeld, 1974 and Persson & Hoglund,
1975) -Since the amount of assistance that can be given
is depndent on the staff time available this quality
co anent can vary considerably. If staff turnover were
high it would perhaps be necessary to take the effect
of staff training into account, but this is not the case
for the typical ISS;
Staff time available lso determines the response time
of the service, which is an important ,component of
quality (Llewellen R Kaminecki, 1975; Wanger et al.,
1976, p A-6)'. The response time is also a direct func-
25
tion of the "load" on the system, 1 e the number ofusers and their demand. Consequently it can also vArS,considerably.
The conclusion from the`, iscussion of quality a_ adeterminant of sales is
represent the influence of quality in a simple way,since quality is not easily measurable but depends onfactors that are Itterreilated.
that it is not possible to
When dicussing the determinants of sal-_ the implicitassumption is that the only decision the customer makeSis whether or not to buy the product or service, alter-natively to remain a user or to leave the service.
Hirshrnan (1970) in his analysis of responses to declinein firms, organizations, dnd states considers this a
characteristic viewpoint of economists:
Vhe customer who, dissatisfied with the product of one firm;shifts to that, of another, uses the market to defend his wel-fare or to improye his position; and he also sets in motionmarket forces which may induce recovery on the part of thefirm that has declined in comparative performance. This isthe sort of mechanism economics thrives on. It is neat - oneeither exits or one does not; it is inversanal - any face-to -face confrontation' between customer and fitm with its insponderable and unpredictable elements is avoided and succetgoand failure of the organization are communicated to it by aset of statistics; and it is indirect - any recovery on thepart of the declining firm oamos by courtesy of the Invisible[land, as an unintended by- product of the customer-s decisionto shift". (pp. 15-16)
The opposite of this "exit option", as Hirshman callsit, is the "voice option" which has been studiedprimarily by political scientists and sociologists
mostly within frameworks which de not include ecoiomic
considerations:
The ,wo options sire defined as follows:

26
step buying the firm p_ rodue
members leave the organization: this is the exit ion.a result revenues drop, membership declines,
gement is impelled to search for ways and means towhatever faults gave led to exit.
2) The firm's customers or the organization'stheir dissatisfac on directly to management or toother authority to which management is subordinate orthrough general pro test addressed to anyone who cares tolisten: this is the voice option. As a result managementonce again engages in a search for the causes and possiblecures of customers' and members' dissatisfaction". (p.
kirtIhman argues that in many cases both ns are
available to, And exercised by, customers of commercial
firms or services.
Consider inq that ISSs do lot operate in a market. eco-
nomy and that they show resemblan--, s with membership-
tYpe organizations (e a particul r universiLy commu
ty) both factors which encourage voice e adopt
Hirshman's theory-as one basis for descrihAnc user he-
haviour. Specific features of the organizational
setting of
point are:
There are
which support this theoretic I viw-
The monopoly -like charactei: an ISS.'
illy no real comp°
said that the w(
members
pointed
organi, and the
kind of aft iliation
of voice channels. F -stly
I COMpe
it is sometim-
"no-une".
ellaraeteristie cif the g6nsur fl-
out earlier an ISS typically belongs
A part
L., AN war':
a lar,101-
o f the s _view have some
inter
col. I Hxi!itt.nt
W 1
and user is personal which makes it easy i o nse v-
LOC,10C
and secondly I-SSs 1 solicit eva l tla t ive d-
back from t usor!.; 011 quo!..;
other etlized wa
iron in WW

27
isisfLtl!j±j
Wc have f oun1 that for :i t?uc1y of TESs thto r: I s a need[or '-intormat ion aliout eLI t'ct:s that are not easilymasirah to. [ii part iou la r qua 1 it y is q it cu 1 t to measureanc nijst be ina 1 'st'1 I ri 'i fliurt' ollipi OX Way
The informat ion souro(aV-i 1 lab I e ii / however, givemuoti I nforma t i cri 1 i ror t tv i it ed fr such a c'omp1ex
tulv. rho d i t t iou I t 1 ca :otill I e ri 'a when L ryi nq Lu ut t
1 i' ptibl i litth stat i st tea I rum opel it )11I 1 IS: arr';hic WI i n t lit t u 1 1 ow i iii t is:; i
i vti,j 1 1 S:;iit' 1 el a I I I y new - Al I hionqh oil 1 tnt'itt r ieva 1 system:; iv&' b°en ('St i1i1 j ti&l :; iic' ibout
1 ilhR ;y:;tt'ui HeVt' lupiitt'iit Cur put it ion st iRly (W1lTt'L t'tj1, ')i :;iiuw:; thit OXI I-lilt) I iiltinit ion Si'YVICC'S
oil I lit' iVer1qt' liiVt' t't'il III ojirat 1011 0Iil a
utijlt' ot yearS o I hi' tnt oritilt lull last' I or 1 St utly
1 Is t a i rly siiii I I , 1 iuh1t'iii wli jolt is vr:;t'nudI y t li 1 lOt; lilt'I: lilt 'lilt 'Ii I :; iiIii I: mint i:; I jl I I i; hen)
I U It mole; hi p II I I vU 111 auvh k V Vii I tb I ':; as "i11(1 (0 t I e csiri me, i U 0 11 umH r. [ I hi rep; Iii I I
iIiJiLe't lv .i 1It5tit'11Vt' 1 1 li' iiiitkt't sI I iiVt tilt' nI'lS0155151 vat I it'! = I lit' jihi lit' procitiovi:; impost' Ii I t.'it'ltt
iitIi I miii:; 14_I tlit ivai Iihi I I ty ot tht'i I Clot -I l5l5t,pi 1111111
Lli It ti tiit toyl I y st i hot itt t':;, tiid I fII :n'1 Vu-i'
:;iil it'I:; lii:;:; 11 I llt::t' iii I tt'it'lt-t':; tn I lit' 1\tiillitntit a oust it' I a I 'd pt i.' i itj I lt I o III' I it 0'&I I ii ket'p
SepIitt i'tVn'nt!iitI , wit mb iii selilt' 0tst':; wI I 'I it'rl to 01151 5 't'.irHt r'jiiest I'Iti itimil si v: ,;t'vt'iil qil-1 IS.titt I 0; ; 'm [' I a i It ni I i lu I lit' n SOI I I I lit' Ii .1 Si I it'
(Sitimtte'dl i5 111010 1 Itait utit' t15t'i II ;t'v't ii ii;it'i hit t'1U I w i 1 ii I lit' I 5 1 liii ii Ot It' 1 t} es;' ii I a I i \'m' i I h 'i
Out nil '' act I cal I I ' 01 b ii I trio Ut 0 i I y ; lit i
Si' 110111 '11111 ii :01.11 aI 'I y. To ii -itt I tn, I It

28
difficulties clvec analyzing available numerical
nformation from fact it is collected-pTima-
rily for the bo Yk eking functions of an ISS and, not
-for the manzweriai functions.
Descriptive, clttlialitFiti.vo, information about ISSs is
available fro:c1 number of sources: annual reports and
other;-411peraffiowa statements, conference proceedings,
and rna Often this information consists
DI sub je<ctive acco, its of experiences from ISS opera-
ttons. Study vi.J; ii i t iici -,sporidonce are other sour-
eos 'this kind of int( co ition.
information sources also contain some quantita-
tive information about the ISS operations and perfor
hut the definit ion of variables and their measure-
Ment vary from case to case_. Problems such as these are
not unique to st 'dies of ISSs: Stouffer (1962) Charac-
the ctato cif social science as extremely complex,-
And they "inv I vo valuer: that s(mwftimes. put a s on
the c}t- h(tiviIy c I the investigation" (p. 2911,
Kap ) no s (hot of ten masurements are made
a n't!'l
ft I hs I li.imi sci ntific itiqu "flit' present
examifle of this cis iscussed above.
well clot filed in ut :al i-iifc trmat.ion does not
however it tit t hat i scient t I ic inquiry ms impossible
Glaoi Strauss (1 htS) example, advt cates- an
al roach theory buildino Ulcat is based descrip-
tive OA t ion r cher than conven tonal datarm
'olloction.
Takit
tind I)( oNp[OrO Ater the po ssih.ilities
con I m'ni"t ink! A rh CihoU i'I Voii Cho relatively
of a!:--; a stai
29
U0Otructured character of the empirical evidence avail-able. In the following we will let "data" denote in-
formation thtt has been'c ed.according to some we
defined scheme ,,usually such a scheme is based on a
:numerical scale but classificatory schemes are some-times used. We begin by discussing scientific theoriesin general and then look at the relationship betweentheory and data availability.
We adopt Brodbeck' (1968) definition of a
dedUctively connected set of empirical gene
y as a
rations:
it is possible to- refute. theories and they are,thus
hypothetical. Theories are constructed, and the waythis is done is in essence the content of the worksby Popper (1968) , Kuhn (1962) , and Blalock (1969) .
'Huhn takes a political macro perspective on the process,
popper a philosophical, and Blalock a practical. A
theory can be assessed according to several criteria:
robustness, generality, replicability, precision, use-fulness, and others. Popper' discusses the properties ofa good scientific theory, and sums up the discussion
(p. 37): "the criterion of the scientific status of atheory is its falsifiability, or refutability, or
testability". This gives some implications for the
relationship between theory and problems (to be sub-
ject to scientific inquiry): if a theory is made too
general it will almost always be true such a grand
theory escapes falsification but at the price of des-
troyed testability (and also their explanatory p
is small). Merton-s (1957) and Zetterberg's (1965)
advocacy for "theories of the middle range" can beseen in this context, even. though part of their con-
cern relate to data collection. Stouffer (1962) brings
in another constraint, that of limited resources avail-
able for the inquiry. This in turn relates, to the

i'tion of the subjectivity of theory construction:
it is a creative act by people. And since theories are
some rm of generalizations of (a perceived) reality
the subjectivity of observations follows.
Weber (1968) states that an obJectiNe analysis ofeUl-
tural events is an impossibility, and that all know-
ledge of cultural reality-is always "knowledge from
particular paints of view" (p. 92).'
Thus we See things (observations) but'what we see is'a
function of our point of view (like a theory)., and we
might pursue the question of which comes first. Popper's
reply is that the Observation cones before the hypo-
thesis but is preceeded by an earlier kind of hyp07.
thesis (p. 47)..
Glaser and Strauss (1968) see the connection between
theory and data as not always desirable:. "theory based
on data can usually not be completely refuted by more
data or replaced by another theory... it is destined
to last despite its inevitable modifications and re-
formulations". (p. 4).
Another problemthat has a bearing on the rela_ionship
between theory and data is described by Kaplan (190)
as a "choice between mapping his data into a simple
order and asking his data whether they satisfy a eim-
plc order-" (cf. multidimensional scaling) . Popper
(1962, p. A6) lOoks at the same phenomenon from a gene-
ral viewpoint and states that we try to discover simi-.
larities in the world and te "interpret it in terms of
laws invented by us". This view is also essentially
what. Kuhn characterizes as the way "normal science"
Work.

31
Taking these different aspects of the interrelati onshipbetween theory and data into consideration we can con-
clude that it is possible to construct a scientific
theory even though there is not much well defined nu,-
merical information available.
The impact of data availability on theory, construction-
can be summarized:
A "data-bound" philosophy of theory construction,
will limit the options for theory building, but
the resulting theories can, if the variables are
selected properly, have-higher usefulteSs since
optimizations are possible.
Adata-freeapproach.has the adVantage that by ignor-ing the problem of data availability it can address
relevant-problems in explanatory theories.
Another difference between the two approaches is what
'procedures. there are for increasing confidence in the
theories. For a theory that is constructed from data
the normal procedure is to apply statisticaL,procedures,
and to secure adequate and proper data, i.e. choose an
experimental deSign 'that controls external,factors
,(Campbell and Stanley, 1966). It should be pointed Out
that the statistical (probabilistic) model.of.un-
certainty is not the only possibility: Scbweppd (1973)
preSents a model in terms of "unknown but bounded". vari-
ables, and the theory of "fuzzy sets" is another. These
other mothods have, hOwever, not yet the same developed
apparatus for hypothesis testing but deserVe mention
as possibilities.
For data-free theories the established statistical pro-
cedures cannot be used to increase confidence, which'is a
drawback when it comes to "marketing" the theory. How-
ever, the more important aspect of refutability of

32
the theory still remains, since the theory could be
shown/tO be false by further Observations.
Given these considerations regarding the availabl
pirical basis ad the relationships between data and
theory we believe that it is passible to make a valid
scientific invuiry into the behavior of ISSs, and it
is the research hypothesis of this'' study that the in-
quiry can be done by using the system dynamics metho-
dology (Forrester 1961 and 1968).
SysteLAID2,121cimodelitSystem dynamics, is a vehicle, or a methodology, for
theory construction and it shows great similarities to
the "hypothesis method" for scientific inquiries ip the
natural sciences (Hempel, 1972): the goals of a system
dynamics study is to analyze an observed phenomenon
and give a deeper understanding of its underlying pro-
cesses, and to make it possible to make predictive
statements regarding the phenomenon these goals.corre-_
spond to the characteristics of a good theory given by
Hempel (1972, Chapter 6.3). When the study is of a
system subject to human decision-making this last_aspect
is pursued to arrive at recotmendations for mproving
the performance of the system.
A scientitic inquiry is a process characterized -by
.parallel activities anditerations. We have already
c1sOuSsed the interplay between theory and data: how:One
tries to explain obsekvedpheno ena'with theories, and
how theories determine what is observed. The hypo-.
thetical nature of theories does not. change even though
their content might change,. A theory is a set of inter-
related hypotheseS and as the Scientificinquiry pra-
gresses the set will change: preliminary hypotheses are

formulated to guide information gathering (observations)and'are,rejected or .modified if they do not lead to
an acceptable explanation _of the phenomenon beingdied. Analogously it holds true for system _dynamics
modeling that the process is characterized by iteration.. between observation, Model'forMulation (hypotheses), and
simulationkuns (tests). "When a6ystem'theory takeSshape as a simulation model,-_its behavior predipitates
more discussions:and bring's out additional- supportingand -contradictoryinformation that helps refine. the
theory" (Forrester, 1969'yp. ix).
Different types of hypotheses are formulated in a system"dynamics study (Mashayekhi, 1976).
Reference behavior. A System dynamics study startswith what is called a "reference made of behavior"i.e a description of a problem in terms of how
system.variables develop over time. When the time'horizon for .the description of-the reference be-havior is in the future, as was the'case in, the
study Limits to Growth (Meadows- et al., 1972),
the reference behavior 'is a hypothesis. the sameis true when the description is of variables which
have not hitherto been observed, or which are notpoSsible to study directly (seenext point).
b) Boundary hypotheses. When the boundary. for themodel is drawn-implicit assumptions about what isrelevant for the study are made.These assumptionsare sometimes based on established empiri-cal knowledge. but are often hypepetioal.
Structural hypotheses. Sometimes hypothetical re-
lationships between variables must be formulatedas part of he model building, for example of the
314
type "an increase in A leads to an
where A and B are variables in the
studies might have omitted certain
increase in B"
model. Earlier
relationships,
might-not
, an which
or .even important variables, so there
be any established empirical knoWiedg
to build.
d) Hypothetical parameter values. the same reasoning
as for .the relationship between variables can be
applied regarding. parameter valves.
Regarded as a theory-a systeth dynamics mode' can. com-
tribUte to a generalization of earlier knowledge by
providing a unified description of different occurences
of- a phenomenon.. The model can also make earlier know-
ledge more -detailed by showing under what circumstances
earlier explanations are valid; It is-often true that
when-a deeper understanding of a phenomenon-is achieved
"tru.hs",turn out to be "half-truths"..
A system dynamics model, like simulation models in ge-.
neral, can also increase the scope of existing know-
ledge since it is posible to simulate changes in the
model. Sometimes this is not even necessary: a thoroUgh
analysis of the simulation results can both point out
and explain aspects that were previously unobserved
From this discussion it seems that system dynamics can.
be used to astudy complex problems and give inbreased
knowl#dge about the phenomena in question. particu-
,lar we find it reasonable to assume that system dy-
namics modeling is an appropriate methodology for mak-_
ing a scientific inquiry into thebehavior of informa-,
tion search services.

35
The process offormulat_nga simulation model. can be
desCribedap follOw6,A.-phenOmenon. is observed andstudied and pidliminary hypotheses are formulated. Re-_
. f'garding-structuralhypotheses and by para7-meter Values it is primarily -4 question= of inductive
reasoning:_the goal:is to findsohethingresembling a
general law..The.preliminary model is teStedl)y-deduc-
tive reasoning: if the Model ia,valid.the-re4illts of, -the simulation run must resemble theobservations,of
the real -System. That the. model willreproduce.the "r--ference mode- of behavior",-isthe Minimum requireMeht.
In addition the validity of the model must be tested
in some way. There are ho established norms for howthis ahould be done. The appropriateness of different
tests depends on the: character. of the problem or,pherio-.
nienoni if one wants-to explain instabilitiesit couldb appropriate to subject:the model'to,iloise or stepfunction inputs, which is not -directly.yelevant when
one-dpstudying.longtermgroWth problems'. In either
case one should examine how the behavior of the modelis changed by Changes in parametervalues- to make sure
that the simulation results are not the consequence of
a "fortnate" combination of parameter values in an
"'incorrect'' structure.
The model is -tested and refined, I. e. the, preliminary
hypotheses-are changed, until the model can give an
adeguateexplanation of the observed phenomenon. Cri-
teria for acceptability is a question of credibility,and as for other scientific theories credibility is a
function of the scope and character of available facts.
In the cases where the "reference'tmode of behavior" refers.
to the future, and hence is an hypothesis, confirmation
cannot be made:by direct observation. This does not
36
mean that the hypothesis is without emp riCal content.
(of. Hempel, 1972, p. 103), but it can only be confirm-
ed indirectly, i.e. by confirmation of the model struc-
ture which generates the behavior. For this type of
study a test implication is to "wait and see" and in
some cases this Can be used for confirmation of the
hypotheses.
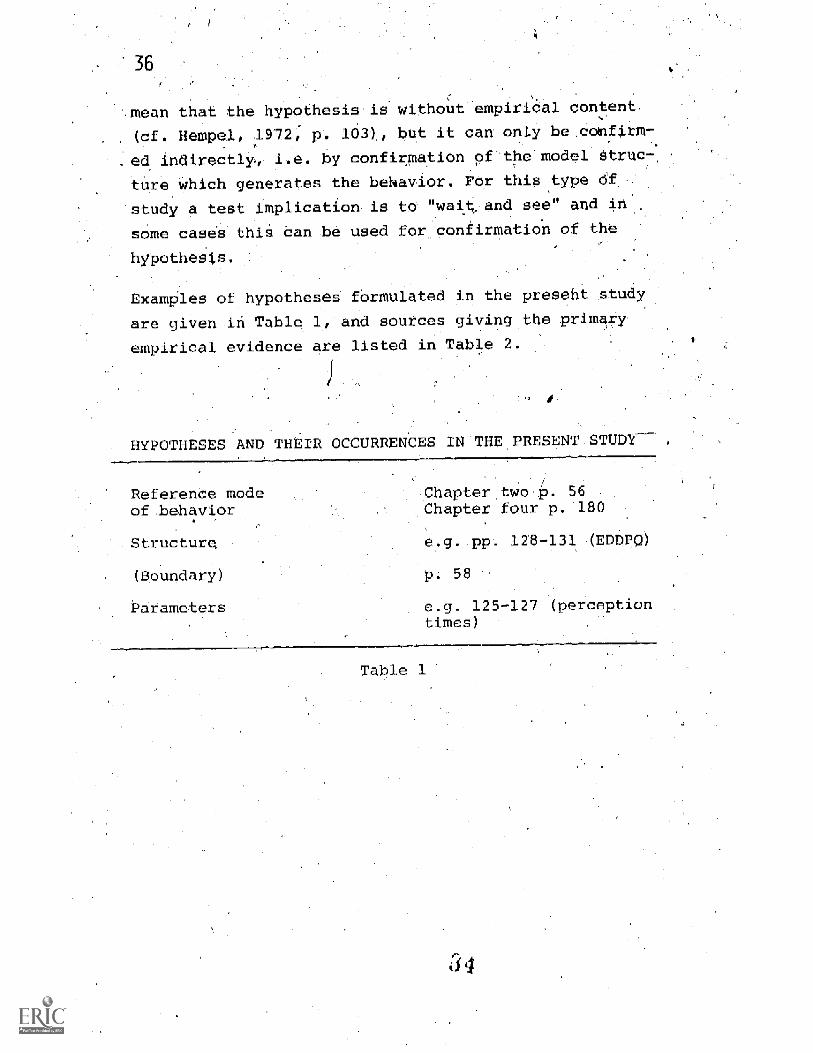
ExamOles of hypotheses formulated in the preseht study
are given in Table 1,-and sources giving the primay
empirical evidence are listed in Table 2.
HYPOTHESES AND THEIR OCCURRENCES IN .THEPRESENT.STUDY
ReferenCe modeof.behavior
Structure
(Boundary)
Parameters
Chapter two-P. 56Chapter four p. 180
e.g. pp.. 12'43-131 -(ED613,0)
p- 58
e.g. 125-127 (perceptiontames)
Table 1

HYPOTHESES. AND EVIDENCE FOR 1552 (Examples
Referen e. mode
Structure
{boundary)
Parameters
Brown,. 1977TOmberg, 1977--:Published: Statistics
SDI statistics
Sirshman, 1970Wander et_ai.-, 1976
Llewellen and Kaminecici, 1975. -
Wind et al., 1976GustaNiWi, 1976
Benenfeld et al., 1975.Hjerppe, fM-
..Ljungbei'g, 1915'Pensyl, 1977Wanger. et al., 1976Ware, 1973Publisheclstatistiaa- RITL -IDC
NASIC/MIT
37
NASIC/MITRITL-IDC
RITL7IDCCISTIUGACC
Table 2
(
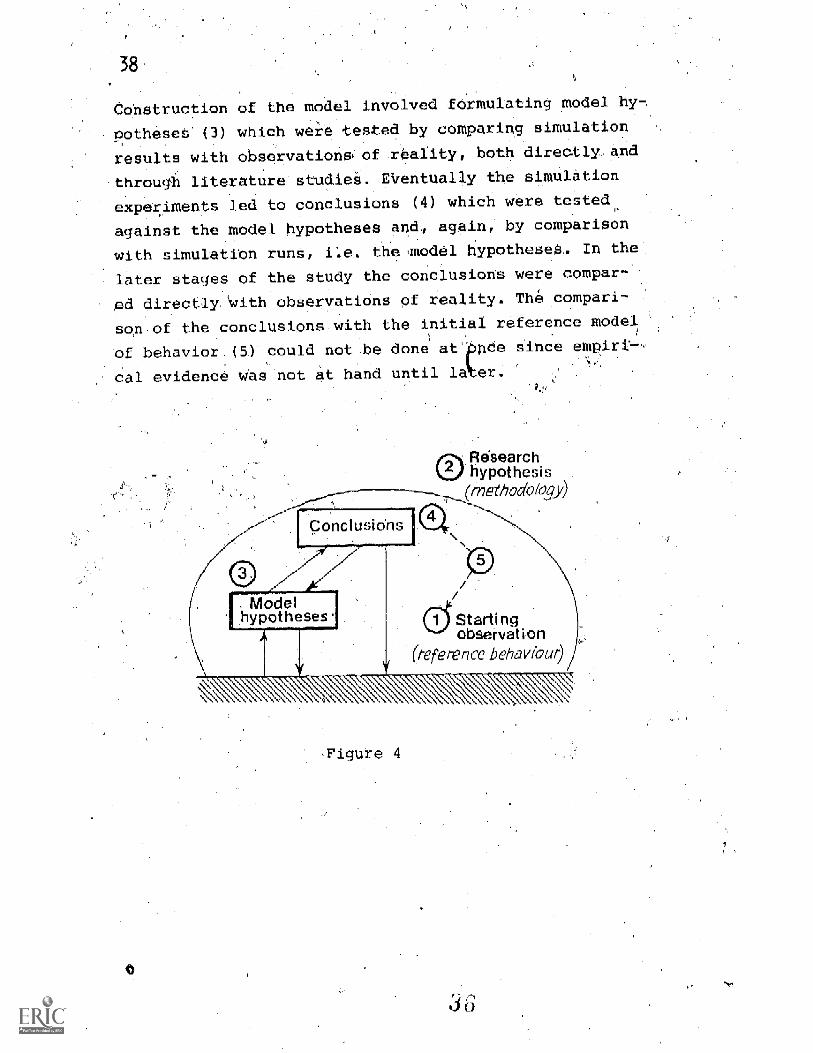
The different types of hypotheses discussed aboveoan interrelated set, or 24:1JILlaykathtat, which isillustrated in Figure 4.
This:study Of IS5s Started with.an observation that the ,
typical 158 was facing a decline in growth (1)', and an
hypothetical "mode of behavior" was formulated. ,Since
system dynamics had proved `to be of value for simila*
types of problems, and Since its application-was covenient, the research hypothesis (2) was that syste
dynamics would be an appropriate methodology.
38
Construction of the model involved formulating model hy-
ootheseS (3) which were tested by comparing simulation
results with observations of reality, both directly and
through literature studies. Eirentually the simUlation
experiments led to conclusions (4) which were tested
against the model hypotheses and, again, by comparison
with simulation runs, i e..the'model hypotheseS. In the-.
later stageS of the study the conclusions were compar-.
ed directly'with observatiOns of-reality. The compari-
son-of the conclusions. with the initial reference model
of behavior.(a) could not be done at
cal evidence whs.-not at hand until la er.
nee since empiri-,
Researchhypothesis
ocio/ogy)
,.Figure 4

39
III. ANALYSIS OF GROWTH OF INFORMATION S ARCH SERVICES
A first attempt tb explain ISS behavior
As ISSs became establiShed it _gradually became visible
that they were' facing many of the,problems that the
SDI=-service had, in pafticular it seemed that.the,'
growth in business voluthe was not enough to secure the
inveStments necessary to achieve selfrsustainability.
One commonly advocated remedy was to spend Teseurces'on marketing. HoWever, as Was the case for the SDI-
serviceS, a Concentrated marketing drife usually,=gave
an-overwhelming response that the ISS had difficulty
absorbing; the result sometimes was that there was a
substantial degradation of the service, in terms of
response time, whidh took ij .relatively ong-tiMe to
compensate.
On these premises- the study DMISS was started. The
problem to be investigated was that of '!ihsufficient
growth ", and the working hypothesis was that the'pr&-
biem could be explained by aeanalysis of 'managerial
policies (DMISS, p. 11), in particular the resource
allocation trade-off between marketing and production
was .investigated. The simulation model ISSI, was'deve-
loped based on literature studiesi study visits, inter-.
views and correspondence with ISS managerS,-In parti-
cular the NASIC/MIT.service was consulted.:'.
With ISS1 it was possible to make an analysis of the
basic growth mechanism. -for an ISS. F r the case when
the ISS resources, primarily staff, are constant the
study represents a relevant theory of-ISS behavior.
Although not a typical situation an ISS is -sometimes
set up as a research project, or an experiment, with
a fixed budget. What seems to be the root of the mane-,

40
rial problem is the different 441 in of the users
ed far assistance and _, production i.e. search
g: at firAt it is relatively easy to give both ade-
quate assistance and response time, but later the SS
has difficulties in keeping the response time Short.
In other words it seems that by doing the necessary
marketing the ISS ends up being oVerpommitted.-pegar-
less ofwhatthe,ISS hanagement does at the tim'e it
will cause user disappointment. in some way. (DMIO, p.
47) . Trom the simulations'.with'ISS1),t seems that the
size OfAhepotential.marXet is crucial (DMISS, p. 50)
thiS Could be an important decision variable, if it
contrgliable.by-management Regardless, the simula-
tion results raise the question whether the focus on
OP number of queries, and not on the number of users,
gives the,appropriate basis for decisions regarding
ISSs
The analyia o_ S's when resources
are variabl theory (AMISS, p. 52 ff.)
gave two general.conclu ns:
1) that the behavior of the ISS is fundamentally
different when resou-_-,
p.:61) , and
2) for a definitive a
have to be elabOra
ces are made variable (DMISS,
alYsis of ISSs- he. m- 1. would
The model ISS 2 described in chapter
such an elaborated model.
and study visits revealed
ambitions to be profit ma
recovery seemed to be typ
for GDISS is consequently
and the purpose-of the pa-
:wo constitutes
Furth -- iterature_studies
hat few, if any,'ISSs had
ing rather partial cost
cal. The probleth statement
different (see pp. 56-57)
-r is to present an analy is

fNUMERY
DELAY
PERCEIVED
ELY .POTLNI1m,
USE115 c.
Qs
r1OFINc,11
TO ()UMQUERY
HACKLoc,
AvviMck
0E10
INCOMING
OuEtHES
U4U3
ANWRRATE
QT
INCATED 190[1.1C7rA
Ft? (.4P'(;:Ty
mARKETN1 r5L-A.r.F1C
,ri:\
FRACTIONAL,
41L.LUCZION
.-CF srAFF TQP.HOWCTICN
A(.0,..-1710P;
0,-1,) mwiKrrircr;
sTivr
Figure
The f edback
INU.5,1N(i
011,RIES
wII
Ill 5UPPtvii
511
PEP siArrHAN)
\kErftlio,CO'T;1 RAIL r
rail ALA
11,1(11 'LL110'
I R32
WiTOMIRS'
EVALUATION OF
5ENvi(r,
.? cl
IIIIVIIIY '1/4
DO -,Iv 1Y
t )101y
10001)1:I:ON 11(,'LIV[0 fly
CAI)A(1,1y MC.N1G(mmt
` ,LAWI I Avl
11I f; I {I I. (
1111(1.r., ((l' '2)1;0 '
,LIT.,'"'IL;11
42_
of causes growth behavior ISSs.
The analysis of,ISSs, and in particular the analy
of the effects of different parameter. values, pre
ted in AMISS represents a test of the basic structur
of the ISS/user/funder system, and the construction
1S$2 builds on this test.
In chapter two is presented a systems theory of
ISS/User/funder interactions that determine the
havior of ISSs. The system description consists of a
verbal description and figures illustrating the feed-
back loops involved which are reprinted here (Picture
In addition a quantification of the relationships
between system variables is needed; this is given in
Chapter three of this report.
-5
The quantified model represents a synthesis of infor-
mation from study visits, interviews and corresponden-
ce with ISS managers, and literature sources.
The simulated ISS grows rapidly in terms of number of
users for the first 60 weeks, and then the typical dec-
line in growth occurs when the number of users is about
800. From then on growth is significantly slower but
the ISS satisfies the Cunder-s economic requremeuts
and is not doing too badly in keeping Lhe doliv(Ity
delay at the rnornt so the service expands and bar, a
staff of 4.4 at the end of the simulated time perpe_rled
of 240 weeks. The number of use rs at th,117. Llme t 1117,
which means a market porchat ion of 57 per 'Vita ISS
teeeives 3') search rogue!,to, i.o quer cs, per mid
the number of now users is per week , whieb 1
the perc ent le "FeLurn usot n"

VARIABLE
(f)
6kro
!KOWA QUERIES(QUER'r RATE 0,
/I.."/EFFECT FROM MARKET,. PENETRATION ON ENTRY PATE..
.._ -1...-
VARIABLE
rEFFECT FROM DELIVERY DELAY ONTHE SUPPORT FROM FUNDER
(5)
EFFECT rRONI MARKETING AND"ASSISTANCE ON ENTRY RATE
CE)
E'',"r-P,'; RATE
USERS
(Li)
fiL 24.3
TI (vii:K)
(41
EFFECT FROM DELIVERYDELAY ON ENT,RY RATE
00 L
(3)
rC.A1EiY-
CN H [7 FbITY 10 QuEF:7::
ERFECTI*kECONOMIC CCNST4IN7
0 80 160 240
Figure 6
iesu1ts from simulation with IS52
TIME (WEEKS

Results from computer simulation with 1SS2 are given in
Figure 6. The behavior of the simulation model is rea-
listic in both qualitative and quantitative terms, as
verified by interviews and literature sources. (Brown,
1977; Wander 1916; genefeld et 1975;
Tomberg, 1977-a).
analyzing underlying forces, contained in the
systems theory, it is possible to explain the behavior.
One explanation is given in Chapter two (pp. 76-84)
and in ECISS (p.181) the explanation is given in more
general terms. This latter explanation is made on the
basis of a more aggregated loop-diagra (Figure 7) andreads:
Loop 1 is typical for business and service activities; asbusiness volume goes up, expansion is needed and more resour-ces acquired which makes it pcIssible to handle more busi-ness. Loop 2 is the., - congestion loop. As business volume goes
up, the fact that qdeues develop)males the service less at-tractive and discourages business. IS8s,s,Casily becaTe con-gested, and at least part of the reason" for this is a focuson search requests instead of users: capacity planning isdone on the basis of "how many Questions can we answer? rather
than "hownuny users can wo serve?" The point is that accept-ng a user should be a long term conmdtment. Until it is seen
aS such, we can say that too many users are admitted to theservice. This, of course, would not be the case if the spon-sor would expand the resources for the ISS quick iy enough.However, the typical sponsor wants to be sure of an establish-ed need for more resources before he grants expansion (will-ing risk capital isjadeed rare) , but by the time U need isestablished, there is already congestion, which also hindersexpansion (loop 3). One reason for the latter effect is thatthe "eAcess" nimixm: of users reduces the throughput, sincethe JO staff is forced to sptind time on user assistance,whidn'will lower the-revenue/cost ratio and activate economic
'e1-n on the part O1 the siponsor.

45
EXPANSION
CONGESTION BUSINESSVOLUME
Figure 7Structure of 16S2
An analysis of managerial decision making for ISSs is
also given (see pp. 84-91). The concluLon and re-
commendations from this analysis can be .,iilimarized:
Management focus has been on queries, instead of
users which has had a misleading effect on plan-
ning and investment activitied.
The importance of the price-mechanism has been
overestimated and not- understood (a conclusion
from the literature studies).
- The possibility to expand, in staff, is hindered
by the doublebind of queues which are needed to
justify expansion .and at the same time discourage
users.
- Marketing and assistance can have a negative
effect on sales; Mere is a possible "marketing
trap" (which is par-tly a function of the first
point: focus on g cries and not users).

46
IV. IMPLICATIONS FOR THE AGGREGATE INFORMATIONSEARCH MARKET
In general growth forecasts for the computer-based in-
formation services market have been optimistic:
"The market for these services (bibliographic and documentretrieval systems) is expected to grow to a substantial Sizesome time during the earning decade. This market is presentlyin a period of rapid growth of the order of 30 percent peryear Such service is presently limited to libraries, butthe price is already within a range acceptable to many busi-ness and professional users, and an even more rapid growthcan be expected when this type of service is made availableas a part of a package of services tailored to the -needs ofthe individual user who is not a computer professional."(Program in Information Technology and Telecommunications,1976, p. 16)
One. of the results of our analysis of ISS growth (see
the previous section) was the identification of several
common misconceptions regarding the operation-o_ ISS's.
Briefly described these misconceptions are:
- The leng i of time a typical ISS has been opera-tional is often overestimated. The consequenceof this could be that an initial, transbient,growth might be believed to be a mature, stabld,growth.
The number of searches a person can perform inweek, say, is often overestimated.
- Too much reliance has been put on pricing policiesas a control instrument for the growth developmentof
- In most ISS models the representation of the usersand their influence is too simplified and, ingeneral, too little emphasis has been put on fact-ors outside the ISS itself.
In ECSISS (reprinted in Chapter four) the consequences
of these misconceptions are discussed. It' is claimed

47
that the model IS S2 is a releVant model of the growth
development of an ISS, and the implication is that since
a typical ISS will experience a stagnation, there, are
reasons to question the optimistic forecasts. Since the
growth of the aggregate information search market is de-,
pendent on other developments, e. g. in the publishing
industry andthe integration-0: ISS-s'and other infer-.
mation utilities, a stagnation in the market is judged
not to be inevitable but likely.

L18
V. GENERAL CONCLUSIONS-FROM THE STUDY
By- applying the system dynamics methodology to the
study of information search Services it has been poss-
ibleto attain:
-,A deeper understanding of the mechanisms thatdetermine the growth behavior of ISS-s.
- An Analysis of managerial decision making that_gives recommendations for policy decisions.
A basis for assessing the development of.theaggregate information search market.
We find these to be good indicators of the applicabi-
lity and suitability of system:dynamics for the study
of problems relating to the growth development of ISSs.
Like many other research activities this study points
to other ardas where more research is needed. The
analysis in Chapter four indicates that the investment
function is of great importance for an ISS when-egard-
ed as an economic system. Considering that there are
indications not only of a temporary stagnation, which
we have shown, but of a poSsible decline, which is
shown by Tomberg (1977-a) see Figure,8 - a thorough
study of the economics of the whole market is warranted.
To make this possible more research is needed in ui
formation economics ", which is defined by McDonough
(1963) :
"Inforation economics is the study of the allocation ofcertain scarce resources of an organization to achieve thebest decisions for that organization. In particular, infor-mation economics concentrates on the allocation of resour-ces for the storage Of knowledge, _for the obtaining of in-formation through data processing, and for the effectiveutilization of both stored knowledge and processed'informa-tion by individualS in the fi

49
.ii
1 000
000
800
700
600
500
400
.rober of f.etrices
1976 197
Figure. 8
The number of European .ibliographic on-lineservices and average number of users since1969 (=100) (from Tomberg, 1977-a) .
1977
As the present study has illustrated an ISS is best
studied as one part of an integrated ISS/user/funder
system, and without an "information economic" coupling
to the users' organization any real understanding of
the economics of an ISS is not possible.
At present the options available for the ISS management
are relatively few with regard to service offerings\, as
was discussed in Chapter two, hut.this situation i1
changing. New service features are being introduced
which will make it possible for the 'SS"- to offer,ydi-
versified service. For the managerial decisions inVolv-,
ed in the selection of "service mix" a more thorough
knowledge of the users' preferences and behavior is
needed.

50
Finally, it is to be .hoped that .this study of be- dyna7
mics of ISS°s.can-give some motivation for .ISS managers.
to spend:resources on collecting more detailed statist -
ics about the 155 operations and user behaVior. The
.theory presented here Is general in nature and must be
complemented with speCific information about the user
population of a particular IS$ to make it possible to
Fudge the applicability of the theory to the specific
case which can guide the managerial d-cision making for
the ISS.

51
CHAPTER TWO
GROWTH DYNAMICS OF INFORMATION SEARCH SERVICES

NTRODUCTION
53
Information search service of the kinddese ibed in
Chapter one were', and still are', considered an effi-
cient solution to the problem of access to:the scien-
tific literature. Usually the ISS's 'experienced growth.
.in the number of Users. Sometimes this growth was
quite. dramatic. However, by looking at the situation
a bit closer it was possible to find reasons,to be-
lieve that the rapid growth might not prevail.
For example, preliminary analysis-,of unpublished
statistics showed that at the NASIC/MIT service growth
was slowing down. This observation was later confirmed
in the quarterly reports. The development of the number
of searches per quarter at NASIC/MIT is given in Figure
1.
searches/quarter A
NASIC/MIT
100
300
200
100
Dec -75
Figure 1
The number of searches /quarterat NASIC/MIT.

51.1
We see that with the exception of the summe 1974
the growth during the fir two years folloWS what
looks like an exponential path,. and then show relax --t
tively little variation for a period of year and
a'half, after which growth seems. to esu
y inspecting the :statisti.es from the "Royal Institute
Technology IDC we can see asimilar development
although not as clearly. The development of the number
of search requests per quarter at RITL-IDC is shown
in Figure 2. The summer of 1973 this service was
offered free of charge within the institute which
accounts for the high number of search requests during
the fourth and fifth quarter. If we discount for this
we can see .that the growth during the first two years
is almost exponential.
search requests/quarter 'DC
Q(t is
numper guar er
TrotRITL-I C.
=/6
sts

55
The starting level seems a .bit high but this can be
explained by the fact that the on-line search servicebenefiCed from being associate with an established
S.DI-service; .there was already a market for biblio-
graphic information and there were established channels
for the. marketing. From February 1976 the growth devel-
opment looks very different from that at NASIC/Mir. Thereason for this is that the operations RITL-IDC/changed character in a fundamental way: a Communica-
tions node was installed which enabled users who had
access to dial -up terminals to search directly fr cave
these terminals and not to have to go thINiAlqh the
RITL-IDC service. This accounts for the sharp drop in
the number of search requests for the last= two quarters
in. Figure 2. Much of the increase during the first
quaxters, of 1976 can be attribute to the marketi
activities. related to the introduc, f the hodv.
After this change, however; the -RITLIDC. servi can-
not be considered 4a tyical IS` as we have der ed
it in this study.
A third indication of growth s cl
Brown (1977)'' in an account of the experiences the
National Dureau of Standarry rd,brary. The libra y servos
a staff of about 3 000 people, loss t :han half of whom.
are highly trained scienti = to rrac3 tc c hnologtechnologists
librz ys6;,L up nu TSS in 1974.
"In ti is second year cat_ fis
tine users detTeased and fell )-nunt-hs 1-0Tt was not known wIwther tills want that a saturation
point had boon reached of new users in the orcianir:ation, orwhoth0t- publicity, which had drewixi off ttkiviivt,d [vricd ofstaff 'short:n(10:i, way.; inckx:c1 the only ei.fectivc., means ofattract int] the novice, Ft was hard h fvfieve iliat allpotential (-at :Foul-Ars had boon readied, since ihe users \wryonly a small ptrcent,uje t1Ic,,t(1,110 ffi,iff-- 1.,(,)

56
11, PROBLEM STATEMENT
The problem addressed inn this study is that of irregular
growth of SS-s, i.e. after a period of initial growth
the number r users of an TSS typically levels off dra-
matically (see Figure 3) even though the potential
market is not nearly penetrated. This' premature dec-
line in growth contributes to management uncertainty
regarding the continuation of the service. The large
initial investment to ablish-an,ISS serves
heighten concern over early growth curtailment.
The difficulty in' aintaini g growth until the target
market is penetrated, or until an economically self-
sustaining level of operation is reached, can be a
strong inhibiting force the growth of the number of
.surviving'ISS's. Since overoptimistic. forecasts for
growth are common, by the fOnder
occurs and the,problem is oftep referredAo as that
of "insufficient growth".
NUMBEROF USERS
- 2 YRS
1_:1!
'I'yi).i ea l dew.number r
TIME
tient or H ,)1-
57
If the current mental pictures and beliefs prevail and
-used .as a basis forJorecaatsAnd expeetationsthefate of the om-lipp based ISSs can be the same as that
of, the SDI operations of the mid-1960-s, i.e. after
a period Of success,. with grOwth in both the.nutber of
services and the number of'users per center, use deter.
rioated to a level below that warranting continuation.
The number of SDI'Operationgdeclined rapidly, and to-
day the SDI funotion.is carried out by a feW-large
centers or-is offered as an-option by, the larger ISS-8.-
Overexpectations Occur and reoccur- ecause of a lack
of nowledge of underlying factors. The established
lchowledge of user behavior and market reactions is
insufficient for guiding the ISS managers. This claim
is' substantiated by the following quote:
"...totally inadequate conceptions concerning STI (Scientificand Technical Information) users are guiding the thinkingof many STI/SS (Scientific and Technical Information Systemsand Services) designers and managers. Unless and until researchis done that reshapes current "mental pictures" of who canor might use STI/SS-s, hopes for seeing major improvementsin the delivery and utilization of such systems and servicesarebound to be fruStrated". (Freeman and BubenStein, 1974,.p. 9)
The purpose of this paper is to present an analysis of
causes fOr the growth 'behavior of ISSs. It offers. an
explanation of the observed growth:behavior.of ISSs
It offers an explanation of the observed growth devel-
opment and can serve as alpasis for further Understanding
needed for effective management decision making. The
analysis is -based on results from computer. simulations
with a model of.a hypothetical ISS.-

58
III. BOUNDARY FOR THE STUDY
Depending on the objective of ,a Systems study its boUns
dary can be different from what is traditionally held
to be the system boundary. For a study of the growth.
of an ISS.,the4appropriateboundary Must include, in
addition to the ISS itself, both the funder and the
users since their decisions and actions have a direct
effect on the 158 (Baker and Nance, 1968, 1959, and
1970).
The structure of an information search service has
previously been discussed and related to the overall
activity of user access to the scientific literature
(see p. 18).
The performance of an. ISS is evaluated from different
Viewpoints: management evaluates the goarjulfillment,
the funder, the users, and the potential. 'users evalu-
ate the service in some utility terms :All these
evaluations lead to decisions and actions hat affect
the.future operatibps of the IBS
ana e en: decisions.
Management tries to keep the delivery delay for the
service, the response time, at an acceptable level by
allocating staff effort to the "production7'function,
i.e. performing the information searches. The re-
sources. not needed to achieve the delivery delay goal
are employed in user. .assistance and marketing. There
is a constraint for the alloctiOn policy since
certain minimum effort is required'for user assistance.
Part of this minimum is spent on. administrative work.

59
A way for management to increase the.pro-
ductive capacity.is. to decrease the staff timespent
oneachquery.SuchChanges can onfy bemade slowly
since 'they involve a learning process by the staff and
an'adjuatment time -for- the user4.The time epen't per
query has a strong effect-on the quality-of the service
'and.is a high -level policy variable. In the study. we .
assume that the .quality goal. is not changed.
The users and their decisions.
The definition of a "user" of,an ISS is uncertain when
there i no formal contract, like a subscgiption, on
which to base the definiiien ( arron, 1969). In this
study a user is defined as a person'who decides to use
the ISS, and he remains a user for a "normal user time",
unless the effect, of delivery delays will make him
terminate his interactions sooner, i.e. exercise the
exit, option dfspussed on p. 5.
Tt users submit queries according to their average
piopensify tdAuery. This propensity, however, is in-
fluenced by the expetienced delivery delay: if this is
long then the propensity to query will be lower.`
The potential users.
Thepotential.users decide to become user
(
n the basis.
of their perception-of 'the value of the service mea-'
ured by'perceive ,delivery delay, and the intensity
the marketing effort+. The'entry rate is also
the importance of these two service characteristics is discus-sed in (Liewellen and Kaminecki, '1975) and (Berk, 1974) respec-.tively.

0
subjeCt to influence from the pportion of aptual
users.to potentialuser6:..the Word -of mouth effedti
which has a positive infitience on awareness- and entry
rate, grows at first with the number of user s but
saturates.when the proportion of,usersis'high.'There.
is also a general saturation effect which makes it
more difficult to attract and recruit users as the
market penetration - pproaches 100 per cent.
The funder and decision.
The fUnder's assessment of the IS operations consists
of:both a critical and a supportive aspect. On the one
hand the ISS must prove its worth in the marketplace,
and the criteria used for-the critical evaluation are
usually economic or some measure -of market pertration,
i.e. how successful- the service is in termsof growth,''
in queries Or users+. The critical Component will lead
to 'a reduction of support if the growth is not Suffi-
cient compared to the fUrider's expectation.
The supportive component rests on the realiz'ation_that
low performance in terms of growth can be the result
of too little resources. ISS's typically have procedures
for eValuative feedback from users, which enables them
to respond with "voice" in response to a decline in the
service quality (see p.26). If the funder is committed,
an expressed low user satisfaction might lead to an
increase in /the funcer-s willingness to support the
IsS. However, this commitment could not continue in-
definitely; thus if user sgtisfaction does not go up
4-)Ekonomic considerations are becoming increasingly irrtarit asdiscussed in (Schwap; 1976 .and DeGennara, 1975).
in a reasonable period of time, the funder is forced
the Cone sion that the users are finding, other.
forms of ser. ice.
SYSTEM DESCRIPTION
Behavior is -the.aggregate of system activity, which,
include l decision making and aetions..ActionS lead to
changes in the system. When' Seethinsisdon-the,-Out-,,-
come also changes future doings either becauseof.
physical changes in the system or because of psycholo7
gical changes, i.e. learning. Actions are prompted by
decisions. Decisions are influenced by the state of
the system which, in turn, i's- affected by actions. In
systems with human decision makers is always im-
portant to account for the possibility that the per-
ceived state Of the system can .be different from the,
actual, and to realize that it As the frmer that is
ireluencing the decision-making. Thus system activity
can le described in terms of feedback loops,,which are
closed paths representing the effects.of a decision on
the system and on future decisions via information feed-
back.
A decision can befinfluenced by very many information
sources but to include them all in a system descrip-
tion demands a level of detail that inhibits percep-
tion-and insight. Thus system description variables
must be selected carefully. It is easy. to construe a
thOusand reasons for A decision, but the "good reasons"
are few; the set' fof chosen to describe the
state_ of the system must be able to represent all the
"good reasons" for the decisions in the system. Al-
studY' of an information search service must include'
the number of users an' the number of queries as

variab describing the state of the system, and al
study f the growth of an ISS must include the pro-.
AuctiVe'resource:staffn subsequent sections the
feedback ldops affeCting,these variables are described.
The systemloops'are numbered-in one .seq0ende and are
Prefixed by the initial of the variable on which they
exert. the .priMaryinflUende.,
'Loops a cting_the number of users.
I
The feedback 100136 affecting the number of users are
:given ,in Figure 4.
Loop Ul represents the .natural tendency for growth'
inthe-numberofusers.Theree'anintrinsicheedfor`an ISS+ and the most important factor affecting the
growth is awareness :of the service whichls,.in turn,
largely determined by. word -of -mouth although the marke--
ting effort by the ISS might proMPt the'adtual decision
to: become a, user (Benenfeld et al., .1975,- p, Thus
Until the ISS has Peached'its,Service capacity the
number of users could'grow at an increasing rate.
Loops U4 and U2=are
users. Loop U4
-represents the
users within.a
1 ops that inhibit the growth in
is the market saturation -effect, whiCh
increasing difficulty in recruiting new
saturated. population of potential users.
Loop U2 portrays a negative effect from delivery delay.
on entries.AsmOre users enter the number of queries'
increases which lengthens'the delivery delay which, in
turn reduces the number of-future entries.
That this is true also-outside research orients acacommunities is Shown in (khlgren, 1975).

DELIVERDELAYPERCEIVED BY Li2POTENTIALUSERS
DELIVERYDELAY
ERCEIVEDY USERS
MARKETSATURATIPN
U4NEWUSERS-4-4.-USERSENTERING
NEED FORASSISTANCE
U5 ALLOCATIONOF STAFF FORPRODUCTIONALLOCATION
STAFF FORMARKETING Bi
ASSISTANCE
Figure 4
i7eedback. loops affecting thenumber Of.users.
Loop U3 shows another factor inhibiting the number of
entries. As the number of queries increases, more Staff
is needed for production, ie. increased searching
decreases staff_ resources available for marketing and
user assistance. This negative effect is counteracted
by the effect of loop U5 which is to make it more
difficult to allocate staff for production as the
need for assistance increases.

Feedback loops affecting the number of 'queries
In Figure the feedback loops affecting ,the .number
of queries are shoW,11 together with the4reviotsly di
cussed loops. Loop-j2,6 represents tbe.leffect of user
perception of good service, ii.,'short delivery delay
effects- an increase ink :us proPensitY to query. Con-
Versely a decrease in' the propensity to quer is the
reaction ah' delivery delay increases. A build up of
query backlog lengthens:the delivery delay causing;a_
negative effect on the number of inCOmind queried' t'his
effect is amplified by loop U2 which' gives a reduction
in the number of Users;: and a hence udries, when delivery
dlai-is long.
The managerial pdliCy for reaQUrCe.aflocation is repre-
sented. in loop Q7: when query .backlog rises the.Ailo
aation of staff. to production is'increased whichA.m.
creases the answer rate and reduces the backlog:The
delivery'deiay is shortened by both the increase in
answer- - rate and the reduction in query backlOg. Loop
Q8 shows a dysfunctional effect of the resource allc
cation.decisions, in terms of control of the'qUery,
backlog. As, the answer rate increases the delivery
del ay decreases which, eventually stimulates an,in
crease inquery submisSion and causes potential users .-
to become tserS.
Feedba loops affecting the number of af
.Figure 5 gives all. loops necessary to analyze the
behavior of an ISS under constant staffing. For some
studies this would be adequate since an ISS sometimes
is set up as a research prof t dr, experimental activity

DEUVERY Li
DELAYPERCEIVEDBY POTENTIALUSERS
-DELOERYDELAY
PROPENSITY QUERYTO QUERY BACKLOG
IARKET
NEWUSERSENTERING
U4
U I
USERS
ALLOCATIONOF STAFFTO MARKETING
INCOMINGQUERIES
,,''ANSWER'RATE
U3Yk
INDICATED OtitSTIONNEED FOR C PACITYSTAFF TOMARKETING
Figure ,5
Ick loops affecting the: of users'and queries.
FN
ALLOCATION:
, PRODUCTION'
STAFF
65
with fixed: budget. the most common setting for an
ISS, however, is to .be, part of a larger Organiza-
tion such as a library, an&subject to budgetary con-
cer_ herefore feedback loops affeptingHthe number
of staff are necessary. These are_ shown in Figure 6.
Loop -59 represents the compensation for. leaving- staff.
As Staff increas so will the number of staff leaving,
assuming that the average time to stay is net changed.

'This will lead to an increase
and eventual hires.
the nuMbO.of desired
The e)ipinsIon Of the IS in termsr'df staff `is sh0 in
loop S10.:In the .typical organizational setting for.
ISS justification for expansion is normally based
a demonstrated "need" such as a high backlog of
clueries pr long delivery delay.
One of the two primary constraints on expansion is
represented by, the fundks willingness to, support the
ISS. If deliVery delays are long for a sustained period
of.'time the funder-s willingness to support must decline
since solicited evaluations of the service are low.
The second Constraint is economical and is represented
by loops S12 and S13. Establishment of an ISS requires
a relatively large investment, and operation has high
and visible marginal costs, such as Search.fees to the
information wholesalers and telecommunication costs.
It i therefore common to require the ISS to recover
some of these costs (Wanger et al., 1976, p.153).
Rarely is the recovery of the initial inyestment expec-.)
ted,ind the economic constraint contains only variable
costs- staff salaries and search costs. The fonder
expects a pertain volume 'of searches per staff member,
and this ratio ig,determining the economic constraint.
Loop S12 is ,a positive loop depicting the influence of
an increase in staff: shorter delivery delay, More in-
coming queries', and an improved gderies per staff ratio,
which reduces the, economic constraint on hires. Loop
S13 is a negative loop since an increase in Staff leads
to lower queries per staff ratio and a ,negative
enCe on hires.

AVERAGEQUERYRATE
QUERIESPER STAFFRATIO S13
ECONOMICCONSTRAINTON'HIRING
INCOMINGQUERIES
2 WILLINGNESSTO SUPPORT
CUSTOMERS.EVALUATION OF.SERVICE
PRODUCTIONCAPACITY
DELIVERY--'*DELAY DELIVERY
DELAYPERCEIVED BYMANAGEMENT
ArTUALHIRES
STAFFLEAVI
DESIREDHIRES DESIRED
REPLACEMENTS
EXPANSION
411466 6.
Feedback loops affecting the number of to f.-
3

THE SIMLILATiON MODEL AND BEHA SS
The simulation model is a systeWdynamica model Written
in theDYNAMOSimulation language .seeAForrdster, 1968)and (Pugh,,. 1973) fciradescriOtiOn..C _ptuallyasysteM-dynaMies model is a set of-diffe*ential- equa-tions describing the continous changesin a system.As on a-digitalHcomputer the model equa-tions- are,.forMally.a set of first orderdifference
equat. ohs. A furtherdiscussionabout.,the mathemati-
Cal reOrdsentatiOnis glveninChapter three.aspartof' he det4iled, model desOtApion
.
Forwlating the model means writing the model equa-
tions on\basis of the causal analysis and the causal
loop diagrams. Normally the equations are more detailed
than the diagrams so the' question of selecting variablesust be addressed again.
iThe'cho ce of which variables shoUld. be 'includeda system dynamics mopel depends ontheputpose ofl
the study, or the. "point ofview", and on the level
f aggregation. The latter is often a consequence
he ,firmer but can also be influenced by, available
resources. ThePlSiCeof,-yariables shduld not be
base4oll what datLis. aVailablepa system dynamics
Study: can work the other way '''Ipoint.oUt what data
is needed:to. make the study relevant.
The boundary for the studied system is both crucial
and diffidult to determine. There is danger of omitt-
ing important variables, Which typically results in
neglected representation of influences that have a
controlling effect on one or more of the system vatiables, negative fee ok loops. such omissions
could be the consequence of the mod ler liodolo=-
gioalbise (Andersen. 1977, O. Al ff,) to think Jr.loops" All relevant relationships between variables
must be identified before the decision aboUt inclusion/exClusion can':.be made. .one way of reducing the dangerof faulty exclusions-ti to apply precedence analysis
( Langef6?4'; 1966)'Wh6 constructing't* model or., ifthis is not done, for verification of'Orucial part&
.%,of the model., This analysis is in itself statiC andfor each variable one poses the question "On what1P
does the value of this variable depend?", i.e. one '
identifies all, the information precedents needed to
compute the Value. When thip is done it is possible
to.consider aggregations and exclusions.
The Pro:cesswill be iilustrated--Ith the formulation
of the representati:orvOf "quili3ty.'!, and connected parts
f the model'ISS2 as Pxa:ple.:
As a sting point for the discussion we illustrate,k
FIgure 7,-how decisions, actions, and informationdp.iack interact in a loop structure (see p. 98 for
jan'o the symbols used). The decision con-.,
trols the action steam. Action'changes the state orcondition of the system, here
system (cf. p.95). The actual
affects the information about
basis for ehe decis'ion.
called the 'level of the
level of the syspvm
the, level, whiff` is the
A,decision, is typically- influenced by a number of in-
formationformation inputs. Tf every possible information inputwere to be included in the model perceivability would
be lost. If, on the other hand, important variables
are not included in the model'it cannot adequately
represent the dynamic behavior of the system.

70
Vonhe
Wei)
The structure of a -eedbacloop '(from. 1968;
P- 1-4) -
The criterion for the system boundary is given by
Forrester (1968, p..4-2):
"In concept a feedback system is a closed system. Itsd,behavior arises whitin its internal Structure.
Any interaction which is essential to the behavior modebeing investigated must be included inside-the system
boundary".
InHother-word8, variable cannot.beexcluded if it
affects a decision which in turn has a significant
effect:on other model variables given the purpose of
the study.
As an example- onsi der the pre edents tion

base they can:be listed:
availablility of'data
- competitive situatipn
cost of storage
- `capacity of the sys
bases
(between wholesaler)
installation
71
None of these-have precedents within the ISS/user/
(under system being studied. A possibility. would be
that'the users influenced the-acquisitions but the
information -search market is essentially supply driven.
The cc A, for building a data ba4 is very highThnd the
motivation to take down' a data base is low since the
number ,of datat'ases" is used as a marketing. argument.
SiMilarly "formats and channelsre determined byA
fact6rs outside,the ISS/user/fUnder system.
"Other component are by definition outside the
tem boundary.,_
-Price could be excluded from the model on
since in practice the ISS
similar
on the costs
wholesaler, bUt this would not be quite
since various pricing h6mes are practiced
generality. of the mode -could not have been
eMenstrated withadt the given analysis t l th6 effect.
_ price changes (see p. 21): it had to be shown that
the user- decision are not influenced significantly
price.
Quality, as has already,been discussed (see p. 23) is
one of't e determinants of sales, i.6. it is e ne-of
the inputs to the decision of a potential user to
became a User as is shown in Figure 8. The modeler

72
exclusion deciSion
of crossing the-Sy9,
now be illustrated as a question
boundary
In Figure ,"quality "' is shown to be a precedent to..
"users` p city to query". Here, by definition,,
the precedents 'to "qualitywith the exception of
"delivery delay" "are outside the system boundary. It
the assumption of t*s study that new users and
return users behave differently, i.e. act on different
.sets of information inputs. The propensity to query is
a measure of heikv often a user will return to the ISS'.
Since he is already familiar with the-service, marketing
is assumed,not to influence the decision to return.
The representation of these boundary crossings,in the
system dynamics model is typically .done by a constant
that represents the influence of f,,Jtors outside the
model on the model variables. When :the numericaavalue:
of the C.onstairt,is determined it'is important td"con-4
Sider the effeCts of all the p-9craerits.
The modelers decision whether to combine two system
componentsi be t1Rey variables orxonstants can berW,
facilitated by making a precedence matrix. In Figure
10 the graph of Figure 8 is represented in this way.
From the matrix it can b_ seen that "assistance" and
. "marketing" have the sam precedence set, the amount
of staff not allocated to production (ASM) bUt since
they have different succodents (rows 9 and 10) it is
not without problem to combine the two. However, since
it is in practice difficult to 'draw theA_ine between
'assistance and the marketing fuirotions it is natural
think in terms of a combined function,, and in this
case a matrix like the one in Figure 9 helps to
track of the original precedence relationships

rtumri users)
riteret
1..
quality awareness
"other"componen
Ainformaiion
base,
formats4 channels
taff trocteto .prt5olucti:on
'(ASP)
ssue. *jisl'e/17 hot-oda
Gqistance
market`,effo rt-
marketpenetrgtiqn
(woiY4 mouth)
querybac
- if allocateto marketingassistance (ASM
staffusers need
7 fora5sistance(ANEED)
5
potentialusers
d ryde iverydelay norm
pq)
Oki
continwitionnot 5nown
Figur 8
nurnber71of user:
generaleducation, ILevel
nurnr er

74
query backlog
previous.gure
rate orate of answetsincorr .
queries
userspropento qua
skci c usercharachteristics
Staff ASPalloo ed
nu i ers to prodof users
dual itytomponentsother thandelivery
prey,delay,delivery
.Slyste.171- tvusndumaryir
previougfigure
Figur0 9
previousfigure
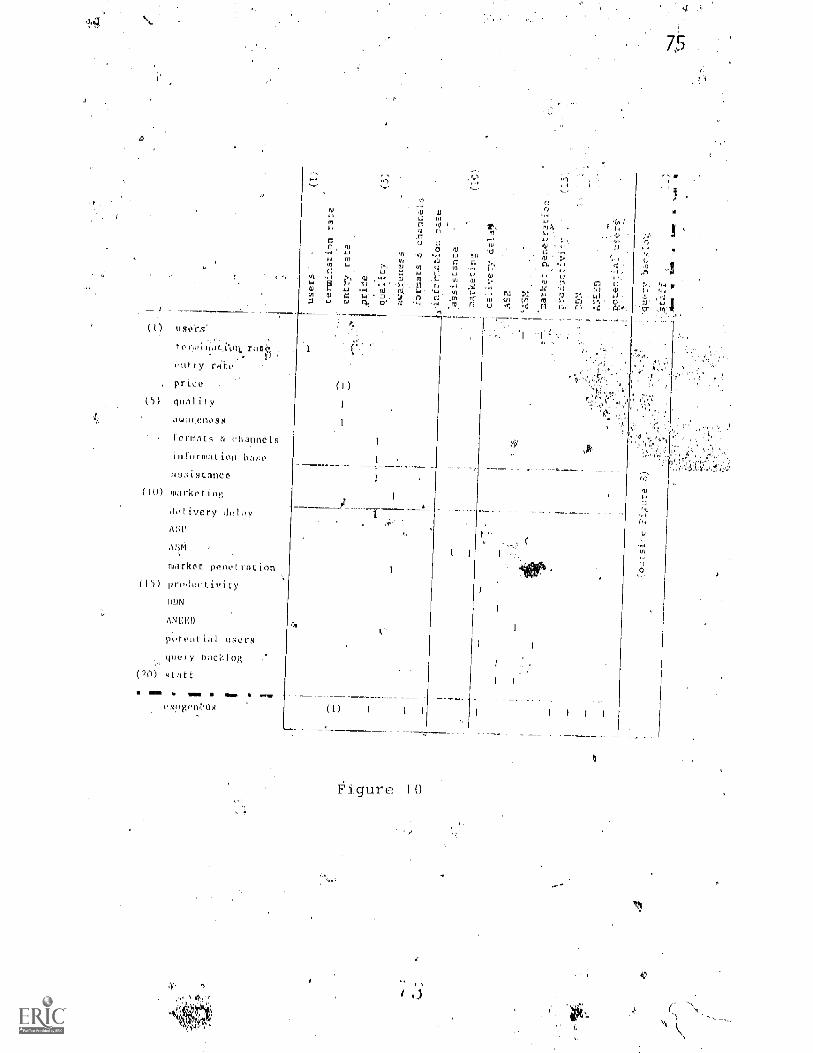
use'rs'
.ifit-io0A fa
ry rit'fe
, price
Al qUality
awat.UneJS
rorMaL9 & chatuielEi
intormacion base
anAStanC0
.Om Marketing
delivery delay
/VW
market penvtratIon
(15) productivity
ON
ANTED
poten 11 USO
lery baatlog
aft
*
7$
Figure 10
I

76
which are important when the interrelationships between
syitem components Ore quantified.
A precedence matrix also gives an pxplicitilist of
all the comprinent left. Outside the'system boundary
(row 21).
The numerical values chosen for the _parameters of the
simulationiwdel 12 axe representative_ of an ISS in
an academie setting. The q ntified model represents
a synthesis of information rom literature sources4
augmented by correspondence with, and study visits4
to operational 1-s, ptesented in Chapter three.
The simulated 155 thus begins with a staff of three
persons. The average number of .searches per staff
is ten per week, and management tries to keep delivery
delay at half a week. The potential market for the
iS 2 000use s, each having a normal information,
need- of almost two searches per-_year. Figures 11-a
and 1J -b shoW the behavior ofthe system variables
resulting from a simulation run of the first 240 wee_
of operation.
The simulated growS rapidly in terms of the number,
..df'users for the first 50 weeks, and then the typical
,decline in grseth occurs whn the number of users is
about .800.\Prbm then on the growth is significantly
'older', but the ISS-is satisfying the funder's.economic
requirementSince the delivery delay is maintained
the 155 expands and has a staff of 4.4'
end. of the. 240 weeksThe number of users at-,.
that time is 1137',Which means a Market penetration of
57 percent. The ISSepceives 35 search requests perI ' .
week, andthe'number of new uses 25 per week, which

VARIABLE
ZOowOdd
W
N0
ciooco0 re) rn
INCOMING QUERIES 0)(QUERY RATE)
(E)
ENTRY RATE
USERS
U)
00o411
.0 a-I00 160 240
TIME (WEEKS)
Figure 11-aReference run of ISS2 (part I)
77

78
VARIABLE
w
C)
EFFECT FROM DELIVERY DELAY ONTHE SUPPORT FROM FUNDER
(S)
EFFECT FROM MARKETING ANDASSISTANCE ON ENTRY RATE
EFFECT FROM MARKETPENETRATION ON ENTRY RATE
(4)
0
222 Si SS11.vgg .. . 10g .
EFFECT FROM DELIVERYDELAY ON ENTRY RATE
C)
(2)iiiiiiiiiiii 10 llllll
EFFECT FROMDELIVERY DELAYON TFIE PROPEN-SITY TO QUERY
EFFECTIVEECONOMIC CONSTRAINT
O 160 4C
TIME (WEEKS)
Figure 11-bReference run of ISS2 (part II)

means that the percentage of "return users" is 29.
79
The overall behavior of the model confbrms well withthe typical deVelopment which was given as part Qf the
problem statemerit-(see p.56). When it comes to comparing
the volume of business problems arise due to the lack
of standards for statistics which was discussed inOChapter one (See p.27). There is also a difference
between the M.' and the statistics that-are kept:
in the, model'the users are counted when they deeide
to become users, in the statistics users. are not known
until they have actually subMitted a query to the I.In the long tun the figures will be-comparable, but inshort -run simulations the Model will show a Much-higherentry rate of users.
Sine ISS2 represents a typical service, i.e. iS a
general model, variations in actual numbers will occurwhen the results are compared to any particular I.
SS
However, the purpose of the present study is not to
make predictive statements regarding specific4alues
of system variables. In a situation where measurement
noise is a reality, which is the case in the present
study, attempts to make point predictions are likely
to be unsucessful.' The reasons fbr this is disciJSsed
by Forrestet:(1961, Appendix K) who concludes:
If the presence f noise is admitted, we must necessarilycome to the conclusion that even the perfect model may notbe a useful- predictor of the specific future state of thesystem it represents. This does not keep the model frombeing a useful predictor Of system improvement that willcome from design changes". (p. 431)
An assessment of the realism of the simulation resultswill have to be- made in more general terms. For this

80
purpose jeveral prformance related, and operational
meaSure. were liSted as part of the simulations'runs
(see p. 156) and together w4th the model Variables in.
Figure 4 in Chapter three these measures provide a
basis-for judging the realism of the simulations
(I)results.
Looking at the NASIC/MIT service we can make some com-
parisons for the first'twoyears. Thereafter this be-
comes more difficult since the simulations results give
an expansion in staff whereas the NASIC/MIT service has
had a constant staff.
The total number of searches during the first year of
operation was 316 at NASIC/MIT (Benenfeld et aj., 1975)
the simulated result for I552 is 324. The percentage
of return users is a bit lower for rss2, about 20%
compared to about 30% for NASIC/MIT, but this is a
consequence of the-different representation of users
mentioned Above. Both NASIC/MIT and ISS2 show, however,
an increasing percentage for return users (personal
communication, Augdst, 1976). For IS5 2 this can be
seen by inspecting the simulation result (Figure 11-a):
growth ftiincoming queries is, for the second half of
the simuration run, higher than the growth in user
entries. After about two years the query backlog for
I552 is about 18; insPection of the NASIC/MIT appointment
calendar at the corr sponding time gave a value of
10-15.-Hjerppe (197`5, P. 125)- reports a backlog of
10 -0 search requests. The annual growth rate for ISS2
at this time is ,abobt 30% which is consistent with an
estimate from a Stanford study (Program in Information
Technology and Telecommunications, 1976, p. 15) when
one considers that the average age of operational
ISgs at the time was about two years (see, Chapter

four,. p. 178 for a discussionl.
Based on an assessment of thiS kind w find the be-
havior of the simulation model to be realistic in
both, qualitative and quantitative terms, By analyzing
the:underlying forces we can obtain an e'Xplanation
for the -behaVior. The follm4ng analysis will show
that the decine in growth l§.a direct consequenceof market responses
-The "natural" gr wth of the IS.(loop is. amplified
during the firSt yeAr when. thevolume of queries .iss.
insufficient to 'Pnflict with-'the marketing activities.
users "'are attracted to the serVice-by'rlatively inten-,v-
'sVe marketing, adequate assistance, and delivery delay
to the ISS operations.
that is-Tractically Ion par whith their requirements:.
As more and more resources are needed for p dUction,
a declining'effect frorivmarketing and assistance on
the entry rate (loop U3) follows.
The reactive character of the allocation policy means
that the ISS management only allocates resources to
production based on an established need, reflected byan increase in the ueries in process (loop Q7). The
rapid growth iri terms of users leads to increasing
difficulties in keeping the delivery delay .at the, norm;
The adverse effects on the existing users' propensity.-..,
to query are counteracted by an ,increase in the alloca
tion of staff to production and for the first. 60 weeks
.the propensity to query doeS not drop much blow normal..
Afterwards, a substant i. decrease in propensity causes
a negative ef ei,ct on the query rate (loop,Q6). The
effect from the increase in delivery delay on entry
rate (loop U2)is slower in developing since the poten-
tial not have first hand ex rience with the

service and their perc ptions develop slowly. Once the',potential 'tigers have trade an asessment of the service',
it s diffueult for the-ISS to change it. Unsatisfied
-users naturdll are less incline to pay attention to
IsS change. wising the potential users pereeption'is,a slow process.
For the first 60 weeks the awarepes of the se
growing and the word -of "Mouth' ef6ct, or the e
from Market penetration, contribUtes-tb the'inc' ing
rate of growth on'users (loop U4). _Me typical ISS
does not experience market saturation effects.
effect from marketing and assistance on efitryra_e,
is decreasing for the. first 70 w-reks which caUgesa, . -.,..- .- -. .7
decrease. in the' entry rate after about one y,
the relatil
(
ly good' delay sitatio
high aWaren-ss of the service,. After week .70 -h
from marketing and assistance increase somewhatippar
due 'to the rebogn,ition
of neeci(or assistance fpk,-,...
the growing number of users (loop U5) .but also helped'
by. the, increasing 'negative effect from delivery' on
entry rate. This latter effect redUces the growth in
users Aldbp U2), so that' -the relative effect of theM.
allocation, of-staff to marketing and assistance is in-
creasing.
The cause of the overshoot in entry rate and the
resulting dramatic decline in the growth of thenulip
of users is the decline in staff capacity available
for marketing as a consequence of the necessary alloca-,
tion of staff for production (seching). The flow of
incoming queries remains too strong to enable the ISS
to keep delivery delays at the norm - a condition which
will have anincremental_ effect on-the decrease in entry

,
rate loop U2):.
The initial .growth of theJSSis driven primarily by
the relativbly high marketing effort during the firSt
year. Lew awareness of the ISS ,is cited as one cause
of :failure to-grow (Carmon, 1973) , and other studi,em.
Support the necessity of marketing, activities to
hieve growth '(Eserk 1974). HoWever, it is important
keep the delivery delay at an acceptable level Mince
is the principal determinant of service quality. No
problem facing 'the'ISS management is to balance the
co\umitments to the.users. Accepting a user means a com-
mitment tO spend resources on assistance but also implies-,
a longer term commitment.to answer submitted queries.
ThiM latter commitment is not always recognized as being-.long-term but observed behaviora of ISS's indicates that
the demand for re-ieu7rc s for-production per user does
increase after a few y ars.
The ,difficulty in minding an ideal balance, i.e. pro-.0-
viding adequate assistance to every user,while,main-.tainingathe delivery ay goal is illustrated by .
these results.'Delays of various magnitude dependent
on the effects of the 'SS operations result in deci-,
sions- by users and potential users.. High user expecta-,
tions ate generated and Managementhag difficulties in
responding adequately to the demand for 'assistance as
well as for searching.
The-predicament of the ISS management is complicated
by the funder-s reactions. The different phasing of
the users' needs for production and assistance-makes,
it difficult to avoid dissapointment in,ondfTespect
r the other. if too much emphasis is placed 'on satis-
fying the need for assistance, ,then the:de Vdelay

84
is longer, discouraging users from'entering'(loop U2).
eventually, the funder-S willingness to support the
service (loop S11) is reduced which hinders expansion
and retards growth. If the production aspect is neglec-
ted, thq,cOnomle constraint. on hiring can become binding
(loops S12 and S1
If too'little emphasis-is placed onmarketingand ass
stancesome-Aasers-arediscouraged from uSng the service,
and since delivery delays are relatively shOrt,..no-
visible justification exists for expanding the service.
loop S10). THis "no-win" situation, is sopetiMes a
reality; i.e. to justify.expansioti-f-'staff, an
crease in marketing effort is needed,. requiring more
staff.
V-. FURTHER ANALYSIS OF MANAGERIAL DEC ION MAKINGFOR AN 1SS
A discussion Fof.developments in the market for scien-
tific and technical information offers additional per-
Spectives on the situation of the .ISS managers. The
decline in batch oriented systems for the dissemina-
tion of STI (SDI services) spawned much activity in
the information-science field related to investigating -
the applicability of on-line techniques for SITI disse-
mination. The new technique changed the nature,of the
tiiformation service-provided; the subscription orienta-
tion was,replaced by a demand search orientation, similar
in concept to-a. "retrospective search".,Demand search
added the capability of providing interacticn and
modification.of the.query during the actual search.
The economics of the new technique proved discouraging.
Firstly, the hardware itself was relatively costly; even.

ding a minimal service. Secondly,-
the information baSeS and their indices
significantlyAs a consequence of the edo7
fficulies for-sMall'independent centers, a
-et-structure developed where th6 mai ntenancemaintenance of
the large information bases r fed on a relatively
small-ndbr of "-information whOleSalers", who also
provide the information processifig resources needed
for searching (Gardner et al., 1-914, pi* 2)-. The 158-s-
:tidied' here' are "information retailers", and the IS's
management are limited to external deilopmeht.of soft-
ware for the service and.' n _Illation acquisition.
The purpose of this section is to discuss possible
managerial actions and:their effects, given the limita-
fions dictated,by th structure of the STI market-and
_ determinants for staff hiring as modeled previousI.
ti
Different er___..ni-rnarice tin
Marketing is . imetime.s cd_ idered the "cur_ all" for
t istrue that the typical TSShat insuffic ient
marketing resources, but if oar1eting is-ever emphasized,
an adverse effect on deliVery delaYS Can emerge to limit
resources even more necessary to coMpensate for the
relatively long delivery delay,..
4
figure 12 bh the resu
tingtoo-mu emphasis on
imulation (run indlca-.
arketing and .tksatance -The
numbe ,of users grows int ialiy as'fast as in the
reference run (note that the scale ,in FigUre 12 -is
-,different) thpn levels .out just 'Over 90. The number
of users does not,A:lecline in spite of the adverse
effects from the long delivery,delay,since trig effect
from niarketihg and assista ce on entry rate is .relatively

hig i The longldslivery_,delay, leads to a s trOng need .
to:expand staff but:also-reduce the funder's willing-.
ness- to supp0rt-the service. Th -ISS is also hindered
from expansion by the edonomic
the low volume of queries pet
'Market
4.e user
dint becaUse of
The result is a
ap!' with the long -delivery defy reducing
opensity to querty. As a consequence,the.,
mar eting-effort must increase to attrac t Lore users-
to compengate for the low propensity to y. However,
such an increase diverts resources from production and
the delivery-delay situation would Worsen.
The change. made the mulation to give Figure 12-
reflects an increase in the indicated'adedfor'staff
arketing in loop U5.-There are, 'hoiaever, Dther ways
majnagement' tq emph4size :marketing; the chane'in
,alLocation of re
slowly. This mean that
sta,
ff Plows tha uch a..,1 %
immediate'efect is th
indicating a e
_by hires (loop
'a reduction, in the
se:rvioe (Iqop,S11)
ources (loop Qq) can be' made more
the pressure to real: ocate,
olidy- is not advisable: The
dplive
more st
expan
funde 's willingnes8 to support th
nee the funder rewires
opijn. about the quality of'tivityticing tfMe ti form an
delays ncrease6 (
ff,. which is eff red
ion is not hinder d by
service. The growth n 156th. users, (loop U2) a d'queries
(loop Q6) retarded, anc1-tiie econ c ,constr(10,90 S12)1 together with at uced wi 1.ingnes_
e part of the fundei (loop S11), will soon Testi
Via! a. reduction"of st ft. After this77 eductlion -6-le be-- P
havior of-the,model similar to Elereference,
the. result of, the prafitns daring-the 240 weeps4 ik
orSei,in both lasers nd queles. -Short term/scd;sses,
ill terms Of staff expan io are cdunteraAed by market
run,

11tLuid'i .
INCOM ,DUEIF,i1E$,11
(QUERY RATE)
ENTRY' RATE :(E)
TIME W KS
(

L- .-The -e e p tentiai- Market can l'oe ,governed- by
,:theinstitutiOnai- Setting, and it might not be ,possible_p
to imposedsriminatqry rules regarding who °myj and mayz . .-iw- -
not become_ 1.18er.., It is common, . however , to allow the
ISS :e potential -user popUlation -beyond 4the
rganizatidnal 'hosti and thi0-00licy
to ease groyth
, thiS
bOUndary.0sometimes
ru4S*i171.1._
IY0
tial tharke
SimUlation
licy gives
ze.of_the. Poten-
practicaylly.
redse
identical tov the- refer
'.the potential, Marke' be
.relate d to the available aff. Initiair the n4mber
f, siktaff a typl 1 ISS is small, which,cou be
taken to indicate that a reduction o sizpotential market wo d be better. SiMulation
of the
uns .with-
the model show7that a reduction of t ie.- number of poten-..
.tial 'Users from 2 000 .to 700 es -better result in
qualitative terms, i.e. .in termilLoUassistance given
and delivery del: but since the a is no .visible -need
for expansi (loop 40) , :the sta is not, increased..
With the .st- of three:. the ISS succeds in attracting
. -85% percent the:. (reduced) potentiaI
The dual size -o the potenti meet is diffic lt
de
dang
creese%
changes in t
least "no.- -al expariSlon is possible .f.
inCekaotly': The simulation. results indic
in overrestristIng the market; so that while
n the potential Maricelt, causes only saight°-
uantitive resultS of the US operatittims,

0
User educdtiOn had a ways
the marketing of.IS$.a.
like Manyother.,,ier
sponsibility not only to
them hOp themselveSi-Anohqr
dated user has more-'realist
the 'infOrMatibn searh'srvice.i
been,COnsideed a part of
r-fOr this is'that an
naidersi cit
p but also to help
on ia that tin Odu-
expectations regarding
&IP
With -egard to delivery 'dela in particular, over -.expectation- has beeRsomMop, f"he general tendenw to
:overetimate the '-ePeed%Of cothputerized.propesseS is
part of-the reason for (this, hut'the-aSS shave also
reirprced the impreasio-b
eir advertising,:.4nd matk
disappointment effct,'mherfpi
ISS does not give 'instant ac
Is greater than it be.
cling to this bias
,g. The resulting
becomes' clear that The4ess7 to the,literature,
The aimulatpir mo e. was
delivery dela on 4le !Jur
delivery delay has s
user. The rc.-1
run with reduced sensitivity
he i-ljtential, users,"/-n the decision
imulation is
'cant improvementgiven in I:igure and shows a ns
,compared `to tA7 reference r,un.
la l- use eipg tiv deli
actua is 'not, discouraged, affd,t.,?
issbusipp as in a ite e teas_.
to que'ry qo that- ex ansion is possibTe.
o '5%5 at the end Of the 240. weeks and
rs ls:14450i-;717be ISS gets a=

-0RIABLE
pocnw
(E)
(U)
ENT y .
USERS
,, sue
I MIN G QUERIES
UERY ATE)
F rigue 1TSimulation tesult when the mentivity to delivery deny

171
The growth 'curve for the nu4ersof user In Figure 1
\has a "kink" around week 65 5-out the leVe ing off iS
not nearly.as dramatic As it ,the 'reference run. The
quantitative results'from the. ;imulation,compare
favorably with eimulation where the funder imposes'
no constraint ft the expansion:r.lot s 'In ofwords the negative effects from overexpectation
arding livery del can inhibit growth almost as
much as the funders constraints-- This -haWies the
impdi-tance for.4SS managers that4the marketing Message;
and pper edUcatic5p programs convey arealistic.picture
xpectations terms of 4elive -ry delays.
CONCLUSIONS FROM THE ,SIMULATION .EXPERIMENT
of inforvatih search services and:
simulations,
,draw the f011owing'conol
IS& model we
1 The ofi en experieneed decline in growth innufter of tisers can be Ixplained.as a rIgtuconseqUence of market responses to ISSoperations.
the IS& mAagement is in a eontradicitorysituatpn where long delivery-delays,pr deustifIvation for. expansion but' inhibit h.
A-re dtictioniin. the sensitivity pp delive lay,by Appropriate 'marketing anduser educati n,is Sh effective Way to alleviate thisproble
.
,7 ,
Marketing is not a CO-re-all for SS's and oveithha msis,on arketing:can be ,h ul for.the
growth Of the .IS, especially f t e-funderhas a constraint relating to t e volumeOfbusiness per staff, in whibh- case there isa potenthl "ma Bing .tray
-
incregsing the, Size of the potential marketmight llio/..1 to a significant increase in
owth;719 fti iently largp',market isMportan -
"normal".growth.,-,


The description of the I SS/user fu der sy m tha was.given both ferbally and in form of causal loop'diagrams.in the formliKpart'of,okapter tWo wis the 'basis for
the development of the sibiUlatibn model I552-. Based on
results from simulation experiments with thismodel
the analysis and conclusions o he latter part-of thechapter were made.-
I552 is a system dynamics Model. This methodology i s
described by Forteatet 161, 1968), Goodman (1974)
a.o. The langua sed fOr-the dimulationtAs'irYNAMO
II, which is dec !bed in pugh (1973),
MODELING TOOLS
Conceptually a systeth dynamic& model,is a: sys
,differen6,a1 eons of the ,following form;
em Lpf
(2) .
where L is the vector of "lev -els'', is the vector off-"rates ", A i he vector.of "au ilia variab "
t is time.
Nlevel rep s i ark accu u ion of--reso keea:pe n-
,
for tion, e . employees,A
if 6- ers
popu ation 'of custome_ esc ibes activities,,- 'i-
in .item such` as fkow of money, 3tr.m,fs form
tiond., shipmpnt of goode:--- An,equa clef nq:
represents a deCAsion.i he sys Ah 'au.. $--,A
able ia used yo break 41_- itheridee_1..
A
Are-detaild Tioarts, which 's6Meti',----clarity.
P ,) ,
41

96
Equations (1) and (2) can be represented by a feedback
loop (Figure 1), With the arrow from rates to' levels.3 e
representing integration.
Consider a tank of water with ,both inflow-valves and.
outflow valves as an The inflow rate causes .
the level of water tare ancltile outflow rate causes,
it 't6 be lower, At any point in 'A e the level, of water'
is equal to the initial level phi's the,net effect of
the infloand outflow up till that tide. Thus' the we-b
er level is given by:
L0 (
(iF OF)dt3)
ere L is the level of water at any .given time t
L is thei Itbjotial leve.U.Of water- (at time
Tri is the:inflow4ate,
OF is: th'ouflowrate
-dt is theldiffe ope_ or k
t=0)
ineefv
_ere
tal compiler the pr.acess'o
0 appro?timated by fist -order%
vel equ the

Where t is used
names from the time indices a
L.K = new value of 1 time = 1(),
L.J = revises value of leVel- (at time = 3)-
DT = the elapsed time between _okr1,J and
time = K.
.
of ,the inflow 'rateduring
theinterval.JK'
= the value of the outflow rate. during:,
the interval
In order to compute the actual-value o the' leffe
equatiOns defining, the rates must also b knoWn. T
general form, for a rate equation is:
(levels) 5)
.- When -.the -valu s pf
time K the rates f
can be determined'.
levpls
su6c
beeq computed at
time interval, XL,
tion -can be- any functIcA
of level . Taking, a thewaterta4 an,exa le
the outflow rate could be proportional to the amount
-of wate n the tank. If the water tank is 'part of a--
sy 1p i h human operaters the inflow rate could deg
Al on h w much. the:volume Of Water in the tank dif
fers from a6aesired ume.
In this 1 tter case the inflow 'rate depends on the
operators decisi and the rate equation is a pol
statement that de c ibes hOw decisio s are-made
ib co in system dynamics to let the terms "d
on" " licy"' have a broadmeaning:
"They go be nd the uSualehuman decisions and inclUde the
Control precesses that are implicit in system strucand in habit(and trkditionate-:eqqation (or ,palstartement) might-describe how the hiring rate in a inn

an ihe level of-mabanci 1 of, availableA rate equation the subjec-
d intuitive re s ses of le social pressureswithin an organization; a rate equa ion Might represent theexplicit policies. that control, inventory ordering on the basisof current inventory and average sales rate.
The rate equations are more subtle than the level equaticts.The rate equations state our, perception of how.the real- systemdicisions respond to the circumstances ending the decisionpoint. (Mass, 1975, p. 164)
artih
When developing a system.dynamicy mocl, lo 'diagrams'
are often.used.ln the diagrams a le is represet:
ed by a. rectangle and rate'var-ah sy a valvelike
symbol. C cies repres nt au ilia` fables. An example
Figure 2
ple

In this, example the solid arrow.throughER into U'r
presents,'the flow of Users. The arrow starts in a cloud-
like symbol which is Called a l!iource"..Here there isonly an inflow 'of-users' but f' there had been an out--
flow as well this would have been represented by an
arrow going-into another cloud-like symbol which-thenwould have been_dalle95-a "sink". Information links
are illustrated by dashed arrows going from any level,-
or-auxiliary variable to each auxiliary variable or
rate affected by-it. Information "take-off" is :shown
by a small Circle.. Constants are drawn as short solid
lines next to the name of the conbtant.qn Figure 2we see that, the-recruitable population R.depends onboth the .current number of users U and:the-potential,
popUlation P.
The number
auxin
the9tesp Ve yaria le..
is the number'of'the
Ilocu ntatio nfformat'
IFor pre.ntatidn of asystem dynamics Rio
MENTOR program (Pugh, 1973) provides altdde. , .,
with definitions of quantity namesand informalion'
about equation number and type. ThefmodeldinFigure.)
would appear.as follows ±n. -Ole DOCUMENTOR(format:
-U,K s U.J (DT)x(ER.JK)
- USERS (USERS)
ENTRY RATE (USERS/WEEK)
NO. OF.usrtS
LV
1 N
1.2,
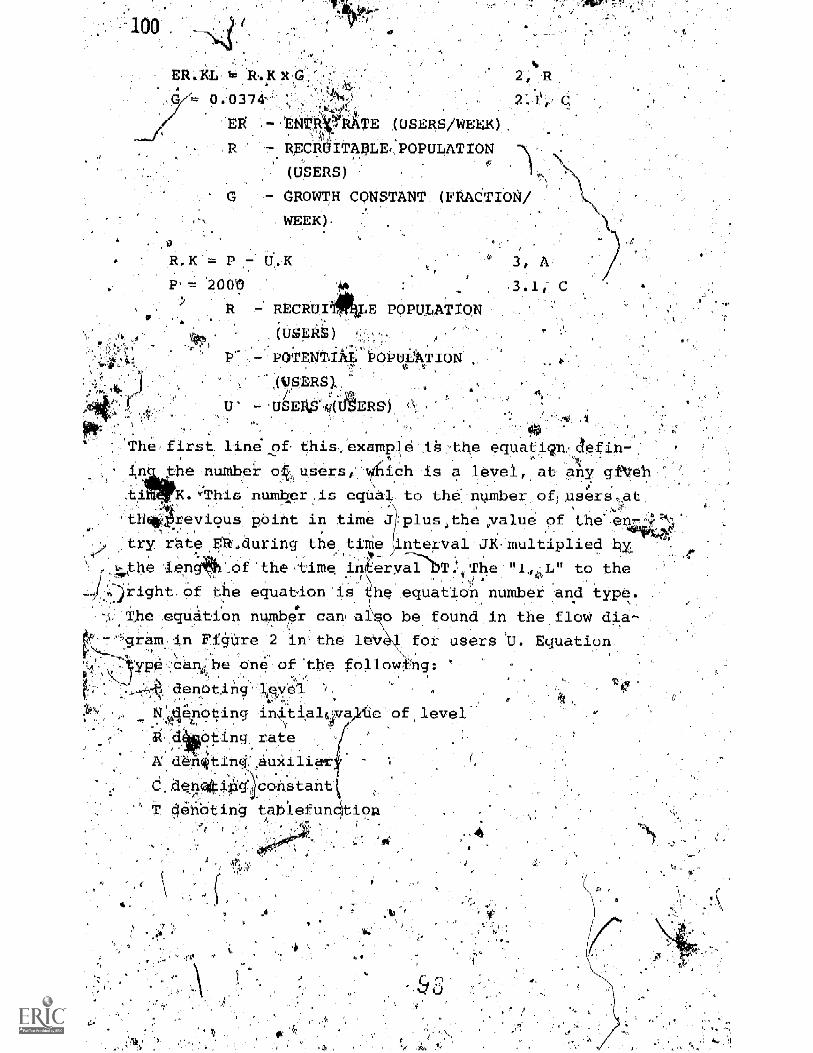
- USERS/WEEK
R 7 RECIIII.ASLE POPULATION
(USERS)
- GROWTH CONSTANT. (FRACTION/
WEEK)
R.K = P U.K
P' = .20011
R RECRUI JJE POPULATION
(USERS)
POT' ENTI4
(USER 1..
.USE
The first line of this, example .1S the equati9n- ciefihe number o users, Oich is a level, at any gi'Veh
This number .1s equal to the number of users atthe* revious pCint in time plus,the yalue of the.' en -try rate Elt..during the, time interval JK. multiplied bythe Jen the time. in eryal iT .' The "1, L" to theright, of the equation i h equation number and type.
-7... The equation number can al o be found in the floci7 dia-m in Figure 2 in the lb ,l for users 'U,
ypi :cani be one of. ,
denoting lleyelN denoting in4.tialcva
doting rateA den ngl,aintilid_aq r a g constant
en Ling tablefun
cllowig
of,level

101
The second line ofthe*exaMple is.an initial Value
assignment indicatingthiwinitial humber of users to
be equal to the constant IIN, which is specifie0 in the
next line as a constant having'the value zero.
The variable names appearing in the equation are then
listed together with their definitions. In parentheses
are giveR the units of Measurement.
The fourth equation of the example ( "2, R") is a rate
equation describing the entry rate ER. It says that
for each coming time interval of unit length the entry
,rate is equal td a growth constant times the number of
recruitable users R. The units for ER is users/ Week
but this does not mean that the soultion _time interval-
DT is one week: UT specified separately as a control
parameter for the execution of the simulation program
and specifies the time between successive calculation
of the values of the Model variables. Since the growth
constant. is equal to.0.0372 the entry rate, measured
in.users week,'. is equal to 0.0374 times the number of
recruitable users.
Equation 3 is an auxiliary equation indicated by "A" to
the right. It defines the recruitable population as
the difference betWeen the potential population P and
the current number of users U.K.
Equations. 2 and 3 ,illustrate, the .use of auxiliary
,equations: it would -have been- possible to define the
equation. for the entry rate.directlyas 7
U.K) x G. In this simple example perhaps clarity
not lost but when the equations are more complex this
can happen.

102
The ample discussed a0ove is ,a 'Sys
tion of a dynami,C model presented by.
chara0prizing the growths patterns.of
tion. Ware's growth model is base
first-order equation:
dti
.The fto.tatio , has - been. transformed to con
definitions .given:-46ve. The orrespond
the system dynamics model and 4th e dif
tion is easier to see from the foil
tions:
ER d1.1,
dtx Rv
(7)
(8)
This is also a practical illustration. of what Baas said
ihitial1 about the ,conceptual foundatiop, of system
dynamics being a system of ,differential equations
the form given by equation (1) and (2Y Which are
reprinted here
dt
'A = 3 L)
(A)
(10)
where L is ,a vector of "levels", R is the vector Of
"rates", A.is the vector of "auxiliary variables",
and t is timeI
In the following all equations will be given in the.
DYNAMO form.. common notations fdr these equations are
summarized as followS-.4,

IN ALLIEOUATIONS; tine indices are writtethe variable naffie'separated from it by -a
Tcar
IME INDICE,S denote both point in times and 16intervals according- to the following:
denotes the previous point in-time and is used in level andauxiliary equation
denotes"the current,point intime and is used in level andauxiliary equations
,4enotes:the time interval betweenand K and is used in rate equa-
tions'(and sometimes in auxiliaryequations containing-a variablethat is or will be smoothed -
-
'e p. 105)
XL denotes the time interval betWeenX dnd the succeeding point intime, L, and is used in rateequations
/T-
DT-denotes the length of the time interval betweensuccessive calculdtionS of the values.of the modelvariables and is used in-level equations.
Special Functions in DYNAMO
The DYNAMO. compiler =can perform;a number of special
functions (see Forrester, 1968, chapter 8), some of
which are used in the model ISS2.
TheiTABLE fundtion gives-the numerical values of a
dependent variable as .a function of an argument (in-
dependent varaible) by performing-linear interpola-
tion between points in a table. This is a convenient
way of expressing e.g. non -lineal relationshipS bey
tween variables. The formats of the equations needed
are the following:

DV.K TABLE(INAME IV.K, NI, h, A
TNAME = WE / g g /EL n. T
where DV.K. is the Yiameof the dependent variable.
,TABLE is the funetiOnnaMe
TNAME is the name:of the table on which thefunction' is to operate
iS the name of-the independent variablefor which the corresponding table-entryis to belocated.(level or auxiliaryVariable)
Ni is the value of IV.K at which the firsttableentry is.recorded
-N2 is the value of IV.K for the last tableentry
N3 is. the interval in IV.K between. table'entries
El is the. value of-the. table. at = Ni
E2, . is-the value of the table at V.K = Ni-N3
is the last-table entry giving the valueof the table at IV.K ® N2
is the equation number and type (auxiliary)
I, T is the equation number and type (table)
The following figure illustrates the TABLE funotiOn:
Figure-3

The TABHLfunction- is'siMilar to 'the TABLE function..
The function name. stands for TABLE witlHigh7Lowexten--sions. It differs from the TABLE function byHallOwing.the independent variable to be Outside- thbrange speci
by I41, N2..11-the.value-'of IV.K is less than Ni
e valUp.of thedependentvariable6.A6 equal to El,
and when. the independent variable is greater than 02.then the value of the dependent variable is equal toEL. The ThBHL function has the same arguments, as the-
. 'TABLE funetieunt
TABHL(TNiME,IV.K. ,N2,N3)
e MIN function is one of the DYNAMO,functions that,
perform logical operations'. It is written=
MIN(P,Q)
The SMOOTH. function is a first order information delay..
.The function contains an integration,' i.e. a level, and
in a flow diagram it is represented bY.a rectangle.
"It is used in an information channel to produce a first-order exponential delay. It represents the process of a
, gradual, delayed adjustment of recognized informationnoving toward the value being supplied by a source. Itis used to generate a delayed awareness of a changingsituationh'(Forrester, 1968, p. 8-22)
The fundt n is written:
where PV.K
P .1( SMOOTp(IVAC,DELTME)
is the,recogdized,- or perceived, valueOf the input variable
IV.K is the input variable whose value isdelayed
DELTA is the delay time

'44 \
Cr)
1
DON
Gtlivtry
DillyNorm
tofde6, Mt
18
PO
Prop
to fury
PON I SPNo,u, surf nebid;idly / to keep fit.
POrAftMil nom
33
osrionirrobli
his
POO Suitt froductivity
DONM Pot drily Nr.n
DAPdifot.
of riff topakiitetiOn
32
INNor growth
, red normal
1
DDN
Nom
N

I
I Reductionaiscr FTME
d i KM, time
REV GL RECF,
Reitnuf Recovery?
f rRECF
Recowyfactor
EVI XRevenue
Index
48
NSUF
Start-up fund
Tim
-ALR
Average :caverate
22
II
I
I
I .1
.
I
I
I
I
on job
LDDPMLot term delivey
Pere a 1:d16
A H
Approved
hires
20 UDEEfita of OatMay ao Cupp:
24
DDPFDewy delay
perry (tinder15
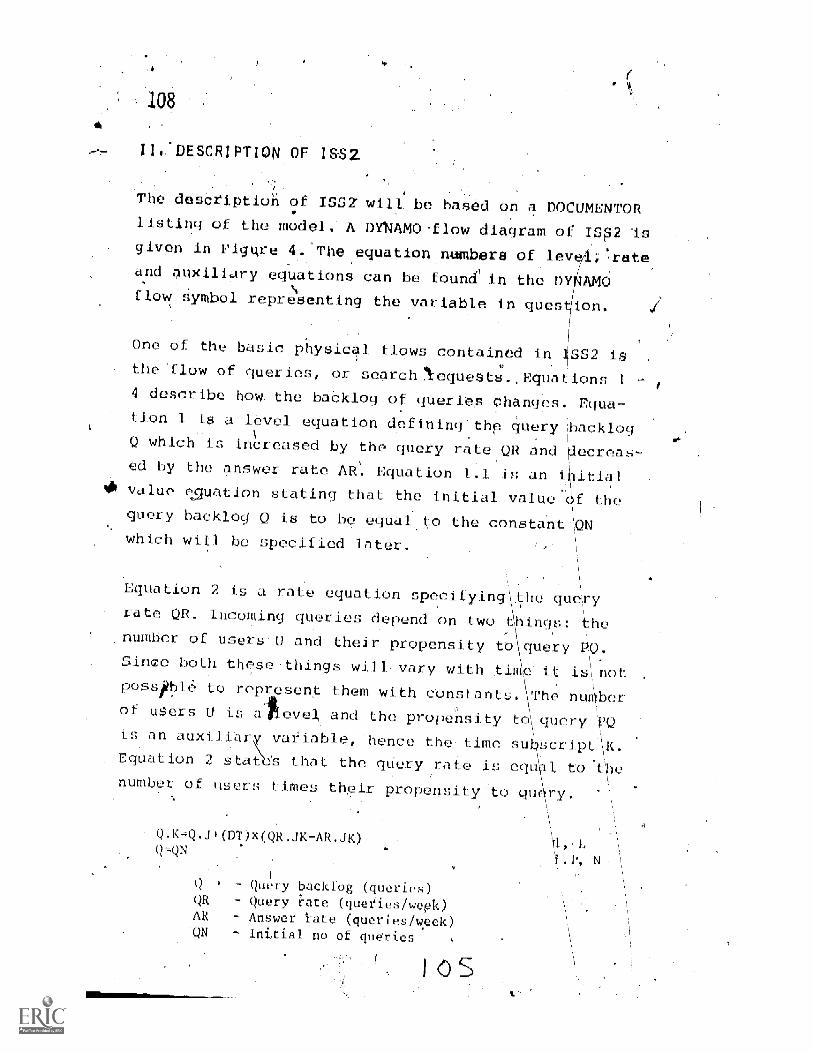
108
lisMESCRIPTI NOF laS2
The d setiption of ISSZ. will be based on a DOCUMENTORlisting of the model. A DYNAMO-flow diagram or I5p2 isgiven in Figure 4.'The equation numbers of lev 1 rateand auxiliary equations can be found' in the DY IAMOglow representing the variable in question.
One of the basic physical flaws contained in SS2 isthe flow of queries, or searchNequests.,Equations 1
4 describe how the backlog of queries changes. Equa-tion 1 is a level equation defining thp query backlogQ which is increased by the query rate QR and ec /cas-ed by the answer rate AR. Fgnation 1.1 i an i itial
410 value equation stating that the initial value f thequery backloq Q is to be equal to the constant QNwhich will be specified later.
Equation 2 _ a rate equation (wen,cifyin-rate QR. Incoming queries depend on two ings: thenumber of usersU and their propensity to\query
\Sinqe both thesethin will vary with time it isnotposspole to represent them with constants. The numberof users U is aevel3 and the propensity to\ queryis an auxilia variable, hence the time sut script \K.Equation 2 sta t?-- that the qiiery rate is eq 11 to thenumber of users times their propensity to q
K-Q..14-(DT)x(
JK-AR.JK)
Q ° - Query backlog (quo es)QR - Query ?ate (queiie. _epk)AR - Answer fate (queries/week)QW IniXial no of queries
I S
Y.

QR. K1. -U. KX1().K
QR y rat i )
U - 1 r; (ingV() Prop query plot. i /week /tiger 1
Alt .KI.,,ASIT.KgSPOltx).:( )AAR .1
AR Annw rat e ((pier i Ps/ PIOASP Al local. inn of NC:111 to prodhr n (nraf I)SPQR Stal f product ivi t y (quor af 1)EQAAR- Effect 1)1 cowry Iity u11 awiwii Lai
(dimensiviilOss)
U
The (Ins r°.1 t'( Alt whit ipr i f, led in Egli, I Ion i f1
C(111 t t niimhtir .Ii 1 t 0,1(1-At nci ,ASP ita t 11C7t_ tv i Ly :;PQR i not -tI recrri itv,1 j 1 dlii1ify I.()AAP
In cquat our 4 rind 4 .,1 t het y nn .Titii_=;w rd 1.:(./AAlt i r1 etc t i ti: i tttl I Iv. TABU!,I ti t i 11 (:;("' 1"P. I W" k111,W t 1 it
n I L I i hie t -tt,it .1 Vi t y 1,o4 vttli 1 I 1 Id 110'11 ill 1111. .1.'114'11111 1111
dvd i I.ihI I
i ( '! ; it =I I L i:; no Ho
it 1 i=ty wit i 1 c,-1( .1 414('I 111 1111.1 1..1 '1.111;
1-1.1114111 t( 1- 1. It i 1; 111(11 1 11 1,1\;( t A(H W(111 111.) t 1 I 1
in( wit t1111,1-y 1)1,.1,1(ii1 1 y low .:( ii'1 ('if1t 1` i
11.11 4)1 1 11( ' 1111 ( 111.1 1)(1
till(( y
i 1 y t
lint 11 he re lev,in t il,tt t 1:-.
t i 1,11,1e 1 he 1:1)AA1 :Join r her et ill )
whtn t 47Y. 1 4"4.1
t II 1.1 t
.1 I It Al; wi 1 1 lie e( 11
11(11; 1 (.(1('11
.11 1i t
Wi 'II
pf
hack I
111 +`t 11111, A;;P
i zer 0 r:(1AAt lli :; r:_; 1.f1 it t wile
' C 1< tvil 1 IA' =t I1 1 0(1 1-(
1,11 111(1 1
11,11 ri h I he
1111104'r (It
it I hieti .7 it
The - n:10-
f h
I

110..
n. EQAAR Can illrAprnkenlnd By a. table f no ill list In '1 guru.,
(111 weI
.01 .0Z
(1111=
.t `of Av.li I a
hive fonn no wd ntenre I ( I I I n . pm uctIvIty-door s , t ! t 1 Int eII t ( ) I query Ava I 1 , 1 1 d I i t y In !B\I i t I'T .1t-li 1 0, and i!`. likely tl t his 0 If pc t VI.I y
.401,1 1 rnAaar@i tp 1-110 rr rnan(ro !n If I
albw :a!lnn. VQA/11( thew.rnle hdr-, ,he valno nne b m..11v., Q t_,:<(!1,1) 4: b mn I c ZO!
Wil c.'11 t must 1,V ,I
I
y
It doc I n;it (n.t. ;!;ity
2( t \1 ;1.: AAP is .`q..)(: 1 f(r(I "Po-
t tor I t ht. TAMIL t Itric n
4 we /1
the rabi 1 f:1)1('';(41 t
4

EQAAR.
TEQAAR-
:om- 10
TAIIIII. 'IF AAR. I 1<,0 L. 02, 00.1/. 9
19,1A_Ali , - Elf oc't c >f quet_y availability (
answor ra ri dim. less(,) Qnpry backlog (queries.)Al'tilt Slat f produ 1 vii y (tow(
work / start)
'['ho nuM1
wook lopond
Tho d 11 r vc L li ea reh t 1 m0
ht.
4, A4.1, 1.
4.2,
pwrio( csirl ; nnwet .n a
much Limo, Ls spent on each one,
ems tt1 vary greatly depending
f )11 h0 ph 1 I ihy of thf.' IS S: some services spend
rc la ve y 1 tt_
(ahorli :11'"nd
typ11a_cal so,_
inf.).1(.1 (Wai
vc y sin I Imo a t-
ff time per search, -roas
It c1t`c 1: One hour seems tc be
tiMoyhich js indicated by the SOC
a I I'176, p. A-9) , but Lilo
Lhe t-orwinal (mean value 1.9.1
m I mit /-,., ;mod 1 A n va i tr).3 mina e0reveals, that the. 1 r . . 1 1 I {nests ma t .t re tiVO4, simple kind. The
(cc)Ft(=y,i 1 i.ipi t. i n1(2 i the NAS I C r, r°..v ice rrt MITa I in(.:;t (boil 11; 111 an valn0 rMi.nntes (Benenfeld et al,1 h /1 ) het ISS opr i nc1 in Ilia iyersity anci
r e: ;cat c l env. 1 the' HL)ya i T n:;t!Dr', J
i V t 0 1 vc I - h t inl
1 91
H ',1 tai 1 lit'!,. c crtl.;,ic.lcc1 I r >n.; we , t {?I hide L_ililt for at
1 r:7, ..p1 .0i 1 II .1 I c c ti r cA.l1 en 1.1-(-)Innont.,- .1,11( 1Laling
w i I1 i e fat .1 v '1 y (r-unii 1 x r,oar 11 rotiu it:.-; t-lie nnmber of-...,
:;-,,II1 1., I.tff por week mwit Ics--; than 20, and
II t_a i 1 ?1, I .1 -run dVi'ldy i ay)(a JO..The SDCunt..a..L !; 1 N.J..- n,
-
it 1 ., I 91 1i_ I ii) ,slivt"---.; at
r,o.311- v.,-i l 1:1(..' 1 sod frchc-s lict lei icd in a week of 9.6.
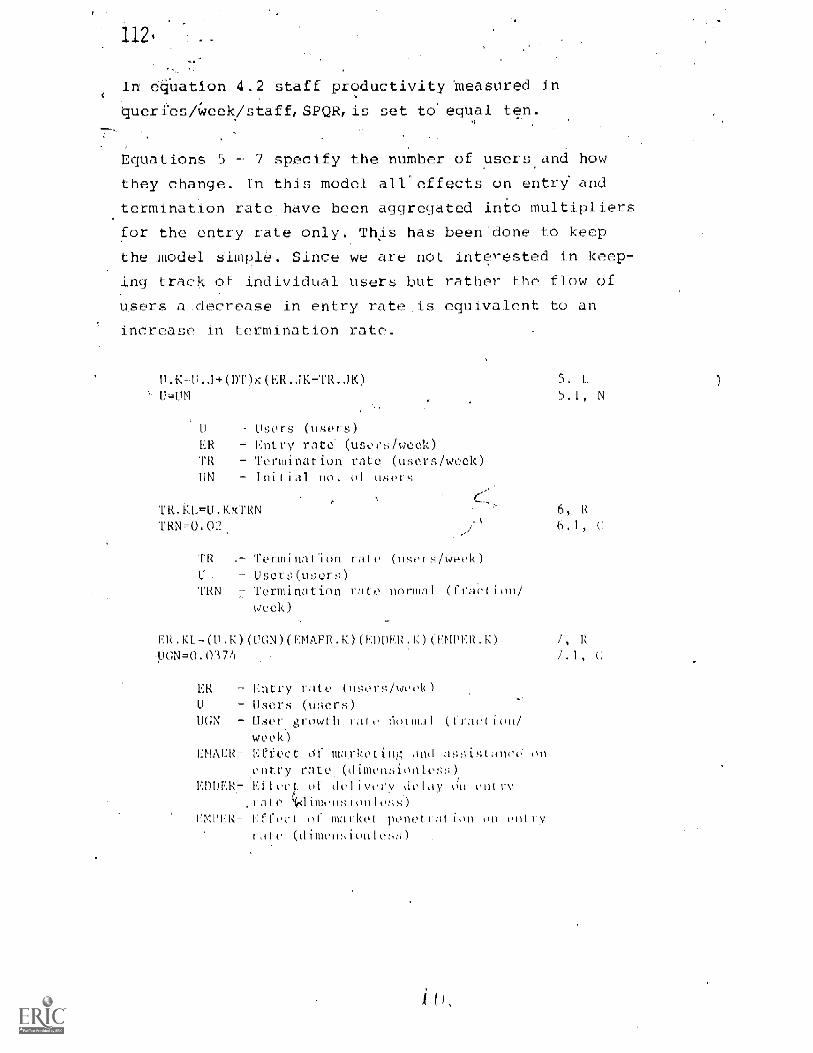
112'
In equation 4.2 staff productivity 'measured in
querres/week/staff,SPQR,is set to equal ten.
Equations 5 - 7 specify the number of users and how
they change. In this model all'effects on entry' and
termination rate have been aggregated into multipliers
for the entry rate only. This has been done to keep
the model Simple. Since we are not interested in keep-
ing track of individual users taut rather the flow of
users a decrease in entry rate equivalent to an
increase in termination rate.
U.KI1.J-4-(D1')x(ER.,1K-' R.JK)
II Users (user s)
ER Entry rate (users/weel')
TR Termination rate (usersUN Initial no. of users
U.KxTRN'I'RN =O. 02
TR
-ek)
= - Termination rate (users/we V.
U- Users(nsers)TRN 7 Termination
week)
normal (fraction/
FR.KL(U.K) GN)(EM ER.K) EDDEU.K ft11'ER.K)
UGN=0.0174
ER Entry rate (users /week)
Users (users)UGN - User growth rate Cloimai (tra tion
week)EMAER- Eftect Ot markotin and assist L on
entry rate (dimens onless)RUDER- Effect_ of delivery delay 'nt r
,rato {.(limolp;ionle!;!-O
r,mrkR- tJtect market ponelt.;_ i in on ry
1-.1tc (dimetn;ioule0
5. 1.
5.1, N
1, R
113
K uation _he umber of users UI a level
which is increased by tie entry rate ER and decreased
try the termination rate TR'. The initial value of the
number of users is aetermined being equal to the
constant UN. This is specified in the initial value
ion 51.1.
The termination rate TR is defined in equation tt as
the= product Of the number of users U and a termination,
rate normaLTRN. In equal:ten 6.1 TRN is set to-equal
0.0'2. This moans that each.week 1/5(1 of the users
leave the service or, expressed differently, that a
normal time to remain a user is abiut one year. Such
time reflects the rolatively high turnover of
and changes in interest characteristics typical
L an , _ c setting. The termination rate'is difft-.
cult to aeasure since there is no formal contract
which li i to ltc canceled; a Ill be invisible
the lam S he_etwevn the times he submits a cluf_ry. in
this sLiidy we have
Itliysit _al termination
tit delininq a user
nil thn consider
to try to estimate the -
i ti to
someoltilt: use the
approach
use for a normal ust'r
l line k.)t, t1 wee -s (see 7, 59) . ln the yearly statis-
t ic kept by etperat 1011 l 1 1, -;Ss individual -- are
k.yltic' nett traced so bur approach cons
with practi which makes to mpare
vc,-u1Ls'with puhlishod L ist
nt
In this model all ettects on and Le uin Lion
t r Ikive II -euat into inu It iplior !--; I 0 t tit lt 1 y cull y Th i s ha I) t,0 keep t he nu)(4,,
mp I t nee We art ilctt I iltt'rt'St ed 1 ii keepi
tiv klu,i I user but,. ra her t w ctl use's

114
.decrease in entry rate is equivalent to an increase
in termination rate.
EquatiOn 7 defines t e entr rate ER as a product
five terms. The first two t-rmsrepresent the un-
disturbed growth of the number of users and t
remaining three terms representant inhibiting fo'rces1
The inflow of users then is stated.in terms of a nor-
mal growth rate which is modified by multipliers that
represent the deviation of he actual system state
from the normal with re ard'to,delivery delay (EDDER)
and the amount of marketing and assistance given
(EMAER). In addition the normal growth rate is modi-
fid by a multiplier representing the effect of market
penetration EMPER.
The user growth rate normal UGN is specified in
equation 7.1 as being equal to Q.0374. This value is
based on the experiences at the University of Georgia
Computing Center and other inforMation centers.
It is, however, not a trivial matter to estimate UGN.
For ISSs, as for many other growth rates, observed
,values are
the factors
.ed to three
Inction of many variables.
affecting the growth
major influences, as
rate
In this study
have been reduc-
seen in equation 7,
that modify the normal, or inherent, growth in thenumber of users. Of these three one represents a
market saturation effect (EMPER) and the other two are
multipliers representing the effect of a deviation of
the system state from a "normal" state with regard to
delivery delay (EDDER) and the amount of marketing and
assistance provided (EMAF;R)
115
We can ignore the market saturation effect when look-
ing at the initial grawth. Since data on UGN is notr.
available we have to find a proxy,. The main considera-
tion for shoosing among available statistics is that the
growth Of users should be aa "undisturbed" as possible.
For example, a change from a: free service to one that
costs money will disturb the growth pattern.
We believe that the data from the University of
Georgia Computing Center is the best available even
though the service iS an SDI-service. Froin the account
of the center- operatidns given by Carmon (1973) we
can infer that the amount of marketing and assistance-
was adequate but not excessive: the introduction of
the service was preceded _by an earlier attempt which
failed "due to the lack of professional staff to in-
terface with the users" so when the service was re-
started "a full-time staff, although small, was em-p
played " ". Furthermore communication with the center
was done via a terminal network and "the computer
facilities had already found relatively widespread
acceptance and --, from which we can assume that the
delivery delay situation was satisfactory.
Carmon presents several diagrams of growth. Of these
we have chosen the growth of users for the CA conden-
sates data base (this diagram can also be found in
(Ware, 1973, Fig. 2), The reason is twofold: the
diagram is one of the least aggregated, and the CA
Condensates data base is comprehensive enough to be a
basic adequate information service in one subject
field (chemistry).

116
In Ware's (1973.) paper a saturating growth model. has
been used to Interpret the data (see the'exampIe on
pp. 99-102). Experiences from other services, especial-
ly those offering on-line services (i.e. ISSs), indi-
cate that at least initially the growth is exponential
(see for example, the statistics froi NASIC/MIT And
RITIDC in Figur-6S 1 and 2 on p. 53 and 54). To get
an estimate of the natural growth rate UGN we there-
fore have to reinterpret the- data,. We do .this by
estimating the doubling time graphically as shown in
Figure 6, where the circles are the observed data
points reported by Ware (this part of the figure is
copied from Ware's graph).
Figure 6Graphical estimation of doubling time.
he estimated doubling time for the number of users
is 4.25 months which gives a growth constant of
0.0374+.
Multiplying this with 52/12 to get weeks of equal lenght weget a doubling time of 18.4, weeks. Since the, doubling time
for an exponential growth process is 0.69 times the timeconstant for the process (see e.g. Goodman, 1974, p. 22.) we
find the time. constant to he 26.7 weeks, and consequentlythe growth constant 0.0374 since it its the inversion ofthe time constant.
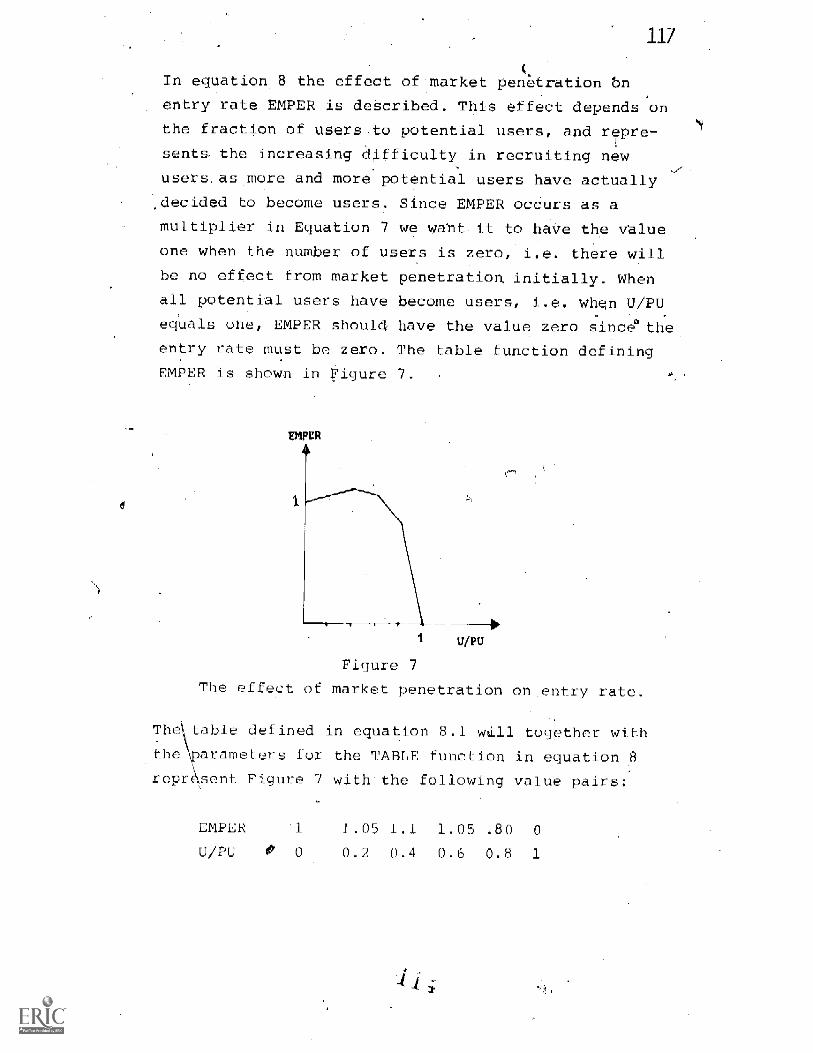
117
In equation 8 the effect of market penkration bn
entry rate EMPER is deScribed. This effect depends on
the fraction of users-to potential users, and repre-
sents the increasing difficulty in recruiting new
users,asmore and more potential users have actually
decided to become users, Since EMPER occurs as a
multiplier in Equation 7 we want it to haVe the value
one when the number of users is zero, i.e. there will
be no effect from market penetration initially. When
all potential users have become users, i.e. when U/PU
equals one, EMPER should, have the value zero since the
entry rate must be zero. The table function defining
EMPER is shown in Figure 7.
The
The\table defined in equation 8.1 will together with
the ,par-- eters for the TABLE function in equation
repr_ sent Figure 7 with the following value pairs:
VIPER
U /PU
Figure 7
of market penetration on .entry rate.
EMPER ' 1 1.05 1.1 1.05 .80 0
U/PU e 0 0.2 0.4 0.6 0.8

118
EAPER.K-TABLE (TEMPER,U.K/PU,0,1,0.TEMPER-1/1.05/1.1/1.05/.8010PU 2000
EMPER- Effect of market penetration on entryrate (dimensionles)
Users (users)PU - Potential market (usprs
8, A8.1, T
The initial increase and-subsequent derease in the
function in Figure 7 represents an additional effect
due to the fact that the probability of a user to_
come in contact with a potential user, i.e. the word-
of-mouth effect, at first increases .with an increase
in the number of users and th611 decreases,The word-
of-mouth effect is imp rtant, as found in the NASIC/
MIT project (BenenfOd et_al., 1975, p. 1-4): "Aware--
ness about the'service is most often achieved by word-
of-mouth," To an extent this effect is inherent in the
exponential 'formulation of the entry rate. However,
compared to the, situation at the University of Georgia,
for an ISS that starts the service withbut a previous
attempt to introduce the,service the world-of-mou th
effect could contribute to the normal growth rate.
This additional effect we assume not to be more t1
10%.
When approximate y 2/3 of the market i penettated it
becomes more dif ult to attract users, which
represented by decre -e in the value of EMPER from
unity to 'Zero. The implicit assumption in the shape
of the table function is that when both the delivery
delay situation and the amount of Marketing and
assistance provided are normal, i.e. ELDER and EMAER
are equal to one, then growth in the number of users
will level off when about 8 5% of the market is

reached.+ To achieve a highen market penetration
EDDER,or EMAER must be higher than one.
The Size of the-potential user market is 'given in
equation 8.2 as being 2 000. The typical ISS we model
is part of a reasonably large academic institution, and
the value of PU is based on a personal communication'
from the NAS/MIT;,Office (May, 1976) . Wish and
(1975) made a _urvey at the-University of Wisconsin
which gave an estimate of about 1 000 potential*users
among the faculty. To this graduate students must be
added.
"If librarians want to establish their libraries as infor-mation service centers, then customer satisfaction must besought by offering speed and ease of access to informationstorage as well as professional expertise, perhaps fOr anadded fee." (Wish and Wish, 1975, p. 3.)
The remaining two factors in the equation fol- the
'entry rate ER (equation 7) are the multipliers EDDER
and EMAER representing the effect of delivery delay
and the amount of marketing and assistance 'provided,
respectively. The multipliers are built around a
normal State of the system with regard to these two
major service characteristics. The actual state of the
system is compared to a norm and the multiplier rep-
resents the effect of deviations from this norm.
Further examples of the modeling technique of' using
normal values can be found in (Forrester, 1968, p. 23
ff )-
Recall that the termination rate for users is 0.02. Whenthe effective ,entry fate equals. the termination rate growthwill level off. This will happen when EIDER = 0.5348, andthe value df U/PU will be 0.8664.

120
The effect of deliv delay on entry rate is peci-
fie in equation 19 as a TABLE function., and the
corresponding table is given in eviation 19,1
EDDER.K=TABLE (TEDDER DDPP.K DDN,0,3,0.5) 19.ATEDDER=1.6/1.47/1/.47 3/.3/. 19.1; TDDN=0,5 f.
EDDER- Effect of-delivery delay on entry.rate (dim. less)
DDPP Delivery, delay perceived by potentialusers (weeks)
DDN Delivery delay norm (weeks)
The dependent variable for the TABLE function is the
ratio of delivery delay perceived by potential users,
DDPP, to delivery delay norm, DDN. The higher this atiO
the worse is the service perceived. When the p_
ceived delivery delay equals the norm, i.e. DDPP /DDN
1, then the value of the Multiplier is by definition
one, Should the perceived delivery delay be shorter
than the norm then DDPP/DDN is less than one, and the
value of the multiplyer should be greater than one.
The actual table function used in 1SS2 is shown in
Figure 8.
Figure 8
The effect of delivery delay on entry ra -e

Equations 19 and 19.1.
as the representation
121
ve the following value pairs
this table:
EDDER 1.6 1.47 1.0 0.47 0.3 0.3 0.3
DDPP /DDN 0.0 0.5 -1.0. 1.5 2.0 2.5 3.0.
Around the normal point (1.1) the curve in Figure 8
is assumed to be linear with a slope of about That
is to say that the effect is proportional to the
change,inDIDPP/DDN. This assumption was not based on
empirical observations since it is very difficult to
analyse effects due to delivery delay in isolation:
when the delivery delay increases the ISS is over-
loaded'and has typicalj_y already triedompensate
this by reduding the aiount of marketing and assis-
tance. The assumption, however, is indirectly support-
ed by experiences. at the Library of Congress, SCORPIO
service (personal communication, March, 1977): the
installation of a faster processor in the main compu
ter resulted in a 23% improvement in response time
and the -increase in the number of searches was between
23% and 35%. (Unpublished statistics for the SCORPIO
service revealed an average of 857 searches for the
four months prior to the installation of the fast
processor. The following month the number was about
1200 with an even higher projection for the next
manth. Some of the increase had to be attributed to
the return of Congress, but 200 -300 searches were
attributed to the shorter response time.)

122
The ref_ ip between the delivery delay sit ation-
and EDDER is, however, not _linear for all values of
DDI4)/DDN. Even a relatively long delivery delay does
not reduce the entry rate to zero as indicated by
IliQrP130 (1975, P.: 123) who gives statistics from the
RECON service at RtTL-TDC where the average delay
between submission of query and search was about 10
vs durirN 1973. Judging from the relatively high
satis7aetion expressed by the users in spite of the
long delivery delay, the effect this factor will
probably grow slower as the deli gets Thoso
considerations are reflected in the kinks in the table
function in Figure 8.
The value of the delivery delay norm DDN is given in
equation 39.2 as 0.5. In the SDC impact study (Wanger
1976, pp. 221-2) it is reported that over 80?,
of, ail search requests were being filled within one
week of eir receipt. The average delay is 2 days
(p. A-24) but if there is an appointment system, WhiCb
SS:LIMO for the typical ISS in an acodemic setting,
this time w> I have to be lengthened somewhat (cf.
iljerppe, 197'), p. 125). The managers interviewed in
the SDC study ind carLi that 86% of their users were
satisfied with the turn- around time. From this
dicussion we i fer that halt a week is a iii isoniai le
norm for delivery Aelay.
The remaining term in the e tu.i ( len for the entry rat
ER (equati4-m 7) is EMAER, the of fe-t of mark Ling and
assistance on entry rate. EMAER is specified in
equ ation _ and and like 1-j1DDER it is a M111-
ptior represen(i offecLII of deviatiomi from normal
situation. The argument I (he TABLE function Lii
ocitit ion 31 is 4he ratio (II neoded liable

123
assistance ASTNP/ASM. ASM is the amount c,t- staff
allocated to marketing and assistvee (see page 147)
and ASTND is the needed assistance expressed in number
of staff. iilTNP is calculated in ectjation 11 al; the
product Lit the numb,er di users and the a:',ffistanro
needed p r mler (expressed in sCaff/user), ANEEP. The
vakie of ANEEP is 0.001 start per ti:-v1 (equation 16.1)
which Iteani.1 that, assuming a 40 hour work week ,and 48
work week,-; pot year, that a -user requirett 2 houi6 ui
stoti timefto be satisfied. In a relatively mature
itate tot:- an, 'SS with about tall users und
about, 3pet-uonf3 Llitu mean:: that 28Y, of Llit,
time must Po !Tent on marketing and almiutaneo. xpe-
ri,ruicef; Irvm operattonal ISO gvc the actual average
V alue!; for vcourceli flpent on market it (11:ftomor
aI=Itance a: ,luytnlifff lot weon and 4V,. (Iardner
( 1 " 1 ' 1 , n ) I I I I p I ..,k) I ('N HI iClt pm I II'
t ,1 1 LUCkl t C 111 1 1 1 M 1 Y", h opor,it I nj luff-lootofto market f_uu c.t torts, tiI ,it Life Ni? 1011,11 ihrary ct
Canada An c:ftimaled 40':, of atIt effort-. ::pent on,
ma 1- Lit jii u Ince (per :,,-;of fa I conmtun hit ion, May,
107'0.
The cItefd Ii w marketinu and awftfftancf
Ilustrated in FiOc0
4 'lit i '4y' I t. 4.;
A;;VNID.K rKNANITD A
ANITO 0,001 I ,
AS1:fi1) A,;-;,:i;;tAnct, nt;oded c;,t,tkliwt;ek)
H - (tPict,i)
ANIT)- A pc; ti;.c t ;t itwock/wwt)
(
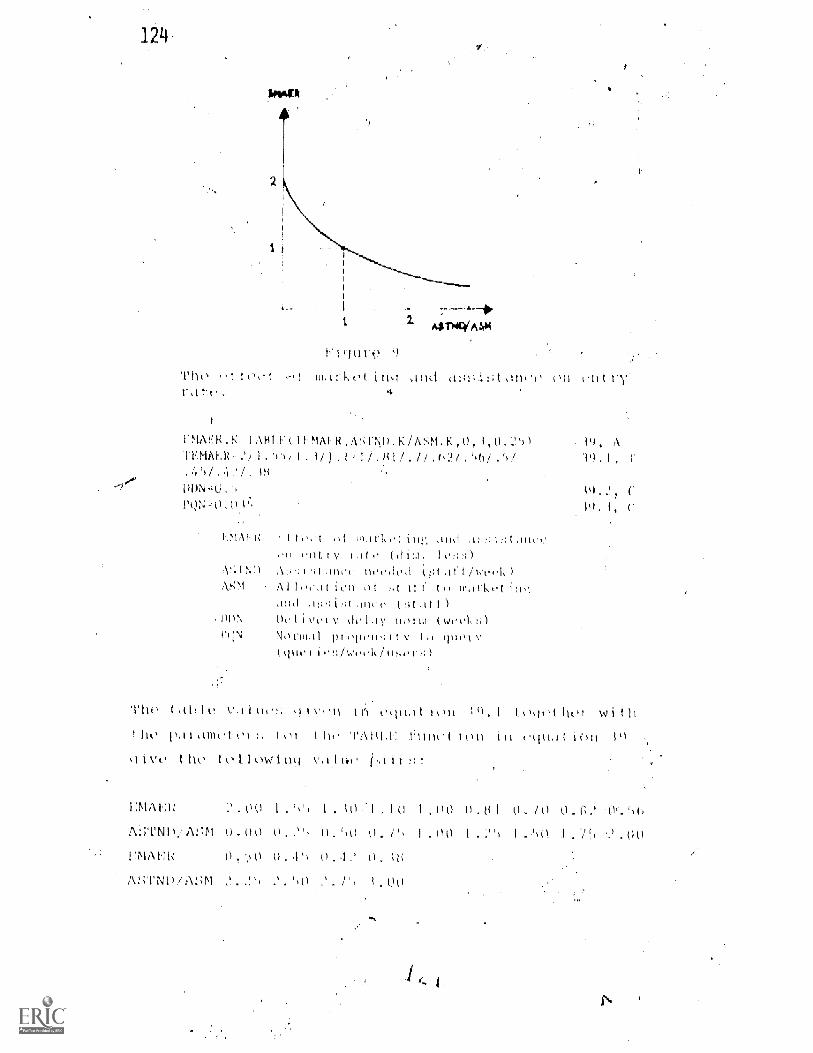
. ' 1
, 0 ' , ' C l',-\!/ 1IN,1,!1i
0 ,-I ' 0 ,, 1. ' 0 . ' ( 1 1.1 \ /1)1; 1
1111 ` 41 / ' I 0 ' , ' 1 1 i '0 0,, '0 I 141: v, ON,1,1;\I
,),, Al ,' 9 ` 0 0/ i W 0 00 ' 1 III' 1.. 01 ' 1 ' 1 00 " 11,1\111:1
I
III m i.)ti
1
V 'hi
II 1 II
1)1
LI hij I i'A hi! )11 CI ) OA) h
I 1.,11i1.1. :TM vi, Oil I 101 !: WW1' till 11,1 i I ht II.A I l ;111 1 hA (II' ) 011,1,
.1111
t' 1 A 11 11'11110N
) tti IOU ,k1' I A I Of\ I 1,10
(I I1' rtIr J.1)1 _I it 1'; 1t.I 1101 11,,.11
,),),,/1,1 1,01,,),)11 '".1 7V '0!II') 'III': A )(1.o
.011 1' `1.11'u.; I" I ,.'I 1 II r. 1
N(111
/I / / I
N'11N1.1\,' ) IHV I >i*
1I; 1 ;;I:1' ptiP 1X11 1.111 I k../
;),-N(10

The vf L
LS t_ dlnnr'
delay,
doubled
125
tam market and assistance on entry rate
be --,aLer than that from delivery
and Pigure it shows that the t tit_ry rate could be
11 there were unlimited resources available
for mar Lag. The to _le al Aso shows that an allocation
staff to marle ,Ling gives
s _ Ile. 'l`Ilat the feet of m rketinq
t s by the statistics froM
L;icjte lilt
increasing returns to
iftlre
fact drama-
RITL-IDC (see
whore the sharp increase in the
socirch requests in early 1976 came after a
ampaign (the increase was Crom about 75
t 1.? ®1 h
p I/ Ler ti) -11i0ilt 125)
tai` ct-Ahe th6 delivery delay anti how
it pc'rc eived by the different decision mikers. The
tvt.::,ry i i.rid icaI ott DIX is defined in equation
the qn, backlog 0 by the answer ra he
on Ay
AP
111t_' 1' 11 ed over 50MA0
r cmk)11 I nt loduc lug
measured readily rat
-iod of t into' which
itll,lc indicated
Lo constantit I I oCy delay . I I t he answer -1',1 IL
Ca 1 LSI I a
t 11110 thi tl I hi, de 1:ivOry e t ay could be
will ell in be luntraLed by the
1 loi.ving examp 1 : suppose;Ind I ii,it t iii t; 1
+itlel 1 t hen iI t. he answ r
is query backlog
sus by incom ne
gin i poi-lit, 1 1 1 vi,t '' Oelay w I 11 hi: lrclA I a we
The pi,' I
I I t
ch blX Is me ;1110d n be
theI Ind I me , 'Mt h i ng t Imo
1 I1) ,tit Il IIlt1 I 11 t I 111, t hilt it IC(
alt I it Ittw itI I tl M0,1S111--(:
: 11,1: to k.N,J, t 4Ar0ek p
C., ;10 I N (le I
oi.4
ved5Ii,il t,I t
it 0J del is'01 lay I)lN kit ) 11,4 etniat ion 1.I

126
ee p. 105 for a brief deserLpLi n of the SMOOTII
function) . The users- perception time UPI' is the
srnOothin time for. the, SMOOTH function. UP T is set to
13 weeks (in equation 13-.1) which is a maturing time
for the users' experience, and it isasguPea that .it
takes that long to forin a definite-opinion regarding
the true value of the delivery delay.
DDITI.KSMff A (DtX.K.UPf)
UPT13, .
D1)P0 Delivery delay perceived by users(weeks)
DIX Delivery delay iudicat (weeks)
Users percept time (weeks)
11.'1,
The pctenti al users and the fund_ _r do not have a firsthand experience of the service so the percep_ -)n of
the:delivery delay is based on the use The users'
communicate-their perception of the delivery delay and
this communication takes time, which' introduces
another perception delay in the flow of information
about' the delivery delay. Time perception time for
potential users is assumed to he 2 weeks, and for
the (under 40 weeks. Equations 14 anti' 1.4.1 define the
delivery delay Perceived, by potential users DUFF as a
26 weeks smooth of the delivery delay perceived by.
DDPU. Similarly in equations 1S and 15.1 the
delivery delay. perceived by further DUPE is foinulated
as a' 40 weeks smooth of DDPU.
DIX.K--Q.K/AR.JK 12,
DIX --Delivery delay indicatedQ Query backlog (queries)
AR Answer rate (queries/week)

DDPP. K OOTH(DIOU.K,PFT)PPT-q6
DDPP'- Delivery del ay' peree -ed by pcusers (leeks)
DDPU Deli Very delay perceived by (nets (weeksP1'T Potential users per -lon time (weeks)
127
14, A
14.1, C
DDPF.K SMOOTU(DDPU.K,FFT)FP1'40
DI F Delivery delay perceived by funder(weeks)
11D1U Delivery'delay perceived by users(weeks)"
FPT Fuoder's perception time
15, A
15.1, C
LDOPM.K=SMOOTH(DIK.K.I.MTT) 16, A1,MPT26 16.1,
LDDPK- icing term delivery delay perch vecl bymsnagenent (weeks)
DIX - Delivery delay indicated (weeks)LRPT Mana&rrient-s icing term perception
time (decks)
tvranagem nt does riot have to rely on users percep-
t ion to find out about the delivery delay, no their
lone 'term recognized delivery delay bf)DPM is a 26,
weeks s-exponontial average e. smooth) cif the indi-
cated delivery delay DIX, as defined by equations 16
and 16.1.-The implicit assumption here is. that mania-
cement forms a definite opinion about the delivery
delay situation with a- lag of half a year which we
believe is realistic considering that it takes some
Limo before statistics are processed and since there
is a natural tendency in an academic sot,tinq Lo regard
a year as consisting of two xssenesters.
livery delay on entry rata has air:-
been discussed. In addition to this effect delivery
delay a 1 ' has <r n impact on the propensity to query
it di-scouracje return use without Making
he user leave the service. ThusAt any given Limo

128
the nsity to query migl t lie different from the
normal propensity to query go. The value of PON taken
from an OECD study eitied irr bjungbergi 1975, p.77)
is 1.8 queries per year, or 0.035 queries per week as
divan in equation 17.1. Stated differently this means
, that there is normally 9 weeks between queries from
one user.
PQ.Kr-PQNXEDDPQ.K
PQ Prepvesit to c u y ue / eok/
user)-
PQN Normal prop nutty jo query (querie5/.
week/user) .
EDDPQ Effect of del very delay on th prop
sity to query (dim. le'ss
035
17, A
.39.3,
In equation -17 the propensity to query PO is given asthe product of the propensity to query normal PQN and
the effect of delivery delay on the propensity to
query EDUQ, Theeffect from mark ting and assistance
on the propensity to query-Au jra ged to be negligible
on the following grounds: mark pg and assistance re
crueial for attracting users to the,service and-the
important aspect is to increase the users knowledge
about the functions cf . t7ad system (Persson and
ylund, 1975, p. 63); :a change in PQ reflectS t
response of already having' knowledge about the
system and obbut what to expect. EDDPQ is a multiplier
representinq effects of deviations from a normal
delivery dci,ay situation when the delivery defy per-
ceived by users DDPU is equal to the delivery delay
ncr (or yhon DDPD/DDN,==1). When the normal situation
prevails the value of EDDPQ is one and the propensity
to query is equal to the normal propensity to query
(st.,: equation 17). EDDPQ is defined by a TABLE func-
tion in equatWn 13, and by-the TABLE in equation 18.1.

EDDPQ.K.. LE(TEDDPQ,DDPILK/DDN,0 0.5) 18, A18.1, TTEDDIN1.5/1.25/1/.8 .65/.57/.5
EDDPQ- Effect of delivery deley'n thepropensity to query (dim. less)
DDPU Delivery delay perceived by users(woeks)
DDN Delivery delay norm (weeks)
129
The function defining ,EAbPQ is illustrated iri Figure
10,EDDPQ
Figure 10.
The effeet of delivery delay.ori thepropensity to. query.
The relative flatness of the curved scribing EDDPQ
explained by 'the fact that EDDPQ is an additional
effect on the propensity to query which is primai-ily
a characters tic of the user population.
Equation 18 and 18.1 give the following value pairs:
EDDPQ 1.5 1.25 1.0. 0.8 0.65 0.57 0.5
DDPU/DDN 0.0 0.5 1.0 1.5 2.0 2.5 3.0
The effect of delivery delay on t propensity to
query has received little- attention in the litetature
bUt there are some experiences from operational IBS_
that can aid the construction of the table. Since
EDDPQ is a multiplier with a norm we know by defini-

130
tion the point (1.1 ). If the propensity to query were
constant the table'funttion would be horizontal. This
is not the 6- e which is shown by the changes in, the
percentage of return users. If the propensity to query
increases the number of users that will return to the
ISS dUring a. year increases boo. At the NASIC/MIT
service the p rcentage rethrn users was about 30, at
the end of the initial phase. (Benenfeld et al., 1975,
p. 1 -2) and in 1976 it was estimated to be 35% arid
growing (personal communication :Augiast 1976).
Anpther indication, that.PQ is not c nstane is that the
number of users and the number of searches grow at
different rates: the latest annual report from NASIC/
MIT (Pensyl, 1977, pp. 5 -6) gives a growth in searches
of 46% and in users-of:33%.
We. infer that the o urs respond-- tobetter service by'
returning.more often to the ISS'in terms of the table
function it Figure 10 this means that the. funotiom
will be.monotonously decreasing. Since we do not have,
any- further information about the shape of the func-
tion we make the simple assumption of linearity with
the exception that EDDPQ will not go down to zero. We
assume that the effect of delivery delay'on the
propensity to query is between +50% and -30%,
A decline in the propensity to query as a response to
a decline in the service component delivery-delay
represents one aspect of the voice option on -the part
of the users, which was discussed on 26. The most,
obvlous way to exercise the vc 401A)p5 ion is to com-
plain to the funder of the service 4 this aspect is
discussed further on p. 136- but one can also with-
hold ones queries without leaving the service, thus

remaining a user and re-uire staff time for complaints.. .
In the model this is part of assistance.needed' TND
ee p.'12.3), This .consequence of,the voice opt 'is--
so discusSed by HirshmanA1970,p.- 131Y:"voio_ can
-lict direct costs on management a complaining
-cuatomers occupy the time.of the firm-s personnel and
succeed- i-_- having defective merchandise 'fixed- up' or
exchanged".
tquation 9-11 deacribe the ,number- of ,staff and how. it
changes. Equation,9,1s the level equation-and states
that .the number ofstaff Sis. increased by the. hiring
rate HR and decreased by the leave -rate LR. Equation
is the initial value equation where the initial
value of S is set equal to EN..
The leave rate LR, defined-in equation 10, is formula-
ted as the number of staff divided by the average time
they stay on the job TOJ. Experienc9 from NASIC/MIT
and RITL-IDC indicate that turn-pverJof staff is low.;
in equation 10.1 TOJ is set equal to 200 weeks.
S.K=S.J4-(DT ) (HR -LR.J()S-SN
- Staff (staff).
HR. -Hiring rate (staff /week)LR Leave rate (staff/week)SN - Initial no. of staff
'1..R.KLS.K/TOJTOJ200
Lk. 7,Leave rate ( taff -eek)S - Staff (staff).TOJ - Time on-job (weeks)
RR.KL,--NE.K/PTME
PTME.25
RR Hiring rate (staff /week)AB Approved hires (staff)FTME Hiring time (weeks).
9, L9.1,
11, R1111, C

132
The hirin_. rate HR ig described in equation 11 aS.the
number of approved hires AB divided by a hiring-time
PTME. The hiring,iimerepresehtsthe delay necessary
fdrthe hiring decision. to be effeCtuated. It includes.
such components,as time to advertize, select candida-
tes,and alloW-for their notice time. PTME also in--
cludes delays inherent in the budgeting process. In-'
eqUation 11.1 the hiring:timeis given as. 26. weeks, or
half a year, which is assumed.to Covet the delays
discussed;
The hiring decision is influenced by both economic
concerns and the performance of the ISS in terms of
delivery_ delay. The decision.iS described` in equations
20-27.
The approved hires AH specified in equation 20 are a
function of the-desired hires DH and the funder-s-
willingness to support the service as well as an e o-,
noMic constraint. TO model the expansion decision,
4,e. the' determinant$ of AH, on empirical data cannot
be done Without- a considerable data collection effort.
Evenif such an endeavor Was started the nature of-.=
the decision making process is fuzzy and involve
that are very difficult to measure. In this ,
study we have taken another apprOacti: from sources in
the literature we extract general.trends and attitudes
and then formulate the components of the expansion
dec4sion in accordance. The factorS affecting the
decision should -then be regarded ,.a examples of
policies. The consequence-for the study is that the
conclusions that can be made ar not absolute but
contingent on these hypothetical policies (as pointed
Out on p. 85).
AH.K(DH.KKEDDSF.10-EECHR.KxS.K
AH .- Approved hires (staff).DB' .Desired hires (staff.EDDgF- Effect of delivery delay on the
upport'from fonder (dim. lese).EECHR- Effective economic constraint. On.
hiring (dim. less)Staff (stpff)
DR.K=(ALRAUPTME)+DXS.KxS.K
AL
DH Desired hires (staff)ALR Average leave "rate (s week)PTME - Hiring time (weeks)DXS . - Desired expansion of staff. (dim.
less)
Staff (staff)
ICSMOOTH(LR.J1,1,MPT)
ALR - Average leave rate (staff/week)LR -Leave rate (staff /week) .
LMPT Management `s tong term percep-tion time (weeks)
'2C
133
A.
21. A
The first factor A.n-equation 20, ,determining the_,
approved'.hires is desired hires DH. This is what-the.
ISS management considers needed to give a satisfaC7
tory service, and it corresponds to a request for
funding.
The desired hires DH is formulated in equation 2i as
the SumOf a, compensation for staff, that has-leftand
a desired increase in staff which depends on the
delivery delay situation. perceived by:management.
Management knows the, average leave rate ALRi and it
also knows-how long it will take to fill positions:
the hiring tim&PTME.,Thereforeit iS'necessary, to
multiply the average leave rate with the hiring tine
to compensate for leaving staff. ALRx1DTME-then-rep=.
resents managements estimate of the number of staff
leaving. The desired expanSion of staff DXS h is
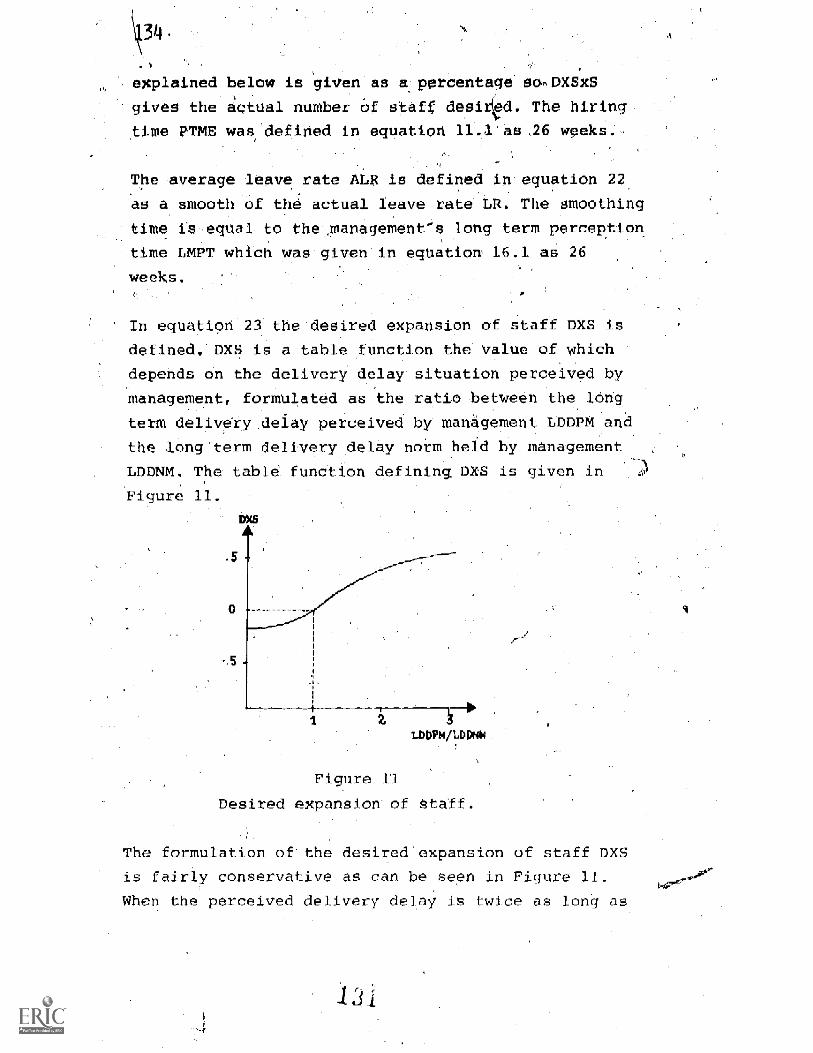
3
explained below is given as a percentage so,DXSXS
gives the actual number. Of staffdesirced. The hiring
time PTME was defined in equation 11.1'as ,26 weeks;,
The average leave rate AIR is defined in-equation 22,
as a smooth of the actual leave rate LR. The smoothing
time is equal to the-,management-s,long term perception
time LMPT which was equation 16.1 as 26
weeks.
In equation 23 the desired expansion'of staff DXS is
defined. DXS is a table function the value of which
depends on the delivery delay situation perceived by
management, formulated as the ratio between the long
term delivery .delay perceived by management LDDPM and
the longterm delivery delay norm held by management
LDDNM. The table. function defining DXS is given .in-
Figure 11.
LDDP D
Figuke 11
Desired expansion of to
The formulation of the desired expansion of staff DXS
is fairly conservative as can be seen in Figure 11.
When the perceived delivery delay is twice as long as
3

135
the norm, which is an indication of, insuff cient
number of staff, the increase ruested by manageMent
is assumed to be 35%. It is also assumed that Manage-
ment never requests-More than an increase of-50%. When
the delivery delay perceived by management is shorter
than the norm, i.e. when LDDPM/LDDNM is less than one,
it is assumed that the ISS management makes "responsible"
requests for fUnding and accepts a.'decrease in the
number of staff.
DXS.K=TABLE(TDXS LDDPM.R/LDDNM,0 3,0.5)-LDDNMO.5TDXS .2/-. 5/0/.2/.35/.45/.5
DX S Desired expansion of staff(dim. less),
LDDPM- tong term delivery delay perQeivedby management (weeks)
LDDNM- Long term delivery delay norm heldby management (weeks)
23, AC
T
The conservatism-in the decision regarding DXS is also
manifested by the. choice Of ,the long term delivery
delay norm held by Management LDDNM which.is-set to
half -a-week = the same as the delivery delay norm held-
by the marketDDN. LDDNM is specified in equation 23.1.
In equation 23 and 23,2 the- desired expansion of staff
is defined. Tbgether these two,equations give the
following-value pairs:
DXS -20% -15% 0 -20% 35% 4/5% 50%.
LIMP- LDDNM 0.00 0.50 1.00 1.50 2.00 2.50 3.00
Returning to equation 20 where,the approved hires is,
defined we see that the desired hires will not auto-
matically become approved - the funder's willingness
to support the service, represented as the effect from

136
delivery delay-on the support from (under, EDDSF,
also have an influence. We have pointed out that ,an
ISS has fairly established procedures for evaluatiWe
feedback. (see page 26) which constitute a vehiCle:Ifor
the users-to practice the "voice ". option as a res onsc
to declining quality of the service. if a bad deliVery'-,delay situation is sustained for a lone `period of
time, i.e.: if a long 'time-aVerage- of the deliverys
delay is longer than the norm, users will be dissati
Pied and the funder will .consider using his resources
on other functions. than the ISS. The delivery delay
perceived by funder, is a long.termaverage of the
delivery delay perceived by users recall from
equation 15.that the funder's Perception time,. 40
weeks. Since the users perception time is 13 weeks
,(equation in this means that the funder reacts to
approximately the average value for the preceding
year
The effect of delivery delay on the supportt f,otn fungi.
der, EDDSF, ig illustr ted in Figure 12.
Fig re 12
The effect from delivery delay on-the supportfrom funder.
When the long term delivery delay is equal. to 'norm
or better, i.e. when DDPF /OON is less than or equal to
one, the funder is supportive and accepts the desired
1
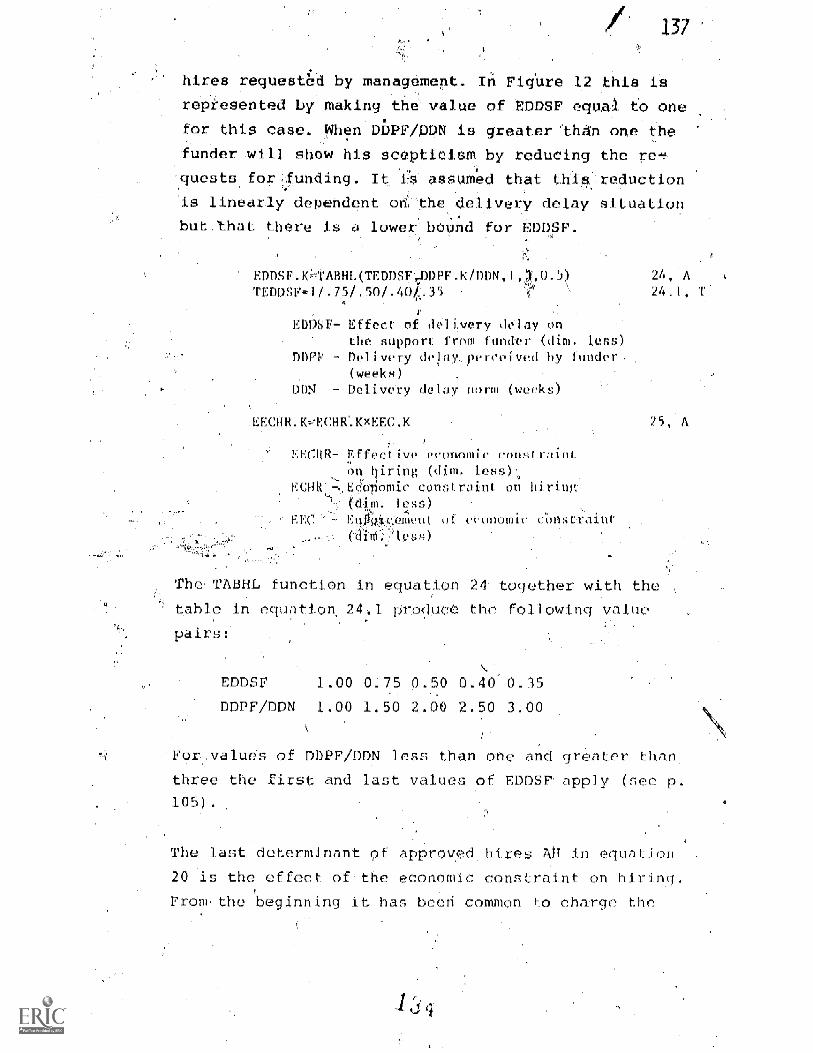
1 7
hires req-- d by management. In figure 12 th s is
reptesented by making the value of EDDSF equai to one
for this case. When DDPF/ pN is greater than one the
fonder .will show his seep ioism by redueing the tett
quests forjunding. It 1ss assumed that thin:.reduction
is linearly dependent od he delivery delay situation
bu:Ahat there is a lower bound for EDDSF.
EDDSF.IU,IABHI TEDDSEnDDIV K DIA,1TEDDSF,1/.75/.50/.
EDPSF- Effect l i very delay on
the support from hinder (dim. ler ,
DDPF - Delivery delay, perceived by fander(weeks)
DDN Delivery delay norm 4(s)
EECIUR.
EECHR- Effective ecor Bic
on 10.ring (dim. le's
KCHlt E6liomic constraint on hiringOm. 125s)
E,e, ement of ..'cr-nic aiur
(dimi.' less)
24,
24.1,
The TABHL function in equation '24- together with the
table in equation 244
pairs:
pro uci the following value
EDDSF 1.00 0.75 Q. 0.40 0.35
DOFF /DIN 1.00 1.50 2. 2.50 3.00
For :values
three the first and last val. (,6. of EDDSF apply (see p.
105).
DDPF/DDN less than one and greater than
The last determinant 9f approved hires An in equation
20 is the effect of the economic constraint on hiring.
from the beginning it has been common to charge the

138
users of ISSs for the service, and a recent discussion
about developments in the field of scientific and 1
technical information dissemination indicates that
ecdnomic considerations are becoming increasingly
important (Schwar7, 1976, p. 9 ff.) . De, Gennaro (1975)
provides a,diseussion or the developments that have
led to this situation. Regarding user fees for.
computer based bibilfographic search services Almost
libraries have found it necessary to 'recover at Least
some costs in this manner" (Gardner et al p. 4).
The effective economic constraint on hiring is defined
in equation 25 as the product of two terms: he
economic constraint on hidng, ECHR,:anA the enforcement
of the economic constraint; EEC. The latter factor is
explained fUrthcr.bolow and in equation 21; it topro-
sents the effeet-that thefunder is willing to.,,refrain
from enforcing the economic constraint, especially
during the start-up period of the sory,ioe
ECHR.1--TABHLOTCHR,REVGL/REVIX:K,1,1-5,0.1)TFCHRU/.08/.15/:)0/.)-i/.?)RFVC1.1-4
ECHR - Economic con,:traiat oh hi r in
(dim: lo!i8)
Revenui2 goal (OTTles/wcek/stalF)REM- Rovvolto intlex (dint fosq)
26, A26.1, T
C
The economic ccinStraint on hiring, ECHR, is a functio
the ratio between the revenue goal REV.OL and the
revenue index REV1X, and is defined by the TAMIL
function in equation 26 and the table in equation
26.1 If the,. revenue index is greater than the
revenue goal, i.e. REVGL REVTX is less than ono, then
there is no economic constraint on 'hiring andECH.R As
zero.
t__, ,..J
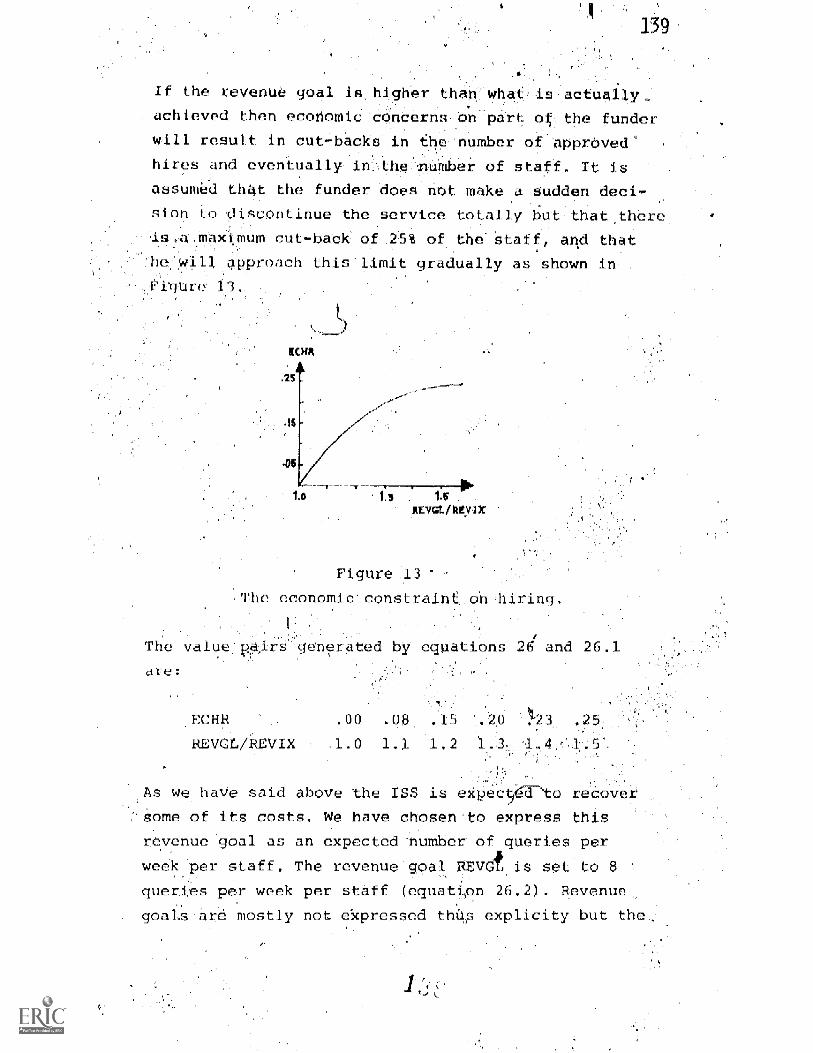
139
If the revenue goal is,higher th n'what
achieved then economic concerns, on part
will result in cutbacks in the number
actually,
the funder
approvedhires and eventually- the-nUMber of staff. It is
assumed fhat the funder does net make a sudden deci-
sion to discontinue the service totally but that there,
um cut-back of'.25% of the Staff, and thats ea ma
'llapproach this limit gradually as shown in
'cat 13
1 0 1.3 1.6 .
IIIVGL/REV1X
Figure J3
The economic' constrain
L.
on hiring.
ener _ed by eglaations 2d and 26.1
.ECHR
REVGL/REVIX
.00 .08 .15 .20 11'23 .25
1.0 1.1 1.2 1.3 .4
As we have said above the ISS is e4ec amto recover,
-ome of its costs. We have chosen to express this
revenue goal as an expected 'number of_queries per
week per staff. The revenue'goal REV0f is set to 8
queries per week per staff (equatipn 26.2). Revenue
goals -are mostly not Ocpressed thOs explicity but the.,-

140
economic performance of an 155 is pically judged on
a more aggregate level, e.g. on the 'basis of annual
reports. The realism of the chosen revenue goal can
be inferred from the actual situation at NASIC/MIT
(Pensyl, 1977):. for the period June 1976 to Na Y 1977
the average number of search requests -der week and
staff was 7.95.1" This resulted in an income 'practi-
cally equal to the computation and operating expenses
- not explicitly stated as a goal, but a situation that
is becoming,a norm for ISSs:
"A common pattern is that the library absorbs the indirectcosts such as the cost of the terminal and staff operators-time, but asks the user to pay the direct costs includingoomputer time, printing, and comunication charges." (DeCennaro, 1975).
The second factor affecting the effective economic
constraint on hiring, EECI-IR, in equation 25 is the en-
forcement of the economic constraint EEC. For a
reasonable start-up period it is assumed that the
funder is willing to accept that the number of queries.
per week and staff will not be equal to his goal; he
guarantees a budget for the ISS operations. In the
simulation model this represented as a
nary fund which is depleted by a certain
weekly, this amount being what the funder
ould" be recovered, unless the volume
is at the revenue goal, in which case the
left intact. It is also possible that the
discro in-
mount
thinks
f business
fund will he
fund will be
The figure given in the report is 3.65 searelics per clay anci"searcher". in this ease searches .1170 counted once for cacdata base ,Accessed and the nunilxw- of such accesses is about_2.3 per user, thus the number of queries per week Mill ourdefinitions) s: (l.65/2.3)x5-7.93-

141
.lit up after a decline by achieving a,- volume of
'business that is higher than the revenue goal. The
enforcement of the economic constraint EEC is a funs=tion of what is left in Jr discretionary fund DF
relative to the initial amount NSUF. The ratio DF/NSUF
then taken as a measure of the economic viabilityof the ISS operation. The relationship between-this
measure and EEC is given in Fioure-14,.
EEC
Figure 14
The enforcement _f the economicconstraint.--
when the ratio DF/N UP is one 9greater then EEC iszero; in this case the ISS operation brings in the
expected amount= of moaey and the 'economic constraint
on hiring is not enforced. As the ratio becomes less,
which means that the discretionary fund is being de-
pleted the funder becomes increasingly conci,rnod a itsF"igure 14 this is represented by an increasing (nega
Live) slope tor' the function. IF the discretionary
fund is used up the economic constraint will be en-
forced Fully, i.e. Cl C will have the value

142
The enforcement of the economic constraint EEC i de-
fined in equation 27 .as a TABHL function.
Togo
function
EEC.Km'IM31-11,(TEEC,DF,K/NSUF,O, 1,0.25)
TEEC-=.1. /. 45/ .20/.07/0
FIE(- l;]nforce constraint
(ditn_ less)
OF, OisQretiona y funds (dollars)
NSW' - Initial start-up fund (dollars)
er
27, A27.1.
ith the table in equation 27.1 the TABilL
enders the following value pairs:
E17C 1.00 0.45 0.20 0.07 0.00
D1;'/NUF 0.00 0.25 0.50 0.75 1.00
To kee e model simple we have chosen not to incluc
equations describing the cost accounting. Cost data
are generally difficult to obtain. One reason is tha
sometimes the ISS together, with th6 hosting library
embedded within a larger mega izational framework
(see p. 17 and Zais, 1.977, p. another is that the
chargjnq scheme from the serv7 suppliers can be very
complex.
We need, however, some measure of the economic vlabi lity
of the ISS, and as mentioned above we have made'a formu-
Icition with a discretionary fund DC'. 1:quation 28 is the
ation defining the discretionary fund. It is
increa -ed by the income DIN, by which we mean ncome
excess of the rges passed on to the user. The
fund iS depleted by the reduction in discretionary
funds DOT, which represents what the fonder thinks
"should" lacy flowing in to meet operating expenses_
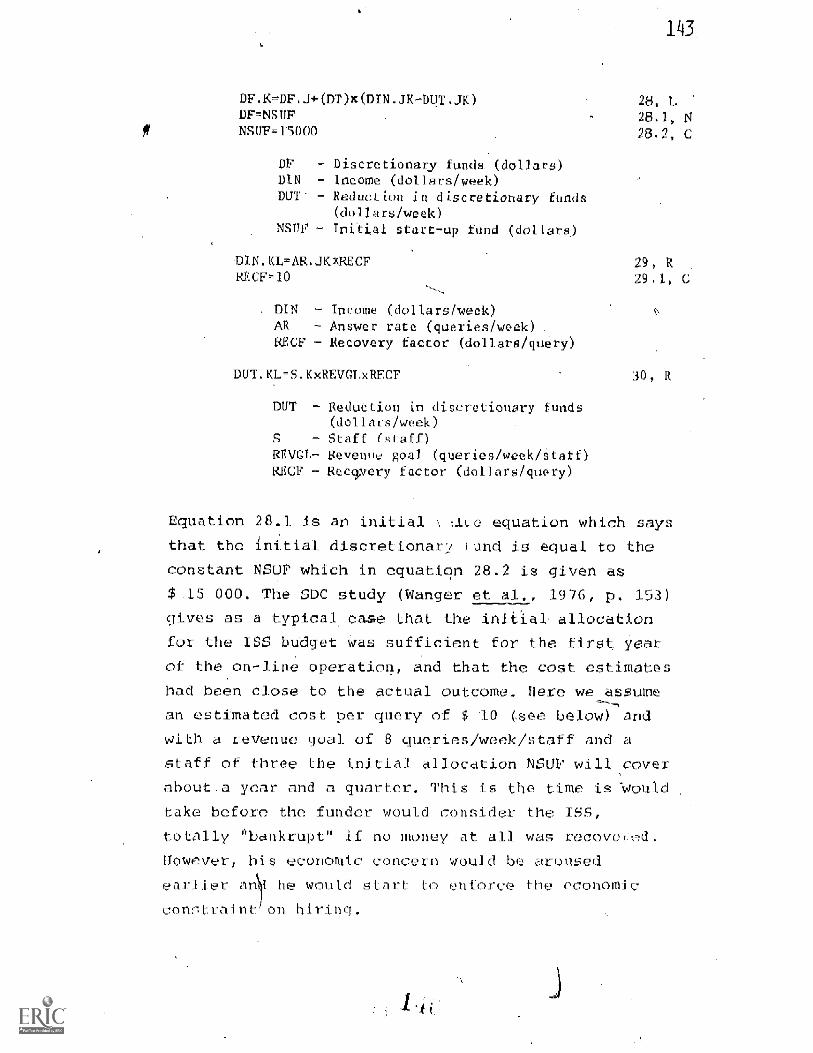
DF.KDF.J+CDT)X(DINJX-DUTDF.NSUPNSUP=15000
DF - Discretionary funds (cicalaDIN - Income (dollars/week)DUT' - Reduction in discretionary funds
(dollars/week)- Initial start-up fund (dolla
143
28,
28.1, N28.2, C
DIN.KLAR. RECF 29,RECF10 29.1, C
DIN - Income (dollars/week)AR - Answer rate (queries/week)RECF - Recovery factor (dollars/query)
DUTAL=S.KxREVel, RECF 30, R
DUT Reduetioi, in discretionary funds(dollars/week)
- Staff (staff)REVGL- Revenue goal (queries/week/staff)RECF - Reclvery factor (dollars query)
Equation 28.1 is an initial \ tiLe equation which says
that the initial discretionary Lund is equal to the
constant NSUF which in equation 28.2 is given as
$ _15 000. The SDC study (Wanger pt al. 1976, p. 153)
(Jives as a typical, case that the jnia1 allocation
for the ISS budget Was sufficient for the first year
of the on-line operation, and that the cost estimates .
had been close to the actual outcome. Here we assume
an estimated cost per query of $ 10 (see below) and
with a revenue goal of 8 queries/week/staff and a
staff of three the initial allocation NSUP will
about,a year and a quarter. This is the time is Would
take before the fonder would consider the ISS,
totally 'bankrupt" if no money at all was recovered.
However, his economic concern would be aroused
earlier al) he would start to enforce the economic
constraint- on h ring.
COVer

1414
Equation 29 is the
come to the discre
aate equation describing the in-
onary fund, DIN, as the product of
the answer rate AR and the recovery factor REM,
which is like a surcharge the users pay in addition
to computation costs. RECP is given in equation 29.1
as $ 10 per query (see below for discussion) . T'11:-
means that the ISS will have to charge the users
about $ 30,$ 40 per query: the average cost per query
at NASIC/MIT is about $ 35 (2.3 NASIC searches times. /
the average total cost of $ 15.75 per search (Pensyl,
1977), the SDC -study (Wanger et- al,, 1976, p. A-8)
gives an ,average cost per search of $ 23.83 (median
$ L7.16) but does not reveal how many such searches
axe made for one query.
Equation:30 is the rate equation describing the.reduc-
tion in discretionary funds, OUT, and represents the
expected cost, which Occurs in addition to what the
user pays for ccimputing costs, at a volume of busine-s
equal to revenue goal REVGL. The- total reduction will
then be (S(staff)xREVGL(queries/week/4 Aff)xRECF($/
query)), with the dimension ($/week).
In practice the fenders estimated'cost is often not
explicitly stated as we have done here, so the sur-
charge-will have to be estimated by management. Here
we have assumed that the same estimate, RECF, is used
by both. At the NASIC/MIT.service the income less
computing expenses, i,e. the recovery facFor, is
$ 6.44 per query (2.3 MASIC earches times $ 2.80
(Pensyl, 1977)), and the, operating expenses, calcu-
lated analogously, are $.7.19 per query. Operating
expenses include such things as materials,' postage,
telephone, but there is no standard way of defining
these costs. here we have for simplicity assumed $ 10

145
per query. The equations relating to the economics of
the ISS should tie regarded as .a simplified- represen-
tation of the budgeting process.
The resource allocation decision is des ribedin
equations 31-37. It is,An the nature of a services like
an ISS to have a reactive resource allocation. policy:
management tries to spend some resources on marketing
but when queries come in they have to be answered.
Since it is common to have the users make appoint-
ments with the staff in advance, and since marketing
activities involve other 'commitments, ,e.g. rental of
space for demonstrations, changes in the allocation
cal tot be ,effective immediately. The allocation change
time ACT is, however, assumed to be relatively short:
equation 31.1 gives the value two weeks.
In equation 31 the allocation of staff to production,
ASP, is defined as a SKOOTH (see page 105) of the de-
cided allocation of staff to production. A 4Amoothing
time of two weeks means that this is the time over
which the change will take place.
ASP.K=SMOOTH(DAP.K,ACT)ACT2
ASP - Allocation of staff to production(staff)
DAP Decided allocation cif staff toproduction (staff)
ACT Allocation change time (works)
DAl).KNIN(IAP.1(,ISP.K) 32, A
11111* 31, A31.1, C
DAP Decided allocation of staff toproducIion (staff)
[AP - Indicated balanced allocatstaff to production (staff)Staff needed for production tokeep delivery delay norm (staff

146
ISP.K=Q.K SPQRxDONM) ADDNM0.5
ISP - Staff nedded for production tokeep delivery delay norm (staff)
Q Query backlog (queries)SPQR - Staff productivity .(queries/week/
staff).
DDNM - Delivery delay norm held by manage-ment .(weeks)
Equation 32 defines the desired allocation-of staff to
production, DAP, as the minimum of two variables: the
indicated-balanced allocation of staff to production,
'AP, and the staff needed for production to keep the
delivey delay norm, ISP.
DAP is the actual decision about how much staff should'
be allocated to production. The ISS management alio-.
cates enough staff to keep the delivery delay at the
norm until there is a conflict from the presSure to
allocate resources to marketing and assistance - it
is not possible to allocate 100% pf the staff to
searching since some assistance will have to be pro-
vided.
In practice it can happen that it is not possible
allocate the'necessary resources to proddction
immediately; Hjerppe (1975, pp. 125-126) reports:
... unprocessed queries piled up quite rapidly, especiallyif the system had a serious break-down. The situation thisfall, 1974, has been that we have for at least two nonthshad a queue of 10-20 queries waiting, and this backlog isvery hard to eliminate as long as the queries keep comingat a regular pace, which is what we in other circumstanceswould want them to do."
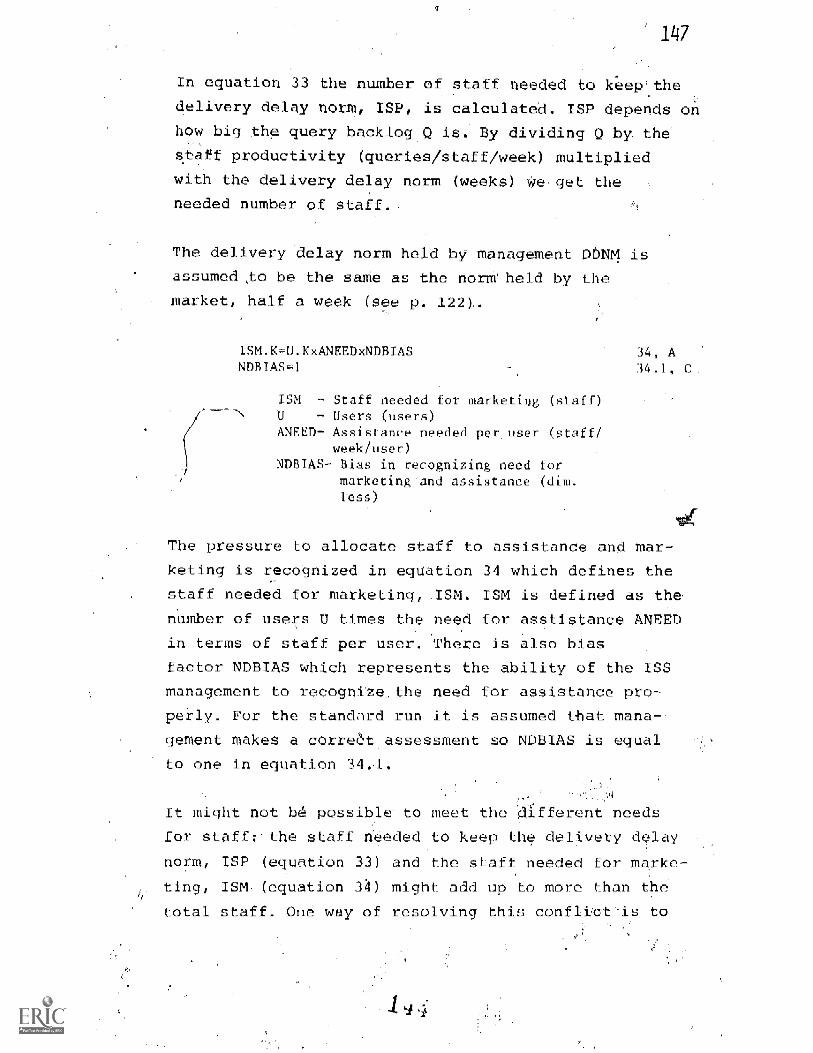
147
In equation 33 the number of staff needed to kep'the
delivery delay norm, ISP, is calculated. ISP .depends on
how big thp query backlog Q is, By dividing Q by the
Staff productivity (queries s-_aff/week) multiplied
with the delivery delay norm (weeks) ire get the
needed number of staff. ,
The delivery delay norm held by management DDNM is
assumed to be the same as the norm' held by the
market, half a week (see p. 122)..
ISM.K=U.KxANFEDxNDBIAS
ISM - Staff needed for marketing (stnU - Users (users)ANEED- Assistance needed per user (sta
week/user)NDBIAS- Bias in recognizing need for
marketing and assistance (dim.Less)
34, A34.1, C
The pressure to allocate staff to assistance and mar-
keting is recognized in equation 34 which defines the
staff needed for marketing, :ISM. ISM is defined as the
number of users U times the need for asstistance ANEED
in terms of staff per user. There is also bias
factor NDBIAS which represents the ability of the ISS
management to recognize the need for assistance pro-
perly. For the standard run it is assumed that mana
clement makes a corre6t assessment so NDBIAS is equal .
to one in equation 34.1.
It might not b_ possible to meet the Afferent needS
for staff: the staff needed to keep the delivery delay
norm, ISP (equation 33) and the staff needed for marke-
ting, ISM. (equation 34) might add up to more than the
total staff. One way of resolving this conflict-is to
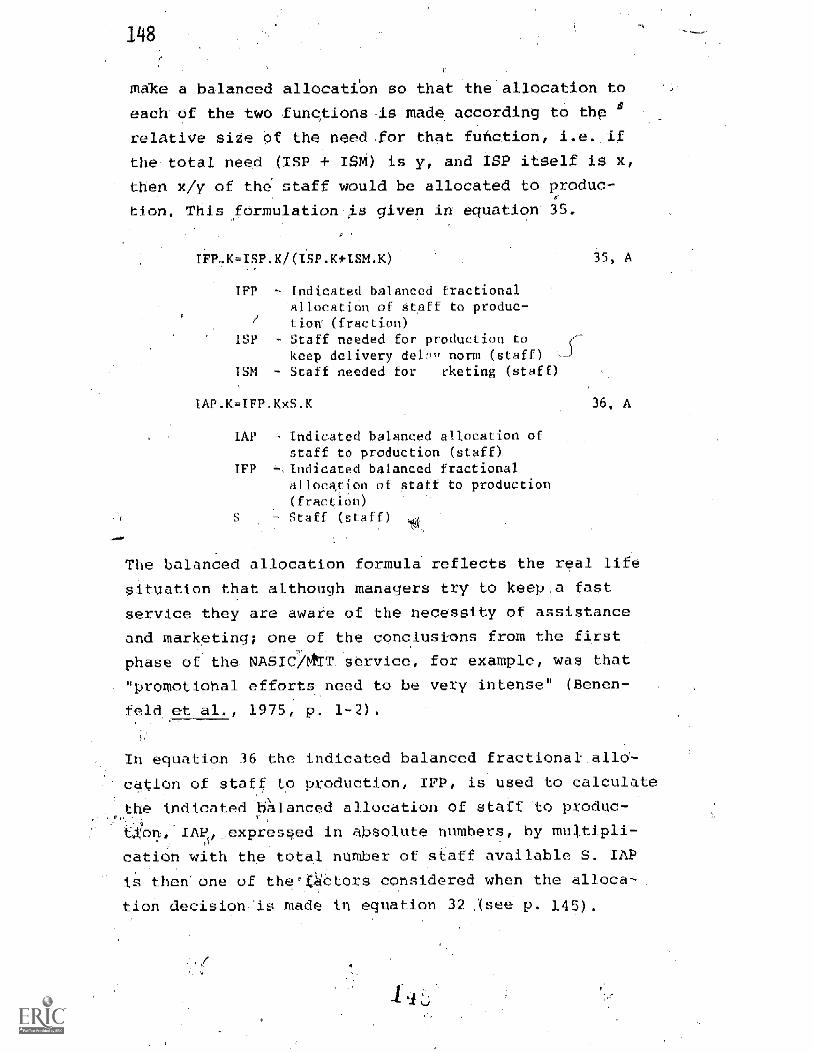
148
make a balanced allocatibn so that the allocation to
each Of the two functions-is made. according to the
relative size of the need ,for that function, i.e. if
the total need (ISP 4- IBM) is y, arid ISP itself is x,
then x/y of the staff would be allocated to produc-,
tion. This fOrmulationjs given in'.equation 35.
II SP.K+ISM.K) 35, A
IFP - Indicated balanced fractionalallocation of staff to produc-
/ Lion. (fraction)
ISP - Staff needed for production tokeep delivery delv norm (staff)
ISM - Staff needed for rketing (staff)
IAP,K=IFP.KxS.K
IAP Indicated balanced allocation ofstaff to production (staff)
IFP ,indicated balanced fractionalallocation of staff to production(fraction)
- Staff (staff)
36, A
The balanced allocation formula reflects the real life
situation that although managers try to keep.a fast
service they are aware of the necessity of assistance
and marketing; one of the conclusions froM the first
phase of the NASICMT. service, for example, was that
"promotional efforts need to be very intense" (Benen-
feld et al., 1975, p. 1-2).
In equation 36 the indicated balanced fractional= alld-
cation of staff o production, IFP, is used to calculate
the indicated balanced allocation of staff to produc-,,
on, IAplexpressed in absolute numbers, by multipli-,
cation with the total number of staff available S. TAP
is then' one of the'66tors considered when the alloca-
tion de ision 'is made in equation 32 see p. 145).

149
The staff resources not allodated to production are
available for marketing and assistance activities, as
described in equation 37. This equation simplystat's
that the allocation of staff to marketing and assistance,
ASM, is equal to the total staff S less what has been
allocated to production, ASP.
ASM.K=S.K-ASP.K 37. A
ASM - Allocation Of staff to marketingand assistance (staff)
S - Staff (staff)ASP - Allocation of staff to production
(staff)
Equations 40-47 define performance and operational
measures which can help in assessing the "results" of
different simulation runs.-They will,not be described
further, but they are listed in the next section,
The performance measure used to assess the revenue
situation of the ISS, which affects the economic
constraint'on hiring (in equation 26), is'the revenue
index REVIX'desckibed in equation 48. It is the ratio
of the average query rate AVQR, defined in equation
49, and the average number of staff, in
equation 50. The smoothing time STRA for the compo-
nents of REVIX is assumed to be equal to the .other
administrative delays, hiring time PTME in equation 11.1
and LMPT in equation 16.1, i,e. 26 weeks as specified
in equation 50.1.
REVIX.K=AVQR.K/AVS.K 48, A
REV -X- Revenue (dim. lessAVQR - Average query rate (queries /week)AVS - Average staff 'f )

10
AVQR.K =SMOOTFI(QR.JK,STRA) 49, A
AVQR - Average query rate. (queries /week).QR - Query rate (queries /week)STRA - Smoothing time for revenue
assessment (weeks)
AVS.K.SMOOTH(S.K,STRA) 50, ASTRA26 50.1,
AVS - Average staff (staff)S - Staff (staff)STRA - Smoothing time for revenue
assessment (weeks)'
This completes the description of the model equations.
To run the model initial values fOtr, S, and U and
control "cards" are needed, these are also given in
the following section.

151
I- MODEL LISTINGS
DOCUMENTO- 11 t'
Q.K-Q. D QR.LIK-AR.JK)Q -QN
Q - QUERY BACKLOG (QUERIES)QR -QUERY RATE (QUERIES /GREEK)-'AR - ANSWER RATE (QUERIES /WEEK)QN INITIAL NO OF.QUERIES
QR.KL-U.K*PQ.KQR - QUERY RATE (QUERIES/WEEK)U - USERS (USERS)PQ - PROPENSITY TO QUERY (QUERIES /WEEK /USER)
AR.KL-ASP.K*SPQR*WAAR.KAR 7 ANSWER RATE MARIE /WEEIQASP - ALLOCATION OF STAPP TO PRODUCTION (STAFF)SPQR STAFF PRODUCTIVITY (QUERIES/WEEK/STAFF)EQAAR EFFECT OF QUERY AVAILABILITY ON ANSWER .RATE
(DIM. LESS)
3, R
e
EQAAR.K-TABHL(TEQAAR,Q.K,0,0.:02,0.005) 4, ATEQAAR7-70/.1/.5/.9/1 401,SPQR=10 4.2, C
EQAAR EFFECT OF QUERY AVAILABILITY ON ANSWER RATE(DIM, LESS)
Q QUERY BACKLOG (QUERIES)"SPQR STAFF PRODUCTIVITY (QUERIES/ EEK/sTAFF)
u.K-U.,34-(DT) *(ER.," -TR.JK)u-UN
U - USERS (USERS)ER 7 ENTRY RATE (USERS/ KTR: a TERMINATION RATE (USI RUNo, - INITIAL NO of USEEc
E )
L5.1,
TR.KL-U.K rRN 6, RTRN-0.02 6.1,
TR - TERM NATrow RATE USERS/WEEK)U USE ;S (USERS)TRN - TERMINATION RATE NORMAL(FRACTION/wEEK)
ER.KL-7(U.K) OGN)(MAER.K)(EDDER.K)(EmPER 'K) 7, RUGN-0.0374 C
ER -7 ENTRY RATE,. (IiSERS/WEEK)U - USERS (USERS)[JGN USER GROWTH RATE NORMAL-(ERACTIoN/wEEK):EMAER - EFFECT OF MARKETING AND AsS-ESTAN0E ON EN- Y
RAW- '(DIM. LESS)EDDER = EEPECT oF DELIVERY DELAY ON ENTRY RATE
LESS)EmpER EFFEcT oF,mARKET RAII-0N-0N ENTRy -ATE
10 IM . LESS)

152
EMPER.K-TABLE(TEMPER,U.K/PU,0 1,0. 8, ATEMPER=1/1.05/1.1/1.05/.80/0 8.1, TPU=2000 8.2, C'
Et ER EFFECT OF MARKET PENETRATIO ON ENTRY RATE(DIM. LESS)
U - USERS (USERS)PU 7 POTENTIAL MARKET (USERS)
S.K-S.J DT)*(HR.JK-LR;JK) 9, LS=SN. 9.1, N
S - STAFF (STAFF)HR HIRING RATE (STAFF WEEK)LR LEAVE RATE (STAFF / WEEK)8N INITIAL NO, OP STAFF
LR.KL=S.K/TOJTOJ-200
LR - LEAVE `"RATE (1AFF/wEEK)S - STAFF (STAFF-) -TOJT - TIME ON JOB (WEEKS)-
'41R.KL-AH.K/PTMEPTME=26
HR 7:- HIRING RATE umN100AH APPROVED HIRES (STAfF),pTME, -HTRING.TIME (WEEKS).
DELIVERY DELAY ETC.
DIX.K=Q.K AR.JK- DELIVERY DELAY INDICATED (WEE K8)
Q QUERY BACKLOG (QUERIES)AR - ANSWER RATE (QUERIES/WEEK)
DDpU.K-S -TH(DTX.K,UPT)UPT=11
DDPU *LIVERY DELAY PER' :WED BY USERS KM.. LESS')
D1X DELIVERY DELAYINDICATED (WEEKS)UPT - USERS! PERCEPTION TIME _ (WEEKS)''
DDPP.K-SMOOTR(DDPU.K,PPT)PPT-26
[)DPP DELIVERY DELAY PERCEtVEI BY POTENT.(WEEKS)
.
DDPU DELIVERY DELAY PI RQ1?IyED '13r-USER:3 n;
10, R-10.1, c
11; R11.1; C
12,
14, A14.1, CSIRS
PENTIAL USERS' PERCEPTION TIME ilKS)
DDPF.K-S DTH DDPO.K,UPT) 1!: AFPT=40
=PINT DELIVERY DELAY PER EIVED DY FUN ER WEEKSDDPU DELJVERY DELAY PERCEIVED DY MiE S CBES)
FP'1' FONDER'S PERCE_VION TIME (WEEKS)

LDDPM.K=SM OTH(DIX.K,LMPT)EMPT=26
LDDPM - LONG TERM'DELIVERY DELAY PERCEIVED BYMANAGEMENT' (WEEKS)
DIX - DELIVERY DELAY INDICATED (WEEKS)MPT - MANAGEMENT'S LONG. TERM PERCEPTION TIME
(WEEKS1
EFFECTS OF DD
153
16, A16.1, C
PQ.KPON*EDDPQ.K 17, APQ -,PROPENSITY TO QUERY (QUERIES /WEEK /USER)PQN - NORMAL PROPENSITY TO QUERY4(QUERTES/WEEK/ '
-)USER)EDDPQ ..- EFFECT OF DELIVERY DELAY ON THE PROPENSITY-
TO QUERY:(DIM. LESS)
EDDPQ.K= TABLE (TEDDPQ,DDPU.K /DDN,Q,3,O.5) 18,TEDDPQ=1.5/1.25/1/.8/.65/.57/25 18.1,
EDDPQ EFFECT OF DELIVERY DELAY ON THE PROPENSITYTO QUERY (DIM. LESS)
DDPU DELIVERY DELAY PERCEIVED BY USERS (WEEKS)
DON DELIVERY DELAY NORM (WEEKS)
EDDER.KTABLE(TEDDER,DDPP-K/DDN,0,3,0.5) 19, ATEDDER=1.6/1.47/1/.47/.3/.3/-3 ,f. T
EDDER - EFFECT OF DELIVERY DELAY ON ENTRY RATE'(DIM. LESS)
ODPP - `DELIVERY DELAY PERCEIVED BY POTENTIAL USERS(WEEKS)
DON - DELIVERY DELAY NORM (WEEKS)
LONG7TERM DECISIONS
AU.K(DH.K*EDDSF.K)-EECHR. .KAEI - APPROVED HIRES (STAPP)DO - DESIRED HIRES (STAFF)EDD P EFPECT OP DELIVERY DELAY ON THE
PROM SUNDER (DIM. LESS)EECHR - EFFECTIVE ECONOMIC CONSTRAI_T ON ING
20, A
SUPPORT -.
(DIM. LESS)T (STAFF)
OH.K=(ALR.K*PTME)+DXS.K*S.KDO - DESIRED HIRES (STAFF)ALR - AVERAGE LEAVE RATE (STAFF/WEEK)PTME HIRING TIME (WEEKS)DXS - DESIRED EXPANSION OP. STAFF(DIM.
7 STAPF (STAFF)
ALR.K=,-SMOOTH(LR.JK,LMPT)ALR AVERAGE LEAVE RATE (STAP/WEEK)I,R - 1-.EAvi:LyATE (STAPP/WEEK)LMPT - MANAGEMENT'S LONG TERM PERCEPTION TIME
(WEEKS]i
22, A

154
DXS.K=TABLE(TDXS,LD PM.K/LDDNM, :5)
LOONM=0.5 --
TDXS=-.2/-.15/0/.2/35/.45/.5DXS DESIRED EXPANSION OF STAFF(DIM. LESS)LDDPM - LONG TERM DELIVERY DELAY PERCEIVED BY
MANAGEMENT (WEEKS). _
-LDDNM- --LONG TERM DELIVERY DELAY NORM-HELD BYMANAGEMENT (WEEKS)
23, A23.1, C23.2, T
EDDSF.Kr2TABHL(TEDDSF,DDPF.K/DDN,143,0.5) 24, ATEDDSF=1/.75/.50/.49/.35.--'- 24.1, T
EDDSF. EFFECT.OP DELIVERY DELAY ON THE SUPPORTFROM.FUNDER- '(DM. LESS) ..
DDPF -.DELIVERY DELAY PERCEIVED BY KINDER (WEEKS)DDN - DELIVERY DELAY NORM (WEEKS)
EECHR.K=ECHR.K*EEC.K 25, AEECHR - EFFECTIVE ECONOMIC CONSTRAINT. ON HIRING
(DIM. LESS)ECHR - ECONOMIC CONSTRAINT ON HIRING (DIM.. LESS)EEC - ENFORCEMENT OF ECONOMIC CONSTRAINT (DIM.
LESS)
ECHR.K=TABHL(TECHR,REVGL/REVIX.K,41.5'-0.1)TECHR=0/..08/.15/.20/.23/.45 26.1, T-REVGL=8 26.2, C
ECHR - ECONOMIC CONSTRAINT ON HIRING (DIM. LESS)REVGL = REVENUE GOAL (QUERIES/WEEK/STAFF)REVIX - REVENUE INDEX' (DIM. LESS)
EEC.K=TABHL(TEEC,DF.K/NSUF,0,1,0.25) 27,
TEEC=1/.45/.20/.07/0 27.1,EEC - ENFORCEMENT OF ECONOMIC CONSTRAINT (DIM.
LESS)DF - DISCRETIONARY FUNDS (DOLLARS)NSUF INITIAL START-UP FUND (DOLLARS)
DF.K.DF.J4-(DT)-(DIN.JK-DUT.JK)-DF=NSUF-NSUF=15000
DF - DISCRETIONARY -FUNDS -(DOLLARS)DIN - INCOME (DOLLARS/WEEK)OUT' --REDUCTION IN DISCRETIONARY FUNDS- (DOLLARS/WEEK)NSUF - INITIAL START-UP FUND (DOLLARS)
28, L28.1, N28.2, C
DIN.KL=AR.JK*RECFRECP=10
-DIN - INCOME (DOLLARS/WEEK)AR - ANSWER RATE (QUERIES/WEEK)RECF RECOVERY FACTOR (DOLLARS/QUERY)
DUT.KL=S.K*REVGL*RECFDUT - RBEIDUCTIai IN DISCRFTIONARY
(
S STAFF (STAFF)REVGL REVENUE GOAL (QUERIES/f4 S'T'AFF;
RECF - RECOVERY FACTOR (DOLLARS /QUERY)
29, R29.1,
30,
I

ALLOCATION OF STAFF
ASP.K=SMOOTH(DAP.KtACT)ACT=a 31.1, C
ASP ALLOCATION. OF STAFF TO PRODUCTION (STAFF)DAP DECIDED ALLOCATION'OF STAFF,. TO PRODUCTIOy.
(STAFF)ACT . ALLOCATION CHANGETIME (WEEKS)
,DAP'.KMIN 32,DAP DECIDES ALLOCATION-OF STAFF TO PRODUCTION
(STAFF). '
IAP INDICATED BALANCED ALLOCATION-OF STAFF:TO-PRODUCTIONASTAFf)
-ISP STAFF NEEDED FOR PRODUCTION TO KEEPDELIVERY DELAY NORMSTAFF).
I'. K =Q. K/ (SPQR *DDNM), 33, ADDNM=0.5 1, C
ISP STAFF NEEDED FOR PRODUCTION TO KEEPDELIVERY DELAY NORM (STAFF),
Q QUERY BACKLOG (QUERIES).SPQR STAFF PRODUCTIVITYAQUERiEVWEEK/STAFF)DDNM DELIVERY DELAY NORM HELD BY MANAGEMANT
(WEEKS)
ISM.K=U.K*ANEED*NDBIAS 34 ANDBIAE=1 ice` 34.1, C.
ISM --STAFF NEEDED FOR MARKETING (STAFFU USERS (USERS)ANEED ASSISTANCE NEEDED PER USER (STAFF/WEEK/
.USER)
NDBIAS.-- BIAS IN RECOGNIZING NEED FOR MARKETING ANDASSISTANCE (DIM. LESS)
IFP,K=ISP.K/(ISP.Ki-ISM.K) 35, AIFP r- INDICATED BALANCED FRACTIONAL ALLOCATION'OF-
STAFF I10. PRODUCTION (FRACTION).ISP STAFF NEEDED FOR PRODUCTION TO KEEP
DELIVERY. DELAY NORM (STAFF)ISM STAFF NEEDED FOR MARKETING (STAFF).
IAP.K=IFP.K*S.K 36,IAP INDICATED-BALANCED ALLOCATION OF STAFF TO
PRODUCTION (STAFF)-IFP INDICATED BALANCED FRACTIONAL ALLOCATION OF
STAFF TO)PRODUCTION- (FRACTION)S STAFF (`STAFF)
ASM.K=S.KASP.K 37,ASM ALLOCATION OF STAFF TO MARKETING AND
ASSISTANCE (STAFF)S STAFF (STA'FF)ASP ALLOCATION OF STAFF TO PRODUCTION S FF)
.s.
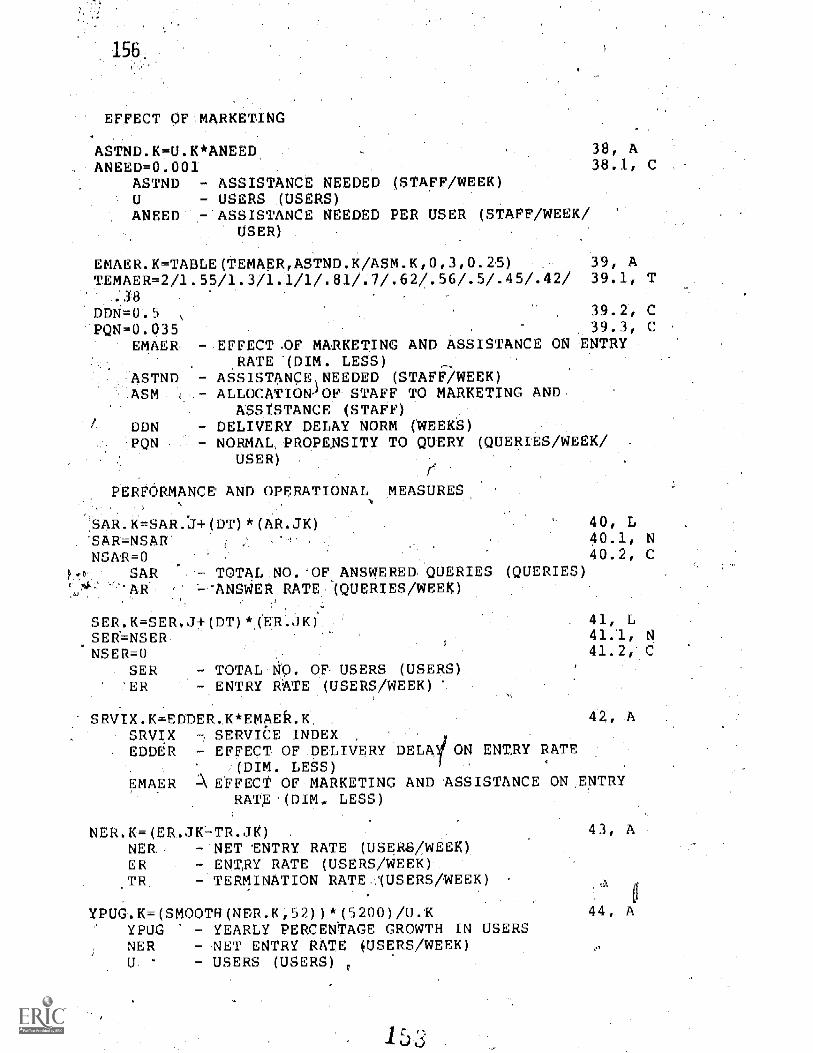
156
EFFECT 0 `,MARKETING
ASTND.K=U.K*ANEED=0.001
ASTNDUANEED
ANEED,
ASSISTANCE NEEDED (STAFF/WEEK)USERS (USERS)ASSISTANCE NEEDED PER USER (STAPE/WEEK/,
USER)
38, A38.1, C
EMAER.K=TABLE(TEMAER,ASTND.K/ASM.K,0,3,0.25) 39, ATEMAER=2/1.55/1.3/1.1/1/.81/.7/.62/.56/.5/.45/.42/ 39.1, T
DDN =0.5 39.2, C-PQN=0.035 39.3, C
EMAER EFFECT-OF MARKETING AND ASSISTANCE ON ENTRYRATE (DIM. LESS)
e.18TNP. ASSISTANCEINEEDED (STAFF /WEEK)ASM ALLOCATION-JOE-STAFF TO MARKETING AND
ASSISTANCE (STAFF)DDN DELIVERY DELAY =NORM (WEEKS)PQN NORMAL; PROPENSITY TO QUERY (QUERIES /WEEK/
USER)
PERFORMANCE' AND OPERATIONAL
SAR.K=SAR.:14-(DT)SAR=NSARNSAR=0
SARAR
EASURES
AR.JK) 40, L40.1, N40.2, C
TOTALI40.'OPANSWERED QUERIES (QUERIES)ANSWERJ1ATEAQUERIES/WEEK)
SER.K=SER. DT) (ER.JK)SER=NSERNSER=0
SER TOTAL-NO. OF USERS (USERS) .
:ER ENTRY RATE (USERS/WEEK)
SRVIXK=EDDER.**EMAEk.K.SRVIX 7 SERVICE INDEXEDDER EFFECT OF .DELIVERY DELAY ON ENTRY RATE
(DIM. LESS)EMAER -\ EFFECT OF MARKETING AND ASSISTANCE ON ENTRY
RAT,E'(DIM. LESS)
41, L41.1, N41.2, C
NER.K=(ER.JKTR.JK)NER NET ENTRY RATE (USERS/WEEK)ER ENTRY RATE (USERS/WEEK)TR TERMINATION RATE 1USERS/WEEK)
YPUG.K=(SMOOTH(NER.K,52))*(5200)/U.KYPUG YEARLY PERCENTAGE GROWTH IN USERSNER NET ENTRY RATE FUSERS/WEEK)LE USERS (USERS) r
43, A

QPUG.K=(S OOTH(NER.K,12))-(1200/U.K. QPUG QUARTERLY PERCENTAGE. IN USERS
NER -NET-ENTRY RATEAUSER/WEEK)USERS (USERS)
AGOWL.K=AGOW J-1-(DT).*(GWR.K)AGOWL=NAGOWL:NAGOWL=O
4GOWL - ACCUMULATED GOODWILLGWR GOODWILL RATE
GINR.KL RVIX.KGWR - GOODWILL RATESRVIX, - SERVICE INDEX
REVIX.K=AVQR.K/AVS.KREVIX REVENUE INDEX (DIM. LESS)AVQR - AVERAGE QUERY RATE (QUERIES /WEEK)AVS - AVERAGE STAFF (STAFF)
AVQR.K=SMOOTH(QR.JK,STRA)AVQR y AVERAGE QUERY RATE (QUERIES/WEEK)QR QUERY RATE (QUERIES/WEEK)STRA - SMOOTHING TIME FOR REVENUE ASSESSMENT
- (WEEKS)
AVSiK=SMOOTH(S:K,STRA)STRA=26
AVS. AtVERAGE STAFF (STAFF)S - STAFF (STAFF)SA SMOOTHING. TIME FOR REVENUE- ASSESSMENT_
(WEEKS)
INITIAL` CONDITIONS AND CONTROL CARDS
0=1SN=3UN =50DT=.2TIME=NTIME7'NTIME=0LENGTH=0PLTPER=8
QN - INITIAL NO OF QUERIESSN - INITIAL NO. OF STAFFUN INITIAL'NO. OF USERS
PLOT U=U Q(.200=0/S=S,ASP=%/ER=EUSERS (USERS)
.
Q - QUERY BACKLOG (QUERIES)QR - QUERY RATE (QUERIES/WEEK)S - STAFF (STAFF)'Asp - ALLOCATION OF STAFF TO PRODUCTION. (STAFF)
157
A
46, L46-.1 N46.2A C
47, R
48, 2
49, A
50, A50.1; C
50.5, 'C .
50.6, C50.7, 'C50.8, C50.9, N'
51.2,C,
51.4
5

158
PLOT EDDPQ=1,EDDER=2,EMAER=3tEMPER4 (0,2)/DXS='X("1,1)/EECHR=C,EDDSF=S(,©,1),
EDDPQ - EFFECT OF DELIVERY DELAY ON THE PROPENSITYTO QUERY (DIM4- LESS)-
DXS - DESIRED EXPANSION.OF STAFF(DIM. LESS)EECHR - EFFECTIVE ECONOMIC CONSTRAINT ON HIRING -.
(DIM. LESS)EFFECT OF DELIVERY DELAY ON THE SUPPORT
FROM FONDER (DIM. LESS)
,51.5
EDDSF
PRTPER=48
PRINTU
S
QRHRER
PRINTSARSEREECHR
YPUGQPUGAGOWL
1) U /2) Q /3 S/4)QR/5)HR/6)ER-:.USERS (USERS)QUERY BACKLOG (QUERIES)
- STAFF (STAFF)--- QUERY RATE (QUERIES/WEEK),- HIRING RATE (STAFF/WEEK)-- ENTRY RATE (USERS/WEElq
51.7, C,
51.8
1 ) SAR/2)SER/3)EECORMYPUG/5)QPUG/6)AGOWL 51.9TOTAL NO. OF,ANSWERED QUERIES (QUERIES),TOTAL NO... OF USERS (USERS)
- EFFECTIVE. ECONOMIC CONSTRAINT ON HIRING(DIM.,, LESS) -
- YEARLY PERCENTAGE GROWTH IN USERS- QUARTERLY PERCENTAGE' GROWTH IN USERS.
ACCUMULATED GOODWILL.-

Definition of Variable Names.
159
ACT Allocation change timeAGOWL Accumulated goodwillAR Approved hires (staff)ALR Average leave rate (staff/week),ANEED Assistance needed per user (staff/week/uiser)AR Answer rate (queries/week)AM Allocation of staff to marketing and assistance
(staff)ASP Allocaten.of staff to producticirtskkff)ASTND Asststance needed (staff/week)VQR -Average que'hr rate (queries/week)
AVS Average staff (staff)
Decided allocation of staff production(staff)Delivery delay norm (weeks)Delivery delay norm held by managemant (weeks)Delivery delay perceived by funder (weeks)Delivery delay perceived by potential users(weeks)
week)
DAP.
DbNDDNMDDPF.DDPP
,
DDPU Delivery delay perceived by users (weeks)DF Discretionary.funds (dollars)DH Desired hires (staff)-DIN Income-(dollars/week)DIX Delivery delayvindieated (weeks)DUT. Reduction in discretionary funds (dollars/week)DXS Desired expansion of staff (dim. less)ECHR Economic-constraint on hiring (dim. less)EDDER Effect of delivery delay on entry rate (dim.
less)EDDPQ Effect of delivery delay ,on the propensity to
query (dim. less)EDDSF Effect 'of delivery delay on the support from
funder (dim. less)EEC Enforcement of economic constraint (dim. less)EECHR Effective economic constraint on hiring (dim.
less)EMAER 'Effect of marketing and assistance on entry
jrate (dim. less)EMPER Effect:of market penetration on entry rate
(dim. less)EQAAR' Effect of query availability on answer rate
,(dim. less)ER Entry *ate (users/week)
FPT Funder s perception time (weeks)

160
-
GWR 'Goodwill ra
IAP
IFP
Hiring rateistaff/week)
Indicatedbalanoed allocation of staff toprodpctionataff) "HIndiOatep balaniped' fractional allodationstaff -to (fraction) .
ISM. Staffn*dectlor.marketing .(staff) ::r
ISP StaWn4eded, for :prodi4ctiOn: to keep deliverydelay: norm- (staff) :-
LDDNM LongYterm"delivery delay porrvheId.:by.maria.,gement '(weeks). . .-H
LpDPM Long term deli-Very delay perceived,bymAnagement (weeks) .,-':
LMPT Management's- long tern perception time (weeks);LR Leave rate (staff /week)NDBIAS Bias_in.recognizing-,4Ieed for marketing and
asSistance.(diM. lesS)NER N,0t!entry.rate(users/week)NSUF Initial start,-up'.fund (dollars)
PPT Potential 'users' perception -me .(weeks)`PQ Propensity to 'query,(querieS/week/OSers).PQN Normal propensity, to (queries/week/
gsers)..PTME Hiring time (weeks) r-
PU-.,
Potential market (users)-,:.
QNQPUGOR
Query backlog (queries)Initial nos of querie,Quarterly percentage growth in usersQuery rate (queries/week)
RECF Recovery factor (dollars/querREVCL Revenue goal (queries/week/sta_f)REVIX Revenue index (dith. less)
S Staff (staff)SAR Total no of answered cfueries (querieS)SER Total no. of users (users)SN initial no of staffSPQR Staff productivity (queries /week /staff)SRVIX Service indexSTRA Smoothing time for revenue assessment '(weeks)
TOJ Time on job (weeks)TR Termination rate (users /week)TRN 'Termination rate normal (fraction/week)
UUN
Users (users)User growth rate normal (frac iOn/week)
Initial no. of.4sersUsers' perception time ( eeks)Yearly percentage growth in users

162.
Model
NAME, NO T DEFINITION:WHERE USED
4 i .4s
ACT 1 1 C ALLuv,
ATILJN CHANGE TIME' (WEEKS)ASP, A, 1
AGOWL 46 L ACCUMULATED. GOODWILL'46.1 N
PRINT,51.9AH 20 A APPROVED HIRES (STAFF)
HR,R111AIR 22 A AVERAGE LEAVE RATE (STAFF/WEEK
DH,A,21ANEED 38.1 C, ASSISTANCE NEEDED
USER)ISM,A,34/ TND,A,38
AR 3 R ANSWER RATE (QUERIES/WEEK)Q,L,1/DIX,A,12/DIN;R,29/SAR,L,40
ASM 37 A' ALLOCATION OF STAFF TO MARKETING ANDASSISTANCE (STAFF)
ER (STAFF /WEEK/
EMAER,A,39ASP 31 A ALLOCION OF STAFF TO PRODUCTION (STAFF)
AR,R,3/ASM,A,37/PLOT;51.4ASTND 38 A ASSISTANCE NEEDED (STAFF/WEEK)
EMAER,A,39AVQR 49 A AVERAGE QUERY RATE.H(QUERIES/WEEK)
REVIX,A,48AVS 50 A AVERAGE STAFF
REVIX,A,48DO- 32 A DECIDEd ALLOCATION'OF STAFF TO P ODUCTION
(STAF0):ASP,A,3
DON 3
EDDPQ,A,_DDNM 33.1
ISP,A,33DDPF 15-
EDDSF,A,24.PP' 1 14
DELIVERY DELAY :NORMDER,A,19/EDDSF,A,24
C DELIVERY DELAY NORM(WEEKS)
(WEEKS)
HELD BY
DELIVERY DELAY PERCEIVED BY
MANAGEMANT
FONDER (WEEKS)
DELIVERY.DELAY PERCEIVED BY POTENTIAL USERS(WEEKS
EDDER,A,19DDPU 13 A DELIVERY DELAY PERCEIVED BY USERS (WEEKS)
DDPF,A,14/DDPF,A,15/EDDPQ,A,18DF 28 L DISCRETIONARY FUNDS (DOLLARS)
28.1 NEEC,A,27
DH 21 A DESIRED HIRES (STAFF)AH,A,20

fi
DIN 29 R INCOME (Doudiks/wgEK)DF,L -,28
DIX 12. A DELIVERY DELAY INDICATED (WEEKS),DDPU,A11'.3/LDDAM,A,16,
50..8 C
Q,L11/U,L,5/S,L,9/DF;L,28/SAR,L,40/SER,L,41/AGOWLbUT 36 IC- itEDJCI'ION IN.DISCRETIONARt FUNDS (Douidis:Ammo'DF,L,2
DXS 23 A DESIRED EXPANSION. OF STAFF (DIN LESS)DH,A,21/PLOT,51.5
ECHR 26 A ECONOMIC CONSTRAINT ON HIRING (DIM. LESS)EECHR,A,25
EDDE.R 19 EFFECT OF DELIVERY DELAY ON ENTRY RATE(DIM. LESS)
ER,R,7 /SRVIXS,42EDDPQ ,18 A EFFECT OF DELIVERY DELAY ON THE PROPENSITY
TO QUERY (DIM. LESS),PQ,A,17/PLOT,51.5
EDDSF 24 A EFFECT OF DELIVERY DELAY ON THE SUPPORTFROM FUNDER (DIM. LESS)
AH A 20/PLOT,51.5ETC 27 A, ENFORCEMENT OF ECONOMIC CONSTRAINT (DIM.
LESS)EECHR,A,25
EECHA 25 A EFFECTIVE ECONOMIC CONSTRAINT ON HIR NG(DIM. LESS)
0/PLOT,51.5/PRINT,51.939 A EFFECT OF MARKETING Aki',-"ASSISTANCE
RATE (DIM. LESS)7/SRVIX,A,42
8 A EFFECT OF MARKFT P(DIM. LESS)
AH,AEMAER
ER1 REMPER
ER,R,7EQAAR 4 A EFFECT OF QUERY AVAILABILITY ON ANSWER RATE
(DIM; LESS)
ER 7 R ENTRY RATE (USERS/WEEK)U,L,5/SER,L,41/NER,A,43/PRINT,51.8
FPT 15.1 -C FONDER'S PERCEPTION TIME (WEEKS)DDPF,A,15
GWR 47 R GOODWILL RATEAGOWL,L,46
HR 11 R HIRING RATE (STAFF/WEEK)S,L,9 /PRINT -,51.8
IAP 36 A INDICATED BALANCED ALLOCATION OF STAFF TOPRODUCTION (STAFF)
ON ENTRY
NETRATION ON -ENTRY- RATE
I
DAP,A,32IFP 35
IAP,A,36ISM 34+ A. STAFF NEEDED. FOR MARKETING (STAFF)
'IFP,A 35
INDICATED BALANCED FRA TIQNAL ALLOCATION-..?FSTAFF TO PRODUCTION'(FRACTION).

164
JSP '33 'A STAFF NEEDED FOR PRODUCTION TO KEEPDELIVERY' DELAY NORM (STAFF)
DAP,A,32/IFP A,35LDDNM 23.1 C LONG TERM-DELIVERY DELAY NORM HELD BY
_MNAGEMENT (WEEKS),
LONG TERM DELIVERY DELAY-PERCEIVED bYMANAGEMENT (WEEKS)
DXS,A,23LDDPM., 16
DXS,A,23LENGTH 51.2 CLMPT - 16.1 C' MANAGEMENT'S LONG TF.RM'PERCEPTION TI
, (WEEKS)LDDPM,A,16/ALR.A.22
LR 10 R LEAVE RATEg,L,9/ALR,A,22
NAGOWL. . 46.2. CAGOWL,N,46.-1
NDBIAS C
ISM, 34NER. 43 A
YPUG,A,44/QPIJGNSAR 40.2 C
SAR,N,40.1LASER. 41.2 C
SER,N,41.1NSUF- 28.2 C
EEC,A,27/DF,NNTIME '51.1 C
TIME,N,50.9PLTPER 51.3-CPPT 14.1 C
ODPP,A,14PQ 17
)6QR,R,2PQN 39.3 C
BIAS IN RECO NI/ING NEED _
SSISTANCE (DIM. LESS)'.
T ENTRY RATE (USERS /WEEK)45
INITIAL .START -UP FUND (DOLLARS)28.1
POTENTIAL. USERS' PERCEPTION TIME (WEEKS)/
A PROPENSITY-TO QUERY- (QUERIES/WEEK/USER)/-
'NORMAL PROPENSITY TO QUERY (QUERIES/WEEK/USER) :
PQ,A,17PRTPER 51.7 CPTME 11.1 C "HIRING TIME (WEEKS)
HR,R,11/DH A,21PU 8.2 C POTENTIAL. MARKET (USERS)
EMPER,A,8Q 1 L QUERY BACKLOG (QUERIES)
1,1 NEQAAR,A,4/DIX,A,12/ISP,A,33/PLOT,51.4/PRINT,51 8
QN 50.5 C INITIAL NO OF QUERIESQ,N,1.1
QPUG 45PRINT,51.9
QUARTERLY PERCENTAGE GROWTH IN USERS
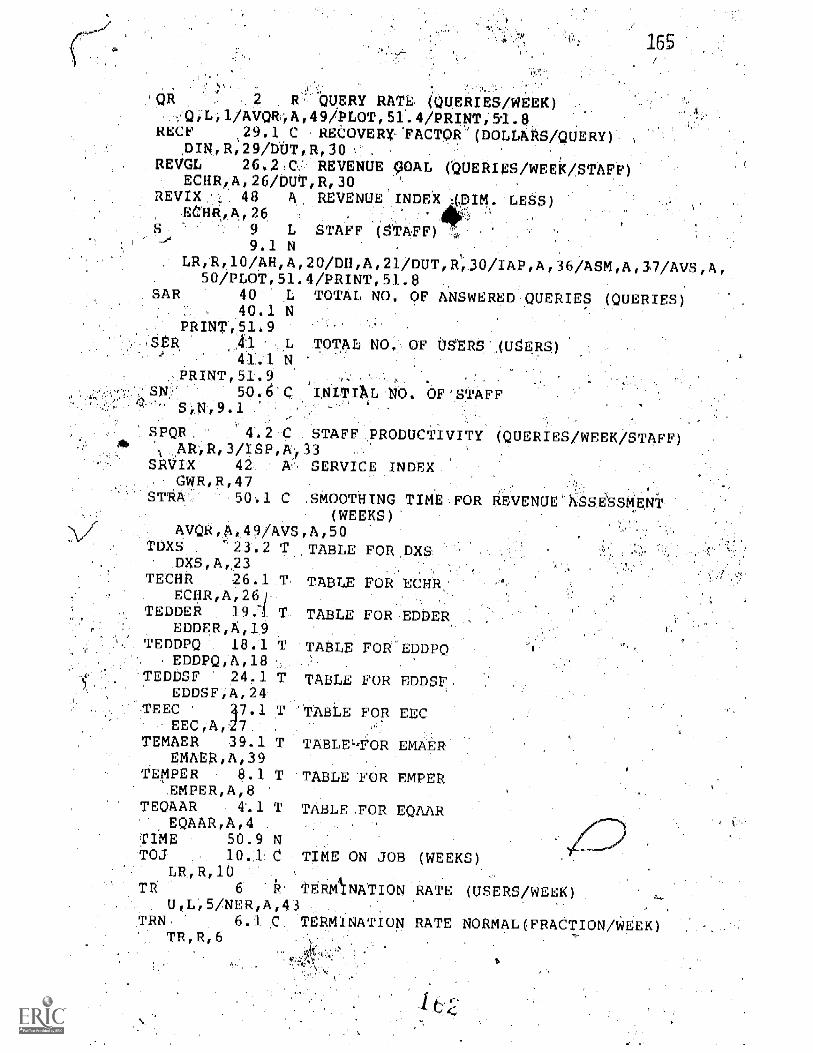
QR 2 R QUERY RATE (QUERIES/WEEK)Q,L,l/AVQR,A,49/PLOT,51.4/PRINT,91.8
RECF 29.1 C RECOVERY FACTOR (DOLLARS/QUERY)DIN,R,29/DUT,R,30
REVGL 26.2 C REVENUE GOAL (QUERIES/WEEK/STAFF)ECHR,A,26/DUT,R,30
REVIX _ 48 A REVENUE INDEX IM LESS)ECHR,A,26
9 L STAFF (STAFF)9.1 N
LR,R,10/AH,A,20/DH,A,21/DUT,R,30/IAP,A,36/ASM,A,37/AVS50/PLOT,51.4/PRINT,51.8
SAR 40 L TOTAL NO. OF ANSWERED QUERIES (QUERIES)40.1 N
PRINT,51.9S ER 41 L TOTAL NO, OF OSERS (USERS)
41,1 NPRINT,51.9
50.8S,N19 1
SPQR. 4.2 C STAFF PRODUCTIVITY (QUERIES EEK/ TAFF)'\ AR R, /ISP,A 33SRVIX 42 A SERVICE INDEX
GWR,R,47STRA' 50.1 C SMOOTHING TIME FOR
(WEEKS)AVQR,A,49/AVS,A,50
TDXS "23.2 T TABLE FOR DXSDXS, A,,.23
TECHR 26.1 T TABLE FOR ECHR:ECHR,A,26/
TED_ DER 19:1 T TABLE FOR EDDER,EDDER,A,19
TEDDPQ 18.1 T TABLE FOR EDDPOEDDPQ,A,18
TEDDSF 24.1 T TABLE FOR EDDSFEDDSF A,24
TEEC 7.1 .T TABLE FOR EECEEC,A, 7
TEMAER 39.1 T TABLE -FOR EMAEREMAER,A,39
TEMPER 8.1 T TABLE FOR EMBEREMPER,A,8
TEQAAR 4.1 T TABLE FOR EQAAREQAAR,A,4
TIME 50.9 NTOJ 10.1 C TIME ON JOB (WEEKS)
LR,R 10TR 6 R TERM4INATION RATE (USERS WEEK)
U L /NER,A,4TRN 6.1 C
TR,R,6
REVENUE'ASSESSMENT
TERMINATION RATE NORMAL(FRACTION/WEEK)

166
5 L USERS (USERS)-5.1 N
, R, 2/ TR, R,' 6/ ER, R ,7 /EMPER,A,$ /ISM,A,34 /ASTND,Af.,44/QPUG,A,45/PL0T,51.4/PRINT,51.8
UGN 7.1 6 USER GROWTH RATE NORMALER,R,7
N 50 7 C INITIAL NO, OF USERSU N, 5.1
.UPT " 13.1 C USERS' .PERCEPTION TIME (WEEKS)IMPU,A,13-
YPUG 44 A YEARLY 'PERCENTAGE GROWTH'IN USERSPRINT 51.9
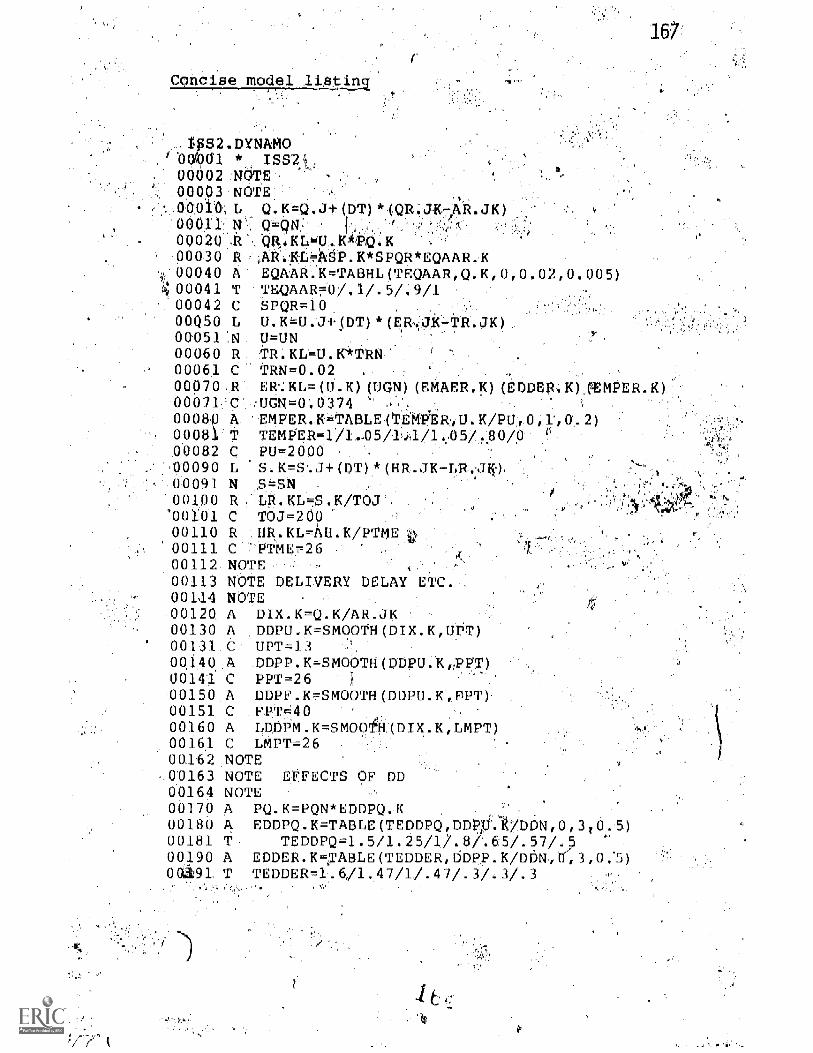
0one1 s e
S2.DYNAMOO di * ISS200 02 NOTE00003 NOTE00010, L Q.K=Q *(QR.JK-AR.J.K)00011 N Q=ON00020 R .K00030 R AR.XLVASP.K*SPQR*EQAAR.K
;,00040 A EQAAR.K=TASHL(TEOAAR,Q.K,0,0.02,0.005)4 00041 T TEQAAR=0/.1/.5/.9/100042 C SPQR=1000Q50 L U.K=U...14(DT)*(ER
.
.3K-TR.JK)00051 N U=UN00060 R TR.KL=U.K*TRN00061 C TRN=0.0200070,R ER.KL(U.K) (UONHEMAER.K)(EDDER.K) MMPER.K)00071 C UGN=0.03740008p A EMPER.KTABLE(TERPIR,U.K/PU,0,1,0-2)00081 T TEMPER=1/1-05/1.4/145/.,80/0 c
00082 C PU=200000090 L 'S.K=S...7+(DT)*(HR.JK-LR.JK)00091 N S=SN00100 R LR.KL=S.K/TOJ'00101 C TOJ=20000110 R HR.KL-AU.K/PT00111 C PTME=2600112 NOTE0011 NOTE DELIVERY DELAY ETC,00114 NOTE00120 A DIX.K=Q.K/AR.JK00130 A DDPU.K=SMOOTH(DIX.K,UPT)00131 C UPT=1300140 A DDIDP.K=SMOOMODPU.K,PPT00141 C PPT=2600150 A DDPF.K=SMOOTH(DDPU.K,SPT)00151 C FPT40 A.00160 A 4DDPM.K=SMOOTH(DIK.K,LMPT)00161 C LMPT2600162 NOTE00163 NOTE EFFECTS OF DD00164 NOTE00170 A PQ.KPQN*EDDPQ.K00180 A EDDPQ.KTABLE(TEDDPQ,DDP,0:K/DDN,0,3,0.5)00181 T TEDDPQ=1.5/1.25/1/.8/.65/.57/.500190 A EDDER.KTABLE(TEDDER,DDPP.K/DEN,dc3,0:5)01191 T TEDDER=1.6,/1.47/1/.47/.3/.3/.3

168
00192 NOTE00193 NOTE LONG TERM DECISIONS00194 NOTE00200 A AHIK=(DH.K*EDDSF.K)-EECHR.K*S.K00210 A DH.K=(ALR.K*PTME)+DXS.X*S.K00220 A ALR,K=SMOOTH(LR.JK,LMPT)00230 A DXS.K=TABLE(TDXS,I,DDPM.K/LDDNM,0,3,0.5)00231 C LDDNM=0.500232 T TDXS=-.2/-.15/0/.2/.35/.45/.500240 A EDDEF.K=TABHL(TEDDSF,DDPF.K/DDN 0.5)
00241 T TEDDSF=1/.75/.50/.40/.3500250 A EECHR.K=ECHR.K*EEC.K00260 A ECBR.K=TABHL(TECHR4REVGL/REVIX. 1.5,0.1)0(261 T TECHR=0/.08/.15/.20/.23/.2500262 C REVGL=800270 A ....K=TABHL(TEEC,DE.K/NSUF,0,1,0.25)00271 T TEEC=1/.45/.20/.07/000280 L DF.K=DF.J4-(DT)*(DIN.JK-DUT.3K)00281 N DF=NSUF00282 C NSUF=1560000290 R DIN.KL=AR.JK*RECF00291 C RECF=1000300 R DUT.KL=S.K*REVGL*RECF0030'1 NOTE00302 NOTE ALLOCATION OF STAFF00303 NOTE00310 A ASP.K=SMOOTH(DAP.K,ACT)00311 C ACT200320 A DAP.K=MIN(IAP-K ISP,K)00330 A ISP.K=Q.K/(SPQR DDNM)
331 C DONM=0.5340 A ISM.K-U.K*ANEED NDBIAS341 C NDBIAS=1350 A IFP.K=ISP.K/(ISP AISM.K)
00360 A IAP.K=IFF.K*S.K00370 A ASM.K=S.K-ASP.K00371 NOTE00372 NOTE EFFECT OF00373 NOTE0038'0 A ASTND.K=U.K ANEED00381 C ANEED=0.00100390 A EMAER.K=TABLE(TEMAER,ASTND.K/ASM.K,0,3,0.25)00391 T TEMAER=2/1.55/1.3/1.1/1/.81/.7/.62/.56/.5/.45/.42/.380392 C 'DDN-0.50013 C: PQN=0.035
MARKETING

169
00394 N00395 RFORMANCE AND OPERATIONAL MEASURES00396 NOTE
.00 L SAR.K=SAR.J+(DT)*(AR.JK)01 N SAR=NSAR
.402 C N$AR=900410 LTSER,K=SER. (DT)*(ER.JK)00411 N' SER=NSER00412 C NSER=0 :
00420 A SRVI.K=EDDER.K*EMAER.K00430 A NER.K=(ER.4KTR.JK)00440'A YPOG.K=(SMOOTH(NER.K152 ) ).*(5200) U.K00459, A OUG.X=($MOOTH(NER.Xf12 ).) -(1200) U.K00460 .L AGONLK=AGOWL.J-17(LT)*(G R.JK)00461:N AGOWL=NAGOWL00462C NAGOWL =O00470.R GWR.KL=SRVIX.K,00.40 A REVIX.K=AVO.K/AVS.K09490 A AVQR.K=SMOOTH(OR.JK,STRA)00500 A AVS.K=SMOOTH(SK,STRA)00501 C STRA=2600502 NPTE00503 NOTE INITIAL CONDTIONS. AND CONTROL CARDS00504 NOTE00505 C0050§C SN=300507'C UN=50=00508 C DT=.200509 N TIME =NTII00511 C .NTIME=000512 LENGTH =O00513 s OLTPER=800514 PLOT U=U/Q=Q_ =0/S=S,ASP=%/ER=E0.0515 PLOT EDDPQ=1 DbER=2,EMAER=3,EMPER=.4(0,2 )/'00516 X DXS= (-1,1)/EECHR=C,EDDSF=S(0,1)00517 C PRTP R=4800518 PRINT 1 U/2)0/3)S/4)(2R/50R/6M0,0519 PRINT 1 SAR/2)SER/3)EECH0/4)1PLIG/5)QPNG/6 AGOWL00521 RUN

170
-70EL TESTING
gLicialallTIILL2Lgjjqy
There is no established norm for judging model validity;
mod 1 Validity is a realtive matter and 'depends on the
1,purpose. One of the 'Purposes of the present study
explain e-behavio of ISS-s; tte model will
sable to "rep duce" system beha-
the comparison of simulation results and aCtu-
avi r it is, common to apply statistical methods.-etimes, hOwever, this is not possible or desirable.
orrester discusses nanguaptitative model validation
1961 -pp. 128-129):
"A model will: be cast in numerical form in order that our
statements, will be specific and unambigous. Such state-ments, however, often arise fram beliefs about relativemagnitudes, limiting conditions,. and probable consequences.The numbers thatappear in.such a model often do not de7rive in any analytical or statistical way from a- ific
numerical data fram the operating system.
anttative validation of &model should be done whenpdssible and when the anticipated results are expected tojustify the cost and effort. However, if most of the con-tent r F a model` is drawn from nonnumerical sources in the
form individual personal knowledge and Verbal andwritten descriptions, the defense of the model will usuallyrest on the same kinds of knowledge
5
In assessing the real' of the simulation results in
Chaper two we used the approach discussed by Forrest--.
ef.
sensitivity.T2!
The conisequeces of changes in parameter values must
be tested to get an indication of the sensitivity of
model to such changes..To an extent this form of sett
-e

171
.tivity analysis is done continously asthe model is:de-
veloPed, and the result of these tests is that-import-,
ant parameters are identified, the values of which will
have to be verified by empirical evidence before the'
model development can proceed. Some'paramet ill .
affect the simulation results little, a hese.
parameters it is not necessary to spend' ces on
obtaining rical'evidenee.'A
For the model ISS2, for-example,the usdr rowt rat
normal UGN determines. the speed of the overall= growt
development. It was therefore hedessary:to.fin
empirically -based estimate for, :(4Was-.discUssed on p;7
116. Examples of parameters that do -riot affect the
lation results in any significant way are-the users--
rception time UPI' and the potent=ial USersperceptidn
PPT. No further attemptwas made to find estimatesa. .
of these parameters.
simu-
is not possible to test all combinations of paramet-
which is a limitation of the sensitivity tests:
"Thus the modeler may miss a combination of parameterswhich will have a dramatieeffecXygn'conclusions. Thisdanger is one disadvantage' Of sinulattonmcdels comparedto analyticmpdels. BecautOof this limitation, the model-er must select those paramet'ers for testing which hisunderstanding of the system suggests are important, ratherthan try to test numerous changes in the hopes of findingone which will produce an r-tant effect." (Shaffer,1976, p. 300)
simplified description of ISS2 can illustrate what
'parameters are important: the basic activity r=epresents
edin I552 is the processing of queries, and the way
the ISS manages this: processing has direct effects on
the rest of the ISS/user/funder systeM. The parameters>-
that have a direct impact on the physical flow of quer-

172
ies largely determine the behavior of I5S2. These para-
meters are given in FigUre 15-(the definItions of
are, given on p. 159 ff-).
In addition to pointing,but -needed empiridal evidence:
the sensitivity analysis.can identify important deci-
sion variables. These variables a!e often. riOt amenable.-
to ,empirical validation since they represent -policy op-
tions. BoweVer, by simulating changes In these Vari-
ables it is possible to get a ba=sis for policy 'analysis
for the system.
The focus in the present study is on manager:h31. 1-
sion making and therefore we have assumed a .C:0 .n be-,
navior on the part of the funder. We have conseg entIy,
not regarded the parameters that det rmine staff, Sykra.'
possible decision variables, although'they have a si hi-'
ficant impact on tie simulaition results. The number of
users, U, is the primary determinant of the query rate
possible deci-
of these para-
acid the parameters that influence` I7 --Ale
sion variables. The results of the to
meters are given in the discussion in Chapter two,(p.
84 ff.) where also the implications for managerial de-
cision making are given,
Model Runs Discussed in ha -ter Two
The figures in Chapter two were produced by Cunning the
model ISS2 with parameter values according to the fol-
lowing:
Figures 11-a and 11-b .length-2_0,
Figure 12 length-240, ndbias=2
Figure 13 length= 4O -; tedder-1.5/1.3/1/.8/.6/.4/.3

ND MS -"PO
EMAER
EMPERELVER
1GN
SPQR4 --EECHR
EDDsFDXS
Figure 15The flow of queries in ISS2.
173
ThdAalscupsion of managerial decision making in Chapter
two is basedJpn the.results of the following simulations
with the finaliversion of the model (the length of all
runs is 240)
SN =l and NS 5000
SN=2 and NS 10000
SN=2.5 and NSUF=12500
SN-4 and NSUF=20000
SN=10 and NSUF510000
NDBIPS=2
NDBIAS=0.5
NEBIAS=1.2
.N100811AS=0.8
,'I l /1/1/1/1 TE iR 0 0/0/0/0
ACT=2

000L0d
000Elld
OOSTf1d
0ozi=pci
oLL7nd
oognd
ZWO=N0d
z8 "/vEr%138'/176'/T/9 TA-z=bdcam
sr/sr/s6' /s9VT/P-i/sT7± Ca'
Z8' /P8' /987/6' /T/rT/ST-7=04a43.l
S*AVSS'AVTAS'T/GCTPalaal,
SC/08./58r/W/T/T.T/SVT3dalaLL
EVVV9'/W/T/CT/S-1=1120GaLL
Vq7'/LVT/SVT/9"IllaUGaL

CHAPTER FOUR
AN EXPLANATION OF THE COMING STAGNATIONOF INFORMATION SEARCH SERVICES
`originally published i
pp. 109-116. Reprinted by permission.On-line Review, v.
175
1977);

177
An explanation of thecoming 'stagnationofinformation search service-sMats `G. Lindquist
Keywords: InformaSystem dynamics
Abstract: Analyses of the on-line search market have been subject to severalserious misconceptions concerning the service retailed,. i.e. the information ..search services (ISS). One of the consequences of this is that the ISS growth.potential has been overestimated, The paper points out that even if there is anoxerall growth in on-line searching, the individual ISSs will typically show astagnation after just over two years. Since the average operative age of an ISSis about two years, it is possible that even the aggregate growth in the next fewyears will tie less than the present. This decline in growth rate is not inevitablebut likely.
an search services. Systems analysis, Simulation studies,,
1 Int oductionInt [illation related activities are becom-
ing i creasingly important in our society,whic seems to be becoming fundamentallyinform = on based!. In particular, the pro-duction, istribution and consumption ofscientific a eAnological information haveexperienced an accelerated rate of growth;
Paper OLR8. The author is with the Alfred P.Sloan School of Management, MassachusettsInstitute of Technology,- Cambridge, Mass.02139,' USA.Received February 1977.
Research sponsored by grant 75-2030 S fromthe Swedish Council for Scientific Informa-tion and Documentation (SINFDOK),Stockholm.
and there Au indication that the growthwill slow t1,6 the near future2.
The overa_ annug growth ,rate in theinformation Services market, i.e. the pro-vision of search capabilities and data bases,has been estimated -at 30%3 with a projec.tion of even higtien.growth in the future. On-line searching lone has grown dramatically;the volume of Searches performed on theLockheed system in'1973 was 20 times the1970 figure, and in 1975 there were 150times as many searches as in 19704. Thestructure of the market- for informationsearch services, in terms of suppliers anddistributors, a1so seems to have been stabil:ized around 1973-74 {
Together. these developments could hethe basis for expectations of growth forinformation search services, i.e. the informa-tion retailers whose customers are the end

178
our society seems to have changedinto a fundamentally information-based one.'
users of the information. They are in amarket where the only trend is growth.There is, however, something else that hasto be taken into account, namely the lack ofestablished knowledge of the ISS users andthe market, a problem that was identifiedand emphasized in a 1974 study of researchneeds related to technical and scientificinfommition6.
2 Misconceptions regarding operational ISSThe insufficient knowledge about ISSs
and their markets has led to some seriousmisconceptions which in some ways havehindered both proper learning and growth ofoperative ISSs. The most important miscon-ceptions are discussed in the followingSections.
2.1 Age of !SSThe length of time a typical ISS has been
operational is often overestimated. It is truethat moat search systems have been availablesine 1069-70, and a few even longer'', butthiOmust not be confused with the availa-bilify of the retailing search service. Of allthe Ins participating in the SDC impactstudyl, about 44% had had access to the on-line systems for one year Or less, and another44% between one and three years. Con-sidering, in addition, that the first year'soperation is often less effective owing to
substantial organizational adjustment efforts,we 'must concludeothat ISS operation is stillin its infancy. 1,
2.2 Staff productivityThe number of searches a .person can
perform!. is often overestimated, which isparticularly serious if the sponsor of the ISS-bases his staffing decision on this estimate:The reason for the. overestimation could bethat there is a bias in the answers fromsearchers regarding search time per query,since a sh _rt search time would make com-puterized iterature 'searches look more cost-effective. Survey' answers might then bemore ideal than real, meaning that the in-dicated search time does not include a
reasonable overhea'd time. In an operationalenvironment, overhead time is significantand includes administration, system break-downs, scheduling delays, and other dis-turbances. The direct search time seems tovary greatly depending on the philosophy, ofthe ISS: some services spend relatitly littlestaff time per search, whereas others spend agreat deal. One hour seems to be a typicalsearch time which is indicated .by the SDCstudy9; but the very short time at theterminiWean value, 19.1 minutes; medianvalue 15,3 miutes) reveals that the searchrequestsrmust be of a relatively simple kind.The corresponding time for the NASIC
. we must conclude that lSS operationis still in. its infancy.'

'The reliance on institutional funds or grantslimits'the population of potential users moreseverely than is commonly acknoWledged.'
service at MIT is almost double (mean Value37 minutes)°, and another ISS operating ina ufilversity a ;esearch:environnient, theRoyal Institute of Technology IDC, gives anaverage search time of,.9 hours". The con-clusion from this disefission is that for anISS operating in, 4 researeh environment anddealing with relstivtlY, (complex search _re-quests, the number af searches per staff perweek must be less than 20, and that a feasiblelong-run average is about 10,
2.3 Applicability of-pkicing policiesConsiderable effort has been spent on
discussions of ISS pricing policies. It is clearthat price has some effect on the number ofincoming search requests, but ISSs do notoperate in a normal market economy. UntilThe cost for searching has come down to10% or maybe 20% of today's cost, wecannot expect the end user to pay for theservice outi,of his own pocket. The relianceon instithtional toads or grants limits the

172U
re in a position where we do not have ash experience as we think;'
population of potential users more severelythan is commonly acknowledged.
2.4 Basis for system- analysisThe applications of various system
analysis techniques to aspects of ISS opera-tion have been legion, but in geaeral toolittle emphasis has been put, on factSrs out-side the ISS itself. In most ISS models, theepresentation of the users and their influence
too simplified. The most serious omission,however, is that of the influence_ of thesponsoring unit's actions17. An ISS modelfor managerial decision making must take.into account the effects of-both the user.
and the sponsor's actions:. .,
Frankly, we are in a position wheie -we donot have as much experience as we think, weare less efficient than we like to think, ourmarket is smaller than we think, and we donot take into account all the necessaryfactors when we analyze-our problems.
3. Analysis of ISS growthTo get an idea of the future growth of
individual ISSs,- it is not sufficient to extra-polate trends, but it is necessary to make a
1
more thorough study the factors determ-ng growth. It is .necessary to avoidmisconceptions a missions'of importantinfluences. Finally, it must be realized that-what will happen: an individual ISS is notnecessarily p,'-scaletrdown equivalent of whatwill happen in the information searchindustry as a whole;4he service suppliers andthe search rvices do different kinds ofbusiness.
By looki g at tie question fromthe yiewp S, ca
constructrelevant hsidering the facan also make -more. a orate p
simulation, model ISsuch an adequate basis forwhere ISSs are heading_ .
system dynamics typei4 amajor feedback loops that affe
More'd, by 'don-
eviously,'wedictions.
2 " providesiscussion ofmodel is of
all thehe growth,
in term of number of users,o-f typical ISSin an ademic environment. The results ofthe system analysis and simulation runs withthe model' how that the hypothesized refer-ence behavior (see Fig. 1) is indeed fullyexplainable with the variables chosen and isa consequence of the structure of thesystem, which includes both the users andthe sponsor.
A predictiba of stagnation- for operativeunits in a market characterized by aggregategrowth requires an explanatibn. The basic
stagnation.is not a mystery buta consequence of the activity in the system.'

'The decline in lSS growth rate is likely, but wemight ask whether or notit is inevitable.
Numberof users
Projection 1
,Projectio 2
mechanism can described by three causalloops (Fig. 2),
,Loop I is typical f business andservice activities; 35 sines volume goes up,expansion is needed and more resourcesacquired , which can make it possible tohandle more.. business:Loop 2 is the con-gestion loop. As business volume goes tip,the fact that queues. develop makes theservice less attractive and discouragesbusiness, ISSs easily becoMe congested, andat least part of the reason for this is a focuson search requests instead of users: capacityplanning is done on basis .of 'how manyquestions can we answer?' rather. than 'howrIiany users can we serve?' The point is thataccepting a user should be a long term cornmitment. Until it is seen as such, we can saythat too many users are admitted to theservice_ This, of course,' would not he thecase if the sponsor would expand theresour+dcs for the ISS quickly enough. Bow-.
a
:is.development of the'numberof users of an SS
ever, the typical sponsor wants to be sure ofan established need fur more resourcesbefore lie grants expansion (Wan& riskcapital is indeed rare), but, by the time theneed is established, there is already con-gestion, which also hinders expansion (loop3). One reason for the latter effect is thatthe 'excess' number of users reduces thethroughput, mice. the ISS staff is forced tospend time on user assistance, which willlower? the revenue/cost ratio and activateeconomic concern on the part of the sponsor,
Fig. 3 shows the result of the computersimulation of ISS2.
4 Implicatigns of the analysisThe simulation results will not be dis-
cussed in detail here, but their implicationswill be explored. They moll that the twoyears plus".stagnation is no a mystery but

On-Line Review
consequence of the activity In the system.So stagnation should not be unexpected,and, when it occurs, it does riot nece§sarilymean that the market is penetrated.
It is interisting to note that a similar stag-nation was typical for SDI services. Forthese, stagnation did not occur until afterabout four years, a difference which couldbe a result of a larger market for the typi-cal major service-, and probably systemic
30% (see Introduction ) iis consistent with thesimulation results, since the average age ofexisting ISSs is just over two years, In esti-mations- of a likely ISS. growth rate in thenear future, the implication is that thetypical ISS will stagnate but the annualaverage growth rate will stabilize somewherearound 10-12%.
The decline in ISS growth rate is likely,but we.might ask whether or not it is inevit-
C NGESTION BUSINESS.VOLUME
1
differences bet en SDI and ISS services aswell.
The reference run of the simulationmodel shows rapid initial growth. In aboutthe second year, the annual growth rate isapproximately 30%, and after that it de-clines to between 10% and 12 %.. The growthin search reqUests (queries) is slightly higherbut follows'the same pattern as the numberof users. The estimated aggregate growthrate for the rmation search industry of
RESOURCES
Fig. 2 The Bask mechanismfor ISS growth
able. In principle it is not, for there are waysto influence the development and achieve ahigher growth rate until market saturation isreached. Since problems well stated are halfsolved, we can look at the previous explan-ation for guidettnes towards solutions. If thenegative effects of congestion could be miti-gated, higher growth would be achieved.Such' an effect could be achieved either by achange in the link between congestion andbusiness volume, .01 the link between con-
'Complex systems are typically insensitive topolicy changes,
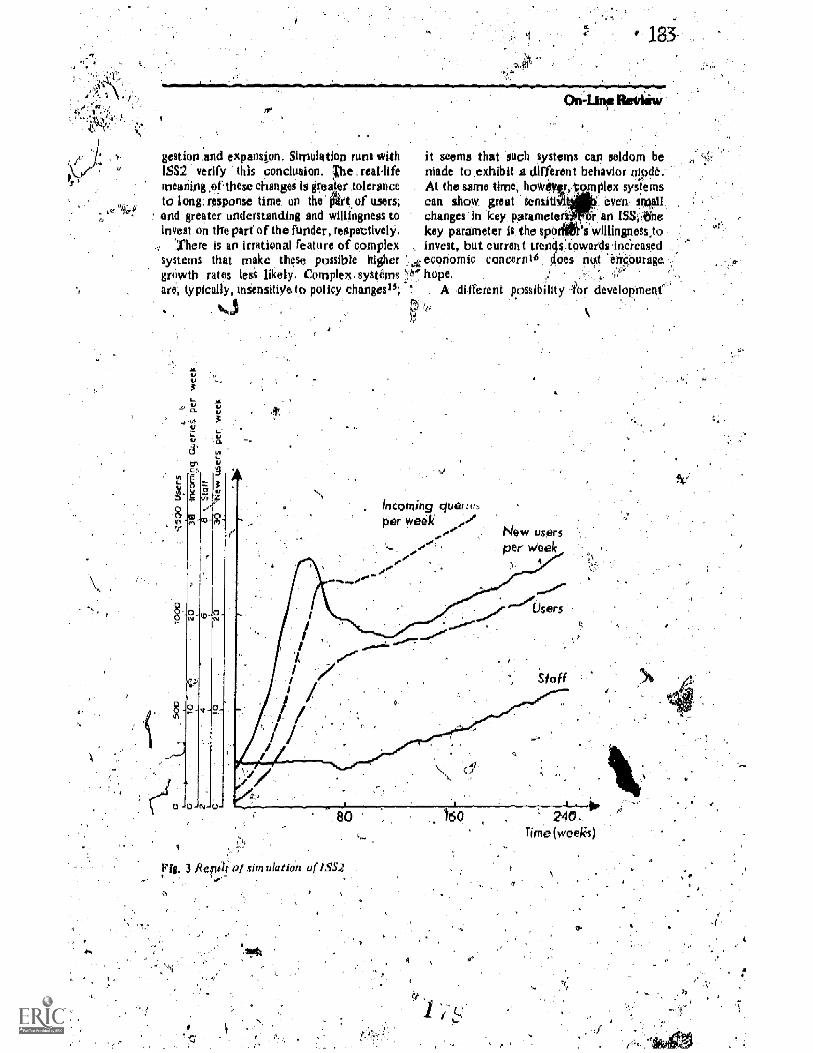
gestion and expansion. Simulation runs withISS2 verify this conclusion. xhe real-lifemeaning of these changes is greater toleranceto long. response time on the Art of users,and greater understanding and willingness toinvest on the part of the (under, respectively.
'here is an irrational feature of complexsystems that make these possible highergrowth rates less likely. Complex. syst4msare typically, insensithle to policy ehangests;
it seems that such systems can seldom beniade to exhibit a different behavior mode.At the same time, howev, 'complex systems#can show great sensitiii: even smallchanges in key parameters., Or an 1SS, tinekey parameter is the spbrilers willingness,toinvest, but current trendsjowards increasedeconomic cancernm does not encourage.
a' hope.f dA different possibility or developm

that could invalidate. our predicticiof integration of ISSs and other infertnatieutilities. There is an academic consensus Atan *crease. in service repertoire would giveeipbstantlally higher groivth potential P.Flotveiier, there is at present not muchstructure in the operative domain on which9,66ild such a diversification.
5 SummeryThe -findings from the analysis discussed
in this paper can IN summarized as follows.The growth, in number of users, of a typicallg, in a research oriented_ environment, ischaracterized by rapid growth, ayears plus' stagnation and following that, aslower gfrowth of about I 6-12% annually.Since existing ISSs are young, we can expect
/ a stagnation in the coming years_ for afetypical ISS. Lin ess new ISks arc establi_there could be taguation. in the indUstry asa whole. The ation is not inevitaile butlikely ,
6 Rtiferences1 ME. Porat: orrnation economy'.
Report 2/, Pro Information Tech,nolcigy. and lecornmuniclitions, Stan-
. ford University, August 19762 Geoiges AnderIP In fimnat ion in 1985,
OECD, Paris:1973z,,'Ecoirrincs of cdinputer co K unicationnetworks (seventh seinia ual report)'.R eport 26. ProgranLin Ink:II-nation Tech':no/logy 'and TeleeorninunicationseiSlanford 'University, June 1976,p:15'
4 Lea___G. Burchirial: `Bringing the Amerjcrevolution otirline information scienceAnd national ?so, Huil. ASIS, 1976, 2,(8), pp. 2128 '.." e'
5 Roger_ K. Summit aid Oscar; Firschein:'Document retrieval systems and tech-piques'; an-Cuadra :kei4ew.f Info.nriar ion Science d Technolok,
.
Vol. 9, ASIS, Wfshington DC, 1974 1..E. Freemanand Ru nstein(Eds).,The users and uses of scier and tech-
Meal' information critical '1'e search -,_
needs', University of Denver ResearchInstitute, November 1974
7 Roger K. Summit and Oscar > irschein,op. cit., p. 291
8 Judith Wanger, Carlos A. Cuadra andMary`, " hburn: !Impact ,of on-linere trieva . ices: a survey of users, 1974-75'.. SytiV m Deivelopment CorPorition,Santa Moptca, Calif., 1976
9 ibid.. p. A-9A
10 Alan R. Benenfeld et al.: 'NASIC at MIT:final report', Report ESL-FR-587, Elec-tronic Systems Laboratory, MassachusettsInstitute of Technology, February 1975,p, I-5 _,
.11 Roland lljerppe 'Experiences of an inter-active retrieval .systern ESRO/RECON' inSchwarz (Ed.): The moire Library,TLS, Stockholm, 1975
1.2 See the introductory discussion inR.E. Nuance:. 'Strategic simulation Of alibrarY/user/ftfrider syi'tern'. Ph.D. thesis,,`Purdue University, 1968 ._. ,..
1 3 k detailed- description of the is,siven in Mats G. Lindquist: 'Growth71yarnics of info trtatipn rearch serves .
' Report ..TRITA-__ B-61109. 'The RoyalInstitute of Techn _logy -Library, Stock-
14 The. system 'dynamos met odelogy is
holm , :November 19
described in Jay W. Foriestgrineiplesof systems, Wright-Allen press, C&bridge,_Blass', 1968 -.- '. ./1
,,,
15 See discussion in Chripter4: 'Notes oncorntgex syste s in Jay W. Forrester`:"Urban Dynamic_ MIT Press, Cambridge,
-ss 1969han 'Schwarz. ices
o dostry: the to ec ogicaluniversity librtry,.1.0%4.1,76, 32, (I),0.1-16 I. 4
17 Pirsonal communication with 'D. Dunn,Stanrord Univetsity, November .1976. t_nindfcation is also given by the-increased'a t tention. to -'privat files' as a service
t d e ve I rnent, wi is discussed in chap-ter, of annual review (see Reference5) t-or theaast two years.'


(1973),-. InfOrmatiOnin. 4985, Par OECD
en, kD. P.. (1977) "Mathematical Models and Deci-ionjlakini in Bureaucracies: A'Case Story Told
from Three Points of View", unpublished ,Ph. D.gisse-tation, M.I.T. Cambridge, Mass.
(ji975).-"Providing On-lie,Search Services',Through the Public Library", EingJ14I, v. 12,pp;% 156-.157;-
ance, R. (1968). "The Use c Bimu-_ng Inftirmatial Storage and ,Retriev-Doc. pp,. 363-370.
(1969).- "An InduStrialerSity;;Library", Proc.-of
daiu- 'Tampa, Pia.
. R. and Nanc6, .-E. .(1970q. ganiaims apd Simulation'tudies university Lib-
.
rhriesi 1Methodological Overy Inform- Stor.Tetr., v. 5, p. 153' 168.1-i.-
.
.
6chaiyy i3. 1 9741, 'Subject:ilea:1110 ap- o:E-#eMiddle pf the 19th CenIturv_A-.Geeralis6d View"Lib. Sc., v. 1, n. 14,1i60,9-4.,
Baumol, J. 1,7and Marcus, M. A19731 F nomics--f Academic Libraries-, Washington,' "D. C. Americ councilof Education.
Benenfeld, A. R: etRepoft", Report
illaboratary, M.IA
al.ESL-.T,,
.
,
Berkimy A. (1974) . "An EperiMentaltase Study of toa fusion of an informatiennovation a Scienti ic Community", Ph. D. dici.bertation, niversity,of Il nois at 0rba a:Champa-ign..
974 r "NASIC.at MITR -587, Electronic SysambtAdge,Mass..
Blalock, M. '(1969). fTCliffs : Prentice-Halm .
Brodbeck, M (Ed.) (19P8) `.1 Reahe Social Science
le Philosd hacmillan.
Att.
Bro wn, . P. (1917).'"On-line'BiblipgrapllictRqtriev41$ysterfis,Use", ap!RIALJLtrAL12!, v. 6B, n, 4,_pp.155 -160.

188
Burehinal,' L..' }G. L(1276).' "Bringing the Ampriaan ReVolu-ftion-On-; Science- and. Nationil
Bull. ASIS, v. , n p' 27-28.
Campbell, D. T. an _C erirnental4Pq tndCAAdT°egh-for ArateaW ,Chicago:
Rand M6Nall.Y. ',7--7.7-'
- Carman, J. L. (a. ation of al Multi-discip-:'4 lified Informati paper presented at the
4thJnterratiOnS.r conference on Mech nixed informa7tion Stora- Retrieval:Syst g, Cran 1-1 ILK.
DeGennaro, R. (1975). .."Pay.LibrarieS and User Charges"Librar ,Journal, February-i5, pp.. 363-367.
il
ScienCe since Vkabylon,'Havens -YaldUnivesity Press.
Forrester,'J.' W. (imly. incWtr.kel Dyi ica CambridgMash.': MIT Pregt.
Forrester, J --WA,,(1968)J.,bridge, Mass.: WzIpht-Allen Press,,
les oT S st m Cara' .
ster, J. W. (1,969) Urban Dynamics, CatbMaSs.:'MIT'F kss.
Freeman, J. E'., and -Rubenstein',' A. II. (074).an0--Uses of Scientific and 'teChnicaa inCritica Research Npeds", Uhlversity:ofsearch Institute-, belly
idge,
.
G:tdner, et_al f19-44-.
aced bibliograp -- seasearch,Libirariel,", AIL2 n 2,pp.
aus, A. L.St
0.968) Thor ua
74) Study Notes. i $ht-Akt pr.ass..
(1.976),"MplianIgnksagenteri$,Elid Ise:Infermationsuinyttjande-M-utred:
.64 §IdOdighAaArd for TechniC01 DO:xec)cholm.:

189
hman, A. O. ( 97 vExitt Voice land Loyalty, Cam-bridge; Mass.: arvard University Press.
Hjerppe, R. 197t) "Experiences of an Interactive Re-trieva ystem ESRO/RECON", in Schwarz, 1S. (Ed.),The I e active Librar Stockholm: Tekniska L t-
sallskapet.
HJ rppe (1977).-."NAgra synpunk er p& prisS ttninginformationstjahster" mimeographed P. M., TheRoyal InstitUte of Technology.Library
Hjerppe, R. et al. (19.7 "The Utilization of the_RE CON SysteM:in-,4A00 during 1975 ", ReportLIB-4658, The ReyalInstitute of Technology Library,Stockholm.
av
Hjerppe, R. and Lindquist, .441.:,(71). "A Model 10rtheEvaluation. cf InformatOn-retrieval Systems Con-siCering the- Decision Situation of the USer",-'Prod. ASIS, v. 8, pp. 77-81.,
Kap .a n, A. (143.6 eaSGAOMOntin Behavioral Scidhc..Cad.,) Reading in the philosophy
the 'S SclanAs, Nev,York:,Macmillan
T._(197on Transfer ,
for TeChnolOgicaence, v. 181, pp115-4
The Structure of Scientific Regoo PreSS.:University of Ch
(1966) - Theoretical .Analysis of, Lund: Studentlitt Stur.
Lar on, R. et al. (1976) "3RIPt' AM, Into ctiland Editing System lot:- Large Textual qataReport .TRTTA-LIB-4056, The Royal InstitiinologyLibra,FY, Stockholm.
%.
,
.Ljungberg, S. (197) . "Th Use o> cnputersti.on and bocumentatio Dokumerlt.,
,._
arcs,Tech-
pp 74-80. ,(In =Swedish).
LlewelIen I,. A acid Kamineckl, k. M. (1975). "ComPar,r-son of Syst m Development Corporation and LockheedSystems in earchirig, CA Condensates and NTIS Da471diea' err paper ,presented at Ithe 66th AnCOnf he S cial Libraries Assoc
0

Marron, H. (1969). "On Costing Informa ion Services ".,Proc. ASIS, v. 6, pp.4515-520.
ashayekhi, A. (1976 "Common, Hypotheses in System Dy-namics Stugies' and the;Ways they are SUpported";,mimeographed memorandurwe System Dynamics Group,M.I.T- aMbridge, Mass
Mass, -N. 1975) .rib Cau
oonomic C cle An Anal of
McDonough, A. (1963)-. Inmerit s,,New York
atiot He
meadbvit,D.r,ton,
Me
Draw -Ht
-(1957),..
1., (1972) Tie Limits to Growth,(Potomac-Associates Inc.'
41957)..'Socia TheoNew.York: The Free Brea
and Social S
Pensyl, M (19:77),. "Annual Report1977" -"meograkthed,
and Hoglundut Ber ased Cur
is -Social SciefiliRoy. Institute o_
June 1976 - JulyIC/MIT, Cambridge, Mass.
4. (197 'wEvaluation of aeh,ta. Awar nessService for-Swed-
Report TRITALIB-6061, The -nology ;Library, Stockholm.
Popper,_KR (196$). CorCectures and Refutation TheGrowth f Sgientifi lowl!clg!, Npw York: Harper.*
am4ip Information Tehnology and Telecdmminications-(1976)-,: l'Ectulomics of Computer Communication net-works eventh semi-annual rpport)",_ Rep t 26,=anfo University, Stanford, Calif.
A73) . DYNAMO''Ii
Masst: MIT Press.:.idge,
'lloa?sa, G. (1973).-Scientificthe Hague; Mouton.
4
nforma ion and Socie
Schwarz, S, -(1976). "InformaThe Role of the TechnolJ.-DOe
innti e-Ha' -1
naiiiio S stems, _ngle

Shaffer, W. (106) . "Courtchusett Ciiminal Justice4D. dissertation, m.r.T.,
j
gement* and 'the Kassa-Asstem unpublished ePh.bridge
Stouffer, -S A. t196_sign", in: Socialhe Free Press.
Summit
one ,Observations on Stydy De=Research to Tet Ideas, New York:
K. and Firschein, 0.. (1974). ."Docliment ReJeval Ystems and Techniques", in: Cuadra, .
( .), 'Annual Review of Information .Science andWashington C.: ASIS.
L
Tombe g, A. (107-a). "On-line Segvices in Europe", On-e.lin ReView, n. 3, ,pp 1.77 -193. ',
AV (1977 -b') . Lecture presented at a seminarRQyal Insti.tute!,pf:,TpchnoIpgy 30 November.
11,
et' al., (1576). "Impact of On-line Retrii Ai of ,fterpf _074-5n*SyStemleoxP6rAtion, Santa Monica, Calif.
A .
(19 "A General Statistical' Mcidel forin uttir-e bemand-level, of Data Base
an Infrpmation Retrieval Organi?aion",v. 24; 11,. 4, pp. 261 264..
M.#1,;_, (.68)..`_ "'Objectivity' in Social Science", in:rodbeCki M.: lyd,1-, eddings iAr the:Philosophe Zo&al Sdlexaces, New Nor Naonlplan.'
,
'Wind,.
al. 19761. "Marke d Guidelines forthe in InhUstral-Pro - - ct" , -repaV for NSF'.
, grant N422,71, mimeb4 tiled, The WhartcaL ftSChool
(1University of Penpsyl ania.,-4
J. R. and Wish(m- A. (1975) . "MarketinT and Friing of On-line Services", Taper presented at the4th AS_LS12115L;y_pAL2.1Ila, Portland,, Oregon,.
Za1s, H.W. (19T..1--'"The Priqing of jnf-rmation:-. ,_6,del for del _15seminati n fo rmation
r Se vices", Ph' diasertati e BerkeyLaboratory, Up versity, of C Berkel-
U..
Itcr. (1977) . Economricing ioi.2, -pp. 8 95;
cyr)1 ,1berg, H. L.cci _ogy, 0
(1565tawa: Be
n iii
Related Documents


![[34] - Lindquist Lablindquistlab.wi.mit.edu/wp-content/uploads/2013/06/...Schirmer, C. Queitsch, A. S. Kowal, and S. Lindquist, submitted (1997). a" Y. Sanchcz and S. L. Lindquist,](https://static.cupdf.com/doc/110x72/606c80b19bb7de31a926ace6/34-lindquist-schirmer-c-queitsch-a-s-kowal-and-s-lindquist-submitted.jpg)