Page 1 1220 Roosevelt, Suite 200 Tel. +1949.453.0609 Irvine, CA 92620-3675 [email protected] USA www.pabraifunds.com To: All Limited Partners and Investors of the Pabrai Investment Funds From: Mohnish Pabrai, Managing Partner Date: January 10, 2020 Re: 2019 Results etc. Dear Partners: Happy New Year! December 31 was our annual redemption date. A total of $64.9 million was redeemed from the various funds in 2019. The redemptions on a per fund basis are: PIF2: $8.1 million PIF3: $10.2 million PIF4: $46.6 million For the quarter ended December 31, 2019, a total of $2.4 million was added to PIF3 by new and existing investors. Dhandho Holdings will be making a distribution to its unit holders in Q1 2020. As we have done in the past, we’re opening up all three funds on April 1, 2020 to accommodate any Dhandho Holdings investors who wish to move some or all of the distribution to Pabrai Funds. The funds will also be open to all existing Pabrai investors to add funds. New investors can add funds to PIF3 and PIF4. PIF2 will remain closed to new investors as it hardly has any slots available. PIF3 is our offshore fund for non-US accredited offshore investors, and U.S. IRAs, foundations, and endowments. The minimum investment to join PIF3 as a new partner is $3 million for individuals and $10 million for IRAs/foundations/endowments. PIF4 is for qualified US-based investors. The minimum investment to join PIF4 as a new partner is $8 million. For current investors in any of the funds, the minimum addition to their current investment is $25,000. For IRA investors the minimum is $5,000. If you are interested in or would like more information about the April 1, 2020 opening, please contact Valerie Magursky or me at [email protected] or [email protected], respectively. The updated performance numbers on all the funds are:

Welcome message from author
This document is posted to help you gain knowledge. Please leave a comment to let me know what you think about it! Share it to your friends and learn new things together.
Transcript
Page 1
1220 Roosevelt, Suite 200 Tel. +1949.453.0609
Irvine, CA 92620-3675 [email protected] USA www.pabraifunds.com
To: All Limited Partners and Investors of the Pabrai Investment Funds
From: Mohnish Pabrai, Managing Partner
Date: January 10, 2020
Re: 2019 Results etc.
Dear Partners:
Happy New Year! December 31 was our annual redemption date. A total of $64.9 million was
redeemed from the various funds in 2019. The redemptions on a per fund basis are:
PIF2: $8.1 million PIF3: $10.2 million PIF4: $46.6 million
For the quarter ended December 31, 2019, a total of $2.4 million was added to PIF3 by new and
existing investors.
Dhandho Holdings will be making a distribution to its unit holders in Q1 2020. As we have done in
the past, we’re opening up all three funds on April 1, 2020 to accommodate any Dhandho Holdings
investors who wish to move some or all of the distribution to Pabrai Funds. The funds will also be
open to all existing Pabrai investors to add funds. New investors can add funds to PIF3 and PIF4. PIF2
will remain closed to new investors as it hardly has any slots available.
PIF3 is our offshore fund for non-US accredited offshore investors, and U.S. IRAs, foundations, and
endowments. The minimum investment to join PIF3 as a new partner is $3 million for individuals and
$10 million for IRAs/foundations/endowments. PIF4 is for qualified US-based investors. The
minimum investment to join PIF4 as a new partner is $8 million.
For current investors in any of the funds, the minimum addition to their current investment is $25,000.
For IRA investors the minimum is $5,000. If you are interested in or would like more information
about the April 1, 2020 opening, please contact Valerie Magursky or me at [email protected] or
[email protected], respectively.
The updated performance numbers on all the funds are:
Page 2
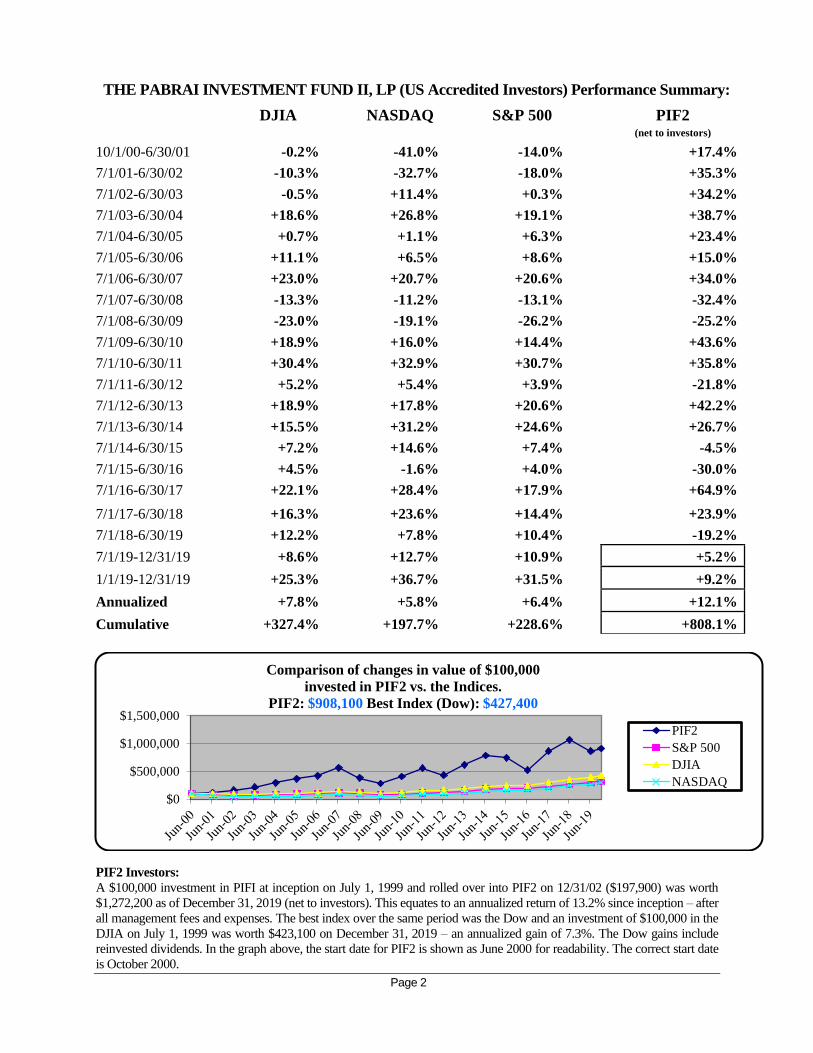
THE PABRAI INVESTMENT FUND II, LP (US Accredited Investors) Performance Summary:
DJIA NASDAQ S&P 500 PIF2
(net to investors)
10/1/00-6/30/01 -0.2% -41.0% -14.0% +17.4%
7/1/01-6/30/02 -10.3% -32.7% -18.0% +35.3%
7/1/02-6/30/03 -0.5% +11.4% +0.3% +34.2%
7/1/03-6/30/04 +18.6% +26.8% +19.1% +38.7%
7/1/04-6/30/05 +0.7% +1.1% +6.3% +23.4%
7/1/05-6/30/06 +11.1% +6.5% +8.6% +15.0%
7/1/06-6/30/07 +23.0% +20.7% +20.6% +34.0%
7/1/07-6/30/08 -13.3% -11.2% -13.1% -32.4%
7/1/08-6/30/09 -23.0% -19.1% -26.2% -25.2%
7/1/09-6/30/10 +18.9% +16.0% +14.4% +43.6%
7/1/10-6/30/11 +30.4% +32.9% +30.7% +35.8%
7/1/11-6/30/12 +5.2% +5.4% +3.9% -21.8%
7/1/12-6/30/13 +18.9% +17.8% +20.6% +42.2%
7/1/13-6/30/14 +15.5% +31.2% +24.6% +26.7%
7/1/14-6/30/15 +7.2% +14.6% +7.4% -4.5%
7/1/15-6/30/16 +4.5% -1.6% +4.0% -30.0%
7/1/16-6/30/17 +22.1% +28.4% +17.9% +64.9%
7/1/17-6/30/18 +16.3% +23.6% +14.4% +23.9%
7/1/18-6/30/19 +12.2% +7.8% +10.4% -19.2%
7/1/19-12/31/19 +8.6% +12.7% +10.9% +5.2%
1/1/19-12/31/19 +25.3% +36.7% +31.5% +9.2%
Annualized +7.8% +5.8% +6.4% +12.1%
Cumulative +327.4% +197.7% +228.6% +808.1%
PIF2 Investors:
A $100,000 investment in PIFI at inception on July 1, 1999 and rolled over into PIF2 on 12/31/02 ($197,900) was worth
$1,272,200 as of December 31, 2019 (net to investors). This equates to an annualized return of 13.2% since inception – after
all management fees and expenses. The best index over the same period was the Dow and an investment of $100,000 in the
DJIA on July 1, 1999 was worth $423,100 on December 31, 2019 – an annualized gain of 7.3%. The Dow gains include
reinvested dividends. In the graph above, the start date for PIF2 is shown as June 2000 for readability. The correct start date
is October 2000.
$0
$500,000
$1,000,000
$1,500,000
Comparison of changes in value of $100,000
invested in PIF2 vs. the Indices.
PIF2: $908,100 Best Index (Dow): $427,400
PIF2
S&P 500
DJIA
NASDAQ
Page 3
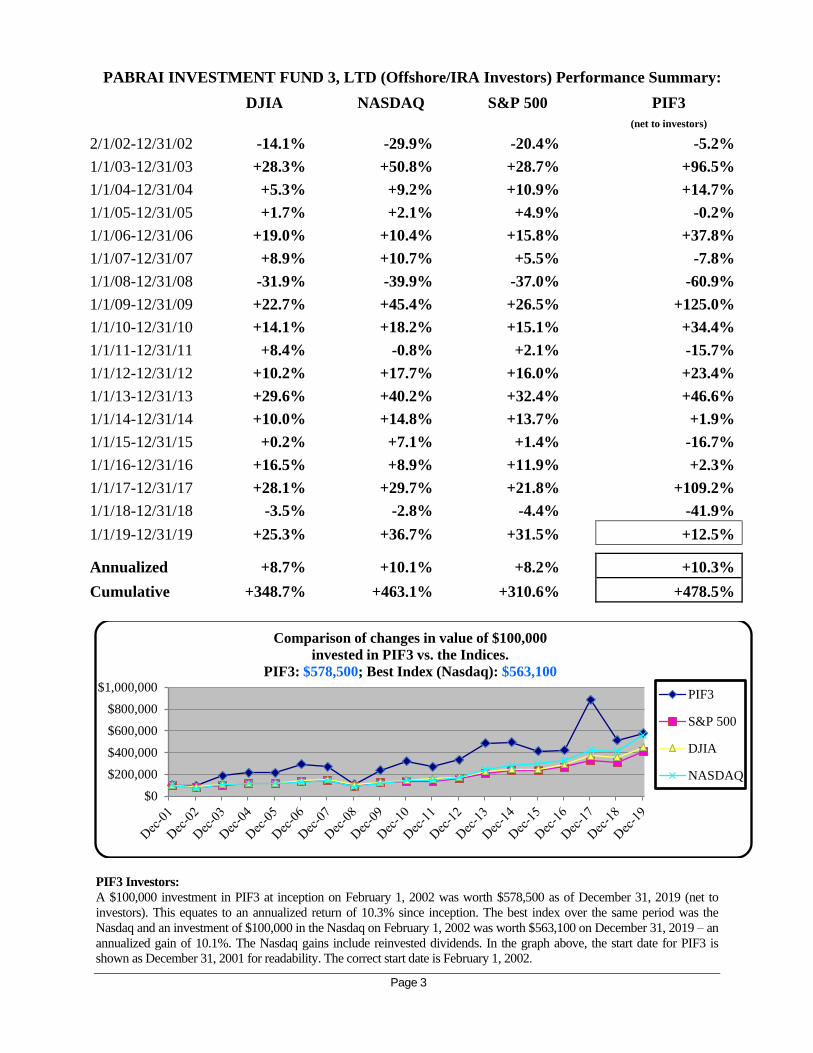
PABRAI INVESTMENT FUND 3, LTD (Offshore/IRA Investors) Performance Summary:
DJIA NASDAQ S&P 500 PIF3
(net to investors)
2/1/02-12/31/02 -14.1% -29.9% -20.4% -5.2%
1/1/03-12/31/03 +28.3% +50.8% +28.7% +96.5%
1/1/04-12/31/04 +5.3% +9.2% +10.9% +14.7%
1/1/05-12/31/05 +1.7% +2.1% +4.9% -0.2%
1/1/06-12/31/06 +19.0% +10.4% +15.8% +37.8%
1/1/07-12/31/07 +8.9% +10.7% +5.5% -7.8%
1/1/08-12/31/08 -31.9% -39.9% -37.0% -60.9%
1/1/09-12/31/09 +22.7% +45.4% +26.5% +125.0%
1/1/10-12/31/10 +14.1% +18.2% +15.1% +34.4%
1/1/11-12/31/11 +8.4% -0.8% +2.1% -15.7%
1/1/12-12/31/12 +10.2% +17.7% +16.0% +23.4%
1/1/13-12/31/13 +29.6% +40.2% +32.4% +46.6%
1/1/14-12/31/14 +10.0% +14.8% +13.7% +1.9%
1/1/15-12/31/15 +0.2% +7.1% +1.4% -16.7%
1/1/16-12/31/16 +16.5% +8.9% +11.9% +2.3%
1/1/17-12/31/17 +28.1% +29.7% +21.8% +109.2%
1/1/18-12/31/18 -3.5% -2.8% -4.4% -41.9%
1/1/19-12/31/19 +25.3% +36.7% +31.5% +12.5%
Annualized +8.7% +10.1% +8.2% +10.3%
Cumulative +348.7% +463.1% +310.6% +478.5%
PIF3 Investors:
A $100,000 investment in PIF3 at inception on February 1, 2002 was worth $578,500 as of December 31, 2019 (net to
investors). This equates to an annualized return of 10.3% since inception. The best index over the same period was the
Nasdaq and an investment of $100,000 in the Nasdaq on February 1, 2002 was worth $563,100 on December 31, 2019 – an
annualized gain of 10.1%. The Nasdaq gains include reinvested dividends. In the graph above, the start date for PIF3 is
shown as December 31, 2001 for readability. The correct start date is February 1, 2002.
$0
$200,000
$400,000
$600,000
$800,000
$1,000,000
Comparison of changes in value of $100,000
invested in PIF3 vs. the Indices.
PIF3: $578,500; Best Index (Nasdaq): $563,100
PIF3
S&P 500
DJIA
NASDAQ
Page 4
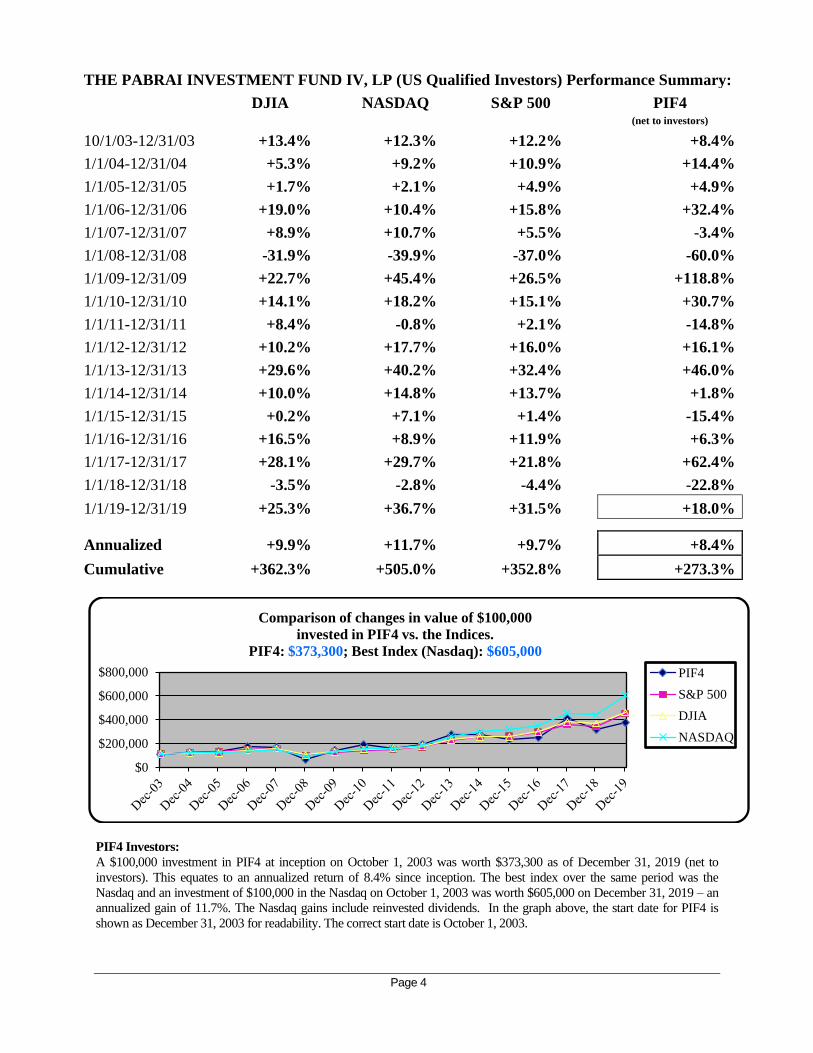
THE PABRAI INVESTMENT FUND IV, LP (US Qualified Investors) Performance Summary:
DJIA NASDAQ S&P 500 PIF4
(net to investors)
10/1/03-12/31/03 +13.4% +12.3% +12.2% +8.4%
1/1/04-12/31/04 +5.3% +9.2% +10.9% +14.4%
1/1/05-12/31/05 +1.7% +2.1% +4.9% +4.9%
1/1/06-12/31/06 +19.0% +10.4% +15.8% +32.4%
1/1/07-12/31/07 +8.9% +10.7% +5.5% -3.4%
1/1/08-12/31/08 -31.9% -39.9% -37.0% -60.0%
1/1/09-12/31/09 +22.7% +45.4% +26.5% +118.8%
1/1/10-12/31/10 +14.1% +18.2% +15.1% +30.7%
1/1/11-12/31/11 +8.4% -0.8% +2.1% -14.8%
1/1/12-12/31/12 +10.2% +17.7% +16.0% +16.1%
1/1/13-12/31/13 +29.6% +40.2% +32.4% +46.0%
1/1/14-12/31/14 +10.0% +14.8% +13.7% +1.8%
1/1/15-12/31/15 +0.2% +7.1% +1.4% -15.4%
1/1/16-12/31/16 +16.5% +8.9% +11.9% +6.3%
1/1/17-12/31/17 +28.1% +29.7% +21.8% +62.4%
1/1/18-12/31/18 -3.5% -2.8% -4.4% -22.8%
1/1/19-12/31/19 +25.3% +36.7% +31.5% +18.0%
Annualized +9.9% +11.7% +9.7% +8.4%
Cumulative +362.3% +505.0% +352.8% +273.3%
PIF4 Investors:
A $100,000 investment in PIF4 at inception on October 1, 2003 was worth $373,300 as of December 31, 2019 (net to
investors). This equates to an annualized return of 8.4% since inception. The best index over the same period was the
Nasdaq and an investment of $100,000 in the Nasdaq on October 1, 2003 was worth $605,000 on December 31, 2019 – an
annualized gain of 11.7%. The Nasdaq gains include reinvested dividends. In the graph above, the start date for PIF4 is
shown as December 31, 2003 for readability. The correct start date is October 1, 2003.
$0
$200,000
$400,000
$600,000
$800,000
Comparison of changes in value of $100,000
invested in PIF4 vs. the Indices.
PIF4: $373,300; Best Index (Nasdaq): $605,000
PIF4
S&P 500
DJIA
NASDAQ

Page 5
General Comments
All three funds had strong Q4 2019 performance. They were up 10%, 15.6% and 8.2%, respectively,
for the quarter versus 7-12% for the various indices. However, the funds were well behind the indices
in 2019. The funds were up 9.2%, 12.5%, and 18%, respectively, in 2019 versus 25-37% for the
indices. Our India positions, which were such a big tailwind in 2017, gave us plenty of headwinds in
2018 and 2019.
The funds continue to have approximately 40% invested in small and mid-caps in India and I am very
thrilled with the assets we own in India. The Indian small and mid-cap indices were down 5-9% (in
USD terms) in 2019 due to concerns over India’s non-bank finance companies (NBFCs) that have
since subsided. The indices were up 3-5% (in USD terms) in the fourth quarter and we are likely past
the bottom. The wonderful compounders we own in India have legs. Many of them are easy doubles
from here. I just hope I am smart enough to hold on to some of our India bets for a long time.
A few of our newer businesses contributed to positive performance in 2019, including one of our
largest new additions, Micron, and one of our smallest, a very nice business in Turkey. I aggressively
bought every share of the Turkish business that I could, but could only invest about $7 million in this
deeply undervalued nano cap. In less than six months after we invested, that position is valued at over
$33 million. We’re not done yet. Amazingly, it is still undervalued. I love the business and folks who
run it. Channeling Warren Buffett, it is a very nice castle with a decent moat and a couple of good
knights in charge of the place.
In 2019, Pabrai Funds made some progress towards bridging the gap between the NAVs and
underlying intrinsic value, but the gap remains wide. With the exception of the 2008-09 period, Pabrai
Funds is trading at one of the widest discounts to intrinsic value since inception. Barring any macro
shocks, 2020 could be a great year for Pabrai Funds. The funds are already up 1 - 8% in the first ten
days of the year.
I have been running Pabrai Funds now for over two decades. The years have gone by quickly. I am
just as excited about managing Pabrai Funds as I have ever been. I think the twenties are likely to be
great years for Pabrai Funds as all the lessons and learnings over the last few decades get reflected in
our holdings and future bets.
Alignment of Interests
My immediate family has a stake of 175,859 units of PIF2 and 433,197 units of PIF4. The
administrative team at Pabrai Funds and I own 54,157 units of PIF4 and 14,754 units of PIF3 in
various retirement accounts. In addition, The Dakshana Foundation owns 77,006 units of PIF3. The
aggregate stake of the Pabrai family, the Pabrai Funds team and The Dakshana Foundation in Pabrai
Funds is worth approximately $39 million.
Pabrai Funds charges no management fee, just performance fees – which are ¼ of the returns over 6%
annualized (subject to high-water marks). I only get paid when you make money. When you win, I
win. I am very bullish on the long-term future of Pabrai Funds – as demonstrated by my being the
second largest investor in the funds. No fees were earned in Q4 2019.
I have an approximately $11.9 million investment in Dhandho Holdings. Additionally, The Dakshana
Foundation has an approximately $0.7 million investment in Dhandho Holdings. Besides this, I have
Page 6
no other meaningful interests in any other mutual funds, hedge funds or private equity funds. Our
interests are completely aligned.
Online Portal for Investment Statements
We are working with our administrator, Liccar, to set up an online portal for each investor. Instead of
emailing your investment statements quarterly, Liccar will upload them to the portal and notify you
via email. Liccar will also upload the K-1’s to the portal.
We will begin using the portal for the 3/31/2020 investment statements. All investors will receive an
email from Liccar prior to that date which will give you instructions for setting up your account in the
portal.
Final K-1’s (for US Investors)
For PIF2 and PIF4 investors, we expect your final K-1s to be emailed to you (password protected) and
uploaded to the Liccar portal in March 2020.
PIF3 Switching to Quarterly Reporting on January 1, 2020
PIF3 investors have gotten their NAV reported monthly, while the other two funds get quarterly
statements. This is an accident of history. Effective January 1, 2020, PIF3 will report quarterly, like
PIF2 and PIF4. This will lead to lower administrative expenses for PIF3 and filter out some noise. The
next PIF3 statement will be 3/31/2020.
Annual Report – Will be out in Q2 2020
Our modus operandi now is to provide expansive commentary in the annual reports and the annual
meetings. The quarterly letter will continue to provide updated performance numbers and
announcements, but minimal commentary. The annual report is slated to be published in Q2 2020.
Chai With Pabrai Blog
Please check out my blog www.ChaiWithPabrai.com which I try to keep updated. Here are some
recent additions to the blog:
2020 Free Lunch Portfolio
In December 2017, I co-authored an article in Forbes about The "Free Lunch" Portfolio, which
combines the power of Uber Cannibals, Shameless Cloning and Spinoffs. An updated portfolio was
published on the blog in December 2019. We have now rebalanced the Free Lunch Portfolio for 2020.
http://www.chaiwithpabrai.com/blog/2020-free-lunch-portfolio
My Annual Talk at Boston College
I very much enjoyed my discussion with Prof. Arvind Navaratnam’s class on Fundamental Analysis
& Value Investing at the Carroll School of Management (Boston College) in November 2019. We
Page 7
discussed a few investing frameworks, the importance of investment mistakes, and how to look for
businesses that transcend geography and currency.
http://www.chaiwithpabrai.com/blog/my-9th-annual-talk-at-boston-college
It is also available as a podcast on Apple Podcasts:
https://tinyurl.com/applepabrai
Interview for Graham & Doddsville Newsletter, Columbia Business School
I enjoyed being interviewed for the Graham & Doddsville newsletter from the students of Columbia
Business School. I discussed my journey that led to my starting Pabrai Funds, mistakes and learnings
from the 2008 financial crisis and the importance of staying within one’s circle of competence.
http://www.chaiwithpabrai.com/blog/interview-for-graham-doddsville-newsletter-columbia-business-
school
2020 Annual Meetings – Save the Date
There will be two annual meetings held sequentially in Orange County, California & Chicago. These
meetings will cover Pabrai Funds, Dhandho Holdings and Dhandho Funds.
Prior to the California meeting on September 12th, 2020, we will have the 7th Annual Gran Fondo
Dhandho Bike Ride. It’s a scenic ride around the Newport Estuary with views of the Pacific Ocean in
Newport Beach, California. Biking can be a dangerous activity; we only want folks who are decent
bikers on the ride. The ride begins at Starbucks in Newport Beach at 8:15 AM, and ends there around
10:30 AM. For folks that just wanna chill, you can come to the Starbucks at 10:30 AM and hang out
with us bikers.
Here is a link to the Starbucks location:
http://www.starbucks.com/store/18175/us/jamboree-bristol/3601-jamboree-road-newport-beach-ca-
926602961
Bikers are best off staying at the Newport Beach Marriott Bayview, as it is less than 0.5 miles from
our Starbucks rendezvous point. Here is a link to the hotel’s website:
http://www.marriott.com/hotels/travel/npbst-newport-beach-marriott-bayview/. We will provide bike
rental information for out-of-towners in our next Letter to Partners in April.
I hope you’ll join me on Saturday morning to experience some of the magic of Southern California.
The California meeting is scheduled to be on Saturday, September 12th, 2020 at 4:00 PM at:
Soka University
Performing Arts Center
1 University Drive, Aliso Viejo, California 92656 Tel. +1949.480.4000
Page 8
Soka University has a spectacular campus nestled in the scenic hills of Aliso Viejo. It is a 20-minute
drive from Orange County Airport (SNA), and about an hour drive from LAX.
There is a fantastic Marriott Club Sport hotel about 3 miles from Soka University:
Marriott Renaissance ClubSport
50 Enterprise
Aliso Viejo, CA 92656
Reservations: 800-468-3571
Phone: 949-643-6700
There are many hotels in the area. Here is a link to other hotels near Soka University:
https://tinyurl.com/hotelsOC
The Chicago meeting is scheduled to be on Saturday, September 26th, 2020 at 4:00 PM at:
Carlucci’s Restaurant
(The Auditorium)
6111 North River Road, Rosemont, Illinois 60018 Tel. +1847.518.0990
Carlucci’s is a five-minute taxi ride away from O’Hare airport. The Marriott Suites O’Hare and The
Westin O’Hare are both next to the restaurant. In addition, there are a plethora of hotels in the vicinity.
Good deals on O’Hare hotels are usually available on the major travel-related websites.
Agenda:
4:00 – 4:30 PM: Meet and Greet
4:30 – 6:30 PM: Presentation and Q&A
6:30 – 7:15 PM: Cocktail Hour
7:15 PM: Dinner (Chicago only)
In lieu of dinner in California, we’ll have an extended cocktail hour with expanded appetizers
(multiple food stations), and lots of tables to sit and chat.
The invites will go out electronically via email in July 2020. Look for it in your inbox! If you don’t
receive it, please contact [email protected]. Your significant other and young kids are welcome
to attend. As we are now a Registered Investment Advisor, the SEC requires that all guests must be
“accredited investors,” which includes your adult kids (22 years or older). The invitation is non-
transferable.
I look forward to seeing you in September.
Page 9
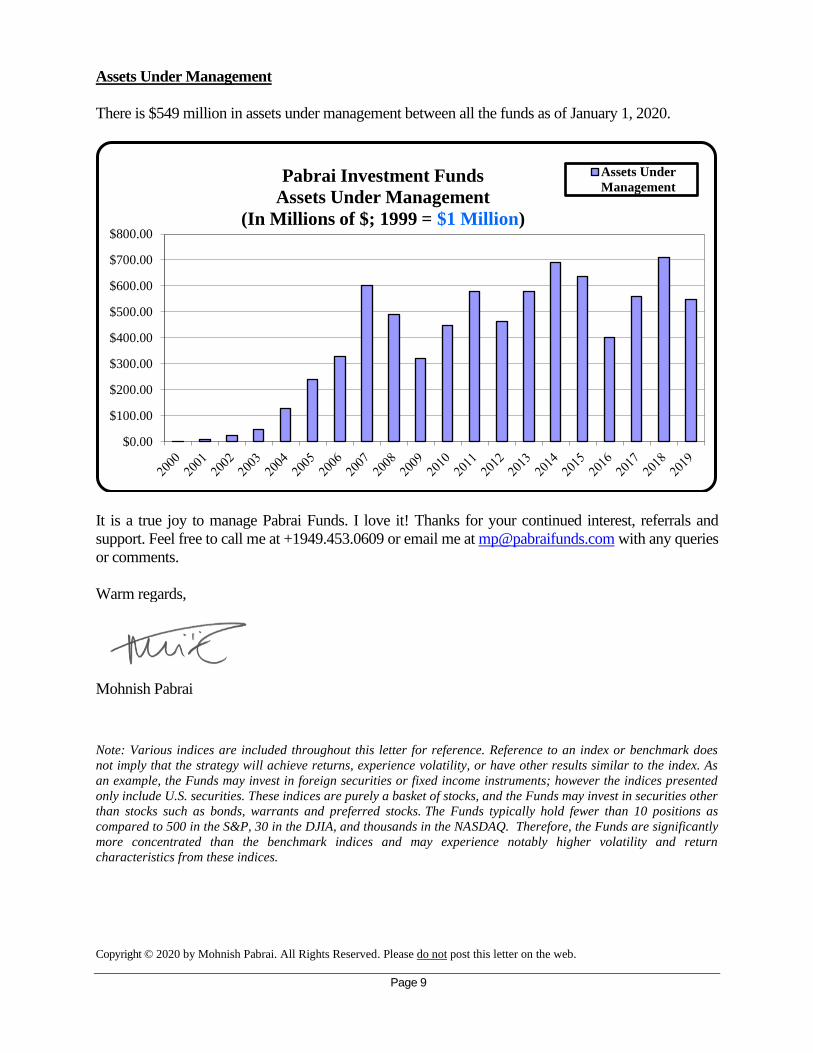
Assets Under Management
There is $549 million in assets under management between all the funds as of January 1, 2020.
It is a true joy to manage Pabrai Funds. I love it! Thanks for your continued interest, referrals and
support. Feel free to call me at +1949.453.0609 or email me at [email protected] with any queries
or comments.
Warm regards,
Mohnish Pabrai
Note: Various indices are included throughout this letter for reference. Reference to an index or benchmark does
not imply that the strategy will achieve returns, experience volatility, or have other results similar to the index. As
an example, the Funds may invest in foreign securities or fixed income instruments; however the indices presented
only include U.S. securities. These indices are purely a basket of stocks, and the Funds may invest in securities other
than stocks such as bonds, warrants and preferred stocks. The Funds typically hold fewer than 10 positions as
compared to 500 in the S&P, 30 in the DJIA, and thousands in the NASDAQ. Therefore, the Funds are significantly
more concentrated than the benchmark indices and may experience notably higher volatility and return
characteristics from these indices.
Copyright © 2020 by Mohnish Pabrai. All Rights Reserved. Please do not post this letter on the web.
$0.00
$100.00
$200.00
$300.00
$400.00
$500.00
$600.00
$700.00
$800.00
Pabrai Investment Funds
Assets Under Management
(In Millions of $; 1999 = $1 Million)
Assets Under
Management
Page 10
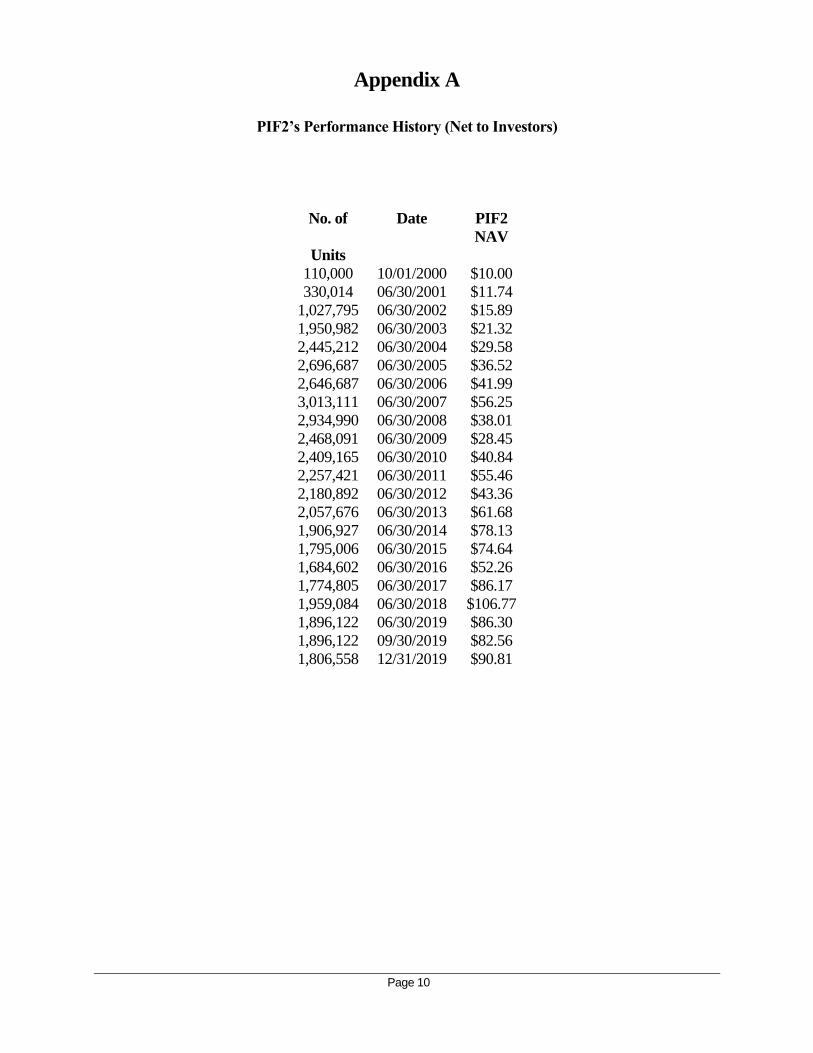
Appendix A
PIF2’s Performance History (Net to Investors)
No. of Date PIF2
NAV
Units
110,000 10/01/2000 $10.00
330,014 06/30/2001 $11.74
1,027,795 06/30/2002 $15.89
1,950,982 06/30/2003 $21.32
2,445,212 06/30/2004 $29.58
2,696,687 06/30/2005 $36.52
2,646,687 06/30/2006 $41.99
3,013,111 06/30/2007 $56.25
2,934,990 06/30/2008 $38.01
2,468,091 06/30/2009 $28.45
2,409,165 06/30/2010 $40.84
2,257,421 06/30/2011 $55.46
2,180,892 06/30/2012 $43.36
2,057,676 06/30/2013 $61.68
1,906,927 06/30/2014 $78.13
1,795,006 06/30/2015 $74.64
1,684,602 06/30/2016 $52.26
1,774,805 06/30/2017 $86.17
1,959,084 06/30/2018 $106.77
1,896,122 06/30/2019 $86.30
1,896,122 09/30/2019 $82.56
1,806,558 12/31/2019 $90.81
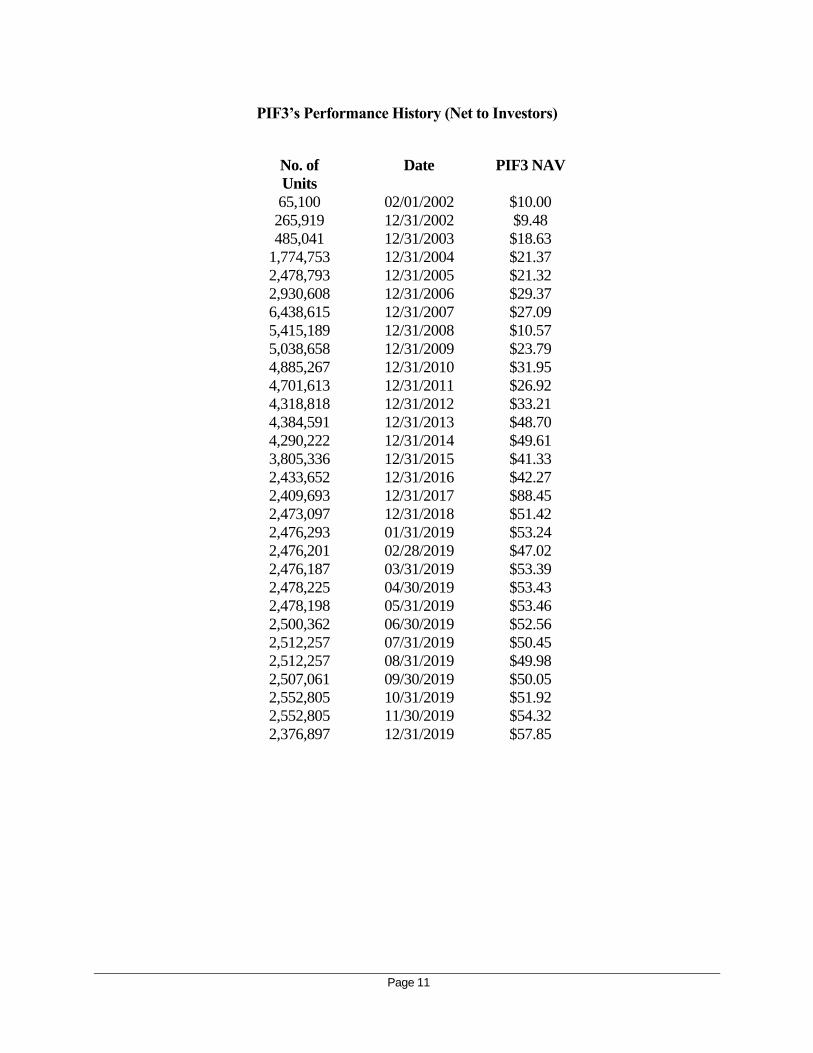
Page 11
PIF3’s Performance History (Net to Investors)
No. of Date PIF3 NAV
Units
65,100 02/01/2002 $10.00
265,919 12/31/2002 $9.48
485,041 12/31/2003 $18.63
1,774,753 12/31/2004 $21.37
2,478,793 12/31/2005 $21.32
2,930,608 12/31/2006 $29.37
6,438,615 12/31/2007 $27.09
5,415,189 12/31/2008 $10.57
5,038,658 12/31/2009 $23.79
4,885,267 12/31/2010 $31.95
4,701,613 12/31/2011 $26.92
4,318,818 12/31/2012 $33.21
4,384,591 12/31/2013 $48.70
4,290,222 12/31/2014 $49.61
3,805,336 12/31/2015 $41.33
2,433,652 12/31/2016 $42.27
2,409,693 12/31/2017 $88.45
2,473,097 12/31/2018 $51.42
2,476,293 01/31/2019 $53.24
2,476,201 02/28/2019 $47.02
2,476,187 03/31/2019 $53.39
2,478,225 04/30/2019 $53.43
2,478,198 05/31/2019 $53.46
2,500,362 06/30/2019 $52.56
2,512,257 07/31/2019 $50.45
2,512,257 08/31/2019 $49.98
2,507,061 09/30/2019 $50.05
2,552,805 10/31/2019 $51.92
2,552,805 11/30/2019 $54.32
2,376,897 12/31/2019 $57.85
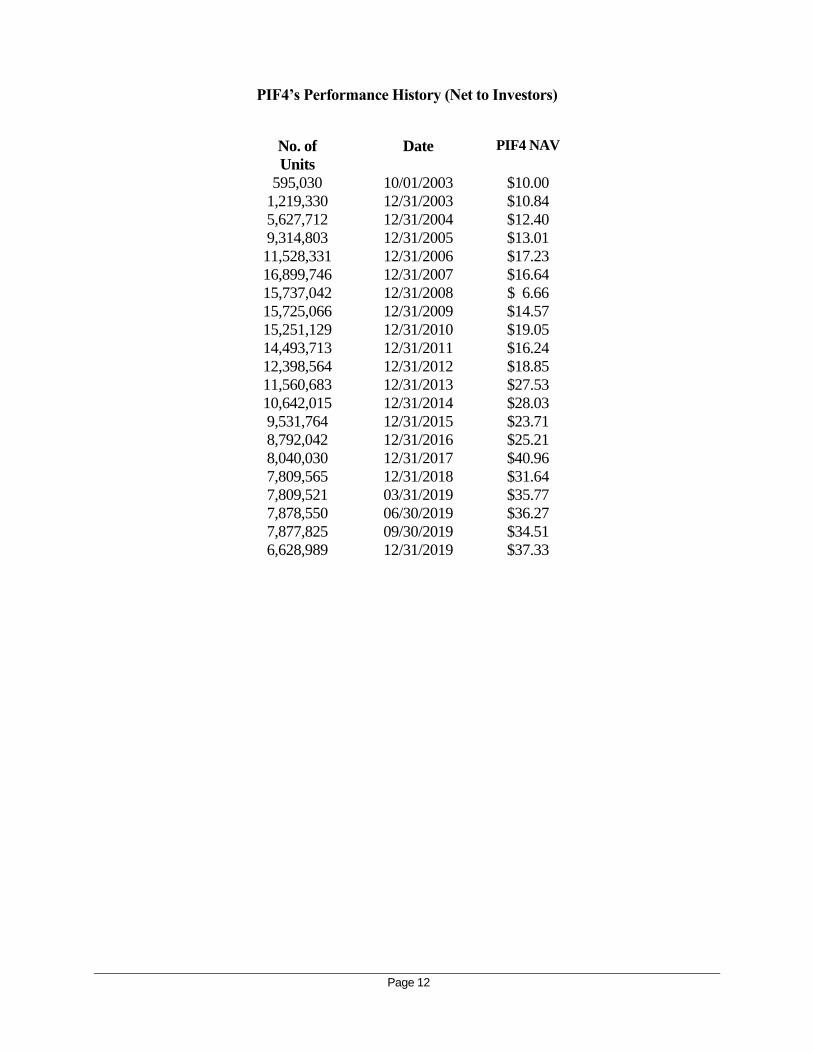
Page 12
PIF4’s Performance History (Net to Investors)
No. of Date PIF4 NAV
Units
595,030 10/01/2003 $10.00
1,219,330 12/31/2003 $10.84
5,627,712 12/31/2004 $12.40
9,314,803 12/31/2005 $13.01
11,528,331 12/31/2006 $17.23
16,899,746 12/31/2007 $16.64
15,737,042 12/31/2008 $ 6.66
15,725,066 12/31/2009 $14.57
15,251,129 12/31/2010 $19.05
14,493,713 12/31/2011 $16.24
12,398,564 12/31/2012 $18.85
11,560,683 12/31/2013 $27.53
10,642,015 12/31/2014 $28.03
9,531,764 12/31/2015 $23.71
8,792,042 12/31/2016 $25.21
8,040,030 12/31/2017 $40.96
7,809,565 12/31/2018 $31.64
7,809,521 03/31/2019 $35.77
7,878,550 06/30/2019 $36.27
7,877,825 09/30/2019 $34.51
6,628,989 12/31/2019 $37.33
Related Documents