Lima Tahun Kinerja Perekonomian Perekonomian Indonesia Indonesia IMAN SUGEMA International Center for Applied Finance & Economics (Inter CAFE) Institut Pertanian Bogor 5 Maret 2008

Welcome message from author
This document is posted to help you gain knowledge. Please leave a comment to let me know what you think about it! Share it to your friends and learn new things together.
Transcript

Lima Tahun Kinerja
PerekonomianPerekonomian IndonesiaIndonesia
IMAN SUGEMAInternational Center for Applied Finance &
Economics(Inter CAFE)
Institut Pertanian Bogor
5 Maret 2008

OUTLINEOU
I World economyI. World economy
II. Domestic economy

PART 1WORLD ECONOMYWORLD ECONOMY

INTRODUCTION
• Global economy:y– Over heating– Global economy recession – Escalation of energy and commodity prices– Excess liquidity
• National economy:• National economy:– Strong growth, but poor quality– Unemployment and poverty remain the biggest p y p y gg
problem– Excess liquidity
Investment handicap– Investment handicap

Global overheatingg
• China India Russia and emergingChina, India, Russia and emerging markets
• Growth pole has shifted to emerging• Growth pole has shifted to emerging economiesN th A i d EU l th• North America and EU, slower growth
• Commodity prices• Carbon emission

BRIC becomes the driving forcedriving force …
Global i b limbalances,
US trade deficits
persistspersists ..…

Stronger tradeStronger trade surpluses in China and commodity exportingcommodity exporting
countries …….

BOP surpluses reflected in thereflected in the
reserves
World Oil PriceWorld Oil Price
80
100
120
40
60
80
0
20
98 99 00 01 02 03 04 05 06 07 08
2/26
/199
2/26
/199
2/26
/200
2/26
/200
2/26
/200
2/26
/200
2/26
/200
2/26
/200
2/26
/200
2/26
/200
2/26
/200

Commodity prices followCommodity prices follow ……500
350
400
450
200
250
300
0
50
100
150
0
12/1
/00
4/1/
01
8/1/
01
12/1
/01
4/1/
02
8/1/
02
12/1
/02
4/1/
03
8/1/
03
12/1
/03
4/1/
04
8/1/
04
12/1
/04
4/1/
05
8/1/
05
12/1
/05
4/1/
06
8/1/
06
12/1
/06
4/1/
07
8/1/
07
12/1
/07
CPO Gold Tin Copper Alumunium Plyw ood Coffee Rice Tea

Consequently global i fl tiinflation soars ….

Short-term interest rate, high but tend to decline following the SPM woesdecline following the SPM woes ……

Property price and p y pcredit decelerate

Capital flows to emerging economies is constantly increasing, to find new y g,opportunities …

Emerging market: stock hikesg g

Emerging market: credit and interest rate

So far the story isSo far the story is ….
• BRIC is the engine of world’s economy, and thus g y,global recession will depend on these economies …….O hi d f ld’ l i i i i• One third of world’s population is improving, consequently causing price hikes ….
• The world is now overheating• The world is now overheating ….• Over liquidity stock market bubble and rapid
expansion in bankinge pa s o ba g• Interest rate declines amid inflation threat• Beware of hot money reversal …….y

Global Economy Recession
• US and UE soft landing economyUS Economy structural weakness
Recession
US Economy structural weakness- US economic growth deceleration for the
past 2 years ( from over 3.5% becoming less than 2%)- US trade deficit (US$ 850 miliar)- Investment growth for the past 2 years minus 5.1%- Energy Inflation threat - US Current Account deficit (6 % GDP)UE riel condition- Economic growth less than1% for the past 3 yearsg p y- Export competitive weakness
• Sub-prime mortgage crisis• US Investment bank financial loss• US Investment bank financial loss • World oil prices volatility


Dampak Sub Prime di USAPrime di USA
Fed sudah memotong 300 bps suku bunga dengan ekspektasi tambahan 50-100 bpstambahan 50 100 bps
Kongres AS telahKongres AS telah menyetujui paket stimulus fiskal sebesar USD 185 milyar

Economy Recession Risk
• Turbulence Effect
Recession Risk Turbulence Effect
• Fall of Global Stock Exchange Index• World Economy Growth Decelerationy
Transmission mechanism;- Trade; Increasing commodity prices g y p- Money market; asset bubble, hot money
• Central Bank in NA, Europe, and Japan pour liquidity aggressively excess liquidity
• Financial Crisis• Contagion Effect

Global IndexGlobal Index

Commodity prices tl koutlook ….

Growth weaken?

Down side prospectDown side prospect

Summing up ….g p
• Slowing down in advanced economies dueSlowing down in advanced economies due to commodity price hikes, drying up of credits, and low aggregate demandgg g
• Consequently, emerging market will slow down though still robustg
• Financial fragilities in Eastern Europe and Latin America
• Financial workout in advanced nations

Domestic EconomyDomestic Economy
• Growth without quality• Strong export but low output impact• Monetary matterMonetary matter• Excess liquidity

Growth, unemployment and poverty paradoxpoverty paradox ….
10.00%
12.00%
n,
an 18.00%18.50%19.00%
n
00%
6.00%
8.00%
tum
buha
gang
gura
16 00%16.50%17.00%17.50%
emis
kina
n
0 00%
2.00%
4.00%
Pert
Pen
14 50%15.00%15.50%16.00% K
e
0.00%2001 2002 2003 2004 2005 2006 Mar-07
14.50%
Pertumbuhan Pengangguran KemiskinanPertumbuhan Pengangguran Kemiskinan

The majority of unemployment isunemployment is amongst less educated
60%80%
100%
20%40%
60%
0%2004 2005 (Feb) 2005 (Nop) 2006 (Feb) 2006
(Agust) 2007 (Feb)
Under Primary School Primary School Junior High School Senior High School Diploma I/II Academy/Diploma III U i it
Sumber: Sakernas, Badan Pusat Statistik.
University

Disguised unemployment i lis more latent ……
Dalam Juta
Februari 2005
Februari 2006
Agustus 2006
Februari 2007
Dalam Juta
Berusaha Sendiri 17,48 18,30 19,50 18,67
Berusaha dibantu buruh tidak tetap 21,24 20,63 19,95 20,85
Berusaha dibantu buruh tetap 2,91 2,81 2,85 2,85
Buruh / Karyawan 25,74 25,97 26,82 26,87
Pekerja Bebas di Pertanian 4,95 5,89 5,54 6,28
Pekerja Bebas di Non Pertanian 4,09 4,24 4,62 4,27
Pekerja Tak Dibayar 18,54 17,33 16,17 17,80 j y , , , ,
TOTAL 94,95 95,18 95,46 97,58 BPS, 2007

GDP growth is improving …g g
GPDB
7.00%
2.00%3.00%4.00%5.00%6.00%
0.00%1.00%
Mar
-01
Jun-
01S
ep-0
1D
ec-0
1M
ar-0
2Ju
n-02
Sep
-02
Dec
-02
Mar
-03
Jun-
03S
ep-0
3D
ec-0
3M
ar-0
4Ju
n-04
Sep
-04
Dec
-04
Mar
-05
Jun-
05S
ep-0
5D
ec-0
5M
ar-0
6Ju
n-06
Sep
-06
Dec
-06
Mar
-07
Jun-
07S
ep-0
7

GDP by expenditure: weak domestic demandweak domestic demand but strong external demand
2001 2002 2003 2004 2005 2006 2007
Consumption Expenditures 3.9 4.7 4.6 4.9 4.3 3.9 4.9
Private Consumption Expenditure 3.5 3.8 3.9 5 4 3.2 4.9
General Government Consumption Expenditure 7.6 13 10 4 6.6 9.6 4.7
Investment 10.3 1.4 -0.8 15.7 8.4 1.4 8.4
Gross Domestic Fixed Capital Formation 6.5 4.7 0.6 14.7 10.8 2.9 7.9
Change In Stock 25.7 -68.7 251.5 -45.4 -25.7 -29.8 20.4
Statistical Discrepancies 30 1 213 8 357 3 132 6 50 7 456 4 1 7Statistical Discrepancies 30.1 213.8 -357.3 132.6 -50.7 456.4 1.7
Domestic Demand 5.4 3.9 3.3 7.4 5.3 3.3 5.8
Net Export -9.6 8.9 18.6 -19.5 13.6 15.6 12.3
Export of goods and services 0.6 -1.2 5.9 13.5 16.4 9.2 8.8
Less Import of goods and services 4.2 -4.2 1.6 26.7 17.1 7.6 8
GDP 3.8 4.4 4.7 5 5.7 5.5 6.3

Amongst domestic demand i t ti iprivate consumption is
more stable
30.00%35.00%
15.00%20.00%25.00%
0.00%5.00%
10.00%
2 2 3 3 4 4 5 5 6 6 7 7
-15.00%-10.00%-5.00%
Mar
-01
Sep
-01
Mar
-02
Sep
-02
Mar
-03
Sep
-03
Mar
-04
Sep
-04
Mar
-05
Sep
-05
Mar
-06
Sep
-06
Mar
-07
Sep
-07
G Kons Pem G Kons RT G Invest

Composition of iconsumption ..

Export failed to respond to i i iincreasing prices …

Export sector is among the slowest
2001 2002 2003 2004 2005 2006 20072001 2002 2003 2004 2005 2006 2007PERTANIAN 4.1 3.2 3.2 2.8 2.7 3.0 3.5PERTAMBANGAN & PENGGALIAN 0.3 1.0 -1.4 -4.5 3.1 2.2 3.9INDUSTRI PENGOLAHAN 3.3 5.3 5.3 6.4 4.6 4.6 5.1LISTRIK GAS DAN AIR BERSIH 7 9 8 9 4 9 5 3 6 3 5 9 10 3LISTRIK, GAS DAN AIR BERSIH 7.9 8.9 4.9 5.3 6.3 5.9 10.3BANGUNAN 4.6 5.5 6.1 7.5 7.4 9.0 8.2PERDAGANGAN, HOTEL, DAN RESTORAN 4.4 3.9 5.4 5.7 8.4 6.1 7.7PENGANGKUTAN DAN KOMUNIKASI 8.1 8.4 12.2 13.4 13.0 13.6 11.9KEUANGAN PERSEWAAN DAN JASA 6 6 6 4 7 2 7 7 6 8 5 6 7 9KEUANGAN, PERSEWAAN, DAN JASA 6.6 6.4 7.2 7.7 6.8 5.6 7.9JASA-JASA 3.2 3.8 4.4 5.4 5.0 6.2 6.5PRODUK DOMESTIK BRUTO 3.8 4.4 4.7 5.0 5.7 5.5 6.3
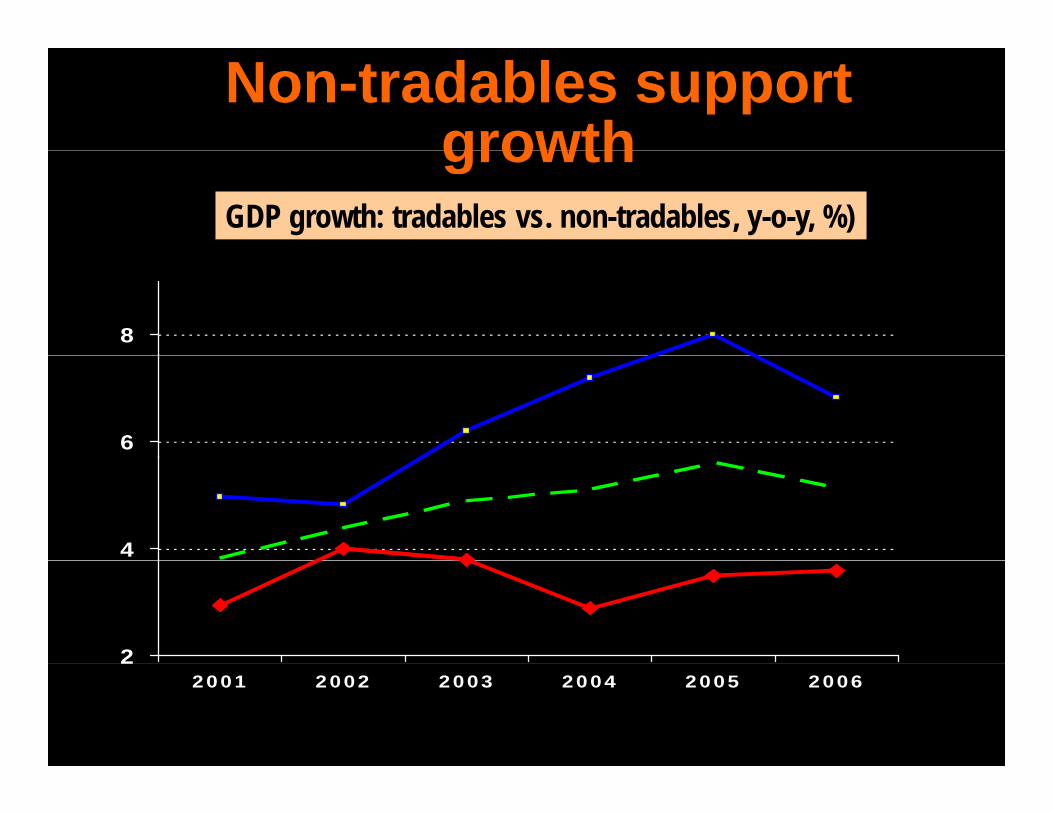
Non-tradables support growthgrowth
GDP growth: tradables vs. non-tradables, y-o-y, %)
8
6Non-tradable
4
GDP
2
Tradable2
2001 2002 2003 2004 2005 2006

Real investment is still weakReal investment is still weak ………
Investasi (net)
40
50
30
10
20
-10
0
-20

Composition of investment …..

Economy Recession: Dampak terhadap Pasar ModalDampak terhadap Pasar Modal
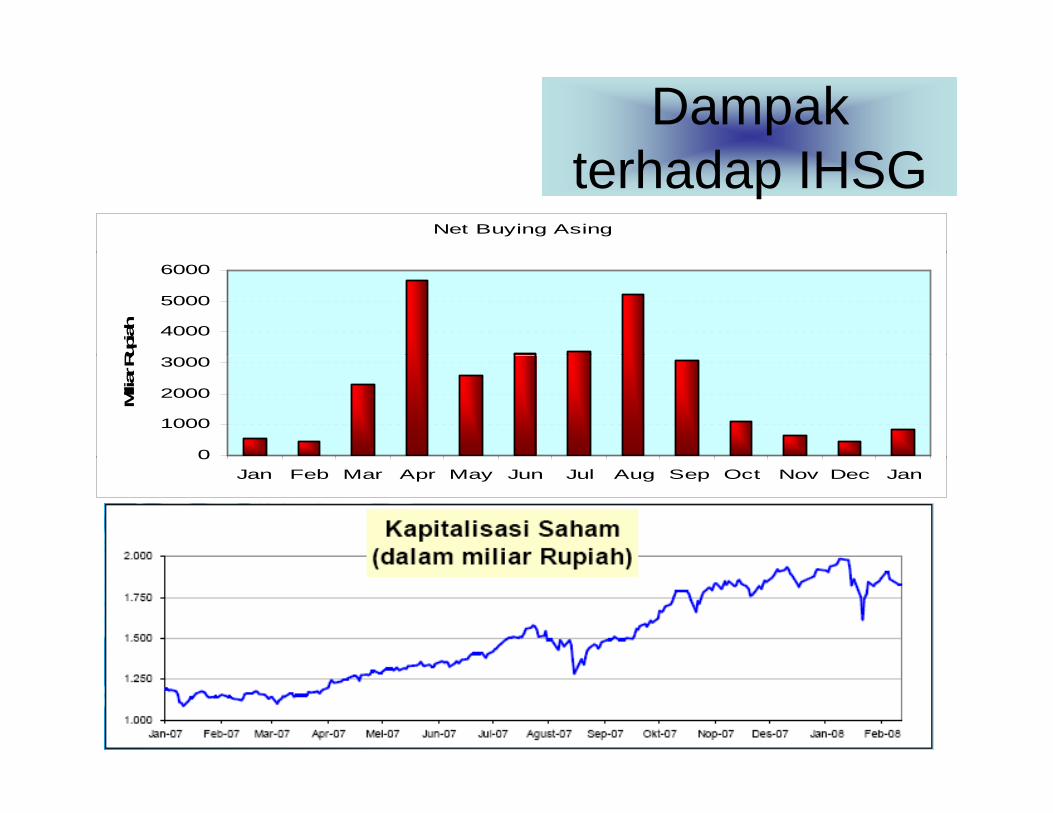
Dampak h d IHSGterhadap IHSG
Net Buying Asing
4000
5000
6000
Rupiah
0
1000
2000
3000
Miliar R
u
0Jan Feb Mar Apr May Jun Jul Aug Sep Oct Nov Dec Jan

Dampak Pada P SUN (1)Pasar SUN (1)

Dampak Pada Pasar S ( )
Posisi Net Buying Asing atas Obligasi Negara
SUN (2)
Posisi Net Buying Asing atas Obligasi Negara
1215415000
32315565
7702 7526
5000
10000
32311294 1474 918
0
5000
-1697-3354
-6361-4209-5000
Jan Feb Mar Apr May Jun Jul Aug Sep Oct Nov Dec Jan
-10000

Monetary matters

Strong export coupled with hot money …
P i d 2004 2005 2006 2007Q1 2007Q2Periode 2004 2005 2006 2007Q1 2007Q2Current Acc 1,563 277 9,936 3,044 2,557 Capital Acc 1,851 346 2,560 2,269 2,125
FDI (1,512) 5,272 2,876 88 587 Portfolio 4,409 4,190 4,126 2,764 4,762
BOP 309 445 14 510 4 415 3 637 BOP 309 445 14,510 4,415 3,637 Error & Omission (3,105) (179) 2,011 (898) (1,045)

The proceed is l t daccumulated
40000
50000
60000
20000
30000
40000
0
10000
20000
0
Dec-01
Jun-0
2Dec-0
2Ju
n-03
Dec-03
Jun-0
4Dec-0
4Ju
n-05
Dec-05
Jun-0
6Dec-0
6Ju
n-07
Dec-07

Inflation is under control
15
20
10
15
0
5
-5
0
Feb-03
Jun-0
3Oct-
03Feb
-04Ju
n-04
Oct-04
Feb-05
Jun-0
5Oct-
05Feb
-06Ju
n-06
Oct-06
Feb-07
Jun-0
7Oct-
07Feb
-08
yoy mom

Increasing F d P iFood Prices
10000
12000
14000
6000
8000
Rp p
er k
g
0
2000
4000
R
0Des-06 Jun-07 Sep-07 Okt-07 Jan-08
Beras IR4 Terigu Gula Pasir M.Goreng Telur

Independent pmonetary stance
15
20
5
10
0
5
01 01 02 02 03 03 04 04 05 05 06 06 07 07 08
Jan-0
1Ju
l-01
Jan-0
2Ju
l-02
Jan-0
3Ju
l-03
Jan-0
4Ju
l-04
Jan-0
5Ju
l-05
Jan-0
6Ju
l-06
Jan-0
7Ju
l-07
Jan-0
8
SB-SB1 FFR diff

Deposit rate follows policy rate closely
15
20
5
10
0
5
01 02 02 03 03 04 04 05 05 06 06 07 07
Dec
-0
Jun-
0
Dec
-0
Jun-
0
Dec
-0
Jun-
0
Dec
-0
Jun-
0
Dec
-0
Jun-
0
Dec
-0
Jun-
0
Dec
-0
SB Dep-1 SB-SBI 1

Credit rate is relatively sluggishCredit rate is relatively sluggish
20
15
20
5
10
0
01 02 02 03 03 04 04 05 05 06 06 07 07
Dec
-
Jun-
Dec
-
Jun-
Dec
-
Jun-
Dec
-
Jun-
Dec
-
Jun-
Dec
-
Jun-
Dec
-
SB-KMK SB-Dep 1 Spread

More stable exchange rate ….g
10000
1200014000
40006000
8000
02000
4000
00 00 01 01 02 02 03 03 04 04 05 05 06 06 07 07 08
3/3/
200
9/3/
200
3/3/
200
9/3/
200
3/3/
200
9/3/
200
3/3/
200
9/3/
200
3/3/
200
9/3/
200
3/3/
200
9/3/
200
3/3/
200
9/3/
200
3/3/
200
9/3/
200
3/3/
200

Lesser volatilityLesser volatility …..
Year CVYear CV2000 9.01%2001 8 28%2001 8.28%2002 5.88%2003 2.81%2004 3.78%2005 3.60%2006 1.80%2007 1.77%

Lesser volatility due toLesser volatility due to …..
• More favorable external conditionMore favorable external condition• More active approach from the central
bank:bank:– Inflation targeting
M t d t d i f ti– More accurate data and information– Direct scrutiny to players (iron hands)

The dollar zone
160180
100120140160
20406080
020
/200
0
/200
0
/200
1
/200
1
/200
2
/200
2
/200
3
/200
3
/200
4
/200
4
/200
5
/200
5
/200
6
/200
6
/200
7
/200
7
/200
8
1/4/
7/4/
1/4/
7/4/
1/4/
7/4/
1/4/
7/4/
1/4/
7/4/
1/4/
7/4/
1/4/
7/4/
1/4/
7/4/
1/4/
IDR/USD EUR/USD JPY/USD

The Stock VolatilityThe Stock Volatility

Banking sectorBanking sector

Decoupling of financial sector …
• Banking sector:• Banking sector:– Excess liquidity
SBI l t– SBI placement– Excess supply of credit
• Situation will be better in 2008:– Higher margin– Higher credit growth
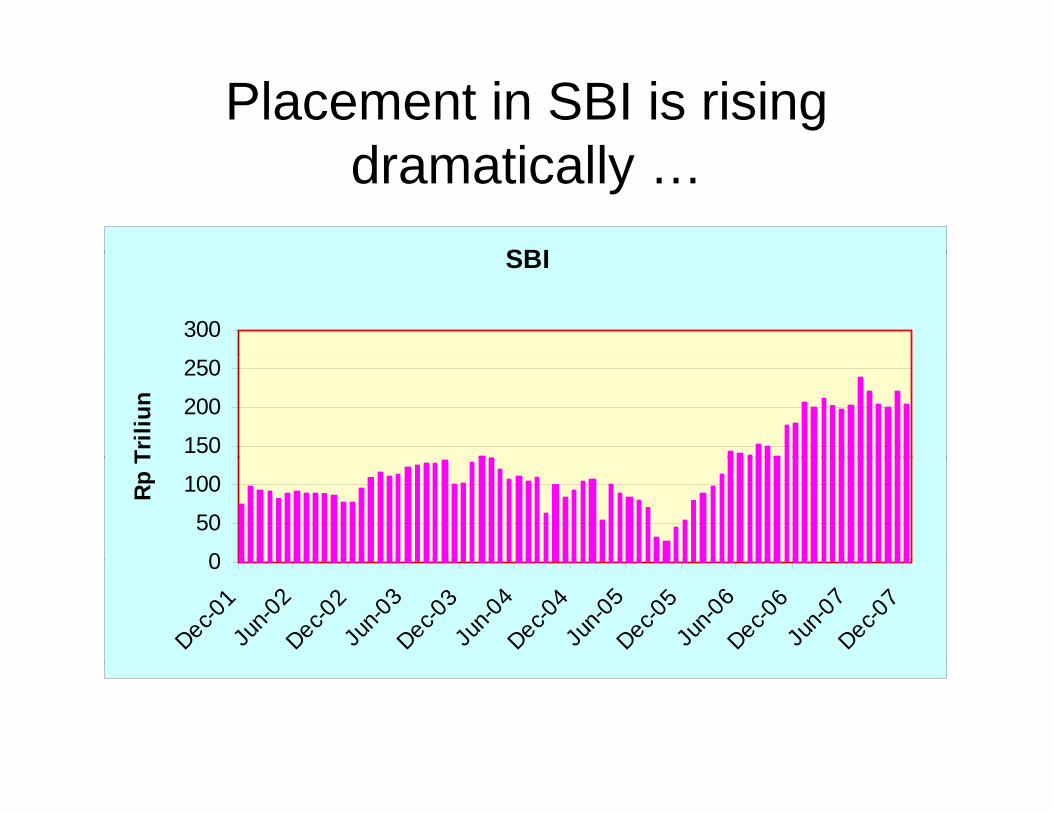
Placement in SBI is rising d ti lldramatically …
SBISBI
300
150
200
250
Trili
un
0
50
100Rp T
0
Dec-01
Jun-0
2Dec-0
2Ju
n-03
Dec-03
Jun-0
4Dec-0
4Ju
n-05
Dec-05
Jun-0
6Dec-0
6Ju
n-07
Dec-07

Mainly due weak demand for creditMainly due weak demand for credit….
Hasil Estimasi Model Permintaan dan Penawaran Kredit Nasional
543893488918
600000
296237
357084
470784488918
443856
233552
326718
438286365019
419754
300000
400000
500000
r Rp
233552
227643
100000
200000
300000
Mily
a
02001 2002 2003 2004 2005 2006
Tahun
Estimated Supply Estimated Demand Actual

Assets credit and depositsAssets, credit, and deposits …
2,000,000
2,500,000
1,000,000
1,500,000
0
500,000
2 3 4 5 6 07 7 7 7 7 07 07 7 7 7 07 7
200
200
200
200
Dec
-0
Jan-
0
Feb-
0
Mar
-0
Apr
-0
May
-0
Jun-
0
Jul-0
Aug
-0
Sep
-0
Oct
-0
Nov
- 0
Dec
-0
A t K dit DPKAssets Kredit DPK

Intermediation is improving, disintermediation will be resolved (but slow?)( )
LDRLDR
7080
40506070
%
0102030
0
Dec-04
Mar-05
Jun-0
5Sep
-05Dec-0
5Mar-
06Ju
n-06
Sep-06
Dec-06
Mar-07
Jun-0
7Sep
-07Dec-0
7

A more balanced credit growthA more balanced credit growth ….
Credit Growth 2000 2001 2002 2003 2004 2005 2006 2007Growth 2000 2001 2002 2003 2004 2005 2006 2007
Investasi 13.15% 12.55% 12.87% 13.74% 23.91% 13.35% 12.39% 23.44%
KMK 14.14% 7.37% 15.36% 14.25% 23.39% 22.78% 17.58% 28.34%
Konsumsi 66.46% 45.75% 36.57% 40.42% 34.70% 36.73% 9.39% 24.88%

Expensive fund still dominates …
120%
80%
100%
120%
60%
80%
20%
40%
0%2002 2003 2004 2005 Dec-06 Dec-07
Giro Deposito Tabungan

Lower currency risk …..
140%
160%
100%
120%
60%
80%%
0%
20%
40%
Currency Mismatch
0%2002 2003 2004 2005 Dec-06 Jan-07 Feb-07 Mar-07 Apr-07 May-07 Jun-07 Jul-07 Aug-07 Sep-07
Periode

Ample capital, decreasing NPLAmple capital, decreasing NPL
23 8
2121.5
2222.5
67
19 520
20.521
345
1818.5
1919.5
123
17.52002 2003 2004 2005 Dec-06 Sep-07 Des-07
0
CAR NPL

Stronger profit except 2005Stronger profit, except 2005 …..
50,000
60,000
30,000
40,000
10,000
20,000
02002 2003 2004 2005 Dec-06 Dec-07
Laba tahun berjalan Laba setelah pajak

Profit and efficiencyProfit and efficiency …..4 100
33.5
708090
1 52
2.5
405060
0.51
1.5
102030
02002 2003 2004 2005 Dec-06 Dec-07
0
ROA BOPO

Profit and marginProfit and margin ….
33.5
4
5
6
7
22.5
3
3
4
5
0.51
1.5
1
2
3
02002 2003 2004 2005 Dec-06 Dec-07
0
ROA NIM

Competitiveness IndicatorCompetitiveness Indicator
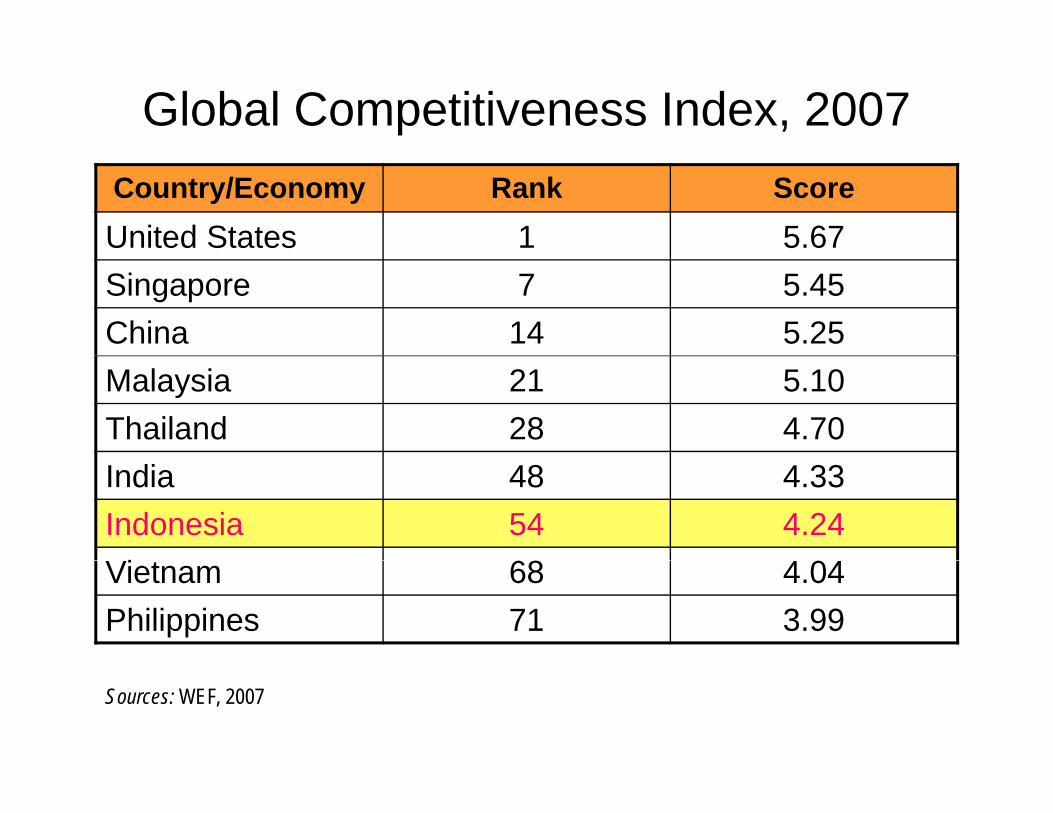
Global Competitiveness Index, 2007Country/Economy Rank ScoreUnited States 1 5.67Singapore 7 5.45China 14 5.25Malaysia 21 5.10Thailand 28 4.70India 48 4.33Indonesia 54 4.24Vi 68 4 04Vietnam 68 4.04Philippines 71 3.99
Sources: WEF, 2007

Peringkat daya saing (overall) di berbagai negaraCountry 2003 2004 2005 2006 2007Argentina 50 50 49 47 51
Brazil 44 44 42 44 49
China 27 22 29 18 15China 27 22 29 18
Hong Kong 10 6 2 2 3
India 42 30 33 27 27
I d i 54Indonesia 49 49 50 52 54
Korea 32 31 27 32 29
Malaysia 21 16 26 22 23
Philippines 41 43 40 42 45
Singapore 4 2 3 3 2
Taiwan 17 12 11 17 18Taiwan 17 12 11 17
Thailand 28 26 25 29 33
Venezuela 51 51 51 53 55
Source: International Institute for Management Development, World Competitiveness Yearbook, various years.
# Countries 51 51 51 53 55

Downward evaluation of IndonesiaPromising countries for overseas business operation
over the medium term (next 3 years or so)
Rank 1997 2000 2001 2002 2003 2004 2005Rank 1997 2000 2001 2002 2003 2004 2005
1st China China China China China China China
2nd USA USA USA Thiland Thailand Thailand India
3rd Indonesia Thailand Thailand USA USA India Thailand
4th Thailand Indonesia Indonesia Indonesia Viet Nam Viet Nam Viet Nam
5th India Malaysia India Viet Nam India USA USA
6th Vet Nam Taiwan Viet Nam India Indonesia Russia Russia
7th Philippines India Taiwan Korea Korea Indonesia Korea7th Philippines India Taiwan Korea Korea Indonesia Korea
8th Malaysia Viet Nam Korea Taiwan Taiwan Korea Indonesia
9th Brazil Korea Malaysia Malaysia Malaysia Taiwan Brazil
Source: Jetro, Based on JBIC
10th Taiwan Philippines Singapore Brazil Russia Malaysia Taiwan

Peringkat kemudahan berbisnis, 2007g ,
Description Indonesia Malaysia Philippines Singapore Thailand VietnamDescription Indonesia Malaysia Philippines Singapore Thailand Vietnam
Ease of doing business 123 24 133 1 15 91
Starting business 168 74 144 9 36 97
Dealing with licenses 99 105 77 5 12 63
Employing workers 153 43 122 1 49 84
Registering property 121 67 86 13 20 38Registering property 121 67 86 13 20 38
Getting credit 68 3 97 7 36 48
Protecting investors 51 4 141 2 33 165
Paying taxes 110 56 126 2 89 128
Trading across borders 41 21 57 1 50 63
Enforcing contracts 141 63 113 4 26 40Enforcing contracts 141 63 113 4 26 40
Closing business 136 54 147 2 44 121
Source: World Bank, Doing Business in 2007.

The most problematic factors for doing business in Indonesia 2007doing business in Indonesia, 2007
Problematic Factors
21.8
0.5
T R tPoor work ethic in National Labor Force
Crime and Theft
4.23.7
2.22
CorruptionForeign Currency RegulationsGovernment Instability/Coups
Tax Rates
8 58
5.65.5
Restrictive Labor RegulationsTax Regulations
Inadequately Educated Work ForceInflation
p
16.110.810.7
8.5
Inefficient Government BureaucracyAccess to Financing
Policy InstabilityRestrictive Labor Regulations
Source: WEF (2007) based on executive opinion survey.
20.5Inadequate Supply of Infrastructure

Paying taxes: Indonesia in comparison, 2007
Region/ E
Payments ( b )
Time (h )
Total tax payable(% fit)Economy (number) (hours) (% gross profit)
Indonesia 51 266 38.8Singapore 5 49 23.2g pMalaysia 35 166 36.0Thailand 35 264 37.7L PDR 34 672 35 5Lao, PDR 34 672 35.5Philippines 47 195 42.8Timor Leste 15 640 28.3Vietnam 32 1,050 41.1
Source: World Bank 2007Source: World Bank, 2007.

Paying Taxes Indicators Over the Past 3 Years

Level of Bureaucracy in Asia
Singapore 2.2
Levels of Red Tape (0= no red
Hong Kong 3.1Japan 4.6S K 4 9tape, 10= high
levels of red tape)
S Korea 4.9Taiwan 5.5Thailand 5.6Philippines 6.2Malaysia 6.4Chi 7 3China 7.3Vietnam 7.6Indonesia 8.2India 8.9
Source: PERC, June 2005

Summing up ….
• High growth but low quality ….g g q y• Poverty and unemployment remain the
mayor problemmayor problem• Competitiveness is low
St BOP d t t d l d• Strong BOP due to trade surplus and hot money creating excess liquidity
• Capital market is bubbling, and can be counter productive
• The Dutch disease

APBN-P 2008
APBN -P 2008 (Triliun) Keterangan APBN APBN-P Selisih Pendapatan Negara 781.3 823.3 42B l j P i t h 854 6 910 6 56Belanja Pemerintah 854.6 910.6 56Belanja Pusat 573.4 626 52.6Subsisi BBM 45.8 102.1 56.3Subsidi Listrik 29.8 42.6 12.8Pangan PSH 7.2 19.8 12.6B l j k/l 311 9 274 8 37 1Belanja k/l 311.9 274.8 37.1Transfer ke Daerah 281.2 284.6 3.4Defisit 73.3 87.3 14Persentase Defisit 1.7 2 0.3

Projection
Indicators 2008 2009 2010 RangeGDP growth (%) 6.3 6.5 6.5 0.2SBI rate (%) 7.5 6.0 6.0 0.5Inflation 6.0 5.5 5.0 1.0E change rate 9000 9200 9200 500Exchange rate 9000 9200 9200 500ICP (USD/barrel) 95 85 80 10Kemiskinan 16.0 15.0 13.0 0.5Pengangguran 8 5 8 0 7 0 0 5Pengangguran 8.5 8.0 7.0 0.5

Related Documents