Life-Cycle Analysis of Greenhouse Gas Emissions for Hydrogen Fuel Production in the United States from LNG and Coal DOE/NETL-2006/1227 November 2005

Welcome message from author
This document is posted to help you gain knowledge. Please leave a comment to let me know what you think about it! Share it to your friends and learn new things together.
Transcript

Life-Cycle Analysis of Greenhouse Gas Emissions for Hydrogen Fuel Production in the United States from LNG and Coal
DOE/NETL-2006/1227
November 2005

Disclaimer
This report was prepared as an account of work sponsored by an agency of the United States Government. Neither the United States Government nor any agency thereof, nor any of their employees, makes any warranty, express or implied, or assumes any legal liability or responsibility for the accuracy, completeness, or usefulness of any information, apparatus, product, or process disclosed, or represents that its use would not infringe privately owned rights. Reference therein to any specific commercial product, process, or service by trade name, trademark, manufacturer, or otherwise does not necessarily constitute or imply its endorsement, recommendation, or favoring by the United States Government or any agency thereof. The views and opinions of authors expressed therein do not necessarily state or reflect those of the United States Government or any agency thereof.
Life-Cycle Analysis of Greenhouse Gas Emissions for Hydrogen Fuel Production in the United States from LNG and Coal
DOE/NETL-2006/1227
November 2005
NETL Contact Robert Vagnetti
Analyst Office of Systems, Analyses and Planning
Prepared by:
John Ruether (deceased) National Energy Technology Laboratory
Massood Ramezan
Science Applications International Corporation
Eric Grol Science Applications International Corporation
National Energy Technology Laboratory www.netl.doe.gov

This paper, “Life-Cycle Analysis of Greenhouse Gas Emissions for Hydrogen Fuel Production in the United States from LNG and Coal,” was first presented at the Second International Conference on Clean Coal Technologies for our Future, Sardinia, Italy, 10-12 May 2005 by John Ruether (deceased). This abridged document provides the salient findings of the original analysis and incorporates comments received from technical review. For information regarding the detailed analyses please contact Robert Vagnetti at [email protected].
DOE/NETL-2006/1227
1
1. Summary Analysis is developed of the life-cycle emissions of greenhouse gases released during the production of hydrogen in the United States from liquefied natural gas (LNG) and coal. For production of hydrogen from LNG, greenhouse gas (GHG) emissions from all process steps are considered including natural gas production, liquefaction, shipping by tanker, regasification, pipeline transport, and ultimately conversion to hydrogen via steam methane reforming (SMR). In the analysis, GHG emissions are computed for both construction of needed capital facilities and operations over the expected lifetime of the equipment. Life-cycle emissions of GHG for production of hydrogen from LNG were developed using carbon capture and sequestration (CCS) methods and compared to emissions that do not employ carbon capture. For 92% CO2 capture considered at the SMR plant, the GHG burden is reduced by 64%. Compared to hydrogen production from LNG, fewer steps are needed to recover coal and convert it to hydrogen. Methane emissions from mining are considered for two mining methods: surface and deep mining. Coal-mine methane (CMM) mitigation methods are evaluated for reducing methane emissions both by capture and use of concentrated methane, as well as by oxidation of methane in mine ventilation air. Coal is converted to hydrogen via gasification. As with hydrogen from LNG, gasification plants with and without CCS were considered. CMM mitigation can reduce methane emissions from deep-mined coal by about 61 percent (US EPA, 1999a). Technology is not available for reducing CMM from surface mining, but the lower rank coals produced via surface mining are less gassy than those deep mined, so methane emissions are lowest with use of surface-mined coals. The coal type and processing options that yield the largest GHG burden are deep-mined coal without CMM mitigation or CCS in the gasification step. However, employing the use of both CMM mitigation and CCS with deep-mined coals reduces the GHG burden by about 82%. The lowest GHG burden is achieved with surface-mined coal and use of CCS (reduction of 84%). The lower GHG burden achievable with use of coal compared to LNG is explained by the greater number of process steps employed in using LNG, several of which have significant emission rates of GHG. Application of CCS in the final step where natural gas or coal is converted to hydrogen has a larger beneficial effect with coal than with LNG. Furthermore, if emissions are expressed per unit of hydrogen product (kg CO2e/kg H2), the results show that uncontrolled GHG emissions are 12.4 and 8.9 kg CO2e/kg H2 for underground mined coal and LNG, respectively. However, when CCS and CMM mitigation (for coal) measures are employed, the figures are reduced to 1.9 and 4.7 kg CO2e/kg H2 for surface mined coal and LNG, respectively.
DOE/NETL-2006/1227
2
Finally, it is shown that when the technologies CMM mitigation and CCS are used, hydrogen can be produced from both LNG and coal at a fraction of the GHG burden of an energy-equivalent amount of petroleum-derived gasoline.
2. Introduction The world may be approaching an historic turning point in its use of energy to power its light-duty vehicle fleets. Having depended almost exclusively on petroleum products—gasoline and diesel—since the beginning of the auto age in the early 20th century, governments and industry in virtually all the Organization for Economic Cooperation and Development (OECD) countries are working to develop the technology needed to power light-duty vehicles with fuel cells that run on hydrogen. Three concerns are the principal drivers for these activities:
• National security: concern that international trade in petroleum could be interrupted by terrorists or governments hostile to Western-style democracies.
• Global warming due to the buildup of greenhouse gases (GHG) in the atmosphere, principally carbon dioxide.
• Price and availability of petroleum looking toward the future: large oil price increases of the last several years plus rapidly expanding oil consumption in Third World countries has reignited concerns about “Oil Peaking” (Bakhtiari, 2004).
In the United States, President Bush has described a vision of fuel cell vehicles (FCV) becoming the dominant technology for the light-duty fleet by 2040 (Bush, 2003). This would reduce petroleum consumption by 11 million barrels/day. If the hydrogen used to power the fleet were provided without carbon emissions, it would reduce greenhouse gas emissions by 1,500 million Mt (metric tonnes) of CO2 per year. Internationally, 16 countries are participating in the International Partnership for the Hydrogen Economy (IPHE, 2005). This paper develops estimates of life-cycle GHG emissions for producing hydrogen from natural gas and coal. The technology for doing so is well-developed. World production of hydrogen is currently about 38 million tonnes per year. Over 90% of it is used, in descending order, for ammonia production, petroleum refining, and methanol production (Ramage et al., 2004). Virtually all the hydrogen for these uses is derived from reforming natural gas or gasification of a heavy fossil-fuel feedstock. Natural gas would seem at first to be the better choice of feedstock if limiting CO2 emissions is an important consideration. Its atomic ratio of hydrogen/carbon is about five times that of coal. Moreover, it enjoys large capital and operating cost advantages compared to coal because it’s a gas instead of a solid. In fact, the attractiveness of natural gas as an energy source has led to large increases in its use –and price—in recent years in the United States. From 2002 to 2004 wellhead prices roughly doubled, and the Energy Information Agency of the U.S. Department of Energy now projects that future production of natural gas from the lower 48 states and Canada will see marginal growth (EIA, 2005). For these reasons, the present study assumes that natural gas that might be used to provide large additional quantities of hydrogen would be imported as liquefied natural gas, LNG.

DOE/NETL-2006/1227
3
3. Computing Life-Cycle GHG Emissions Life-cycle environmental analysis (LCA) develops estimates of the total environmental burden that a particular approach to providing a good or service would entail over the useful life of the major equipment used to generate that good or service. Computing LCA emission estimates for an industrial process has two major parts. One consists of estimating emissions that occur just once in the life cycle of the project, the construction and demolition of equipment devoted to the project. Typically emissions for construction of capital facilities is the subject of careful analysis, while demolition at the end of project life is assigned a small fraction of emissions for construction (usually 10%) (Gorokhov et al., 2002). The second major part of LCA is to compute emissions during the operation of the equipment over its useful life. Life-cycle emissions per unit of energy throughput (g CO2e/MJ) is obtained by summing the two components after apportioning emissions for construction and demolition over all product produced during the project life. A full LCA analysis will also include other parts, such as fuel transportation and losses due to process inefficiencies. Two very different approaches have been developed for estimating life-cycle emissions. The better-known approach is process-based. For emissions due to plant construction, total resource requirements for principal building materials such as cement and steel are estimated for all buildings, equipment, and supplies used in constructing capital facilities. Then GHG emission for the manufacture, transport to the building site, and construction of the plant facilities from the components is computed (SETAC, 1998). The second approach is an outgrowth of economic input-output analysis. The dollar values expended in particular economic sectors in the construction of plant facilities are summed. Appropriate multipliers are used to estimate the effect of these expenditures on economic activity throughout the economy. Tabulations of resource requirements and pollutant emissions per dollar of economic activity in each sector of the economy are used to estimate total environmental burden. In the United States, software describing environmental burdens generated by sectors of the U.S. economy has been developed by workers at Carnegie Mellon University (CMU) based on data for nearly 500 economic sectors published by the federal Bureau of Economic Analysis. The software, available on the Web, is called EIOLCA (CMU, 2002). In previous work, we have compared the two methods for estimating life-cycle emissions of GHG for IGCC power plants with and without carbon capture and storage (CCS) (Ruether et al., 2004). For emissions due to plant construction, it was found that EIOLCA yielded results about five to seven times larger than those computed using the SETAC method. The difference was explained as being due to the greater inclusiveness of all activities involved in plant construction afforded by the EIOLCA approach. For emissions due to operation of the plants, the two methods agreed closely. It was shown that for IGCC plants without CCS, GHG emissions due to plant construction represented less than 1% of total life-cycle emissions. When CCS was used to capture 90% of plant CO2 emissions, however, GHG emissions due to plant construction represented upwards of 4% of the total.
DOE/NETL-2006/1227
4
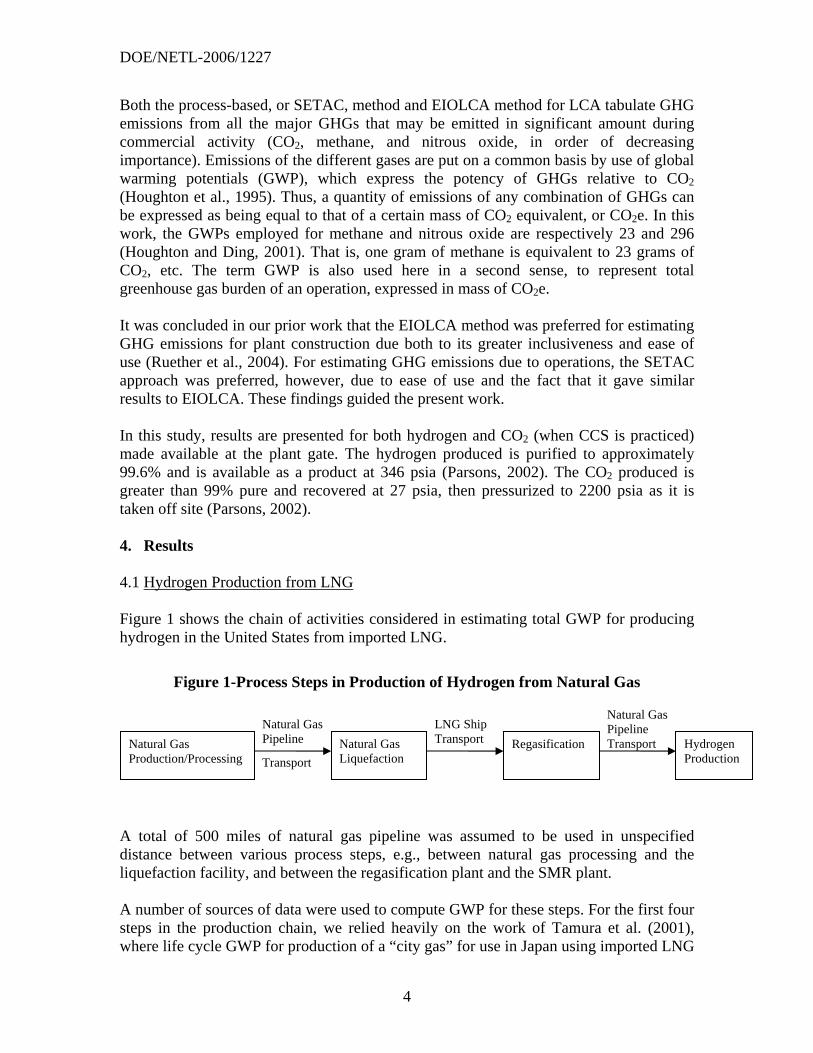
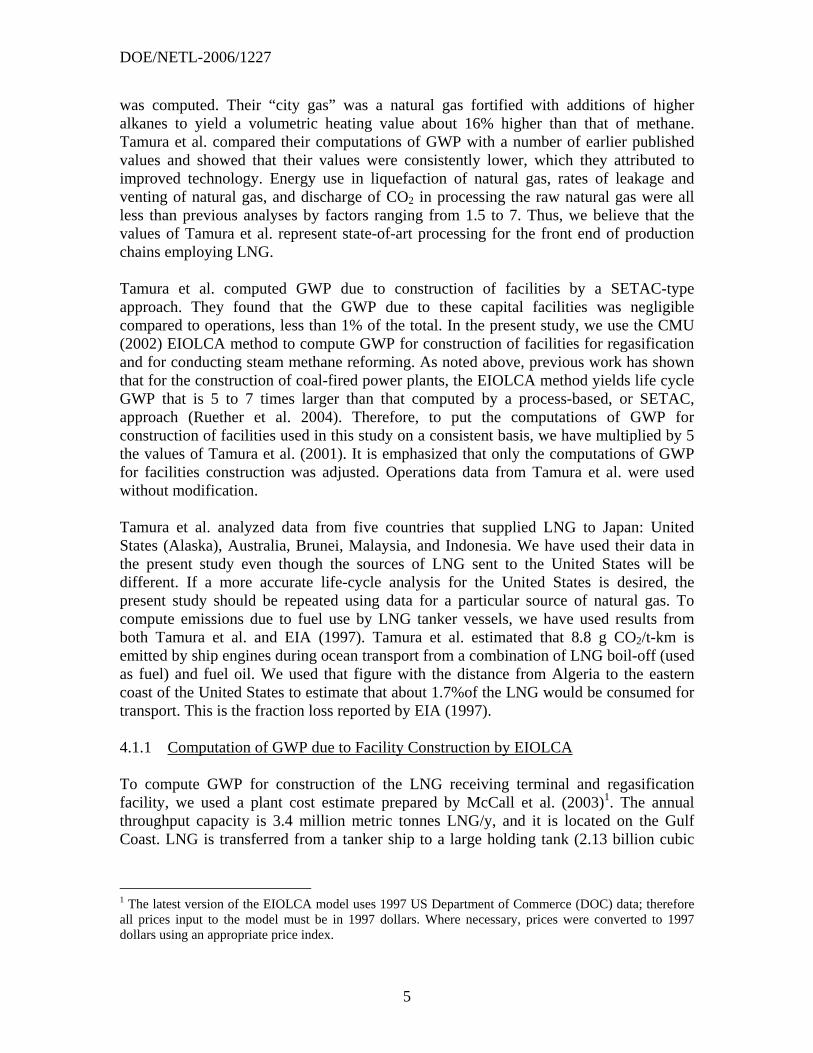
Both the process-based, or SETAC, method and EIOLCA method for LCA tabulate GHG emissions from all the major GHGs that may be emitted in significant amount during commercial activity (CO2, methane, and nitrous oxide, in order of decreasing importance). Emissions of the different gases are put on a common basis by use of global warming potentials (GWP), which express the potency of GHGs relative to CO2 (Houghton et al., 1995). Thus, a quantity of emissions of any combination of GHGs can be expressed as being equal to that of a certain mass of CO2 equivalent, or CO2e. In this work, the GWPs employed for methane and nitrous oxide are respectively 23 and 296 (Houghton and Ding, 2001). That is, one gram of methane is equivalent to 23 grams of CO2, etc. The term GWP is also used here in a second sense, to represent total greenhouse gas burden of an operation, expressed in mass of CO2e. It was concluded in our prior work that the EIOLCA method was preferred for estimating GHG emissions for plant construction due both to its greater inclusiveness and ease of use (Ruether et al., 2004). For estimating GHG emissions due to operations, the SETAC approach was preferred, however, due to ease of use and the fact that it gave similar results to EIOLCA. These findings guided the present work. In this study, results are presented for both hydrogen and CO2 (when CCS is practiced) made available at the plant gate. The hydrogen produced is purified to approximately 99.6% and is available as a product at 346 psia (Parsons, 2002). The CO2 produced is greater than 99% pure and recovered at 27 psia, then pressurized to 2200 psia as it is taken off site (Parsons, 2002). 4. Results 4.1 Hydrogen Production from LNG Figure 1 shows the chain of activities considered in estimating total GWP for producing hydrogen in the United States from imported LNG.
Figure 1-Process Steps in Production of Hydrogen from Natural Gas
A total of 500 miles of natural gas pipeline was assumed to be used in unspecified distance between various process steps, e.g., between natural gas processing and the liquefaction facility, and between the regasification plant and the SMR plant. A number of sources of data were used to compute GWP for these steps. For the first four steps in the production chain, we relied heavily on the work of Tamura et al. (2001), where life cycle GWP for production of a “city gas” for use in Japan using imported LNG
Natural Gas Pipeline
Transport
LNG Ship Transport
Natural Gas Pipeline Transport Natural Gas
Production/Processing Natural Gas Liquefaction
Regasification Hydrogen Production
DOE/NETL-2006/1227
5
was computed. Their “city gas” was a natural gas fortified with additions of higher alkanes to yield a volumetric heating value about 16% higher than that of methane. Tamura et al. compared their computations of GWP with a number of earlier published values and showed that their values were consistently lower, which they attributed to improved technology. Energy use in liquefaction of natural gas, rates of leakage and venting of natural gas, and discharge of CO2 in processing the raw natural gas were all less than previous analyses by factors ranging from 1.5 to 7. Thus, we believe that the values of Tamura et al. represent state-of-art processing for the front end of production chains employing LNG. Tamura et al. computed GWP due to construction of facilities by a SETAC-type approach. They found that the GWP due to these capital facilities was negligible compared to operations, less than 1% of the total. In the present study, we use the CMU (2002) EIOLCA method to compute GWP for construction of facilities for regasification and for conducting steam methane reforming. As noted above, previous work has shown that for the construction of coal-fired power plants, the EIOLCA method yields life cycle GWP that is 5 to 7 times larger than that computed by a process-based, or SETAC, approach (Ruether et al. 2004). Therefore, to put the computations of GWP for construction of facilities used in this study on a consistent basis, we have multiplied by 5 the values of Tamura et al. (2001). It is emphasized that only the computations of GWP for facilities construction was adjusted. Operations data from Tamura et al. were used without modification. Tamura et al. analyzed data from five countries that supplied LNG to Japan: United States (Alaska), Australia, Brunei, Malaysia, and Indonesia. We have used their data in the present study even though the sources of LNG sent to the United States will be different. If a more accurate life-cycle analysis for the United States is desired, the present study should be repeated using data for a particular source of natural gas. To compute emissions due to fuel use by LNG tanker vessels, we have used results from both Tamura et al. and EIA (1997). Tamura et al. estimated that 8.8 g CO2/t-km is emitted by ship engines during ocean transport from a combination of LNG boil-off (used as fuel) and fuel oil. We used that figure with the distance from Algeria to the eastern coast of the United States to estimate that about 1.7%of the LNG would be consumed for transport. This is the fraction loss reported by EIA (1997). 4.1.1 Computation of GWP due to Facility Construction by EIOLCA To compute GWP for construction of the LNG receiving terminal and regasification facility, we used a plant cost estimate prepared by McCall et al. (2003)1. The annual throughput capacity is 3.4 million metric tonnes LNG/y, and it is located on the Gulf Coast. LNG is transferred from a tanker ship to a large holding tank (2.13 billion cubic
1 The latest version of the EIOLCA model uses 1997 US Department of Commerce (DOC) data; therefore all prices input to the model must be in 1997 dollars. Where necessary, prices were converted to 1997 dollars using an appropriate price index.
DOE/NETL-2006/1227
6
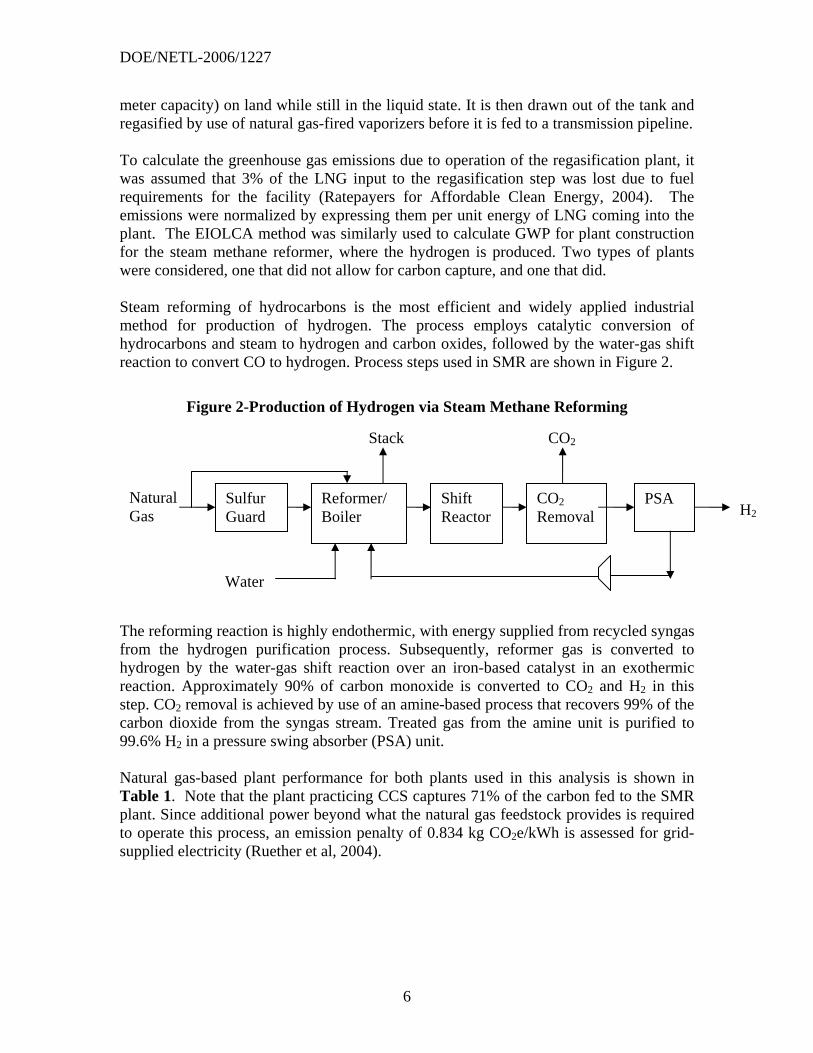
meter capacity) on land while still in the liquid state. It is then drawn out of the tank and regasified by use of natural gas-fired vaporizers before it is fed to a transmission pipeline. To calculate the greenhouse gas emissions due to operation of the regasification plant, it was assumed that 3% of the LNG input to the regasification step was lost due to fuel requirements for the facility (Ratepayers for Affordable Clean Energy, 2004). The emissions were normalized by expressing them per unit energy of LNG coming into the plant. The EIOLCA method was similarly used to calculate GWP for plant construction for the steam methane reformer, where the hydrogen is produced. Two types of plants were considered, one that did not allow for carbon capture, and one that did. Steam reforming of hydrocarbons is the most efficient and widely applied industrial method for production of hydrogen. The process employs catalytic conversion of hydrocarbons and steam to hydrogen and carbon oxides, followed by the water-gas shift reaction to convert CO to hydrogen. Process steps used in SMR are shown in Figure 2.
Figure 2-Production of Hydrogen via Steam Methane Reforming
The reforming reaction is highly endothermic, with energy supplied from recycled syngas from the hydrogen purification process. Subsequently, reformer gas is converted to hydrogen by the water-gas shift reaction over an iron-based catalyst in an exothermic reaction. Approximately 90% of carbon monoxide is converted to CO2 and H2 in this step. CO2 removal is achieved by use of an amine-based process that recovers 99% of the carbon dioxide from the syngas stream. Treated gas from the amine unit is purified to 99.6% H2 in a pressure swing absorber (PSA) unit. Natural gas-based plant performance for both plants used in this analysis is shown in Table 1. Note that the plant practicing CCS captures 71% of the carbon fed to the SMR plant. Since additional power beyond what the natural gas feedstock provides is required to operate this process, an emission penalty of 0.834 kg CO2e/kWh is assessed for grid-supplied electricity (Ruether et al, 2004).
Natural Gas
Sulfur Guard
Reformer/ Boiler
Shift Reactor
CO2 Removal
PSA H2
Stack CO2
Water

DOE/NETL-2006/1227
7
Table 1-Steam Methane Reformer Plants (Parsons, 2002) Activity CO2 Capture Case No CO2 Capture Case
H2 Produced (short tons/day) 418 418 Natural Gas Feed (million scf/day) 60.3 65.6
Plant Efficiency (Equivalent Thermal Efficiency, HHV), % 78.6 83.9
CO2 Removal, % 71 - Net Power Consumption, MW 15 6 Greenhouse gas emissions due to fugitive losses during natural gas pipeline transportation were determined by using a factor from the US Environmental Protection Agency (EPA) (1999a). It is reported that approximately 19,300 scf/mile/year of natural gas is lost during transit. For this analysis, a total pipeline distance of 500 miles was assumed for pipeline distribution after the natural gas processing and regasification steps. Summary figures for all the foregoing calculations of GWP for production of hydrogen from LNG are shown in Table 2. For all plant operation steps, GWP due to energy expenditure is computed without inclusion of Operations and Maintenance activities. Earlier work in analyzing power plants showed that O&M contributed less than 1% of GHG emissions due to consumption of the fuel used for power generation (Ruether et al., 2004). GWP expended for CO2 compression is listed separately in the table because the original study from which data were taken (Parsons, 2002) did not deliver CO2 at the pressure desired here, 2200 psi. 4.2 Hydrogen Production from Coal Three main process steps are involved in producing hydrogen from coal: coal mining (including post-mining degassing), transport from mine to hydrogen production plant, and construction and operation of the conversion plant. Estimates of life-cycle GWP for construction and operation of a process chain for production of hydrogen from coal is developed next. Two main cases are considered: where no measures are taken either in mining or in gasification to avoid emission of GHGs to the atmosphere, and where technical measures are employed to reduce such emissions. For the mining steps, deep-mined and surface-mined coals are considered, the two types of mining giving rise to differing amounts of coal-mine methane emissions. 4.2.1 GHG Emissions due to Coal Mining Earlier work showed that the significance of methane emissions during coal mining to total GWP due to coal use in power production strongly depends on whether CCS is practiced (Ruether et al., 2004). Using data for the average of all coal mined in the United States in 1997, it was shown that GWP due to methane emissions during mining and CO2 emissions due to transport of the coal represented only 3% of GWP from CO2 emissions during electricity generation for cases where CCS was not practiced. For an IGCC system

DOE/NETL-2006/1227
8
Table 2-Summary GWP for Hydrogen Production from LNG
Activity GWP, g CO2e/MJ Production
Manufacture/construction of facilities 0.02, a Fuel consumption 0.48, a Flare combustion 0.15, a Methane venting 0.29, a
Processing CO2 venting 1.69, a
Liquefaction Manufacture/construction of facilities 0.07, a Fuel consumption 5.10, a Flare combustion 0.33, a Methane venting 0.55, a
Ocean transport Manufacture/construction of facilities 0.15, a Fuel consumption 0.90, a, e
Regasification Manufacture/construction of facilities 0.002, b, d Fuel consumption 1.60, f
Pipeline transport of natural gas Methane loss 0.1
Steam methane reforming (no CCS) Manufacture/construction of facilities 0.19, c, d Fuel combustion/carbon conversion 48.6, c Electric power consumption 1.87, c, g
Steam methane reforming (with CCS) Manufacture/construction of facilities 0.2, c, d Fuel combustion/carbon conversion 48.6, c Electric power consumption 4.4, c, g (CO2 capture) -34.5, c CO2 compression 2.6, f
Total: H2 from LNG without CCS 62.5 H2 from LNG with CCS 32.8 a - Tamura et al., 2001 b - McCall et al., 2003 c - Parsons, 2002 d - CMU, 2002 e - US EPA, 1999a f - This work g - Ruether et al., 2004
DOE/NETL-2006/1227
9
in which CCS resulted in a nominal 90% capture of CO2, the comparable figure rose to 26%, however. In the present work, we first investigate whether actions taken to reduce CMM emissions are cost effective for reduction of GWP compared to the practice of CCS. Earlier work indicated it was, without giving details (Hahoe et al., 1999). We consider both underground, or deep-mined, and surface-mined coals. As a rule, methane content increases with both coal rank and depth of deposit. Both factors tend to cause CMM emissions for surface-mined coals to be less than those for deep mined. In the course of mining coal, methane is released not only from the seam being extracted but also from other adjacent seams, especially those above the seam being extracted, that are disturbed during mining operations. Furthermore, methane continues to be emitted from abandoned mines or active mines when coal production is interrupted. Only deep mining operations are susceptible to mitigating CMM emissions via capture and use of the methane or conversion to the less potent GHG, CO2, by catalytic oxidation. The EPA described three technical options in order of increasing cost per mass of CMM recovered and increasing effectiveness in reducing CMM emissions to the atmosphere. One option, Degasification and Pipeline Injection, employs advance well drilling from the surface prior to beginning mining, horizontal bore holes drilled inside the mine after mining has begun but prior to removal of a particular panel of coal, and gob wells (vertical wells from the surface into collapsed strata due to longwall mining). Depending on the type of well, assumed recovery of total CMM emissions are typically in the range 40-60%. Recovered gas of sufficiently high purity is sold to a pipeline, resulting in the lowest overall cost for this mitigation option. The second option, Enhanced Degasification, Gas Enrichment, and Pipeline Injection, consists of gas recovery and use incremental to Option 1. The methods are similar to the first option but are somewhat more focused. The additional measures are assumed to increase CMM recovery efficiency by 20% over that achieved by Option 1 (US EPA, 1999a). The third option, Catalytic Oxidation, eliminates methane in mine ventilation air by passing it through a catalytic reactor. The oxidizer is assumed to convert 98% of ventilation air methane to CO2. Because Options 1 and 2 yield pipeline quality methane, their mitigation cost for reduction of GWP depends on natural gas price as well as mine-specific data such as gas content of the coal being mined. The most expensive choice is Option 3 because no revenue is gained for recovered methane and a large volume of air must be manipulated to remove a relatively small amount of methane2.
2 The cost of Option 3 for reducing GWP is computed here, using the costs given by US EPA, as $15/Mt CO2e. EPRI estimates the cost of CCS for an IGCC power plant employing state-of-the-art technology at $17.50/Mt CO2 (EPRI, 2000). Although it is not possible to assign a price to Options 1 and 2 due to their
DOE/NETL-2006/1227
10
We now develop estimates of GWP due to coal mine methane emissions for two cases, deep-mined and surface-mined U.S. coals, using year 2010 as the basis. Future mining projections developed by the EPA for the period 2005-2020 indicate that the gassiness of the coal being extracted is expected to remain relatively constant. Therefore, emissions on a year 2010 basis are justified since variations in composition of the mined coal will be minimal over the time period of interest. Average values of methane emissions for each type of mining were used. The emissions in Table 3 include those due to mining operations as well as post-mine degassing.
Table 3-GHG Burden from Coal Mining (EPA, 1999a)
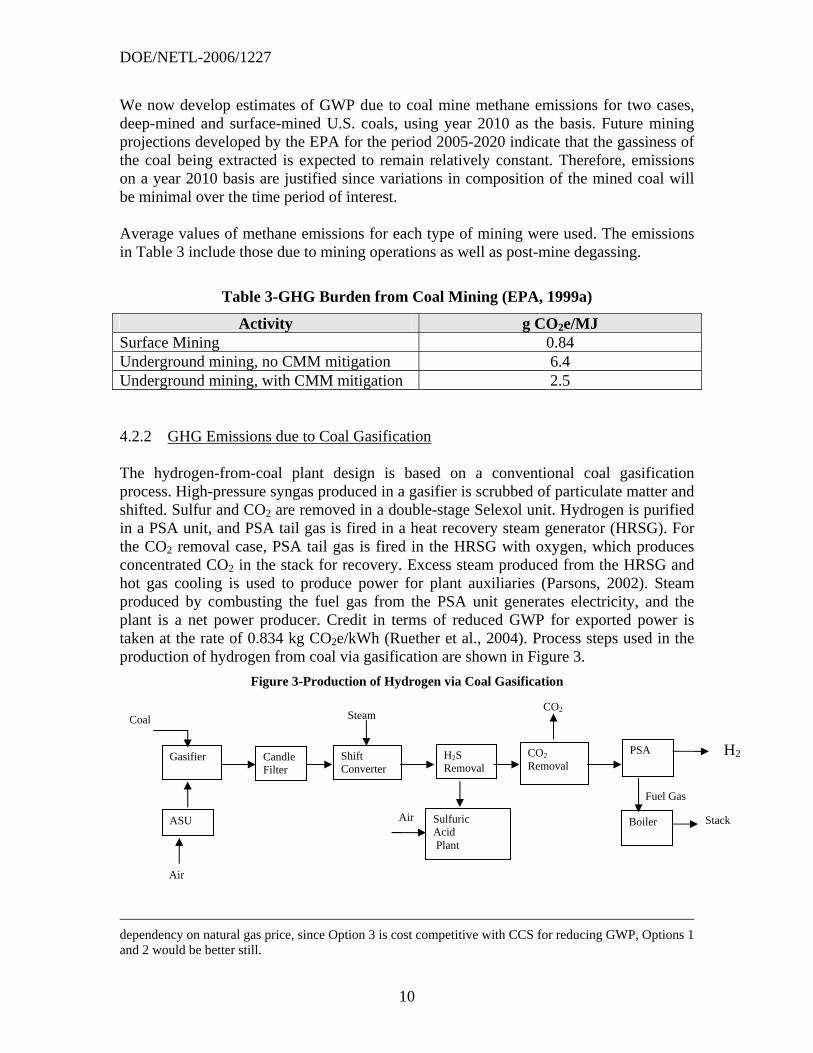
Activity g CO2e/MJ Surface Mining 0.84 Underground mining, no CMM mitigation 6.4 Underground mining, with CMM mitigation 2.5 4.2.2 GHG Emissions due to Coal Gasification The hydrogen-from-coal plant design is based on a conventional coal gasification process. High-pressure syngas produced in a gasifier is scrubbed of particulate matter and shifted. Sulfur and CO2 are removed in a double-stage Selexol unit. Hydrogen is purified in a PSA unit, and PSA tail gas is fired in a heat recovery steam generator (HRSG). For the CO2 removal case, PSA tail gas is fired in the HRSG with oxygen, which produces concentrated CO2 in the stack for recovery. Excess steam produced from the HRSG and hot gas cooling is used to produce power for plant auxiliaries (Parsons, 2002). Steam produced by combusting the fuel gas from the PSA unit generates electricity, and the plant is a net power producer. Credit in terms of reduced GWP for exported power is taken at the rate of 0.834 kg CO2e/kWh (Ruether et al., 2004). Process steps used in the production of hydrogen from coal via gasification are shown in Figure 3.
Figure 3-Production of Hydrogen via Coal Gasification
dependency on natural gas price, since Option 3 is cost competitive with CCS for reducing GWP, Options 1 and 2 would be better still.
Gasifier
ASU
Candle Filter
Shift Converter
H2S Removal
CO2 Removal
PSA
Air
Sulfuric Acid Plant
Boiler Air Stack
Fuel Gas
Steam CO2
Coal
H2
DOE/NETL-2006/1227
11
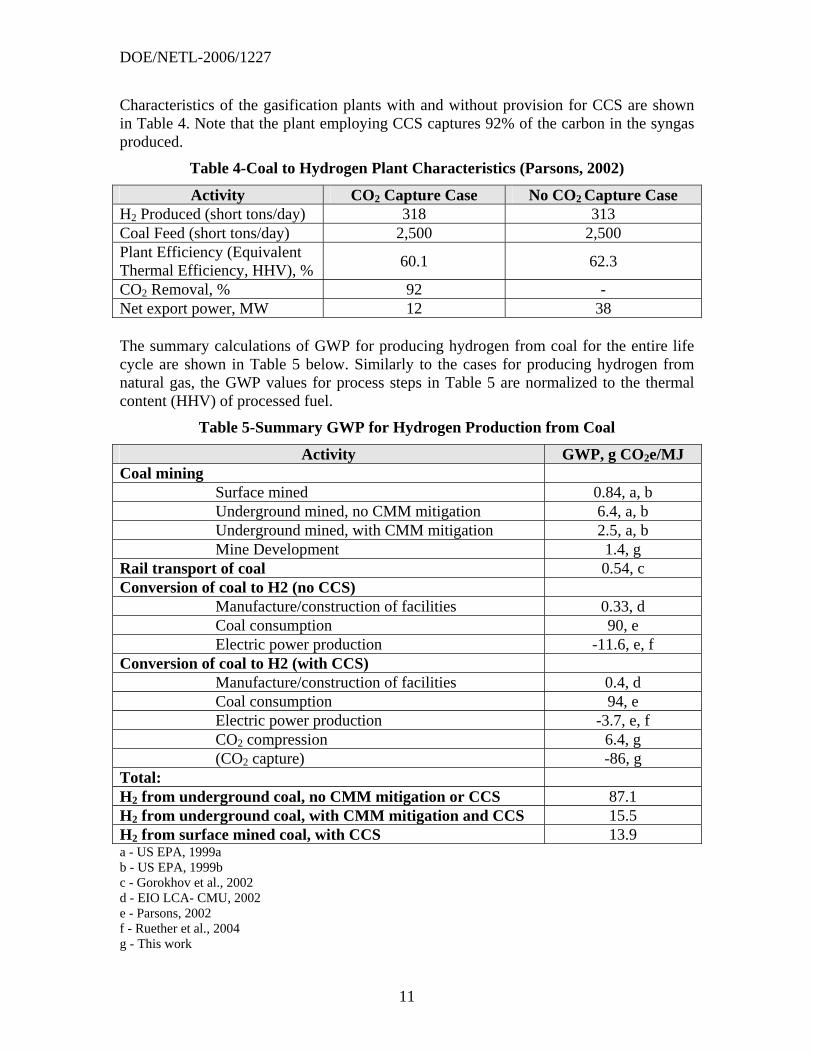
Characteristics of the gasification plants with and without provision for CCS are shown in Table 4. Note that the plant employing CCS captures 92% of the carbon in the syngas produced.
Table 4-Coal to Hydrogen Plant Characteristics (Parsons, 2002)
Activity CO2 Capture Case No CO2 Capture Case H2 Produced (short tons/day) 318 313 Coal Feed (short tons/day) 2,500 2,500 Plant Efficiency (Equivalent Thermal Efficiency, HHV), % 60.1 62.3
CO2 Removal, % 92 - Net export power, MW 12 38 The summary calculations of GWP for producing hydrogen from coal for the entire life cycle are shown in Table 5 below. Similarly to the cases for producing hydrogen from natural gas, the GWP values for process steps in Table 5 are normalized to the thermal content (HHV) of processed fuel.
Table 5-Summary GWP for Hydrogen Production from Coal
Activity GWP, g CO2e/MJ Coal mining
Surface mined 0.84, a, b Underground mined, no CMM mitigation 6.4, a, b Underground mined, with CMM mitigation 2.5, a, b Mine Development 1.4, g
Rail transport of coal 0.54, c Conversion of coal to H2 (no CCS)
Manufacture/construction of facilities 0.33, d Coal consumption 90, e Electric power production -11.6, e, f
Conversion of coal to H2 (with CCS) Manufacture/construction of facilities 0.4, d Coal consumption 94, e Electric power production -3.7, e, f CO2 compression 6.4, g (CO2 capture) -86, g
Total: H2 from underground coal, no CMM mitigation or CCS 87.1 H2 from underground coal, with CMM mitigation and CCS 15.5 H2 from surface mined coal, with CCS 13.9 a - US EPA, 1999a b - US EPA, 1999b c - Gorokhov et al., 2002 d - EIO LCA- CMU, 2002 e - Parsons, 2002 f - Ruether et al., 2004 g - This work
DOE/NETL-2006/1227
12
5. Discussion of Results While the primary purpose of the present paper is to compare life-cycle GHG emissions for producing hydrogen from LNG and coal, a secondary purpose is to identify simplified methods that can be used in performing life-cycle analyses for processes that convert fossil fuels to other energy forms. It was noted above that earlier work showed that GWP for construction of facilities was negligible compared to life-cycle emissions for operations in the case of an IGCC plant, but that when CCS was employed for a nominal 90% CO2 capture, GWP for plant construction rose to the neighborhood of 4%. These observations have been confirmed in the present study for use of coal to produce hydrogen. For facilities used to produce hydrogen from LNG, Table 2 shows that the ratio of GWP for facility construction to life-cycle operations is smaller still than for coal. The well-known lower capital cost per unit of energy throughput that natural gas facilities enjoy compared to coal leads to the relatively low GWP for facility construction for natural gas. Table 2 shows that the total life-cycle emissions of GWP for producing hydrogen from LNG, with and without the practice of CCS at the SMR plant, is 62.5 and 32.8 g CO2e/MJ, respectively. Recall that the fractional capture of CO2 in the SMR plant with CCS was 71%. This is significantly lower than the corresponding fractional capture in the coal gasification plant, which was 92%. Although the referenced study used in this analysis did not prepare a case with similar capture fractions for both feedstocks, which would have facilitated a comparison of life-cycle GHG emissions, there is no physical reason why similar rates of CO2 capture could not be achieved with both natural gas and coal feeds. An approximate estimate of GWP from a SMR plant with 92% CO2 capture is made here. Referencing Table 2, with 92% capture, the sum of the two entries for “Fuel combustion/carbon conversion” and “CO2 capture” would be about 3.9 g CO2/MJ. Other entries for the step Steam methane reforming (with CCS) in the Table would be the same as or larger than the values shown in the Table for 71% capture. Thus, the total GWP for the step Steam methane reforming (with CCS) would be no smaller than 11.1 g CO2/MJ. With use of this value, the total life-cycle GWP for hydrogen from LNG, when CCS was employed with 92% capture in the SMR plant, would be 22.5 g CO2e/MJ. This compares to the value of 32.7 g CO2e/MJ with 71% CO2 capture. Table 5 shows summary results for life-cycle GWP emissions for production of hydrogen from coal. The largest emissions are for the use of deep-mined coal of average gassiness, without CCS in the gasification step, which yields a value of 87.1 g CO2e/MJ. The least is for the use of surface-mined coal of average gassiness for that type coal, with CCS, yielding a value of 13.9. Intermediate is the case where CMM mitigation measures are applied with use of average deep-mined coal, with CCS, yielding a value of 15.5. A comparison of summary results for both LNG and coal feedstocks shows that deep-mined coal with no mitigative measures for reducing GHG emissions yields the largest GWP emissions. When a less gassy, surface-mined coal is used, or when CMM
DOE/NETL-2006/1227
13
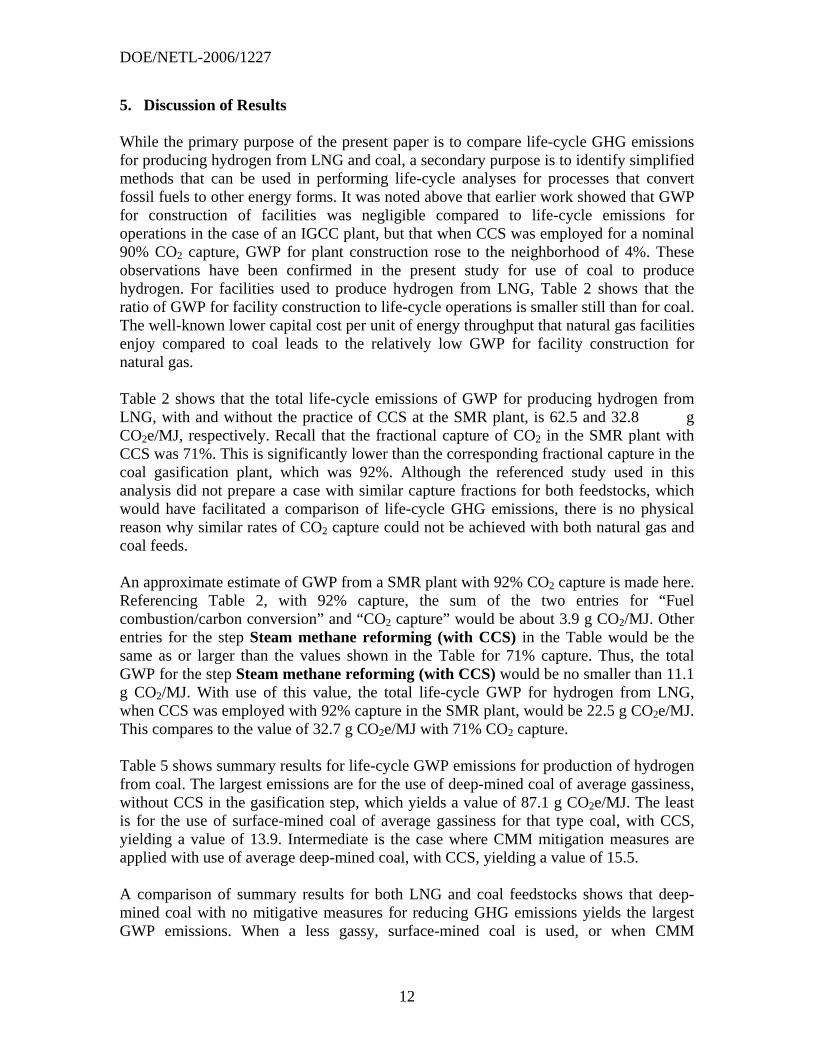
mitigation measures are used with a deep-mined coal, together with CCS in gasification, the total GWP for hydrogen production from coal is less than that for production from LNG, however. There are several reasons for this. One is that the process train that must be followed to produce hydrogen from LNG has many more steps than that using coal. Even when stringent emission control is used at the SMR plant, emissions of GHGs at other process steps cause the total to be above that for coal. These emissions are due to both methane and CO2 released due to processing. It would be technically difficult and expensive to make further large reductions of CO2 emissions in the LNG-to-hydrogen process scheme. GHG emissions in Table 2 and Table 5 are expressed per unit energy throughput, but an interesting comparison can be made if they are expressed per unit of product (kg CO2e/kg H2). The results of the conversion are shown in Table 6.
Table 6-Summary of GHG Emissions for H2 Production from Coal and LNG
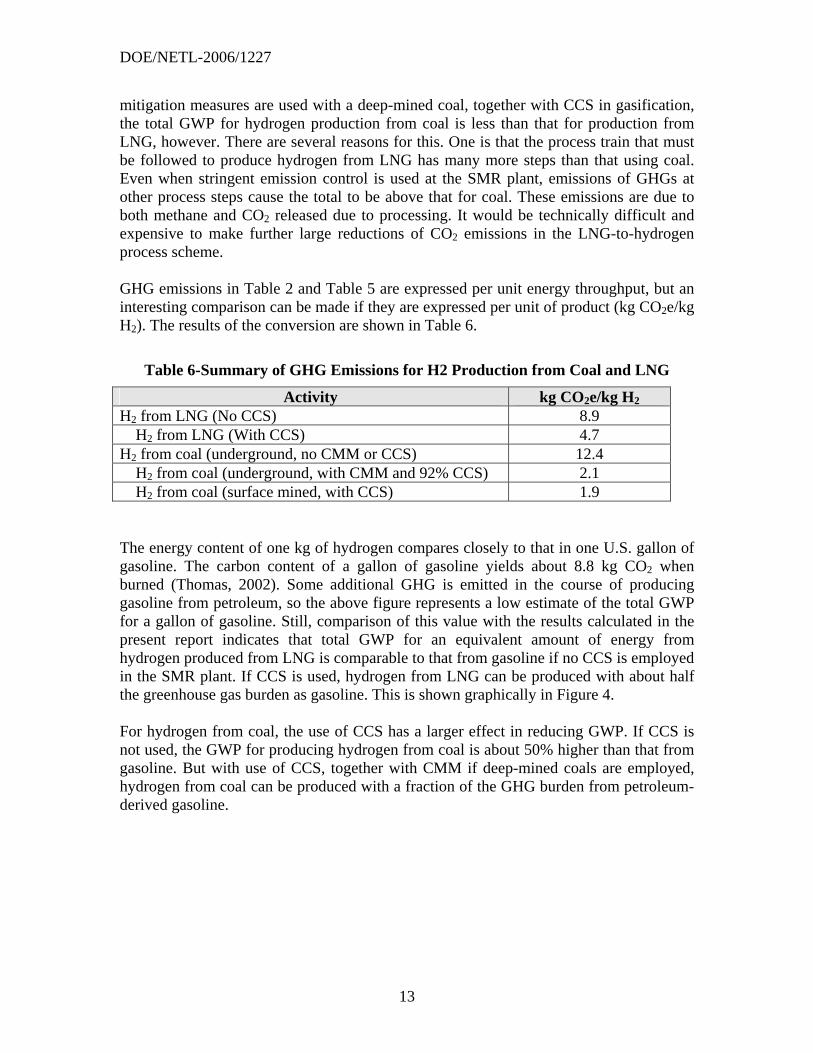
Activity kg CO2e/kg H2 H2 from LNG (No CCS) 8.9 H2 from LNG (With CCS) 4.7 H2 from coal (underground, no CMM or CCS) 12.4 H2 from coal (underground, with CMM and 92% CCS) 2.1 H2 from coal (surface mined, with CCS) 1.9 The energy content of one kg of hydrogen compares closely to that in one U.S. gallon of gasoline. The carbon content of a gallon of gasoline yields about 8.8 kg CO2 when burned (Thomas, 2002). Some additional GHG is emitted in the course of producing gasoline from petroleum, so the above figure represents a low estimate of the total GWP for a gallon of gasoline. Still, comparison of this value with the results calculated in the present report indicates that total GWP for an equivalent amount of energy from hydrogen produced from LNG is comparable to that from gasoline if no CCS is employed in the SMR plant. If CCS is used, hydrogen from LNG can be produced with about half the greenhouse gas burden as gasoline. This is shown graphically in Figure 4. For hydrogen from coal, the use of CCS has a larger effect in reducing GWP. If CCS is not used, the GWP for producing hydrogen from coal is about 50% higher than that from gasoline. But with use of CCS, together with CMM if deep-mined coals are employed, hydrogen from coal can be produced with a fraction of the GHG burden from petroleum-derived gasoline.
DOE/NETL-2006/1227
14
Figure 4-Hydrogen Production from Coal and LNG Compared to Gasoline Content
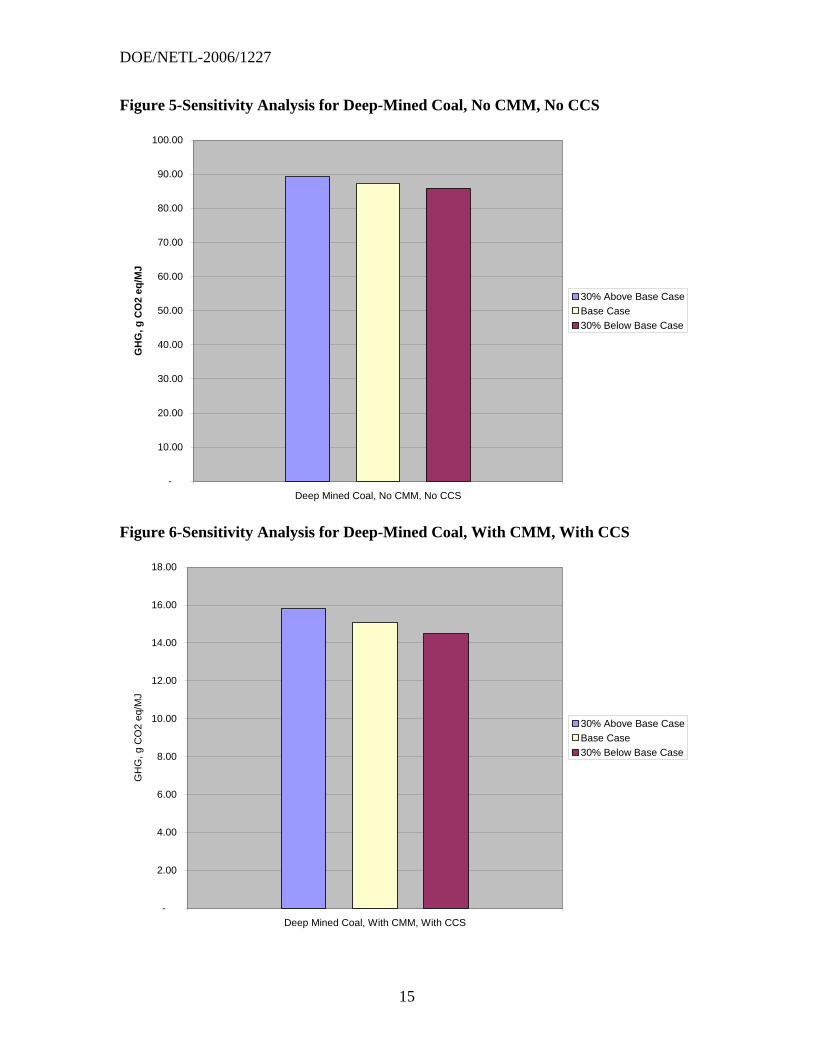
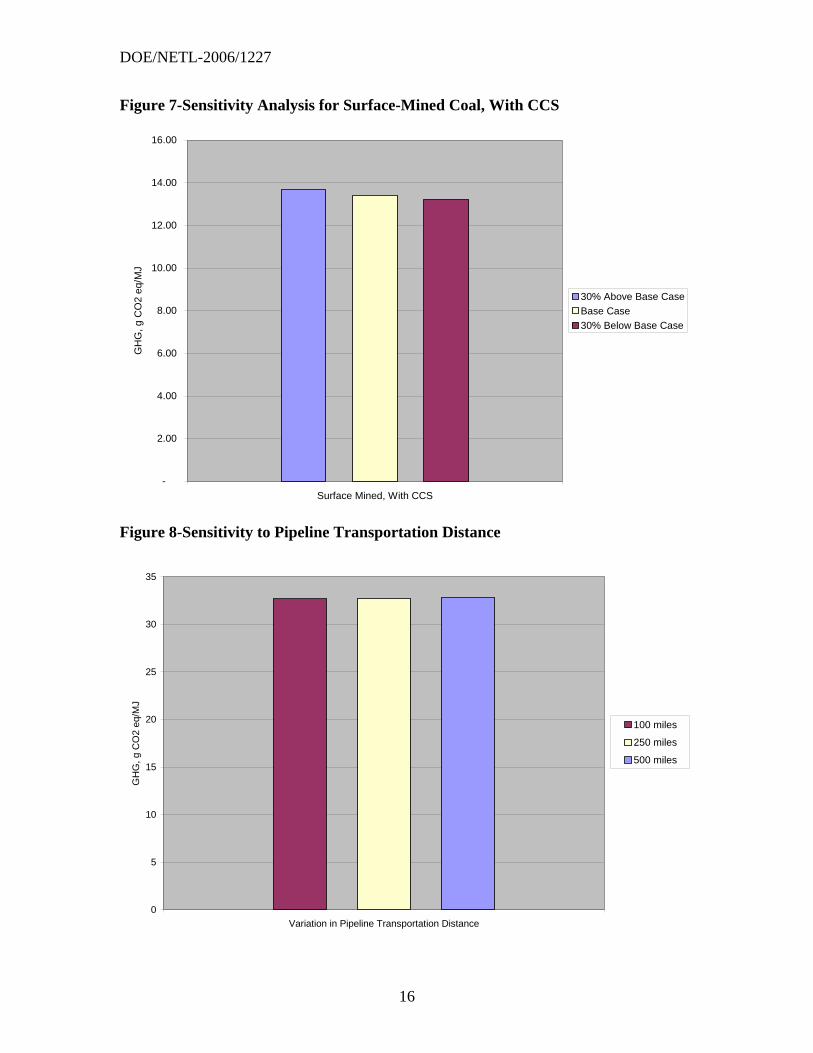
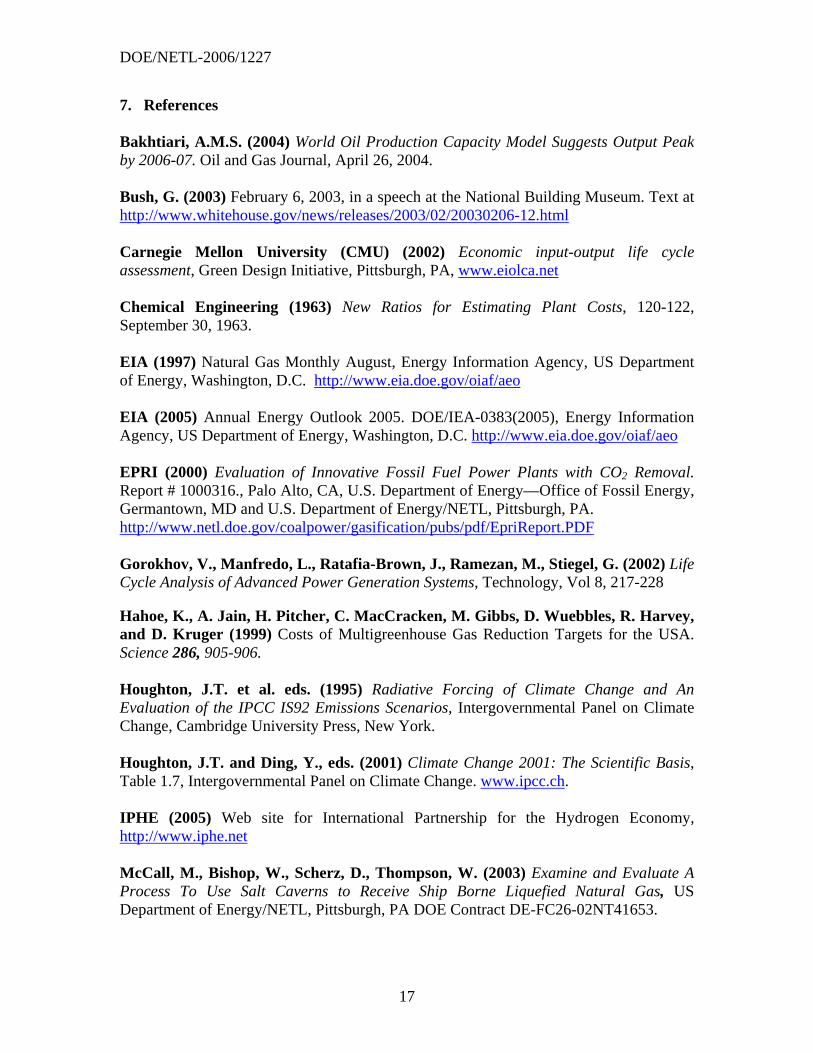
6. Sensitivity Analysis Due to calculation assumptions, measurement variability, and differences in reporting methods, uncertainty does exist in the coal-mine methane emissions reported by the EPA. Sensitivity analyses were performed to evaluate the effect this variability would have on the overall life-cycle emission. For H2 production from coal, the base values in Table 5 were compared to cases where the coal-mine methane emissions were adjusted by 30%. All other emission categories remain unchanged. The results are shown in Figure 5, Figure 6, and Figure 7 (only total emissions are shown). The figures show that variability in coal-mine methane emissions have little effect on the overall GHG emissions. Even when the methane emissions were adjusted by 30%, the total emissions were only affected by less than 5%. For the hydrogen from LNG case, the emissions sensitivity to pipeline transportation distance was examined. The emissions given in Table 2 assume a pipeline distance of 500 miles. This variable (pipeline distance) was adjusted from 100 to 500 miles, and the total emissions recalculated. The results are shown in Figure 8. The results of the sensitivity analysis show that uncertainty in the coal-mine methane emissions (for the H2 from coal case) and variation in pipeline transportation distance (for the H2 from LNG case) have little effect on the total emissions. The overwhelming majority of the total is composed of GHG emissions due to operation.
0
2
4
6
8
10
12
14
16
18
20
0
2
4
6
8
10
12
14
16
18
20K
g C
O2/k
g H
2
Kg C
O2 /U
Sgal
Deep mined coal, No capture
Surface mined coal, With capture
LNG, no capture
LNG, with capture
Hydrogen
Gasoline
DOE/NETL-2006/1227
15
Figure 5-Sensitivity Analysis for Deep-Mined Coal, No CMM, No CCS
-
10.00
20.00
30.00
40.00
50.00
60.00
70.00
80.00
90.00
100.00
Deep Mined Coal, No CMM, No CCS
GH
G, g
CO
2 eq
/MJ
30% Above Base CaseBase Case30% Below Base Case
Figure 6-Sensitivity Analysis for Deep-Mined Coal, With CMM, With CCS
-
2.00
4.00
6.00
8.00
10.00
12.00
14.00
16.00
18.00
Deep Mined Coal, With CMM, With CCS
GH
G, g
CO
2 eq
/MJ
30% Above Base CaseBase Case30% Below Base Case
DOE/NETL-2006/1227
16
Figure 7-Sensitivity Analysis for Surface-Mined Coal, With CCS
-
2.00
4.00
6.00
8.00
10.00
12.00
14.00
16.00
Surface Mined, With CCS
GH
G, g
CO
2 eq
/MJ
30% Above Base CaseBase Case30% Below Base Case
Figure 8-Sensitivity to Pipeline Transportation Distance
0
5
10
15
20
25
30
35
Variation in Pipeline Transportation Distance
GH
G, g
CO
2 eq
/MJ
100 miles
250 miles
500 miles
DOE/NETL-2006/1227
17
7. References Bakhtiari, A.M.S. (2004) World Oil Production Capacity Model Suggests Output Peak by 2006-07. Oil and Gas Journal, April 26, 2004. Bush, G. (2003) February 6, 2003, in a speech at the National Building Museum. Text at http://www.whitehouse.gov/news/releases/2003/02/20030206-12.html Carnegie Mellon University (CMU) (2002) Economic input-output life cycle assessment, Green Design Initiative, Pittsburgh, PA, www.eiolca.net Chemical Engineering (1963) New Ratios for Estimating Plant Costs, 120-122, September 30, 1963. EIA (1997) Natural Gas Monthly August, Energy Information Agency, US Department of Energy, Washington, D.C. http://www.eia.doe.gov/oiaf/aeo EIA (2005) Annual Energy Outlook 2005. DOE/IEA-0383(2005), Energy Information Agency, US Department of Energy, Washington, D.C. http://www.eia.doe.gov/oiaf/aeo EPRI (2000) Evaluation of Innovative Fossil Fuel Power Plants with CO2 Removal. Report # 1000316., Palo Alto, CA, U.S. Department of Energy—Office of Fossil Energy, Germantown, MD and U.S. Department of Energy/NETL, Pittsburgh, PA. http://www.netl.doe.gov/coalpower/gasification/pubs/pdf/EpriReport.PDF Gorokhov, V., Manfredo, L., Ratafia-Brown, J., Ramezan, M., Stiegel, G. (2002) Life Cycle Analysis of Advanced Power Generation Systems, Technology, Vol 8, 217-228 Hahoe, K., A. Jain, H. Pitcher, C. MacCracken, M. Gibbs, D. Wuebbles, R. Harvey, and D. Kruger (1999) Costs of Multigreenhouse Gas Reduction Targets for the USA. Science 286, 905-906. Houghton, J.T. et al. eds. (1995) Radiative Forcing of Climate Change and An Evaluation of the IPCC IS92 Emissions Scenarios, Intergovernmental Panel on Climate Change, Cambridge University Press, New York. Houghton, J.T. and Ding, Y., eds. (2001) Climate Change 2001: The Scientific Basis, Table 1.7, Intergovernmental Panel on Climate Change. www.ipcc.ch. IPHE (2005) Web site for International Partnership for the Hydrogen Economy, http://www.iphe.net McCall, M., Bishop, W., Scherz, D., Thompson, W. (2003) Examine and Evaluate A Process To Use Salt Caverns to Receive Ship Borne Liquefied Natural Gas, US Department of Energy/NETL, Pittsburgh, PA DOE Contract DE-FC26-02NT41653.
DOE/NETL-2006/1227
18
Monroe, D. (2005) Capturing carbon dioxide: Efforts to promote an existing technology for limiting power plant emissions heat up. ScientificAmerican.com, Feb. 14, 2005. http://www.sciam.com/print_version.cfm?articleID=0000492C-072B-120D-872B83414B7F013B North American Combustion Handbook (1978) Second Edition, North American Mfg. Co., Cleveland, OH. Parsons Infrastructure and Technology Group, Inc. (2002) Hydrogen Production Facilities Plant Performance and Cost Comparisons, Reading, PA, US Department of Energy/NETL, Pittsburgh, PA. http://www.netl.doe.gov/coal/Gasification/pubs/pdf/HydrogenFromCoalGasificationFinalReport.pdf Ramage, M.P. et al. (2004) The Hydrogen Economy: Opportunities, Costs, Barriers, and R&D Needs. The National Academies Press, Washington, D.C. Ratepayers for Affordable Clean Energy (2004), Liquid Natural Gas: Inefficient, Unsafe, and Unnecessary, Briefing Paper: July 2004. Ravenridge (1997) Identifying opportunities for methane recovery at U.S. coal mines: draft profile of selected gassy underground mines. http://www.ravenridge.com/pro001%5B1%5D.pdf Ruether, J., M. Ramezan, and P. Balash (2004) Greenhouse Gas Emissions from Coal Gasification Power Generation Systems. Journal of Infrastructure Systems 10 (3), 111-119. Society of Environmental Toxicology and Chemistry (SETAC) (1998) Evolution and Development of the Conceptual Framework and Methodology of Life-Cycle Impact Assessment, SETAC Press, Pensacola, FL. Thomas, C.E. (2002) Hydrogen and Fuel Cells: Pathway to a Sustainable Energy Future, http://www.h2gen.com/PDF_Documents/WhitepaperSustainableEnergy.pdf US EPA (1999a) US methane emissions 1990-2020: inventories, projections and opportunities for reduction. EPA 430-R-99-013. Washington DC, USA, USEPA, Office of Air and Radiation. US EPA (1999b) Inventory of U.S. Greenhouse Gas Emissions and Sinks: 1990-1997. EPA 236-99-003, EPA 430-R-99-013. Washington DC, USA, USEPA, Office of Air and Radiation.
Related Documents