Leveraging IT to Drive Business Value Riaz Raihan National Vice President, Value Engineering and Business Development SAP Canada SAP Canada February 2010

Welcome message from author
This document is posted to help you gain knowledge. Please leave a comment to let me know what you think about it! Share it to your friends and learn new things together.
Transcript

Leveraging IT to Drive Business Value
Riaz RaihanNational Vice President, Value Engineering and Business DevelopmentSAP CanadaSAP Canada
February 2010
Agenda
1. Challenges and Opportunities
2. How Best in Class Companies Drive Valuep
© SAP AG 2009. All rights reserved. / Page 2
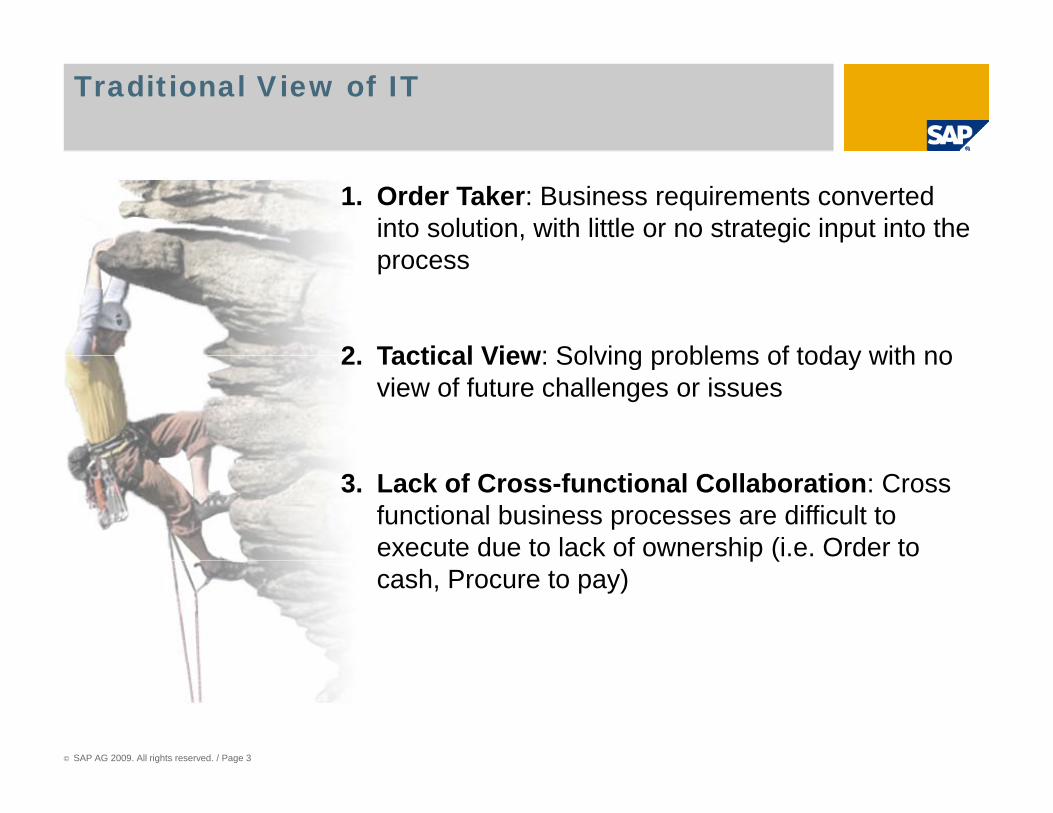
Traditional View of IT
1. Order Taker: Business requirements converted into solution, with little or no strategic input into the process
2 Tactical View: Solving problems of today with no2. Tactical View: Solving problems of today with no view of future challenges or issues
3. Lack of Cross-functional Collaboration: Cross functional business processes are difficult to execute due to lack of ownership (i.e. Order to p (cash, Procure to pay)
© SAP AG 2009. All rights reserved. / Page 3

Challenge #1Capital is Scarce & Economic Conditions Unfavorable!
High and Demonstrable ROI
Low and/or Not Demonstrable ROI
© SAP AG 2009. All rights reserved. / Page 4
More than 82% of IT decisions now require an ROI analysis (InformationWeek)
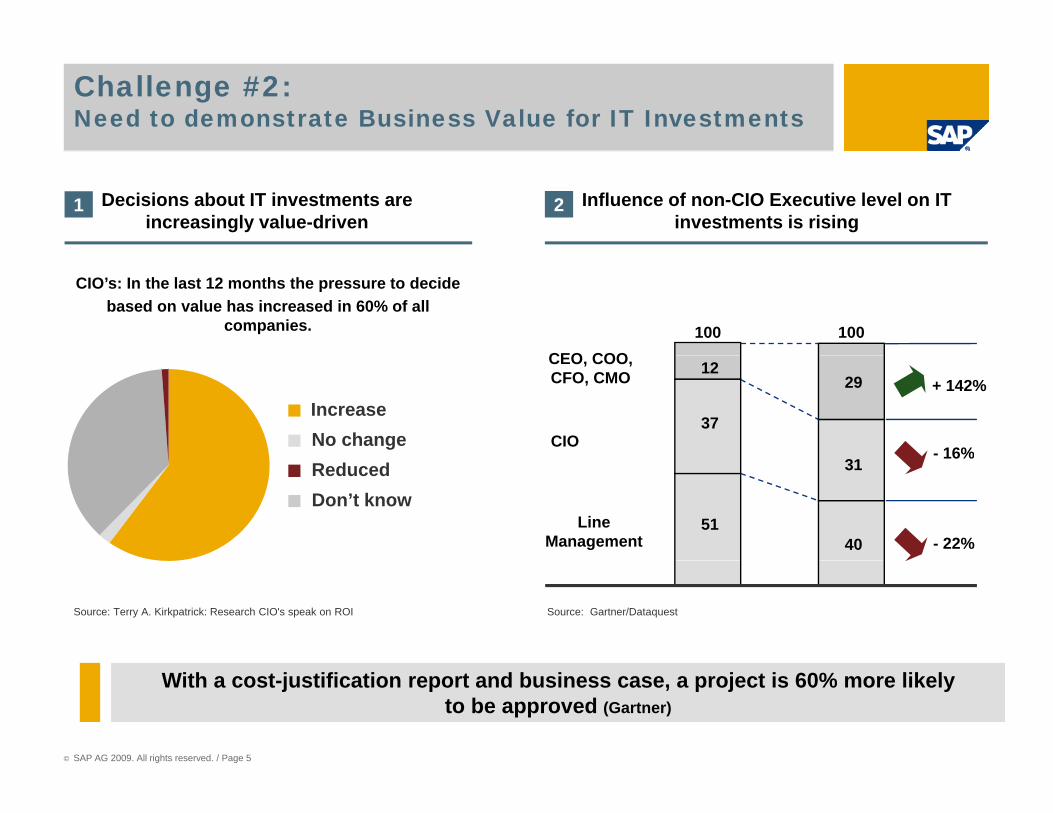
Challenge #2: Need to demonstrate Business Value for IT Investments
Decisions about IT investments areincreasingly value-driven
1 2 Influence of non-CIO Executive level on ITinvestments is rising
100 100CEO COO
CIO’s: In the last 12 months the pressure to decidebased on value has increased in 60% of all
companies.
37
1229 + 142%
- 16%
CEO, COO,CFO, CMO
CIO
IncreaseNo change
5140
3116%
- 22%Line
Management
Don’t knowReduced
Source: Gartner/DataquestSource: Terry A. Kirkpatrick: Research CIO's speak on ROI
© SAP AG 2009. All rights reserved. / Page 5
With a cost-justification report and business case, a project is 60% more likely to be approved (Gartner)
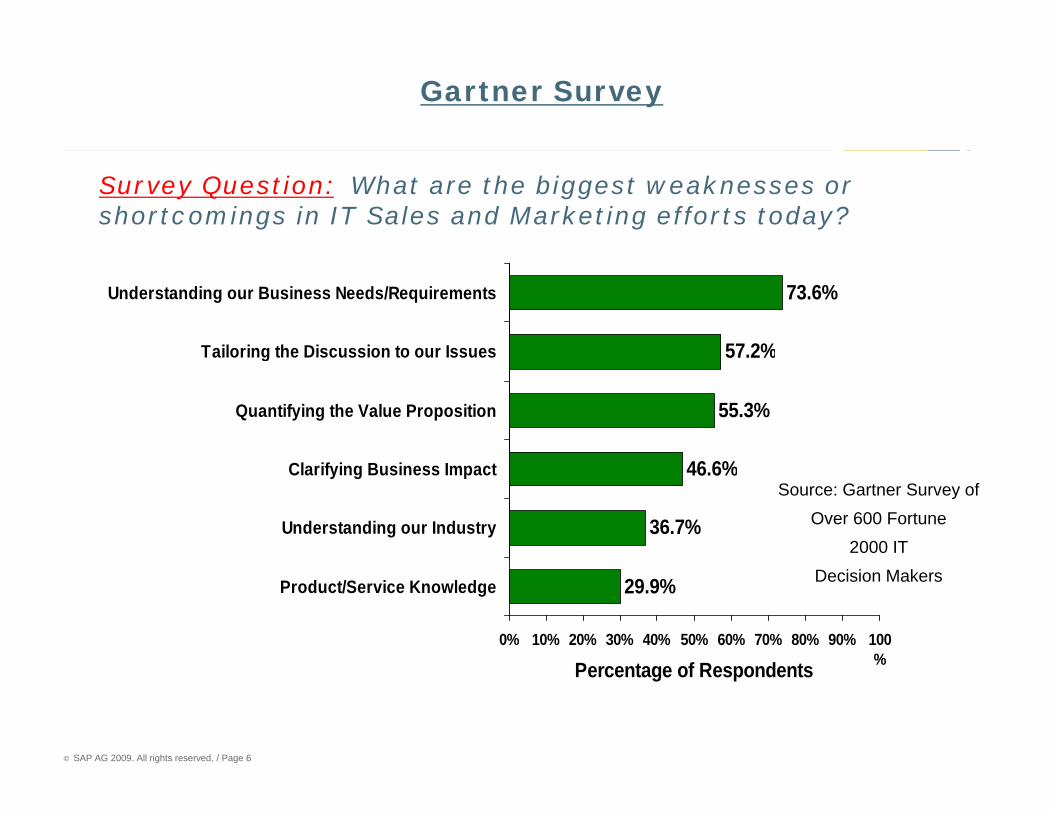
Gartner Survey
Survey Question: What are the biggest weaknesses or shortcomings in IT Sales and Marketing efforts today?
57.2%
73.6%
Tailoring the Discussion to our Issues
Understanding our Business Needs/Requirements
55.3%
57.2%
Quantifying the Value Proposition
Tailoring the Discussion to our Issues
36.7%
46.6%
Understanding our Industry
Clarifying Business ImpactSource: Gartner Survey of
Over 600 Fortune 2000 IT
29.9%
0% 10% 20% 30% 40% 50% 60% 70% 80% 90% 100%
Product/Service Knowledge
P t f R d t
Decision Makers
© SAP AG 2009. All rights reserved. / Page 6
%Percentage of Respondents

Managing Spend
% Spend Managed Strategically YoY % Annual Savings
16%
7%
Best In Class Average
© SAP AG 2009. All rights reserved. / Page 7
Source: SAP ASUG Benchmarking Initiative. N = 47
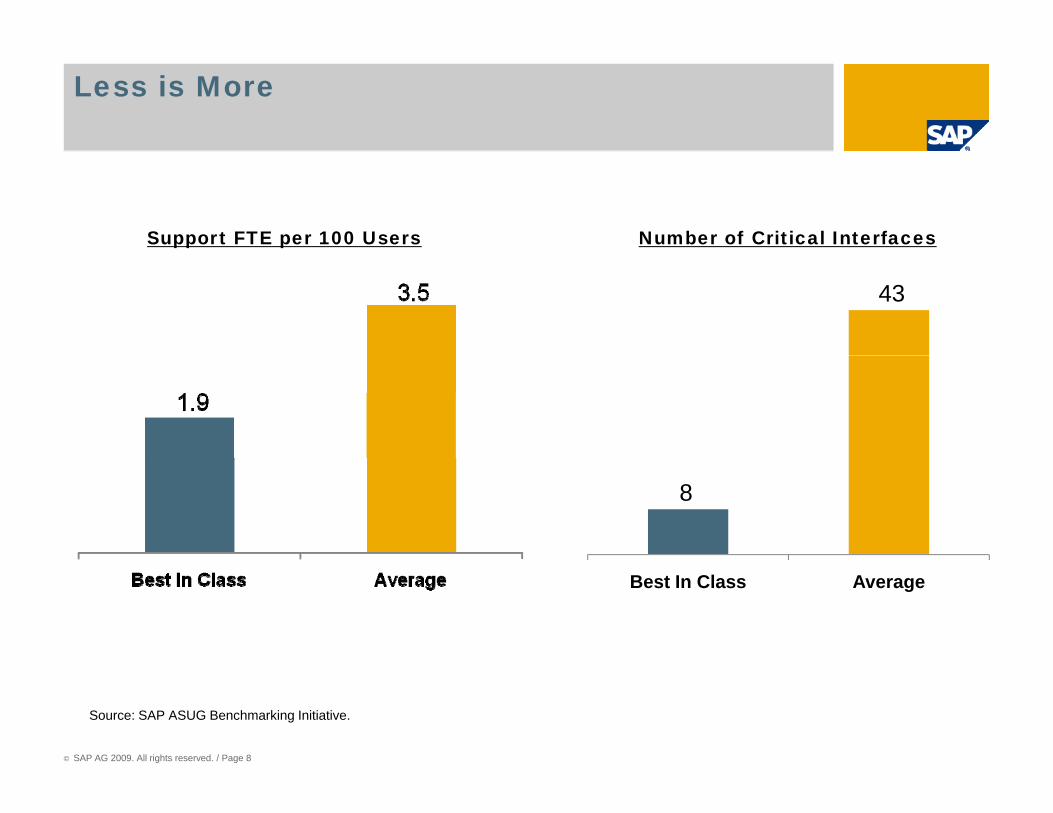
Less is More
Support FTE per 100 Users Number of Critical Interfaces
43
8
Best In Class Average
© SAP AG 2009. All rights reserved. / Page 8
Source: SAP ASUG Benchmarking Initiative.
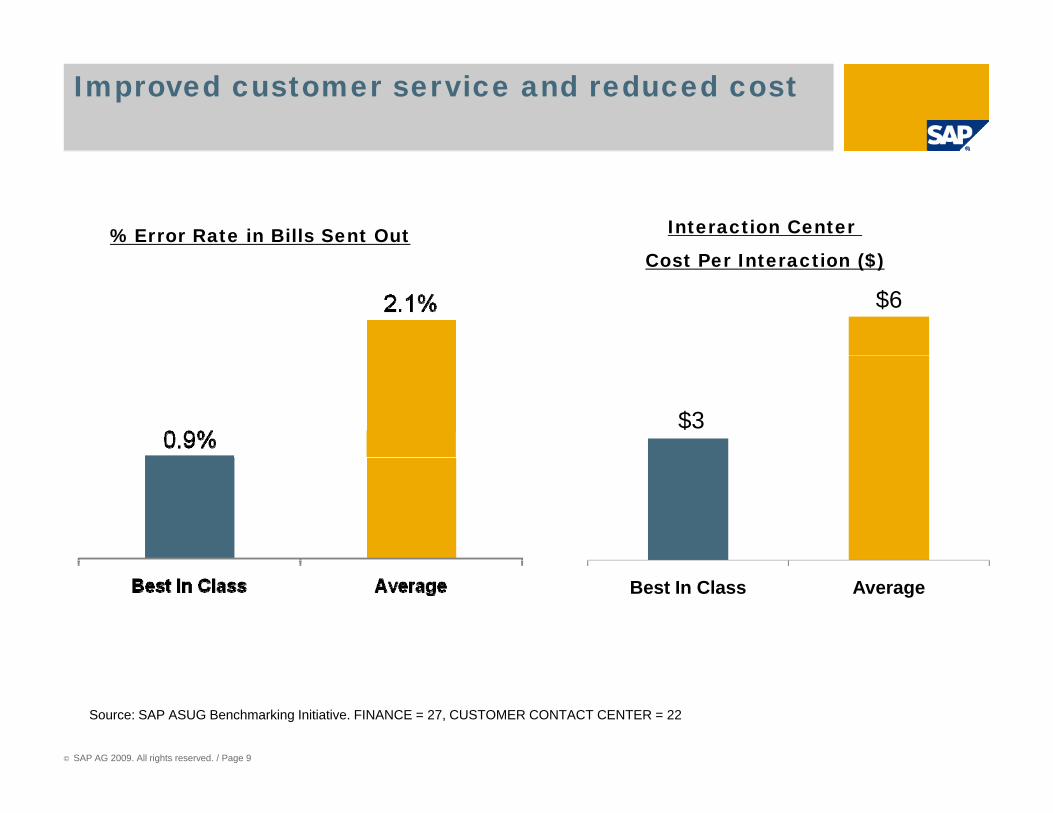
Improved customer service and reduced cost
% Error Rate in Bills Sent Out Interaction Center
$Cost Per Interaction ($)
$6
$3
Best In Class Average
© SAP AG 2009. All rights reserved. / Page 9
Source: SAP ASUG Benchmarking Initiative. FINANCE = 27, CUSTOMER CONTACT CENTER = 22

Key Insight from Procurement Benchmarking: Staffing
Staffing ProfileProcurement FTE per Type as % of Total
Procurement FTEs)
Staffing Profile
Transactional Expertise Based Strategy
28%
64%
60%
28%
12%
9%
Q1
Avg
Note: Non allocated FTEs are not included in the above analysisSource: Participant Responses, SAP Analysis
81% 10% 9%ABC
© SAP AG 2009. All rights reserved. / Page 10

Key Insights from Benchmarking: Best Practices
Average Best Practice Rank by FunctionAverageQ1ABC(Coverage)ABC( Importance)
3.5
4.0
4.5
5.0
1.8
2.5
1.7 1.81.3
1.1 1.1
2.0
1.3
2.5
1.82.0
1 01 0
1.5
2.0
2.5
3.0
1.1 1.0
0.0
0.5
1.0
© SAP AG 2009. All rights reserved. / Page 11

Agenda
1. Challenges and Opportunities
2. How Best in Class Companies Drive Valuep
© SAP AG 2009. All rights reserved. / Page 12

Value Management Lifecycle
Value Discovery (pre-decision): “Build the Case”
Understand your businessRecommend enabling solutions
Build the Case
gBuild the business caseDevelop implementation timeline for results
SOFTWARESELECTION
V l O ti i ti V l R li ti
Realize the ValueMeasure the Value
Value Optimization(post-use): “Measure the Value”
Measure before / after impact of SAPRecommend changes to
Value Realization (post-decision): “Realize the Value”
Ensure that the implementation plan is steered towards business valueg
maximize value attainment Implement process changeEnsure business metrics in place
© SAP AG 2009. All rights reserved. / Page 13
GO LIVE
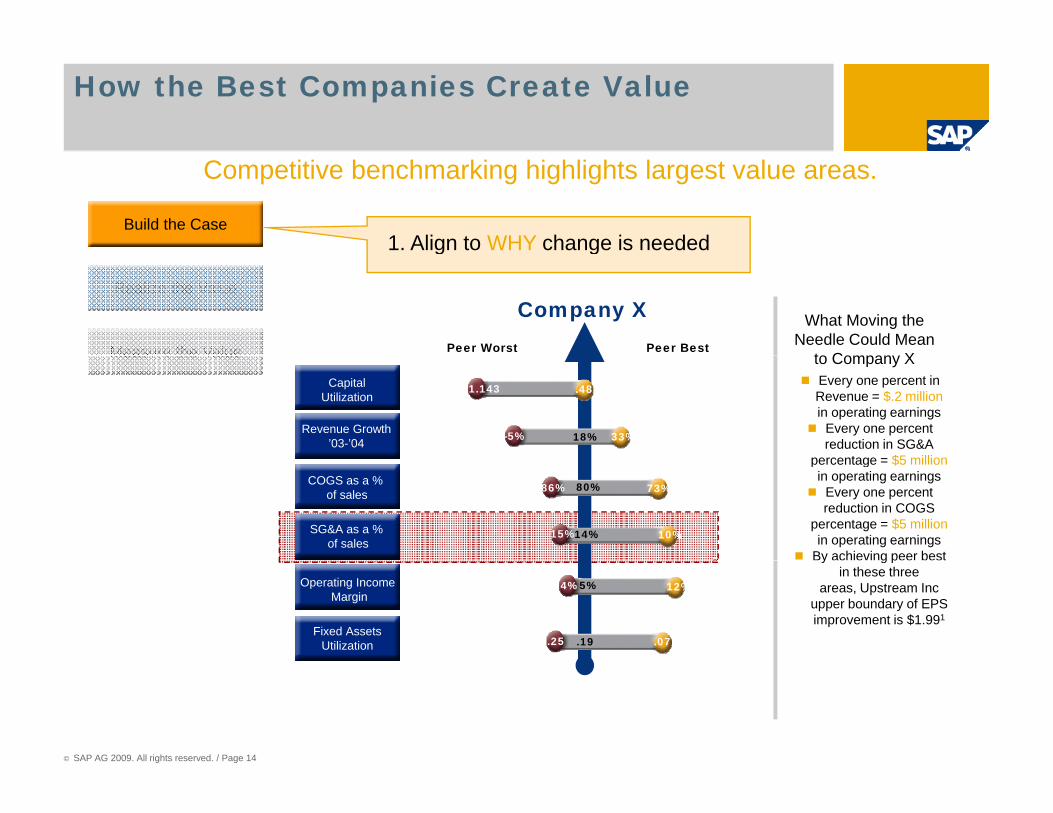
How the Best Companies Create Value
Build the Case1. Align to WHY change is needed
Competitive benchmarking highlights largest value areas.
Realize the Value
Measure the Value
g g
What Moving the Needle Could Mean
to Compan X
Company XPeer BestPeer WorstMeasure the Value
Every one percent in Revenue = $.2 millionin operating earnings
Every one percent reduction in SG&A
percentage = $5 million
to Company XCapital
Utilization
Revenue Growth’03-’04 18%
.481.143
33%-5%
percentage = $5 millionin operating earnings
Every one percent reduction in COGS
percentage = $5 millionin operating earnings
By achieving peer best
COGS as a % of sales
SG&A as a % of sales
80%
14%
73%
10%
86%
15%
y g pin these three
areas, Upstream Inc upper boundary of EPS improvement is $1.991
Operating Income Margin
Fixed AssetsUtilization
5% 12%4%
.07.25 .19
© SAP AG 2009. All rights reserved. / Page 14

How the Best Companies Create Value
Build the Case2. Understand WHAT value drivers exist
SAP process benchmarks further clarify improvement targets.
Realize the Value
Measure the ValueSG&A
Measure the Value
© SAP AG 2009. All rights reserved. / Page 15
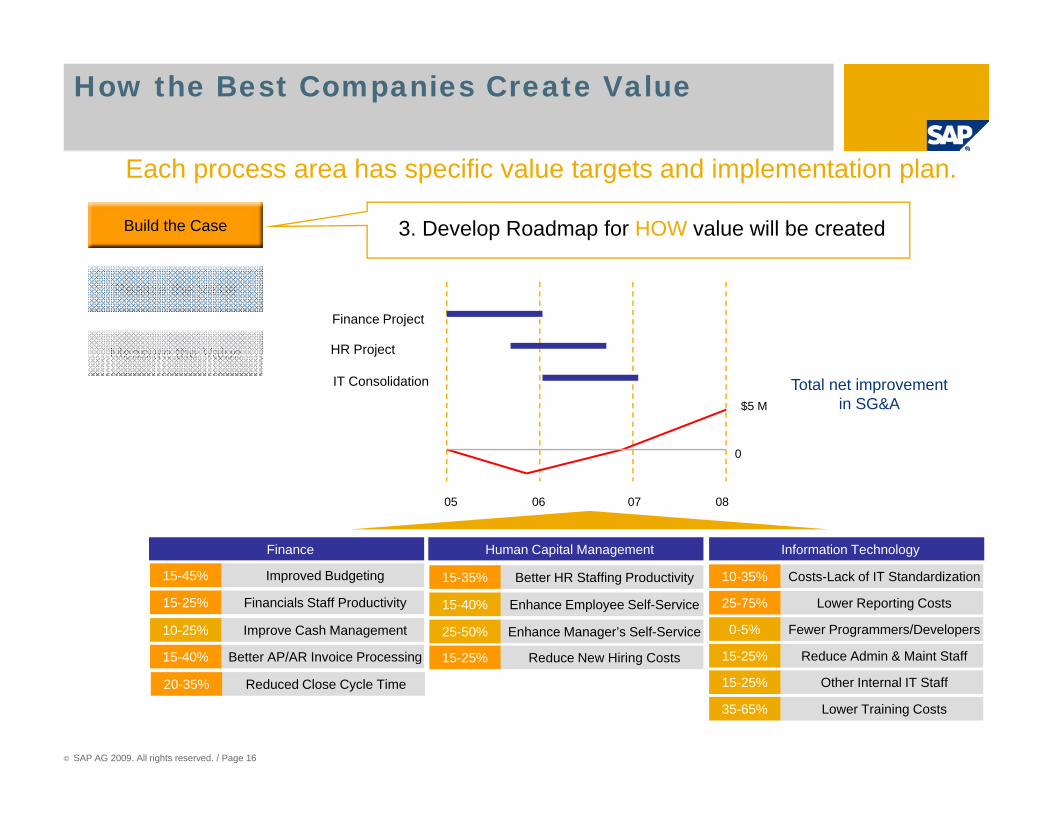
How the Best Companies Create Value
Each process area has specific value targets and implementation plan.
Build the Case 3. Develop Roadmap for HOW value will be created
Realize the Value
Measure the Value HR Project
Finance Project
Measure the Value j
IT Consolidation
0
$5 M
Total net improvementin SG&A
Finance Human Capital Management Information Technology
05 06 07 08
Improved Budgeting15-45%
Financials Staff Productivity15-25%
Better AP/AR Invoice Processing15-40%
Improve Cash Management10-25% Enhance Manager’s Self-Service
Enhance Employee Self-Service
Better HR Staffing Productivity15-35%
15-40%
25-50%
Reduce New Hiring Costs15-25%
Costs-Lack of IT Standardization10-35%
Lower Reporting Costs25-75%
Fewer Programmers/Developers0-5%
Reduce Admin & Maint Staff15-25%
© SAP AG 2009. All rights reserved. / Page 16
g
Reduced Close Cycle Time20-35%
g
Other Internal IT Staff15-25%
Lower Training Costs35-65%

How the Best Companies Create Value
Build the Case
Even with a compelling business case, companies face many challenges in achieving the expected value of their
investment.
Measure the Value
Realize the Value
Typical Barriers
Transition
Business
Unclear ProgramValue Imperatives
Blueprint, Technology,
Issues/DelaysSolution Funding >Program Execution
Executive L k f O iCaseBlueprint, Technology,
& Organizational
Lack of ProgramValue Metrics
ExecutiveDisconnectson Key Business
Case Assumptions
Lack of OngoingValue Review
Unable to ensure new capabilities deliver value
Roadmap “On-time, on-budget”focusLack of Value
ReadinessOrganizational Culture,
Technology Factors
© SAP AG 2009. All rights reserved. / Page 17
FUNDINGAPPROVED
30-60 days 90 days Beyond
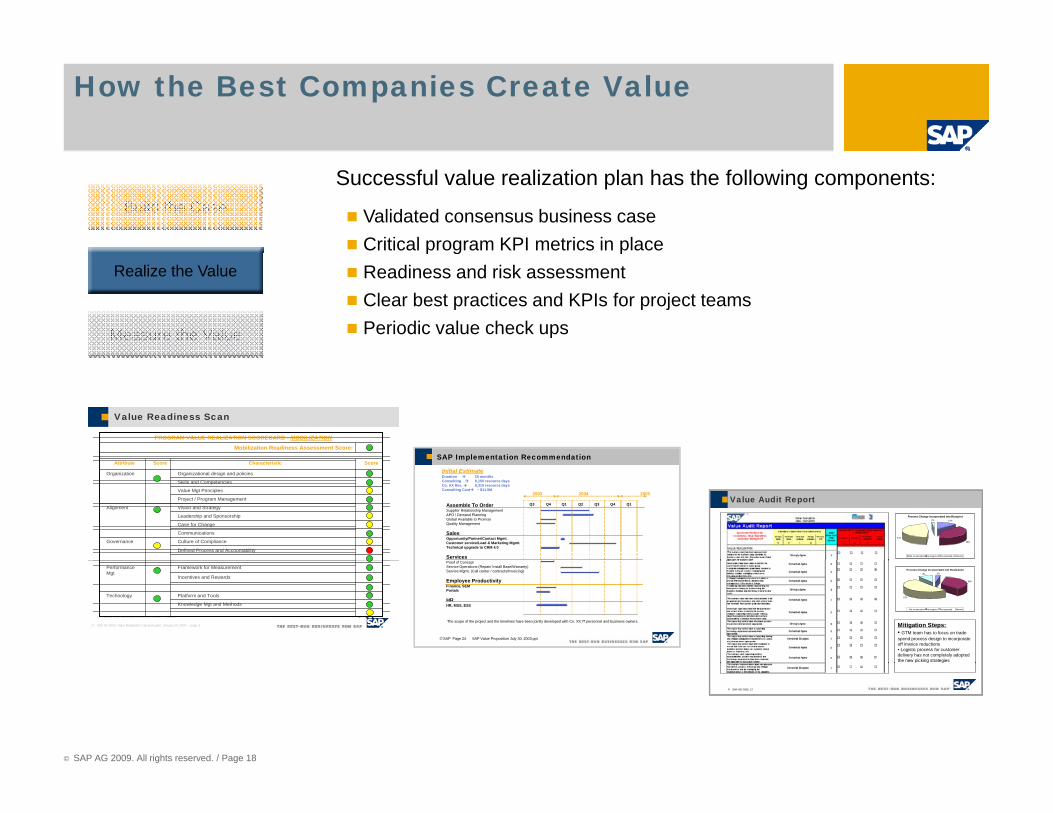
How the Best Companies Create Value
Successful value realization plan has the following components:
Validated consensus business caseCritical program KPI metrics in place
Build the Case
p g pReadiness and risk assessmentClear best practices and KPIs for project teamsPeriodic value check upsMeasure the Value
Realize the Value
SAP Implementation RecommendationSAP Implementation Recommendation
Value Readiness Scan
Mobilization Readiness Assessment Score:
PROGRAM VALUE REALIZATION SCORECARD - MOBILIZATION
Value Audit Report
Process Change incorporated into Blueprint13%
38%
47%
2%
Not incorporated In progress Incorporated Deferred
Value Audit Report
Process Change incorporated into Blueprint13%
38%
47%
2%
Not incorporated In progress Incorporated Deferred
Q1Q4Q3Q2Q1Q4Q3
SAP Implementation Recommendation
Assemble To OrderSupplier Relationship Management APO / Demand PlanningGlobal Available to PromiseQuality Management
SalesOpportunity/Partner/Contact Mgmt.Customer service/Lead & Marketing Mgmt.Technical upgrade to CRM 4.0
Services
Initial EstimateDuration 15 monthsConsulting 6,150 resource daysCo. XX Res. 8,310 resource days Consulting Cost ~ $11.5M
2003 2004 2005
Q1Q4Q3Q2Q1Q4Q3
SAP Implementation Recommendation
Assemble To OrderSupplier Relationship Management APO / Demand PlanningGlobal Available to PromiseQuality Management
SalesOpportunity/Partner/Contact Mgmt.Customer service/Lead & Marketing Mgmt.Technical upgrade to CRM 4.0
Services
Initial EstimateDuration 15 monthsConsulting 6,150 resource daysCo. XX Res. 8,310 resource days Consulting Cost ~ $11.5M
2003 2004 2005Value Mgt Principles
Culture of ComplianceGovernance
Defined Process and Accountability
Skills and Competencies
Project / Program Management
Vision and StrategyAlignment
Leadership and Sponsorship
Organization
Attribute
Communications
Case for Change
Organizational design and policies
ScoreCharacteristicScore
Process Change incorporated into Realization3%
36%
52%
9%
Not incorporated In progress Incorporated Deferred
Mitigation Steps:• GTM team has to focus on trade spend process design to incorporate off invoice reductions• Logistic process for customer delivery has not completely adopted the new picking strategies
©SAP Page 24 SAP Value Proposition July 30, 2003.ppt
Proof of ConceptService Operations (Repair/ Install Base/Warranty)Service Mgmt. (Call center / contracts/Invoicing)
Employee ProductivityFinance, SEMPortals
HRHR, MSS, ESS
The scope of the project and the timelines have been jointly developed with Co. XX IT personnel and business owners.
©SAP Page 24 SAP Value Proposition July 30, 2003.ppt
Proof of ConceptService Operations (Repair/ Install Base/Warranty)Service Mgmt. (Call center / contracts/Invoicing)
Employee ProductivityFinance, SEMPortals
HRHR, MSS, ESS
The scope of the project and the timelines have been jointly developed with Co. XX IT personnel and business owners.© SAP AG 2006, Value Realization Call and Learn, January 20, 2006 – page 3
© SAP AG 2006 Value Realization FAST START – page 12
Incentives and Rewards
Knowledge Mgt and Methods
Platform and ToolsTechnology
Performance Mgt
Framework for Measurement
© SAP AG 2009. All rights reserved. / Page 18
© SAP AG 2005 12© SAP AG 2005 12

How the Best Companies Measure Value
Each targeted value area must have specific governance plan in the project.
Value Source Baseline Improvement % BenefitBuild the Case
IT Auditing Costs $2.0 M 30 - 40 % $0.6 – 0.8 M
Financial Auditing Costs $5.0 M 8 - 12 % $0.4 – 0.6 M
Budget-to-Report Productivity $12.0 M 10 - 15 % $1.2 – 1.8 M
Realize the Value
Total Annual Impact $2.2 – 3.2 MMeasure the Value
Value Area Key KPIs Owner Project Team
ValueStatus
Related Initiatives
IT Auditing costs IT Audit cost as % of total audit cost
Eva Posch (EP)Bill Ditch (PO)
Finance Sarbanes Oxley
Financial Auditing Costs
Audit costs as % of finance cost
Eva Posch (EP)Bill Ditch (PO)
Finance Sarbanes Oxley
Budget to Report Productivity
Finance FTE per SG&A cost
Eva Posch (EP)Bill Ditch (PO)
Finance Shared Services
© SAP AG 2009. All rights reserved. / Page 19
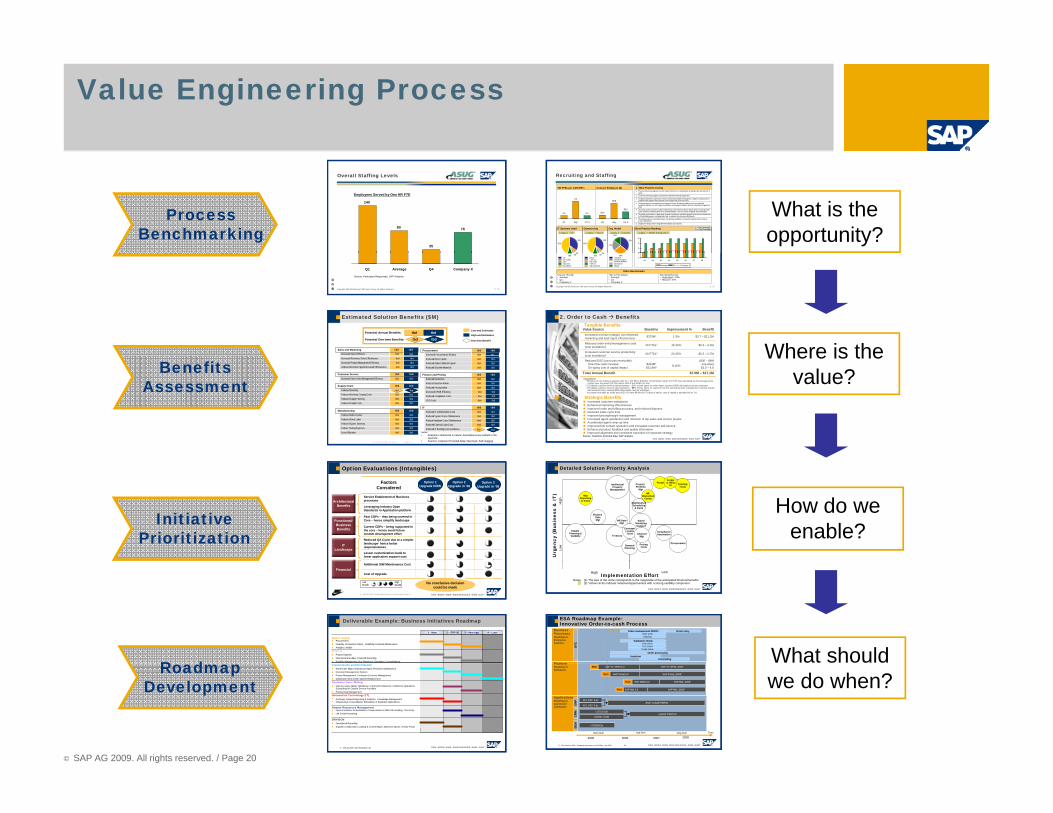
Value Engineering Process
ProcessBenchmarking
Overall Staffing Levels
140
80
35
76
Employees Served by One HR FTE
Overall Staffing Levels
140
80
35
76
Employees Served by One HR FTE
Recruiting and Staffing
HR FTEs per 1,000 EE’s Cost per Employee ($)
Applicant tracking system is integrated with employee data repository8
Recruiting system has automated analysis and reporting capabilities to analyze the talent pool and to measure source effectiveness
7
Recruiting system delivers a broad range of reports and analyses specifically designed to measure the effectiveness of the Recruiting process, including time to hire, acceptance rate and source effectiveness
6
Employee performance expectations clearly communicated during Recruiting process. Applicant tracking system is integrated with employee data repository; no re-keying of data at the time of hire
3
5
4
2
1
# Best Practice Listing
Hiring managers have comprehensive recruiting self-service, including the ability to create and submit job requirement profiles, the use of approval workflows; and viewing of candidate short lists and profile and application data Recruiting system automates candidate administration, with interview invitation, rejection letters and standard offer letters generated automatically based on standard templates, and assessments completed and tracked online
Extensive pretesting of applicants performed to determine fit with job requirements
External and internal applicants are able to place themselves in a talent pipeline according to their own interests or goals
Best Practice Ranking 1 = No Coverage5 = Full Coverage1 = No Coverage5 = Full CoverageOutsourcingIT Systems Used Org. Model
45%35%
5%
45%35%
5%
14%
21%
36%
2
3
4
5
0.1
0.4
0.1
Q1 Avg Co X
$14
$58
$26
Q1 Avg Co X
Company X = between Average and Q1Company X = SAP Company X = CentralizedCompany X = Inhouse
What is the opportunity?
2. Order to Cash Benefits Tangible Benefits
$0.5 – 0.7M20-25%60 FTEs3Increased customer service productivity (cost avoidance)
$0.3 – 0.4M15-20%40 FTEs2Reduced order entry/management costs (cost avoidance)
$3.7 – $11.2M1-3%$375M1Increased revenue (margin) via enhanced marketing and lead mgmt effectiveness
Improvement % BenefitBaseline Value Source
Estimated Solution Benefits ($M)
Low-end Estimates
High-end Estimatestbd tbd
One-time Benefit
Potential Annual Benefits:
Potential One-time Benefits: tbd tbd
tbdtbdSales and MarketingtbdtbdIncreased Sales Efficiency
tbdtbdProcurementtbdtbdIncreased Procurement Efficiency
Estimated Solution Benefits ($M)
Low-end Estimates
High-end Estimatestbd tbd
One-time Benefit
Potential Annual Benefits:
Potential One-time Benefits: tbd tbd
tbdtbdSales and MarketingtbdtbdIncreased Sales Efficiency
tbdtbdProcurementtbdtbdIncreased Procurement Efficiency
P. 13
Q1 Average Q4 Company X
Source: Participant Responses, SAP Analysis
P. 13
Q1 Average Q4 Company X
Source: Participant Responses, SAP Analysis
P. 37
Cost per Hire ($):• Average:• Q1:• Company X:
Time to Hire (Days):• Average:• Q1:• Company X:
Recruiting Process:• Automated = 53%• Manual = 47%
Other Benchmarks
Manual/NoneOutsourced
SAP & OtherOther
SAP
Decentralized
Centrally managed /decentrally deployed
Centralized
Offshore
< 33% O.S.33% to 66%
Inhouse
Fully Outsourced> 66% O.S.
10% 5%5%
10% 5%5%
29%1
2
#1 #2 #3 #4 #5 #6 #7 #8
Average Q1 Company X
Where is theBenefits
Assessment
© SAP AG 2005, VE Plan page 6
Source: Customer-provided data. SAP analysis.
Strategic BenefitsIncreased customer satisfactionEnhanced marketing effectivenessImproved order and billing accuracy, and reduced disputesReduced sales cycle timeImproved pricing/margin managementIncreased agent satisfaction and retention of top sales and service peopleAccelerated agent ramp-up time Improved first contact resolution and increased customer self-serviceEnhanced product feedback and quality informationImproved alignment and consistent execution of corporate strategy
($36 – 68Mone-time)$2.5 – 4.88-15%$454M4
$31.8M4
Reduced DSO (accounts receivable):One-time cash increaseOn-going cost of capital impact
(cost avoidance)
$7.0M – $17.1MTotal Annual BenefitAssumptions
1 Revenue for the trailing 4 quarters (Q4 ’04 – Q3 ’05) is $1931M; ‘Incremental’ margin of 19.4% was calculated as the average gross margin over the period (22.2%) minus 25% of the SG&A (11.4%)
2 120 global customer service representatives; ~33% of time spent on order mgmt; assume $45k fully-loaded cost per employee3 120 global customer service representatives; ~50% of time spent on customer service (excluding order management, training, breaks
and vacation time); assume $45k fully-loaded cost per employee4 Accounts receivable as of the end of Q3 ’05 were $454M (or 78 days of sales); cost of capital is assumed to be 7%.
© SAP AG 2005, VE Plan page 2
Notes:• Analysis is directional in nature; Assumptions are outlined in the
appendix • Sources: Customer-Provided Data; Interviews; SAP analysis
tbdtbdReduce Tooling Expenses
tbdtbdReduced Spares Inventory
tbdtbdAsset Utilization
tbdtbdIncreased Product Management EfficiencytbdtbdIncreased Revenues/ Sales Effectiveness
tbdtbdManufacturing
tbdtbdSupply Chain
tbdtbdCustomer Service
tbdtbdReduced Direct LabortbdtbdReduced Indirect Labor
tbdtbdReduced Freight CoststbdtbdReduced Supply Planning
tbdtbdReduced Inventory Carrying CostsReduced Inventory
tbdtbdIncreased Sales Order Management Efficiency
tbdtbdReduced Incentive Spend/ Increased Effectiveness
tbdtbdReduce Deduction Admin
tbdtbdReduced Indirect Material SpendtbdtbdReduced Direct Spend
tbdtbdReduce Hardware Costs / Maintenance
tbdtbdReduced Compliance CoststbdtbdIncreased AP/AR Efficiency
tbdtbdReduced System Costs / Maintenance
tbdtbdReduced External Labor Costs
tbdtbdIT
tbdtbdFinance and Pricing
Reduced IT Backlog (cost avoidance)
tbdtbdReduced IT Administrative Costs
tbdtbdDSO Costs
tbdtbdReduced Pricing Admin
tbdtbdReduced Deductions
tbdtbdReduced Obsolete Materials
tbdtbdIncreased Procurement Efficiency
tbd tbd
tbd tbd
Where is the value?
InitiativePrioritization
Lesser customization leads to lower application support cost
Reduced QA Cycle due to a simpler landscape- hence better responsiveness
Leveraging Industry Open Standards in Application platform
Past CDPs – they being covered in Core – hence simplify landscape
Current CDPs – being supported in the core – hence avoid future custom development effort
Service Enablement of Business processes
FactorsConsidered
Option Evaluations (Intangibles)
Option 2Upgrade in ‘06
Option 1Upgrade NOW
Option 3Upgrade in ‘08
Architectural Benefits
Functional/ Business Benefits
IT Landscape
Detailed Solution Priority Analysis
Urg
ency
(B
usin
ess
& I
T)
TrainingTools
Project / Portfolio
Mgt
Finance DataMgt
IntellectualProperty
Management
Low
Hig
h
Treasury
Supply Planning &
Visibility
DemandPlanning
HR Interaction
Center
HR DataMgt
ComplianceAutomation
Sales/MarketingSupport
ProcurementPricingTools
Portal
CustomerLoyaltyTools
MaintenanceScheduling
& Parts
MgrReporting& Tools
ChannelMgt
Forms& Office
UI
How do we enable?
© SAP AG 2005, Confidential Document / For Discussion Only / 5
Additional S/W Maintenance Cost
Cost of UpgradeFinancial
HighBenefit
LowBenefit No conclusive decision
could be made
© SAP AG 2005, Confidential Document / For Discussion Only / 5
Additional S/W Maintenance Cost
Cost of UpgradeFinancial
HighBenefit
LowBenefit No conclusive decision
could be made
R d
Power Supply ProcurementUsability, Production Orders, Reliability Centered MaintenanceAnalytics, Mobile
FinanceProject SystemsNew General Ledger, Financial ReportingPortfolio Management, Bus Planning & Simulation, Consolidations
2 – ERP 05 3 – New App 4 – Later1 - Now
Deliverable Example: Business Initiatives Roadmap
Power Supply ProcurementUsability, Production Orders, Reliability Centered MaintenanceAnalytics, Mobile
FinanceProject SystemsNew General Ledger, Financial ReportingPortfolio Management, Bus Planning & Simulation, Consolidations
2 – ERP 05 3 – New App 4 – Later1 - Now
Deliverable Example: Business Initiatives Roadmap ESA Roadmap Example: Innovative Order-to-cash Process
Platform
Business ProcessesRoadmap to Enterprise Services
Order entry
OTC
Order management (IDOC)order entryClearing
Validation CheckATP checkGTS check
Credit checkOrder processing
InvoicingControlling
ESA Roadmap Example: Innovative Order-to-cash Process
Platform
Business ProcessesRoadmap to Enterprise Services
Order entry
OTC
Order management (IDOC)order entryClearing
Validation CheckATP checkGTS check
Credit checkOrder processing
InvoicingControlling
Implementation EffortLowHigh
Notes: (1) The size of the circle corresponds to the magnitude of the anticipated financial benefits(2) Yellow circles indicate initiatives/opportunities with a strong usability component
Implementation EffortLowHigh
Notes: (1) The size of the circle corresponds to the magnitude of the anticipated financial benefits(2) Yellow circles indicate initiatives/opportunities with a strong usability component
What should
© SAP AG 2009. All rights reserved. / Page 20
RoadmapDevelopment
© SAP AG 2006, Value Realization / 24
Transmission and DistributionWork Order Mgmt, Warehouse Mgmt, Predictive MaintenanceDocument Management SystemProject Management, Contractor & Invoice ManagementDistribution Work Order System Replacement
Customer Care / BillingData Accuracy, Meter Validations, Credit and Collections, Collections Operations, Scheduling for Outside Service ProvidersEnergy Data Management
Information Technology (IT)Archiving, General Reporting & Analytics, Knowledge ManagementInfrastructure Consolidation, Elimination of Duplicate Applications
Human Resources ManagementOpen Enrollment Consolidation, Compensation & Skills DB, Auditing, Time Entry Life Event Processing
SRM/SCMOperational ReportingSupplier Collaboration, Catalog & Content Mgmt, Maverick Spend, Vendor Portal
© SAP America 2006 Roadmap Imperatives, Jack Childs July 2006 42
2005 2006 2008Time
2007
short term mid term long term
ApplicationsRoadmap toApplicationLandscape
R/3 „P01“ 4.6c
R/3 „P02“ 4.6c„P03“ mySAP ERP05
LOTUS DB
SIEBEL CRMmySAP CRM 5.0
HYPERION
ERP
CR
MSE
M
PlatformRoadmap toNetweaver
SAP XI / BPM 3.0 SAP XI / BPM „2006“
SAP Portal 6.0 SAP Portal „2006“
SAP MDM 3.0PoC
PoC
PoC
SAP BW 3.5PoC SAP BW „2006“
SAP BW „2006“
© SAP America 2006 Roadmap Imperatives, Jack Childs July 2006 42
2005 2006 2008Time
2007
short term mid term long term
ApplicationsRoadmap toApplicationLandscape
R/3 „P01“ 4.6c
R/3 „P02“ 4.6c„P03“ mySAP ERP05
LOTUS DB
SIEBEL CRMmySAP CRM 5.0
HYPERION
ERP
CR
MSE
M
PlatformRoadmap toNetweaver
SAP XI / BPM 3.0 SAP XI / BPM „2006“
SAP Portal 6.0 SAP Portal „2006“
SAP MDM 3.0PoC
PoC
PoC
SAP BW 3.5PoC SAP BW „2006“
SAP BW „2006“ we do when?
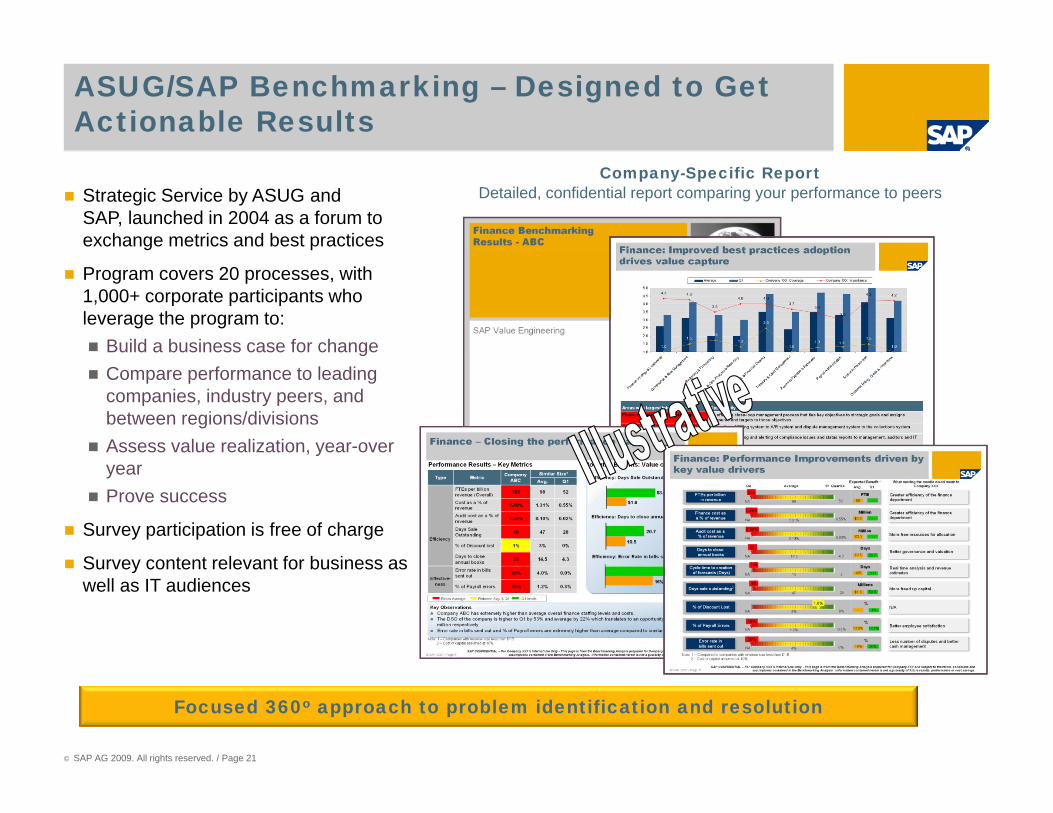
ASUG/SAP Benchmarking – Designed to Get Actionable Results
Strategic Service by ASUG and SAP, launched in 2004 as a forum to exchange metrics and best practices
Company-Specific ReportDetailed, confidential report comparing your performance to peers
Program covers 20 processes, with 1,000+ corporate participants who leverage the program to:
Build a business case for changegCompare performance to leading companies, industry peers, and between regions/divisionsAssess value realization, year-over yearProve success
Survey participation is free of charge
Survey content relevant for business asSurvey content relevant for business as well as IT audiences
© SAP AG 2009. All rights reserved. / Page 21
Focused 360o approach to problem identification and resolution
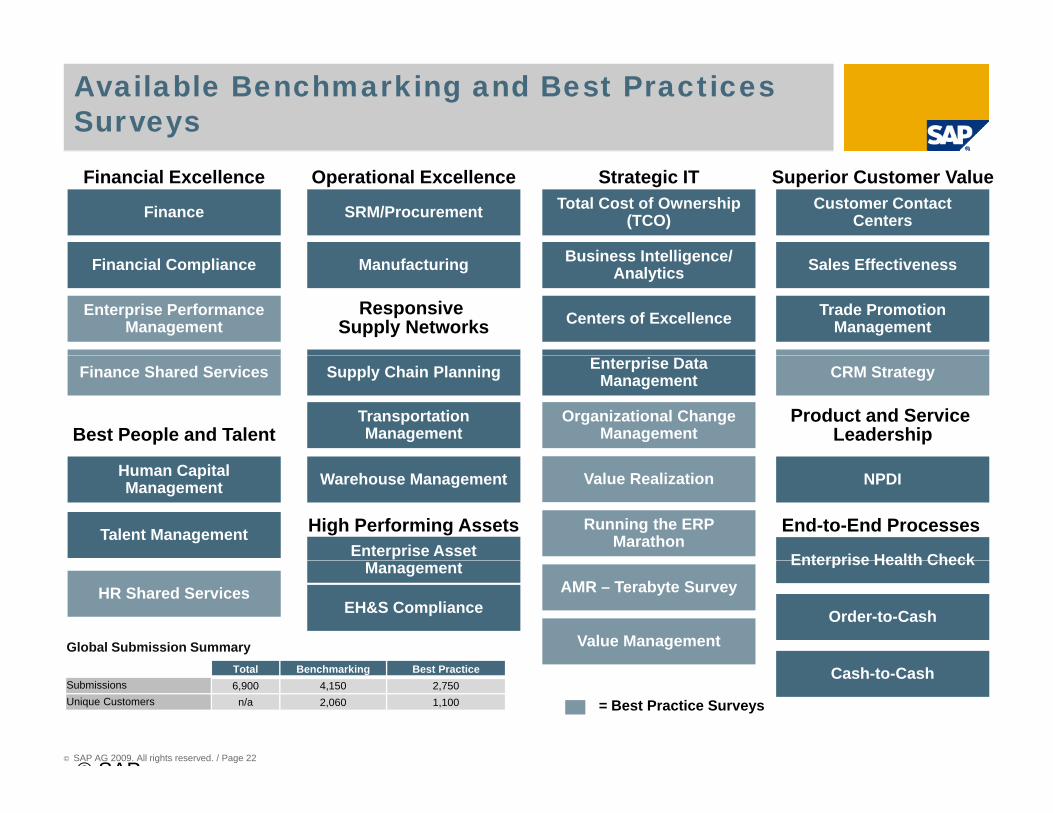
Available Benchmarking and Best Practices Surveys
Financial Excellence Strategic ITCustomer Contact
CentersFinance Total Cost of Ownership (TCO)SRM/Procurement
B siness Intelligence/
Operational Excellence Superior Customer Value
Sales EffectivenessFinancial Compliance Business Intelligence/ AnalyticsManufacturing
Trade Promotion ManagementCenters of ExcellenceResponsive
Supply NetworksEnterprise Performance
Management
Best People and TalentProduct and Service
LeadershipOrganizational Change
ManagementTransportation Management
CRM StrategySupply Chain PlanningFinance Shared Services Enterprise Data Management
Human Capital Management
Talent Management
NPDI
Enterprise Health Check
Running the ERP Marathon
Value RealizationWarehouse Management
Enterprise Asset High Performing Assets End-to-End Processes
Order-to-Cash
Enterprise Health CheckAMR – Terabyte Survey
Management
EH&S ComplianceHR Shared Services
Value ManagementGlobal Submission Summary
© SAP AG 2009. All rights reserved. / Page 22
= Best Practice Surveys
Cash-to-CashTotal Benchmarking Best PracticeSubmissions 6,900 4,150 2,750Unique Customers n/a 2,060 1,100
© SAP

NewCo Corporate Objectives
Improved visibility to execution activitiesB tt t f t d iBetter management of procurement and sourcing activitiesReal time performance measurementFinancial / physical synchronization
Reduce Operating
Costs
Improvement opportunity prioritization
Increasing Profitability
Global visibility to key business driversDetailed cost & profitability analysisFinancial modeling / simulation
Enhance Product
Reduce operating costsIncrease capital efficiency and free cash flow Improve labor productivityDrive innovation and new Financial modeling / simulation
Scalability to handle increased volumesMarginsDrive innovation and new
product introductionEnhance ability to capture profitable growth opportunities
© SAP AG 2009. All rights reserved. / Page 23
© SAP
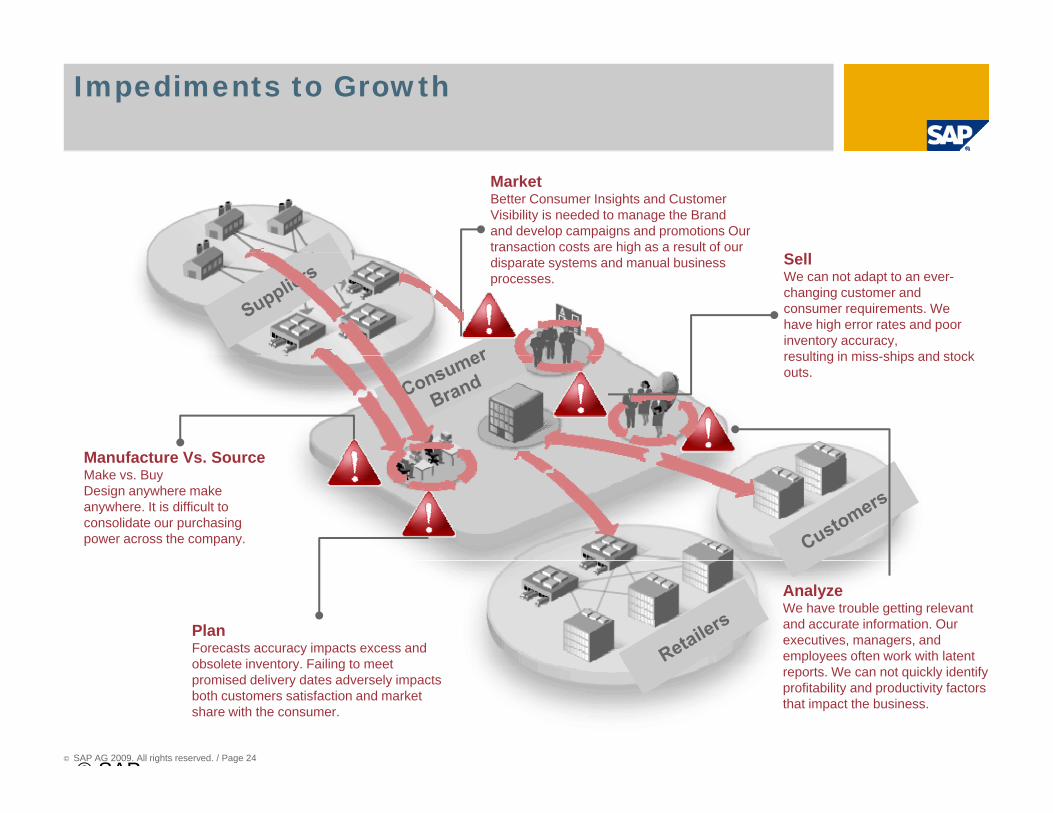
Impediments to Growth
Market Better Consumer Insights and Customer Visibility is needed to manage the Brand and develop campaigns and promotions Our transaction costs are high as a result of our
Sg
disparate systems and manual business processes.
SellWe can not adapt to an ever-changing customer and consumer requirements. We have high error rates and poor inventory accuracy, resulting in miss ships and stock
Manufacture Vs Source
resulting in miss-ships and stock outs.
Manufacture Vs. Source Make vs. BuyDesign anywhere make anywhere. It is difficult to consolidate our purchasing power across the company.
AnalyzeWe have trouble getting relevant and accurate information. Our executives, managers, and employees often work with latent
PlanForecasts accuracy impacts excess and obsolete inventory Failing to meet
© SAP AG 2009. All rights reserved. / Page 24
yreports. We can not quickly identify profitability and productivity factors that impact the business.
obsolete inventory. Failing to meet promised delivery dates adversely impacts both customers satisfaction and market share with the consumer.
© SAP
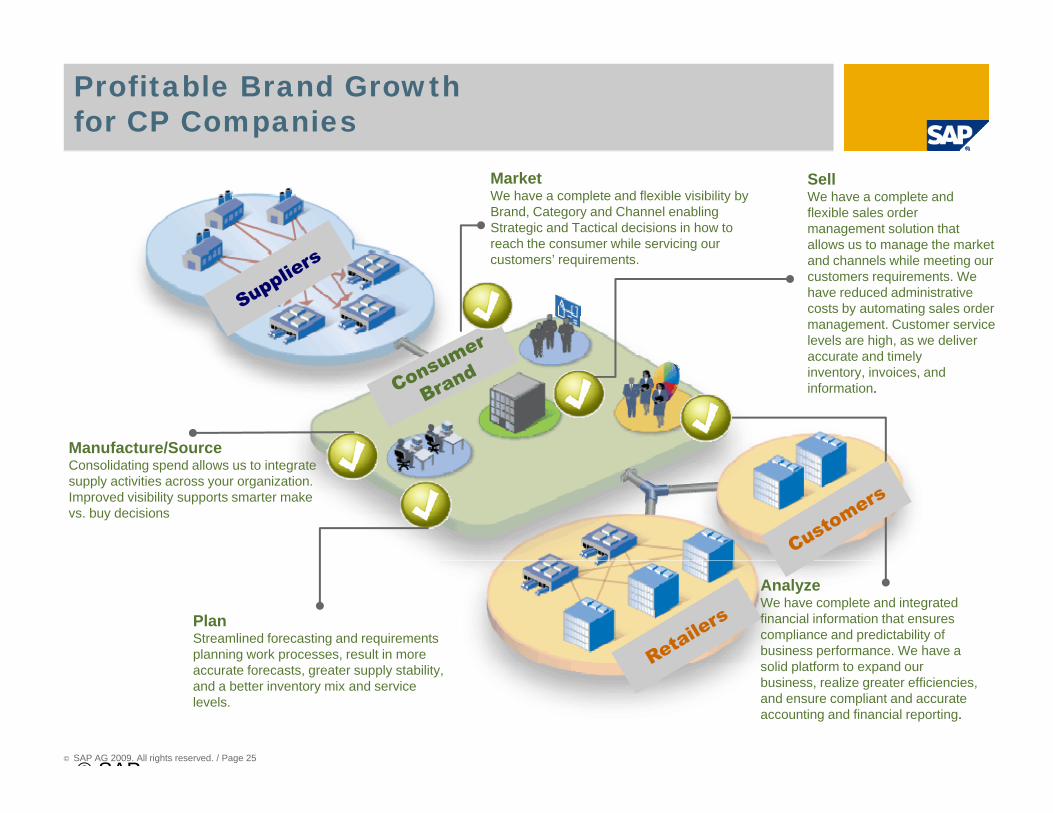
Profitable Brand Growth for CP Companies
MarketWe have a complete and flexible visibility by Brand, Category and Channel enabling Strategic and Tactical decisions in how to reach the consumer while servicing our
SellWe have a complete and flexible sales order management solution that allows us to manage the market
customers’ requirements. and channels while meeting our customers requirements. We have reduced administrative costs by automating sales order management. Customer service levels are high, as we deliver accurate and timely
Manufacture/Source
accurate and timely inventory, invoices, and information.
Consolidating spend allows us to integrate supply activities across your organization. Improved visibility supports smarter make vs. buy decisions
PlanStreamlined forecasting and requirements planning work processes, result in more
AnalyzeWe have complete and integrated financial information that ensures compliance and predictability of business performance. We have a
lid l tf t d
© SAP AG 2009. All rights reserved. / Page 25
accurate forecasts, greater supply stability, and a better inventory mix and service levels.
solid platform to expand our business, realize greater efficiencies, and ensure compliant and accurate accounting and financial reporting.
© SAP
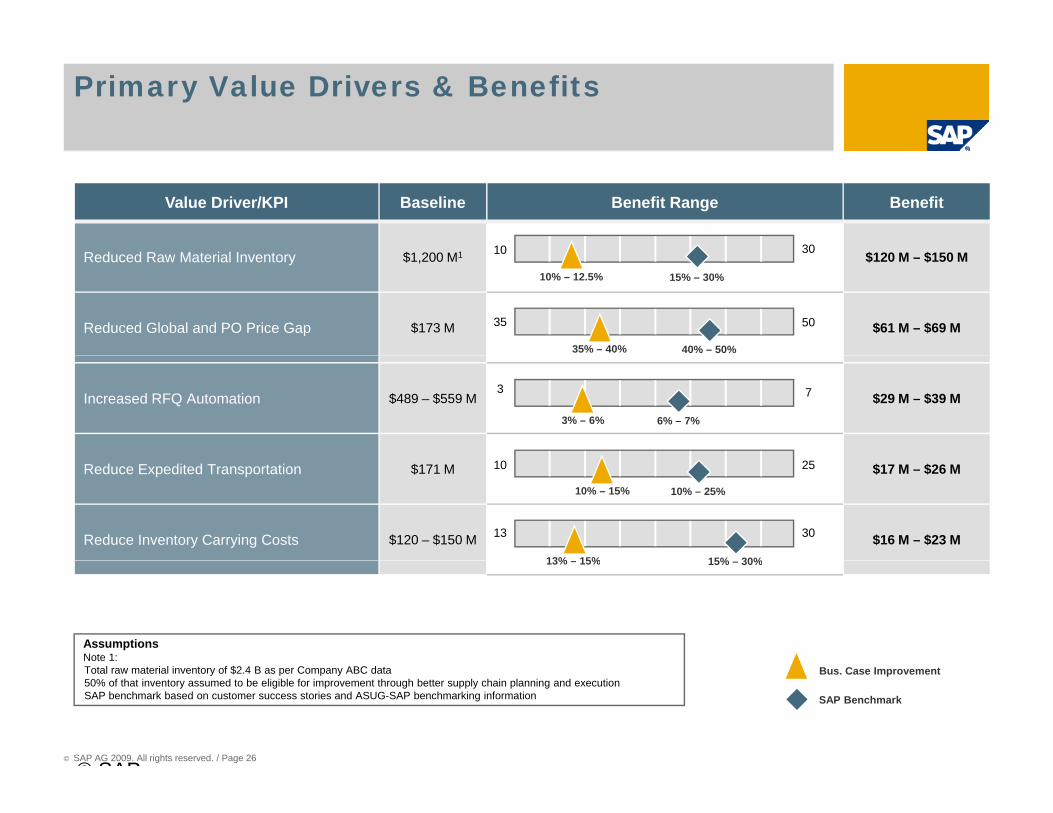
Primary Value Drivers & Benefits
Value Driver/KPI Baseline Benefit Range Benefit
R d d R M t i l I t $1 200 M1 $120 M $150 M3010Reduced Raw Material Inventory $1,200 M1 $120 M – $150 M
Reduced Global and PO Price Gap $173 M $61 M – $69 M40% – 50%35% – 40%
5035
15% – 30%10% – 12.5%
3010
Increased RFQ Automation $489 – $559 M $29 M – $39 M6% – 7%3% – 6%
73
Reduce Expedited Transportation $171 M $17 M – $26 M
Reduce Inventory Carrying Costs $120 – $150 M $16 M – $23 M15% 30%13% 15%
3013
10% – 25%10% – 15%
2510
AssumptionsNote 1:
15% – 30%13% – 15%
© SAP AG 2009. All rights reserved. / Page 26
•Total raw material inventory of $2.4 B as per Company ABC data•50% of that inventory assumed to be eligible for improvement through better supply chain planning and execution•SAP benchmark based on customer success stories and ASUG-SAP benchmarking information
Bus. Case Improvement
SAP Benchmark
© SAP

Estimated Benefits: $189 M – $254 M Annual and $135 M – $176 M One-time
Conservative EstimateLikely Scenario$189 M $254 M
$135 M $176 M
Potential Annual Benefits:
Potential One-Time Benefits: One-Time Benefit
Direct Materials Procurement $119 M $149 MReduced Global and PO Price Gap $61 M $69 MReduced Spend via Parts Consolidation $13 M $19 MIncreased RFQ Automation $29 M $39 MR d d S d i D l i P h $16 M $22 M
Quotation Management $7 M $10 MImproved Margins for New Quotes $5 M $7 MImproved Quoting-related Efficiency $2 M $3 M
Human Resources $7 M $10 MReduced Spend via Delaying Purchases $16 M $22 M
Supply Chain Management $43 M $68 M
Reduced Inventory (One-time)
Reduce Obsolete Inventory
Reduced Employee Turnover $4 M $6MIncreased Manager Self-Service $3 M $4 M
Finance/Analytics $8 M $10 MImproved Analytics-related Efficiency $4 M $5 M
$120 M $150 M
$15 M $26 M
Reduce Inventory Carrying Costs $16 M $23 MReduce Expedited Transportation $17 M $26 MReduce Freight Costs $10 M $19 M
Manufacturing $5 M $7 MR d L b E $3 M $5 M
Reduced Treasury Transaction Cost $4 M $5 M
Reduce Labor Expenses $3 M $5 MReduce Non-Labor Expenses $2 M $2 M
© SAP AG 2009. All rights reserved. / Page 27
Source: Company ABC data and SAP analysis
© SAP

Benefits Costs Analysis
Investment Cost & Benefits Flow ($Millions) 5-Year Project Economics
NPV $702 M
IRR 92%$300.00
$350.00
$400.00
Payback 25 Months
3 Month Cost of Delay $5.3 M
$131 00
$261.00 $278.00
$100 00
$150.00
$200.00
$250.00
($78.00)($36.00) ($37.00) ($7.00) ($7.00)
$25.00 $55.00 $55.00$33.00$73.00
$131.00
-$50.00
$0.00
$50.00
$100.00Benefit Assumptions
25%, 50%, 75% and 100% accrual has been assumed in years 1 – 4 year post implementation respectivelyDiscount Rate: 10%-$100.00
Year 1 Year 2 Year 3 Year 4 Year 5
Annual benefits One-time benefits Total cost
Discount Rate: 10%5 year cash flow analysis
© SAP AG 2009. All rights reserved. / Page 28
© SAP

Value Lifecycle Manager
© SAP AG 2009. All rights reserved. / Page 29
© SAP
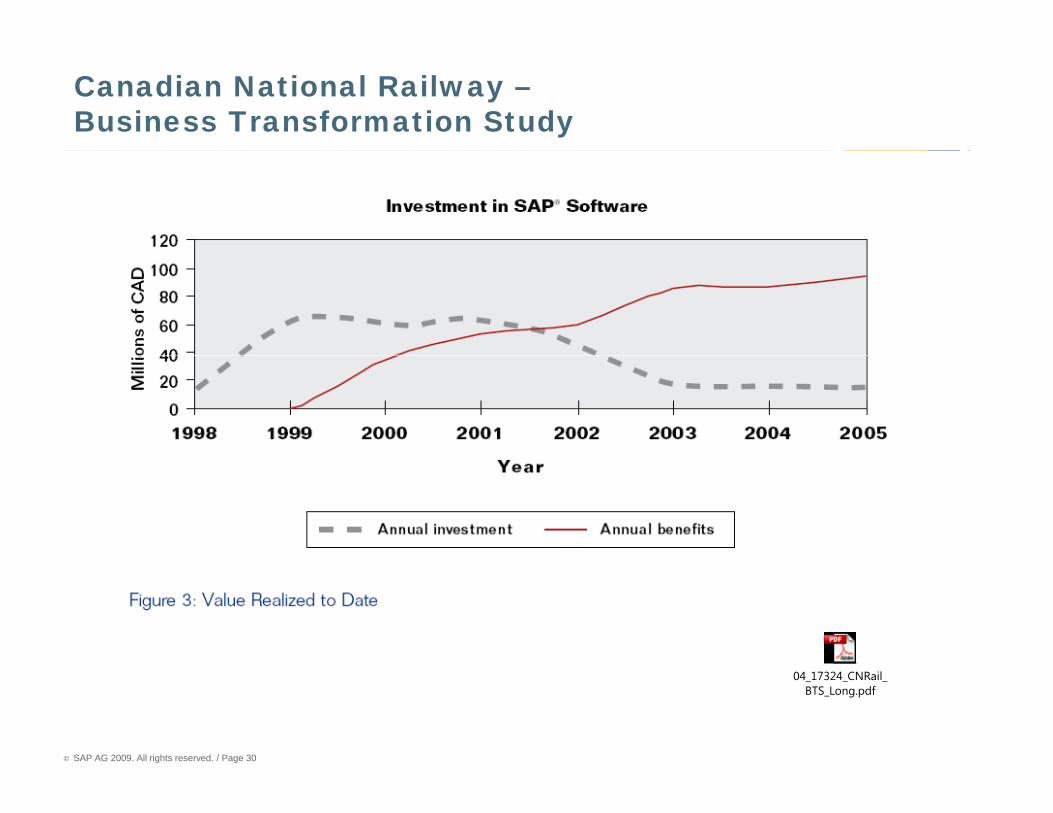
Canadian National Railway –Business Transformation Study
© SAP AG 2009. All rights reserved. / Page 30
04_17324_CNRail_BTS_Long.pdf

Risk Premium Justification
The Risk-justified Project Cost Is Higher Than the Actual Proposed Project Cost of the SAP Solution
$1.75
$1.83
$2.50 $22.58
Implementation Risk Discount off the
risk adjusted cost
$3.00
$3.50
$
$12 20
TCO/ Operational Risk
Country Localization
Technology Platform Risk
MethodologyLocal Presence
Pro
ject
Cos
t
ustif
ied
Cos
t
cost
$10.00
$12.20 Solution flexibility
Risk
Openness of solutionScalability
Supplier Risk
Roadmap & VisionM&A
Solution Risk
Tota
l
duct
/ C
ost To
tal R
isk
Ju
duct
/ n
Cos
t
M&A Exposure (Viability)Local presence
Product CapabilitiesResearch & DevelopmentTechnical ArchitectureC
ompe
ting
Prod
Impl
emen
tatio
n C
Tota
l SA
P P
rod
Impl
emen
tatio
© SAP AG 2009. All rights reserved. / Page 31
All $ in Millions
© SAP
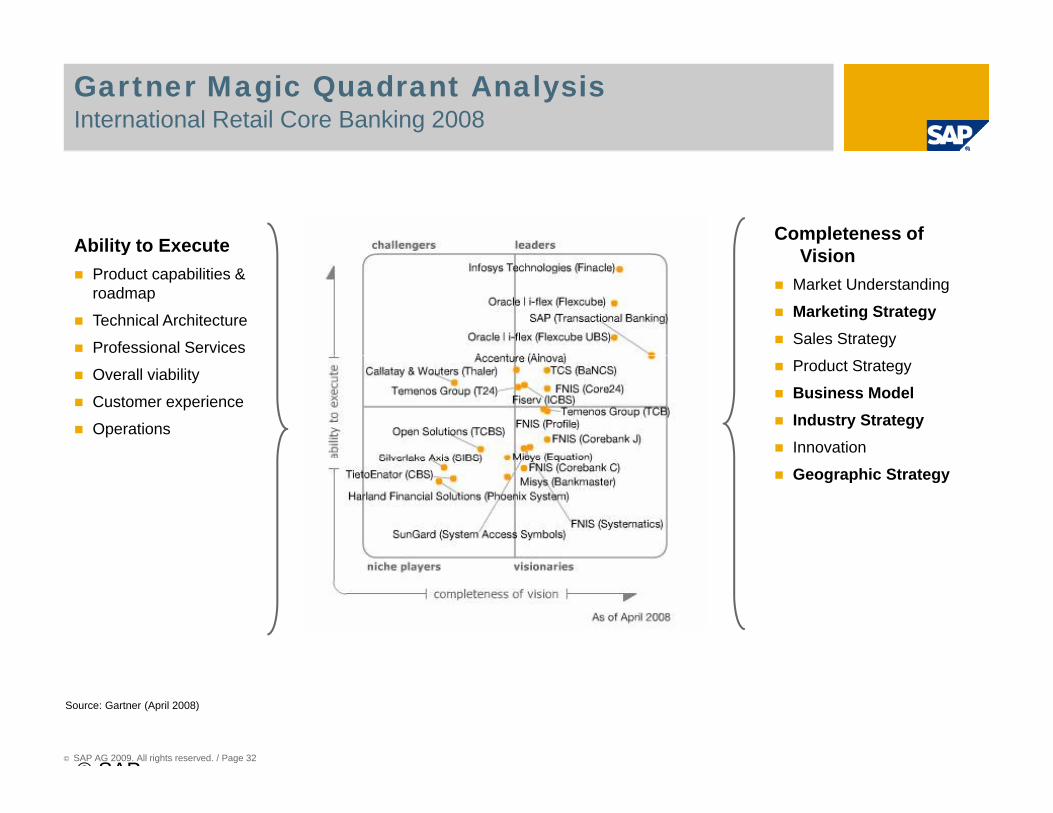
Gartner Magic Quadrant AnalysisInternational Retail Core Banking 2008
Ability to Execute Completeness of Visiony
Product capabilities & roadmap
Technical Architecture
Professional Services
VisionMarket Understanding
Marketing StrategySales Strategy
Overall viability
Customer experience
Operations
Product Strategy
Business ModelIndustry StrategyInnovation
Geographic Strategy
© SAP AG 2009. All rights reserved. / Page 32
Source: Gartner (April 2008)
© SAP
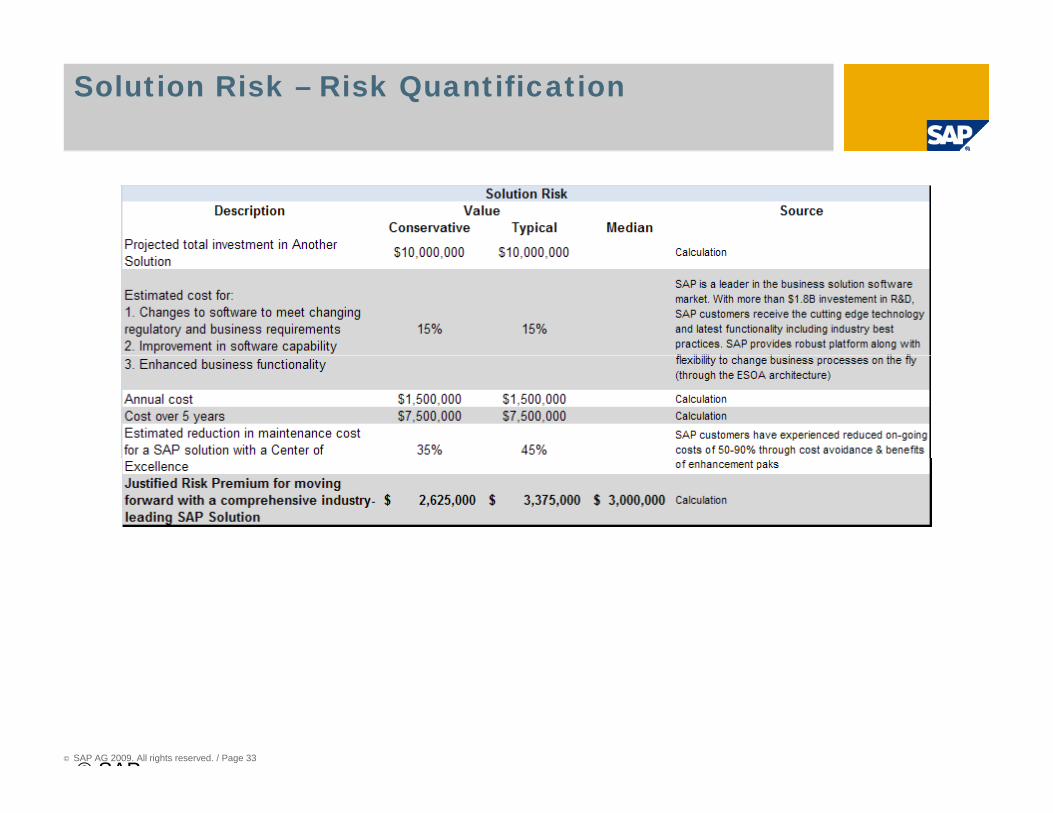
Solution Risk – Risk Quantification
© SAP AG 2009. All rights reserved. / Page 33
© SAP
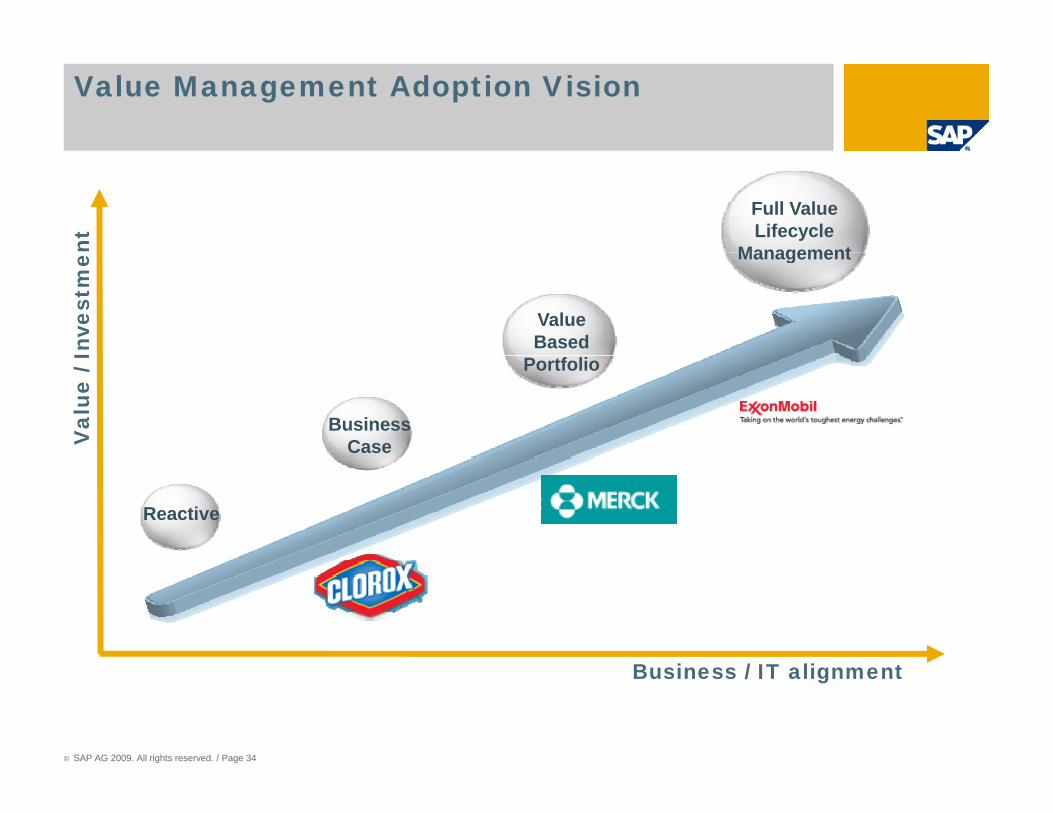
Value Management Adoption Visionnt
Full Value Lifecycle
Management
Inve
stm
e
Value Based
Management
Val
ue /
I
Business Case
Portfolio
Reactive
© SAP AG 2009. All rights reserved. / Page 34
Business / IT alignment

Thank you!
Related Documents