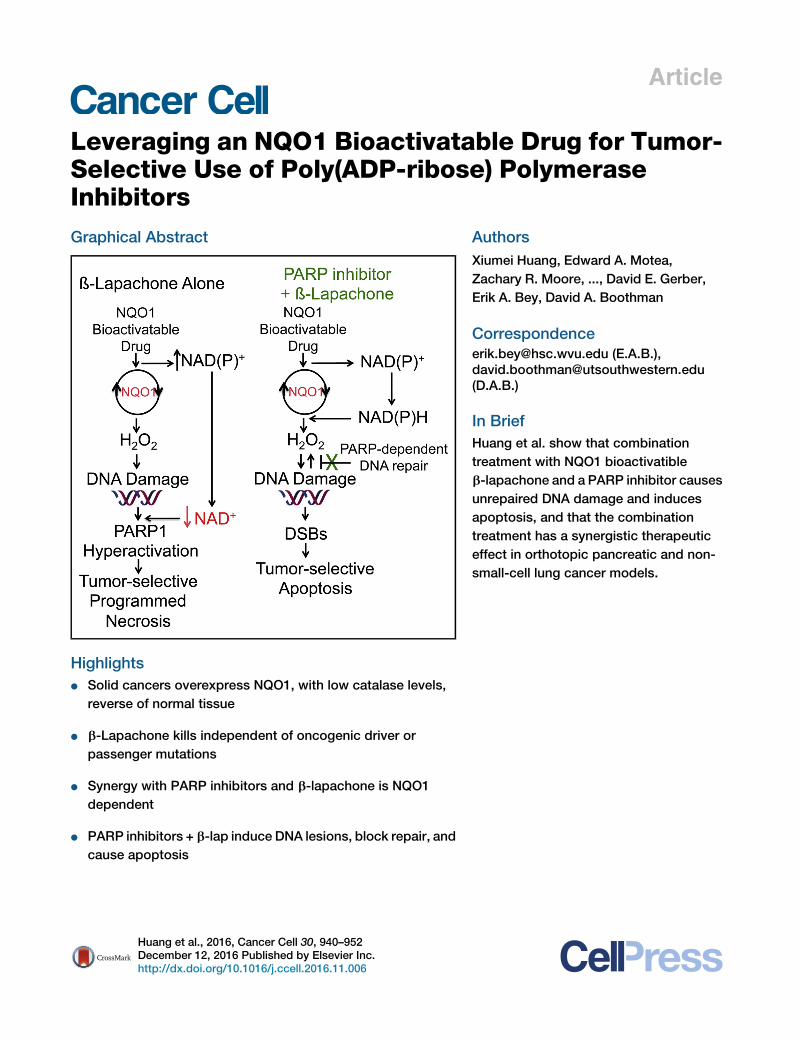
Article Leveraging an NQO1 Bioactivatable Drug for Tumor- Selective Use of Poly(ADP-ribose) Polymerase Inhibitors Graphical Abstract Highlights d Solid cancers overexpress NQO1, with low catalase levels, reverse of normal tissue d b-Lapachone kills independent of oncogenic driver or passenger mutations d Synergy with PARP inhibitors and b-lapachone is NQO1 dependent d PARP inhibitors + b-lap induce DNA lesions, block repair, and cause apoptosis Authors Xiumei Huang, Edward A. Motea, Zachary R. Moore, ..., David E. Gerber, Erik A. Bey, David A. Boothman Correspondence [email protected] (E.A.B.), [email protected] (D.A.B.) In Brief Huang et al. show that combination treatment with NQO1 bioactivatible b-lapachone and a PARP inhibitor causes unrepaired DNA damage and induces apoptosis, and that the combination treatment has a synergistic therapeutic effect in orthotopic pancreatic and non- small-cell lung cancer models. Huang et al., 2016, Cancer Cell 30, 940–952 December 12, 2016 Published by Elsevier Inc. http://dx.doi.org/10.1016/j.ccell.2016.11.006

Welcome message from author
This document is posted to help you gain knowledge. Please leave a comment to let me know what you think about it! Share it to your friends and learn new things together.
Transcript
Article
Leveraging an NQO1 Bioac
tivatable Drug for Tumor-Selective Use of Poly(ADP-ribose) PolymeraseInhibitorsGraphical Abstract
Highlights
d Solid cancers overexpress NQO1, with low catalase levels,
reverse of normal tissue
d b-Lapachone kills independent of oncogenic driver or
passenger mutations
d Synergy with PARP inhibitors and b-lapachone is NQO1
dependent
d PARP inhibitors + b-lap induce DNA lesions, block repair, and
cause apoptosis
Huang et al., 2016, Cancer Cell 30, 940–952December 12, 2016 Published by Elsevier Inc.http://dx.doi.org/10.1016/j.ccell.2016.11.006
Authors
Xiumei Huang, Edward A. Motea,
Zachary R. Moore, ..., David E. Gerber,
Erik A. Bey, David A. Boothman
[email protected] (E.A.B.),[email protected](D.A.B.)
In Brief
Huang et al. show that combination
treatment with NQO1 bioactivatible
b-lapachone and a PARP inhibitor causes
unrepaired DNA damage and induces
apoptosis, and that the combination
treatment has a synergistic therapeutic
effect in orthotopic pancreatic and non-
small-cell lung cancer models.
Cancer Cell
Article
Leveraging an NQO1 Bioactivatable Drug forTumor-Selective Use of Poly(ADP-ribose)Polymerase InhibitorsXiumei Huang,1 Edward A. Motea,1 Zachary R. Moore,1 Jun Yao,1 Ying Dong,1 Gaurab Chakrabarti,1 Jessica A. Kilgore,2
Molly A. Silvers,1 Praveen L. Patidar,1 Agnieszka Cholka,1 Farjana Fattah,1 Yoonjeong Cha,3 Glenda G. Anderson,4
Rebecca Kusko,3 Michael Peyton,5 Jingsheng Yan,6 Xian-Jin Xie,6 Venetia Sarode,7 Noelle S. Williams,2 John D. Minna,5
Muhammad Beg,5 David E. Gerber,5 Erik A. Bey,8,* and David A. Boothman1,9,*1Departments of Pharmacology andRadiationOncology, SimmonsComprehensiveCancer Center (SCCC), UT SouthwesternMedical Center
(UTSW), Dallas, TX 75390, USA2Department of Biochemistry, SCCC, UTSW, Dallas, TX 75390, USA3Immuneering Corporation, One Broadway 14th Floor, Cambridge, MA 02142, USA45Degrees Bio., Inc., 111 North Market Street #300, San Jose, CA 95113, USA5Department of Internal Medicine, Division of Hematology-Oncology6Department of Biostatistics7Department of PathologyUTSW, Dallas, TX 75390, USA8Department of Pharmaceutical Sciences, West Virginia University Cancer Institute, Morgantown, WV 26506, USA9Lead Contact
*Correspondence: [email protected] (E.A.B.), [email protected] (D.A.B.)http://dx.doi.org/10.1016/j.ccell.2016.11.006
SUMMARY
Therapeutic drugs that block DNA repair, including poly(ADP-ribose) polymerase (PARP) inhibitors, fail dueto lack of tumor-selectivity. When PARP inhibitors and b-lapachone are combined, synergistic antitumoractivity results from sustained NAD(P)H levels that refuel NQO1-dependent futile redox drug recycling.Significant oxygen-consumption-rate/reactive oxygen species cause dramatic DNA lesion increases thatare not repaired due to PARP inhibition. In NQO1+ cancers, such as non-small-cell lung, pancreatic, andbreast cancers, cell death mechanism switches from PARP1 hyperactivation-mediated programmed necro-sis with b-lapachonemonotherapy to synergistic tumor-selective, caspase-dependent apoptosis with PARPinhibitors and b-lapachone. Synergistic antitumor efficacy and prolonged survival were noted in human or-thotopic pancreatic and non-small-cell lung xenograft models, expanding use and efficacy of PARP inhibitorsfor human cancer therapy.
INTRODUCTION
Poly(ADP-ribose) polymerase-1 (PARP1) is crucial to multiple
DNA repair pathways, including DNA base excision repair, sin-
gle-strand break (SSB), and double-strand break (DSB) repair
(Dantzer et al., 2000; Wang et al., 2006). Once bound to DNA le-
sions, PARP1 consumes NAD+ and PARylates nearby proteins,
Significance
Inhibitors of poly(ADP-ribose) polymerase (PARP) activity, simtypically toxic to normal tissue, and are only efficacious againscers by synthetic lethality. We show that the NAD(P)H:quinone(ARQ761, ArQule, in clinical form), capitalizes on elevated NQOcancer (NSCLC) and breast cancer to elicit tumor-selective progdriver or passenger mutations. b-Lapachone can be utilized toand efficaciously kill solid tumors that overexpress NQO1.
940 Cancer Cell 30, 940–952, December 12, 2016 Published by Elsev
with activation and deactivation consequences. Self-PARylation
(PAR-PARP1) is a post-translational modification that enzy-
matically inactivates the protein, rendering it unable to bind
DNA and function in DNA repair (Helleday et al., 2008; Lee
et al., 2014). DNA repair defects in breast cancer-associated
genes 1 and 2 (BRCA1/2) yielded hypersensitivity to PARP inhi-
bition and caused a rush to develop new PARP inhibitors for
ilar to other DNA repair blockers, lack tumor-selectivity, aret a small subset of vulnerable (e.g., BRCA1/2-deficient) can-oxidoreductase 1 (NQO1) bioactivatable drug, b-lapachone1:CAT ratios in recalcitrant pancreatic, non-small-cell lungrammed necrosis. Cells are killed independent of oncogenicgreatly expand the use of PARP inhibitors to synergistically
ier Inc.
targeted therapy in these rare (�5%) hereditary breast and
ovarian cancers (Farmer et al., 2005; Sandhu et al., 2013; Under-
hill et al., 2011). This subtype of cancers exhibits defective
homologous recombination (HR) repair and reliance on PARP-
dependent alternative non-homologous end-joining for survival.
Exposing HR-defective BRCA1/2 cells to PARP inhibitors re-
sults in synthetic lethality that stimulated great interest in
PARP inhibitors (Farmer et al., 2005). Attempts to broaden
their clinical application, including combined approaches using
DNA damaging agents (e.g., ionizing radiation, temozolomide,
or gemcitabine; Albert et al., 2007; Jacob et al., 2007; Rajan
et al., 2012) limited tumor-selective rationale and increased
normal tissue toxicities.
NAD(P)H:quinone oxidoreductase 1 (NQO1) bioactivatable
drugs have the potential to deliver tumor-selective DNA dam-
age and cell death. They are a unique class of rare quinones
that include b-lapachone (b-lap, ARQ761 in clinical form) and
deoxynyboquinone (Huang et al., 2012). NQO1 catalyzes the
two-electron oxidoreduction of b-lap to generate an unstable
hydroquinone that spontaneously reacts in a two-step back-re-
action with oxygen to regenerate the original compound (Bey
et al., 2007). NQO1-dependent futile redox cycling oxidizes
�60 moles of NAD(P)H to create �120 moles of reactive oxygen
species (ROS) in �2 min (Pink et al., 2000). High levels of super-
oxide dismutase in cancers generate long-lived and cell mem-
brane-permeable hydrogen peroxide (H2O2) that diffuses into
nuclei to induce massive oxidative base and SSB DNA lesions.
A significant bystander effect, blocked by catalase (CAT), oc-
curs from NQO1+ cancer cells affecting neighboring NQO1�
cancer cells (Bey et al., 2007; Cao et al., 2014). Rapid accumu-
lation of DNA lesions overwhelms DNA repair capacity and
causes ‘‘hyperactivation’’ of PARP. Rapid protein PARylation,
including PAR-PARP1, severe NAD+/ATP depletion, massive
DNA lesions, and repair inhibition follows (Huang et al., 2012).
ROS (H2O2) formation only occurs while pools of NAD(P)H are
available for NQO1-driven futile redox cycling. A lethal b-lap
dose induces caspase-independent programmed necrosis
(i.e., NAD+-Keresis) (Moore et al., 2015). b-Lap-induced cell
death is specific for cancers overexpressing NQO1 and sup-
presses GAPDH/glycolysis, OXPHOS, triggering m-calpain-
directed programmed necrosis (Bey et al., 2007; Pink et al.,
2000; Tagliarino et al., 2001). Although b-lap shows evidence
of single-agent activity in phase 1 clinical trials, strategies to
enhance its efficacy without augmenting toxicity are needed.
We hypothesized that inhibiting PARP activity prior to b-lap
exposure would enhance both agents, extending NQO1-medi-
ated ROS production and inhibiting PARP-driven DNA repair
in a tumor-selective manner.
RESULTS
NQO1:CAT Ratios Offer an Exploitable TherapeuticWindowExamination of NQO1 (Figure 1A) and CAT (Figure 1B) mRNA
expression in matched non-small-cell lung cancer (NSCLC)
tumor tissue showed relatively elevated NQO1 expression,
with concomitant lowered CAT levels compared with associated
normal tissue. As reported previously (Bey et al., 2007; Siegel
et al., 1998), a significant (p % 2.2 3 10�38) elevation in NQO1
mRNA levels in a larger dataset (n = 432) of NSCLC patient tumor
compared with associated normal lung tissue by gene expres-
sion microarray analyses was noted (Figure 1C). In contrast,
CAT mRNA expression was significantly lower (p % 5.6 3
10�48) in tumor compared with normal lung tissue (Figure 1D).
Concomitant high NQO1 and low CAT mRNA levels (high
NQO1:CAT ratios [p% 1.13 10�88]; Figure 1E) in NSCLC tumor
tissue offer an ideal target for NQO1 bioactivatable drugs.
Fresh, snap-frozen pathology-assisted dissection of tumor
compared with associated normal tissue from NSCLC patients
confirmed elevated NQO1 enzyme levels in tumor compared
with normal tissue (Figure 1F). Western analyses confirmed low-
ered catalase levels in NSCLC tumors, with high levels in associ-
ated normal lung tissue (Figure 1G). Immunohistochemical ana-
lyses confirmed NQO1 elevations in NSCLC, pancreatic ductal
adenocarcinoma (PDA), and high-grade cancers, including
triple-negative breast cancers (TNBCs) (Figure S1A). Enzyme as-
says confirmed elevated NQO1 levels in cancer compared with
associated normal tissue (Figures S1B and S1C), evenwhen pro-
tein was not noted by western blots (patient 2823, Figure 1G).
Advanced and treatment-resistant NSCLC cases also exhibit
NQO1 overexpression, with increased levels in patients with pro-
gressive disease compared with patients who exhibited clinical
responses (Figure S1D). Elevated NQO1 levels were greater in
high- versus low-grade PDAs (Figure S1E).
b-Lap Lethality Is NQO1 Dependent, but Not Influencedby Oncogenic Driver or Passenger MutationsA >50-member NSCLC cell line panel was used to examine the
roles of NQO1 and oncogenic driver and passenger mutations
in lethality by b-lap. Lethal dose 50 (LD50) values for each NSCLC
cell line were determined, with or without b-lap (in mMconcentra-
tions, for 2 hr) treatment, ± dicoumarol, a fairly specific NQO1 in-
hibitor (not shown). In a double-blind manner, NQO1 enzyme
levels and polymorphism status (i.e., *2 [C609T] or *3 [C465T])
assessments via restriction fragment-length polymorphism ana-
lyses were measured (Figure 2). LD50 values for b-lap-treated
NSCLC cell lines ranged between 1 and 4 mM, after 2 hr, regard-
less of oncogenic or passenger mutations or deletions. At least
one wild-type NQO1 allele was sufficient for efficient cell killing
by b-lap, as heterozygous *2 or *3 NQO1 SNP cells were killed
with equal efficacy as homozygous wild-type cancer cells. Inhi-
bition of NQO1 by dicoumarol (50 mM, 2 hr) spared b-lap lethality
(not shown), with LD50 values of >20 mM, the highest concentra-
tions used. In contrast, NSCLC cells with homozygous NQO1
polymorphic alleles (i.e., *2 or *3) that lack NQO1 activities (Bey
et al., 2007, 2013) were resistant. Similar hypersensitivities of
PDA and breast cancer cells to b-lap (2–6 mM, 2 hr), indepen-
dent of KRAS, p53, or other oncogenic driver and/or passenger
mutations were also noted (Figures S2A and S2B). Lethality
caused by b-lap in NQO1+ cancer cell lines was noted in all
subtypes, as seen in prostate cancer (Planchon et al., 2001). Di-
coumarol (50 mM, 2 hr) spared NQO1+ cancer cell lines, while
inherently resistant NQO1 polymorphic cells were not sensitive.
Re-expression of wild-type NQO1 in several PDA or breast
NQO1 polymorphic cancer cells restored sensitivity to b-lap at
the 2–6 mM LD50 range, and dicoumarol spared lethality (Figures
S2A and S2B). A similar screen of NSCLC cell lines exposed to
docetaxel or pemetrexed revealed wide-ranging LD50 values
Cancer Cell 30, 940–952, December 12, 2016 941
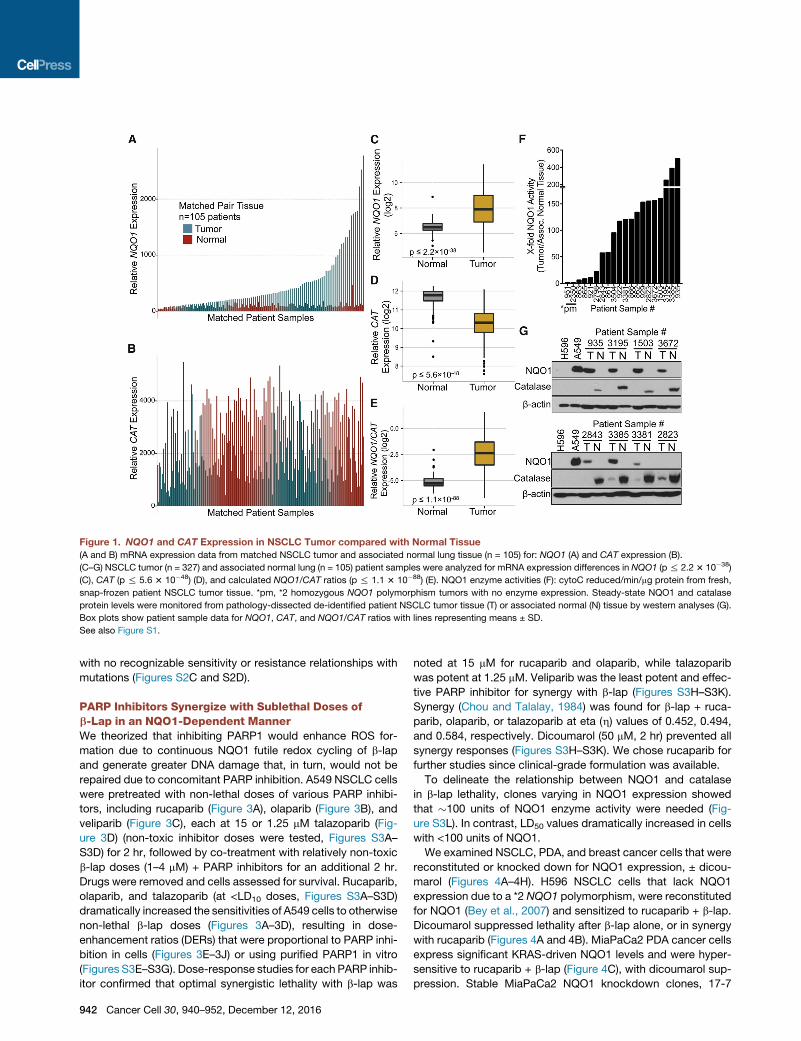
Figure 1. NQO1 and CAT Expression in NSCLC Tumor compared with Normal Tissue
(A and B) mRNA expression data from matched NSCLC tumor and associated normal lung tissue (n = 105) for: NQO1 (A) and CAT expression (B).
(C–G) NSCLC tumor (n = 327) and associated normal lung (n = 105) patient samples were analyzed for mRNA expression differences in NQO1 (p% 2.23 10�38)
(C), CAT (p % 5.6 3 10�48) (D), and calculated NQO1/CAT ratios (p % 1.1 3 10�88) (E). NQO1 enzyme activities (F): cytoC reduced/min/mg protein from fresh,
snap-frozen patient NSCLC tumor tissue. *pm, *2 homozygous NQO1 polymorphism tumors with no enzyme expression. Steady-state NQO1 and catalase
protein levels were monitored from pathology-dissected de-identified patient NSCLC tumor tissue (T) or associated normal (N) tissue by western analyses (G).
Box plots show patient sample data for NQO1, CAT, and NQO1/CAT ratios with lines representing means ± SD.
See also Figure S1.
with no recognizable sensitivity or resistance relationships with
mutations (Figures S2C and S2D).
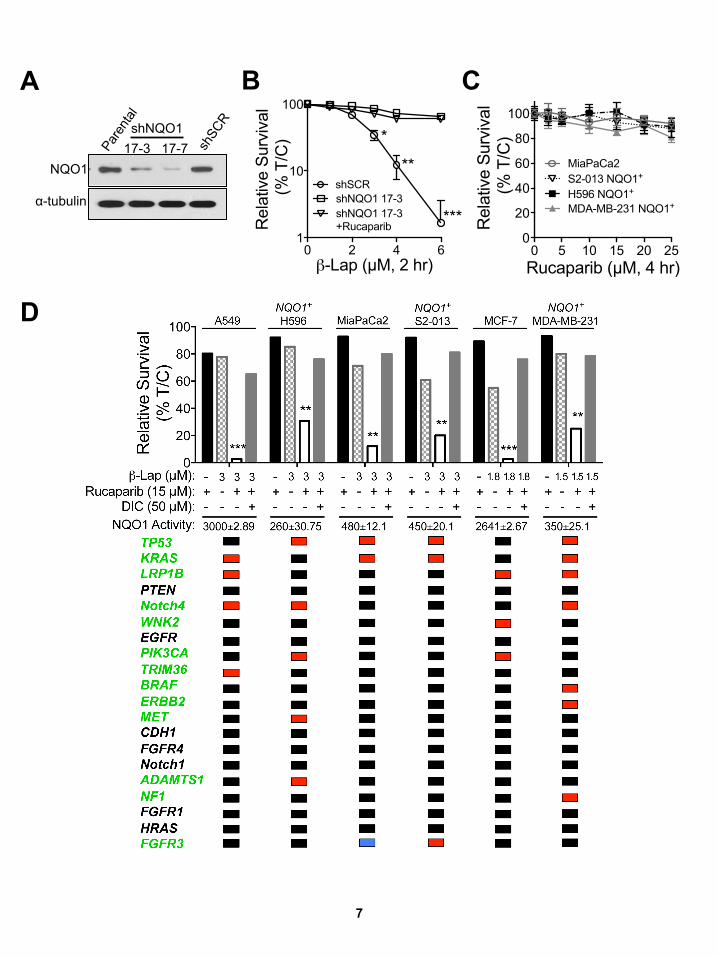
PARP Inhibitors Synergize with Sublethal Doses ofb-Lap in an NQO1-Dependent MannerWe theorized that inhibiting PARP1 would enhance ROS for-
mation due to continuous NQO1 futile redox cycling of b-lap
and generate greater DNA damage that, in turn, would not be
repaired due to concomitant PARP inhibition. A549 NSCLC cells
were pretreated with non-lethal doses of various PARP inhibi-
tors, including rucaparib (Figure 3A), olaparib (Figure 3B), and
veliparib (Figure 3C), each at 15 or 1.25 mM talazoparib (Fig-
ure 3D) (non-toxic inhibitor doses were tested, Figures S3A–
S3D) for 2 hr, followed by co-treatment with relatively non-toxic
b-lap doses (1–4 mM) + PARP inhibitors for an additional 2 hr.
Drugs were removed and cells assessed for survival. Rucaparib,
olaparib, and talazoparib (at <LD10 doses, Figures S3A–S3D)
dramatically increased the sensitivities of A549 cells to otherwise
non-lethal b-lap doses (Figures 3A–3D), resulting in dose-
enhancement ratios (DERs) that were proportional to PARP inhi-
bition in cells (Figures 3E–3J) or using purified PARP1 in vitro
(Figures S3E–S3G). Dose-response studies for each PARP inhib-
itor confirmed that optimal synergistic lethality with b-lap was
942 Cancer Cell 30, 940–952, December 12, 2016
noted at 15 mM for rucaparib and olaparib, while talazoparib
was potent at 1.25 mM. Veliparib was the least potent and effec-
tive PARP inhibitor for synergy with b-lap (Figures S3H–S3K).
Synergy (Chou and Talalay, 1984) was found for b-lap + ruca-
parib, olaparib, or talazoparib at eta (h) values of 0.452, 0.494,
and 0.584, respectively. Dicoumarol (50 mM, 2 hr) prevented all
synergy responses (Figures S3H–S3K). We chose rucaparib for
further studies since clinical-grade formulation was available.
To delineate the relationship between NQO1 and catalase
in b-lap lethality, clones varying in NQO1 expression showed
that �100 units of NQO1 enzyme activity were needed (Fig-
ure S3L). In contrast, LD50 values dramatically increased in cells
with <100 units of NQO1.
We examined NSCLC, PDA, and breast cancer cells that were
reconstituted or knocked down for NQO1 expression, ± dicou-
marol (Figures 4A–4H). H596 NSCLC cells that lack NQO1
expression due to a *2 NQO1 polymorphism, were reconstituted
for NQO1 (Bey et al., 2007) and sensitized to rucaparib + b-lap.
Dicoumarol suppressed lethality after b-lap alone, or in synergy
with rucaparib (Figures 4A and 4B). MiaPaCa2 PDA cancer cells
express significant KRAS-driven NQO1 levels and were hyper-
sensitive to rucaparib + b-lap (Figure 4C), with dicoumarol sup-
pression. Stable MiaPaCa2 NQO1 knockdown clones, 17-7
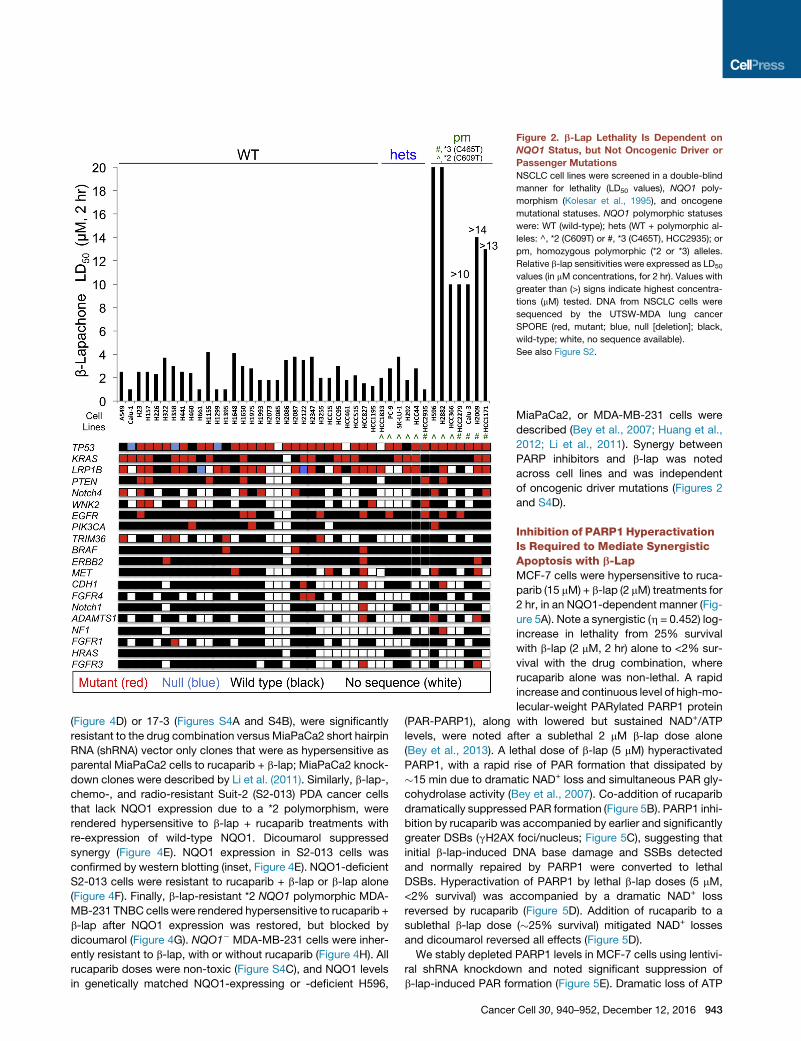
Figure 2. b-Lap Lethality Is Dependent on
NQO1 Status, but Not Oncogenic Driver or
Passenger Mutations
NSCLC cell lines were screened in a double-blind
manner for lethality (LD50 values), NQO1 poly-
morphism (Kolesar et al., 1995), and oncogene
mutational statuses. NQO1 polymorphic statuses
were: WT (wild-type); hets (WT + polymorphic al-
leles: ^, *2 (C609T) or #, *3 (C465T), HCC2935); or
pm, homozygous polymorphic (*2 or *3) alleles.
Relative b-lap sensitivities were expressed as LD50
values (in mM concentrations, for 2 hr). Values with
greater than (>) signs indicate highest concentra-
tions (mM) tested. DNA from NSCLC cells were
sequenced by the UTSW-MDA lung cancer
SPORE (red, mutant; blue, null [deletion]; black,
wild-type; white, no sequence available).
See also Figure S2.
(Figure 4D) or 17-3 (Figures S4A and S4B), were significantly
resistant to the drug combination versus MiaPaCa2 short hairpin
RNA (shRNA) vector only clones that were as hypersensitive as
parental MiaPaCa2 cells to rucaparib + b-lap; MiaPaCa2 knock-
down clones were described by Li et al. (2011). Similarly, b-lap-,
chemo-, and radio-resistant Suit-2 (S2-013) PDA cancer cells
that lack NQO1 expression due to a *2 polymorphism, were
rendered hypersensitive to b-lap + rucaparib treatments with
re-expression of wild-type NQO1. Dicoumarol suppressed
synergy (Figure 4E). NQO1 expression in S2-013 cells was
confirmed by western blotting (inset, Figure 4E). NQO1-deficient
S2-013 cells were resistant to rucaparib + b-lap or b-lap alone
(Figure 4F). Finally, b-lap-resistant *2 NQO1 polymorphic MDA-
MB-231 TNBC cells were rendered hypersensitive to rucaparib +
b-lap after NQO1 expression was restored, but blocked by
dicoumarol (Figure 4G). NQO1� MDA-MB-231 cells were inher-
ently resistant to b-lap, with or without rucaparib (Figure 4H). All
rucaparib doses were non-toxic (Figure S4C), and NQO1 levels
in genetically matched NQO1-expressing or -deficient H596,
Cancer
MiaPaCa2, or MDA-MB-231 cells were
described (Bey et al., 2007; Huang et al.,
2012; Li et al., 2011). Synergy between
PARP inhibitors and b-lap was noted
across cell lines and was independent
of oncogenic driver mutations (Figures 2
and S4D).
Inhibition of PARP1 HyperactivationIs Required to Mediate SynergisticApoptosis with b-LapMCF-7 cells were hypersensitive to ruca-
parib (15 mM) + b-lap (2 mM) treatments for
2 hr, in an NQO1-dependent manner (Fig-
ure 5A). Note a synergistic (h = 0.452) log-
increase in lethality from 25% survival
with b-lap (2 mM, 2 hr) alone to <2% sur-
vival with the drug combination, where
rucaparib alone was non-lethal. A rapid
increase and continuous level of high-mo-
lecular-weight PARylated PARP1 protein
(PAR-PARP1), along with lowered but sustained NAD+/ATP
levels, were noted after a sublethal 2 mM b-lap dose alone
(Bey et al., 2013). A lethal dose of b-lap (5 mM) hyperactivated
PARP1, with a rapid rise of PAR formation that dissipated by
�15 min due to dramatic NAD+ loss and simultaneous PAR gly-
cohydrolase activity (Bey et al., 2007). Co-addition of rucaparib
dramatically suppressed PAR formation (Figure 5B). PARP1 inhi-
bition by rucaparib was accompanied by earlier and significantly
greater DSBs (gH2AX foci/nucleus; Figure 5C), suggesting that
initial b-lap-induced DNA base damage and SSBs detected
and normally repaired by PARP1 were converted to lethal
DSBs. Hyperactivation of PARP1 by lethal b-lap doses (5 mM,
<2% survival) was accompanied by a dramatic NAD+ loss
reversed by rucaparib (Figure 5D). Addition of rucaparib to a
sublethal b-lap dose (�25% survival) mitigated NAD+ losses
and dicoumarol reversed all effects (Figure 5D).
We stably depleted PARP1 levels in MCF-7 cells using lentivi-
ral shRNA knockdown and noted significant suppression of
b-lap-induced PAR formation (Figure 5E). Dramatic loss of ATP
Cell 30, 940–952, December 12, 2016 943
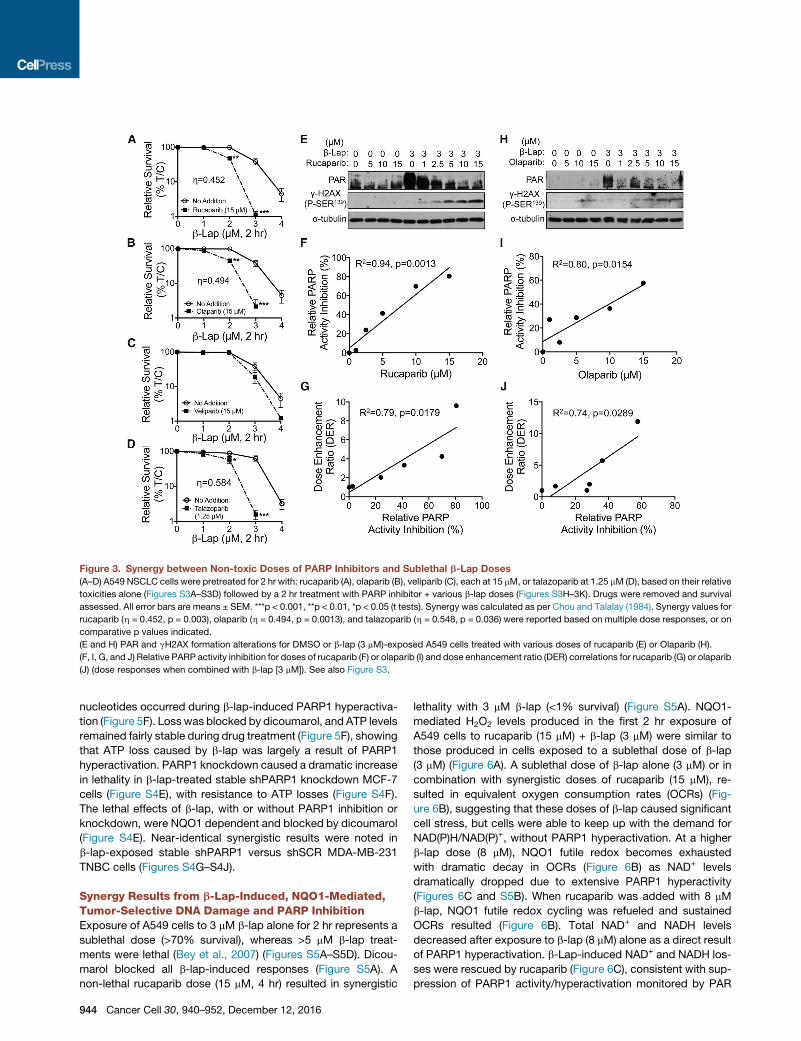
Figure 3. Synergy between Non-toxic Doses of PARP Inhibitors and Sublethal b-Lap Doses
(A–D) A549 NSCLC cells were pretreated for 2 hr with: rucaparib (A), olaparib (B), veliparib (C), each at 15 mM, or talazoparib at 1.25 mM (D), based on their relative
toxicities alone (Figures S3A–S3D) followed by a 2 hr treatment with PARP inhibitor + various b-lap doses (Figures S3H–3K). Drugs were removed and survival
assessed. All error bars are means ± SEM. ***p < 0.001, **p < 0.01, *p < 0.05 (t tests). Synergy was calculated as per Chou and Talalay (1984). Synergy values for
rucaparib (h = 0.452, p = 0.003), olaparib (h = 0.494, p = 0.0013), and talazoparib (h = 0.548, p = 0.036) were reported based on multiple dose responses, or on
comparative p values indicated.
(E and H) PAR and gH2AX formation alterations for DMSO or b-lap (3 mM)-exposed A549 cells treated with various doses of rucaparib (E) or Olaparib (H).
(F, I, G, and J) Relative PARP activity inhibition for doses of rucaparib (F) or olaparib (I) and dose enhancement ratio (DER) correlations for rucaparib (G) or olaparib
(J) (dose responses when combined with b-lap [3 mM]). See also Figure S3.
nucleotides occurred during b-lap-induced PARP1 hyperactiva-
tion (Figure 5F). Loss was blocked by dicoumarol, and ATP levels
remained fairly stable during drug treatment (Figure 5F), showing
that ATP loss caused by b-lap was largely a result of PARP1
hyperactivation. PARP1 knockdown caused a dramatic increase
in lethality in b-lap-treated stable shPARP1 knockdown MCF-7
cells (Figure S4E), with resistance to ATP losses (Figure S4F).
The lethal effects of b-lap, with or without PARP1 inhibition or
knockdown, were NQO1 dependent and blocked by dicoumarol
(Figure S4E). Near-identical synergistic results were noted in
b-lap-exposed stable shPARP1 versus shSCR MDA-MB-231
TNBC cells (Figures S4G–S4J).
Synergy Results from b-Lap-Induced, NQO1-Mediated,Tumor-Selective DNA Damage and PARP InhibitionExposure of A549 cells to 3 mM b-lap alone for 2 hr represents a
sublethal dose (>70% survival), whereas >5 mM b-lap treat-
ments were lethal (Bey et al., 2007) (Figures S5A–S5D). Dicou-
marol blocked all b-lap-induced responses (Figure S5A). A
non-lethal rucaparib dose (15 mM, 4 hr) resulted in synergistic
944 Cancer Cell 30, 940–952, December 12, 2016
lethality with 3 mM b-lap (<1% survival) (Figure S5A). NQO1-
mediated H2O2 levels produced in the first 2 hr exposure of
A549 cells to rucaparib (15 mM) + b-lap (3 mM) were similar to
those produced in cells exposed to a sublethal dose of b-lap
(3 mM) (Figure 6A). A sublethal dose of b-lap alone (3 mM) or in
combination with synergistic doses of rucaparib (15 mM), re-
sulted in equivalent oxygen consumption rates (OCRs) (Fig-
ure 6B), suggesting that these doses of b-lap caused significant
cell stress, but cells were able to keep up with the demand for
NAD(P)H/NAD(P)+, without PARP1 hyperactivation. At a higher
b-lap dose (8 mM), NQO1 futile redox becomes exhausted
with dramatic decay in OCRs (Figure 6B) as NAD+ levels
dramatically dropped due to extensive PARP1 hyperactivity
(Figures 6C and S5B). When rucaparib was added with 8 mM
b-lap, NQO1 futile redox cycling was refueled and sustained
OCRs resulted (Figure 6B). Total NAD+ and NADH levels
decreased after exposure to b-lap (8 mM) alone as a direct result
of PARP1 hyperactivation. b-Lap-induced NAD+ and NADH los-
ses were rescued by rucaparib (Figure 6C), consistent with sup-
pression of PARP1 activity/hyperactivation monitored by PAR
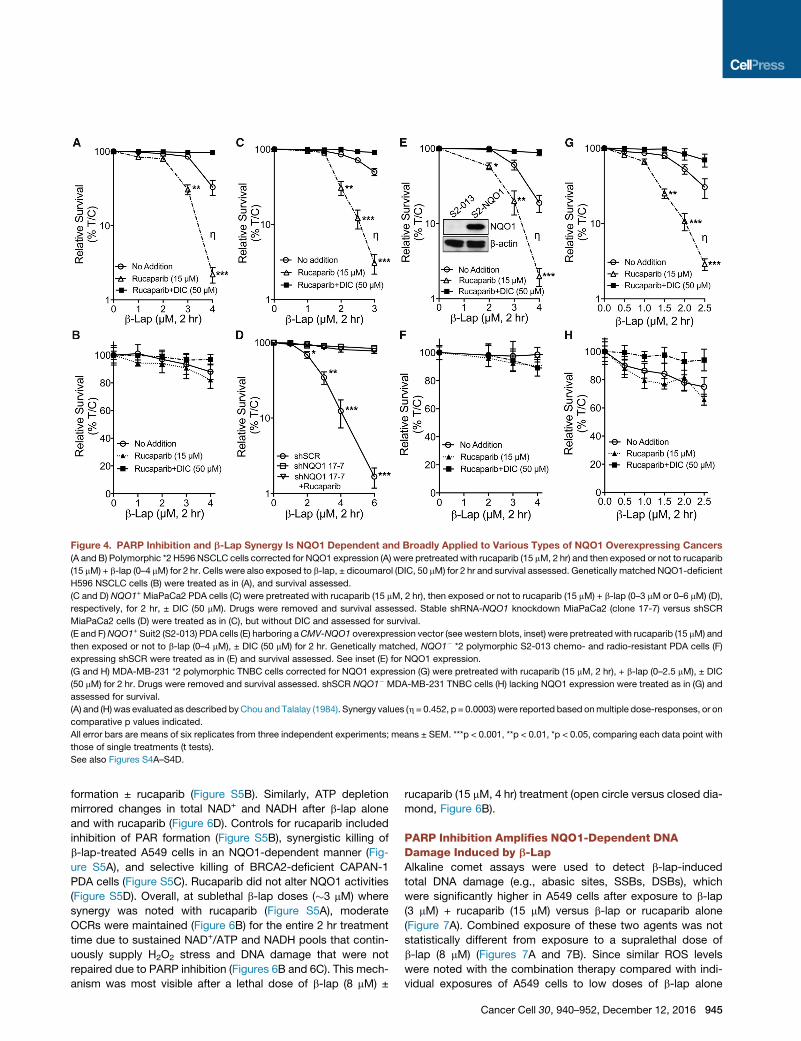
Figure 4. PARP Inhibition and b-Lap Synergy Is NQO1 Dependent and Broadly Applied to Various Types of NQO1 Overexpressing Cancers
(A and B) Polymorphic *2 H596 NSCLC cells corrected for NQO1 expression (A) were pretreated with rucaparib (15 mM, 2 hr) and then exposed or not to rucaparib
(15 mM) + b-lap (0–4 mM) for 2 hr. Cells were also exposed to b-lap, ± dicoumarol (DIC, 50 mM) for 2 hr and survival assessed. Genetically matched NQO1-deficient
H596 NSCLC cells (B) were treated as in (A), and survival assessed.
(C and D) NQO1+ MiaPaCa2 PDA cells (C) were pretreated with rucaparib (15 mM, 2 hr), then exposed or not to rucaparib (15 mM) + b-lap (0–3 mM or 0–6 mM) (D),
respectively, for 2 hr, ± DIC (50 mM). Drugs were removed and survival assessed. Stable shRNA-NQO1 knockdown MiaPaCa2 (clone 17-7) versus shSCR
MiaPaCa2 cells (D) were treated as in (C), but without DIC and assessed for survival.
(E and F)NQO1+ Suit2 (S2-013) PDA cells (E) harboring aCMV-NQO1 overexpression vector (see western blots, inset) were pretreatedwith rucaparib (15 mM) and
then exposed or not to b-lap (0–4 mM), ± DIC (50 mM) for 2 hr. Genetically matched, NQO1� *2 polymorphic S2-013 chemo- and radio-resistant PDA cells (F)
expressing shSCR were treated as in (E) and survival assessed. See inset (E) for NQO1 expression.
(G and H) MDA-MB-231 *2 polymorphic TNBC cells corrected for NQO1 expression (G) were pretreated with rucaparib (15 mM, 2 hr), + b-lap (0–2.5 mM), ± DIC
(50 mM) for 2 hr. Drugs were removed and survival assessed. shSCR NQO1� MDA-MB-231 TNBC cells (H) lacking NQO1 expression were treated as in (G) and
assessed for survival.
(A) and (H) was evaluated as described byChou and Talalay (1984). Synergy values (h = 0.452, p = 0.0003) were reported based onmultiple dose-responses, or on
comparative p values indicated.
All error bars are means of six replicates from three independent experiments; means ± SEM. ***p < 0.001, **p < 0.01, *p < 0.05, comparing each data point with
those of single treatments (t tests).
See also Figures S4A–S4D.
formation ± rucaparib (Figure S5B). Similarly, ATP depletion
mirrored changes in total NAD+ and NADH after b-lap alone
and with rucaparib (Figure 6D). Controls for rucaparib included
inhibition of PAR formation (Figure S5B), synergistic killing of
b-lap-treated A549 cells in an NQO1-dependent manner (Fig-
ure S5A), and selective killing of BRCA2-deficient CAPAN-1
PDA cells (Figure S5C). Rucaparib did not alter NQO1 activities
(Figure S5D). Overall, at sublethal b-lap doses (�3 mM) where
synergy was noted with rucaparib (Figure S5A), moderate
OCRs were maintained (Figure 6B) for the entire 2 hr treatment
time due to sustained NAD+/ATP and NADH pools that contin-
uously supply H2O2 stress and DNA damage that were not
repaired due to PARP inhibition (Figures 6B and 6C). This mech-
anism was most visible after a lethal dose of b-lap (8 mM) ±
rucaparib (15 mM, 4 hr) treatment (open circle versus closed dia-
mond, Figure 6B).
PARP Inhibition Amplifies NQO1-Dependent DNADamage Induced by b-LapAlkaline comet assays were used to detect b-lap-induced
total DNA damage (e.g., abasic sites, SSBs, DSBs), which
were significantly higher in A549 cells after exposure to b-lap
(3 mM) + rucaparib (15 mM) versus b-lap or rucaparib alone
(Figure 7A). Combined exposure of these two agents was not
statistically different from exposure to a supralethal dose of
b-lap (8 mM) (Figures 7A and 7B). Since similar ROS levels
were noted with the combination therapy compared with indi-
vidual exposures of A549 cells to low doses of b-lap alone
Cancer Cell 30, 940–952, December 12, 2016 945
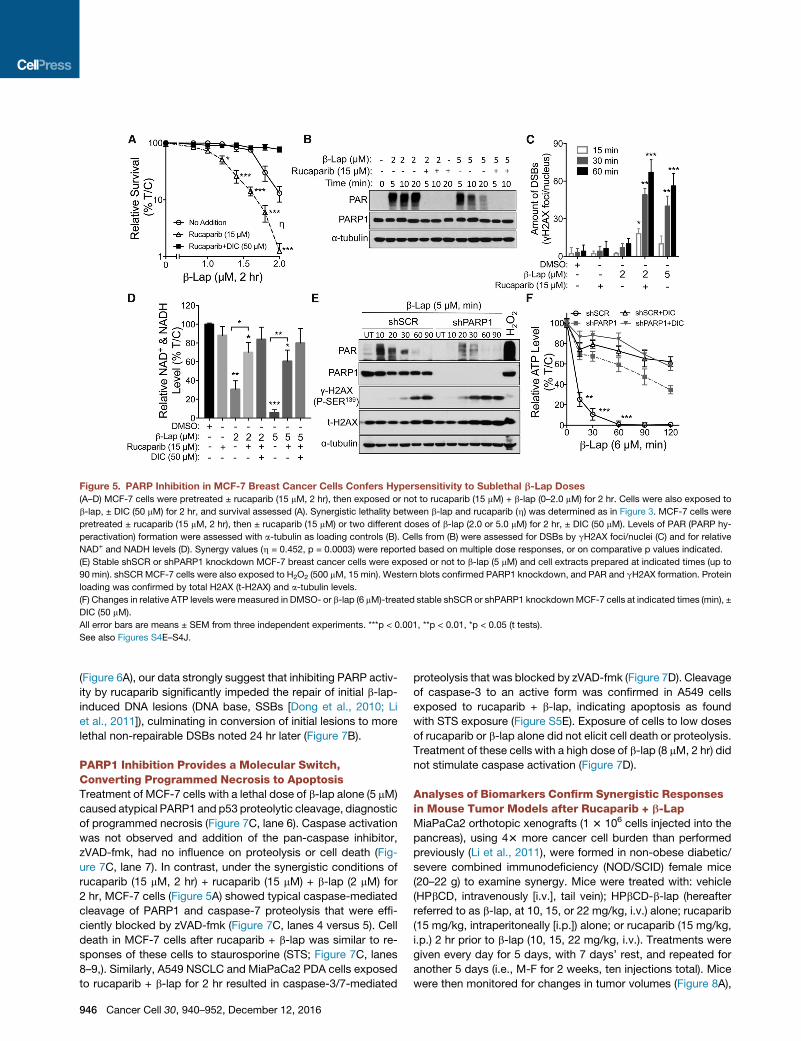
Figure 5. PARP Inhibition in MCF-7 Breast Cancer Cells Confers Hypersensitivity to Sublethal b-Lap Doses
(A–D) MCF-7 cells were pretreated ± rucaparib (15 mM, 2 hr), then exposed or not to rucaparib (15 mM) + b-lap (0–2.0 mM) for 2 hr. Cells were also exposed to
b-lap, ± DIC (50 mM) for 2 hr, and survival assessed (A). Synergistic lethality between b-lap and rucaparib (h) was determined as in Figure 3. MCF-7 cells were
pretreated ± rucaparib (15 mM, 2 hr), then ± rucaparib (15 mM) or two different doses of b-lap (2.0 or 5.0 mM) for 2 hr, ± DIC (50 mM). Levels of PAR (PARP hy-
peractivation) formation were assessed with a-tubulin as loading controls (B). Cells from (B) were assessed for DSBs by gH2AX foci/nuclei (C) and for relative
NAD+ and NADH levels (D). Synergy values (h = 0.452, p = 0.0003) were reported based on multiple dose responses, or on comparative p values indicated.
(E) Stable shSCR or shPARP1 knockdown MCF-7 breast cancer cells were exposed or not to b-lap (5 mM) and cell extracts prepared at indicated times (up to
90 min). shSCRMCF-7 cells were also exposed to H2O2 (500 mM, 15 min). Western blots confirmed PARP1 knockdown, and PAR and gH2AX formation. Protein
loading was confirmed by total H2AX (t-H2AX) and a-tubulin levels.
(F) Changes in relative ATP levels were measured in DMSO- or b-lap (6 mM)-treated stable shSCR or shPARP1 knockdownMCF-7 cells at indicated times (min), ±
DIC (50 mM).
All error bars are means ± SEM from three independent experiments. ***p < 0.001, **p < 0.01, *p < 0.05 (t tests).
See also Figures S4E–S4J.
(Figure 6A), our data strongly suggest that inhibiting PARP activ-
ity by rucaparib significantly impeded the repair of initial b-lap-
induced DNA lesions (DNA base, SSBs [Dong et al., 2010; Li
et al., 2011]), culminating in conversion of initial lesions to more
lethal non-repairable DSBs noted 24 hr later (Figure 7B).
PARP1 Inhibition Provides a Molecular Switch,Converting Programmed Necrosis to ApoptosisTreatment of MCF-7 cells with a lethal dose of b-lap alone (5 mM)
caused atypical PARP1 and p53 proteolytic cleavage, diagnostic
of programmed necrosis (Figure 7C, lane 6). Caspase activation
was not observed and addition of the pan-caspase inhibitor,
zVAD-fmk, had no influence on proteolysis or cell death (Fig-
ure 7C, lane 7). In contrast, under the synergistic conditions of
rucaparib (15 mM, 2 hr) + rucaparib (15 mM) + b-lap (2 mM) for
2 hr, MCF-7 cells (Figure 5A) showed typical caspase-mediated
cleavage of PARP1 and caspase-7 proteolysis that were effi-
ciently blocked by zVAD-fmk (Figure 7C, lanes 4 versus 5). Cell
death in MCF-7 cells after rucaparib + b-lap was similar to re-
sponses of these cells to staurosporine (STS; Figure 7C, lanes
8–9,). Similarly, A549 NSCLC and MiaPaCa2 PDA cells exposed
to rucaparib + b-lap for 2 hr resulted in caspase-3/7-mediated
946 Cancer Cell 30, 940–952, December 12, 2016
proteolysis that was blocked by zVAD-fmk (Figure 7D). Cleavage
of caspase-3 to an active form was confirmed in A549 cells
exposed to rucaparib + b-lap, indicating apoptosis as found
with STS exposure (Figure S5E). Exposure of cells to low doses
of rucaparib or b-lap alone did not elicit cell death or proteolysis.
Treatment of these cells with a high dose of b-lap (8 mM, 2 hr) did
not stimulate caspase activation (Figure 7D).
Analyses of Biomarkers Confirm Synergistic Responsesin Mouse Tumor Models after Rucaparib + b-LapMiaPaCa2 orthotopic xenografts (1 3 106 cells injected into the
pancreas), using 43 more cancer cell burden than performed
previously (Li et al., 2011), were formed in non-obese diabetic/
severe combined immunodeficiency (NOD/SCID) female mice
(20–22 g) to examine synergy. Mice were treated with: vehicle
(HPbCD, intravenously [i.v.], tail vein); HPbCD-b-lap (hereafter
referred to as b-lap, at 10, 15, or 22 mg/kg, i.v.) alone; rucaparib
(15 mg/kg, intraperitoneally [i.p.]) alone; or rucaparib (15 mg/kg,
i.p.) 2 hr prior to b-lap (10, 15, 22 mg/kg, i.v.). Treatments were
given every day for 5 days, with 7 days’ rest, and repeated for
another 5 days (i.e., M-F for 2 weeks, ten injections total). Mice
were then monitored for changes in tumor volumes (Figure 8A),
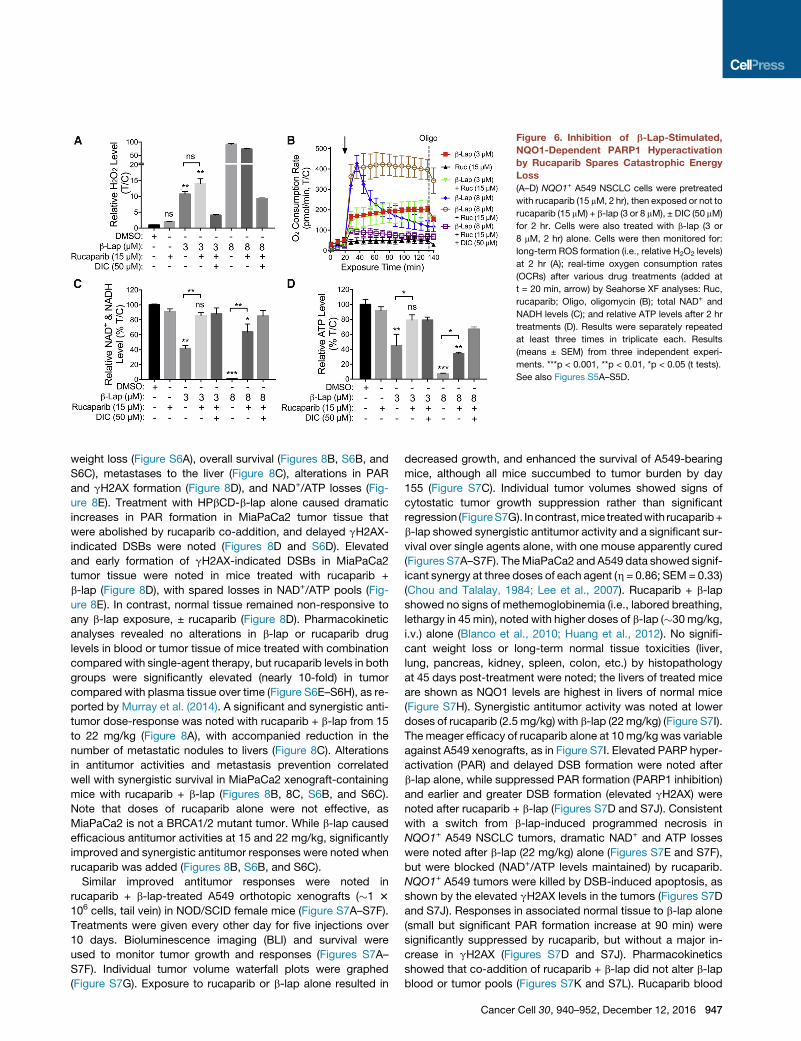
Figure 6. Inhibition of b-Lap-Stimulated,
NQO1-Dependent PARP1 Hyperactivation
by Rucaparib Spares Catastrophic Energy
Loss
(A–D) NQO1+ A549 NSCLC cells were pretreated
with rucaparib (15 mM, 2 hr), then exposed or not to
rucaparib (15 mM) + b-lap (3 or 8 mM), ± DIC (50 mM)
for 2 hr. Cells were also treated with b-lap (3 or
8 mM, 2 hr) alone. Cells were then monitored for:
long-term ROS formation (i.e., relative H2O2 levels)
at 2 hr (A); real-time oxygen consumption rates
(OCRs) after various drug treatments (added at
t = 20 min, arrow) by Seahorse XF analyses: Ruc,
rucaparib; Oligo, oligomycin (B); total NAD+ and
NADH levels (C); and relative ATP levels after 2 hr
treatments (D). Results were separately repeated
at least three times in triplicate each. Results
(means ± SEM) from three independent experi-
ments. ***p < 0.001, **p < 0.01, *p < 0.05 (t tests).
See also Figures S5A–S5D.
weight loss (Figure S6A), overall survival (Figures 8B, S6B, and
S6C), metastases to the liver (Figure 8C), alterations in PAR
and gH2AX formation (Figure 8D), and NAD+/ATP losses (Fig-
ure 8E). Treatment with HPbCD-b-lap alone caused dramatic
increases in PAR formation in MiaPaCa2 tumor tissue that
were abolished by rucaparib co-addition, and delayed gH2AX-
indicated DSBs were noted (Figures 8D and S6D). Elevated
and early formation of gH2AX-indicated DSBs in MiaPaCa2
tumor tissue were noted in mice treated with rucaparib +
b-lap (Figure 8D), with spared losses in NAD+/ATP pools (Fig-
ure 8E). In contrast, normal tissue remained non-responsive to
any b-lap exposure, ± rucaparib (Figure 8D). Pharmacokinetic
analyses revealed no alterations in b-lap or rucaparib drug
levels in blood or tumor tissue of mice treated with combination
compared with single-agent therapy, but rucaparib levels in both
groups were significantly elevated (nearly 10-fold) in tumor
compared with plasma tissue over time (Figure S6E–S6H), as re-
ported by Murray et al. (2014). A significant and synergistic anti-
tumor dose-response was noted with rucaparib + b-lap from 15
to 22 mg/kg (Figure 8A), with accompanied reduction in the
number of metastatic nodules to livers (Figure 8C). Alterations
in antitumor activities and metastasis prevention correlated
well with synergistic survival in MiaPaCa2 xenograft-containing
mice with rucaparib + b-lap (Figures 8B, 8C, S6B, and S6C).
Note that doses of rucaparib alone were not effective, as
MiaPaCa2 is not a BRCA1/2 mutant tumor. While b-lap caused
efficacious antitumor activities at 15 and 22 mg/kg, significantly
improved and synergistic antitumor responses were noted when
rucaparib was added (Figures 8B, S6B, and S6C).
Similar improved antitumor responses were noted in
rucaparib + b-lap-treated A549 orthotopic xenografts (�1 3
106 cells, tail vein) in NOD/SCID female mice (Figure S7A–S7F).
Treatments were given every other day for five injections over
10 days. Bioluminescence imaging (BLI) and survival were
used to monitor tumor growth and responses (Figures S7A–
S7F). Individual tumor volume waterfall plots were graphed
(Figure S7G). Exposure to rucaparib or b-lap alone resulted in
decreased growth, and enhanced the survival of A549-bearing
mice, although all mice succumbed to tumor burden by day
155 (Figure S7C). Individual tumor volumes showed signs of
cytostatic tumor growth suppression rather than significant
regression (FigureS7G). Incontrast,mice treatedwith rucaparib+
b-lap showed synergistic antitumor activity and a significant sur-
vival over single agents alone, with one mouse apparently cured
(Figures S7A–S7F). TheMiaPaCa2 and A549 data showed signif-
icant synergy at three doses of each agent (h = 0.86; SEM= 0.33)
(Chou and Talalay, 1984; Lee et al., 2007). Rucaparib + b-lap
showed no signs of methemoglobinemia (i.e., labored breathing,
lethargy in 45 min), noted with higher doses of b-lap (�30mg/kg,
i.v.) alone (Blanco et al., 2010; Huang et al., 2012). No signifi-
cant weight loss or long-term normal tissue toxicities (liver,
lung, pancreas, kidney, spleen, colon, etc.) by histopathology
at 45 days post-treatment were noted; the livers of treated mice
are shown as NQO1 levels are highest in livers of normal mice
(Figure S7H). Synergistic antitumor activity was noted at lower
doses of rucaparib (2.5mg/kg) with b-lap (22mg/kg) (Figure S7I).
The meager efficacy of rucaparib alone at 10mg/kg was variable
against A549 xenografts, as in Figure S7I. Elevated PARP hyper-
activation (PAR) and delayed DSB formation were noted after
b-lap alone, while suppressed PAR formation (PARP1 inhibition)
and earlier and greater DSB formation (elevated gH2AX) were
noted after rucaparib + b-lap (Figures S7D and S7J). Consistent
with a switch from b-lap-induced programmed necrosis in
NQO1+ A549 NSCLC tumors, dramatic NAD+ and ATP losses
were noted after b-lap (22 mg/kg) alone (Figures S7E and S7F),
but were blocked (NAD+/ATP levels maintained) by rucaparib.
NQO1+ A549 tumors were killed by DSB-induced apoptosis, as
shown by the elevated gH2AX levels in the tumors (Figures S7D
and S7J). Responses in associated normal tissue to b-lap alone
(small but significant PAR formation increase at 90 min) were
significantly suppressed by rucaparib, but without a major in-
crease in gH2AX (Figures S7D and S7J). Pharmacokinetics
showed that co-addition of rucaparib + b-lap did not alter b-lap
blood or tumor pools (Figures S7K and S7L). Rucaparib blood
Cancer Cell 30, 940–952, December 12, 2016 947
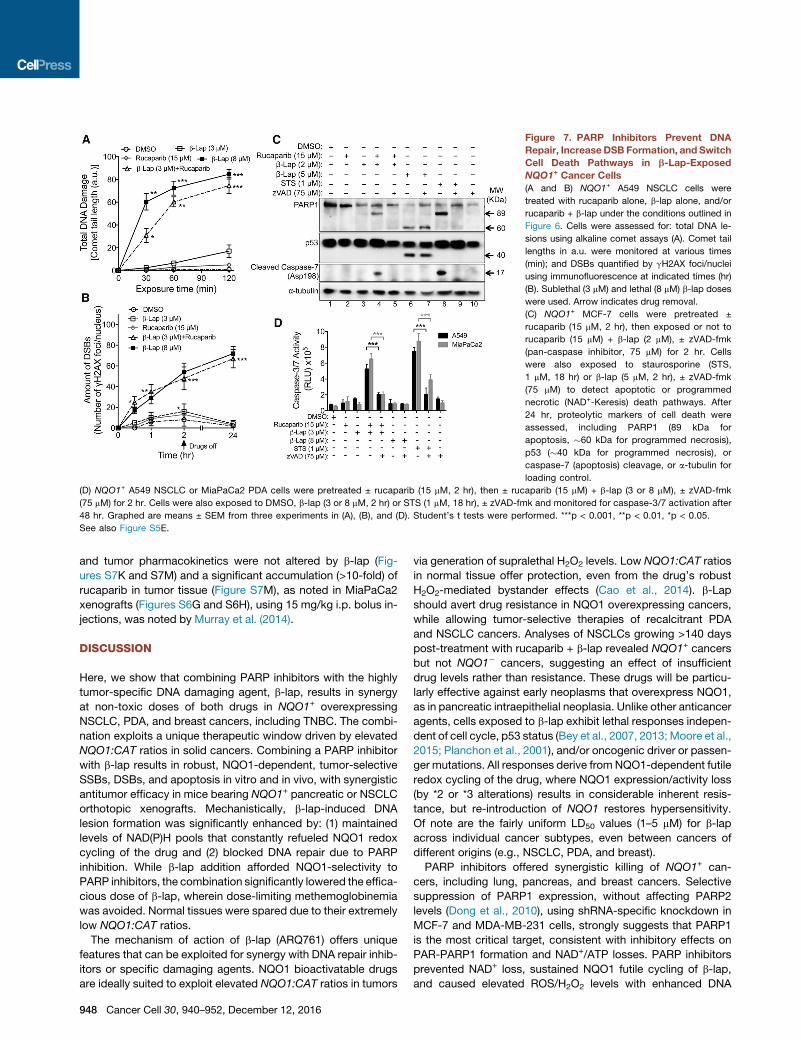
Figure 7. PARP Inhibitors Prevent DNA
Repair, IncreaseDSB Formation, and Switch
Cell Death Pathways in b-Lap-Exposed
NQO1+ Cancer Cells
(A and B) NQO1+ A549 NSCLC cells were
treated with rucaparib alone, b-lap alone, and/or
rucaparib + b-lap under the conditions outlined in
Figure 6. Cells were assessed for: total DNA le-
sions using alkaline comet assays (A). Comet tail
lengths in a.u. were monitored at various times
(min); and DSBs quantified by gH2AX foci/nuclei
using immunofluorescence at indicated times (hr)
(B). Sublethal (3 mM) and lethal (8 mM) b-lap doses
were used. Arrow indicates drug removal.
(C) NQO1+ MCF-7 cells were pretreated ±
rucaparib (15 mM, 2 hr), then exposed or not to
rucaparib (15 mM) + b-lap (2 mM), ± zVAD-fmk
(pan-caspase inhibitor, 75 mM) for 2 hr. Cells
were also exposed to staurosporine (STS,
1 mM, 18 hr) or b-lap (5 mM, 2 hr), ± zVAD-fmk
(75 mM) to detect apoptotic or programmed
necrotic (NAD+-Keresis) death pathways. After
24 hr, proteolytic markers of cell death were
assessed, including PARP1 (89 kDa for
apoptosis, �60 kDa for programmed necrosis),
p53 (�40 kDa for programmed necrosis), or
caspase-7 (apoptosis) cleavage, or a-tubulin for
loading control.
(D) NQO1+ A549 NSCLC or MiaPaCa2 PDA cells were pretreated ± rucaparib (15 mM, 2 hr), then ± rucaparib (15 mM) + b-lap (3 or 8 mM), ± zVAD-fmk
(75 mM) for 2 hr. Cells were also exposed to DMSO, b-lap (3 or 8 mM, 2 hr) or STS (1 mM, 18 hr), ± zVAD-fmk and monitored for caspase-3/7 activation after
48 hr. Graphed are means ± SEM from three experiments in (A), (B), and (D). Student’s t tests were performed. ***p < 0.001, **p < 0.01, *p < 0.05.
See also Figure S5E.
and tumor pharmacokinetics were not altered by b-lap (Fig-
ures S7K and S7M) and a significant accumulation (>10-fold) of
rucaparib in tumor tissue (Figure S7M), as noted in MiaPaCa2
xenografts (Figures S6G and S6H), using 15 mg/kg i.p. bolus in-
jections, was noted by Murray et al. (2014).
DISCUSSION
Here, we show that combining PARP inhibitors with the highly
tumor-specific DNA damaging agent, b-lap, results in synergy
at non-toxic doses of both drugs in NQO1+ overexpressing
NSCLC, PDA, and breast cancers, including TNBC. The combi-
nation exploits a unique therapeutic window driven by elevated
NQO1:CAT ratios in solid cancers. Combining a PARP inhibitor
with b-lap results in robust, NQO1-dependent, tumor-selective
SSBs, DSBs, and apoptosis in vitro and in vivo, with synergistic
antitumor efficacy in mice bearing NQO1+ pancreatic or NSCLC
orthotopic xenografts. Mechanistically, b-lap-induced DNA
lesion formation was significantly enhanced by: (1) maintained
levels of NAD(P)H pools that constantly refueled NQO1 redox
cycling of the drug and (2) blocked DNA repair due to PARP
inhibition. While b-lap addition afforded NQO1-selectivity to
PARP inhibitors, the combination significantly lowered the effica-
cious dose of b-lap, wherein dose-limiting methemoglobinemia
was avoided. Normal tissues were spared due to their extremely
low NQO1:CAT ratios.
The mechanism of action of b-lap (ARQ761) offers unique
features that can be exploited for synergy with DNA repair inhib-
itors or specific damaging agents. NQO1 bioactivatable drugs
are ideally suited to exploit elevated NQO1:CAT ratios in tumors
948 Cancer Cell 30, 940–952, December 12, 2016
via generation of supralethal H2O2 levels. Low NQO1:CAT ratios
in normal tissue offer protection, even from the drug’s robust
H2O2-mediated bystander effects (Cao et al., 2014). b-Lap
should avert drug resistance in NQO1 overexpressing cancers,
while allowing tumor-selective therapies of recalcitrant PDA
and NSCLC cancers. Analyses of NSCLCs growing >140 days
post-treatment with rucaparib + b-lap revealed NQO1+ cancers
but not NQO1� cancers, suggesting an effect of insufficient
drug levels rather than resistance. These drugs will be particu-
larly effective against early neoplasms that overexpress NQO1,
as in pancreatic intraepithelial neoplasia. Unlike other anticancer
agents, cells exposed to b-lap exhibit lethal responses indepen-
dent of cell cycle, p53 status (Bey et al., 2007, 2013; Moore et al.,
2015; Planchon et al., 2001), and/or oncogenic driver or passen-
ger mutations. All responses derive fromNQO1-dependent futile
redox cycling of the drug, where NQO1 expression/activity loss
(by *2 or *3 alterations) results in considerable inherent resis-
tance, but re-introduction of NQO1 restores hypersensitivity.
Of note are the fairly uniform LD50 values (1–5 mM) for b-lap
across individual cancer subtypes, even between cancers of
different origins (e.g., NSCLC, PDA, and breast).
PARP inhibitors offered synergistic killing of NQO1+ can-
cers, including lung, pancreas, and breast cancers. Selective
suppression of PARP1 expression, without affecting PARP2
levels (Dong et al., 2010), using shRNA-specific knockdown in
MCF-7 and MDA-MB-231 cells, strongly suggests that PARP1
is the most critical target, consistent with inhibitory effects on
PAR-PARP1 formation and NAD+/ATP losses. PARP inhibitors
prevented NAD+ loss, sustained NQO1 futile cycling of b-lap,
and caused elevated ROS/H2O2 levels with enhanced DNA
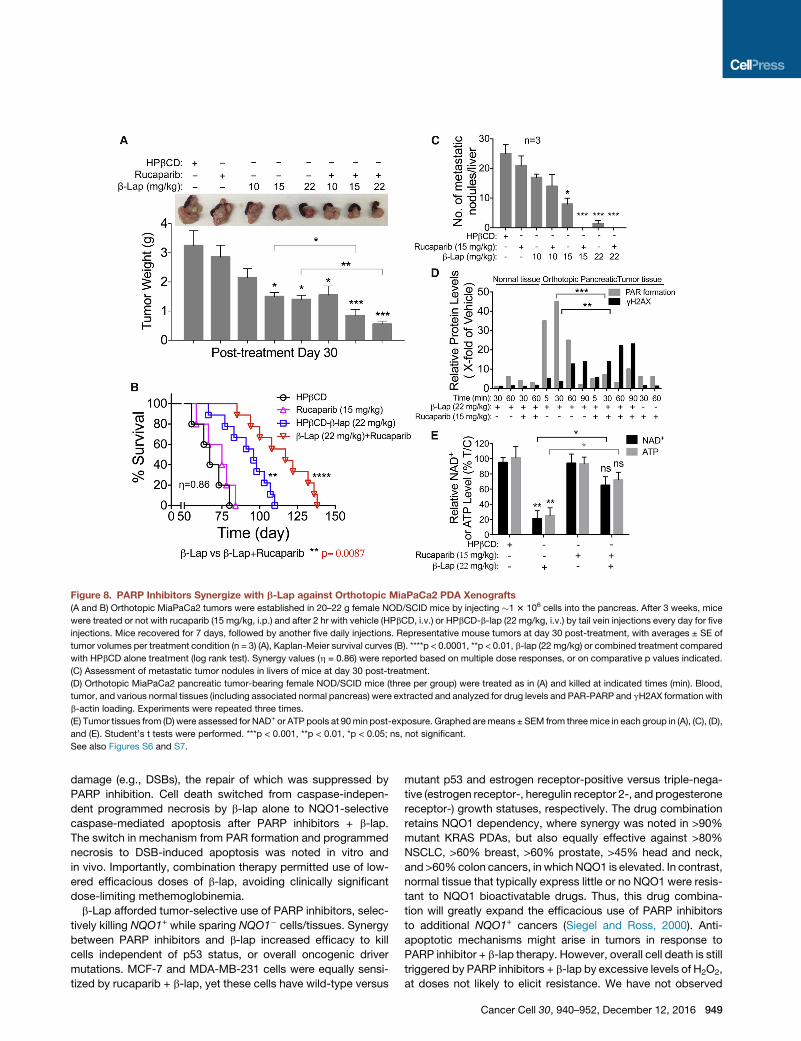
Figure 8. PARP Inhibitors Synergize with b-Lap against Orthotopic MiaPaCa2 PDA Xenografts
(A and B) Orthotopic MiaPaCa2 tumors were established in 20–22 g female NOD/SCID mice by injecting �1 3 106 cells into the pancreas. After 3 weeks, mice
were treated or not with rucaparib (15 mg/kg, i.p.) and after 2 hr with vehicle (HPbCD, i.v.) or HPbCD-b-lap (22 mg/kg, i.v.) by tail vein injections every day for five
injections. Mice recovered for 7 days, followed by another five daily injections. Representative mouse tumors at day 30 post-treatment, with averages ± SE of
tumor volumes per treatment condition (n = 3) (A), Kaplan-Meier survival curves (B). ****p < 0.0001, **p < 0.01, b-lap (22 mg/kg) or combined treatment compared
with HPbCD alone treatment (log rank test). Synergy values (h = 0.86) were reported based on multiple dose responses, or on comparative p values indicated.
(C) Assessment of metastatic tumor nodules in livers of mice at day 30 post-treatment.
(D) Orthotopic MiaPaCa2 pancreatic tumor-bearing female NOD/SCID mice (three per group) were treated as in (A) and killed at indicated times (min). Blood,
tumor, and various normal tissues (including associated normal pancreas) were extracted and analyzed for drug levels and PAR-PARP and gH2AX formation with
b-actin loading. Experiments were repeated three times.
(E) Tumor tissues from (D) were assessed for NAD+ or ATP pools at 90min post-exposure. Graphed aremeans ± SEM from threemice in each group in (A), (C), (D),
and (E). Student’s t tests were performed. ***p < 0.001, **p < 0.01, *p < 0.05; ns, not significant.
See also Figures S6 and S7.
damage (e.g., DSBs), the repair of which was suppressed by
PARP inhibition. Cell death switched from caspase-indepen-
dent programmed necrosis by b-lap alone to NQO1-selective
caspase-mediated apoptosis after PARP inhibitors + b-lap.
The switch in mechanism from PAR formation and programmed
necrosis to DSB-induced apoptosis was noted in vitro and
in vivo. Importantly, combination therapy permitted use of low-
ered efficacious doses of b-lap, avoiding clinically significant
dose-limiting methemoglobinemia.
b-Lap afforded tumor-selective use of PARP inhibitors, selec-
tively killing NQO1+ while sparing NQO1� cells/tissues. Synergy
between PARP inhibitors and b-lap increased efficacy to kill
cells independent of p53 status, or overall oncogenic driver
mutations. MCF-7 and MDA-MB-231 cells were equally sensi-
tized by rucaparib + b-lap, yet these cells have wild-type versus
mutant p53 and estrogen receptor-positive versus triple-nega-
tive (estrogen receptor-, heregulin receptor 2-, and progesterone
receptor-) growth statuses, respectively. The drug combination
retains NQO1 dependency, where synergy was noted in >90%
mutant KRAS PDAs, but also equally effective against >80%
NSCLC, >60% breast, >60% prostate, >45% head and neck,
and >60%colon cancers, in whichNQO1 is elevated. In contrast,
normal tissue that typically express little or no NQO1 were resis-
tant to NQO1 bioactivatable drugs. Thus, this drug combina-
tion will greatly expand the efficacious use of PARP inhibitors
to additional NQO1+ cancers (Siegel and Ross, 2000). Anti-
apoptotic mechanisms might arise in tumors in response to
PARP inhibitor + b-lap therapy. However, overall cell death is still
triggered by PARP inhibitors + b-lap by excessive levels of H2O2,
at doses not likely to elicit resistance. We have not observed
Cancer Cell 30, 940–952, December 12, 2016 949
resistance to b-lap or other NQO1bioactivatable drugs inNQO1+
cancer cells, evenwhen 75%NQO1� cells were co-culturedwith
25% NQO1+ cells (Cao et al., 2014).
Our results have immediate translational applicability. b-Lap
is relatively new in clinical trials (ARQ761), but has shown
promising tolerability, pharmacokinetics, and responses Gerber
et al. (2014). Previous and ongoing clinical trials showed PARP
inhibitors were well-tolerated in clinical use, and one (olaparib)
was recently approved by the U.S. Food and Drug Administra-
tion for treatment of advanced ovarian cancer (Lee et al.,
2014). Based on our preclinical studies in vivo, concomitant syn-
ergy in toxicity was not noted compared with individual agents
(b-lap or rucaparib) alone, so that b-lap and rucaparib markedly
enhanced antitumor activity, improved survival compared with
either agent alone, but ultimately resulted in no increase in
toxicity to normal tissue or showed increased toxic side effects.
Rucaparib shows tumor-selective accumulation, ± b-lap, and
does not affect b-lap pharmacokinetics. Leveraging NQO1 bio-
activatable drugs to afford a significantly broader, tumor-selec-
tive use of PARP inhibitors in clinical trials is warranted.
EXPERIMENTAL PROCEDURES
Cell Culture
Breast and PDA cancer cells were obtained from the American Tissue Culture
Collection (ATCC) and lung cancer cells were generated by the UTSW-MD
Anderson SPORE in lung cancer (Skoulidis et al., 2015) or were from the
ATCC. Cells were grown as in Supplemental Experimental Procedures.
NQO1 Enzyme Activity Assays
NQO1 enzyme activities from cancer cells or tumor or normal tissues were
measured as dicoumarol-inhibited units (Li et al., 2011; Pink et al., 2000).
Cell-Based PARP Enzymatic Activity Inhibition Assays
In brief, A549 cells were pretreatedwith varying concentrations (0, 1.0, 2.5, 5.0,
10, and 15 mM) of PARP inhibitors (rucaparib or olaparib) for 2 hr followed by
co-treatment with vehicle (DMSO) or b-lap (3 mM) for 2 hr. Cells were washed
with ice-cold PBS twice and lysed with ice-cold radioimmunoprecipita-
tion assay buffer containing protease inhibitor cocktails. Total lysate protein
concentrations were determined by bicinchoninic acid assays for equal
loading onto 4%–20% gradient gels and western blotting to probe for PARP
inhibition via PAR formation. a-Tubulin was used as loading control. PAR for-
mation densitometry was measured via NIH ImageJ, and PARP1 activity was
measured for each PARP inhibitor concentration relative to control with b-lap
(3 mM). Linear regression/correlation was calculated via Prism 7.
DER Calculations
DER calculations were obtained using the equation below:
Relative cell survival (%) of b-lap (3 mM) alone or combinations (b-lap [3 mM] +
PARP inhibitor concentrations [0, 1.0, 2.5, 5.0, 10, 15 mM] of rucaparib and
olaparib) were obtained via DNA assays. Mean values were used in the equa-
tion above to calculate DERs. Linear regression/correlation was calculated via
Prism 7 software.
Survival Assays
Relative survival assays based on 7-day DNA content assessments were as
described previously (Huang et al., 2012; Pink et al., 2000). Colony-forming
ability assayswere performed using 500–1,000 cells per 60mmplate. Colonies
950 Cancer Cell 30, 940–952, December 12, 2016
of >50 healthy appearing cells were counted and normalized to vehicle-treated
cells.
ATP, NAD/NADH, and H2O2 Quantification
ATP (CellTiter-Glo), hydrogen peroxide (H2O2) (ROS-Glo), and NAD/NADH
(NAD/NADH-Glo) were assayed at indicated time-points during or after treat-
ments using specific assays (Promega).
Antibodies
Antibodies used for immunofluorescence and western blotting, included
NQO1 (A180), PARP1 (SC-8007, Santa Cruz), Actin (C4, Santa Cruz), PAR
(Trevigen), Cleaved caspase-7 (D6H1, Cell Signaling Technology), cleaved
caspase-3 (5A1E, Cell Signaling Technology), p53 (DO-1, Santa Cruz), cata-
lase (D4P7B, Cell Signaling Technology), gH2AX (JBW301, Millipore), and
a-tubulin (Santa Cruz).
Western Blotting
Western blots were performed using enhanced chemiluminescent detection
and density analyses using NIH ImageJ with intensity normalization (Bey
et al., 2007; Huang et al., 2012; Li et al., 2011).
Comet and Immunofluorescence Assays
Alkaline comet assays (Trevigen) to measure total DNA damage, including
DNA base, SSBs and DSBs were assessed (Bey et al., 2007). Slides were
stained with SYBR green and images captured using a Leica DM5500 micro-
scope. Comet tail lengths were quantified by NIH ImageJ. Cells were imaged
by immunofluorescence for gH2AX foci on a Leica DM5500 fluorescent micro-
scope and quantified for foci/nucleus (Bey et al., 2007; Huang et al., 2012;
Li et al., 2011).
OCR Assessments
Real-time OCRs measurements were monitored using the Seahorse XF bio-
analyzer (Seahorse Bioscience) in Seahorse media containing glucose and
glutamine.
Antitumor, Survival, Pharmacokinetic, and Pharmacodynamic
Studies
Antitumor, survival, pharmacodynamics, and pharmacokinetic studies using
pancreatic-specific orthotopic MiaPaCa2 xenograft-bearing NOD/SCID
mice were performed. All animal procedures were approved by the UT South-
western IACUC committee. Rucaparib for in vivo use was obtained from
Clovis Oncology. BLI-based tumor volumes, long-term survival, and target
validation assays were performed with log rank tests for survival (Blanco
et al., 2010; Ma et al., 2015). Pharmacokinetics of rucaparib or b-lap levels
in blood and tumor were assessed by liquid chromatography-tandem mass
spectrometry analyses following extraction of plasma or tumor homogenates
with acetonitrile (Blanco et al., 2010; Ma et al., 2015). An unpaired t test
(GraphPad QuickCalcs) was used to measure significant differences in b-lap
concentrations after different treatments. Pharmacodynamic parameters of
PAR formation, gH2AX, and NAD+/ATP levels in tumors were performed
(Ma et al., 2015).
Microarray Expression Data, Processing, and Analyses
Gene expression data series were retrieved from the GEO database using
criteria described in the Supplemental Experimental Procedures. The assem-
bled cohort included 327 NSCLC tumor, 105 normal lung, and 128 NSCLC
cell line specimens: a total of 560 specimens. Matched-pair specimens (n =
105) from two independent studies were analyzed. The 560 specimen data
files were downloaded as raw CEL files (Irizarry et al., 2003). R package
aroma.affymetrix was used and data processed using the linear model from
RMA, then fit robustly using probe level models (Robinson and Speed,
2007). Probe level models were fit to RMA-background corrected and quan-
tile-normalized data to obtain gene-level summaries. Gene-level summariza-
tion used standard CDF provided by Affymetrix. The Welch’s t test for unequal
variance was used to compute the p value for the difference in means. All
analyses were performed in R. Statistical tests were performed using base R
statistical functions, and graphics were generated using the ggplot2 graphics
package (Wickham, 2009).
Statistics
Data (means ± SD) were graphed and ANOVA used to compare groups.
Two-tailed Student’s t tests for independent measures with Holm-Sidak
correction for multiple comparisons, if >1 comparisons, were performed.
Minimum replicate size for any experiment was n = 3. Alpha was set to 0.05.
Statistical analyses were performed in GraphPad Prism 6. Images were repre-
sentative of results of experiments or stainings repeated three times. *p < 0.05;
**p < 0.01; and ***p < 0.001.
Synergy Calculations
Synergy interactions between the two drugs were evaluated using two
methods: (1) direct comparisons made between the effect of combined treat-
ments and the effect of individual drugs in each experiment (Figures 3A, 3B,
3D, 4A, 4C, 4E, 4G, 5A, S3H, S3I, and S3K); and (2) formal synergy effects
evaluations used a strict method proposed by Chou and coworkers (Chou
and Talalay, 1984; Lee et al., 2007), where pooled, multiple dose responses
for each treatments were required. Values (h) were reported based on multiple
dose-response data from studies in Figures 3A, 3B, 3D, 4A, 4C, 4E, 4G, 5A,
S3H, S3I, and S3K. We formally tested drug-drug interactions for three pairs:
(1) b-lap + rucaparib showed a highly significant effect of (h = 0.452, p =
0.0003); (2) b-lap + olaparib showed a highly significant effect of synergy
(h = 0.494, p value = 0.0013); and (3) b-lap + talazoparib showed a significant
synergy (h = 0.584, p = 0.036). For in vivo rucaparib + b-lapachone synergy
showed an h value of 0.86, with p values indicated on graphs.
SUPPLEMENTAL INFORMATION
Supplemental Information includes Supplemental Experimental Procedures
and seven figures and can be found with this article online at http://dx.doi.
org/10.1016/j.ccell.2016.11.006.
AUTHOR CONTRIBUTIONS
Concepts and Designs, X.H., E.A.B., and D.A.B.; Methodology, X.H., E.A.M.,
Z.R.M., J.Y., Y.D., G.C., J.A.K., M.A.S., P.L.P., A.C., F.F., Y.C., M.P., and
J.Y.; Data Acquisition, X.H., G.G.A., R.K., J.X., V.S., N.S.W., E.A.B., and
E.A.M.; Analytics, X.H., E.A.M., Z.R.M., G.C., G.G.A., R.K., J.X., V.S.,
N.S.W., J.D.M., D.E.G., M.B., E.A.B., and D.A.B.; Administrative, J.D.M.,
M.B., D.E.G., E.A.B., N.S.W., and D.A.B.; Writing, X.H., Z.R.M., N.S.W.,
D.E.G., E.A.M., and D.A.B.; Supervision, X.H., E.A.B., and D.A.B.
ACKNOWLEDGMENTS
Special thanks to Dr. Julia Meade for her review. We are grateful to UTSW
SCCC (5P30CA142543) for support of cores (Bioinformatics, Biomarker
Research, and Preclinical Pharmacology [PK]). Preclinical Pharmacology
Core was supported by institutional funds from the Institute for Innovations
in Medical Technology (IIMT) and CPRIT (RP110708-C3) (to N.S.W.). Work in
NSCLC and breast cancers were supported by NCI (CA102792) (to D.A.B.)
and UTSW-MD Anderson SPORE in lung cancer (P50CA70907) (to J.D.M.).
Work in PDA was supported by AACR/PanCan grants 12-60-25-BOOT and
15-65-25-BOOT (to D.A.B.). D.A.B., Y.D., and E.A.B. declare US patent appli-
cation, ‘‘Methods of treating cancer comprising targetingNQO1’’ (13/820,127).
D.A.B., X.H., and Z.R.M. declare US patent applications, ‘‘Compounds and
anti-tumor NQO1 substrates’’ (14/351, 8961) and ‘‘Tumor-selective combina-
tion therapy’’ (TF13048; international PCT/US2014/033400). D.E.G. receives
funding for clinical trials from ArQule, Inc., grants SCCC-10Y11 ARQ-761
and SCCC-15Y11.
Received: September 11, 2015
Revised: June 18, 2016
Accepted: November 11, 2016
Published: December 12, 2016
REFERENCES
Albert, J.M., Cao, C., Kim, K.W., Willey, C.D., Geng, L., Xiao, D., Wang, H.,
Sandler, A., Johnson, D.H., Colevas, A.D., et al. (2007). Inhibition of
poly(ADP-ribose) polymerase enhances cell death and improves tumor growth
delay in irradiated lung cancer models. Clin. Cancer Res. 13, 3033–3042.
Bey, E.A., Bentle, M.S., Reinicke, K.E., Dong, Y., Yang, C.R., Girard, L., Minna,
J.D., Bornmann, W.G., Gao, J., and Boothman, D.A. (2007). An NQO1- and
PARP-1-mediated cell death pathway induced in non-small-cell lung cancer
cells by beta-lapachone. Proc. Natl. Acad. Sci. USA 104, 11832–11837.
Bey, E.A., Reinicke, K.E., Srougi, M.C., Varnes, M., Anderson, V.E., Pink, J.J.,
Li, L.S., Patel, M., Cao, L., Moore, Z., et al. (2013). Catalase abrogates beta-
lapachone-induced PARP1 hyperactivation-directed programmed necrosis
in NQO1-positive breast cancers. Mol. Cancer Ther. 12, 2110–2120.
Blanco, E., Bey, E.A., Khemtong, C., Yang, S.G., Setti-Guthi, J., Chen, H.,
Kessinger, C.W., Carnevale, K.A., Bornmann, W.G., Boothman, D.A., and
Gao, J. (2010). Beta-lapachone micellar nanotherapeutics for non-small cell
lung cancer therapy. Cancer Res. 70, 3896–3904.
Cao, L., Li, L.S., Spruell, C., Xiao, L., Chakrabarti, G., Bey, E.A., Reinicke, K.E.,
Srougi, M.C., Moore, Z., Dong, Y., et al. (2014). Tumor-selective, futile redox
cycle-induced bystander effects elicited by NQO1 bioactivatable radiosensi-
tizing drugs in triple-negative breast cancers. Antioxid. Redox Signal. 21,
237–250.
Chou, T.C., and Talalay, P. (1984). Quantitative analysis of dose-effect rela-
tionships: the combined effects of multiple drugs or enzyme inhibitors. Adv.
Enzyme Regul. 22, 27–55.
Dantzer, F., de La Rubia, G., Menissier-De Murcia, J., Hostomsky, Z., de
Murcia, G., and Schreiber, V. (2000). Base excision repair is impaired in
mammalian cells lacking poly(ADP-ribose) polymerase-1. Biochemistry 39,
7559–7569.
Dong, Y., Bey, E.A., Li, L.S., Kabbani, W., Yan, J., Xie, X.J., Hsieh, J.T., Gao, J.,
and Boothman, D.A. (2010). Prostate cancer radiosensitization through
poly(ADP-Ribose) polymerase-1 hyperactivation. Cancer Res. 70, 8088–8096.
Farmer, H., McCabe, N., Lord, C.J., Tutt, A.N., Johnson, D.A., Richardson,
T.B., Santarosa, M., Dillon, K.J., Hickson, I., Knights, C., et al. (2005).
Targeting the DNA repair defect in BRCA mutant cells as a therapeutic strat-
egy. Nature 434, 917–921.
Gerber, D., Arriaga, Y., Beg, M.S., Dowell, J.E., Schiller, J.H., Frankel, A.E.,
Leff, R., Meek, C., Bolluyt, J., Fatunde, O., et al. (2014). Phase 1 correlative
study of ARQ761, a b-lapachone analogue that promotes NQ01-mediated
programmed cancer cell necrosis. Eur. J. Cancer 50 (Suppl 6 ), 84.
Helleday, T., Petermann, E., Lundin, C., Hodgson, B., and Sharma, R.A. (2008).
DNA repair pathways as targets for cancer therapy. Nat. Rev. Cancer 8,
193–204.
Huang, X., Dong, Y., Bey, E.A., Kilgore, J.A., Bair, J.S., Li, L.S., Patel, M.,
Parkinson, E.I., Wang, Y., Williams, N.S., et al. (2012). An NQO1 substrate
with potent antitumor activity that selectively kills by PARP1-induced pro-
grammed necrosis. Cancer Res. 72, 3038–3047.
Irizarry, R.A., Hobbs, B., Collin, F., Beazer-Barclay, Y.D., Antonellis, K.J.,
Scherf, U., and Speed, T.P. (2003). Exploration, normalization, and summaries
of high density oligonucleotide array probe level data. Biostatistics 4, 249–264.
Jacob, D.A., Bahra, M., Langrehr, J.M., Boas-Knoop, S., Stefaniak, R., Davis,
J., Schumacher, G., Lippert, S., and Neumann, U.P. (2007). Combination
therapy of poly (ADP-ribose) polymerase inhibitor 3-aminobenzamide and
gemcitabine shows strong antitumor activity in pancreatic cancer cells.
J. Gastroenterol. Hepatol. 22, 738–748.
Kolesar, J.M., Kuhn, J.G., and Burris, H.A., 3rd (1995). Detection of a point mu-
tation in NQO1 (DT-diaphorase) in a patient with colon cancer. J. Natl. Cancer
Inst. 87, 1022–1024.
Lee, J.J., Kong, M., Ayers, G.D., and Lotan, R. (2007). Interaction index and
different methods for determining drug interaction in combination therapy.
J. Biopharm. Stat. 17, 461–480.
Lee, J.M., Ledermann, J.A., and Kohn, E.C. (2014). PARP inhibitors for BRCA1/
2 mutation-associated and BRCA-like malignancies. Ann. Oncol. 25, 32–40.
Li, L.S., Bey, E.A., Dong, Y., Meng, J., Patra, B., Yan, J., Xie, X.J., Brekken,
R.A., Barnett, C.C., Bornmann, W.G., et al. (2011). Modulating endogenous
NQO1 levels identifies key regulatory mechanisms of action of beta-lapachone
for pancreatic cancer therapy. Clin. Cancer Res. 17, 275–285.
Cancer Cell 30, 940–952, December 12, 2016 951
Ma, X., Huang, X., Moore, Z., Huang, G., Kilgore, J.A., Wang, Y., Hammer, S.,
Williams, N.S., Boothman, D.A., andGao, J. (2015). Esterase-activatable beta-
lapachone prodrug micelles for NQO1-targeted lung cancer therapy.
J. Control. Release 200, 201–211.
Moore, Z., Chakrabarti, G., Luo, X., Ali, A., Hu, Z., Fattah, F.J., Vemireddy, R.,
DeBerardinis, R.J., Brekken, R.A., and Boothman, D.A. (2015). NAMPT inhibi-
tion sensitizes pancreatic adenocarcinoma cells to tumor-selective, PAR-in-
dependent metabolic catastrophe and cell death induced by beta-lapachone.
Cell Death Dis. 6, e1599.
Murray, J., Thomas, H., Berry, P., Kyle, S., Patterson, M., Jones, C., Los, G.,
Hostomsky, Z., Plummer, E.R., Boddy, A.V., and Curtin, N.J. (2014). Tumour
cell retention of rucaparib, sustained PARP inhibition and efficacy of weekly
as well as daily schedules. Br. J Cancer 110, 1977–1984.
Pink, J.J., Planchon, S.M., Tagliarino, C., Varnes, M.E., Siegel, D., and
Boothman, D.A. (2000). NAD(P)H: quinone oxidoreductase activity is the
principal determinant of beta-lapachone cytotoxicity. J. Biol. Chem. 275,
5416–5424.
Planchon, S.M., Pink, J.J., Tagliarino, C., Bornmann, W.G., Varnes, M.E., and
Boothman, D.A. (2001). beta-Lapachone-induced apoptosis in human pros-
tate cancer cells: involvement of NQO1/xip3. Exp. Cell Res. 267, 95–106.
Rajan, A., Carter, C.A., Kelly, R.J., Gutierrez, M., Kummar, S., Szabo, E.,
Yancey, M.A., Ji, J., Mannargudi, B., Woo, S., et al. (2012). A phase I combi-
nation study of olaparib with cisplatin and gemcitabine in adults with solid
tumors. Clin. Cancer Res. 18, 2344–2351.
Robinson, M.D., and Speed, T.P. (2007). A comparison of Affymetrix gene
expression arrays. BMC Bioinformatics 8, 449.
952 Cancer Cell 30, 940–952, December 12, 2016
Sandhu, S.K., Schelman, W.R., Wilding, G., Moreno, V., Baird, R.D., Miranda,
S., Hylands, L., Riisnaes, R., Forster, M., Omlin, A., et al. (2013). The poly(ADP-
ribose) polymerase inhibitor niraparib (MK4827) in BRCAmutation carriers and
patients with sporadic cancer: a phase 1 dose-escalation trial. Lancet Oncol.
14, 882–892.
Siegel, D., and Ross, D. (2000). Immunodetection of NAD(P)H:quinone oxido-
reductase 1 (NQO1) in human tissues. Free Radic. Biol. Med. 29, 246–253.
Siegel, D., Franklin, W.A., and Ross, D. (1998). Immunohistochemical detec-
tion of NAD(P)H:quinone oxidoreductase in human lung and lung tumors.
Clin. Cancer Res. 4, 2065–2070.
Skoulidis, F., Byers, L.A., Diao, L., Papadimitrakopoulou, V.A., Tong, P., Izzo,
J., Behrens, C., Kadara, H., Parra, E.R., Canales, J.R., et al. (2015). Co-occur-
ring genomic alterations definemajor subsets of KRAS-mutant lung adenocar-
cinoma with distinct biology, immune profiles, and therapeutic vulnerabilities.
Cancer Discov. 5, 860–877.
Tagliarino, C., Pink, J.J., Dubyak, G.R., Nieminen, A.L., and Boothman, D.A.
(2001). Calcium is a key signaling molecule in beta-lapachone-mediated cell
death. J. Biol. Chem. 276, 19150–19159.
Underhill, C., Toulmonde, M., and Bonnefoi, H. (2011). A review of PARP inhib-
itors: from bench to bedside. Ann. Oncol. 22, 268–279.
Wang, M., Wu, W., Wu, W., Rosidi, B., Zhang, L., Wang, H., and Iliakis, G.
(2006). PARP-1 and Ku compete for repair of DNA double strand breaks by
distinct NHEJ pathways. Nucleic Acids Res. 34, 6170–6182.
Wickham, H. (2009). ggplot2: Elegant Graphics for Data Analysis (Springer
Science & Business Media).
Cancer Cell, Volume 30
Supplemental Information
Leveraging an NQO1 Bioactivatable Drug for
Tumor-Selective Use of Poly(ADP-ribose)
Polymerase Inhibitors
Xiumei Huang, Edward A. Motea, Zachary R. Moore, Jun Yao, Ying Dong, GaurabChakrabarti, Jessica A. Kilgore, Molly A. Silvers, Praveen L. Patidar, AgnieszkaCholka, Farjana Fattah, Yoonjeong Cha, Glenda G. Anderson, Rebecca Kusko, MichaelPeyton, Jingsheng Yan, Xian-Jin Xie, Venetia Sarode, Noelle S. Williams, John D.Minna, Muhammad Beg, David E. Gerber, Erik A. Bey, and David A. Boothman
Supplemental Data
1
2
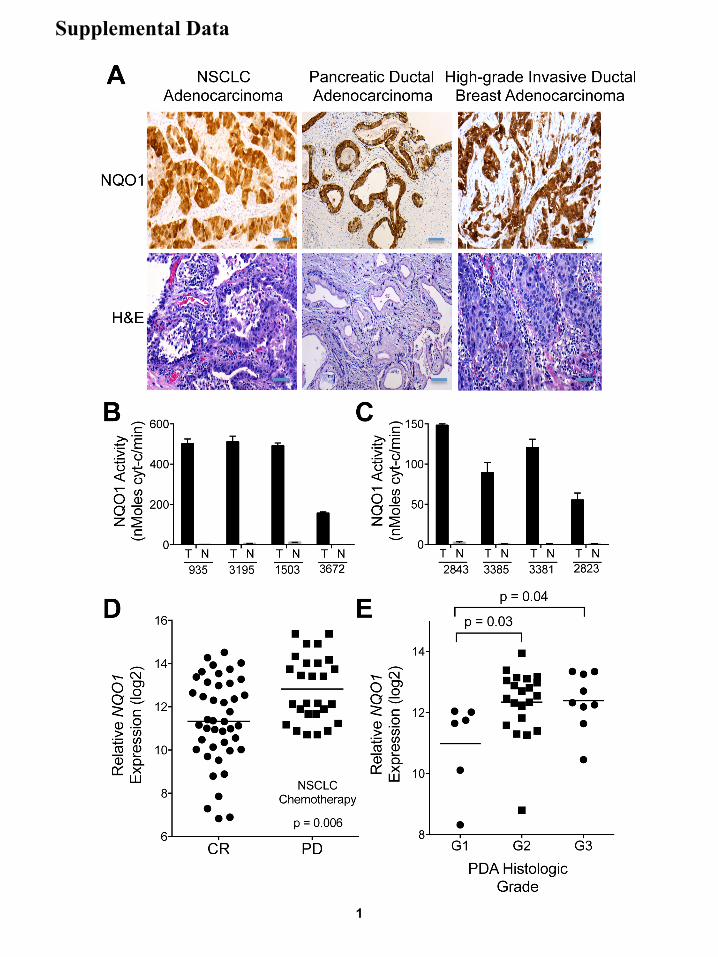
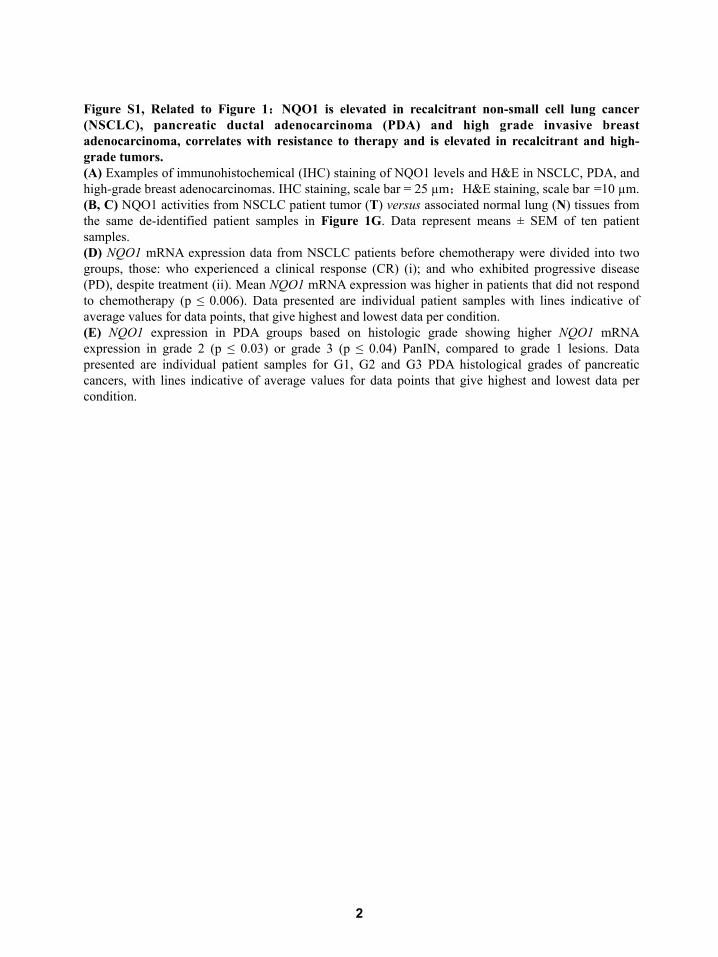
Figure S1, Related to Figure 1:NQO1 is elevated in recalcitrant non-small cell lung cancer (NSCLC), pancreatic ductal adenocarcinoma (PDA) and high grade invasive breast adenocarcinoma, correlates with resistance to therapy and is elevated in recalcitrant and high-grade tumors. (A) Examples of immunohistochemical (IHC) staining of NQO1 levels and H&E in NSCLC, PDA, and high-grade breast adenocarcinomas. IHC staining, scale bar = 25 µm;H&E staining, scale bar =10 µm. (B, C) NQO1 activities from NSCLC patient tumor (T) versus associated normal lung (N) tissues from the same de-identified patient samples in Figure 1G. Data represent means ± SEM of ten patient samples. (D) NQO1 mRNA expression data from NSCLC patients before chemotherapy were divided into two groups, those: who experienced a clinical response (CR) (i); and who exhibited progressive disease (PD), despite treatment (ii). Mean NQO1 mRNA expression was higher in patients that did not respond to chemotherapy (p ≤ 0.006). Data presented are individual patient samples with lines indicative of average values for data points, that give highest and lowest data per condition. (E) NQO1 expression in PDA groups based on histologic grade showing higher NQO1 mRNA expression in grade 2 (p ≤ 0.03) or grade 3 (p ≤ 0.04) PanIN, compared to grade 1 lesions. Data presented are individual patient samples for G1, G2 and G3 PDA histological grades of pancreatic cancers, with lines indicative of average values for data points that give highest and lowest data per condition.
β-La
pach
one
LD50
(µ
M, 2
hr)
WT No Addition + Dic (50 µM)
0 2 4 6 8
10 12 14 16 18 20
Mia
Pac
a2
AS
PC
-1
CFP
AC
-1
BX
PC
-3
HS
766T
C
APA
N-2
C
APA
N-1
S
W19
90
HPA
FII
3.27
D
AN
-G
8988
T
S20
07
Tu89
02
PAN
C1
PAN
C1
+ N
QO
1 S
2-01
3 S
2-01
3 +
NQ
O1
��1"
��2"
>12 >15
TP53%KRAS%LRP1B%PTEN%
Notch4%WNK2%EGFR%
PIK3CB%TRIM33%ERBB3%MET%CDH1%FGFR2%Notch1%
ADAMTS2%NF1%
HRAS%FGFR3%p16%
pm B A
3
4
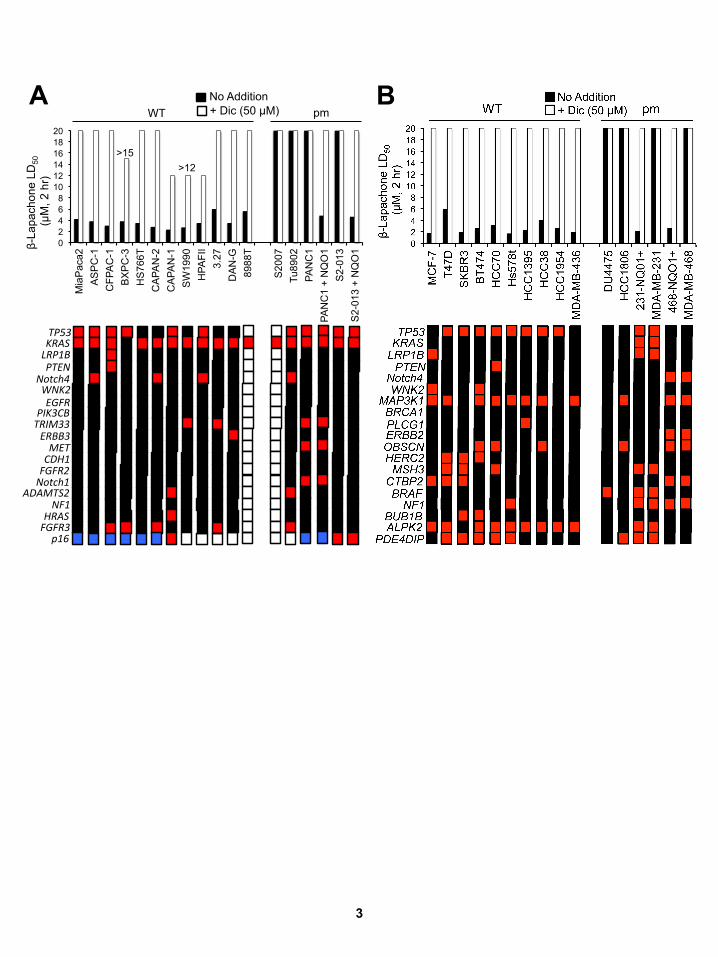
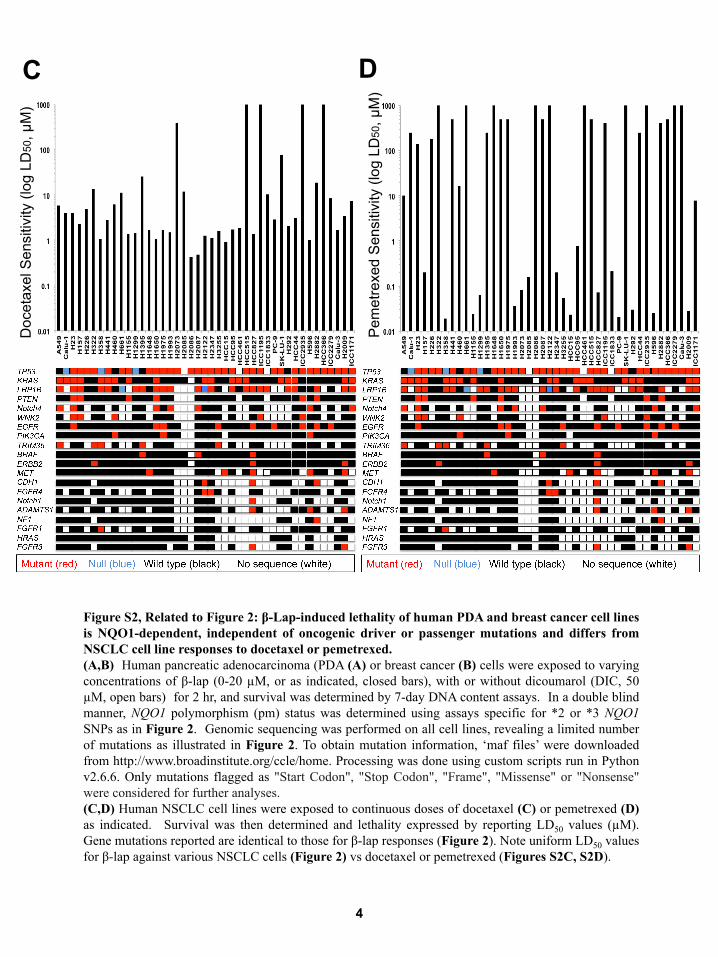
Figure S2, Related to Figure 2: β-Lap-induced lethality of human PDA and breast cancer cell lines is NQO1-dependent, independent of oncogenic driver or passenger mutations and differs from NSCLC cell line responses to docetaxel or pemetrexed. (A,B) Human pancreatic adenocarcinoma (PDA (A) or breast cancer (B) cells were exposed to varying concentrations of β-lap (0-20 µM, or as indicated, closed bars), with or without dicoumarol (DIC, 50 µM, open bars) for 2 hr, and survival was determined by 7-day DNA content assays. In a double blind manner, NQO1 polymorphism (pm) status was determined using assays specific for *2 or *3 NQO1 SNPs as in Figure 2. Genomic sequencing was performed on all cell lines, revealing a limited number of mutations as illustrated in Figure 2. To obtain mutation information, ‘maf files’ were downloaded from http://www.broadinstitute.org/ccle/home. Processing was done using custom scripts run in Python v2.6.6. Only mutations flagged as "Start Codon", "Stop Codon", "Frame", "Missense" or "Nonsense" were considered for further analyses. (C,D) Human NSCLC cell lines were exposed to continuous doses of docetaxel (C) or pemetrexed (D) as indicated. Survival was then determined and lethality expressed by reporting LD50 values (µM). Gene mutations reported are identical to those for β-lap responses (Figure 2). Note uniform LD50 values for β-lap against various NSCLC cells (Figure 2) vs docetaxel or pemetrexed (Figures S2C, S2D).
C D
Doc
etax
el S
ensi
tivity
(log
LD
50, µ
M)
Pem
etre
xed
Sen
sitiv
ity (l
og L
D50
, µM
)
0.0 0.5 1.0 1.5 2.0 2.50
20
40
60
80
100
Talazoparib (µM, 4 hr)
Rel
ativ
e S
urvi
val
(% T
/C)
No Additionβ-Lap (3 µM)β-Lap (3 µM)+DIC
*** ***
0 5 10 15 20 250
20
40
60
80
100
Veliparib (µM, 4 hr)
Rel
ativ
e S
urvi
val
(% T
/C)
No Additionβ-Lap (3 µM)β-Lap (3 µM)+DIC
0 5 10 15 20 250
20
40
60
80
100
Rucaparib (µM, 4 hr)
Rel
ativ
e S
urvi
val
(% T
/C) No Addition
β-Lap (3 µM)β-Lap (3 µM)+DIC
*** ***
0 5 10 15 200
20
40
60
80
100
Olaparib (µM, 4 hr)
Rel
ativ
e Su
rviv
al
(% T
/C)
No Additionβ-Lap (3 µM)β-Lap (3 µM)+DIC
**
*** ***
0 200 400 600 800 10000
5
10
15
20
NQO1 activity (U)
β-La
p LD
50
(µM
, 2 h
r)
Spearman corr. coef. = -0.69p value = 0.038
Spearman corr. coef. = -0.92p value = 0.0011
H596 NSCLC NQO1+ Clones
MiaPaCa2 Kd Clones
0 20 40 60 80 1000
2
4
6
8
10
Relative PARP1Activity Inhibition (%)
Dos
e E
nhan
cem
ent
Rat
io (D
ER
) R2=0.80, p=0.0392
-25 25 50 75 100-10
10
20
30
40
50
Relative PARP1 inhibition (%, T/C)
Dos
e En
hanc
emen
tR
atio
(DER
)Talazoparib
Rucaparib
Olaparib
AG143613-AB
Veliparib
R2=0.956, p=0.0039
0 5 10 15 200
20
40
60
80
100
Rucaparib (nM)
Rel
ativ
e PA
RP
1 ac
tivity
inhi
bitio
n (%
)
0 1 2 3 4 5 250
20
40
60
80
100
Talazoparib (µM, 4 hr)
Rel
ativ
e S
urvi
val
(% T
/C)
15
0 5 10 15 20 250
20
40
60
80
100
Veliparib (µM, 4 hr)
Rel
ativ
e Su
rviv
al
(% T
/C)
0 5 10 15 20 250
20
40
60
80
100
Rucaparib (µM, 4 hr)
Rel
ativ
e Su
rviv
al
(% T
/C)
0 5 10 15 20 250
20
40
60
80
100
Rel
ativ
e Su
rviv
al
(% T
/C)
Olaparib (µM, 4 hr)
G
D
A
J
B
H
K
C
L
E F
η=0.494
I
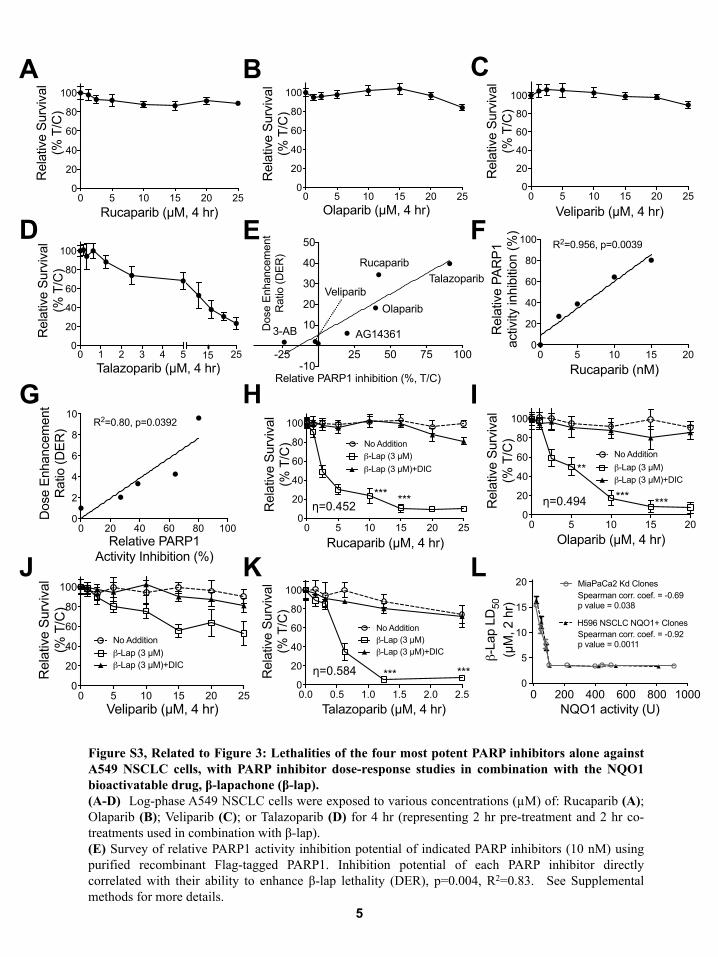
Figure S3, Related to Figure 3: Lethalities of the four most potent PARP inhibitors alone against A549 NSCLC cells, with PARP inhibitor dose-response studies in combination with the NQO1 bioactivatable drug, β-lapachone (β-lap). (A-D) Log-phase A549 NSCLC cells were exposed to various concentrations (µM) of: Rucaparib (A); Olaparib (B); Veliparib (C); or Talazoparib (D) for 4 hr (representing 2 hr pre-treatment and 2 hr co-treatments used in combination with β-lap). (E) Survey of relative PARP1 activity inhibition potential of indicated PARP inhibitors (10 nM) using purified recombinant Flag-tagged PARP1. Inhibition potential of each PARP inhibitor directly correlated with their ability to enhance β-lap lethality (DER), p=0.004, R2=0.83. See Supplemental methods for more details.
η=0.452
η=0.584
5
6
(F) Relative PARP1 inhibition was assessed for Rucaparib using recombinant PARP1 protein and standard PAR formation enzyme assays. (G) Dose enhancement ratios (DERs) at indicated concentrations of Rucaparib correlate with Rucaparib PARP1 activity inhibition at different concentrations in a cell-free PARP1 activity assay. See Supplemental methods for more details. (H-K) A549 NSCLC cells were pretreated with or without various doses (µM) of Rucaparib (H); Olaparib (I) ; Veliparib (J); and Talazoparib (K), as indicated for 2 hr. Cells were then exposed or not to each PARP inhibitor (µM) + a sublethal dose of β-lap (3 µM for A549 cells) for 2 hr. Survival was then assessed using 7-day relative survival DNA content assays. (L) Endogenous NQO1+ MiaPaCa2 cells were knocked down for NQO1 expression using stable shRNA-NQO1 retroviral expression Simultaneously, *2 homopolymorphic H596 NSCLC cells were transfected with a CMV-NQO1 mammalian expression vector. NQO1+ cells were NQO1- transfected with CMV-NQO1 for expression. All error bars are means ± SEM from three experiments. Student’s t tests were performed. ***, p < 0.001; **, p < 0.01; *, p < 0.05. Synergy values (eta, η) were reported based on multiple dose-responses or on comparative p values indicated.
0 2 4 61
10
100
β-Lap (µM, 2 hr)R
elat
ive
Surv
ival
(% T
/C)
shNQO1 17-3shNQO1 17-3+Rucaparib
shSCR
***
**
*shNQO1 17-3 17-7
α-tubulin
NQO1
A B
0 5 10 15 20 250
20
40
60
80
100
Rucaparib (µM, 4 hr)
Rel
ativ
e Su
rviv
al (%
T/C
)
MiaPaCa2
H596 NQO1+
MDA-MB-231 NQO1+
S2-013 NQO1+
C
D
7
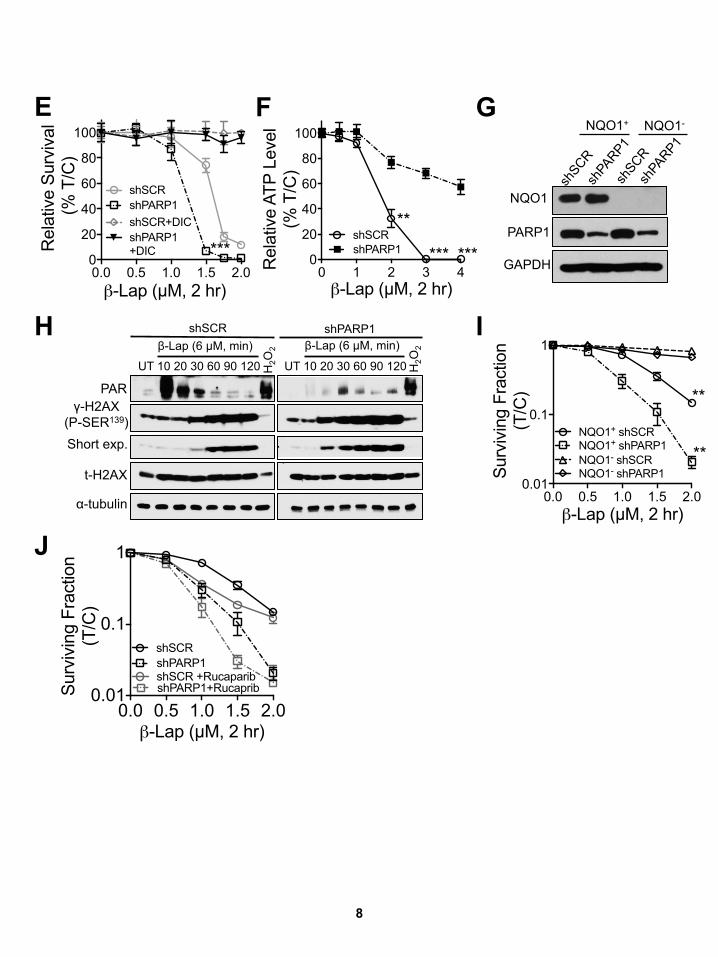
8
0.0 0.5 1.0 1.5 2.00.01
0.1
1
β-Lap (µM, 2 hr)
shSCR shPARP1shSCR +RucaparibshPARP1+RucapribS
urvi
ving
Fra
ctio
n (T
/C)
0 1 2 3 40
20
40
60
80
100
β-Lap (µM, 2 hr)
shSCRshPARP1 *** ***
**
Rel
ativ
e AT
P Le
vel
(% T
/C)
0.0 0.5 1.0 1.5 2.00
20
40
60
80
100
β-Lap (µM, 2 hr)
Rel
ativ
e Su
rviv
al (%
T/C
)
shSCRshPARP1shSCR+DICshPARP1+DIC ***
NQO1+ NQO1-
NQO1
GAPDH
PARP1
PAR
α-tubulin
UT 10 20 30 60 90 120
β-Lap (6 µM, min)
t-H2AX
H2O
2
H2O
2
shSCR shPARP1 β-Lap (6 µM, min)
H
Short exp.
γ-H2AX (P-SER139)
UT 10 20 30 60 90 120
E F
J
I
G
0.0 0.5 1.0 1.5 2.00.01
0.1
1
β-Lap (µM, 2 hr)
NQO1+ shSCR NQO1+ shPARP1NQO1- shSCRNQO1- shPARP1
**
**
Surv
ivin
g Fr
actio
n (T
/C)
9
Figure S4, Related to Figures 4, 5: NQO1 expression loss results in resistance to β-lapachone, with or without PARP inhibitors and stable PARP1 knockdown sensitizes MDA-MB-231 breast cancer cells to β-lap in an NQO1-dependent manner. (A) MiaPaCa2 cells were knocked down for NQO1 by stable shRNA-NQO1 lentiviral infection. Stable MiaPaCa2 knockdown clones (17-3 and 17-7) were isolated and analyzed for NQO1 expression. α-Tubulin was used for loading. (B) Stable shSCR or shPARP knockdown 17-3 MiaPaCa2 cells were pretreated or not with Rucaparib (15 µM, 2 hr) and then exposed to Rucaparib (15 µM) in combination with varying doses of β-lap (0-6 µM) for 2 hr as indicated. Survival was then determined by 7-day DNA content assays. (C) NQO1 overexpressing MiaPaCa2 PDA, Suit-2 (S2-013) PDA, H596 NSCLC, and MDA-MB-231 breast cancer cells were treated for 4 hr with varying concentrations of Rucaparib (µM) and survival was assessed using 7-day relative survival DNA content assays. (D) A summary of the synergistic responses of non-small cell lung (NSCLC) (A549, NQO1+ H596), PDA (MiaPaCa2, NQO1+ Suit2 (S2-013)) and breast (MCF-7, NQO1+ MDA-MB-231) cancer cells following Rucaparib + β-lapachone therapy as described in Figure 4. Examination of sequenced mutations of major oncogenic driver or passenger mutations indicates a clear independence of synergistic lethal activity of Rucaparib + β-lap with respect to mutations in these genes (indicated in green). (E) Stable shSCR vector alone or shPARP1 knockdown MCF-7 cells were treated with various concentrations of β-lap (µM) in the presence or absence of dicoumarol (DIC, 50 µM) for 2 hr. Relative survival was then assessed. (F) Stable shSCR vector alone or shPARP1 knockdown MCF-7 cells were treated with or without various doses (0-4 µM) of β-lap for 2 hr and relative ATP levels were assessed at the end of this treatment. (G) Stable MDA-MB-231 cells harboring shSCR vector and shRNA-NQO1 knockdown were generated and knockdown confirmed by Western blotting. GAPDH is for loading control. (H) shSCR or shPARP1 knockdown MDA-MB-231 cells were exposed or not to β-lap (6 µM) and whole cell lysates prepared at times indicated. Samples were interrogated for PAR formation, γH2AX vs total-H2AX (t-H2AX) and α-tubulin for loading. Cells were also treated with 500 µM H2O2 for 15 min as the positive control. (I) Stable shSCR vs shPARP1 knockdown MDA-MB-231 cells expressing or lacking NQO1 were exposed to β-lap at various concentrations (µM) for 2 hr and surviving fractions assessed by colony forming ability assays. (J) MDA-MB-231-NQO1+ Cells were pretreated with or without 15 µM Rucaparib for 2 hr, then exposed or not to Rucaparib (15 µM) + various β-lap concentrations (µM) as indicated for 2 hr. Cells were then assessed for survival using colony forming assays as in (I). All error bars are means ± SEM from three experiments. Student’s t tests were performed. ***, p < 0.001; **, p < 0.01; *, p < 0.05.
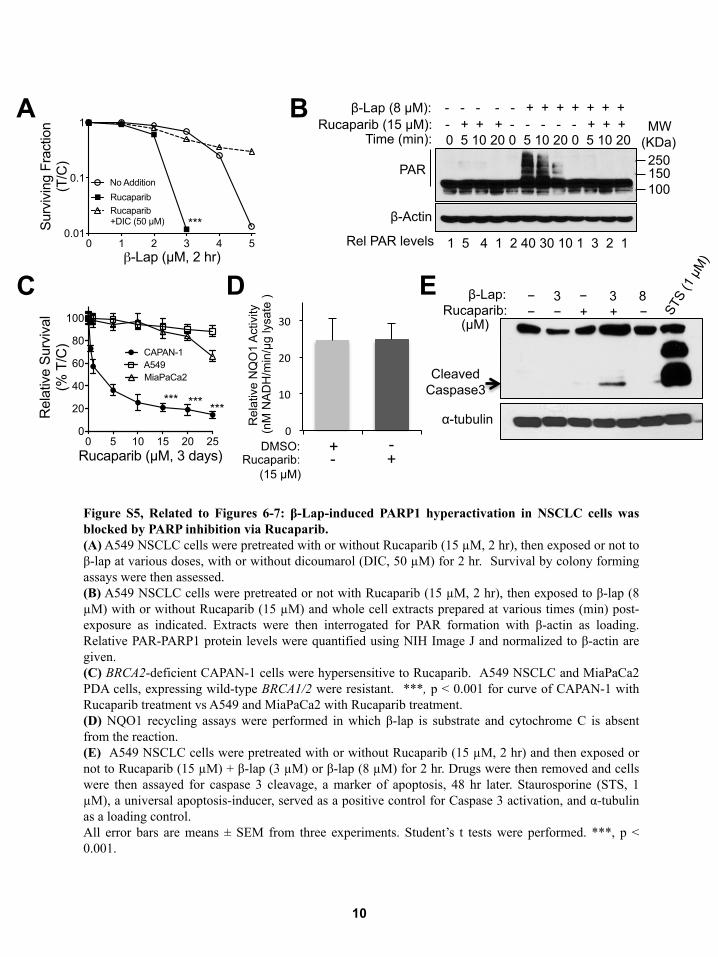
0 1 2 3 4 50.01
0.1
1
β-Lap (µM, 2 hr)
Sur
vivi
ng F
ract
ion
(T/C
)
No Addition
Rucaparib Rucaparib +DIC (50 µM) ***
0 5 10 15 20 250
20
40
60
80
100
Rucaparib (µM, 3 days)
Rel
ativ
e Su
rviv
al
(% T
/C)
CAPAN-1A549MiaPaCa2
****** ***
0
10
20
30
Rel
ativ
e N
QO
1 A
ctiv
ity
(nM
NA
DH
/min
/µg
lysa
te )
DMSO: Rucaparib:
(15 µM)
+ + -
Rel PAR levels 1 5 4 1 2 40 30 10 1 3 2 1
PAR
β-Actin
Time (min): 0 5 10 20 0 5 10 20 0 5 10 20 Rucaparib (15 µM): - + + + - - - - - + + +
β-Lap (8 µM): - - - - - + + + + + + +
250 150 100
A
Cleaved Caspase3
− 3 − 3 8 − − + + −
α-tubulin
β-Lap: Rucaparib:
(µM)
C D E
Figure S5, Related to Figures 6-7: β-Lap-induced PARP1 hyperactivation in NSCLC cells was blocked by PARP inhibition via Rucaparib. (A) A549 NSCLC cells were pretreated with or without Rucaparib (15 µM, 2 hr), then exposed or not to β-lap at various doses, with or without dicoumarol (DIC, 50 µM) for 2 hr. Survival by colony forming assays were then assessed. (B) A549 NSCLC cells were pretreated or not with Rucaparib (15 µM, 2 hr), then exposed to β-lap (8 µM) with or without Rucaparib (15 µM) and whole cell extracts prepared at various times (min) post-exposure as indicated. Extracts were then interrogated for PAR formation with β-actin as loading. Relative PAR-PARP1 protein levels were quantified using NIH Image J and normalized to β-actin are given. (C) BRCA2-deficient CAPAN-1 cells were hypersensitive to Rucaparib. A549 NSCLC and MiaPaCa2 PDA cells, expressing wild-type BRCA1/2 were resistant. ***, p < 0.001 for curve of CAPAN-1 with Rucaparib treatment vs A549 and MiaPaCa2 with Rucaparib treatment. (D) NQO1 recycling assays were performed in which β-lap is substrate and cytochrome C is absent from the reaction. (E) A549 NSCLC cells were pretreated with or without Rucaparib (15 µM, 2 hr) and then exposed or not to Rucaparib (15 µM) + β-lap (3 µM) or β-lap (8 µM) for 2 hr. Drugs were then removed and cells were then assayed for caspase 3 cleavage, a marker of apoptosis, 48 hr later. Staurosporine (STS, 1 µM), a universal apoptosis-inducer, served as a positive control for Caspase 3 activation, and α-tubulin as a loading control. All error bars are means ± SEM from three experiments. Student’s t tests were performed. ***, p < 0.001.
10
B MW
(KDa)
-
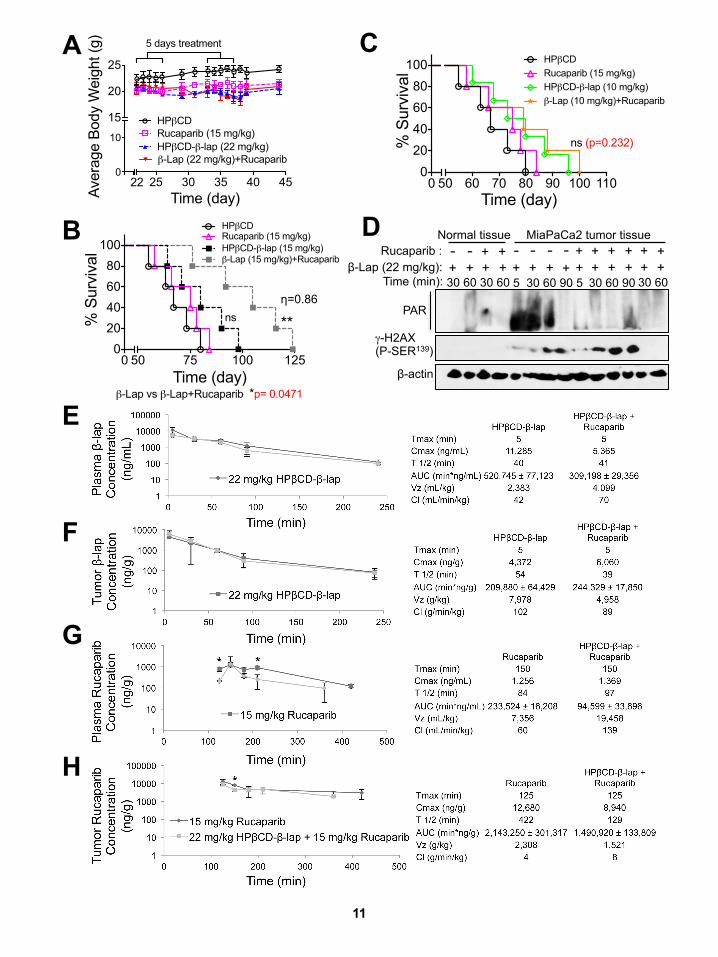
25 30 35 40 450
10
15
20
25
Time (day)Aver
age
Body
Wei
ght (
g)
HPβCDRucaparib (15 mg/kg)HPβCD-β-lap (22 mg/kg)β-Lap (22 mg/kg)+Rucaparib
5 days treatment
22
0 50 75 100 1250
20406080
100
Time (day)
% S
urvi
val
HPβCDRucaparib (15 mg/kg)HPβCD-β-lap (15 mg/kg)β-Lap (15 mg/kg)+Rucaparib
**ns
β-Lap vs β-Lap+Rucaparib *p= 0.0471
Time (min): 30 60 30 60 5 30 60 90 5 30 60 90 30 60 β-Lap (22 mg/kg):
PAR
β-actin
Normal tissue MiaPaCa2 tumor tissue
γ-H2AX (P-SER139)
Rucaparib : -‐ + + + + -‐ + +
+ + + + + + + + + + + + + + + + -‐ -‐ -‐ -‐
D
E
F
G
H
η=0.86
A C
B
0 50 60 70 80 90 100 1100
20406080
100
Time (day)
% S
urvi
val
HPβCDRucaparib (15 mg/kg)HPβCD-β-lap (10 mg/kg)β-Lap (10 mg/kg)+Rucaparib
ns (p=0.232)
11
Figure S6, Related to Figure 8: Weight loss changes and antitumor activities of Rucaparib + β-lapachone treatments in PDA animal model and pharmacokinetics (PK) of HPβCD-β-lap and Rucaparib in plasma and MiaPaCa2 pancreatic tumors (PDA). (A-D) MiaPaCa2 cells (1 X 10⁶) were injected into the pancreatic tissue of NOD/SCID female 20-22 g mice and drug treatments began 21 days post-injection. (A) Changes in weights were monitored over a 20 day period after exposure with HPβCD (vehicle), Rucaparib (15 mg/kg, ip), β-lapachone (22 mg/kg, iv), as well as 2 hr pretreatment with Rucaparib (15 mg/kg, ip), then with β-lapachone (β-lap, 22 mg/kg, iv) once every day for 5 injections. Mice were allowed seven days rest, then treated with 5 additional injections. (B, C) Mice were pretreated 2 hr with 15 mg/kg Rucaparib (ip), then with 15 (B) or 10 (C) mg/kg β-lapachone (β-lap), iv. Overall survival was monitored. (D) Western blot analyses of tumor and normal tissue from orthotopic xenografts derived from MiaPaCa2 cells grown in female NOD/SCID mice treated with Rucaparib alone (15 mg/kg), β-lapachone alone (22 mg/kg) or the combination of Rucaparib + β-lapachone as in Figure 8D. Monitored are poly(ADP)-modified proteins (PAR), mostly PAR-PARP1, γH2AX as an indicator of DSB formation, and β-actin as a loading control. (E-H) Mice were dosed in combination with 15 mg/kg Rucaparib ip two hours prior to dosing with 22 mg/kg HPβCD-β-lap iv. At varying times after administration, the mice were sacrificed and whole blood and tumor tissues were harvested. Plasma was obtained from the whole blood by centrifugation and tumors were homogenized in PBS to generate a lysate. The plasma and tumor samples were then analyzed by LC-MS/MS. HPβCD-β-lap concentrations were measured in plasma (E) and tumor (F) over time for both types of treatment. Rucaparib concentrations were also measured in plasma (G) and tumor (H) for both types of treatment. Non-compartmental pharmacokinetic parameters are shown for maximum time (Tmax), maximum concentration (Cmax), half-life (T 1/2), area under the concentration time curve (AUC), volume of distribution (Vz), and clearance (Cl). All error bars are means ± SD from three mice in each group. Student’s t tests were performed. ***, p < 0.001; **, p < 0.01; *, p < 0.05; ns, not significant. Synergy values (eta, η) were reported based on multiple dose-responses or on comparative p values indicated.
12
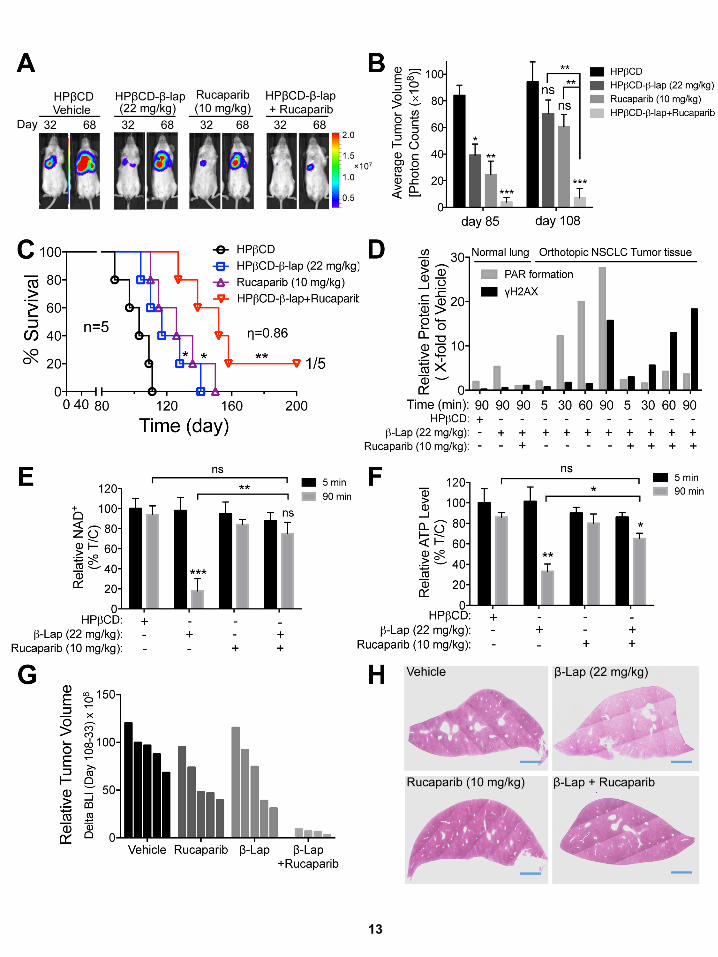
13 13
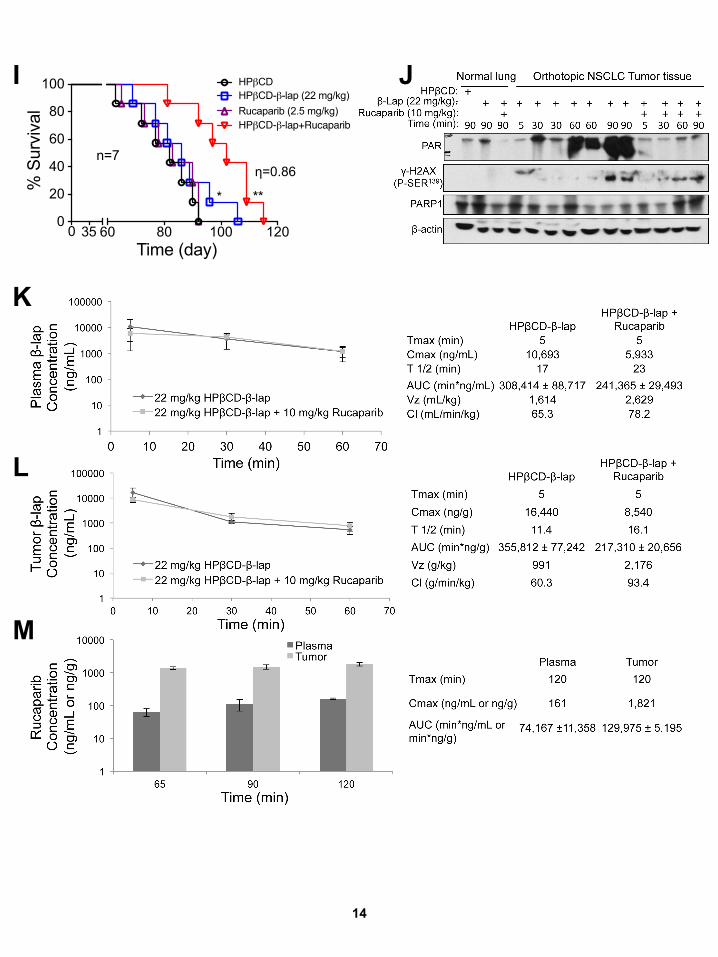
60 80 100 1200
20
40
60
80
100
Time (day)
% S
urvi
val
HPβCD
Rucaparib (2.5 mg/kg)HPβCD-β-lap (22 mg/kg)
HPβCD-β-lap+Rucaparib
n=7
**
0 35
*
J
K
L
M
14
I
η=0.86
15
Figure S7, Related to Figure 8: PARP inhibitors synergize with β-lap against orthotopic A549 NSCLC xenografts, PARP inhibition by Rucaparib results in super-additive antitumor activity with β-lapachone (β-lap) against A549 NSCLC xenografts in NOD/SCID female mice, and Pharmacokinetics of HPβCD-β-lap and Rucaparib in plasma and A549 NSCLC tumors. (A, B) Orthotopic A549 NSCLC tumors expressing luciferase were established in 18-20 g female NOD/SCID mice by injecting ~1 X 10⁶ cells, iv, tail vein. After 6 days, mice were treated or not with Rucaparib (10 mg/kg, ip). Rucaparib was given daily for 11 days. On day 7(t=0, cell injection), mice were injected with vehicle (HPβCD, iv) alone, or HPβCD-β-lap (22 mg/kg, iv, tail vein) every other day for a total of 5 injections over 10 days. Bioluminescence imaging (BLI) was used to monitor relative tumor volumes. Representative BLI images are shown at days 32 and 68 (A). Average tumor volumes were calculated at days 85 and 108 post-treatment (B). (C) Kaplan-Meier survival curves of animals treated in (A). **, p < 0.01; *, p < 0.05, β-lap (22 mg/kg) or combined treatment versus HPβCD alone treatment (log-rank test). (D) Orthotopic A549 NSCLC tumor-bearing female NOD/SCID mice (3/group) were treated as in (A) and sacrificed at indicated times (min). Blood, tumor and various normal tissues (including associated normal lung tissue) were extracted and analyzed for PAR-PARP1, γH2AX levels and loading using β-actin (Figure S7J). Relative levels of each biomarker were calculated using loading controls. Experiments were repeated at least three times. (E, F) Tumor tissues from (D) were assessed for relative NAD+ (E) or ATP (F) levels at indicated times (5 and 90 min). (G) Mice (5/group) were treated as described in Figure S7A-S7F. Tumor volumes were estimated using BLI imaging (means ± SEM, Figure S7B) and individual tumors in mice graphed as a waterfall plot as the differences in volumes from days 33 to 108. Change in BLI values were divided by 1 X 10⁸ to fit values on scale. (H) Mice (3/group) were treated as described in Figure S7A-S7F, and day 45 following the last of the 5 treatments, mice were sacrificed and all organs examined for long-term toxicities to normal tissue. 10% formalin fixed and examined for toxicities. H&E staining for liver, scale bar = 0.5 cm. (I) Female NOD/SCID mice bearing A549 NSCLC lung cancer xenografts were exposed to vehicle or Rucaparib (2.5 mg/kg, ip) 1 hr, and then injected with or without β-lap (22 mg/kg, iv). Each group had 7 mice. Rucaparib was injected daily and β-lap injected every other day for 5 days over an 11-day period. A Kaplan-Meier survival curve was then constructed. (J) Mice were treated as described in Figure S7D, tumor and various normal tissues (including associated normal lung tissue) were extracted and analyzed for PAR-PARP1, γH2AX levels and loading using β-actin. Relative levels of PAR and γH2AX were calculated and graphed in Figure S7D. All error bars are means ± SEM from three mice in each group. Student’s t tests were performed. ***, p < 0.001; **, p < 0.01; *, p < 0.05; ns, not significant. (K-M) Mice were dosed with 10 mg/kg Rucaparib ip 1 hr prior to dosing with 22 mg/kg HPβCD-β-lap iv or 22 mg/kg HPβCD-β-lap was given alone. At varying times after administration of HPβCD-β-lap, mice were sacrificed and whole blood and tumor tissues harvested. Plasma was obtained from the whole blood by centrifugation and tumors were homogenized in PBS to generate a lysate. Plasma and tumor samples were then analyzed by LC-MS/MS. HPβCD-β-lap concentrations were measured in plasma (K) and tumor (L) over time for both types of treatment. Rucaparib concentrations were also determined for both plasma and tumor (M). Error bars on the graphs represent standard deviation between samples. Non-compartmental pharmacokinetic parameters are shown for maximum time (Tmax), maximum concentration (Cmax), half-life (T 1/2), area under the concentration time curve (AUC), volume of distribution (Vz), and clearance (Cl). Errors for the AUC values are represented by the standard error of the mean. Synergy values (eta, η) were reported based on multiple dose-responses or on comparative p values indicated.
16
Supplemental Experimental Procedures Cell Culture A majority of breast and PDA cancer cells were obtained from the American Tissue Culture Collection (ATCC, Manasas, VA), and all lung cancer cell lines were generated by the UT Southwestern-MD Anderson SPORE in lung cancer, or from the ATCC. All cells were cultured under 5% CO2-95% air atmosphere at 37 °C, generally in DMEM or RPMI (Life Technologies, Carlsbad, CA) containing 10% or 5% fetal bovine serum (Hyclone, Thermo Sci., Logan UT), as required. All cells were mycoplasma-free and MAP tested. NQO1 Enzyme Activities and Protein Levels NQO1 enzyme levels were monitoring cytochrome C (Sigma-Aldrich, St. Louis, MO) reduction as the terminal electron acceptor and menadione as the quinone electron donor as substrate (Sigma-Aldrich). Reactions were initiated with NADH addition. NQO1 activity to recycle β-lap was also assessed as described (Li et al., 2011; Pink et al., 2000) Tumor and associated normal de-identified patient samples were obtained from two IRBs: (i) the UT Southwestern Medical Center Tissue Resource (UTSTR), IRB# STU 102010-051 (PI: A Witkiewicz), where fresh frozen tissues for enzyme assays were obtained; and (ii) IRB STU 0142011-005 (PI: DE Gerber), ‘A Phase I dose-escalation study of ARQ 761 (β-lapachone) in adult patients with advanced solid tumors’, from which 10% formalin-fixed sections were stained for NQO1 expression and counterstained for H&E. PARP1 Enzymatic Assays and Dose Enhancement Ratio (DER) Calculations Cell-Free Purified PARP1 Enzymatic Assays. PARP1 activity was assessed in vitro using recombinant flag-tagged PARP1 enzyme. In a reaction buffer containing Tris-HCl (10 mM, pH 8.0) and MgCl2 (10 mM) was added purified Flag-PARP1 (10 nM) and purified DNA substrate containing blunt-ends and an internal synthetic abasic site (1000 nM, Sigma-Aldrich), which are known to bind and activate PARP1 (D’Silva et al., 1999; Khodyreva et al., 2010). After 15s incubation at room temperature, the reaction was initiated by addition of NAD+ (100 µM) with or without the indicated PARP inhibitors (10 nM) in Figure S3E or at varying concentrations of Rucaparib (0, 2.5, 5.0, 10, 15 nM) in Figures S3F, S3G. Enzymatic reactions were incubated at room temperature for 1 min and immediately quenched with ice-cold trichloroacetic acid (TCA, 20% w/v solution). Equal aliquots of each reaction were then loaded on to a nitrocellulose membrane using a dot blot apparatus. Membrane were then blocked with casein blocking solution (Sigma-Aldrich) for 1 hr at room temperature and processed using standard Western blot procedures: PAR antibody (1:500 dilution, Trevigen) at 4°C overnight; secondary anti-mouse antibody (1:1000, Sta. Cruz) for 1 hr at room temperature. PAR formation densitometry was measured via Image J, and PARP1 activity inhibition was calculated relative to no PARP inhibitor control. Linear regression correlation was calculated via Prism 7 software.
17
Dose Enhancement Ratio (DER) Calculations. Dose enhancement ratio (DER) calculations in Figure S3E were obtained as described in the equation shown below:
or the combination [β-lap (3 µM) + PARP inhibitors (~LD10)] were obtained via DNA assay as previously described. These values were then used in the equation described above to calculate the DER. Linear regression correlation was calculated via Prism 7 software. (See text for DER calculation for Figures S3F, S3G. Survival Assays Relative survival assays based on 7 day DNA content assessments were performed as described (Huang et al., 2012; Pink et al., 2000). Briefly, cells (1 X 10⁴) were seeded onto 48-well plates, pretreated with PARP inhibitors (Selleck Chemicals, Houston, TX; Cayman Chemical, Ann Arbor, MI) or vehicle for 2 hr, and then co-treated with Rucaparab (15 µM) + β-lap (synthesized by us) at various doses, with or without dicoumarol (DIC, 50 µM) (Sigma-Aldrich) in 6 replicates per dose. After ~7 days growth, or once vehicle-treated cells reached 90% confluence, media were removed, cells washed, lysed by freeze-thaw, DNA stained by Hoechst 33258 dye (Sigma-Aldrich, 14530) and quantified by fluorescence (460 nm) in a Victor X3 (Perkin-Elmer, Waltham, MA) plate reader. For colony forming ability assays, cells were treated as described above at 500-1000 cells per 60 mm plates. After ~7 days, colonies were fixed in methanol and stained with crystal violet (C6158, Sigma-Aldrich). Colonies of >50 healthy appearing cells were counted and total colonies normalized to vehicle-treated cells. Western Blotting Lysates were prepared from cancer cells or homogenized tumor tissue in RIPA-containing buffer with protease (S8820, Sigma-Aldrich) and phosphatase inhibitors (sc45044, sc45045, Santa Cruz). Proteins were separated by 8% SDS-PAGE gels, transferred to PVDF membranes (IPVH00010, Millipore), blocked in casein buffer (B6429, Sigma-Aldrich) and incubated with primary antibodies overnight at 4 °C. Secondary antibody incubation was performed for 1 hr at room temperature with anti-mouse or anti-rabbit HRP conjugated antibodies (Santa Cruz). ECL chemiluminescent detection was then performed (Thermo Scientific, 34077) and density analyses were performed in NIH ImageJ with intensity normalization as indicated. Immunofluorescence Cells were grown on glass coverslips and treated with Rucaparib, β-lap or the combination as described in “Survival Assays”. Cells were fixed, washed, blocked in 1% BSA, (30 min, rm. temp.) in PBS with 5% normal goat serum (NGS, Jackson ImmunoResearch, West Grove, PA), incubated
18
with primary antibody in PBS/NGS overnight at 4 oC, and incubated with Alexa-Fluor conjugated secondary antibody (Life Technologies) for 1 hr at room temperature. Cells were then imaged on a Leica DM5500 fluorescent microscope and gH2AX foci/nuclei quantified. Pharmacokinetic Analyses of HPβCD-β-lap and Rucaparib in mice bearing A549 NSCLC Xenografts Pharmacokinetic studies were performed in NOD/SCID mice bearing orthotopic A549 lung cancer cells. Rucaparib was injected at 10 mg/kg via the intraperitoneal (ip) route. One hour after Rucaparib treatment, the mice were injected with HPβCD-β-lap (22 mg/kg) via tail vein (iv). Animals were sacrificed at different time points (from 5 to 60 min) after HPβCD-β-lap treatment. Whole blood and tumor tissue was harvested at the same time. The blood sample was separated by centrifugation for 10 min at 9600 x g and the plasma supernatant was saved. Tumor tissues were homogenized in PBS For standards, blank commercial plasma (Bioreclamation, Westbury, NY) or untreated tumor tissue homogenate was spiked with varying concentrations of compound. Standards and samples were mixed with a 2X volume of 100% acetonitrile containing 0.15% formic acid, vortexed, and then spun 5 min at 16,100 x g. The supernatant was removed and spun again and the resulting second supernatant was put into an HPLC vial with an insert and then analyzed by LC-MS/MS using an AB Sciex 3200 QTRAP® coupled to a Shimadzu Prominence LC. β-lap and Rucaparib were detected with the mass spectrometer in MRM (multiple reaction monitoring) mode by following the precursor to fragment ion transition 243.1 → 187.2 and 324.1 → 293.2, respectively. An Agilent Zorbax XDB-C18 column (50 x 4.6 mm, 5 micron packing) was used for chromatography with the following conditions: Buffer A: dH20 + 0.1% formic acid, Buffer B: MeOH + 0.1% formic acid, 1.5 mL/min flow rate, 0-1.5min 3%B, 1.5-2.5 min gradient to 100% B, 2.5-3.5 min 100% B, 3.5-3.6 min gradient to 3% B, 3.6-4.5 min 3% B. In general, back-calculation of standard curve and quality control samples were accurate to within 20% for 70% of these samples at concentrations ranging from 5 ng/ml to 10,000 ng/ml. Pharmacokinetic parameters from 0-1 hr for β-lap and 0-2 hr for Rucaparib were calculated using the non-compartmental analysis tool of Phoenix WinNonlin (Certara Corporation, Princeton, NJ). An unpaired t-test (GraphPad QuickCalcs, San Diego, CA) was used to test for significant differences in β-lap concentrations in the different treatment groups. Pharmacokinetic Analyses of HPβCD-β-lap and Rucaparib in mice bearing orthotopic MiaPaCa2 xenografts Pharmacokinetic studies were performed in NOD/SCID mice bearing orthotopic MiaPaCa2 pancreatic cancer cells. Rucaparib was injected at 15 mg/kg via the intraperitoneal (ip) route. Two hours after Rucaparib treatment, some of the mice were injected with HPβCD-β-lap (22 mg/kg) via tail vein (iv). Animals were sacrificed at different time points (from 5 to 240 min) after potential HPβCD-β-lap treatment. Whole blood and tumor tissue was harvested at the same time. Processing and analysis followed the same procedure outlined previously for A549 tumor bearing
19
mice except tolbutamide (transition 271.2 → 91.2) was included as an internal standard and β-lapachone levels were measured with an AB Sciex 4000 QTRAP®. Pharmacokinetic parameters from 0-4 hr for β-lap and 0-7 hr for Rucaparib were calculated using the non-compartmental analysis tool of Phoenix WinNonlin (Certara Corporation, Princeton, NJ). An unpaired t-test (GraphPad QuickCalcs, San Diego, CA) was used to test for significant differences in β-lap and Rucaparib concentrations in the different treatment groups. Microarray Expression Data, Processing and Analyses Gene expression data series were retrieved from the Gene Expression Omnibus (GEO) database on September 30, 2011 subject to the following criteria: Study included NSCLC tumor or cell lines of NSCLC origin, more than 50 samples in the full study, processed using the GeneChip Human Genome U133 Plus 2.0 expression array. A total of 8 series met these criteria and were included in the cohort for analysis: GSE2109, GSE8332, GSE10445, GSE10843, GSE14315, GSE18842, GSE19804, GSE31546. The assembled cohort included 327 NSCLC tumor samples, 105 normal lung and 128 NSCLC cell line specimens, for a total of 560 specimens. Within this assembled cohort were 105 matched-pair specimens from two independent studies, in which biopsies were taken from both tumor and adjacent normal lung for each NSCLC patient studied. The 560 specimen data files included in the cohort were downloaded as raw CEL files for post-processing together, following the standard gene expression data preparation workflow (Irizarry et al., 2003). We used the R package aroma.affymetrix, which uses persistent memory to allow analyses of very large datasets. Data were processed using the linear model from RMA, then fit robustly using probe level models as described (Robinson and Speed, 2007). Probe level models were fit to RMA-background corrected and quantile normalized data to obtain gene-level summaries. Gene-level summarization used the standard CDF provided by Affymetrix. The Welch's t-test for unequal variance was used to compute p values for the difference in the means. All analyses were performed in R. Statistical tests were performed using base R statistical functions, graphics were generated using the ggplot2 graphics package (Wickham, 2009). Response analyses in NSCLC patients We accessed NQO1 expression levels from RNAseq data in 467 lung adenocarcinoma (LUAD) cases from The Cancer Genome Atlas (TCGA: https://tcga-data.nci.nih.gov/tcga). From this dataset, we only included cases that: (1) were treated with standard of care chemotherapy (cisplatin and/or a taxol-based agent) and (2) contained information on patient response outcomes. Next, we separated cases into either clinical response (CR) or progressive disease (PD) groups as per Response Evaluation Criteria in Solid Tumors (RECIST) guidelines (Therasse et al., 2000), resulting in 71 total LUAD cases: 44 cases in the CR group and 27 cases in the PD group. Statistical significance was measured using a two-tailed Student’s t-test.
20
Histologic grade analyses in PDA patients We accessed NQO1 expression levels from RNAseq data in 128 pancreatic adenocarcinoma (PDA) cases from TCGA. Next, we analyzed cases that contained PDA histologic grade between Grade 1 and Grade 3 (G1-G3) (Kloppel et al., 1985). This filter resulted in 36 total PDA cases: 6 cases in G1 group, 21 cases in G2 group and 9 cases in G3 group. Statistical significance was measured using a two-tailed Student’s t-test. Statistical considerations in evaluation the combined effects of PARP inhibitors + β-lap therapies The effects of PARP inhibitors or β-lap alone, or combined treatment of PARP inhibitors + β-lap were examined using one-way ANOVA followed by two-group comparisons for continuous measures of log-rank tests for survival outcome measures in vivo. Synergistic effects in vitro and in vivo were easily established with multiple doses examined. Evaluations of ‘synergistic effects’ in vivo between PARP inhibitors and β-lapachone on tumor volumes and/or survival measurements in vivo were completed as dose-response curves (containing three doses) (Loewe, 1953; Chou and Talalay, 1984; Lee et al., 2007; and Tallarida, 2011).
Supplemental References D'Silva, I., Pelletier, J. D., Lagueux, J., D'Amours, D., Chaudhry, M. A., Weinfeld, M., Lees-Miller, S. P., and Poirier, G. G. (1999). Relative affinities of poly(ADP-ribose) polymerase and DNA-dependent protein kinase for DNA strand interruptions. Biochimica et biophysica acta 1430, 119-126. Khodyreva, S. N., Prasad, R., Ilina, E. S., Sukhanova, M. V., Kutuzov, M. M., Liu, Y., Hou, E. W., Wilson, S. H., and Lavrik, O. I. (2010). Apurinic/apyrimidinic (AP) site recognition by the 5'-dRP/AP lyase in poly(ADP-ribose) polymerase-1 (PARP-1). Proceedings of the National Academy of Sciences of the United States of America 107, 22090-22095. Therasse, P., Arbuck, S. G., Eisenhauer, E. A., Wanders, J., Kaplan, R. S., Rubinstein, L., Verweij, J., Van Glabbeke, M., van Oosterom, A. T., Christian, M. C., and Gwyther, S. G. (2000). New guidelines to evaluate the response to treatment in solid tumors. European Organization for Research and Treatment of Cancer, National Cancer Institute of the United States, National Cancer Institute of Canada. Journal of the National Cancer Institute 92, 205-216.
Related Documents
![[PPT]TUMOR TRAKTUS UROGENITAL - FK UWKS 2012 C | … · Web viewTUMOR TRAKTUS UROGENITAL I. Tumor Ginjal A. Tumor Grawitz B. Tumor Wilms II. Tumor Urotel III. Tumor Testis IV. Karsinoma](https://static.cupdf.com/doc/110x72/5ade93b87f8b9ad66b8bb718/ppttumor-traktus-urogenital-fk-uwks-2012-c-viewtumor-traktus-urogenital.jpg)