Levels and profiles of PCBs and OCPs in marine benthic species from the Belgian North Sea and the Western Scheldt Estuary Stefan Voorspoels * , Adrian Covaci, Johan Maervoet, Ingrid De Meester, Paul Schepens Toxicological Centre, University of Antwerp (UA), Universiteitsplein 1, 2610 Wilrijk, Belgium Abstract Various benthic invertebrates (flying crab, common shrimp, and red starfish), small fish (sand goby), benthic flatfish (dab, plaice, and sole) and gadoids (bib and whiting) were collected in the Belgian North Sea and along the Scheldt Estuary, both representing areas impacted by various contaminants to different degrees. The levels of 25 polychlorinated biphenyls (PCBs) and 15 organo- chlorine pesticides (OCPs), which included penta- and hexachlorobenzene, a-, b-, and c-hexachlorocyclohexane isomers, chlordanes, and DDT and metabolites, were determined. Sum of PCBs and OCPs in benthic invertebrates and goby ranged from 1.5 to 280 ng/g wet weight (ww) and from 0.27 to 23 ng/g ww, respectively. The fish livers revealed total PCB and OCP levels ranging from 20 to 3200 ng/g ww and from 6.0 to 410 ng/g ww, respectively. Levels of both contaminant groups were significantly higher in samples from the Scheldt Estuary compared to the Belgian North Sea. For most species a highly inverse correlation was found between the concentration of contaminants and the distance to Antwerp (r between 0.812 and 0.901, p < 0:05), pointing to a higher degree of exposure further upstream. PCB and OCP exposures are highly correlated (r between 0.836 and 1.000, p < 0:05), which suggests that the pollution can be classified as historical. However, because urban and industrial centres may still be emitting these compounds, more recent point and non-point sources cannot be ruled out. Ó 2004 Elsevier Ltd. All rights reserved. Keywords: PCBs; Pesticides; Invertebrates; Fish; North sea; Scheldt estuary 1. Introduction The use and/or production of polychlorinated bi- phenyls (PCBs) and organochlorine pesticides (OCPs), such as 2,2-bis-(4-chlorophenyl)-1,1,1-trichloroeth- ane (DDT), hexachlorobenzene (HCB) and lindane (c-HCH) have been banned in most developed countries since the 1970s (UNEP, 2003). Despite this measure, these compounds are among the most prevalent envi- ronmental pollutants and they can be found in various environmental compartments, both biotic (from plank- ton to humans) (de Voogt et al., 1990; Covaci et al., 2002; Voorspoels et al., 2002) and abiotic (air, water, sediments, soil) (Fuoco et al., 1995; de Boer et al., 2001). Their widespread presence is due to their extremely persistant and lipophilic nature. These properties cause these persistent organic pollutants (POPs) to bioaccu- mulate in the adipose tissues of biota, resulting in the enrichment throughout the food chain (de Voogt et al., 1990). Prolonged exposure to these pollutants can interfere with normal physiology and biochemistry (den Besten et al., 1989; Everaarts et al., 1998; Mills et al., 2001; Picard et al., 2003). The occurrence and severity of these interferences depend on various factors, such as the concentration of pollutants in the organism, suscept- ability of the species, and duration of exposure (Giesy and Kannan, 1998; Safe, 1994). Effects of these com- pounds can be seen at various levels of the food chain, including starfish (den Besten et al., 1990), shrimp (Key et al., 2003), crabs (Weis et al., 1992), fish (Mills et al., 2001; Khan, 2003; Boon et al., 1992; Sleiderink et al., 1995), porpoises (Jepson et al., 1999), and humans (Masuda, 2003). Because humans readily consume seafood, such as shrimp, crab and various fish species, these organisms are of great scientific value to estimate the possible exposure to PCBs and OCPs through marine food * Corresponding author. Tel.: +32-3-820-27-04; fax: +32-3-820-27- 22. E-mail address: [email protected] (S. Voorspoels). 0025-326X/$ - see front matter Ó 2004 Elsevier Ltd. All rights reserved. doi:10.1016/j.marpolbul.2004.02.024 www.elsevier.com/locate/marpolbul Marine Pollution Bulletin 49 (2004) 393–404

Welcome message from author
This document is posted to help you gain knowledge. Please leave a comment to let me know what you think about it! Share it to your friends and learn new things together.
Transcript

www.elsevier.com/locate/marpolbul
Marine Pollution Bulletin 49 (2004) 393–404
Levels and profiles of PCBs and OCPs in marine benthic speciesfrom the Belgian North Sea and the Western Scheldt Estuary
Stefan Voorspoels *, Adrian Covaci, Johan Maervoet, Ingrid De Meester, Paul Schepens
Toxicological Centre, University of Antwerp (UA), Universiteitsplein 1, 2610 Wilrijk, Belgium
Abstract
Various benthic invertebrates (flying crab, common shrimp, and red starfish), small fish (sand goby), benthic flatfish (dab, plaice,
and sole) and gadoids (bib and whiting) were collected in the Belgian North Sea and along the Scheldt Estuary, both representing
areas impacted by various contaminants to different degrees. The levels of 25 polychlorinated biphenyls (PCBs) and 15 organo-
chlorine pesticides (OCPs), which included penta- and hexachlorobenzene, a-, b-, and c-hexachlorocyclohexane isomers, chlordanes,
and DDT and metabolites, were determined. Sum of PCBs and OCPs in benthic invertebrates and goby ranged from 1.5 to 280 ng/g
wet weight (ww) and from 0.27 to 23 ng/g ww, respectively. The fish livers revealed total PCB and OCP levels ranging from 20 to
3200 ng/g ww and from 6.0 to 410 ng/g ww, respectively. Levels of both contaminant groups were significantly higher in samples
from the Scheldt Estuary compared to the Belgian North Sea. For most species a highly inverse correlation was found between the
concentration of contaminants and the distance to Antwerp (r between 0.812 and 0.901, p < 0:05), pointing to a higher degree of
exposure further upstream. PCB and OCP exposures are highly correlated (r between 0.836 and 1.000, p < 0:05), which suggests that
the pollution can be classified as historical. However, because urban and industrial centres may still be emitting these compounds,
more recent point and non-point sources cannot be ruled out.
� 2004 Elsevier Ltd. All rights reserved.
Keywords: PCBs; Pesticides; Invertebrates; Fish; North sea; Scheldt estuary
1. Introduction
The use and/or production of polychlorinated bi-phenyls (PCBs) and organochlorine pesticides (OCPs),
such as 2,2-bis-(4-chlorophenyl)-1,1,1-trichloroeth-
ane (DDT), hexachlorobenzene (HCB) and lindane
(c-HCH) have been banned in most developed countries
since the 1970s (UNEP, 2003). Despite this measure,
these compounds are among the most prevalent envi-
ronmental pollutants and they can be found in various
environmental compartments, both biotic (from plank-ton to humans) (de Voogt et al., 1990; Covaci et al.,
2002; Voorspoels et al., 2002) and abiotic (air, water,
sediments, soil) (Fuoco et al., 1995; de Boer et al., 2001).
Their widespread presence is due to their extremely
persistant and lipophilic nature. These properties cause
*Corresponding author. Tel.: +32-3-820-27-04; fax: +32-3-820-27-
22.
E-mail address: [email protected] (S. Voorspoels).
0025-326X/$ - see front matter � 2004 Elsevier Ltd. All rights reserved.
doi:10.1016/j.marpolbul.2004.02.024
these persistent organic pollutants (POPs) to bioaccu-
mulate in the adipose tissues of biota, resulting in the
enrichment throughout the food chain (de Voogt et al.,1990).
Prolonged exposure to these pollutants can interfere
with normal physiology and biochemistry (den Besten
et al., 1989; Everaarts et al., 1998; Mills et al., 2001;
Picard et al., 2003). The occurrence and severity of these
interferences depend on various factors, such as the
concentration of pollutants in the organism, suscept-
ability of the species, and duration of exposure (Giesyand Kannan, 1998; Safe, 1994). Effects of these com-
pounds can be seen at various levels of the food chain,
including starfish (den Besten et al., 1990), shrimp (Key
et al., 2003), crabs (Weis et al., 1992), fish (Mills et al.,
2001; Khan, 2003; Boon et al., 1992; Sleiderink et al.,
1995), porpoises (Jepson et al., 1999), and humans
(Masuda, 2003).
Because humans readily consume seafood, such asshrimp, crab and various fish species, these organisms
are of great scientific value to estimate the possible
exposure to PCBs and OCPs through marine food

394 S. Voorspoels et al. / Marine Pollution Bulletin 49 (2004) 393–404
sources. The area studied in this investigation covered
both commercial fishing grounds (Belgian North Sea––
BNS) and a recreational fishing area (Western Scheldt
Estuary––SE). The drainage basin of the SE covers avery densely populated and highly industrialised region,
polluted by POPs (Voorspoels et al., 2003; Van de Vijver
et al., 2003; Chu et al., 2003; Steen et al., 2001), heavy
metals (Coteur et al., 2003) and non-persistent pollu-
tants, such as volatile organic compounds (Huybrechts
et al., 2003).
In this work, PCBs and OCPs were determined in
benthic invertebrates and different fish species from bothBNS and SE in order to evaluate trends in levels, con-
gener distribution, and geographical variation.
2. Materials and methods
2.1. Sampling
Seven locations were selected in the BNS and nine
locations in the SE (Fig. 1). Selection of the species was
based upon their availability at the sampling locations.
Finally, three species of benthic invertebrate organisms
were chosen: crab, starfish, and shrimp. These organ-
isms are very suitable as sentinel species, since they tend
not to migrate (Everaarts et al., 1998; Roose et al.,
1998). Crabs have already been used extensively assentinel organisms in monitoring studies of lipophilic
contaminants on Canada’s West Coast (Ikonomou
et al., 2002), while starfish have been subject to many
studies regarding levels and effects of POPs (Everaarts
et al., 1998; Picard et al., 2003; den Besten et al., 2001).
Furthermore, starfish hold a top position in the food
chain as a predator of bivalves, but it may feed also on
decaying organic material (e.g. fish) (Everaarts et al.,1998).
Fig. 1. Sampling
Table 1
Overview of sampled species
Class Species name
Benthic invertebrates Crangon crangon (common shrimp), Lyo
Benthic fish Pomatoschistus minutus (sand goby)
Benthic flatfish Solea solea (common sole), Limanda lima
Gadoid fish Merlangius merlangus (whiting), Trisopte
Three benthic flatfish, two gadoid fish species, and
one goby species were also sampled at the same loca-
tions. An overview of all sampled species is presented in
Table 1. Except for starfish and goby, all organisms inthis study are suitable for human consumption.
The number of animals collected at each location
varied between 3 and 10 for starfish, between 30 and 50
for shrimp, crab and goby, and between 1 and 5 for the
other fish species. The sampling campaigns took place
during October and November 2001. All organisms were
collected using a 3 m beam trawl with fine-meshed net
(6 · 6 mm), at a constant speed of 1.5 to 2.0 knots forabout 30 min., using the research vessel Zeeleeuw, pro-
vided by the Flemish Marine Institute (VLIZ).
Preliminary sample pre-treatment steps were under-
taken on board and they included species determination,
recording of fish length and washing with distilled water.
The flatfishes and gadoids were dissected on board
immediately after capture and only the excised liver
samples were collected for this study. The invertebratesand goby samples were stored entirely. All samples were
kept in hexane pre-washed glass recipients at )20 �Cuntil analysis.
2.2. Sample availability
All sampled species were available in large amounts
at the BNS locations. Crab and shrimp were veryabundant and available at each location, while starfish,
goby and dab were very little abundant in the SE. Other
flatfish and gadoids were caught in at least five locations
on the BNS and three locations in the SE.
2.3. Targeted compounds
Based on their abundance in the samples, the fol-lowing PCB-congeners (IUPAC numbering), were tar-
locations.
carcinus holsatus (flying crab), Asterias rubens (red starfish)
nda (dab), Pleuronectus platessa (plaice)
rus luscus (bib)
S. Voorspoels et al. / Marine Pollution Bulletin 49 (2004) 393–404 395
geted for analysis: 28, 44, 52, 74, 95, 99, 101, 105, 110,
118, 128/174, 138, 149, 153, 156, 163, 167, 170, 177, 180,
183, 187, 194, 196, and 199. CB 44 and 110 were not
measured in crab, starfish, and goby. Data of these twocongeners were included in the sum of PCBs for the
other species.
The following OCPs were also determined: pentachloro-
benzene (QCB), a-, b-, c-, and d-hexachlorocyclohexane(hereafter refered to as ‘‘HCHs’’), hexachlorobenzene
(HCB), trans-chlordane (TC), cis-chlordane (CC), trans-
nonachlor (TN), oxychlordane (OxC) (TC, CC, TN, and
OxC are hereafter referred to as ‘‘Chlordanes’’), 2,2-bis-(4-chlorophenyl)-1,1,1-trichloroethane (p,p0-DDT),
2,2-bis(4-chlorophenyl)-1,1-dichloroetylene (p,p0-DDE),
2,2-bis(4-chlorophenyl)-1,1-dichloroethane (p,p0-DDD),
2-(4-chlorophenyl)-2-(2-chlorophenyl)-1,1,1-trichloro-
ethane (o,p0-DDT), and 2-(4-chlorophenyl)-2-(2-chlorophe-
nyl)-1,1-dichloroethane (o,p0-DDT), (hereafter referred
to as ‘‘DDTs’’). For crab, goby and starfish samples,
no data are available for QCB, chlordanes, o,p0-DDT,and o,p0-DDD. These compounds contribute approxi-
mately 10% to the total OCP load determined in this
study and are therefore not included in the sum of OCPs
and in the statistical analyses to facilitate compari-
son between species. e-HCH was used as internal stan-
dard (IS) for QCB, HCB, and HCHs whereas CBs 46
and 143 were used as IS for the PCBs, DDTs, and
chlordanes.
2.4. Chemicals
All solvents used for the analysis (n-hexane, acetone,
dichloromethane, and iso-octane) were of SupraSolv�
grade (Merck, Darmstadt, Germany). Individual refer-
ence standards for each of the compounds were used
for identification and quantification (CIL, Andover,USA; Dr. Ehrenstorfer Laboratories, Augsburg, Ger-
many). Sodium sulphate was heated for at least 6 h
at 600 �C and silica was pre-washed with n-hexane
and dried overnight at 60 �C before use. Extraction
thimbles were pre-extracted for 1 h and dried at 100 �Cfor 1 h.
2.5. Sample preparation and clean up
Prior to analysis, the samples were thawed and ho-
mogenised using a high-speed blade-mixing device, ex-
cept for the shrimp and crab samples of which only the
soft parts were taken. After homogenisation, two iden-
tical composite samples of each species, location and
tissue were created. Thirty individual shrimp, goby and
crabs were homogenised for each pool. The pools ofstarfish samples consisted of 3–8 equally sized individ-
uals. The composite samples of gadoids and flatfish
consisted of 3–6 individuals. Size was taken into account
when fish samples were pooled.
The method used for the preparation and clean up of
the samples has previously been described by Jacobs
et al. (2002) and is briefly presented below. Between 1
and 10 g of homogenised sample was spiked withinternal standards and extracted for 2.5 h by hot Soxhlet
with hexane/acetone (3/1; v/v). After lipid determina-
tion, the extract was cleaned-up on acid silica and PCBs
and OCPs were eluted with n-hexane followed by di-
chloromethane. The eluate was concentrated to near
dryness and reconstituted in 80 ll iso-octane.
2.6. Chemical analysis
PCB quantification was performed using a Hewlett
Packard 6890 GC (Palo Alto, CA, USA) coupled with a
l-ECD detector and equipped with a 50 m · 0.22mm · 0.25 lm HT-8 (SGE, Zulte, Belgium) capillary
column. One ll was injected in pulsed splitless mode
(pulse pressure¼ 40 psi, pulse time¼ 1.2 min) with the
split outlet opened after 1.2 min. Injector and detectortemperatures were set at 290 �C and 320 �C, respectively.The temperature program of the HT-8 column was set
to 90 �C for 1.2 min, then raised with 20 �C/min to 180
�C, kept for 1 min, then increased with 3 �C/min to 275
�C (kept 0.5 min) and further raised by 5 �C/min to
290 �C and kept for 18 min.
OCP measurements of all extracts were performed
using a Hewlett Packard 6890 GC equipped with a 25 m· 0.22 mm · 0.25 lm HT-8 capillary column and con-
nected via direct interface with a Hewlett Packard
5973 mass spectrometer that was operated in Electron
Capture Negative Ionisation (ECNI) mode. Methane
was used as moderating gas and the ion source, quad-
rupole and interface temperatures were set at 150, 130
and 300 �C, respectively. The mass spectrometer was
used in the selected ion-monitoring (SIM) mode. One llof the cleaned extract was injected in pulsed splitless
mode (injector temperature 280 �C, pressure pulse 30
psi, pulse time 1.50 min). The splitless time was 1.50
min. The temperature of the HT-8 column was kept at
90 �C for 1.50 min, then increased to 200 �C at a rate of
15 �C/min (kept for 2.0 min), further increased to 270 �Cat a rate of 5 �C/min and kept for 1.0 min and finally
raised to 290 �C at a rate of 25 �C/min and kept constantfor 10.0 min.
2.7. Quality assurance
Multi-level calibration curves in the linear response
interval of the detector were created for the quantifica-
tion and good correlation (r2 > 0:999) was achieved.
The identification of POPs was based on their relativeretention times (RRTs) to the internal standard used for
quantification on GC/ECD and was based on RRTs, ion
chromatograms and intensity ratios of the monitored
ions for quantification on GC/MS. A deviation of the

396 S. Voorspoels et al. / Marine Pollution Bulletin 49 (2004) 393–404
ion intensity ratios within 20% of the mean values of the
calibration standards was considered acceptable.
The quality control was performed by regular anal-
yses of procedural blanks, blind duplicate samples, cer-tified reference material CRM 349 (PCBs in cod liver
oil), and by random injection of standards and solvent
blanks. The method was validated by participation in an
interlaboratory comparison organised by the Institute
for Reference Measurements and Materials (IRMM,
Geel, Belgium). Seven PCB congeners (CBs 28, 52, 101,
118, 138, 153 and 180) were determined in non-spiked,
medium- and high-level spiked pork fat (Bester et al.,2001). The results of the individual PCB congeners
deviated less than 10% from the target values at all
spiking levels.
Limit of quantification (LOQ) for PCBs and OCPs,
based on GC/ECD and GC/MS performance, was
dependent of the sample intake. The sample intake was
therefore adapted to the expected pollution load of the
sample. Results are reported as ‘not detected’ (N.D.)when the concentration is lower than 0.01 ng/g wet
weight (ww). Procedural blank values were found to be
very low for most OCPs (<5% of value found in sam-
ples), but p,p0-DDE and PCBs were clearly present and
consistent (RSD<30%) in procedural blanks and there-
fore the mean blank value for these compounds were
used for subtraction.
Two PCBs of interest were co-eluting from the col-umn, namely CB 128 and CB 174. However, after ver-
ification by GC/MS-EI, 90% of the CB 128/174 signal
could be attributed to CB 128. The peak has therefore
been interpreted as being CB 128.
2.8. Statistical analysis
For samples with concentrations below LOQ, zerowas used in the calculations. Simple linear regression
coefficient was used to test for correlations between the
total PCB/OCP load and the distance to Antwerp.
Simple linear regression was used also to test the cor-
relation between PCBs, OCPs, CB 153, and p,p0-DDE.
The Mann Whitney U-test was used to compare the
mean concentrations in BNS and SE and to test the
Table 2
Lipid percentages (extractable lipids)
N Mean S
Crab 28 1.9 1
Goby 17 2.0 1
Starfish 21 2.7 1
Shrimp 23 0.6 0
Dab liver 7 35 7
Plaice liver 9 27 1
Bib liver 12 55 7
Sole liver 16 15 9
Whiting liver 12 34 1
profile differences. Tests were considered significant if p
was lower than 0.05. All statistical tests were performed
using Statistica� v5.0 software (StatSoft Inc., Tulsa,
OK, USA).
3. Results and discussion
3.1. Lipid content
Lipid determination was performed on an aliquot of
the extract (1/5th) before clean up. This procedure al-lowed good lipid recoveries for lean and fatty fish dur-
ing QUASIMEME interlaboratory exercises. The lipid
percentage in benthic invertebrates ranged from 0.6 ±
0.1% in shrimp to 2.7 ± 1.1% in starfish. The whole-body
lipid percentage in goby was 2± 1.1%. Lipid content
in fish livers varied widely between species, with val-
ues ranging from 15± 9.4% in sole to 55± 7.8% in bib
(Table 2).The lipid content of fish tissue is influenced by several
factors, such as sex, age, species, nourishment and
spawning status (Larsson et al., 1993; Kozlova, 1997). In
the present study, all samples were taken prior to
spawning, resulting in maximum seasonal lipid levels.
Nevertheless, wet weight based results are preferred and
therefore, lipid based results are given only for com-
parison with other studies.
3.2. PCB levels
The congeners that could be detected and their fre-
quency of detection were species and location depen-
dent. Shrimp showed very low concentrations for all
congeners analysed. The low extractable lipids of shrimp
(0.6 ± 0.1%) were probably related to this observation(Roose et al., 1998). For the other benthic invertebrates
and goby, most congeners could be measured in all
samples. Total PCB levels in benthic invertebrates and
goby ranged from 1.5 to 280 ng/g ww (from 330 to 24200
ng/g lipid weight (lw)).
In liver samples of gadoid fish all congeners could be
measured. These samples also showed the highest lipid
D Median Range
.2 1.4 0.8–4.8
.1 1.4 0.8–3.5
.1 2.5 1.3–5.3
.1 0.6 0.5–0.8
.1 37 21–42
2 22 15–47
.8 57 42–70
.4 13 5.1–40
4 36 9.8–50

S. Voorspoels et al. / Marine Pollution Bulletin 49 (2004) 393–404 397
content (Table 2). Although total PCB levels in dab were
the lowest among all fish livers analysed, most congeners
could be determined in dab and plaice liver, and only a
few congeners were below LOQ (CBs 52, 74, 167, 194,199) at some locations. In sole liver, more congeners
were below LOQ at the BNS locations (Table 4). The
congeners that were most often not detected in sole liver
were CBs 28, 52, 167, 156, 194, and 199. All PCB levels
in sole liver from the SE were above LOQ. The lipid
content in sole liver was lower than in the other samples
(Table 2), which can explain the high frequency of
congeners below LOQ. In general, total PCB levels inthe fish livers of this study ranged from 20 to 3200 ng/g
ww (from 420 to 14400 ng/g lw). PCB data are sum-
marised in Table 3. The concentration range of all
congeners for each species is presented in Table 4.
Interspecies variation of PCB levels was rather lim-
ited. However, shrimp showed significantly lower levels
at the BNS locations. These lower PCB levels in shrimp
can be partially explained by their pelagic nature andfeeding pattern. Shrimp live slightly above the seabed,
resulting in less intense contact with the sediment com-
pared to the other benthic species of the present study.
Shrimp primarily feed on mysids and amphipods (Oh
et al., 2001), that occupy a low trophic level. The other
benthic invertebrates of the present study (crab and
starfish) contained relatively higher PCB levels, that can
also be explained by their feeding habit: crabs, and to alesser extent starfish, are scavengers that feed partially
on decaying organic material (such as carcasses of dead
fish and other organisms), which can bear relatively high
pollutant loads (Britton and Morton, 1994; Everaarts
et al., 1998).
Table 3
Total PCB levels for each species expressed in ng/g ww (in ng/g lw) at the d
Location Benthic invertebrates Benthic fish Ben
Crab Shrimp Starfish Goby Dab
BNS
1 36 (2900) 1.5 (330) 26 (680) 25 (860) 310
2 29 (2200) 30 (1200) 250
3 23 (2100) 30 (1200) 89 (
4 53 (4400) 2.5 (430) 45 (2500) 25 (2100)
5 32 (3100) 2.4 (380) 44 (2300) 27 (2200)
6 27 (2200) 1.8 (380) 30 (710) 23 (2400) 160
7 47 (3100) 2.6 (360) 29 (1100) 13 (1700) 290
8 47 (3400) 2.6 (420) 46 (1900) 97 (3200)
SE
9 210 (6200) 3.1 (470)
10 200 (11 700)
11 190 (8600) 7.3 (1000) 83 (5200)
12 200 (6700) 6.5 (1200) 120 (4000) 260
13 280 (24 200) 19 (3100)
14 270 (5800) 37 (5300)
15 39 (6200)
16 34 (4800)
Goerke and Weber (2001) have shown that species-
specific elimination of PCBs had a clear impact on res-
idue patterns. In their study, white prawn (Palaemon
longirostris), a species related to the common shrimp,eliminated all PCBs (the most chlorinated PCB tested
was CB 153) at a faster rate compared to the other
species, including flounder (Platichus flesus). In the
present study, crab and whiting samples displayed sig-
nificantly higher lipid normalised PCB levels at all
locations than did the other species. For both species,
the observations may be explained by their trophic po-
sition.
3.3. OCP levels
OCP data are summarised in Table 5. a-, b-, and
c-HCH isomers, HCB, p,p0-DDT, p,p0-DDE, and p,
p0-DDD were consistently analysed in all samples.
Therefore only these compounds are included in the sum
of OCPs and in the statistical data analysis. QCB,chlordanes (TC, TC, TN, and OxC), and o,p0-DDTs
(o,p0-DDT and o,p0-DDD) are only reported and not
extensively discussed. In general, the contribution of
QCB, chlordanes, and o,p0-DDTs to the sum of OCPs in
this study was around 10%. The concentration range of
all compounds for each species is presented in Table 6.
Similar to PCBs, the lowest OCP concentrations were
found in shrimp. Only QCB, HCB, p,p0-DDE, and c-HCH could be detected in shrimp samples from both
BNS and SE. OxC was the only chlordane that could be
detected in shrimp from the SE (range 0.07–0.19 ng/g
ww). All crab and most goby samples contained mea-
surable concentrations of all OCPs.
ifferent locations
thic flatfish liver Gadoid fish liver
Plaice Sole Bib Whiting
(790) 190 (840) 200 (670) 810 (1400) 780 (2100)
(760) 110 (570) 730 (1800)
420) 74 (480)
140 (1500) 1500 (2600) 1300 (2800)
20 (1100) 940 (1600) 1600 (3500)
(420) 1100 (2300) 68 (1300) 650 (1200) 230 (1300)
(810) 96 (640) 57 (910)
1700 (3100) 1700 (10 900)
230 (2300) 1300 (2200)
1400 (2900)
1400 (2900) 480 (3700) 2900 (4900)
(620) 980 (3900) 450 (3600) 2700 (4800) 3100 (10 100)
300 (2100) 3200 (7300) 2800 (5400)
1200 (4300) 680 (5200) 1400 (14 400)
800 (7700)

Table 4
Concentration range of all PCB congeners in all samples (ng/g ww)
Congener Benthic invertebrates Benthic fish Benthic flatfish liver Gadoid fish liver
Crab Shrimp Starfish Goby Dab Plaice Sole Bib Whiting
CB 28 0.24–1.7 N.D.–2.1 0.19–0.60 0.06–0.59 0.80–3.0 0.96–9.3 N.D.–4.6 5.5–19 1.5–17
CB 52 N.D.–8.3 N.D.–1.5 0.63–2.4 0.29–3.3 N.D.–5.9 0.45–37 N.D.–30 10–120 4.7–79
CB 44 n.a. N.D.–0.25 n.a. n.a. 0.56–2.9 0.48–13 N.D.–6.9 5.2–28 2.2–23
CB 74 0.25–1.9 N.D.–0.58 0.13–0.53 0.05–0.35 0.44–2.5 N.D.–10 N.D.–3.3 4.0– 20 1.8–20
CB 95 0.08–10.2 N.D.–1.2 0.44–7.8 0.31–4.7 1.1–8.2 1.2–47 N.D.–26 5.4–85 7.2–92
CB 101 0.49–28 N.D.–0.36 2.3–7.3 0.86–12 4.6–20 3.5–120 1.5–71 41–240 17–260
CB 99 2.0–16 N.D.–0.84 1.8–4.2 0.86–6.6 4.2–16 4.7–81 1.8–32 39–160 11–160
CB 110 n.a. N.D.–0.20 n.a. n.a. 3.1–14 2.5–62 0.18–29 15–120 11–150
CB 149 0.25–23 N.D.–0.63 1.7–15 1.05–12 3.3–17 4.2–100 1.5–44 22–170 18–240
CB 118 2.2–17 0.18–2.5 1.8–4.4 0.80–7.2 7.2–21 7.3–86 1.6–49 54–230 15–210
CB 153 5.4–68 0.20–5.2 5.1–16 2.5–21 23–64 27–250 6.3–131 135–480 48–530
CB 105 0.57–4.5 N.D.–0.27 0.55–1.1 0.31–2.1 1.5–4.3 1.2–18 N.D.–9.8 9.5–48 2.9–48
CB 163 1.4–15 0.23–3.2 1.6–3.9 0.88–6.2 4.5–14 5.2–77 1.9–40 19–160 9.9–120
CB 138 3.8–35 N.D.–2.8 3.2–8.7 1.6–12 13–39 14–120 2.5–79 76–280 25–310
CB 187 1.7–16 0.20–3.7 1.5–3.7 1.2–7.1 6.7–24 7.8–97 1.3–54 27–190 16–150
CB 183 0.33–8.1 N.D.–0.73 0.12–0.46 0.18–2.1 0.52–2.7 0.92–19 N.D.–15 8.5–78 3.1–64
CB 128 0.68–6.8 N.D.–0.38 0.66–1.7 0.47–3.5 2.2–8.3 2.2–33 N.D.–12 15–61 4.8–77
CB 177 0.28–6.5 N.D.–0.94 0.48–2.1 0.39–4.6 0.86–6.1 1.8–30 0.29–9.1 6.3–39 4.9–21
CB 167 0.28–2.7 N.D.–0.46 0.22–0.73 0.25–1.7 N.D.–0.54 N.D.–6.6 N.D.–5.5 5.6–41 0.24–19
CB 156 0.32–4.2 N.D.–1.4 0.16–0.44 0.16–1.2 1.2–2.4 0.71–16 N.D.–15 9.3–86 1.4–45
CB 180 1.4–20 0.16–6.8 0.17–1.2 0.59–5.5 4.2–20 4.6–76 N.D.–97 45–300 8.3–230
CB 199 0.13–1.8 N.D.–0.44 N.D.–0.19 0.08–0.78 N.D.–2.7 0.18–8.4 N.D.–4.8 3.7–28 1.1–20
CB 170 0.60–5.7 N.D.–2.5 0.20–0.92 0.26–2.3 1.4–7.5 1.4–29 N.D.–35 19–130 3.3–83
CB 196 N.D.–0.78 0.08–2.8 N.D.–0.23 N.D.–0.15 4.1–20 5.3–48 0.49–38 34–200 12–141
CB 194 0.13–1.7 N.D.–0.50 N.D.–0.11 0.03–0.64 N.D.–2.0 N.D.–6.2 N.D.–30 5.3–32 0.48–20
Sum PCBs 23–280 1.5–39 26–83 23–120 89–310 96–1400 20–800 650–3200 230–3100
n.a.: not available; N.D.: not detected.
Table 5
Sum of OCPs for each species expressed in ng/g ww (in ng/g lw) at the different locations
Location Benthic invertebrates Benthic fish Benthic flatfish liver Gadoid fish liver
Crab Shrimp Starfish Goby Dab Plaice Sole Bib Whititng
BNS
1 3.3 (270) 0.43 (91) 2.6 (67) 3.2 (110) 34 (86) 26 (120) 23 (76) 89 (160) 100 (280)
2 2.8 (220) 2.8 (110) 23 (72) 15 (79) 63 (150)
3 3.0 (270) 2.8 (120) 13 (59) 9.7 (62)
4 4.6 (380) 0.27 (46) 4.5 (250) 3.4 (290) 16 (170) 270 (480) 160 (340)
5 3.0 (280) 0.61 (97) 4.4 (230) 3.6 (300) 6.7 (370) 120 (200) 280 (620)
6 2.6 (220) 0.28 (58) 3.3 (80) 3.0 (320) 31 (83) 160 (350) 7.5 (150) 75 (140) 22 (130)
7 4.4 (290) 0.47 (66) 2.6 (100) 1.8 (220) 38 (110) 8.7 (58) 6.0 (96)
8 4.4 (320) 0.67 (110) 4.9 (200) 14 (460) 190 (350) 210 (1400)
SE
9 18 (510) 0.60 (91) 23 (230) 150 (250)
10 16 (920) 78 (160)
11 14 (660) 0.71 (100) 10 (650) 130 (270) 51 (390) 280 (460)
12 18 (600) 0.66 (120) 16 (550) 56 (130) 110 (440) 45 (370) 310 (540) 410 (1300)
13 21 (1800) 0.91 (150) 26 (180) 360 (810) 380 (750)
14 23 (480) 1.6 (230) 100 (370) 54 (410) 140 (1500)
15 1.3 (200) 57 (550)
16 1.7 (240)
Sum of OCPs includes: HCB, a-, b-, c-HCH, and p,p0-DDTs.
398 S. Voorspoels et al. / Marine Pollution Bulletin 49 (2004) 393–404
All OCPs were consistently detected in liver samples
of dab, plaice, bib, and whiting and most compounds
were found in sole samples. Also o,p0-DDT and o,p0-DDD were analysed in the fish liver samples. o,p0-DDT
could not be detected in most samples, except in dab and
whiting. O,p0-DDD levels were above LOQ in most
samples, except in sole liver. The highest concentrations
measured for o,p0-DDT and o,p0-DDD were 2.1 and 8.0

Table 6
Concentration range of all OCPs in all samples (ng/g ww)
Compound Benthic invertebrates Benthic fish Benthic flatfish liver Gadoid fish liver
Crab Shrimp Starfish Goby Dab Plaice Sole Bib Whiting
QCB n.a. N.D.–0.69 n.a. n.a. 0.31–1.3 0.03–0.96 N.D.–0.89 0.29–2.5 0.16–1.9
a-HCH 0.17–0.28 N.D. 0.13–0.18 0.09–0.42 0.24–1.1 0.14–0.93 N.D.–0.36 0.42–1.2 0.43–1.1
HCB 0.14–0.84 0.08–0.50 N.D. 0.05–0.48 1.9–4.4 0.59–3.7 N.D.–1.8 1.8–7.0 0.94–5.6
c-HCH N.D.–0.30 0.18–0.42 0.15–0.60 0.11–1.2 0.55–19 N.D.–11 N.D.–6. 7 5.1–17 3.4–18
b-HCH 0.08–0.40 N.D. N.D.–0.11 N.D.–0.15 0.30–1.9 0.16–1.6 0.09–4.0 0.57–2.5 0.41–2.2
d-HCH n.a. N.D.–0.01 n.a. n.a. 0.01–0.26 N.D.–0.14 N.D.–4.7 0.07–0.36 0.02–0.30
OxC n.a. N.D.–0.19 n.a. n.a. 0.24–0.58 0.19–1.8 N.D.–0.97 0.98–8.4 0.23–4.6
TC n.a. N.D. n.a. n.a. 0.12–0.75 0.01–2.0 0.01–0.57 0.56–5.4 0.10–3.4
TN n.a. N.D. n.a. n.a. 0.52–1.3 0.29–4.6 0.09–1.8 2.0–9.4 0.51–12
CC n.a. N.D. n.a. n.a. 0.35–1.1 0.09–2.3 0.07–0.64 1.1–6.5 0.24–5.0
o,p0-DDT n.a. N.D. n.a. n.a. N.D.–0.61 N.D.–0.82 N.D.–0.61 N.D.–0.82 N.D.–2.1
o,p0-DDD n.a. N.D. n.a. n.a. N.D.–0.86 0.19–5.0 N.D. 0.71–3.4 0.30–8.0
p,p0-DDT 0.17–5.1 N.D. 0.63–1.9 0.48–2.9 1.2–2.5 0.36–5.4 0.08–1.3 1.9–19 0.58–26
p,p0-DDE 1.3–11 N.D.–0.81 0.75–3.9 0.51–5.2 7.4–20 6.0–100 1.7–30 44–210 11–270
p,p0-DDD 0.26–5.9 N.D. 0.50–3.9 0.50–6.0 1.2–9.5 1.5–42 0.61–21 16–120 5.1–100
Sum OCPs 2.6–23a 0.27–2.6 2.6–10a 1.8–16a 14–63 9.5–140 6.4–61 83–390 25–440
n.a.: not available; N.D.: not detected.a Sum of OCPs includes: HCB, a-, b-, c-HCH, and p,p0-DDTs.
S. Voorspoels et al. / Marine Pollution Bulletin 49 (2004) 393–404 399
ng/g ww, respectively. Levels of total chlordanes ranged
from 0.27 to 25 ng/g ww.
3.4. PCB and OCP levels in other studies
Based on data provided by other studies, we can
conclude that biota from the SE are highly contami-
nated. Levels of PCBs and OCPs found in dab, plaice,
and sole liver from near the Norwegian coast (Green
and Knutzen, 2003) were comparable with levels of theBNS livers from the present study, except for sole, which
showed higher OCP levels in our study.
De Boer et al. (2001) reported CB 153 levels ranging
from 270 to 1900 ng/g lw in fish liver from an area with
high degree of industrialisation and harbour activities
(Rotterdam habour, The Netherlands), while the levels
in our study ranged from 79 to 3300 n/g lw. De Boer
et al. (2001) concluded that flounder liver from theirstudy could be considered as relatively highly contami-
nated, but these results were not exceptionally high for
an harbour area. Levels of QCB, HCHs, and HCB in
fish liver from the SE of the present study and in
flounder liver reported by de Boer et al. (2001) were
comparable, while DDTs were somewhat higher in the
SE (1400 vs. 780 ng/g lw).
Most data on starfish are produced by analysis of thepyloric caeca and not of the whole body as in the present
study, although it is not uncommon practice. Results of
both analyses can be easily compared, since the differ-
ence between lipid-based PCB levels of pyloric caeca and
of total body is approximately a factor 1.5 (den Besten
et al., 2001). PCB concentrations found in starfish of the
present study were similar to (Everaarts et al., 1998) or
higher than (den Besten et al., 2001) those previously
reported for starfish from the Southern North Sea.
Similar levels were observed for a- and c-HCH, p,p0-DDT, and p,p0-DDE, while levels of p,p0-DDD were
slightly higher in the present study (40 vs. 10 ng/g lw)
(den Besten et al., 2001).
In general, total POP levels of the BNS samples were
almost one order of magnitude higher than those of
Greenland (Cleeman et al., 2000), while fish livers from
the SE surpassed the Greenland values by more than
two orders of magnitude. The sum of p,p0-DDTs washigher in the present study (200 vs. 60 ng/g lw). HCHs
levels were similar for sculpin and the fish of the present
study (both around 25 ng/g lw), but levels in cod were
higher. Compared to the Greenland study, the HCHs
pattern was different in the fish livers of the present
study. The major contributor to the sum of HCHs was
clearly a-HCH in the Greenland study, while in the
present study c-HCH was the predominant isomer. Thismay be attributed to the higher long-range transport
capability of a-HCH (Beyer et al., 2000).
3.5. PCB profiles
To visualise the PCB profiles in the different species,
PCBs were divided into homologue groups (Table 7).
Because homologue patterns did not vary betweenlocations (mean RSD<25), a mean profile for each
species was calculated and is presented in Fig. 2.
Contribution of the lower chlorinated congeners
(tri- and tetra-CBs) to the sum of PCBs was very low.
Although the lower chlorinated biphenyls have an in-
creased mobility from the substrate to water and are
therefore more available to aquatic organisms (de Boer
et al., 2001), they are very susceptible to metabolism and

Table 7
PCB homologue groups
Homologue PCB congeners
Tri-CBs 28
Tetra-CBs 52, 44a, 74
Penta-CBs 95, 99, 101, 105, 110a, 118
Hexa-CBs 128/174, 149, 153, 156, 163, 167
Hepta-CBs 170, 177, 180, 183, 187
Octa-CBs 194, 196, 199
aNot measured for crab, goby, and starfish.
400 S. Voorspoels et al. / Marine Pollution Bulletin 49 (2004) 393–404
are eliminated rapidly in the marine environment. No
statistically significant profile differences concerning tri-
homologues could be observed between any of the spe-
cies from this study and between the livers of the five
large fish species analysed (flatfish and gadoids). Somespecies-dependant differences were seen concerning
tetra- to octa-CB homologues between the small benthic
organisms (crab, shrimp, starfish, and goby) and larger
fish. The most obvious statistically significant deviating
pattern was found in shrimp, where levels of tetra-,
penta-, and hexa-CB congeners were relatively lower,
while the concentrations for hepta- and octa-CB cong-
eners were relatively higher (Fig. 2). The different levelsof nearly all PCB homologue groups found in shrimp
compared to the other benthic invertebrates are not
likely to be solely dependent on the bioavailability, but
probably also on metabolism and elimination. Being
invertebrates, it was suggested that shrimp have a the-
oretical lower metabolic activity than marine vertebrates
(Livingstone, 1992; Borg�a et al., 2001), but they seem to
be able to metabolise and eliminate certain PCBs faster
0
10
20
30
40
50
60
Tri-CBs Tetra-CBs Penta-CBs
PCB ho
Perc
enta
ge c
ontr
ibut
ion
CrabGobyShrimpStarfishDabPlaiceSoleBibWhitingSediment
Fig. 2. PCB homologue profile (%±2 SE) in a
than some fish species (Goerke and Weber, 2001). Be-
cause organochlorine patterns in an organism depend on
both species dependent uptake and elimination pro-
cesses (Mehrtens and Laturnus, 1999), deducting meta-bolic capacities from tissue profile should be done with
great caution.
The contribution of hexa-CB congeners in crab,
goby, and starfish was statistically higher than in the
fish livers, while the contribution of octa-CB congeners
was significantly lower. Also the hepta-CB congeners
showed relatively lower concentrations in starfish.
Because contaminants in the sediments are bioavail-able to sediment dwelling organisms (Pruell et al., 1993),
four sediment samples from the SE have also been
analysed to establish the PCB profile. The mean homo-
logue pattern of the sediment is included in Fig. 2. The
contribution of tri-, tetra-, and penta-CB congeners to
the total PCBs is higher in the sediments than in the fish
and benthic invertebrates, and the contribution of hexa-,
hepta-, and octa-CB congeners to the total PCBs ishigher in the organisms than in the sediment.
3.6. OCP profiles
To visualise the OCP profile in the different species,
OCPs were divided into three groups, namely HCHs,
HCB, and DDTs. No location dependent profile differ-
ences were seen in neither species, except in shrimp. Inthe latter species the profile was slightly biased regarding
DDTs contribution to the total OCP level. This was
mainly because of very low total concentrations of
DDTs (Table 6). The same bias was seen in the HCHs
Hexa-CBs Hepta-CBs Octa-CBs
mologue
ll species and in sediment from the SE.

S. Voorspoels et al. / Marine Pollution Bulletin 49 (2004) 393–404 401
profile of shrimp, since only the c-HCH isomer could be
measured (Table 6). Nevertheless, the mean of all pro-
files was taken for each species and is plotted in Fig. 3.
Figs. 4 and 5 give more detailed profile informationon DDT metabolites and HCH-isomers, respectively.
0
20
40
60
80
100
HCHs HCompound / C
Perc
enta
ge c
ontr
ibut
ion Crab Goby
Shrimp StarfishDab Plaice Bib SoleWhiting Sediment
Fig. 3. OCP profile (%±2 SE) in all spe
0
20
40
60
80
100
p,p’-DDE p,pCom
Perc
enta
ge c
ontr
ibut
ion
Fig. 4. Profile of p,p0-DDT metabolites (%±2 SE)
0
20
40
60
80
100
a-HCH g-HCom
Perc
enta
ge c
ontri
butio
n
Crab GobyShrimp StarfishDab PlaiceBib SoleWhiting Sediment
Fig. 5. HCHs profile (%±2 SE) in all sp
There are no significant profile differences in HCH-iso-
mers and DDT-metabolites among the larger fishes of
this study (flatfish and gadoids). Between the small ben-
thic organisms and the larger fishes and among the smallbenthic organisms themselves, statistically significant
CB DDTsompound group
cies and in sediment from the SE.
’-DDD p,p’-DDTpound
Crab GobyShrimp StarfishDab PlaiceBib SoleWhiting Sediment
in all species and in sediment from the SE.
CH b-HCHpound
ecies and in sediment from the SE.

Table 8
Correlation between CB 153 and p,p0-DDE levels
N r p
Crab 14 0.9893 0.000
Shrimp 13 0.9526 0.000
Starfish 10 0.9653 0.000
Goby 7 0.9996 0.000
Dab 6 0.8783 0.021
Plaice 7 0.8952 0.006
Sole 12 0.9713 0.000
Bib 10 0.8359 0.003
Whiting 9 0.9063 0.001
Significant if p < 0:05.
402 S. Voorspoels et al. / Marine Pollution Bulletin 49 (2004) 393–404
profile differences were observed. The relative contri-
bution of p,p0-DDD to the total OCP load was virtually
equal in most species of this study. This metabolite is
mainly formed in the environment by anaerobic degra-dation of p,p0-DDT (Walters and Aitken, 2001). The
p,p0-DDD concentrations found in these samples are due
to uptake from the environment (water, sediment, etc.)
or by ingestion with food. Compared to flatfish and
gadoids, the contribution of p,p0-DDT to the total sum
of DDTs in the small benthic organisms was higher,
while the contribution of p,p0-DDE was lower. Benthic
invertebrates have a lower metabolic rate (Livingstone,1992; Borg�a et al., 2001), which can explain this obser-
vation.
Similar as for PCBs, four sediment samples from the
SE were analysed for their OCP content to establish the
OCP, DDTs, and HCHs profiles (Fig. 3). Levels of
OCPs in the sediments were very low, with concentra-
tions ranging from 2.2 to 7.7 ng OCPs/g dry weight.
Contribution of p,p0-DDT to the total DDTs was higherin the sediments than in the fishes, while contribution of
p,p0-DDE was lower (Fig. 4). This DDT-metabolite
profile in the sediments supports the explanation of the
interspecies differences that were observed. For small
benthic species, the profile differences between sediment
and the tissues were less pronounced (Fig. 4), which
supports the lower metabolic ability of the smaller
benthic organisms.Crab showed significantly higher contribution of p,p0-
DDE, which seems contradictory to the above proposed
explanation (Livingstone, 1992; Borg�a et al., 2001). The
relatively higher p,p0-DDE levels in crab may however
be explained by the species’ feeding habit. Being scav-
engers, crab accumulates a substantial part of its p,p0-DDE load from its preys, which might have much
higher pollutant load than crab themselves. This canexplain the relatively higher than expected p,p0-DDE
contribution to the total DDTs-load.
The HCHs profile also displays variation between
certain samples (Fig. 5). The contribution of the b-HCH
isomer was quite similar for most species. However, in
the small benthic species the a-isomer contribution was
higher and c-isomer contribution was lower compared
to the flatfish and gadoids. The HCHs profile of thesediments was slightly biased because a-HCH could not
be detected (Fig. 5). The high contribution of a-HCH,
which was in the HCH technical mixture, to the total
sum of HCHs in the benthic invertebrates from this
study is consistent with the limited metabolic abilities of
these organisms.
Selective organ distribution may also explain the
profile differences between the small benthic organismsand fish (Inomata et al., 1996; Feroz and Qudduskhan,
1979). For the crab, goby, shrimp, and starfish samples,
the whole bodies or soft parts were used, while for fish,
only liver tissue was analysed.
3.7. Correlations between compounds
Levels of PCBs and OCPs were significantly corre-
lated in all species. This correlation was greatly influ-
enced by CB 153, which constituted almost 20% of the
total PCB load, and by p,p0-DDE, which contributed
approximately for 50% to the total OCPs. Details ofcorrelations between CB 153 and p,p0-DDE are given in
Table 8. The high correlation between these compounds
(mean r > 0:93; p < 0:05) indicates that they are likely
to originate from the same source and that they repre-
sent the background pollution in this area; the presence
of a point-source of one of the compounds is highly
unlikely.
3.8. Geographical variation
In addition to the inter-compound correlation, there
was also a significant correlation between contaminant
levels and sampling locations. The BNS and the SE were
considered as two separate areas, as it was more likely to
find higher concentrations in the estuary than in the
North Sea, where the impact of dilution is rather high.The Mann–Whitney U-test was applied to compare the
mean concentrations of PCBs and OCPs in both areas.
Only species of which more than 3 sampling locations
for each area were available were included in the cal-
culations. Of these species (crab, shrimp, sole, bib, and
whiting), the difference in concentration between BNS
and SE was statistically significant. It could be con-
cluded that concentrations were clearly area dependentand that they were significantly higher in the SE for both
PCBs and OCPs (Tables 3 and 5). Recently the same
conclusions were drawn concerning levels of polybro-
minated diphenyl ether (PBDE) in biota from these two
areas (Voorspoels et al., 2003).
Apart from the concentration difference between BNS
and SE, a correlation was observed between pollutant
concentration and the distance to Antwerp. Consideringsamples from location 7 to 16, a statistically significant
inverse correlation between the distance to Antwerp and
concentration was observed for both PCBs and OCPs
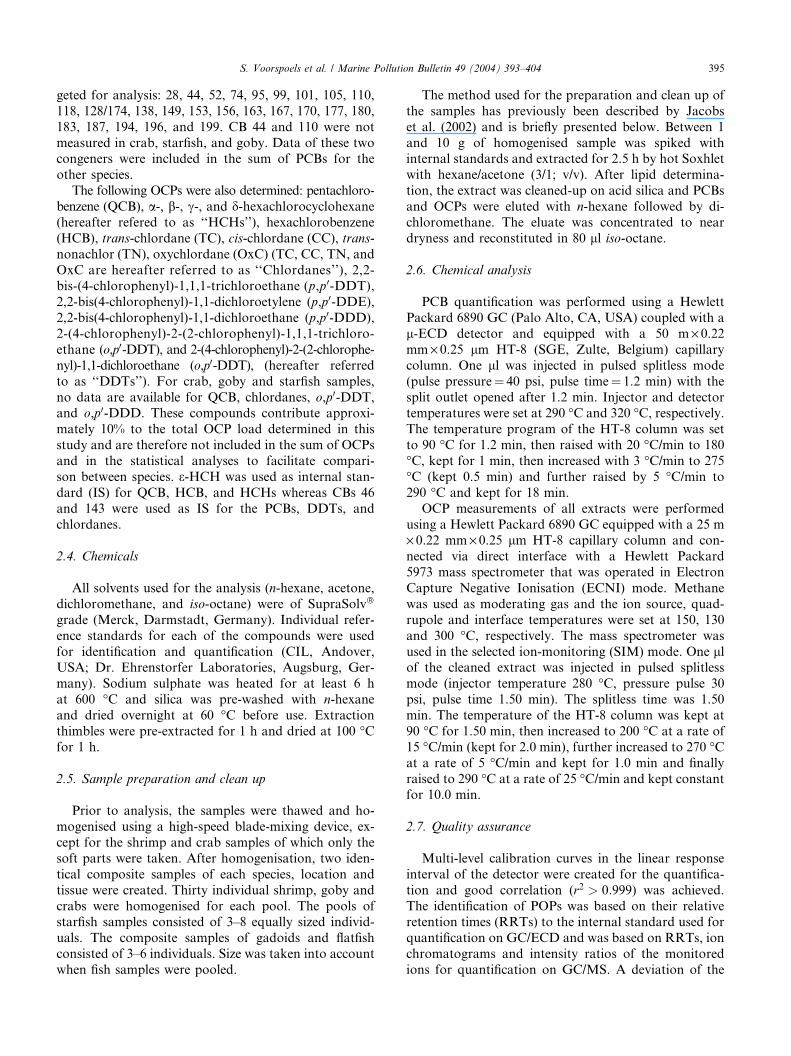
(Table 9). This correlation was highly significant for both
Table 9
Correlation between concentration of PCBs/OCPs and distance to Antwerp
PCBs OCPs
N r p r p
Crab 8 0.8801 0.004 0.8778 0.004
Shrimp 9 0.8934 0.001 0.8727 0.002
Starfish 4 0.6697 0.330 0.7087 0.291
Goby 3 0.7857 0.425 0.7474 0.463
Plaice 4 0.8404 0.160 0.8095 0.191
Sole 7 0.8924 0.007 0.8186 0.024
Bib 6 0.8496 0.032 0.7675 0.075
Whiting 4 0.1676 0.832 0.1182 0.882
Note: only samples with N > 3 have been taken into account; significant if p < 0:05.
S. Voorspoels et al. / Marine Pollution Bulletin 49 (2004) 393–404 403
PCBs and OCPs in crab, shrimp, sole, and bib (r between0.850 and 0.893; p < 0:05). For starfish, goby, and plaice,the correlation did not reach statistical significance. No
correlation could be found for whiting samples. This can
be possibly explained by the small sampling size of
whiting combined with the lesser sedentary character of
gadoids. The results of all other samples clearly indicated
that pollution was higher more upstream. Recently the
same inverse correlation with the distance to Antwerp
was observed concerning PBDE levels in biota (Voor-spoels et al., 2003). Although PCBs and OCPs are mostly
banned products, the levels found in BNS and SE might
reflect not only ‘‘historical’’ exposure, but also present
contamination due to the vicinity of the highly urbanised
and industrialised area of Antwerp.
3.9. Conclusion
Levels of PCBs and OCPs in benthic invertebrates
and in benthic flatfish and gadoid liver samples from the
BNS were comparable with those found in other parts of
the North Sea. The same species sampled at variouslocations in the SE could be considered as highly con-
taminated.
Acknowledgements
The authors thank the VLIZ for their logistic assis-
tance and Dr. A. Cattrijsse for his help with the sam-pling and species determination on board of the ship.
We also thank the entire crew of ‘‘De Zeeleeuw’’ for
taking us back safely to the harbour in spite of the harsh
weather conditions. Dr. Shaogang Chu is greatly
acknowledged for his assistance during sampling and
dissection.
References
Bester, K., de Vos, P., Le Guern, L., Harbeck, S., Hendrickx, F.,
Kramer, G.N., Linsinger, T., Mertens, I., Schimmel, H., Sejerøe-
Olsen, B., Pauwels, J., De Poorter, G., Rimkus, G.G., Schlabach,
M., 2001. Preparation and certification of a reference material on
PCBs in pig fat and its application in quality control in monitoring
laboratories during the Belgian ‘‘PCB-crisis’’. Chemosphere 44,
529–537.
Beyer, A., Mackay, D., Matthies, M., Wania, F., Webster, E., 2000.
Assessing long-range transport potential of persistent organic
pollutants. Environ. Sci. Technol. 34, 699–703.
Boon, J.P., Everaarts, J.M., Hillebrand, M.T.J., Eggens, M.L.,
Pijnenburg, J., Goksøyr, A., 1992. Changes in levels of hepatic
biotransformation enzymes and haemoglobin levels in female
plaice (Pleuronectus platessa) after oral administration of a
technical polychlorinated biphenyl mixture (Clophen A40). Sci.
Total Environ. 114, 113–133.
Borg�a, K., Gabrielsen, G.W., Skaare, J.U., 2001. Biomagnification of
organochlorines along a Barents Sea food chain. Environ. Pollut.
113, 187–198.
Britton, J.C., Morton, B., 1994. Marine carrion and scavengers.
Oceanogr. Mar. Biol. 32, 369–434.
Chu, C., Covaci, A., Voorspoels, S., Schepens, P., 2003. The
distribution of octachlorostyrene (OCS) in environmental samples
from Europe. J. Environ. Monitor. 5, 619–625.
Cleeman, M., Riget, F., Paulsen, G.B., Klungsøyr, J., Dietz, R., 2000.
Organochlorines in Greenland marine fish, mussels and sediments.
Sci. Total Environ. 245, 87–102.
Coteur, G., Gosselin, P., Wantier, P., Chambost-Manciet, Y., Danis,
B., Pernet, P., Warnau, M., Dubois, P., 2003. Echinoderms as
bioindicators, bioassays, and impact assessment tools of sediment-
associated metals and PCBs in the North Sea. Arch. Environ.
Contam. Toxicol. 45, 190–202.
Covaci, A., Van de Vijver, I., De Coen, W., Das, K., Bouquegneau,
J.M., Blust, R., Schepens, P., 2002. Determination of organohalo-
genated contaminants in liver of harbour porpoises (Phocoena
phocoena) stranded on the Belgian North Sea coast. Mar. Pollut.
Bull. 44, 1152–1169.
de Boer, J., van der Zande, T.E., Pieters, H., Ariese, F., Schipper,
C.A., van Brummelen, T., Vethaak, D., 2001. Organic contami-
nants and trace metals in flounder liver and sediment from the
Amsterdam and Rotterdam harbours and off the Dutch coast.
J. Environ. Monitor. 3, 386–393.
den Besten, P.J., Herwig, H.J., Zandee, D.I., Voogt, P.A., 1989. Effects
of cadmium and PCBs on reproduction of the seastar Asterias
rubens: aberrations in the early development. Ecotox. Environ.
Safe. 18, 173–180.
den Besten, P.J., Herwig, H.J., Smaal, A.C., Zandee, D.I., Voogt, P.A.,
1990. Interference of polychlorinated biphenyls (Clophen A50)
with gametogenesis in the sea star Asterias rubens L. Aquat.
Toxicol. 18, 231–246.
den Besten, P.J., Valk, S., van Weerlee, E., Nolting, R.F., Postma,
J.F., Everaarts, J.M., 2001. Bioaccumulation and biomerkers in the
sea star Asterias rubens (Echinodermata: Asteroidea): a North Sea
field study. Mar. Environ. Res. 51, 365–387.
404 S. Voorspoels et al. / Marine Pollution Bulletin 49 (2004) 393–404
de Voogt, P., Wells, D.E., Reutergardh, L., Brinkman, U.A.Th., 1990.
Biological activity, determination and occurence of planar, mono-
and di-ortho PCBs. Int. J. Environ. An. Ch. 40, 1–46.
Everaarts, J.M., den Besten, P.J., Hillebrand, M.Th.J., Halbrook,
R.S., Shugart, L.R., 1998. DNA strand breaks, cytochrome P-450-
dependent monooxygenase system activity and levels of chlorinated
biphenyl congeners in the pyloric caeca of the seastar (Asterias
rubens) from the North Sea. Ecotoxicology 7, 69–79.
Feroz, M., Qudduskhan, M.A., 1979. Metabolism, tissue distribution,
and elimination of cis-(C-14)chlordane in the tropical freshwater-
fish Cinchlasoma sp. J. Agric. Food Chem. 27, 1190–1197.
Fuoco, R., Colombini, M.P., Abete, C., Carignani, S., 1995. PCBs in
sediment, soil and sea water samples from Antarctica. Int. J.
Environ. An. Ch. 61, 309–318.
Giesy, J.P., Kannan, K., 1998. Dioxin-like and non-dioxin-like toxic
effects of polychlorinated biphenyls (PCBs): implications for risk
assessment. Crit. Rev. Toxicol. 28, 511–569.
Goerke, H., Weber, K., 2001. Species-specific elimination of polychlo-
rinated biphenyls in estuarine animals and its impact on residue
patterns. Mar. Environ. Res. 51, 131–149.
Green, N.W., Knutzen, J., 2003. Organohalogens and metals in marine
fish and mussels and some relationship to biological variables at
reference localities in Norway. Mar. Pollut. Bull. 46, 362–377.
Huybrechts, T., Dewulf, J., Van Langenhove, H., 2003. State-of-the-
art of gas chromatography-based methods for analysis of anthro-
pogenic volatile organic compounds in estuarine waters, illustrated
with the river Scheldt as an example. J. Chromatogr. A 1000, 283–
297.
Ikonomou, M., Rayne, S., Fischer, M., Fernandez, M., Cretney, W.,
2002. Occurrence and congener profiles of polybrominated
diphenyl ethers (PBDEs) in environmental samples from coastal
British Columbia, Canada. Chemosphere 46, 649–663.
Inomata, O.N.K., Montone, R.C., Lara, W.H., Weber, R.R., Toledo,
H.H.B., 1996. Tissue distribution of organochlorine residues––
PCBs and pesticides––in Antarctic penguins. Antarct. Sci. 8, 253–
255.
Jacobs, M., Covaci, A., Schepens, P., 2002. Investigation of selected
persistent organic pollutants in farmed Atlantic salmon (Salmo
salar), salmon aquaculture feed, and fish oil components of the
feed. Environ. Sci. Technol. 36, 2797–2805.
Jepson, P.D., Bennet, P.M., Allchin, C.R., Law, R.J., Kuiken, T.,
Baker, J.R., Rogan, E., Kirkwood, J.K., 1999. Investigating
potential associations between chronic exposure to polychlorinated
biphenyls and infectious disease mortality in harbour porpoises
from England and Wales. Sci. Total Environ. 243/244, 339–348.
Key, P.B., Fulton, M.H., Harman-Fetcho, J.A., McConnell, L.L.,
2003. Acetylcholinesterase activity in grass shrimp and aqueous
pesticide levels from South Florida drainage canals. Arch. Environ.
Contam. Toxicol. 45, 371–377.
Khan, R.A., 2003. Health of flatfish from localities in Placentia Bay,
Newfoundland, contaminated with petroleum and PCBs. Arch.
Environ. Contam. Toxicol. 44, 485–892.
Kozlova, T.A., 1997. Seasonal cycles in total chemical, composition of
two Lake Baikal benthic-pelagic sculpins (Cottocomephorus,
Cottoidei). J. Fish Biol. 50, 734–743.
Larsson, P., Okla, L., Collvin, L., 1993. Reproductive status and lipid-
content as factors in PCB, DDT and HCH contamination of a
population of pike (Esox lucius L.). Environ. Toxicol. Chem. 12,
855–861.
Livingstone, D.R., 1992. Persistent pollutants in marine invertebrates.
In: Walker, C.H., Livingstone, D.R. (Eds.), Persistent Pollutants in
Marine Ecosystems. In: SETAC Special Publishing Series. Per-
gamon Press, Oxford, UK, pp. 235–263.
Masuda, Y., 2003. Health effect of polychlorinated biphenyls and
related compounds. J. Health Sci. 49, 333–336.
Mehrtens, G., Laturnus, F., 1999. Mixed function oxidase depen-
dent biotransformation of polychlorinated biphenyls by differ-
ent species of fish from the North Sea. Chemosphere 38, 2995–
3002.
Mills, L.J., Gutjahr-Gobell, R.E., Haebler, R.A., Borsay Horowitz,
D.J., Jayaraman, S., Pruell, R.J., McKinney, R.A., Gardner, G.R.,
Zaroogian, G.E., 2001. Effects of estrogenic (o,p0-DDT; octyl-
phenol) and anti-androgenic (p,p0-DDE) chemicals on indicators
of endocrine status in juvenile male summer flounder (Paralichtus
denatus). Aquat. Toxicol. 52, 157–176.
Oh, C.W., Hartnoll, R.G., Nash, R.D.M., 2001. Feeding ecology of
the common shrimp Crangon crangon in Port Erin Bay, Isle of
Man, Irish Sea. Mar. Ecol.––Prog. Ser. 214, 211–223.
Picard, A., Palavan, G., Robert, S., Pesando, D., Ciapa, B., 2003.
Effects of organochlorine pesticides on maturation of starfish and
mouse oocytes. Toxicol. Sci. 73, 141–148.
Pruell, R.J., Rubinstein, N.I., Taplin, B.K., LiVolsi, J.A., Bowen,
R.D., 1993. Accumulation of polychlorinated organic contami-
nants from sediment by three benthic marine species. Arch.
Environ. Contam. Toxicol. 24, 290–297.
Roose, P., Cooreman, K., Vyncke, W., 1998. PCBs in cod (Gadus
morhua), flounder (Platichthys flesus), blue mussel (Mytilus edulis)
and brown shrimp (Crangon crangon) from the Belgian Continental
Shelf: relation to biological parameters and trend analysis.
Chemosphere 37, 2199–2210.
Safe, S.H., 1994. Polychlorinated biphenyls (PCBs): Environmental
impact, biochemical and toxic responses, and implications for risk
assessment. Crit. Rev. Toxicol. 24, 87–149.
Sleiderink, H.M., Oostingh, I., Goksøyr, A., Boon, J.P., 1995.
Sensitivity of cytochrome P450 1A induction in dab (Limanda
limanda) of different age and sex as a biomarker for environmental
contaminants in the Southern North Sea. Arch. Environ. Contam.
Toxicol. 287, 423–430.
Steen, R.J., van der Vaart, J., Hiep, M., Van Hattum, B., Cofino,
W.P., Brinkman, U.A., 2001. Gross fluxes and estuarine behaviour
of pesticides in the Scheldt estuary (1995–1997). Environ. Pollut.
115, 65–79.
UNEP, 2003. Stockholm Convention: Master List of Actions: On the
Reduction and/or Elimination of the Releases of Persistent Organic
Pollutants, Fifth ed. United Nations Environmental Programme,
Geneva, Switzerland.
Van de Vijver, K.I., Hoff, P.T., Van Dongen, W., Esmans, E.L., Blust,
R., De Coen, W.M., 2003. Exposure patterns of perfluorooctane
sulfonate in aquatic invertebrates from the Western Scheldt estuary
and the southern North Sea. Environ. Toxicol. Chem. 22, 2037–
2041.
Voorspoels, S., Covaci, A., Maervoet, J., Schepens, P., 2002.
Relationship between age and levels of organochlorine contami-
nants in human serum of a Belgian population. B. Environ.
Contam. Toxicol. 69, 22–29.
Voorspoels, S., Covaci, A., Schepens, P., 2003. Polybrominated
diphenyl ethers in marine species from the Belgian North Sea
and the Western Scheldt Estuary: levels, profiles, and distribution.
Environ. Sci. Technol. 37, 4348–4357.
Walters, G.W., Aitken, N.D., 2001. Surfactant-enhanced solubilisation
and anaerobic biodegradation of 1,1,1-trichloro-2,2-bis(p-chloro-
phenyl)-ethane (DDT) in contaminated soil. Water Environ. Res.
73, 15–23.
Weis, J.S., Cristini, A., Rao, K.R., 1992. Effects of pollutants
on molting and regeneration in crustacea. Am. Zool. 32, 495–
500.
Related Documents