Master Builders Head Office Master Builders House 417 Wickham Terrace Brisbane Queensland 4000 Telephone (07) 3404 6444 Facsimile (07) 3832 2361 ask@qmba.com.au www.qmba.com.au Builders Maste r M A S T E R B U I L D E R S Q U E E N S L A N D Master Builders Response to the Discussion Paper “Towards Sustainable Housing in Queensland” and Regulatory Impact Statement Released by Government on 8 December 2004

Welcome message from author
This document is posted to help you gain knowledge. Please leave a comment to let me know what you think about it! Share it to your friends and learn new things together.
Transcript

Master Builders Head Offi ceMaster Builders House417 Wickham TerraceBrisbane Queensland 4000
Telephone (07) 3404 6444Facsimile (07) 3832 2361
BuildersMasterM
AS
TER BUILDERS
Q
U E E N S L A ND
Master Builders Responseto the Discussion Paper
“Towards Sustainable Housing in Queensland”and
Regulatory Impact Statement
Released by Government on 8 December 2004

Master Builders Response – Towards Sustainable Housing
Gen2617.po.kh 22/12/04
EXECUTIVE SUMMARY
1. Master Builders does not support government proposals to ban electric hot water systems in all new homes and compulsorily require the use of solar, gas or heat pump hot water systems.
2. Master Builders does not support the banning of electric hot water systems based
on the government’s premise that it will dramatically reduce greenhouse gas emissions. The proposals based upon these grounds are fundamentally flawed and the stated policy objectives will not be achieved.
3. Regulating to ban electric hot water would see less than a 0.038% saving to total
greenhouse gas emissions per annum i.e. less than 1% savings over a 25 year period
4. Master Builders does not support the notion that electric hot water in new homes
will place pressure on energy infrastructure and that it will help to reduce the risks to performance of Queensland’s electricity supply. Savings on electricity demand by imposing the proposals upon the community will be less than 0.14% per annum or 1.4% over a 10 year period.
5. Master Builders has demonstrated that the proposed measures will impose
significant costs onto the community and dramatically affect housing affordability with little, if any, gain in greenhouse gas savings or a reduction of pressures on electricity infrastructure. The Regulatory Impact Statement acknowledges that gas hot water systems have higher capital and operating costs resulting in costs that are estimated to be greater than the value estimated for their greenhouse savings.
6. Master Builders believes that removing consumer choice, with little if any benefit
being gained in achieving the stated objectives, cannot be justified.
7. Master Builders has major concerns with allowing local governments to opt to make the installation of water tanks mandatory, if they wished to, as it will create an uneven playing field and cause confusion within industry operating in many different local government jurisdictions
8. Master Builders is extremely concerned that some Local Governments have
already influenced Land Developers to impose the proposals contained in the Discussion Paper upon consumers and builders through building covenants on the sale of land.
Master Builders Response – Towards Sustainable Housing ______________________________________________________________________________________
Gen2618.po.kh 22 December 2004 1
INTRODUCTION Master Builders is the largest industry organisation in Queensland, representing over 10,000 members including builders, subcontractors, manufacturers, industry consultants, associates and students. More than 90% of all commercial building work and 85% of all housing construction is conducted by Master Builders members. For more than a century Master Builders has represented the building and construction industry and has provided government with valued and respected input into the development of policy at all levels which affect both the industry and the community Master Builders supports the concept for more Sustainable Housing Development in Queensland. This commitment is clearly demonstrated by Master Builders being a signatory to a Heads of Agreement with Government and other industry stakeholders, on 18 July 2004 to increase public awareness of the importance and value of more sustainable design and construction practices and increasing the uptake of sustainable housing practices by industry and the community. The Heads of Agreement will achieve these objectives by collaborative efforts with Local Governments and other stakeholders in establishing demonstration houses in selected Queensland centres regionally and on a statewide basis. However, Master Builders does not support Government proposals, released in a Discussion Paper and Regulatory Impact Statement on 8 December 2004, to ban electric hot water systems in all new homes and compulsorily requiring the use of greenhouse efficient hot water systems. It also has concerns relating to local governments opting to make the installation of water tanks in their local government area mandatory. This will create an uneven playing field and cause confusion within industry operating in many different local government jurisdictions. GOVERNMENT PROPOSALS FOR LEGISLATING EFFICIENT HOT WATER One of the primary reasons given for banning electric hot water systems cited in the Regulatory Impact Statement (RIS) and Discussion Paper is that it will significantly reduce greenhouse gas emissions and reduce pressure on energy infrastructure. The following are extracts from the RIS released by the Queensland Government (Local Government and Planning and Environmental Protection Agency) relating to proposed legislative measures to improve sustainability of new housing 1Policy Objectives The primary objectives of the proposed legislation are to:
• Increase water efficiency 1 Page 5 of Regulatory Impact Statement
Master Builders Response – Towards Sustainable Housing
Gen2618.po.kh 22 December 2004 2
• Increase energy efficiency • Reduce greenhouse gas emissions
The increasing demand for more energy and water for use in homes is contributing to an increase in greenhouse gas emissions and is placing pressure on energy and water infrastructure. The increasing greenhouse gas emissions attributed to household energy use poses risks in terms of potential impacts from global warming. The growing population in Queensland, and associated demand for new housing, will lead to further increases in greenhouse gas emissions if housing does not become more energy efficient. 2 Increased levels of greenhouse gases are believed to be the major cause of global warming. …… The proposed regulations will help reduce growth in greenhouse gas emissions….. 3The measure proposed is the requirement that greenhouse efficient hot water systems (HWS) are used in new Class 1 buildings in Queensland. The greenhouse efficient HWS under consideration are:
• Solar electric • Solar gas • Efficient gas (here taken to mean either 5 star gas storage or
instantaneous/continuous gas); and • Heat pump
To address this, government therefore has proposed to ban the use of electric hot water systems in all new homes. MASTER BUILDERS RESPONSE Greenhouse gas emissions An analysis of the statistics cited in the Regulatory Impact Statement (see table) clearly demonstrates that if all new homes built per annum retained electric hot water systems, they would only contribute 0.038% to total greenhouse gas emissions in Queensland. The primary reasons for banning electric hot water are therefore fundamentally flawed and the stated policy objectives will not be achieved. Regulating for greenhouse efficient hot water systems would only see a slight improvement on the 0.038% contribution to total greenhouse gas emissions.
2 Page 13 Greenhouse Gas Emissions of Regulatory Impact Statement 3 Page 29 of Regulatory Impact Statement

Master Builders Response – Towards Sustainable Housing
Gen2618.po.kh 22 December 2004 3
Analysis of Government Figures from Regulatory Impact Statement
Contributors to Greenhouse Gases %Contribution to
TOTAL Greenhouse Gas Emissions (QLD)
Total Electricity Generation in Queensland
26% 4
23% 5 of electricity generated is for total housing stock (23% of 26%)
6%
Hot water is 34% 6 of household energy use (34% of 6%)
2%
New homes forecast growth to be 1.9% per annum 7 of existing total housing stock (1.9% of 2%) (1.48 million dwellings 8 of which 1.14 million are Class 1 detached 9
0.038%
In other words, if all new housing stock built per annum all had electric or non-greenhouse efficient hot water systems then they would contribute 0.038% of total greenhouse gas emissions
0.038%
Installing solar or greenhouse efficient hot water would generate savings on the 0.038% p.a. contribution but would be negligible in the big scheme of things (less than1% in 30 years)
Slightly less than
0.038% p.a. Less than 1% in 30
years If all 1.48 million existing dwellings all switched to solar then there would only be a slight saving to the total 2% contribution to total greenhouse gas emissions
Less than
2%
The fear factor of global warming and greenhouse gas emissions, and therefore the proposal to eliminate electric hot water systems, is predicated upon an emotional response, not fact, and clouds the issue.
4 Page 1 Para 2 of Regulatory Impact Statement 5 Page 1 Para 2 and Page 13 Para 3 of Regulatory Impact Statement 6 Page 1 Table 1 of Regulatory Impact Statement 7 Page 16 Para 4 of Regulatory Impact Statement 8 Page 19 Table 6 of Regulatory Impact Statement 9 Page 20 Table 7 of Regulatory Impact Statement

Master Builders Response – Towards Sustainable Housing
Gen2618.po.kh 22 December 2004 4
Master Builders therefore does not support the banning of electric hot water on the grounds that it will dramatically reduce greenhouse gas emissions. The proposals based upon these grounds in support of the policy objectives are fundamentally flawed as demonstrated in the above table. New homes net increase on energy demand (caused by hot water) Electricity demand caused by the installation of electric hot water systems in new housing stock per annum will increase total electricity generated by only 0.14% p.a. Over a ten year period, electricity demand caused by additional hot water systems in new housing will increase by 1.4% if total energy generation remains static (today’s figures). Due to economic and industrial growth over 10 years, total electricity generation will undoubtedly increase to meet demand. Therefore hot water will place an additional load of much less than 1.4% of electricity generated over a 10 years period.
Electricity usage % of total electricity
use Total electricity generation 100% 23% of electricity generated for total housing stock 23% Hot water is 34% of household energy use (34% of 23%) 7.8% New homes forecast growth to be 1.9% p.a. of existing total housing stock (1.9% of 7.8%)
0.14% p.a.
Electricity demand increase caused by hot water in new homes over 10 year period
Less than1.4%
Master Builders therefore does not support the notion that hot water in new homes “will place pressures on energy infrastructure” and that “they will help to reduce the risks to the performance of Queensland’s electricity supply infrastructure posed by increasing household energy demand”10 Cost increases for the community It is acknowledged in the RIS that the proposed regulations have the potential to result in significant costs to the community11 and that the proposed amendments are likely to increase barriers to entry in the housing market. The proposed amendments will increase barriers to entry by imposing higher capital costs for prospective homeowners12 of new homes. These measures, together with other proposed energy efficiency requirements proposed for 2006 in the Building Code of Australia will impact on housing affordability. 10 Page 13 of Regulatory Impact Statement 11 Page 1 Para 1 of Regulatory Impact Statement 12 Page 12 of Regulatory Impact Statement

Master Builders Response – Towards Sustainable Housing
Gen2618.po.kh 22 December 2004 5
It is acknowledged in the RIS that: 13 “The net capital cost of solar gas is about double the cost of a solar electric appliance, but the benefits in terms of greater greenhouse savings are not sufficient to outweigh the higher capital cost. Continuous natural gas hot water systems have higher capital and operating costs than conventional models, resulting in costs that are estimated to be greater than the value estimated for their greenhouse savings” “The cost benefit assessment of gas water heaters shows a strong net cost for natural gas hot water systems. This is due to a number of factors:
• Capital costs for gas water heaters are greater than off-peak electric hot water systems, particularly in relation to plumbing costs for connection to gas reticulation works;
• Gas water heaters are typically less energy efficient than off-peak electric hot water systems and thus use more energy;
• The cost of reticulated gas in Queensland is high compared to the cost of off-peak electricity.......;
• It is assumed that LPG, at even higher prices than natural gas, is used in zones 1 and 3; and
• The only off-setting benefit is greenhouse gas savings” These figures and assumptions are supported by a study done by the Energex Institute in April 2003. Their report is included as Attachment A. From the Energex Institute’s own figures there are negligible net savings (if any) to consumers over a 10 year period when taking into account running costs over the period, capital purchase and installation costs less Renewable Energy Certificates (RECs) and the state government solar hot water rebates.
Hot water system
Total net costs over 10 years Energex
Smart Housing Publication Dept of Housing
Solarhart 302 L 14 $2,666 $2,400 Rheem Heat Pump $2,863 $2,400 Storage electric tariff 31 $2,872 Solarhart 302 J 15 $2,982 Heat Exchange tariff 33 $3,203 $3,490 Storage electric tariff 33 $3,265 $3,590 Continuous Flow Natural Gas $3,718 $3,880 Storage Natural Gas $4,200 $4,430 Continuous Flow LPG $5,885 Storage LPG $7,010
13 Page 58 of Regulatory Impact Statement Para 6 and 7 14 Referenced in Footnote page 27 of the Regulatory Impact Statement 15 Referenced in Footnote page 27 of the Regulatory Impact Statement

Master Builders Response – Towards Sustainable Housing
Gen2618.po.kh 22 December 2004 6
Furthermore, net costs for similar various hot water systems highlighted in the Queensland Government, Department of Housing publication “Smart Housing – Towards Sustainable Housing - Cost Efficiency” published May 2004, also indicates negligible savings (if any) over a 10 year period and that gas hot water will add significant costs to the community. Master Builders believes that the cost of capital purchase and installation is not truly reflected in the above figures. A quote from the Solar Centre (North Ipswich) for a Solarhart 302 L to be installed at a new house in Bardon was Solarhart 302L $3040 Roof-fit $ 370 (does not include plumbing and electrical) Hire Mobile Crane $ 220 LESS RECs $1080 Total $2550 The cost of plumbing and electrical connection is not included, or the cost of strengthening the roof frame structure to accommodate additional weight. Master Builders therefore believes that the proposed measures have the potential to impose significant costs onto the community, with little, if any, gain in greenhouse gas savings or a reduction of pressures on the electricity infrastructure. Housing affordability, when taken in context with;
• the recent energy efficiency measures introduced via the Building Code of Australia on 1 September 2003;
• a recent increase in the Portable Long Service Leave Levy on 1 January 2005; • a proposed Training Levy to be introduced possibly on 1 July 2005; • proposed raising of the bar for energy efficiency for houses via the Building
Code of Australia in 2006 (which will add significant costs, especially for North Queensland);
• proposed introduction of water tanks; will be severely eroded, and will impact as a real barrier for entry into the new housing market. When all of these additional costs are added to a mortgage with a 25 year term, the total costs, especially in relation to interest on the loan, will be significant. Master Builders has commissioned Reed Construction Data (formally Cordell), a highly respected and independent Construction Costing organization, to monitor on a quarterly basis the cost of construction of a typical dwelling (excluding land costs) in South East

Master Builders Response – Towards Sustainable Housing
Gen2618.po.kh 22 December 2004 7
Queensland and translate these costs into a Housing Affordability Index based on ABS data including information on Average Weekly Income and Consumer Price Index relating specifically to Queensland. The report clearly indicates that introduction of the governments proposals will have a significant impact on Housing Affordability. The Report is included as Attachment B. There is a direct correlation between housing affordability and housing approval figures. The Housing Affordability graphs since February 2000, shown in Attachment B, can be compared to the building approval figures shown on the last page of the Attachment B report. The impact of GST on housing affordability shows the same downward trends on approval figures. The rise and falls in affordability since the introduction of GST are also reflected in the approvals graph. It could be anticipated that mandatory introduction of the proposals will directly affect building approvals. Although many of the community, industry and government believe that industry is currently in a boom period, with resultant skill shortages being experienced, evidence shows that this is not the case. Current levels are nowhere near the housing booms in 1988 and 1994 (as shown in the graph). Historically, when there are periods of high activity in the housing sector the commercial (construction) sector is depressed. Labour operating in the commercial sector then migrate into the housing sector alleviating skill shortages in this sector. Over the past few years both the housing and commercial sectors have simultaneously been experiencing high activity levels, resulting in a severe skills shortage as trades-people do not need to migrate from one sector of the industry to the other to find work. It is expected that new energy efficiency measures to be introduced in both the housing and commercial sectors in May 2006 via the Building Code of Australia will have a significant impact on building costs and affordability. Any resultant fallout on building approvals, in both sectors, will have a devastating effect on the viability of the industry. The housing sector felt this effect following the introduction of the GST which increased the cost of housing. The commercial sector did not experience this effect as commercial approvals were not affected by the GST because clients (as businesses) could claim the GST cost increase back as an input tax credit. Home buyers could not do this. Consumer Choice By regulating the compulsory exclusion of electric hot water, choice for consumers is removed with little or negligible resultant impact on total greenhouse gas emissions or energy infrastructure. There are many variables to be taken into account when making a hot water system purchase, such as energy availability and pricing. Presently the majority of domestic consumers do not have access to natural gas. The alternative gas supply (LPG) is the most expensive home energy alternative.

Master Builders Response – Towards Sustainable Housing
Gen2618.po.kh 22 December 2004 8
To optimize the use of solar energy, collector panels need to be facing true north, away from the shade of trees or neighbouring buildings and kept clean to best absorb solar energy. It is possible for solar hot water systems to rely heavily on their booster elements powered by electricity or gas to meet the hot water needs of the home’s occupants. Homeowner’s choices are individual, indicating a need for a wide range of alternative products in the hot water category. Some families have limited funds available and are unable to consider perceived environmentally friendly choices at this time. Those choosing to use electric hot water systems have not only a choice of system sizes but economic tariff options. Master Builders strongly believes that removing consumer choice, with little if any benefit being gained in achieving the stated objectives, cannot be justified. Rainwater Tanks It is acknowledged that water availability has the potential to be a major limiting factor for accommodating the anticipated population growth in Queensland unless actions are taken to address this issue. This is especially the case in South East Queensland, where planning for the future is vital for an ability to provide water to the one million extra people projected to live in SE Queensland by 2026. The current Government proposal does not intend to make the installation of water tanks for garden use mandatory for all new houses built in Queensland, but wishes to leave it up to individual councils to mandate, through a State Model Code, if they chose to. Master Builders has serious concerns with this approach as it will create an uneven playing field and cause confusion within industry operating in many different local government jurisdictions, some of which may adopt mandatory water tanks and others which will not. It has the potential to increase construction costs and timeframes in having to conform to inconsistent standards. Although water tanks, for garden use, may take the pressure off water infrastructure, it is believed to be only a bandaid stop-gap measure and does not address the real issue. The Government, through its forecast projections of population growth and the recent SE Qld Regional Plan, must bite the bullet and plan for additional water infrastructure in the short to medium term. Local Government and Land Developers Master Builders is extremely concerned that some Local Government Councils have already influenced land developers to impose the proposals outlined in the Discussion Paper, together with additional requirements, upon consumers and builders through covenants on the sale of land. An example is the covenant on the sale of land for the Montruse Estate, Calamvale, which requires as an essential element, heating of water to be either solar, instantaneous gas or heat pump and that 3000 litre rainwater tanks must

Master Builders Response – Towards Sustainable Housing
Gen2618.po.kh 22 December 2004 9
be installed on every house. The building covenant also requires that solar panels must be located so they are not highly visible from the roadways. This creates a dilemma as many blocks are on the southern side of an East/West roadway. Solar panels, to be efficient, must face north. Proposed legislation would legitimize the practice of Local Governments influencing land developers to impose stringent building covenants on land. A copy of the covenant is included as Attachment C. OPTIONS Government has proposed four options to address the policy objectives stated in the Discussion Paper and Regulatory Impact Statement, being;
• Option 1 - No regulation • Option 2 – State regulation • Option 3 – State regulation with local government discretion • Option 4 – Planning Schemes
Master Builders rejects Options 3 and 4 for the reasons stated in the Regulatory Impact Statement. Master Builders does not support Option 2, even though this would result in a uniform standard across the state and the political process to establish the requirements need only be done once, at state level. The uniformity of requirements would make it easy for builders and buyers to know the minimum standards. This option is not supported as it would impose significant costs upon the community, create real barriers to entry into the home market by affecting affordability and would not achieve the stated objectives in the Regulatory Impact Statement in reducing greenhouse gas emissions or pressure on the electrical energy infrastructure, as demonstrated in this paper. Master Builders supports Option 1. The no regulation scenario would see the continuation of a number of current initiatives for energy and water. These include rebates on solar water heaters (which could be removed if Option 2 was adopted), the promotion of AAA shower roses, information dissemination by the EPA, Department of Housing and industry, and the demonstration smart house project being implemented by industry and government. Whilst Master Builders cannot see any justification of regulating new energy efficiency provisions at this time, there are numerous incentives and other options that will improve the energy efficiency of the industry whilst maintaining a maximum of consumer choice. The market is the most appropriate mechanism for handling this matter. Consumers are extremely concerned with the environment and energy efficiency of their homes. The Government and Master Builders need to increase the education and training of the public and industry to enable consumers to make the best choices for themselves. The benefits of introducing “compulsory” measures simply do not exist at the moment.

Master Builders Response – Towards Sustainable Housing
Gen2618.po.kh 22 December 2004 10
A voluntary compliance approach minimizes compliance costs, allowing homeowners or builders to choose the level of housing sustainability that suits their circumstances and reduces enforcement and management costs for local governments and private certifiers.

Master Builders Response – Towards Sustainable Housing
Gen2618.po.kh 22 December 2004 11
Attachment A
Energex Hot Water System Life Cost Analysis

Calculation detail:
. All storage type units [solar, gas and electric (including heat exchange)] - 105 litres hot water used per day.
. Continuous flow gas systems - 236 litres per day (estimated to be comparable with 105 litres delivered from storage system.)Notes on flow rates and hot water delivery temperatures for this exercise:Mains pressure water is delivered from storage type units at 50 degrees C above ambient temperature (usually 65 - 70 degrees C)Electric heat exchange type units are designed to deliver hot water at a maximum flow of 9 litres per minute
Notes on Solar System's booster energy requirement
Energy and estimated unit purchase pricing (including basic installation) current 10 April 2003
Electric and Gas hot water system pricing is averaged and current 10 April 2003All calculations are approximations based on industry accepted formulas.The information contained within this file is to be used as a guide only.Individual household hot water use will vary depending on the following:
- The unit's thermostat setting The time spent showering The water flow rate of your shower rose (average between 9 - 24 litres per minute) Possible faulty leaking hot water system Leaking hot water taps Heat losses as a result of uninsulated piping from the hot water system to the hot water taps Normal daily heat losses for each particular hot water system Type and thickness of storage unit insulation Anne Armansin - manager ENERGEX institute Ph (07) 3407 6010
Adequately sized Solar hot water systems, installed with their collector panels facing due north, are estimated to meet 80% hot water needs in SEQ (105 litres per day) met by the sun. (Remaining 20% calculated at Tariff 11 electricity pricing)
Solar hot water systems are individually represented with applicable solar rebate calculations deducted from total original purchase price
Hot Water System Life Cost Analysis
Running Costs based on Industry supplied formulas (to determine energy used by a range of hot water system types producing the same amount of hot water delivered from the 'tap' using the various energy forms and tariffs available).Daily electricity consumption figures for this example are between 8.2 and 9.5 kWh per day (depending on individual unit's intended performance)Comparing:
Continuous Flow type Gas units are designed to deliver water at 25 degrees above ambient temperature at maximum flow rate of individual models (I.e. 16 litres per minute @ 25 degrees above ambient temp; 24 litres per minute @ 25 degrees above ambient temp)
ENERGEX institute 21/02/2005 Page 1

colour codes
solar w elec boost
elec heat
pump
elec storage
elec heat
exchange
gas cont flow
gas storage
4 - 5 peoplesystem type / energy
5 - 6 people system type / energy
unit size litres / flow
new unit average purchase price
(installed)
running cost est.
year 1
total est first year expenses
year 2
year3
year 4
year 5
year6
year 7
year 8
year 9 year 10
solahart 301 J Series (1 panel) 300 1,943$ 56$ 1,999$ $2,055 $2,111 $2,167 $2,223 $2,279 $2,335 $2,391 $2,447 2,503$ Rheem Solar Hiline 52S30005/2SCTNF 300 2,000$ 56$ 2,056$ $2,112 $2,168 $2,224 $2,280 $2,336 $2,392 $2,448 $2,504 2,560$ solahart 301 K Series (1 panel) 300 2,086$ 56$ 2,142$ $2,198 $2,254 $2,310 $2,366 $2,422 $2,478 $2,534 $2,590 2,646$ solahart 302 L Series 300 2,106$ 56$ 2,162$ $2,218 $2,274 $2,330 $2,386 $2,442 $2,498 $2,554 $2,610 2,666$ Rheem Solar Hiline 52S3005/2SCTFP 300 2,117$ 56$ 2,173$ $2,229 $2,285 $2,341 $2,397 $2,453 $2,509 $2,565 $2,621 2,677$ Rheem Solar Loline 51134005/2SCT 340 2,300$ 56$ 2,356$ $2,412 $2,468 $2,524 $2,580 $2,636 $2,692 $2,748 $2,804 2,860$ Rheem Heat Pump 55027500 (Tariff 33) 275 2,203$ 66$ 2,269$ $2,335 $2,401 $2,467 $2,533 $2,599 $2,665 $2,731 $2,797 2,863$ Rheem Heat Pump 55027500 (Tariff 33) 275 2,203$ 66$ 2,269$ $2,335 $2,401 $2,467 $2,533 $2,599 $2,665 $2,731 $2,797 2,863$
storage electariff 31 315 $ 1,222 $ 165 $ 1,387 $1,552 1717 1882 $2,047 2212 2377 2542 2707 $ 2,872
solahart 302 J Series 300 2,422$ 56$ 2,478$ $2,534 $2,590 $2,646 $2,702 $2,758 $2,814 $2,870 $2,926 2,982$ edwards L 305 / 2 panel 300 2,451$ 56$ 2,507$ $2,563 $2,619 $2,675 $2,731 $2,787 $2,843 $2,899 $2,955 3,011$ Rheem Solar Loline 51127005/2SCT 270 2,486$ 56$ 2,542$ $2,598 $2,654 $2,710 $2,766 $2,822 $2,878 $2,934 $2,990 3,046$ edwards DES 315 / 2 panel 315 2,550$ 56$ 2,606$ $2,662 $2,718 $2,774 $2,830 $2,886 $2,942 $2,998 $3,054 3,110$ edwards LX 305 / 2 panel 300 2,565$ 56$ 2,621$ $2,677 $2,733 $2,789 $2,845 $2,901 $2,957 $3,013 $3,069 3,125$
storage electariff 31
storage electariff 31 400 $ 1,470 $ 169 $ 1,639 $1,808 1977 2146 $2,315 2484 2653 2822 2991 $ 3,160
heat exchangetariff 33 180 $ 823 $ 238 $ 1,061 $1,299 1537 1775 $2,013 2251 2489 2727 2965 $ 3,203
storage electariff 33 160 $ 1,035 $ 223 $ 1,258 $1,481 1704 1927 $2,150 2373 2596 2819 3042 $ 3,265
solahart 302 K Series 300 2,803$ 56$ 2,859$ $2,915 $2,971 $3,027 $3,083 $3,139 $3,195 $3,251 $3,307 3,363$ heat exchange
tariff 33 280 $ 929 $ 246 $ 1,175 $1,421 1667 1913 $2,159 2405 2651 2897 3143 $ 3,389 storage elec
tariff 33 250 $ 1,125 $ 235 $ 1,360 $1,595 1830 2065 $2,300 2535 2770 3005 3240 $ 3,475 cont flow
natural gas 22 $ 1,485 $ 220 $ 1,705 $1,925 2145 2365 $2,585 2805 3025 3245 3465 $ 3,685 cont flow
natural gascont flow
natural gas 24 $ 1,518 $ 220 $ 1,738 $1,958 2178 2398 $2,618 2838 3058 3278 3498 $ 3,718 storage
natural gas 130 $ 1,400 $ 280 $ 1,680 $1,960 2240 2520 $2,800 3080 3360 3640 3920 $ 4,200 storage
natural gasstorage
natural gas 160 $ 1,470 $ 288 $ 1,758 $2,046 2334 2622 $2,910 3198 3486 3774 4062 $ 4,350 solahart 302 BC12 Oyster Series 300 3,838$ 56$ $ 3,894 $3,950 4006 4062 $4,118 4174 4230 4286 4342 $ 4,398
storagenatural gas 135 $ 1,160 $ 375 $ 1,535 $1,910 2285 2660 $3,035 3410 3785 4160 4535 $ 4,910
storage electrictariff 11 160 $ 1,035 $ 389 $ 1,424 $1,813 2202 2591 $2,980 3369 3758 4147 4536 $ 4,925 storage
natural gasstorage
natural gas 170 $ 1,235 $ 389 $ 1,624 $2,013 2402 2791 $3,180 3569 3958 4347 4736 $ 5,125 storage electric
tariff 11 250 $ 1,125 $ 409 $ 1,534 $1,943 2352 2761 $3,170 3579 3988 4397 4806 $ 5,215 heat exchange
tariff 11heat exchange
tariff 11 400 $ 1,240 $ 452 $ 1,692 $2,144 2596 3048 $3,500 3952 4404 4856 5308 $ 5,760 cont flow
lpg 22 $ 1,485 $ 440 $ 1,925 $2,365 2805 3245 $3,685 4125 4565 5005 5445 $ 5,885 cont flow
lpgcont flow
lpg 24 $ 1,518 $ 440 $ 1,958 $2,398 2838 3278 $3,718 4158 4598 5038 5478 $ 5,918 storage
lpg 130 $ 1,400 $ 561 $ 1,961 $2,522 3083 3644 $4,205 4766 5327 5888 6449 $ 7,010 storage
lpgstorage
lpg 160 $ 1,470 $ 576 $ 2,046 $2,622 3198 3774 $4,350 4926 5502 6078 6654 $ 7,230 storage
lpg 135 $ 1,160 $ 749 $ 1,909 $2,658 3407 4156 $4,905 5654 6403 7152 7901 $ 8,650 storage
lpgstorage
lpg 170 $ 1,235 $ 778 $ 2,013 $2,791 3569 4347 $5,125 5903 6681 7459 8237 $ 9,015
life
cost
com
paris
on 4
- 6
peop
lelife cost comparison 4 - 6 people
ENERGEX institute 21/02/2005 Page 1

Master Builders Response – Towards Sustainable Housing
Gen2618.po.kh 22 December 2004 12
Attachment B
Housing Affordability Cost Index

FEBRUARY 2005 REPORT
MASTER BUILDERS QUEENSLAND
& CORDELL HOUSING COST INDEX
Regulatory Impact Statement Costing
“Proposed amendments to building and plumbing regulations
to improve sustainability of new housing”

Master Builders Queensland & Cordell Housing Cost Index – New Home Construction
Reed Construction Data Page 2 FEBRUARY 2005
CONTENTS
1 – BRIEF..................................................................................................................... 3
2 – METHOD............................................................................................................... 3
3 – COST MODEL ...................................................................................................... 3
4 – VARIATIONS OF CONSTRUCTION ............................................................... 4
5 – DATA...................................................................................................................... 4
5.1 - Reed Construction Data.................................................................................. 4
5.2 - Additional Data Sources ................................................................................. 5
6 – ANALYSIS SUMMARY....................................................................................... 5
6.1 – Implementation Costs..................................................................................... 5
6.2 - Affordability Index – Base.............................................................................. 6
6.3 - Affordability Index – Option 1 (Electric Storage)........................................ 7
6.4 - Affordability Index – Option 2 (Solar – Electric Boost) .............................. 7
6.5 - Affordability Index – Option 3 (Solar – Gas Boost)..................................... 8
6.6 - Affordability Index – Option 4 (Gas Storage) .............................................. 8
6.7 - Affordability Index – Option 5 (Gas Continuous)........................................ 9
6.8 - Affordability Index – Option 6 (Heat Pump)................................................ 9
Master Builders Queensland & Cordell Housing Cost Index – New Home Construction
Reed Construction Data Page 3 FEBRUARY 2005
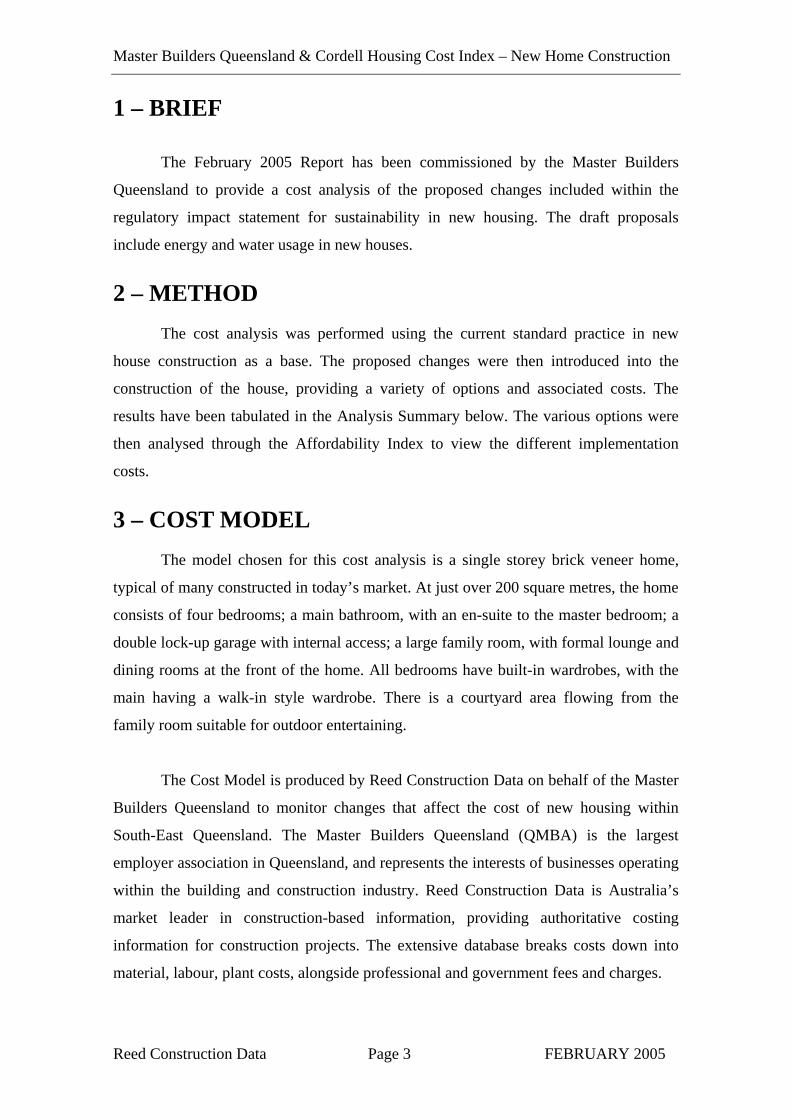
1 – BRIEF
The February 2005 Report has been commissioned by the Master Builders
Queensland to provide a cost analysis of the proposed changes included within the
regulatory impact statement for sustainability in new housing. The draft proposals
include energy and water usage in new houses.
2 – METHOD The cost analysis was performed using the current standard practice in new
house construction as a base. The proposed changes were then introduced into the
construction of the house, providing a variety of options and associated costs. The
results have been tabulated in the Analysis Summary below. The various options were
then analysed through the Affordability Index to view the different implementation
costs.
3 – COST MODEL
The model chosen for this cost analysis is a single storey brick veneer home,
typical of many constructed in today’s market. At just over 200 square metres, the home
consists of four bedrooms; a main bathroom, with an en-suite to the master bedroom; a
double lock-up garage with internal access; a large family room, with formal lounge and
dining rooms at the front of the home. All bedrooms have built-in wardrobes, with the
main having a walk-in style wardrobe. There is a courtyard area flowing from the
family room suitable for outdoor entertaining.
The Cost Model is produced by Reed Construction Data on behalf of the Master
Builders Queensland to monitor changes that affect the cost of new housing within
South-East Queensland. The Master Builders Queensland (QMBA) is the largest
employer association in Queensland, and represents the interests of businesses operating
within the building and construction industry. Reed Construction Data is Australia’s
market leader in construction-based information, providing authoritative costing
information for construction projects. The extensive database breaks costs down into
material, labour, plant costs, alongside professional and government fees and charges.

Master Builders Queensland & Cordell Housing Cost Index – New Home Construction
Reed Construction Data Page 4 FEBRUARY 2005
4 – VARIATIONS OF CONSTRUCTION The Regulatory Impact Statement “Proposed amendments to building and
plumbing regulations to improve sustainability of new housing” provides a number of
options for consideration. These options relate specifically to energy use and water
saving devices. All options outlined below contain the additional recommendations of
AAA Rated shower roses
Rainwater tank (3,000 litre)
Dual-flush toilets
Efficient lighting
Water pressure limiting device
The options include
BASE – Standard current practice Electric Storage HWS (Off-peak)
OPTION 1 – Standard current practice with additional recommendations listed above
OPTION 2 – As for Option 1 with Solar HWS (Electric boost)
OPTION 3 – As for Option 1 with Solar HWS (Gas boost)
OPTION 4 – As for Option 1 with Gas Storage HWS
OPTION 5 – As for Option 1 with Gas Continuous HWS
OPTION 6 – As for Option 1 with Heat Pump HWS.
5 – DATA
5.1 - Reed Construction Data
The data used for construction costs associated with this cost analysis have been
calculated using the Cordell Queensland Housing Building Cost Guide. The database of
information is researched and updated on a daily basis, capturing movements in labour,
material, plant hire and fees and charges. This information is published quarterly in the
Cordell Building Cost Guide, and on the Internet via the Reed Construction Data e-
Costing program. The database is also used for various insurance-based products,
providing replacement costs for major insurance companies.

Master Builders Queensland & Cordell Housing Cost Index – New Home Construction
Reed Construction Data Page 5 FEBRUARY 2005
5.2 - Additional Data Sources
Data used for comparative analysis of affordability were sourced from the
Australian Bureau of Statistics, including information on Average Weekly Income and
the Consumer Price Index relating specifically to Queensland.
6 – ANALYSIS SUMMARY
6.1 – Implementation Costs
The implementation costs tabulated below reflect the current trade rates with the
addition of the GST and builders margin. This is the additional end cost to the
homeowner. The new totals are for including the option cost within the base house.
These costs have been substituted into the affordability index for further analysis.
Option Construction
Method
HWS Cost Implementation
Cost
New Total
Base Electric - Storage $ 1,081.00 $ - $229,119.20 Option 1 Electric - Storage $ 1,081.00 $ 2,294.64 $231,413.84 Option 2 Solar - Electric $ 4,375.00 $ 5,588.64 $234,707.84 Option 3 Solar - Gas $ 5,722.00 $ 6,935.64 $236,054.84 Option 4 Gas - Storage $ 1,309.00 $ 2,522.64 $231,641.84 Option 5 Gas - Continuous $ 1,656.00 $ 2,869.64 $231,988.84 Option 6 Heat Pump $ 4,851.00 $ 6,064.64 $235,183.84

Master Builders Queensland & Cordell Housing Cost Index – New Home Construction
Reed Construction Data Page 6 FEBRUARY 2005
6.2 - Affordability Index – Base
Quarterly Affordability Index of Building Costs and Weekly Earnings
Graph 1. (February 2000 to November 2004)
90.0091.0092.0093.0094.0095.0096.0097.0098.0099.00
100.00101.00
Feb-00
May-00
Aug-00
Nov-00
Feb-01
May-01
Aug-01
Nov-01
Feb-02
May-02
Aug-02
Nov-02
Feb-03
May-03
Aug-03
Nov-03
Feb-04
May-04
Aug-04
Nov-04
Quarters
Inde
x po
ints
February 2000 = 100 index points. Note: Forecast used for average weekly earnings for November 2004 index point. Sources: Reed Construction Data; ABS catalogue No. 6302 August 2004.
The Affordability Index is based on the ratio of the total cost of building to
average weekly earnings. The total cost of building was based on the cost of building a
200 square metre, 4-bedroom single storey brick veneer house in South-East
Queensland. Average weekly earnings were based on the gross average weekly
earnings in Queensland. Increases in the index represent the cost of building being
more affordable to the average wage earner. Decreases in the index represent the cost
of building being less affordable to the average wage earner.

Master Builders Queensland & Cordell Housing Cost Index – New Home Construction
Reed Construction Data Page 7 FEBRUARY 2005
6.3 - Affordability Index – Option 1 (Electric Storage)
Quarterly Affordability Index of Building Costs and Weekly Earnings
Graph 2. (February 2000 to November 2004)
90.0091.0092.0093.0094.0095.0096.0097.0098.0099.00
100.00101.00
Feb-00
May-00
Aug-00
Nov-00
Feb-01
May-01
Aug-01
Nov-01
Feb-02
May-02
Aug-02
Nov-02
Feb-03
May-03
Aug-03
Nov-03
Feb-04
May-04
Aug-04
Nov-04
Quarters
Inde
x po
ints
February 2000 = 100 index points. Note: Forecast used for average weekly earnings for November 2004 index point. Sources: Reed Construction Data; ABS catalogue No. 6302 August 2004.
6.4 - Affordability Index – Option 2 (Solar – Electric Boost)
Quarterly Affordability Index of Building Costs and Weekly Earnings
Graph 3. (February 2000 to November 2004)
90.0091.0092.0093.0094.0095.0096.0097.0098.0099.00
100.00101.00
Feb-00
May-00
Aug-00
Nov-00
Feb-01
May-01
Aug-01
Nov-01
Feb-02
May-02
Aug-02
Nov-02
Feb-03
May-03
Aug-03
Nov-03
Feb-04
May-04
Aug-04
Nov-04
Quarters
Inde
x po
ints
February 2000 = 100 index points. Note: Forecast used for average weekly earnings for November 2004 index point. Sources: Reed Construction Data; ABS catalogue No. 6302 August 2004.

Master Builders Queensland & Cordell Housing Cost Index – New Home Construction
Reed Construction Data Page 8 FEBRUARY 2005
6.5 - Affordability Index – Option 3 (Solar – Gas Boost)
Quarterly Affordability Index of Building Costs and Weekly Earnings
Graph 4. (February 2000 to November 2004)
90.0091.0092.0093.0094.0095.0096.0097.0098.0099.00
100.00101.00
Feb-00
May-00
Aug-00
Nov-00
Feb-01
May-01
Aug-01
Nov-01
Feb-02
May-02
Aug-02
Nov-02
Feb-03
May-03
Aug-03
Nov-03
Feb-04
May-04
Aug-04
Nov-04
Quarters
Inde
x po
ints
February 2000 = 100 index points. Note: Forecast used for average weekly earnings for November 2004 index point. Sources: Reed Construction Data; ABS catalogue No. 6302 August 2004.
6.6 - Affordability Index – Option 4 (Gas Storage)
Quarterly Affordability Index of Building Costs and Weekly Earnings
Graph 5. (February 2000 to November 2004)
90.0091.0092.0093.0094.0095.0096.0097.0098.0099.00
100.00101.00
Feb-00
May-00
Aug-00
Nov-00
Feb-01
May-01
Aug-01
Nov-01
Feb-02
May-02
Aug-02
Nov-02
Feb-03
May-03
Aug-03
Nov-03
Feb-04
May-04
Aug-04
Nov-04
Quarters
Inde
x po
ints
February 2000 = 100 index points. Note: Forecast used for average weekly earnings for November 2004 index point. Sources: Reed Construction Data; ABS catalogue No. 6302 August 2004.

Master Builders Queensland & Cordell Housing Cost Index – New Home Construction
Reed Construction Data Page 9 FEBRUARY 2005
6.7 - Affordability Index – Option 5 (Gas Continuous)
Quarterly Affordability Index of Building Costs and Weekly Earnings
Graph 6. (February 2000 to November 2004)
90.0091.0092.0093.0094.0095.0096.0097.0098.0099.00
100.00101.00
Feb-00
May-00
Aug-00
Nov-00
Feb-01
May-01
Aug-01
Nov-01
Feb-02
May-02
Aug-02
Nov-02
Feb-03
May-03
Aug-03
Nov-03
Feb-04
May-04
Aug-04
Nov-04
Quarters
Inde
x po
ints
February 2000 = 100 index points. Note: Forecast used for average weekly earnings for November 2004 index point. Sources: Reed Construction Data; ABS catalogue No. 6302 August 2004.
6.8 - Affordability Index – Option 6 (Heat Pump)
Quarterly Affordability Index of Building Costs and Weekly Earnings
Graph 7. (February 2000 to November 2004)
90.0091.0092.0093.0094.0095.0096.0097.0098.0099.00
100.00101.00
Feb-00
May-00
Aug-00
Nov-00
Feb-01
May-01
Aug-01
Nov-01
Feb-02
May-02
Aug-02
Nov-02
Feb-03
May-03
Aug-03
Nov-03
Feb-04
May-04
Aug-04
Nov-04
Quarters
Inde
x po
ints
February 2000 = 100 index points. Note: Forecast used for average weekly earnings for November 2004 index point. Sources: Reed Construction Data; ABS catalogue No. 6302 August 2004.

Qld Building Approvals (houses) Aug 87 - Dec 04
0
500
1000
1500
2000
2500
3000
3500
4000
Aug-87
Aug-88
Aug-89
Aug-90
Aug-91
Aug-92
Aug-93
Aug-94
Aug-95
Aug-96
Aug-97
Aug-98
Aug-99
Aug-00
Aug-01
Aug-02
Aug-03
Aug-04

Master Builders Response – Towards Sustainable Housing
Gen2618.po.kh 22 December 2004 13
Attachment C
Building Covenant Montruse Estate


Related Documents