Productivity Commission Paula Barnes Productivity Analysis Branch Productivity Commission PC-ABS Productivity Perspectives Conference, Canberra 20 November 2012 Productivity in Australian Manufacturing: Some preliminary results

Welcome message from author
This document is posted to help you gain knowledge. Please leave a comment to let me know what you think about it! Share it to your friends and learn new things together.
Transcript

Productivity Commission
Paula Barnes
Productivity Analysis Branch
Productivity Commission
PC-ABS Productivity Perspectives Conference, Canberra 20 November 2012
Productivity in
Australian Manufacturing: Some preliminary results

Productivity Commission 2
MFP for manufacturing and the market sector
Data source: ABS (Cat. no. 5260.055.002, 2010-11)
60
70
80
90
100
110
120
1985-86 1988-89 1991-92 1994-95 1997-98 2000-01 2003-04 2006-07 2009-10
MFP Manufacturing
MFP Market sector (12 industries)
Index 2009-10 = 100
Productivity Commission 3
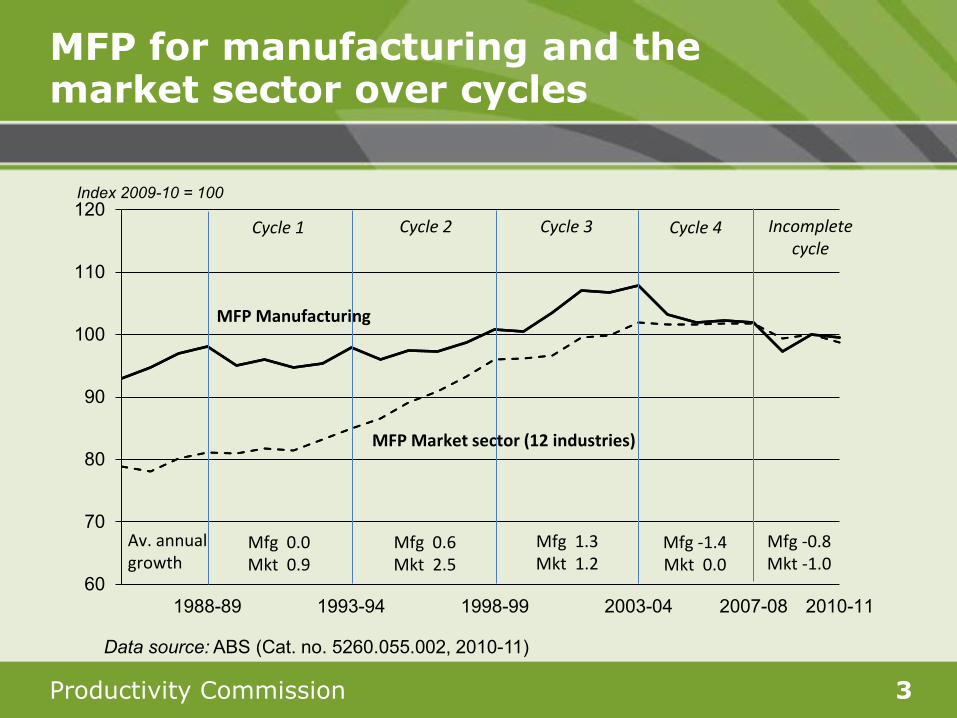
MFP for manufacturing and the market sector over cycles
Data source: ABS (Cat. no. 5260.055.002, 2010-11)
60
70
80
90
100
110
120
1988-89 1993-94 1998-99 2003-04 2007-08 2010-11
Mfg 0.0 Mkt 0.9
Mfg 0.6 Mkt 2.5
Mfg 1.3 Mkt 1.2
Mfg -1.4 Mkt 0.0
MFP Manufacturing
MFP Market sector (12 industries)
Av. annual growth
Incomplete cycle
Mfg -0.8 Mkt -1.0
Cycle 1 Cycle 2 Cycle 3 Cycle 4
Index 2009-10 = 100
Productivity Commission 4
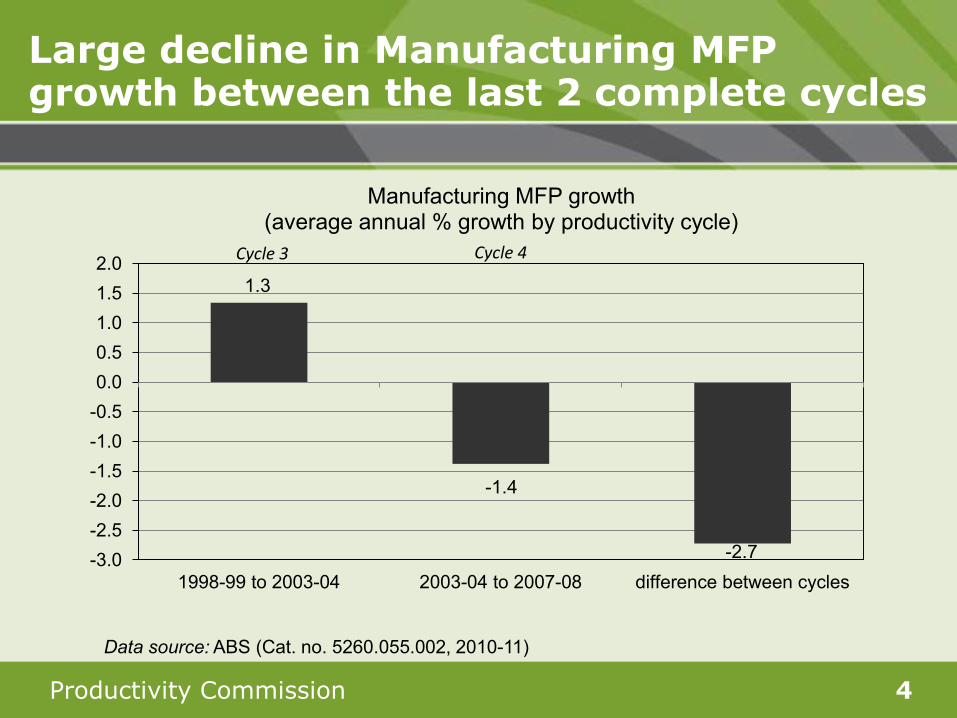
Large decline in Manufacturing MFP growth between the last 2 complete cycles
Data source: ABS (Cat. no. 5260.055.002, 2010-11)
-3.0-2.5-2.0-1.5-1.0-0.50.00.51.01.52.0
1998-99 to 2003-04 2003-04 to 2007-08 difference between cycles
Manufacturing MFP growth (average annual % growth by productivity cycle)
Cycle 3 Cycle 4
1.3
-1.4
-2.7

Productivity Commission 5
Less negative MFP growth in the incomplete period
Data source: ABS (Cat. no. 5260.055.002, 2010-11)
-3.0-2.5-2.0-1.5-1.0-0.50.00.51.01.52.0
2003-04 to 2007-08 2007-08 to 2010-11 difference between periods
Manufacturing MFP growth (average annual % growth by productivity cycle)
Cycle 4 Incomplete cycle
-1.4 -0.8
0.6
Productivity Commission 6
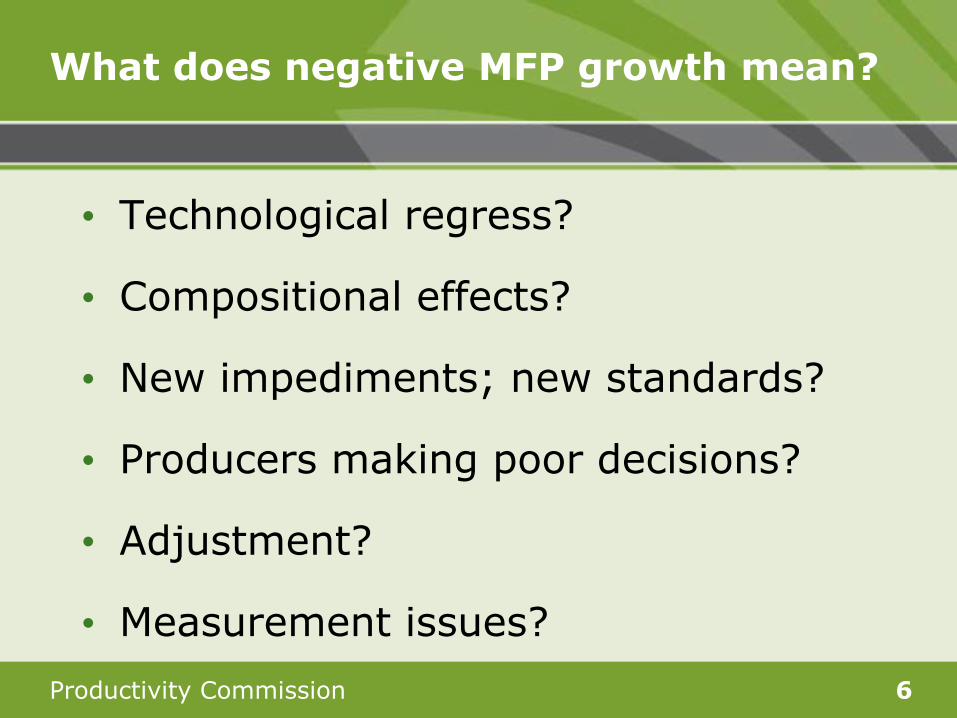
What does negative MFP growth mean?
• Technological regress?
• Compositional effects?
• New impediments; new standards?
• Producers making poor decisions?
• Adjustment?
• Measurement issues?
Productivity Commission 7
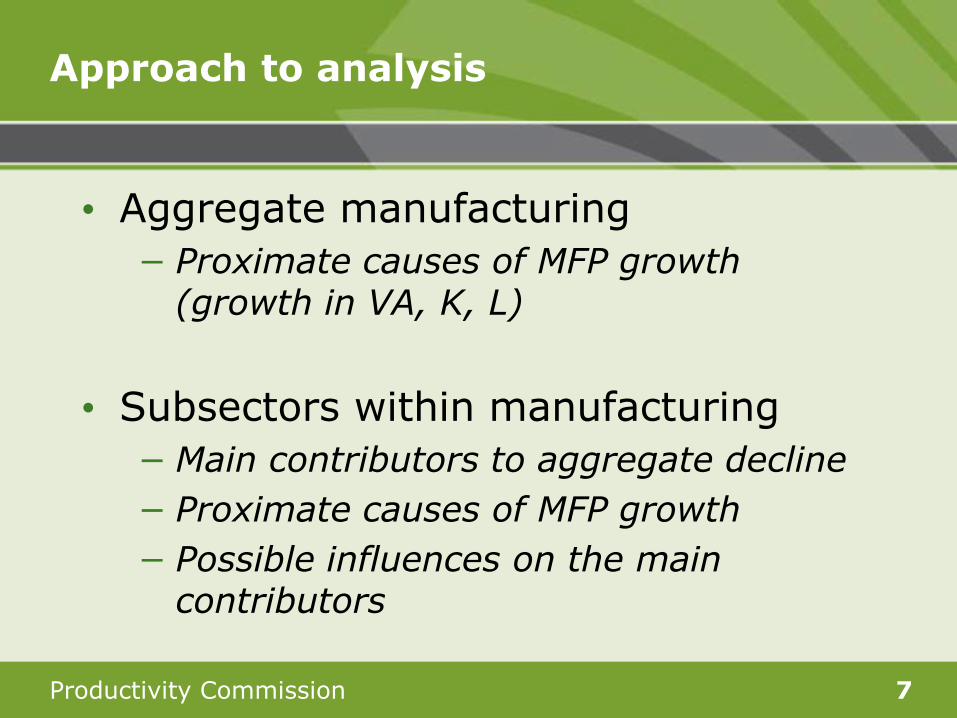
Approach to analysis
• Aggregate manufacturing − Proximate causes of MFP growth
(growth in VA, K, L)
• Subsectors within manufacturing − Main contributors to aggregate decline − Proximate causes of MFP growth − Possible influences on the main
contributors

Productivity Commission 8
Proximate causes of the MFP growth decline in manufacturing
Data source: ABS (Cat. no. 5260.055.002, 2010-11)
-3.0
-2.0
-1.0
0.0
1.0
2.0
3.0
1998-99 to 2003-04 2003-04 to 2007-08 Difference between thecycles
Value added growth Weighted hours worked growthWeighted capital services growth MFP growth
Cycle 3 Cycle 4
Growth in VA, inputs and MFP (average annual % growth by productivity cycle)
Productivity Commission 9
Subsector MFP estimates
• Manufacturing divided into 8 subsectors (still diverse in activities) • Food, beverage & tobacco products (FBT) • Textile, clothing & other mfg (TCO) • Wood & paper products (WP) • Printing & recorded media (PRM) • Petroleum, coal, chemical & rubber products (PCCR) • Non-metallic mineral products (NM) • Metal products (MP) • Machinery & equipment mfg (ME)
• Data and methodological limitations

Productivity Commission 10
… how does MFP growth vary across subsectors?
-6.0 -4.0 -2.0 0.0 2.0 4.0 6.0 8.0
Food, beverage & tobacco products (FBT)
Petroleum, coal, chemical & rubber products (PCCR)
Printing & recorded media (PRM)
Textile, clothing & other manufacturing (TCO)
Wood & paper products (WP)
Metal products (MP)
Machinery & equipment manufacturing (ME)
Non-metallic mineral products (NM)
Total manufacturing - ABS
Cycle 3: 1998-99 to 2003-04 Cycle 4: 2003-04 to 2007-08
% per year
Data source: Authors’ subsector estimates (preliminary); Total manufacturing ABS (Cat. no. 5260.055.002, 2010-11)

Productivity Commission 11
Change in subsector MFP growth between cycles 3 and 4
-9.3
-4.7
-4.1
-3.7
-2.7
-2.3
-1.8
-1.4
-0.1
-10 -9 -8 -7 -6 -5 -4 -3 -2 -1 0
Printing & recorded media
Petroleum, coal, chemical & rubber products
Textile, clothing & other manufacturing
Food, beverage & tobacco products
Total manufacturing (ABS)
Metal products
Machinery & equipment manufacturing
Non-metallic mineral products
Wood & paper products
Change in average annual % growth
Data source: Authors’ subsector estimates (preliminary); Total manufacturing ABS (Cat. no. 5260.055.002, 2010-11)

Productivity Commission 12
Manufacturing subsector sizes (Shares of gross value added at basic prices 2009-10)
Data source: ABS (5204.0, 2010-11)
Food, beverage and tobacco products
22%
Metal products 20%
Machinery and equipment 18%
Petroleum, coal, chemical and rubber
products 17%
Wood and paper products 7%
Textile, clothing and other manufacturing
7%
Non-metallic mineral products 5%
Printing and recorded media 4%
Productivity Commission 13
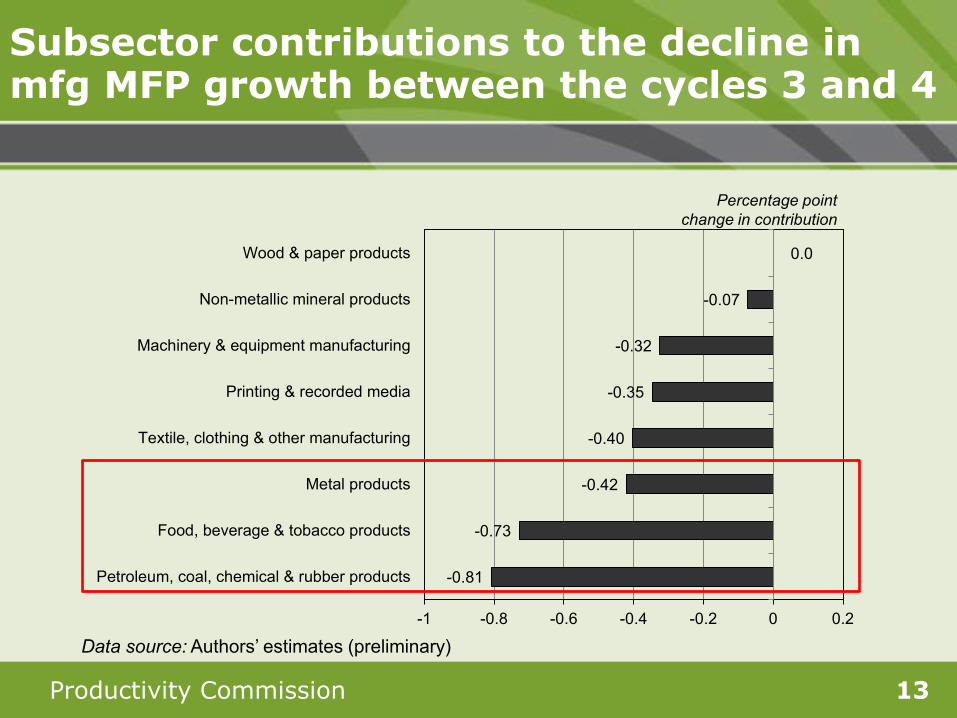
Subsector contributions to the decline in mfg MFP growth between the cycles 3 and 4
Data source: Authors’ estimates (preliminary)
-0.81
-0.73
-0.42
-0.40
-0.35
-0.32
-0.07
0.0
-1 -0.8 -0.6 -0.4 -0.2 0 0.2
Petroleum, coal, chemical & rubber products
Food, beverage & tobacco products
Metal products
Textile, clothing & other manufacturing
Printing & recorded media
Machinery & equipment manufacturing
Non-metallic mineral products
Wood & paper products
Percentage point change in contribution
Productivity Commission 14
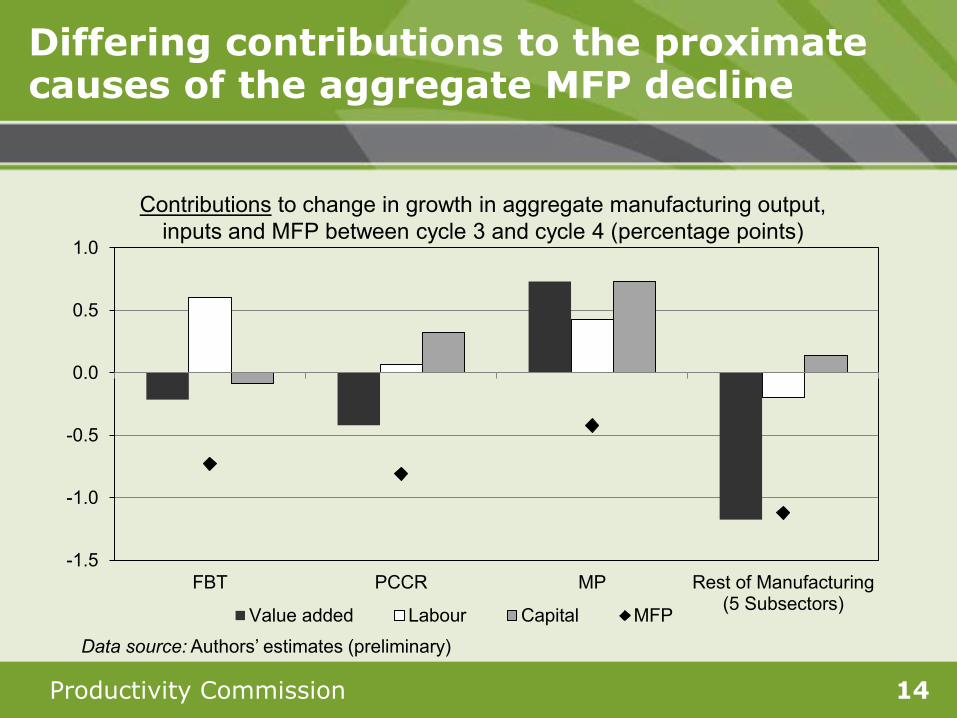
Differing contributions to the proximate causes of the aggregate MFP decline
Data source: Authors’ estimates (preliminary)
-1.5
-1.0
-0.5
0.0
0.5
1.0
FBT PCCR MP Rest of Manufacturing(5 Subsectors)Value added Labour Capital MFP
Contributions to change in growth in aggregate manufacturing output, inputs and MFP between cycle 3 and cycle 4 (percentage points)

Productivity Commission 15
Metal products (MP)
Data source: Authors’ estimates (preliminary) based on ABS data
-5
-4
-3
-2
-1
0
1
2
3
4
5
1998-99 to 2003-04 2003-04 to 2007-08 Difference between the cycles
value added growth weighted hours worked growthweighted capital services growth MFP growth
% per year
Cycle 3 Cycle 4
Productivity Commission 16
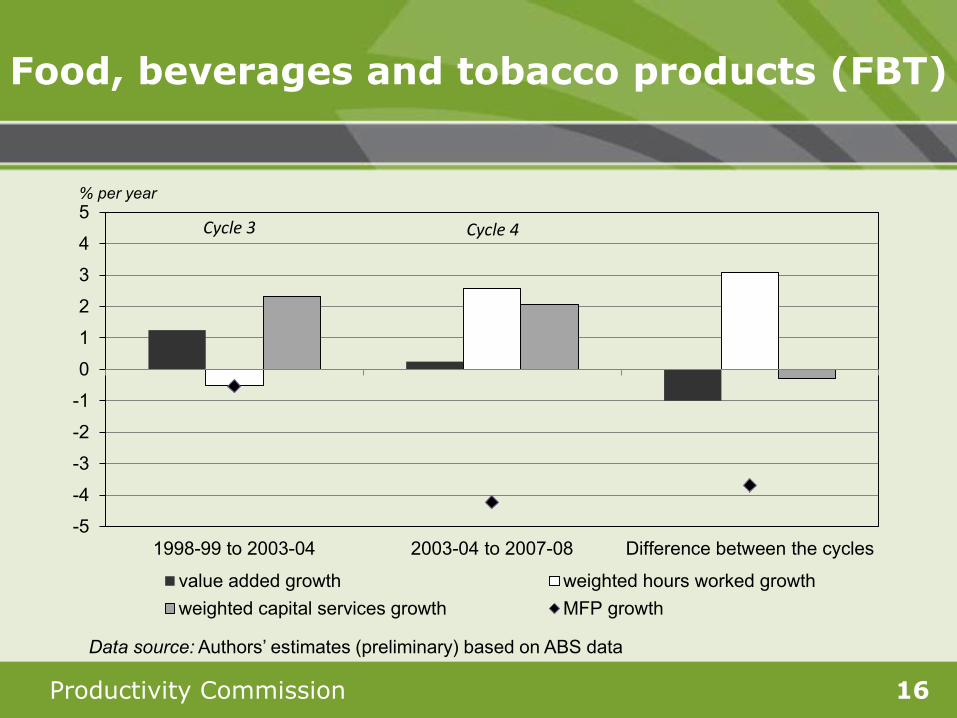
Food, beverages and tobacco products (FBT)
Data source: Authors’ estimates (preliminary) based on ABS data
-5
-4
-3
-2
-1
0
1
2
3
4
5
1998-99 to 2003-04 2003-04 to 2007-08 Difference between the cycles
value added growth weighted hours worked growthweighted capital services growth MFP growth
% per year
Cycle 3 Cycle 4

Productivity Commission 17
Petroleum, coal, chemicals, and rubber products (PCCR)
Data source: Authors’ estimates (preliminary) based on ABS data
-5
-4
-3
-2
-1
0
1
2
3
4
5
1998-99 to 2003-04 2003-04 to 2007-08 Difference between the cyclesvalue added growth weighted hours worked growthweighted capital services growth MFP growth
% per year
Cycle 3 Cycle 4
Productivity Commission 18
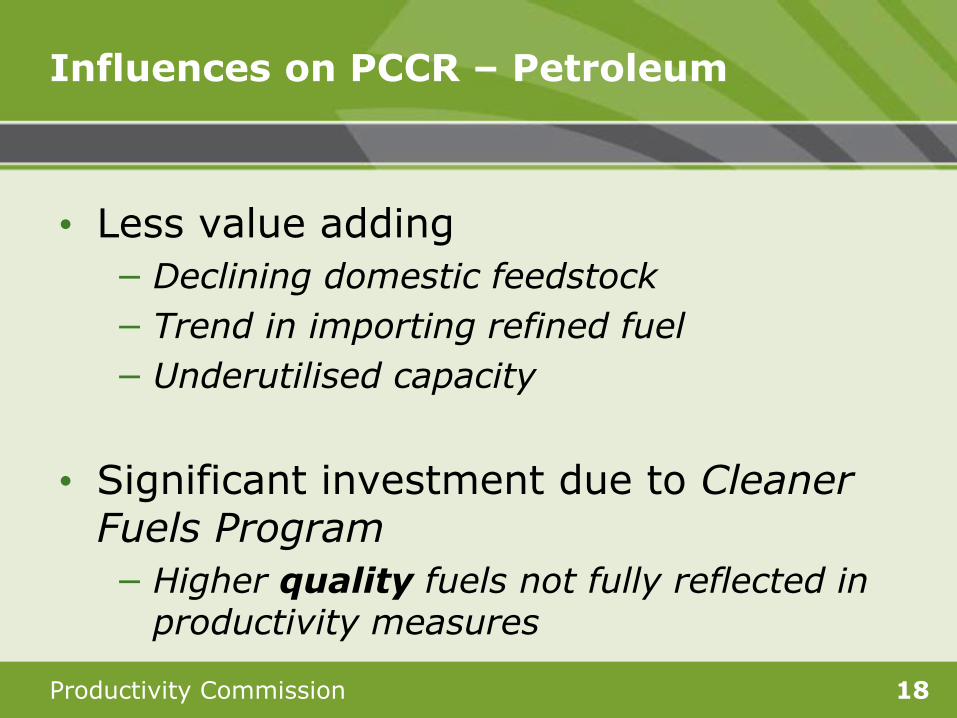
• Less value adding − Declining domestic feedstock − Trend in importing refined fuel − Underutilised capacity
• Significant investment due to Cleaner
Fuels Program − Higher quality fuels not fully reflected in
productivity measures
Influences on PCCR – Petroleum

Productivity Commission 19
• Diverse subdivision − Including plastics, paints, foam rubber,
adhesives and tyres
• Mixed influences − Greater import competition in plastics and
tyres − Increased demand from construction
‘boom’
Influences on PCCR – Polymers and rubber
Productivity Commission 20
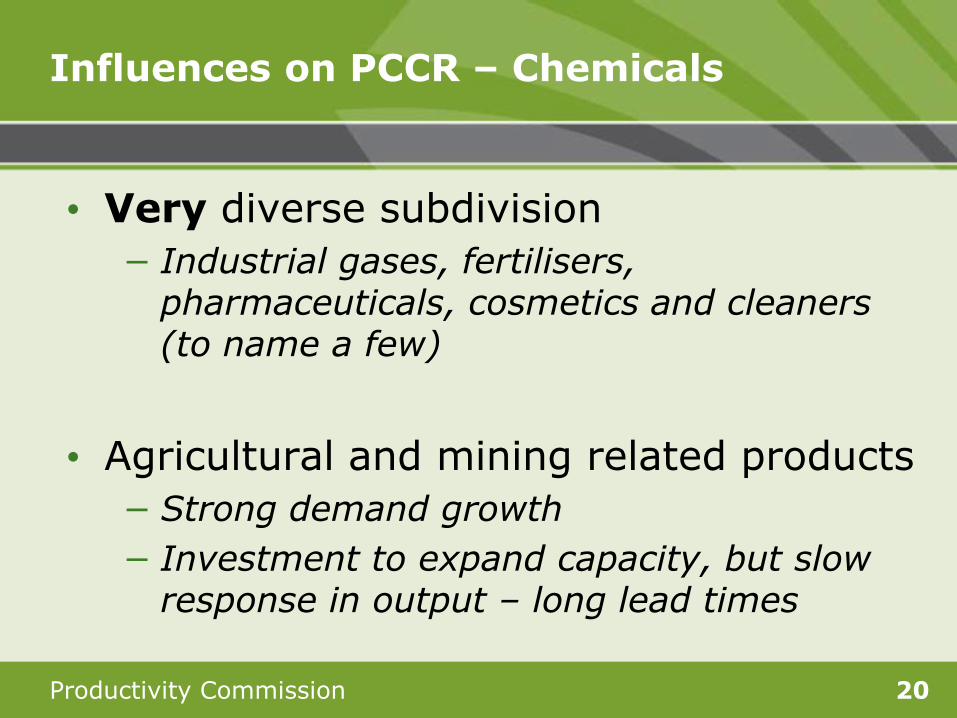
• Very diverse subdivision − Industrial gases, fertilisers,
pharmaceuticals, cosmetics and cleaners (to name a few)
• Agricultural and mining related products
− Strong demand growth − Investment to expand capacity, but slow
response in output – long lead times
Influences on PCCR – Chemicals
Productivity Commission 21
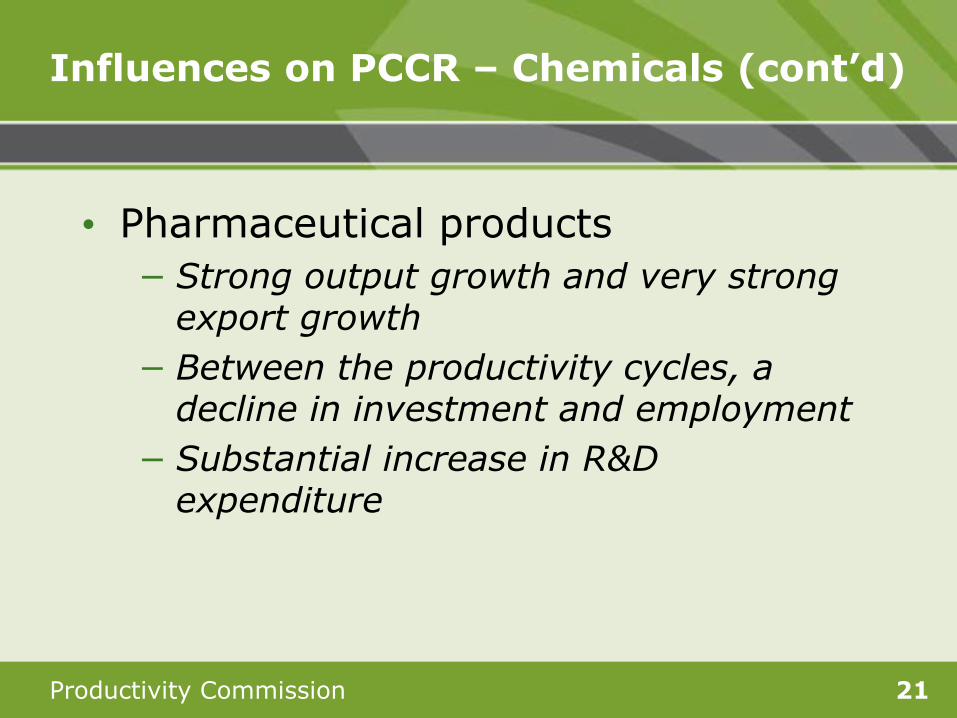
• Pharmaceutical products − Strong output growth and very strong
export growth − Between the productivity cycles, a
decline in investment and employment − Substantial increase in R&D
expenditure
Influences on PCCR – Chemicals (cont’d)
Productivity Commission 22
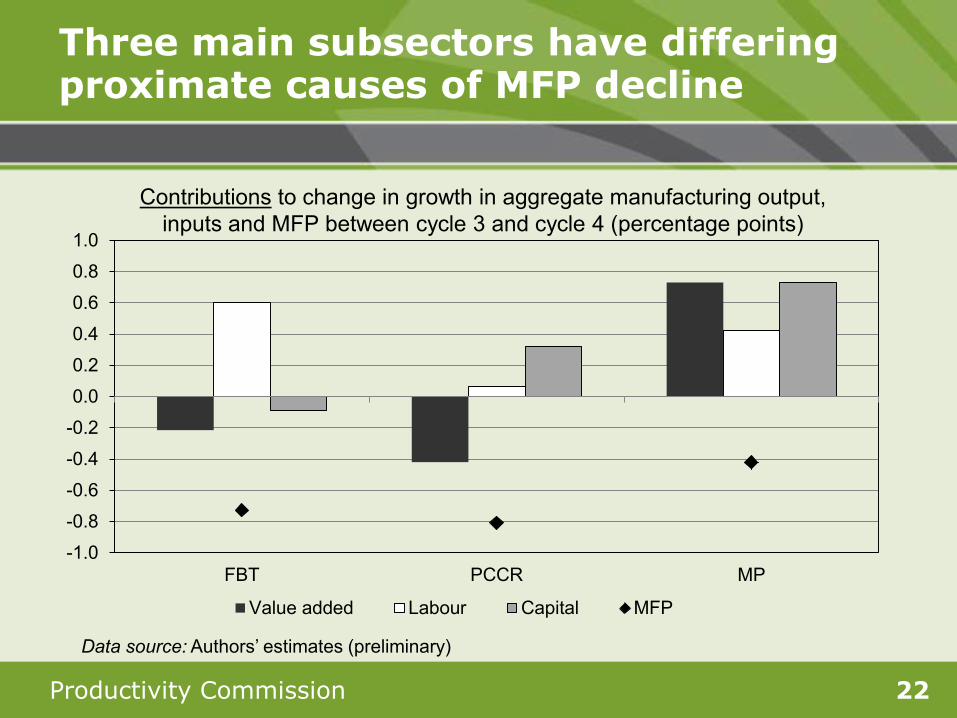
Three main subsectors have differing proximate causes of MFP decline
Data source: Authors’ estimates (preliminary)
-1.0
-0.8
-0.6
-0.4
-0.2
0.0
0.2
0.4
0.6
0.8
1.0
FBT PCCR MP
Value added Labour Capital MFP
Contributions to change in growth in aggregate manufacturing output, inputs and MFP between cycle 3 and cycle 4 (percentage points)

Productivity Commission 23
Summary and ongoing research
• Summary − Diversity − Multiple influences
• Ongoing research
− Further work on influences − Linking the disaggregated picture with
the aggregate estimates
Related Documents


