Achieving high performance through shared services Lessons from the masters

Welcome message from author
This document is posted to help you gain knowledge. Please leave a comment to let me know what you think about it! Share it to your friends and learn new things together.
Transcript
Achieving high performance through shared services
Lessons from the masters

2
IntroductionWhether run as an insourced or outsourced
solution for common service delivery, shared
services as a business model is here to stay.
For several decades now, shared services has
delivered impressive results for companies in
terms of cost, quality, productivity, customer
service and other key business metrics.
Organizations have already seen that shared
services works.
Now, Accenture’s 2009 global shared services
study, Achieving high performance through shared services: Lessons from the masters, shows that demand for expanding shared
services’ scope and geographic reach has
truly exploded.
3
More than half of our survey
respondents operate shared services
organizations with global reach, and
seven out of 10 plan to expand the
geographic coverage of their shared
services organization within the next
three years. Fueled in large part by the
ailing global economy, which not only
keeps cost reductions a top priority
but also spurs organizations to look
for additional value from existing
investments, high performance
through shared services has become
even more important. Shared services
is a critical enabler of businesses’
survival during the downturn through
its dual focus on effi ciency (primarily
through economies of scale and skill)
and effectiveness (allowing management
to focus on business issues; sharing
information, best practice and resources
across the business; and bringing value
drivers beyond productivity—such as
customer service, business agility
and support for new capabilities—
to the fore).
Yet for all the benefi ts shared services
has delivered and could potentially
deliver, it is certainly possible to build
a bad solution. Shared services’ history
has its fair share of attempts that have
fallen by the wayside.
That a signifi cant number of shared
services organizations never live up to
expectations should not surprise
anyone familiar with the model’s
complexity. Shared-service centers
face a number of challenges once the
actual migrations are over, including
stabilizing the service after the go-live
date, establishing a service culture
(and not just a transaction-processing
culture) quickly, creating compelling
shared services career paths and
building continuous improvement with
material results, regardless of how the
external environment changes.
Longer-term, shared services leaders
must continue to deliver on the
promise of their original business case,
achieving and maintaining the balance
between scope, cost and service quality,
and turning shared services into a
true strategic enabler by extending
the scope into more insight-based
activities.
Shared services masters are succeeding
in these objectives. Not only have
they moved more functions to be
performed through shared services,
their shared services are meeting their
expectations better than we see in
most other organizations. Given the
heightened importance of shared
services today, what can be learned
from these masters?
Achieving high performance through shared services: Lessons from the masters attempts to answer this question.
Accenture undertook a global, cross-
industry study of more than 275
executives with responsibility for
shared services in their organizations
to identify trends, priorities, issues
and opportunities in shared services
today. We sought to identify what
characteristics mark those companies
that have been extraordinarily
successful in their use of shared
services—to provide a snapshot of
shared services mastery. In addition,
we aimed to provide a look to the
future of shared services and how
it will differ from today. (See sidebar,
Our research methodology in brief.)
Successful shared services take
nurturing, as those that excel at
shared services know well. Essentially,
these shared services masters operate
in accordance with the principle that
for shared services to contribute to
high performance in business, they
essentially must be run as high-
performance businesses themselves.
4
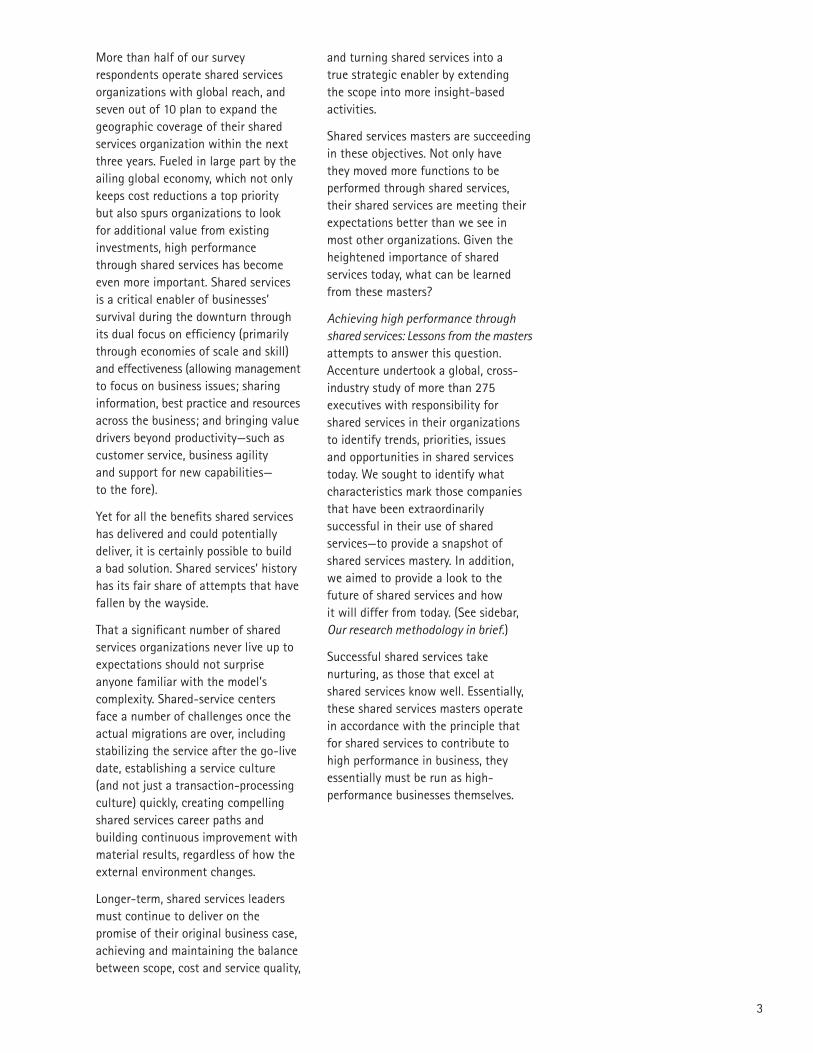
Accenture’s extensive and ongoing
research program into what defi nes
high performance began in 2003.
Since that time, we have studied
more than 6,000 companies, including
more than 500 that meet our criteria
as high performers. What we have
learned is that high performance is
defi nable, quantifi able—and achievable.
High-performance businesses
effectively balance current needs and
future opportunities. They consistently
outperform peers in revenue growth,
profi tability and total return to
shareholders. And they sustain their
superiority across time, business cycles,
industry disruptions and changes in
leadership.
How they do it is through a combination
of the right market focus and position,
the right capabilities and the right
performance anatomy. These elements
combine into a framework that gives
the organization growth, profi tability,
longevity, consistency and positioning
for the future. (See Figure 1.)
A shared framework for high performance
Figure 1. The Accenture framework for high performance
Greater than
expected returns
from investments
Continued value
creation over
industry eras and
life cycles
Reliable and
predictable
performance
Top line
revenue
growth
Higher future value growth
Profita
bility
Growth
Longevity
Cons
isten
cy
Positioning for the future
Peer competitiveness
High PerformanceBusiness
Shared services that achieve high
performance share this same framework.
From a profi tability perspective, they
lead to a dramatically lower-cost
operating model for the parent
organization. From a longevity
perspective, shared services brings
sustainable traction not achievable
through reengineering alone. Shared
services’ contracted service agreements
and measurable service predictability
yield consistency, while shared services’
ability to accommodate volume changes
without an equivalent increase in cost
foster growth. Finally, shared services’
ability to adapt to changing business
environment and goals give the
organization using shared services a
platform for strong future positioning.
From our research, we found that
shared services masters operate within
this framework for high performance.
They stand apart from other
organizations operating shared services
models in that their shared services
themselves are organized and operated
as entities on par with the operating
units served. Their actions contribute
to growth, profi tability, longevity,
consistency and/or positioning for the
future. An elite group of our survey
respondents (less than 10 percent)
demonstrated shared services mastery—
showing an unmistakable ability to
use the operating models, workforce
management techniques, technologies
and industry-recognized best practices
to achieve the ambitious objectives
they set with much greater frequency
than other respondents.
More specifi cally, we found:
1. The masters view shared services as
high-performance businesses in their
own right and craft their shared
services strategy and investment plans
accordingly.
2. Shared services masters demonstrate
a superior ability to target and secure
their objectives.
3. Shared services masters understand
the value of different sourcing models
and are far more likely than others to
deploy these models in combination
to achieve business resilience.
4. While the majority of respondents
rank talent management as one of the
most signifi cant criteria for success,
the masters are more likely to take
defi nitive steps to build the workforce
they need.
5. Shared services masters judiciously
invest in the shared services best
practices and technology tools that
will sustain lower cost over time.
In the sections that follow, we discuss
each of these fi ndings in more detail
and use the framework for high
performance to articulate what
Accenture believes is coming next in
the future of shared services.
Our research methodology in brief
We conducted an online survey of more than 275 respondents
between November 2008 and February 2009. Respondents were those
with responsibility for managing the shared services organizations at
their companies—directors, vice presidents and other executives.
These executives came from companies in more than 20 industries
operating in North America, Central America, South America, Western
Europe, the Middle East, Asia and the South Pacifi c. Sixty percent of
the organizations report revenues in excess of $5 billion. Our research
was supplemented by an extensive literature review, as well as by
Accenture’s own extensive experience on more than 500 shared
services implementations worldwide over the last 20 years.
5
6
Despite the challenges to making shared
services successful, a few organizations
consistently shine. These are the
shared services masters—organizations
that have turned their shared services
operations into high-performance
businesses in and of themselves. For
these masters, shared services has
moved beyond a vehicle for mere
transaction processing and has become
a core element of their overall strategies
for growth.
Interestingly, what defi nes these masters
is not who they are, but how they
behave. A look at the shared services
masters as determined by our survey
reveals no commonalities based on the
parent organizations’ size, revenue,
industry or geographic location.
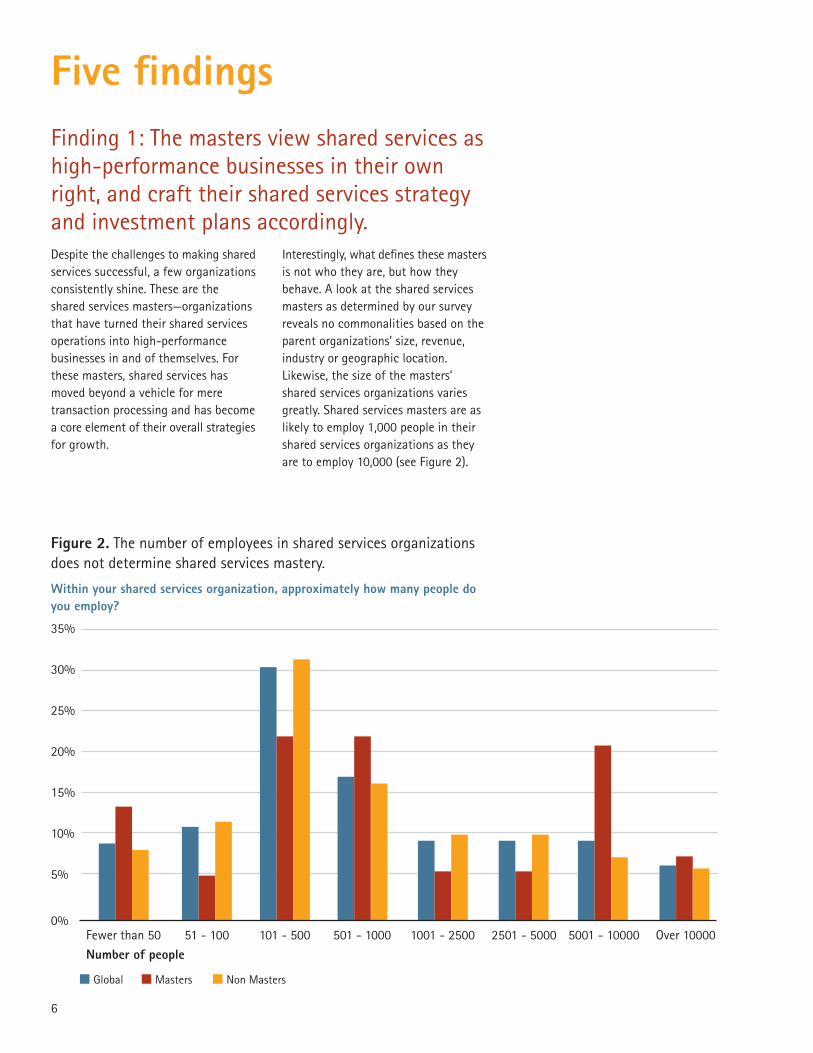
Likewise, the size of the masters’
shared services organizations varies
greatly. Shared services masters are as
likely to employ 1,000 people in their
shared services organizations as they
are to employ 10,000 (see Figure 2).
Five fi ndingsFinding 1: The masters view shared services as
high-performance businesses in their own
right, and craft their shared services strategy
and investment plans accordingly.
Figure 2. The number of employees in shared services organizations
does not determine shared services mastery.
35%
30%
25%
20%
15%
10%
5%
0%Fewer than 50
Number of people51 - 100 101 - 500 501 - 1000 1001 - 2500 2501 - 5000 5001 - 10000 Over 10000
Global Masters Non Masters
Within your shared services organization, approximately how many people do you employ?

7
What the masters do share however
is an identifi able enthusiasm for the
shared services model. Masters are set
apart fi rst and foremost by the extent
to which they have embraced shared
services. Shared services masters are old
pros; they are much more likely to be
seasoned veterans at running shared
services when compared to their
counterparts. Thirty-fi ve percent of the
masters have been running their shared
services model for more than 10 years,
versus 20 percent of the other survey
respondents. Additionally, while
approximately 15 percent of the other
respondents had fewer than three years’
experience running their shared services
organizations, none of the shared
services masters did. Perhaps it’s not
surprising that when it comes to
mastery, experience matters.
These longevity statistics also
demonstrate the masters’ dedication
to the shared services model. They are
committed to shared services, and what
we see through our research is that
they are now pushing the boundaries of
the quantities and types of services they
want their shared services to deliver.
First, shared services masters operate
more shared services centers than their
counterparts. More than 60 percent of
the masters (as compared to 35 percent
of the others) operate fi ve or more
shared services centers. Additionally, the
masters’ shared services operations are
more likely to have global reach. In fact,
the number of masters having global
and regional, as well as national, shared
services coverage is three times that of
the other respondents. (See Figure 3.)
Figure 3. Shared services masters are three times more likely than
other respondents to have shared services operations that offer
national, regional and global coverage.
70%
80%
60%
50%
40%
30%
20%
10%
0%
National Regional Global All
Geographic coverage of the shared services organization
Global Masters Non Masters
What broad geographical areas does your shared services organization cover?
8
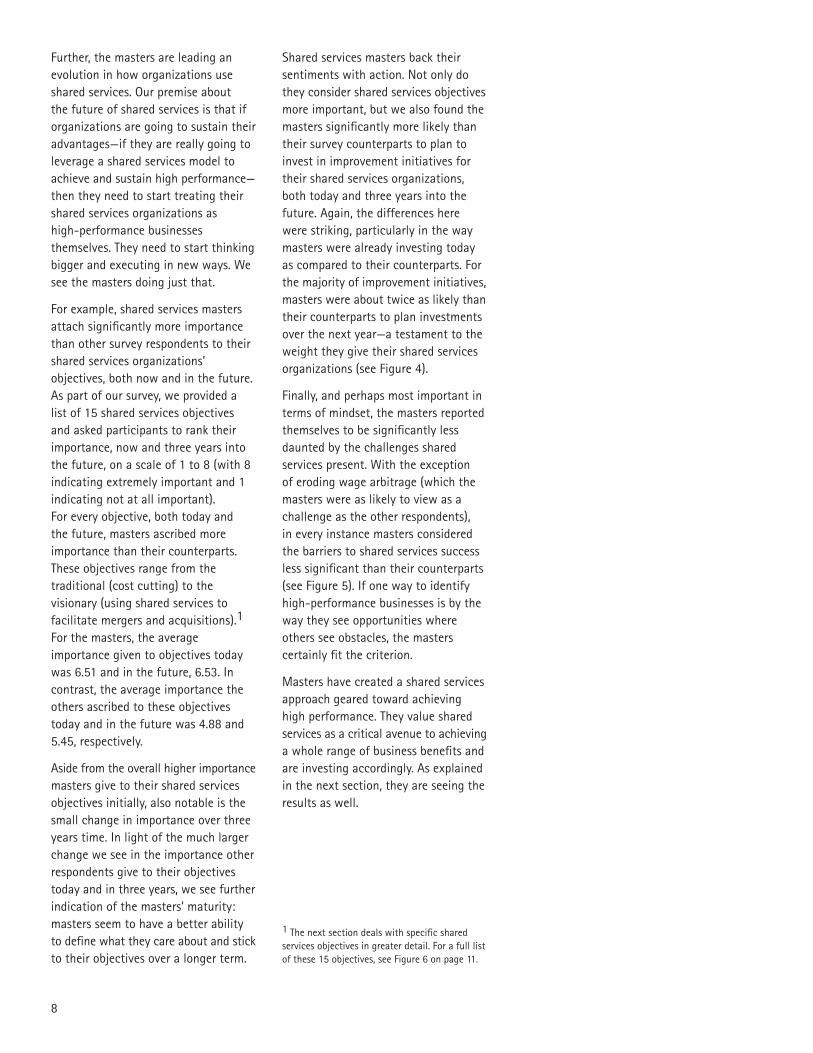
Further, the masters are leading an
evolution in how organizations use
shared services. Our premise about
the future of shared services is that if
organizations are going to sustain their
advantages—if they are really going to
leverage a shared services model to
achieve and sustain high performance—
then they need to start treating their
shared services organizations as
high-performance businesses
themselves. They need to start thinking
bigger and executing in new ways. We
see the masters doing just that.
For example, shared services masters
attach signifi cantly more importance
than other survey respondents to their
shared services organizations’
objectives, both now and in the future.
As part of our survey, we provided a
list of 15 shared services objectives
and asked participants to rank their
importance, now and three years into
the future, on a scale of 1 to 8 (with 8
indicating extremely important and 1
indicating not at all important).
For every objective, both today and
the future, masters ascribed more
importance than their counterparts.
These objectives range from the
traditional (cost cutting) to the
visionary (using shared services to
facilitate mergers and acquisitions).1
For the masters, the average
importance given to objectives today
was 6.51 and in the future, 6.53. In
contrast, the average importance the
others ascribed to these objectives
today and in the future was 4.88 and
5.45, respectively.
Aside from the overall higher importance
masters give to their shared services
objectives initially, also notable is the
small change in importance over three
years time. In light of the much larger
change we see in the importance other
respondents give to their objectives
today and in three years, we see further
indication of the masters’ maturity:
masters seem to have a better ability
to defi ne what they care about and stick
to their objectives over a longer term.
Shared services masters back their
sentiments with action. Not only do
they consider shared services objectives
more important, but we also found the
masters signifi cantly more likely than
their survey counterparts to plan to
invest in improvement initiatives for
their shared services organizations,
both today and three years into the
future. Again, the differences here
were striking, particularly in the way
masters were already investing today
as compared to their counterparts. For
the majority of improvement initiatives,
masters were about twice as likely than
their counterparts to plan investments
over the next year—a testament to the
weight they give their shared services
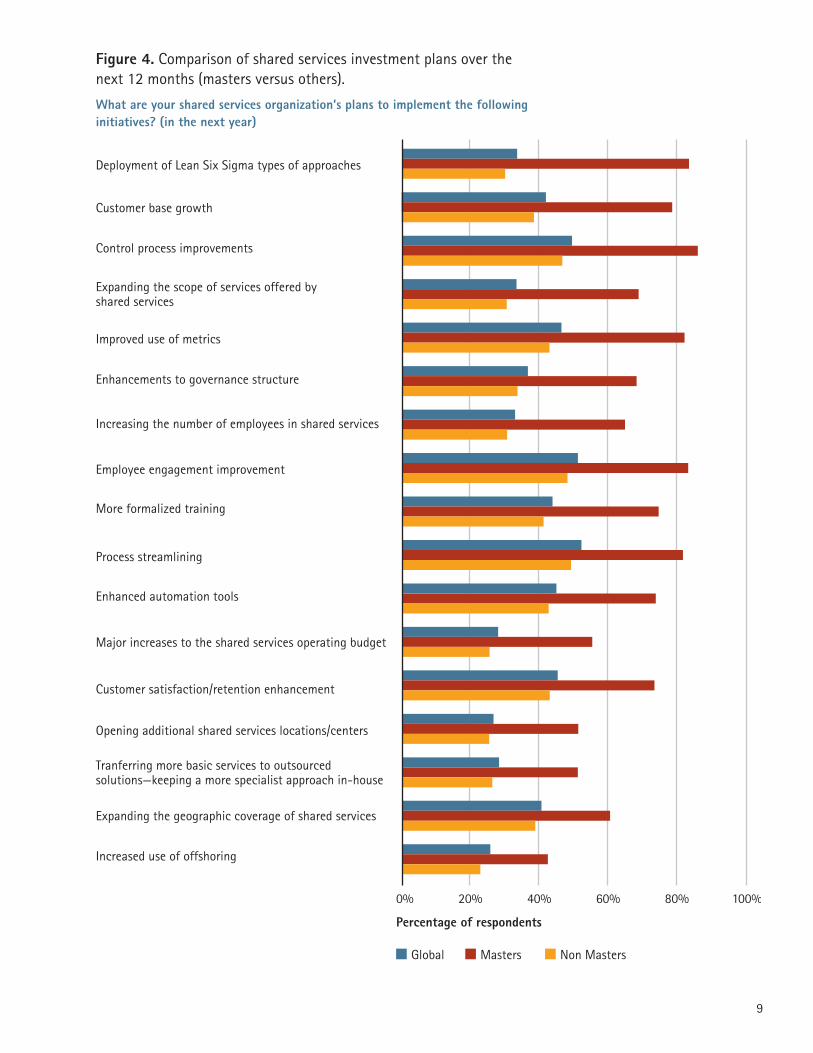
organizations (see Figure 4).
Finally, and perhaps most important in
terms of mindset, the masters reported
themselves to be signifi cantly less
daunted by the challenges shared
services present. With the exception
of eroding wage arbitrage (which the
masters were as likely to view as a
challenge as the other respondents),
in every instance masters considered
the barriers to shared services success
less signifi cant than their counterparts
(see Figure 5). If one way to identify
high-performance businesses is by the
way they see opportunities where
others see obstacles, the masters
certainly fi t the criterion.
Masters have created a shared services
approach geared toward achieving
high performance. They value shared
services as a critical avenue to achieving
a whole range of business benefi ts and
are investing accordingly. As explained
in the next section, they are seeing the
results as well.
1 The next section deals with specifi c shared
services objectives in greater detail. For a full list
of these 15 objectives, see Figure 6 on page 11.
9
Figure 4. Comparison of shared services investment plans over the
next 12 months (masters versus others).
What are your shared services organization’s plans to implement the following initiatives? (in the next year)
Deployment of Lean Six Sigma types of approaches
Customer base growth
Control process improvements
Improved use of metrics
Enhancements to governance structure
Increasing the number of employees in shared services
Employee engagement improvement
More formalized training
Process streamlining
Enhanced automation tools
Customer satisfaction/retention enhancement
Opening additional shared services locations/centers
Major increases to the shared services operating budget
Tranferring more basic services to outsourcedsolutions—keeping a more specialist approach in-house
Expanding the geographic coverage of shared services
Increased use of offshoring
Expanding the scope of services offered by shared services
Percentage of respondents
Global Masters Non Masters
0% 20% 40% 60% 80% 100%

10
Figure 5. Comparison of attitudes toward signifi cance of barriers to
shared services success today (masters versus others).
Please indicate to what degree you feel that each of the following issues are barriers to the success of your shared services organization today.
6 7
Eroding wage arbitrage
Availability of skilled employees
Regulatory limits
Insufficient staffing
Lack of customer data/customer insight
Poor governance structure
Ability to retain the best talent
Change resistance
Low employee morale
Limited operating budgets
Shifting agendas/goal/targets
Cultural differences across geographies
Limited availability of accurate metrics
Staying relevant
Ability to attract the best talent
IT challenges/issues
Lack of vision and support from executive leadership
Insufficient levels of standardization
Employee language skills
Not a barrier at all Significant barrier
Global Masters Non Masters
4 51 2 3

11
Figure 6. A comparison of the importance given to 15 shared services
objectives, both now and in the future, and respondents’ performance
against these objectives.
Comparison between the importance given to objectives today and in three years.
7
0.01Facilitate mergers and acquisitions integration
Support new business process capabilities
Enhance focus on business unit operations vs. back office processing
Reduce cost through wage and labor arbitrage
Increase productivity of internal customers
Concentrate resources on core higher value activities
Facilitate the deployment of technology and secure ROI
Meet process excellence targets
Increase service quality to the shared services organization customers
Better response to organizational changes
Rationalize the company’s operating model
Reduce costs through simplification and standardization
Align the organization on the common objectives
Attract and retain the best talent
Meeting internal customer satisfaction expectations
0.05
0.16
0.31
0.32
0.39
0.43
0.49
0.51
0.51
0.52
0.59
0.65
0.96
0.16
6543210
Difference between performance against
objectives and importance of objectives
4.465.09 4.45
4.645.34 4.58
4.745.36 4.58
4.695.07 4.53
5.045.51 4.74
5.005.74 4.68
4.995.51
4.59
5.025.61
4.59
5.235.65
4.74
5.165.63
4.65
5.195.55
4.68
5.385.79
4.85
5.165.65
4.57
5.115.66
4.45
5.545.99
4.58
Importance today
Importance in three years
Current performance against objectives
Not at all important Extremely important
Current performance against objectives
As well as asking survey respondents
to rate the importance of 15 shared
services objectives, we also asked them
to rate their performance against these
objectives. Interestingly, across all 15
areas, we saw a gap in how important
the objectives were rated and how well
our respondents believed they had
actually achieved them (see Figure 6).
Finding 2: Shared services masters
demonstrate a superior ability to target and
secure their objectives.
12
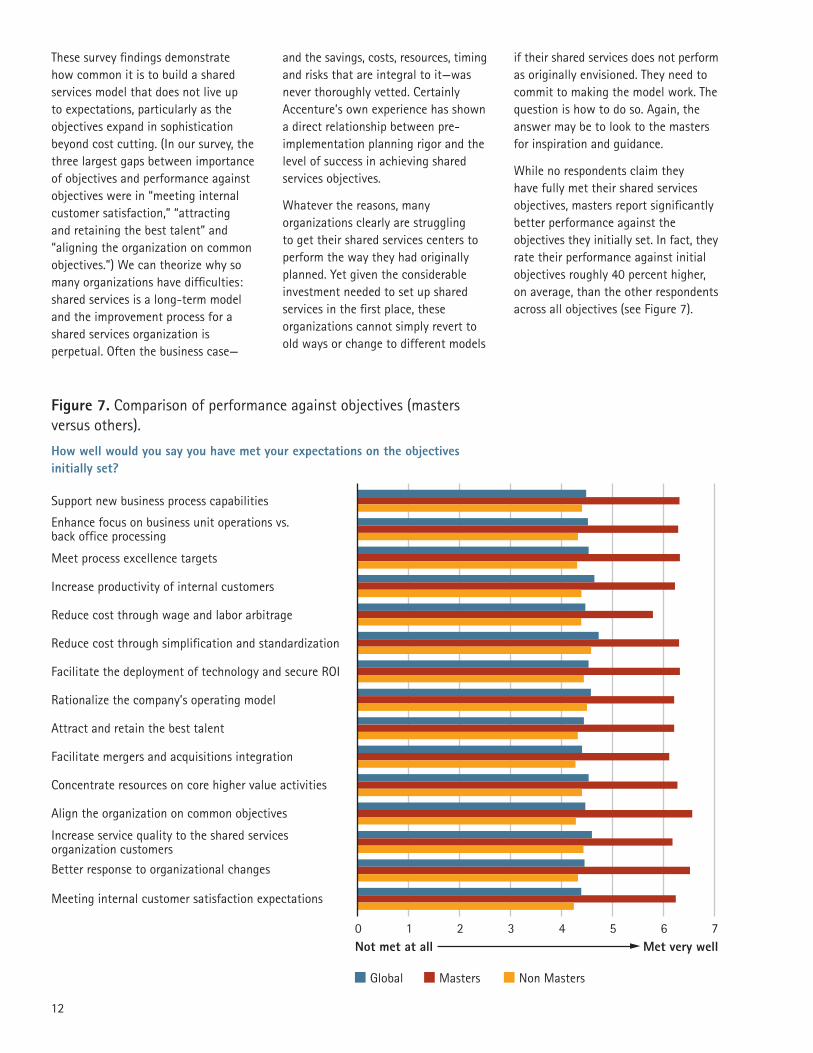
These survey fi ndings demonstrate
how common it is to build a shared
services model that does not live up
to expectations, particularly as the
objectives expand in sophistication
beyond cost cutting. (In our survey, the
three largest gaps between importance
of objectives and performance against
objectives were in “meeting internal
customer satisfaction,” “attracting
and retaining the best talent” and
“aligning the organization on common
objectives.”) We can theorize why so
many organizations have diffi culties:
shared services is a long-term model
and the improvement process for a
shared services organization is
perpetual. Often the business case—
and the savings, costs, resources, timing
and risks that are integral to it—was
never thoroughly vetted. Certainly
Accenture’s own experience has shown
a direct relationship between pre-
implementation planning rigor and the
level of success in achieving shared
services objectives.
Whatever the reasons, many
organizations clearly are struggling
to get their shared services centers to
perform the way they had originally
planned. Yet given the considerable
investment needed to set up shared
services in the fi rst place, these
organizations cannot simply revert to
old ways or change to different models
if their shared services does not perform
as originally envisioned. They need to
commit to making the model work. The
question is how to do so. Again, the
answer may be to look to the masters
for inspiration and guidance.
While no respondents claim they
have fully met their shared services
objectives, masters report signifi cantly
better performance against the
objectives they initially set. In fact, they
rate their performance against initial
objectives roughly 40 percent higher,
on average, than the other respondents
across all objectives (see Figure 7).
Figure 7. Comparison of performance against objectives (masters
versus others).
How well would you say you have met your expectations on the objectives initially set?
Support new business process capabilities
Enhance focus on business unit operations vs. back office processing
Meet process excellence targets
Reduce cost through wage and labor arbitrage
Reduce cost through simplification and standardization
Facilitate the deployment of technology and secure ROI
Rationalize the company’s operating model
Attract and retain the best talent
Facilitate mergers and acquisitions integration
Concentrate resources on core higher value activities
Increase service quality to the shared services organization customers
Better response to organizational changes
Align the organization on common objectives
Meeting internal customer satisfaction expectations
Increase productivity of internal customers
Global Masters Non Masters
10 2 3 4 5 6 7
Not met at all Met very well

13
While these results could speak to the
masters’ greater experience (we noted
earlier that as a group, masters tend
to have been running shared services
organizations longer), we also believe
other factors are at play. First, masters
seem to recognize the importance of
retaining key leaders. The percentage
of masters reporting that their shared
services leadership had been in place six
or more years was approximately double
the other respondents (65 percent
versus 33 percent). Ample research
performed by Accenture and other
organizations has demonstrated the
criticality of effective leadership to
effective shared services. We will not
duplicate what has been written on
the topic of shared services leadership
here, other than to reiterate that shared
services works best when leadership is
consistent over time.
In addition, our research shows
masters are working all the structural
levers in unison: they have focused
considerable energy on getting their
shared services operating models,
workforce models, best practices and
technologies right. (The sections that
follow go into greater detail about
each of these important elements and
what masters are doing in each case
that sets them apart.) The masters’
profi ciency in the shared services
fundamentals has given them an edge
in securing their original objectives.
The question is whether mastery of the
fundamentals will be enough to secure
future objectives. Our survey fi ndings
indicate that as their shared services
centers mature, organizations across
the board are starting to want more
from their shared services organizations,
in terms of both cost reductions and
scope increases. These increased
expectations are again likely due at
least in part to the current global
fi nancial situation: More than 50 percent
of respondents in the survey believe
the recent economic uncertainty has
signifi cantly infl uenced them to expand
and/or further leverage the benefi ts of
shared services in their organizations.
(Not surprisingly, cost takeout remains
a top objective both now and in three
years.)
However, as their shared services
mature, all respondents’ objectives
for the shared services also become
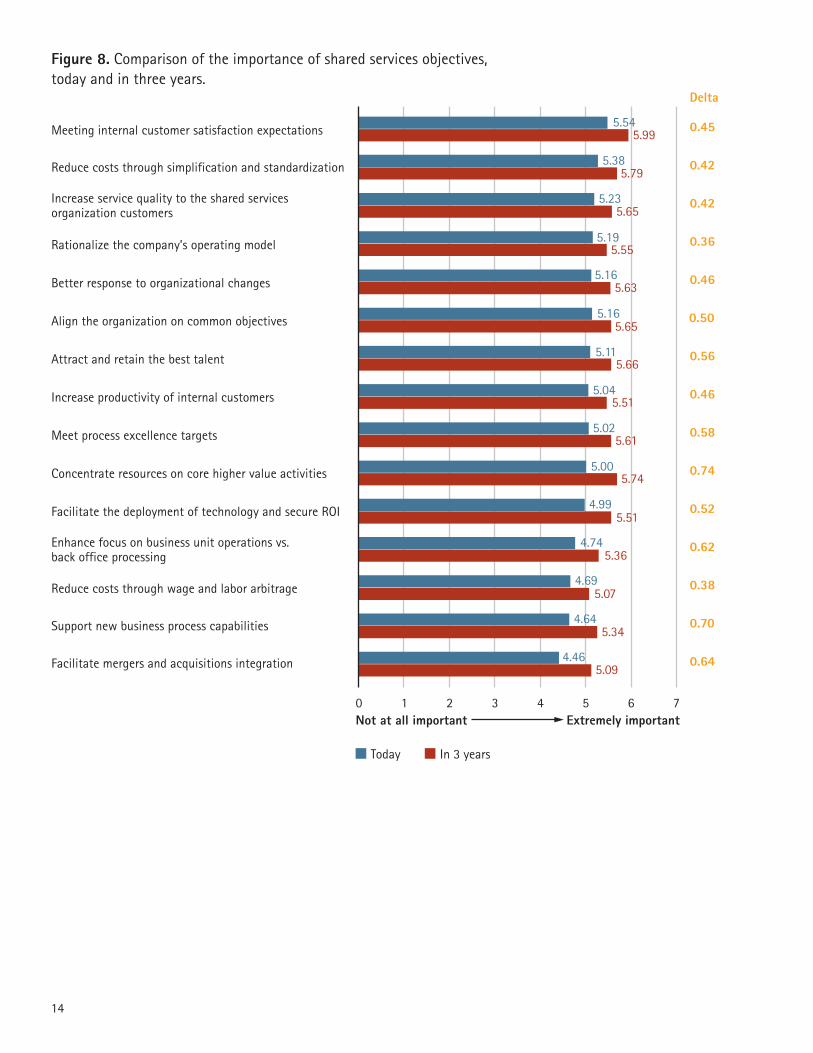
increasingly sophisticated. As Figure 8
shows, the objectives that show the
most dramatic increases in importance
in three years are “concentrating core
resources on higher value activities,”
“supporting new business process
capabilities” and “facilitating mergers
and acquisitions.” Given the diffi culties
so many organizations have had to
date meeting their arguably simpler
objectives, what do the increasingly
complex demands on shared services
organizations portend for performance?
Again we see trends among the masters
that the others would do well to note.
As described previously, masters are
more likely to consider improvement
initiatives to be important to the
success of their shared services
organization and they are more
likely to invest in these initiatives.
Among these initiatives, we note that
shared services masters have placed
signifi cantly more emphasis on deploying
Lean Six Sigma and other continuous
improvement approaches within the
next year than their counterparts.
Continuous improvement initiatives
such as these are critical to ensuring
the shared services organization’s
longevity (one of the fi ve key dimensions
of high performance). While more than
80 percent of the masters plan to
implement these continuous
improvement approaches in the near
term, less than 30 percent of the others
do. Similarly, masters are signifi cantly
more likely to have immediate (within
the next year) plans for control process
initiatives and improved use of metrics
(87 percent versus 47 percent and 83
percent vs. 45 percent, respectively).
In short, the masters are positioning
their shared services organizations to
run like high-performance businesses
over the long term, with real process
management discipline and an eye
toward keeping their edge.
The good news for the others is that
they seem to be making some
thoughtful moves to shrink their own
performance gaps. Specifi cally, in our
research we see some close matchup
between what factors they perceive
as absolutely critical to the success of
their shared services and initiatives the
majority plan to implement in the next
year. As Figure 9 shows, our survey
respondents consider attracting and
retaining the best employees as among
the top fi ve critical factors to ensuring
the success of their shared services
organizations over the next three years.
Correspondingly, employee engagement
improvement ranks among respondents’
top fi ve planned initiatives in the next
year. Rounding out the top fi ve success
factors and planned initiatives we see
some more close matchups, including
a desire for improving end user
satisfaction and plans for customer
satisfaction and retention initiatives;
a desire to standardize processes and
plans for process streamlining
initiatives; and a desire to reduce
operating costs and plans for control
process improvement initiatives.
14
Figure 8. Comparison of the importance of shared services objectives,
today and in three years.
Meeting internal customer satisfaction expectations
Reduce costs through simplification and standardization
Increase service quality to the shared services organization customers
Better response to organizational changes
Align the organization on common objectives
Attract and retain the best talent
Increase productivity of internal customers
Meet process excellence targets
Concentrate resources on core higher value activities
Facilitate the deployment of technology and secure ROI
Reduce costs through wage and labor arbitrage
Support new business process capabilities
Enhance focus on business unit operations vs. back office processing
Facilitate mergers and acquisitions integration
Rationalize the company’s operating model
0.45
Delta
0.42
0.42
0.46
0.50
0.56
0.46
0.58
0.74
0.52
0.38
0.70
0.62
0.64
0.36
Today In 3 years
10 2 3 4 5 6 7
5.54
5.38
5.23
5.195.55
5.165.63
5.165.65
5.115.66
5.045.51
5.025.61
5.005.74
4.995.51
4.745.36
4.695.07
4.645.34
4.465.09
5.79
5.65
5.99
Not at all important Extremely important

15
Figure 9. Comparison of success factors and implementation plans.
How important do you think each of the following are going to be to ensuring the success of your shared services organization over the next three years?
When are your shared services organization's plans to implement the following initiatives?
Retaining the best employees
Attracting the best employees
Improving end user satisfaction
Reduction of operating costs
Better understanding internal customer needs
Improve technology platforms
Enhance focus on core processes
Improved executive management sponsorship
More effective governance structures
Simplifying the customer interface
More clearly defining scope of services
Having greater access to customer insights and data
Providing more consistent customer experience
More effective service level agreements
More well-defined mission and vision
A clear change in journey management process
Greater standardization of processes
1 to 2 (not important) 3 (neutral) 4 to 5 (crucial)
3% 73%24%
3% 72%24%
2% 72%26%
4% 70%26%
4% 67%29%
4% 66%30%
5% 64%31%
8% 62%30%
9% 59%31%
13% 58%29%
11% 55%34%
13% 55%31%
9% 55%36%
9% 54%36%
9% 53%38%
10% 53%37%
17% 49%34%
Process streamlining
Employee engagement improvement
Control process improvements
Customer satisfaction/retention enhancement
Enhanced automation tools
More formalized training
Customer base growth
Expanding the geographic coverage of shared services
Enhancements to governance structure
Expanding the scope of services offered by shared services
Deployment of Lean Six Sigma types of approaches
Transferring more basic services to outsourced solutions
Increasing the number of employees in shared services
Major increases to the shared service operating budget
Opening additional shared services location/centers
Increased use of offshoring
Improved use of metrics
Next year 2 - 3 years >4 years Not planning
52% 4%38% 6%
51% 10%32% 6%
51% 8%37% 5%
48% 14%34% 5%
47% 11%34% 8%
45% 8%40% 8%
43% 19%32% 5%
41% 13%39% 7%
41% 16%31% 12%
37% 20%31% 11%
34% 14%41% 11%
34% 24%34% 8%
34% 23%32% 11%
29% 21%39% 11%
29% 31%30% 11%
27% 32%31% 10%
27% 31%28% 15%
16
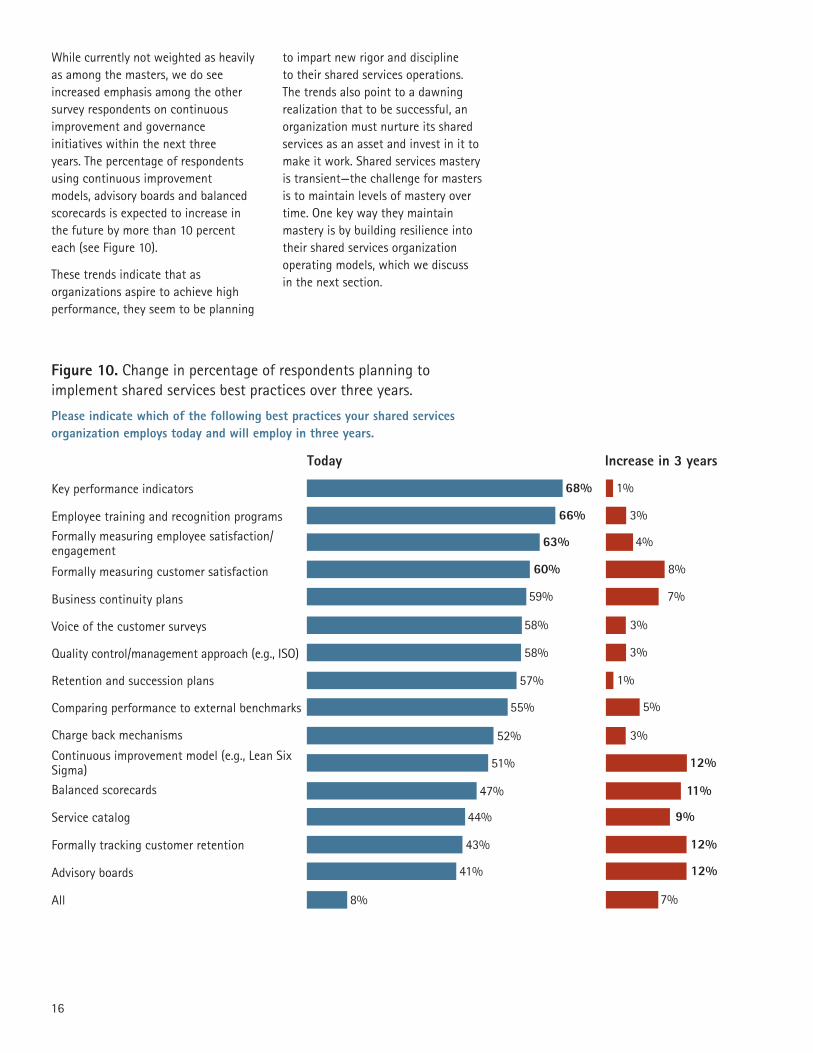
While currently not weighted as heavily
as among the masters, we do see
increased emphasis among the other
survey respondents on continuous
improvement and governance
initiatives within the next three
years. The percentage of respondents
using continuous improvement
models, advisory boards and balanced
scorecards is expected to increase in
the future by more than 10 percent
each (see Figure 10).
These trends indicate that as
organizations aspire to achieve high
performance, they seem to be planning
to impart new rigor and discipline
to their shared services operations.
The trends also point to a dawning
realization that to be successful, an
organization must nurture its shared
services as an asset and invest in it to
make it work. Shared services mastery
is transient—the challenge for masters
is to maintain levels of mastery over
time. One key way they maintain
mastery is by building resilience into
their shared services organization
operating models, which we discuss
in the next section.
Figure 10. Change in percentage of respondents planning to
implement shared services best practices over three years.
Please indicate which of the following best practices your shared services organization employs today and will employ in three years.
Key performance indicators
Employee training and recognition programs
Formally measuring employee satisfaction/engagement
Business continuity plans
Voice of the customer surveys
Quality control/management approach (e.g., ISO)
Retention and succession plans
Comparing performance to external benchmarks
Charge back mechanisms
Continuous improvement model (e.g., Lean Six Sigma)
Service catalog
Formally tracking customer retention
Balanced scorecards
Advisory boards
All
Formally measuring customer satisfaction
Today Increase in 3 years
68% 1%
66% 3%
63% 4%
60% 8%
59% 7%
58% 3%
58% 3%
57% 1%
55% 5%
52% 3%
51% 12%
47% 11%
44% 9%
43% 12%
41% 12%
8% 7%

17

18
Figure 11. The comparative benefi ts of different shared services
sourcing models.
Shared services is a service delivery
model for both captive (insourced) and
outsourced solutions. As shown in the
matrix in Figure 11, each sourcing
model has its own benefi ts.
For now, our survey shows that the
in company, onshore shared services
sourcing method predominates, with
75 percent of the respondents employing
that model (versus 25 percent using
the outsourced, offshore model).
One model is not necessarily better than
others; each model answers specifi c
organizational needs. Real shared
services mastery comes from the
ability to fi nd the right mix of models
dependent on business needs. By using
an optimal mix of different models,
an organization gains resilience in its
shared services in the face of changes in
economic conditions in one area, changes
in workforce demographics, eroding wage
arbitrage and so on. This resilience is a
key to longevity: as with any endeavor,
an organization that uses a mix lowers
the risks associated with having “all the
eggs in one basket.” Masters actively
choose to use a mixture of insourced
and outsourced, demonstrated by the
fact that the number of masters
currently employing all the sourcing
methods is more than twice the others
(26 percent versus 11 percent).
Although the majority of respondents
(70 percent) are considering adding
offshoring to their mix over the next few
years, for now, other initiatives rank
higher priority. For example, 96 percent
of the respondents plan on implementing
process streamlining initiatives in the
next few years, with more than half
(52 percent) planning on undertaking
these initiatives within the next 12
months. Likewise, 89 percent will be
turning their attention to improving
employee engagement, with 51 percent
undertaking these initiatives in the
next year (see Figure 12).
Finding 3: Shared services masters understand
the value of different sourcing models and are
far more likely than others to deploy these
models in combination to achieve business
resilience.
Sourcing model Benefi ts
In company, onshore Sole ownership and the superior
customer experiences associated with
a local model
In company, offshore Scalability and the benefi ts of labor
sourcing, yet still with ownership
Outsourced, onshore Predictable costs, superior customer
experiences and contracted outcomes
Outsourced, offshore Most predictable low costs, fl exible
global model and contracted outcomes
19
Figure 12. Organizations’ plans for shared services initiatives.
When are your shared services organization's plans to implement the following initiatives?
Process streamlining
Employee engagement improvement
Control process improvements
Customer satisfaction/retention enhancement
Enhanced automation tools
More formalized training
Customer base growth
Expanding the geographic coverage of shared services
Enhancements to governance structure
Expanding the scope of services offered by shared services
Deployment of Lean Six Sigma types of approaches
Transferring more basic services to outsourced solutions
Increasing the number of employees in shared services
Major increases to the shared service operating budget
Opening additional shared services location/centers
Increased use of offshoring
Improved use of metrics
Next year 2 - 3 years >4 years Not planning
52% 4%38% 6%
51% 10%32% 6%
51% 8%37% 5%
48% 14%34% 5%
47% 11%34% 8%
45% 8%40% 8%
43% 19%32% 5%
41% 13%39% 7%
41% 16%31% 12%
37% 20%31% 11%
34% 14%41% 11%
34% 24%34% 8%
34% 23%32% 11%
29% 21%39% 11%
29% 31%30% 11%
27% 32%31% 10%
27% 31%28% 15%
20
Why? The research indicates that
companies have a lot of clean up to
do with their existing shared services,
and they know it. As Figure 12 shows,
fi xing processes, controls and customer
service are top of the agenda.
Organizations want to thoughtfully
reengineer their processes and then
decide what makes sense to move
offshore, probably sometime two or
more years into the future.
Certainly we have seen a trend over
the past decade toward increased use
of the offshore, outsourced model,
thanks largely in part to the proven
success of captive (in house) shared
services that has enabled outsourcing
to become more widespread and the
outsourcing success stories visible in
the marketplace.
Interestingly, masters are nearly twice
as likely as other respondents to plan
on increasing their use of offshoring
over the next year (43 percent versus
25 percent). We believe that this fi nding
provides further evidence of their
mastery over the shared services model
for a number of reasons. First, as
mentioned previously, the masters have
gotten the fundamentals right and so
have been able to stabilize their shared
services model. Their comfort with
shared services has grown to the point
where it can be turned almost into a
“lights out” model; the masters feel
ready to hand off the running of these
stabilized functions in return for a
more predictable cost structure. When
they outsource their shared services,
organizations also transfer the risks of
increasing costs to the outsourcing
provider (who must make it their
business to capitalize on wage arbitrage
and their own continuous improvement
programs in order to deliver contracted
services at contracted prices and still
make a profi t).
Second, as masters squeeze productivity
out of their shared services, their next
step is to account for potential variability
in their cost base. With outsourcing,
they can grow or shrink and gain access
to new skills or language capabilities
without having to scale up their back
offi ce or carry extra capacity.
Finally, outsourcing also facilitates a
global model. In fact, that is what we
see among the masters: Given the ability
to source and manage work globally,
they no longer feel constricted by the
need to set up the organization near
any particular offi ce or manufacturing
facility. They can establish a shared
services operation, or leverage the
delivery locations of their service
provider, wherever it makes sense
organizationally and fi nancially.
Accordingly, we see that high-
performance businesses are increasingly
moving toward a hybrid approach that
enables the shared services organization
to gain the advantages of being both
local and global. That is, a hybrid
approach offers the scalability and the
benefi ts of labor sourcing associated
with a global model and the customer
intimacy and superior customer
experiences associated with a local
model.
Mastery in sourcing is about the ability
to best leverage a hybrid model of in
house and outsourced operations to
meet business needs. Making the
chosen sourcing model work, however,
necessitates mastery in other areas,
including superior talent management,
vigorous use of shared services leading
practices and reliance on key
technologies. We describe how shared
services masters approach these
factors in the sections that follow.
21
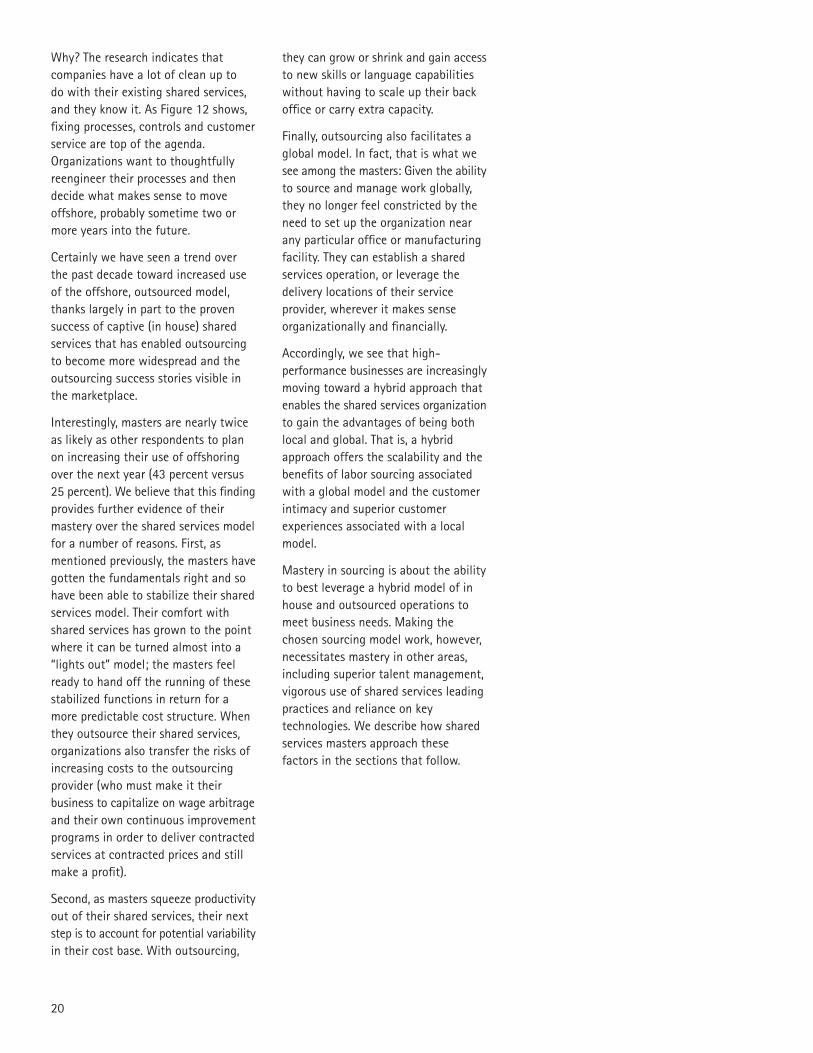
The quality of the workforce ultimately
determines shared services success:
Talent management is key to quality
and consistency of service, which in
turn impacts profi tability and growth.
The respondents in our survey clearly
recognize the criticality of aligning the
development of talent with the shared
services organization’s performance
and cultural objectives. In fact,
attracting and retaining employees
were the two factors rated by our
respondents as most important to
ensuring the success of their shared
services organizations over the next
three years. More than 70 percent of
respondents rated these factors as
either very important or absolutely
critical (see Figure 13). Forty-three
percent say talent management already
is a very important objective today;
64 percent believe it will be a very
important objective within three years.
Finding 4: While the majority of respondents
rank talent management as one of the most
signifi cant criteria for success, the masters are
more likely to take defi nitive steps to build the
workforce they need.
Figure 13. Relative importance of different factors to shared services
success.
How important do you think each of the following are going to be to ensure the success of your shared services organization over the next three years?
1 to 2 (not important) 3 (neutral) 4 to 5 (crucial)
Retaining the best employees 3% 73%24%
Attracting the best employees 3% 72%24%
Improving end user satisfaction 2% 72%26%
Greater standardization of processes 4% 70%26%
Reduction of operating costs 4% 67%29%
Better understanding internal customer needs 4% 66%30%
Improve technology platforms 5% 64%31%
Enhance focus on core processes 8% 62%30%
Improved executive management sponsorship 9% 59%31%
More effective governance structures 13% 58%29%
Simplifying the customer interface 11% 55%34%
Providing more consistent customer experience 13% 55%31%
More clearly defining scope of services 9% 55%36%
Having greater access to customer insights and data 9% 54%36%
More effective service level agreements 9% 53%38%
More well-defined mission and vision 10% 53%37%
A clear change in journey management process 17% 49%34%

22
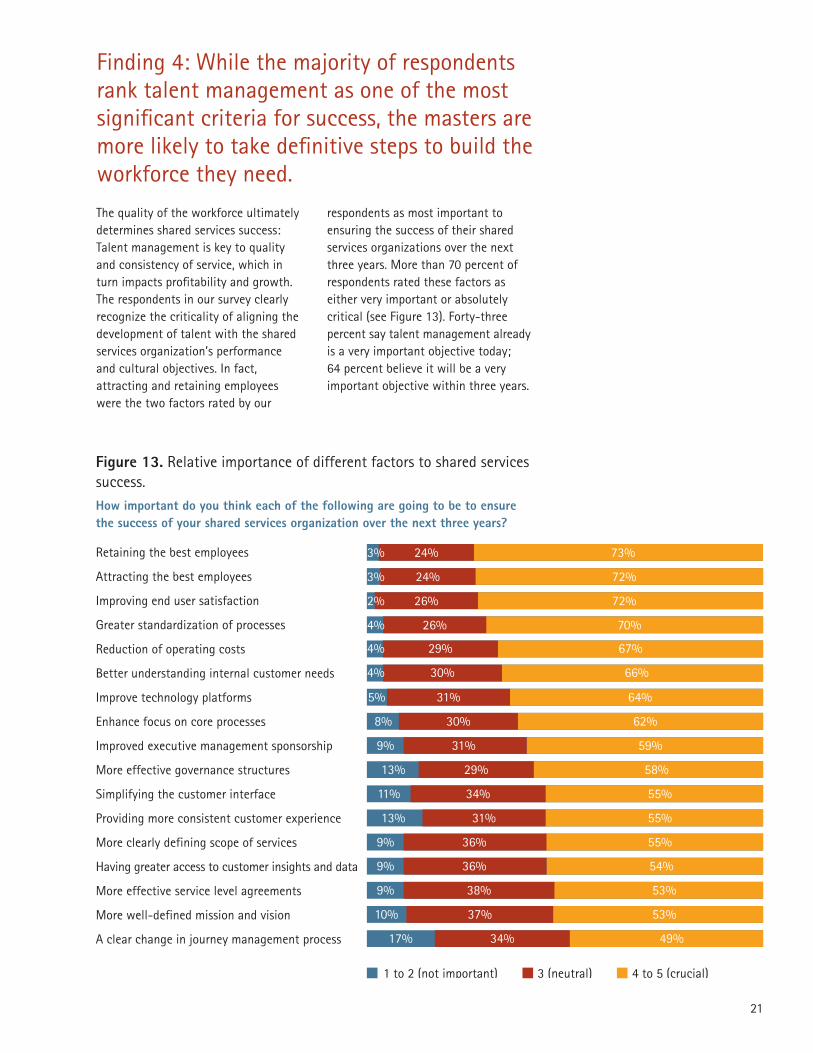
At the same time, securing skilled
employees looms as the highest expected
barrier to success over the next three
years. The ability to retain talent,
already considered a top barrier today,
continues to grow in importance even
as other top barriers become much less
signifi cant. For example, current top
barriers, including IT challenges and
change resistance, all diminish (see
Figure 14). As organizations become
more confi dent with the shared services
model, they solve these essentially
one-off challenges. Talent management,
on the other hand, remains an ongoing
issue because of the dynamic nature
of a shared services organization’s
workforce.
For example, for commodity transaction
processing, shared services organizations
frequently experience high turnover.
Particularly in the type of shared
services-saturated locations where it
is virtually an industry, high workforce
turnover is especially pronounced.
The fact this turnover is an issue may
seem counterintuitive in times of
economic downturn, when presumably
the talent pool grows bigger and
shared services organizations should
experience little diffi culty in replacing
employees who leave. And in fact, it
is important to have enough turnover
within a shared services center, not
only to help keep costs low, but also
to renew the organization through the
new energy and new ideas that come
from new people. But turnover brings
associated costs in recruitment and
training. Good employees make all the
difference in the customer service
experience, which in turn will make or
break the organization. The balance is
in attracting, training and retaining
the good people—making sure every
person on payroll counts by managing
turnover so that the shared services
organization fi nds and keeps the cream
of the crop.
The talent management issue is also
complicated by the fact that for higher
end processes, which is where shared
services organizations are beginning to
set their sights, resource availability is
more challenging. When you associate
this shift in objectives to the higher
time to profi ciency required to build
an employee’s higher-level skills, the
talent management challenge becomes
more clear.
Once again, what sets the masters apart
is how they approach these challenges.
Shared services masters are more than
twice as likely than other respondents
to plan on increasing the number of
their shared services employees within
the next year (65 percent versus 31
percent). Likewise, they are nearly twice
as likely to have plans to introduce more
formalized training for their shared
services employees over the next year
(74 percent versus 40 percent). And they
are more than 50 percent more likely
than other respondents to plan initiatives
that improve employee engagement
(83 percent versus 49 percent).
Again, these fi ndings (and the
expenditures they imply) seem
counterintuitive in today’s environment.
But what they point to is the master’s
strategic approach to shared services.
Despite the overall downturn in the
economy, masters are making the
choice that investments in their
employees at shared services centers
actually becomes a strategic investment
for the business overall. A downturn, in
fact, can be seen as an opportunity to
upgrade skills from a wider talent pool.
Given the expanded roles they expect
their shared services to take on in
delivering business value, we believe
masters make their talent management
decisions with the idea that investments
in this area will bring the downstream
benefi ts of cost reductions and greater
agility for the business overall.
In the next section, we investigate
other key investments the masters are
making in the areas of best practices
and technologies.
23
Figure 14. Relative magnitude of barriers to shared services success,
now and in three years.
Change resistance
Insufficient levels of standardization
IT challenges/issues
Limited operating budgets
Insufficient staffing
Availability of skilled employees
Ability to attract the best talent
Shifting agendas/goals/targets
Limited availability of accurate metrics
Staying relevant
Poor governance structure
Low employee morale
Lack of vision and support from executive leadership
Lack of customer data/customer insight
Cultural differences across geographies
Ability to retain the best talent
4.24 -0.24
4.19 -0.53
4.18 -0.20
4.04 0.14
4.00 0.12
3.96 -0.10
3.94 0.04
3.91 0.11
3.90 -0.07
3.89 -0.32
3.88 -0.20
3.83 -0.22
3.81 -0.32
3.77 -0.08
3.74 -0.16
3.68 -0.01
Employee language skills
Regulatory limits
Eroding wage arbitrage
3.67 0.08
3.56 -0.04
3.48 0.37
Today Change in 3 years
Not a barrier at all Significant barrier

24
All of the respondents in our survey
recognize that eroding wage arbitrage
is becoming a serious barrier to their
shared services success. In fact, it is
the one barrier that both masters and
other respondents see as equally serious
now and growing most signifi cantly in
importance. For example, on a scale of
1 to 5, with 1 representing “not a
barrier at all” and 5 representing “a
very signifi cant barrier,” wage arbitrage
grows in signifi cance from an average
of 3.48 today to 3.85 in the future—an
increase of 11 percent. In comparison,
as barriers, issues of governance
decline in signifi cance by 8 percent
and issues of standardization decline
in signifi cance by 13 percent over the
next three years. (Figure 14 on page 23
in the previous section compares
barriers to the success of shared
services organizations today and in
three years.)
The consequence of these trends?
Shared services masters understand
that wage arbitrage-driven benefi ts
realization is not sustainable over
time. Therefore, they must leverage all
avenues (albeit slower in this economic
environment), to sustain their
performance. As noted earlier, these
avenues include a mix of sourcing
models and talent management. They
also include judicious use of shared
services best practices and enabling
technologies.
Not surprisingly, we do in fact see a
signifi cantly higher number of shared
services masters employing best
practices than other respondents, both
now and in the future. We provided
survey participants with a list of 19
well-recognized shared services best
practices. In all 19 cases, shared
services masters are more likely to
employ the best practice than their
other counterparts by margins ranging
from 20 percent more likely (service
level agreements) to 146 percent more
likely (advisory boards). While 39 percent
of the masters report employing all
of the best practices we listed, only
5 percent of the other respondents are
putting all practices to use.
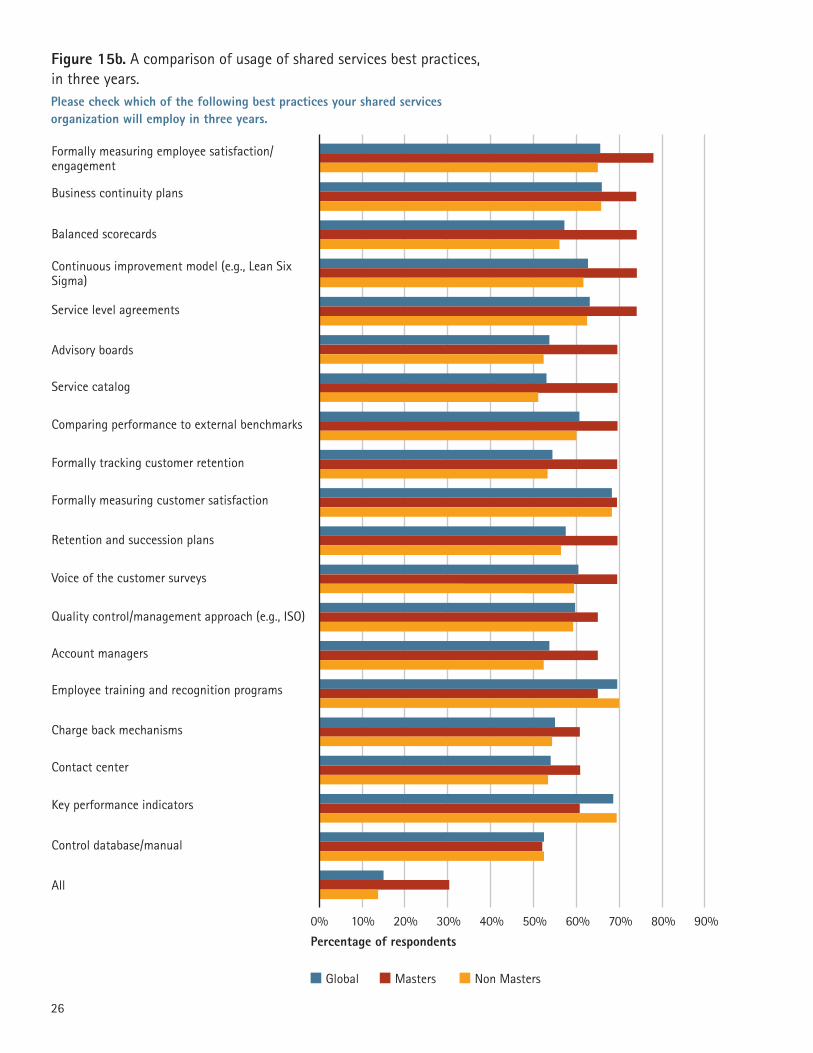
In the future, gaps will likely remain;
however, if the other respondents
follow through on their reported plans,
these gaps in best practice usage will
shrink considerably. For example,
within three years, masters will only be
about one-third more likely to employ
advisory boards than the others (see
Figure 15a & b).
Finding 5: Shared services masters judiciously
invest in the shared services best practices
and technology tools that will sustain lower
cost over time.

25
Figure 15a. A comparison of usage of shared services best practices,
today.
Please check which of the following best practices your shared services organization employs today.
Percentage of respondents
Global Masters Non Masters
Service level agreements
Charge back mechanisms
Account managers
Contact center
Employee training and recognition programs
Retention and succession plans
Formally measuring customer satisfaction
All
Key performance indicators
Business continuity plans
Formally measuring employee satisfaction/engagement
Control database/manual
Service catalog
Balanced scorecards
Comparing performance to external benchmarks
Continuous improvement model (e.g., Lean Six Sigma)
Voice of the customer surveys
Quality control/management approach (e.g., ISO)
Formally tracking customer retention
Advisory boards
0% 20% 40% 60% 80% 100%
26
Please check which of the following best practices your shared services organization will employ in three years.
Figure 15b. A comparison of usage of shared services best practices,
in three years.
Percentage of respondents
Global Masters Non Masters
Service level agreements
Charge back mechanisms
Account managers
Contact center
Employee training and recognition programs
Retention and succession plans
Formally measuring customer satisfaction
Key performance indicators
Business continuity plans
Formally measuring employee satisfaction/engagement
Control database/manual
Service catalog
Balanced scorecards
Comparing performance to external benchmarks
Continuous improvement model (e.g., Lean Six Sigma)
Voice of the customer surveys
Quality control/management approach (e.g., ISO)
Formally tracking customer retention
Advisory boards
All
0% 20% 30%10% 40% 50% 70%60% 80% 90%

27
As with shared services best practices,
shared services masters are signifi cantly
more likely to employ enabling
technologies than other respondents,
and are likely to continue doing so in
the future. In many cases, masters were
twice as likely as other respondents to
make use of the enabling technologies
we included in our survey. While
overall, the current gaps in technology
usage between the masters and other
respondents are not as large as they
are for best practice usage, the gaps
in technology usage also do not close
as dramatically as the gaps in best
practices usage in the future.
(See Figure 16.)
Among enabling technologies, the ones
most likely to be employed by the
masters now tend toward tools that
increase effi ciency through automation
and self-service (automated service-
management tools; optical character
recognition; and employee, supplier
and customer self-service tools). In
contrast, other respondents are more
likely to be focusing on data warehouses,
data analysis and reporting tools and
fi nancial consolidation and reporting
tools.
While less a matter of right and wrong
focus, the masters’ technology focus
areas are another indication of the
greater maturity of their shared
services operations; they have some
of the more basic functional aspects
(such as data warehousing and
reporting) well in hand, and are now
moving into more sophisticated areas
to extract more value from their
shared services. The technologies the
masters now are employing position
the shared services organizations to
manage future volume increases
without equivalent cost increases.
Thus, the masters’ moves in this area
can be seen as the leading edge of the
next wave of technology interest.
Some guidance for future
planning
Of course, the real story is not about
the quantity of best practices or
technologies, but rather about their
function in supporting robust operating
components—in particular, process,
service and organization. No best
practice or technology should be
implemented without a clear view
to how it impacts achieving high
performance—either through
contributing to profi tability, longevity,
consistency, growth or positioning for
the future. In fact, high performance
should be the reference point to any
planned shared services initiative.
To that end, we provide a list of
questions to consider when developing
a future strategy that will move your
own shared services organization
toward high performance:
• Do you view shared services as a
cost-cutting tool or as a strategy for
organizational growth, profi tability,
longevity, consistency and a stronger
future market position?
• Would you characterize your shared
services organization as having a
service culture or a transaction-
processing culture?
• Have you determined what objectives
you want your shared services
organization to achieve now and in
the future?
• Have you identifi ed gaps in
performance against these objectives
and begun making the investments
that will lead to closing these gaps?
• Do you have plans in place for
dealing with expected barriers to
future success?
• Are you confi dent you have employed
the right mix of sourcing options to
allow you to face changes in your
operating environment, both
negative (eroding wage arbitrage)
and positive (future growth)?
• Do you have plans in place to deal
with a scarcity of skilled talent as
your goals for your shared services
organization change?
• Do your top employees have training
opportunities and compelling career
paths?
• Are you familiar with industry-
recognized best practices and
technologies and how they would
apply to your shared services
organization?
• Are you taking advantage of these
best practices and technologies?
• Have you built your shared services
on a principle of continuous
improvement?

28
Figure 16. A comparison of usage of enabling technologies today.
Please indicate which of the following technology enablers your shared services organization employs today.
Percentage of respondents
Global Masters Non Masters
Optical character recognition
All
Automated service management tools
Employee self-service
Direct deposit
Supplier self-service
Case management tools
Scanning
Customer self-service tools
ePayment (or EFT/ACH)
Portals
ERP systems
EDI
Workflow
Data warehouse
Financial consolidation/reporting tools
Data analysis and reporting tools
Document imaging
0% 20% 40% 60% 80% 100%

29
ConclusionIn the future, while cost
reduction will still be a top
priority for shared services, the
avenues to pursue this and other
more sophisticated objectives
will expand through many
innovative ways beyond labor-
related wage arbitrage.
While the turbulent global
economy certainly makes cost
savings an appealing and desired
outcome, the dramatic, “quick-
hit” cost savings that were
possible when organizations
fi rst undertook shared services
have turned into much smaller,
incremental gains. These gains
are about sustaining the
business through the downturn
and positioning it for a strong
future when conditions improve.
Companies must pursue them
through a combination of bold
strategy, smart investment and a
thirst for continuous improvement.
The majority of organizations
still have a long way to go in
making the improvements to
their shared services that will
deliver the desired outcomes.
However, the masters of shared
services are leading the way.
These masters recognize that to
get shared services to contribute
to high performance overall,
shared services themselves must
be run like high-performance
businesses. Understanding that
shared services will allow
companies to add more value
to their business over time, the
masters go after higher-value
shared services objectives with
conviction. Undaunted by the
shakiness of the business climate,
they invest in building strong
capabilities (including workforce
skills, best practices and
technologies) and make smart use
of all available sourcing models
(insourced and outsourced) to
gain the maximum advantage
from each. What they gain is a
shared services organization
that contributes to general
organizational profi tability,
growth, longevity, consistency
and stronger positioning for the
future. As the shared services
masters aggressively pursue their
drive toward high performance
through shared services, all would
do well to learn from their lessons.

About the Authors
Gary Duncan is a senior executive
leading the Accenture Shared Services
offering globally within the Finance &
Performance Management service line.
He has been helping Accenture’s clients
to assess, design and build service-
oriented, high-performance Shared
Services solutions over the past 15 years.
Duncan has led the development of
Accenture’s methodology and tools for
building high-quality shared services
solutions. He has co-authored white
papers on more than a dozen key shared
services topics and manages Accenture
Shared Services research studies.
Gerald Fass is a senior executive
within the Accenture Finance &
Performance Management service line,
specializing in enterprise resource
planning-enabled multifunctional
shared services transformation. An
experienced practitioner, he leads the
Accenture Shared Services offering in
Europe, Africa and Latin America, and
is involved with the delivery of the
complete life cycle of ERP-enabled
global shared services and fi nance
transformation initiatives. Fass has
substantial experience in fi nance process
reengineering, organization design and
change and program management in
complex and demanding environments,
across multiple industries. He is a
co-author of the Accenture Shared
Services methodology.
30

31
About Accenture
Accenture is a global management
consulting, technology services and
outsourcing company. Combining
unparalleled experience, comprehensive
capabilities across all industries and
business functions, and extensive
research on the world’s most
successful companies, Accenture
collaborates with clients to help them
become high-performance businesses
and governments. With more than
181,000 people serving clients in over
120 countries, the company generated
net revenues of US$23.39 billion for
the fi scal year ended Aug. 31, 2008.
Its home page is www.accenture.com.
Copyright © 2009 Accenture
All rights reserved.
Accenture, its logo, and
High Performance Delivered
are trademarks of Accenture.
Related Documents