Learning inequality during the COVID-19 pandemic Per Engzell* a,b,c , Arun Frey d , and Mark Verhagen a,b a Leverhulme Centre for Demographic Science, 42 Park End St, Oxford OX1 1JD, UK b Nuffield College, University of Oxford, 1 New Rd, Oxford OX1 1NF, UK c Swedish Institute for Social Research, Stockholm University, 106 91 Stockholm, Sweden d Department of Sociology, University of Oxford, 42 Park End St, Oxford OX1 1JD, UK October 2020 Abstract Suspension of face-to-face instruction in schools during the COVID-19 pan- demic has led to concerns about consequences for student learning. So far, data to study this question have been limited. Here we evaluate the effect of school closures on primary school performance using exceptionally rich data from the Netherlands (n≈350,000). The Netherlands represents a best-case sce- nario with a relatively short lockdown (8 weeks) and high degree of technological preparedness. We use the fact that national exams took place before and after lockdown, and compare progress during this period to the same period in the three previous years using a difference-in-differences design. Our results reveal a learning loss of about 3 percentile points or 0.08 standard deviations. These results remain robust when balancing on the estimated propensity of treatment and using maximum entropy weights, or with fixed-effects specifications that compare students within the same school and family. Losses are up to 55% larger among students from less-educated homes. Investigating mechanisms, we find that most of the effect reflects the cumulative impact of knowledge learned rather than transitory influences on the day of testing. The average learning loss is equivalent to a fifth of a school year, nearly exactly the same period that schools remained closed. These results imply that students made little or no progress whilst learning from home, and suggest much larger losses in countries less prepared for remote learning. Equal author contributions, alphabetical order. The authors thank participants at the 2020 Joint IZA & Jacobs Center Workshop “Consequences of COVID-19 for Child and Youth Develop- ment,” the Organisation for Economic Co-operation and Development (OECD) Education & Skills Forum “Measuring the Impact of School Closures During the COVID-19 Pandemic,” and seminar participants at the Leverhulme Centre for Demographic Science, University of Oxford. P.E. was sup- ported by Nuffield College, Leverhulme Centre for Demographic Science, The Leverhulme Trust, and the Swedish Research Council for Health, Working Life, and Welfare (FORTE), grant 2016-07099. A.F. was supported by the UK Economic and Social Research Council (ESRC) and the German Academic Scholarship Foundation. M.V. was supported by the UK Economic and Social Research Council (ESRC) and Nuffield College. *To whom correspondence may be addressed: per.engzell@nuffield.ox.ac.uk 1

Welcome message from author
This document is posted to help you gain knowledge. Please leave a comment to let me know what you think about it! Share it to your friends and learn new things together.
Transcript

Learning inequality during the COVID-19 pandemic
Per Engzell*a,b,c, Arun Freyd, and Mark Verhagena,b
aLeverhulme Centre for Demographic Science, 42 Park End St, Oxford OX1 1JD, UKbNuffield College, University of Oxford, 1 New Rd, Oxford OX1 1NF, UK
cSwedish Institute for Social Research, Stockholm University, 106 91 Stockholm, SwedendDepartment of Sociology, University of Oxford, 42 Park End St, Oxford OX1 1JD, UK
October 2020
Abstract
Suspension of face-to-face instruction in schools during the COVID-19 pan-demic has led to concerns about consequences for student learning. So far,data to study this question have been limited. Here we evaluate the effectof school closures on primary school performance using exceptionally rich datafrom the Netherlands (n≈350,000). The Netherlands represents a best-case sce-nario with a relatively short lockdown (8 weeks) and high degree of technologicalpreparedness. We use the fact that national exams took place before and afterlockdown, and compare progress during this period to the same period in thethree previous years using a difference-in-differences design. Our results reveala learning loss of about 3 percentile points or 0.08 standard deviations. Theseresults remain robust when balancing on the estimated propensity of treatmentand using maximum entropy weights, or with fixed-effects specifications thatcompare students within the same school and family. Losses are up to 55%larger among students from less-educated homes. Investigating mechanisms,we find that most of the effect reflects the cumulative impact of knowledgelearned rather than transitory influences on the day of testing. The averagelearning loss is equivalent to a fifth of a school year, nearly exactly the sameperiod that schools remained closed. These results imply that students madelittle or no progress whilst learning from home, and suggest much larger lossesin countries less prepared for remote learning.
Equal author contributions, alphabetical order. The authors thank participants at the 2020Joint IZA & Jacobs Center Workshop “Consequences of COVID-19 for Child and Youth Develop-ment,” the Organisation for Economic Co-operation and Development (OECD) Education & SkillsForum “Measuring the Impact of School Closures During the COVID-19 Pandemic,” and seminarparticipants at the Leverhulme Centre for Demographic Science, University of Oxford. P.E. was sup-ported by Nuffield College, Leverhulme Centre for Demographic Science, The Leverhulme Trust, andthe Swedish Research Council for Health, Working Life, and Welfare (FORTE), grant 2016-07099.A.F. was supported by the UK Economic and Social Research Council (ESRC) and the GermanAcademic Scholarship Foundation. M.V. was supported by the UK Economic and Social ResearchCouncil (ESRC) and Nuffield College.
*To whom correspondence may be addressed: [email protected]
1
1 Introduction
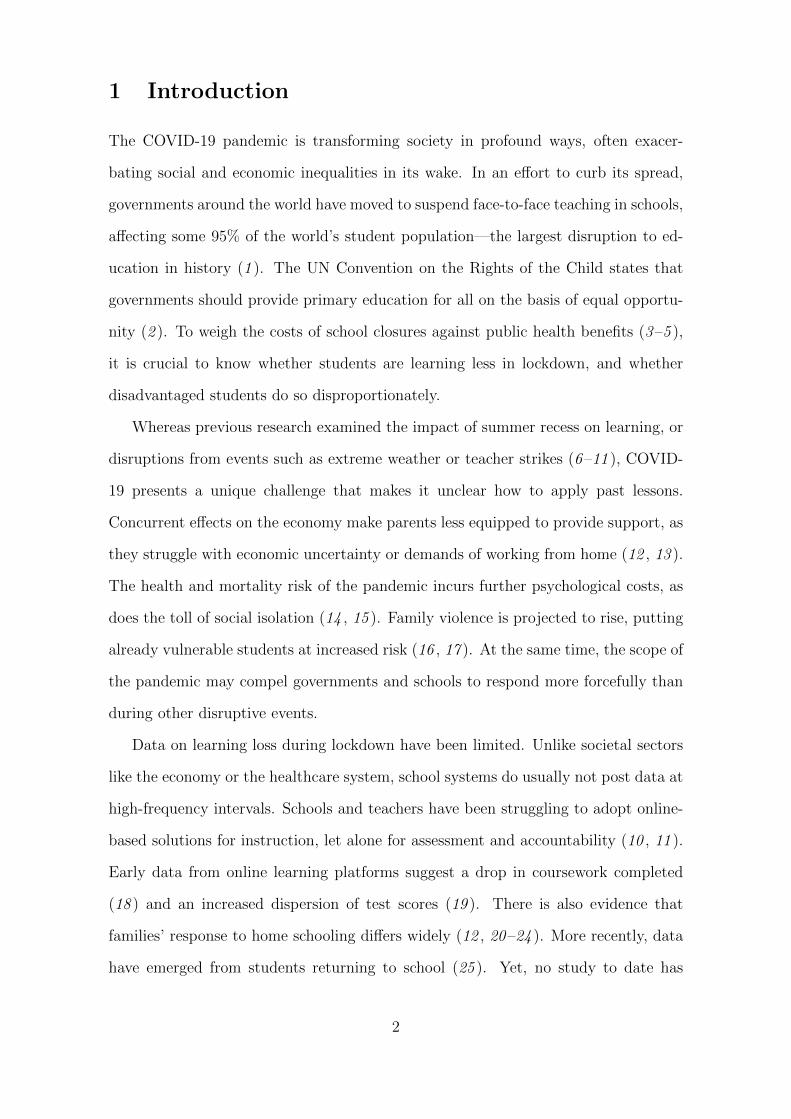
The COVID-19 pandemic is transforming society in profound ways, often exacer-
bating social and economic inequalities in its wake. In an effort to curb its spread,
governments around the world have moved to suspend face-to-face teaching in schools,
affecting some 95% of the world’s student population—the largest disruption to ed-
ucation in history (1 ). The UN Convention on the Rights of the Child states that
governments should provide primary education for all on the basis of equal opportu-
nity (2 ). To weigh the costs of school closures against public health benefits (3 –5 ),
it is crucial to know whether students are learning less in lockdown, and whether
disadvantaged students do so disproportionately.
Whereas previous research examined the impact of summer recess on learning, or
disruptions from events such as extreme weather or teacher strikes (6 –11 ), COVID-
19 presents a unique challenge that makes it unclear how to apply past lessons.
Concurrent effects on the economy make parents less equipped to provide support, as
they struggle with economic uncertainty or demands of working from home (12 , 13 ).
The health and mortality risk of the pandemic incurs further psychological costs, as
does the toll of social isolation (14 , 15 ). Family violence is projected to rise, putting
already vulnerable students at increased risk (16 , 17 ). At the same time, the scope of
the pandemic may compel governments and schools to respond more forcefully than
during other disruptive events.
Data on learning loss during lockdown have been limited. Unlike societal sectors
like the economy or the healthcare system, school systems do usually not post data at
high-frequency intervals. Schools and teachers have been struggling to adopt online-
based solutions for instruction, let alone for assessment and accountability (10 , 11 ).
Early data from online learning platforms suggest a drop in coursework completed
(18 ) and an increased dispersion of test scores (19 ). There is also evidence that
families’ response to home schooling differs widely (12 , 20 –24 ). More recently, data
have emerged from students returning to school (25 ). Yet, no study to date has
2
Schools close
Schools re−
open
0.00
0.25
0.50
0.75
1.00
01−Jan 01−Feb 01−Mar 01−Apr 01−May 01−Jun 01−Jul 01−Aug
Num
ber
of te
sts
rela
tive
to y
early
max
imum
Year 2017 2018 2019 2020
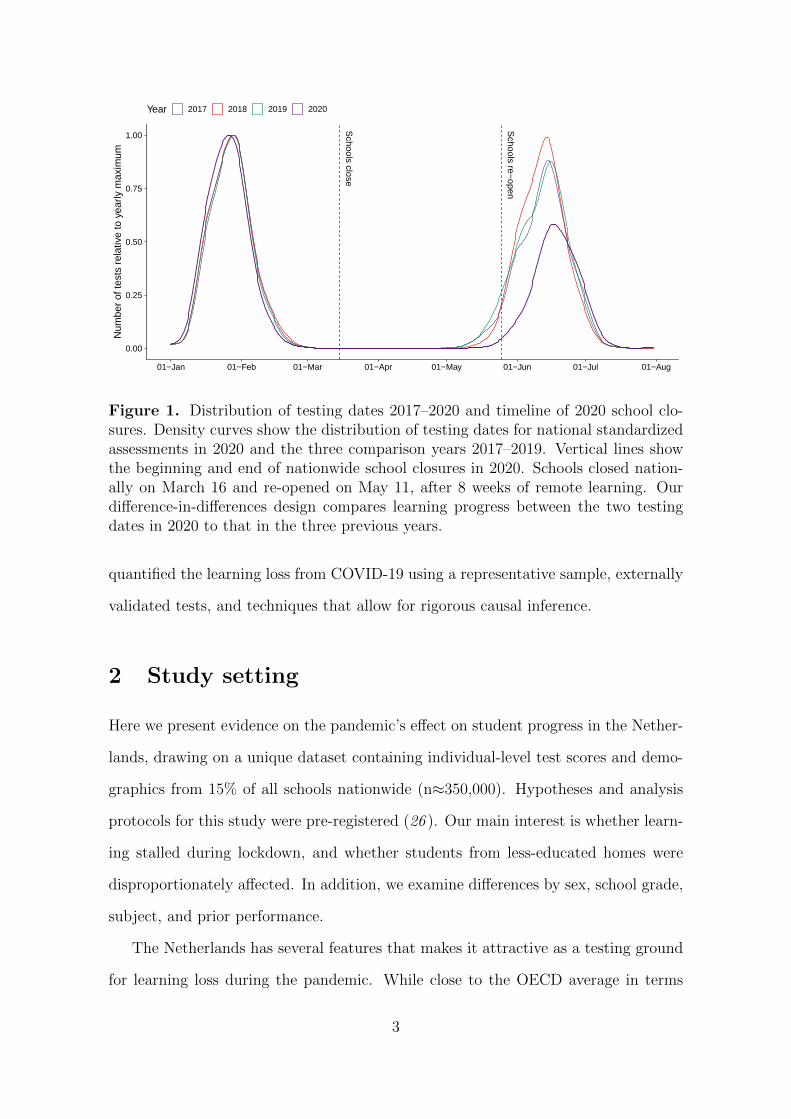
Figure 1. Distribution of testing dates 2017–2020 and timeline of 2020 school clo-sures. Density curves show the distribution of testing dates for national standardizedassessments in 2020 and the three comparison years 2017–2019. Vertical lines showthe beginning and end of nationwide school closures in 2020. Schools closed nation-ally on March 16 and re-opened on May 11, after 8 weeks of remote learning. Ourdifference-in-differences design compares learning progress between the two testingdates in 2020 to that in the three previous years.
quantified the learning loss from COVID-19 using a representative sample, externally
validated tests, and techniques that allow for rigorous causal inference.
2 Study setting
Here we present evidence on the pandemic’s effect on student progress in the Nether-
lands, drawing on a unique dataset containing individual-level test scores and demo-
graphics from 15% of all schools nationwide (n≈350,000). Hypotheses and analysis
protocols for this study were pre-registered (26 ). Our main interest is whether learn-
ing stalled during lockdown, and whether students from less-educated homes were
disproportionately affected. In addition, we examine differences by sex, school grade,
subject, and prior performance.
The Netherlands has several features that makes it attractive as a testing ground
for learning loss during the pandemic. While close to the OECD average in terms
3

of school spending and educational performance (27 ), the country leads the world
in broadband penetration (28 , 29 ). National and local governments also took swift
action to ensure that students had access to appropriate technology (30 , 31 ). School
closures were short in comparative perspective (Appendix Figure A1), and the first
wave of the pandemic was relatively mild (32 ). The Netherlands therefore presents
a best-case scenario, providing a lower bound on learning loss elsewhere in Europe
and the world. Despite these favorable conditions, survey evidence from lockdown
indicates high levels of dissatisfaction with remote learning (33 ), and considerable
disparities in help with schoolwork and learning resources (20 ).
Key to our study design is the fact that national assessments take place twice a
year in the Netherlands (34 ): halfway into the school year in January–February and
at the end of the school year in May–June. In 2020, these testing dates occurred just
before and after the nationwide school closures that lasted 8 weeks starting March
16 (Figure 1). Access to data from 3 years prior to the pandemic lets us create a
natural benchmark against which to assess learning loss. We do so using a difference-
in-differences design (35 ), and address loss to follow-up using various techniques:
regression adjustment, re-balancing on the propensity score and maximum entropy
weights, and comparison within schools and families.
3 Results
We assess standardized tests in Maths & Arithmetics, Spelling, and Reading Com-
prehension for students aged 7–11 (grades 4–7), and a composite score of all three
subjects. Results are transformed into percentiles using a common norm for all years.
Figure 2 shows the difference between students’ percentile placement between the first
and second test in each of the years 2017–2020. This difference is centered closely
around zero in the years leading up to the pandemic, but drops in 2020 when students
fall short of performance in previous years. To adjust for potential confounders and
distinguish between subgroups, we go on to estimate a difference-in-differences model
4

Spelling
Reading
Maths
Composite
−100 −50 0 50 100
0.000.010.020.030.04
0.000.010.020.030.04
0.000.010.020.030.04
0.000.010.020.030.04
Difference between first and second test
Den
sity
2017 2018 2019 2020
Figure 2. Difference in test scores 2017–2020. Density curves show the differencebetween students’ percentile placement between the first and second test in each ofthe years 2017–2020, with 2020 marked in red. The dark red area reflects learningloss in the treatment year. Note that this graph does not adjust for confoundingdue to trends, testing date, or sample composition, which we address in subsequentanalyses using a variety of techniques.
(see Section 5: Materials and Methods). In our baseline specification, we adjust for
the time elapsed between testing dates and a linear trend in year, and cluster standard
errors at the school level.
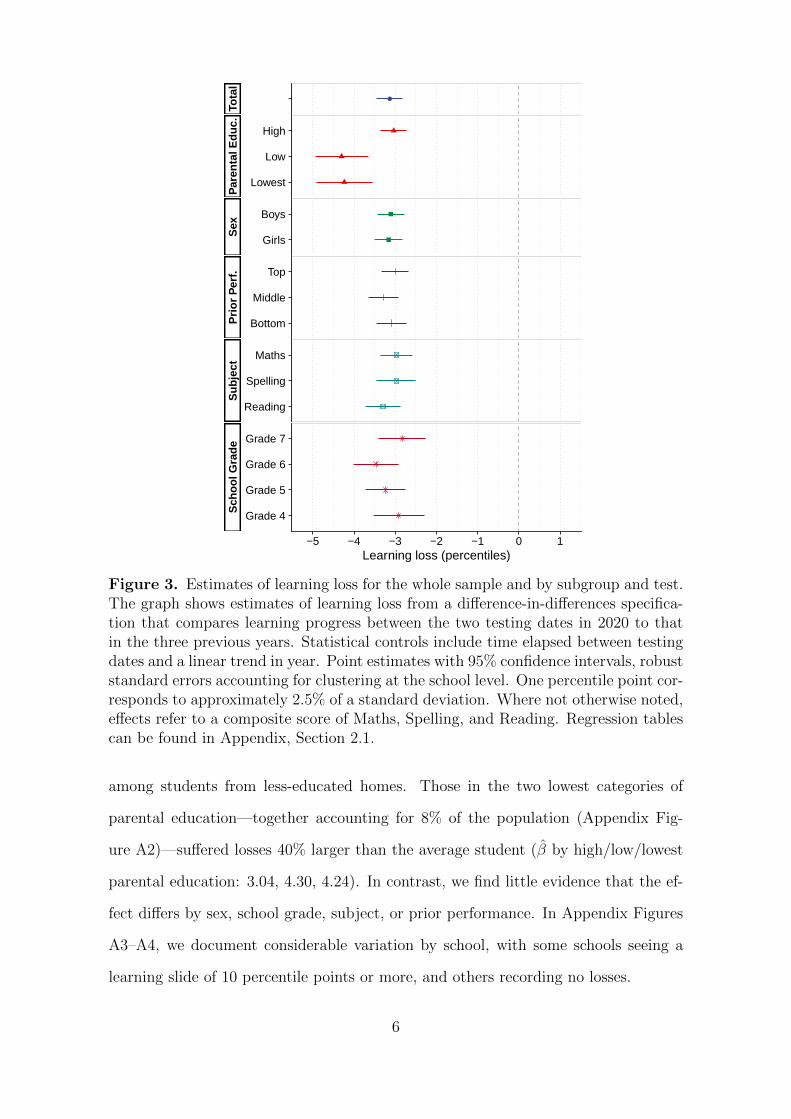
Baseline specification Figure 3 shows our baseline estimate of learning loss in
2020 compared to the three previous years, using a composite score of students’ per-
formance in Maths & Arithmetics, Spelling, and Reading Comprehension. Students
lost on average 3.13 percentile points in the national distribution, equivalent to 0.08
standard deviations (SD) (36 ). Losses are not distributed equally but concentrated
5
Tota
lP
aren
tal E
duc.
Sex
Prio
r P
erf.
Sub
ject
Sch
ool G
rade
−5 −4 −3 −2 −1 0 1
Lowest
Low
High
Girls
Boys
Bottom
Middle
Top
Reading
Spelling
Maths
Grade 4
Grade 5
Grade 6
Grade 7
Learning loss (percentiles)
Figure 3. Estimates of learning loss for the whole sample and by subgroup and test.The graph shows estimates of learning loss from a difference-in-differences specifica-tion that compares learning progress between the two testing dates in 2020 to thatin the three previous years. Statistical controls include time elapsed between testingdates and a linear trend in year. Point estimates with 95% confidence intervals, robuststandard errors accounting for clustering at the school level. One percentile point cor-responds to approximately 2.5% of a standard deviation. Where not otherwise noted,effects refer to a composite score of Maths, Spelling, and Reading. Regression tablescan be found in Appendix, Section 2.1.
among students from less-educated homes. Those in the two lowest categories of
parental education—together accounting for 8% of the population (Appendix Fig-
ure A2)—suffered losses 40% larger than the average student (β by high/low/lowest
parental education: 3.04, 4.30, 4.24). In contrast, we find little evidence that the ef-
fect differs by sex, school grade, subject, or prior performance. In Appendix Figures
A3–A4, we document considerable variation by school, with some schools seeing a
learning slide of 10 percentile points or more, and others recording no losses.
6

Tota
lP
aren
tal E
duca
tion
−6 −5 −4 −3 −2 −1 0 1
Lowest
Low
High
Learning loss (percentiles)
BaselineControlsE−BalanceP−Score75% schoolsSchool FEFamily FE
Figure 4. Robustness to specification. The graph shows estimates of learning lossfor the whole sample and separately by parental education, using a variety of biasadjustments. Point estimates with 95% confidence intervals, robust standard errorsaccounting for clustering at the school level. For details, see Section 5: Materials andMethods, and Appendix Section 2.
Placebo analysis and year exclusions In Appendix, Section 2.3–2.4, we examine
the robustness of these results in several ways. To confirm that our baseline specifica-
tion is not prone to false positives, we perform a placebo analysis assigning treatment
status to each of the three comparison years (Appendix Figure A5). In each case, the
95% confidence interval of our main effect spans zero. We also re-estimate our main
specification dropping comparison years one at a time (Appendix Figure A6). These
results are estimated with less precision but otherwise align well with those of our
main analysis.
Additional specifications and robustness tests In Figure 4, we report a series
of additional specifications addressing the fact that only a subset of students returned
after lockdown (see Figure 1). Our difference-in-differences design discards with those
students who did not do so, which might lead to bias if their performance differs from
those we observe. First, we adjust for the individual covariates used to examine
7

heterogeneity in the main analysis. We also balance treatment and control groups
on a wider set of covariates using maximum entropy weights (37 ) and the estimated
propensity of treatment (38 ). Moreover, we restrict analysis to schools where at
least 75% of students returned after lockdown. Finally, we adjust for unobserved
heterogeneity using school and family fixed effects (39 ). As Figure 4 shows, social
inequalities grow somewhat when adjusting for selection at the school and family
level. The largest gap in effect sizes between educational backgrounds is found in our
within-family analysis, estimated at 55% (β by high/low/lowest parental education:
3.16, 4.50, 4.90).
Knowledge learned vs. transitory influences Do these results actually reflect
a decrease in knowledge learned, or more transient “day of exam” effects? Social
distancing measures may alter factors such as seating arrangements or indoor cli-
mate, that in turn can influence student performance (40 –42 ). Following school
re-openings, tests were taken in-person under normal conditions and with minimal
social distancing. Still, students may have been under stress or simply unaccustomed
to the school environment after several weeks at home. Similarly, if remote teaching
covered the requisite material but put less emphasis on test-taking skills, results may
have declined while knowledge remained stable. We address this by inspecting perfor-
mance on tasks that are independent of the curriculum (see Section 5: Materials and
Methods). These results, in Figure 5, show that treatment effects shrink by nearly
two thirds when doing so (main effect β –1.19 vs. –3.13), which implies that differ-
ences in knowledge learned account for the majority of the drop in performance. In
years prior to the pandemic, we observe no such difference in students’ performance
on the two types of test (Appendix Figure A10).
8

Tota
lP
aren
tal E
duca
tion
−5 −4 −3 −2 −1 0 1
Lowest
Low
High
Learning loss (percentiles)
Figure 5. Knowledge learned vs. transitory influences. The graph compares esti-mates for the composite achievement score in our main analysis (light color) with testnot designed to assess curricular content (dark color). Both sets of estimates refer toour baseline specification reported in Figure 3. Point estimates with 95% confidenceintervals, robust standard errors accounting for clustering at the school level. Fordetails, see Section 5: Materials and Methods, and Appendix Section 2.9.
4 Discussion
During the pandemic-induced lockdown in 2020, schools in many countries were forced
to close for extended periods. It is of great policy interest to know whether students
are able to have their educational needs met in these circumstances, and identify
groups at special risk. In this study, we have addressed this question with uniquely
rich data on primary school students in the Netherlands. There is clear evidence that
students are learning less during lockdown than in a typical year. These losses are
evident in all grades 4 through 7 and across three subject areas: Maths, Spelling, and
Reading. The size of these effects is on the order of 3 percentile points or 0.08 SD,
but students from disadvantaged homes are disproportionately affected. In the most
low-resourced households, the size of the learning slide is up to 55% larger than in
the general population.
Are these losses large or small? To answer this, we turn to projections made early
in the pandemic (11 , 24 , 29 , 43 –45 ). The most credible estimates are from inter-
nationally recognized bodies like the World Bank (43 ) or the European Commission
9

(29 ). Helpfully, these projections span a range of scenarios that let us position the
Netherlands as a “best case” based on its resilience in the first wave of the pandemic.
The World Bank’s “optimistic” scenario—schools closed for 3 months and remote
learning operating at 60% efficiency—projects a 0.06 SD loss in standardized test
scores (43 ). This is less than our 0.08 SD, despite the fact that Dutch schools only
closed for 8 weeks. The European Commission estimates a lower bound of learning
loss of 0.008 SD per week (29 ). Multiplied by 8 weeks this translates to 0.064 SD,
again on the same order of magnitude as our findings if marginally smaller.
Another way to quantify these effects is as a proportion of gains made in a normal
year. Here, the World Bank (43 ) projects a best-case scenario of 0.3 years of quality-
adjusted schooling lost. In the US, Kuhfeld et al. (11 ) estimate that students may
lose a third of a school year in reading and more in maths.1 Both scenarios assume
that schools remain closed for 3 months, not re-opening until after summer. Typical
estimates of yearly progress for our age span range from 0.30–0.40 SD (46 , 47 ). Under
the World Bank assumption of 0.40 SD yearly progress (43 ), our estimated loss of 0.08
SD translates into 20% of a school year (33% if extrapolating to a 3-month lockdown).
This length coincides with the period that schools actually remained closed, implying
that students made little or no progress during this time. If we allow for the fact that
a third of our treatment effect may reflect transitory testing fluctuations (Figure 5),
students nevertheless lost two thirds of expected progress whilst learning from home.
Taken together, our estimates suggest that existing projections of learning loss
are, if anything, too conservative. This is alarming in light of the much larger losses
projected in countries less prepared for the pandemic. At the same time, our results
may underestimate costs even in the context that we study. Schools remained at
reduced capacity following re-openings. Dynamic models demonstrate how small
initial losses can accumulate into large disadvantages with time (44 , 48 ). Test scores
do not consider children’s psycho-social development (49 , 50 ), neither societal costs
1Contrary to expectations from previous literature (26 ), we did not find losses to be larger inmaths. It should be stressed that, the Netherlands, while close to the OECD average in readingperformance, places among Europe’s top performers in maths (27 ).
10

due to productivity decline or heightened pressure among parents (51 –53 ). Overall,
our results highlight the importance of social investment strategies to “build back
better” and enhance resilience and equity. Further research is needed to assess the
success of such initiatives, and address the long-term fallout of the pandemic for
student learning and well-being.
5 Materials and Methods
We access data through partnership with a digital platform that supplies teachers
and principals with tools to track student performance. The data have been ana-
lyzed under stringent data security protocols, and in a fully anonymized way not
traceable to any individual student or school. The sample covers 15% of all primary
schools (n≈350,000) and is broadly representative of the national student body in the
Netherlands (Appendix Figure A2).
Test scores Nationally standardized tests are taken across three main subjects:
Maths & Arithmetics, Spelling, and Reading Comprehension. Students across the
Netherlands take the same exam within a given year. These tests are administered
in school, and each of them lasts up to 60 minutes. Test results are transformed
to percentile scores, but the norm for transformation is the same across years so
absolute changes in performance over time are preserved. We rely on translation keys
provided by the test producer to assign percentile scores. However, as these keys are
actually based on smaller samples than that at our disposal, we further re-norm the
distribution to ensure that it is uniform within our sample.
Our main outcome is a composite score that takes the average of all non-missing
values in the three areas (Maths, Spelling, and Reading). In sensitivity analyses in
Appendix Table A6, we require a student to have a valid score on all three subjects.
We also display separate results for the three sub-tests in Figure 3. The test in
Maths & Arithmetics contains both abstract problems and contextual problems that
11

describe a concrete task. The test in Reading Comprehension assesses the student’s
ability to understand written texts, including both factual and literary content. The
test in Spelling asks students to write down a series of words, demonstrating that
they have mastered the spelling rules.
As an alternative outcome we also assess students’ performance on shorter quizzes
known as “3-minute tests” (drieminutentoets) in Figure 5. The purpose of these tests
is somewhat different as they are not designed to elicit curricular content. Instead,
they aim to establish how well students can process unfamiliar information and how
this skill develops over the years. In a typical task, students are presented with an
infographic (e.g., a map), and asked to answer a set of simpler questions. As this
part of the assessment does not test for the retention of curricular content, we would
expect it to be less affected by school closures, which is indeed what we find.
Parental education We classify parental education according to the official defi-
nition designed by Statistics Netherlands (CBS), also used by the Dutch Ministry of
Education to allocate resources to schools. The variable codes as high those house-
holds where at least one parent has a degree above lower secondary education; low
those where both parents have a degree above primary education but neither has one
above lower secondary education; and lowest those where at least one parent has no
degree above primary education and neither has a degree above lower secondary ed-
ucation. These groups make up, respectively, 92%, 4%, and 4% of the student body
and our sample (Appendix Figure A2).
Other covariates Sex is a binary variable distinguishing boys and girls. Prior
performance is constructed from all test results in the previous year. We create a
composite score similar to our main outcome variable, and split this in to tertiles of
top, middle, and bottom performance. School grade is the year the student belongs
in. School starts at age 4 in the Netherlands but the first three grades are less
intensive and more akin to kindergarten. The last grade of comprehensive school
12
is grade 8, but this grade is shorter and does not feature much additional didactic
material. In matched analyses using reweighting on the propensity of treatment and
maximum entropy weights, we also include a set of school characteristics described in
Appendix, Section 1.3: school-level socioeconomic disadvantage, proportion of non-
Western immigrants in the school’s neighborhood, and school denomination.
Difference-in-differences analysis We analyze the rate of progress in 2020 to
that in previous years using a difference-in-differences design. This first involves
taking the difference in educational achievement pre-lockdown (measured using the
middle-of-year test) compared to that post-lockdown (measured using the end-of-year
test): ∆y2020i = y2020-posti −y2020-prei , where yi is some achievement measure for student
i and the superscript 2020 denotes the treatment year. We then calculate the same
difference in the three years prior to the pandemic, ∆y2017−2019i . These differences can
then be compared in a regression specification:
∆yi = β0 + X′iγ + β1Ti + εi, (1)
where ∆yi reflects the difference between end-of-year achievement and middle-of-
year achievement, X′iγ is a set of individual control variables, and Ti is an indicator
variable for the year 2020. The coefficient β1 reflects overall learning loss due to the
pandemic. From here, we estimate a model including one of our various interest vari-
ables and its interaction with the treatment variable to capture possible heterogeneity
in the estimated learning loss:
∆yi = β0 + X′iγ + β1Ti + β2Ai + β3TiAi + εi, (2)
where Ai is a categorical variable reflecting some student characteristic. We es-
timate Equation (2) in turn including parental education, student sex, and prior
performance in Ai. In addition, we estimate Equation (1) separately by grade and
subject. In running text, we use β as a shorthand for the estimated treatment effect
13
in a given group. In our baseline specification in Figure 3, the vector Xi includes
terms for the time elapsed between testing dates and a linear trend in year. Through-
out our analyses, we adjust confidence intervals for clustering on schools using robust
standard errors.
Propensity score and entropy weighting Moreover, we match treatment and
control groups on a wider range of individual- and school-level characteristics us-
ing reweighting on the propensity of treatment (38 ) and maximum entropy balanc-
ing (37 ). In both cases, we include the following covariates: parental education,
student sex, prior performance, school-level socioeconomic disadvantage, proportion
immigrant background, and school denomination. Propensity of treatment weights
involve first estimating the probability of treatment using a binary response (logit)
model and then reweighting observations so that they are balanced on this propensity
across comparison and treatment groups. The entropy balancing procedure instead
uses maximum entropy weights that are calibrated to directly balance comparison
and treatment groups non-parametrically on the observed covariates.
School and family fixed effects We perform within-school and within-family
analyses using fixed-effects specifications (39 ). The within-school design discards
all variation between schools by introducing a separate intercept for each school.
By doing so, it eliminates all unobserved heterogeneity across schools which might
have biased our results if, for example, schools that perform worse in all years are
over-represented during the treatment year. The same logic applies to the within-
family design, which discards all variation between families by introducing a separate
intercept for each group of siblings identified in our data. This step reduces the size
of our sample by approximately 60%, as not every student has a sibling attending a
sampled school within the years that we are able to observe. The benefit is that it
allows us to remove any unobserved confounding at the family level.
14

References
(1 ) United Nations, Education during COVID-19 and beyond ; UN Policy Briefs:
2020.
(2 ) United Nations (1989). Convention on the Rights of the Child. United Nations,
Treaty Series 1577.
(3 ) Brooks, S. K., Smith, L. E., Webster, R. K., Weston, D., Woodland, L., Hall, I.,
and Rubin, G. J. (2020). The impact of unplanned school closure on children’s
social contact: rapid evidence review. Eurosurveillance 25.
(4 ) Viner, R. M., Russell, S. J., Croker, H., Packer, J., Ward, J., Stansfield, C.,
Mytton, O., Bonell, C., and Booy, R. (2020). School closure and management
practices during coronavirus outbreaks including COVID-19: a rapid system-
atic review. The Lancet Child & Adolescent Health.
(5 ) Snape, M. D., and Viner, R. M. (2020). COVID-19 in children and young
people. Science 370, 286–288.
(6 ) Downey, D. B., Von Hippel, P. T., and Broh, B. A. (2004). Are schools the
great equalizer? Cognitive inequality during the summer months and the school
year. American Sociological Review 69, 613–635.
(7 ) von Hippel, P. T., and Hamrock, C. (2019). Do test score gaps grow before,
during, or between the school years? Measurement artifacts and what we can
know in spite of them. Sociological Science 6, 43.
(8 ) Marcotte, D. E., and Hemelt, S. W. (2008). Unscheduled school closings and
student performance. Education Finance and Policy 3, 316–338.
(9 ) Belot, M., and Webbink, D. (2010). Do teacher strikes harm educational at-
tainment of students? Labour 24, 391–406.
15
(10 ) Defeyter, G., von Hippel, P., Shinwell, J., Henderson, E., Mann, E., Henderson,
E., Brownlee, I., Pepper, G., Stretesky, P., Long, M., McKenna, J., Daly-Smith,
A., Lalli, G., Bundy, D., and Drake, L., Back to school post COVID-19: Re-
building a better future for all children; Education Committee, UK Parliament:
2020.
(11 ) Kuhfeld, M., Soland, J., Tarasawa, B., Johnson, A., Ruzek, E., and Liu, J. Pro-
jecting the potential impacts of COVID-19 school closures on academic achieve-
ment, EdWorkingPaper, Annenberg Institute at Brown University, 2020.
(12 ) Andrew, A., Cattan, S., Dias, M. C., Farquharson, C., Kraftman, L., Krutikova,
S., Phimister, A., and Sevilla, A. (2020). Inequalities in children’s experiences
of home learning during the COVID-19 lockdown in England.
(13 ) Witteveen, D., and Velthorst, E. (2020). Economic hardship and mental health
complaints during COVID-19. Proceedings of the National Academy of Sci-
ences.
(14 ) Brooks, S. K., Webster, R. K., Smith, L. E., Woodland, L., Wessely, S., Green-
berg, N., and Rubin, G. J. (2020). The psychological impact of quarantine and
how to reduce it: rapid review of the evidence. The Lancet.
(15 ) Golberstein, E., Wen, H., and Miller, B. F. (2020). Coronavirus disease 2019
(COVID-19) and mental health for children and adolescents. JAMA Pediatrics.
(16 ) Cabrera-Hernandez, F., and Padilla-Romo, M. Hidden Violence: How COVID-
19 School Closures Reduced the Reporting of Child Maltreatment, University
of Tennessee, Department of Economics, 2020.
(17 ) Pereda, N., and Dıaz-Faes, D. A. (2020). Family violence against children in
the wake of COVID-19 pandemic: a review of current perspectives and risk
factors. Child and Adolescent Psychiatry and Mental Health 14, 1–7.
16

(18 ) Chetty, R., Friedman, J. N., Hendren, N., and Stepner, M. How did covid-19
and stabilization policies affect spending and employment? A new real-time
economic tracker based on private sector data, National Bureau of Economic
Research, 2020.
(19 ) DELVE Initiative Balancing the risks of pupils returning to schools, DELVE
Report No. 4. Published 24 July, 2020.
(20 ) Bol, T. Inequality in homeschooling during the Corona crisis in the Nether-
lands: First results from the LISS Panel, SocArXiv, 2020.
(21 ) Jæger, M. M., and Blaabæk, E. H. (2020). Inequality in learning opportunities
during Covid-19: Evidence from library takeout. Research in Social Stratifica-
tion and Mobility 68, 100524.
(22 ) Bacher-Hicks, A., Goodman, J., and Mulhern, C. Inequality in household adap-
tation to schooling shocks: Covid-induced online learning engagement in real
time, National Bureau of Economic Research, 2020.
(23 ) Bayrakdar, S., and Guveli, A. Inequalities in home learning and schools’ pro-
vision of distance teaching during school closure of COVID-19 lockdown in the
UK, ISER Working Paper, University of Essex, 2020.
(24 ) Pensiero, N., Kelly, A., and Bokhove, C. Learning inequalities during the
Covid-19 pandemic: how families cope with home-schooling, University of
Southampton EPrint, 2020.
(25 ) Maldonado, J. E., and De Witte, K. The effect of school closures on standard-
ised student test outcomes, KU Leuven Department of Economics Discussion
Paper DPS20.17, 2020.
(26 ) Engzell, P., Frey, A., and Verhagen, M. D. Pre-analysis plan for: Learning
inequality during the COVID-19 pandemic, Open Science Framework, 2020.
(27 ) Schleicher, A., PISA 2018: Insights and interpretations ; OECD Publishing:
2018.
17
(28 ) Statistics Netherlands (CBS) The Netherlands leads Europe in internet ac-
cess, https://www.cbs.nl/en-gb/news/2018/05/the-netherlands-leads-europe-
in-internet-access, 2018.
(29 ) Di Pietro, G., Biagi, F., Costa, P., Karpinski, Z., and Mazza, J., The likely
impact of COVID-19 on education: Reflections based on the existing literature
and recent international datasets ; Publications Office of the European Union:
2020.
(30 ) Reimers, F. M., and Schleicher, A., A framework to guide an education response
to the COVID-19 Pandemic of 2020 ; OECD Publishing: 2020.
(31 ) SIVON Opnieuw extra geld voor laptops en tablets voor onderwijs
op afstand, https://www.sivon.nl/actueel/opnieuw-extra-geld-voor-laptops-
en-tablets-voor-onderwijs-op-afstand/, 2020.
(32 ) Johns Hopkins Coronavirus Resource Center COVID-19 Case Tracker,
https://coronavirus.jhu.edu/data, 2020.
(33 ) de Haas, M., Faber, R., and Hamersma, M. (2020). How COVID-19 and the
Dutch ‘intelligent lockdown’change activities, work and travel behaviour: Evi-
dence from longitudinal data in the Netherlands. Transportation Research In-
terdisciplinary Perspectives, 100150.
(34 ) Vlug, K. F. (1997). Because every pupil counts: the success of the pupil moni-
toring system in The Netherlands. Education and Information Technologies 2,
287–306.
(35 ) Angrist, J. D., and Pischke, J., Mostly harmless econometrics: An empiricist’s
companion; Princeton University Press: 2008.
(36 ) Cohen, J., Statistical power analysis for the behavioral sciences ; Academic
press: 2013.
18
(37 ) Hainmueller, J. (2012). Entropy balancing for causal effects: A multivariate
reweighting method to produce balanced samples in observational studies. Po-
litical Analysis, 25–46.
(38 ) Imbens, G. W., and Wooldridge, J. M. (2009). Recent developments in the
econometrics of program evaluation. Journal of Economic Literature 47, 5–86.
(39 ) Wooldridge, J. M., Econometric analysis of cross section and panel data; MIT
press: 2010.
(40 ) Mendell, M. J., and Heath, G. A. (2005). Do indoor pollutants and thermal
conditions in schools influence student performance? A critical review of the
literature. Indoor Air 15, 27–52.
(41 ) Marshall, P. D., and Losonczy-Marshall, M. (2010). Classroom ecology: re-
lations between seating location, performance, and attendance. Psychological
Reports 107, 567–577.
(42 ) Park, R. J., Goodman, J., and Behrer, A. P. (2020). Learning is inhibited
by heat exposure, both internationally and within the United States. Nature
Human Behaviour, DOI: 10.1038/s41562-020-00959-9.
(43 ) Azevedo, J. P., Hasan, A., Goldemberg, D., Iqbal, S. A., and Geven, K. (2020).
Simulating the potential impacts of covid-19 school closures on schooling and
learning outcomes: A set of global estimates. World Bank Policy Research
Working Paper.
(44 ) Kaffenberger, M. Modeling the long-run learning impact of the COVID-19
learning shock: actions to (more than) mitigate loss, RISE Insight Series, 17,
2020.
(45 ) Psacharopoulos, G., Collis, V., Patrinos, H. A., and Vegas, E. (2020). Lost
wages: The COVID-19 cost of school closures. World Bank Policy Research
Working Paper.
19

(46 ) Bloom, H. S., Hill, C. J., Black, A. R., and Lipsey, M. W. (2008). Performance
trajectories and performance gaps as achievement effect-size benchmarks for
educational interventions. Journal of Research on Educational Effectiveness 1,
289–328.
(47 ) Hill, C. J., Bloom, H. S., Black, A. R., and Lipsey, M. W. (2008). Empirical
benchmarks for interpreting effect sizes in research. Child development perspec-
tives 2, 172–177.
(48 ) DiPrete, T. A., and Eirich, G. M. (2006). Cumulative advantage as a mecha-
nism for inequality: A review of theoretical and empirical developments. Annual
Review of Sociology 32, 271–297.
(49 ) Gassman-Pines, A., Gibson-Davis, C. M., and Ananat, E. O. (2015). How eco-
nomic downturns affect children’s development: an interdisciplinary perspec-
tive on pathways of influence. Child Development Perspectives 9, 233–238.
(50 ) Shanahan, L., Steinhoff, A., Bechtiger, L., Murray, A. L., Nivette, A., Hepp, U.,
Ribeaud, D., and Eisner, M. (2020). Emotional distress in young adults during
the COVID-19 pandemic: Evidence of risk and resilience from a longitudinal
cohort study. Psychological medicine, 1–10.
(51 ) Collins, C., Landivar, L. C., Ruppanner, L., and Scarborough, W. J. (2020).
COVID-19 and the gender gap in work hours. Gender, Work & Organization.
(52 ) van Ballegooijen, H., Goossens, L., Bruin, R. H., Michels, R., and Krol, M.
Concerns, quality of life, access to care and productivity of the general popu-
lation during the first 8 weeks of the coronavirus lockdown in Belgium and the
Netherlands, medRxiv, 2020.
(53 ) Biroli, P., Bosworth, S., Della Giusta, M., Di Girolamo, A., Jaworska, S., and
Vollen, J. Family life in lockdown, IZA Discussion Paper 13398, Institute of
Labor Economics, Bonn. 2020.
20
(54 ) Kuiper, M. E., de Bruijn, A. L., Reinders Folmer, C., Olthuis, E., Brownlee, M.,
Kooistra, E. B., Fine, A., and van Rooij, B. The intelligent lockdown: Com-
pliance with COVID-19 mitigation measures in the Netherlands, PsyArXiv,
2020.
(55 ) OECD, Students, computers and learning: Making the connection; OECD Pub-
lishing: 2015.
(56 ) Snijders, T. A., and Bosker, R. J., Multilevel analysis: An introduction to basic
and advanced multilevel modeling ; Sage: 2011.
21
Appendix
1 Background
1.1 Study context
Figure A1 provides a timeline of school closures in the OECD. In the Netherlands,
schools closed on March 16 and reopened on May 11. While students initially attended
classes every other day, since June 8 in-person instruction is back to normal activity.
Dutch school closures were short compared to many other countries and, in general,
the country pursued a light lockdown in the first wave of the pandemic (33 , 54 ).
The country leads the world in technology adoption (28 , 55 ): in 2019, more than
90% of households enjoyed broadband access even among the poorest quartile (29 ).
Adding to this advantage, the policy response has been swift: already in March 2020,
the Ministry of Education devoted 2.5 million euros to online learning devices for
students in need (30 ), and this scheme was extended with another 3.8 million in June
(31 ).
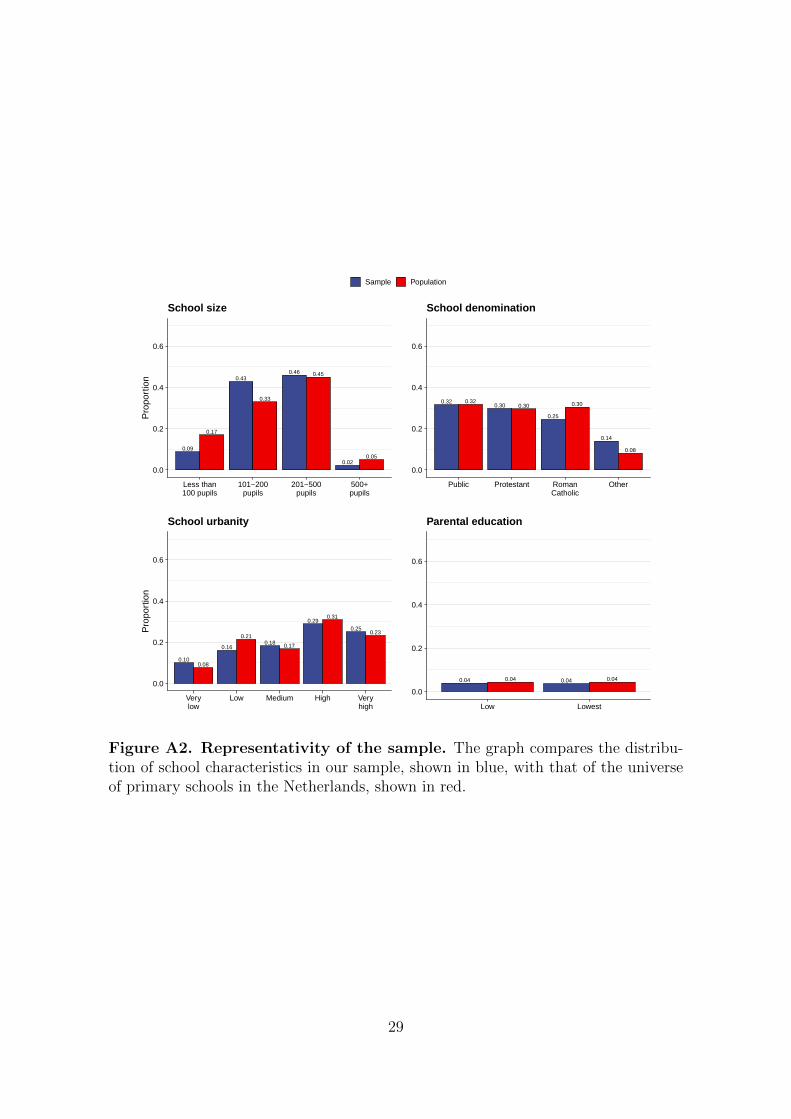
1.2 Representativeness
Our sample contains schools that have opted in to the digital platform service that we
partner with to analyze learning loss. Although covering a subset of schools, the sam-
ple is large (n≈350,000) and broadly representative of the national student population.
Figure A2 compares the distribution of key school characteristics in the sample and
the population as a whole. As this figure shows, there is some over-representation of
mid-sized schools (101–200 students). Crucially, however, the relative representation
of public as opposed to private schools is identical to that in the student population,
as is the socioeconomic composition of the sample as represented by the parental
education variable that we use in our main analysis.
22
1.3 School variables
Test scores and individual covariates are described in the main manuscript. In ad-
dition, we use school-level characteristics to balance observations using maximum
entropy and propensity of treatment weights (Section 2.5 below and Figure 4 in the
main manuscript). We also use these measures in Section 2.2, where we examine
school-level treatment effects.
Socioeconomic disadvantage This score ranges from 20 to 40, and is a composite
based on the parental education variable used in our main analyses, with weights
assigned according to the norm used by the Central Bureau of Statistics: 0.3 for
“low education” (both parents have a degree above primary education but neither
has one above lower secondary education) and 1.2 for “lowest education” (at least
one parent has no degree above primary education and neither has a degree above
lower secondary).
Proportion immigrant background The proportion of non-Western inhabitants
is based on the neighborhood in which a school is located, which closely correlates
with a school’s student composition as most students attend a school close to their
home. A person is defined as having a non-Western background if they or at least
one of their parents were born in Turkey or countries in Africa, Latin America and
Asia, except former Dutch colonies and Japan. This variable is not available at an
individual level in our data.
School denomination In our matched analyses, we include school denomination
as an additional control variable. Here we distinguish three categories: public schools,
Christian schools (including Protestant, Catholic, and Reformist denominations), and
other denominations (including inter alia Islamic and Waldorf schools).
23

2 Additional results
2.1 Regression tables
Table A1 displays the main effect reported in main manuscript Figure 2, as well as
the separate results by subject domain. Table A2 shows results by parental education
for the composite score as reported in main text Figure 2, and results for separate
subjects. Table A3 does the same for student sex and Table A4 does so for prior
performance. In Table A5, we report additional regression results simultaneously
controlling for individual-level covariates: parental education, student sex, prior per-
formance. In Table A6 we restrict the sample to only those students with a valid
score in all three subjects.
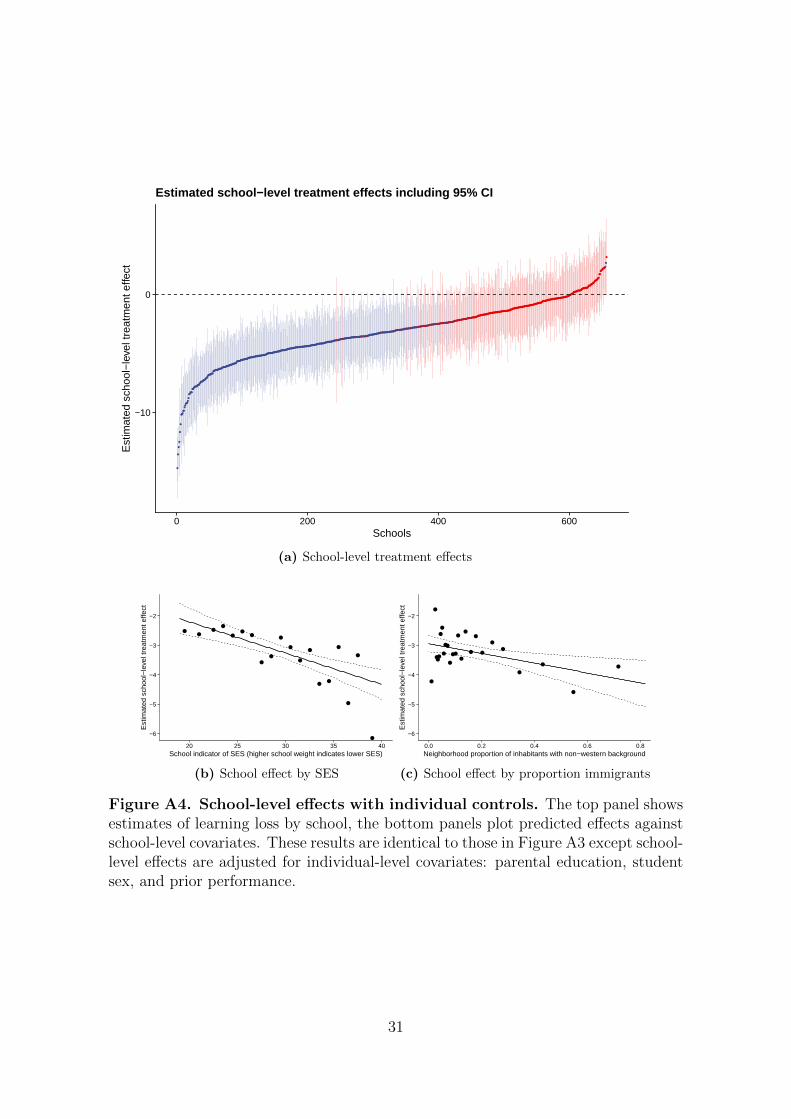
2.2 School variability
Figure A3–A4 report estimates from a mixed-effects model that lets the learning
loss differ between schools (56 ). The results reveal considerable variation, with some
schools seeing a learning slide of 10 percentile points or more, and others recording no
losses or even small gains. In both cases, we plot the predicted school-level treatment
effects against school-level socioeconomic disadvantage and the share of non-Western
immigrants in the school neighborhood. Losses are larger in schools with a high
proportion of students from less-educated homes and of immigrant background, and
this holds further when adjusting for individual-level covariates.
2.3 Placebo analysis
In Figure A5 we perform a placebo analysis on non-treated years. We do so by keep-
ing the specification identical to our main analysis but excluding the actual treatment
year and, in turn, assigning treatment status to each of the three comparison years.
Doing so reveals few significant effects, and those that are so by chance are mostly
in the opposite direction of the results reported in the main manuscript. Our iden-
24
tification strategy thus appears robust to false positives, and if anything, is likely to
underestimate the treatment effect somewhat given the small bias towards a positive
treatment effect in two of three control years. Crucially, however, the pooled effect is
not significantly different from zero in any year.
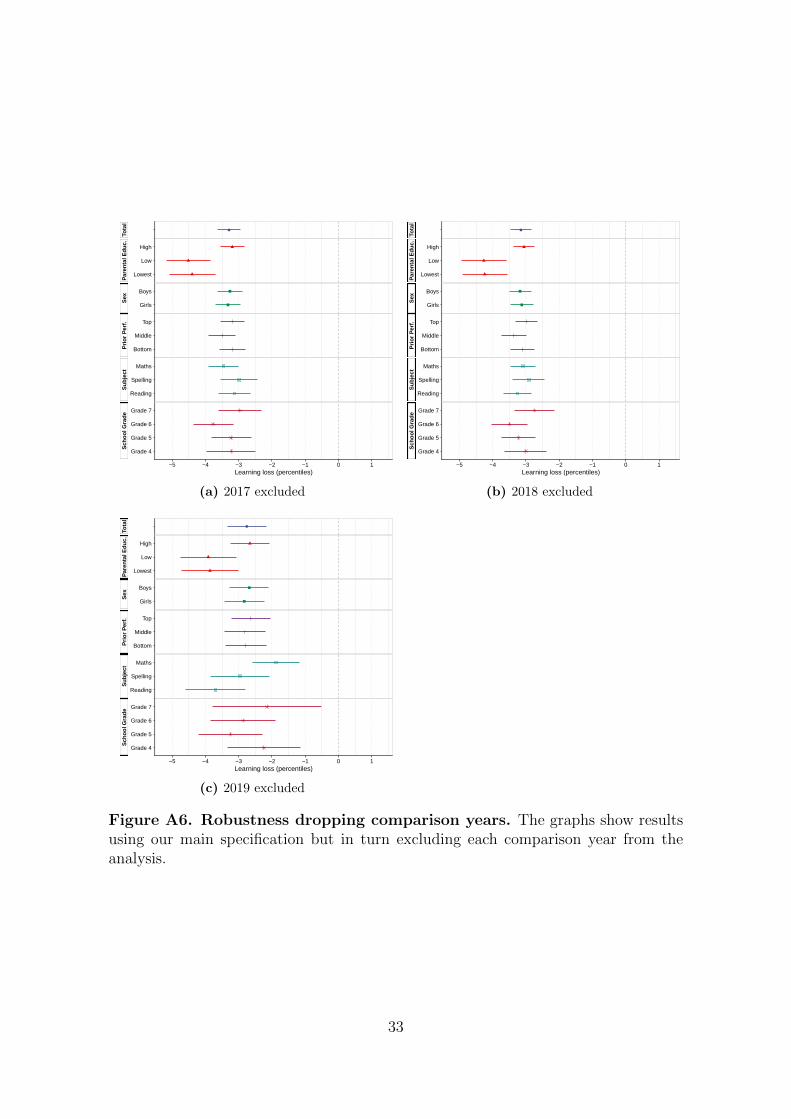
2.4 Year exclusions
We re-estimate our main specification dropping comparison years one at a time to
confirm that our results are not driven by any one comparison year. Figure A6
reports the results from these analyses. Although the estimates are less precisely
estimated, especially in the last analysis dropping the year immediately preceding
the treatment, the qualitative results remain unchanged. Specifically, the difference
in effect size between students from high- and low-educated homes remains similar
and is significant at the 0.1% level throughout these analyses.
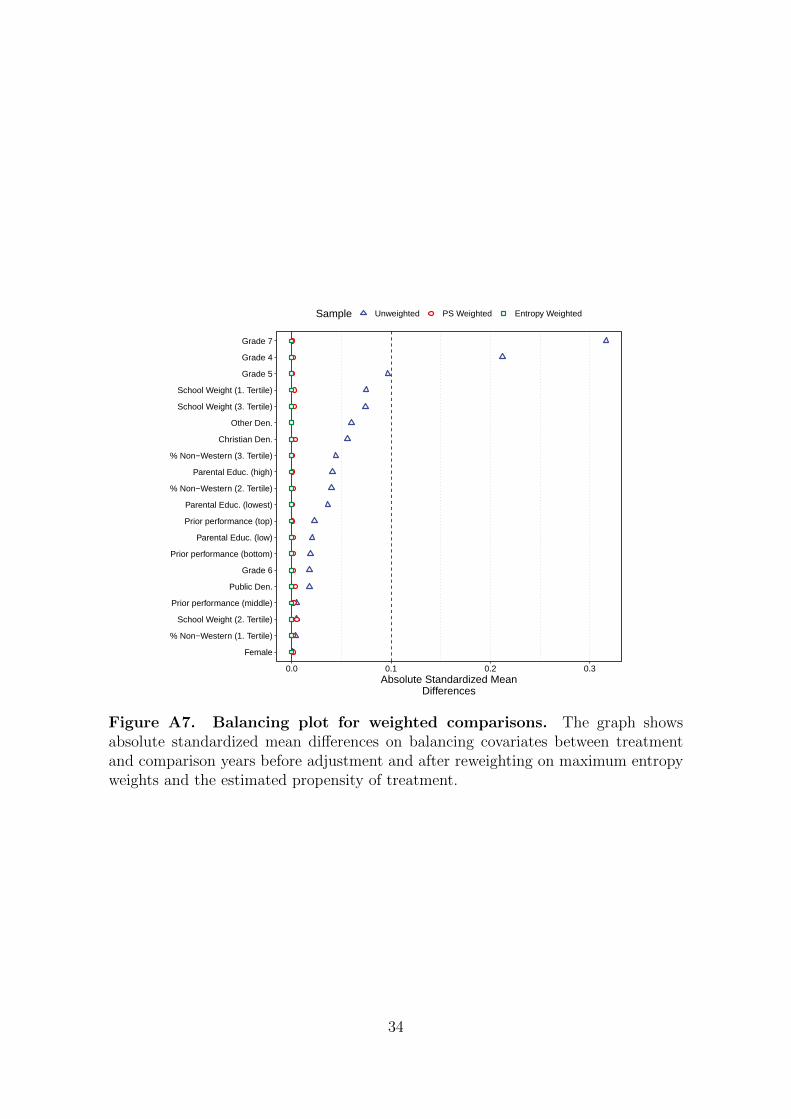
2.5 Covariate balancing
To further address loss to follow-up we implement re-weighting on the propensity of
treatment and maximum entropy balancing. Figure A7 shows that both methods
achieve a sample that is balanced on the desired characteristics. The weighted re-
gressions use either of these sets of unit weights to rebalance treatment and control
groups and achieve comparability. Figure A8 displays our main results using both
sets of weights. The results correspond closely across both weighting schemes and are
also not appreciably different from our main specification as reported in Figure 2 of
the main manuscript.
2.6 Near-complete schools
Moreover, we restrict the sample to only schools where at least 75% of students
were tested in the treatment year. Table A7 reports the main treatment effect using
this restriction, which remains significant at the 0.1% level and near identical in
25

magnitude to that of our main analysis (–3.18 in Table A7 vs –3.13 in Table A1 and
main manuscript Figure 2). Table A8 further displays differential treatment effects by
parental education. The estimated treatment at low levels of education is, if anything,
slightly larger than estimates reported in our main analysis.
2.7 School fixed effects
Table A9 shows results adding school fixed effects, while Table A10 does so for the
interaction by parental education. Again, the estimated treatment effect is significant
at the 0.1% level and remains similar in magnitude to our estimates reported in the
main text: –3.17 for the whole student body pooled (Table A9) with an added penalty
of –1.30 and –1.33 for the groups from less-educated homes, over the baseline of –3.07
for those with at least one higher educated parent (Table A10).
2.8 Family fixed effects
Figure A9 and Tables A11–A12 report results using family fixed effects. This restricts
the sample to treated students where either they or a sibling is observed in a com-
parison year. We sacrifice roughly 60% of our original sample size, which makes the
results somewhat less stable. Nevertheless they remain qualitatively similar, and so-
cioeconomic differences in this analysis are somewhat larger: the added added penalty
is –1.34 and –1.74 for those from less-educated homes, over the over the baseline of
–3.16 for those with at least one higher educated parent (Table A12).
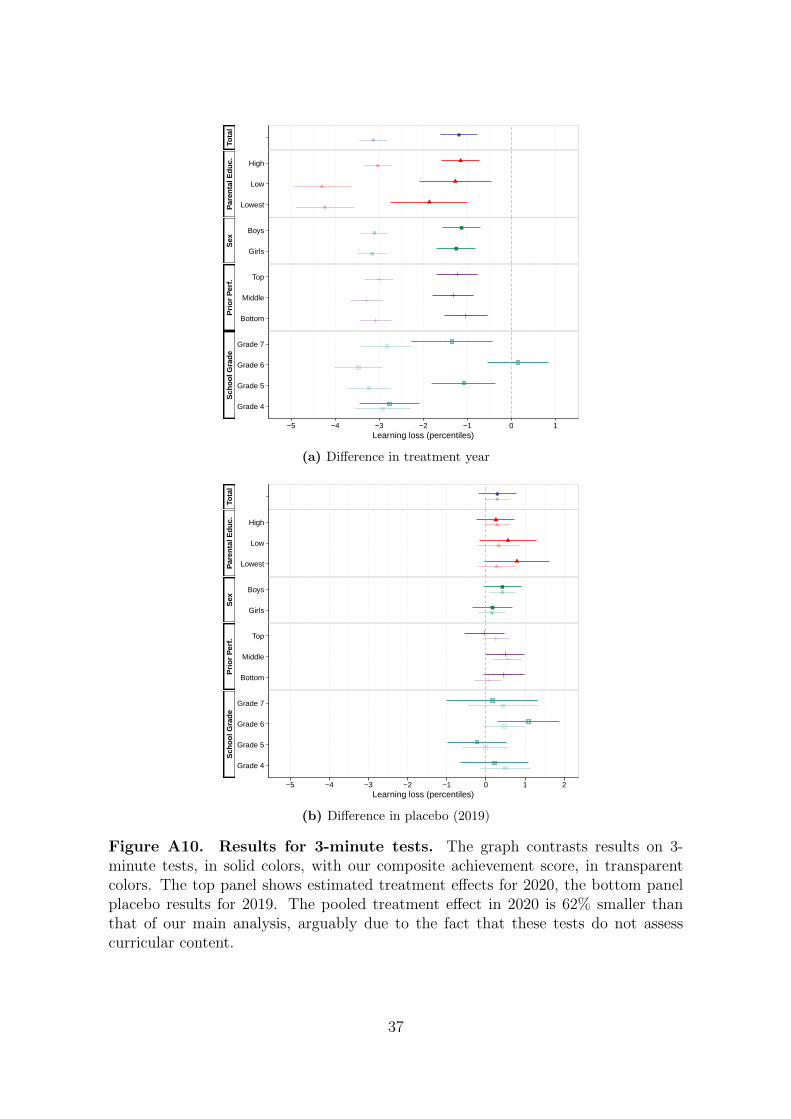
2.9 3-minute tests
We also assess students’ performance on short 3-minute tests not designed to test
curricular content. If our main estimates of learning loss reflect the cumulative impact
of knowledge learned, we would expect these effects to be small or zero. In contrast,
if our estimates of learning loss mainly reflect “day of exam” effects due to stress
exposure, testing conditions, or familiarity with the school setting, we would expect
26
similarly large losses on both kinds of test. Figure A10, top panel, reveals that the
treatment effect on this outcome is on average 62% smaller than for our main outcome.
Figure A10, bottom panel, shows that this is not the case in a non-treatment year,
where estimated null effects on the both tests are instead near identical.
27

AustraliaAustria
BelgiumCanada
ChileCzech Republic
DenmarkEstoniaFinlandFrance
GermanyGreece
HungaryIcelandIreland
IsraelItaly
JapanLuxembourg
MexicoNetherlands
New ZealandNorwayPoland
PortugalSlovenia
South KoreaSpain
SwedenSwitzerland
TurkeyUnited Kingdom
United StatesFeb Mar Apr May Jun Jul Aug Sep
School closures Required at all levels Required at some levels Recommended
Figure A1. School closures in the OECD. The graph shows the onset andduration of school closures in 33 OECD countries, with the Netherlands marked inorange. Includes all OECD countries for which data could be located. Source: OxfordCOVID-19 Government Response Tracker (https://covidtracker.bsg.ox.ac.uk/).
28
Sample Population
0.09
0.430.46
0.02
0.17
0.33
0.45
0.05
0.0
0.2
0.4
0.6
Less than100 pupils
101−200pupils
201−500pupils
500+pupils
Pro
port
ion
School size
0.14
0.320.30
0.25
0.08
0.320.30 0.30
0.0
0.2
0.4
0.6
Public Protestant RomanCatholic
Other
School denomination
0.10
0.160.18
0.290.25
0.08
0.21
0.17
0.31
0.23
0.0
0.2
0.4
0.6
Verylow
Low Medium High Veryhigh
Pro
port
ion
School urbanity
0.04 0.040.04 0.04
0.0
0.2
0.4
0.6
Low Lowest
Parental education
Figure A2. Representativity of the sample. The graph compares the distribu-tion of school characteristics in our sample, shown in blue, with that of the universeof primary schools in the Netherlands, shown in red.
29

●
●
●●
●●
●●
●●●
●
●●●●●
●
●●●
●
●
●●●●●
●●●●●●●●●●
●●●●●●
●●●●●●●●●
●●●●●●●●●●●●●●●●●●●●●●●●●●●●
●●●●●●●●●●●●●●●●●●●●●●●●●●●●●●●●●●●●●●●●●●●●●●●●●●●●●●●●●●●●●●●●●●●●●●●●●●●●●●●●●●●●●●●●●●●●●●●●●●●●●●●●●●●●●●●●●●●●●●●●●●●●●●●●●●
●●●●●●●●●●●●●●●●●●●●●●●●●●●●●●●●●●●●●●●●●●●●●●●●●●●●●●●●●●●●●●●●●●●●●●●●●●●●●●●●●●●●●●●●●●●●●●●●●●●●●●●●●●●●●●●●●●●●●●●●●●●●●●●●●●●●●●●●●●●●●●●●●●●●●●●●●●●●●●●●●●●●●●●●●●●●●●●●●●●●●●●●●●●●●●●●●●●●●●●●●●●●●●●●●●●●●●●●●●●●●●●●●●●●●●●●●●●●●●●●●●●●●●●●●●●●●●●●●●●●●●●●●●●●●●●●●●●●●●●●●●●●●●●●●●●●●●●
●●●●●●●●●●●●●●●●●●●●●●●●●●●●●●●●●●●●●●●●●●●●●●●●●●●●●●●●●●●●●●●●●●●●●●●●●●●●●●●●●●
●●●●●●●●●●●●●●●●●●●●●●●●●●●●●●●●●●●●●●●●●●●●
●●●
●●●●●●●●●●
●●●●●●●●●
●
●●●
●●●●
●●●●●●
●
●
●
−10
0
0 200 400 600Schools
Est
imat
ed s
choo
l−le
vel t
reat
men
t effe
ct
Estimated school−level treatment effects including 95% CI
(a) School-level treatment effects
●
●
●
●
●●
●
●
●
●
●
●
●
●●
●
●
●
●−6
−5
−4
−3
−2
20 25 30 35 40School indicator of SES (higher school weight indicates lower SES)
Est
imat
ed s
choo
l−le
vel t
reat
men
t effe
ct
(b) School effect by SES
●
●
●
●
●
●
●
●
●●
●
●
●
●
●
●
●
●
●
●
●
●
●
●
●
−6
−5
−4
−3
−2
0.0 0.2 0.4 0.6 0.8Neighborhood proportion of inhabitants with non−western background
Est
imat
ed s
choo
l−le
vel t
reat
men
t effe
ct
(c) School effect by proportion immigrants
Figure A3. School-level effects. The top panel shows estimates of learning loss byschool from a linear mixed model allowing learning loss to differ across schools. Thebottom panels plot the predicted effects against school-level covariates: socioeconomicdisadvantage and proportion non-Western immigrant background.
30
●
●
●
●
●
●
●●●
●●
●
●
●●●
●
●
●●●●●
●●●●●●●●
●●●●●●●●●
●●●●●●
●●●●●●●●●
●●●●●●●●●●●●●●
●●●●●●●●●●●●●●●●●●●●●●
●●●●●●●●●●●●●●●●●
●●●●●●●●●●●●●●●●●●●●●●●●●●●●●●●●●●●●●●●●●●●●●●●●●●●●●●●●●●●●●●●●●●●●●●●●●●●●●●●●●●●●●●●●●●●●●●●●●●●●●●●●●●●●●●●●●●●●●●●●●●●●●●●●●●●●●●●●●●●●●●●●●●●●●●●●●●●●●●●●●●●●●●●●●●●●●●●●●●●●●●●●●●●●●●●●●●●●●●●●●●●●●●●●●●●●●●●●●●●●●●●●●●●●●●●●●●●●●●●●●●●●●●●●●●●●●●●●●●●●●●●●●●●●●●●●●●●●●●●●●●●●●●●●●●●●●●●●●●●●●●●●●●●●●●●●●●●●●●●●●●●●●●●●●●●●●●●●●●●●●●●●●●●●●●●●●●●●●●●●●●●●●●●●●●●●●●●●●●●●●●●●●●●●●●●●●●●●●●●●●●●●●●●●●●●●●●●●●●●●●●●●●●●●●●●●●●●●●●●●●●●●●●●●●
●●●●●●●●●●●●●●●●●●●●●●●●●●●●●●●●●●●●●●●●●●●●●●●●●
●●●●●●●●●●●●●●
●●●●●●●●●●●●●
●●●●●●●●●●
●●
●●
●●●
●●●●
●
●
●
−10
0
0 200 400 600Schools
Est
imat
ed s
choo
l−le
vel t
reat
men
t effe
ct
Estimated school−level treatment effects including 95% CI
(a) School-level treatment effects
●●
●
●
●
●
●
●
●
●
●
●
●
●●
●
●
●
●−6
−5
−4
−3
−2
20 25 30 35 40School indicator of SES (higher school weight indicates lower SES)
Est
imat
ed s
choo
l−le
vel t
reat
men
t effe
ct
(b) School effect by SES
●
●
●●●
●
●
●
●●
●
● ●
●
●
●
●
●
●
●
●
●
●
●
●
−6
−5
−4
−3
−2
0.0 0.2 0.4 0.6 0.8Neighborhood proportion of inhabitants with non−western background
Est
imat
ed s
choo
l−le
vel t
reat
men
t effe
ct
(c) School effect by proportion immigrants
Figure A4. School-level effects with individual controls. The top panel showsestimates of learning loss by school, the bottom panels plot predicted effects againstschool-level covariates. These results are identical to those in Figure A3 except school-level effects are adjusted for individual-level covariates: parental education, studentsex, and prior performance.
31

Tota
lP
aren
tal E
duc.
Sex
Prio
r P
erf.
Sub
ject
Sch
ool G
rade
−5 −4 −3 −2 −1 0 1
Lowest
Low
High
Girls
Boys
Bottom
Middle
Top
Reading
Spelling
Maths
Grade 4
Grade 5
Grade 6
Grade 7
Learning loss (percentiles)
(a) 2017 as treated
Tota
lP
aren
tal E
duc.
Sex
Prio
r P
erf.
Sub
ject
Sch
ool G
rade
−5 −4 −3 −2 −1 0 1
Lowest
Low
High
Girls
Boys
Bottom
Middle
Top
Reading
Spelling
Maths
Grade 4
Grade 5
Grade 6
Grade 7
Learning loss (percentiles)
(b) 2018 as treated
Tota
lP
aren
tal E
duc.
Sex
Prio
r P
erf.
Sub
ject
Sch
ool G
rade
−5 −4 −3 −2 −1 0 1
Lowest
Low
High
Girls
Boys
Bottom
Middle
Top
Reading
Spelling
Maths
Grade 4
Grade 5
Grade 6
Grade 7
Learning loss (percentiles)
(c) 2019 as treated
Figure A5. Placebo effects for non-treated years. The graphs show resultsusing our main specification but excluding the actual treatment year and insteadassigning treatment status to each comparison year.
32
Tota
lP
aren
tal E
duc.
Sex
Prio
r P
erf.
Sub
ject
Sch
ool G
rade
−5 −4 −3 −2 −1 0 1
Lowest
Low
High
Girls
Boys
Bottom
Middle
Top
Reading
Spelling
Maths
Grade 4
Grade 5
Grade 6
Grade 7
Learning loss (percentiles)
(a) 2017 excluded
Tota
lP
aren
tal E
duc.
Sex
Prio
r P
erf.
Sub
ject
Sch
ool G
rade
−5 −4 −3 −2 −1 0 1
Lowest
Low
High
Girls
Boys
Bottom
Middle
Top
Reading
Spelling
Maths
Grade 4
Grade 5
Grade 6
Grade 7
Learning loss (percentiles)
(b) 2018 excluded
Tota
lP
aren
tal E
duc.
Sex
Prio
r P
erf.
Sub
ject
Sch
ool G
rade
−5 −4 −3 −2 −1 0 1
Lowest
Low
High
Girls
Boys
Bottom
Middle
Top
Reading
Spelling
Maths
Grade 4
Grade 5
Grade 6
Grade 7
Learning loss (percentiles)
(c) 2019 excluded
Figure A6. Robustness dropping comparison years. The graphs show resultsusing our main specification but in turn excluding each comparison year from theanalysis.
33
Female
% Non−Western (1. Tertile)
School Weight (2. Tertile)
Prior performance (middle)
Public Den.
Grade 6
Prior performance (bottom)
Parental Educ. (low)
Prior performance (top)
Parental Educ. (lowest)
% Non−Western (2. Tertile)
Parental Educ. (high)
% Non−Western (3. Tertile)
Christian Den.
Other Den.
School Weight (3. Tertile)
School Weight (1. Tertile)
Grade 5
Grade 4
Grade 7
0.0 0.1 0.2 0.3Absolute Standardized Mean
Differences
Sample Unweighted PS Weighted Entropy Weighted
Figure A7. Balancing plot for weighted comparisons. The graph showsabsolute standardized mean differences on balancing covariates between treatmentand comparison years before adjustment and after reweighting on maximum entropyweights and the estimated propensity of treatment.
34

E−Balance P−Score
Tota
lP
aren
tal E
duc.
Sex
Prio
r P
erf.
Sub
ject
Sch
ool G
rade
−5 −4 −3 −2 −1 0 1 −5 −4 −3 −2 −1 0 1
Lowest
Low
High
Girls
Boys
Bottom
Middle
Top
Reading
Spelling
Maths
Grade 4
Grade 5
Grade 6
Grade 7
Learning loss (percentiles)
Figure A8. Entropy balanced and propensity-score weighted results. Thegraph shows results using our main specification while balancing treatment and con-trol years on maximum entropy weights (“E-Balance,” left) and the estimated propen-sity of treatment (“P-Score,” right).
35

Tota
lP
aren
tal E
duc.
Sex
Prio
r P
erf.
Sub
ject
Sch
ool G
rade
−7 −6 −5 −4 −3 −2 −1 0 1 2
Lowest
Low
High
Girls
Boys
Bottom
Middle
Top
Reading
Spelling
Maths
Grade 4
Grade 5
Grade 6
Grade 7
Learning loss (percentiles)
Figure A9. Family fixed effects. The graph shows results combining ourdifference-in-differences with family fixed effects. This analysis discards all varia-tion between families by introducing a separate intercept for each sibling group, thusadjusting for any heterogeneity across families.
36
Tota
lP
aren
tal E
duc.
Sex
Prio
r P
erf.
Sch
ool G
rade
−5 −4 −3 −2 −1 0 1
Lowest
Low
High
Girls
Boys
Bottom
Middle
Top
Grade 4
Grade 5
Grade 6
Grade 7
Learning loss (percentiles)
(a) Difference in treatment year
Tota
lP
aren
tal E
duc.
Sex
Prio
r P
erf.
Sch
ool G
rade
−5 −4 −3 −2 −1 0 1 2
Lowest
Low
High
Girls
Boys
Bottom
Middle
Top
Grade 4
Grade 5
Grade 6
Grade 7
Learning loss (percentiles)
(b) Difference in placebo (2019)
Figure A10. Results for 3-minute tests. The graph contrasts results on 3-minute tests, in solid colors, with our composite achievement score, in transparentcolors. The top panel shows estimated treatment effects for 2020, the bottom panelplacebo results for 2019. The pooled treatment effect in 2020 is 62% smaller thanthat of our main analysis, arguably due to the fact that these tests do not assesscurricular content.
37

Table A1. Main effects by subject.
Composite Maths Reading SpellingTreatment −3.13∗∗∗ −2.97∗∗∗ −3.30∗∗∗ −2.97∗∗∗
(0.16) (0.19) (0.21) (0.24)Year (std.) 0.70∗∗∗ 0.21∗∗ 0.94∗∗∗ 0.98∗∗∗
(0.06) (0.07) (0.09) (0.09)Days between tests (std.) 0.48∗∗∗ 0.54∗∗∗ 0.20∗∗ 0.64∗∗∗
(0.05) (0.05) (0.07) (0.09)(Intercept) 0.69∗∗∗ 0.56∗∗∗ 1.11∗∗∗ 0.60∗∗∗
(0.06) (0.07) (0.08) (0.11)R2 0.01 0.00 0.00 0.00Adj. R2 0.01 0.00 0.00 0.00Num. obs. 358407 352656 272382 343151RMSE 11.04 14.86 18.78 17.00N Clusters 937 937 930 936∗∗∗p < 0.001; ∗∗p < 0.01; ∗p < 0.05
Table A2. Results by parental education and subject.
Composite Maths Reading SpellingTreatment −3.04∗∗∗ −2.85∗∗∗ −3.24∗∗∗ −2.86∗∗∗
(0.16) (0.19) (0.21) (0.24)Treat x Par. Educ. (low) −1.26∗∗∗ −1.11∗∗ −1.15∗ −1.72∗∗∗
(0.29) (0.39) (0.48) (0.44)Treat x Par. Educ. (lowest) −1.20∗∗∗ −1.81∗∗∗ −0.41 −1.29∗
(0.33) (0.42) (0.43) (0.51)Parental Educ. (low) −0.26∗ −0.29 −0.58∗∗ 0.11
(0.12) (0.16) (0.21) (0.20)Parental Educ. (lowest) 0.21 0.41∗ −1.00∗∗∗ 0.89∗∗
(0.16) (0.17) (0.20) (0.29)Year (std.) 0.70∗∗∗ 0.21∗∗ 0.94∗∗∗ 0.98∗∗∗
(0.06) (0.07) (0.09) (0.09)Days between tests (std.) 0.48∗∗∗ 0.54∗∗∗ 0.20∗∗ 0.64∗∗∗
(0.05) (0.05) (0.07) (0.09)(Intercept) 0.70∗∗∗ 0.55∗∗∗ 1.18∗∗∗ 0.56∗∗∗
(0.06) (0.07) (0.08) (0.12)R2 0.01 0.00 0.00 0.00Adj. R2 0.01 0.00 0.00 0.00Num. obs. 358407 352656 272382 343151RMSE 11.03 14.86 18.78 17.00N Clusters 937 937 930 936∗∗∗p < 0.001; ∗∗p < 0.01; ∗p < 0.05
38
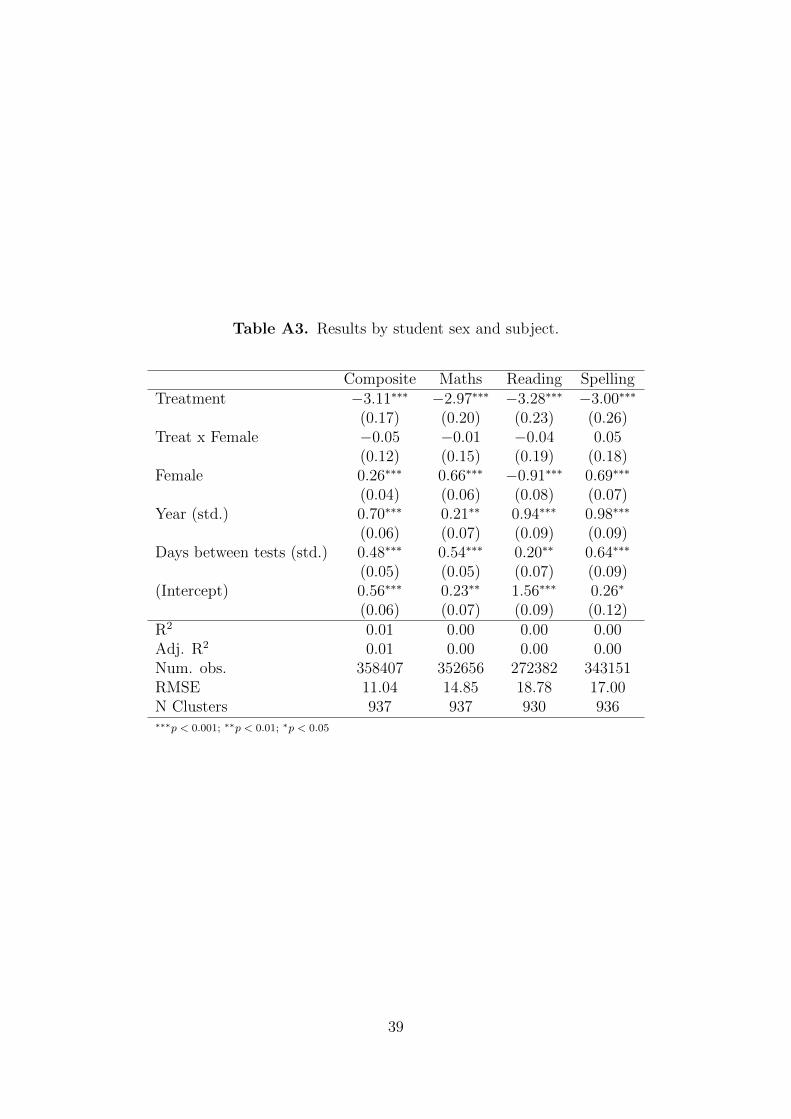
Table A3. Results by student sex and subject.
Composite Maths Reading SpellingTreatment −3.11∗∗∗ −2.97∗∗∗ −3.28∗∗∗ −3.00∗∗∗
(0.17) (0.20) (0.23) (0.26)Treat x Female −0.05 −0.01 −0.04 0.05
(0.12) (0.15) (0.19) (0.18)Female 0.26∗∗∗ 0.66∗∗∗ −0.91∗∗∗ 0.69∗∗∗
(0.04) (0.06) (0.08) (0.07)Year (std.) 0.70∗∗∗ 0.21∗∗ 0.94∗∗∗ 0.98∗∗∗
(0.06) (0.07) (0.09) (0.09)Days between tests (std.) 0.48∗∗∗ 0.54∗∗∗ 0.20∗∗ 0.64∗∗∗
(0.05) (0.05) (0.07) (0.09)(Intercept) 0.56∗∗∗ 0.23∗∗ 1.56∗∗∗ 0.26∗
(0.06) (0.07) (0.09) (0.12)R2 0.01 0.00 0.00 0.00Adj. R2 0.01 0.00 0.00 0.00Num. obs. 358407 352656 272382 343151RMSE 11.04 14.85 18.78 17.00N Clusters 937 937 930 936∗∗∗p < 0.001; ∗∗p < 0.01; ∗p < 0.05
39

Table A4. Results by prior performance and subject.
Composite Maths Reading SpellingTreatment −3.00∗∗∗ −3.11∗∗∗ −3.15∗∗∗ −2.46∗∗∗
(0.17) (0.21) (0.24) (0.27)Treat x Prior Perf. (middle) −0.29∗ −0.10 −0.22 −0.67∗∗∗
(0.13) (0.18) (0.23) (0.20)Treat x Prior Perf. (bottom) −0.08 0.62∗∗ −0.23 −0.90∗∗∗
(0.16) (0.21) (0.25) (0.24)Prior Perf. (middle) 0.59∗∗∗ 0.60∗∗∗ 0.36∗∗∗ 0.75∗∗∗
(0.06) (0.08) (0.10) (0.09)Prior Perf. (bottom) 1.02∗∗∗ 0.88∗∗∗ 0.76∗∗∗ 1.34∗∗∗
(0.07) (0.09) (0.11) (0.11)Year (std.) 0.70∗∗∗ 0.21∗∗ 0.94∗∗∗ 0.97∗∗∗
(0.06) (0.07) (0.09) (0.09)Days between tests (std.) 0.48∗∗∗ 0.54∗∗∗ 0.20∗∗ 0.64∗∗∗
(0.05) (0.05) (0.07) (0.09)(Intercept) 0.18∗∗ 0.08 0.76∗∗∗ −0.06
(0.07) (0.08) (0.09) (0.12)R2 0.01 0.01 0.00 0.00Adj. R2 0.01 0.01 0.00 0.00Num. obs. 358407 352656 272382 343151RMSE 11.03 14.85 18.78 17.00N Clusters 937 937 930 936∗∗∗p < 0.001; ∗∗p < 0.01; ∗p < 0.05
40

Table A5. Main effects with controls.
Composite Maths Reading SpellingTreatment −3.12∗∗∗ −2.97∗∗∗ −3.22∗∗∗ −2.98∗∗∗
(0.16) (0.19) (0.21) (0.24)Parental Educ. (low) −0.74∗∗∗ −0.75∗∗∗ −0.98∗∗∗ −0.44∗
(0.11) (0.14) (0.19) (0.18)Parental Educ. (lowest) −0.32∗ −0.20 −1.33∗∗∗ 0.35
(0.13) (0.15) (0.18) (0.26)Female 0.26∗∗∗ 0.67∗∗∗ −0.91∗∗∗ 0.70∗∗∗
(0.04) (0.05) (0.07) (0.06)Prior Perf. (middle) 0.55∗∗∗ 0.60∗∗∗ 0.36∗∗∗ 0.64∗∗∗
(0.05) (0.07) (0.09) (0.08)Prior Perf. (bottom) 1.06∗∗∗ 1.06∗∗∗ 0.82∗∗∗ 1.20∗∗∗
(0.06) (0.07) (0.10) (0.10)Grade 5 −0.01 −0.10 −0.32 0.31
(0.12) (0.14) (0.18) (0.23)Grade 6 0.02 0.01 0.18 0.01
(0.11) (0.14) (0.17) (0.19)Grade 7 0.08 −0.06 0.69∗∗∗ −0.07
(0.13) (0.17) (0.19) (0.22)Year (std.) 0.69∗∗∗ 0.21∗∗ 0.82∗∗∗ 0.99∗∗∗
(0.06) (0.07) (0.10) (0.09)Days between tests (std.) 0.48∗∗∗ 0.55∗∗∗ 0.21∗∗ 0.64∗∗∗
(0.05) (0.05) (0.07) (0.09)(Intercept) 0.07 −0.23 1.21∗∗∗ −0.39
(0.11) (0.14) (0.15) (0.20)R2 0.01 0.01 0.00 0.00Adj. R2 0.01 0.01 0.00 0.00Num. obs. 358407 352656 272382 343151RMSE 11.03 14.85 18.77 16.99N Clusters 937 937 930 936∗∗∗p < 0.001; ∗∗p < 0.01; ∗p < 0.05
41

Table A6. Main effects, complete subject scores only.
Composite Maths Reading SpellingTreatment −3.05∗∗∗ −3.05∗∗∗ −3.38∗∗∗ −2.73∗∗∗
(0.17) (0.22) (0.22) (0.27)Year (std.) 0.68∗∗∗ 0.35∗∗∗ 0.96∗∗∗ 0.73∗∗∗
(0.07) (0.09) (0.09) (0.11)Days between tests (std.) 0.49∗∗∗ 0.56∗∗∗ 0.24∗∗∗ 0.68∗∗∗
(0.05) (0.06) (0.07) (0.10)(Intercept) 0.84∗∗∗ 0.54∗∗∗ 1.12∗∗∗ 0.87∗∗∗
(0.06) (0.07) (0.08) (0.12)R2 0.01 0.00 0.00 0.00Adj. R2 0.01 0.00 0.00 0.00Num. obs. 259206 259206 259206 259206RMSE 10.53 14.94 18.79 16.99N Clusters 929 929 929 929∗∗∗p < 0.001; ∗∗p < 0.01; ∗p < 0.05
Table A7. Main effects in near-complete schools.
Composite Maths Reading SpellingTreatment −3.18∗∗∗ −2.98∗∗∗ −3.26∗∗∗ −3.13∗∗∗
(0.19) (0.23) (0.25) (0.27)Year (std.) 0.73∗∗∗ 0.21∗ 0.88∗∗∗ 1.12∗∗∗
(0.08) (0.09) (0.12) (0.12)Days between tests (std.) 0.39∗∗∗ 0.51∗∗∗ 0.14 0.47∗∗∗
(0.06) (0.07) (0.09) (0.11)(Intercept) 0.82∗∗∗ 0.62∗∗∗ 1.23∗∗∗ 0.77∗∗∗
(0.08) (0.08) (0.10) (0.15)R2 0.01 0.01 0.00 0.00Adj. R2 0.01 0.01 0.00 0.00Num. obs. 248346 244227 190227 235817RMSE 11.06 14.88 18.79 16.97N Clusters 594 594 591 593∗∗∗p < 0.001; ∗∗p < 0.01; ∗p < 0.05
42
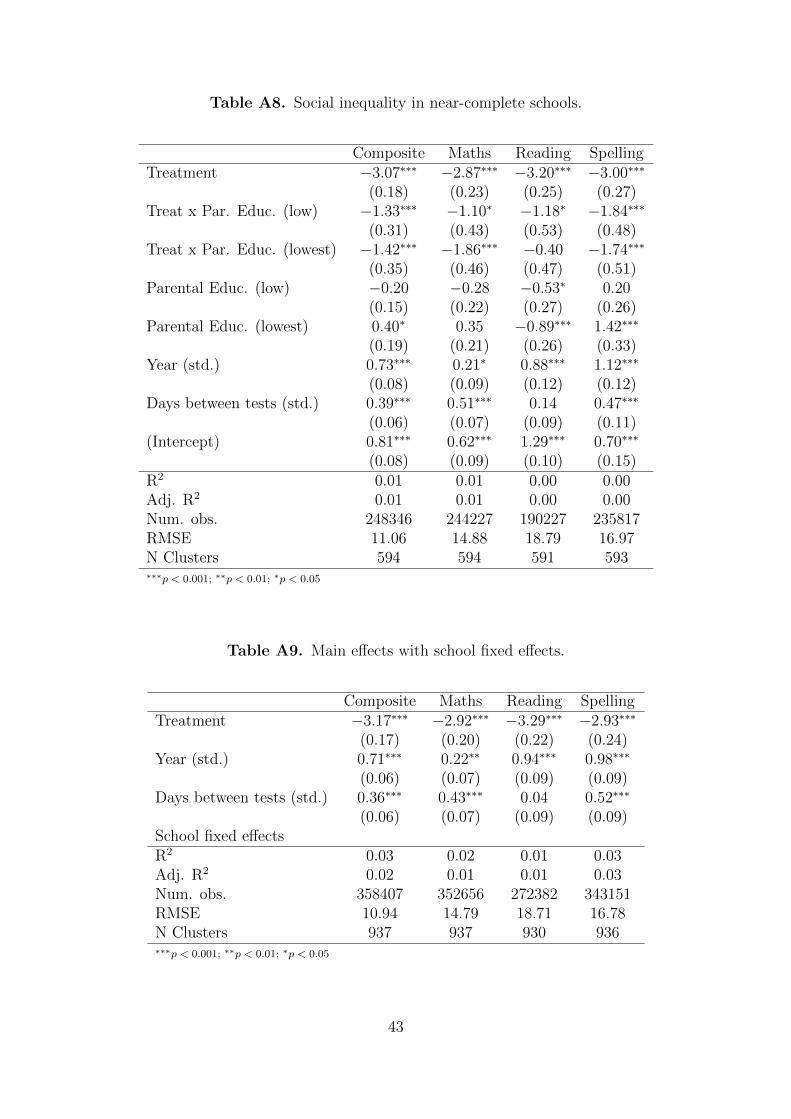
Table A8. Social inequality in near-complete schools.
Composite Maths Reading SpellingTreatment −3.07∗∗∗ −2.87∗∗∗ −3.20∗∗∗ −3.00∗∗∗
(0.18) (0.23) (0.25) (0.27)Treat x Par. Educ. (low) −1.33∗∗∗ −1.10∗ −1.18∗ −1.84∗∗∗
(0.31) (0.43) (0.53) (0.48)Treat x Par. Educ. (lowest) −1.42∗∗∗ −1.86∗∗∗ −0.40 −1.74∗∗∗
(0.35) (0.46) (0.47) (0.51)Parental Educ. (low) −0.20 −0.28 −0.53∗ 0.20
(0.15) (0.22) (0.27) (0.26)Parental Educ. (lowest) 0.40∗ 0.35 −0.89∗∗∗ 1.42∗∗∗
(0.19) (0.21) (0.26) (0.33)Year (std.) 0.73∗∗∗ 0.21∗ 0.88∗∗∗ 1.12∗∗∗
(0.08) (0.09) (0.12) (0.12)Days between tests (std.) 0.39∗∗∗ 0.51∗∗∗ 0.14 0.47∗∗∗
(0.06) (0.07) (0.09) (0.11)(Intercept) 0.81∗∗∗ 0.62∗∗∗ 1.29∗∗∗ 0.70∗∗∗
(0.08) (0.09) (0.10) (0.15)R2 0.01 0.01 0.00 0.00Adj. R2 0.01 0.01 0.00 0.00Num. obs. 248346 244227 190227 235817RMSE 11.06 14.88 18.79 16.97N Clusters 594 594 591 593∗∗∗p < 0.001; ∗∗p < 0.01; ∗p < 0.05
Table A9. Main effects with school fixed effects.
Composite Maths Reading SpellingTreatment −3.17∗∗∗ −2.92∗∗∗ −3.29∗∗∗ −2.93∗∗∗
(0.17) (0.20) (0.22) (0.24)Year (std.) 0.71∗∗∗ 0.22∗∗ 0.94∗∗∗ 0.98∗∗∗
(0.06) (0.07) (0.09) (0.09)Days between tests (std.) 0.36∗∗∗ 0.43∗∗∗ 0.04 0.52∗∗∗
(0.06) (0.07) (0.09) (0.09)School fixed effectsR2 0.03 0.02 0.01 0.03Adj. R2 0.02 0.01 0.01 0.03Num. obs. 358407 352656 272382 343151RMSE 10.94 14.79 18.71 16.78N Clusters 937 937 930 936∗∗∗p < 0.001; ∗∗p < 0.01; ∗p < 0.05
43
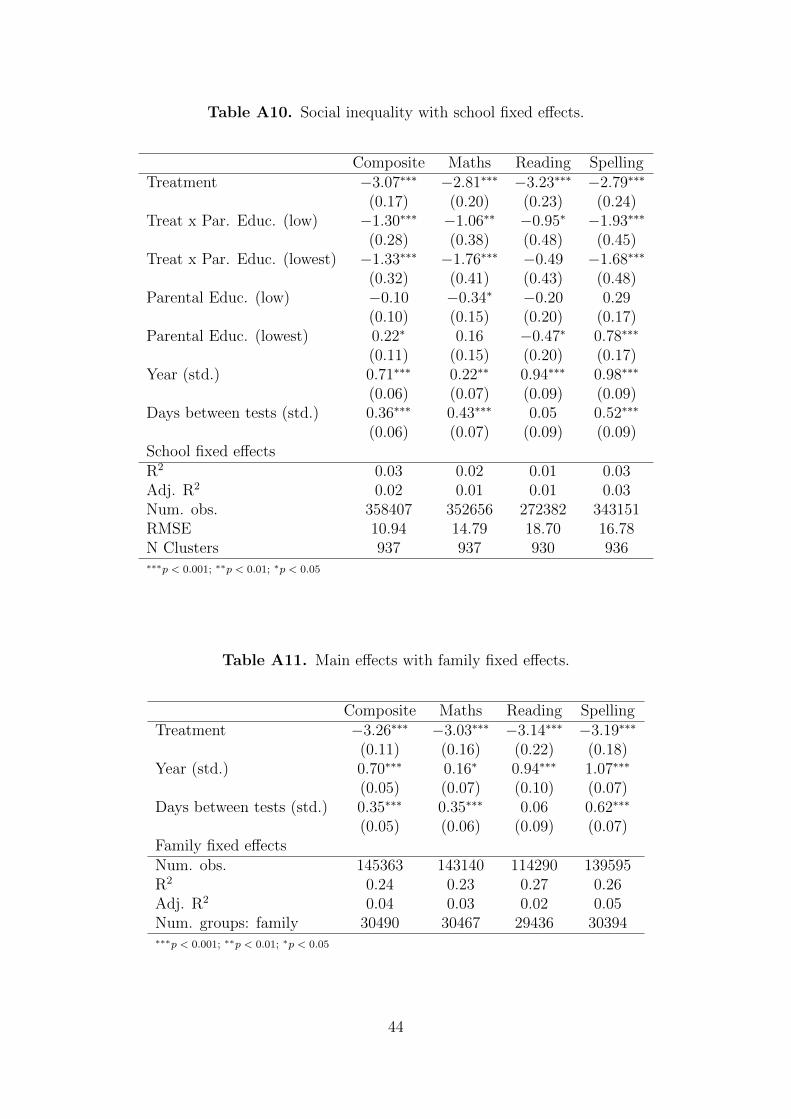
Table A10. Social inequality with school fixed effects.
Composite Maths Reading SpellingTreatment −3.07∗∗∗ −2.81∗∗∗ −3.23∗∗∗ −2.79∗∗∗
(0.17) (0.20) (0.23) (0.24)Treat x Par. Educ. (low) −1.30∗∗∗ −1.06∗∗ −0.95∗ −1.93∗∗∗
(0.28) (0.38) (0.48) (0.45)Treat x Par. Educ. (lowest) −1.33∗∗∗ −1.76∗∗∗ −0.49 −1.68∗∗∗
(0.32) (0.41) (0.43) (0.48)Parental Educ. (low) −0.10 −0.34∗ −0.20 0.29
(0.10) (0.15) (0.20) (0.17)Parental Educ. (lowest) 0.22∗ 0.16 −0.47∗ 0.78∗∗∗
(0.11) (0.15) (0.20) (0.17)Year (std.) 0.71∗∗∗ 0.22∗∗ 0.94∗∗∗ 0.98∗∗∗
(0.06) (0.07) (0.09) (0.09)Days between tests (std.) 0.36∗∗∗ 0.43∗∗∗ 0.05 0.52∗∗∗
(0.06) (0.07) (0.09) (0.09)School fixed effectsR2 0.03 0.02 0.01 0.03Adj. R2 0.02 0.01 0.01 0.03Num. obs. 358407 352656 272382 343151RMSE 10.94 14.79 18.70 16.78N Clusters 937 937 930 936∗∗∗p < 0.001; ∗∗p < 0.01; ∗p < 0.05
Table A11. Main effects with family fixed effects.
Composite Maths Reading SpellingTreatment −3.26∗∗∗ −3.03∗∗∗ −3.14∗∗∗ −3.19∗∗∗
(0.11) (0.16) (0.22) (0.18)Year (std.) 0.70∗∗∗ 0.16∗ 0.94∗∗∗ 1.07∗∗∗
(0.05) (0.07) (0.10) (0.07)Days between tests (std.) 0.35∗∗∗ 0.35∗∗∗ 0.06 0.62∗∗∗
(0.05) (0.06) (0.09) (0.07)Family fixed effectsNum. obs. 145363 143140 114290 139595R2 0.24 0.23 0.27 0.26Adj. R2 0.04 0.03 0.02 0.05Num. groups: family 30490 30467 29436 30394∗∗∗p < 0.001; ∗∗p < 0.01; ∗p < 0.05
44

Table A12. Social inequality with family fixed effects.
Composite Maths Reading SpellingTreatment −3.16∗∗∗ −2.93∗∗∗ −3.12∗∗∗ −3.02∗∗∗
(0.12) (0.16) (0.23) (0.19)Treat x Par. Educ. (low) −1.34∗∗ −0.79 −0.61 −2.50∗∗∗
(0.45) (0.63) (0.89) (0.76)Treat x Par. Educ. (lowest) −1.74∗∗∗ −2.10∗∗∗ −0.06 −2.97∗∗∗
(0.42) (0.58) (0.83) (0.72)Year (std.) 0.70∗∗∗ 0.16∗ 0.94∗∗∗ 1.07∗∗∗
(0.05) (0.07) (0.10) (0.07)Days between tests (std.) 0.35∗∗∗ 0.35∗∗∗ 0.06 0.61∗∗∗
(0.05) (0.06) (0.09) (0.07)Family fixed effectsNum. obs. 145363 143140 114290 139595R2 0.24 0.23 0.27 0.26Adj. R2 0.04 0.03 0.02 0.05Num. groups: family 30490 30467 29436 30394∗∗∗p < 0.001; ∗∗p < 0.01; ∗p < 0.05
45
Related Documents