November 11, 2020 Tom Larson, Paul M. Ong, Don Mar, James H. Peoples, Jr. i Inequality and COVID-19 Food Insecurity

Welcome message from author
This document is posted to help you gain knowledge. Please leave a comment to let me know what you think about it! Share it to your friends and learn new things together.
Transcript
November 11, 2020
Tom Larson, Paul M. Ong,
Don Mar, James H. Peoples, Jr.i
Inequality and
COVID-19 Food
Insecurity
Executive Summary
Introduction
Food Insecurity and the Pandemic
Pulse Survey and Food Insecurity
Conclusion and Recommendations
04
05
06
12
15
REPORT DESIGN BY MEGAN POTTER
TABLE
OF
CONTENTS

The COVID-19 pandemic has seen a surge in food insecurity. Although other studies have documented an initial increase in food insecurity during the pandemic, we found a continuing rise in food insecurity. We analyzed data from the U.S. Census Household Pulse Survey (HPS) covering the 13-week period from April 23 to July 21 to assess patterns of inequality and systematic disparities brought on by the COVID pandemic.ii The major findings include:
1. Although food insecurity is a chronic problem in the United States, the percentage of households experiencing food insecurity has increased from 10.5 percent in October 2019 to 18 percent in late April, during the pandemic, and to 26 percent by early July.
2. Food insecurity levels during the COVID-19 pandemic have become much higher than the levels experienced during the Great Recession of 2007‒9, affecting more than 64 million persons by July 16, 2020.
3. Food insecurity has increased across race and ethnicity, but Blacks and Latinx households are more likely to experience food insecurity. Thirty-six percent of Black and 31 percent of Latinx households reported food insecurity compared to 16 percent of non-Hispanic Whites over the entire survey period.
4. Food insecurity for lower income households is extremely high. Almost half (45 percent) of households earning less than $25,000 a year reported being food insecure, primarily due to unaffordability.
5. Solutions include more coordination between federal, state, and local agencies, increasing the awareness of food programs, improved benefits through SNAP (formerly Food Stamp Program), and finding ways to bring affordable healthy food to food deserts.
E x e c u t i v e S u m m a r y
UCLA Center for Neighborhood Knowledge 03
One of the big impacts of the COVID-19 pandemic has been a surge in food insecurity. We find that the pandemic has greatly increased food insecurity and threatens to increase severe diet-related diseases such as obesity, diabetes, and heart disease—diseases that are among the leading causes of death in the United States. In addition, children in families with food insecurity may suffer from birth defects, anemia, cognitive problems, asthma, and poor general health. These problems can lead to poor performance in school and can be coupled with behavioral problems and high dropout rates. Food insecurity is a major problem even when the nation has low unemployment. In 2019 with the lowest unemployment rate in a decade, there were 32.5 million people suffering from food insecurity (10.5 percent of the population) in December 2019.iii Food insecurity last increased during the Great Recession of 2007‒9 and now the nation is facing an increase in food insecurity greater than that experienced during the Great Recession due to the COVID-19 pandemic. The impacts are very uneven, with the greatest increases in insecurity found among children, African Americans, and Latinx, but White middle-class families are also affected. Government assistance is a critical need now to protect families from insufficient and unhealthy food.
The 2.2 trillion dollar CARES Act did provide 24.7 billion dollars directly for food assistance,iv but mostly helped individuals with additional unemployment benefits, job protections, and housing protections. Many families received economic help, but that did not prevent rising crisis levels of hunger and food insecurity.
I n t r o d u c t i o n
04 UCLA Center for Neighborhood Knowledge

10%
11%
12%
13%
14%
15%
16%
1998 2001 2004 2007 2010 2013 2016 2019
Food insecurity was a major problem before the COVID-19 pandemic, and Figure 1 shows the incidence from 1998 to 2019.v The number of households who are food insecure follows the business cycle closely with rises and falls tightly related to changes in unemployment rates. Unemployment rates during the pandemic quickly exceeded those of the Great Recession and may have been as high briefly as during the Great Depression. Feeding America, an organization that coordinates food banks across the country, predicted that the number of people facing food insecurity would rise during the pandemic past 53.4 million persons, including 18 million children.vi
Fo o d I n s e c u r i t y a n d t h e P a n d e m i c
Figure 1: Food Insecure Households 1998-2019, Pre-COVID-19, by Percentage
Source: USDA, Economic Research Service, using Current Population Survey data from CPS-FSS, 2019.
UCLA Center for Neighborhood Knowledge 05

In Figure 2 we see food insecurity by race and ethnicity. Even in good years for the economy, Black and Hispanic households have high rates of food insecurity. The Great Recession shot Latinx levels of food insecurity above levels for Black non-Hispanics. The long economic expansion from 2009 through 2019 brought Latinx insecurity rates to new lows. Black households saw a return to pre-pandemic levels of more than 20 percent—levels much higher than for other races or ethnic groups surveyed. The “Other” category represents mostly Asians and has rates close to those for White non-Hispanics.
Figure 2: Food Insecure Households, By Race, CPS-FSS, Pre-COVID-19, by Percentage
Source: USDA, Economic Research Service, using Current Population Survey data from CPS-FSS, 2019.
06 UCLA Center for Neighborhood Knowledge
0%
5%
10%
15%
20%
25%
30%
2001 2002 2003 2004 2005 2006 2007 2008 2009 2010 2011 2012 2013 2014 2015 2016 2017 2018
WHITE NH BLACK NH LATINX OTHER

The COVID-19 pandemic led to a large rise in food insecurity in the United States as unemployment increased and incomes fell. The COVID Impact Survey by NORC, at the University of Chicago, did interviews over three months of the pandemic, from April to June. The food security results show a more than doubling of food insecurity in April compared to December 2019 (the last previous survey result from CPS-FSS). Although, the census and NORC surveys are not directly comparable, the measured rate in December by the census in 2019 was 10.5 percent and the NORC finding was a rate of 23 percent in April 2020. Although the NORC study found some decline in food insecurity after April, the level remained very high in June at 20 percent (see Figure 4).vii One study by the Urban Institute found that food insecurity among nonelderly adults aged 18 to 64 in the United States reached 21.9 percent in late March and early April.viii It was also found that 31 percent of households reduced their spending on food. These findings occurred before most of the benefits of the CARES Act had been distributed. The main government food program, SNAP, was criticized as falling far short of need given the severity of the food crisis. A second Urban Institute study tracked food insecurity in two periods, first from March 25 through April 10 and then again from May 14 through May 27. They found that between the end of March and late May, food insecurity fell. They attribute this to a combination of some people going back to work and to more people realizing benefits from CARES and Paycheck Protection Program (PPP).ix Food insecurity rates during the pandemic are worse than during the Great Recession. In 2009, there were 50.2 million people living in food insecure households accounting for 16.6 percent of American households.x Millions more are facing food insecurity during the pandemic.
UCLA Center for Neighborhood Knowledge 07
Pulse Survey and Food Insecurity
This research brief utilizes the U.S. Census Bureau’s weekly HPS to analyze the pandemic’s impact on food accessibility. The HPS covers the period from April 23 to June 21 in 12 separate surveys. The HPS survey has much larger samples than the Urban Institute and NORC studies cited above, with more than one million interviews conducted.
The first wave of the Pulse survey reports that almost 15 percent of the population had trouble having enough food because they could not afford to buy enough. By week 12, the percentage had risen above 35 percent. On this one measure of food insecurity, we see greater levels of food insecurity than during the Great Recession every week after April 23 (the end of the first week of the HPS surveys).
One of the most important reasons for food insecurity is the financial hardship created by the pandemic, but there are also other reasons associated with shelter-in-place mandates that affected households with and without financial hardships and disrupted the operations of grocery stores. There are five possible responses to the following question: "Why did you not have enough to eat (or not what you wanted to eat)? Choose all that apply.” Approximately 79.4 percent of the households we categorized as being food insecure stated that they “Couldn’t afford to buy more food," 15.9 percent stated “Couldn’t get out to buy food (for example, didn’t have transportation, or had mobility or health problems that prevented you from getting out," 20.1 percent stated “Afraid to go or didn’t want to go out to buy food,” 8.2 percent “Couldn’t get groceries or meals delivered to me,” and 18.2 percent “The stores didn’t have the food I wanted.”
The overall finding from our results is that the economic and financial impacts have been the primary driver behind food insecurity and the rise in food insecurity. This is also apparent when examining food-insecure households and two measures of COVID-19’s impact through the labor market: where either the respondent experienced a loss of employment income during the pandemic or where the respondent reported losing a job due to the pandemic’s economic impact. Nearly three-quarters of food-insecure households (72.9 percent) and those experiencing unaffordability (74.3 percent) experienced one or both of these labor-market disruptions.
08 UCLA Center for Neighborhood Knowledge

Figure 3: Percent of Households Food Insecure or Food Unaffordable
Food insecurity and unaffordability increased over time during the pandemic. Using 12 waves of the HPS, we find that while there was some decline in food insecurity from wave 2 through 4 and another decline from wave 5 to 6, food insecurity had greatly increased from the level of December 2019 to the first wave in late April and then increased more through wave 12 where it reached a high of 26 percent. Earlier studies using the HPS did not catch this longer-range increase. Programs to reduce food insecurity fell far short of the great need during the pandemic. Despite the extra funding of unemployment benefits and the SNAP program more than 64 million people were food insecure by the week of July 16. This exceeded the dire predictions that more than 50 million would be food insecure.
Figure 3 traces the temporal changes in the percent of households that are food insecure and the percent that are food insecure because of unaffordability. Both show a distinct increase over the 12 waves. Overall food insecurity increased by 8 percentage points. These increases are probably due to the accumulative impact of prolonged employment losses and exhaustion of household resources.
UCLA Center for Neighborhood Knowledge 09
0%
5%
10%
15%
20%
25%
30%
April 23 – May 5
May 7 – M
ay 12
May 14 – M
ay 19
May 21 – M
ay 26
May 28 – June 2
June 4 – June 9
June 11 – June 16
June 18 – June 23
June 25 – June 30
July 2 - July 7
July 9 - July 14
July 16 - July 21
Insecure Unaffordable
0%
5%
10%
15%
20%
25%
30%
35%
40%
NH White Asian Other Hispanic Black
Unaffordable Other Reasons
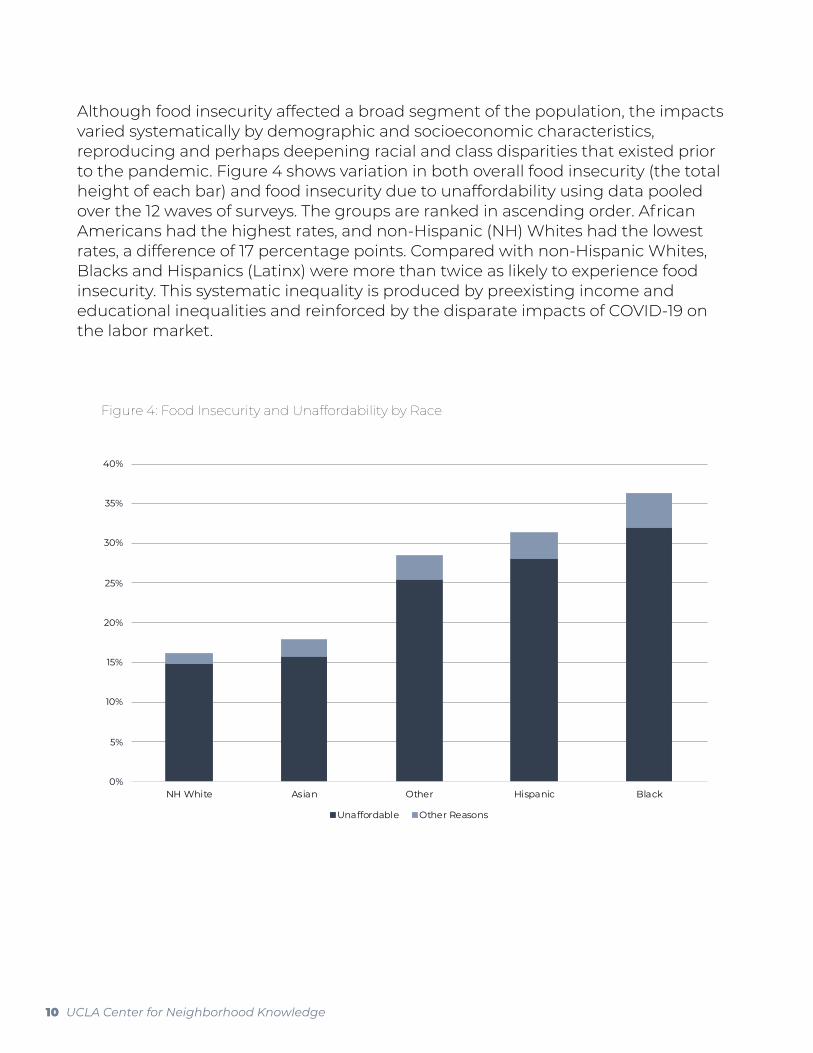
Although food insecurity affected a broad segment of the population, the impacts varied systematically by demographic and socioeconomic characteristics, reproducing and perhaps deepening racial and class disparities that existed prior to the pandemic. Figure 4 shows variation in both overall food insecurity (the total height of each bar) and food insecurity due to unaffordability using data pooled over the 12 waves of surveys. The groups are ranked in ascending order. African Americans had the highest rates, and non-Hispanic (NH) Whites had the lowest rates, a difference of 17 percentage points. Compared with non-Hispanic Whites, Blacks and Hispanics (Latinx) were more than twice as likely to experience food insecurity. This systematic inequality is produced by preexisting income and educational inequalities and reinforced by the disparate impacts of COVID-19 on the labor market.
Figure 4: Food Insecurity and Unaffordability by Race
10 UCLA Center for Neighborhood Knowledge
0%
5%
10%
15%
20%
25%
30%
35%
40%
45%
50%
Less Than $25k $25k to LT $35k $35k to LT $50k $50k to LT $75k $75k to LT $100k $100k to LT $150k $150k or more
Unaffordable Other Reasons
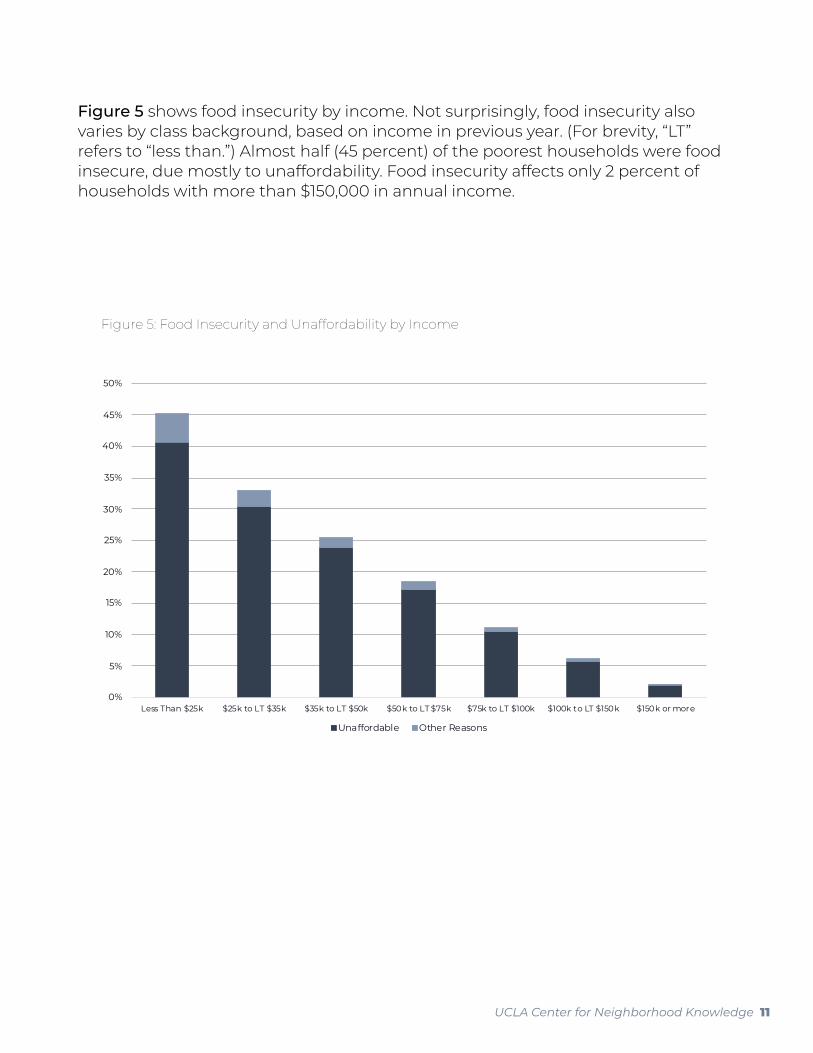
Figure 5 shows food insecurity by income. Not surprisingly, food insecurity also varies by class background, based on income in previous year. (For brevity, “LT” refers to “less than.”) Almost half (45 percent) of the poorest households were food insecure, due mostly to unaffordability. Food insecurity affects only 2 percent of households with more than $150,000 in annual income.
Figure 5: Food Insecurity and Unaffordability by Income
UCLA Center for Neighborhood Knowledge 11

C o n c l u s i o n a n d R e c o m m e n d a t i o n s
The economic and food benefits that the CARES Act and other COVID-19 programs provided may have reduced food insecurity from extremely high levels, but the data suggest that need greatly exceeded the provided aid. During the spring and summer, federal policies to assist workers and small businesses temporarily provided financial and food assistance. The supplemental unemployment insurance benefits expired on July 31, 2020. The CARES Act also included the PPP, which offered loans to small businesses to retain employees; however, this program was terminated on August 8, 2020. On August 8, 2020, Trump’s executive order provided additional funds for unemployment insurance, but reduced the federal enhancement to unemployment insurance from $600 to $300.
Despite hundreds of billions of dollars in economic aid provided to employers and individuals, we have found that food insecurity rose to levels higher than during the Great Recession. The CARES Act and other relief programs quickly ran out of funds. From July to October 2020, federal legislators debated over different proposals to extend the supplemental unemployment insurance benefits and failed to provide any new relief. Future prospects are problematic. As unemployment is likely to be high for the rest of the year; many schools remain closed or partially closed; and state and local governments cut programs, high levels of food insecurity will continue and may rise even further.
Because food insecurity and diet-related health problems affect many people every year, a range of solutions have been developed. Ending food insecurity will require changes in policy and in funding. Policy changes and coordination of existing programs are needed at the state level as well as at the federal level. Many farmer’s markets do not accept EBT cards or permit WIC purchases, reducing access to healthy fresh food in some neighborhoods. Many who are eligible for food benefits do not apply. States can work to increase awareness of food programs. Applications for food assistance can be simplified so they are easier to understand and complete. State agencies can be helped to work together to identify, educate, and enroll eligible parties.xi But a relatively easy solution to widespread food insecurity is providing more access to food through food stamps—now available on EBT cards through the SNAP program. A Hamilton Project proposal was that SNAP maximum benefits be increased by 15 percent during recessions.xii The SNAP program by itself is one of the country’s most important antipoverty programs. SNAP has been estimated to have lifted 10 million people out of poverty in 2012.xiii The Food Stamp Program and its replacement SNAP have been found to improve diets, lower diet-related illness, and improve economic sufficiency.
12 UCLA Center for Neighborhood Knowledge

Even with increased benefits from nutrition programs, many families still may have low access to a healthy diet. Low-income minority neighborhoods are often food deserts where affordable healthy foods are in short supply. Such neighborhoods have food insecurity along with high rates of obesity. Communities and governments can support bringing in full-service supermarkets, farmer markets, and improved “corner stores” (the little mom and pop grocery stores).xiv Programs like SNAP do not mean healthy diets are obtained. SNAP benefits can lead some to buy cheap processed foods with high levels of sodium and sugar.
Morally, providing aid is just the right thing to do. But even a strictly rational approach to food insecurity would be to increase access to healthy food as that would reduce health care costs and the loss of lives which would benefit all society.
UCLA Center for Neighborhood Knowledge 13

Endnotes Photo Credits Cover Page: Joel Muniz (via unsplash.com) Page 13: Jon Cameron (via unsplash.com)
i Tom Larson is Emeritus Professor of economics at the California State University, Los Angeles. Don Mar is Emeritus Professor of economics at San Francisco State University. Paul Ong is Research Professor at UCLA Luskin School of Public Affairs and Director of the Center for Neighborhood Knowledge. James Peoples is Professor of Economics at the University of Wisconsin-Milwaukee and affiliate faculty of the Supply Chain Management Institute, Lubar School of Business. ii This brief is part of a series produced by the UCLA Center for Neighborhood Knowledge’s COVID-19 Research Initiative, which documents the direct and indirect impacts of the public-health crisis, with a focus on systematic racial and income inequalities. iii USDA. 2019. Household Food Insecurity in the United States. iv A total of $8.9 billion for child nutrition programs and an additional $15.8 billion for SNAP. v USDA. 2019. Household Food Insecurity in the United States. vi Feeding America. 2020. “The Impact of the Coronavirus on Local Food Insecurity,” May 19. https://www.feedingamerica.org/research/coronavirus-hunger-research vii COVID Impact Survey, conducted by NORC at the University of Chicago for the Data Foundation. www.COVID-impact.org/blog/social-economic-health-impacts-persist-as-americans-grapple-with-convergence-of-pandemic-and-civil-unrest viii Karpman, Michael, Stephen Zuckerman, Dulce Gonzalez, and Genevieve Kenny. 2020. “The COVID-19 Pandemic Is Straining Families’ Abilities to Afford Basic Needs,” Urban Institute, April 28. ix Waxman, Elaine, Poonam Gupta, and Michael Karpman. "More Than One in Six Adults Were Food Insecure Two Months into the COVID-19 Recession: Findings from the May 14-27 Coronavirus Tracking Survey," Urban Institute, 2020. https://www.urban.org/research/publication/more-one-six-adults-were-food-insecure-two-months-covid-19-recession.. x USDA, Household Food Insecurity in the United States. xi ASTHO Staff, “States Take Action to Address Food Insecurity,” April 10, 2019|5:52 p.m. xii Hoynes, Hilary, and Diane Whitmore Schanzenbach. 2019. “Strengthening SNAP as an Automatic Stabilizer,” May 16. https://www.hamiltonproject.org/papers/strengthening_snap_as_an_automatic_stabilizer xiii https://www.brookings.edu/research/twelve-facts-about-food-insecurity-and-snap xiv Larson, Tom, and Deborah Larson. 2018. “Supermarkets, Fast Food and Obesity: A Study of Food Access and Health in South Los Angeles.” Business Forum 27(1): 17‒25.
https://knowledge.luskin.ucla.edu/
KnowledgeLuskin
UCLACenterforNeighborhoodKnowledge
Related Documents