Welcome message from author
This document is posted to help you gain knowledge. Please leave a comment to let me know what you think about it! Share it to your friends and learn new things together.
Transcript
ii
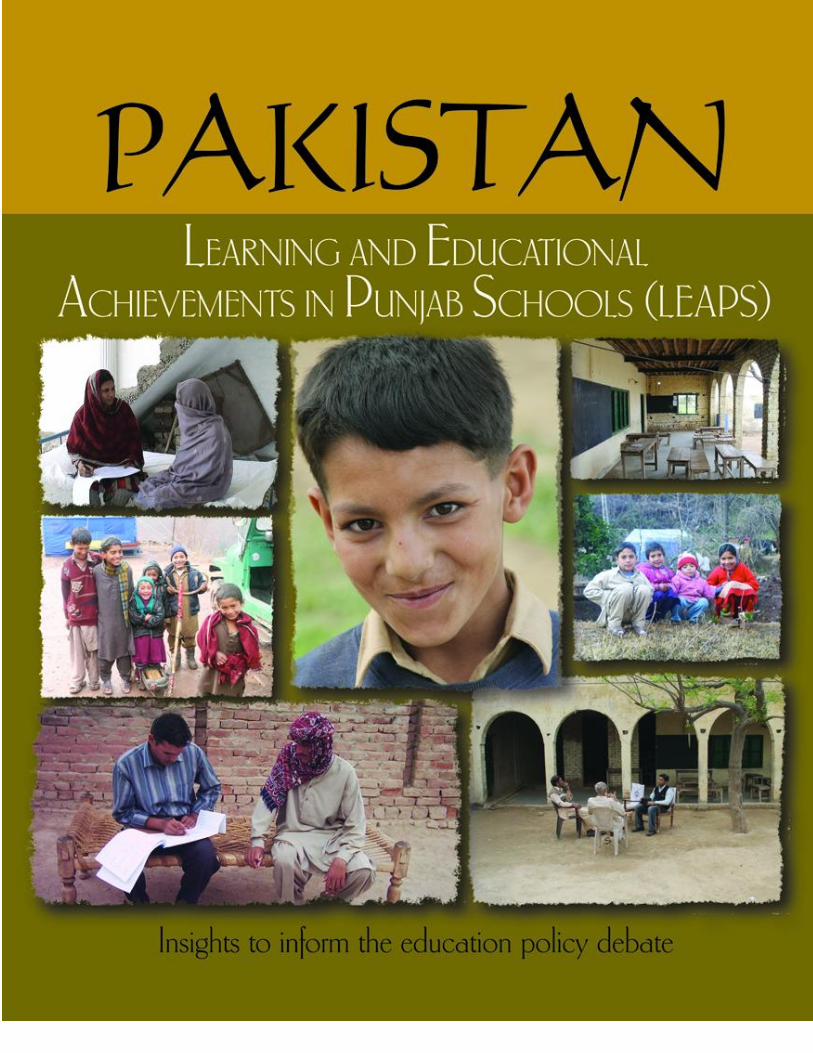
PAKISTA� Learning and Educational Achievements
in Punjab Schools (LEAPS): Insights to inform the education policy debate
February 20, 2007
Tahir Andrabi, Jishnu Das, Asim Ijaz Khwaja, Tara Vishwanath,
Tristan Zajonc1
And
The LEAPS Team
1 The authors’ affiliations are (in order): Andrabi: Pomona College, Das: The World Bank and Centre for Policy
Research (New Delhi), Khwaja: Harvard University, Vishwanath: The World Bank and Zajonc: Harvard University.
The findings, interpretations, and conclusions expressed in this paper are entirely those of the authors. They do not
necessarily represent the view of the World Bank, its Executive Directors, or the countries they represent.
CURRENCY AND EQUIVALENTS
Currency Unit = Pakistan Rupee US$ = PKR 60.5
FISCAL YEAR July 1 – June 30
ACRONYMS AND ABBREVIATIONS
AJK Azad Jammu & Kashmir NCTM National Council of Teachers of Mathematics
EFA Education for All NWFP North Western Frontier Province
EMIS Educational Management Information
System PIHS Pakistan Integrated Household Survey
FANA PTC Primary Teaching Certificate
FATA Federally Administered Tribal Areas STR Student-Teacher Ratio
FBS Federal Bureau of Statistics SW
GPS Global Positioning System TIMMS Trends in International Math & Science
Study
ILO International Labor Organization
NAGE National Assessment of Governing Board
�EC National Educational Census
Vice President: Praful C. Patel, SARVP
Country Director: Yusupha B. Crookes, SACPK
Sector Director: John Roome, SASHD
Sector Manager: Michelle Riboud, SASHD
Task Managers: Tara Vishwanath, SASPR
Jishnu Das, DECRG
ii
Acknowledgements
The LEAPS surveys that form the basis of this report were carried out once a year between 2003 and 2007. A LEAPS
year begins with pre-survey field work in July that carries on till November. Tests and surveys start in December and
January and a household survey is implemented between April and June. The data are compiled and cleaned in the
“slack” months during the summer. This has been possible because of an exceedingly dedicated team in Pakistan and
constant cooperation with education officials of the education department in Punjab.
In Pakistan, the LEAPS team is led by Irfan Ahmed (Overall Coordinator), Sarfraz Bhatti, Kashif Abid, Tahir Ansari and
Syed Ali Asjad with initial assistance from Intzaar Butt. The support of Ali Cheema and the faculty and administration at
Lahore University of Management Sciences (LUMS) is also gratefully acknowledged. Anila Asghar, Duriya Farooqi and
the teachers and children at the Akhtar Mubarak Centre in Lahore all provided key inputs at various stages of the study.
Throughout the project, Khalid Gillani (Director, Project Monitoring Implementation Unit, Department of Education,
Punjab and Secretary, Department of Education, Punjab) and Tahseen Sayed (World Bank, Islamabad) as well as District
Education Officers have been tireless supporters. Shahid Rashid (Secretary in the Department of Education 2003-2006),
Khushnood Lashari (the Secretary in the Department of Education, Punjab in 2002-03 and now Additional Chief
Secretary) and Adnan Qadir (Queen’s University) gave the initial impetus for the project.
At The World Bank in Washington, Charles Griffin’s involvement was critical in initiating the project. Since then,
Michelle Riboud (Sector Manager, SASHD), Julian Schweizer (Sector Director, SASHD) and Shantayanan Devarajan
(Chief Economist, SAS) and Elizabeth M. King (Research Manager, DECRG) have shown constant interest and support
for this work. Thelma Rutledge and Hedy Sladovich provided critical support for editing and formatting the document
under immense time pressure in the final stages. Funding for this project was received from SASHD (The World Bank),
The Knowledge for Change Program (KCP), PSIA Trust Funds, BNPP Trust Funds and Pomona College. Pomona
College waived administrative overheads for this project; the College’s administration and faculty help is acknowledged.
The report is based on many conversations with Jeffrey Hammer (Princeton University), Lant Pritchett (Harvard
University), Elizabeth M. King (The World Bank), Ali Cheema (LUMS), Mehnaz Aziz (CRI, Islamabad) and
presentations at LUMS, PIDE and numerous universities and conferences in the United States and UK. It has also
benefited tremendously from thoughtful reviewer comments by Abhijit Banjejee (Massachusetts Institute of
Technology), Jeffrey Hammer (Princeton University), Harry Patrinos (World Bank) and Tahseen Sayed (World Bank,
Islamabad).
We were fortunate to receive excellent research assistance from Samia Amin (World Bank), Zahra Siddique
(Northwestern), Amer Hasan (University of Chicago) and Nick Eubank (World Bank). The LEAPS website is designed
by Emil Anticevic and Amer Hasan, with assistance from DECDG (The World Bank). Finally, none of this would have
been possible without the support of teachers, head-teachers, parents and children in the schools and villages where the
LEAPS team has been working. We hope that this report and other ongoing studies from the LEAPS surveys justify
their considerable enthusiasm for this work.
iii
TABLE OF CONTENTS
EXECUTIVE SUMMARY ...................................................................................................................... vi
INTRODUCTION ................................................................................................................................ 1
1. ARE STUDENTS LEARNING? .................................................................................................... 18
I. What Do Children Know? ............................................................................................................. 19 II. Why Do Some Children Outperform Others? ............................................................................ 25
2. ARE SCHOOLS FUNCTIONAL?................................................................................................................ 35
I. Private School Location Patterns .................................................................................................. 37 II. Revenues and Profits ....................................................................................................................... 38 III. Social Costs of Schooling ............................................................................................................... 40 IV. School Facilities ................................................................................................................................ 41 V. Schooling Market: Potential Concerns ......................................................................................... 47 VI. Discussion ......................................................................................................................................... 52
3. DO TEACHERS TEACH? .......................................................................................................................... 58
I. Facts and Findings ........................................................................................................................... 61 II. Government and Private Compensation: Inputs or Outcomes .............................................. 71 III. Discussion ......................................................................................................................................... 76
4. PARENTS AND THEIR CHILDREN ......................................................................................................... 83
I. Facts and Findings ........................................................................................................................... 84 II. Discussion ......................................................................................................................................... 101
5. THOUGHTS FOR DISCUSSION AND DEBATE ...................................................................................... 105
BIBLIOGRAPHY .................................................................................................................................................... 117 ANNEXES TO LEAPS REPORT ........................................................................................................................ 121 ANNEX 1: SAMPLING PROCEDURE OF THE LEAPS PROJECT ............................................. 121 ANNEX 2: CHILDREN WHO CHANGE SCHOOLS ...................................................................... 125 TECHNICAL ANNEX ........................................................................................................................................... 126
I. PREVIOUS STUDIES .......................................................................................................................... 126 II. THE LEAPS TEST INSTRUMENT .................................................................................................... 130 III. CONCLUSION .................................................................................................................................... 142
iv
LIST OF TABLES, FIGURES, AND BOXES
TABLES
Table 1: Enrollment Patterns .......................................................................................................................................... 10 Table 2: Private School Enrollment Patterns................................................................................................................ 14 Table 3: Gender Enrollment Patterns ............................................................................................................................ 16 Table 1.1: What do Children Know in English? .......................................................................................................... 22 Table 1.2: What do Children Know in Urdu ................................................................................................................ 24 Table 1.3: Rising Enrollment, Lagging Learning ......................................................................................................... 25 Table 1.4: Knowledge Scores .......................................................................................................................................... 25 Table 1.5: Enrollment Patterns and Math Scores by Village, Wealth, and Literacy ............................................... 27 Table 2.1: Revenues and Profits of Private Schools in different types of villages .................................................. 39 Table 2.2: Private schools are half as expensive as government schools ................................................................. 40 Table 2.3: Student Teacher Ratios .................................................................................................................................. 42 Table 2.4: Average School Facilities ............................................................................................................................... 45 Table 2.5: Changes in School Infrastructure between 2003 and 2005 ...................................................................... 47 Table 2.6: School Segregation ......................................................................................................................................... 51 Table 4.1: Household and Child Characteristics, Enrollment, and the Distance Gradient .................................. 93 Table 4.2: Private School Neighborhoods .................................................................................................................... 93 Table 4.3: How Children Spend their Day—a minute by minute account .............................................................. 99
BOXES
Box 1: Reading Cross-Sectional Enrollment Profiles ............................................................................................ 11 Box 1.1: LEAPS Survey Tests ...................................................................................................................................... 20 Box 1.2: Rote Learning is Prevalent in Both Government and Private Schools ................................................. 23 Box 1.3: How Are Knowledge Scores Computed? ................................................................................................... 26 Box 1.4: Results from the Learning Decomposition ................................................................................................ 28 Box 1.5: Field Notes - How Teachers Adjust To High Student-Teacher Ratios ................................................. 33 Box 2.1: Boring Schools? .............................................................................................................................................. 43 Box 2.2: Negative Community Interactions with the School .................................................................................. 46 Box 2.3: Medium of Instruction - English versus Urdu? ......................................................................................... 48 Box 2.4: Socioeconomic Indices .................................................................................................................................. 52 Box 2.5: Who Decides Where to Locate a School? .................................................................................................. 54 Box 3.1: What We Know about Teachers .................................................................................................................. 60 Box 3.2: What Data are required for this First Look at the Teaching Sector? ..................................................... 61 Box 3.3: Doesn’t the Government Already have a Monitoring System in Place? ............................................... 68 Box 3.4: Additional Responsibilities for Government Teachers .............................................................................. 70 Box 4.1: What are Household Assessments of Schools Based On? ........................................................................ 86
FIGURES
Figure 1: A typical rural private school ........................................................................................................................... 3 Figure 2: Education Inputs ................................................................................................................................................ 7 Figure 3: Enrollment by Gender ..................................................................................................................................... 11 Figure 4: Household Wealth, Literacy, and Enrollment ............................................................................................. 12 Figure 5: School Availability and Enrollment ............................................................................................................... 13 Figure 6: Explaining Variations in Enrollment Rates .................................................................................................. 13 Figure 7: Public and Private School Student Wealth ................................................................................................... 15 Figure 1.1: Mathematical Abilities .................................................................................................................................. 19
v
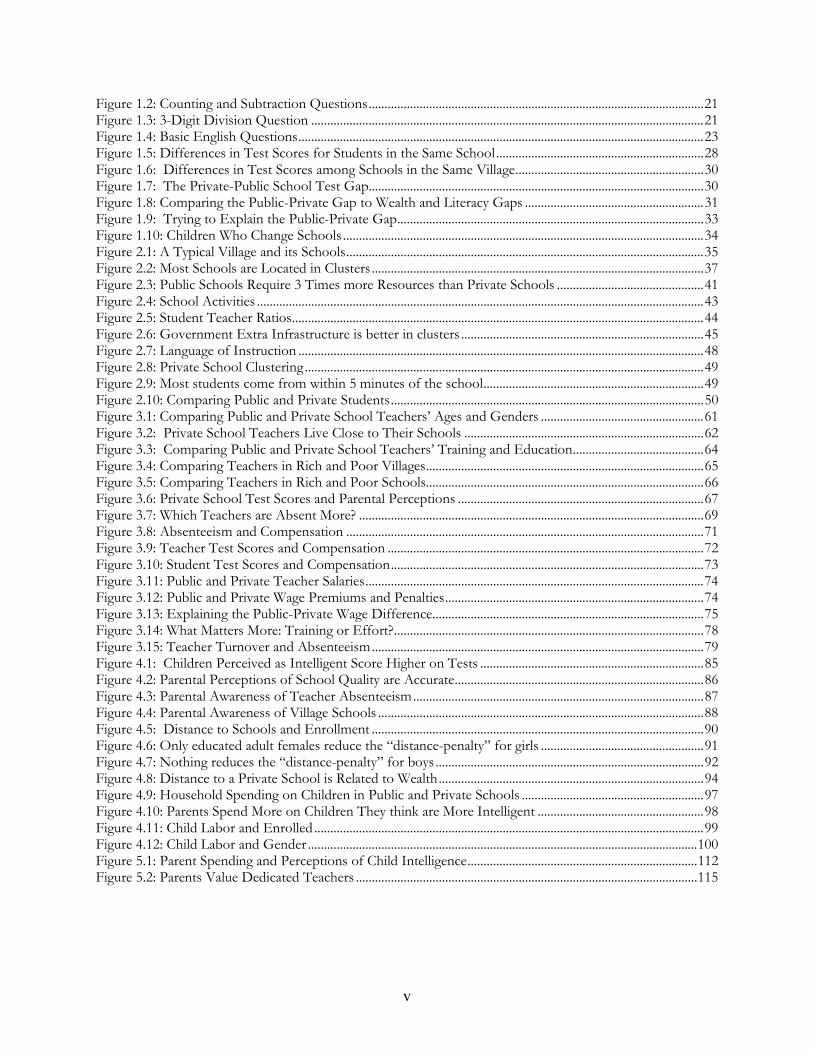
Figure 1.2: Counting and Subtraction Questions ......................................................................................................... 21 Figure 1.3: 3-Digit Division Question ........................................................................................................................... 21 Figure 1.4: Basic English Questions ............................................................................................................................... 23 Figure 1.5: Differences in Test Scores for Students in the Same School ................................................................. 28 Figure 1.6: Differences in Test Scores among Schools in the Same Village ........................................................... 30 Figure 1.7: The Private-Public School Test Gap......................................................................................................... 30 Figure 1.8: Comparing the Public-Private Gap to Wealth and Literacy Gaps ........................................................ 31 Figure 1.9: Trying to Explain the Public-Private Gap ................................................................................................ 33 Figure 1.10: Children Who Change Schools ................................................................................................................. 34 Figure 2.1: A Typical Village and its Schools ................................................................................................................ 35 Figure 2.2: Most Schools are Located in Clusters ........................................................................................................ 37 Figure 2.3: Public Schools Require 3 Times more Resources than Private Schools .............................................. 41 Figure 2.4: School Activities ............................................................................................................................................ 43 Figure 2.5: Student Teacher Ratios ................................................................................................................................. 44 Figure 2.6: Government Extra Infrastructure is better in clusters ............................................................................ 45 Figure 2.7: Language of Instruction ............................................................................................................................... 48 Figure 2.8: Private School Clustering ............................................................................................................................. 49 Figure 2.9: Most students come from within 5 minutes of the school ..................................................................... 49 Figure 2.10: Comparing Public and Private Students .................................................................................................. 50 Figure 3.1: Comparing Public and Private School Teachers’ Ages and Genders ................................................... 61 Figure 3.2: Private School Teachers Live Close to Their Schools ........................................................................... 62 Figure 3.3: Comparing Public and Private School Teachers’ Training and Education ......................................... 64 Figure 3.4: Comparing Teachers in Rich and Poor Villages ....................................................................................... 65 Figure 3.5: Comparing Teachers in Rich and Poor Schools....................................................................................... 66 Figure 3.6: Private School Test Scores and Parental Perceptions ............................................................................. 67 Figure 3.7: Which Teachers are Absent More? ............................................................................................................ 69 Figure 3.8: Absenteeism and Compensation ................................................................................................................ 71 Figure 3.9: Teacher Test Scores and Compensation ................................................................................................... 72 Figure 3.10: Student Test Scores and Compensation .................................................................................................. 73 Figure 3.11: Public and Private Teacher Salaries .......................................................................................................... 74 Figure 3.12: Public and Private Wage Premiums and Penalties ................................................................................. 74 Figure 3.13: Explaining the Public-Private Wage Difference..................................................................................... 75 Figure 3.14: What Matters More: Training or Effort? ................................................................................................. 78 Figure 3.15: Teacher Turnover and Absenteeism ........................................................................................................ 79 Figure 4.1: Children Perceived as Intelligent Score Higher on Tests ...................................................................... 85 Figure 4.2: Parental Perceptions of School Quality are Accurate .............................................................................. 86 Figure 4.3: Parental Awareness of Teacher Absenteeism ........................................................................................... 87 Figure 4.4: Parental Awareness of Village Schools ...................................................................................................... 88 Figure 4.5: Distance to Schools and Enrollment ........................................................................................................ 90 Figure 4.6: Only educated adult females reduce the “distance-penalty” for girls ................................................... 91 Figure 4.7: Nothing reduces the “distance-penalty” for boys .................................................................................... 92 Figure 4.8: Distance to a Private School is Related to Wealth ................................................................................... 94 Figure 4.9: Household Spending on Children in Public and Private Schools ......................................................... 97 Figure 4.10: Parents Spend More on Children They think are More Intelligent .................................................... 98 Figure 4.11: Child Labor and Enrolled .......................................................................................................................... 99 Figure 4.12: Child Labor and Gender .......................................................................................................................... 100 Figure 5.1: Parent Spending and Perceptions of Child Intelligence ........................................................................ 112 Figure 5.2: Parents Value Dedicated Teachers ........................................................................................................... 115
vi
EXECUTIVE SUMMARY
1. There have been dramatic changes in the educational landscape of Pakistan in the new millennium. Enrollments are
starting to look up with a 10 percentage point jump in net enrollments between 2001 and 2005. In addition,
secular, co-educational and for-profit private schools have become a widespread presence in both urban and
rural areas. Between 2000 and 2005, the number of private schools increased from 32,000 to 47,000 and by
the end of 2005, one in every 3 enrolled children at the primary level was studying in a private school.
2. These changes represent an opportunity and a challenge for educational policy in the country. A large fraction of
rural Pakistani households no longer lives in a village with one or two government schools—half the
population of rural Punjab, for instance, lives in villages where parents routinely have 7-8 schools to choose
from. This new educational landscape is best described as an active educational marketplace with multiple schools
vying for students whose parents are actively making educational decisions. From evaluating policy reform to
understanding how the private sector can help educate the poor, the rise of such schools represents a
significant opportunity and challenge, not only in Pakistan but also in the wider South-Asian context.
3. Furthermore, with enrollments looking up, debate will likely shift to what children are learning in school. Enrollment
does not imply learning. Low-income countries routinely place at the bottom of the charts in international
comparisons. Measuring what children are learning in public and private schools and understanding how the
educational marketplace can foster learning is a first step towards formulating policy in the new millennium.
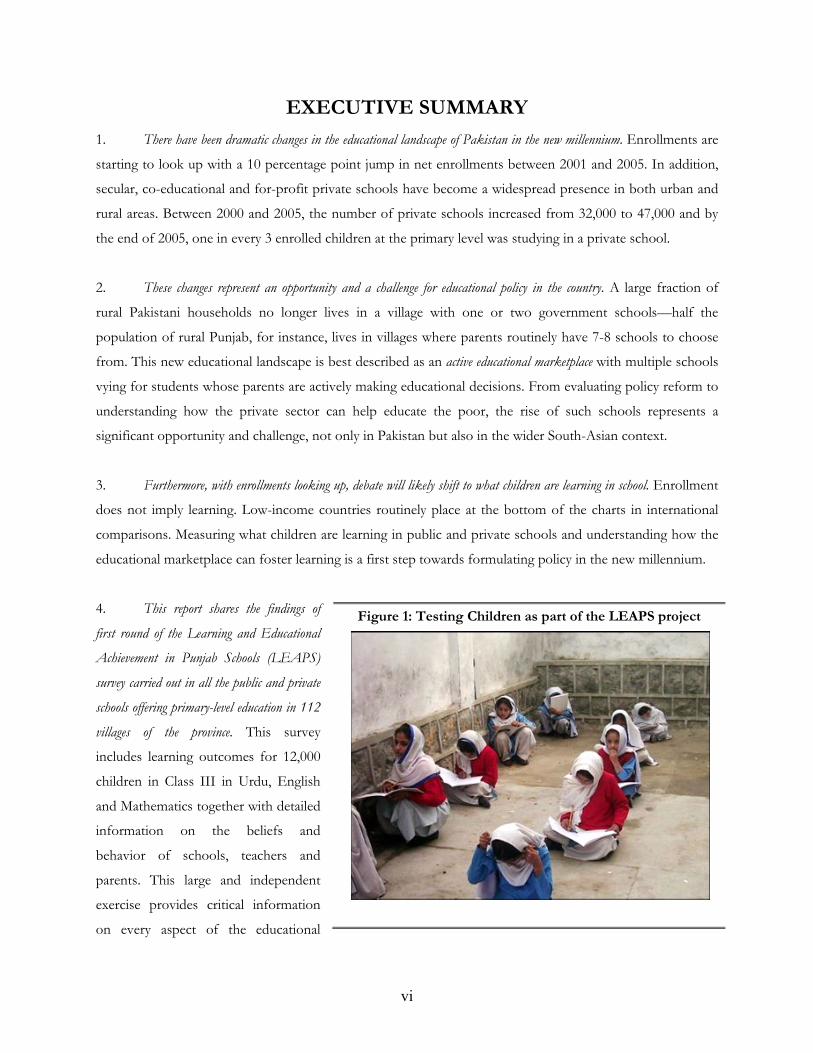
4. This report shares the findings of
first round of the Learning and Educational
Achievement in Punjab Schools (LEAPS)
survey carried out in all the public and private
schools offering primary-level education in 112
villages of the province. This survey
includes learning outcomes for 12,000
children in Class III in Urdu, English
and Mathematics together with detailed
information on the beliefs and
behavior of schools, teachers and
parents. This large and independent
exercise provides critical information
on every aspect of the educational
Figure 1: Testing Children as part of the LEAPS project
vii
marketplace, including performance of all types of schools in select districts of the province. This report
presents findings from the first round of the survey in 2003 along with trends for a few key outcomes
between 2003 and 2007; a further report will incorporate all other information from the 4 rounds collected
between 2003 and 2007.
5. The findings shed light on the relative strengths and weaknesses of private and government schooling. Driven by
higher teacher salaries, government schools require twice the resources to educate a child compared to private
schools. Furthermore, children studying in private schools report higher test-scores in all subjects—partly
because their teachers exert greater effort. Private schooling alone, however, cannot be the solution. Access
to private schools is not universal. Private schools choose to locate in richer villages and richer settlements
within villages, limiting access for poor households. In contrast, a laudable feature of the government school
system is that it ensures equal geographical access to schools for all. Since children who receive less attention
and educational investments at home are also more likely to be enrolled in government schools (if they are
enrolled at all), government school reform could ensure that no child is left behind.
6. Based on these findings, the report proposes a modified role of the government for discussion. This modified role
envisions the government as complementary to, rather than in competition with, the private sector. It
advances three spheres for government intervention. The first is as a provider of information on the quality of
every school—public or private—in the country. This will enable households to make informed decisions and
increase beneficial competition between schools. The second is as an actor who corrects the imbalances arising
from unequal geographical access to private schools and ensures that all children acquire a set of basic
competencies. Inevitably, this requires reform of government teacher hiring and compensation schemes. The
third is as an innovator willing to experiment with and evaluate “out-of-the-box” reforms such as public-private
partnerships where financial support is given to children regardless of the school chosen. Moving from such
proposals to operational feasibility requires debate and discussion, both on the proposals presented here and
to better understand the concrete steps that such a transition might require.
viii
I. CHALLENGES FACING THE EDUCATION SYSTEM IN PAKISTAN
7. Enrollment. Educational outcomes in Pakistan have traditionally been poor. The adult literacy rate is
50 percent compared to a 58 percent average for the entire South Asian region. Similarly, the primary school
net enrollment for 2004 at 61 percent was lower than comparator countries in the same region: Sri Lanka (97
percent), India (90 percent), and Nepal (78 percent).2 Recent enrollment data, however, suggest grounds for
optimism. In a space of four years (2001-2005), net national enrollment jumped 10 percentage points, from 51
to 61 percent. The highest increase occurred in Punjab province (12 percentage points), followed by Sindh
and NWFP provinces (7 percentage points), and Balochistan province (4 percentage points). Enrollment rates
in urban and rural areas increased and for both boys and girls— for example, girls in rural Punjab and NWFP
registered enrollment growths of 14 and 10 percentage points respectively. Participation in schooling is finally
looking up.
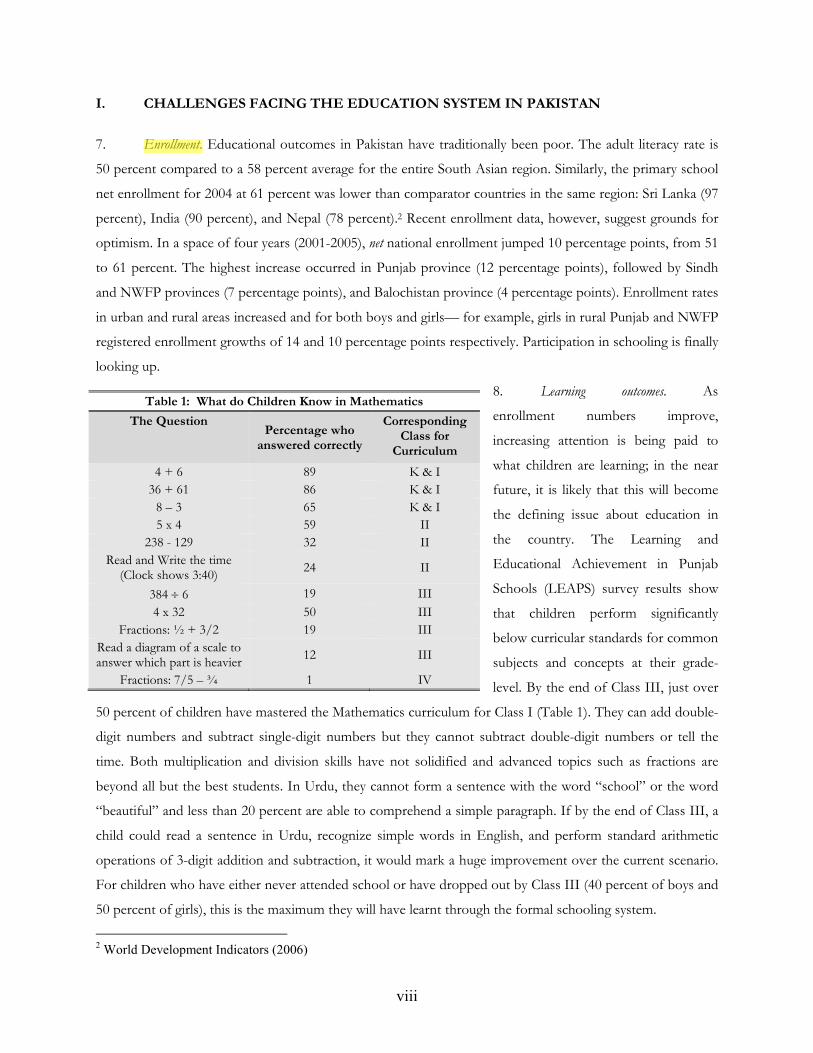
8. Learning outcomes. As
enrollment numbers improve,
increasing attention is being paid to
what children are learning; in the near
future, it is likely that this will become
the defining issue about education in
the country. The Learning and
Educational Achievement in Punjab
Schools (LEAPS) survey results show
that children perform significantly
below curricular standards for common
subjects and concepts at their grade-
level. By the end of Class III, just over
50 percent of children have mastered the Mathematics curriculum for Class I (Table 1). They can add double-
digit numbers and subtract single-digit numbers but they cannot subtract double-digit numbers or tell the
time. Both multiplication and division skills have not solidified and advanced topics such as fractions are
beyond all but the best students. In Urdu, they cannot form a sentence with the word “school” or the word
“beautiful” and less than 20 percent are able to comprehend a simple paragraph. If by the end of Class III, a
child could read a sentence in Urdu, recognize simple words in English, and perform standard arithmetic
operations of 3-digit addition and subtraction, it would mark a huge improvement over the current scenario.
For children who have either never attended school or have dropped out by Class III (40 percent of boys and
50 percent of girls), this is the maximum they will have learnt through the formal schooling system.
2 World Development Indicators (2006)
Table 1: What do Children Know in Mathematics
The Question Percentage who
answered correctly
Corresponding Class for
Curriculum
4 + 6 89 K & I
36 + 61 86 K & I
8 – 3 65 K & I
5 x 4 59 II
238 - 129 32 II
Read and Write the time (Clock shows 3:40)
24 II
384 ÷ 6 19 III
4 x 32 50 III
Fractions: ½ + 3/2 19 III
Read a diagram of a scale to answer which part is heavier
12 III
Fractions: 7/5 – ¾ 1 IV
Nadia
Highlight
ix
Box 1: Learning across the South Asia region: Is Poor Learning in Pakistan an Exception?
Recent testing exercises in low-income countries show that learning levels are far below international standards, and that they have little or nothing to do with the curriculum designed for the Grade level. The results from the LEAPS study show that children tested for Mathematics in Pakistan fall in the middle of the spectrum of children tested in Mathematics in 29 Indian states according to the Annual State of Education Report released by Pratham in 2005. In a comparable division problem, for instance, the tested children ranked ahead of 19 states out of 29—below West Bengal, Kerala and Haryana but above Andhra Pradesh, Punjab and Gujarat.
II. THE CURRENT EDUCATIONAL LANDSCAPE
9. The educational marketplace is expanding. The emerging reality of Pakistan, both urban and rural, is that
there is a well-defined educational marketplace at the primary level with actively engaged players on both sides of
the market—the schools and the parents. The one-school village (two if gender segregated) has given way to a
selection among public and private schools (religious schools are rarely used with the percentage of children
enrolled in such schools stagnant at 1-3 percent of enrollment countrywide). The “education story” in
Pakistan is the rise of an active and competitive educational marketplace where self-owned, for-profit private
schools offering secular education provide parents another option for investing in their children’s education.
10. The number of private schools has increased dramatically since the 1990s. Between 2000 and 2005 the number
of private schools increased from 32,000 to 47,000. Since 1995, one-half of all new private schools have set
up in rural areas and they are increasingly located in villages with worse socioeconomic indicators. Enrollment
in private schools increased dramatically between 2001 and 2005 and by 2005, one out of every three enrolled
child was studying in a private school. Although the government remains the largest provider of education,
this report shows that government schools—despite being staffed with better-educated and better-paid
teachers—are now competing for the same segment of students, even in rural areas.
11. The average rural private school is affordable. In a nationwide census of private schools in 2000, the fee in
the median rural private school (50 percent of all private schools charge lower fees) was Rs.60 per month.
According to household survey data from the Pakistan Integrated Household Survey (PIHS 2001), 18 percent
of the poorest third sent their children to private schools in villages where they existed.
x
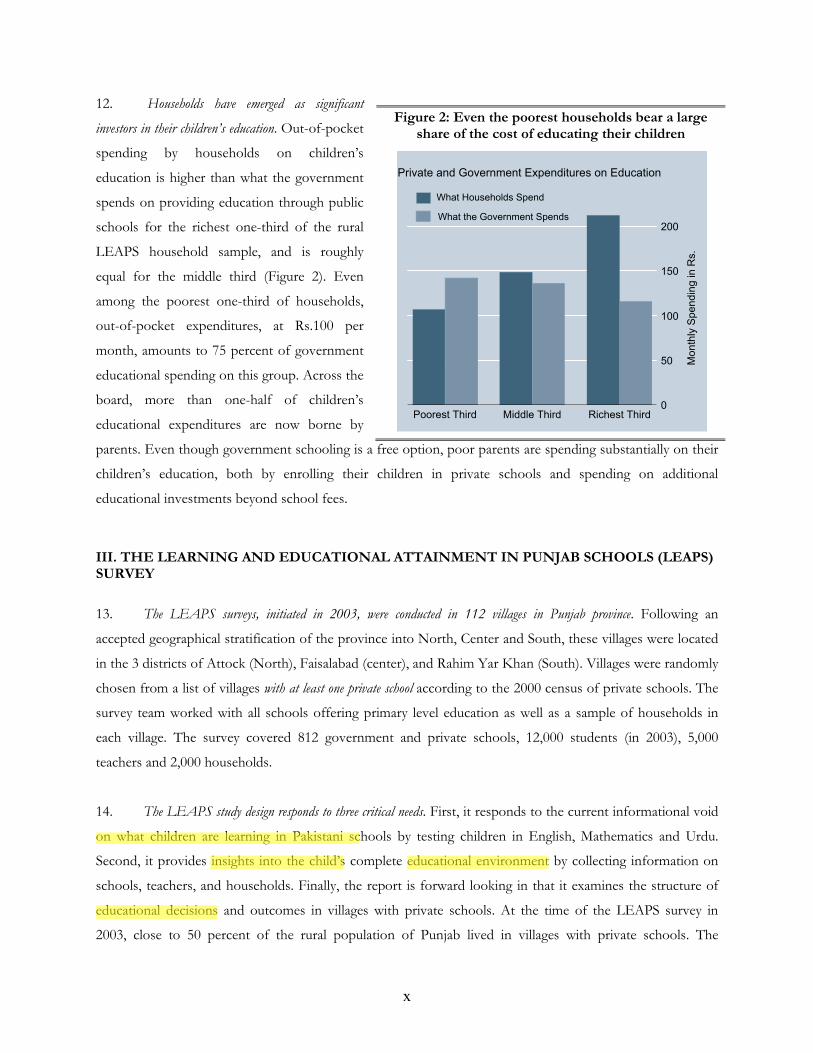
12. Households have emerged as significant
investors in their children’s education. Out-of-pocket
spending by households on children’s
education is higher than what the government
spends on providing education through public
schools for the richest one-third of the rural
LEAPS household sample, and is roughly
equal for the middle third (Figure 2). Even
among the poorest one-third of households,
out-of-pocket expenditures, at Rs.100 per
month, amounts to 75 percent of government
educational spending on this group. Across the
board, more than one-half of children’s
educational expenditures are now borne by
parents. Even though government schooling is a free option, poor parents are spending substantially on their
children’s education, both by enrolling their children in private schools and spending on additional
educational investments beyond school fees.
III. THE LEARNING AND EDUCATIONAL ATTAINMENT IN PUNJAB SCHOOLS (LEAPS) SURVEY
13. The LEAPS surveys, initiated in 2003, were conducted in 112 villages in Punjab province. Following an
accepted geographical stratification of the province into North, Center and South, these villages were located
in the 3 districts of Attock (North), Faisalabad (center), and Rahim Yar Khan (South). Villages were randomly
chosen from a list of villages with at least one private school according to the 2000 census of private schools. The
survey team worked with all schools offering primary level education as well as a sample of households in
each village. The survey covered 812 government and private schools, 12,000 students (in 2003), 5,000
teachers and 2,000 households.
14. The LEAPS study design responds to three critical needs. First, it responds to the current informational void
on what children are learning in Pakistani schools by testing children in English, Mathematics and Urdu.
Second, it provides insights into the child’s complete educational environment by collecting information on
schools, teachers, and households. Finally, the report is forward looking in that it examines the structure of
educational decisions and outcomes in villages with private schools. At the time of the LEAPS survey in
2003, close to 50 percent of the rural population of Punjab lived in villages with private schools. The
Figure 2: Even the poorest households bear a large share of the cost of educating their children
0
50
100
150
200
Mo
nth
ly S
pe
nd
ing
in
Rs.
Poorest Third Middle Third Richest Third
Private and Government Expenditures on Education
What Households Spend
What the Government Spends
Nadia
Highlight
Nadia
Highlight
Nadia
Highlight
Nadia
Highlight
xi
exponential growth in private schools in the new millennium from 32,000 in 2000 to 47,000 in 2005 implies
that the future we envisaged in 2003 is now the present for most of rural Punjab.
15. The sampling strategy provides a valuable opportunity to contextualize the relative strengths and weaknesses of
government vis-à-vis private schools within the larger educational environment. Given little de jure variations in the way
government schools operate (and in the case of teachers, little de facto variation as well), private schools
provide an alternate system of educational provision to which government provision can be compared.
Including systematic information about rural private schools—where one-third of all enrolled children are
currently studying—as well as data from households and all the schools in these villages brings the
educational marketplace in its entirety into better focus.
16. Although the findings of this report are from data on 3 districts in rural Punjab, the analysis and policy ideas raised
are relevant for a wider population. Both Punjab and NWFP have seen dramatic increases in private schooling
since the mid-nineties. In addition, the geographical expansion of private schools means that the educational
landscape described here will become relevant for a greater fraction of Pakistani villages over the next 10
years. While rural Sindh and Balochistan are currently different and need to be treated as such, many Pakistani
households already live in the kinds of villages studied here—and their numbers will only increase over time.
Beyond Pakistan, India, Bangladesh and Nepal have all seen an increase in private schooling over the last
decade. The issues discussed here are likely as relevant for this wider group.
17. The LEAPS report advances evidence based discussion and policy. It is important to stress that whether the
debate is over private schools or reform in government schools, we do not, by choice, go beyond what the
data can tell us. Our reading of the education discussion in Pakistan is that the views expressed and stands
taken are seldom supported by a systematic look at the data, albeit in many cases because the data are just not
available. In our view, this report will have served its purpose if these data from households and schools
informs the debate on education in the country.
xii
IV. THE EDUCATIONAL MARKETPLACE
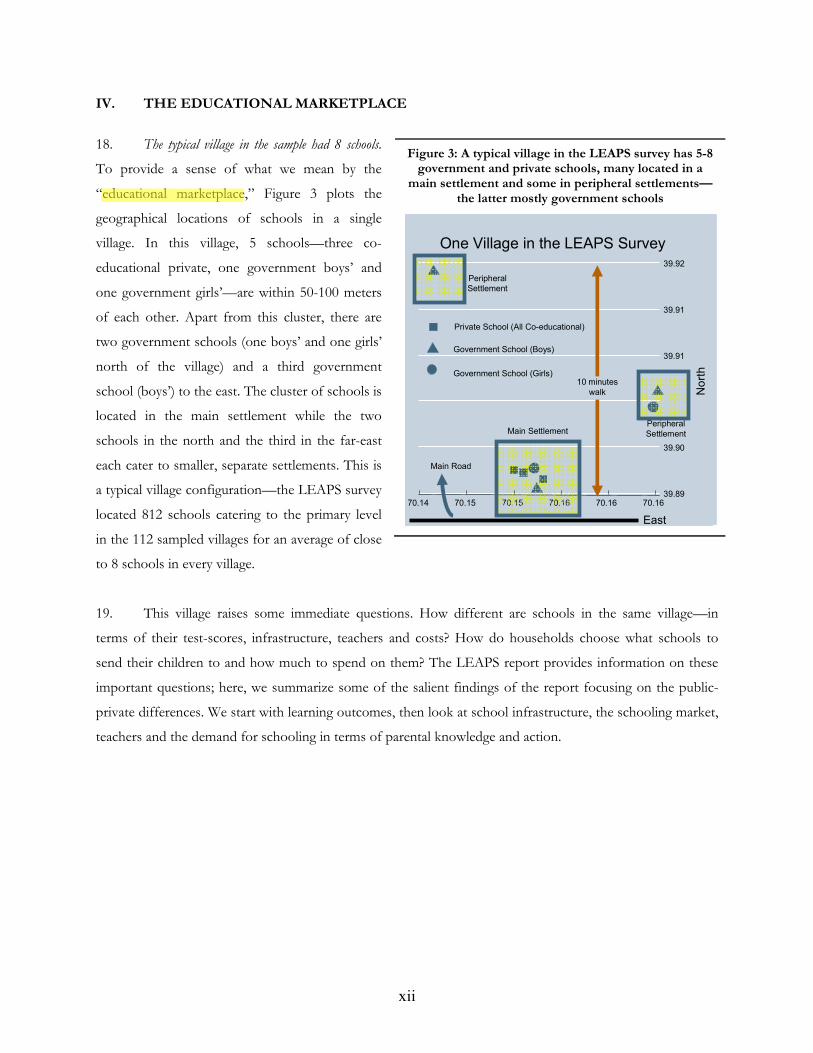
18. The typical village in the sample had 8 schools.
To provide a sense of what we mean by the
“educational marketplace,” Figure 3 plots the
geographical locations of schools in a single
village. In this village, 5 schools—three co-
educational private, one government boys’ and
one government girls’—are within 50-100 meters
of each other. Apart from this cluster, there are
two government schools (one boys’ and one girls’
north of the village) and a third government
school (boys’) to the east. The cluster of schools is
located in the main settlement while the two
schools in the north and the third in the far-east
each cater to smaller, separate settlements. This is
a typical village configuration—the LEAPS survey
located 812 schools catering to the primary level
in the 112 sampled villages for an average of close
to 8 schools in every village.
19. This village raises some immediate questions. How different are schools in the same village—in
terms of their test-scores, infrastructure, teachers and costs? How do households choose what schools to
send their children to and how much to spend on them? The LEAPS report provides information on these
important questions; here, we summarize some of the salient findings of the report focusing on the public-
private differences. We start with learning outcomes, then look at school infrastructure, the schooling market,
teachers and the demand for schooling in terms of parental knowledge and action.
Figure 3: A typical village in the LEAPS survey has 5-8 government and private schools, many located in a
main settlement and some in peripheral settlements—the latter mostly government schools
Private School (All Co-educational)
Government School (Boys)
Government School (Girls)
39.89
39.90
39.91
39.91
39.92
No
rth
70.14 70.15 70.15 70.16 70.16 70.16
East
One Village in the LEAPS Survey
10 minutes
walk
Main Settlement
Peripheral
Settlement
Peripheral
Settlement
Main Road
Private School (All Co-educational)
Government School (Boys)
Government School (Girls)
39.89
39.90
39.91
39.91
39.92
No
rth
70.14 70.15 70.15 70.16 70.16 70.16
East
One Village in the LEAPS Survey
10 minutes
walk
Main Settlement
Peripheral
Settlement
Peripheral
Settlement
Main Road
Nadia
Highlight
xiii
What are Children Learning?
Facts about learning in a nutshell: Learning outcomes are poor. They have little to do with where
you live, and everything to do with whether you go to a public or private school. The differences
between public and private schools are so large that it will take government school students between
1.5 to 2.5 years of additional schooling to catch up to where private school students were in Class 3.
It also costs less to educate a child in a private school. Putting learning and cost differences
together, the quality-adjusted-cost in government schools is three times higher than in private
schools.
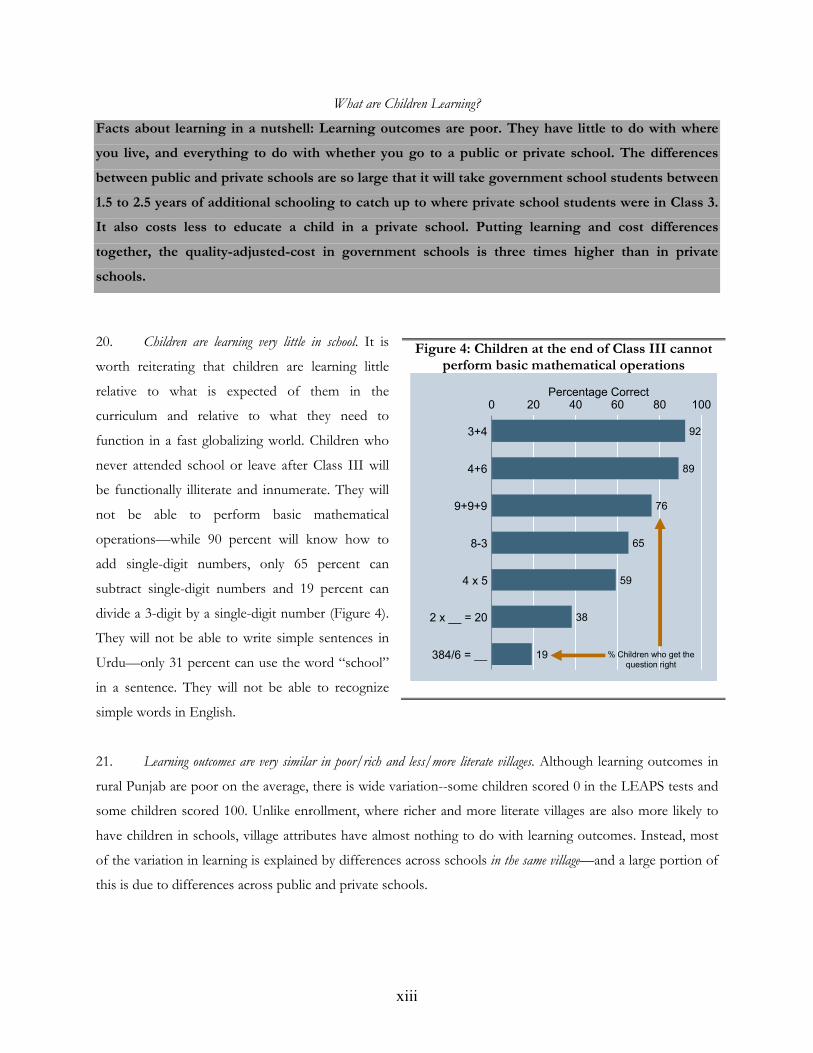
20. Children are learning very little in school. It is
worth reiterating that children are learning little
relative to what is expected of them in the
curriculum and relative to what they need to
function in a fast globalizing world. Children who
never attended school or leave after Class III will
be functionally illiterate and innumerate. They will
not be able to perform basic mathematical
operations—while 90 percent will know how to
add single-digit numbers, only 65 percent can
subtract single-digit numbers and 19 percent can
divide a 3-digit by a single-digit number (Figure 4).
They will not be able to write simple sentences in
Urdu—only 31 percent can use the word “school”
in a sentence. They will not be able to recognize
simple words in English.
21. Learning outcomes are very similar in poor/rich and less/more literate villages. Although learning outcomes in
rural Punjab are poor on the average, there is wide variation--some children scored 0 in the LEAPS tests and
some children scored 100. Unlike enrollment, where richer and more literate villages are also more likely to
have children in schools, village attributes have almost nothing to do with learning outcomes. Instead, most
of the variation in learning is explained by differences across schools in the same village—and a large portion of
this is due to differences across public and private schools.
Figure 4: Children at the end of Class III cannot perform basic mathematical operations
19
38
59
65
76
89
92
0 20 40 60 80 100Percentage Correct
384/6 = __
2 x __ = 20
4 x 5
8-3
9+9+9
4+6
3+4
% Children who get the
question right19
38
59
65
76
89
92
0 20 40 60 80 100Percentage Correct
384/6 = __
2 x __ = 20
4 x 5
8-3
9+9+9
4+6
3+4
% Children who get the
question right
xiv
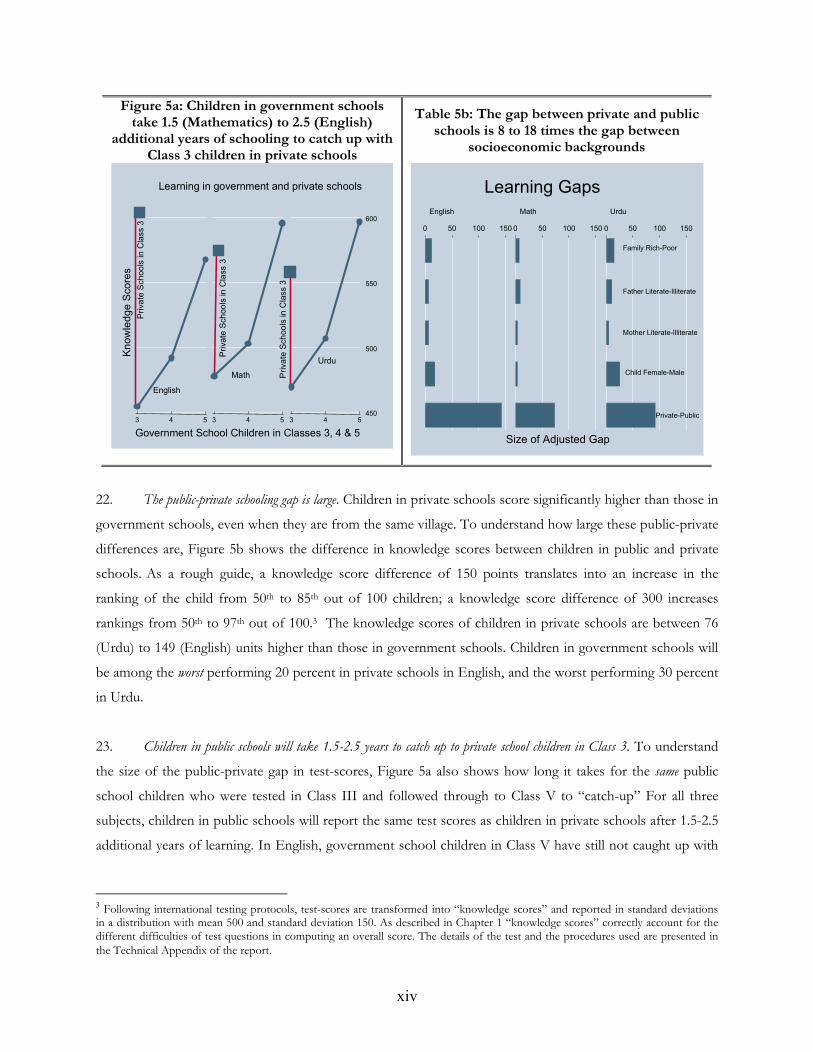
22. The public-private schooling gap is large. Children in private schools score significantly higher than those in
government schools, even when they are from the same village. To understand how large these public-private
differences are, Figure 5b shows the difference in knowledge scores between children in public and private
schools. As a rough guide, a knowledge score difference of 150 points translates into an increase in the
ranking of the child from 50th to 85th out of 100 children; a knowledge score difference of 300 increases
rankings from 50th to 97th out of 100.3 The knowledge scores of children in private schools are between 76
(Urdu) to 149 (English) units higher than those in government schools. Children in government schools will
be among the worst performing 20 percent in private schools in English, and the worst performing 30 percent
in Urdu.
23. Children in public schools will take 1.5-2.5 years to catch up to private school children in Class 3. To understand
the size of the public-private gap in test-scores, Figure 5a also shows how long it takes for the same public
school children who were tested in Class III and followed through to Class V to “catch-up” For all three
subjects, children in public schools will report the same test scores as children in private schools after 1.5-2.5
additional years of learning. In English, government school children in Class V have still not caught up with
3 Following international testing protocols, test-scores are transformed into “knowledge scores” and reported in standard deviations in a distribution with mean 500 and standard deviation 150. As described in Chapter 1 “knowledge scores” correctly account for the different difficulties of test questions in computing an overall score. The details of the test and the procedures used are presented in the Technical Appendix of the report.
Figure 5a: Children in government schools take 1.5 (Mathematics) to 2.5 (English)
additional years of schooling to catch up with Class 3 children in private schools
Table 5b: The gap between private and public schools is 8 to 18 times the gap between
socioeconomic backgrounds
450
500
550
600
3 4 5 3 4 5 3 4 5
English
Math
Urdu
Kn
ow
led
ge
Sco
res
Government School Children in Classes 3, 4 & 5
Learning in government and private schools
Priva
te S
ch
oo
ls in
Cla
ss 3
Pri
vate
Sch
oo
ls in
Cla
ss 3
Priva
te S
ch
oo
ls in
Cla
ss 3
450
500
550
600
3 4 5 3 4 5 3 4 5
English
Math
Urdu
Kn
ow
led
ge
Sco
res
Government School Children in Classes 3, 4 & 5
Learning in government and private schools
Priva
te S
ch
oo
ls in
Cla
ss 3
Pri
vate
Sch
oo
ls in
Cla
ss 3
Priva
te S
ch
oo
ls in
Cla
ss 3
Family Rich-Poor
Father Literate-Illiterate
Mother Literate-Illiterate
Child Female-Male
Private-Public
0 50 100 150 0 50 100 150 0 50 100 150
English Math Urdu
Size of Adjusted Gap
Learning Gaps
xv
private school children in Class III. Even in Urdu, an additional 1.5 years of schooling is required before
government school children catch up with their counterparts in private schools.
24. The public-private learning gap is much larger than that across children from different socioeconomic backgrounds.
Another way to benchmark the private-public gap in learning is to compare it to differences across widely
emphasized parental dimensions, such as parental literacy and wealth. The gap between public and private
schools in English is 12 times that between rich and poor children. The gap between public and private
schools in Mathematics is 8 times that between children with literate and illiterate fathers. The gap between
public and private schools in Urdu is 18 times the gap between children with literate and illiterate mothers
(Figure 5b). 4
25. Educating a child in a public school costs twice as much as in a private school. Are test scores in private schools
higher because they use more resources, or, put another way, are children in government schools learning less
because there is no money? The overall cost of educating a child in the median rural private school was
Rs.1000 or $15 a year—one month’s fee is roughly the equivalent of one day’s wage for an unskilled laborer.
As it turns out, educating a child in a public school costs society twice as much—at Rs.2000 a year—as a private
school. Looking at the quality-adjusted cost of private schools, education in the public sector is three times
more expensive than the private sector. For every Rs.1 that a private school spends on an extra percent
correct on a test, the public system spends Rs.3.
26. In addition to higher test-scores, parental satisfaction with private schools is also higher. When asked about
teaching skills of government and private teachers, parents ranked 45 percent of government school teachers
“above average” or “excellent” compared to 60 percent in private schools. When asked to rank all the schools
in the village, parents were 26 percentage points less likely to rate a government school as “good” or
“excellent” compared to their private counterparts. Whether we look at test scores, costs or parental
satisfaction, private schools look a whole lot better.
4 Because wealthier children are more likely to be in private schools, the socioeconomic gaps control for the school that the child is in as well as other relevant household and child attributes. Similarly, because private schools have richer children, the public-private gap controls for the household and child attributes of children. In Chapter 1 we also show that public-private differences are not due to differences in the student body—either observable or unobservable. In terms of observable differences the raw gap between public and private schools is reduced by at most 20 percent, with a rich set of school, child and household controls.
xvi
Are Schools Functional?
Facts about schools in a nutshell: Private schools are located in intensely competitive schooling
clusters. The need to keep fees low implies that profits are low: The median private school’s profits
are equivalent to the salary of a male teacher. Moreover, private schools compete on other
dimensions than learning. Consequently, facilities in private schools are better than in government
schools.
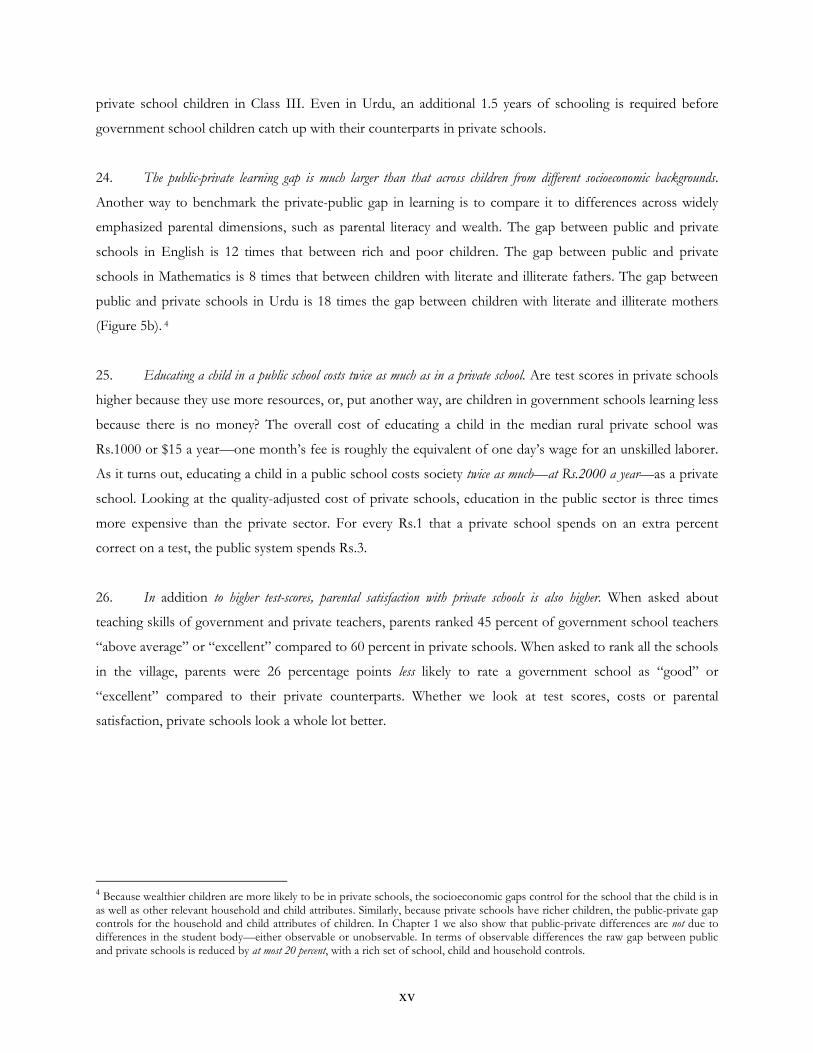
27. Private schools are located in intensely competitive
schooling clusters. The geographical clustering patterns
evident in Figure 3 extend to the wider LEAPS data
from 112 villages. The average private school in the
LEAPS data is located such that close to half of all
other schools in the village are within a 5-minute walk,
and less than a third are more than a 15-minute walk
away. With 8 schools in every village, the average
private school has close to 4 schools surrounding it.
Government schools tend to be less clustered, with just
over a third of all schools in a village within a 5-minute
walking distance of the average school.
28. One consequence is that private school profits are low. A detailed cost and revenue accounting exercise with
private schools showed that the median profit of a private school is Rs.14000 a year. This is equivalent to the
salary of a male teacher in a private school. Another way of looking at it is the principal of the private sector
could earn exactly this amount by teaching in another school—profits lower than this would imply that in
monetary terms, the principal would be better off by shutting down the school.
29. A second consequence is that private schools have lower student-teacher ratios and better infrastructure than government
schools. Prior to looking at private-public differences, it is worth noting that basic facilities in the LEAPS
sample schools, including government schools, are not “dismal”—they have classrooms and blackboards,
although seating arrangements and the availability of toilets is troubling. Slightly more than a one-quarter of
schools have no toilet facilities and even in schools with such facilities, there are 74 children to every toilet.
Comparing private to public schools, the typical private school has almost one-half the student-teacher ratio
and significantly better facilities than the typical government school—cost savings in private schools are not
because they are skimping on other aspects of a child’s education.
Figure 6: Nearly half of all schools in a village are within a 5-minute walk of a private school.
35.84%
20.66%
43.5%47.31%
28.51%
24.18%
Government Private
<5 Minutes 5-15 Minutes >15 Minutes
Distances Between Schools in the Same Village
xvii
Do Teachers Teach?
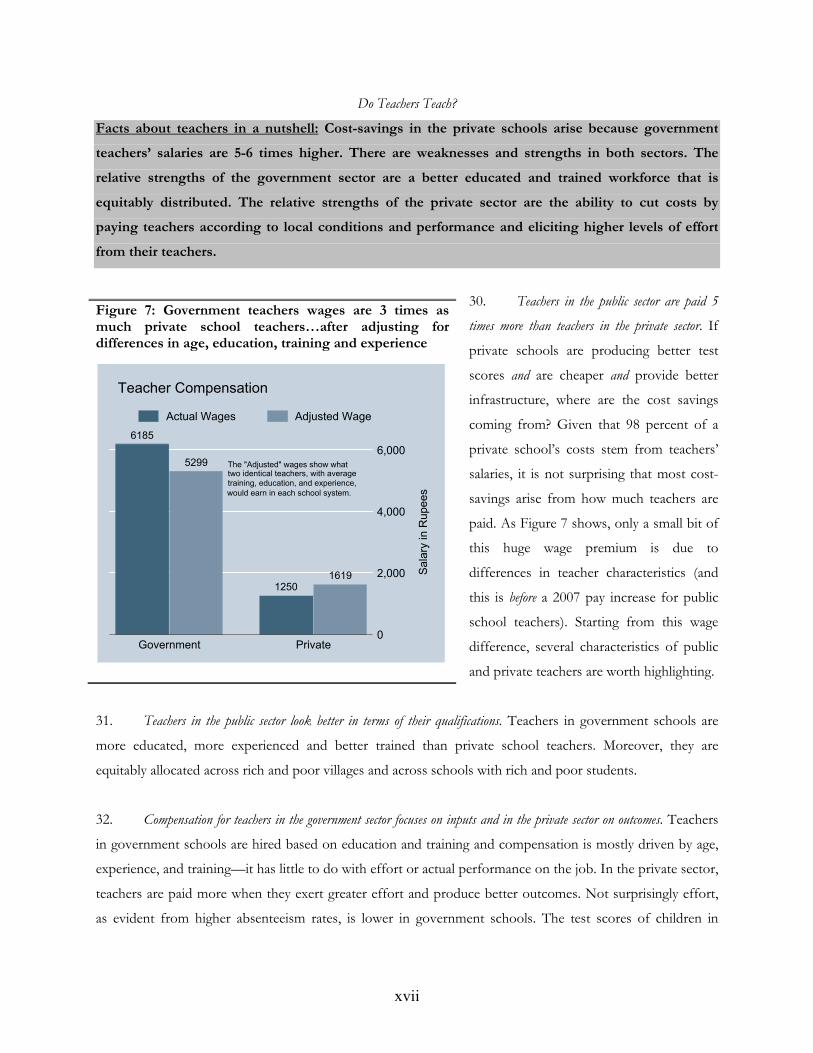
Facts about teachers in a nutshell: Cost-savings in the private schools arise because government
teachers’ salaries are 5-6 times higher. There are weaknesses and strengths in both sectors. The
relative strengths of the government sector are a better educated and trained workforce that is
equitably distributed. The relative strengths of the private sector are the ability to cut costs by
paying teachers according to local conditions and performance and eliciting higher levels of effort
from their teachers.
30. Teachers in the public sector are paid 5
times more than teachers in the private sector. If
private schools are producing better test
scores and are cheaper and provide better
infrastructure, where are the cost savings
coming from? Given that 98 percent of a
private school’s costs stem from teachers’
salaries, it is not surprising that most cost-
savings arise from how much teachers are
paid. As Figure 7 shows, only a small bit of
this huge wage premium is due to
differences in teacher characteristics (and
this is before a 2007 pay increase for public
school teachers). Starting from this wage
difference, several characteristics of public
and private teachers are worth highlighting.
31. Teachers in the public sector look better in terms of their qualifications. Teachers in government schools are
more educated, more experienced and better trained than private school teachers. Moreover, they are
equitably allocated across rich and poor villages and across schools with rich and poor students.
32. Compensation for teachers in the government sector focuses on inputs and in the private sector on outcomes. Teachers
in government schools are hired based on education and training and compensation is mostly driven by age,
experience, and training—it has little to do with effort or actual performance on the job. In the private sector,
teachers are paid more when they exert greater effort and produce better outcomes. Not surprisingly effort,
as evident from higher absenteeism rates, is lower in government schools. The test scores of children in
Figure 7: Government teachers wages are 3 times as much private school teachers…after adjusting for differences in age, education, training and experience
6185
5299
12501619
The "Adjusted" wages show whattwo identical teachers, with average
training, education, and experience,
would earn in each school system.
0
2,000
4,000
6,000
Sala
ry in R
upees
Government Private
Teacher Compensation
Actual Wages Adjusted Wage
xviii
private schools suggest that less-educated teachers making greater effort can outperform more educated and
better trained government teachers.
33. Compensation for teachers in the government sector is unrelated to local labor market conditions. Teacher salaries
for government schools are the same in villages with a large number of unemployed graduates and villages
where there are no other educated people for miles. While this is understandable, maybe to attract teachers to
remote areas under the “education for all” mandate, it means that the flexibility to pay according to local
labor market conditions vanishes. In contrast, compensation in the private sector reflects the alternative
employment opportunities of the teacher in the wider labor market. As a consequence, women and those
who reside locally are paid less.
34. The higher qualifications of government school teachers combined with their lower effort defines the tragedy of government
schools. As one reviewer of this report puts it: “The question really is how we free up the resources represented by those
government teachers who do not teach. The loss here is doubly tragic both because it is money down the drain and because the
government actually hires those who have the training needed to be the best teachers. The only reason the private schools look so
good is that the poorly performing public schools are so disastrous: if at some future date, children actually start demanding
something more than the most rudimentary education, the semi-educated teachers in the private schools would actually find it hard
to cope.”
xix
Are private schools unilaterally a better option?
Facts about the constraints to private schooling in a nutshell: Private schools are overwhelmingly
located in richer villages, while government schools ensure equitable geographical access for all
income levels. Within villages, private schools are located in central and richer settlements. The
main constraint on private schools is the availability of an educated (female) workforce. Private
schools do not arise in a vacuum: government investment in girls’ secondary schooling during the
1980s probably paved the way for private schools today.
Are private schools then a unilaterally better option? No—because private schools are not everywhere.
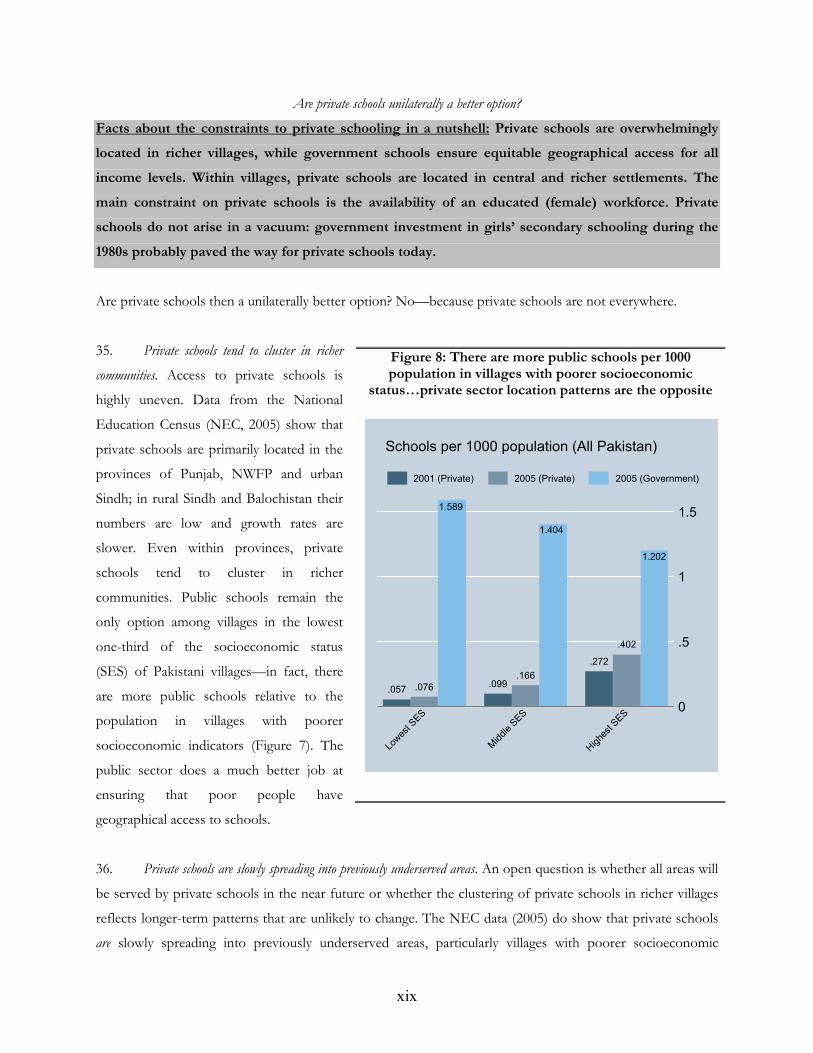
35. Private schools tend to cluster in richer
communities. Access to private schools is
highly uneven. Data from the National
Education Census (NEC, 2005) show that
private schools are primarily located in the
provinces of Punjab, NWFP and urban
Sindh; in rural Sindh and Balochistan their
numbers are low and growth rates are
slower. Even within provinces, private
schools tend to cluster in richer
communities. Public schools remain the
only option among villages in the lowest
one-third of the socioeconomic status
(SES) of Pakistani villages—in fact, there
are more public schools relative to the
population in villages with poorer
socioeconomic indicators (Figure 7). The
public sector does a much better job at
ensuring that poor people have
geographical access to schools.
36. Private schools are slowly spreading into previously underserved areas. An open question is whether all areas will
be served by private schools in the near future or whether the clustering of private schools in richer villages
reflects longer-term patterns that are unlikely to change. The NEC data (2005) do show that private schools
are slowly spreading into previously underserved areas, particularly villages with poorer socioeconomic
Figure 8: There are more public schools per 1000 population in villages with poorer socioeconomic
status…private sector location patterns are the opposite
.057 .076
1.589
.099.166
1.404
.272
.402
1.202
0
.5
1
1.5
Lowes
t SES
Middle
SES
Highe
st S
ES
Schools per 1000 population (All Pakistan)
2001 (Private) 2005 (Private) 2005 (Government)
xx
characteristics. Yet, the number of private schools in villages with the lowest SES increased only from 0.057
to .076 per 1000 population compared to an increase from .272 to .402 in villages with the highest SES.
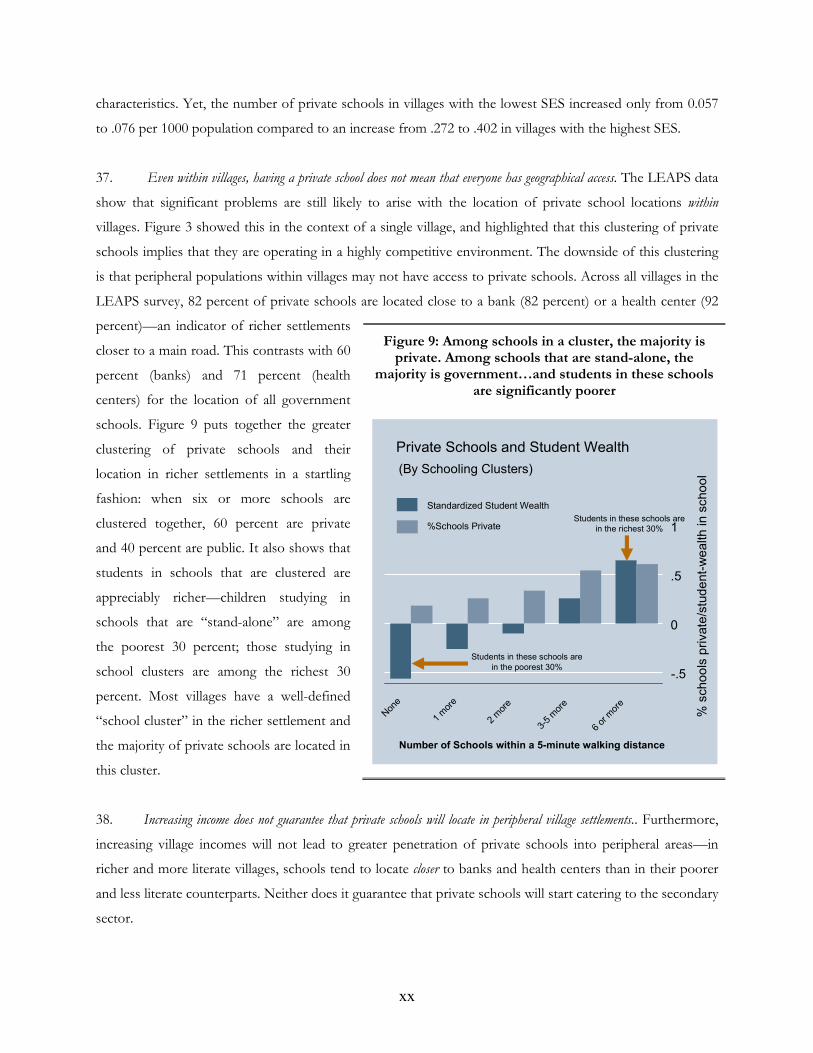
37. Even within villages, having a private school does not mean that everyone has geographical access. The LEAPS data
show that significant problems are still likely to arise with the location of private school locations within
villages. Figure 3 showed this in the context of a single village, and highlighted that this clustering of private
schools implies that they are operating in a highly competitive environment. The downside of this clustering
is that peripheral populations within villages may not have access to private schools. Across all villages in the
LEAPS survey, 82 percent of private schools are located close to a bank (82 percent) or a health center (92
percent)—an indicator of richer settlements
closer to a main road. This contrasts with 60
percent (banks) and 71 percent (health
centers) for the location of all government
schools. Figure 9 puts together the greater
clustering of private schools and their
location in richer settlements in a startling
fashion: when six or more schools are
clustered together, 60 percent are private
and 40 percent are public. It also shows that
students in schools that are clustered are
appreciably richer—children studying in
schools that are “stand-alone” are among
the poorest 30 percent; those studying in
school clusters are among the richest 30
percent. Most villages have a well-defined
“school cluster” in the richer settlement and
the majority of private schools are located in
this cluster.
38. Increasing income does not guarantee that private schools will locate in peripheral village settlements.. Furthermore,
increasing village incomes will not lead to greater penetration of private schools into peripheral areas—in
richer and more literate villages, schools tend to locate closer to banks and health centers than in their poorer
and less literate counterparts. Neither does it guarantee that private schools will start catering to the secondary
sector.
Figure 9: Among schools in a cluster, the majority is private. Among schools that are stand-alone, the
majority is government…and students in these schools are significantly poorer
-.5
0
.5
1
% s
cho
ols
pri
vate
/stu
de
nt-
we
alth
in
scho
ol
Non
e
1 m
ore
2 m
ore
3-5
mor
e
6 or
mor
e
(By Schooling Clusters)
Private Schools and Student Wealth
Standardized Student Wealth
%Schools Private
Number of Schools within a 5-minute walking distance
Students in these schools are
in the poorest 30%
Students in these schools are
in the richest 30%
xxi
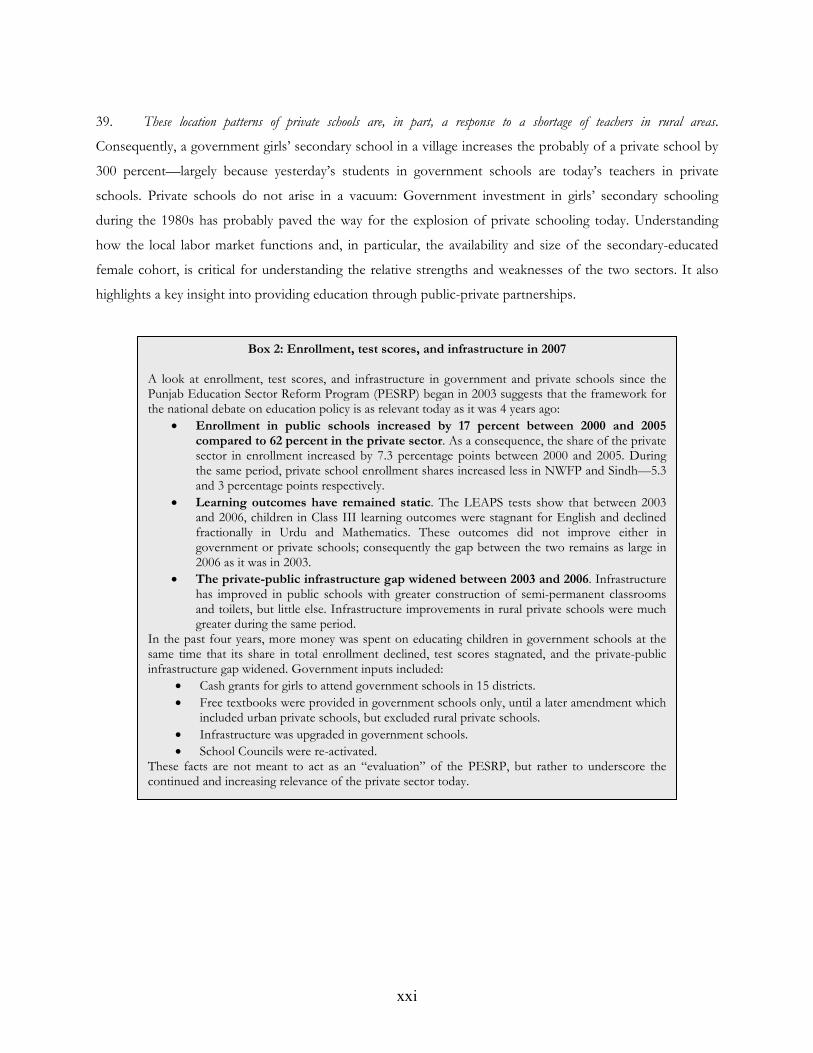
Box 2: Enrollment, test scores, and infrastructure in 2007 A look at enrollment, test scores, and infrastructure in government and private schools since the Punjab Education Sector Reform Program (PESRP) began in 2003 suggests that the framework for the national debate on education policy is as relevant today as it was 4 years ago:
• Enrollment in public schools increased by 17 percent between 2000 and 2005 compared to 62 percent in the private sector. As a consequence, the share of the private sector in enrollment increased by 7.3 percentage points between 2000 and 2005. During the same period, private school enrollment shares increased less in NWFP and Sindh—5.3 and 3 percentage points respectively.
• Learning outcomes have remained static. The LEAPS tests show that between 2003 and 2006, children in Class III learning outcomes were stagnant for English and declined fractionally in Urdu and Mathematics. These outcomes did not improve either in government or private schools; consequently the gap between the two remains as large in 2006 as it was in 2003.
• The private-public infrastructure gap widened between 2003 and 2006. Infrastructure has improved in public schools with greater construction of semi-permanent classrooms and toilets, but little else. Infrastructure improvements in rural private schools were much greater during the same period.
In the past four years, more money was spent on educating children in government schools at the same time that its share in total enrollment declined, test scores stagnated, and the private-public infrastructure gap widened. Government inputs included:
• Cash grants for girls to attend government schools in 15 districts.
• Free textbooks were provided in government schools only, until a later amendment which included urban private schools, but excluded rural private schools.
• Infrastructure was upgraded in government schools.
• School Councils were re-activated. These facts are not meant to act as an “evaluation” of the PESRP, but rather to underscore the continued and increasing relevance of the private sector today.
39. These location patterns of private schools are, in part, a response to a shortage of teachers in rural areas.
Consequently, a government girls’ secondary school in a village increases the probably of a private school by
300 percent—largely because yesterday’s students in government schools are today’s teachers in private
schools. Private schools do not arise in a vacuum: Government investment in girls’ secondary schooling
during the 1980s has probably paved the way for the explosion of private schooling today. Understanding
how the local labor market functions and, in particular, the availability and size of the secondary-educated
female cohort, is critical for understanding the relative strengths and weaknesses of the two sectors. It also
highlights a key insight into providing education through public-private partnerships.
xxii
What do households know and who do they invest in?
Facts about the demand for education in a nutshell: Parents, both literate and illiterate know a lot
about their children and the schools in their village. What school they choose depends on their
preferences for quality, cost and distance. There are two groups of particularly vulnerable children—
girls living “far” from school and children perceived as “less intelligent” by their parents. Female
enrollment drops off sharply with distance to school. Parents invest less on children perceived to be
“less intelligent”.
Parents are making decisions in this complicated environment to find out about schools, choose among them
and ultimately invest in their children’s education. How are households, particularly those with illiterate
parents, coping?
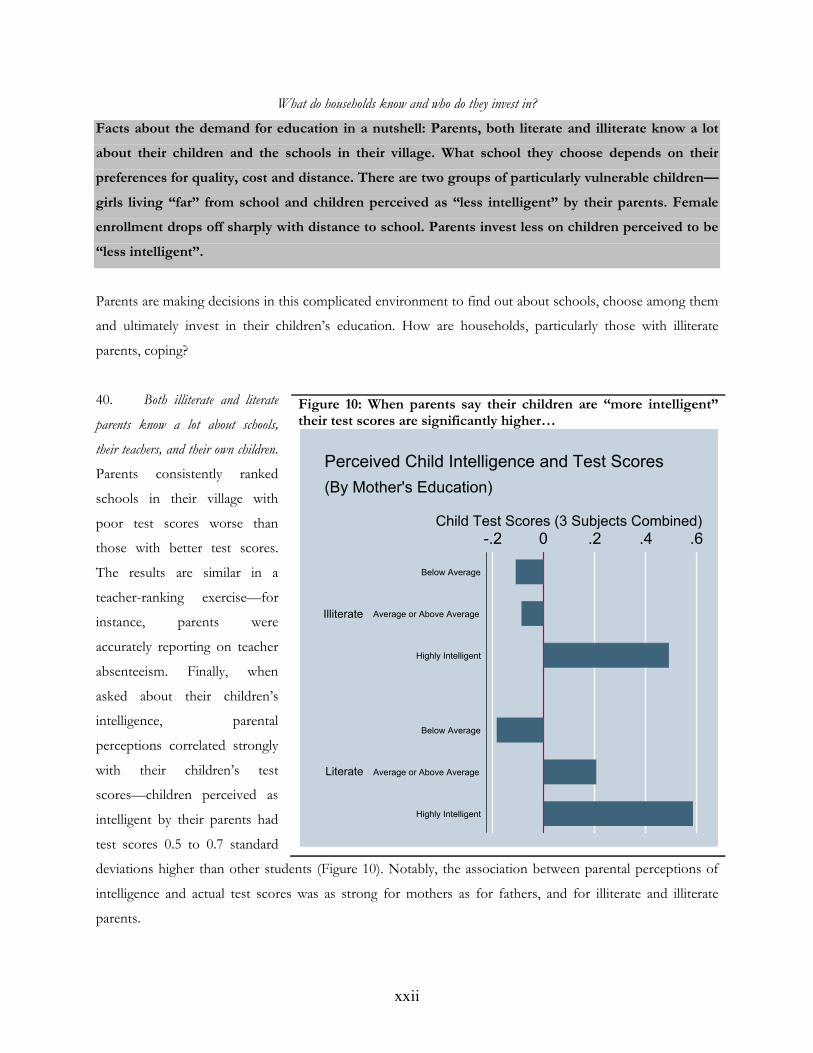
40. Both illiterate and literate
parents know a lot about schools,
their teachers, and their own children.
Parents consistently ranked
schools in their village with
poor test scores worse than
those with better test scores.
The results are similar in a
teacher-ranking exercise—for
instance, parents were
accurately reporting on teacher
absenteeism. Finally, when
asked about their children’s
intelligence, parental
perceptions correlated strongly
with their children’s test
scores—children perceived as
intelligent by their parents had
test scores 0.5 to 0.7 standard
deviations higher than other students (Figure 10). Notably, the association between parental perceptions of
intelligence and actual test scores was as strong for mothers as for fathers, and for illiterate and illiterate
parents.
Figure 10: When parents say their children are “more intelligent” their test scores are significantly higher…
-.2 0 .2 .4 .6Child Test Scores (3 Subjects Combined)
Literate
Illiterate
Highly Intelligent
Average or Above Average
Below Average
Highly Intelligent
Average or Above Average
Below Average
(By Mother's Education)
Perceived Child Intelligence and Test Scores
xxiii
41. Low enrollment has little to do with child-labor but a lot to do with distance, particularly for girls. One group of
vulnerable children consists of those who live far from school. For children in the primary school-going age group, the
alternative to not going to school is not working at home or in factories, instead it is playing and sleeping.
Primary age children who are not in school spend only 93 minutes a day working at home and working for a
wage. On the other hand, every additional 500 meters increase in the distance to the closest school results in a
large drop in enrollment, and more so for girls—girls living 500 meters from the school are 15 percentage points
less likely to attend than those living next door. The drop-off is much smaller for boys, and in fact, distance
to school accounts for the bulk of the gender differential in enrollment in Pakistan. The magnitude of this
decline is similar among rich and poor households, teenage and younger girls, and girls with literate or
illiterate mothers. Solving the distance issue is thus the key to increasing enrollment, particularly for girls, and
it has little to do with incomes.
42. The second group of vulnerable children consists of those perceived as less intelligent by their parents. Parents spend
significantly on their enrolled children, but invest a less on this vulnerable group. More than one-half of all educational
expenditures for school-going children are out-of-pocket spending by households. Parents spend almost as
much on girls as on boys. The distinction within households is the relative investments on children perceived to
be more or less intelligent. By the time children enter primary school, those perceived as less intelligent have
three strikes against them—they are less likely to be enrolled, when enrolled they are less likely to be in
private schools, and even for a household with two children enrolled in similar schools, children perceived as
more intelligent by parents will have more spent on them.
xxiv
V. SHAPING THE EDUCATIONAL DEBATE IN PAKISTAN USING DATA 43. How can these data be used to answer policy questions? As examples, we take two issues that are
both contentious and widely debated. The first is a proposal to increase the minimum qualifications of
government teachers, the second is the question of how (and whether) to regulate private schools.
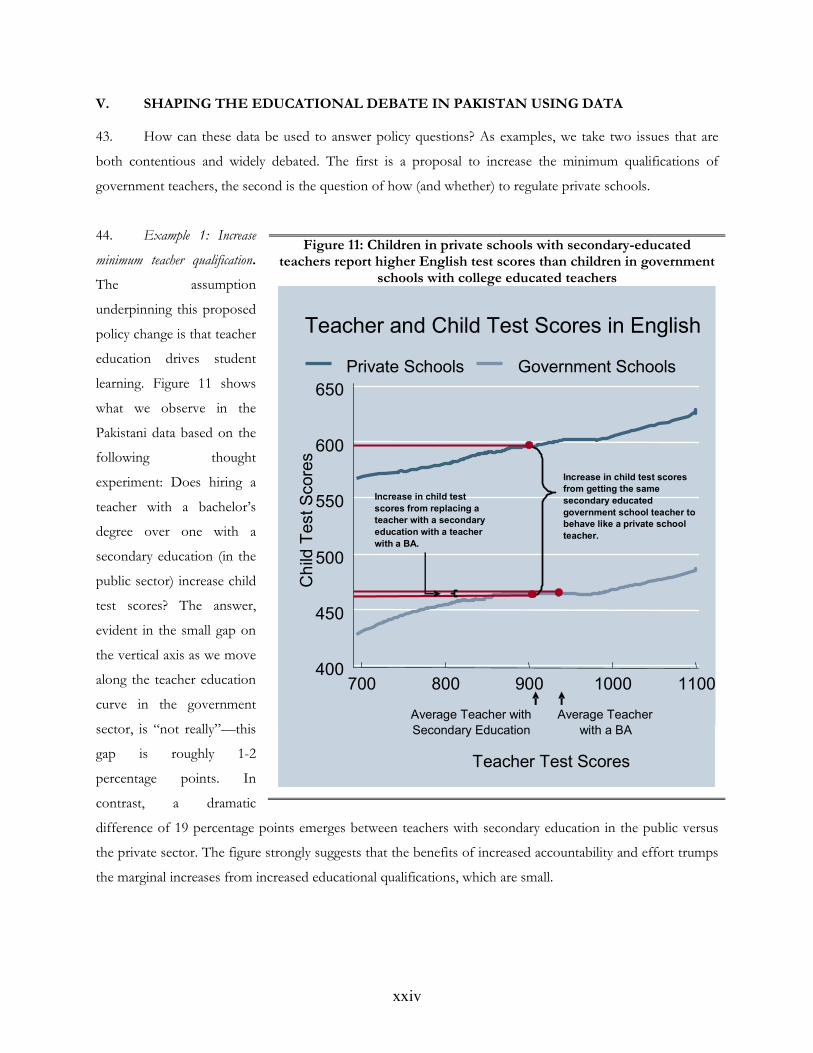
44. Example 1: Increase
minimum teacher qualification.
The assumption
underpinning this proposed
policy change is that teacher
education drives student
learning. Figure 11 shows
what we observe in the
Pakistani data based on the
following thought
experiment: Does hiring a
teacher with a bachelor’s
degree over one with a
secondary education (in the
public sector) increase child
test scores? The answer,
evident in the small gap on
the vertical axis as we move
along the teacher education
curve in the government
sector, is “not really”—this
gap is roughly 1-2
percentage points. In
contrast, a dramatic
difference of 19 percentage points emerges between teachers with secondary education in the public versus
the private sector. The figure strongly suggests that the benefits of increased accountability and effort trumps
the marginal increases from increased educational qualifications, which are small.
Figure 11: Children in private schools with secondary-educated teachers report higher English test scores than children in government
schools with college educated teachers
400
450
500
550
600
650
Ch
ild E
ng
lish K
no
wle
dg
e T
est
Sco
res
700 800 900 1000 1100
Teacher English Knowledge Test Scores
Private Schools Government Schools
Teacher Education and Child Learning
Increase in child test scores
from getting the same
secondary educated
government school teacher to
behave like a private school
teacher.
Increase in child test
scores from replacing a
teacher with a secondary
education with a teacher
with a BA.
Average Teacher with
Secondary Education
Average Teacher
with a BA
400
450
500
550
600
650
Ch
ild T
est S
core
s
700 800 900 1000 1100
Teacher Test Scores
Private Schools Government Schools
Teacher and Child Test Scores in English
Increase in child test scores
from getting the same
secondary educated
government school teacher to
behave like a private school
teacher.
Increase in child test
scores from replacing a
teacher with a secondary
education with a teacher
with a BA.
Average Teacher with
Secondary Education
Average Teacher
with a BA
400
450
500
550
600
650
Ch
ild E
ng
lish K
no
wle
dg
e T
est
Sco
res
700 800 900 1000 1100
Teacher English Knowledge Test Scores
Private Schools Government Schools
Teacher Education and Child Learning
Increase in child test scores
from getting the same
secondary educated
government school teacher to
behave like a private school
teacher.
Increase in child test
scores from replacing a
teacher with a secondary
education with a teacher
with a BA.
Average Teacher with
Secondary Education
Average Teacher
with a BA
400
450
500
550
600
650
Ch
ild T
est S
core
s
700 800 900 1000 1100
Teacher Test Scores
Private Schools Government Schools
Teacher and Child Test Scores in English
Increase in child test scores
from getting the same
secondary educated
government school teacher to
behave like a private school
teacher.
Increase in child test
scores from replacing a
teacher with a secondary
education with a teacher
with a BA.
Average Teacher with
Secondary Education
Average Teacher
with a BA
xxv
45. If effort trumps education and training, a policy to raise the minimum education standard for primary school teachers
would cause problems in areas with limited teacher availability. The median village in Punjab had 8 secondary-school
educated women in 1998 so teachers with a bachelor’s degree will have to be brought in from outside the
village. Absenteeism increases when teachers are not local hires, so effort among more highly educated
graduates may be lower. This does not bode well given the overall skill shortage in the Pakistani economy.
46. Example 2: Regulate the private sector. Different opinions about private schools and their recent growth
abound. One camp advocates regulatory oversight of private schools. Another camp argues that even if
private schools provide poor quality, or parents do not get what they pay for, regulation will not solve the
problem. Can the data combined with standard economic analysis shed light on this issue?
47. Economic theory suggests that the first rationale for regulation is to ensure that every school meets a minimum quality
standard. But, the bulk of the poorly performing schools are government schools. While top government schools
are only slightly worse than top private schools, the performance of the worst government schools is much
worse that that of the worst private schools. The same goes for infrastructure—of the 100 schools with the
worst infrastructure, 98 are in the public sector. This is particularly a problem because parents invest more in
children they think are more intelligent (e.g., they select private schools). Children perceived as “less
intelligent,” who are overwhelmingly enrolled in government schools, may not be receiving an education that
meets a basic minimal standard.
48. The second rationale for regulation is to address pricing inefficiencies arising from monopolistic behavior. Typically,
every country looks at such issues and advocates alternatives. Since private schools overwhelmingly locate in
schooling clusters, they cannot behave as monopolies. The direct competition from other schools keeps their
prices low. Indeed, the average profit of a rural private school in Punjab is approximately the salary of one
male teacher.
49. The third often used rationale for regulation is that consumers are unable to evaluate the quality of the product they
receive, and that it is cheaper to regulate quality rather than provide information. As discussed earlier, the average
household is actually fairly good at distinguishing well performing from poorly performing schools. Unlike
the private sector where prices signal quality so that schools with higher test scores charge higher fees, in the
government sector, all schools are free and therefore parents may find it harder to evaluate their relative
performance. Once again the standard rationales for regulation suggest that it is schools in the government
rather than the private sector that deserve closer attention. Furthermore, if there is a set of parents who do
not know much about schools, providing information itself is a feasible alternative. Not only does this enable
parents to make better decisions, but it can also lead to greater competition across schools leading to better
xxvi
outcomes. A pilot study shows that providing information about school test scores in the village does lead to
improvements in learning and that these improvements are higher for initially poorly performing children.
Fixing the underlying failures of information may be easier than imposing additional regulatory structure from
above.
50. Of the three rationales for regulation—ensuring a quality standard, ensuring competitive pricing and ensuring that
prices reflect quality —schools in the government sector are more likely candidates for regulation than those in the private sector.
But government schools are already regulated. It appears the inherent ability of parents to choose schools is
better than the safeguards in educational quality the bureaucracy can achieve. Given these data, the issue of
regulation of a new activity may be premature.
VI. A MODIFIED ROLE FOR GOVERNMENT?
51. Article 37 (b) & (c) of the Constitution of Pakistan (1973) affirms that “the State shall remove
illiteracy and provide free and compulsory secondary education within minimum possible period.” The
education landscape has changed since 1973, with a rapid rise in enrollments in Punjab and other provinces.
52. Although there may be pockets in Punjab where school availability is still an issue, access to education is reasonable.
Every village in our sample has multiple public schools that are free, and average learning, although poor, is
similar across villages, whether in lagging or high-performing regions. The “State shall remove illiteracy” and
what such an affirmation means in the context of the results presented here is the real issue. The rapid rise of
private schools and the higher scores in these schools is one means for citizens to fulfill their demands for
such educational services.
53. However, the view that the government should step back from education all together and leave it to the private sector
and to households is too extreme. This view assumes that parents will make schooling decisions for their children
based on their children’s best interests, rather than their own. A body of literature argues, and as parental
discrimination in Pakistan towards children shows, this is generically not the case. As a reviewer of the report
points out, and we agree, “it is worth emphasizing that parental discrimination has to be one of the most powerful reasons for
state intervention into education.” Parental discrimination means that different children in the same family can
reach adulthood with very different skills and knowledge—those perceived as less intelligent by their parents
likely suffer a significant educational disadvantage in adulthood. The goal of literacy is for all children in the
country, so some kind of government action is required to ensure that these children are not left behind.
Nadia
Highlight
xxvii
54. It is well within the powers of the government to improve educational quality in public schools, and enable a balance
between private school location and parental knowledge and discrimination. The picture regarding private schools is
changing rapidly, and some basic institutions are needed to help parents make better decisions. We propose a
discussion on a modified role of the government. This role envisages a government educational system that
tries to rectify the problems arising from private school location decisions and tries to protect children who
do not receive sufficient investments from parents. The modified proposal has three parts: providing
information, complementing the private sector to protect vulnerable children and innovating and evaluating
“out-of-the-box” reforms for public-private partnerships. Suppose that every year a sample of children is
tested in every village. Our goal is to ask what government policies can ensure that the knowledge these
children hold increases over time.
Providing Information
55. Information for better decision making and accountability: Data on learning outcomes need to be
systematically collected, monitored, analyzed and made publicly available. These data serve two purposes.
First, given that many villages now have 8 or more schools, parents with access to test scores of schools in
their village may be able to make better schooling choices for their children. Moreover, test score
comparisons across children, schools and even villages could lead to greater parental demands for
performance among school principals and teachers. Initial results from a randomized experiment that
provides such test scores in the LEAPS sample of villages suggest that this simple (and virtually free) step
could have large effects for initially poorly performing children. Second, transparent and publicly available
information on standardized tests and school performance will allow independent monitoring on progress as
well as research on what is working. The uses of these data increase dramatically if they also provide
information beyond test scores on the full learning environment (teachers, parents and schools) of the
Pakistani child.
56. An open question is whether the same protocol can be used for these two very different purposes.
International experience suggests not. Typically, school-wise results, which require testing on the universe of
schools, are administered by the government. However, tests used for monitoring performance and learning
gaps are administered by an independent or autonomous quasi-government institution, similar to the National
Center for Educational Statistics in the United States. This ensures a separation of powers and guarantees the
integrity of the findings. Furthermore, since monitoring tests are conducted for a sample (rather than all
schools), they also allow for collecting more information on student and school attributes—critical for
understanding the correlates of learning achievement.
xxviii
57. The widespread test at the end of Class V administered in Punjab province in 2006 is an important
first step and further work is required to ensure that citizens are able to monitor and hold the state
accountable for its performance in guaranteeing the right to education. If these exam results are standardized
and replicated every year in a reliable manner, with information given to parents on school results, part of the
information gap will be filled.
58. Regular and timely access to data is a critical component for evidence based policy making. In recent
years, Punjab has collected annual data on all its public schools, instituted a test of 1.2 million children,
collected detailed information on all teachers in the province and the Federal Bureau of Statistics has
collected information on all schools in the country. Making such information public and validating the
analysis would be an important first step. Researchers, academics, multilateral institutions (who are often
implicated in the withholding of data and information) and those interested in the Pakistani education system
need to ensure that this information is made available to the broader public on a regular basis. Enrollment
numbers are released on an annual basis; similar results need to be made available on learning so that this
becomes part of the popular discourse on the state of Pakistani education.
Reforming Government Education: Increasing Access and Improving Quality
Increasing Access: The government has been remarkably successful in ensuring access to schools at the
primary level in large parts of the country, including Punjab. Further expansion includes the setting up of
secondary schools (especially for girls) and identifying pockets where school availability is still a concern. In
addition, the government needs to experiment with policies that can decrease the “distance-penalty” for girls.
59. Deployment strategies for teachers could try and reduce competition between the public and private sector in the limited
market for teachers. One of the most powerful tools that the government holds in its hands is the right to
transfer teachers to villages and schools where they are needed most. Given the inherent differences in
salaries between the private and public sector, it makes little sense, if we are concerned about the right to
education of the poor in Pakistan, for the public sector to compete with the private sector when both choices
are available.
60. A complementary strategy might involve transferring teachers to those villages and settlements (or levels of schooling, such
as secondary) where the private sector has no presence. This would justify part of their high salaries because of the
inherent difficulties of working in the places where they are posted. Although problems of accountability and
incentives will remain, these teachers will be providing some education where previously there was none. The
government system of compensation and the right to transfer teachers to other locales allows it to fulfill
xxix
certain key objectives: in particular, bringing education to geographical areas where the private sector
presence is not as strong and expanding access to secondary education, where poor teacher qualifications may
prove an impediment for private sector provision.
61. Increasing secondary schooling options for girls could lead to higher attainment as well as long-term gains in the
increased availability of teachers. One way to improve learning is to keep children in school longer. More
secondary schools (particularly for girls) would help widen educational opportunities and ensure a cohort of
secondary educated women in every village. Such an expansion would also increase the future supply of
teachers. Private schools are 3 times as likely to locate in villages with a Government girls’ secondary
school—largely because the students in these schools yesterday became the teachers in the private schools
today. Building more secondary schools will be cheaper if teachers from existing government schools with
low student-teacher ratios are used, instead of new hires.
62. The government also needs to experiment with ways to reduce the “distance-penalty” for girls. A girl who lives 500
meters further from a school is 15 percentage points less likely to be enrolled than one who lives next door to
a school. It is very costly to provide a government school within 100 meters of every household; an
alternative is urgently required. The LEAPS data so far do not yield a clear policy—what they do show is that
money, age and parental literacy have little to do with the ability of girls to attend farther schools.
Improving quality: From the widening international consensus and the LEAPS data, it is clear that
improving quality in the government sector is all about rethinking government teacher hiring and
compensation. The debate around how to do this could center around (a) letting teachers teach, (b) increasing
flexibility in hiring through probation periods and the relaxation of certification where necessary and (c)
providing incentives for better performance.
63. Let teachers teach. If teachers are primarily in villages to teach, burdening them with additional duties
and requirements does not help. Work-related absences (though self-reported and not verified) are quite
common in the public sector, but not in the private sector. The reasons ranged from attending workshops
and meetings, collecting salaries, being on examination duty in other schools and administering polio
vaccinations. Should rewards go to teachers who complete electoral rolls on time, administer polio
vaccinations and attend numerous meetings, or to those who teach? A recent proposal to separate teaching
and management cadres is laudable—much will depend on whether additional duties can be restricted only to
those in the latter group.
xxx
64. Consider a probationary period to identify and retain good teachers. To some extent, good teachers are born,
not made. The only way to figure out who has the instinct to be a good teacher and who does not is to
observe them for some period of time. Yet, the public sector is a “settled” sector with very little turnover—
teacher turnover in a given year is 24 percent in government schools compared to 71 percent in the private
sector. The private sector builds in the flexibility to get rid of teachers who are inherently bad and hire new
ones but the government sector does not. One possibility is a probationary period of 2-3 years during which
the teacher is kept on a temporary contract. At the end of this period, the teacher may be converted to a
permanent contract through a clear process. The problem, though, is in the details: Who should decide
whether the teacher should be retained or not and what should be the nature of the process?
65. Teachers should be rewarded for greater effort. These incentives will increase performance. While few disagree with
the overall premise (apart from the inherent political realities), this is a tough issues to resolve and requires
extensive public discussion. Broadly speaking, there are two ways to go about doing this—one is to reward
teachers on inputs such as attendance, the other on outcomes such as learning. In recent randomized
evaluations, both have been shown to work; yet the former ran into problems when the same technique was
tried with government nurses (rather than NGO teachers) and the latter faces severe technical issues (see
chapter 3). One alternative is to reward teachers not on outcomes but on processes. The problem is that it is
not clear how such a process would work, or who would decide.
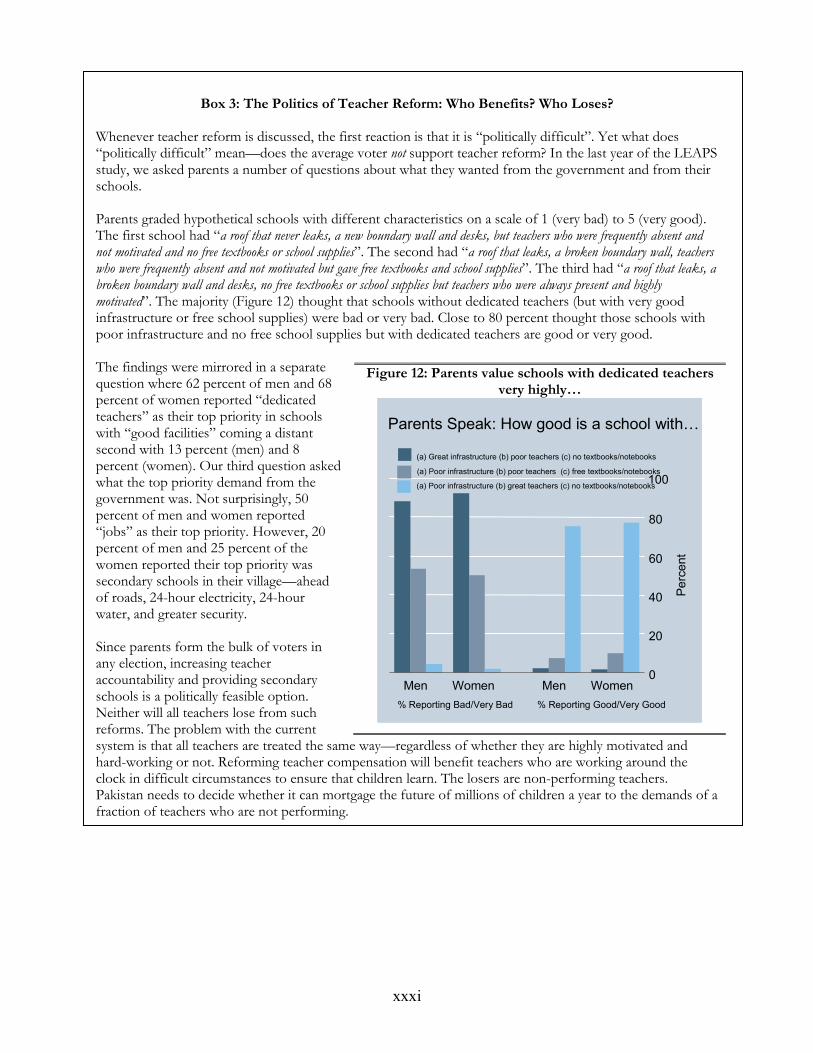
xxxi
Box 3: The Politics of Teacher Reform: Who Benefits? Who Loses? Whenever teacher reform is discussed, the first reaction is that it is “politically difficult”. Yet what does “politically difficult” mean—does the average voter not support teacher reform? In the last year of the LEAPS study, we asked parents a number of questions about what they wanted from the government and from their schools. Parents graded hypothetical schools with different characteristics on a scale of 1 (very bad) to 5 (very good). The first school had “a roof that never leaks, a new boundary wall and desks, but teachers who were frequently absent and not motivated and no free textbooks or school supplies”. The second had “a roof that leaks, a broken boundary wall, teachers who were frequently absent and not motivated but gave free textbooks and school supplies”. The third had “a roof that leaks, a broken boundary wall and desks, no free textbooks or school supplies but teachers who were always present and highly motivated”. The majority (Figure 12) thought that schools without dedicated teachers (but with very good infrastructure or free school supplies) were bad or very bad. Close to 80 percent thought those schools with poor infrastructure and no free school supplies but with dedicated teachers are good or very good. The findings were mirrored in a separate question where 62 percent of men and 68 percent of women reported “dedicated teachers” as their top priority in schools with “good facilities” coming a distant second with 13 percent (men) and 8 percent (women). Our third question asked what the top priority demand from the government was. Not surprisingly, 50 percent of men and women reported “jobs” as their top priority. However, 20 percent of men and 25 percent of the women reported their top priority was secondary schools in their village—ahead of roads, 24-hour electricity, 24-hour water, and greater security. Since parents form the bulk of voters in any election, increasing teacher accountability and providing secondary schools is a politically feasible option. Neither will all teachers lose from such reforms. The problem with the current system is that all teachers are treated the same way—regardless of whether they are highly motivated and hard-working or not. Reforming teacher compensation will benefit teachers who are working around the clock in difficult circumstances to ensure that children learn. The losers are non-performing teachers. Pakistan needs to decide whether it can mortgage the future of millions of children a year to the demands of a fraction of teachers who are not performing.
Figure 12: Parents value schools with dedicated teachers very highly…
0
20
40
60
80
Perc
ent
% Reporting Bad/Very Bad % Reporting Good/Very Good
Men Women Men Women
How Parents Rank Schools
(a) Great infrastructure (b) poor teachers (c) no free school su pplies
(a) Poor infrastructure (b) poor teachers (c) free school suppl ies
(a) Poor infrastructure (b) great teachers (c) no free school su pplies100
0
20
40
60
80
Perc
ent
% Reporting Bad/Very Bad % Reporting Good/Very Good
Men Women Men Women
Parents Speak: How good is a school withK
(a) Great infrastructure (b) poor teachers (c) no textbooks/notebooks
(a) Poor infrastructure (b) poor teachers (c) free textbooks/notebooks
(a) Poor infrastructure (b) great teachers (c) no textbooks/notebooks100
0
20
40
60
80
Perc
ent
% Reporting Bad/Very Bad % Reporting Good/Very Good
Men Women Men Women
How Parents Rank Schools
(a) Great infrastructure (b) poor teachers (c) no free school su pplies
(a) Poor infrastructure (b) poor teachers (c) free school suppl ies
(a) Poor infrastructure (b) great teachers (c) no free school su pplies100
0
20
40
60
80
Perc
ent
% Reporting Bad/Very Bad % Reporting Good/Very Good
Men Women Men Women
Parents Speak: How good is a school withK
(a) Great infrastructure (b) poor teachers (c) no textbooks/notebooks
(a) Poor infrastructure (b) poor teachers (c) free textbooks/notebooks
(a) Poor infrastructure (b) great teachers (c) no textbooks/notebooks100
xxxii
If not teachers, what else?
66. Apart from teachers, there is no single input that can be easily and consistently linked to test scores. As an
illustration, in one of our sample villages the three head-teachers of private schools agreed that motivated
teachers were critical for better learning, but they differed on everything else. In fact, each of them was doing
something different to improve learning in the school. The first had arranged Mathematics training for a
teacher; the second constructed a boundary wall because he felt that road-traffic was distracting children and
the third provided a chaperone to bring children to school across a small forest. Private schools are probably
doing better not because of “a set of inputs” that are higher quality than the government, but because they
have the ability and flexibility to fix the weakest link in the chain, and in different schools, this implies that
they are doing different things.
67. Government schools can learn from private schools. One approach is the “planning approach” that tries to see
what input should be augmented to improve outcomes; a second approach admits that different places and
different children have different needs and a central planner can never seek to align inputs perfectly for every
single child. It also recognizes that there are agents at the local level who can do this better—the flexible head-
teachers in private schools for instance. The “flex-approach” suggests that instead of trying to fix every input
optimally, the planner fixes the system so that those who know more and are able to respond better to
individual needs prosper, while those who are inflexible and provide low-quality inputs are taken out of the
system. A debate around whether such a “flex-approach” is better and feasible in the government system is
necessary for shifting from inputs to outcomes in educational performance. Government should not try to fix
the pipes, but instead fix the institutions that fix the pipe and ensure that the water is flowing. How the
institutions actually fix the pipes is of lesser concern.
Innovating and Evaluating “out-of-the-box” reforms
68. In countries where private schooling option is widespread, policy options in education have revolved around public-private
partnerships. Such partnerships largely involve government financing and private delivery of education.
Examples include grant-in aid schools (UK, India) and charter schools in the US which largely involve block
grants/funding to private schools. The other model is financing families directly through vouchers to each
school-going child. This has been tried in Colombia, Chile, Sweden and the U.S. among other countries. How
well these alternate forms of partnerships work is highly debated and depends on country circumstances
69. Are vouchers the way forward for fixing institutions in Pakistan? Along similar lines, one way to fix the
institutions is to provide financing for education, but leave provision to the private sector. Under such
schemes (or equivalent schemes such as tuition subsidies), each child is given money (a “voucher”) that can
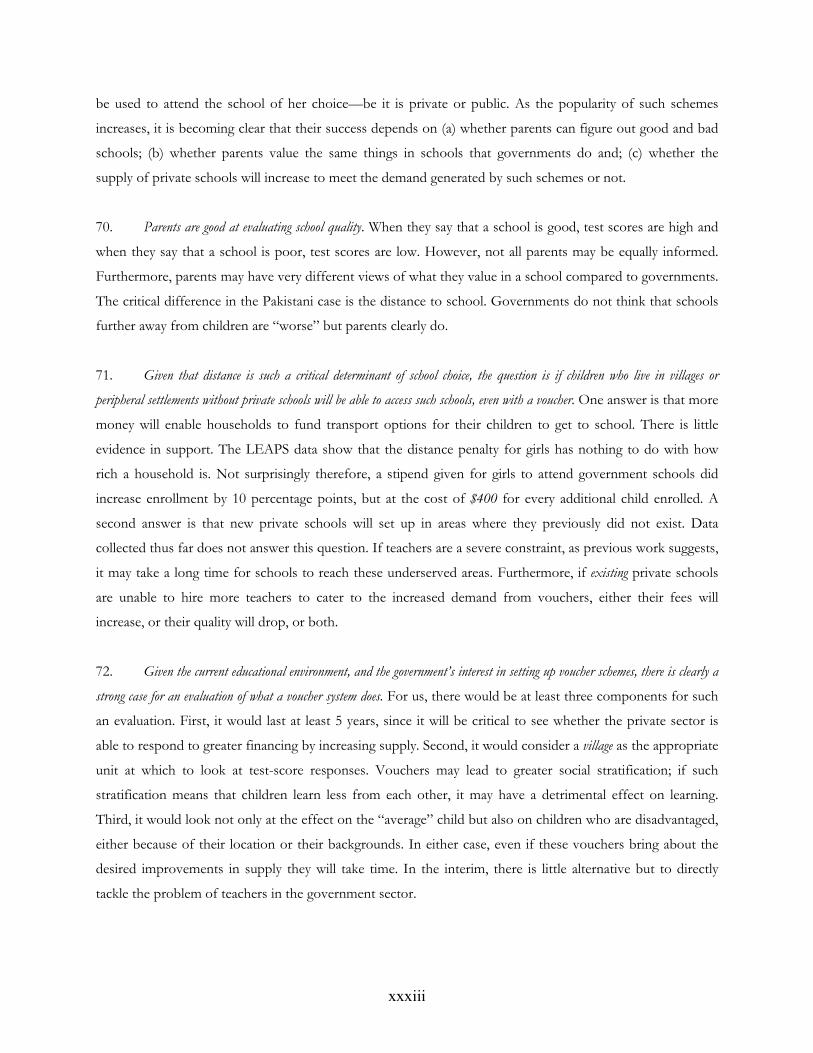
xxxiii
be used to attend the school of her choice—be it is private or public. As the popularity of such schemes
increases, it is becoming clear that their success depends on (a) whether parents can figure out good and bad
schools; (b) whether parents value the same things in schools that governments do and; (c) whether the
supply of private schools will increase to meet the demand generated by such schemes or not.
70. Parents are good at evaluating school quality. When they say that a school is good, test scores are high and
when they say that a school is poor, test scores are low. However, not all parents may be equally informed.
Furthermore, parents may have very different views of what they value in a school compared to governments.
The critical difference in the Pakistani case is the distance to school. Governments do not think that schools
further away from children are “worse” but parents clearly do.
71. Given that distance is such a critical determinant of school choice, the question is if children who live in villages or
peripheral settlements without private schools will be able to access such schools, even with a voucher. One answer is that more
money will enable households to fund transport options for their children to get to school. There is little
evidence in support. The LEAPS data show that the distance penalty for girls has nothing to do with how
rich a household is. Not surprisingly therefore, a stipend given for girls to attend government schools did
increase enrollment by 10 percentage points, but at the cost of $400 for every additional child enrolled. A
second answer is that new private schools will set up in areas where they previously did not exist. Data
collected thus far does not answer this question. If teachers are a severe constraint, as previous work suggests,
it may take a long time for schools to reach these underserved areas. Furthermore, if existing private schools
are unable to hire more teachers to cater to the increased demand from vouchers, either their fees will
increase, or their quality will drop, or both.
72. Given the current educational environment, and the government’s interest in setting up voucher schemes, there is clearly a
strong case for an evaluation of what a voucher system does. For us, there would be at least three components for such
an evaluation. First, it would last at least 5 years, since it will be critical to see whether the private sector is
able to respond to greater financing by increasing supply. Second, it would consider a village as the appropriate
unit at which to look at test-score responses. Vouchers may lead to greater social stratification; if such
stratification means that children learn less from each other, it may have a detrimental effect on learning.
Third, it would look not only at the effect on the “average” child but also on children who are disadvantaged,
either because of their location or their backgrounds. In either case, even if these vouchers bring about the
desired improvements in supply they will take time. In the interim, there is little alternative but to directly
tackle the problem of teachers in the government sector.
1
INTRODUCTION
The Educational Setting
The changing educational marketplace in Pakistan presents opportunities and challenges for education policy in the country.
Enrollment in primary schools is increasing and secular, co-educational private schools are locating in both
urban and rural areas. Many rural Pakistani families no longer live in a village with one or two government
schools—in rural Punjab, for instance, parents can now routinely chose among seven to eight schools in their
village. The expansion of education providers in the private sector has implications for educating the poor
not only in Pakistan, but also in the wider South-Asian context.
The Learning and Educational Achievement in Punjab (LEAPS) report presents basic facts and a framework for an “evidence-
based” debate around education performance and education policy in Pakistan. This report is based on a large and
independent survey and testing exercise that provides information on every aspect of the educational
marketplace in selected districts of rural Punjab. This report presents findings from the first survey in 2003; a
forthcoming report will incorporate information from all four survey rounds between 2003 and 2007. The
first four chapters—on learning, schools, teachers, and households—present an overview of the education
sector. The final chapter presents questions for debate and discussion based on these facts and suggests a new
“modified” role government can play in this new educational landscape. The data collected through the
LEAPS survey are publicly available at www.leapsproject.org and further analyses of these data are welcome
and encouraged. This introduction presents a portrait of this new educational marketplace, provides an
overview of the report’s focus and the types of villages included in the LEAPS sample.
Facts and features of the new educational marketplace
Educational attainment is poor, but improving. Educational performance, as measured by literacy and enrollment
indicators reported in household survey data, is poor both in absolute terms and relative to the average
income of the country. Adult literacy in Pakistan is 50 percent compared to 58 percent average for South Asia
as a whole. The primary school net-enrollment rate was 66 percent in 2004 compared to 90 percent for India,
97 percent for Sri-Lanka and 78 percent for Nepal. Pakistan is struggling to meet the educational needs of its
large population.
Enrollment is on the rise. Data from household and establishment surveys show that the number of children in
school is increasing. Across the four main provinces of Punjab, Sindh, NWFP, and Balochistan, the number
of children in school has risen from 21.36 million in 2001 to between 27.67 million (National Educational
Nadia
Highlight
2
Census, 2005) and 28.84 million (Pakistan Social and Living Standards Measurement Survey or PSLM, 2004-
05). Net enrollment across the four provinces rose from 51 percent in 2001 (Pakistan Integrated Household
Survey) to 61 percent in 2004-05 (PSLM).
Of the three players in the educational marketplace—government, religious, and private schools—attendance in government and
religious schools has increased slowly or stagnated since 1991 while private school enrollment has risen rapidly. Parents who
send their children to school have three options—government, religious, or private schools. Religious schools
attract a small minority of school-going children, with enrollment ranging from 1-3 percent depending on the
data source used. Enrollment in government schools has increased, but total share of enrollment in
government schools declined between 1991 and 2001 (using comparable PIHS data) from 87.5 percent in
1991 to 74 percent in 2001. Between 2001 and 2005, the relative share of the public sector has either
remained constant (according to the household survey data from PSLM 2004) or declined further to 66
percent (according to the National Education Census or NEC, 2005). The share of the private sector, which
stood at 12.5 percent in 1991 and increased to 25.9 percent in 2001 has either stagnated since then (PSLM
data), or increased further to 33 percent in 2005 (NEC, 2005). Whether the private sector maintained its share
or increased it further between 2001 and 2005, it has made significant inroads into the education marketplace
between 1991 and 2005, and is now teaching one out of every three children enrolled at the primary level.
Private schools are locating in rural areas and the children in these schools are increasingly drawn from poorer segments of society.
Private schools were primarily an urban phenomenon before the early 1990s, but since 1995 they have
increasingly located in rural areas. By 2000, 8,000 new private schools were being set up every year—half of
them in rural areas. Not surprisingly, the growth in private school shares has been highest among the poor, a
factor largely driven by the phenomenal growth rates among low and middle-income groups in rural areas
(see Andrabi, Das and Khwaja, forthcoming).
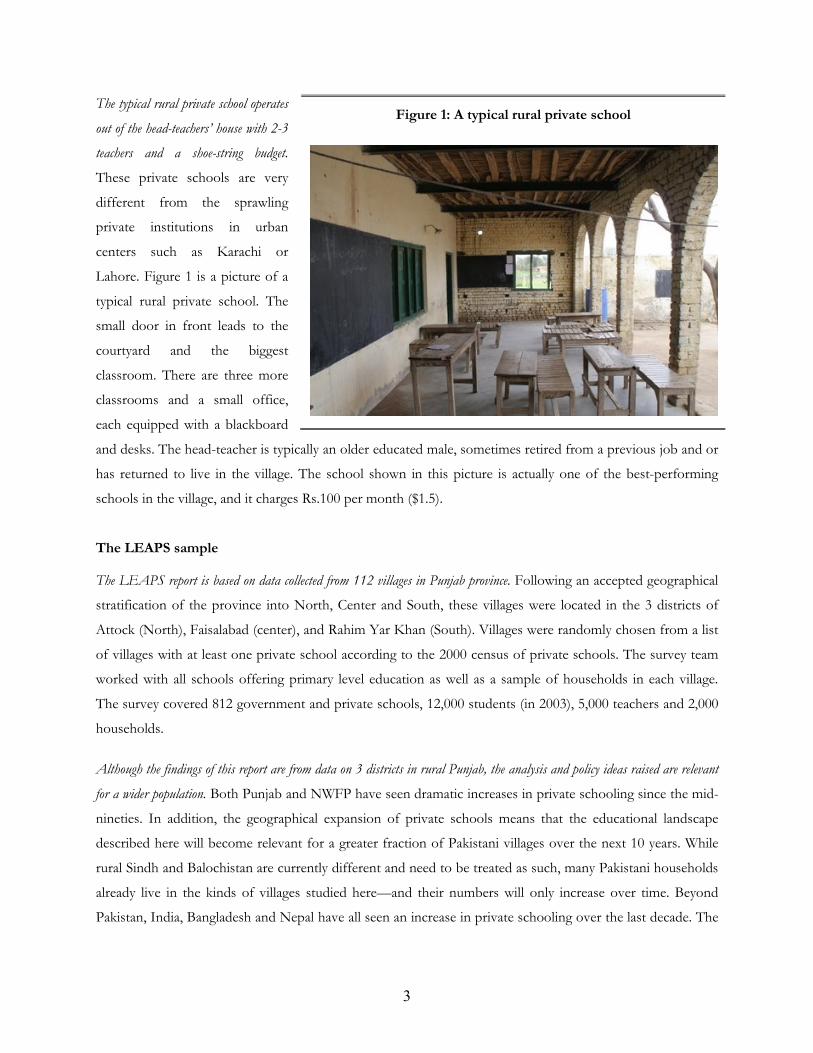
3
The typical rural private school operates
out of the head-teachers’ house with 2-3
teachers and a shoe-string budget.
These private schools are very
different from the sprawling
private institutions in urban
centers such as Karachi or
Lahore. Figure 1 is a picture of a
typical rural private school. The
small door in front leads to the
courtyard and the biggest
classroom. There are three more
classrooms and a small office,
each equipped with a blackboard
and desks. The head-teacher is typically an older educated male, sometimes retired from a previous job and or
has returned to live in the village. The school shown in this picture is actually one of the best-performing
schools in the village, and it charges Rs.100 per month ($1.5).
The LEAPS sample
The LEAPS report is based on data collected from 112 villages in Punjab province. Following an accepted geographical
stratification of the province into North, Center and South, these villages were located in the 3 districts of
Attock (North), Faisalabad (center), and Rahim Yar Khan (South). Villages were randomly chosen from a list
of villages with at least one private school according to the 2000 census of private schools. The survey team
worked with all schools offering primary level education as well as a sample of households in each village.
The survey covered 812 government and private schools, 12,000 students (in 2003), 5,000 teachers and 2,000
households.
Although the findings of this report are from data on 3 districts in rural Punjab, the analysis and policy ideas raised are relevant
for a wider population. Both Punjab and NWFP have seen dramatic increases in private schooling since the mid-
nineties. In addition, the geographical expansion of private schools means that the educational landscape
described here will become relevant for a greater fraction of Pakistani villages over the next 10 years. While
rural Sindh and Balochistan are currently different and need to be treated as such, many Pakistani households
already live in the kinds of villages studied here—and their numbers will only increase over time. Beyond
Pakistan, India, Bangladesh and Nepal have all seen an increase in private schooling over the last decade. The
Figure 1: A typical rural private school
4
issues discussed here are likely as relevant for this wider group and the LEAPS report brings together
evidence on all aspects of the educational marketplace by using the following survey instruments.
1. School surveys. The school surveys collected information on infrastructure, prices, costs, and other
facilities available in the neighborhood of the school
2. Teacher surveys. The LEAPS project administered three teacher surveys. A short roster of questions
administered for all teachers in the school and for all teachers who had left the school in the previous
two years yields information on about 5,000 teachers in the LEAPS project schools. A longer
questionnaire administered to the teachers of the tested children includes detailed socioeconomic
information about the teacher and yields data on roughly 800 teachers. A head-teacher questionnaire
(where the head-teacher was different from the class teacher) included questions on management
practices and bonus schemes, along with other modules.
3. Child tests. All children in grade 3 (approximately 12,000) were tested in the LEAPS project schools
with specially designed tests in Urdu, Mathematics, and English administered by the LEAPS team to
ensure impartial test circumstances. Further, for a sample of 10 randomly selected children in every
class (roughly 6,000), a short questionnaire was administered to collect information on parental
literacy, family structure, and household assets (in classes with less than 10 children, all children were
chosen).
4. Household surveys. Finally, to cover the inputs that the child received from home, a full-fledged
household questionnaire was fielded for 1,800 households in the sampled villages, with a special
focus on households with grade 3 students. A similar stratified approach was used to sample
households with school-age children who were not in school to ensure that we could compare the
activities of enrolled and out-of-school children. The details of this sampling procedure are presented
in Annex 1.
The aims of the LEAPS report
Opinions about private schools in Pakistan generally fall into two camps. One camp argues that private schooling is
stratifying Pakistani society into those who can afford such schooling and those who cannot (see for instance,
Rahman, 2005). Given that the provision of quality education is a constitutional responsibility of the
government, there is little positive to say about the increasing penetration of such schools into rural areas.
Further refinements of such a view advocate a strong regulatory policy and state oversight of such schools.
A second camp argues that private schools perform a valuable service by taking the “load off” government
schools. Providing quality education for an increasing population entirely through government schools will be
5
difficult; to the extent that private schools share the burden, their penetration may improve the education that
all children receive. Those who cannot afford private schools will still benefit, the argument goes, because
classrooms are less crowded than they would be otherwise and more resources are available. This camp
argues for a more pragmatic stance about the relevant alternatives given Pakistan’s history.
The LEAPS report considers these viewpoints and more. The media, the multiple “Islamic education” experts in the
West, and policymakers in Pakistan frequently express views and take passionate stands unsupported by data,
albeit in many cases because the data are just not available. As a result, educational debate often fixates on the
notion that Pakistan is a “failed state” and educational facilities, standards, and outcomes in the country are
poor because of government apathy and an elitist mindset. Such pronouncements make it difficult for policy-
makers and researchers to understand and effectively address a difficult yet critical topic affecting not just
Pakistan but other South Asian countries as well. The educational lives of the poor and those who live in rural
areas are best understood by examining the data. This report will have served its purpose if statements and
views expressed in the country and by international experts become more consistent with the data from the
households and schools in the villages.
THE FOCUS OF THE LEAPS REPORT
Efforts to enrich the debate on education policy focus on three areas: learning outcomes, the link between
inputs and outcomes, and the role of private schools.
The centrality of learning outcomes
The main educational outcome that the LEAPS report focuses on is learning, as measured through test-scores
of grade 3 children in English, Mathematics, and Urdu. This focus on “learning” offers several advantages
over focusing on more conventional measures like enrollment rates.
Measures of enrollment are valued in large part because they are viewed to be good estimates of child learning
– after all, children in school are almost certainly learning more than those not attending. But measures of
enrollment fail to capture the tremendous variations in learning that we find between schools. It may be true
that students in school may be learning more than those out of schools, but it is also true that students in
some schools are literally years behind students at other schools in the same grade.
Examining student learning is also important because it provides some insight into why parents choose to
enroll (or not enroll) their children in school. If parents decide to send their children to school based on
whether they think school with result in a better life for their children, then parents may not want to send
6
their children to school because they feel that they will not learn much. And examination of student learning
(and parental perceptions of schools) allows such an analysis.
The focus on learning rather than enrollment in this report is also a reflection of the quality of work already
conducted on enrollment in Pakistan. From data collected through household surveys such as the PIHS or
PSLM, the basic facts about spatial and household-level enrollment variation are well-documented, well
understood and regularly updated (see for instance, Alderman and others 1995, Gazdar 2000, Shahid Kardar
1995, Lloyd and others 2005). Increasing enrollment remains the dominant paradigm for thinking about
educational achievement in the country. Moreover, increasing Net and Gross Enrollment Rates (NER and
GER) were seen (and to some degree are still seen) as the aim of public policy on education. But as
participation improves, what children are actually learning is likely to become the defining issue in debates about
education in the country.
In an early interview, an educational specialist on our team, Anila Asghar, asked a mother about the decision
to send a child to school. The mother she interviewed had been through primary school but her husband was
uneducated:
“We send our boys to the government school but actually we would like to send them to a private school. But we do not have money for tuition and other expenses. We want our children to learn because the poor are progressing because of education (gharib aagay jaa rahay hain taaleem ki wajah se).”
This finding—that parents look at their children’s performance and care deeply about what their children are
learning—was echoed in interviews across all parts of Punjab. Despite this interest in the quality of children’s
educations on behalf of parents, however, no systematic data on school quality has ever been collected. It is
our hope that the data from the exams administered in LEAPS villages will stimulate a renewed and
nationwide push toward systematic thinking about learning among practitioners/researchers (on test
instruments, protocols and scoring techniques; discrepancies and commonalities among different tests, and
broadening the scope of testing), policymakers (on the implications of differences in learning between private
and public schools, and the impact of teacher training on test scores), and the public at large (on whether
private schools lead to educational apartheid, and at what point age gaps in learning arise).
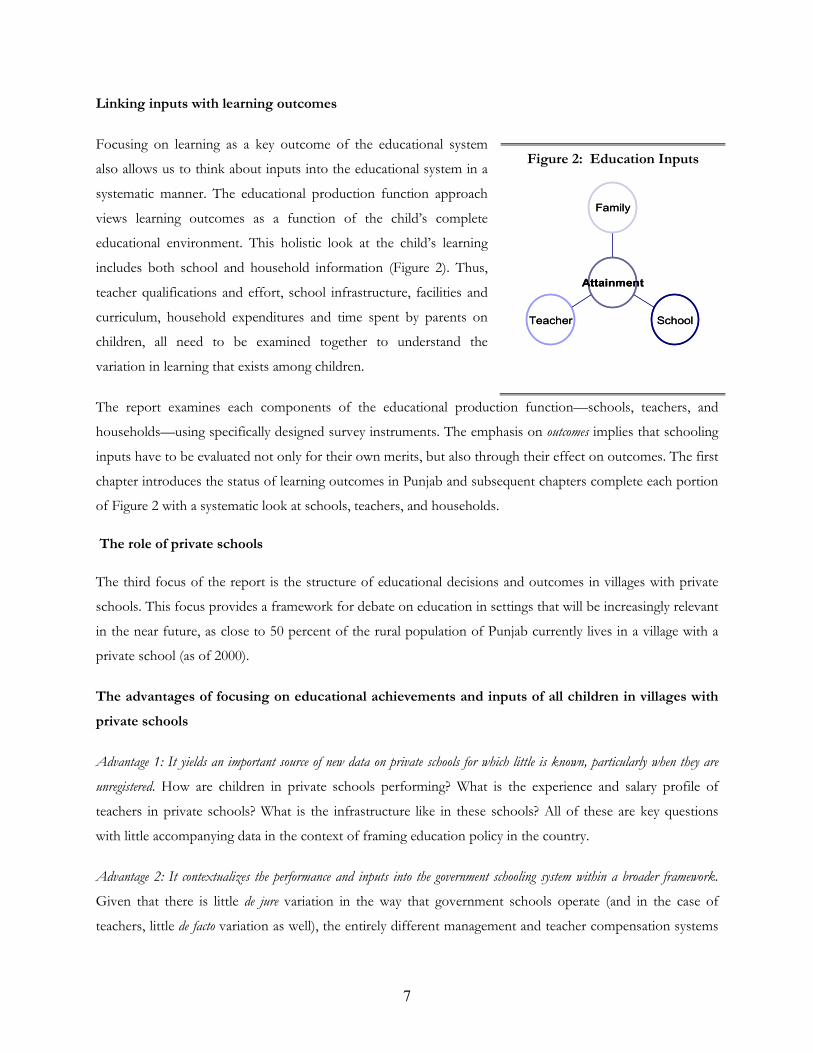
7
Linking inputs with learning outcomes
Focusing on learning as a key outcome of the educational system
also allows us to think about inputs into the educational system in a
systematic manner. The educational production function approach
views learning outcomes as a function of the child’s complete
educational environment. This holistic look at the child’s learning
includes both school and household information (Figure 2). Thus,
teacher qualifications and effort, school infrastructure, facilities and
curriculum, household expenditures and time spent by parents on
children, all need to be examined together to understand the
variation in learning that exists among children.
The report examines each components of the educational production function—schools, teachers, and
households—using specifically designed survey instruments. The emphasis on outcomes implies that schooling
inputs have to be evaluated not only for their own merits, but also through their effect on outcomes. The first
chapter introduces the status of learning outcomes in Punjab and subsequent chapters complete each portion
of Figure 2 with a systematic look at schools, teachers, and households.
The role of private schools
The third focus of the report is the structure of educational decisions and outcomes in villages with private
schools. This focus provides a framework for debate on education in settings that will be increasingly relevant
in the near future, as close to 50 percent of the rural population of Punjab currently lives in a village with a
private school (as of 2000).
The advantages of focusing on educational achievements and inputs of all children in villages with
private schools
Advantage 1: It yields an important source of new data on private schools for which little is known, particularly when they are
unregistered. How are children in private schools performing? What is the experience and salary profile of
teachers in private schools? What is the infrastructure like in these schools? All of these are key questions
with little accompanying data in the context of framing education policy in the country.
Advantage 2: It contextualizes the performance and inputs into the government schooling system within a broader framework.
Given that there is little de jure variation in the way that government schools operate (and in the case of
teachers, little de facto variation as well), the entirely different management and teacher compensation systems
Figure 2: Education Inputs
Teacher School
Family
Attainment
Teacher School
Family
Attainment
8
of private schools provides a valuable point of comparison. On the question of teacher training, the
comparison will show that nearly all government teachers are “trained” and nearly all private school teachers
are “untrained”. Without the private comparison, we have no way of knowing how important this training is;
comparing government and private schools provides some indication of whether (at the primary level) this
training bears fruit in terms of learning achievements.
Advantage 3: The dynamics of villages with private schools are entirely different from rural village with a single school. These
issues range from the type of data necessary to monitor educational outcomes and draw conclusions about
the effects of government programs to the type of planning required, say for, the location of government
schools or the complexity of household decisions about school choice.
For example, in a village with a single school, if enrollment in the school decreases, it is reasonable to assume
that enrollment in the village has also fallen. This is no longer true when there are private schools as well. In
such a case, decreased enrollment in a government school could just as well reflect a movement of children to
private schools without any overall change in enrollment levels. For this, we need data on private school
enrollments, and this information is not collected as part of the standard Educational Management
Information Systems (EMIS) data.
Consider next the issue of where to locate a school. In a village without a school, it probably makes sense to
locate the school in the middle of the most densely populated settlement. But this is not necessarily the case
in villages with a private school. If private schools are already located in densely populated settlements, it
might make more sense to locate a government school further out to serve populations not currently served
by the private school. Yet, as will be discussed in the chapter on schools, there is currently no data at the
provincial level on the location or number of schools (public and private) in a village, which is an important
factor for improving school access.
Finally, the decisions that households need to make are infinitely more complex when there is school choice.
With a single school in a village, a household needs to decide whether to send the child to school or not.
When there are multiple schools, households need to decide whether to enroll their child and figure out which
school to send their child to. This requires a completely different set of information (location of schools, cost
of each school, and quality of teaching at each school) and interacts in complex ways with the government’s
education policy.
9
CONTEXTUALIZING THE LEAPS REPORT Inter-District Variation
The three different districts of the LEAPS sample vary in measures of wealth, education, and occupation. Rahim Yar Khan is
the poorest of the three districts with much lower per-capita expenditures and household wealth than
Faisalabad and Attock. Faisalabad reports the highest per capita expenditures and Attock the highest
household wealth.
The lowest adult educational achievement is in Rahim Yar Khan for males and Attock for females. Faisalabad reports the
highest levels of male and female education. Along a number of measures, male education in Attock is similar
to that in Faisalabad with Rahim Yar Khan following; for female education, Faisalbad is a consistently strong
performer with Attock coming last. This division may be the result of enrollment patterns from the past—if
boys have had high enrollment rates in the past and continue to have high enrollment rates today then we
would observe high enrollment for boys as well as a high proportion of adult men who can read or write (as is
observed in Attock). Similarly the pattern in Faisalabad is suggestive of high enrollment by girls in the past
that continues today.
One-half of all household heads in Rahim Yar Khan report no education and one-third are farmers with 20 percent self-employed
and 11 percent salaried workers. Household heads in Faisalabad are somewhat more educated with a significantly
lower proportion engaged in farming (19 percent) and greater number reporting salaried employment (16
percent). Households heads in Attock report higher educational levels than in Rahim Yar Khan, but lower
than Faisalabad; 23 percent report farming as their main occupation followed by self-employment (16
percent) and salaried jobs (12 percent). In all three districts, farming remains the single largest occupation, but
a transition toward self-employment and salaried jobs is evident in the central and Northern districts
compared to in the South.
Enrollment patterns in the LEAPS villages
Enrollment patterns are well understood in the literature on education in Pakistan, and provide a natural
starting point for comparisons with other samples. The enrollment patterns in the report are based on the
LEAPS household census of over 150,000 children between the ages of 5-15 in the project villages.
The average enrollment rate in the surveyed villages is 76 percent for boys and 65 percent for girls between
the ages of 5-15, which is somewhat higher than those reported by the PSLM for all of rural Punjab, primarily
as a reflection of the LEAPS sampling strategy. These overall enrollment rates, however, mask tremendous
variation both across and within villages.
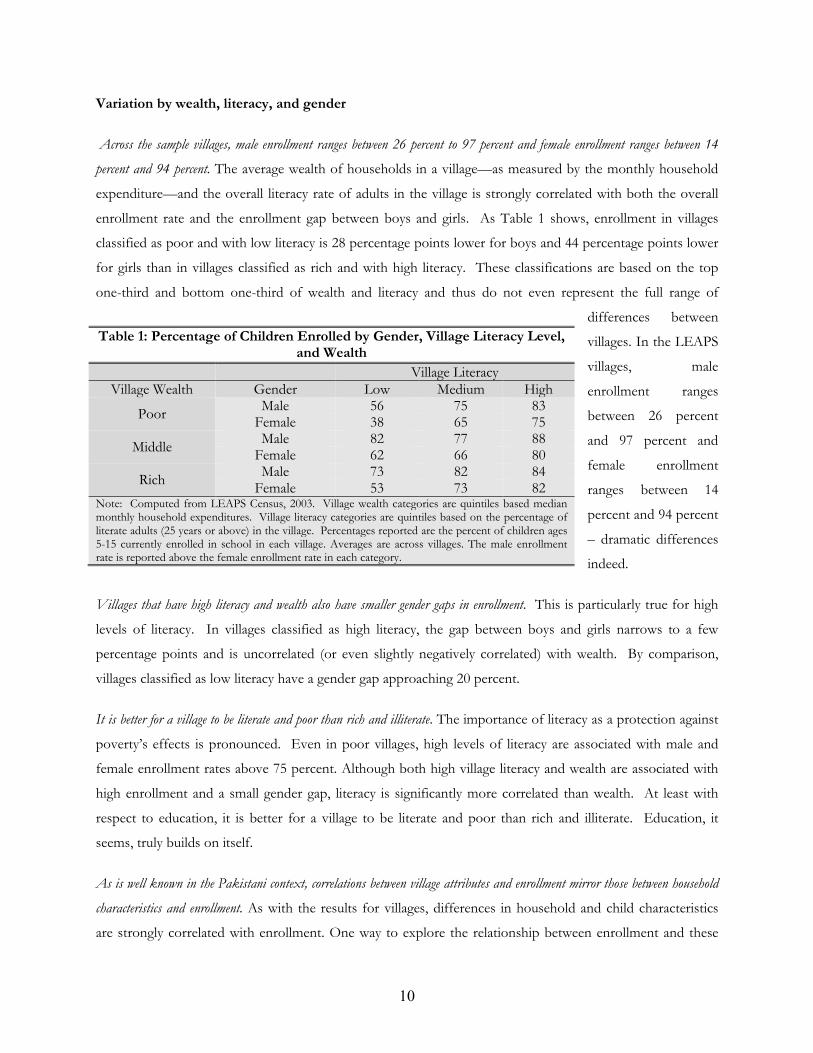
10
Variation by wealth, literacy, and gender
Across the sample villages, male enrollment ranges between 26 percent to 97 percent and female enrollment ranges between 14
percent and 94 percent. The average wealth of households in a village—as measured by the monthly household
expenditure—and the overall literacy rate of adults in the village is strongly correlated with both the overall
enrollment rate and the enrollment gap between boys and girls. As Table 1 shows, enrollment in villages
classified as poor and with low literacy is 28 percentage points lower for boys and 44 percentage points lower
for girls than in villages classified as rich and with high literacy. These classifications are based on the top
one-third and bottom one-third of wealth and literacy and thus do not even represent the full range of
differences between
villages. In the LEAPS
villages, male
enrollment ranges
between 26 percent
and 97 percent and
female enrollment
ranges between 14
percent and 94 percent
– dramatic differences
indeed.
Villages that have high literacy and wealth also have smaller gender gaps in enrollment. This is particularly true for high
levels of literacy. In villages classified as high literacy, the gap between boys and girls narrows to a few
percentage points and is uncorrelated (or even slightly negatively correlated) with wealth. By comparison,
villages classified as low literacy have a gender gap approaching 20 percent.
It is better for a village to be literate and poor than rich and illiterate. The importance of literacy as a protection against
poverty’s effects is pronounced. Even in poor villages, high levels of literacy are associated with male and
female enrollment rates above 75 percent. Although both high village literacy and wealth are associated with
high enrollment and a small gender gap, literacy is significantly more correlated than wealth. At least with
respect to education, it is better for a village to be literate and poor than rich and illiterate. Education, it
seems, truly builds on itself.
As is well known in the Pakistani context, correlations between village attributes and enrollment mirror those between household
characteristics and enrollment. As with the results for villages, differences in household and child characteristics
are strongly correlated with enrollment. One way to explore the relationship between enrollment and these
Table 1: Percentage of Children Enrolled by Gender, Village Literacy Level, and Wealth
Village Literacy Village Wealth Gender Low Medium High
Poor Male 56 75 83 Female 38 65 75
Middle Male 82 77 88 Female 62 66 80
Rich Male 73 82 84 Female 53 73 82
Note: Computed from LEAPS Census, 2003. Village wealth categories are quintiles based median monthly household expenditures. Village literacy categories are quintiles based on the percentage of literate adults (25 years or above) in the village. Percentages reported are the percent of children ages 5-15 currently enrolled in school in each village. Averages are across villages. The male enrollment rate is reported above the female enrollment rate in each category.
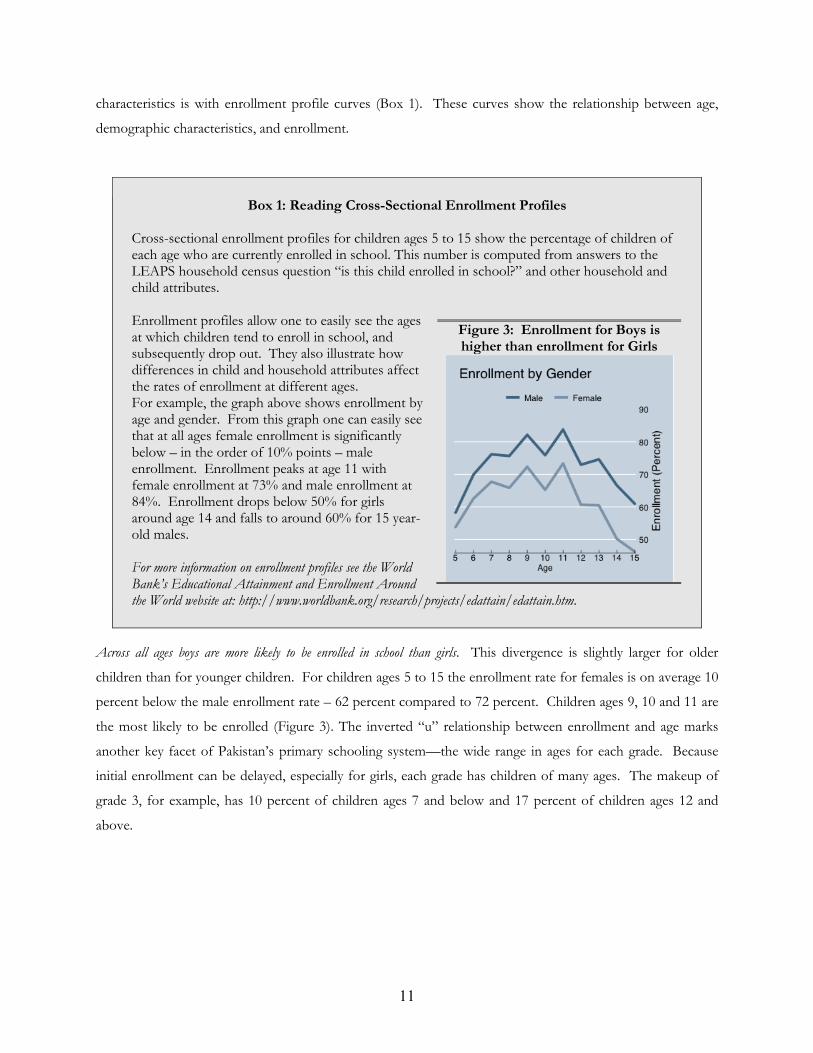
11
characteristics is with enrollment profile curves (Box 1). These curves show the relationship between age,
demographic characteristics, and enrollment.
Box 1: Reading Cross-Sectional Enrollment Profiles Cross-sectional enrollment profiles for children ages 5 to 15 show the percentage of children of each age who are currently enrolled in school. This number is computed from answers to the LEAPS household census question “is this child enrolled in school?” and other household and child attributes. Enrollment profiles allow one to easily see the ages at which children tend to enroll in school, and subsequently drop out. They also illustrate how differences in child and household attributes affect the rates of enrollment at different ages. For example, the graph above shows enrollment by age and gender. From this graph one can easily see that at all ages female enrollment is significantly below – in the order of 10% points – male enrollment. Enrollment peaks at age 11 with female enrollment at 73% and male enrollment at 84%. Enrollment drops below 50% for girls around age 14 and falls to around 60% for 15 year-old males. For more information on enrollment profiles see the World Bank’s Educational Attainment and Enrollment Around the World website at: http://www.worldbank.org/research/projects/edattain/edattain.htm.
Figure 3: Enrollment for Boys is higher than enrollment for Girls
Across all ages boys are more likely to be enrolled in school than girls. This divergence is slightly larger for older
children than for younger children. For children ages 5 to 15 the enrollment rate for females is on average 10
percent below the male enrollment rate – 62 percent compared to 72 percent. Children ages 9, 10 and 11 are
the most likely to be enrolled (Figure 3). The inverted “u” relationship between enrollment and age marks
another key facet of Pakistan’s primary schooling system—the wide range in ages for each grade. Because
initial enrollment can be delayed, especially for girls, each grade has children of many ages. The makeup of
grade 3, for example, has 10 percent of children ages 7 and below and 17 percent of children ages 12 and
above.
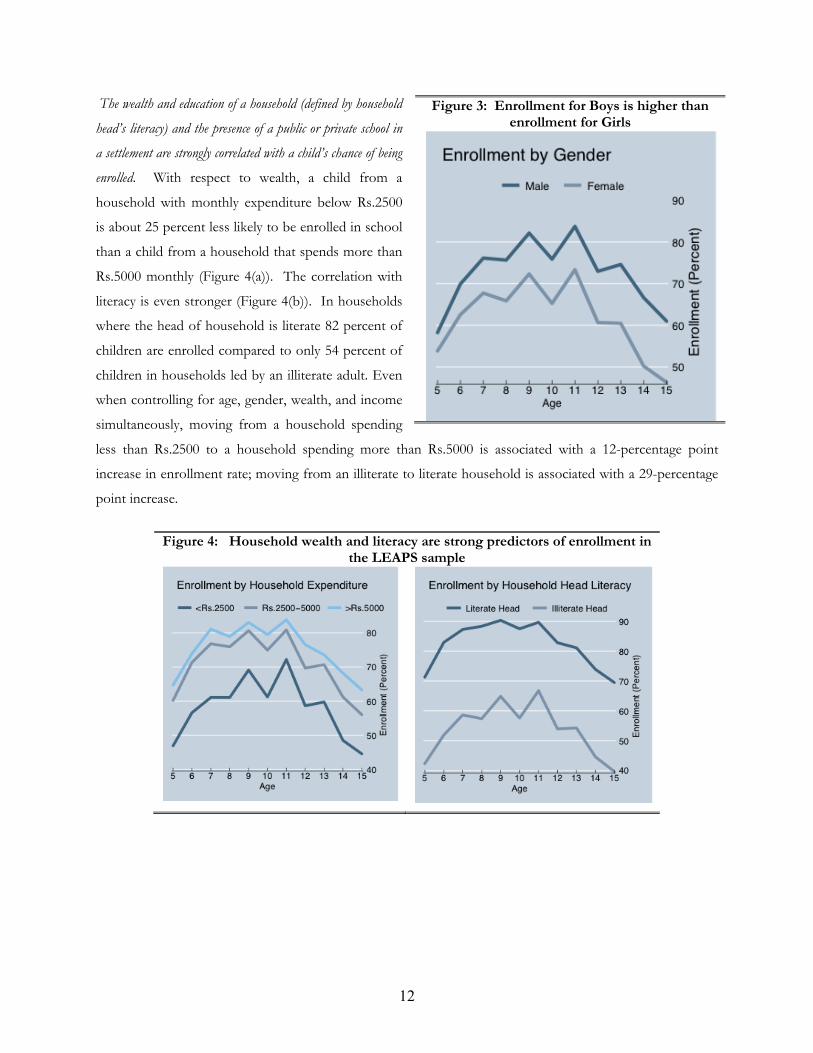
12
The wealth and education of a household (defined by household
head’s literacy) and the presence of a public or private school in
a settlement are strongly correlated with a child’s chance of being
enrolled. With respect to wealth, a child from a
household with monthly expenditure below Rs.2500
is about 25 percent less likely to be enrolled in school
than a child from a household that spends more than
Rs.5000 monthly (Figure 4(a)). The correlation with
literacy is even stronger (Figure 4(b)). In households
where the head of household is literate 82 percent of
children are enrolled compared to only 54 percent of
children in households led by an illiterate adult. Even
when controlling for age, gender, wealth, and income
simultaneously, moving from a household spending
less than Rs.2500 to a household spending more than Rs.5000 is associated with a 12-percentage point
increase in enrollment rate; moving from an illiterate to literate household is associated with a 29-percentage
point increase.
Figure 4: Household wealth and literacy are strong predictors of enrollment in the LEAPS sample
Figure 3: Enrollment for Boys is higher than enrollment for Girls
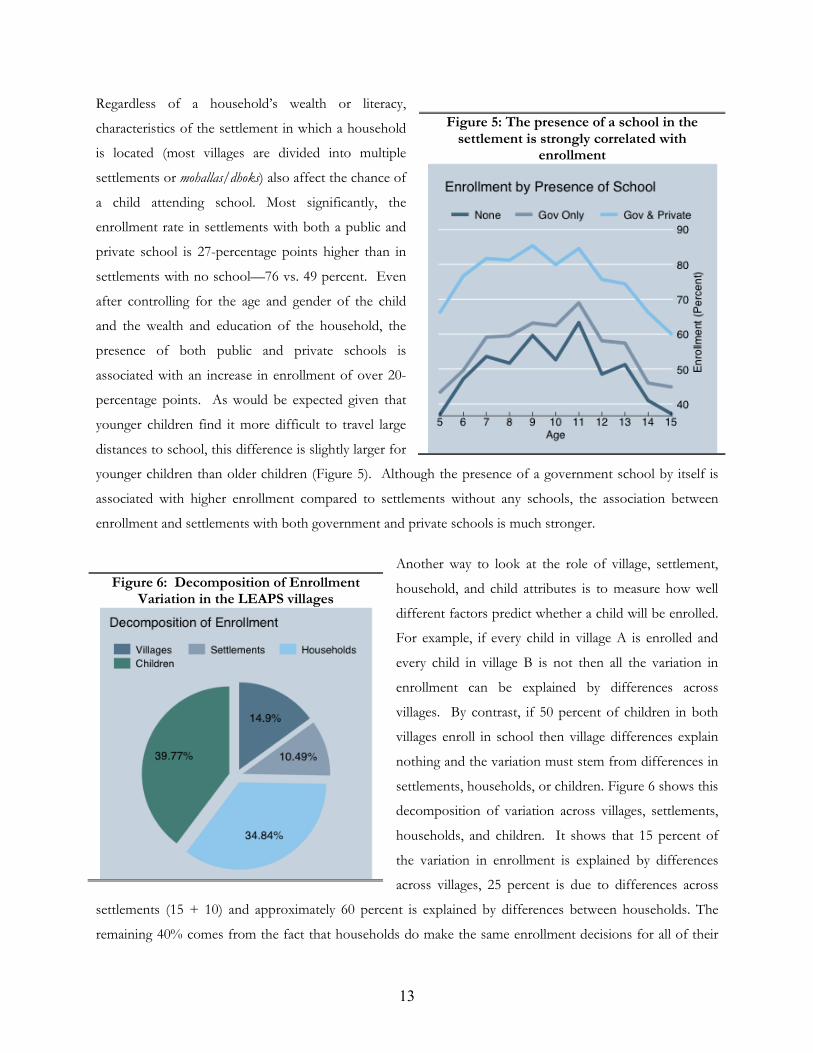
13
Regardless of a household’s wealth or literacy,
characteristics of the settlement in which a household
is located (most villages are divided into multiple
settlements or mohallas/dhoks) also affect the chance of
a child attending school. Most significantly, the
enrollment rate in settlements with both a public and
private school is 27-percentage points higher than in
settlements with no school—76 vs. 49 percent. Even
after controlling for the age and gender of the child
and the wealth and education of the household, the
presence of both public and private schools is
associated with an increase in enrollment of over 20-
percentage points. As would be expected given that
younger children find it more difficult to travel large
distances to school, this difference is slightly larger for
younger children than older children (Figure 5). Although the presence of a government school by itself is
associated with higher enrollment compared to settlements without any schools, the association between
enrollment and settlements with both government and private schools is much stronger.
Another way to look at the role of village, settlement,
household, and child attributes is to measure how well
different factors predict whether a child will be enrolled.
For example, if every child in village A is enrolled and
every child in village B is not then all the variation in
enrollment can be explained by differences across
villages. By contrast, if 50 percent of children in both
villages enroll in school then village differences explain
nothing and the variation must stem from differences in
settlements, households, or children. Figure 6 shows this
decomposition of variation across villages, settlements,
households, and children. It shows that 15 percent of
the variation in enrollment is explained by differences
across villages, 25 percent is due to differences across
settlements (15 + 10) and approximately 60 percent is explained by differences between households. The
remaining 40% comes from the fact that households do make the same enrollment decisions for all of their
Figure 5: The presence of a school in the settlement is strongly correlated with
enrollment
Figure 6: Decomposition of Enrollment Variation in the LEAPS villages
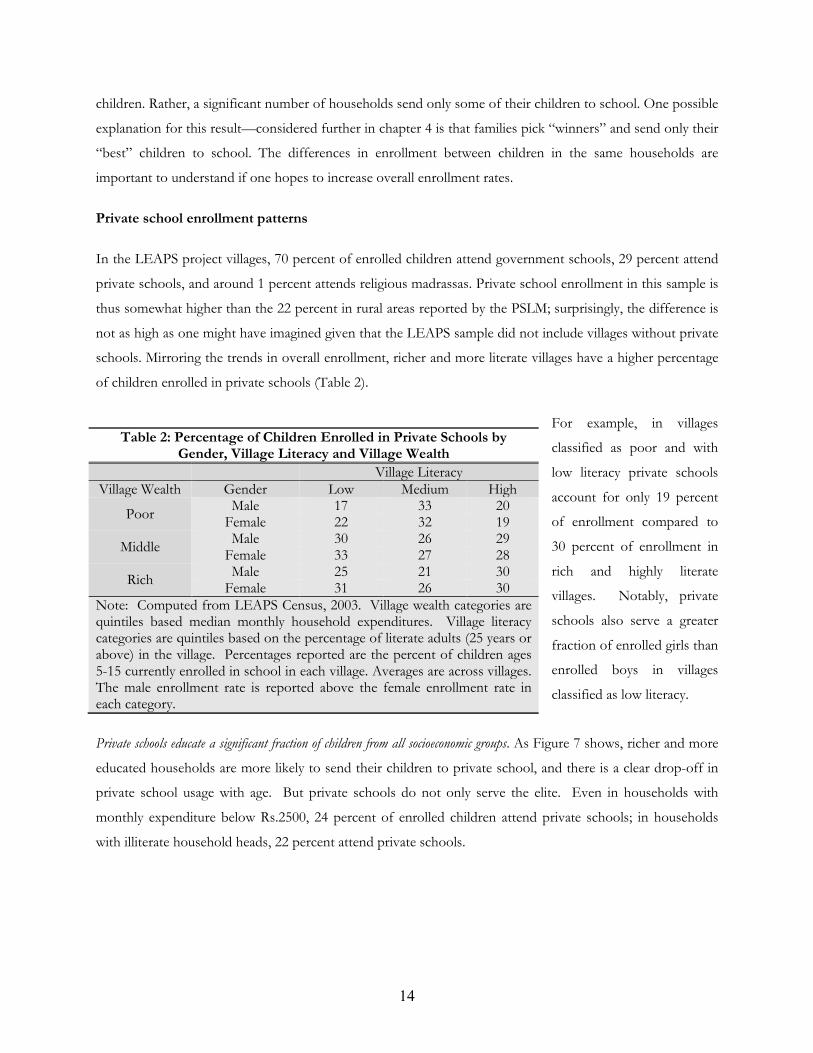
14
children. Rather, a significant number of households send only some of their children to school. One possible
explanation for this result—considered further in chapter 4 is that families pick “winners” and send only their
“best” children to school. The differences in enrollment between children in the same households are
important to understand if one hopes to increase overall enrollment rates.
Private school enrollment patterns
In the LEAPS project villages, 70 percent of enrolled children attend government schools, 29 percent attend
private schools, and around 1 percent attends religious madrassas. Private school enrollment in this sample is
thus somewhat higher than the 22 percent in rural areas reported by the PSLM; surprisingly, the difference is
not as high as one might have imagined given that the LEAPS sample did not include villages without private
schools. Mirroring the trends in overall enrollment, richer and more literate villages have a higher percentage
of children enrolled in private schools (Table 2).
For example, in villages
classified as poor and with
low literacy private schools
account for only 19 percent
of enrollment compared to
30 percent of enrollment in
rich and highly literate
villages. Notably, private
schools also serve a greater
fraction of enrolled girls than
enrolled boys in villages
classified as low literacy.
Private schools educate a significant fraction of children from all socioeconomic groups. As Figure 7 shows, richer and more
educated households are more likely to send their children to private school, and there is a clear drop-off in
private school usage with age. But private schools do not only serve the elite. Even in households with
monthly expenditure below Rs.2500, 24 percent of enrolled children attend private schools; in households
with illiterate household heads, 22 percent attend private schools.
Table 2: Percentage of Children Enrolled in Private Schools by Gender, Village Literacy and Village Wealth
Village Literacy Village Wealth Gender Low Medium High
Poor Male 17 33 20 Female 22 32 19
Middle Male 30 26 29 Female 33 27 28
Rich Male 25 21 30 Female 31 26 30
Note: Computed from LEAPS Census, 2003. Village wealth categories are quintiles based median monthly household expenditures. Village literacy categories are quintiles based on the percentage of literate adults (25 years or above) in the village. Percentages reported are the percent of children ages 5-15 currently enrolled in school in each village. Averages are across villages. The male enrollment rate is reported above the female enrollment rate in each category.
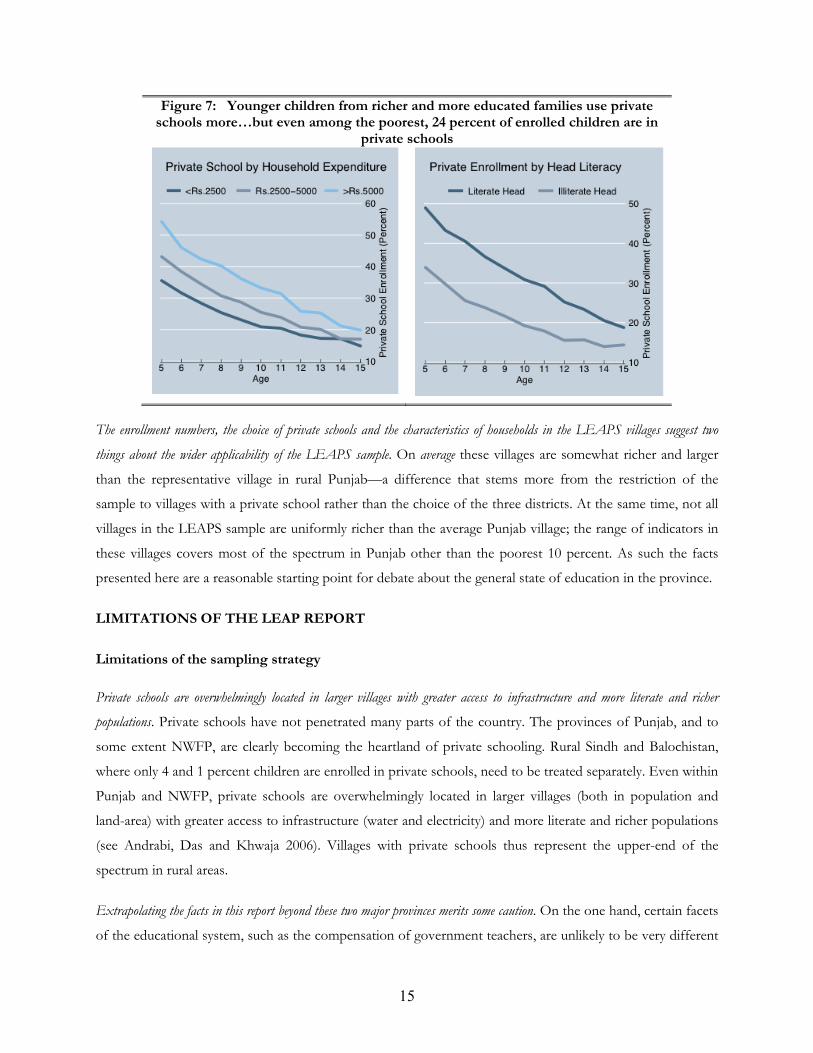
15
Figure 7: Younger children from richer and more educated families use private schools more…but even among the poorest, 24 percent of enrolled children are in
private schools
The enrollment numbers, the choice of private schools and the characteristics of households in the LEAPS villages suggest two
things about the wider applicability of the LEAPS sample. On average these villages are somewhat richer and larger
than the representative village in rural Punjab—a difference that stems more from the restriction of the
sample to villages with a private school rather than the choice of the three districts. At the same time, not all
villages in the LEAPS sample are uniformly richer than the average Punjab village; the range of indicators in
these villages covers most of the spectrum in Punjab other than the poorest 10 percent. As such the facts
presented here are a reasonable starting point for debate about the general state of education in the province.
LIMITATIONS OF THE LEAP REPORT
Limitations of the sampling strategy
Private schools are overwhelmingly located in larger villages with greater access to infrastructure and more literate and richer
populations. Private schools have not penetrated many parts of the country. The provinces of Punjab, and to
some extent NWFP, are clearly becoming the heartland of private schooling. Rural Sindh and Balochistan,
where only 4 and 1 percent children are enrolled in private schools, need to be treated separately. Even within
Punjab and NWFP, private schools are overwhelmingly located in larger villages (both in population and
land-area) with greater access to infrastructure (water and electricity) and more literate and richer populations
(see Andrabi, Das and Khwaja 2006). Villages with private schools thus represent the upper-end of the
spectrum in rural areas.
Extrapolating the facts in this report beyond these two major provinces merits some caution. On the one hand, certain facets
of the educational system, such as the compensation of government teachers, are unlikely to be very different
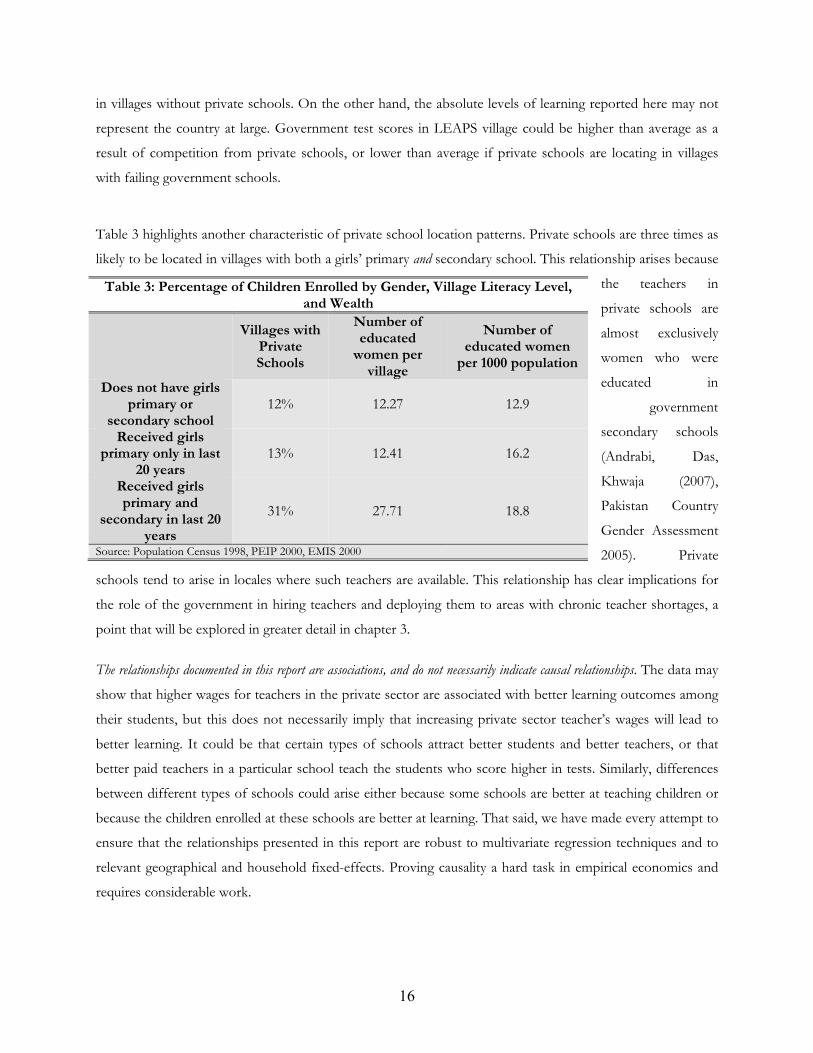
16
in villages without private schools. On the other hand, the absolute levels of learning reported here may not
represent the country at large. Government test scores in LEAPS village could be higher than average as a
result of competition from private schools, or lower than average if private schools are locating in villages
with failing government schools.
Table 3 highlights another characteristic of private school location patterns. Private schools are three times as
likely to be located in villages with both a girls’ primary and secondary school. This relationship arises because
the teachers in
private schools are
almost exclusively
women who were
educated in
government
secondary schools
(Andrabi, Das,
Khwaja (2007),
Pakistan Country
Gender Assessment
2005). Private
schools tend to arise in locales where such teachers are available. This relationship has clear implications for
the role of the government in hiring teachers and deploying them to areas with chronic teacher shortages, a
point that will be explored in greater detail in chapter 3.
The relationships documented in this report are associations, and do not necessarily indicate causal relationships. The data may
show that higher wages for teachers in the private sector are associated with better learning outcomes among
their students, but this does not necessarily imply that increasing private sector teacher’s wages will lead to
better learning. It could be that certain types of schools attract better students and better teachers, or that
better paid teachers in a particular school teach the students who score higher in tests. Similarly, differences
between different types of schools could arise either because some schools are better at teaching children or
because the children enrolled at these schools are better at learning. That said, we have made every attempt to
ensure that the relationships presented in this report are robust to multivariate regression techniques and to
relevant geographical and household fixed-effects. Proving causality a hard task in empirical economics and
requires considerable work.
Table 3: Percentage of Children Enrolled by Gender, Village Literacy Level, and Wealth
Villages with
Private Schools
Number of educated women per village
Number of educated women
per 1000 population
Does not have girls primary or
secondary school 12% 12.27 12.9
Received girls primary only in last
20 years 13% 12.41 16.2
Received girls primary and
secondary in last 20 years
31% 27.71 18.8
Source: Population Census 1998, PEIP 2000, EMIS 2000
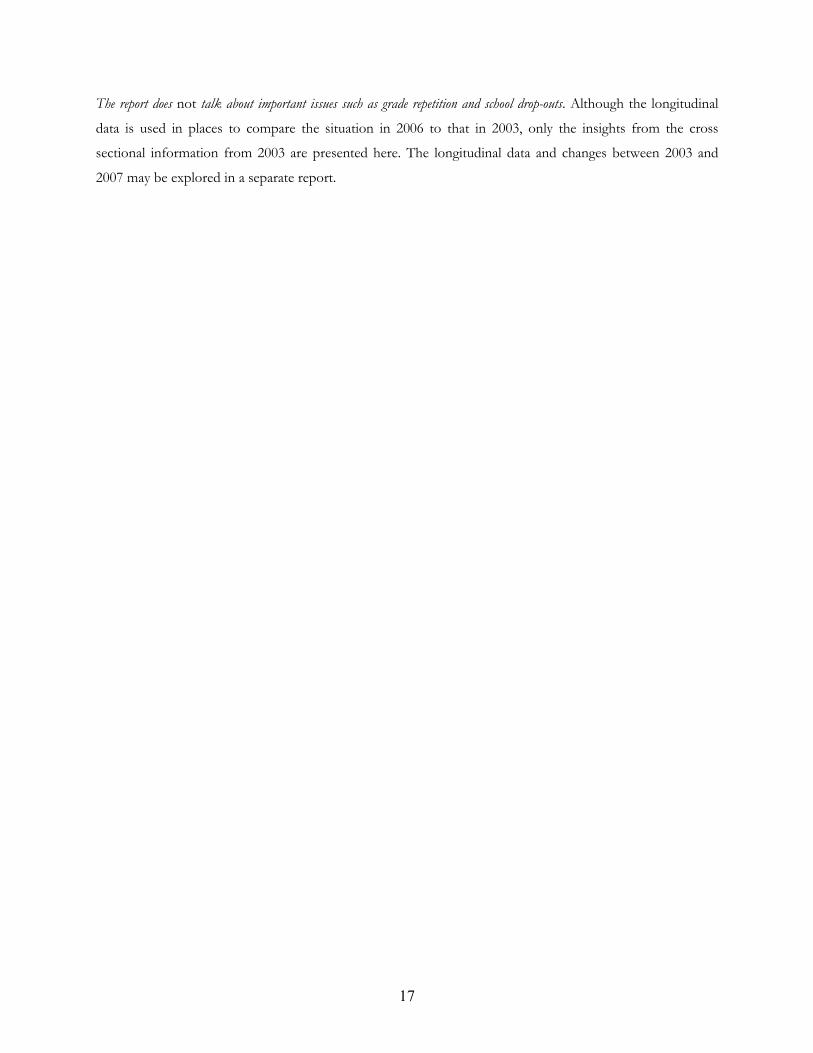
17
The report does not talk about important issues such as grade repetition and school drop-outs. Although the longitudinal
data is used in places to compare the situation in 2006 to that in 2003, only the insights from the cross
sectional information from 2003 are presented here. The longitudinal data and changes between 2003 and
2007 may be explored in a separate report.
18
Chapter 1: Are students learning?
1.1 This chapter of the LEAPS report examines how much primary school students are learning in rural Punjab
Province and how much factors like school facilities, parental education, and wealth matter. The sampling for the LEAPS
report was done in two stages. In the first stage, three districts were chosen from the province of Punjab. The
choice of districts follows the accepted division of the province into the “better” performing North and
Central parts (Attock and Faisalabad) and a “poorer” performing South (Rahim Yar Khan). Within these
districts, 112 villages were chosen randomly from a list of all villages with a private school in 2003. The total
sample yields over 800 public and private schools. The LEAPS survey tested all 12,000 children in Class 3
enrolled in these schools on three subjects—English, Mathematics and Urdu. We describe the outcomes
from these tests in two sections.
1.2 Levels of learning. Section 1 gives a sense of what children are learning in schools. It focuses both on
“average learning” and the specific knowledge that children acquire in school. Can children add 5+14 and make
a sentence with the word “ball”? Basic test data on counting and addition in Mathematics and alphabets in
English and Urdu provide information on where children are compared to one another and where they stand
relative to the curriculum.
1.3 Learning levels and attributes. Section 2 presents associations between children’s learning levels and
their attributes. It identifies learning “gaps” across geographical locations, schools (public/private),
households (parental wealth and education) and children (age and gender), and looks at associations between
learning and school characteristics, such as infrastructure and the student-teacher ratio.
1.4 Summary of the findings. First, learning levels are poor. Most children fail to meet the curricular goals
set by Pakistan’s Ministry of Education. Second, most variation in learning is across schools in the same
village. That is, there are good and bad schools in all villages rather than good schools in certain types of
villages and bad in others. Third, private schools significantly outperform government schools, and this
difference dwarves all other associations. The worst government schools, where children learn virtually
nothing, drive most of this gap. Fourth, there is no single characteristic of private schools that accounts for the
vast difference with government schools—improving quality in government schools will require more than
improving infrastructure or reducing the student-teacher ratio. These facts inform the structure and questions
raised through the remainder of this report.
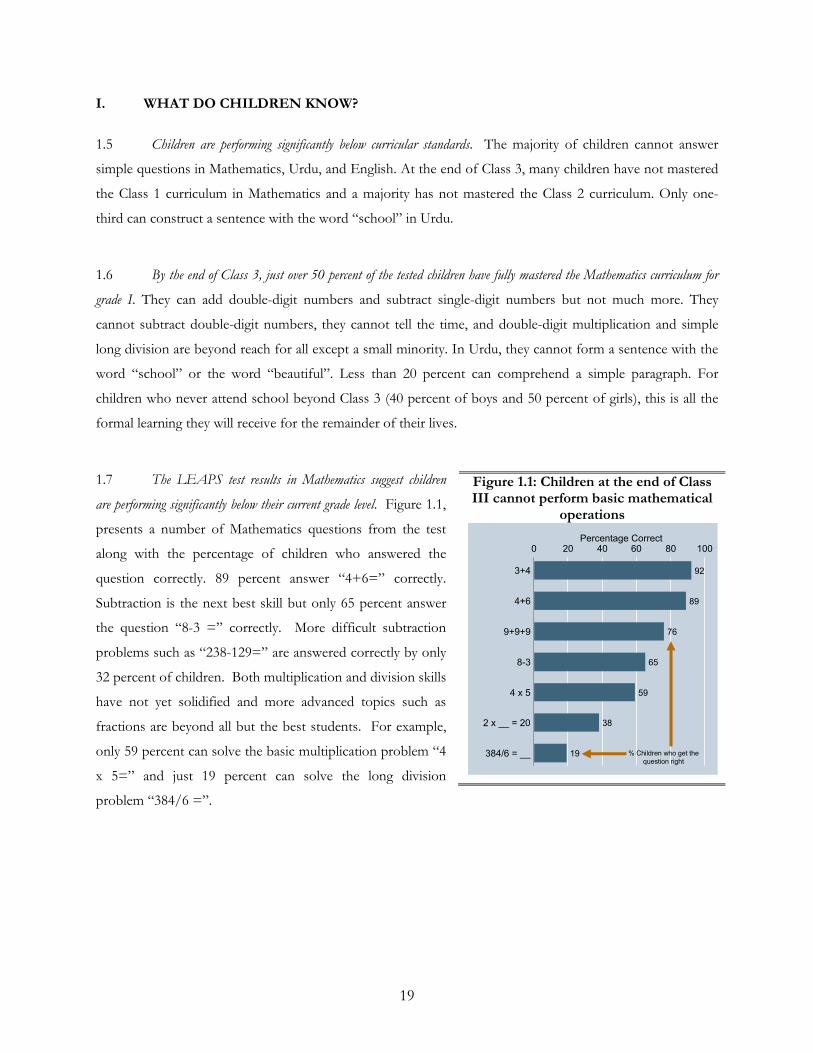
19
I. WHAT DO CHILDREN KNOW?
1.5 Children are performing significantly below curricular standards. The majority of children cannot answer
simple questions in Mathematics, Urdu, and English. At the end of Class 3, many children have not mastered
the Class 1 curriculum in Mathematics and a majority has not mastered the Class 2 curriculum. Only one-
third can construct a sentence with the word “school” in Urdu.
1.6 By the end of Class 3, just over 50 percent of the tested children have fully mastered the Mathematics curriculum for
grade I. They can add double-digit numbers and subtract single-digit numbers but not much more. They
cannot subtract double-digit numbers, they cannot tell the time, and double-digit multiplication and simple
long division are beyond reach for all except a small minority. In Urdu, they cannot form a sentence with the
word “school” or the word “beautiful”. Less than 20 percent can comprehend a simple paragraph. For
children who never attend school beyond Class 3 (40 percent of boys and 50 percent of girls), this is all the
formal learning they will receive for the remainder of their lives.
1.7 The LEAPS test results in Mathematics suggest children
are performing significantly below their current grade level. Figure 1.1,
presents a number of Mathematics questions from the test
along with the percentage of children who answered the
question correctly. 89 percent answer “4+6=” correctly.
Subtraction is the next best skill but only 65 percent answer
the question “8-3 =” correctly. More difficult subtraction
problems such as “238-129=” are answered correctly by only
32 percent of children. Both multiplication and division skills
have not yet solidified and more advanced topics such as
fractions are beyond all but the best students. For example,
only 59 percent can solve the basic multiplication problem “4
x 5=” and just 19 percent can solve the long division
problem “384/6 =”.
Figure 1.1: Children at the end of Class III cannot perform basic mathematical
operations
19
38
59
65
76
89
92
0 20 40 60 80 100Percentage Correct
384/6 = __
2 x __ = 20
4 x 5
8-3
9+9+9
4+6
3+4
% Children who get the
question right19
38
59
65
76
89
92
0 20 40 60 80 100Percentage Correct
384/6 = __
2 x __ = 20
4 x 5
8-3
9+9+9
4+6
3+4
% Children who get the
question right
20
Box 1.1: LEAPS Survey Tests
Several characteristics of the LEAPS test design and administration are unique and important in the Pakistani context.
• LEAPS is the largest survey of learning outcomes in both public and private schools in rural Punjab. Children were tested in every school in the 112 villages surveyed, yielding information on over 12,000 children in 800 public and private schools in the districts of Attock, Faisalabad, and Rahim Yar Khan.
• The tests were developed with the help of experts familiar with the curriculum as well as international testing protocols. The tests were extensively piloted and revised to ensure that it would capture information not only where children were with respect to the curriculum, but also where they were on the “ladder of learning.” To accurately capture what children knew, all tests started simply but ended with questions beyond the Class III material. What do we mean by very simple? In English, investigator made three alphabets sounds aloud (with a pause in between each) and asked the children to write each one down. Mathematics tests started with counting. In Urdu, the tests started with the written alphabet. These simple test questions minimized interactions between the test-takers and the students, which have been shown to affect results in other testing exercises.
• The testing was administered by the LEAPS team with no inputs allowed from the teachers of the tested children. Children were selected by constructing school-by-school rosters for the tested class. More than 90 percent of all children in the rosters were eventually tested, suggesting that the Class III population was effectively covered through the testing procedure.
• The test scores were then analyzed using the latest tools and methods from the educational testing literature to ensure strict comparability across schools and children. Both multiple choice and free response questions were included.
Students answered approximately 30 percent of the questions correctly in each subject—indicating that the majority of exam questions were significantly above the ability of most students. That said, a few children received almost perfect scores even though questions toward the end of the test were significantly beyond the grade-level in which they were tested. Details on the test instrument are presented in the Technical Annex to this document.
Comparing LEAPS results with Curriculum Standards
1.8 The gravity of the problem in Mathematics becomes obvious when comparing how students are expected to perform
under the new curriculum standards developed by the Ministry of Education (http://www.moe.gov.pk-->curriculum) with
how they performed in the LEAPS test.
Curriculum standard 1: In grades I-II children should be able to “count, read and write numbers up to
999.”
Figure 1.2: Counting and Subtraction Questions
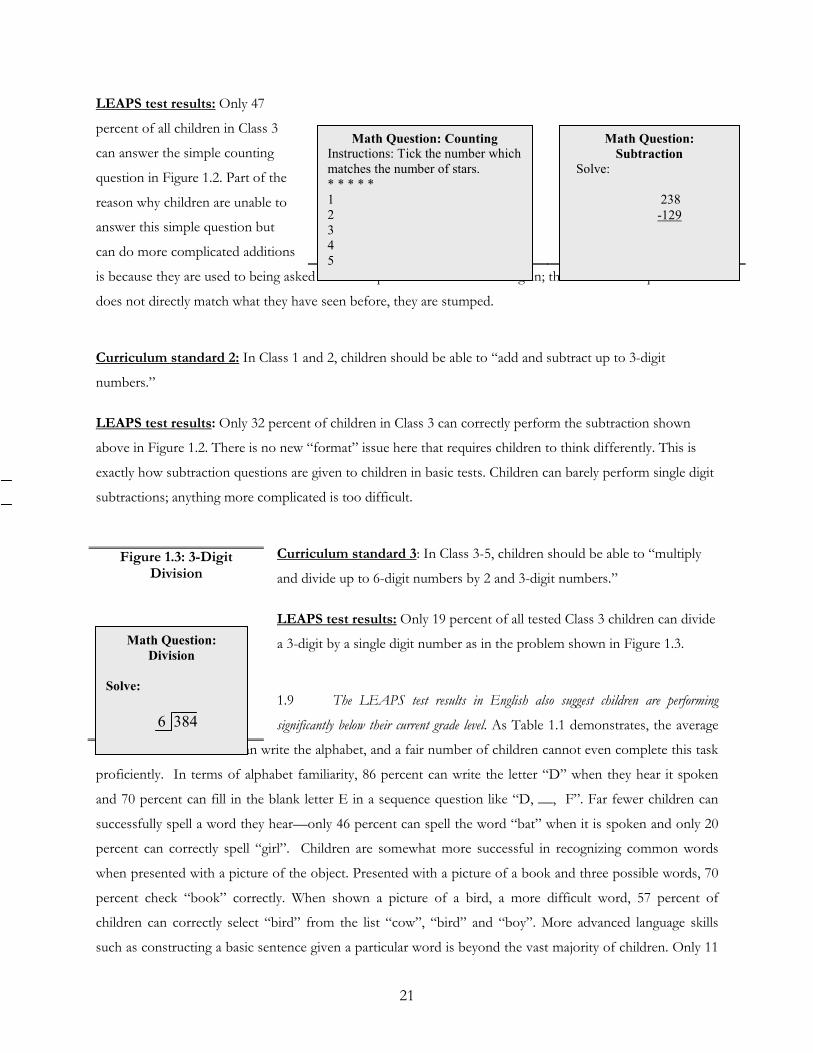
21
LEAPS test results: Only 47
percent of all children in Class 3
can answer the simple counting
question in Figure 1.2. Part of the
reason why children are unable to
answer this simple question but
can do more complicated additions
is because they are used to being asked the same questions over and over again; the moment the question
does not directly match what they have seen before, they are stumped.
Curriculum standard 2: In Class 1 and 2, children should be able to “add and subtract up to 3-digit
numbers.”
LEAPS test results: Only 32 percent of children in Class 3 can correctly perform the subtraction shown
above in Figure 1.2. There is no new “format” issue here that requires children to think differently. This is
exactly how subtraction questions are given to children in basic tests. Children can barely perform single digit
subtractions; anything more complicated is too difficult.
Curriculum standard 3: In Class 3-5, children should be able to “multiply
and divide up to 6-digit numbers by 2 and 3-digit numbers.”
LEAPS test results: Only 19 percent of all tested Class 3 children can divide
a 3-digit by a single digit number as in the problem shown in Figure 1.3.
1.9 The LEAPS test results in English also suggest children are performing
significantly below their current grade level. As Table 1.1 demonstrates, the average
child can do little more than write the alphabet, and a fair number of children cannot even complete this task
proficiently. In terms of alphabet familiarity, 86 percent can write the letter “D” when they hear it spoken
and 70 percent can fill in the blank letter E in a sequence question like “D, __, F”. Far fewer children can
successfully spell a word they hear—only 46 percent can spell the word “bat” when it is spoken and only 20
percent can correctly spell “girl”. Children are somewhat more successful in recognizing common words
when presented with a picture of the object. Presented with a picture of a book and three possible words, 70
percent check “book” correctly. When shown a picture of a bird, a more difficult word, 57 percent of
children can correctly select “bird” from the list “cow”, “bird” and “boy”. More advanced language skills
such as constructing a basic sentence given a particular word is beyond the vast majority of children. Only 11
Figure 1.3: 3-Digit Division
Math Question:
Division
Solve:
6 384
Math Question: Counting
Instructions: Tick the number which
matches the number of stars.
* * * * *
1
2
3
4
5
Math Question:
Subtraction Solve:
238
-129
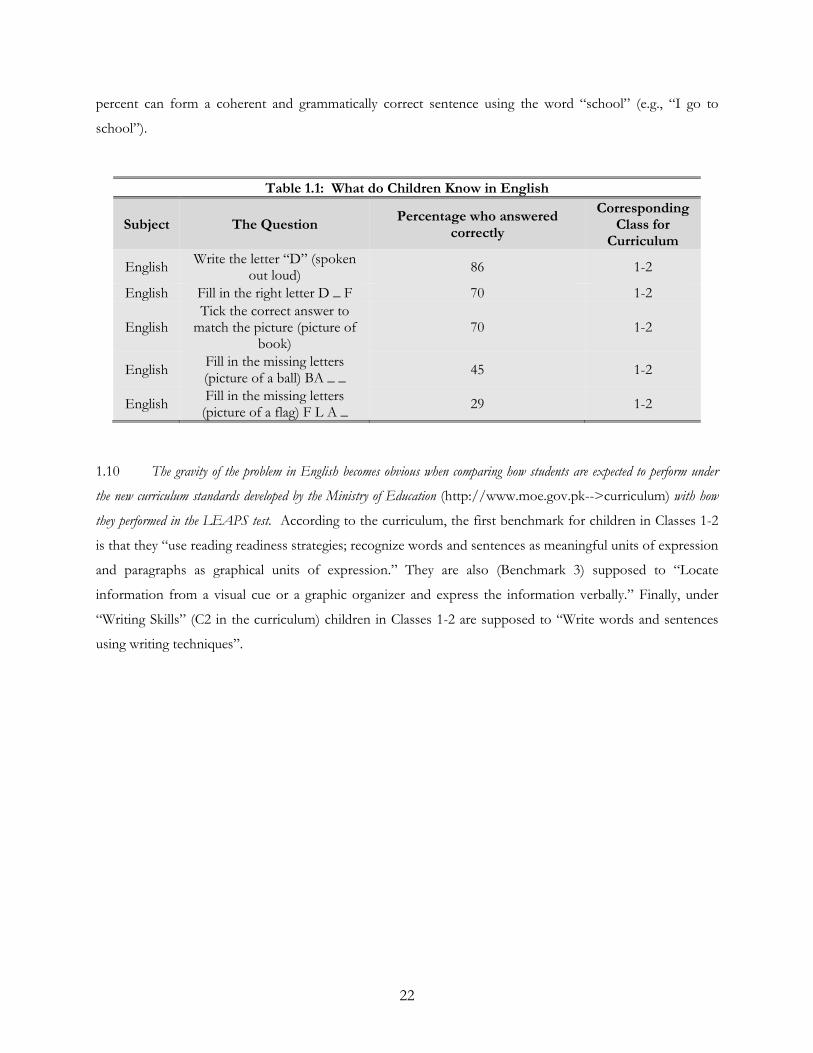
22
percent can form a coherent and grammatically correct sentence using the word “school” (e.g., “I go to
school”).
Table 1.1: What do Children Know in English
Subject The Question Percentage who answered
correctly
Corresponding Class for
Curriculum
English Write the letter “D” (spoken
out loud) 86 1-2
English Fill in the right letter D _ F 70 1-2
English Tick the correct answer to match the picture (picture of
book) 70 1-2
English Fill in the missing letters (picture of a ball) BA _ _
45 1-2
English Fill in the missing letters (picture of a flag) F L A _
29 1-2
1.10 The gravity of the problem in English becomes obvious when comparing how students are expected to perform under
the new curriculum standards developed by the Ministry of Education (http://www.moe.gov.pk-->curriculum) with how
they performed in the LEAPS test. According to the curriculum, the first benchmark for children in Classes 1-2
is that they “use reading readiness strategies; recognize words and sentences as meaningful units of expression
and paragraphs as graphical units of expression.” They are also (Benchmark 3) supposed to “Locate
information from a visual cue or a graphic organizer and express the information verbally.” Finally, under
“Writing Skills” (C2 in the curriculum) children in Classes 1-2 are supposed to “Write words and sentences
using writing techniques”.
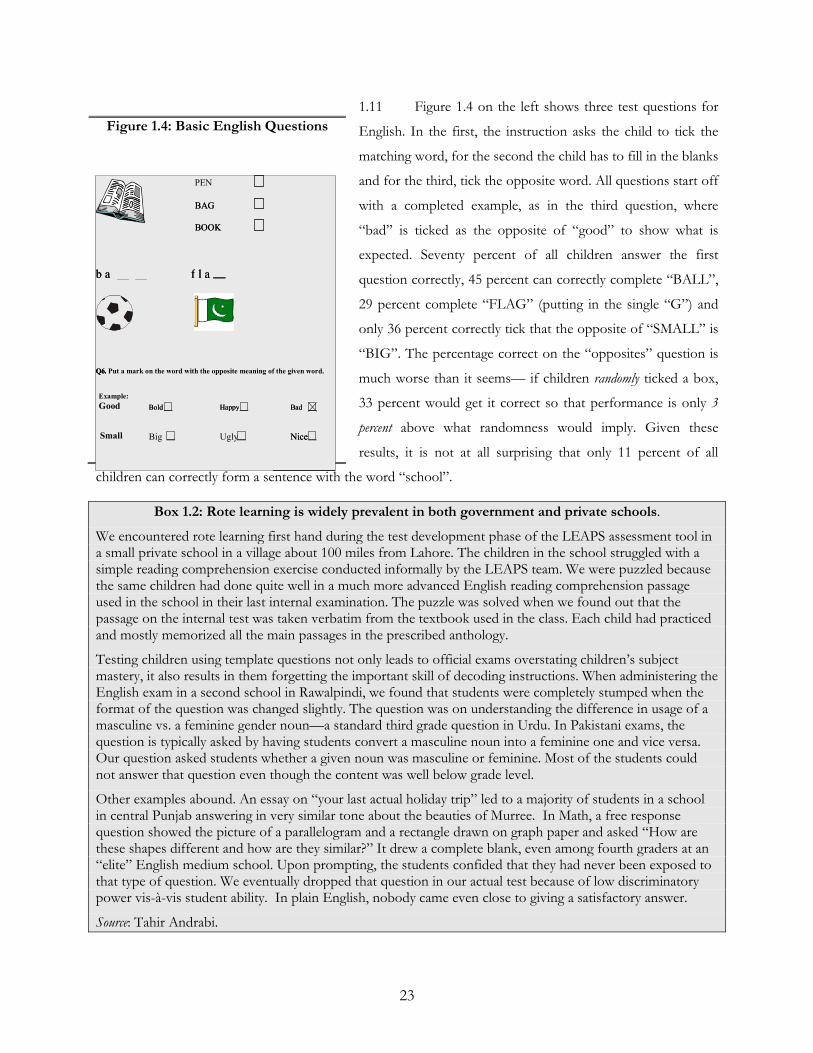
23
1.11 Figure 1.4 on the left shows three test questions for
English. In the first, the instruction asks the child to tick the
matching word, for the second the child has to fill in the blanks
and for the third, tick the opposite word. All questions start off
with a completed example, as in the third question, where
“bad” is ticked as the opposite of “good” to show what is
expected. Seventy percent of all children answer the first
question correctly, 45 percent can correctly complete “BALL”,
29 percent complete “FLAG” (putting in the single “G”) and
only 36 percent correctly tick that the opposite of “SMALL” is
“BIG”. The percentage correct on the “opposites” question is
much worse than it seems— if children randomly ticked a box,
33 percent would get it correct so that performance is only 3
percent above what randomness would imply. Given these
results, it is not at all surprising that only 11 percent of all
children can correctly form a sentence with the word “school”.
Box 1.2: Rote learning is widely prevalent in both government and private schools.
We encountered rote learning first hand during the test development phase of the LEAPS assessment tool in a small private school in a village about 100 miles from Lahore. The children in the school struggled with a simple reading comprehension exercise conducted informally by the LEAPS team. We were puzzled because the same children had done quite well in a much more advanced English reading comprehension passage used in the school in their last internal examination. The puzzle was solved when we found out that the passage on the internal test was taken verbatim from the textbook used in the class. Each child had practiced and mostly memorized all the main passages in the prescribed anthology.
Testing children using template questions not only leads to official exams overstating children’s subject mastery, it also results in them forgetting the important skill of decoding instructions. When administering the English exam in a second school in Rawalpindi, we found that students were completely stumped when the format of the question was changed slightly. The question was on understanding the difference in usage of a masculine vs. a feminine gender noun—a standard third grade question in Urdu. In Pakistani exams, the question is typically asked by having students convert a masculine noun into a feminine one and vice versa. Our question asked students whether a given noun was masculine or feminine. Most of the students could not answer that question even though the content was well below grade level.
Other examples abound. An essay on “your last actual holiday trip” led to a majority of students in a school in central Punjab answering in very similar tone about the beauties of Murree. In Math, a free response question showed the picture of a parallelogram and a rectangle drawn on graph paper and asked “How are these shapes different and how are they similar?” It drew a complete blank, even among fourth graders at an “elite” English medium school. Upon prompting, the students confided that they had never been exposed to that type of question. We eventually dropped that question in our actual test because of low discriminatory power vis-à-vis student ability. In plain English, nobody came even close to giving a satisfactory answer.
Source: Tahir Andrabi.
Figure 1.4: Basic English Questions
BAG
BOOK
BAG
BOOK
b a __ __ f l ab a __ __ f l a
Q6. Put a mark on the word with the opposite meaning of the given word.
Bold Happy Bad
Big Ugly Nice
Q6.
Example:
Good Bold Happy Bad
Small Nice
PEN
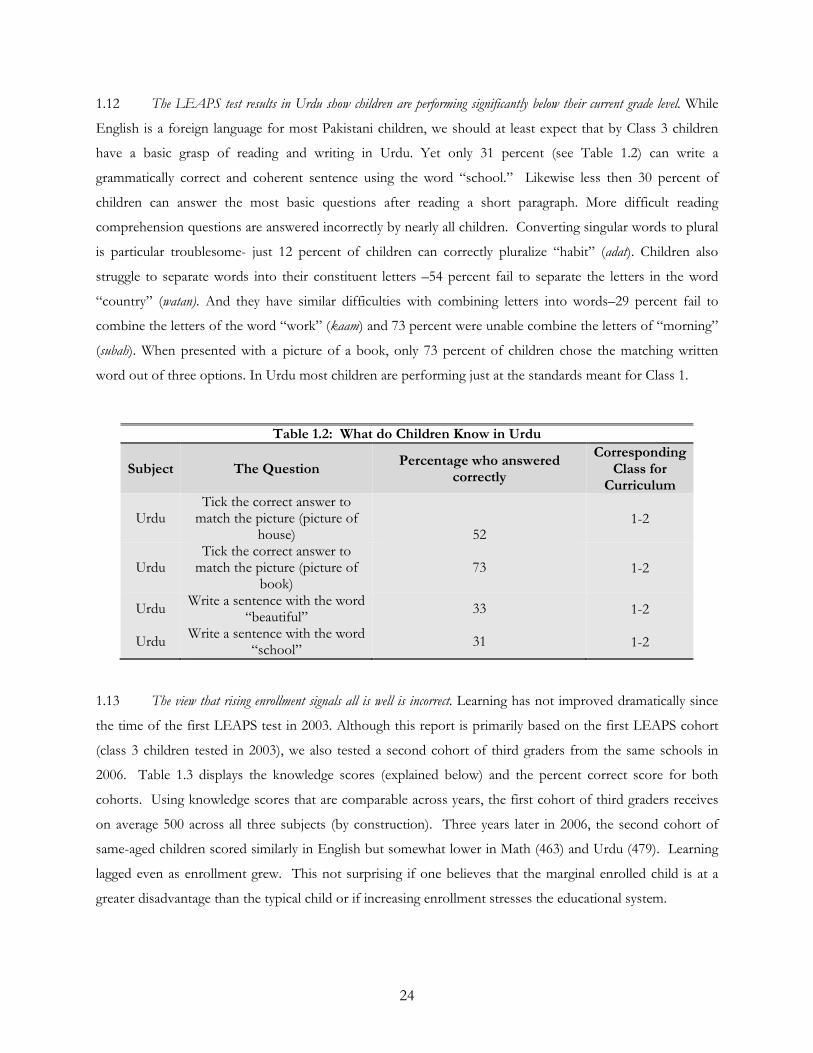
24
1.12 The LEAPS test results in Urdu show children are performing significantly below their current grade level. While
English is a foreign language for most Pakistani children, we should at least expect that by Class 3 children
have a basic grasp of reading and writing in Urdu. Yet only 31 percent (see Table 1.2) can write a
grammatically correct and coherent sentence using the word “school.” Likewise less then 30 percent of
children can answer the most basic questions after reading a short paragraph. More difficult reading
comprehension questions are answered incorrectly by nearly all children. Converting singular words to plural
is particular troublesome- just 12 percent of children can correctly pluralize “habit” (adat). Children also
struggle to separate words into their constituent letters –54 percent fail to separate the letters in the word
“country” (watan). And they have similar difficulties with combining letters into words–29 percent fail to
combine the letters of the word “work” (kaam) and 73 percent were unable combine the letters of “morning”
(subah). When presented with a picture of a book, only 73 percent of children chose the matching written
word out of three options. In Urdu most children are performing just at the standards meant for Class 1.
Table 1.2: What do Children Know in Urdu
Subject The Question Percentage who answered
correctly
Corresponding Class for
Curriculum
Urdu Tick the correct answer to match the picture (picture of
house) 52 1-2
Urdu Tick the correct answer to match the picture (picture of
book) 73 1-2
Urdu Write a sentence with the word
“beautiful” 33 1-2
Urdu Write a sentence with the word
“school” 31 1-2
1.13 The view that rising enrollment signals all is well is incorrect. Learning has not improved dramatically since
the time of the first LEAPS test in 2003. Although this report is primarily based on the first LEAPS cohort
(class 3 children tested in 2003), we also tested a second cohort of third graders from the same schools in
2006. Table 1.3 displays the knowledge scores (explained below) and the percent correct score for both
cohorts. Using knowledge scores that are comparable across years, the first cohort of third graders receives
on average 500 across all three subjects (by construction). Three years later in 2006, the second cohort of
same-aged children scored similarly in English but somewhat lower in Math (463) and Urdu (479). Learning
lagged even as enrollment grew. This not surprising if one believes that the marginal enrolled child is at a
greater disadvantage than the typical child or if increasing enrollment stresses the educational system.
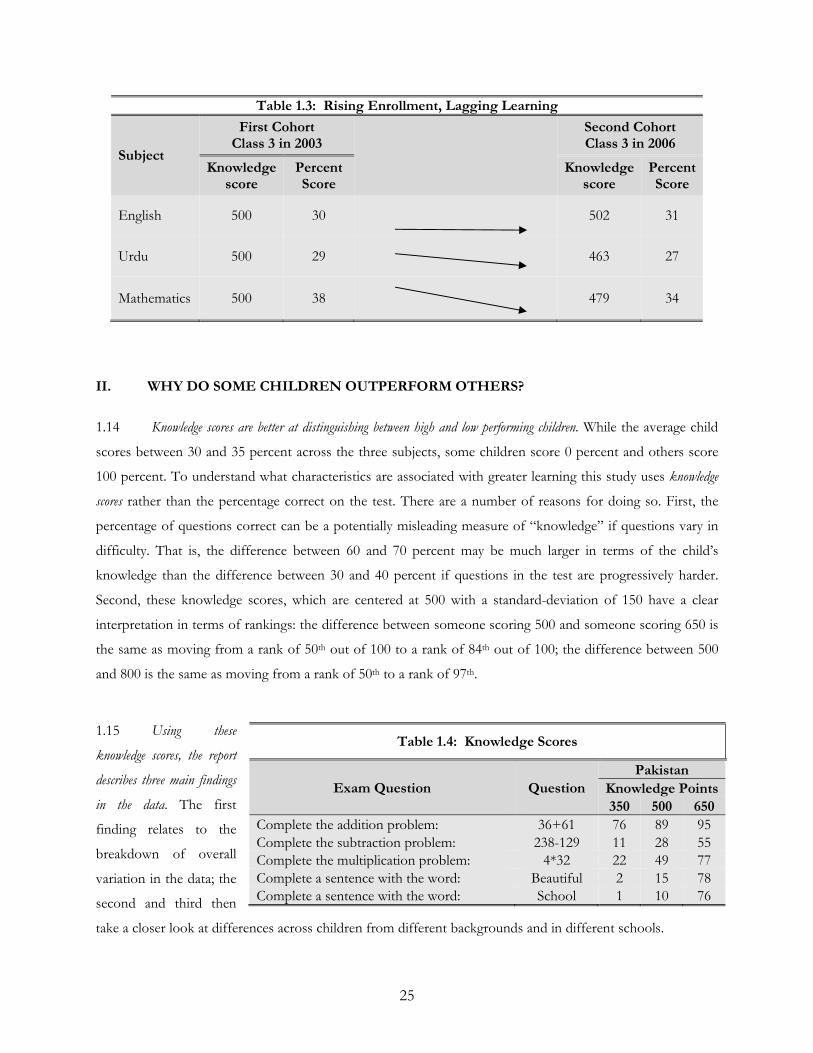
25
Table 1.3: Rising Enrollment, Lagging Learning
Subject
First Cohort Class 3 in 2003
Second Cohort Class 3 in 2006
Knowledge score
Percent Score
Knowledge score
Percent Score
English 500 30 502 31
Urdu 500 29
463 27
Mathematics 500 38
479 34
II. WHY DO SOME CHILDREN OUTPERFORM OTHERS?
1.14 Knowledge scores are better at distinguishing between high and low performing children. While the average child
scores between 30 and 35 percent across the three subjects, some children score 0 percent and others score
100 percent. To understand what characteristics are associated with greater learning this study uses knowledge
scores rather than the percentage correct on the test. There are a number of reasons for doing so. First, the
percentage of questions correct can be a potentially misleading measure of “knowledge” if questions vary in
difficulty. That is, the difference between 60 and 70 percent may be much larger in terms of the child’s
knowledge than the difference between 30 and 40 percent if questions in the test are progressively harder.
Second, these knowledge scores, which are centered at 500 with a standard-deviation of 150 have a clear
interpretation in terms of rankings: the difference between someone scoring 500 and someone scoring 650 is
the same as moving from a rank of 50th out of 100 to a rank of 84th out of 100; the difference between 500
and 800 is the same as moving from a rank of 50th to a rank of 97th.
1.15 Using these
knowledge scores, the report
describes three main findings
in the data. The first
finding relates to the
breakdown of overall
variation in the data; the
second and third then
take a closer look at differences across children from different backgrounds and in different schools.
Table 1.4: Knowledge Scores
Exam Question Question
Pakistan
Knowledge Points
350 500 650
Complete the addition problem: 36+61 76 89 95
Complete the subtraction problem: 238-129 11 28 55
Complete the multiplication problem: 4*32 22 49 77
Complete a sentence with the word: Beautiful 2 15 78
Complete a sentence with the word: School 1 10 76
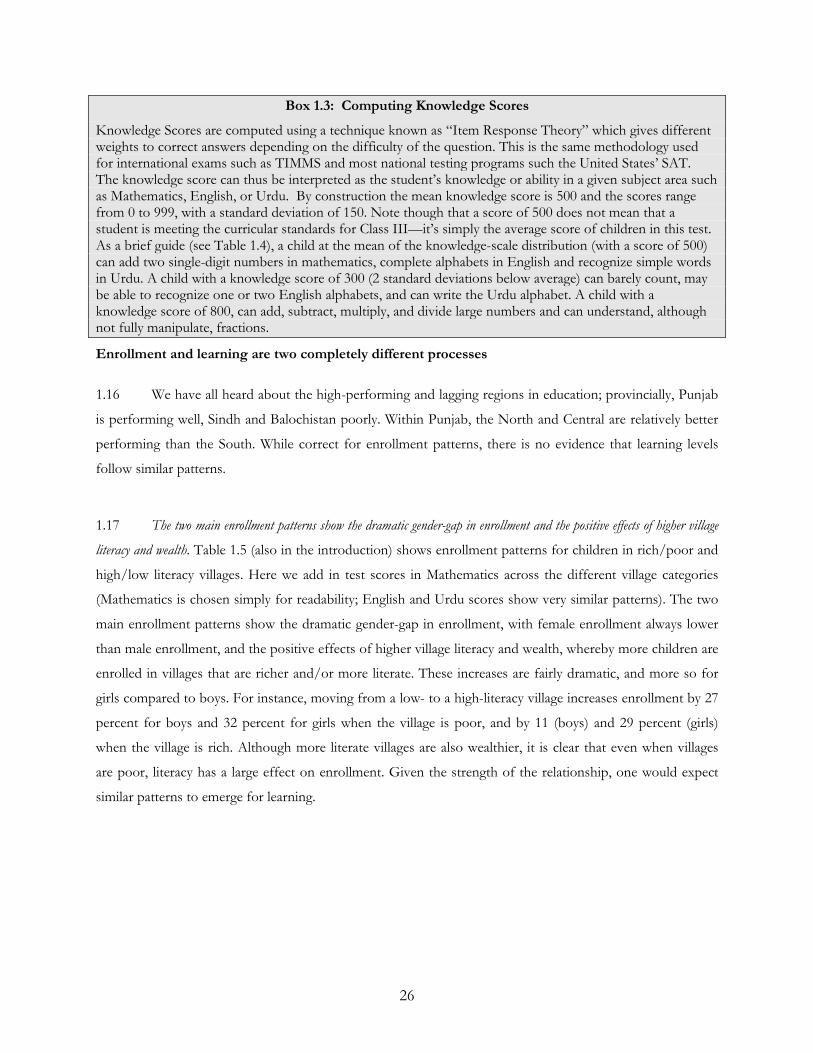
26
Box 1.3: Computing Knowledge Scores
Knowledge Scores are computed using a technique known as “Item Response Theory” which gives different weights to correct answers depending on the difficulty of the question. This is the same methodology used for international exams such as TIMMS and most national testing programs such the United States’ SAT. The knowledge score can thus be interpreted as the student’s knowledge or ability in a given subject area such as Mathematics, English, or Urdu. By construction the mean knowledge score is 500 and the scores range from 0 to 999, with a standard deviation of 150. Note though that a score of 500 does not mean that a student is meeting the curricular standards for Class III—it’s simply the average score of children in this test. As a brief guide (see Table 1.4), a child at the mean of the knowledge-scale distribution (with a score of 500) can add two single-digit numbers in mathematics, complete alphabets in English and recognize simple words in Urdu. A child with a knowledge score of 300 (2 standard deviations below average) can barely count, may be able to recognize one or two English alphabets, and can write the Urdu alphabet. A child with a knowledge score of 800, can add, subtract, multiply, and divide large numbers and can understand, although not fully manipulate, fractions.
Enrollment and learning are two completely different processes
1.16 We have all heard about the high-performing and lagging regions in education; provincially, Punjab
is performing well, Sindh and Balochistan poorly. Within Punjab, the North and Central are relatively better
performing than the South. While correct for enrollment patterns, there is no evidence that learning levels
follow similar patterns.
1.17 The two main enrollment patterns show the dramatic gender-gap in enrollment and the positive effects of higher village
literacy and wealth. Table 1.5 (also in the introduction) shows enrollment patterns for children in rich/poor and
high/low literacy villages. Here we add in test scores in Mathematics across the different village categories
(Mathematics is chosen simply for readability; English and Urdu scores show very similar patterns). The two
main enrollment patterns show the dramatic gender-gap in enrollment, with female enrollment always lower
than male enrollment, and the positive effects of higher village literacy and wealth, whereby more children are
enrolled in villages that are richer and/or more literate. These increases are fairly dramatic, and more so for
girls compared to boys. For instance, moving from a low- to a high-literacy village increases enrollment by 27
percent for boys and 32 percent for girls when the village is poor, and by 11 (boys) and 29 percent (girls)
when the village is rich. Although more literate villages are also wealthier, it is clear that even when villages
are poor, literacy has a large effect on enrollment. Given the strength of the relationship, one would expect
similar patterns to emerge for learning.
27
1.18 A similar pattern
does not emerge for learning.
While the first row does
suggest that moving from a
low- to a high-literacy village
increases Mathematics
scores, a closer look reveals
no systematic pattern.
Villages with medium wealth
appear to be doing worse for
all literacy categories; among
high-wealth villages, those
with high literacy are doing
worse than those with
medium literacy. The best
performing category are
those in high-wealth villages with high literacy; the next best are those in low wealth villages with high literacy.
Finally, there is no gender-gap in the knowledge scores—girls are performing as well as (or even better than)
boys.
If you take away enrollment, a child is only as good as the school she attends
1.19 Most villages have both good and bad schools. Given that village wealth and literacy have little to do with
children’s performance in tests, one possible explanation is that these differences arise from good and bad
schools in the same village rather than good schools in a rich/more literate village and bad schools in the
others. To examine this hypothesis, we ranked villages by average mathematics scores and then selected the
5th best village and the 5th worst village for comparison (with a total of 112, this corresponds roughly to the
5th and 95th percentiles of the distribution). On average, schools in the 5th best village naturally do better
than those in the 5th worst, but when schools are compared individually, it becomes clear that this village
average masks a more complicated story
1.20 That average mathematics scores in these two villages are different does not imply that all schools in the “bad” village
are worse than all schools in the “good” village. In fact, it is the opposite—of 10 schools in the “bad” village, 7 are
better than the worst school in the “good” village. Of the 14 schools in these two villages, 10 “overlap”: That
Table 1.5: While the percent enrolled increases with village wealth and literacy….
Village Wealth Gender % Enrolled by Village Literacy
Low Medium High
Poor Male 56 75 83
Female 38 65 75
Middle Male 82 77 88
Female 62 66 80
Rich Male 73 82 84
Female 53 73 82
Similar patterns do not emerge for levels of learning
Village Wealth Gender
Mathematics Knowledge Scores by Village Literacy
Low Medium High
Poor Male 512 526 565
Female 463 495 503
Middle Male 484 493 484
Female 455 462 489
Rich Male 497 515 525
Female 507 522 522
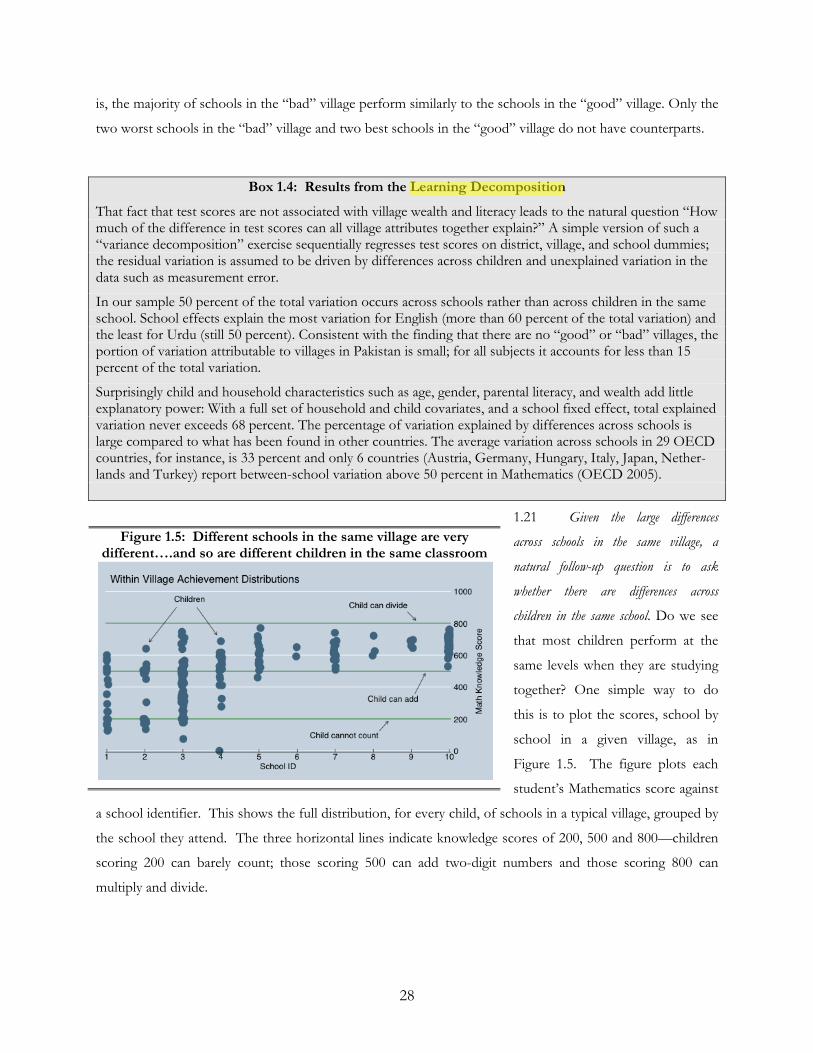
28
is, the majority of schools in the “bad” village perform similarly to the schools in the “good” village. Only the
two worst schools in the “bad” village and two best schools in the “good” village do not have counterparts.
Box 1.4: Results from the Learning Decomposition
That fact that test scores are not associated with village wealth and literacy leads to the natural question “How much of the difference in test scores can all village attributes together explain?” A simple version of such a “variance decomposition” exercise sequentially regresses test scores on district, village, and school dummies; the residual variation is assumed to be driven by differences across children and unexplained variation in the data such as measurement error.
In our sample 50 percent of the total variation occurs across schools rather than across children in the same school. School effects explain the most variation for English (more than 60 percent of the total variation) and the least for Urdu (still 50 percent). Consistent with the finding that there are no “good” or “bad” villages, the portion of variation attributable to villages in Pakistan is small; for all subjects it accounts for less than 15 percent of the total variation.
Surprisingly child and household characteristics such as age, gender, parental literacy, and wealth add little explanatory power: With a full set of household and child covariates, and a school fixed effect, total explained variation never exceeds 68 percent. The percentage of variation explained by differences across schools is large compared to what has been found in other countries. The average variation across schools in 29 OECD countries, for instance, is 33 percent and only 6 countries (Austria, Germany, Hungary, Italy, Japan, Nether-lands and Turkey) report between-school variation above 50 percent in Mathematics (OECD 2005).
1.21 Given the large differences
across schools in the same village, a
natural follow-up question is to ask
whether there are differences across
children in the same school. Do we see
that most children perform at the
same levels when they are studying
together? One simple way to do
this is to plot the scores, school by
school in a given village, as in
Figure 1.5. The figure plots each
student’s Mathematics score against
a school identifier. This shows the full distribution, for every child, of schools in a typical village, grouped by
the school they attend. The three horizontal lines indicate knowledge scores of 200, 500 and 800—children
scoring 200 can barely count; those scoring 500 can add two-digit numbers and those scoring 800 can
multiply and divide.
Figure 1.5: Different schools in the same village are very different….and so are different children in the same classroom
Nadia
Highlight
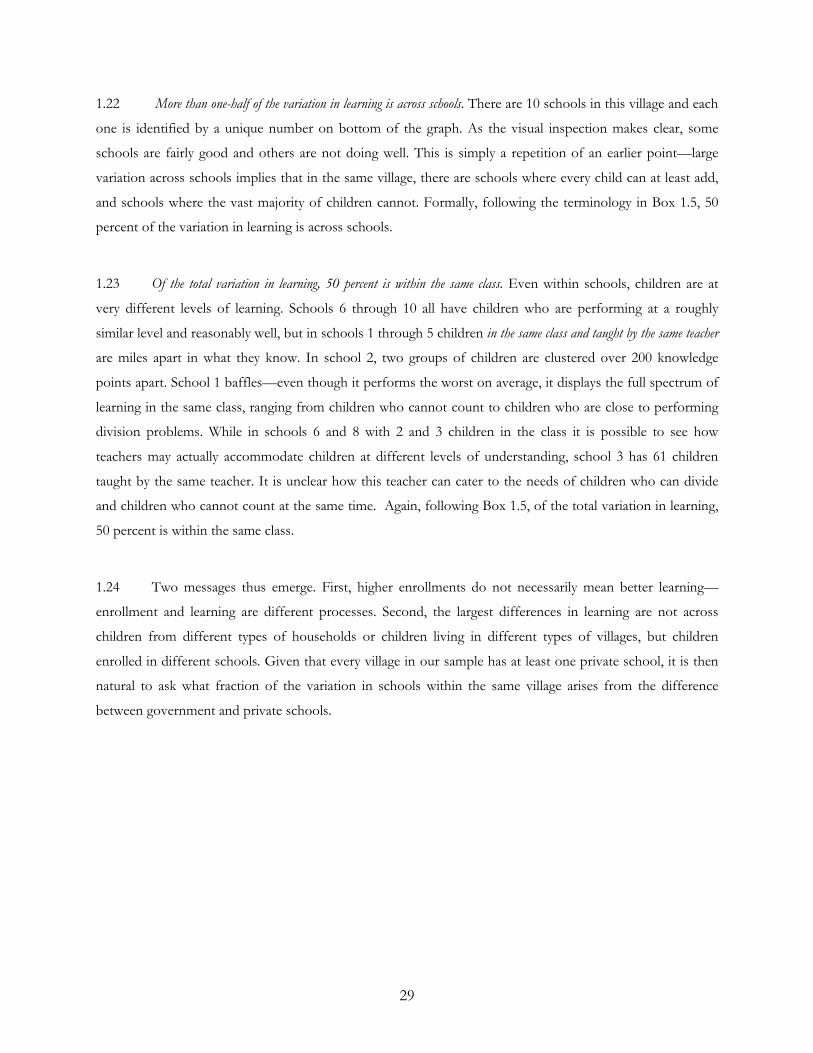
29
1.22 More than one-half of the variation in learning is across schools. There are 10 schools in this village and each
one is identified by a unique number on bottom of the graph. As the visual inspection makes clear, some
schools are fairly good and others are not doing well. This is simply a repetition of an earlier point—large
variation across schools implies that in the same village, there are schools where every child can at least add,
and schools where the vast majority of children cannot. Formally, following the terminology in Box 1.5, 50
percent of the variation in learning is across schools.
1.23 Of the total variation in learning, 50 percent is within the same class. Even within schools, children are at
very different levels of learning. Schools 6 through 10 all have children who are performing at a roughly
similar level and reasonably well, but in schools 1 through 5 children in the same class and taught by the same teacher
are miles apart in what they know. In school 2, two groups of children are clustered over 200 knowledge
points apart. School 1 baffles—even though it performs the worst on average, it displays the full spectrum of
learning in the same class, ranging from children who cannot count to children who are close to performing
division problems. While in schools 6 and 8 with 2 and 3 children in the class it is possible to see how
teachers may actually accommodate children at different levels of understanding, school 3 has 61 children
taught by the same teacher. It is unclear how this teacher can cater to the needs of children who can divide
and children who cannot count at the same time. Again, following Box 1.5, of the total variation in learning,
50 percent is within the same class.
1.24 Two messages thus emerge. First, higher enrollments do not necessarily mean better learning—
enrollment and learning are different processes. Second, the largest differences in learning are not across
children from different types of households or children living in different types of villages, but children
enrolled in different schools. Given that every village in our sample has at least one private school, it is then
natural to ask what fraction of the variation in schools within the same village arises from the difference
between government and private schools.
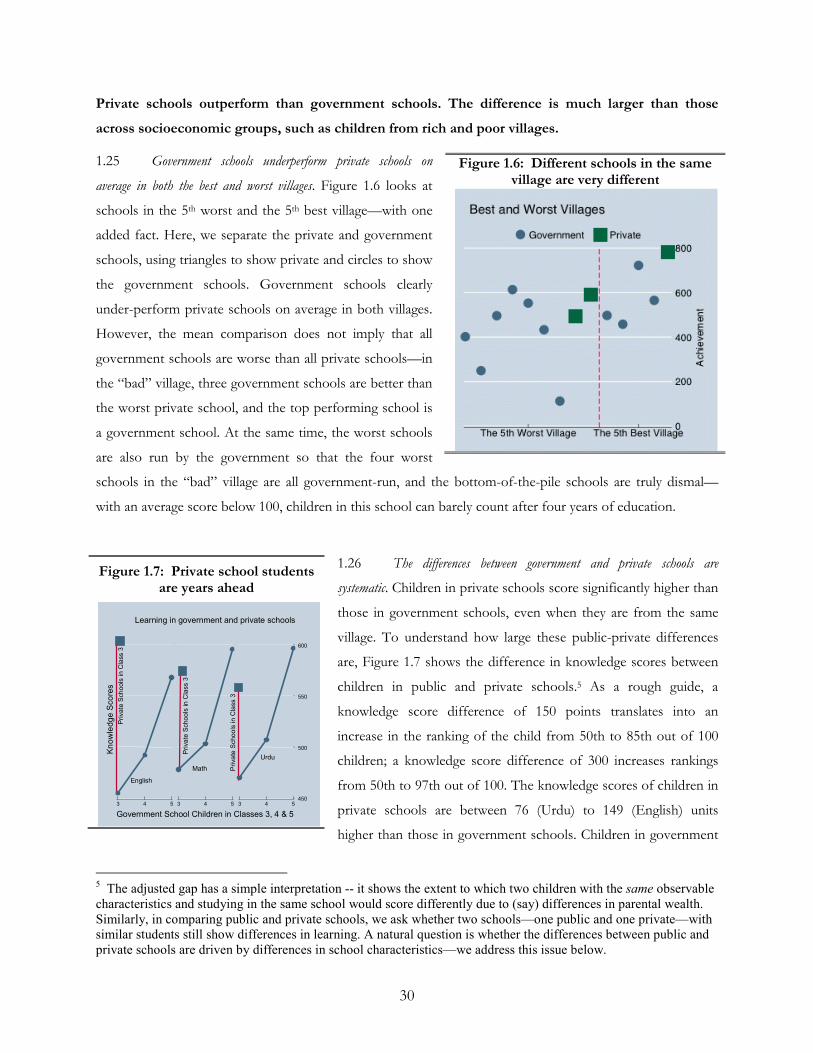
30
Private schools outperform than government schools. The difference is much larger than those
across socioeconomic groups, such as children from rich and poor villages.
1.25 Government schools underperform private schools on
average in both the best and worst villages. Figure 1.6 looks at
schools in the 5th worst and the 5th best village—with one
added fact. Here, we separate the private and government
schools, using triangles to show private and circles to show
the government schools. Government schools clearly
under-perform private schools on average in both villages.
However, the mean comparison does not imply that all
government schools are worse than all private schools—in
the “bad” village, three government schools are better than
the worst private school, and the top performing school is
a government school. At the same time, the worst schools
are also run by the government so that the four worst
schools in the “bad” village are all government-run, and the bottom-of-the-pile schools are truly dismal—
with an average score below 100, children in this school can barely count after four years of education.
1.26 The differences between government and private schools are
systematic. Children in private schools score significantly higher than
those in government schools, even when they are from the same
village. To understand how large these public-private differences
are, Figure 1.7 shows the difference in knowledge scores between
children in public and private schools.5 As a rough guide, a
knowledge score difference of 150 points translates into an
increase in the ranking of the child from 50th to 85th out of 100
children; a knowledge score difference of 300 increases rankings
from 50th to 97th out of 100. The knowledge scores of children in
private schools are between 76 (Urdu) to 149 (English) units
higher than those in government schools. Children in government
5 The adjusted gap has a simple interpretation -- it shows the extent to which two children with the same observable
characteristics and studying in the same school would score differently due to (say) differences in parental wealth.
Similarly, in comparing public and private schools, we ask whether two schools—one public and one private—with
similar students still show differences in learning. A natural question is whether the differences between public and
private schools are driven by differences in school characteristics—we address this issue below.
Figure 1.6: Different schools in the same village are very different
Figure 1.7: Private school students are years ahead
450
500
550
600
3 4 5 3 4 5 3 4 5
English
Math
Urdu
Kn
ow
led
ge
Sco
res
Government School Children in Classes 3, 4 & 5
Learning in government and private schools
Private
Sch
ools
in C
lass 3
Priva
te S
choo
ls in
Cla
ss 3
Priva
te S
choo
ls in
Cla
ss 3
450
500
550
600
3 4 5 3 4 5 3 4 5
English
Math
Urdu
Kn
ow
led
ge
Sco
res
Government School Children in Classes 3, 4 & 5
Learning in government and private schools
Private
Sch
ools
in C
lass 3
Priva
te S
choo
ls in
Cla
ss 3
Priva
te S
choo
ls in
Cla
ss 3
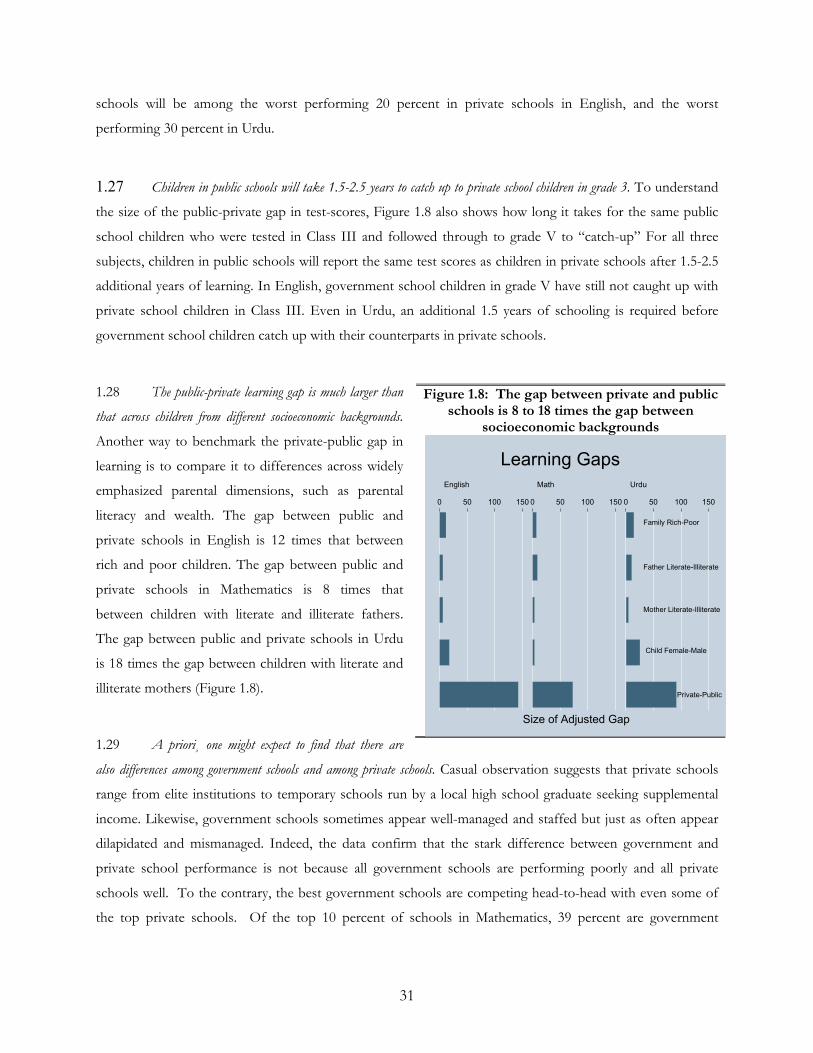
31
schools will be among the worst performing 20 percent in private schools in English, and the worst
performing 30 percent in Urdu.
1.27 Children in public schools will take 1.5-2.5 years to catch up to private school children in grade 3. To understand
the size of the public-private gap in test-scores, Figure 1.8 also shows how long it takes for the same public
school children who were tested in Class III and followed through to grade V to “catch-up” For all three
subjects, children in public schools will report the same test scores as children in private schools after 1.5-2.5
additional years of learning. In English, government school children in grade V have still not caught up with
private school children in Class III. Even in Urdu, an additional 1.5 years of schooling is required before
government school children catch up with their counterparts in private schools.
1.28 The public-private learning gap is much larger than
that across children from different socioeconomic backgrounds.
Another way to benchmark the private-public gap in
learning is to compare it to differences across widely
emphasized parental dimensions, such as parental
literacy and wealth. The gap between public and
private schools in English is 12 times that between
rich and poor children. The gap between public and
private schools in Mathematics is 8 times that
between children with literate and illiterate fathers.
The gap between public and private schools in Urdu
is 18 times the gap between children with literate and
illiterate mothers (Figure 1.8).
1.29 A priori¸ one might expect to find that there are
also differences among government schools and among private schools. Casual observation suggests that private schools
range from elite institutions to temporary schools run by a local high school graduate seeking supplemental
income. Likewise, government schools sometimes appear well-managed and staffed but just as often appear
dilapidated and mismanaged. Indeed, the data confirm that the stark difference between government and
private school performance is not because all government schools are performing poorly and all private
schools well. To the contrary, the best government schools are competing head-to-head with even some of
the top private schools. Of the top 10 percent of schools in Mathematics, 39 percent are government
Figure 1.8: The gap between private and public schools is 8 to 18 times the gap between
socioeconomic backgrounds
Family Rich-Poor
Father Literate-Illiterate
Mother Literate-Illiterate
Child Female-Male
Private-Public
0 50 100 150 0 50 100 150 0 50 100 150
English Math Urdu
Size of Adjusted Gap
Learning Gaps
32
schools. In fact, out of the 804 schools tested, the top scoring school in mathematics is a government school.
Even on the English exam, 17 percent of the top 10 percent of schools are government schools.
1.30 The gap between top and bottom ranked government school is truly massive compared to any other gaps found. The
real problem with poor government school performance is the much higher variation in test scores across
government schools and the performance of the worst schools. In English the worst government school
scored 84 and the best scored 845—a ten-fold difference in performance. By comparison, the worst private
school scored 351 and the best scored 850—only a 2.5 fold difference. The difference between good and bad
government schools is almost 10 times that between children from rich and poor families. The difference is
almost 15 times that between children with literate and illiterate parents. This extreme range of performance
in government schools is not the result of two outlying schools. The vast majority of poor performing
schools are government schools. Government schools account for 91 percent of schools performing in the
bottom 10 percent in Mathematics, 95 percent of the bottom 10 percent in Urdu and the entire bottom 10
percent in English. When government schools fail, they fail completely, and the difference between schools
dwarfs the difference between children from different households.
1.31 The real problem in the government sector is a “long-tail” of dismal schools with no counterparts in the private system.
A clear picture emerges of learning achievement in the sample villages. All villages have good and bad
schools. Although there are some differences across children from different backgrounds, these are small
compared to that between government and private schools. An average private school has children with
higher test scores than an average government school. Third, average performance masks the fact that the
top-performing government schools are almost as good as the top-performing private schools; the real
problem in the government sector is a “long-tail” of dismal schools that have no counterparts in the private
system.
1.32 An immediate reaction to these results is to point to the differences between private and public schools in their student-
body and in their inputs. One reaction may even be to say that in many ways this is a remarkable accomplishment
for these government schools. Attaining top scores with open admittance and large class sizes is considerably
more difficult than with a closed admissions process and small classes, regardless of the quality of instruction.
Some might say government schools perform poorly because they have children from poor and illiterate
backgrounds, insufficient resources, poor infrastructure and very high student-teacher ratios. But does this
argument hold water?
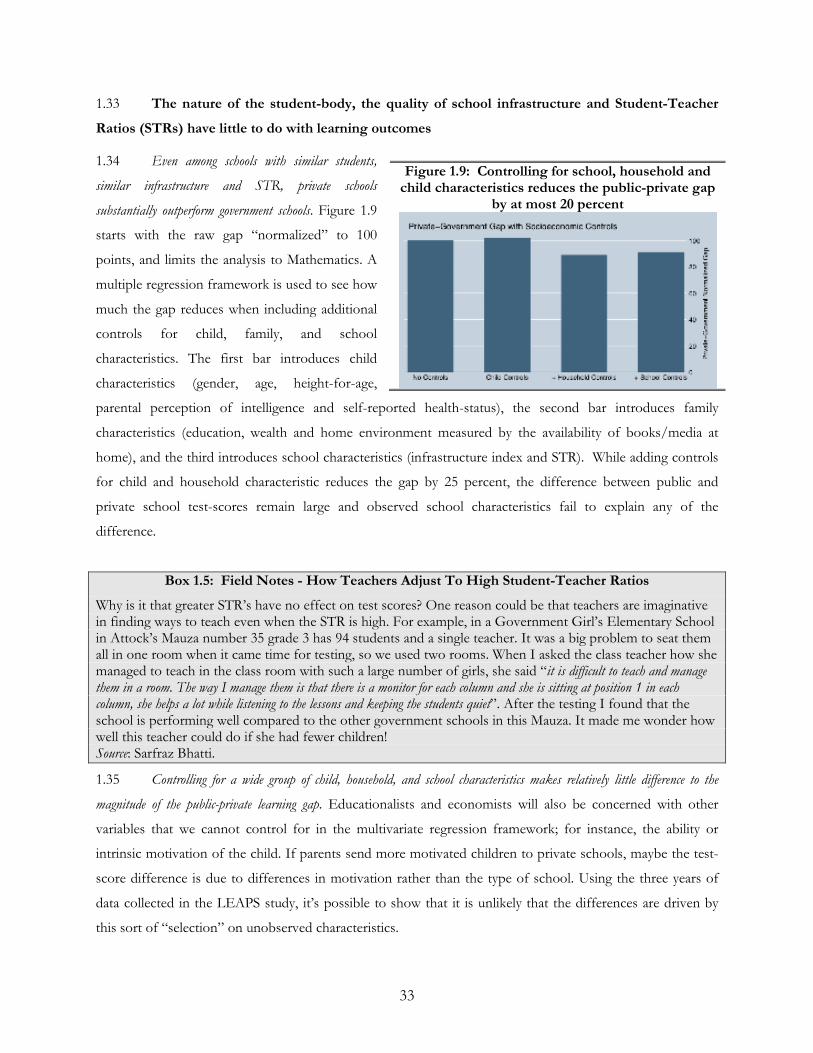
33
1.33 The nature of the student-body, the quality of school infrastructure and Student-Teacher
Ratios (STRs) have little to do with learning outcomes
1.34 Even among schools with similar students,
similar infrastructure and STR, private schools
substantially outperform government schools. Figure 1.9
starts with the raw gap “normalized” to 100
points, and limits the analysis to Mathematics. A
multiple regression framework is used to see how
much the gap reduces when including additional
controls for child, family, and school
characteristics. The first bar introduces child
characteristics (gender, age, height-for-age,
parental perception of intelligence and self-reported health-status), the second bar introduces family
characteristics (education, wealth and home environment measured by the availability of books/media at
home), and the third introduces school characteristics (infrastructure index and STR). While adding controls
for child and household characteristic reduces the gap by 25 percent, the difference between public and
private school test-scores remain large and observed school characteristics fail to explain any of the
difference.
Box 1.5: Field Notes - How Teachers Adjust To High Student-Teacher Ratios
Why is it that greater STR’s have no effect on test scores? One reason could be that teachers are imaginative in finding ways to teach even when the STR is high. For example, in a Government Girl’s Elementary School in Attock’s Mauza number 35 grade 3 has 94 students and a single teacher. It was a big problem to seat them all in one room when it came time for testing, so we used two rooms. When I asked the class teacher how she managed to teach in the class room with such a large number of girls, she said “it is difficult to teach and manage them in a room. The way I manage them is that there is a monitor for each column and she is sitting at position 1 in each column, she helps a lot while listening to the lessons and keeping the students quiet”. After the testing I found that the school is performing well compared to the other government schools in this Mauza. It made me wonder how well this teacher could do if she had fewer children! Source: Sarfraz Bhatti.
1.35 Controlling for a wide group of child, household, and school characteristics makes relatively little difference to the
magnitude of the public-private learning gap. Educationalists and economists will also be concerned with other
variables that we cannot control for in the multivariate regression framework; for instance, the ability or
intrinsic motivation of the child. If parents send more motivated children to private schools, maybe the test-
score difference is due to differences in motivation rather than the type of school. Using the three years of
data collected in the LEAPS study, it’s possible to show that it is unlikely that the differences are driven by
this sort of “selection” on unobserved characteristics.
Figure 1.9: Controlling for school, household and child characteristics reduces the public-private gap
by at most 20 percent
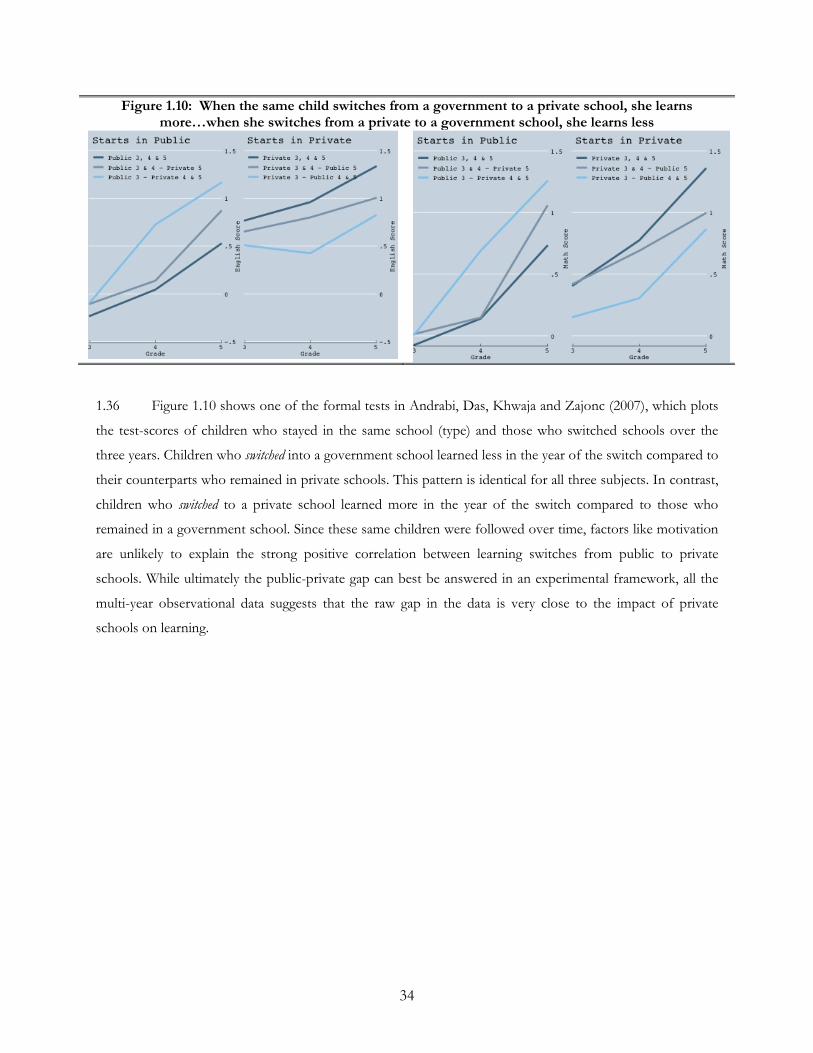
34
Figure 1.10: When the same child switches from a government to a private school, she learns more…when she switches from a private to a government school, she learns less
1.36 Figure 1.10 shows one of the formal tests in Andrabi, Das, Khwaja and Zajonc (2007), which plots
the test-scores of children who stayed in the same school (type) and those who switched schools over the
three years. Children who switched into a government school learned less in the year of the switch compared to
their counterparts who remained in private schools. This pattern is identical for all three subjects. In contrast,
children who switched to a private school learned more in the year of the switch compared to those who
remained in a government school. Since these same children were followed over time, factors like motivation
are unlikely to explain the strong positive correlation between learning switches from public to private
schools. While ultimately the public-private gap can best be answered in an experimental framework, all the
multi-year observational data suggests that the raw gap in the data is very close to the impact of private
schools on learning.
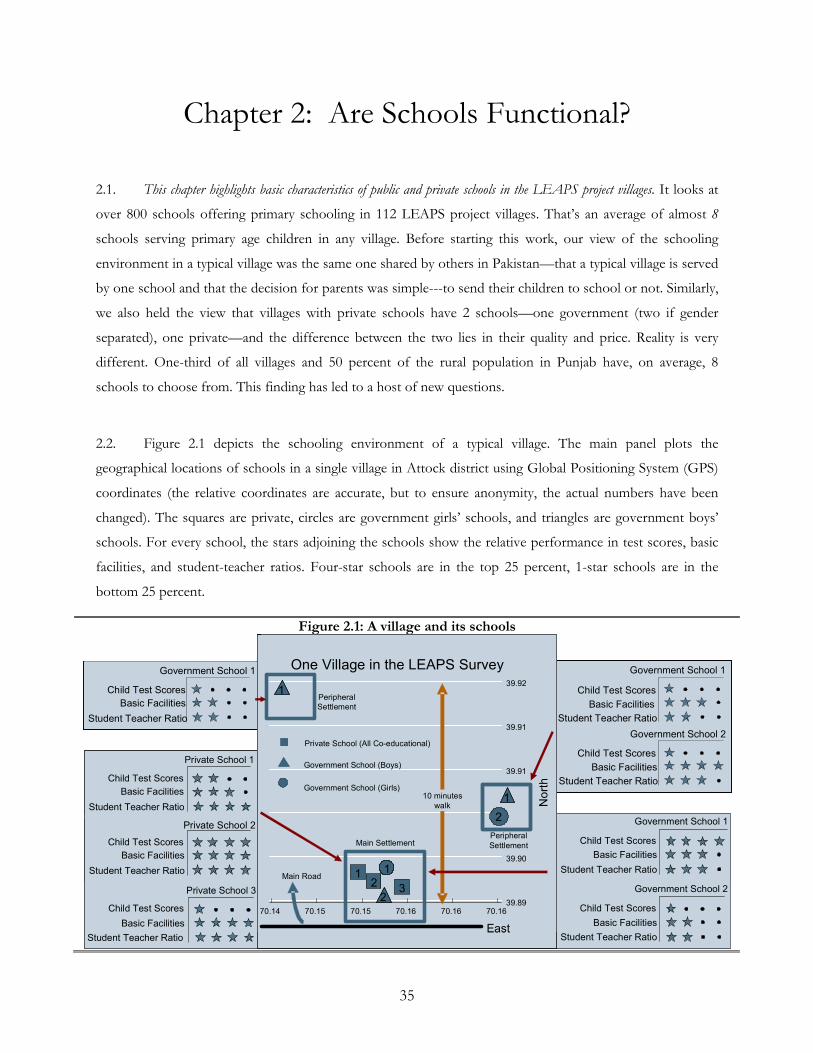
35
Chapter 2: Are Schools Functional?
2.1. This chapter highlights basic characteristics of public and private schools in the LEAPS project villages. It looks at
over 800 schools offering primary schooling in 112 LEAPS project villages. That’s an average of almost 8
schools serving primary age children in any village. Before starting this work, our view of the schooling
environment in a typical village was the same one shared by others in Pakistan—that a typical village is served
by one school and that the decision for parents was simple---to send their children to school or not. Similarly,
we also held the view that villages with private schools have 2 schools—one government (two if gender
separated), one private—and the difference between the two lies in their quality and price. Reality is very
different. One-third of all villages and 50 percent of the rural population in Punjab have, on average, 8
schools to choose from. This finding has led to a host of new questions.
2.2. Figure 2.1 depicts the schooling environment of a typical village. The main panel plots the
geographical locations of schools in a single village in Attock district using Global Positioning System (GPS)
coordinates (the relative coordinates are accurate, but to ensure anonymity, the actual numbers have been
changed). The squares are private, circles are government girls’ schools, and triangles are government boys’
schools. For every school, the stars adjoining the schools show the relative performance in test scores, basic
facilities, and student-teacher ratios. Four-star schools are in the top 25 percent, 1-star schools are in the
bottom 25 percent.
Figure 2.1: A village and its schools
Private School 1
Child Test Scores
Student Teacher Ratio
Basic Facilities
Child Test Scores
Student Teacher Ratio
Basic Facilities
Private School 3
Child Test Scores
Student Teacher Ratio
Basic Facilities
Private School 1
Child Test Scores
Student Teacher Ratio
Basic Facilities
Child Test Scores
Student Teacher Ratio
Basic Facilities
Private School 3
Child Test Scores
Student Teacher Ratio
Basic Facilities
School 1
Child Test Scores
Student Teacher Ratio
Basic Facilities
School 2
Child Test Scores
Student Teacher Ratio
Basic Facilities
Government School 1
Child Test Scores
Student Teacher Ratio
Basic Facilities
Government School 2
Child Test Scores
Student Teacher Ratio
Basic Facilities
Government School 1
Child Test Scores
Student Teacher Ratio
Basic Facilities
Child Test Scores
Student Teacher Ratio
Basic Facilities
Government School 2
Government School 1
Child Test Scores
Student Teacher Ratio
Basic Facilities
Child Test Scores
Student Teacher Ratio
Basic Facilities
Government School 2
Government School 1
Child Test Scores
Student Teacher Ratio
Basic Facilities
Child Test Scores
Student Teacher Ratio
Basic Facilities
Government School 2
Child Test Scores
Student Teacher Ratio
Basic Facilities
Government School 2
School 1
Child Test Scores
Basic Facilities
Student Teacher Ratio
Government School 1
Child Test Scores
Basic Facilities
Student Teacher Ratio No
rth
Private School 2
Private School (All Co-educational)
Government School (Boys)
Government School (Girls)
39.89
39.90
39.91
39.91
39.92
No
rth
70.14 70.15 70.15 70.16 70.16 70.16
East
One Village in the LEAPS Survey
10 minutes
walk
Main Settlement
Peripheral
Settlement
Peripheral
Settlement
Main Road
Private School (All Co-educational)
Government School (Boys)
Government School (Girls)
39.89
39.90
39.91
39.91
39.92
No
rth
70.14 70.15 70.15 70.16 70.16 70.16
East
One Village in the LEAPS Survey
10 minutes
walk
Main Settlement
Peripheral
Settlement
Peripheral
Settlement
Main Road3
2
12
54
1
1
Private School (All Co-educational)
Government School (Boys)
Government School (Girls)
39.89
39.90
39.91
39.91
39.92
No
rth
70.14 70.15 70.15 70.16 70.16 70.16
East
One Village in the LEAPS Survey
10 minutes
walk
Main Settlement
Peripheral
Settlement
Peripheral
Settlement
Main Road
Private School (All Co-educational)
Government School (Boys)
Government School (Girls)
39.89
39.90
39.91
39.91
39.92
No
rth
70.14 70.15 70.15 70.16 70.16 70.16
East
One Village in the LEAPS Survey
10 minutes
walk
Main Settlement
Peripheral
Settlement
Peripheral
Settlement
Main Road31
2
12
342
11
11
Private School 1
Child Test Scores
Student Teacher Ratio
Basic Facilities
Child Test Scores
Student Teacher Ratio
Basic Facilities
Private School 3
Child Test Scores
Student Teacher Ratio
Basic Facilities
Private School 1
Child Test Scores
Student Teacher Ratio
Basic Facilities
Child Test Scores
Student Teacher Ratio
Basic Facilities
Private School 3
Child Test Scores
Student Teacher Ratio
Basic Facilities
School 1
Child Test Scores
Student Teacher Ratio
Basic Facilities
School 2
Child Test Scores
Student Teacher Ratio
Basic Facilities
Government School 1
Child Test Scores
Student Teacher Ratio
Basic Facilities
Government School 2
Child Test Scores
Student Teacher Ratio
Basic Facilities
School 1
Child Test Scores
Student Teacher Ratio
Basic Facilities
School 2
Child Test Scores
Student Teacher Ratio
Basic Facilities
Government School 1
Child Test Scores
Student Teacher Ratio
Basic Facilities
Government School 2
Child Test Scores
Student Teacher Ratio
Basic Facilities
Government School 1
Child Test Scores
Student Teacher Ratio
Basic Facilities
Child Test Scores
Student Teacher Ratio
Basic Facilities
Government School 2
Government School 1
Child Test Scores
Student Teacher Ratio
Basic Facilities
Child Test Scores
Student Teacher Ratio
Basic Facilities
Government School 2
Government School 1
Child Test Scores
Student Teacher Ratio
Basic Facilities
Child Test Scores
Student Teacher Ratio
Basic Facilities
Government School 2
Child Test Scores
Student Teacher Ratio
Basic Facilities
Government School 2
School 1
Child Test Scores
Basic Facilities
Student Teacher Ratio
Government School 1
Child Test Scores
Basic Facilities
Student Teacher Ratio
School 1
Child Test Scores
Basic Facilities
Student Teacher Ratio
Government School 1
Child Test Scores
Basic Facilities
Student Teacher Ratio No
rth
Private School 2
Private School (All Co-educational)
Government School (Boys)
Government School (Girls)
39.89
39.90
39.91
39.91
39.92
No
rth
70.14 70.15 70.15 70.16 70.16 70.16
East
One Village in the LEAPS Survey
10 minutes
walk
Main Settlement
Peripheral
Settlement
Peripheral
Settlement
Main Road
Private School (All Co-educational)
Government School (Boys)
Government School (Girls)
39.89
39.90
39.91
39.91
39.92
No
rth
70.14 70.15 70.15 70.16 70.16 70.16
East
One Village in the LEAPS Survey
10 minutes
walk
Main Settlement
Peripheral
Settlement
Peripheral
Settlement
Main Road3
2
12
54
1
1
Private School (All Co-educational)
Government School (Boys)
Government School (Girls)
39.89
39.90
39.91
39.91
39.92
No
rth
70.14 70.15 70.15 70.16 70.16 70.16
East
One Village in the LEAPS Survey
10 minutes
walk
Main Settlement
Peripheral
Settlement
Peripheral
Settlement
Main Road
Private School (All Co-educational)
Government School (Boys)
Government School (Girls)
39.89
39.90
39.91
39.91
39.92
No
rth
70.14 70.15 70.15 70.16 70.16 70.16
East
One Village in the LEAPS Survey
10 minutes
walk
Main Settlement
Peripheral
Settlement
Peripheral
Settlement
Main Road31
2
12
342
11
11
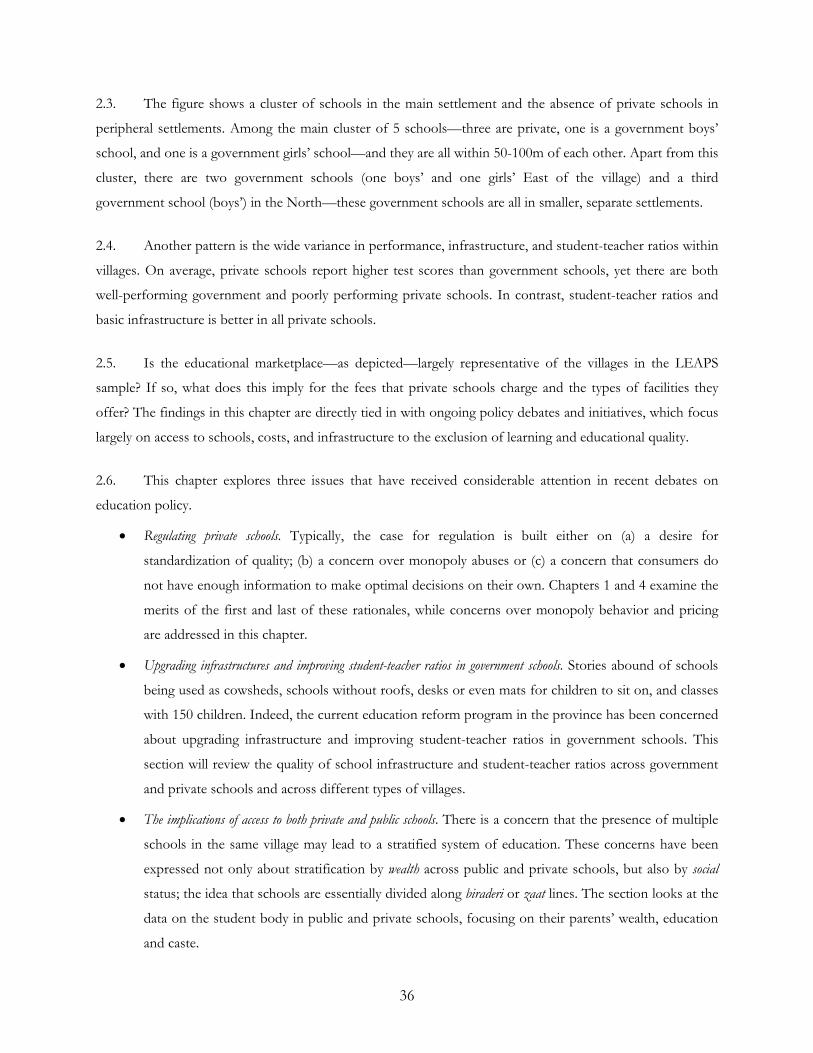
36
2.3. The figure shows a cluster of schools in the main settlement and the absence of private schools in
peripheral settlements. Among the main cluster of 5 schools—three are private, one is a government boys’
school, and one is a government girls’ school—and they are all within 50-100m of each other. Apart from this
cluster, there are two government schools (one boys’ and one girls’ East of the village) and a third
government school (boys’) in the North—these government schools are all in smaller, separate settlements.
2.4. Another pattern is the wide variance in performance, infrastructure, and student-teacher ratios within
villages. On average, private schools report higher test scores than government schools, yet there are both
well-performing government and poorly performing private schools. In contrast, student-teacher ratios and
basic infrastructure is better in all private schools.
2.5. Is the educational marketplace—as depicted—largely representative of the villages in the LEAPS
sample? If so, what does this imply for the fees that private schools charge and the types of facilities they
offer? The findings in this chapter are directly tied in with ongoing policy debates and initiatives, which focus
largely on access to schools, costs, and infrastructure to the exclusion of learning and educational quality.
2.6. This chapter explores three issues that have received considerable attention in recent debates on
education policy.
• Regulating private schools. Typically, the case for regulation is built either on (a) a desire for
standardization of quality; (b) a concern over monopoly abuses or (c) a concern that consumers do
not have enough information to make optimal decisions on their own. Chapters 1 and 4 examine the
merits of the first and last of these rationales, while concerns over monopoly behavior and pricing
are addressed in this chapter.
• Upgrading infrastructures and improving student-teacher ratios in government schools. Stories abound of schools
being used as cowsheds, schools without roofs, desks or even mats for children to sit on, and classes
with 150 children. Indeed, the current education reform program in the province has been concerned
about upgrading infrastructure and improving student-teacher ratios in government schools. This
section will review the quality of school infrastructure and student-teacher ratios across government
and private schools and across different types of villages.
• The implications of access to both private and public schools. There is a concern that the presence of multiple
schools in the same village may lead to a stratified system of education. These concerns have been
expressed not only about stratification by wealth across public and private schools, but also by social
status; the idea that schools are essentially divided along biraderi or zaat lines. The section looks at the
data on the student body in public and private schools, focusing on their parents’ wealth, education
and caste.
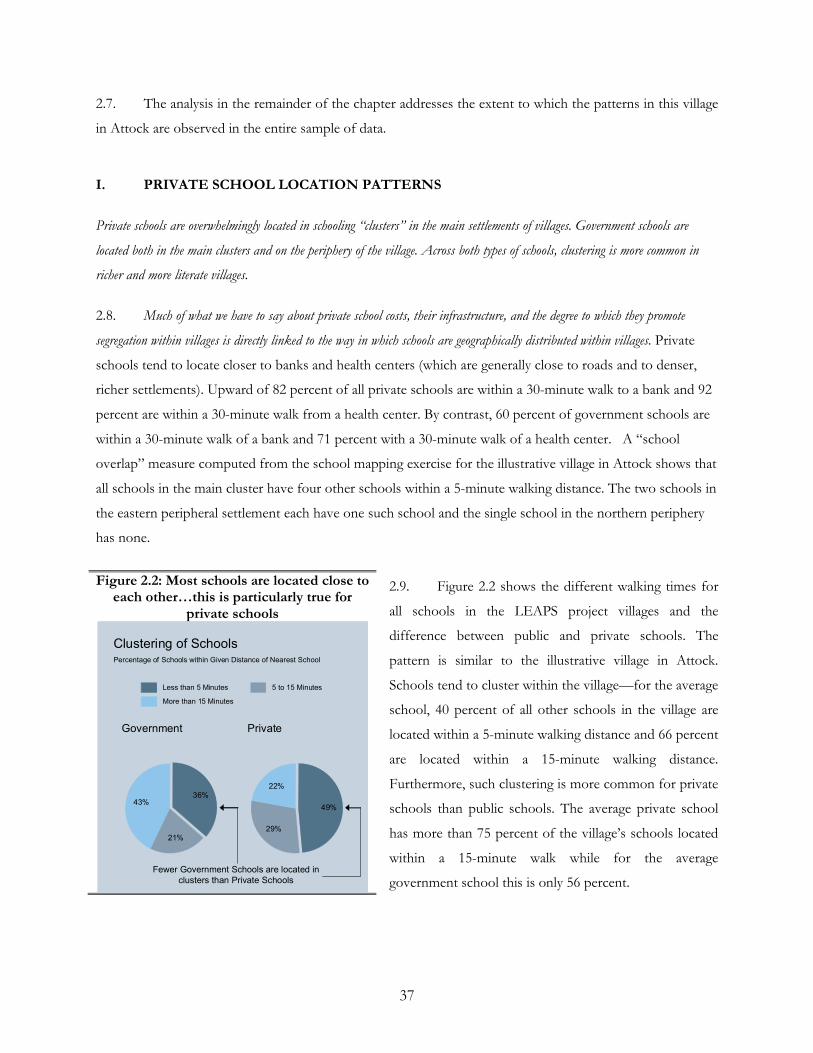
37
2.7. The analysis in the remainder of the chapter addresses the extent to which the patterns in this village
in Attock are observed in the entire sample of data.
I. PRIVATE SCHOOL LOCATION PATTERNS
Private schools are overwhelmingly located in schooling “clusters” in the main settlements of villages. Government schools are
located both in the main clusters and on the periphery of the village. Across both types of schools, clustering is more common in
richer and more literate villages.
2.8. Much of what we have to say about private school costs, their infrastructure, and the degree to which they promote
segregation within villages is directly linked to the way in which schools are geographically distributed within villages. Private
schools tend to locate closer to banks and health centers (which are generally close to roads and to denser,
richer settlements). Upward of 82 percent of all private schools are within a 30-minute walk to a bank and 92
percent are within a 30-minute walk from a health center. By contrast, 60 percent of government schools are
within a 30-minute walk of a bank and 71 percent with a 30-minute walk of a health center. A “school
overlap” measure computed from the school mapping exercise for the illustrative village in Attock shows that
all schools in the main cluster have four other schools within a 5-minute walking distance. The two schools in
the eastern peripheral settlement each have one such school and the single school in the northern periphery
has none.
2.9. Figure 2.2 shows the different walking times for
all schools in the LEAPS project villages and the
difference between public and private schools. The
pattern is similar to the illustrative village in Attock.
Schools tend to cluster within the village—for the average
school, 40 percent of all other schools in the village are
located within a 5-minute walking distance and 66 percent
are located within a 15-minute walking distance.
Furthermore, such clustering is more common for private
schools than public schools. The average private school
has more than 75 percent of the village’s schools located
within a 15-minute walk while for the average
government school this is only 56 percent.
Figure 2.2: Most schools are located close to each other…this is particularly true for
private schools
36%
21%
43%49%
29%
22%
Government Private
Less than 5 Minutes 5 to 15 Minutes
More than 15 Minutes
Percentage of Schools within Given Distance of Nearest School
Clustering of Schools
Fewer Government Schools are located in
clusters than Private Schools
36%
21%
43%49%
29%
22%
Government Private
Less than 5 Minutes 5 to 15 Minutes
More than 15 Minutes
Percentage of Schools within Given Distance of Nearest School
Clustering of Schools
Fewer Government Schools are located in
clusters than Private Schools
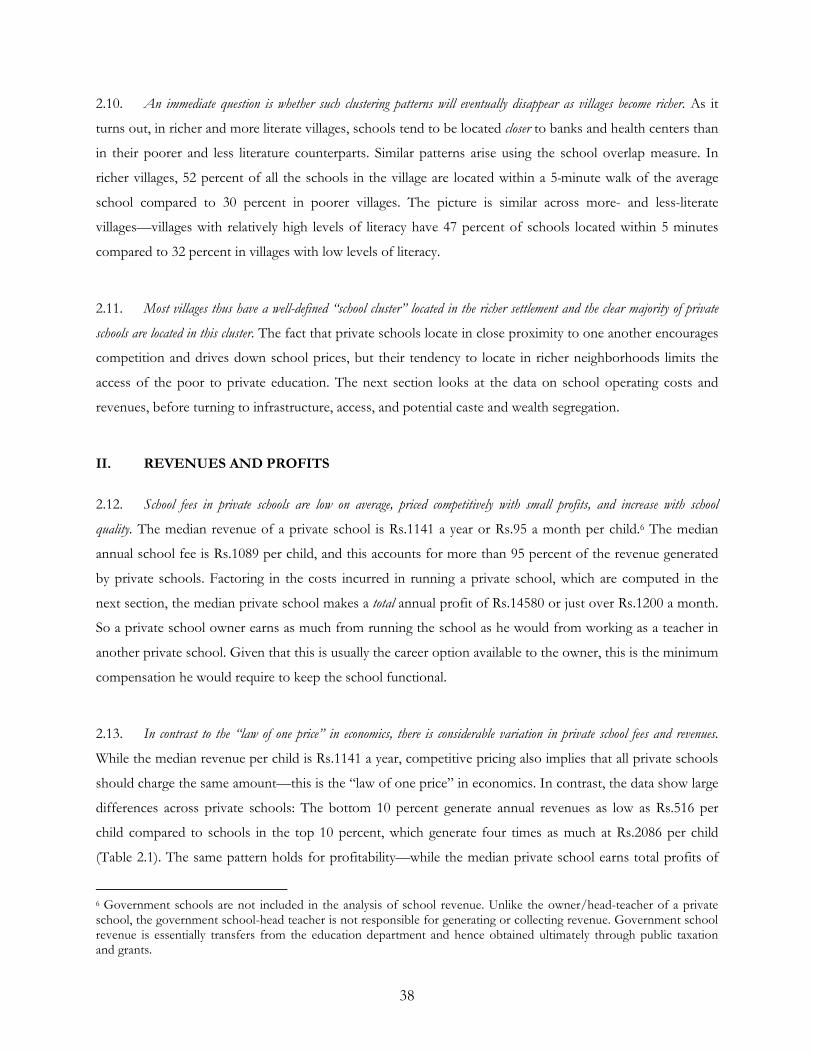
38
2.10. An immediate question is whether such clustering patterns will eventually disappear as villages become richer. As it
turns out, in richer and more literate villages, schools tend to be located closer to banks and health centers than
in their poorer and less literature counterparts. Similar patterns arise using the school overlap measure. In
richer villages, 52 percent of all the schools in the village are located within a 5-minute walk of the average
school compared to 30 percent in poorer villages. The picture is similar across more- and less-literate
villages—villages with relatively high levels of literacy have 47 percent of schools located within 5 minutes
compared to 32 percent in villages with low levels of literacy.
2.11. Most villages thus have a well-defined “school cluster” located in the richer settlement and the clear majority of private
schools are located in this cluster. The fact that private schools locate in close proximity to one another encourages
competition and drives down school prices, but their tendency to locate in richer neighborhoods limits the
access of the poor to private education. The next section looks at the data on school operating costs and
revenues, before turning to infrastructure, access, and potential caste and wealth segregation.
II. REVENUES AND PROFITS
2.12. School fees in private schools are low on average, priced competitively with small profits, and increase with school
quality. The median revenue of a private school is Rs.1141 a year or Rs.95 a month per child.6 The median
annual school fee is Rs.1089 per child, and this accounts for more than 95 percent of the revenue generated
by private schools. Factoring in the costs incurred in running a private school, which are computed in the
next section, the median private school makes a total annual profit of Rs.14580 or just over Rs.1200 a month.
So a private school owner earns as much from running the school as he would from working as a teacher in
another private school. Given that this is usually the career option available to the owner, this is the minimum
compensation he would require to keep the school functional.
2.13. In contrast to the “law of one price” in economics, there is considerable variation in private school fees and revenues.
While the median revenue per child is Rs.1141 a year, competitive pricing also implies that all private schools
should charge the same amount—this is the “law of one price” in economics. In contrast, the data show large
differences across private schools: The bottom 10 percent generate annual revenues as low as Rs.516 per
child compared to schools in the top 10 percent, which generate four times as much at Rs.2086 per child
(Table 2.1). The same pattern holds for profitability—while the median private school earns total profits of
6 Government schools are not included in the analysis of school revenue. Unlike the owner/head-teacher of a private school, the government school-head teacher is not responsible for generating or collecting revenue. Government school revenue is essentially transfers from the education department and hence obtained ultimately through public taxation and grants.
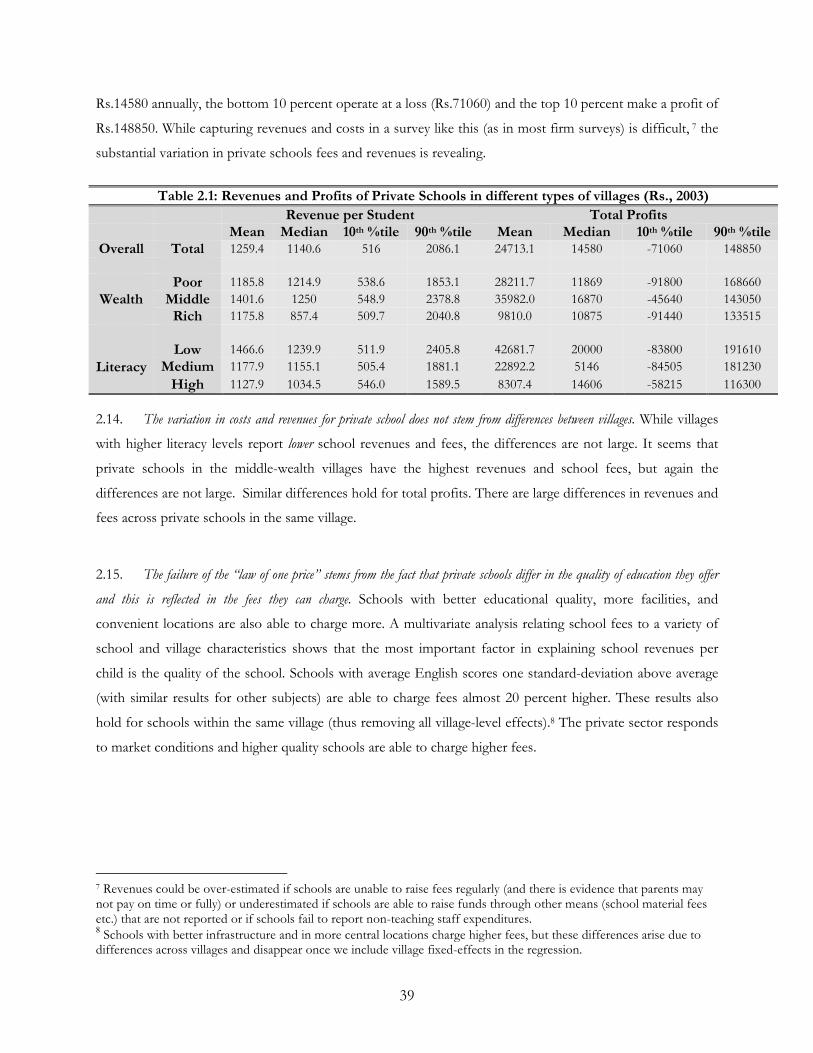
39
Rs.14580 annually, the bottom 10 percent operate at a loss (Rs.71060) and the top 10 percent make a profit of
Rs.148850. While capturing revenues and costs in a survey like this (as in most firm surveys) is difficult, 7 the
substantial variation in private schools fees and revenues is revealing.
Table 2.1: Revenues and Profits of Private Schools in different types of villages (Rs., 2003)
Revenue per Student Total Profits Mean Median 10th %tile 90th %tile Mean Median 10th %tile 90th %tile
Overall Total 1259.4 1140.6 516 2086.1 24713.1 14580 -71060 148850
Wealth Poor 1185.8 1214.9 538.6 1853.1 28211.7 11869 -91800 168660
Middle 1401.6 1250 548.9 2378.8 35982.0 16870 -45640 143050
Rich 1175.8 857.4 509.7 2040.8 9810.0 10875 -91440 133515
Literacy
Low 1466.6 1239.9 511.9 2405.8 42681.7 20000 -83800 191610
Medium 1177.9 1155.1 505.4 1881.1 22892.2 5146 -84505 181230
High 1127.9 1034.5 546.0 1589.5 8307.4 14606 -58215 116300
2.14. The variation in costs and revenues for private school does not stem from differences between villages. While villages
with higher literacy levels report lower school revenues and fees, the differences are not large. It seems that
private schools in the middle-wealth villages have the highest revenues and school fees, but again the
differences are not large. Similar differences hold for total profits. There are large differences in revenues and
fees across private schools in the same village.
2.15. The failure of the “law of one price” stems from the fact that private schools differ in the quality of education they offer
and this is reflected in the fees they can charge. Schools with better educational quality, more facilities, and
convenient locations are also able to charge more. A multivariate analysis relating school fees to a variety of
school and village characteristics shows that the most important factor in explaining school revenues per
child is the quality of the school. Schools with average English scores one standard-deviation above average
(with similar results for other subjects) are able to charge fees almost 20 percent higher. These results also
hold for schools within the same village (thus removing all village-level effects).8 The private sector responds
to market conditions and higher quality schools are able to charge higher fees.
7 Revenues could be over-estimated if schools are unable to raise fees regularly (and there is evidence that parents may not pay on time or fully) or underestimated if schools are able to raise funds through other means (school material fees etc.) that are not reported or if schools fail to report non-teaching staff expenditures. 8 Schools with better infrastructure and in more central locations charge higher fees, but these differences arise due to differences across villages and disappear once we include village fixed-effects in the regression.
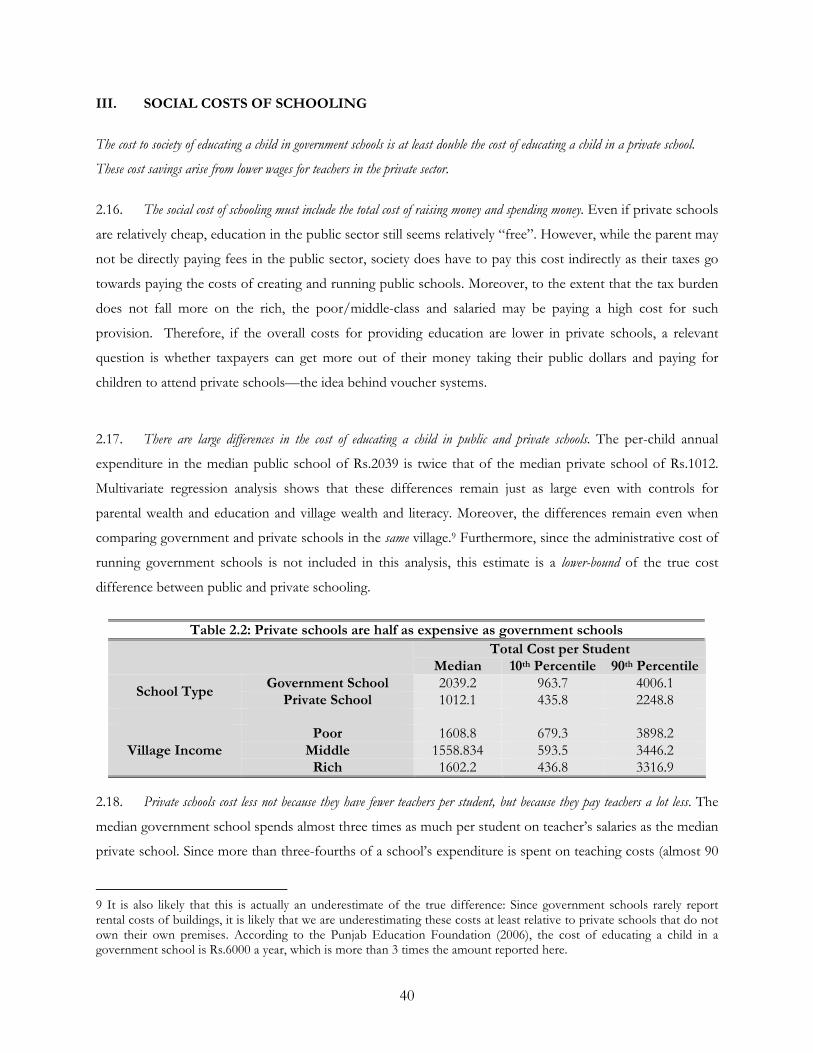
40
III. SOCIAL COSTS OF SCHOOLING
The cost to society of educating a child in government schools is at least double the cost of educating a child in a private school.
These cost savings arise from lower wages for teachers in the private sector.
2.16. The social cost of schooling must include the total cost of raising money and spending money. Even if private schools
are relatively cheap, education in the public sector still seems relatively “free”. However, while the parent may
not be directly paying fees in the public sector, society does have to pay this cost indirectly as their taxes go
towards paying the costs of creating and running public schools. Moreover, to the extent that the tax burden
does not fall more on the rich, the poor/middle-class and salaried may be paying a high cost for such
provision. Therefore, if the overall costs for providing education are lower in private schools, a relevant
question is whether taxpayers can get more out of their money taking their public dollars and paying for
children to attend private schools—the idea behind voucher systems.
2.17. There are large differences in the cost of educating a child in public and private schools. The per-child annual
expenditure in the median public school of Rs.2039 is twice that of the median private school of Rs.1012.
Multivariate regression analysis shows that these differences remain just as large even with controls for
parental wealth and education and village wealth and literacy. Moreover, the differences remain even when
comparing government and private schools in the same village.9 Furthermore, since the administrative cost of
running government schools is not included in this analysis, this estimate is a lower-bound of the true cost
difference between public and private schooling.
Table 2.2: Private schools are half as expensive as government schools
Total Cost per Student
Median 10th Percentile 90th Percentile
School Type Government School 2039.2 963.7 4006.1
Private School 1012.1 435.8 2248.8
Village Income Poor 1608.8 679.3 3898.2
Middle 1558.834 593.5 3446.2 Rich 1602.2 436.8 3316.9
2.18. Private schools cost less not because they have fewer teachers per student, but because they pay teachers a lot less. The
median government school spends almost three times as much per student on teacher’s salaries as the median
private school. Since more than three-fourths of a school’s expenditure is spent on teaching costs (almost 90
9 It is also likely that this is actually an underestimate of the true difference: Since government schools rarely report rental costs of buildings, it is likely that we are underestimating these costs at least relative to private schools that do not own their own premises. According to the Punjab Education Foundation (2006), the cost of educating a child in a government school is Rs.6000 a year, which is more than 3 times the amount reported here.
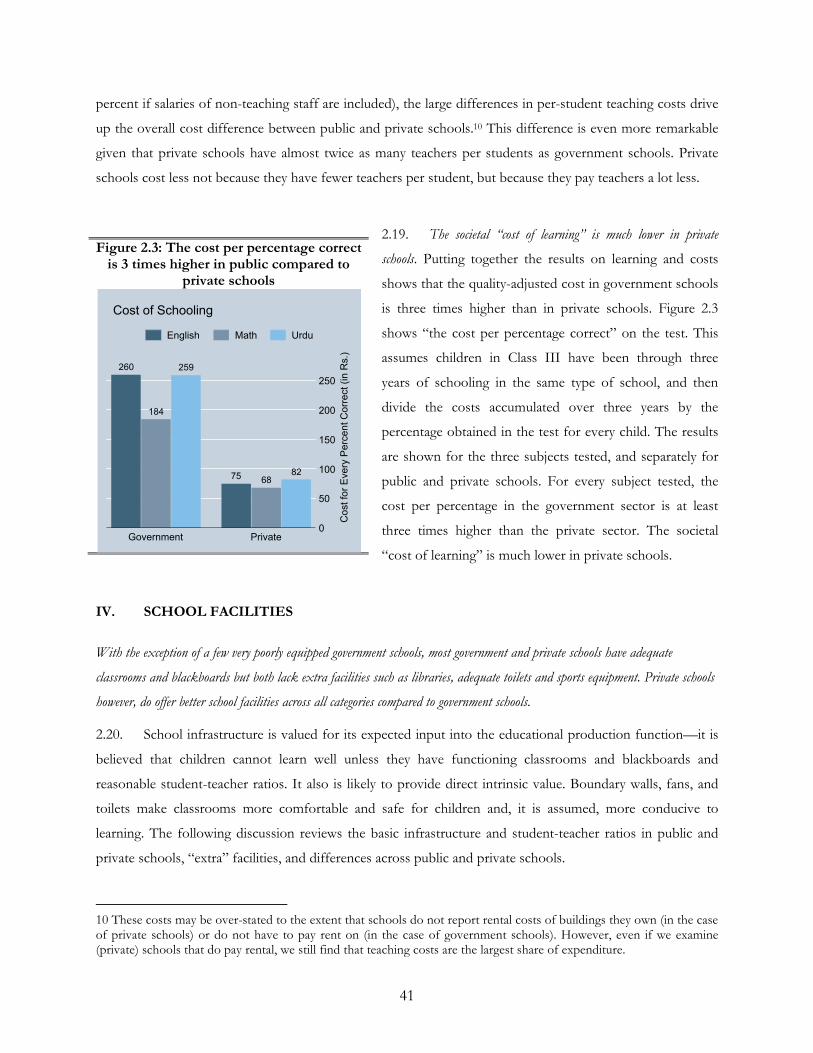
41
percent if salaries of non-teaching staff are included), the large differences in per-student teaching costs drive
up the overall cost difference between public and private schools.10 This difference is even more remarkable
given that private schools have almost twice as many teachers per students as government schools. Private
schools cost less not because they have fewer teachers per student, but because they pay teachers a lot less.
2.19. The societal “cost of learning” is much lower in private
schools. Putting together the results on learning and costs
shows that the quality-adjusted cost in government schools
is three times higher than in private schools. Figure 2.3
shows “the cost per percentage correct” on the test. This
assumes children in Class III have been through three
years of schooling in the same type of school, and then
divide the costs accumulated over three years by the
percentage obtained in the test for every child. The results
are shown for the three subjects tested, and separately for
public and private schools. For every subject tested, the
cost per percentage in the government sector is at least
three times higher than the private sector. The societal
“cost of learning” is much lower in private schools.
IV. SCHOOL FACILITIES
With the exception of a few very poorly equipped government schools, most government and private schools have adequate
classrooms and blackboards but both lack extra facilities such as libraries, adequate toilets and sports equipment. Private schools
however, do offer better school facilities across all categories compared to government schools.
2.20. School infrastructure is valued for its expected input into the educational production function—it is
believed that children cannot learn well unless they have functioning classrooms and blackboards and
reasonable student-teacher ratios. It also is likely to provide direct intrinsic value. Boundary walls, fans, and
toilets make classrooms more comfortable and safe for children and, it is assumed, more conducive to
learning. The following discussion reviews the basic infrastructure and student-teacher ratios in public and
private schools, “extra” facilities, and differences across public and private schools.
10 These costs may be over-stated to the extent that schools do not report rental costs of buildings they own (in the case of private schools) or do not have to pay rent on (in the case of government schools). However, even if we examine (private) schools that do pay rental, we still find that teaching costs are the largest share of expenditure.
Figure 2.3: The cost per percentage correct is 3 times higher in public compared to
private schools
260
184
259
75 6882
0
50
100
150
200
250
Co
st fo
r E
ve
ry P
erc
en
t C
orr
ect (i
n R
s.)
Government Private
Cost of Schooling
English Math Urdu
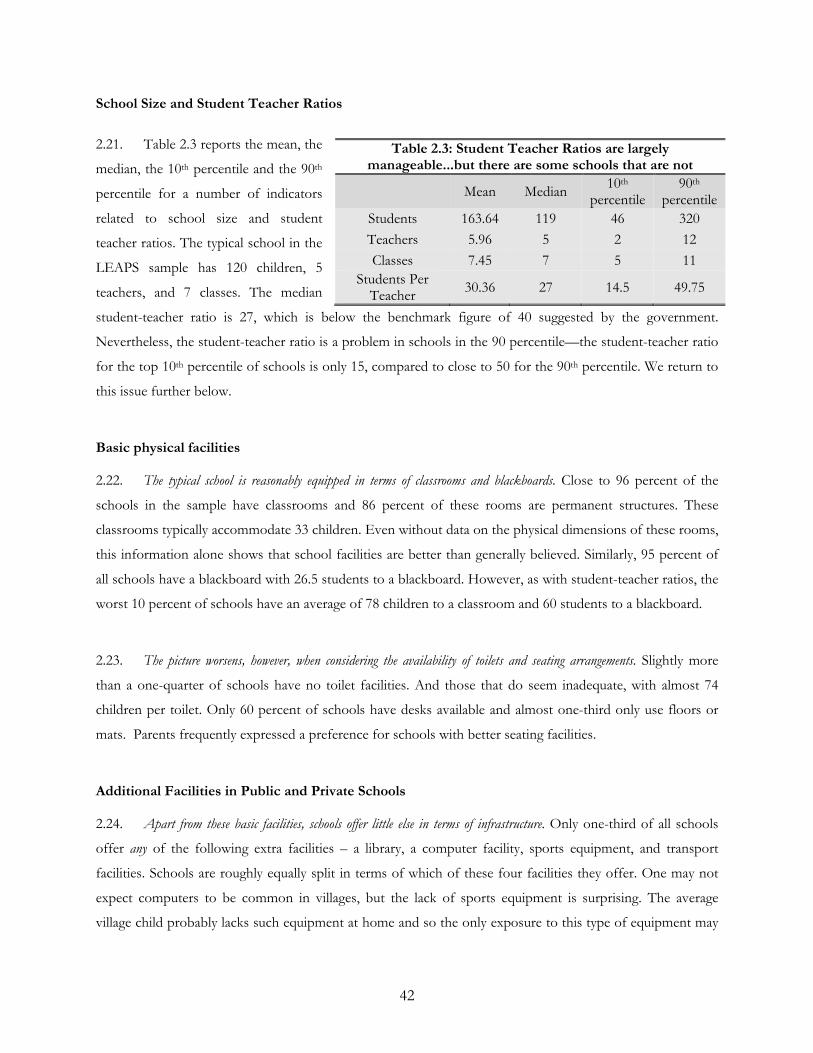
42
School Size and Student Teacher Ratios
2.21. Table 2.3 reports the mean, the
median, the 10th percentile and the 90th
percentile for a number of indicators
related to school size and student
teacher ratios. The typical school in the
LEAPS sample has 120 children, 5
teachers, and 7 classes. The median
student-teacher ratio is 27, which is below the benchmark figure of 40 suggested by the government.
Nevertheless, the student-teacher ratio is a problem in schools in the 90 percentile—the student-teacher ratio
for the top 10th percentile of schools is only 15, compared to close to 50 for the 90th percentile. We return to
this issue further below.
Basic physical facilities
2.22. The typical school is reasonably equipped in terms of classrooms and blackboards. Close to 96 percent of the
schools in the sample have classrooms and 86 percent of these rooms are permanent structures. These
classrooms typically accommodate 33 children. Even without data on the physical dimensions of these rooms,
this information alone shows that school facilities are better than generally believed. Similarly, 95 percent of
all schools have a blackboard with 26.5 students to a blackboard. However, as with student-teacher ratios, the
worst 10 percent of schools have an average of 78 children to a classroom and 60 students to a blackboard.
2.23. The picture worsens, however, when considering the availability of toilets and seating arrangements. Slightly more
than a one-quarter of schools have no toilet facilities. And those that do seem inadequate, with almost 74
children per toilet. Only 60 percent of schools have desks available and almost one-third only use floors or
mats. Parents frequently expressed a preference for schools with better seating facilities.
Additional Facilities in Public and Private Schools
2.24. Apart from these basic facilities, schools offer little else in terms of infrastructure. Only one-third of all schools
offer any of the following extra facilities – a library, a computer facility, sports equipment, and transport
facilities. Schools are roughly equally split in terms of which of these four facilities they offer. One may not
expect computers to be common in villages, but the lack of sports equipment is surprising. The average
village child probably lacks such equipment at home and so the only exposure to this type of equipment may
Table 2.3: Student Teacher Ratios are largely manageable...but there are some schools that are not
Mean Median 10th
percentile 90th
percentile
Students 163.64 119 46 320
Teachers 5.96 5 2 12
Classes 7.45 7 5 11
Students Per Teacher
30.36 27 14.5 49.75
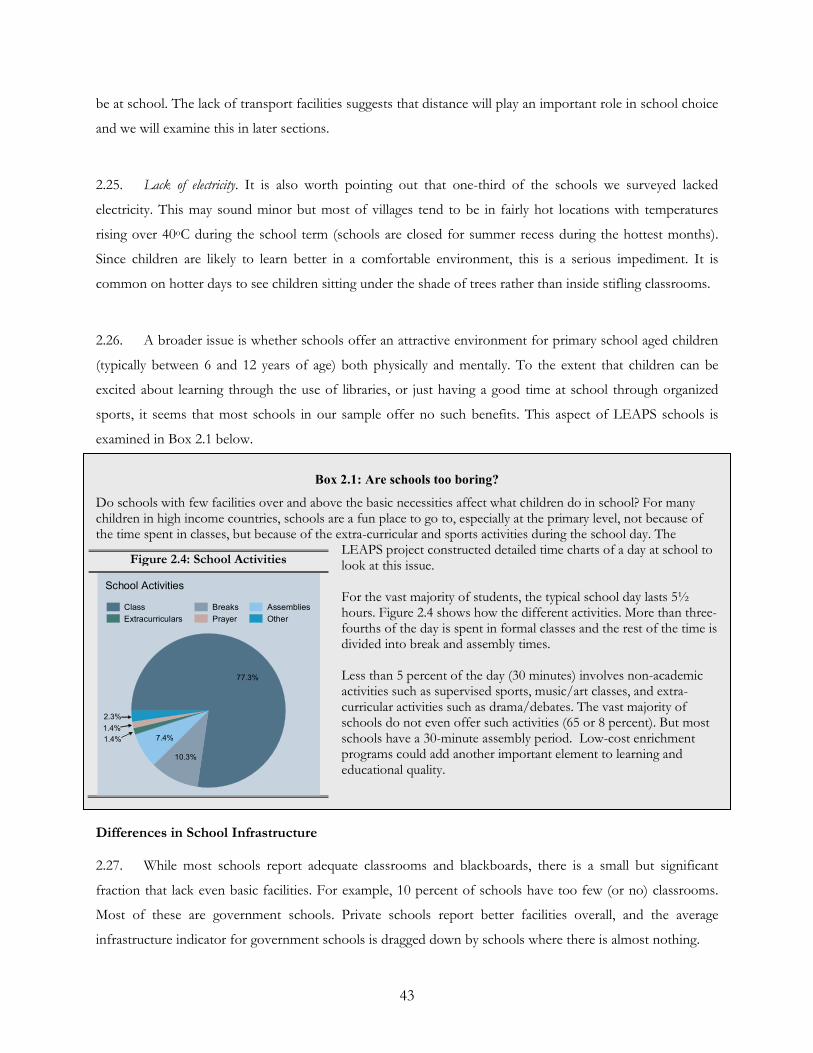
43
be at school. The lack of transport facilities suggests that distance will play an important role in school choice
and we will examine this in later sections.
2.25. Lack of electricity. It is also worth pointing out that one-third of the schools we surveyed lacked
electricity. This may sound minor but most of villages tend to be in fairly hot locations with temperatures
rising over 40oC during the school term (schools are closed for summer recess during the hottest months).
Since children are likely to learn better in a comfortable environment, this is a serious impediment. It is
common on hotter days to see children sitting under the shade of trees rather than inside stifling classrooms.
2.26. A broader issue is whether schools offer an attractive environment for primary school aged children
(typically between 6 and 12 years of age) both physically and mentally. To the extent that children can be
excited about learning through the use of libraries, or just having a good time at school through organized
sports, it seems that most schools in our sample offer no such benefits. This aspect of LEAPS schools is
examined in Box 2.1 below.
Box 2.1: Are schools too boring?
Do schools with few facilities over and above the basic necessities affect what children do in school? For many children in high income countries, schools are a fun place to go to, especially at the primary level, not because of the time spent in classes, but because of the extra-curricular and sports activities during the school day. The
LEAPS project constructed detailed time charts of a day at school to look at this issue. For the vast majority of students, the typical school day lasts 5½ hours. Figure 2.4 shows how the different activities. More than three-fourths of the day is spent in formal classes and the rest of the time is divided into break and assembly times. Less than 5 percent of the day (30 minutes) involves non-academic activities such as supervised sports, music/art classes, and extra-curricular activities such as drama/debates. The vast majority of schools do not even offer such activities (65 or 8 percent). But most schools have a 30-minute assembly period. Low-cost enrichment programs could add another important element to learning and educational quality.
Differences in School Infrastructure
2.27. While most schools report adequate classrooms and blackboards, there is a small but significant
fraction that lack even basic facilities. For example, 10 percent of schools have too few (or no) classrooms.
Most of these are government schools. Private schools report better facilities overall, and the average
infrastructure indicator for government schools is dragged down by schools where there is almost nothing.
Figure 2.4: School Activities
77.3%
10.3%
7.4%1.4%
1.4%
2.3%
Class Breaks Assemblies
Extracurriculars Prayer Other
School Activities
77.3%
10.3%
7.4%1.4%
1.4%
2.3%
Class Breaks Assemblies
Extracurriculars Prayer Other
School Activities
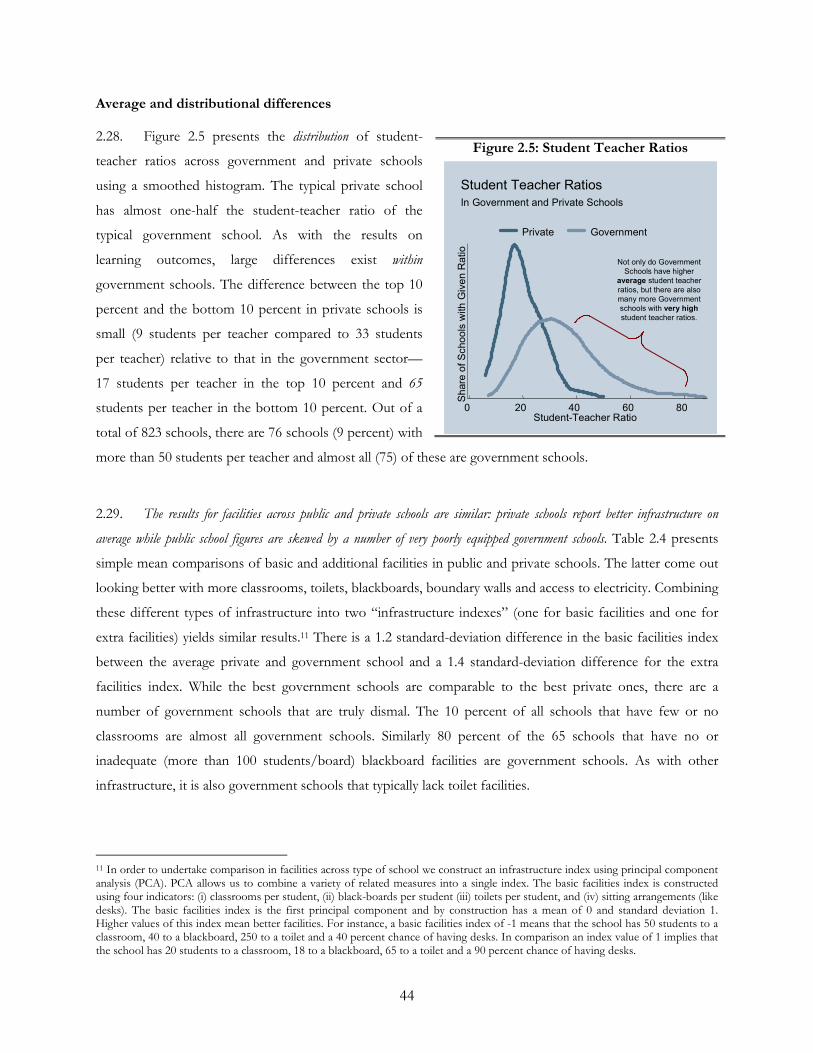
44
Average and distributional differences
2.28. Figure 2.5 presents the distribution of student-
teacher ratios across government and private schools
using a smoothed histogram. The typical private school
has almost one-half the student-teacher ratio of the
typical government school. As with the results on
learning outcomes, large differences exist within
government schools. The difference between the top 10
percent and the bottom 10 percent in private schools is
small (9 students per teacher compared to 33 students
per teacher) relative to that in the government sector—
17 students per teacher in the top 10 percent and 65
students per teacher in the bottom 10 percent. Out of a
total of 823 schools, there are 76 schools (9 percent) with
more than 50 students per teacher and almost all (75) of these are government schools.
2.29. The results for facilities across public and private schools are similar: private schools report better infrastructure on
average while public school figures are skewed by a number of very poorly equipped government schools. Table 2.4 presents
simple mean comparisons of basic and additional facilities in public and private schools. The latter come out
looking better with more classrooms, toilets, blackboards, boundary walls and access to electricity. Combining
these different types of infrastructure into two “infrastructure indexes” (one for basic facilities and one for
extra facilities) yields similar results.11 There is a 1.2 standard-deviation difference in the basic facilities index
between the average private and government school and a 1.4 standard-deviation difference for the extra
facilities index. While the best government schools are comparable to the best private ones, there are a
number of government schools that are truly dismal. The 10 percent of all schools that have few or no
classrooms are almost all government schools. Similarly 80 percent of the 65 schools that have no or
inadequate (more than 100 students/board) blackboard facilities are government schools. As with other
infrastructure, it is also government schools that typically lack toilet facilities.
11 In order to undertake comparison in facilities across type of school we construct an infrastructure index using principal component analysis (PCA). PCA allows us to combine a variety of related measures into a single index. The basic facilities index is constructed using four indicators: (i) classrooms per student, (ii) black-boards per student (iii) toilets per student, and (iv) sitting arrangements (like desks). The basic facilities index is the first principal component and by construction has a mean of 0 and standard deviation 1. Higher values of this index mean better facilities. For instance, a basic facilities index of -1 means that the school has 50 students to a classroom, 40 to a blackboard, 250 to a toilet and a 40 percent chance of having desks. In comparison an index value of 1 implies that the school has 20 students to a classroom, 18 to a blackboard, 65 to a toilet and a 90 percent chance of having desks.
Figure 2.5: Student Teacher Ratios
Sh
are
of
Scho
ols
with
Giv
en
Ra
tio
0 20 40 60 80Student-Teacher Ratio
Private Government
In Government and Private Schools
Student Teacher Ratios
Not only do Government
Schools have higher
average student teacher
ratios, but there are also
many more Government
schools with very high
student teacher ratios.
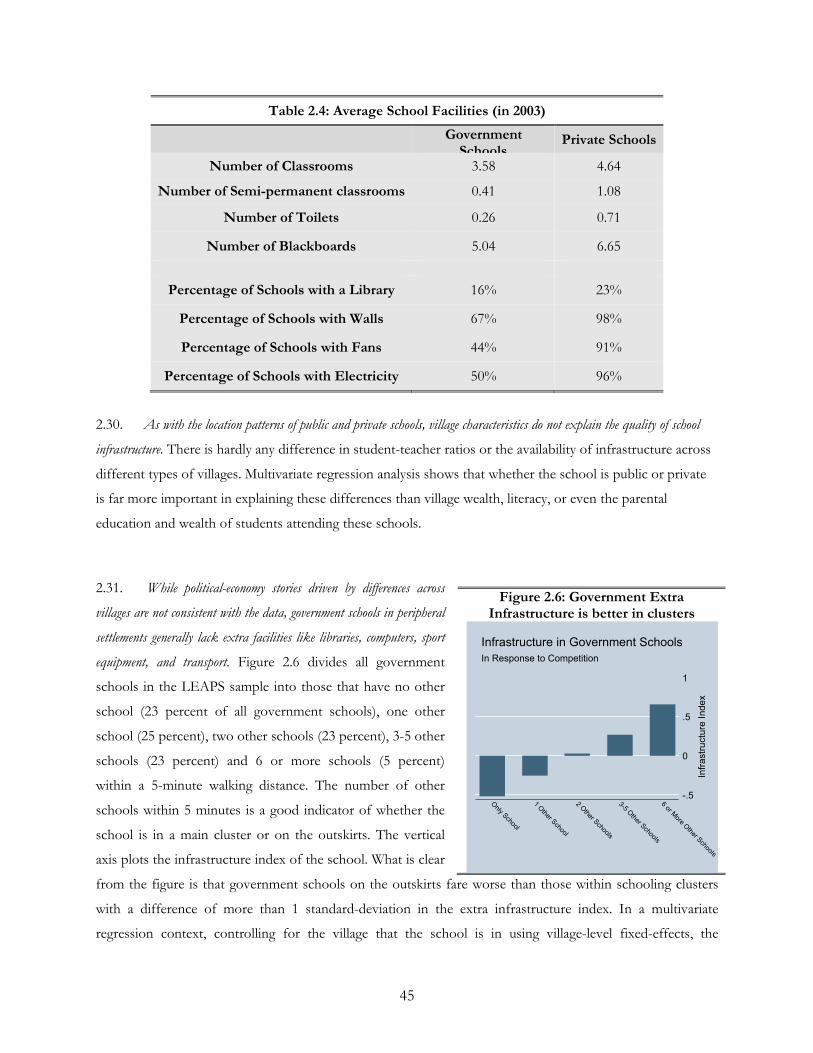
45
Table 2.4: Average School Facilities (in 2003)
Government Schools
Private Schools
Number of Classrooms 3.58 4.64
Number of Semi-permanent classrooms 0.41 1.08
Number of Toilets 0.26 0.71
Number of Blackboards 5.04 6.65
Percentage of Schools with a Library 16% 23%
Percentage of Schools with Walls 67% 98%
Percentage of Schools with Fans 44% 91%
Percentage of Schools with Electricity 50% 96%
2.30. As with the location patterns of public and private schools, village characteristics do not explain the quality of school
infrastructure. There is hardly any difference in student-teacher ratios or the availability of infrastructure across
different types of villages. Multivariate regression analysis shows that whether the school is public or private
is far more important in explaining these differences than village wealth, literacy, or even the parental
education and wealth of students attending these schools.
2.31. While political-economy stories driven by differences across
villages are not consistent with the data, government schools in peripheral
settlements generally lack extra facilities like libraries, computers, sport
equipment, and transport. Figure 2.6 divides all government
schools in the LEAPS sample into those that have no other
school (23 percent of all government schools), one other
school (25 percent), two other schools (23 percent), 3-5 other
schools (23 percent) and 6 or more schools (5 percent)
within a 5-minute walking distance. The number of other
schools within 5 minutes is a good indicator of whether the
school is in a main cluster or on the outskirts. The vertical
axis plots the infrastructure index of the school. What is clear
from the figure is that government schools on the outskirts fare worse than those within schooling clusters
with a difference of more than 1 standard-deviation in the extra infrastructure index. In a multivariate
regression context, controlling for the village that the school is in using village-level fixed-effects, the
Figure 2.6: Government Extra Infrastructure is better in clusters
-.5
0
.5
1
Infr
astr
uctu
re I
ndex
Only School
1 Other S
chool
2 Other S
chools
3-5 Other Schools
6 or More O
ther Schools
In Response to Competition
Infrastructure in Government Schools
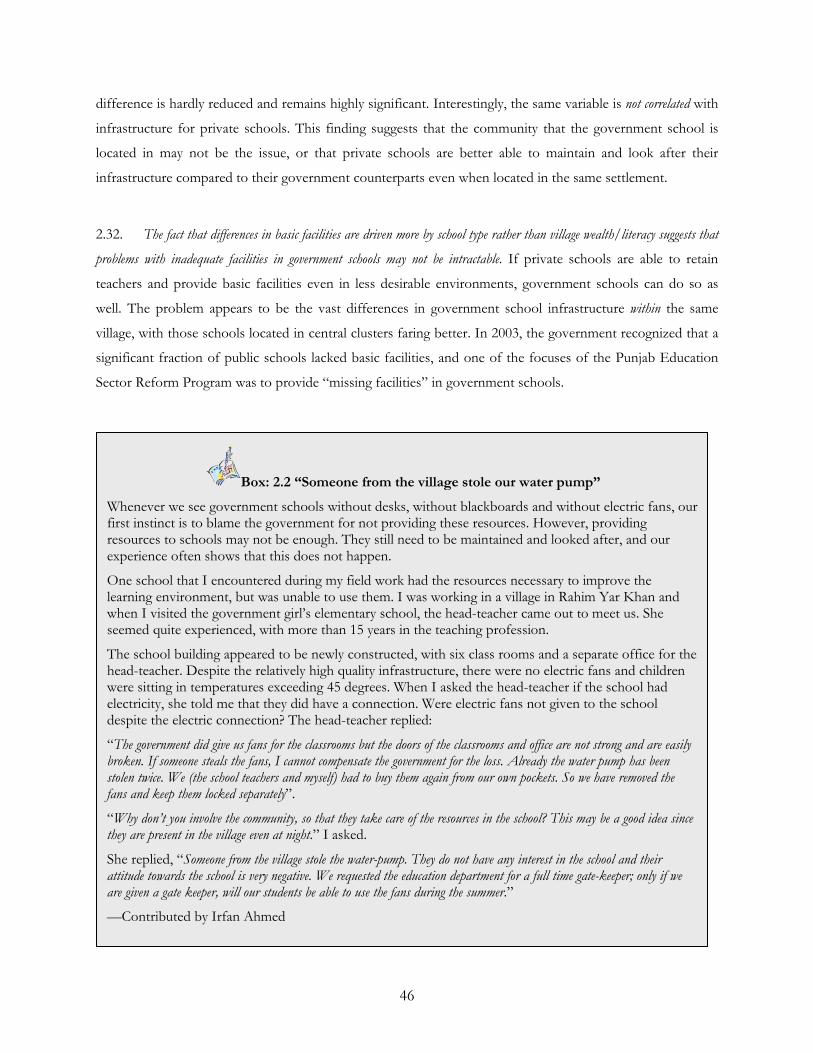
46
difference is hardly reduced and remains highly significant. Interestingly, the same variable is not correlated with
infrastructure for private schools. This finding suggests that the community that the government school is
located in may not be the issue, or that private schools are better able to maintain and look after their
infrastructure compared to their government counterparts even when located in the same settlement.
2.32. The fact that differences in basic facilities are driven more by school type rather than village wealth/literacy suggests that
problems with inadequate facilities in government schools may not be intractable. If private schools are able to retain
teachers and provide basic facilities even in less desirable environments, government schools can do so as
well. The problem appears to be the vast differences in government school infrastructure within the same
village, with those schools located in central clusters faring better. In 2003, the government recognized that a
significant fraction of public schools lacked basic facilities, and one of the focuses of the Punjab Education
Sector Reform Program was to provide “missing facilities” in government schools.
Box: 2.2 “Someone from the village stole our water pump”
Whenever we see government schools without desks, without blackboards and without electric fans, our first instinct is to blame the government for not providing these resources. However, providing resources to schools may not be enough. They still need to be maintained and looked after, and our experience often shows that this does not happen.
One school that I encountered during my field work had the resources necessary to improve the learning environment, but was unable to use them. I was working in a village in Rahim Yar Khan and when I visited the government girl’s elementary school, the head-teacher came out to meet us. She seemed quite experienced, with more than 15 years in the teaching profession.
The school building appeared to be newly constructed, with six class rooms and a separate office for the head-teacher. Despite the relatively high quality infrastructure, there were no electric fans and children were sitting in temperatures exceeding 45 degrees. When I asked the head-teacher if the school had electricity, she told me that they did have a connection. Were electric fans not given to the school despite the electric connection? The head-teacher replied:
“The government did give us fans for the classrooms but the doors of the classrooms and office are not strong and are easily broken. If someone steals the fans, I cannot compensate the government for the loss. Already the water pump has been stolen twice. We (the school teachers and myself) had to buy them again from our own pockets. So we have removed the fans and keep them locked separately”.
“Why don’t you involve the community, so that they take care of the resources in the school? This may be a good idea since they are present in the village even at night.” I asked.
She replied, “Someone from the village stole the water-pump. They do not have any interest in the school and their attitude towards the school is very negative. We requested the education department for a full time gate-keeper; only if we are given a gate keeper, will our students be able to use the fans during the summer.”
—Contributed by Irfan Ahmed
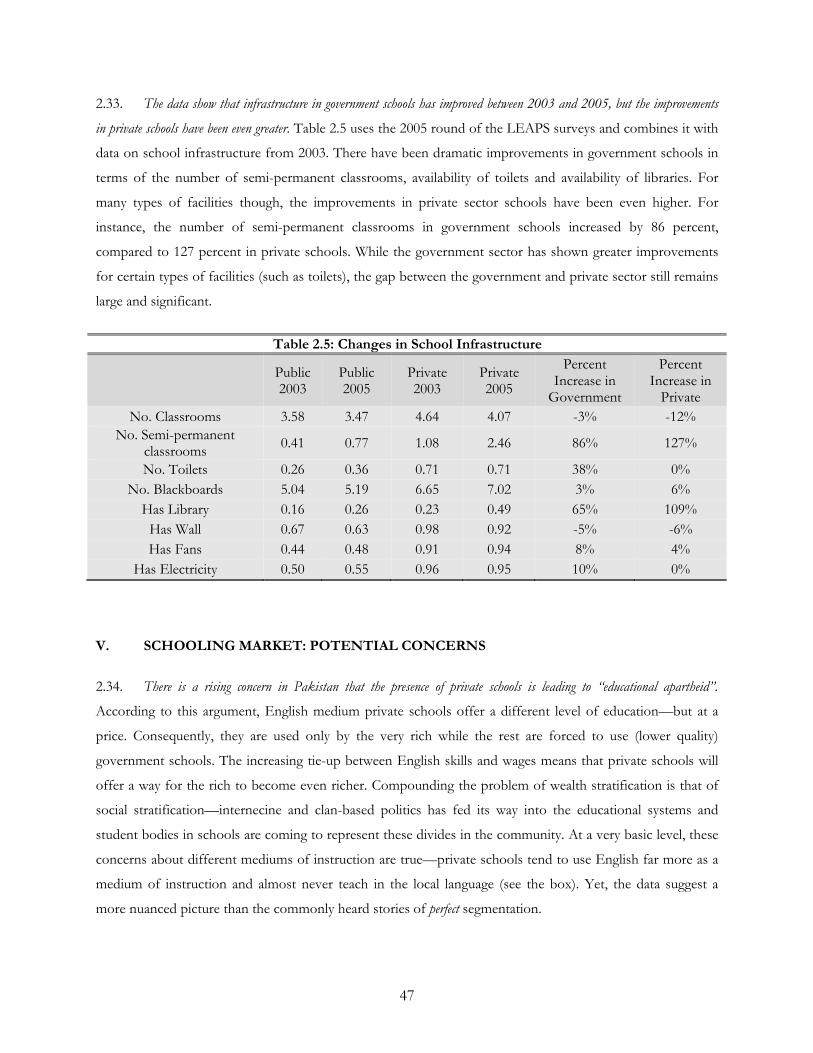
47
2.33. The data show that infrastructure in government schools has improved between 2003 and 2005, but the improvements
in private schools have been even greater. Table 2.5 uses the 2005 round of the LEAPS surveys and combines it with
data on school infrastructure from 2003. There have been dramatic improvements in government schools in
terms of the number of semi-permanent classrooms, availability of toilets and availability of libraries. For
many types of facilities though, the improvements in private sector schools have been even higher. For
instance, the number of semi-permanent classrooms in government schools increased by 86 percent,
compared to 127 percent in private schools. While the government sector has shown greater improvements
for certain types of facilities (such as toilets), the gap between the government and private sector still remains
large and significant.
Table 2.5: Changes in School Infrastructure
Public 2003
Public 2005
Private 2003
Private 2005
Percent Increase in Government
Percent Increase in Private
No. Classrooms 3.58 3.47 4.64 4.07 -3% -12%
No. Semi-permanent classrooms
0.41 0.77 1.08 2.46 86% 127%
No. Toilets 0.26 0.36 0.71 0.71 38% 0%
No. Blackboards 5.04 5.19 6.65 7.02 3% 6%
Has Library 0.16 0.26 0.23 0.49 65% 109%
Has Wall 0.67 0.63 0.98 0.92 -5% -6%
Has Fans 0.44 0.48 0.91 0.94 8% 4%
Has Electricity 0.50 0.55 0.96 0.95 10% 0%
V. SCHOOLING MARKET: POTENTIAL CONCERNS
2.34. There is a rising concern in Pakistan that the presence of private schools is leading to “educational apartheid”.
According to this argument, English medium private schools offer a different level of education—but at a
price. Consequently, they are used only by the very rich while the rest are forced to use (lower quality)
government schools. The increasing tie-up between English skills and wages means that private schools will
offer a way for the rich to become even richer. Compounding the problem of wealth stratification is that of
social stratification—internecine and clan-based politics has fed its way into the educational systems and
student bodies in schools are coming to represent these divides in the community. At a very basic level, these
concerns about different mediums of instruction are true—private schools tend to use English far more as a
medium of instruction and almost never teach in the local language (see the box). Yet, the data suggest a
more nuanced picture than the commonly heard stories of perfect segmentation.

48
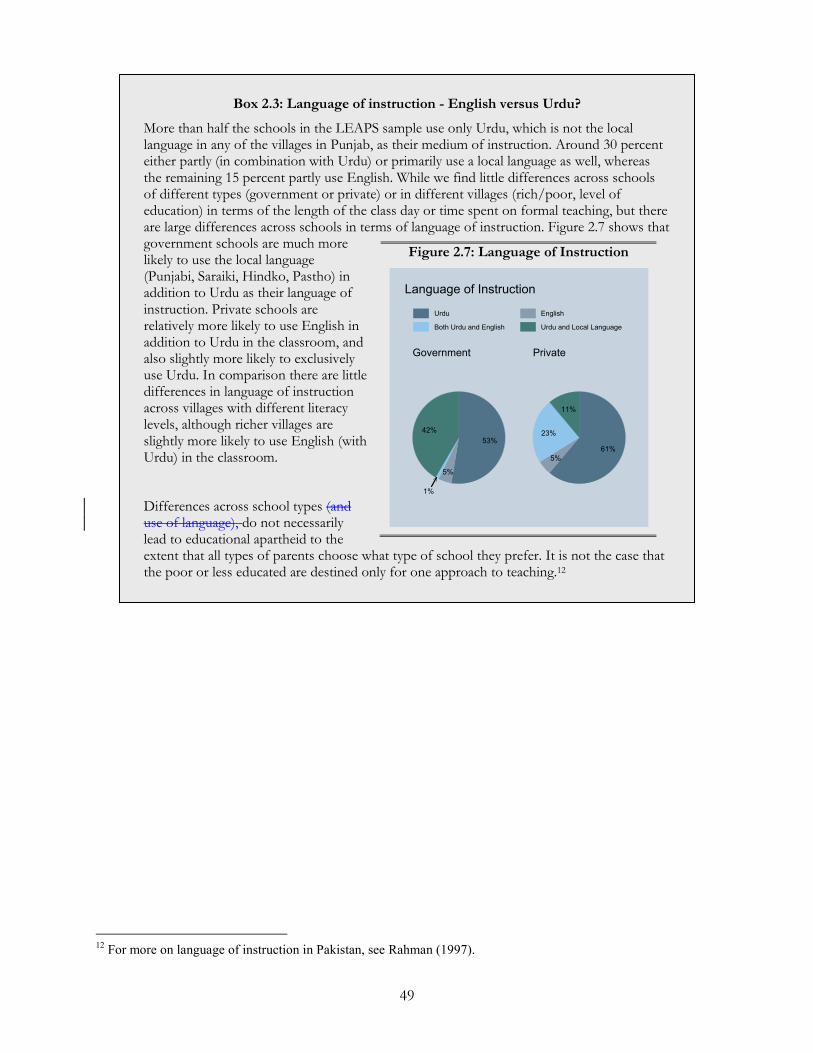
49
Box 2.3: Language of instruction - English versus Urdu?
More than half the schools in the LEAPS sample use only Urdu, which is not the local language in any of the villages in Punjab, as their medium of instruction. Around 30 percent either partly (in combination with Urdu) or primarily use a local language as well, whereas the remaining 15 percent partly use English. While we find little differences across schools of different types (government or private) or in different villages (rich/poor, level of education) in terms of the length of the class day or time spent on formal teaching, but there are large differences across schools in terms of language of instruction. Figure 2.7 shows that government schools are much more likely to use the local language (Punjabi, Saraiki, Hindko, Pastho) in addition to Urdu as their language of instruction. Private schools are relatively more likely to use English in addition to Urdu in the classroom, and also slightly more likely to exclusively use Urdu. In comparison there are little differences in language of instruction across villages with different literacy levels, although richer villages are slightly more likely to use English (with Urdu) in the classroom.
Differences across school types (and use of language), do not necessarily lead to educational apartheid to the extent that all types of parents choose what type of school they prefer. It is not the case that the poor or less educated are destined only for one approach to teaching.12
12 For more on language of instruction in Pakistan, see Rahman (1997).
Figure 2.7: Language of Instruction
53%
5%
1%
42%
61%
5%
23%
11%
Government Private
Urdu English
Both Urdu and English Urdu and Local Language
Language of Instruction
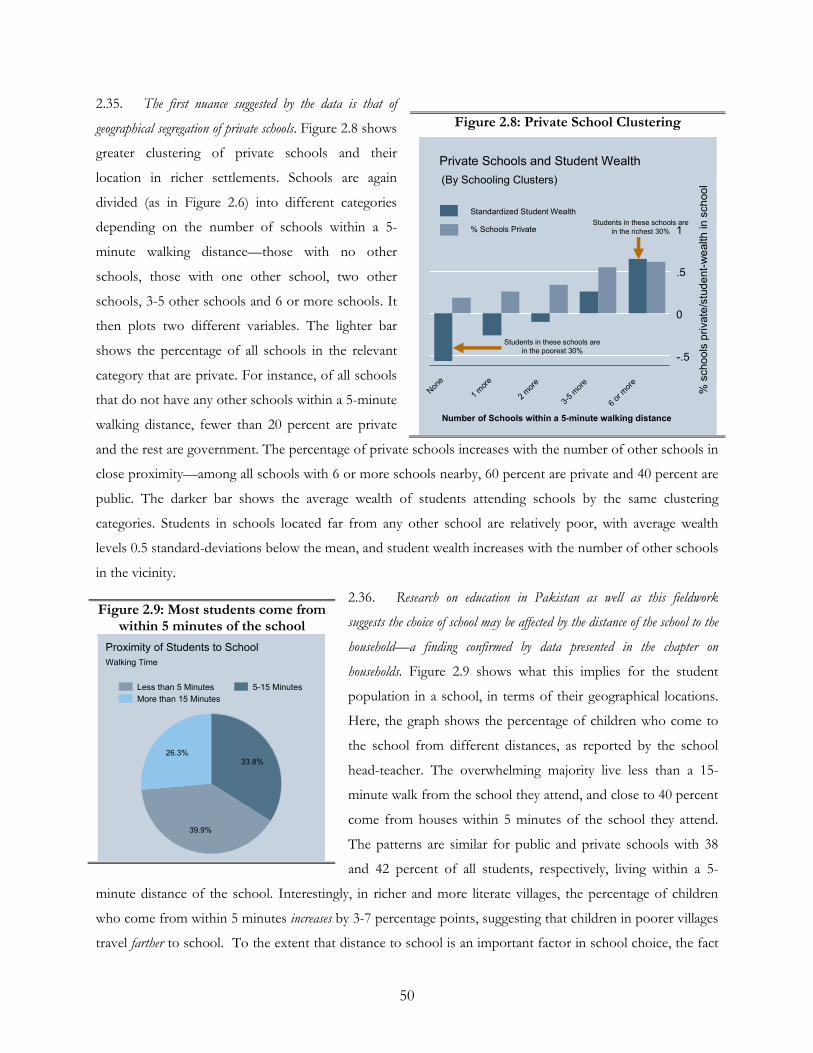
50
2.35. The first nuance suggested by the data is that of
geographical segregation of private schools. Figure 2.8 shows
greater clustering of private schools and their
location in richer settlements. Schools are again
divided (as in Figure 2.6) into different categories
depending on the number of schools within a 5-
minute walking distance—those with no other
schools, those with one other school, two other
schools, 3-5 other schools and 6 or more schools. It
then plots two different variables. The lighter bar
shows the percentage of all schools in the relevant
category that are private. For instance, of all schools
that do not have any other schools within a 5-minute
walking distance, fewer than 20 percent are private
and the rest are government. The percentage of private schools increases with the number of other schools in
close proximity—among all schools with 6 or more schools nearby, 60 percent are private and 40 percent are
public. The darker bar shows the average wealth of students attending schools by the same clustering
categories. Students in schools located far from any other school are relatively poor, with average wealth
levels 0.5 standard-deviations below the mean, and student wealth increases with the number of other schools
in the vicinity.
2.36. Research on education in Pakistan as well as this fieldwork
suggests the choice of school may be affected by the distance of the school to the
household—a finding confirmed by data presented in the chapter on
households. Figure 2.9 shows what this implies for the student
population in a school, in terms of their geographical locations.
Here, the graph shows the percentage of children who come to
the school from different distances, as reported by the school
head-teacher. The overwhelming majority live less than a 15-
minute walk from the school they attend, and close to 40 percent
come from houses within 5 minutes of the school they attend.
The patterns are similar for public and private schools with 38
and 42 percent of all students, respectively, living within a 5-
minute distance of the school. Interestingly, in richer and more literate villages, the percentage of children
who come from within 5 minutes increases by 3-7 percentage points, suggesting that children in poorer villages
travel farther to school. To the extent that distance to school is an important factor in school choice, the fact
Figure 2.8: Private School Clustering
Figure 2.9: Most students come from within 5 minutes of the school
-.5
0
.5
1
% s
cho
ols
pri
vate
/stu
de
nt-
we
alth
in s
ch
oo
l
Non
e
1 m
ore
2 m
ore
3-5
mor
e
6 or
mor
e
(By Schooling Clusters)
Private Schools and Student Wealth
Standardized Student Wealth
% Schools Private
Number of Schools within a 5-minute walking distance
Students in these schools are
in the poorest 30%
Students in these schools are
in the richest 30%
33.8%
39.9%
26.3%
Less than 5 Minutes 5-15 Minutes
More than 15 Minutes
Walking Time
Proximity of Students to School
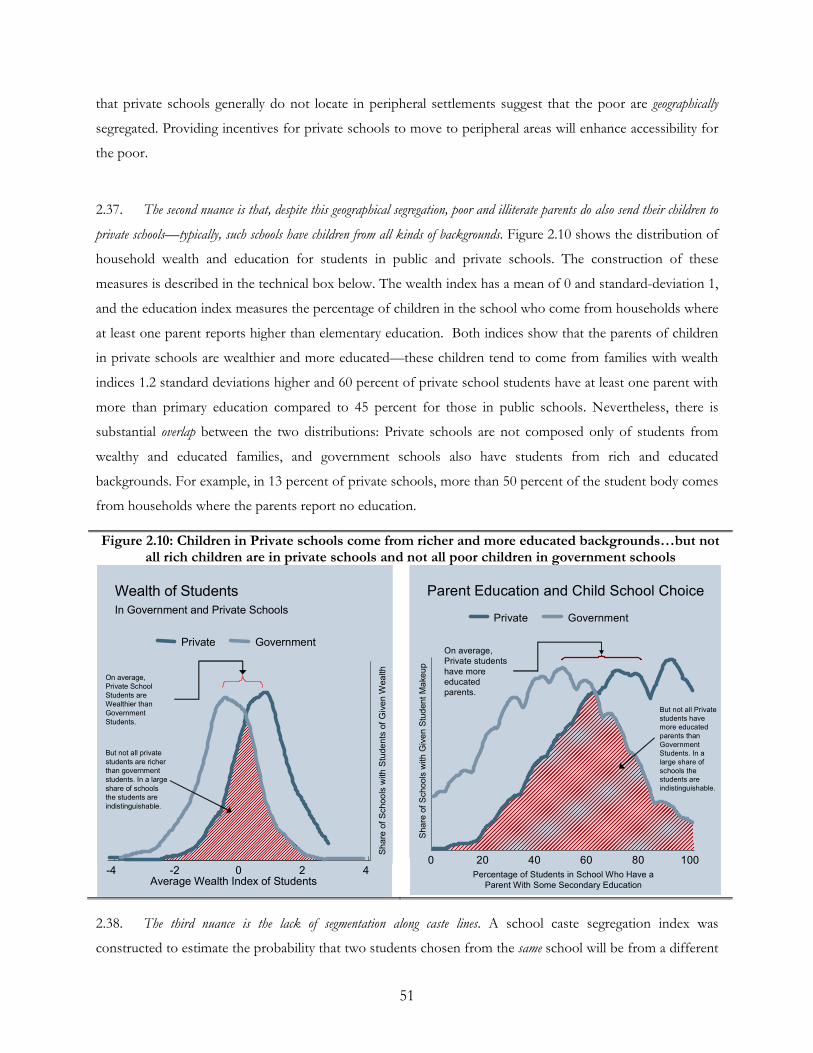
51
that private schools generally do not locate in peripheral settlements suggest that the poor are geographically
segregated. Providing incentives for private schools to move to peripheral areas will enhance accessibility for
the poor.
2.37. The second nuance is that, despite this geographical segregation, poor and illiterate parents do also send their children to
private schools—typically, such schools have children from all kinds of backgrounds. Figure 2.10 shows the distribution of
household wealth and education for students in public and private schools. The construction of these
measures is described in the technical box below. The wealth index has a mean of 0 and standard-deviation 1,
and the education index measures the percentage of children in the school who come from households where
at least one parent reports higher than elementary education. Both indices show that the parents of children
in private schools are wealthier and more educated—these children tend to come from families with wealth
indices 1.2 standard deviations higher and 60 percent of private school students have at least one parent with
more than primary education compared to 45 percent for those in public schools. Nevertheless, there is
substantial overlap between the two distributions: Private schools are not composed only of students from
wealthy and educated families, and government schools also have students from rich and educated
backgrounds. For example, in 13 percent of private schools, more than 50 percent of the student body comes
from households where the parents report no education.
Figure 2.10: Children in Private schools come from richer and more educated backgrounds…but not all rich children are in private schools and not all poor children in government schools
2.38. The third nuance is the lack of segmentation along caste lines. A school caste segregation index was
constructed to estimate the probability that two students chosen from the same school will be from a different
Sh
are
of
Sch
oo
ls w
ith
Stu
de
nts
of
Giv
en
Wea
lth
-4 -2 0 2 4Average Wealth Index of Students
Private Government
In Government and Private Schools
Wealth of Students
On average,
Private School
Students are
Wealthier than
Government
Students.
But not all private
students are richer
than government
students. In a large
share of schools
the students are
indistinguishable.
Sha
re o
f S
chools
with G
ive
n S
tud
ent
Ma
keu
p
0 20 40 60 80 100
Percentage of Students in School Who Have a
Parent With Some Secondary Education
Private Government
Parent Education and Child School Choice
On average,
Private students
have more
educated
parents.
But not all Private
students have
more educated
parents than
Government
Students. In a
large share of
schools the
students are
indistinguishable.
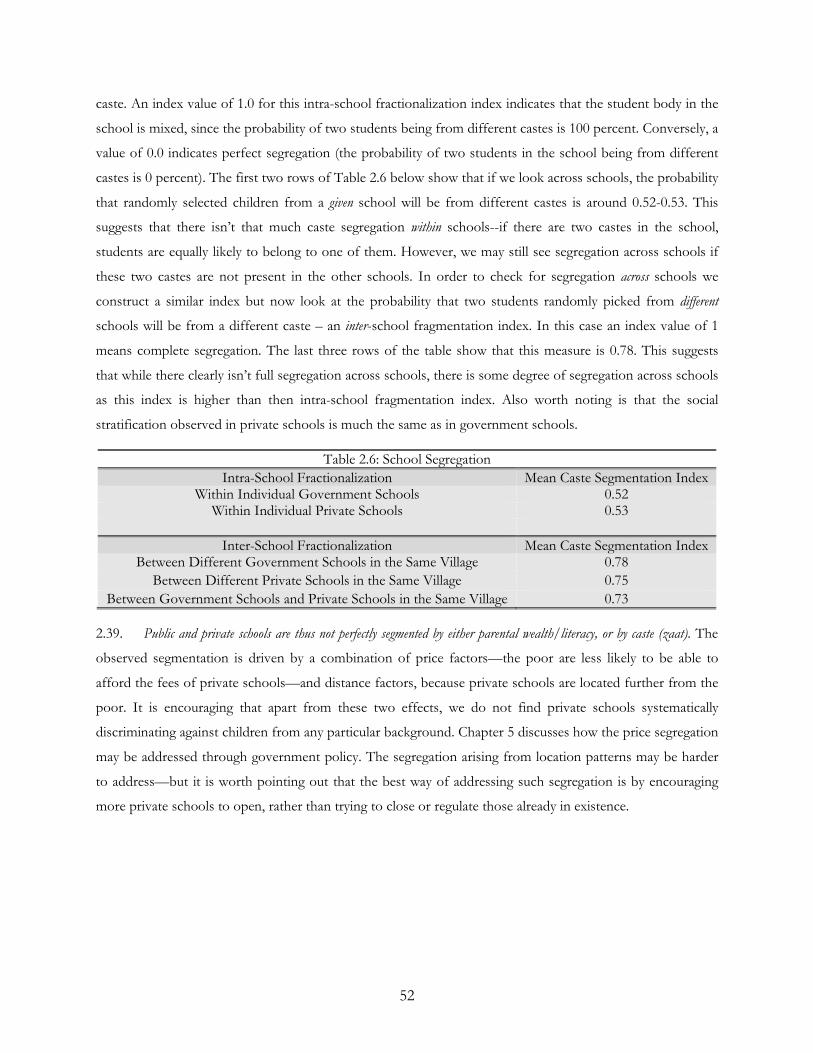
52
caste. An index value of 1.0 for this intra-school fractionalization index indicates that the student body in the
school is mixed, since the probability of two students being from different castes is 100 percent. Conversely, a
value of 0.0 indicates perfect segregation (the probability of two students in the school being from different
castes is 0 percent). The first two rows of Table 2.6 below show that if we look across schools, the probability
that randomly selected children from a given school will be from different castes is around 0.52-0.53. This
suggests that there isn’t that much caste segregation within schools--if there are two castes in the school,
students are equally likely to belong to one of them. However, we may still see segregation across schools if
these two castes are not present in the other schools. In order to check for segregation across schools we
construct a similar index but now look at the probability that two students randomly picked from different
schools will be from a different caste – an inter-school fragmentation index. In this case an index value of 1
means complete segregation. The last three rows of the table show that this measure is 0.78. This suggests
that while there clearly isn’t full segregation across schools, there is some degree of segregation across schools
as this index is higher than then intra-school fragmentation index. Also worth noting is that the social
stratification observed in private schools is much the same as in government schools.
Table 2.6: School Segregation
Intra-School Fractionalization Mean Caste Segmentation Index Within Individual Government Schools 0.52
Within Individual Private Schools 0.53
Inter-School Fractionalization Mean Caste Segmentation Index Between Different Government Schools in the Same Village 0.78
Between Different Private Schools in the Same Village 0.75
Between Government Schools and Private Schools in the Same Village 0.73
2.39. Public and private schools are thus not perfectly segmented by either parental wealth/literacy, or by caste (zaat). The
observed segmentation is driven by a combination of price factors—the poor are less likely to be able to
afford the fees of private schools—and distance factors, because private schools are located further from the
poor. It is encouraging that apart from these two effects, we do not find private schools systematically
discriminating against children from any particular background. Chapter 5 discusses how the price segregation
may be addressed through government policy. The segregation arising from location patterns may be harder
to address—but it is worth pointing out that the best way of addressing such segregation is by encouraging
more private schools to open, rather than trying to close or regulate those already in existence.
53
VI. DISCUSSION
2.40. This chapter highlights basic characteristics of public and private schools in the LEAPS project villages and how these
characteristics differ between schools in central clusters and schools located on settlement peripheries. It also examines claims
that private schools lead to social stratification, and finds little evidence of strong segregation along socio-
economic or caste lines. Private schools are almost always clustered in the main settlement while government
schools are present in the settlements as well at the village periphery. Three implications follow from these
location patterns. First, private school fees and profits are fairly low. The schools that report higher revenues
and profits also have a higher quality of learning. The cost to educate a child in the government sector is
twice that in the private sector. Factoring in differences in learning implies that the cost-per-percent in public
schools is three times that in private schools. Second, basic infrastructure in public and private schools
appears to be in place. Private schools do a somewhat better job of providing basic infrastructure than
government schools, which have some of the worst infrastructure. Third, there is evidence of segregation
arising from pricing and location patterns, but no evidence of discrimination against illiterate or poor parents,
or children from different castes. The discussion below suggests how these characteristics can be used to
inform a debate on what should be done about schools in the province.
Infrastructure— basic, add-ons, and extras
2.41. LEAPS project villages by and large report functional classrooms, reasonable access to blackboards
and manageable student-teacher ratios. The problem appears when we look at additional facilities, such as
Box 2.4: Socioeconomic indices Wealth Index
This index is constructed from data collected in a short survey administered in every school to a randomly selected group of 10 students in Class III (or all, if less than 10). Using ownership of different assets as reported by the students, we construct a single wealth index through principal component analysis. The index (with a mean of 0 and standard deviation of 1) is the first principal component and has a higher value for wealthier students. Education Index
This index is constructed using the fraction of children in a school with at least one parent who has some non-zero level of schooling (similar results obtain if we look at higher levels of parental education). Zaat Fragmentation Index
This index is a measure of the heterogeneity of castes within and between schools. A value of 1 means that all students are from different castes, while a value of 0 means that everyone is from the same caste. A further explanation of the index is presented in paragraph 2.38.
Nadia
Highlight
Nadia
Highlight
54
electricity, fans and toilets and even more so when we look at libraries and basic sports equipment. Three
important questions present a framework for the wider debate.
2.42. First, what should the infrastructure “package” for a school look like? Following the division in the chapter,
one could think of the “basics” (classrooms and blackboards) and “extras” such as fans, toilets, libraries and
transportation. There appears to be a widespread consensus that both the basic and some extra facilities (like
bathrooms) should be available in every school. Yet “extras” make schools a fun place for children, and
educators often suggest that simple additions that make learning “fun” also make children want to come to
school more regularly. What this really hinges on is whether we think of the decision to attend a school as a
parental choice, or partly, a choice of the child. The chapter on households shows that parents make very
conscious choices about which child to “push” through school, and which child to exert less effort on. The
fact that schools are boring means that those children whose parents do not push them to attend school will
likely not attend. In our survey, the reasons parents gave for children not attending school were sometimes
related to the child’s perceptions of school, rather than the opinions of the parents. Reasons for children
remaining out of school included reasons such as the child was “afraid of teacher” or “does not want to go to
school”.
2.43. Evidence shows that simple things that make schools more attractive lead to large gains in attendance, even without a
substantial change in the benefit-cost ratio for parents. For instance, an experimental school meal program in
Rajasthan carried out by the NGO Seva Mandir, dramatically increased enrollment although the cost of the
feeding program was much smaller than the wage losses incurred by parents when their children stopped
working to attend school. In a detailed evaluation, Ravallion and Wodon (2000) find similar effects in
Bangladesh—school meal programs led to large gains in attendance, but no decline in child labor. Recent
studies by the International Labor Organization (ILO) find that a large group of children are “idle”, in the
sense that they are neither in school, nor engaged in child-labor and the chapter on households shows similar
patterns for Pakistan. A recent evaluation of a program run by the organization Child Resources International
in Islamabad shows that “child-centered” teaching approaches help to improve attendance and test-scores
(Naseer and Patnam (2007)). Among primary-age children, the hours saved by not going to school for out-of-
school children are not spent working—they are spent playing. The fact that most out-of-school children are
“idle” suggests that increasing enrollment may not be that hard since it does not need to address the trade-off
between schooling and wages. Making schools “child-attractors” by putting in extra facilities, such as small
libraries could improve enrollments substantially.
2.44. Second, what is process by which decisions are made to renovate or put in place new infrastructure in public schools?
Under the Punjab Education Reform Program considerable funds were spent to provide and repair “missing
55
Box 2.5: Locating a school? Who decides?
In one of the sample villages, there are two government girls’ primary schools. One school was built in 1973 and the other was built in 1987. The government girls’ primary school is a little bit further from the main settlement, but still less than a 15-minute walk. There are three teachers and 35 students.
When we visited this school and talked to the teacher about the small number of students, she told us that this school was the first school in the village but the Nazim approved a new government girls’ primary school in the main village settlement instead of upgrading this old school. Parents now prefer to send their children to the newer school, especially when they are living in the main settlement.
The teacher told me that their school was in the fields and there is no boundary wall; sometimes they find dangerous animals in the school and two days ago, when she opened a cupboard there was a snake in it. The government is spending almost Rs.17500 every month on teachers’ salaries, which means it costs Rs.6000 per child per year.
I don’t understand why the government did not check before opening the new school if there is already a school near the “settlement” or in the “settlement”, and if there was, whether they should close or upgrade it when they built the new school.
—Contributed by Kashif
facilities”. The situation has improved for many schools since 2003, but improvements in private school
infrastructure were even greater during the same period, without any financial assistance from the government.
Not surprisingly, in recent interviews head-teachers expressed concern that there is no clear mechanism for
petitioning the education authorities to fulfill an infrastructure need. When such petitions are made, there is
often no response. Given that the condition of infrastructure varies dramatically across schools, there is a
clear need for a process to meet needs in a timely and targeted fashion, rather than by blanket provision. In
addition, the current stock of infrastructure requires maintenance. Communities are often implicated in the
improper use of school infrastructure. Maintenance is a critical issue that requires imaginative solutions.
Village level school locations: who decides?
2.45. Who should decide where to locate a school? The decision of where to place a government school becomes
far more complicated once private schools enter the picture and we recognize that there are multiple
settlements with differing population characteristics in the same village and there is a strong relationship
between distance and enrollment. The problem of access to schooling is illustrated in village after village by
the large variation within the same village— some schools have 2 teachers and 200 children and others have 8
teachers and 90 students. This huge variation reflects large cost differences in educating children in the
government sector, which can be as low as Rs.400 per child per year to as high as Rs.8000 per child per year.
56
2.46. Balancing the needs of a peripheral village settlement with a poor population and a main village settlement with a large
number of private schools is difficult. Government schools in peripheral settlements significantly improve equity in
access to schooling—the children attending these schools are usually from poorer families and are at risk of
bypassing education entirely without access to these schools. In main settlements, government schools
compete directly with private schools and there are several such schools with few students. Access here is not
an issue. The real question is what would happen to enrollments if these schools were shut down? The type
of data that is collected by the province cannot be used to inform such a decision since school codes used in
the Educational Management Information System (EMIS) do not allow easy mapping of schools to villages.
As incredible as this may sound, there is currently no easy way to identify the number of schools in every
village, which of course precludes going below this level to the settlement. The single exception is the recently
completed school census, which details all schools in the country, both public and private, and identifies them
by the village they are in. Ensuring access to these data would support a greater understanding .
2.47. An important first step would be to pull together data on the locations of schools and make them public so that
researchers and planners can come up with potential solutions with full access to the relevant information. Having such data
would make it easier to set up a process for setting up or closing down a school and deciding how teachers
could be relocated within schools in the same village. A central allocation of teachers to specific schools in a
village may be less efficient than allowing Village Education Committees to make these decisions taking into
account their specific environment. Again, within the Pakistani context and the existing structure of power
relations this may or may not work.
Should private school fees be regulated?
2.48. Regulating private school fees is a topic of regular discussion among policymakers. In some areas
such as Islamabad, measures have been taken to ensure that private schools are charging “appropriate” fees.
The argument for regulating prices can stem from one of two economic rationales: (a) either the firm (private
school) being regulated is a monopoly with excessive profits or (b) that lack of information on the part of
consumers leads to prices that do not reflect quality.
2.49. The results highlighted here from the schooling environment in Punjab villages suggest that justification for either of these
rationales is weak. Private schools are overwhelmingly located in school clusters and therefore behave in a
highly competitive manner. In fact, the only potential monopolies in these environments are government
schools located outside the main settlement where children have no other choice. Consequently, private
school fees are relatively low and profits roughly correspond to the monthly wage of a private school teacher.
57
This is precisely the opportunity cost of the private school’s head-teacher. Finally the considerable variation
in private school fees suggests that fees respond to quality. A school with average test scores (across all three
tests) charges Rs.1000 per year; a school with test scores 2 standard-deviations above the mean charges
Rs.l800 per year. Some private schools are more expensive because they are better.
2.50. In such an educational market attempts to “control” or regulate prices will result in compensating action by private
schools. For instance, capping the prices that private schools can charge implies that those providing quality
levels above that justified by the price will either lower their quality or shut down. Undoubtedly, there may be
some private schools where profits are not excessively high, or prices are above those justified by the quality
of learning, but cracking down on a few such schools could well impose a heavy regulatory burden on the
rest. Instead, given that there may still be a concern that parents are not adequately informed about school
quality, an alternate approach would be to foster competition between schools through standardized testing
and the provision of report cards. The LEAPS project initiated such a scheme and the initial results of the
randomized intervention appear quite positive: Providing information on the relative performance of schools
to parents induced greater competition between schools and raised their investments, leading to
improvements in learning outcomes for the average child, and even more so for those who started off at
lower levels of learning.
Social costs and private schools
2.51. Consider the following arguments:
“Governments should get out of the provision of education and focus only on its financing. Figure 2.14 is the reason—if the cost-per-percent in public schools is three times as high as in private schools, it is much cheaper to let the money follow the child by providing vouchers and letting children decide where to go.”
And,
“Private schools can never provide education to the poor, because they are interested only in making profits. Look at Figure 2.7. It is clear that private schools locate only in the richer settlements of the village, and where government schools are already present. If government schools are shut down, how will poor children in peripheral settlements get access to schooling, which is their constitutional right?”
2.52. This chapter shows that both statements are correct. Costs of learning are far lower in private
schools and their fees are set in a competitive fashion since they are located in schooling clusters. The
downside of these location patterns is that private schools are seldom found in peripheral settlements where
households are poorer. Despite criticisms, the government is delivering education in an equitable manner.
Not only are basic infrastructure and student-teacher ratios similar in rich and poor villages, but government
schools are often the only access to education for children outside the main settlements. Data from the
58
National Education Census (2005) confirm that these patterns hold for the entire country—there are more
government schools per capita in poorer compared to richer villages.
2.53. The correct policy (or “public-private partnership”) would seriously consider the spatial distribution of the population in
a village and the access to schooling. For instance, vouchers may leave a lot of children out of school if they are
insufficient to cover the cost of educating children in peripheral areas. Alternatively, where private schools are
already operational, vouchers may make a lot of sense given the dramatic differences in cost-per-percent
across public and private schools.
2.54. What is also clear is that the main reason for these large cost differences between public and private schools is the
compensation of teachers. The wage-bill in private schools is less than one- quarter of that in government schools;
controlling costs thus has everything to do with limiting the wage bill and restructuring teacher compensation.
The next chapter turns to this difficult topic.
59
Chapter 3: Do Teachers Teach?
3.1 Improving teacher quality and performance has been central to most educational reform efforts in the world. A decade
of research on learning outcomes confirms that teachers are the most important school-based input: a school
with leaking roofs, no textbooks, and uninvolved parents can still produce good learning outcomes for
students if the teacher is motivated and committed.
3.2 A close look at teacher characteristics and compensation reveals dramatic differences between government and private
schools: A teacher in a public school is absent one-fifth of the time and has students that perform very poorly
but still earns 5 times more than a teacher in a private school who is present nearly every day and has students
that perform very well. One implication may be that the educational system would benefit if this government
teacher were to stay at home, pocket 85 percent of his salary and use the other 15 percent to pay a teacher in
the private sector to take his/her place. This chapter shows that such compensation schemes may still have
benefits if used appropriately. The chapter analyzes why and how government and private compensation
schemes are so different and suggest ways to build on the strengths of both to improve the overall quality of
education.
3.3 Comparing how the private and public sectors rewards teachers offers insight into what factors matter in the
“production” of education. In a healthy education marketplace private sector wages reflect productivity (more
effective teachers are paid higher salaries) and outside opportunities (good teachers have multiple job
opportunities). The report examines teacher demographic and educational characteristics in both sectors,
incentives in the form of compensation policy and the system of monitoring, as well as the effect of these
incentives on teacher effort as measured by absenteeism and student outcomes as measured by test scores.
3.4 The focus of the LEAPS survey on villages with both private and public schools is of particular
value, since we are able to compare teacher demographic profiles, characteristics and compensation
differences within the same village and can appropriately correct for geographical effects in the analysis.
60
3.5 The data suggest that private and public schools exist in different and separate systems. On most dimensions of
interest—teacher profiles, competence, effort and rewards—a series of the public-private distinctions
dominate the landscape:
• Teacher selection and hiring practices differ. The government sector hires teachers based on education and
training qualifications. Contrary to views that richer villages or schools with richer children receive
the best teachers, the data show government teachers are equitably distributed across villages and
schools. The private sector hires primarily locally born and resident young women, most of whom do
not have a post-secondary degree or formal teacher training.
• Teachers in private schools are paid a fraction of the salary of public school teachers earn. After controlling for
observed differences, government teachers are paid between 3 and 4 times as much as their private
counterparts. But the story is not just restricted to level differences in salary; the reward and penalty
structure of teacher pay is radically different in the two sectors as well.
• Government salaries are largely determined by experience, education and training. Private sector compensation
schemes are more complex—not only do they reward teachers for effort and performance, they also
respond to the outside opportunities available to the teacher. Those who are likely to be paid higher in
jobs outside the teaching sector get higher salaries
• Once hired, accountability for teachers in government schools is limited. Job retention is used to leverage teacher
performance once they are hired, but teacher turnover is very low and most of it happens as a result
of routine transfers, not firings for absenteeism. Turnover in the private sector is high and
frequent—close to 25 percent of teachers are replaced every year. This frequent turnover may hurt
the private sector, but it also allows constant replenishment of the teaching workforce and pruning of
non-performing teachers.
3.6 The government system rewards inputs and the private sector rewards performance. The private sector responds to
local conditions, the government sector does not. Combining these two systems presents an opportunity for
public-private partnerships to enhance educational outcomes. There may be better solutions even under the
current compensation scheme followed in government schools. A series of facts and findings based on
special purpose data collected through the LEAPS project is used to frame the subsequent discussion.
61
Box 3.1: What we know about teachers
Studies on teacher performance in the United States and countries around the world systematically show that teachers matter.13 For most other schooling inputs (infrastructure, student-teacher ratios, direct funding to schools, provision of textbooks and others), careful empirical work finds little consistent evidence of a link with student achievement. In contrast, there are some teachers whose children learn systematically more; others whose children learn systematically less. However, while it has been easier to show that “teachers matter”, it has been very difficult to pinpoint what it is about teachers that matter—typically, experience matters only in the first year of teaching and qualifications and training have very little effect. These findings have led researchers to hypothesize that intrinsic motivation and aptitude for teaching are the most important determinants of teacher effectiveness. The findings from the United States and other rich countries may or may not hold for countries like Pakistan. The problem is that because educational systems in the richer countries already ensure that only highly educated and trained teachers join the workforce and already have well-designed monitoring mechanisms to ensure that teachers show up for work, the differences between different teachers are small.
The differences among teachers qualifications and work ethic in Pakistan and South-Asia is generally large—there may be teachers with only secondary education and others with a masters degree; there are some teachers who don’t show up for work and some who are present every day. The literature on teachers in South Asia is small. Kingdon and Teal (2005) compare teacher incentives and student outcomes in 30 private and government schools (172 teachers) in one Indian study. Murgai and Pritchett (2006) cite secondary data and use household survey data to look at teacher wages in both sectors, arriving at conclusions very similar to those presented here. In Pakistan, the work on teachers has typically been conducted in education departments. Recent “experiments” from India on the importance of teacher incentives and monitoring is discussed later in the report. However, while this strand of research has led to many interesting studies on teacher development and professionalism, there is no evidence to link teaching inputs and student outcomes in Pakistan.14 Part of the problem is data. Publicly available data sets exist on public schools such as provincial Educational Management Information Systems (EMIS) and one-off data sets on private education by the Federal Bureau of Statistics (FBS). But most research on education comes from household data sets (Pakistan Integrated Household Surveys conducted by the FBS) which have little usable information on teachers. Labor force surveys have not been exploited in any depth. However, the lack of data has not hampered the introduction of “reforms” and changes in the teaching sector that have yet to be evaluated for their impact on student outcomes. Examples include creating a cadre of English language teachers, the introduction of contract teachers, and large-scale, province-wide teacher training programs conducted by the University of Education. Numerous smaller programs conducted by various NGOs and donor initiatives that have not been formally analyzed. Understanding how government teachers function, what reforms are necessary, and where to go from here requires a detailed study of the existing system of teaching linked to student outcomes.
13 See Hoxby (1996), Glewwe, Ilias and Kremer (2003),Vegas (2005) and references therein. 14 For an example of Aga Khan University’s work, see http://www.aku.edu/ied/raps/policydialogue/dialoguekeyedu/discussionreports/report1/index.shtml
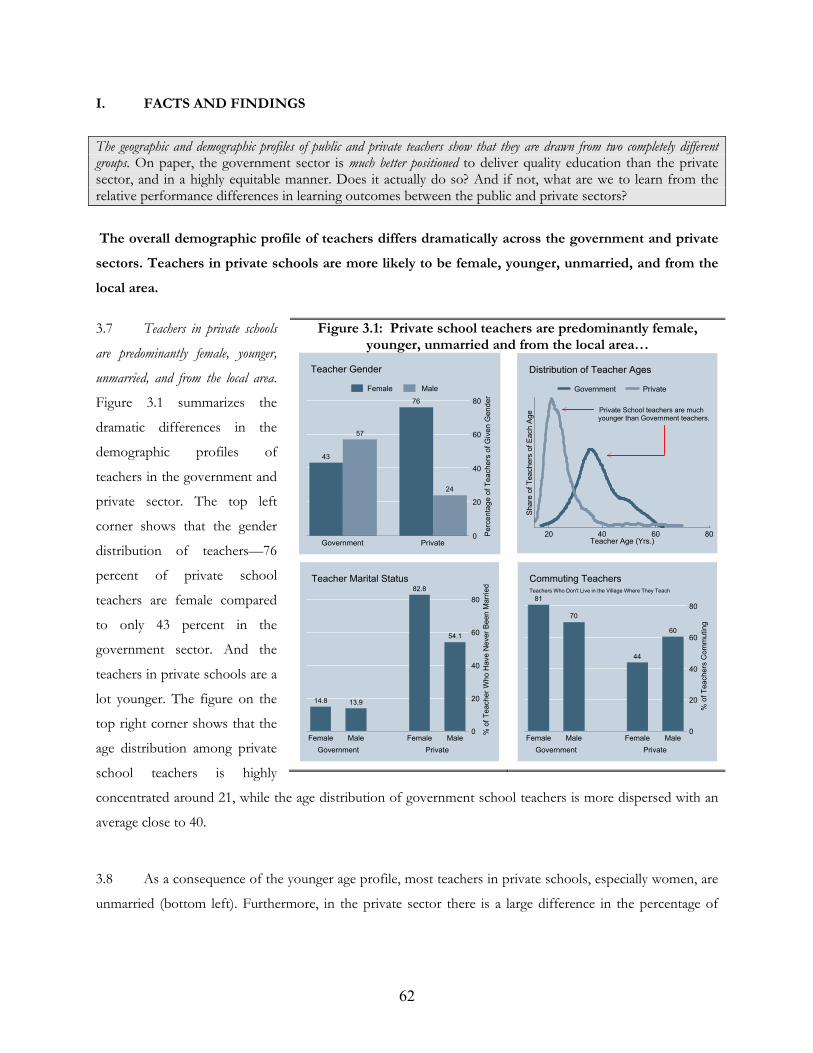
62
I. FACTS AND FINDINGS
The geographic and demographic profiles of public and private teachers show that they are drawn from two completely different groups. On paper, the government sector is much better positioned to deliver quality education than the private sector, and in a highly equitable manner. Does it actually do so? And if not, what are we to learn from the relative performance differences in learning outcomes between the public and private sectors?
The overall demographic profile of teachers differs dramatically across the government and private
sectors. Teachers in private schools are more likely to be female, younger, unmarried, and from the
local area.
3.7 Teachers in private schools
are predominantly female, younger,
unmarried, and from the local area.
Figure 3.1 summarizes the
dramatic differences in the
demographic profiles of
teachers in the government and
private sector. The top left
corner shows that the gender
distribution of teachers—76
percent of private school
teachers are female compared
to only 43 percent in the
government sector. And the
teachers in private schools are a
lot younger. The figure on the
top right corner shows that the
age distribution among private
school teachers is highly
concentrated around 21, while the age distribution of government school teachers is more dispersed with an
average close to 40.
3.8 As a consequence of the younger age profile, most teachers in private schools, especially women, are
unmarried (bottom left). Furthermore, in the private sector there is a large difference in the percentage of
Figure 3.1: Private school teachers are predominantly female, younger, unmarried and from the local area…
43
57
76
24
0
20
40
60
80
Pe
rce
nta
ge
of T
ea
ch
ers
of G
ive
n G
en
de
r
Government Private
Teacher Gender
Female Male
Private School teachers are muchyounger than Government teachers.
Share
of T
eachers
of E
ach A
ge
20 40 60 80Teacher Age (Yrs.)
Government Private
Distribution of Teacher Ages
14.8 13.9
82.8
54.1
0
20
40
60
80
% o
f T
eacher
Who H
ave N
ever
Been M
arr
ied
Government Private
Female Male Female Male
Teacher Marital Status
81
70
44
60
0
20
40
60
80
% o
f T
eachers
Com
muting
Government Private
Female Male Female Male
Teachers Who Don't Live in the Village Where They Teach
Commuting Teachers
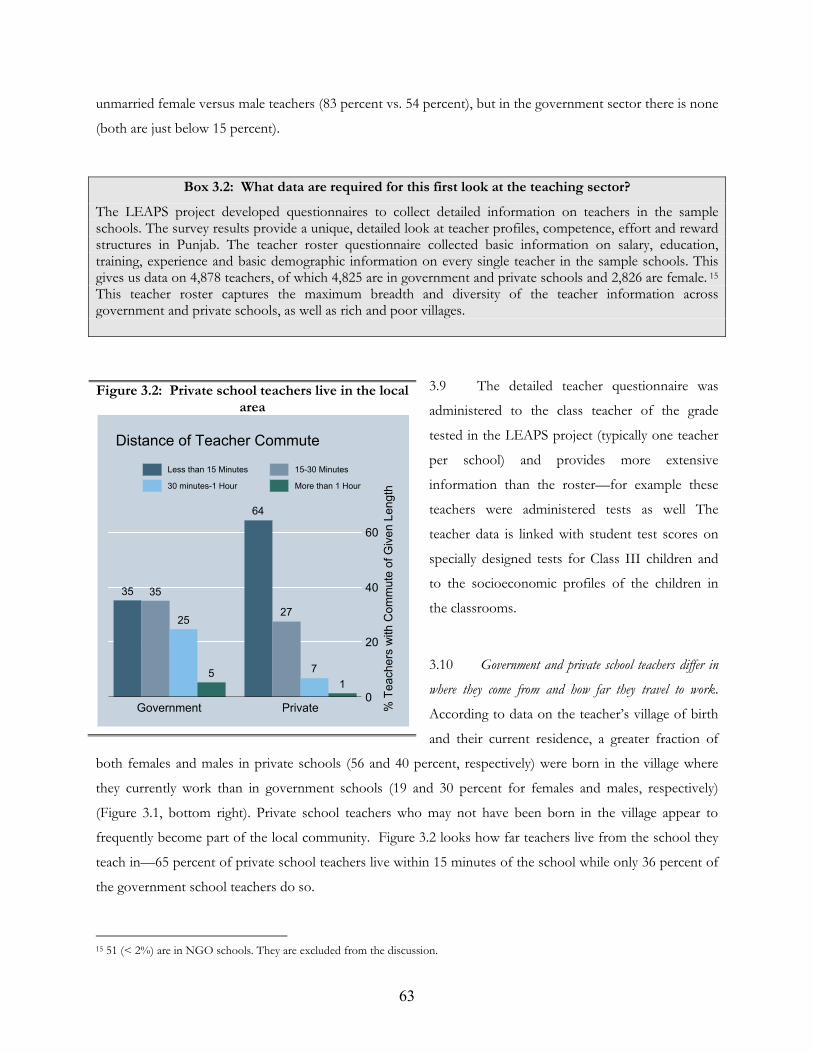
63
unmarried female versus male teachers (83 percent vs. 54 percent), but in the government sector there is none
(both are just below 15 percent).
Box 3.2: What data are required for this first look at the teaching sector?
The LEAPS project developed questionnaires to collect detailed information on teachers in the sample schools. The survey results provide a unique, detailed look at teacher profiles, competence, effort and reward structures in Punjab. The teacher roster questionnaire collected basic information on salary, education, training, experience and basic demographic information on every single teacher in the sample schools. This gives us data on 4,878 teachers, of which 4,825 are in government and private schools and 2,826 are female. 15 This teacher roster captures the maximum breadth and diversity of the teacher information across government and private schools, as well as rich and poor villages.
3.9 The detailed teacher questionnaire was
administered to the class teacher of the grade
tested in the LEAPS project (typically one teacher
per school) and provides more extensive
information than the roster—for example these
teachers were administered tests as well The
teacher data is linked with student test scores on
specially designed tests for Class III children and
to the socioeconomic profiles of the children in
the classrooms.
3.10 Government and private school teachers differ in
where they come from and how far they travel to work.
According to data on the teacher’s village of birth
and their current residence, a greater fraction of
both females and males in private schools (56 and 40 percent, respectively) were born in the village where
they currently work than in government schools (19 and 30 percent for females and males, respectively)
(Figure 3.1, bottom right). Private school teachers who may not have been born in the village appear to
frequently become part of the local community. Figure 3.2 looks how far teachers live from the school they
teach in—65 percent of private school teachers live within 15 minutes of the school while only 36 percent of
the government school teachers do so.
15 51 (< 2%) are in NGO schools. They are excluded from the discussion.
Figure 3.2: Private school teachers live in the local area
35 35
25
5
64
27
7
1
0
20
40
60
% T
ea
ch
ers
with
Co
mm
ute
of G
ive
n L
en
gth
Government Private
Distance of Teacher Commute
Less than 15 Minutes 15-30 Minutes
30 minutes-1 Hour More than 1 Hour
64
3.11 Both measures of “local hiring” (village of birth and current residence), increase dramatically with village literacy. The
percentage of local teachers by place of birth increases from 28 percent for the least literate villages to 48
percent for the most literate. The difference is even larger if we look only at private schools: 39 percent of
teachers are of local origin in the least literate villages while 66 percent are of local origin in the most literate
village. The same pattern also emerges when we look at the distance traveled to school by teachers. The
percentage of teachers who live within 15 minutes of the school increases from 38 to 60 percent moving
from the least to the most literate villages.
3.12 In summary the use of local teachers in private schools increases dramatically as the supply in the village—measured
through village literacy—increases. The average teacher in a private school is a young, unmarried female teacher
who is very likely born in the village where she is teaching and lives close to school. Teachers in government
schools are older, married males who were neither born locally nor live locally. Furthermore, for private
schools, the use of locally resident teachers increases dramatically as the supply in the village—measured
through village literacy—increases; there is some evidence of an increase in government schools as well, but
the difference is smaller.
On the basis of observed characteristics, government school teachers look much better qualified.
They are more educated, better trained, and have more experience. They are also paid a lot more
than their counterparts in the private sector.
3.13 Government teachers are more educated. The government sector follows a strict and consistent hiring policy
for teachers. A large fraction of government teachers is highly educated—19 percent have a master’s degree
(MA) and another 26 percent hold a bachelor’s degree (BA). In contrast, only 4 percent of private school
teachers hold a master’s degree, and 19 percent report a bachelor’s degree (Figure 3.3, top left). The male-
female differential in educational attainment in the government sector is also less pronounced than that in the
private sector: 38 percent of female teachers hold at least a BA compared to 51 percent for male teachers; the
equivalent numbers for the private sector are 17 and 39 percent.
3.14 The differences in education within the government sector stem largely from different age cohorts. Over time, the
educational qualifications required for joining the government teaching cadre has increased, so that younger
and newly hired teachers are more educated—in the latest wave of teachers hired on a contractual basis, more
than 93 percent reported a bachelor’s or higher degree. The lowest educated teachers in the government
sector are usually the oldest—matriculates for instance, report a median age of 40 compared to 35 years for
those with a bachelor’s degree.
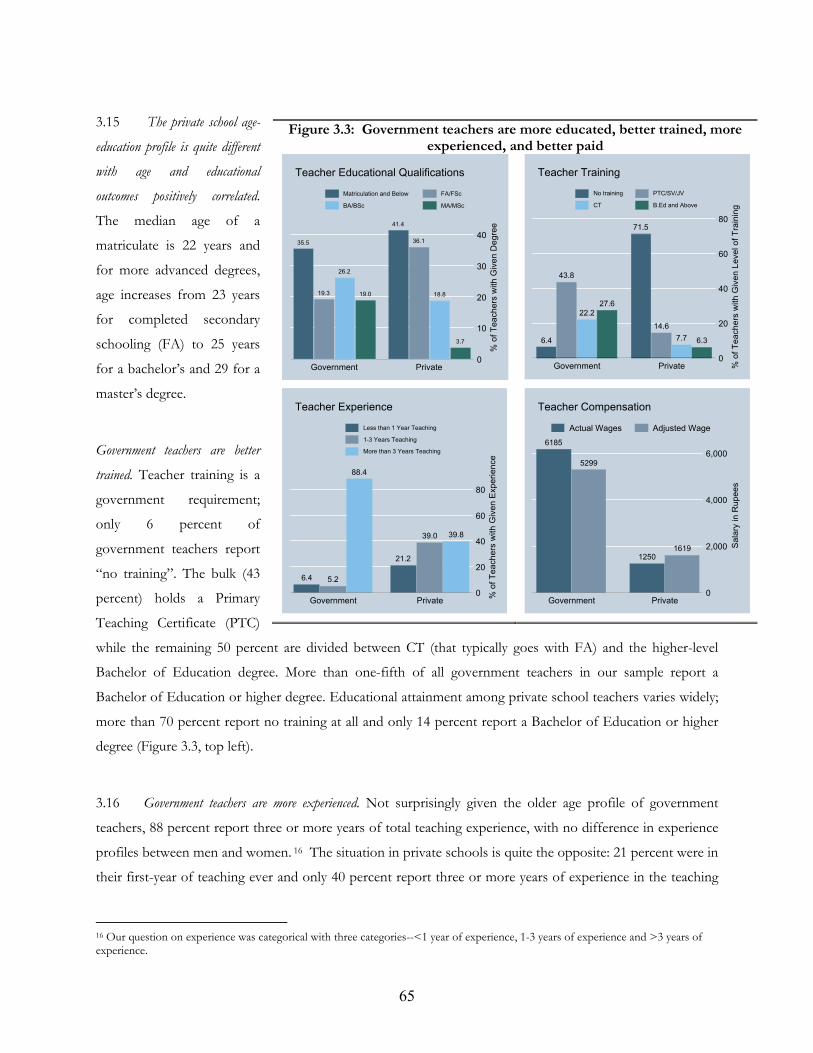
65
3.15 The private school age-
education profile is quite different
with age and educational
outcomes positively correlated.
The median age of a
matriculate is 22 years and
for more advanced degrees,
age increases from 23 years
for completed secondary
schooling (FA) to 25 years
for a bachelor’s and 29 for a
master’s degree.
Government teachers are better
trained. Teacher training is a
government requirement;
only 6 percent of
government teachers report
“no training”. The bulk (43
percent) holds a Primary
Teaching Certificate (PTC)
while the remaining 50 percent are divided between CT (that typically goes with FA) and the higher-level
Bachelor of Education degree. More than one-fifth of all government teachers in our sample report a
Bachelor of Education or higher degree. Educational attainment among private school teachers varies widely;
more than 70 percent report no training at all and only 14 percent report a Bachelor of Education or higher
degree (Figure 3.3, top left).
3.16 Government teachers are more experienced. Not surprisingly given the older age profile of government
teachers, 88 percent report three or more years of total teaching experience, with no difference in experience
profiles between men and women. 16 The situation in private schools is quite the opposite: 21 percent were in
their first-year of teaching ever and only 40 percent report three or more years of experience in the teaching
16 Our question on experience was categorical with three categories--<1 year of experience, 1-3 years of experience and >3 years of experience.
Figure 3.3: Government teachers are more educated, better trained, more experienced, and better paid
35.5
19.3
26.2
19.0
41.4
36.1
18.8
3.7
0
10
20
30
40
% o
f T
ea
ch
ers
with
Giv
en
De
gre
e
Government Private
Teacher Educational Qualifications
Matriculation and Below FA/FSc
BA/BSc MA/MSc
6.4
43.8
22.2
27.6
71.5
14.6
7.7 6.3
0
20
40
60
80
% o
f T
ea
ch
ers
with
Giv
en
Le
ve
l o
f T
rain
ing
Government Private
Teacher Training
No training PTC/SV/JV
CT B.Ed and Above
6.4 5.2
88.4
21.2
39.0 39.8
0
20
40
60
80%
of
Te
ach
ers
with
Giv
en
Exp
eri
en
ce
Government Private
Teacher Experience
Less than 1 Year Teaching
1-3 Years Teaching
More than 3 Years Teaching
6185
5299
12501619
0
2,000
4,000
6,000
Sa
lary
in
Ru
pe
es
Government Private
Teacher Compensation
Actual Wages Adjusted Wage
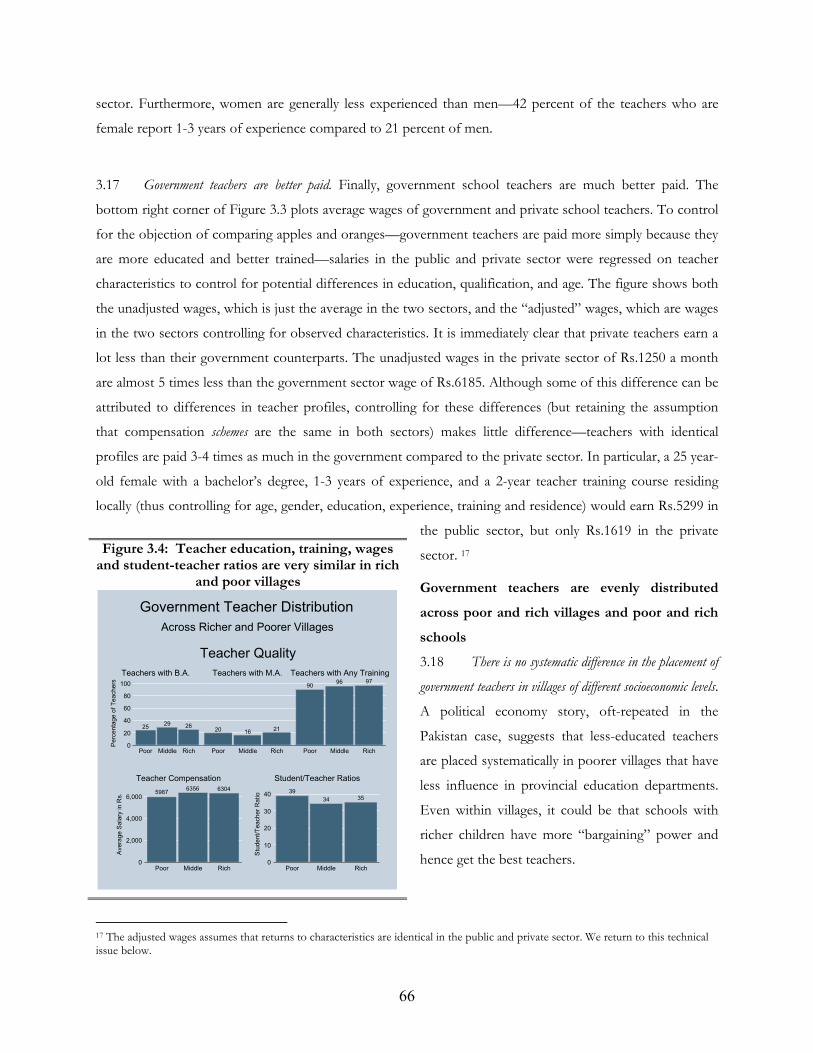
66
sector. Furthermore, women are generally less experienced than men—42 percent of the teachers who are
female report 1-3 years of experience compared to 21 percent of men.
3.17 Government teachers are better paid. Finally, government school teachers are much better paid. The
bottom right corner of Figure 3.3 plots average wages of government and private school teachers. To control
for the objection of comparing apples and oranges—government teachers are paid more simply because they
are more educated and better trained—salaries in the public and private sector were regressed on teacher
characteristics to control for potential differences in education, qualification, and age. The figure shows both
the unadjusted wages, which is just the average in the two sectors, and the “adjusted” wages, which are wages
in the two sectors controlling for observed characteristics. It is immediately clear that private teachers earn a
lot less than their government counterparts. The unadjusted wages in the private sector of Rs.1250 a month
are almost 5 times less than the government sector wage of Rs.6185. Although some of this difference can be
attributed to differences in teacher profiles, controlling for these differences (but retaining the assumption
that compensation schemes are the same in both sectors) makes little difference—teachers with identical
profiles are paid 3-4 times as much in the government compared to the private sector. In particular, a 25 year-
old female with a bachelor’s degree, 1-3 years of experience, and a 2-year teacher training course residing
locally (thus controlling for age, gender, education, experience, training and residence) would earn Rs.5299 in
the public sector, but only Rs.1619 in the private
sector. 17
Government teachers are evenly distributed
across poor and rich villages and poor and rich
schools
3.18 There is no systematic difference in the placement of
government teachers in villages of different socioeconomic levels.
A political economy story, oft-repeated in the
Pakistan case, suggests that less-educated teachers
are placed systematically in poorer villages that have
less influence in provincial education departments.
Even within villages, it could be that schools with
richer children have more “bargaining” power and
hence get the best teachers.
17 The adjusted wages assumes that returns to characteristics are identical in the public and private sector. We return to this technical issue below.
Figure 3.4: Teacher education, training, wages and student-teacher ratios are very similar in rich
and poor villages
2529 26
0
20
40
60
80
100
Perc
enta
ge o
f T
eachers
Poor Middle Rich
Teachers with B.A.
20 16 21
Poor Middle Rich
Teachers with M.A.
9096 97
Poor Middle Rich
Teachers with Any Training
Teacher Quality
59876356 6304
0
2,000
4,000
6,000
Avera
ge S
ala
ry in R
s.
Poor Middle Rich
Teacher Compensation
39
34 35
0
10
20
30
40
Stu
dent/T
eacher
Ratio
Poor Middle Rich
Student/Teacher Ratios
Across Richer and Poorer Villages
Government Teacher Distribution
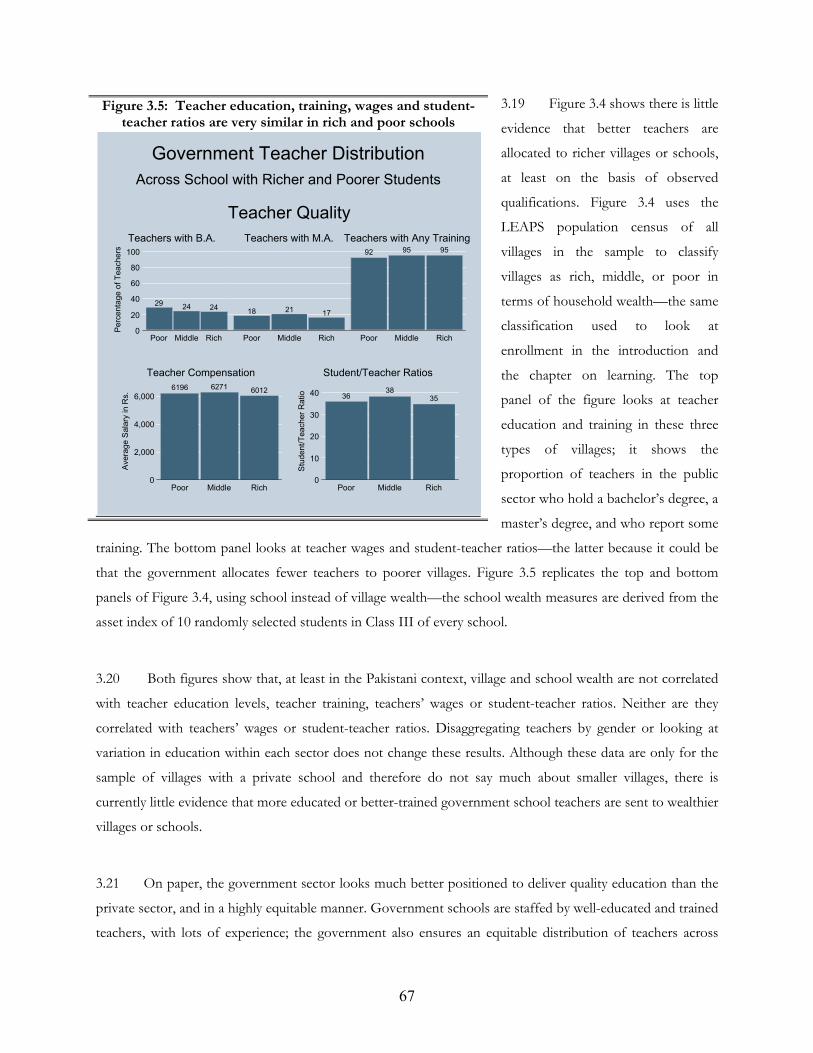
67
3.19 Figure 3.4 shows there is little
evidence that better teachers are
allocated to richer villages or schools,
at least on the basis of observed
qualifications. Figure 3.4 uses the
LEAPS population census of all
villages in the sample to classify
villages as rich, middle, or poor in
terms of household wealth—the same
classification used to look at
enrollment in the introduction and
the chapter on learning. The top
panel of the figure looks at teacher
education and training in these three
types of villages; it shows the
proportion of teachers in the public
sector who hold a bachelor’s degree, a
master’s degree, and who report some
training. The bottom panel looks at teacher wages and student-teacher ratios—the latter because it could be
that the government allocates fewer teachers to poorer villages. Figure 3.5 replicates the top and bottom
panels of Figure 3.4, using school instead of village wealth—the school wealth measures are derived from the
asset index of 10 randomly selected students in Class III of every school.
3.20 Both figures show that, at least in the Pakistani context, village and school wealth are not correlated
with teacher education levels, teacher training, teachers’ wages or student-teacher ratios. Neither are they
correlated with teachers’ wages or student-teacher ratios. Disaggregating teachers by gender or looking at
variation in education within each sector does not change these results. Although these data are only for the
sample of villages with a private school and therefore do not say much about smaller villages, there is
currently little evidence that more educated or better-trained government school teachers are sent to wealthier
villages or schools.
3.21 On paper, the government sector looks much better positioned to deliver quality education than the
private sector, and in a highly equitable manner. Government schools are staffed by well-educated and trained
teachers, with lots of experience; the government also ensures an equitable distribution of teachers across
Figure 3.5: Teacher education, training, wages and student-teacher ratios are very similar in rich and poor schools
29 24 24
0
20
40
60
80
100
Perc
enta
ge o
f T
eachers
Poor Middle Rich
Teachers with B.A.
18 21 17
Poor Middle Rich
Teachers with M.A.
92 95 95
Poor Middle Rich
Teachers with Any Training
Teacher Quality
6196 6271 6012
0
2,000
4,000
6,000
Avera
ge S
ala
ry in R
s.
Poor Middle Rich
Teacher Compensation
3638
35
0
10
20
30
40
Stu
dent/T
eacher
Ratio
Poor Middle Rich
Student/Teacher Ratios
Across School with Richer and Poorer Students
Government Teacher Distribution
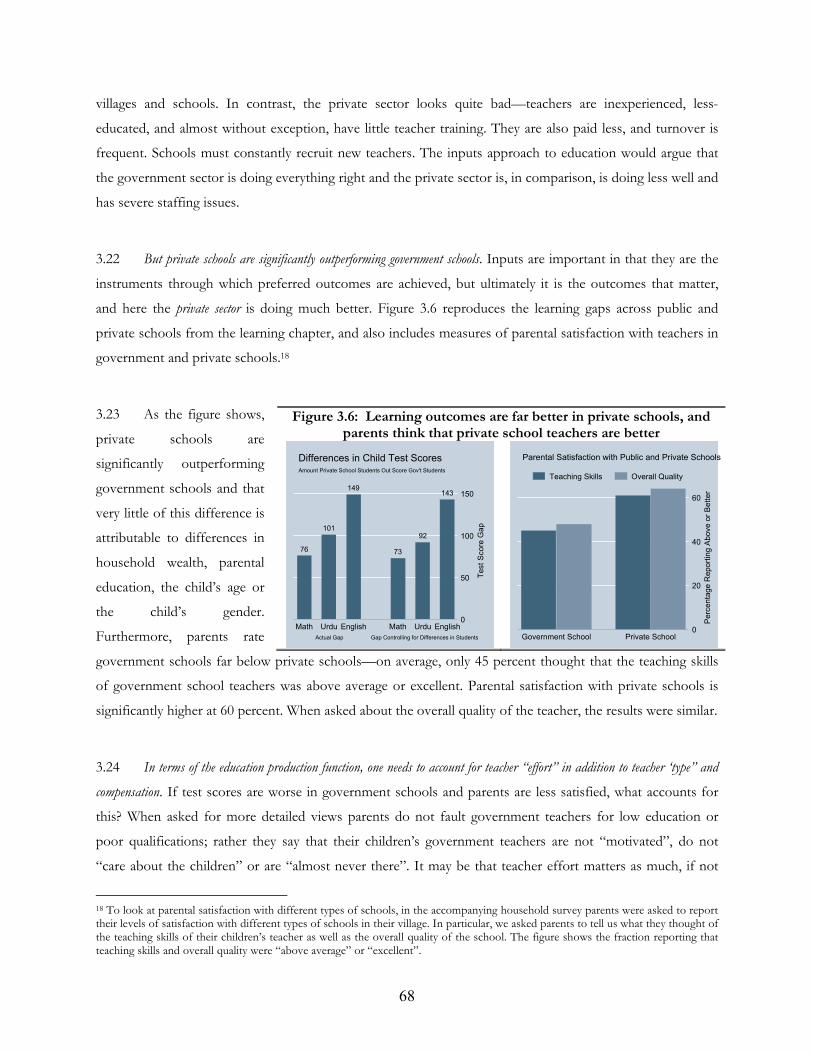
68
villages and schools. In contrast, the private sector looks quite bad—teachers are inexperienced, less-
educated, and almost without exception, have little teacher training. They are also paid less, and turnover is
frequent. Schools must constantly recruit new teachers. The inputs approach to education would argue that
the government sector is doing everything right and the private sector is, in comparison, is doing less well and
has severe staffing issues.
3.22 But private schools are significantly outperforming government schools. Inputs are important in that they are the
instruments through which preferred outcomes are achieved, but ultimately it is the outcomes that matter,
and here the private sector is doing much better. Figure 3.6 reproduces the learning gaps across public and
private schools from the learning chapter, and also includes measures of parental satisfaction with teachers in
government and private schools.18
3.23 As the figure shows,
private schools are
significantly outperforming
government schools and that
very little of this difference is
attributable to differences in
household wealth, parental
education, the child’s age or
the child’s gender.
Furthermore, parents rate
government schools far below private schools—on average, only 45 percent thought that the teaching skills
of government school teachers was above average or excellent. Parental satisfaction with private schools is
significantly higher at 60 percent. When asked about the overall quality of the teacher, the results were similar.
3.24 In terms of the education production function, one needs to account for teacher “effort” in addition to teacher ‘type” and
compensation. If test scores are worse in government schools and parents are less satisfied, what accounts for
this? When asked for more detailed views parents do not fault government teachers for low education or
poor qualifications; rather they say that their children’s government teachers are not “motivated”, do not
“care about the children” or are “almost never there”. It may be that teacher effort matters as much, if not
18 To look at parental satisfaction with different types of schools, in the accompanying household survey parents were asked to report their levels of satisfaction with different types of schools in their village. In particular, we asked parents to tell us what they thought of the teaching skills of their children’s teacher as well as the overall quality of the school. The figure shows the fraction reporting that teaching skills and overall quality were “above average” or “excellent”.
Figure 3.6: Learning outcomes are far better in private schools, and parents think that private school teachers are better
76
101
149
73
92
143
0
50
100
150
Test
Score
Gap
Actual Gap Gap Controlling for Differences in Students
Math Urdu English Math Urdu English
Amount Private School Students Out Score Gov't Students
Differences in Child Test Scores
0
20
40
60
Perc
enta
ge R
eport
ing A
bove o
r B
ett
er
Government School Private School
Parental Satisfaction with Public and Private Schools
Teaching Skills Overall Quality
69
more, than teacher competence in the production of learning. In addition, we also need to think about
teacher compensation: Given that effort is an important component of teacher quality, do we find differences
in how public and private schools reward effort monetarily? Towards such an analysis, the last part of this
section provides a detailed decomposition of government and private teacher salaries, and in particular the
relative contribution of different teacher attributes in the compensation package.
Government teachers exert less effort than their private counterparts. The differences get larger as
teachers become more experienced and for women who live farther from the school.
3.25 To measure effort, we recorded the number of days absent in the last one month for each teacher as
reported by the head-teacher.19 In addition, for 800 detailed teacher interviews, teachers were asked to rate
themselves on absenteeism. This was further broken down into absenteeism arising from emergencies,
personal reasons, or official business. These results almost surely underestimate the extent of “true”
absenteeism in the system, and it is very likely that they underplay the difference between the government and
private sectors. Furthermore, government head-teachers may have had reasons to believe that high
absenteeism recorded in the survey could result in some kind of official backlash (although all survey results
are stripped of identifiers and teachers were informed that all responses were anonymous); private head-
teachers do not face this incentive to underreport.
3.26 Absenteeism is considerably higher in government schools than in private schools. In government schools the
absentee rate is 3.2 days per month vs. 1.8 days per month for private schools (this translates to 15 and 8
percent rates of absenteeism, respectively). It’s possible the high degree of teacher accountability in the
private sector accounts for this difference.
3.27 Absence rates for more versus less experienced teachers. There is no difference in absenteeism between public
and private teachers (1.9 days a month) with less than one year of experience. As shown in Figure 3.7,
however, the story is different for more experienced teachers. Government school teachers with more than
three years of experience are absent 3.4 days a month while teacher absenteeism in private schools remains
unchanged for those who are more experienced.
19 Effort is hard to measure in large-scale surveys without detailed classroom observation of teacher’s going about their daily routine. “A plausible indicator of effort is teacher absenteeism (see for instance, recent work by Chaudhury and Dilip (2006) for an analysis of absenteeism in India and Ghuman and Lloyd 2007, for absenteeism in 12 villages in NWFP and Punjab).” It’s likely that teachers who are absent from class are less effective. Previous studies report teacher absenteeism using an audit approach; that is, by arriving unannounced at the school and taking a roll-call of all present teachers. Since we needed to interview teachers and they needed to be present at time of testing we could not rely on random
checks, and used head-teachers’ reports of teacher absenteeism as the primary measure. Das, Dercon, Habyarimana, and Krishnan
(2005) discuss the different measures and their relative merits.
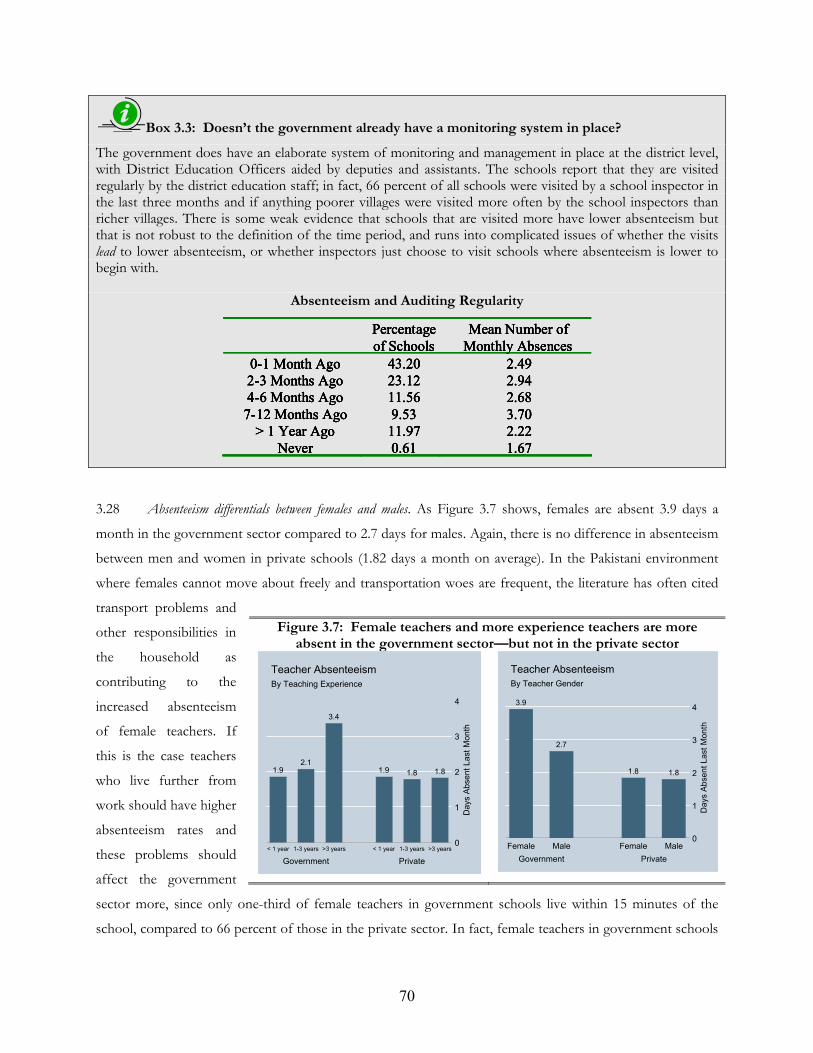
70
Box 3.3: Doesn’t the government already have a monitoring system in place?
The government does have an elaborate system of monitoring and management in place at the district level, with District Education Officers aided by deputies and assistants. The schools report that they are visited regularly by the district education staff; in fact, 66 percent of all schools were visited by a school inspector in the last three months and if anything poorer villages were visited more often by the school inspectors than richer villages. There is some weak evidence that schools that are visited more have lower absenteeism but that is not robust to the definition of the time period, and runs into complicated issues of whether the visits lead to lower absenteeism, or whether inspectors just choose to visit schools where absenteeism is lower to begin with.
Absenteeism and Auditing Regularity
3.28 Absenteeism differentials between females and males. As Figure 3.7 shows, females are absent 3.9 days a
month in the government sector compared to 2.7 days for males. Again, there is no difference in absenteeism
between men and women in private schools (1.82 days a month on average). In the Pakistani environment
where females cannot move about freely and transportation woes are frequent, the literature has often cited
transport problems and
other responsibilities in
the household as
contributing to the
increased absenteeism
of female teachers. If
this is the case teachers
who live further from
work should have higher
absenteeism rates and
these problems should
affect the government
sector more, since only one-third of female teachers in government schools live within 15 minutes of the
school, compared to 66 percent of those in the private sector. In fact, female teachers in government schools
Percentage
of Schools
Mean Number of
Monthly Absences
0-1 Month Ago 43.20 2.49
2-3 Months Ago 23.12 2.94
4-6 Months Ago 11.56 2.68
7-12 Months Ago 9.53 3.70
> 1 Year Ago 11.97 2.22
Never 0.61 1.67
Percentage
of Schools
Mean Number of
Monthly Absences
0-1 Month Ago 43.20 2.49
2-3 Months Ago 23.12 2.94
4-6 Months Ago 11.56 2.68
7-12 Months Ago 9.53 3.70
> 1 Year Ago 11.97 2.22
Never 0.61 1.67
Percentage
of Schools
Mean Number of
Monthly Absences
0-1 Month Ago 43.20 2.49
2-3 Months Ago 23.12 2.94
4-6 Months Ago 11.56 2.68
7-12 Months Ago 9.53 3.70
> 1 Year Ago 11.97 2.22
Never 0.61 1.67
Percentage
of Schools
Mean Number of
Monthly Absences
0-1 Month Ago 43.20 2.49
2-3 Months Ago 23.12 2.94
4-6 Months Ago 11.56 2.68
7-12 Months Ago 9.53 3.70
> 1 Year Ago 11.97 2.22
Never 0.61 1.67
Figure 3.7: Female teachers and more experience teachers are more absent in the government sector—but not in the private sector
1.92.1
3.4
1.9 1.8 1.8
0
1
2
3
4
Days A
bsent
Last
Month
Government Private
< 1 year 1-3 years >3 years < 1 year 1-3 years >3 years
By Teaching Experience
Teacher Absenteeism
3.9
2.7
1.8 1.8
0
1
2
3
4D
ays A
bsent
Last
Month
Government Private
Female Male Female Male
By Teacher Gender
Teacher Absenteeism
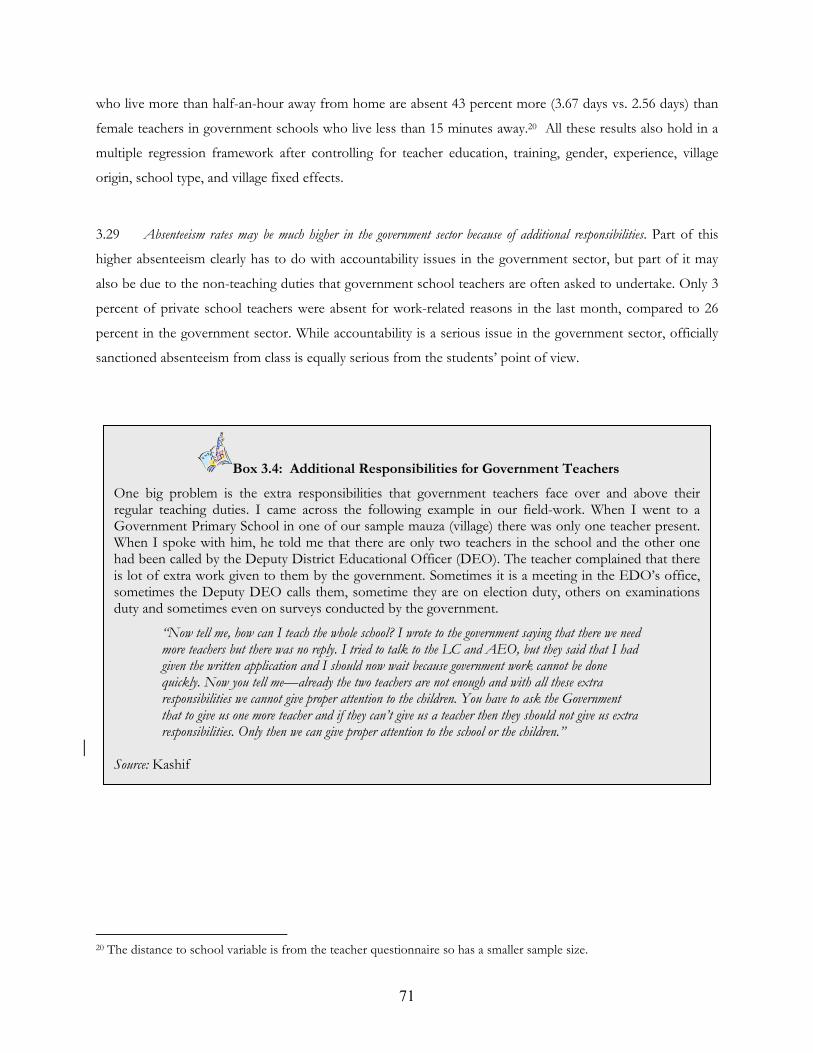
71
Box 3.4: Additional Responsibilities for Government Teachers
One big problem is the extra responsibilities that government teachers face over and above their regular teaching duties. I came across the following example in our field-work. When I went to a Government Primary School in one of our sample mauza (village) there was only one teacher present. When I spoke with him, he told me that there are only two teachers in the school and the other one had been called by the Deputy District Educational Officer (DEO). The teacher complained that there is lot of extra work given to them by the government. Sometimes it is a meeting in the EDO’s office, sometimes the Deputy DEO calls them, sometime they are on election duty, others on examinations duty and sometimes even on surveys conducted by the government.
“Now tell me, how can I teach the whole school? I wrote to the government saying that there we need more teachers but there was no reply. I tried to talk to the LC and AEO, but they said that I had given the written application and I should now wait because government work cannot be done quickly. Now you tell me—already the two teachers are not enough and with all these extra responsibilities we cannot give proper attention to the children. You have to ask the Government that to give us one more teacher and if they can’t give us a teacher then they should not give us extra responsibilities. Only then we can give proper attention to the school or the children.”
Source: Kashif
who live more than half-an-hour away from home are absent 43 percent more (3.67 days vs. 2.56 days) than
female teachers in government schools who live less than 15 minutes away.20 All these results also hold in a
multiple regression framework after controlling for teacher education, training, gender, experience, village
origin, school type, and village fixed effects.
3.29 Absenteeism rates may be much higher in the government sector because of additional responsibilities. Part of this
higher absenteeism clearly has to do with accountability issues in the government sector, but part of it may
also be due to the non-teaching duties that government school teachers are often asked to undertake. Only 3
percent of private school teachers were absent for work-related reasons in the last month, compared to 26
percent in the government sector. While accountability is a serious issue in the government sector, officially
sanctioned absenteeism from class is equally serious from the students’ point of view.
20 The distance to school variable is from the teacher questionnaire so has a smaller sample size.
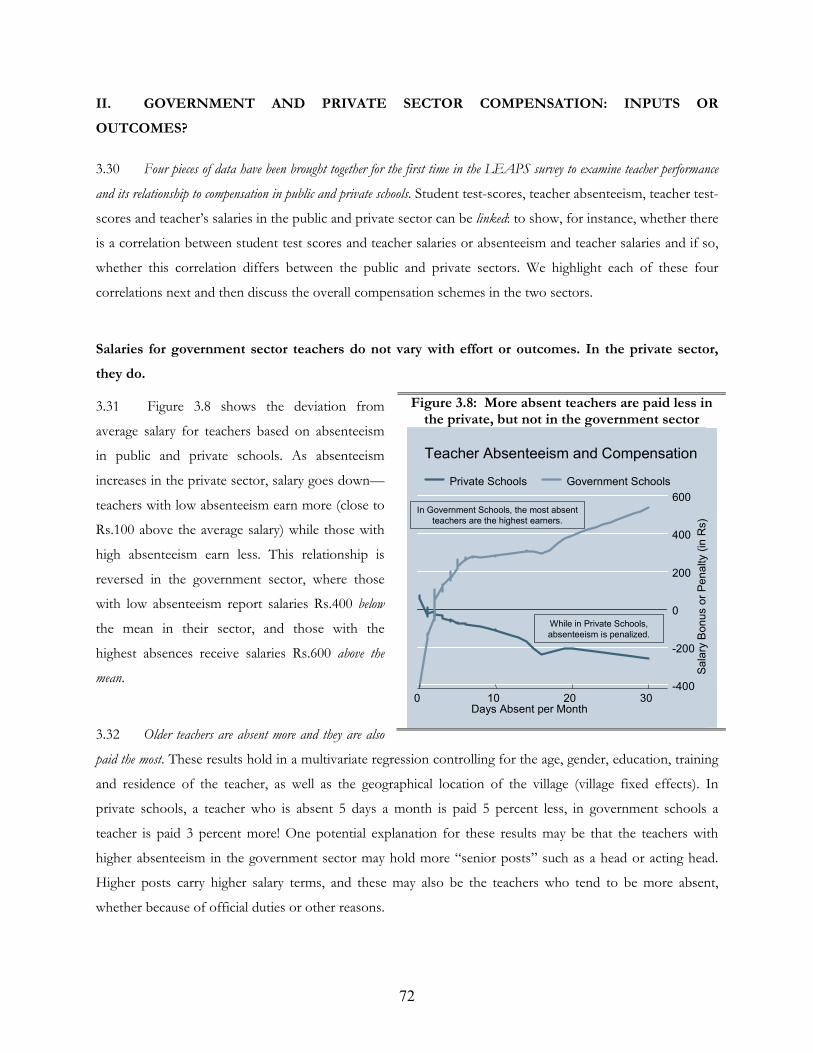
72
II. GOVERNMENT AND PRIVATE SECTOR COMPENSATION: INPUTS OR
OUTCOMES?
3.30 Four pieces of data have been brought together for the first time in the LEAPS survey to examine teacher performance
and its relationship to compensation in public and private schools. Student test-scores, teacher absenteeism, teacher test-
scores and teacher’s salaries in the public and private sector can be linked: to show, for instance, whether there
is a correlation between student test scores and teacher salaries or absenteeism and teacher salaries and if so,
whether this correlation differs between the public and private sectors. We highlight each of these four
correlations next and then discuss the overall compensation schemes in the two sectors.
Salaries for government sector teachers do not vary with effort or outcomes. In the private sector,
they do.
3.31 Figure 3.8 shows the deviation from
average salary for teachers based on absenteeism
in public and private schools. As absenteeism
increases in the private sector, salary goes down—
teachers with low absenteeism earn more (close to
Rs.100 above the average salary) while those with
high absenteeism earn less. This relationship is
reversed in the government sector, where those
with low absenteeism report salaries Rs.400 below
the mean in their sector, and those with the
highest absences receive salaries Rs.600 above the
mean.
3.32 Older teachers are absent more and they are also
paid the most. These results hold in a multivariate regression controlling for the age, gender, education, training
and residence of the teacher, as well as the geographical location of the village (village fixed effects). In
private schools, a teacher who is absent 5 days a month is paid 5 percent less, in government schools a
teacher is paid 3 percent more! One potential explanation for these results may be that the teachers with
higher absenteeism in the government sector may hold more “senior posts” such as a head or acting head.
Higher posts carry higher salary terms, and these may also be the teachers who tend to be more absent,
whether because of official duties or other reasons.
Figure 3.8: More absent teachers are paid less in the private, but not in the government sector
-400
-200
0
200
400
600
Sa
lary
Bo
nu
s o
r P
en
alty (
in R
s)
0 10 20 30Days Absent per Month
Private Schools Government Schools
Teacher Absenteeism and Compensation
While in Private Schools,
absenteeism is penalized.
In Government Schools, the most absent
teachers are the highest earners.
-400
-200
0
200
400
600
Sa
lary
Bo
nu
s o
r P
en
alty (
in R
s)
0 10 20 30Days Absent per Month
Private Schools Government Schools
Teacher Absenteeism and Compensation
While in Private Schools,
absenteeism is penalized.
In Government Schools, the most absent
teachers are the highest earners.
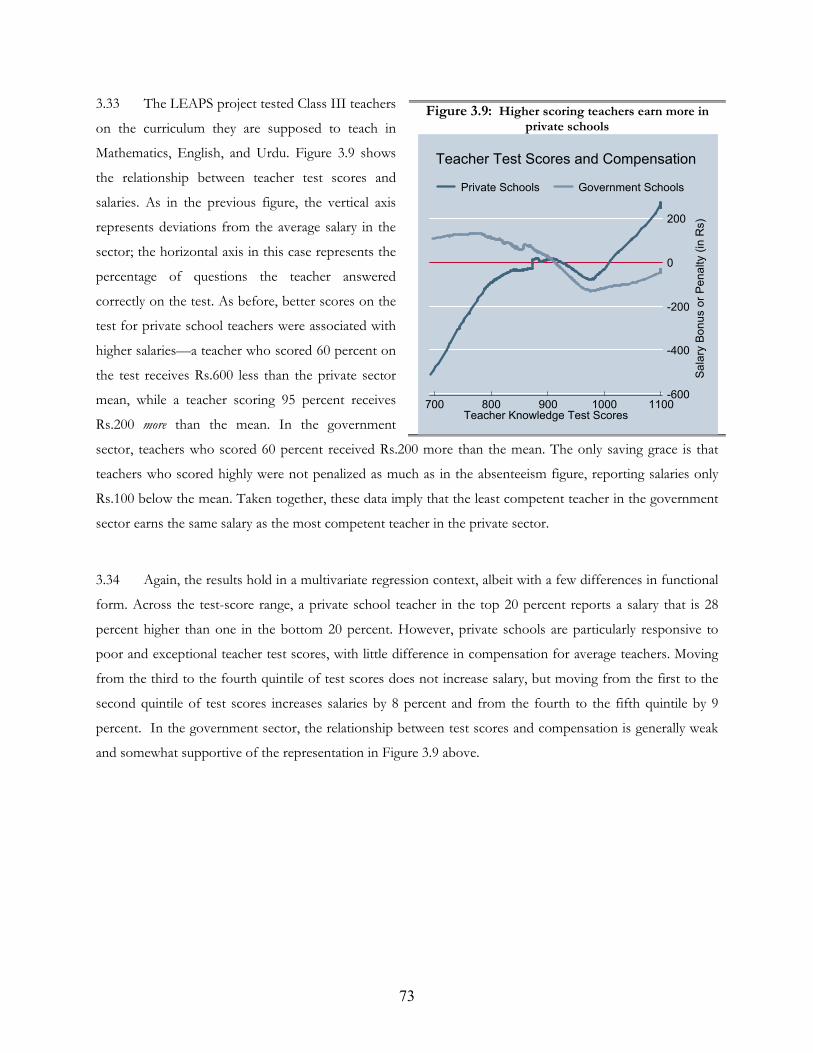
73
3.33 The LEAPS project tested Class III teachers
on the curriculum they are supposed to teach in
Mathematics, English, and Urdu. Figure 3.9 shows
the relationship between teacher test scores and
salaries. As in the previous figure, the vertical axis
represents deviations from the average salary in the
sector; the horizontal axis in this case represents the
percentage of questions the teacher answered
correctly on the test. As before, better scores on the
test for private school teachers were associated with
higher salaries—a teacher who scored 60 percent on
the test receives Rs.600 less than the private sector
mean, while a teacher scoring 95 percent receives
Rs.200 more than the mean. In the government
sector, teachers who scored 60 percent received Rs.200 more than the mean. The only saving grace is that
teachers who scored highly were not penalized as much as in the absenteeism figure, reporting salaries only
Rs.100 below the mean. Taken together, these data imply that the least competent teacher in the government
sector earns the same salary as the most competent teacher in the private sector.
3.34 Again, the results hold in a multivariate regression context, albeit with a few differences in functional
form. Across the test-score range, a private school teacher in the top 20 percent reports a salary that is 28
percent higher than one in the bottom 20 percent. However, private schools are particularly responsive to
poor and exceptional teacher test scores, with little difference in compensation for average teachers. Moving
from the third to the fourth quintile of test scores does not increase salary, but moving from the first to the
second quintile of test scores increases salaries by 8 percent and from the fourth to the fifth quintile by 9
percent. In the government sector, the relationship between test scores and compensation is generally weak
and somewhat supportive of the representation in Figure 3.9 above.
Figure 3.9: Higher scoring teachers earn more in private schools
-600
-400
-200
0
200
Sa
lary
Bo
nu
s o
r P
en
alty (
in R
s)
700 800 900 1000 1100Teacher Knowledge Test Scores
Private Schools Government Schools
Teacher Test Scores and Compensation
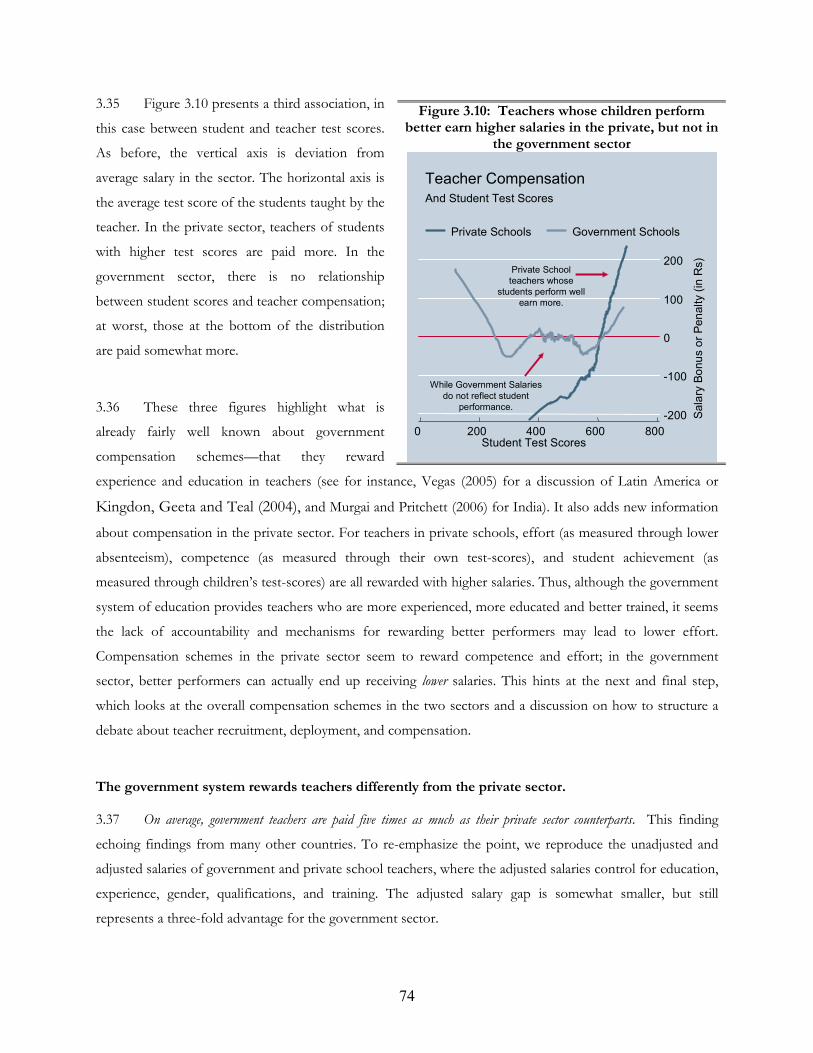
74
3.35 Figure 3.10 presents a third association, in
this case between student and teacher test scores.
As before, the vertical axis is deviation from
average salary in the sector. The horizontal axis is
the average test score of the students taught by the
teacher. In the private sector, teachers of students
with higher test scores are paid more. In the
government sector, there is no relationship
between student scores and teacher compensation;
at worst, those at the bottom of the distribution
are paid somewhat more.
3.36 These three figures highlight what is
already fairly well known about government
compensation schemes—that they reward
experience and education in teachers (see for instance, Vegas (2005) for a discussion of Latin America or
Kingdon, Geeta and Teal (2004), and Murgai and Pritchett (2006) for India). It also adds new information
about compensation in the private sector. For teachers in private schools, effort (as measured through lower
absenteeism), competence (as measured through their own test-scores), and student achievement (as
measured through children’s test-scores) are all rewarded with higher salaries. Thus, although the government
system of education provides teachers who are more experienced, more educated and better trained, it seems
the lack of accountability and mechanisms for rewarding better performers may lead to lower effort.
Compensation schemes in the private sector seem to reward competence and effort; in the government
sector, better performers can actually end up receiving lower salaries. This hints at the next and final step,
which looks at the overall compensation schemes in the two sectors and a discussion on how to structure a
debate about teacher recruitment, deployment, and compensation.
The government system rewards teachers differently from the private sector.
3.37 On average, government teachers are paid five times as much as their private sector counterparts. This finding
echoing findings from many other countries. To re-emphasize the point, we reproduce the unadjusted and
adjusted salaries of government and private school teachers, where the adjusted salaries control for education,
experience, gender, qualifications, and training. The adjusted salary gap is somewhat smaller, but still
represents a three-fold advantage for the government sector.
Figure 3.10: Teachers whose children perform better earn higher salaries in the private, but not in
the government sector
-200
-100
0
100
200
Sala
ry B
onu
s o
r P
en
alty (
in R
s)
0 200 400 600 800Student Test Scores
Private Schools Government Schools
And Student Test Scores
Teacher Compensation
Private School
teachers whose
students perform well
earn more.
While Government Salaries
do not reflect student
performance.-200
-100
0
100
200
Sala
ry B
onu
s o
r P
en
alty (
in R
s)
0 200 400 600 800Student Test Scores
Private Schools Government Schools
And Student Test Scores
Teacher Compensation
-200
-100
0
100
200
Sala
ry B
onu
s o
r P
en
alty (
in R
s)
0 200 400 600 800Student Test Scores
Private Schools Government Schools
And Student Test Scores
Teacher Compensation
Private School
teachers whose
students perform well
earn more.
While Government Salaries
do not reflect student
performance.
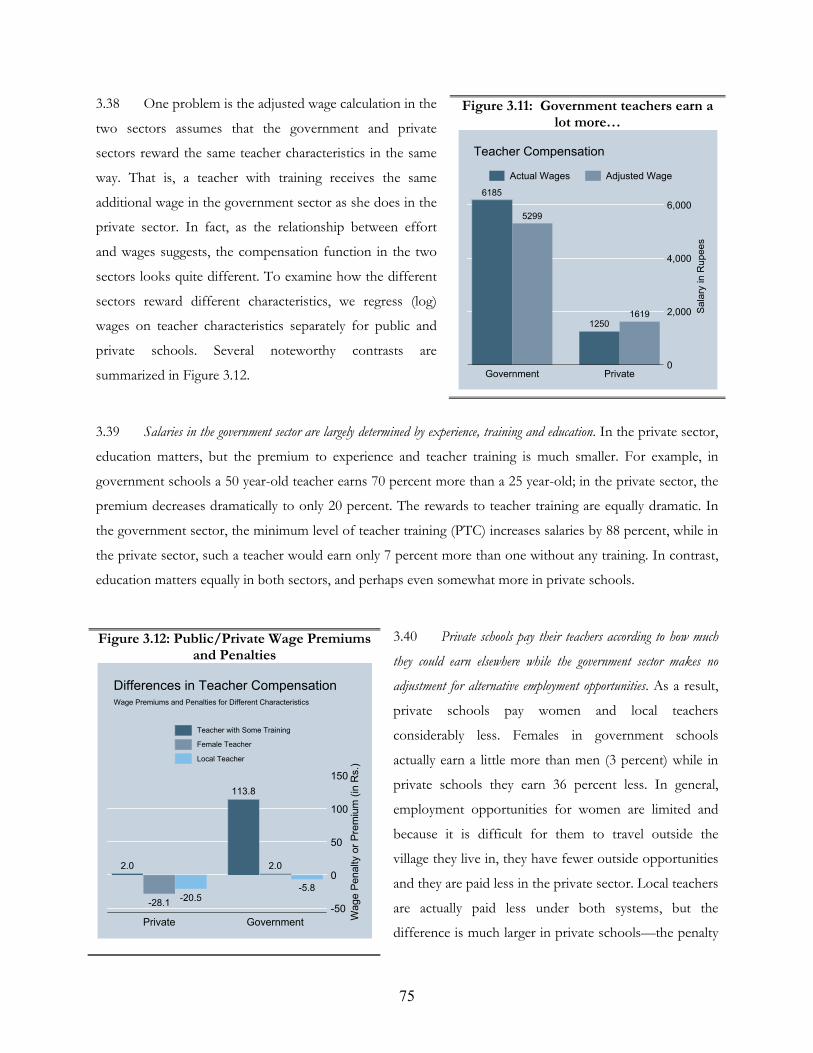
75
3.38 One problem is the adjusted wage calculation in the
two sectors assumes that the government and private
sectors reward the same teacher characteristics in the same
way. That is, a teacher with training receives the same
additional wage in the government sector as she does in the
private sector. In fact, as the relationship between effort
and wages suggests, the compensation function in the two
sectors looks quite different. To examine how the different
sectors reward different characteristics, we regress (log)
wages on teacher characteristics separately for public and
private schools. Several noteworthy contrasts are
summarized in Figure 3.12.
3.39 Salaries in the government sector are largely determined by experience, training and education. In the private sector,
education matters, but the premium to experience and teacher training is much smaller. For example, in
government schools a 50 year-old teacher earns 70 percent more than a 25 year-old; in the private sector, the
premium decreases dramatically to only 20 percent. The rewards to teacher training are equally dramatic. In
the government sector, the minimum level of teacher training (PTC) increases salaries by 88 percent, while in
the private sector, such a teacher would earn only 7 percent more than one without any training. In contrast,
education matters equally in both sectors, and perhaps even somewhat more in private schools.
3.40 Private schools pay their teachers according to how much
they could earn elsewhere while the government sector makes no
adjustment for alternative employment opportunities. As a result,
private schools pay women and local teachers
considerably less. Females in government schools
actually earn a little more than men (3 percent) while in
private schools they earn 36 percent less. In general,
employment opportunities for women are limited and
because it is difficult for them to travel outside the
village they live in, they have fewer outside opportunities
and they are paid less in the private sector. Local teachers
are actually paid less under both systems, but the
difference is much larger in private schools—the penalty
Figure 3.11: Government teachers earn a lot more…
Figure 3.12: Public/Private Wage Premiums and Penalties
6185
5299
12501619
0
2,000
4,000
6,000
Sala
ry in R
upees
Government Private
Teacher Compensation
Actual Wages Adjusted Wage
2.0
-28.1-20.5
113.8
2.0
-5.8
-50
0
50
100
150
Wage P
enalty o
r P
rem
ium
(in
Rs.)
Private Government
Wage Premiums and Penalties for Different Characteristics
Differences in Teacher Compensation
Teacher with Some Training
Female Teacher
Local Teacher
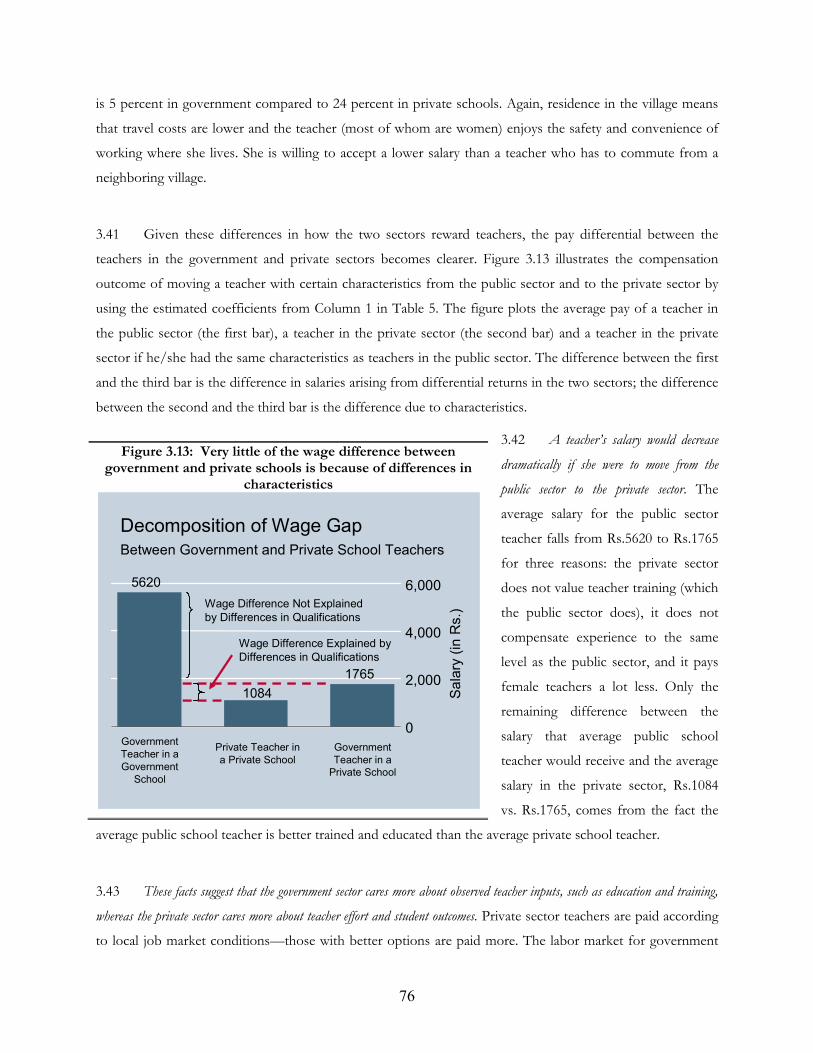
76
is 5 percent in government compared to 24 percent in private schools. Again, residence in the village means
that travel costs are lower and the teacher (most of whom are women) enjoys the safety and convenience of
working where she lives. She is willing to accept a lower salary than a teacher who has to commute from a
neighboring village.
3.41 Given these differences in how the two sectors reward teachers, the pay differential between the
teachers in the government and private sectors becomes clearer. Figure 3.13 illustrates the compensation
outcome of moving a teacher with certain characteristics from the public sector and to the private sector by
using the estimated coefficients from Column 1 in Table 5. The figure plots the average pay of a teacher in
the public sector (the first bar), a teacher in the private sector (the second bar) and a teacher in the private
sector if he/she had the same characteristics as teachers in the public sector. The difference between the first
and the third bar is the difference in salaries arising from differential returns in the two sectors; the difference
between the second and the third bar is the difference due to characteristics.
3.42 A teacher’s salary would decrease
dramatically if she were to move from the
public sector to the private sector. The
average salary for the public sector
teacher falls from Rs.5620 to Rs.1765
for three reasons: the private sector
does not value teacher training (which
the public sector does), it does not
compensate experience to the same
level as the public sector, and it pays
female teachers a lot less. Only the
remaining difference between the
salary that average public school
teacher would receive and the average
salary in the private sector, Rs.1084
vs. Rs.1765, comes from the fact the
average public school teacher is better trained and educated than the average private school teacher.
3.43 These facts suggest that the government sector cares more about observed teacher inputs, such as education and training,
whereas the private sector cares more about teacher effort and student outcomes. Private sector teachers are paid according
to local job market conditions—those with better options are paid more. The labor market for government
Figure 3.13: Very little of the wage difference between government and private schools is because of differences in
characteristics
5620
1084
1765
0
2,000
4,000
6,000
Sa
lary
(in
Rs.)
Government
Teacher in a
Government
School
Private Teacher in
a Private School
Government
Teacher in a
Private School
Between Government and Private School Teachers
Decomposition of Wage Gap
Wage Difference Explained by
Differences in Qualifications
Wage Difference Not Explained
by Differences in Qualifications
77
teachers responds to different signals, particularly the need to reward everyone equally depending on
education, qualifications and training, but little else. The flexibility to adjust wages depending on local
conditions or teacher effort in the private sector is absent from government sector compensation schemes.
We are not saying all government teachers are “bad” and all private school teachers are “good”. As the
chapter on learning pointed out, the top government and private schools perform at the same level. The
problem is the bottom 20 percent of government schools where little to no learning goes on at all. Part of the
problem is that government compensation schemes do not distinguish between good and bad teachers. In
fact, compensation when linked to experience only results in more absenteeism, less-educated teachers (recall
that older teachers are also less educated), and poorer learning outcomes for students.
III. DISCUSSION
3.44 The government sector works well in some regards, very poorly in others. It hires educated and well-
trained teachers and pays them well. It also allocates them fairly across both rich and poor villages and
schools with rich and poor students. On the other hand, it has no mechanism for penalizing non-performing
teachers and rewarding exceptional ones. The current mechanistic compensation scheme results in the highest
compensation being directed towards the worst teachers, in terms of education, training, or effort. Teachers
are also burdened with duties outside the purview of their main responsibilities.
3.45 The private sector compensates teachers for outcomes, and high turnover permits retention based on
merit, but private sector schools locate only in areas where teachers are available at a low wage. It is
exceedingly difficult for private schools to arise in areas without educated women or in the rural areas with
secondary schools, where further education is required. Teachers receive wages according to their available
local opportunities—they are paid less in villages where there is higher literacy (and therefore greater supply),
and females with these characteristics earn the least.
3.46 Overall some private sector characteristics may be “desirable” in government compensation schemes;
others, such as gender discrimination in wages clearly violate government rules and may be “undesirable.”
Suggestions for how can Pakistani can best take advantage of these two very different sectors and
compensation schemes requires either rethinking the stage of education and the geographical locations the
government sector should focus on or a large, systematic reform of the government compensation system.
78
Rethinking teacher recruitment, deployment, and rewards
3.47 The debate around teachers in government schools seems to hinge on two related issues: the
attributes of teachers and the institutional framework that contribute to better student outcomes, and the
availability of teachers or schools catering to different levels of education in each village (primary, middle, and
secondary). Teacher and institutional attributes can be broadly separated into three categories: hard to observe
teacher characteristics such as motivation, which can emerge only over time, easy to observe characteristics such as
educational qualifications, experience and training and, the institutional framework embodied in incentives such
as the teacher salaries and bonuses. Research in the United States has tried to separate the influence of the
first two types of characteristics (motivation and qualification); given that most of this research is for public
school teachers, it has made less progress on the impact of incentives. This research finds that characteristics
like motivation and a love of teaching are far more important in explaining the variation in student learning
compared to educational qualifications, experience, and training. Experience for instance, matters only in the
first year. In short, in systems with the same set of incentives, teachers appear to be born, not made.
3.48 When there are many potential teachers to hire from, it makes sense to try and recruit and retain the
best applicants and eventually fire those who do not perform. However, in geographical areas or levels of
schooling where potential applicants are few, this is no longer true. Firing a teacher makes sense only if you
can replace him/her with another teacher who is better. In areas of limited supply, a teacher who is absent
three days a week may still be a good hire compared to the alternative of being teacher-less. The key point is
that these different factors interact—providing incentives for teachers mean that those with higher motivation
(and thus better outcomes) are more likely to apply, thus increasing the quality of the teacher pool. In fact, in
the United States studies have argued that the quality of the teacher pool has suffered because of teacher
unionization, which pays a fixed wage regardless of the motivation of the teacher (see Hoxby, 1996). Some
options and their potential interactions in terms of student outcomes are discussed next.
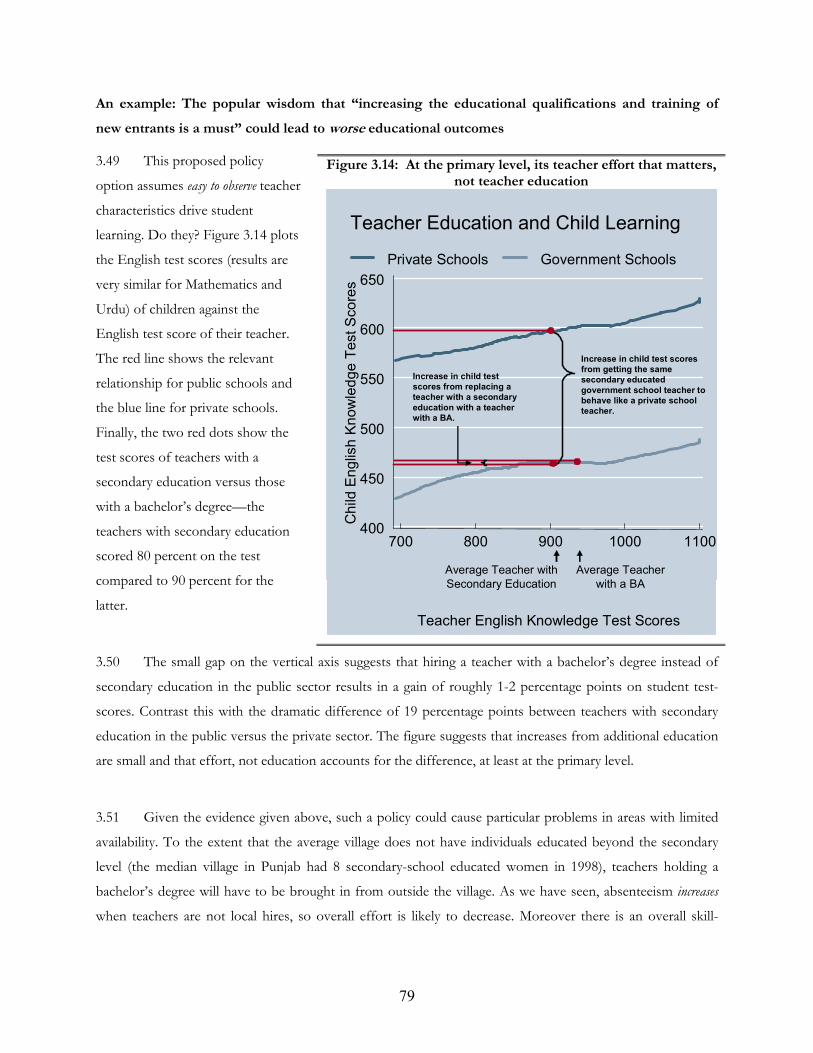
79
An example: The popular wisdom that “increasing the educational qualifications and training of
new entrants is a must” could lead to worse educational outcomes
3.49 This proposed policy
option assumes easy to observe teacher
characteristics drive student
learning. Do they? Figure 3.14 plots
the English test scores (results are
very similar for Mathematics and
Urdu) of children against the
English test score of their teacher.
The red line shows the relevant
relationship for public schools and
the blue line for private schools.
Finally, the two red dots show the
test scores of teachers with a
secondary education versus those
with a bachelor’s degree—the
teachers with secondary education
scored 80 percent on the test
compared to 90 percent for the
latter.
3.50 The small gap on the vertical axis suggests that hiring a teacher with a bachelor’s degree instead of
secondary education in the public sector results in a gain of roughly 1-2 percentage points on student test-
scores. Contrast this with the dramatic difference of 19 percentage points between teachers with secondary
education in the public versus the private sector. The figure suggests that increases from additional education
are small and that effort, not education accounts for the difference, at least at the primary level.
3.51 Given the evidence given above, such a policy could cause particular problems in areas with limited
availability. To the extent that the average village does not have individuals educated beyond the secondary
level (the median village in Punjab had 8 secondary-school educated women in 1998), teachers holding a
bachelor’s degree will have to be brought in from outside the village. As we have seen, absenteeism increases
when teachers are not local hires, so overall effort is likely to decrease. Moreover there is an overall skill-
Figure 3.14: At the primary level, its teacher effort that matters, not teacher education
400
450
500
550
600
650
Ch
ild E
ng
lish
Kn
ow
led
ge
Te
st S
co
res
700 800 900 1000 1100
Teacher English Knowledge Test Scores
Private Schools Government Schools
Teacher Education and Child Learning
Increase in child test scores
from getting the same
secondary educated
government school teacher to
behave like a private school
teacher.
Increase in child test
scores from replacing a
teacher with a secondary
education with a teacher
with a BA.
Average Teacher with
Secondary Education
Average Teacher
with a BA
400
450
500
550
600
650
Ch
ild E
ng
lish
Kn
ow
led
ge
Te
st S
co
res
700 800 900 1000 1100
Teacher English Knowledge Test Scores
Private Schools Government Schools
Teacher Education and Child Learning
Increase in child test scores
from getting the same
secondary educated
government school teacher to
behave like a private school
teacher.
Increase in child test
scores from replacing a
teacher with a secondary
education with a teacher
with a BA.
Average Teacher with
Secondary Education
Average Teacher
with a BA
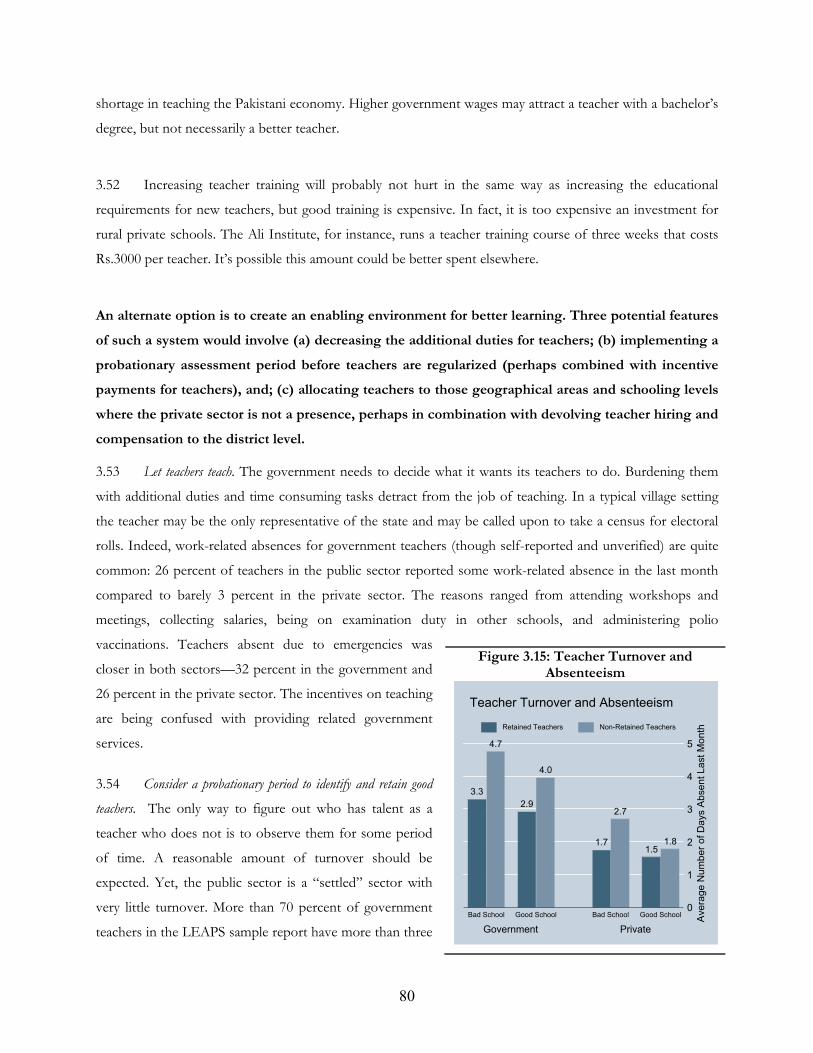
80
shortage in teaching the Pakistani economy. Higher government wages may attract a teacher with a bachelor’s
degree, but not necessarily a better teacher.
3.52 Increasing teacher training will probably not hurt in the same way as increasing the educational
requirements for new teachers, but good training is expensive. In fact, it is too expensive an investment for
rural private schools. The Ali Institute, for instance, runs a teacher training course of three weeks that costs
Rs.3000 per teacher. It’s possible this amount could be better spent elsewhere.
An alternate option is to create an enabling environment for better learning. Three potential features
of such a system would involve (a) decreasing the additional duties for teachers; (b) implementing a
probationary assessment period before teachers are regularized (perhaps combined with incentive
payments for teachers), and; (c) allocating teachers to those geographical areas and schooling levels
where the private sector is not a presence, perhaps in combination with devolving teacher hiring and
compensation to the district level.
3.53 Let teachers teach. The government needs to decide what it wants its teachers to do. Burdening them
with additional duties and time consuming tasks detract from the job of teaching. In a typical village setting
the teacher may be the only representative of the state and may be called upon to take a census for electoral
rolls. Indeed, work-related absences for government teachers (though self-reported and unverified) are quite
common: 26 percent of teachers in the public sector reported some work-related absence in the last month
compared to barely 3 percent in the private sector. The reasons ranged from attending workshops and
meetings, collecting salaries, being on examination duty in other schools, and administering polio
vaccinations. Teachers absent due to emergencies was
closer in both sectors—32 percent in the government and
26 percent in the private sector. The incentives on teaching
are being confused with providing related government
services.
3.54 Consider a probationary period to identify and retain good
teachers. The only way to figure out who has talent as a
teacher who does not is to observe them for some period
of time. A reasonable amount of turnover should be
expected. Yet, the public sector is a “settled” sector with
very little turnover. More than 70 percent of government
teachers in the LEAPS sample report have more than three
Figure 3.15: Teacher Turnover and Absenteeism
3.3
4.7
2.9
4.0
1.7
2.7
1.51.8
0
1
2
3
4
5
Ave
rag
e N
um
be
r o
f D
ays A
bse
nt L
ast M
on
th
Government Private
Bad School Good School Bad School Good School
Teacher Turnover and Absenteeism
Retained Teachers Non-Retained Teachers
81
years experience at the school they are teaching compared to 29 percent in private schools. In 71 percent of
private schools, a teacher left in the previous year compared to 24 percent in the government. Overall, in the
private sector, 530 teachers left in the year preceding the survey and 690 new teachers were hired out of a
total of 2,167 present in the survey year. In the government sector, 171 left, and 356 new ones were hired out
of a total of 2,652 teachers. Figure 3.15 suggests that turnover, both in the public and private sector, may be
good in that it gets rid of teachers who exert less effort. As the figure shows, whether we look at initially high
or low performing schools, teachers who were not retained the following year were those who were more
absent than the others.
3.55 A middle ground therefore might be a probationary period of two to three years during which the
teacher is kept on a temporary contract. At the end of this period, the teacher may be converted to a
permanent contract through a clearing process. The process for retention could evolve. Indeed, the Punjab
government freeze on regular hiring of teachers in 2002 led to an increase in teachers hired on temporary
contracts—although this was a response to a fiscal issue tied in to pension payments rather than as a means
of improving accountability. These contract teachers may work, but only if (a) the government does not
renew contracts for poorly performing teachers and (b) ultimate political pressures do not lead to their
“regularization” (there are already agitations towards this step).
3.56 The data on contract teacher performance from the LEAPS study shows that contract teachers are
absent less often, are more competent, and are paid less. This analysis is a bit misleading because contract
teachers are also a considerably younger than the average teacher in public schools. A correct comparison
would control for age, but this cannot be done in a simple regression context because there is no variation—
all contract teachers are young, all public school teachers are older. In the future a more sophisticated analysis
using regression discontinuity designs will be used.
3.57 What about rewarding teachers for greater effort? While few disagree with the overall premise of rewarding
teachers for effort, the question of how best to do so is a subject of much debate. It is difficult to
institutionalize a mechanism for rewarding effort – after all, how is effort measured? Current literature
suggests it will be necessary to develop policies that combine different means of measuring effort, from
“inputs” like attendance to “outcomes” like child test scores, and possibly even the “process” by which
teachers teach. In recent small-scale randomized evaluations, rewarding teachers based on inputs or outcomes
have both been shown to work; see Duflo and Hanna’s experiment of using cameras and compensation
linked to days present for an example of the first and Muralidharan and Sundararaman (2006) on
compensating teachers based on improvements in test scores for the second. Rewarding teachers strictly on
82
objective outcomes is difficult. The objection is somewhat technical. Test scores display strong mean
reversion—which means, that in any given year, the worst performers at the beginning will show the
strongest gains and the best performers the weakest. Thus, teachers who start with a poor class will get
rewarded irrespective of what they do; those who start with a strong class will not get rewarded irrespective of
what they do. The set of teachers who can change their compensation depending on their effort may be very
small so that the scheme turns out to be very costly. Once teachers understand this process, gaming the
system combined with outright cheating in tests will become pervasive (the experiment above was tried only
for one year). Because of similar problems, every state in the United States has at some time tried and
discarded this strategy. An alternative, advanced by Murgai and Pritchett (2006) is to reward teachers not on
verifiable outcomes, but on verifiable processes. Under this scheme, the hiring and retention of teachers
would be decentralized to the village level. Yet, this also comes with its own problems. Decentralization may
or may not work in the Pakistani context. It would depend on issues of “elite capture” and how democratic
and participative the ultimate process turns out to be. In the state of Uttar Pradesh in India, for instance, a
recent survey revealed that even members of the “Village Education Committee” are not aware of their
membership! The attractiveness of this proposal lies in it promise of giving power to the ultimate receivers of
a service, but there is little evidence on whether such a scheme could or would work.
3.58 Allocate government teachers where they are needed the most. One of the most powerful tools for equity that
the government holds in its hands is the right to transfer teachers to villages and schools where they are
needed most. The inherent differences in salaries between the private and public sector is explored in the
chapter on schooling. It will show that educating a child in a government school requires twice the resources
needed to educate that same child in a private school when one is available. It makes little sense, if we are
concerned about the right to education of the poor in Pakistan, for the public sector to compete with the
private sector when both choices are available. Matters are made worse because the government sector
competes not only for enrollment, but also for teachers in a limited labor market. Private school teachers
desire jobs as public school teachers. When asked, one such teacher said: “And would you not take a job where you
are paid 4 times as much and do not have to work?” Yet, in many villages there are no private schools. In areas or
sectors where the supply of educated potential teachers is low, it will be difficult for private schools to hire
and retain good teachers. The data show that private schools are likely to function better as literacy increases
and that locally hired and resident teachers have lower absenteeism. As village literacy increases, the
percentage of local teachers increases—in private schools, 39 percent are local in the least literate villages
while 66 are local in the most literate (for government schools it increases from 28 to 48 percent). Similarly,
the percentage of teachers who live within 15 minutes of the school goes up from 38 percent to 60 percent
83
when we go from the least literate to the most literate category. Private schools will only function in sectors
and geographical areas where supply of teachers is sufficient.
3.59 Given these supply issues one possibility may be to develop 2 different “cadres” of teachers: a
provincial cadre that can be transferred across districts and a district cadre that can be transferred across
villages. These cadres would provide education where the private sector is reluctant to go. They would also
justify part of their high salaries because of the inherent difficulties of working in the places where they are
posted. Although problems of accountability and incentives will remain, at least these teachers will be
providing some education where none was previously available.
3.60 While some devolution for education has shifted from provinces to districts, teacher compensation
and posting is still a provincial responsibility. As we have seen above, this does not permit different districts
to take advantage of local conditions—where there are many educated individuals, wages should be lower.
Allowing districts to come up with their own hiring, retention, and compensation policies would take the
devolution process further and help strengthen local accountability mechanisms. At the same time, recourse to
a centralized cadre (at a fixed cost per teacher) would ensure that they have access to trained personnel if
needs cannot be met locally.
3.61 Of roughly 12 million employees in the government workforce, 3 million are teachers and they have
strong unions, as do teachers around the world. Moreover, as a hangover from the British era, where teachers
were the only educated individuals for miles on end, village teachers may be asked to man election booths,
draw up voter lists, and work as part and parcel of the political system. A democratic debate on this issue
must go beyond efforts to compete with the private sector, and focus instead on providing somewhat lower
quality education in areas where the private sector is absent, and gradually withdraw provision (but not
financing) as the private sector takes over. Widespread systemic reform is needed before the current cadre of
teachers retires since it will take close to 25 years to refresh at least 50 percent of the teaching workforce. The
question is whether Pakistan can afford to mortgage the future of 2 million children every year for the next 25
years to the desires of 3 million teachers.
84
Chapter 4: Parents and their Children
4.1 Is it true that parents, who may have low educational attainment themselves, must be cajoled and “incentivized” into
sending their children to school? The media and governmental policy suggest that the reality for children, even
when enrolled, is that their ability to participate and learn is severely hampered by multiple demands on their
time, either through housework or paid child-labor. The girl-child is less likely to be enrolled in school in the
first place, and when she is her learning suffers because of the added burden of work at home and low
parental attention, both in terms of money spent and time given. Popular wisdom is that the emergence of
rural private schools may have made matters worse still. Illiterate parents, unable to gauge the quality of
private schools, it is conjectured, are easily fooled by unscrupulous private school operators into paying
unnecessarily high fees. These perceptions have clear implications for educational policy. The government
must work hard to get children into school, compensate for the inability of parents to fund or spend time
with their children, legislate against child-labor and regulate the private sector. Leaving illiterate parents to
fend for themselves is not the best educational investment in the next generation of citizens. What do the
data say about parental participation in the education process?
4.2 Participation is only part of the story. Researchers in Pakistan and elsewhere have actively explored the link
between households and schools. However, the focus has been on factors that lead to higher enrollment. In
the Pakistani context, given the importance of the distance to school and its interplay with gender, there is a
considerable literature on the impact of distance from school on attendance; more so for girls than for boys.
21 As the chapter on learning shows, once children get to school ensuring learning outcomes is an entirely
separate issue. Upping enrollment is undoubtedly an important first-step, but it is now time to think about
how to bolster their learning and expand our understanding about the role of households in supporting the
learning process.
4.3 The role of the household in promoting better educational outcomes is equally important. This chapter presents
detailed information on the choices that parents make regarding their children’s schools, the time and money
they spend on their children, the daily activities that a child engages in, and reiterates the critical constraints
that distance to school has for enrollment, especially among girls. While some findings from the survey data
accord well with some of the commonly held beliefs mentioned above, other findings suggest a closer
21 Alderman, Behrman, Khan, Ross and Sabot (1995), Holmes, Jessica. (2003), Lloyd, Mete and Sathar (2005), Sawada and Lokshin (2001).
Nadia
Highlight
Nadia
Highlight
Nadia
Highlight
Nadia
Highlight
Nadia
Highlight
Nadia
Highlight
Nadia
Highlight
Nadia
Highlight
Nadia
Highlight
Nadia
Highlight
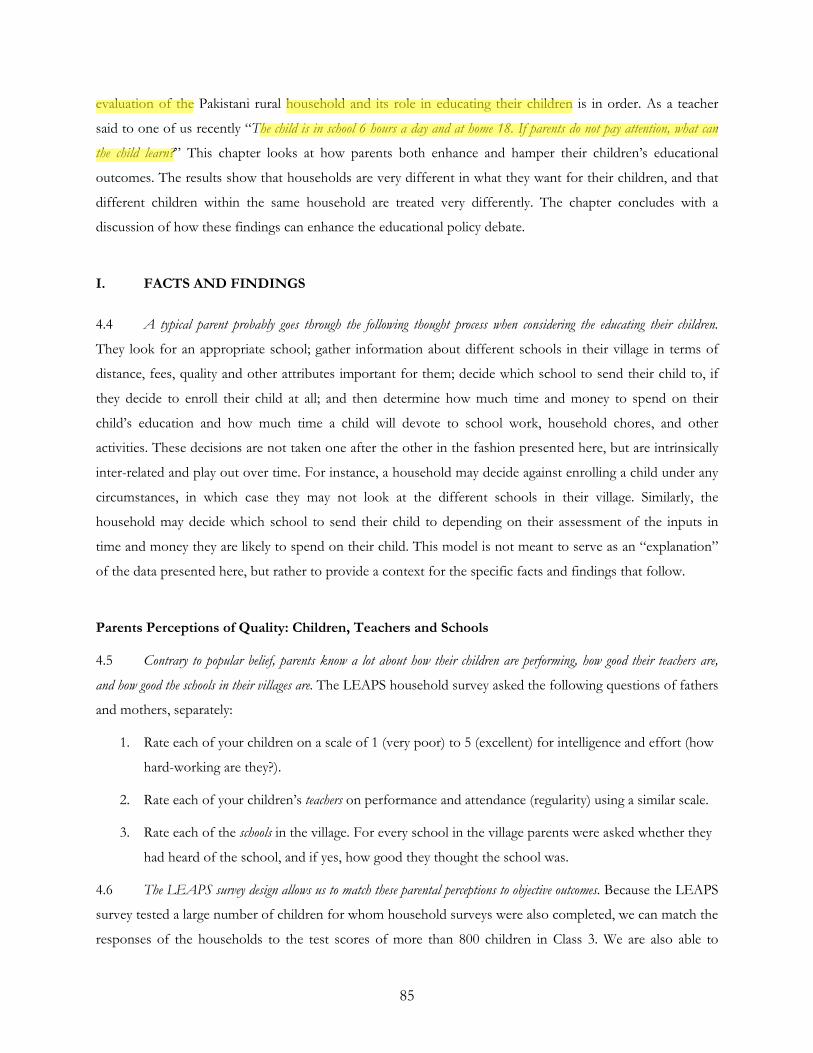
85
evaluation of the Pakistani rural household and its role in educating their children is in order. As a teacher
said to one of us recently “The child is in school 6 hours a day and at home 18. If parents do not pay attention, what can
the child learn?” This chapter looks at how parents both enhance and hamper their children’s educational
outcomes. The results show that households are very different in what they want for their children, and that
different children within the same household are treated very differently. The chapter concludes with a
discussion of how these findings can enhance the educational policy debate.
I. FACTS AND FINDINGS
4.4 A typical parent probably goes through the following thought process when considering the educating their children.
They look for an appropriate school; gather information about different schools in their village in terms of
distance, fees, quality and other attributes important for them; decide which school to send their child to, if
they decide to enroll their child at all; and then determine how much time and money to spend on their
child’s education and how much time a child will devote to school work, household chores, and other
activities. These decisions are not taken one after the other in the fashion presented here, but are intrinsically
inter-related and play out over time. For instance, a household may decide against enrolling a child under any
circumstances, in which case they may not look at the different schools in their village. Similarly, the
household may decide which school to send their child to depending on their assessment of the inputs in
time and money they are likely to spend on their child. This model is not meant to serve as an “explanation”
of the data presented here, but rather to provide a context for the specific facts and findings that follow.
Parents Perceptions of Quality: Children, Teachers and Schools
4.5 Contrary to popular belief, parents know a lot about how their children are performing, how good their teachers are,
and how good the schools in their villages are. The LEAPS household survey asked the following questions of fathers
and mothers, separately:
1. Rate each of your children on a scale of 1 (very poor) to 5 (excellent) for intelligence and effort (how
hard-working are they?).
2. Rate each of your children’s teachers on performance and attendance (regularity) using a similar scale.
3. Rate each of the schools in the village. For every school in the village parents were asked whether they
had heard of the school, and if yes, how good they thought the school was.
4.6 The LEAPS survey design allows us to match these parental perceptions to objective outcomes. Because the LEAPS
survey tested a large number of children for whom household surveys were also completed, we can match the
responses of the households to the test scores of more than 800 children in Class 3. We are also able to
Nadia
Highlight
Nadia
Highlight
Nadia
Highlight
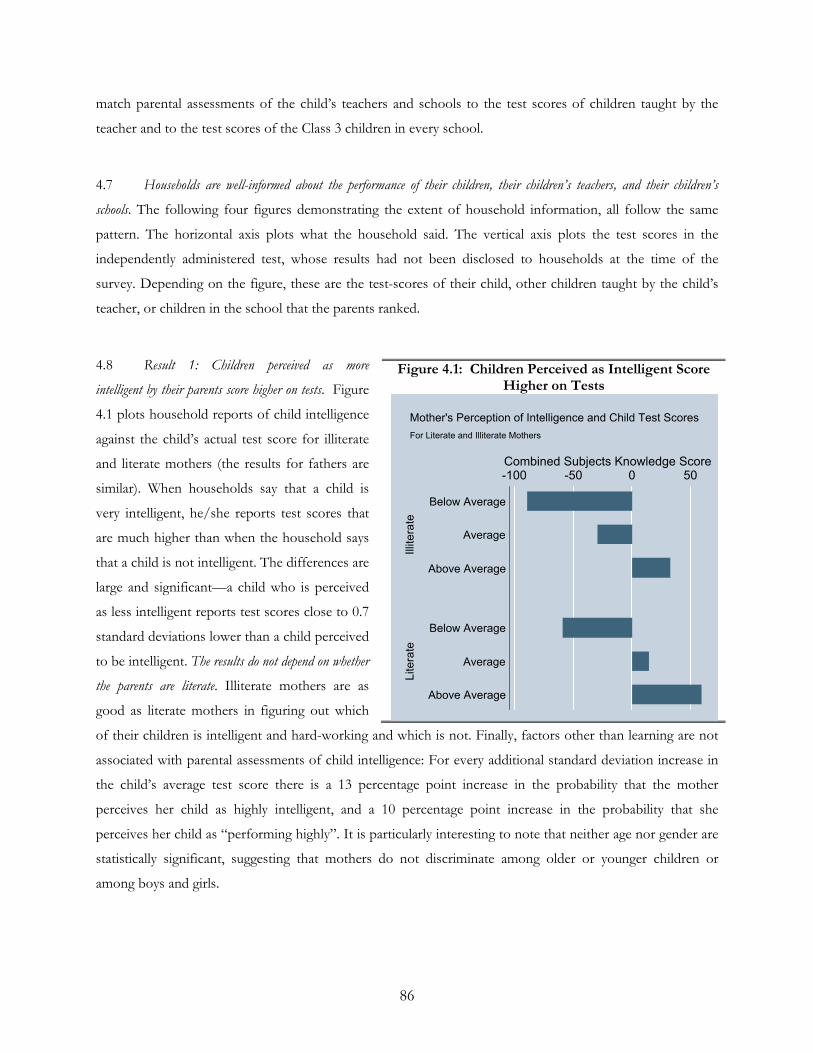
86
match parental assessments of the child’s teachers and schools to the test scores of children taught by the
teacher and to the test scores of the Class 3 children in every school.
4.7 Households are well-informed about the performance of their children, their children’s teachers, and their children’s
schools. The following four figures demonstrating the extent of household information, all follow the same
pattern. The horizontal axis plots what the household said. The vertical axis plots the test scores in the
independently administered test, whose results had not been disclosed to households at the time of the
survey. Depending on the figure, these are the test-scores of their child, other children taught by the child’s
teacher, or children in the school that the parents ranked.
4.8 Result 1: Children perceived as more
intelligent by their parents score higher on tests. Figure
4.1 plots household reports of child intelligence
against the child’s actual test score for illiterate
and literate mothers (the results for fathers are
similar). When households say that a child is
very intelligent, he/she reports test scores that
are much higher than when the household says
that a child is not intelligent. The differences are
large and significant—a child who is perceived
as less intelligent reports test scores close to 0.7
standard deviations lower than a child perceived
to be intelligent. The results do not depend on whether
the parents are literate. Illiterate mothers are as
good as literate mothers in figuring out which
of their children is intelligent and hard-working and which is not. Finally, factors other than learning are not
associated with parental assessments of child intelligence: For every additional standard deviation increase in
the child’s average test score there is a 13 percentage point increase in the probability that the mother
perceives her child as highly intelligent, and a 10 percentage point increase in the probability that she
perceives her child as “performing highly”. It is particularly interesting to note that neither age nor gender are
statistically significant, suggesting that mothers do not discriminate among older or younger children or
among boys and girls.
Figure 4.1: Children Perceived as Intelligent Score Higher on Tests
-100 -50 0 50Combined Subjects Knowledge Score
Lite
rate
Illit
era
te
Above Average
Average
Below Average
Above Average
Average
Below Average
For Literate and Illiterate Mothers
Mother's Perception of Intelligence and Child Test Scores
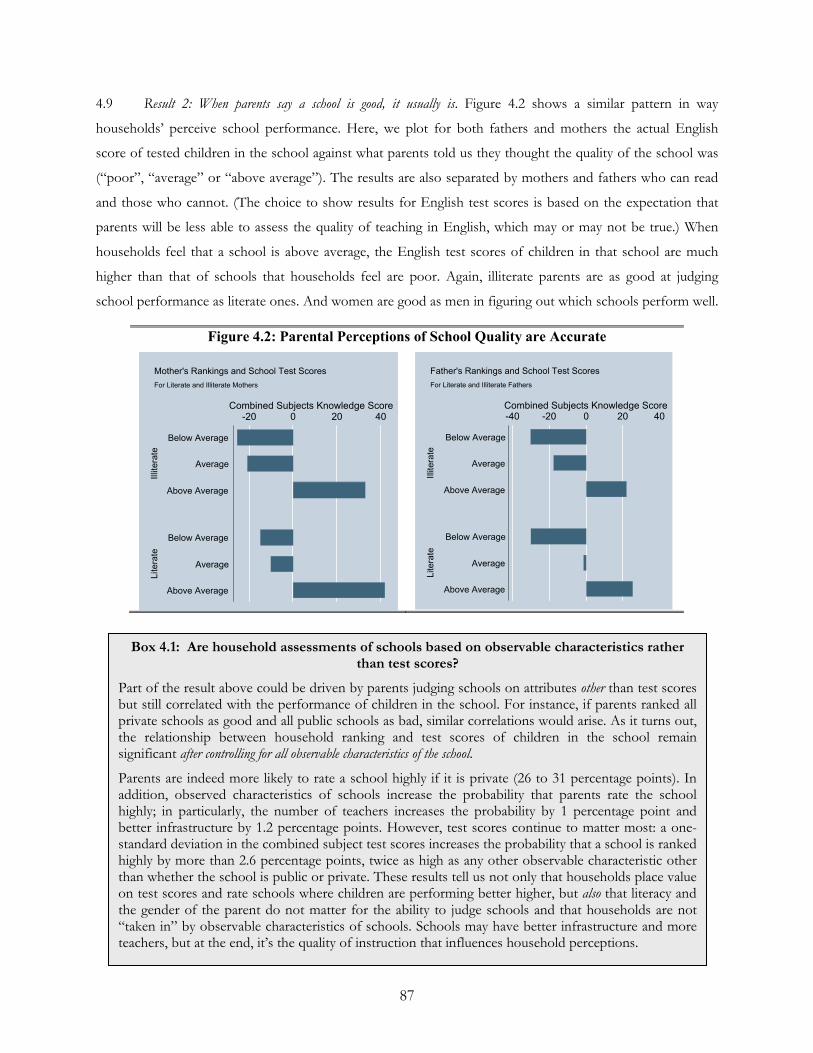
87
Box 4.1: Are household assessments of schools based on observable characteristics rather than test scores?
Part of the result above could be driven by parents judging schools on attributes other than test scores but still correlated with the performance of children in the school. For instance, if parents ranked all private schools as good and all public schools as bad, similar correlations would arise. As it turns out, the relationship between household ranking and test scores of children in the school remain significant after controlling for all observable characteristics of the school.
Parents are indeed more likely to rate a school highly if it is private (26 to 31 percentage points). In addition, observed characteristics of schools increase the probability that parents rate the school highly; in particularly, the number of teachers increases the probability by 1 percentage point and better infrastructure by 1.2 percentage points. However, test scores continue to matter most: a one-standard deviation in the combined subject test scores increases the probability that a school is ranked highly by more than 2.6 percentage points, twice as high as any other observable characteristic other than whether the school is public or private. These results tell us not only that households place value on test scores and rate schools where children are performing better higher, but also that literacy and the gender of the parent do not matter for the ability to judge schools and that households are not “taken in” by observable characteristics of schools. Schools may have better infrastructure and more teachers, but at the end, it’s the quality of instruction that influences household perceptions.
4.9 Result 2: When parents say a school is good, it usually is. Figure 4.2 shows a similar pattern in way
households’ perceive school performance. Here, we plot for both fathers and mothers the actual English
score of tested children in the school against what parents told us they thought the quality of the school was
(“poor”, “average” or “above average”). The results are also separated by mothers and fathers who can read
and those who cannot. (The choice to show results for English test scores is based on the expectation that
parents will be less able to assess the quality of teaching in English, which may or may not be true.) When
households feel that a school is above average, the English test scores of children in that school are much
higher than that of schools that households feel are poor. Again, illiterate parents are as good at judging
school performance as literate ones. And women are good as men in figuring out which schools perform well.
Figure 4.2: Parental Perceptions of School Quality are Accurate
-20 0 20 40Combined Subjects Knowledge Score
Litera
teIllit
era
te
Above Average
Average
Below Average
Above Average
Average
Below Average
For Literate and Illiterate Mothers
Mother's Rankings and School Test Scores
-40 -20 0 20 40Combined Subjects Knowledge Score
Litera
teIllit
era
te
Above Average
Average
Below Average
Above Average
Average
Below Average
For Literate and Illiterate Fathers
Father's Rankings and School Test Scores

88
89
4.10 Result 3: Mothers know best. Figure 4.3
relates households’ perceptions of teacher
attendance (regularity) measured at the school as
part of the teacher questionnaires and roster
exercise (see Chapter 3). Again maternal
assessment of the teachers’ regularity tracks the
actual state of affairs well. Literate mothers do a
slightly better job (especially in figuring out
which teachers are not regular) than literate
fathers. Combining this with results 1 and 2,
mothers are more aware of school conditions
despite, as we will see next, having visited far
fewer schools than fathers.
4.11 Result 4: In a typical village some schools are unknown to parents. Figure 4.4 is the only set of results that
resonate, at first glance, with the common wisdom that households are relatively ignorant, and illiterate and
less wealthy households know less. Mothers have heard of only 60 percent of the schools in their village, and
fathers 70 percent, and illiterate mothers and fathers have heard of even fewer schools. Several salient points
emerge through a multivariate regression analysis: both mothers and fathers are far more likely to report
having heard of a school that is public rather than private. The public “advantage” translates into a 22
percentage point increase for fathers, 17 percentage points for mothers, resulting in a 20.6 percentage point
increase for household responses that combine both the parents’ information. At the level of the school, the
size of the school as measured by the number of male and female teachers correlates strongly with the
probability of being recognized (for male, female, and household regressions), while every additional year that
a school has been in the village increases the probability of recognition by 0.2 to 0.3 percentage points (males
and females, respectively). At the level of the household, being rich, having educated parents and being close
to a school increase the probability that any school is recognized by parents. For every kilometer that the
school is further from the house, the probability of hearing about it decreases by 7 percentage points for
fathers and 9 for mothers, presumably reflecting the limited mobility of women within the village.
Figure 4.3: Mother Knows Best
0
2
4
6
8
Illiterate Literate Illiterate Literate
Fathers Mothers
Not Regular Regular Very Regular
Days A
bsent in
Data
Colle
cte
d fro
m S
chools
By Parental Literacy
Parental Assessment and Teacher Absenteeism
Nadia
Highlight
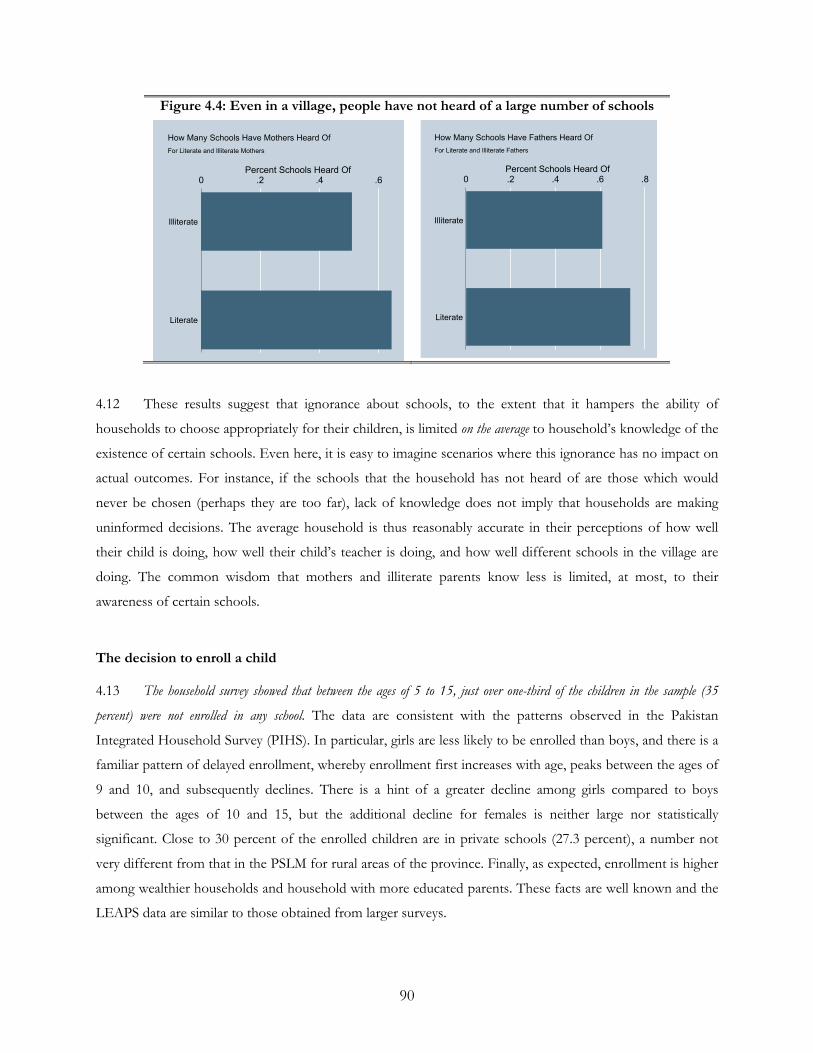
90
Figure 4.4: Even in a village, people have not heard of a large number of schools
4.12 These results suggest that ignorance about schools, to the extent that it hampers the ability of
households to choose appropriately for their children, is limited on the average to household’s knowledge of the
existence of certain schools. Even here, it is easy to imagine scenarios where this ignorance has no impact on
actual outcomes. For instance, if the schools that the household has not heard of are those which would
never be chosen (perhaps they are too far), lack of knowledge does not imply that households are making
uninformed decisions. The average household is thus reasonably accurate in their perceptions of how well
their child is doing, how well their child’s teacher is doing, and how well different schools in the village are
doing. The common wisdom that mothers and illiterate parents know less is limited, at most, to their
awareness of certain schools.
The decision to enroll a child
4.13 The household survey showed that between the ages of 5 to 15, just over one-third of the children in the sample (35
percent) were not enrolled in any school. The data are consistent with the patterns observed in the Pakistan
Integrated Household Survey (PIHS). In particular, girls are less likely to be enrolled than boys, and there is a
familiar pattern of delayed enrollment, whereby enrollment first increases with age, peaks between the ages of
9 and 10, and subsequently declines. There is a hint of a greater decline among girls compared to boys
between the ages of 10 and 15, but the additional decline for females is neither large nor statistically
significant. Close to 30 percent of the enrolled children are in private schools (27.3 percent), a number not
very different from that in the PSLM for rural areas of the province. Finally, as expected, enrollment is higher
among wealthier households and household with more educated parents. These facts are well known and the
LEAPS data are similar to those obtained from larger surveys.
0 .2 .4 .6Percent Schools Heard Of
Literate
Illiterate
For Literate and Illiterate Mothers
How Many Schools Have Mothers Heard Of
0 .2 .4 .6 .8Percent Schools Heard Of
Literate
Illiterate
For Literate and Illiterate Fathers
How Many Schools Have Fathers Heard Of
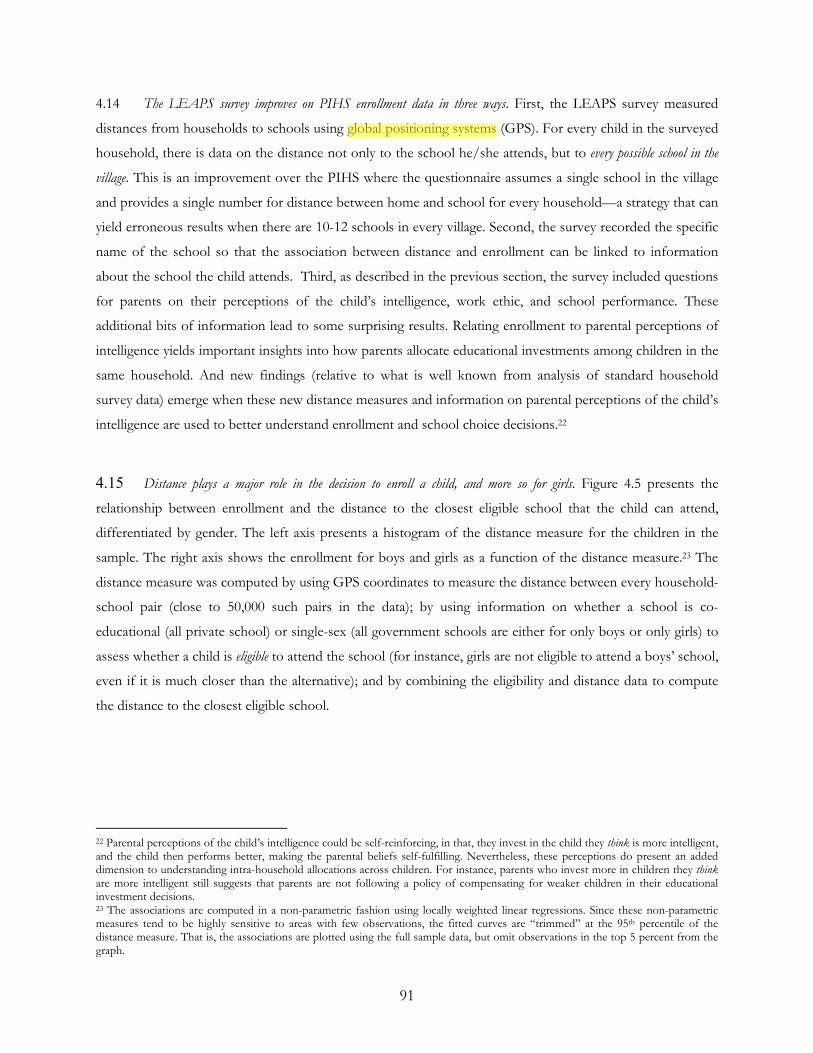
91
4.14 The LEAPS survey improves on PIHS enrollment data in three ways. First, the LEAPS survey measured
distances from households to schools using global positioning systems (GPS). For every child in the surveyed
household, there is data on the distance not only to the school he/she attends, but to every possible school in the
village. This is an improvement over the PIHS where the questionnaire assumes a single school in the village
and provides a single number for distance between home and school for every household—a strategy that can
yield erroneous results when there are 10-12 schools in every village. Second, the survey recorded the specific
name of the school so that the association between distance and enrollment can be linked to information
about the school the child attends. Third, as described in the previous section, the survey included questions
for parents on their perceptions of the child’s intelligence, work ethic, and school performance. These
additional bits of information lead to some surprising results. Relating enrollment to parental perceptions of
intelligence yields important insights into how parents allocate educational investments among children in the
same household. And new findings (relative to what is well known from analysis of standard household
survey data) emerge when these new distance measures and information on parental perceptions of the child’s
intelligence are used to better understand enrollment and school choice decisions.22
4.15 Distance plays a major role in the decision to enroll a child, and more so for girls. Figure 4.5 presents the
relationship between enrollment and the distance to the closest eligible school that the child can attend,
differentiated by gender. The left axis presents a histogram of the distance measure for the children in the
sample. The right axis shows the enrollment for boys and girls as a function of the distance measure.23 The
distance measure was computed by using GPS coordinates to measure the distance between every household-
school pair (close to 50,000 such pairs in the data); by using information on whether a school is co-
educational (all private school) or single-sex (all government schools are either for only boys or only girls) to
assess whether a child is eligible to attend the school (for instance, girls are not eligible to attend a boys’ school,
even if it is much closer than the alternative); and by combining the eligibility and distance data to compute
the distance to the closest eligible school.
22 Parental perceptions of the child’s intelligence could be self-reinforcing, in that, they invest in the child they think is more intelligent, and the child then performs better, making the parental beliefs self-fulfilling. Nevertheless, these perceptions do present an added dimension to understanding intra-household allocations across children. For instance, parents who invest more in children they think are more intelligent still suggests that parents are not following a policy of compensating for weaker children in their educational investment decisions. 23 The associations are computed in a non-parametric fashion using locally weighted linear regressions. Since these non-parametric measures tend to be highly sensitive to areas with few observations, the fitted curves are “trimmed” at the 95th percentile of the distance measure. That is, the associations are plotted using the full sample data, but omit observations in the top 5 percent from the graph.
Nadia
Highlight
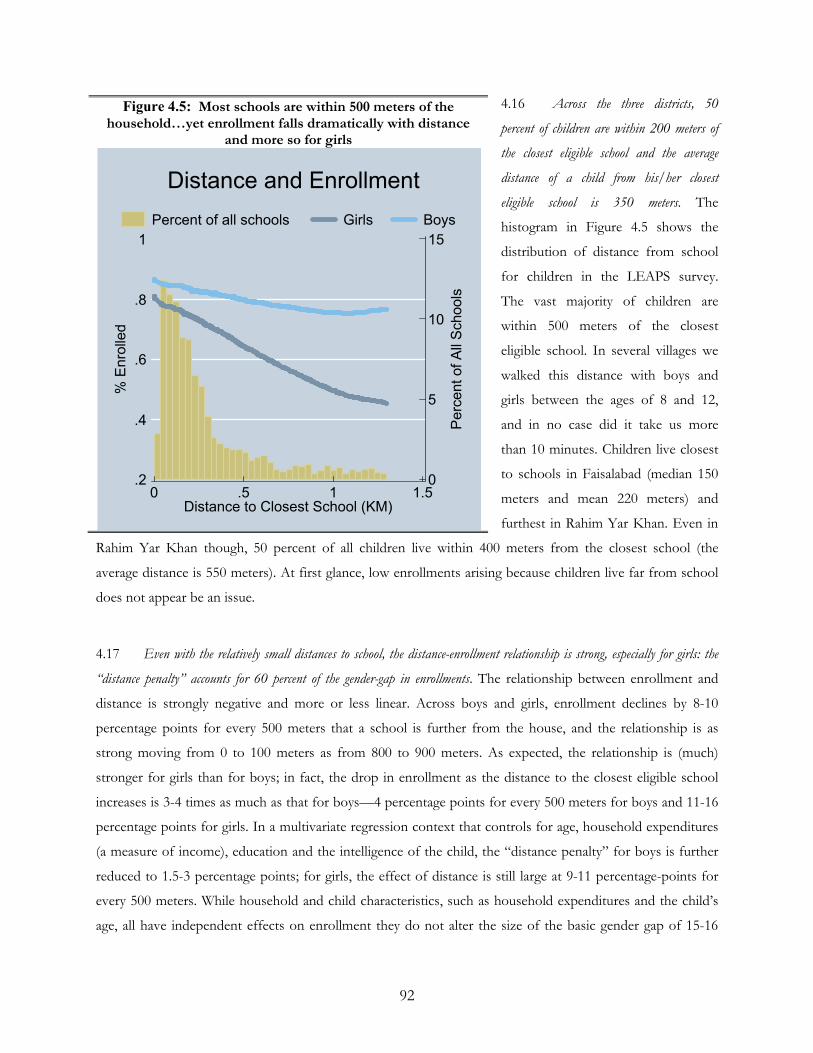
92
4.16 Across the three districts, 50
percent of children are within 200 meters of
the closest eligible school and the average
distance of a child from his/her closest
eligible school is 350 meters. The
histogram in Figure 4.5 shows the
distribution of distance from school
for children in the LEAPS survey.
The vast majority of children are
within 500 meters of the closest
eligible school. In several villages we
walked this distance with boys and
girls between the ages of 8 and 12,
and in no case did it take us more
than 10 minutes. Children live closest
to schools in Faisalabad (median 150
meters and mean 220 meters) and
furthest in Rahim Yar Khan. Even in
Rahim Yar Khan though, 50 percent of all children live within 400 meters from the closest school (the
average distance is 550 meters). At first glance, low enrollments arising because children live far from school
does not appear be an issue.
4.17 Even with the relatively small distances to school, the distance-enrollment relationship is strong, especially for girls: the
“distance penalty” accounts for 60 percent of the gender-gap in enrollments. The relationship between enrollment and
distance is strongly negative and more or less linear. Across boys and girls, enrollment declines by 8-10
percentage points for every 500 meters that a school is further from the house, and the relationship is as
strong moving from 0 to 100 meters as from 800 to 900 meters. As expected, the relationship is (much)
stronger for girls than for boys; in fact, the drop in enrollment as the distance to the closest eligible school
increases is 3-4 times as much as that for boys—4 percentage points for every 500 meters for boys and 11-16
percentage points for girls. In a multivariate regression context that controls for age, household expenditures
(a measure of income), education and the intelligence of the child, the “distance penalty” for boys is further
reduced to 1.5-3 percentage points; for girls, the effect of distance is still large at 9-11 percentage-points for
every 500 meters. While household and child characteristics, such as household expenditures and the child’s
age, all have independent effects on enrollment they do not alter the size of the basic gender gap of 15-16
Figure 4.5: Most schools are within 500 meters of the household…yet enrollment falls dramatically with distance
and more so for girls
.2
.4
.6
.8
1
% E
nro
lled
0
5
10
15
Perc
ent of A
ll S
chools
0 .5 1 1.5Distance to Closest School (KM)
Percent of all schools Girls Boys
Distance and Enrollment
93
percentage points in enrollment in the LEAPS data. In sharp contrast, allowing for the distance-enrollment
relationship to differ across boys and girls reduces the pure effect of gender on enrollment to 5 percentage
points—a dramatic decline of 60 percent.
4.18 One way to assess what policies might increase female enrollment is to ask whether there are any household or child
characteristics that reduce the “distance-penalty”. For instance, if girls from richer households are able to attend
schools farther away this is an indication that with more money, parents will be able to pay for transportation
costs. We examine the effects of two household characteristics (the maximum education of an adult female in
the household and the wealth of the household) and two child characteristics (age and intelligence) on the
distance penalty. The analysis examines a policy question: in the absence of new school construction, how
many households can be induced to send their children, particularly girls, to schools that are farther away?
4.19 The enrollment-distance
relationship for different types of
children and different types of
households is used to address the policy
question. Figure 4.6 presents the
results for girls. As in Figure 4.5,
the relationship between
enrollment and distance to the
closest school for girls is plotted,
but now for different sub-groups.
The top-left graph looks at the
relationship for girls perceived to
be “above average” in intelligence
and “average or below average
intelligence”; the top-right graph
looks at girls aged 5-12 and those
aged 13-15 (post-menarche); the
bottom left by whether the
mother has any schooling or not and the bottom right by household wealth (poor or non-poor is defined
such that 50 percent of all households fall into each of the two categories). Each graph conveys the level effect
of the categorization (the extent to which, say, intelligent girls are more likely to be enrolled than those who
are less intelligent) and the gradient effect of the categorization (the extent to which, say, intelligent girls are
more likely to be sent to schools farther away).
Figure 4.6: Only educated adult females reduce the “distance-penalty” for girls
.2
.4
.6
.8
1
% E
nro
lled
0 .5 1 1.5
Distance to Closest School
Above Average Average or Below
By Intelligence
.2
.4
.6
.8
1
% E
nro
lled
0 .5 1 1.5
Distance to Closest School
Ages 5-12 Ages 12-15
By Age
.2
.4
.6
.8
1
% E
nro
lled
0 .5 1 1.5
Distance to Closest School
No Schooling Some Schooling
By Mothers Education
.2
.4
.6
.8
1
% E
nro
lled
0 .5 1 1.5
Distance to Closest School
Poor Non-Poor
By Household Wealth
Distance and Enrollment For Girls
Nadia
Highlight
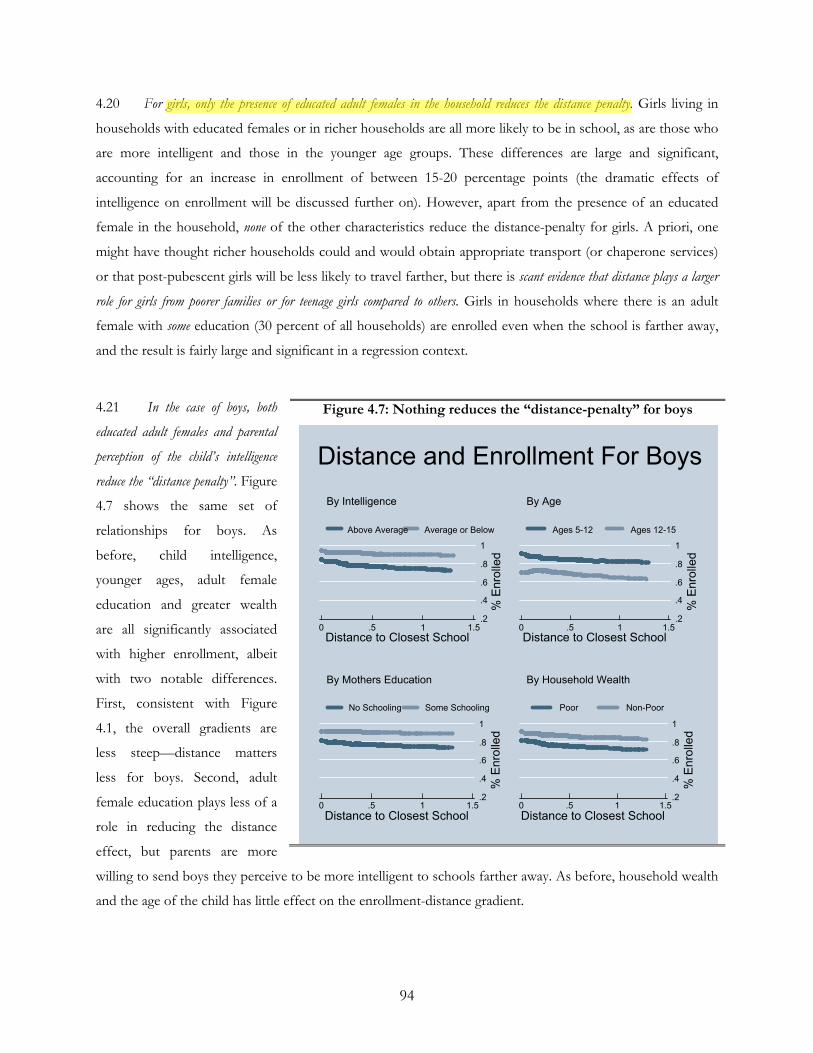
94
4.20 For girls, only the presence of educated adult females in the household reduces the distance penalty. Girls living in
households with educated females or in richer households are all more likely to be in school, as are those who
are more intelligent and those in the younger age groups. These differences are large and significant,
accounting for an increase in enrollment of between 15-20 percentage points (the dramatic effects of
intelligence on enrollment will be discussed further on). However, apart from the presence of an educated
female in the household, none of the other characteristics reduce the distance-penalty for girls. A priori, one
might have thought richer households could and would obtain appropriate transport (or chaperone services)
or that post-pubescent girls will be less likely to travel farther, but there is scant evidence that distance plays a larger
role for girls from poorer families or for teenage girls compared to others. Girls in households where there is an adult
female with some education (30 percent of all households) are enrolled even when the school is farther away,
and the result is fairly large and significant in a regression context.
4.21 In the case of boys, both
educated adult females and parental
perception of the child’s intelligence
reduce the “distance penalty”. Figure
4.7 shows the same set of
relationships for boys. As
before, child intelligence,
younger ages, adult female
education and greater wealth
are all significantly associated
with higher enrollment, albeit
with two notable differences.
First, consistent with Figure
4.1, the overall gradients are
less steep—distance matters
less for boys. Second, adult
female education plays less of a
role in reducing the distance
effect, but parents are more
willing to send boys they perceive to be more intelligent to schools farther away. As before, household wealth
and the age of the child has little effect on the enrollment-distance gradient.
Figure 4.7: Nothing reduces the “distance-penalty” for boys
.2
.4
.6
.8
1
% E
nro
lled
0 .5 1 1.5
Distance to Closest School
Above Average Average or Below
By Intelligence
.2
.4
.6
.8
1
% E
nro
lled
0 .5 1 1.5
Distance to Closest School
Ages 5-12 Ages 12-15
By Age
.2
.4
.6
.8
1
% E
nro
lled
0 .5 1 1.5
Distance to Closest School
No Schooling Some Schooling
By Mothers Education
.2
.4
.6
.8
1
% E
nro
lled
0 .5 1 1.5
Distance to Closest School
Poor Non-Poor
By Household Wealth
Distance and Enrollment For Boys
Nadia
Highlight
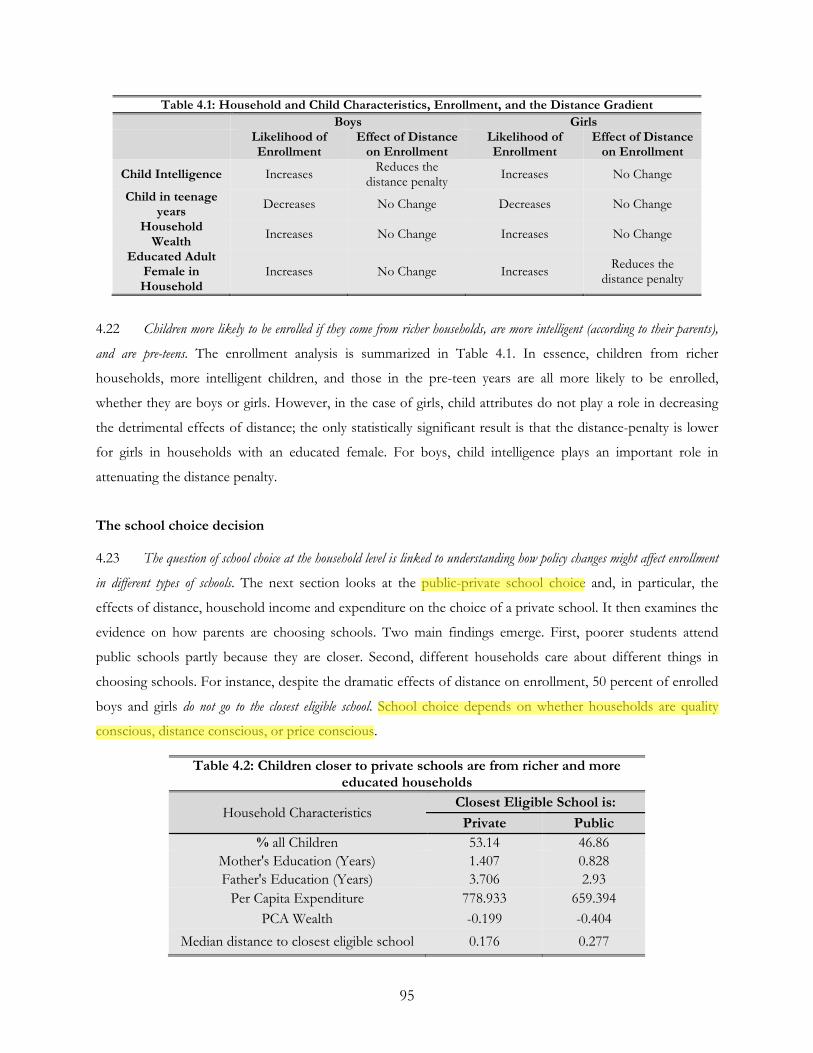
95
Table 4.1: Household and Child Characteristics, Enrollment, and the Distance Gradient
Boys Girls
Likelihood of Enrollment
Effect of Distance on Enrollment
Likelihood of Enrollment
Effect of Distance on Enrollment
Child Intelligence Increases Reduces the
distance penalty Increases No Change
Child in teenage years
Decreases No Change Decreases No Change
Household Wealth
Increases No Change Increases No Change
Educated Adult Female in Household
Increases No Change Increases Reduces the
distance penalty
4.22 Children more likely to be enrolled if they come from richer households, are more intelligent (according to their parents),
and are pre-teens. The enrollment analysis is summarized in Table 4.1. In essence, children from richer
households, more intelligent children, and those in the pre-teen years are all more likely to be enrolled,
whether they are boys or girls. However, in the case of girls, child attributes do not play a role in decreasing
the detrimental effects of distance; the only statistically significant result is that the distance-penalty is lower
for girls in households with an educated female. For boys, child intelligence plays an important role in
attenuating the distance penalty.
The school choice decision
4.23 The question of school choice at the household level is linked to understanding how policy changes might affect enrollment
in different types of schools. The next section looks at the public-private school choice and, in particular, the
effects of distance, household income and expenditure on the choice of a private school. It then examines the
evidence on how parents are choosing schools. Two main findings emerge. First, poorer students attend
public schools partly because they are closer. Second, different households care about different things in
choosing schools. For instance, despite the dramatic effects of distance on enrollment, 50 percent of enrolled
boys and girls do not go to the closest eligible school. School choice depends on whether households are quality
conscious, distance conscious, or price conscious.
Table 4.2: Children closer to private schools are from richer and more educated households
Household Characteristics Closest Eligible School is:
Private Public
% all Children 53.14 46.86
Mother's Education (Years) 1.407 0.828
Father's Education (Years) 3.706 2.93
Per Capita Expenditure 778.933 659.394
PCA Wealth -0.199 -0.404
Median distance to closest eligible school 0.176 0.277
Nadia
Highlight
Nadia
Highlight
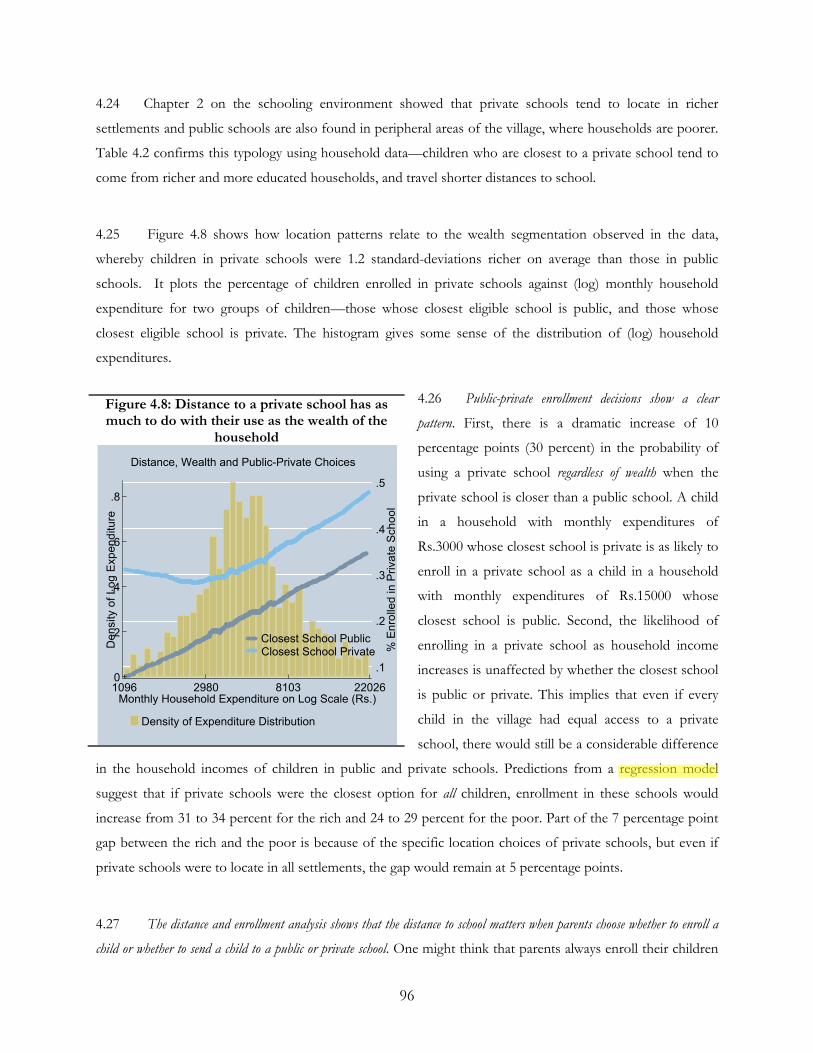
96
4.24 Chapter 2 on the schooling environment showed that private schools tend to locate in richer
settlements and public schools are also found in peripheral areas of the village, where households are poorer.
Table 4.2 confirms this typology using household data—children who are closest to a private school tend to
come from richer and more educated households, and travel shorter distances to school.
4.25 Figure 4.8 shows how location patterns relate to the wealth segmentation observed in the data,
whereby children in private schools were 1.2 standard-deviations richer on average than those in public
schools. It plots the percentage of children enrolled in private schools against (log) monthly household
expenditure for two groups of children—those whose closest eligible school is public, and those whose
closest eligible school is private. The histogram gives some sense of the distribution of (log) household
expenditures.
4.26 Public-private enrollment decisions show a clear
pattern. First, there is a dramatic increase of 10
percentage points (30 percent) in the probability of
using a private school regardless of wealth when the
private school is closer than a public school. A child
in a household with monthly expenditures of
Rs.3000 whose closest school is private is as likely to
enroll in a private school as a child in a household
with monthly expenditures of Rs.15000 whose
closest school is public. Second, the likelihood of
enrolling in a private school as household income
increases is unaffected by whether the closest school
is public or private. This implies that even if every
child in the village had equal access to a private
school, there would still be a considerable difference
in the household incomes of children in public and private schools. Predictions from a regression model
suggest that if private schools were the closest option for all children, enrollment in these schools would
increase from 31 to 34 percent for the rich and 24 to 29 percent for the poor. Part of the 7 percentage point
gap between the rich and the poor is because of the specific location choices of private schools, but even if
private schools were to locate in all settlements, the gap would remain at 5 percentage points.
4.27 The distance and enrollment analysis shows that the distance to school matters when parents choose whether to enroll a
child or whether to send a child to a public or private school. One might think that parents always enroll their children
Figure 4.8: Distance to a private school has as much to do with their use as the wealth of the
household
.1
.2
.3
.4
.5
% E
nro
lled
in
Pri
va
te S
ch
oo
l
0
.2
.4
.6
.8
De
nsity o
f L
og
Exp
en
ditu
re
1096 2980 8103 22026Monthly Household Expenditure on Log Scale (Rs.)
Density of Expenditure Distribution
Closest School PublicClosest School Private
Distance, Wealth and Public-Private Choices
Nadia
Highlight
97
in the closest school given the strong relationship between distance and enrollment (a 500-meter increase in
this distance leads to a 20 percentage point decline for girls). Yet the results so far say little about the school
that the parent actually chooses—while children are less likely to attend school if it is further away, this does
not necessarily imply that all enrolled children go to the closest eligible school.
4.28 Other selection factors. In fact, only 36 percent of all enrolled boys and 38 percent of all enrolled girls
attend the closest eligible school. Of the remainder, 52 percent choose to bypass a nearby private school to go
to a public school that is further away; 15 percent bypass a nearby government school to go to a more distant
private school, 25 percent choose a most distant government school than the one that is closest to their
house and 12 percent bypass one private school to go to another. Neither is bypassing a purely male-child
phenomenon. While boys are more likely to bypass the closest school, 60 percent of all enrolled girls also
travel beyond the closest eligible school to one that is further away. The additional distances they travel are
not large in themselves, ranging from 150 meters (private for private) to 500 meters (public for public), but
these do attain greater significance in light of the enrollment-distance relationship discussed above.24 These
results may be reconciled in a number of ways.
4.29 Data on school bypassing suggests three types of households. A potential reconciliation is that the child whose
enrollment status is affected by the construction of a nearby school is very different from the one who
bypasses a school that is next door to go to one that is further away. In fact, the only child whose enrollment
changes after school construction nearby is the child who is sent to the closest school. The data on bypassing
suggests three types of households in the sampled villages (see Annexure 1, Table A4.1):
• Distance conscious households are characterized by a combination of fewer enrolled children and
enrollment in the closest school for those who attend.
• Quality conscious households bypass a nearby public school to go to a private school further away.
These households tend to be rich with more educated parents, and the schools they finally select
report learning levels close to one standard-deviation higher than the school closest to their house.
• Price conscious households bypass a nearby private school to go to a public school further away. As
one may expect, these households tend to be poorer, less educated, and children are enrolled in
schools where the learning levels are much lower than the school close to their house.
24 If all households and children were identical this finding is puzzling. Consider a household with a school 500 meters away from home. The results suggest is that if the government constructs another school 200 meters from the household, enrollment would increase, but some of the newly enrolled children would go to the school that is 500 meters away. A natural question is: why were these children, whose choice is not affected by the construction of the closer school, not in school in the first place?
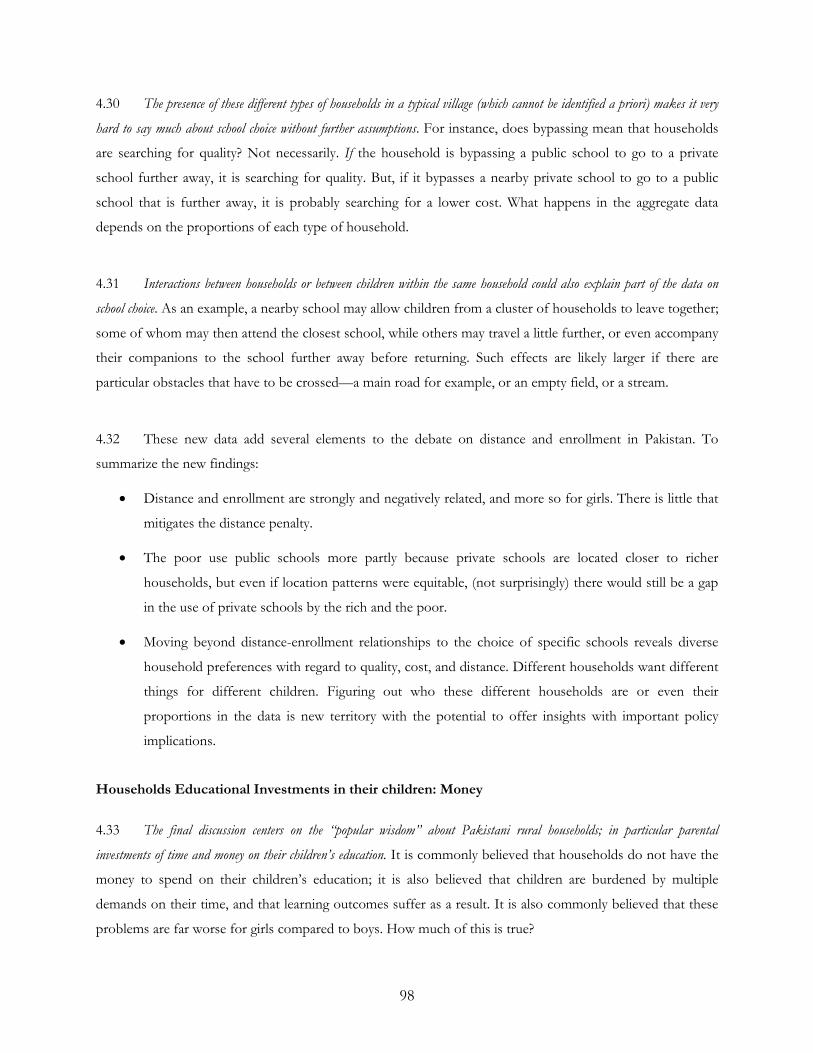
98
4.30 The presence of these different types of households in a typical village (which cannot be identified a priori) makes it very
hard to say much about school choice without further assumptions. For instance, does bypassing mean that households
are searching for quality? Not necessarily. If the household is bypassing a public school to go to a private
school further away, it is searching for quality. But, if it bypasses a nearby private school to go to a public
school that is further away, it is probably searching for a lower cost. What happens in the aggregate data
depends on the proportions of each type of household.
4.31 Interactions between households or between children within the same household could also explain part of the data on
school choice. As an example, a nearby school may allow children from a cluster of households to leave together;
some of whom may then attend the closest school, while others may travel a little further, or even accompany
their companions to the school further away before returning. Such effects are likely larger if there are
particular obstacles that have to be crossed—a main road for example, or an empty field, or a stream.
4.32 These new data add several elements to the debate on distance and enrollment in Pakistan. To
summarize the new findings:
• Distance and enrollment are strongly and negatively related, and more so for girls. There is little that
mitigates the distance penalty.
• The poor use public schools more partly because private schools are located closer to richer
households, but even if location patterns were equitable, (not surprisingly) there would still be a gap
in the use of private schools by the rich and the poor.
• Moving beyond distance-enrollment relationships to the choice of specific schools reveals diverse
household preferences with regard to quality, cost, and distance. Different households want different
things for different children. Figuring out who these different households are or even their
proportions in the data is new territory with the potential to offer insights with important policy
implications.
Households Educational Investments in their children: Money
4.33 The final discussion centers on the “popular wisdom” about Pakistani rural households; in particular parental
investments of time and money on their children’s education. It is commonly believed that households do not have the
money to spend on their children’s education; it is also believed that children are burdened by multiple
demands on their time, and that learning outcomes suffer as a result. It is also commonly believed that these
problems are far worse for girls compared to boys. How much of this is true?
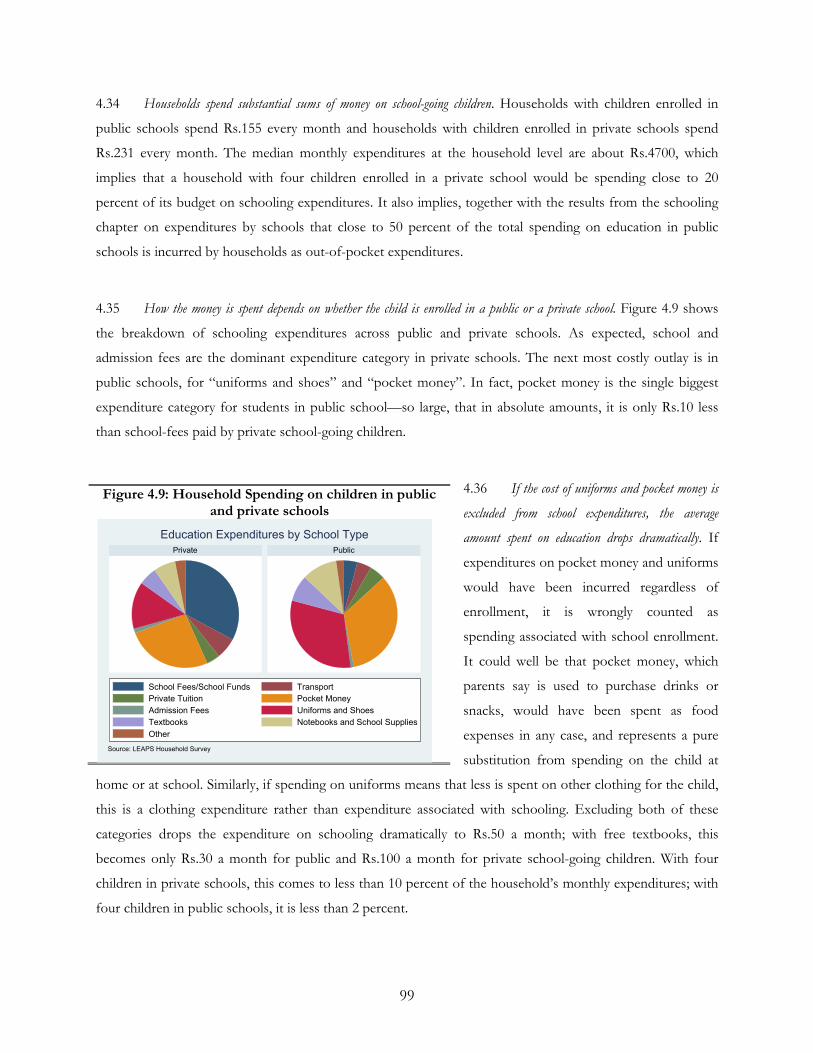
99
4.34 Households spend substantial sums of money on school-going children. Households with children enrolled in
public schools spend Rs.155 every month and households with children enrolled in private schools spend
Rs.231 every month. The median monthly expenditures at the household level are about Rs.4700, which
implies that a household with four children enrolled in a private school would be spending close to 20
percent of its budget on schooling expenditures. It also implies, together with the results from the schooling
chapter on expenditures by schools that close to 50 percent of the total spending on education in public
schools is incurred by households as out-of-pocket expenditures.
4.35 How the money is spent depends on whether the child is enrolled in a public or a private school. Figure 4.9 shows
the breakdown of schooling expenditures across public and private schools. As expected, school and
admission fees are the dominant expenditure category in private schools. The next most costly outlay is in
public schools, for “uniforms and shoes” and “pocket money”. In fact, pocket money is the single biggest
expenditure category for students in public school—so large, that in absolute amounts, it is only Rs.10 less
than school-fees paid by private school-going children.
4.36 If the cost of uniforms and pocket money is
excluded from school expenditures, the average
amount spent on education drops dramatically. If
expenditures on pocket money and uniforms
would have been incurred regardless of
enrollment, it is wrongly counted as
spending associated with school enrollment.
It could well be that pocket money, which
parents say is used to purchase drinks or
snacks, would have been spent as food
expenses in any case, and represents a pure
substitution from spending on the child at
home or at school. Similarly, if spending on uniforms means that less is spent on other clothing for the child,
this is a clothing expenditure rather than expenditure associated with schooling. Excluding both of these
categories drops the expenditure on schooling dramatically to Rs.50 a month; with free textbooks, this
becomes only Rs.30 a month for public and Rs.100 a month for private school-going children. With four
children in private schools, this comes to less than 10 percent of the household’s monthly expenditures; with
four children in public schools, it is less than 2 percent.
Figure 4.9: Household Spending on children in public and private schools
Private Public
School Fees/School Funds Transport
Private Tuition Pocket Money
Admission Fees Uniforms and Shoes
Textbooks Notebooks and School Supplies
Other
Source: LEAPS Household Survey
Education Expenditures by School Type
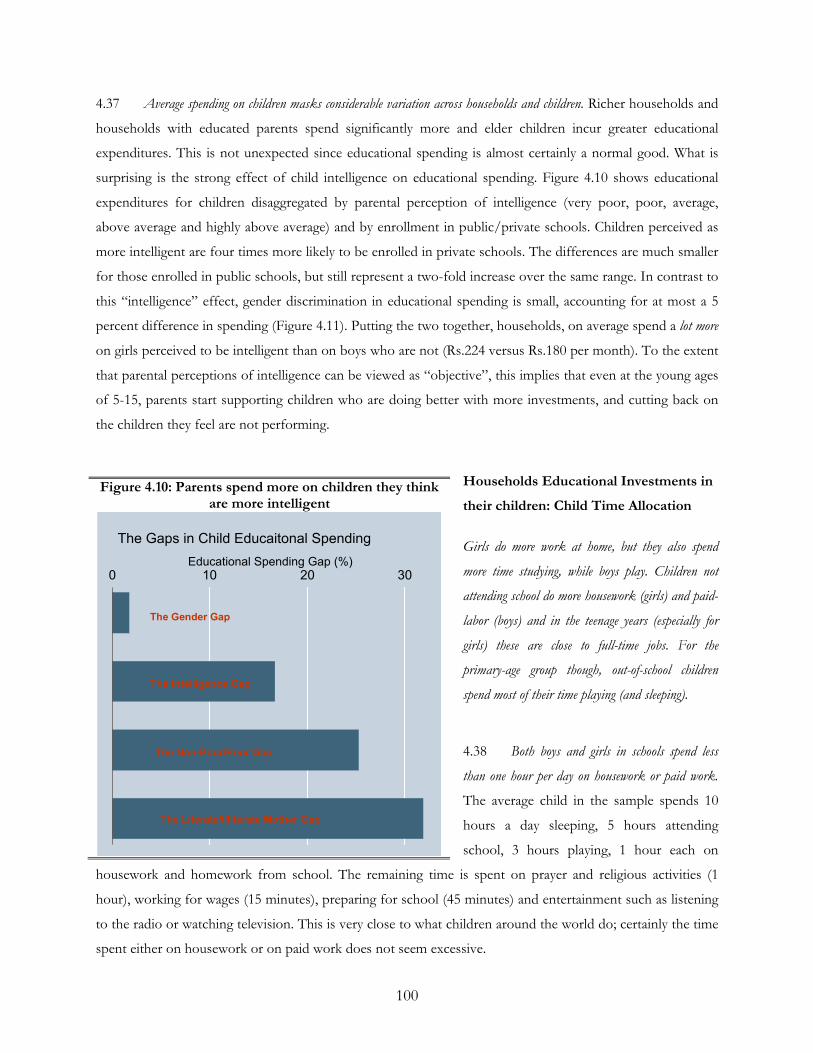
100
4.37 Average spending on children masks considerable variation across households and children. Richer households and
households with educated parents spend significantly more and elder children incur greater educational
expenditures. This is not unexpected since educational spending is almost certainly a normal good. What is
surprising is the strong effect of child intelligence on educational spending. Figure 4.10 shows educational
expenditures for children disaggregated by parental perception of intelligence (very poor, poor, average,
above average and highly above average) and by enrollment in public/private schools. Children perceived as
more intelligent are four times more likely to be enrolled in private schools. The differences are much smaller
for those enrolled in public schools, but still represent a two-fold increase over the same range. In contrast to
this “intelligence” effect, gender discrimination in educational spending is small, accounting for at most a 5
percent difference in spending (Figure 4.11). Putting the two together, households, on average spend a lot more
on girls perceived to be intelligent than on boys who are not (Rs.224 versus Rs.180 per month). To the extent
that parental perceptions of intelligence can be viewed as “objective”, this implies that even at the young ages
of 5-15, parents start supporting children who are doing better with more investments, and cutting back on
the children they feel are not performing.
Households Educational Investments in
their children: Child Time Allocation
Girls do more work at home, but they also spend
more time studying, while boys play. Children not
attending school do more housework (girls) and paid-
labor (boys) and in the teenage years (especially for
girls) these are close to full-time jobs. For the
primary-age group though, out-of-school children
spend most of their time playing (and sleeping).
4.38 Both boys and girls in schools spend less
than one hour per day on housework or paid work.
The average child in the sample spends 10
hours a day sleeping, 5 hours attending
school, 3 hours playing, 1 hour each on
housework and homework from school. The remaining time is spent on prayer and religious activities (1
hour), working for wages (15 minutes), preparing for school (45 minutes) and entertainment such as listening
to the radio or watching television. This is very close to what children around the world do; certainly the time
spent either on housework or on paid work does not seem excessive.
Figure 4.10: Parents spend more on children they think are more intelligent
0 10 20 30Educational Spending Gap (%)
The Gaps in Child Educaitonal Spending
The Gender Gap
The Intelligence Gap
The Non-Poor/Poor Gap
The Literate/Illiterate Mother Gap
0 10 20 30Educational Spending Gap (%)
The Gaps in Child Educaitonal Spending
The Gender Gap
The Intelligence Gap
The Non-Poor/Poor Gap
The Literate/Illiterate Mother Gap
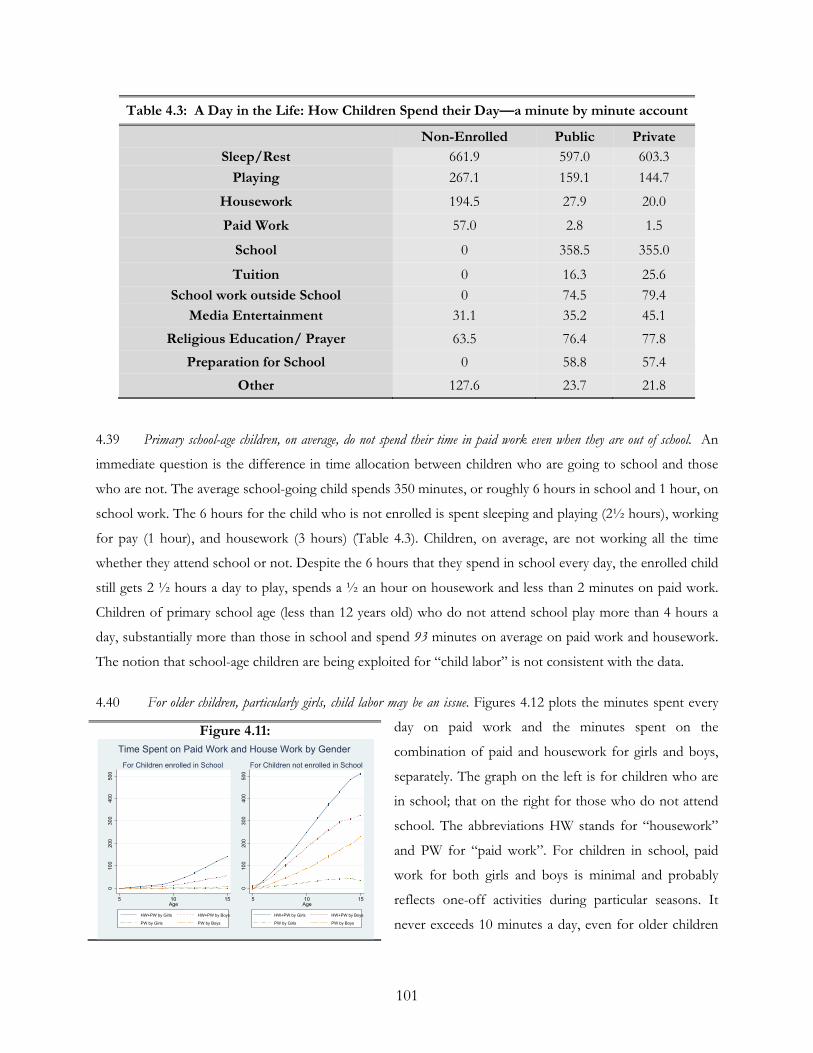
101
Table 4.3: A Day in the Life: How Children Spend their Day—a minute by minute account
Non-Enrolled Public Private
Sleep/Rest 661.9 597.0 603.3
Playing 267.1 159.1 144.7
Housework 194.5 27.9 20.0
Paid Work 57.0 2.8 1.5
School 0 358.5 355.0
Tuition 0 16.3 25.6
School work outside School 0 74.5 79.4
Media Entertainment 31.1 35.2 45.1
Religious Education/ Prayer 63.5 76.4 77.8
Preparation for School 0 58.8 57.4
Other 127.6 23.7 21.8
4.39 Primary school-age children, on average, do not spend their time in paid work even when they are out of school. An
immediate question is the difference in time allocation between children who are going to school and those
who are not. The average school-going child spends 350 minutes, or roughly 6 hours in school and 1 hour, on
school work. The 6 hours for the child who is not enrolled is spent sleeping and playing (2½ hours), working
for pay (1 hour), and housework (3 hours) (Table 4.3). Children, on average, are not working all the time
whether they attend school or not. Despite the 6 hours that they spend in school every day, the enrolled child
still gets 2 ½ hours a day to play, spends a ½ an hour on housework and less than 2 minutes on paid work.
Children of primary school age (less than 12 years old) who do not attend school play more than 4 hours a
day, substantially more than those in school and spend 93 minutes on average on paid work and housework.
The notion that school-age children are being exploited for “child labor” is not consistent with the data.
4.40 For older children, particularly girls, child labor may be an issue. Figures 4.12 plots the minutes spent every
day on paid work and the minutes spent on the
combination of paid and housework for girls and boys,
separately. The graph on the left is for children who are
in school; that on the right for those who do not attend
school. The abbreviations HW stands for “housework”
and PW for “paid work”. For children in school, paid
work for both girls and boys is minimal and probably
reflects one-off activities during particular seasons. It
never exceeds 10 minutes a day, even for older children
Figure 4.11:
01
00
20
03
00
40
05
00
5 10 15Age
HW+PW by Girls HW+PW by Boys
PW by Girls PW by Boys
For Children enrolled in School
01
00
20
03
00
40
05
00
5 10 15Age
HW+PW by Girls HW+PW by Boys
PW by Girls PW by Boys
For Children not enrolled in School
Time Spent on Paid Work and House Work by Gender
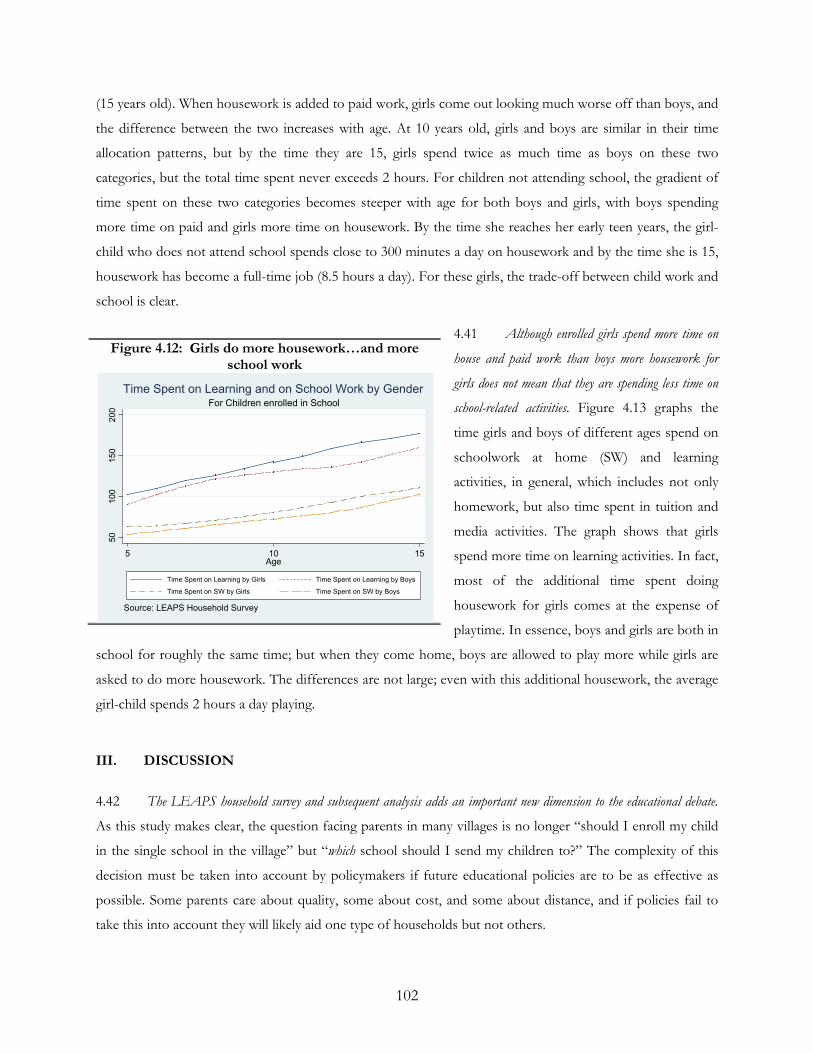
102
(15 years old). When housework is added to paid work, girls come out looking much worse off than boys, and
the difference between the two increases with age. At 10 years old, girls and boys are similar in their time
allocation patterns, but by the time they are 15, girls spend twice as much time as boys on these two
categories, but the total time spent never exceeds 2 hours. For children not attending school, the gradient of
time spent on these two categories becomes steeper with age for both boys and girls, with boys spending
more time on paid and girls more time on housework. By the time she reaches her early teen years, the girl-
child who does not attend school spends close to 300 minutes a day on housework and by the time she is 15,
housework has become a full-time job (8.5 hours a day). For these girls, the trade-off between child work and
school is clear.
4.41 Although enrolled girls spend more time on
house and paid work than boys more housework for
girls does not mean that they are spending less time on
school-related activities. Figure 4.13 graphs the
time girls and boys of different ages spend on
schoolwork at home (SW) and learning
activities, in general, which includes not only
homework, but also time spent in tuition and
media activities. The graph shows that girls
spend more time on learning activities. In fact,
most of the additional time spent doing
housework for girls comes at the expense of
playtime. In essence, boys and girls are both in
school for roughly the same time; but when they come home, boys are allowed to play more while girls are
asked to do more housework. The differences are not large; even with this additional housework, the average
girl-child spends 2 hours a day playing.
III. DISCUSSION
4.42 The LEAPS household survey and subsequent analysis adds an important new dimension to the educational debate.
As this study makes clear, the question facing parents in many villages is no longer “should I enroll my child
in the single school in the village” but “which school should I send my children to?” The complexity of this
decision must be taken into account by policymakers if future educational policies are to be as effective as
possible. Some parents care about quality, some about cost, and some about distance, and if policies fail to
take this into account they will likely aid one type of households but not others.
Figure 4.12: Girls do more housework…and more school work
50
100
150
200
5 10 15Age
Time Spent on Learning by Girls Time Spent on Learning by Boys
Time Spent on SW by Girls Time Spent on SW by Boys
Source: LEAPS Household Survey
For Children enrolled in School
Time Spent on Learning and on School Work by Gender
103
4.43 Three key dynamics emerge that are useful for the policy debate in this more complex environment. First, distance is
important for enrollment, especially for girls. Second, parents are fairly well-informed and make substantial
investments in their children’s education. Third, through their choices of whether to enroll a child, through
the choice of school (private or public) and finally through the amount they chose to spend, households pick
“winners” and try to carry them through. In the following section, we examine the implications these three
dynamics have for two key policy issues currently under debate; a third important policy issue—the regulation
of schools—is discussed in the epilogue.
Potential Policy 1: Improving education for the girl-child
4.44 The gender gap in educational attainment is large, but as the findings in this chapter show, the gender gap is almost
entirely restricted to enrollment. The gap in education expenditures is small (not more than 5 percent) and
households spend a lot more on intelligent girls than on less intelligent boys. It is true that girls enrolled in
school work more at home than boys, but the average working hours are still less than an hour per day and
girls also do more schoolwork at home compared to boys.
4.45 The commonly held view that distance to school affects girls more than boys is supported by the data and accounts for 60
percent of the gender gap in enrollment. And that is precisely the problem. The relationship is so strong and so
negative, that it really does not make much sense viewed in physical terms. Enrollment drops by 20
percentage points for girls for every 500 meters increase in distance from home to school. When we walked
with out-of-school children from households in our sample, it took us 10 minutes to walk these 500 meters.
With 12 schools in every village and with 50 percent of our households within 500 meters of a school, the
policy option of building more schools makes no sense. No government can ensure the availability of a
school within 100 meters of every household; such a policy is neither feasible nor cost-effective. Furthermore,
household wealth, the child’s age and the child’s intelligent all have an independent effect on enrollment, but
none of them mitigate the distance “penalty”, except for the presence of an educated female, which is outside
the purview of any short-term policies. It appears then that this distance effect has little to with monetary
needs of the family or whether the child has reached her teenage years. A workable policy is not yet evident.
4.46 The Punjab government’s stipend program, whereby households are given Rs.200 per month for every enrolled girl
between Class 5 and 8 signals the government’s commitment to education, yet the costs may far outweigh the benefits. An
evaluation (Chaudhury and Parjuli 2006) shows the program increased enrollment by 10 percent. Out of 110
girls now in school, 100 would have gone to school with or without the stipend and 10 additional girls
changed status from non-enrollment to enrollment because of the stipend. The price of targeting these 10
girls is the stipend paid to all 100. The cost per additional girl-child enrolled is the total cost of the stipend divided
104
by 10—a staggering $400 per marginal child. The stipend cannot distinguish between children who would be
going to school anyway, or children who change their decision as a result of the stipend, or children who
would not go to school with or without the stipend. The cost to target the second group is unsustainably
large.
4.47 Differences across households are evident in the significant fraction of children who bypass the closest school to go to a
school that is further away. Although males are slightly more likely to bypass, 60 percent of all enrolled girls are
bypassing as well. The key to improving female enrollment is to understand better the relationship between
enrollment and distance. Why is it that some households and children are able to send their kids to schools
further away, while others take their children out as the distance to school increases? Would this change if
chaperones or elder siblings or neighborhood children walk to school together? This requires further
research.
Potential Policy 2: Improving schooling outcomes through more school inputs
4.48 The goals of policies to increase school inputs need to be debated through a household “lens”. The government
recently instituted a policy of providing free textbooks. This may bring in children for whom the costs of
textbooks were prohibitive and who were therefore not enrolled. It may also have improved learning among
the children who were already enrolled but did not have access to textbooks. The debate here centers around
two issues. First, among the out-of-school children, was the cost of textbooks really prohibitive? The data are
unclear, and much depends on whether we think of pocket money and spending on uniforms as substitutes
for household expenditures on all children. Second, giving out textbooks for free means that households who
were earlier buying textbooks for their children will stop buying them so that the total number of textbooks a
child has access to remains unaffected by the policy. What is the specific aim of this policy? If all children
were enrolled, free textbooks for instance, are a pure income subsidy since parents save the equivalent amount
by not buying textbooks on their own. While this might be a desirable effect of such a program, we should
not expect improvements in learning as a consequence. We are asking, in essence, that a household “lens” be
applied in thinking of potential educational policy.
4.49 A household lens suggests a role for educational policies that support children who receive fewer inputs at home. Right
now some children are heavily supported by households and others are left by the wayside. Children
perceived as intelligent by their parents are more likely to be enrolled, more likely to be in private schools, and
have three times as much money spent on them. In high-income countries, higher investments in more
“productive” children typically kick in around the college-going years. But for children in primary school,
$12,500 per child is spent on learning-disabled children in the United States compared to $6,500 spent on
105
“regular” children, with an implied spending ratio of close to 2:1. In Pakistan, by the time children are in
Class 3, parents have already picked “winners” perceived to be more intelligent and are spending three times
as much on these children. Public money for education should include these “vulnerable” children. In India,
for instance, there is some evidence that programs designed to help poorly performing children (Banerjee and
Cole, Duflo, and Linden 2005) yield positive effects. Maybe it is time to think of similar programs for
Pakistan.
4.50 It may also be time for a wider discussion about the overall goals of the educational system. South Asian systems
were traditionally formulated for stringent selection of talented students: the average or poorly performing
child was relegated to trades or lifestyles that did not require formal schooling. The system was designed to
bring out the best possible children through tests and screening at every possible occasion. The data show
that households are mirroring this system—certain public sector jobs, for instance, are made available only to
children who have passed Class 10; not surprisingly, returns to education in Pakistan are convex at low levels of
education. If a family is aiming for such a job for one of its children, it will be spent considerable resources to
ensure that the required qualification is obtained; if the child can get to Class 9, but no further, the returns are
significantly lower. These kinds of “non-linear” returns or “sheepskin” effects, as they are known in the
literature, may explain non-compensatory behavior among households at a young age. To the extent that the
desire for the average child to perform well seems to be more widely held, it is time now to think about
policies that screen poorly performing children and take measures to help them specifically, without spending
large amounts on the average child.
4.51 Whatever these eventual policies may be, each deserves to be rigorously evaluated. During the course of our
surveys, a female teacher offered the following wisdom: “The difference”, she said, “between Pakistan and Japan is
that in Japan they think for 50 years and then make policies, in Pakistan we make the policy first and do the thinking later, if
at all.” The existing evidence offers policy makers clear choices in some areas—teacher’s performance, for
instance, would certainly improve if they were held accountable for their actions. However, differences across
households and children make predictions about policy effects harder—the ultimate effects of these policies
will depend on the proportion of households with different types of preferences and returns to education.
This proportion will certainly differ across regions (what works for Punjab may not work for Sindh) and
plausibly across villages. In other areas more needs to be understood about the nature of differences across
households and children that affect household educational choices. Experimenting with and evaluating
policies that are in the implementation process is critical. These evaluations will at least validate how useful
they were in the region they were implemented. They will be even more informative if applied using the
106
household “lens” so the extent to which these policies interact with the decisions that households make can
be better understood.
4.52 An advertising executive once remarked that he “knows that half the money spent on advertising is wasted, the problem
is that he does not know which half.” This is particularly true in this case. Policies now need to identify the marginal
rather than the average child so that they do not spend a lot of money on average children to benefit those who
are “marginal”. In these situations, it is often best to enable households to make better decisions without
forcing a particular set of actions on them; how the government can act as a better enabler requires discussion
and debate.
107
Chapter 5: Thoughts for Discussion and Debate
5.1 The state provides equitable access to education at the village level in Punjab. Article 37 (b) & (c) of the
Constitution of Pakistan (1973) affirms that “the State shall remove illiteracy and provide free and
compulsory secondary education within the minimum possible period.” During the 1990s enrollment rose
rapidly in Punjab and other provinces. Based on the sample in the LEAPS study, which covers at least 50
percent of the population of Punjab at the time of the study, the State is indeed providing access to
education. Every village in the sample has multiple free public schools, and average learning is similar across
villages, independent of village-level wealth or learning. Data from the National Education Census (2005)
confirm that there are more government schools per student in poorer villages in all of rural Pakistan, thus
extending the findings from the LEAPS sample villages..
5.2 Literacy goals often unmet. What Pakistan needs to debate is whether any attempt is being made to
address the affirmation that the “State shall remove illiteracy”. It also needs to debate the implications of the
rapid rise of well-performing private schools for achieving this goal. This chapter examines five issues related
to the quality of education and future education policy that are frequently debated in Pakistan. The goal of
this chapter is to argue that evidence can yield important insights for policy and provide a framework for
further debate.
Issue 1: The Learning Agenda: What does it imply?
5.3 Increasing learning requires bringing more children into school. One easily identified group of children at risk
of being left out of the educational system are those who live “far” from school and are therefore less likely
to be enrolled. This study agrees with a number of other studies in Pakistan that the distance to school has a
big impact on enrollment, particularly for girls. The problem is that this effect is too big for a potential
supply-side response of constructing more schools to bring all out-of-school children into schools. It would
be expensive to construct, maintain, and staff schools within 100 meters of every household.
5.4 The government needs to actively pilot interventions to see how these distant effects can be overcome. The problem
with the results thus far is that there are no clear household or child characteristics that mitigate the harmful
effects of distance. An idea that has been advanced is the use of “chaperones” who bring children to
school—anecdotally, it has been suggested that when children can walk to school together or with a
responsible adult, they are more likely to enroll. It is exceedingly difficult to assess this type of phenomenon
108
with these data. This is partly because there are too few households to construct indicators of what
“neighbors” are doing and partly because such interaction effects (for instance, using the number of siblings
as an appropriate indicator) are hard to interpret. It is difficult to dissociate household effects from the
independent effects of having someone to go to school with. If “chaperones” are indeed the solution, this
should not be very hard to address. Given the difficulties in assessing the impact observationally, this sort of
intervention requires rigorous evaluation using randomized strategies.
5.5 Children who do not attend school work for pay less than two hours a day. The data are also notable in
showing that the alternative to school is not work. Primary age children who are not in school spend 93
minutes a day (an hour-and-a-half) working at home and working for a wage. Getting these children into
school does not require “compensating” parents for a loss of income; but it may require schools that are
more interesting for children and schools where learning is of a higher quality. The appropriate infrastructure
and pedagogic “package” to get children who are disinterested and not pushed by their parents into school
requires the combined knowledge of educators, head-teachers and parents themselves.
5.6 While improving enrollment is critical toward ensuring that children learn, it is insufficient. Children are unable to
read simple sentences in Urdu and add and subtract by the time they are in Class 3. That greater enrollment
does not imply more learning demonstrates the importance of a holistic approach toward the educational
rights of the Pakistani citizen. More children may be attending school in rich and highly literate villages
(Chapter 1), but the average child’s test scores in Class 3 remain largely unchanged.
5.7 Once children are in school, efforts to measure performance must follow. Unfortunately, there is no magic recipe
for improving learning. Despite many years of research in high income countries, there is little consensus
(apart from the role of teachers discussed below) on how learning can be improved. There is considerable
agreement, however, that collecting information on learning is the critical first step for the broader “learning
agenda”. Before we even think of how learning may be engendered, a system for tracking learning in different
schools over time based on tests conducted by a reliable and impartial authority will important to ensure that
citizens know how well their children are performing in school.
5.8 Information on enrollment and learning outcomes need to become part of the popular discourse on the state of
Pakistani education. The widespread use of a test at the end of Class 5 in Punjab province in 2006 is an
important first step. Further work is required to ensure that citizens are able to monitor and hold the state
accountable for its performance in guaranteeing the right to education. Ensuring exam results are
109
standardized and replicated every year in a reliable manner is only part of the challenge; access to comparable
data for all schools is also critical. In recent years, Punjab has collected annual data on all its public schools,
the Federal Bureau of Statistics has enumerated and collected information on all schools in the country, and
Punjab has tested children in Class 5. Yet, these data are not publicly available and their accuracy has yet to be
subjected to independent analysis. Researchers, academics, multilateral institutions (who are often implicated in
the withholding of data and information) and those interested in the Pakistani education system need to
ensure the general public has ready access to this information. While enrollment numbers are currently
released on an annual basis, similar summary statistics on academic achievement need to be made available as
well to ensure school quality becomes part of the popular discourse on the state of Pakistani education. In the
United States, school performance in learning is posted on the internet. This may be a worthy goal to aspire
to.
5.9 The comparison of public and private schools made here strongly suggest that better learning is not out of reach of the
Pakistani system. Even within the same villages, private schools are doing much better in all subjects than
public schools. Furthermore, the differences between schools are far greater than the differences across
households or villages, and are equally strong after accounting for parental wealth and education. Based on
the results of this study, where public and private schools in the same community are compared, the best
place to focus attention is on the condition of schools and not the attitude of parents toward their children’s
schooling.
Issue 2: Should the Government Regulate schools?
5.10 Ensuring standards of quality. Popular policy pronouncements and the discourse surrounding private
schools often revolve around regulation of quality and (at varying points in time) prices. But what is such
regulation meant to do? One purpose of regulation is to ensure that providers deliver a minimum standard of
performance. Using performance and test scores as a yardstick, it is government, not private schools that
need better oversight. The bulk of the poorest-performing schools are government schools, where there is
little accountability or mechanism for complaints—these schools are not meeting any minimum quality
standard. In contrast, parents unhappy with a private school can simply withdraw their child, and this exit
option shows up clearly in the data—children in the worst private schools have far higher test-scores than
those in the worst public schools (Chapter 1).
5.11 Ensuring competitive pricing. A second purpose of regulation is to ensure that private schools do not
charge “excessive” fees. Such pricing inefficiencies arise from monopolistic behavior. Firms that act as
monopolies maximize profits by charging prices above what is socially optimal; some consumers who would
110
like to buy the product from the monopolist cannot because this implies decreasing the price for the entire
market. Typically, every country has an authority that looks at monopolistic or restrictive trade practices and
advocates alternatives. The chapter on schools showed that private schools are not behaving as monopolies.
These schools are most often located in “schooling clusters” with other private and government schools.
Direct competition from other schools keeps their prices low—indeed, the average profit at a rural private
school in Punjab is approximately equal to the salary of a male private school teacher. This is precisely the
opportunity cost of the private school entrepreneur. Government schools tend to be located both in
schooling clusters and in stand-alone locations outside the main settlement. Given the strong relationship
between distance and enrollment, these schools may be the only option for a large set of children. From
chapter 2, levels of infrastructure in these schools are lower, suggesting that they do not command the same
resources that government schools in denser and richer settlements do. If there is any evidence that some
schools may be “monopolies” it is these government schools rather than the majority of private schools.
5.12 Ensuring that prices reflect quality. The third common rationale for regulation is that consumers are
unable to evaluate the quality of the product they receive. In the case of private schools, parents cannot tell
the quality of education imparted in school and are thus able to “fleece” parents by charging high fees for low
quality. It is worth recognizing that this rationale for regulation does not imply that poor quality private
schools should not exist. In fact, poor quality need not be a problem as long as it is completely embedded in
the price of the service and as long as the preferences of the child are fully reflected in the decisions of the
parent. A Mehran is cheaper than a BMW, yet few would argue that there is a need to regulate Mehran’s out
of the market. Similarly, in the schooling case, if worse performing and cheaper private schools are regulated
out of existence, there will be a large number of households who will stop sending their children to school
(because the alternative government school is too far away or even lower quality) or be forced to opt for an
even lower quality government school. The rationale for regulation arises from the discrepancy between price
and quality, rather than lower quality itself.
5.13 Moreover, this is a rationale for providing more information, not necessarily regulation. It becomes a rationale for
regulation only if the cost of providing information about quality is prohibitively high, leaving regulation as an
only alternative. The results suggest that the market is already working well in some ways. The average
parent’s ranking (whether the parent is literate or not) of schools coincides with the ranking from
independently administered tests, suggesting parents are already aware of the quality of schools in their
villages. Quality is also reflected in prices – higher fees are clearly associated with higher quality. That said,
providing more information could help increase awareness about the number of schools in the village and
their relative quality and lead to better outcomes through increased competition. If every village had posters
111
and a page of test scores for different schools and their addresses in the village (perhaps with comparisons to
other villages or their own district), parents might make better school choices. Indeed, a randomized
evaluation of precisely such an experiment is underway. Preliminary results suggest that the experiment led to
better learning outcomes among the initially poor performers. If confirmed, such an experiment could then
be reevaluated within the context of the Punjab government’s large-scale testing exercise in Class 5.
5.14 These three rationales for regulation—ensuring a “standard” of quality, ensuring competitive pricing and ensuring
that “prices reflect quality” suggest that public sector schools are better candidates for regulation on all three counts than private
sector schools. But government schools are already regulated! It seems parent’s ability to choose schools is
operating better than government regulation to deliver basic minimum educational goals. Pakistan needs to
rethink the costs and benefits of regulating private schools, given these findings from the data.
5.15 Regulation has to first focus on the worst-performing government schools. As reported, the gap between the best
and worst government schools is 10 times the gap between children from rich and poor families and 15 times
the gap between children with literate and illiterate parents. The utter failure of the lowest performing
government schools suggests an obvious target for any future education reform program. Although efforts to
improve mediocre and slightly above average schools may yield positive results, these schools are not the
driving force behind low child test scores. It is the worst government schools that drive down average test
scores—dropping the 50 worst government schools is equivalent to raising the other 436 government
schools’ scores by 25 knowledge points each. The debate about regulation has to first focus on very poorly
performing government schools. Once theses schools are on track, attention can then be focused on the
extension of regulation to other types of schools.
Issues 3: Shifting the focus from inputs to outcomes
5.16 Reframing the education policy debate involves shifting the focus from inputs to outcomes. Most popular writing on
Pakistani education starts with the poor state of school infrastructure, high pupil-teacher ratios, and low
budgetary support. The implication is that more money will solve all these problems. This would be an easy
solution and one that all funding agencies would be happy to support. Unfortunately, as a number of studies
worldwide show these inputs cannot explain large differences in learning between schools. As confirmed in
chapter 1, private schools outperform public schools regardless of their infrastructure or pupil-teacher ratio.
In fact, the correlation between infrastructure and test scores or student-teacher ratios and test scores is fairly
small to begin with.
Nadia
Highlight
112
5.17 The amount of resources required to educate a child in the private sector is one-half the amount required by the public
sector. Take the case of Urdu. Private school students grasp 38 percent of the content in the test; government
school students grasp 25 percent. By the end of Class 3, assuming that children have been in school for three
years, the spending on a government school student is Rs.6000, on a private school student Rs.3000.
Therefore, it costs Rs.79 per Urdu-percent to educate a child in the private sector and Rs.240 or 3 times as
much in the government sector. These numbers do not change much if we account for differences in
household characteristics. Prima facie, the argument that improving outcomes requires far greater resources
does not appear to be accurate. Although there are more subtle arguments based on the tendency for private
schools to open in richer, more educated villages that support a case for greater spending (more on this
below), the subject is clearly a matter for public debate. The automatic reaction to poor educational results is
to throw more money at it before looking at whether something else is going on.
5.18 The source of the public-private school learning gap is the ability of private school administrators to adapt to the
specific circumstances of their school. The key question of course, is what this something else might be. In a number
of discussions the first question is always “So what do private schools do differently that government schools
do not?” The question and what is implied is that there must be some difference in an input or set of inputs that
can be provided by the government to bring them to the same level of learning as private schools.
5.19 Despite extensive efforts to isolate observable factors that could explain the private-public gap, the data collected by the
LEAPS survey cannot conclusively explain why private schools out perform public schools. Using the set of children in the
household survey who could be matched to test scores in the school-based assessment (about 900 in all) a
“kitchen-sink” regression was used to explain learning as a function of child characteristics (age, gender,
health status, household spending on education, intelligence, work ethic,), family characteristics (availability of
books and other media at home, parental education and income, time spent with the child on studies), school
characteristics (infrastructure, location, student-teacher ratio) and teacher characteristics (absenteeism, age,
education, gender, test scores, training). While some of these were independently correlated with test scores,
the private-public gap could only be reduced by 30 percent at most. This in sharp contrast to richer countries,
where the gap is sharply reduced the moment a basic set of household characteristics is included in the
regression.
5.20 Follow-up fieldwork was done to interview three head-teachers in private schools to get at this
elusive input. All agreed that it was important to bring motivated teachers onboard and ensure that they were
fulfilling their teaching duties, but they differed on everything else. In the first interview, the head-teacher felt
that one of his teachers was weak in mathematics, so he had arranged for her, together with other teachers
Nadia
Highlight
Nadia
Highlight
Nadia
Highlight
Nadia
Highlight
113
from neighboring villages, to go for further training in Hafizabad, 60 kilometers away from the village. The
second head-teacher felt that the lack of a boundary wall was distracting students (the school was next to a
road), so he spent funds on building such a wall and his impression was that children could now focus more
as a result of this construction. In the third school, children from one settlement were frequently absent since
they had to cross a small forest to reach the school. The head-teacher decided to send a teacher every
morning to this settlement to chaperone the children to the school, and attendance increased dramatically.
Much like the intrepid teacher dealing with 94 children in chapter 1, private schools are probably doing better
not because of “a set of inputs” that are of higher quality than those provided by the government, but
because they have the ability and administrative flexibility to fix the weakest link in the chain.
5.21 Shifting from inputs to outcomes requires flexibility. One approach is the “planning approach” that tries
one by one, to check the impact of each input on outcomes; this has also been the approach of most
educational research in low-income countries. A second approach admits that different places and different
children have different needs and a central planner is inherently unable to align inputs perfectly for every
single child. However, it also recognizes agents at the local level can do this better—the flexible head-teachers
in private schools for instance. The “flex-approach” suggests that instead of trying to fix every input
optimally, the planner fixes the system so that those who know more and are able to respond better to
individual needs prosper, while those who are inflexible and provide low-quality inputs are selected out of the
system. The private system does this automatically. As we saw in the chapter on households—private schools
that cannot provide the learning levels parents expect ultimately shut down or charge lower fees. A debate
around whether a more “flexible approach” is better or even feasible in the government system also needs to
tackle the question of educational performance.
Issue 4: Fixing institutions: Public-Private Partnerships?
5.22 In countries where private schooling option is widespread, policy options in education have revolved around public-
private partnerships. Such partnerships largely involve government financing and private delivery of education—
thus combining the flexibility of the private system with funds from the government. Examples include grant-
in aid schools (UK, India) and charter schools in the US which largely involve block grants/funding to
private schools. The other model is financing families directly through vouchers to each school-going child.
Voucher systems de-link the financing of education from its provision by ensuring that “money follows the
child”. That is, parents are given a fixed sum every month by the government and they use this to pay the fees
of any school they elect to send their child to; if they choose a free public school, the money is sent back to
the government. This has been tried in Colombia, Chile, Sweden and the U.S., among other countries. How
well these various arrangements have worked is highly debated and depends on country circumstances.
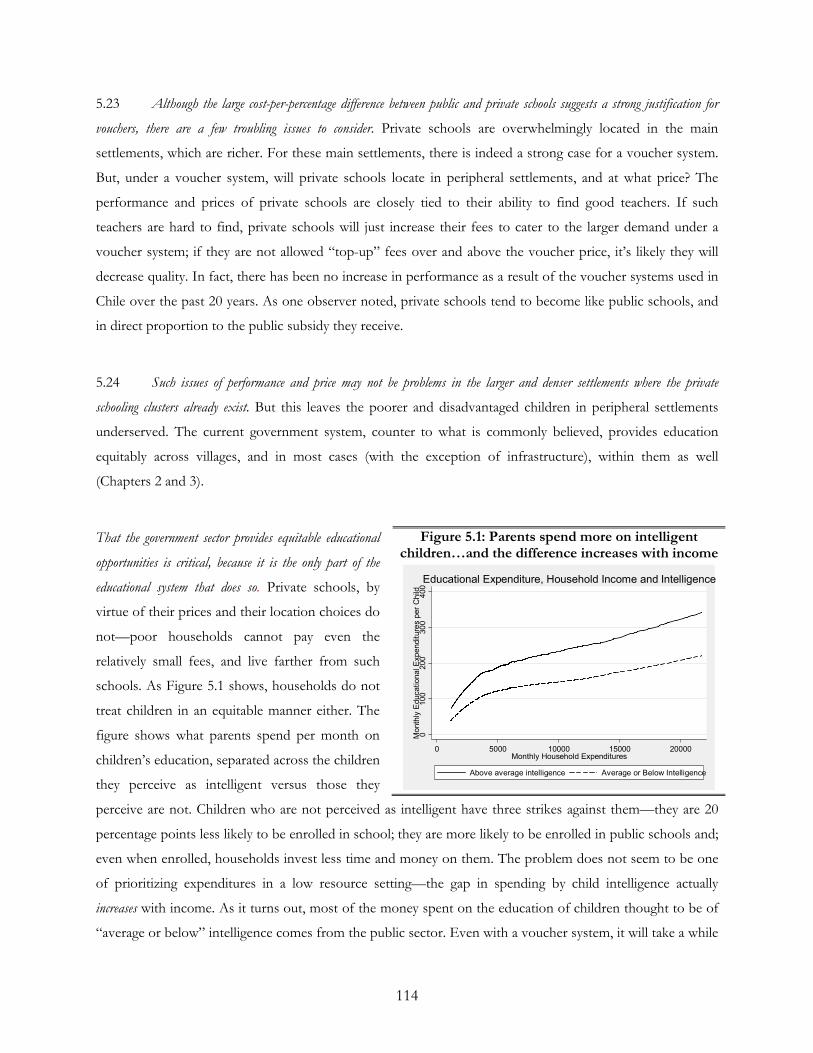
114
5.23 Although the large cost-per-percentage difference between public and private schools suggests a strong justification for
vouchers, there are a few troubling issues to consider. Private schools are overwhelmingly located in the main
settlements, which are richer. For these main settlements, there is indeed a strong case for a voucher system.
But, under a voucher system, will private schools locate in peripheral settlements, and at what price? The
performance and prices of private schools are closely tied to their ability to find good teachers. If such
teachers are hard to find, private schools will just increase their fees to cater to the larger demand under a
voucher system; if they are not allowed “top-up” fees over and above the voucher price, it’s likely they will
decrease quality. In fact, there has been no increase in performance as a result of the voucher systems used in
Chile over the past 20 years. As one observer noted, private schools tend to become like public schools, and
in direct proportion to the public subsidy they receive.
5.24 Such issues of performance and price may not be problems in the larger and denser settlements where the private
schooling clusters already exist. But this leaves the poorer and disadvantaged children in peripheral settlements
underserved. The current government system, counter to what is commonly believed, provides education
equitably across villages, and in most cases (with the exception of infrastructure), within them as well
(Chapters 2 and 3).
That the government sector provides equitable educational
opportunities is critical, because it is the only part of the
educational system that does so. Private schools, by
virtue of their prices and their location choices do
not—poor households cannot pay even the
relatively small fees, and live farther from such
schools. As Figure 5.1 shows, households do not
treat children in an equitable manner either. The
figure shows what parents spend per month on
children’s education, separated across the children
they perceive as intelligent versus those they
perceive are not. Children who are not perceived as intelligent have three strikes against them—they are 20
percentage points less likely to be enrolled in school; they are more likely to be enrolled in public schools and;
even when enrolled, households invest less time and money on them. The problem does not seem to be one
of prioritizing expenditures in a low resource setting—the gap in spending by child intelligence actually
increases with income. As it turns out, most of the money spent on the education of children thought to be of
“average or below” intelligence comes from the public sector. Even with a voucher system, it will take a while
Figure 5.1: Parents spend more on intelligent children…and the difference increases with income
0100
200
30
0400
Month
ly E
ducational E
xpenditure
s p
er
Child
0 5000 10000 15000 20000Monthly Household Expenditures
Above average intelligence Average or Below Intelligence
Educational Expenditure, Household Income and Intelligence
115
before supply of private schooling picks up—meanwhile, if Pakistan is to take seriously the idea of
“Education for All”, there is really no option but to improve the performance of government schools.
5.25 Whichever way the debate goes, a careful evaluation of what a voucher system actually will do is vital. A proper
evaluation program would have at least 3 components. First, it would last at least 5 years, since it will be
critical to see whether the private sector is able to respond to greater financing by increasing supply. Second,
it would consider the village as the appropriate unit for assessing test-score responses. Vouchers may lead to
greater social stratification; if such stratification means that children learn less from each other, it may have a
detrimental effect on learning. Third, it would look not only at the effect on the “average” child but also the
effect on disadvantaged children (whether because of their location or their backgrounds).
Issue 5: Fixing institutions: Can Government Schools Improve?
5.26 Even with greater private sector involvement, fixing government schools is still important, goal. The biggest issue in
the government sector seems to be what to do about teachers—the rest is tinkering at the margins. The
chapter on teachers offers a fairly comprehensive framework for debate, and is briefly summarized here.
5.27 Two things about teachers matter most—their intrinsic motivation and love of teaching and the incentives that they
face. What matters less is their formal educational qualifications, so long as they are above secondary (for
primary school children) and they have some training. Although a number of studies in low-income countries
argue that schools should design systems that provide teachers with better incentives, this might be very hard
to implement and not sustainable in the long-run. It is particularly difficult in an environment where
government teachers fulfill non-teaching responsibilities such as manning election booths, drawing up voter
lists, working as part and parcel of a political system (chapter 3), and performing administrative duties such as
administering polio vaccinations. Even if teachers were to be relieved of non-teaching responsibilities and
better monitoring of teacher attendance could encourage less absenteeism, more subtle incentive schemes,
such as pay based on test scores of the children in their classes, are probably out-of-reach at the moment. The
goal of getting the right teachers into the public sector and ensuring that top performers are retained while
those who do not perform are gradually let-go remains a daunting problem.
5.28 At the moment good government teachers receive the same compensation as those that do no work and there is no
process for shedding teachers who shirk. As Pakistan grows and other job options become available, the mechanical
wage function in the public sector may force the best teachers (who would arguably receive higher salaries
elsewhere) to leave, and the worst (who would arguably receive lower salaries outside) to stay—similar
116
patterns have emerged in the teaching workforce in the United States over the last two decades, and are
already evident in urban Lahore and Karachi.
5.29 The government can afford to move teachers around. In rethinking how government teachers—who
currently earn 5 times as much as their private sector counterparts—should be compensated, two broad
issues arise. First, given that this higher salary “buys” the government the right to transfer teachers, perhaps
the government should think about deploying teachers to geographical areas and to educational sectors (the
secondary sector for instance) where the private sector presence is low. Second, devolving teacher
compensation to the district, along with the creation of a district cadre of teachers in combination with the
provincial cadre, could allow salary scales based on the structure of the local market to develop. This would
also support the ongoing devolution process.
5.30 The politics of teacher reform requires the separation of teachers’ demands from voters’ demands. Whenever teacher
reform is discussed, the first reaction is that it is “politically difficult”. Yet what does “politically difficult”
mean—does the average voter not support teacher reform? In the last year of the LEAPS study, we asked
parents a number of questions about what they wanted from the government and from their schools. Parents
graded hypothetical schools with different characteristics on a scale of 1 (very bad) to 5 (very good). The first
school had “a roof that never leaks, a new boundary wall and desks, but teachers who were frequently absent and not
motivated and no free textbooks or school supplies”. The second had “a roof that leaks, a broken boundary wall, teachers who
were frequently absent and not motivated but gave free textbooks and school supplies”. The third had “a roof that leaks, a
broken boundary wall and desks, no free textbooks or school supplies but teachers who were always present and highly
motivated”.
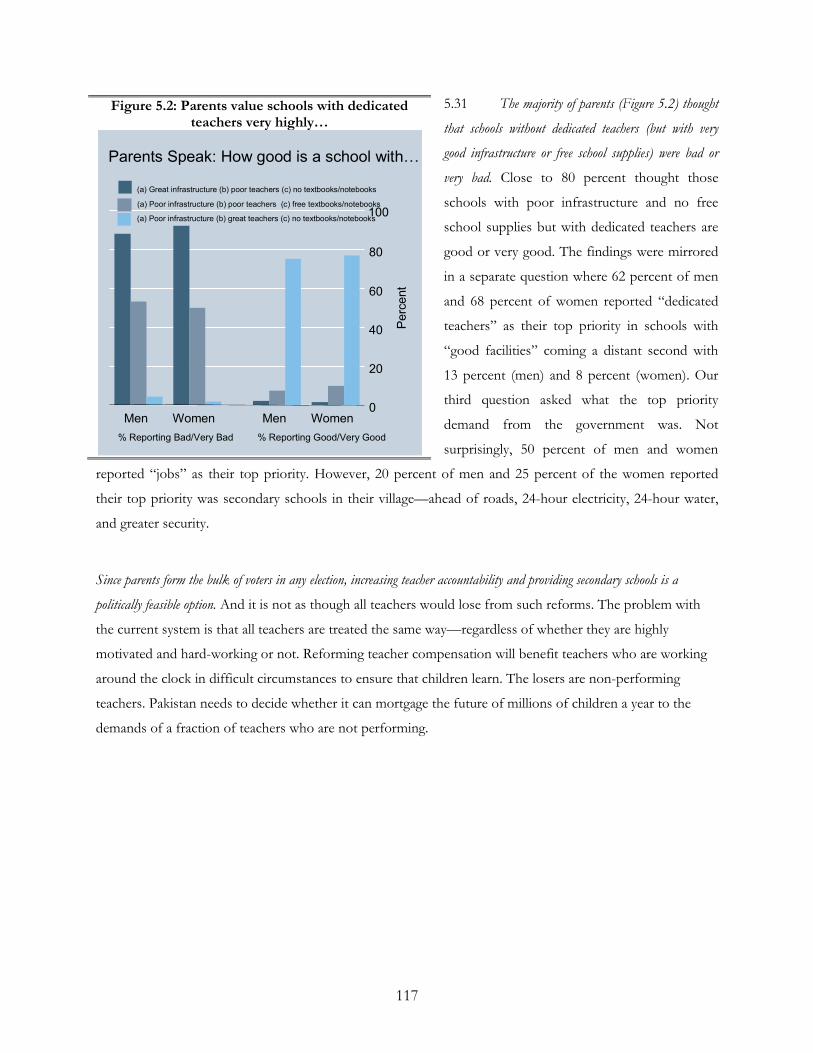
117
5.31 The majority of parents (Figure 5.2) thought
that schools without dedicated teachers (but with very
good infrastructure or free school supplies) were bad or
very bad. Close to 80 percent thought those
schools with poor infrastructure and no free
school supplies but with dedicated teachers are
good or very good. The findings were mirrored
in a separate question where 62 percent of men
and 68 percent of women reported “dedicated
teachers” as their top priority in schools with
“good facilities” coming a distant second with
13 percent (men) and 8 percent (women). Our
third question asked what the top priority
demand from the government was. Not
surprisingly, 50 percent of men and women
reported “jobs” as their top priority. However, 20 percent of men and 25 percent of the women reported
their top priority was secondary schools in their village—ahead of roads, 24-hour electricity, 24-hour water,
and greater security.
Since parents form the bulk of voters in any election, increasing teacher accountability and providing secondary schools is a
politically feasible option. And it is not as though all teachers would lose from such reforms. The problem with
the current system is that all teachers are treated the same way—regardless of whether they are highly
motivated and hard-working or not. Reforming teacher compensation will benefit teachers who are working
around the clock in difficult circumstances to ensure that children learn. The losers are non-performing
teachers. Pakistan needs to decide whether it can mortgage the future of millions of children a year to the
demands of a fraction of teachers who are not performing.
Figure 5.2: Parents value schools with dedicated teachers very highly…
0
20
40
60
80
Perc
ent
% Reporting Bad/Very Bad % Reporting Good/Very Good
Men Women Men Women
How Parents Rank Schools
(a) Great infrastructure (b) poor teachers (c) no free school su pplies
(a) Poor infrastructure (b) poor teachers (c) free school suppl ies
(a) Poor infrastructure (b) great teachers (c) no free school su pplies100
0
20
40
60
80
Perc
ent
% Reporting Bad/Very Bad % Reporting Good/Very Good
Men Women Men Women
Parents Speak: How good is a school withK
(a) Great infrastructure (b) poor teachers (c) no textbooks/notebooks
(a) Poor infrastructure (b) poor teachers (c) free textbooks/notebooks
(a) Poor infrastructure (b) great teachers (c) no textbooks/notebooks100
0
20
40
60
80
Perc
ent
% Reporting Bad/Very Bad % Reporting Good/Very Good
Men Women Men Women
How Parents Rank Schools
(a) Great infrastructure (b) poor teachers (c) no free school su pplies
(a) Poor infrastructure (b) poor teachers (c) free school suppl ies
(a) Poor infrastructure (b) great teachers (c) no free school su pplies100
0
20
40
60
80
Perc
ent
% Reporting Bad/Very Bad % Reporting Good/Very Good
Men Women Men Women
Parents Speak: How good is a school withK
(a) Great infrastructure (b) poor teachers (c) no textbooks/notebooks
(a) Poor infrastructure (b) poor teachers (c) free textbooks/notebooks
(a) Poor infrastructure (b) great teachers (c) no textbooks/notebooks100
118
BIBLIOGRAPHY
Action Aid Pakistan. 1999. “Comparative Analysis of Public, Private and NGO Schools.” Andrabi, Tahir, Jishnu Das and Asim Khwaja. 2006. “A Dime a Day: The Possibilities and Limits of Private
Schooling in Pakistan.” World Bank Policy Research Working Paper 4066, Washington, DC. Andrabi, Tahir, Jishnu Das and Asim Khwaja. 2007. “Students Today, Teachers Tomorrow? Identifying
constraints on the provision of education.” Processed. World Bank, Washington DC. Available at:http://ksghome.harvard.edu/~akhwaja/papers/teachersstudentssept07.pdf
Andrabi, Tahir, Jishnu Das, Asim Khwaja, and Tristan Zajonc. 2007. “Do Value-Added Estimates Add
Value? Accounting for Learning Dynamics.” Processed. World Bank, Washington DC. Alderman, Harold, Jere Behrman, Shahrukh Khan, David Ross, and Richard Sabot. 1995. “Public Schooling
Expenditures in Rural Pakistan: Efficiently Targeting Girls and a Lagging Region.” In D. van de Walle and K. Nead, eds., Public Spending and the Poor: Theory and Evidence. Baltimore, Md.: Johns Hopkins Press.
Alderman, Harold, Jere Behrman, Shahrukh Khan, David Ross and Richard Sabot. 1996. "Decomposing the
regional gap in cognitive skills in rural Pakistan." Journal of Asian Economics, vol. 7(1): 49-76. Arif, Charagh, Saima Chaudhary and Uzma Gilani. 1999. “Learning Achievement of Grades 3 and 5 Children
in Rural Primary Schools,” Punjab Curriculum Development and Research Centre. October. Balochistan Bureau of Curriculum and Extension Centre. 1999. “Learning Achievement of Grade 3 and 5
Children in Rural Primary Schools of District Pishin, Balochistan,” December. Banerjee, Abhijit, Shawn Allen Cole, Esther Duflo and Leigh L. Linden. 2005. "Remedying Education:
Evidence from Two Randomized Experiments in India," NBER Working Paper No. W11904. December.
Banerjee, Abhijit and Esther Duflo. 2006. "Addressing Absence," Journal of Economic Perspectives, vol. 20(1):
117-132. Winter. Behrman, Jere, Shahrukh Khan, David Ross and Richard Sabot. 1997 "School quality and cognitive
achievement production: A case study for rural Pakistan," Economics of Education Review, vol. 16(2): 127-142. April.
Bracey, Gerald W. 2000 “The TIMSS ‘Final Year’ Study and Report: A Critique.” Educational Researcher, vol.
29(4): 4-10. Chaudhury, Nazmul and Dilip Parajuli. 2006. “Conditional Cash Transfers and Female Schooling: The
Impact of the Female School Stipend Program on Public School Enrollments in Punjab, Pakistan.” World Bank Policy Research Working Paper No. 4102, Washington, DC.
Cheng, Yin Cheong. 1997 “Monitoring School Effectiveness: Conceptual and Practical Possibilities and
Dilemmas in Developing a Framework.” Paper presented at the Asia-Pacific Economic Cooperation Education Forum on School-Based Indicators of Effectiveness (Quilin, China, April 13-16).
119
Das, Jishnu, Stefan Dercon, James Habyarimana and Pramila Krishnan. 2005. “Teacher Shocks and Student Learning: Evidence from Zambia” World Bank Working Papers No. WPS3602, Washington, DC.
Dawn, 2006. “Education reforms 2nd phase begins” The Internet Edition, November 14. Available at: http://www.dawn.com/2006/11/14/nat13.htm
Duflo, Esther and Rema Hanna. 2005. "Monitoring Works: Getting Teachers to Come to School" CEPR
Discussion Paper No. 5426. December. Available at SSRN: http://ssrn.com/abstract=895584
EDI. 1999. “Basic Skills Assessment – A Pakistan Case Study.” Theme 3 at EDI Seminar helt at Bhurban
(February 7-10). Gazdar, Haris. 2000. “State, community and universal education: A political economy of public schooling in
rural Pakistan” Asia Research Centre, London School of Economics, October. Ghuman, Sharon and Cynthia Lloyd. 2007. “Poverty, Gender, and Youth,” Population Council Working
Paper No. 1. Glewwe, Paul, Michael Kremer and Nauman Ilias. 2003. “Teacher Incentives” NBER Working Paper No.
W9671. Available at SSRN: http://ssrn.com/abstract=403642 Haque, Manzoorul, Sharif Kalhoro and Shoukat Saeed. 2000. “Baseline Survey of Learning.” Sindh Bureau
of Curriculum Development and Extension Wing. May. Holmes, Jessica. 2003. “Measuring the Determinants of School Completion in Pakistan: Analysis of
Censoring and Selection Bias.” Education Economics, vol. 9(3):237-44.
Hoodbhoy, Pervez. 1998. Education and the State: Fifty Years of Pakistan, Oxford University Press, Karachi: Oxford.
Howie, Sarah J. and Tjeerd Plomp. 2001. “English Language Proficiency and Other Factors Influencing
Mathematics Achievement at Junior Secondary Level in South Africa.” Paper presented at the Annual Meeting of the American Educational Research Association (Seattle, WA, April 10-14).
Hoxby, Caroline. 1996. “How Teachers' Unions Affect Education Production,” Quarterly Journal of Economics,
vol. 111(3). IAE. 2001a. “TIMSS Assessment Frameworks and Specifications 2003.”
http://timss.bc.edu/timss2003i/t03pdf/T03_AF_BookFull.pdf IAE. 2001b. “Frameworks and Specifications for PIRLS Assessment 2001.”
http://timss.bc.edu/pirls2001i/pdf/PIRLS_frame2.pdf Lloyd, Cynthia, Cem Mete and Zeba Sathar. 2005. “The Effect of Gender Differences in Primary School
Access, Type, and Quality on the Decision to Enroll in Rural Pakistan,” Economic Development and Cultural Change, vol. 53(3), April.
Kain, John, Eric Hanushek and Steven Rivkin. 2005. “Teachers, Schools, and Academic Achievement.”
Econometrica, vol 73(2): 417-458. March.
120
Kardar, Shahid. 1995. “Demand for Education Among Low and Middle Income Households in Karachi and Lahore.” Mimeo. The World Bank, Washington, DC.
Khan, Habib, Seyed Shah, Mirza Ahmad, Nasir Amin, Humala Khalid and Ahmad Malik. 1999. “Measuring
Learning Achievement at Primary Level in Pakistan” Pakistan Ministry of Education (Academy of Educational Planning and Management), Islamabad.
Kingdon, Geeta and Francis Teal, 2004. "Does performance related pay for teachers improve student
performance? Some evidence from India," Development and Comp Systems 0409009, EconWPA. Kizilbash, Hamid. 1997. “Working with Rural Primary Teachers: Final Report on Improving the Quality of
Rural Primary School Teachers in Pakistan.” Ali Institute of Education, Lahore, Pakistan. Mirza, Munawar and Abdul Hameed. 1994. “Differential Achievement of Primary Age Students and the Cost
Effectiveness by School Type.” Primary and Non-Formal Education Wing, Ministry of Education. Multi-Donor Support Unit for the Social Action Programme. 1995. “Determinants of Primary Students
Achievement – National Survey Results.” Islamabad, July. Muralidharan, Karthik and Venkatesh Sundararaman. 2006. “Teacher Incentives in Developing Countries:
Experimental Evidence from India.” Available at: http://www.people.fas.harvard.edu/~muralidh/
Murgai, Rinku and Lant Pritchett, 2006. “Teacher Compensation: Can Decentralization to Local Bodies Take
India from the Perfect Storm through Troubled Waters to Clear Sailing?” Mimeo. The World Bank, Washington, DC.
NAEP. (undated) “Mathematics Framework for the 1996 and 2000 National Assessment of Educational
Progress.” http://nces.ed.gov/transfer.asp?location=www.nagb.org/pubs/math96-2000.pdf NAEP. (undated) “Reading Framework for the National Assessment of Educational Progress: 1992-2000).”
http://nces.ed.gov/transfer.asp?location=www.nagb.org/pubs/read92-2000.pdf NAEP. (undated) “Writing Framework and Specifications for the 1998 National Assessment of Educational
Progress.” http://nces.ed.gov/transfer.asp?location=www.nagb.org/pubs/writing.pdf Naseer, Farooq and Manasa Patnam. 2007. “Are child centred classrooms effective? Impact of the CRI
program on student learning outcomes in Pakistan.” Mimeo. Lahore University of Management Sciences.
N.W.F.P. Bureau of Curriculum Development and Extension Services. 1999. “Learning Achievement of
Grade 3 and 5 Children in Rural Primary Schools.” December. PAKISTAN. (undated) “Strategic Frameword for National Education Assessment 2001” Pakistan Country Gender Assessment: Bridging the Gap: Opportunities and Challenges. 2005. Environment
& Social Development Sector Unit, South Asia Region, World Bank. October. Pervez, Muhammad. 1995. “Basic Competencies of Children in Pakistan.” UNICEF: Islamabad, March. Punjab Education Foundation. (undated) “Promoting Quality Education Through Public Private
Partnership” Available at: siteresources.worldbank.org/INTINDIA/Resources/Kardar.ppt
121
Punjab Literacy Watch. 1999. “Levels of Pupil Achievment in Primary Schools of Punjab: A Sample Study.”
UNESCO. October. Rahman, Tariq. 1997. Language and politics in Pakistan. Oxford University Press, USA. November 13. Rahman, Tariq. 2005. Denizens of Alien Worlds: A Study of Education, Inequality and Polarization in Pakistan.
Oxford University Press, USA. January 20. Ravallion, Martin and Quentin Wodon. 2000. “Does Child Labor Displace Schooling? Evidence on
Behavioral Responses to an Enrolment Subsidy.” Economic Journal, vol. 110: C158-C176. Sathar, Zeba and Cynthia Lloyd. 1994. “Who Gets Primary Schooling in Pakistan? Inequlaities among and
within families.” Pakistan Development Review, vol. 33(2): 103-34. Sathar, Zeba, Cynthia Lloyd, and Minhaj ul Haque. 2000. “Investment in Children’s Education and Family-
Building Behavior in Pakistan: Findings from Rural NWFP and Punjab.” Islamabad Population Council.
Sanders, William. 1998. Tennessee Value-Added Assessment System [Online]. Available at :
http://www.shearonforschools.com/TVAAS_index.html Sanders, William and June Rivers. 1996. “Cumulative and Residual Effects of Teachers on Future Student
Academic Achievement”, University of Tennessee Value-Added Research and Assessment Center Research Progress Report.
Sawada, Yasayuki and Michael Lokshin. 2001. “Household Schooling Decisions in Rural Pakistan.” Stanford
University, Economics Department, Stanford, CA. Shah, Mubarik Hussain. 1984. “National Achievement Tests (Protocol Analysis).” Primary and Non-Formal
Education Wing, Ministry of Education. Islamabad. Tirole, Jean. 1994. "The Internal Organization of Government," Oxford Economic Papers, Oxford University
Press, vol. 46(1): 1-29. January. UNESCO 2001 “Learning Achievement in Primary Schools of Pakistan: A Quest for Quality Education.”
UNESCO, Islamabad, in collaboration with the Ministry of Education Curriculum Wing. March. Vegas, Emiliana, ed. 2005 Incentives to Improve Teaching: Lessons from Latin America, World Bank Publications,
Washington, DC. August.
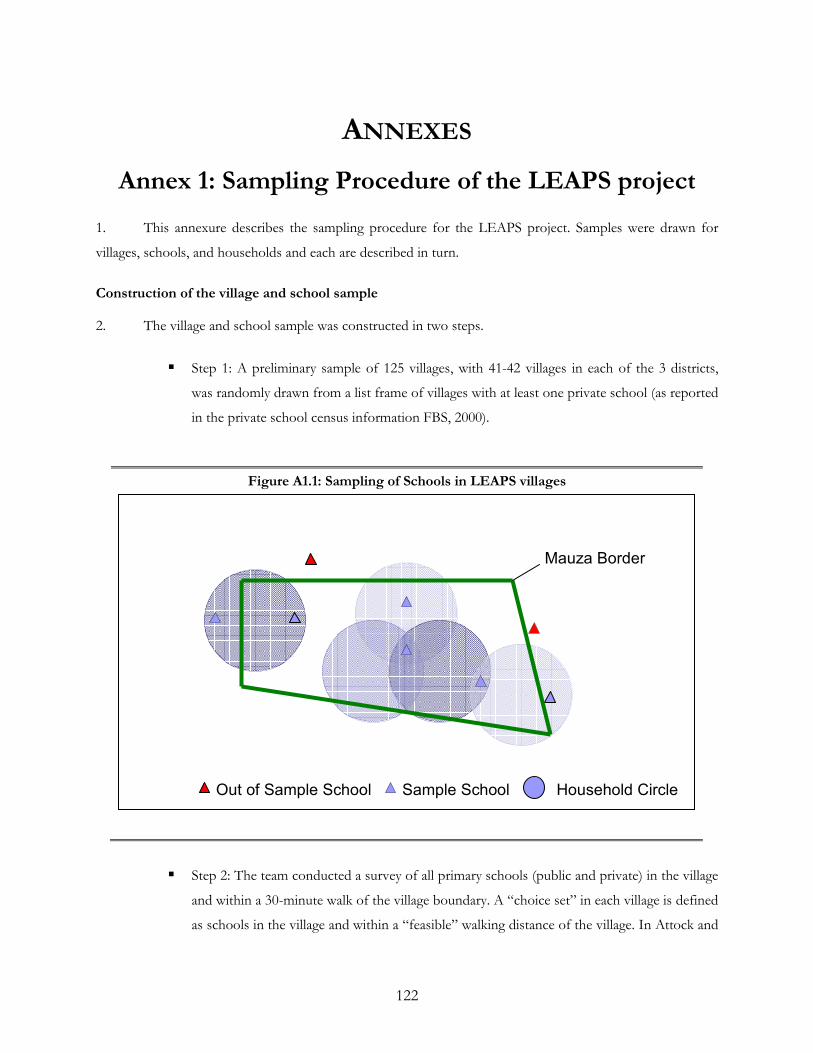
122
Out of Sample School Sample School
Mauza Border
Household Circle
ANNEXES
Annex 1: Sampling Procedure of the LEAPS project
1. This annexure describes the sampling procedure for the LEAPS project. Samples were drawn for
villages, schools, and households and each are described in turn.
Construction of the village and school sample
2. The village and school sample was constructed in two steps.
� Step 1: A preliminary sample of 125 villages, with 41-42 villages in each of the 3 districts,
was randomly drawn from a list frame of villages with at least one private school (as reported
in the private school census information FBS, 2000).
Figure A1.1: Sampling of Schools in LEAPS villages
� Step 2: The team conducted a survey of all primary schools (public and private) in the village
and within a 30-minute walk of the village boundary. A “choice set” in each village is defined
as schools in the village and within a “feasible” walking distance of the village. In Attock and
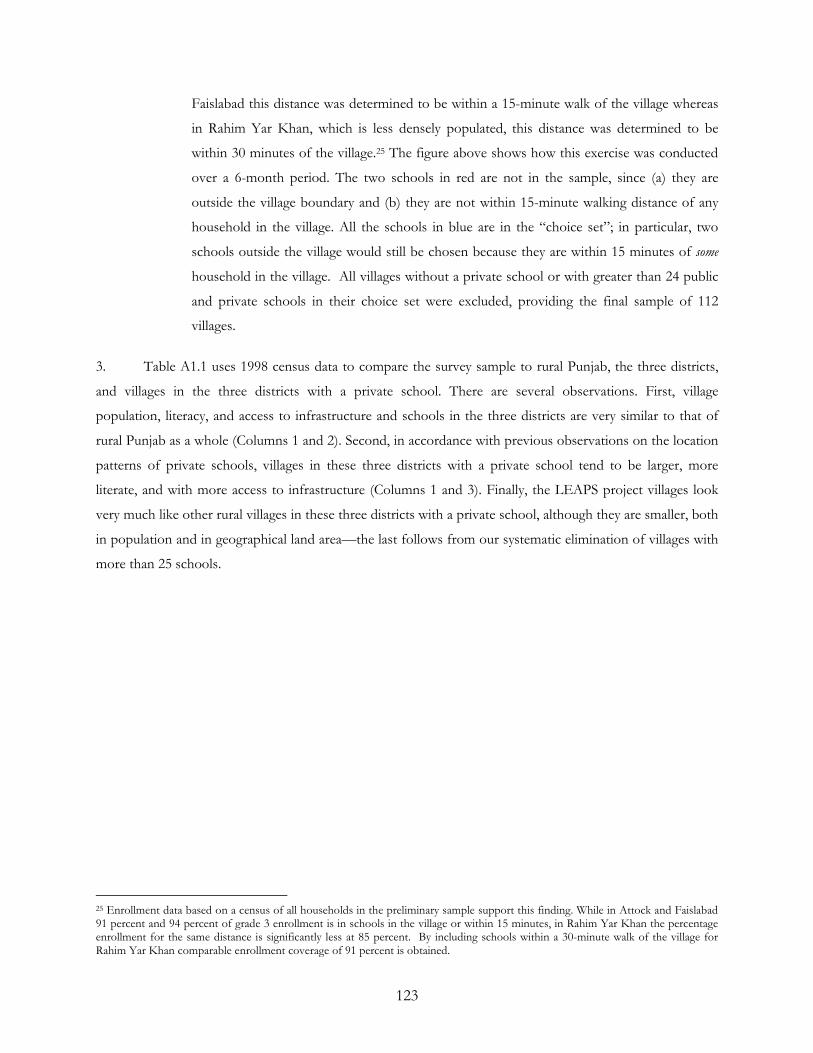
123
Faislabad this distance was determined to be within a 15-minute walk of the village whereas
in Rahim Yar Khan, which is less densely populated, this distance was determined to be
within 30 minutes of the village.25 The figure above shows how this exercise was conducted
over a 6-month period. The two schools in red are not in the sample, since (a) they are
outside the village boundary and (b) they are not within 15-minute walking distance of any
household in the village. All the schools in blue are in the “choice set”; in particular, two
schools outside the village would still be chosen because they are within 15 minutes of some
household in the village. All villages without a private school or with greater than 24 public
and private schools in their choice set were excluded, providing the final sample of 112
villages.
3. Table A1.1 uses 1998 census data to compare the survey sample to rural Punjab, the three districts,
and villages in the three districts with a private school. There are several observations. First, village
population, literacy, and access to infrastructure and schools in the three districts are very similar to that of
rural Punjab as a whole (Columns 1 and 2). Second, in accordance with previous observations on the location
patterns of private schools, villages in these three districts with a private school tend to be larger, more
literate, and with more access to infrastructure (Columns 1 and 3). Finally, the LEAPS project villages look
very much like other rural villages in these three districts with a private school, although they are smaller, both
in population and in geographical land area—the last follows from our systematic elimination of villages with
more than 25 schools.
25 Enrollment data based on a census of all households in the preliminary sample support this finding. While in Attock and Faislabad 91 percent and 94 percent of grade 3 enrollment is in schools in the village or within 15 minutes, in Rahim Yar Khan the percentage enrollment for the same distance is significantly less at 85 percent. By including schools within a 30-minute walk of the village for Rahim Yar Khan comparable enrollment coverage of 91 percent is obtained.
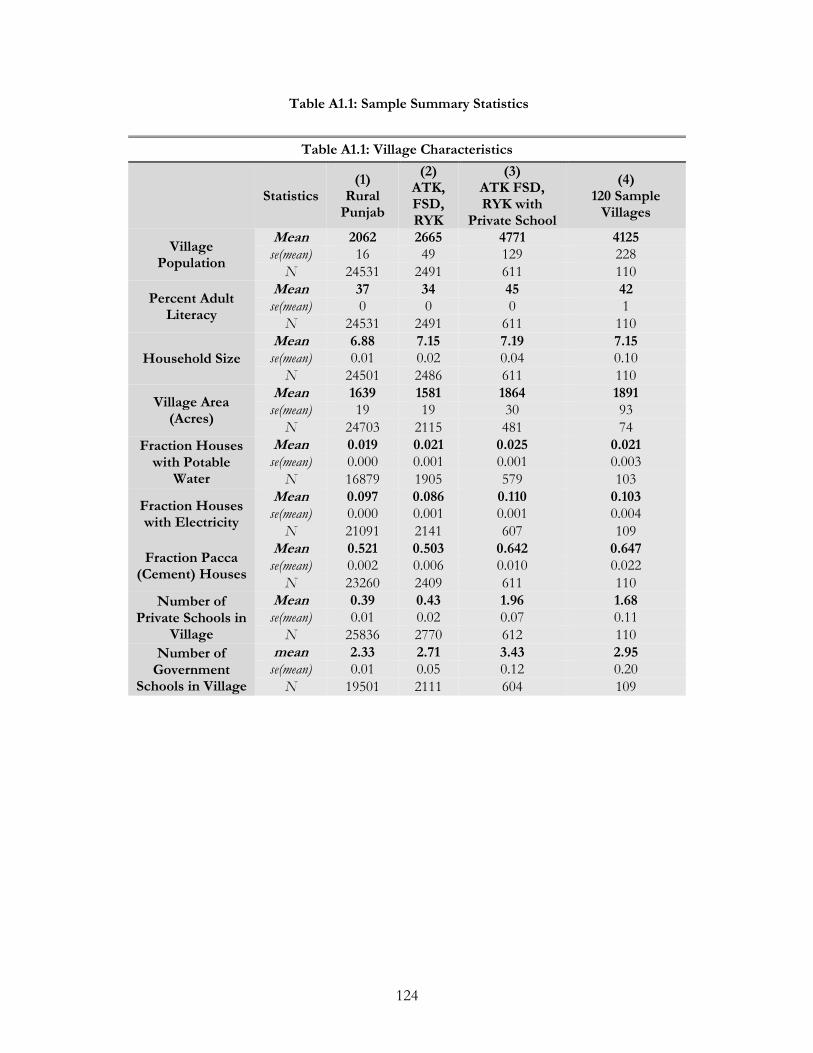
124
Table A1.1: Sample Summary Statistics
Table A1.1: Village Characteristics
Statistics (1)
Rural Punjab
(2) ATK, FSD, RYK
(3) ATK FSD, RYK with
Private School
(4) 120 Sample Villages
Village Population
Mean 2062 2665 4771 4125 se(mean) 16 49 129 228
N 24531 2491 611 110
Percent Adult Literacy
Mean 37 34 45 42 se(mean) 0 0 0 1
N 24531 2491 611 110
Household Size
Mean 6.88 7.15 7.19 7.15 se(mean) 0.01 0.02 0.04 0.10
N 24501 2486 611 110
Village Area (Acres)
Mean 1639 1581 1864 1891 se(mean) 19 19 30 93
N 24703 2115 481 74
Fraction Houses with Potable
Water
Mean 0.019 0.021 0.025 0.021 se(mean) 0.000 0.001 0.001 0.003
N 16879 1905 579 103
Fraction Houses with Electricity
Mean 0.097 0.086 0.110 0.103 se(mean) 0.000 0.001 0.001 0.004
N 21091 2141 607 109
Fraction Pacca (Cement) Houses
Mean 0.521 0.503 0.642 0.647 se(mean) 0.002 0.006 0.010 0.022
N 23260 2409 611 110
Number of Private Schools in
Village
Mean 0.39 0.43 1.96 1.68 se(mean) 0.01 0.02 0.07 0.11
N 25836 2770 612 110
Number of Government
Schools in Village
mean 2.33 2.71 3.43 2.95 se(mean) 0.01 0.05 0.12 0.20
N 19501 2111 604 109
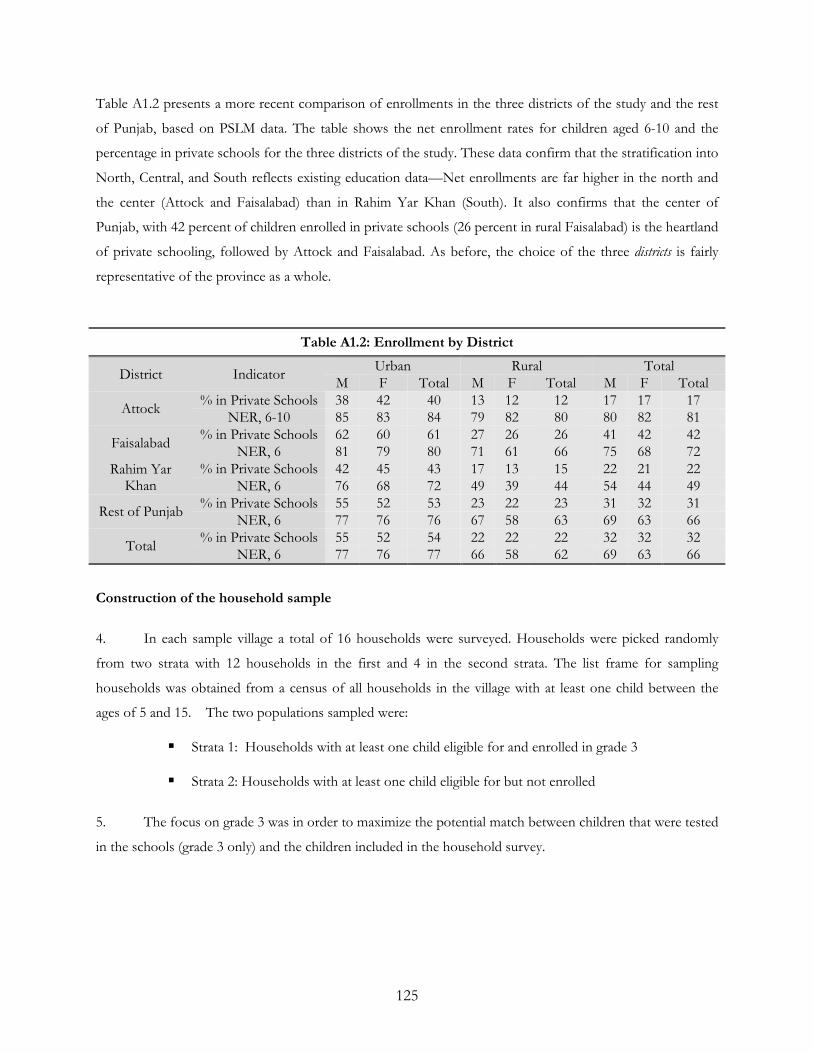
125
Table A1.2 presents a more recent comparison of enrollments in the three districts of the study and the rest
of Punjab, based on PSLM data. The table shows the net enrollment rates for children aged 6-10 and the
percentage in private schools for the three districts of the study. These data confirm that the stratification into
North, Central, and South reflects existing education data—Net enrollments are far higher in the north and
the center (Attock and Faisalabad) than in Rahim Yar Khan (South). It also confirms that the center of
Punjab, with 42 percent of children enrolled in private schools (26 percent in rural Faisalabad) is the heartland
of private schooling, followed by Attock and Faisalabad. As before, the choice of the three districts is fairly
representative of the province as a whole.
Table A1.2: Enrollment by District
District Indicator Urban Rural Total
M F Total M F Total M F Total
Attock % in Private Schools 38 42 40 13 12 12 17 17 17
NER, 6-10 85 83 84 79 82 80 80 82 81
Faisalabad % in Private Schools 62 60 61 27 26 26 41 42 42
NER, 6 81 79 80 71 61 66 75 68 72 Rahim Yar Khan
% in Private Schools 42 45 43 17 13 15 22 21 22 NER, 6 76 68 72 49 39 44 54 44 49
Rest of Punjab % in Private Schools 55 52 53 23 22 23 31 32 31
NER, 6 77 76 76 67 58 63 69 63 66
Total % in Private Schools 55 52 54 22 22 22 32 32 32
NER, 6 77 76 77 66 58 62 69 63 66
Construction of the household sample
4. In each sample village a total of 16 households were surveyed. Households were picked randomly
from two strata with 12 households in the first and 4 in the second strata. The list frame for sampling
households was obtained from a census of all households in the village with at least one child between the
ages of 5 and 15. The two populations sampled were:
� Strata 1: Households with at least one child eligible for and enrolled in grade 3
� Strata 2: Households with at least one child eligible for but not enrolled
5. The focus on grade 3 was in order to maximize the potential match between children that were tested
in the schools (grade 3 only) and the children included in the household survey.
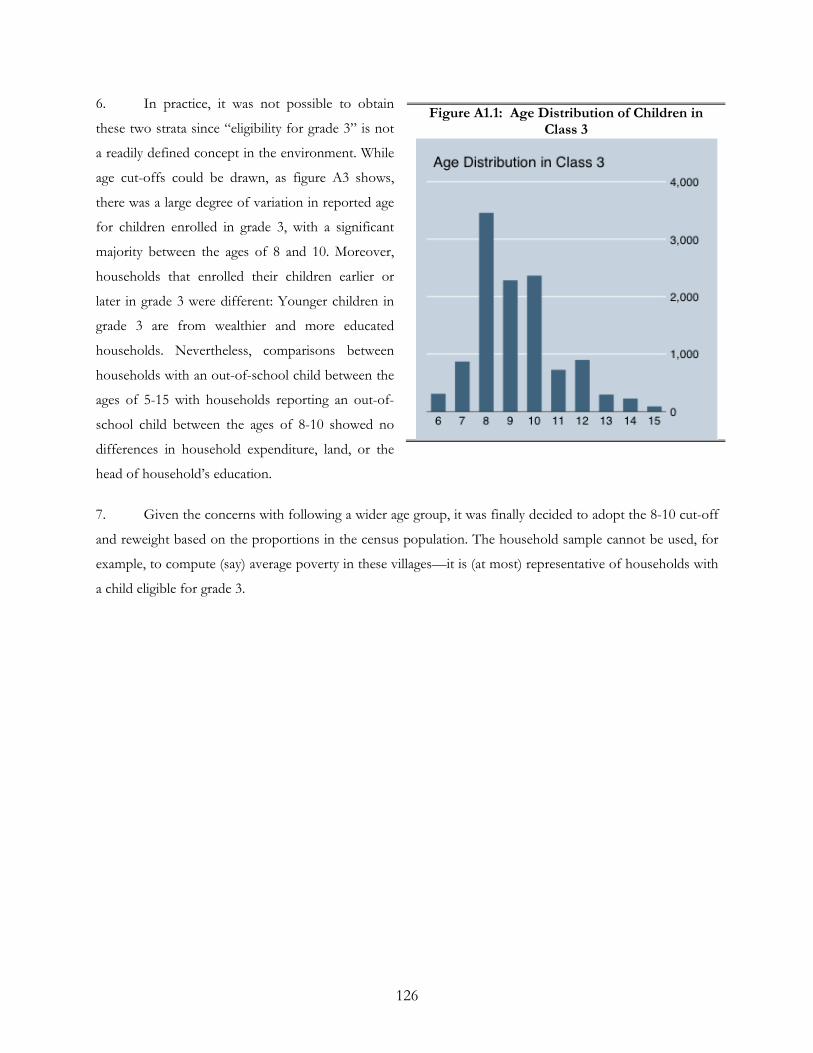
126
6. In practice, it was not possible to obtain
these two strata since “eligibility for grade 3” is not
a readily defined concept in the environment. While
age cut-offs could be drawn, as figure A3 shows,
there was a large degree of variation in reported age
for children enrolled in grade 3, with a significant
majority between the ages of 8 and 10. Moreover,
households that enrolled their children earlier or
later in grade 3 were different: Younger children in
grade 3 are from wealthier and more educated
households. Nevertheless, comparisons between
households with an out-of-school child between the
ages of 5-15 with households reporting an out-of-
school child between the ages of 8-10 showed no
differences in household expenditure, land, or the
head of household’s education.
7. Given the concerns with following a wider age group, it was finally decided to adopt the 8-10 cut-off
and reweight based on the proportions in the census population. The household sample cannot be used, for
example, to compute (say) average poverty in these villages—it is (at most) representative of households with
a child eligible for grade 3.
Figure A1.1: Age Distribution of Children in Class 3
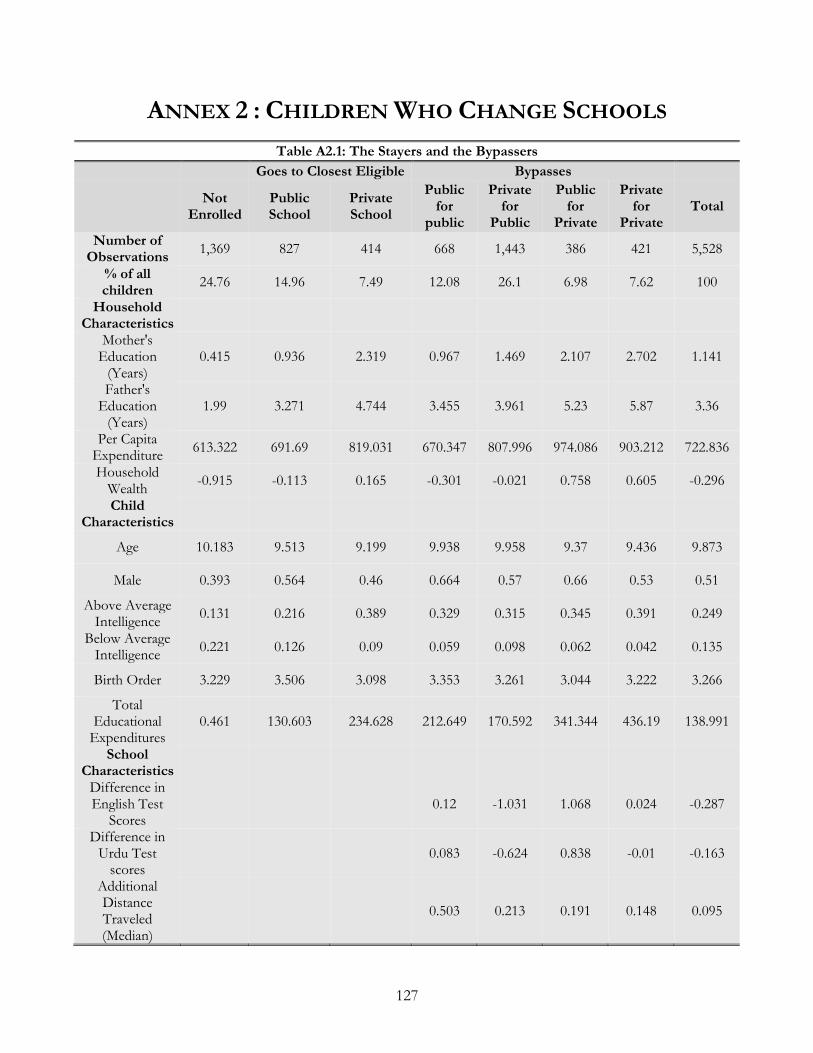
127
ANNEX 2 : CHILDREN WHO CHANGE SCHOOLS
Table A2.1: The Stayers and the Bypassers
Goes to Closest Eligible Bypasses
Not
Enrolled Public School
Private School
Public for
public
Private for
Public
Public for
Private
Private for
Private Total
Number of Observations
1,369 827 414 668 1,443 386 421 5,528
% of all children
24.76 14.96 7.49 12.08 26.1 6.98 7.62 100
Household Characteristics
Mother's Education (Years)
0.415 0.936 2.319 0.967 1.469 2.107 2.702 1.141
Father's Education (Years)
1.99 3.271 4.744 3.455 3.961 5.23 5.87 3.36
Per Capita Expenditure
613.322 691.69 819.031 670.347 807.996 974.086 903.212 722.836
Household Wealth
-0.915 -0.113 0.165 -0.301 -0.021 0.758 0.605 -0.296
Child Characteristics
Age 10.183 9.513 9.199 9.938 9.958 9.37 9.436 9.873
Male 0.393 0.564 0.46 0.664 0.57 0.66 0.53 0.51
Above Average Intelligence
0.131 0.216 0.389 0.329 0.315 0.345 0.391 0.249
Below Average Intelligence
0.221 0.126 0.09 0.059 0.098 0.062 0.042 0.135
Birth Order 3.229 3.506 3.098 3.353 3.261 3.044 3.222 3.266
Total Educational Expenditures
0.461 130.603 234.628 212.649 170.592 341.344 436.19 138.991
School Characteristics
Difference in English Test
Scores 0.12 -1.031 1.068 0.024 -0.287
Difference in Urdu Test scores
0.083 -0.624 0.838 -0.01 -0.163
Additional Distance Traveled (Median)
0.503 0.213 0.191 0.148 0.095
Technical Annexes
Test Construction, Characteristics and Analysis26
A1.1 To construct the LEAPS test, a feasibility study was conducted in June/July, 2002 to build the
knowledge and capacities to conduct the more extensive LEAPS test. This appendix provides background
information for the test instrument, the rationale behind the test design, a description of the test content, a
formal validation of each individual test and notes on issues that arose during the test’s administration and
preliminary data analysis. It is organized as follows. Section A2 summarizes assessments of primary education
undertaken in Pakistan over the past two decades, till 2003. The summary is based on published studies and
publicly available documents; as such, it may miss small-scale studies that are hard to access or recent tests
whose details have not been publicly released. Section A3 provides an overview of the assessment instrument,
discussing both the test design and content. It then covers the procedural and implementation issues faced
during the administration of the pilot test instrument and a diverse range of concerns related to the
interpretation of the results. This section includes a summary of the actions that were taken in the final
LEAPS test to address these issues and concerns. Section A4 presents an assessment of the testing
instrument using Item-Response Theory to examine the validity of each question (henceforth item) as well as
the precision of each test and the set of item parameters.
I. PREVIOUS STUDIES
A1.2 Since 1984, at least 19 assessments of primary education in Pakistan have been conducted. These
efforts gained momentum after the World Declaration on Education for All (EFA) in 1990 and again with
the joint UNESCO-UNICEF global initiative for Monitoring Learning Achievement in 1996. The studies
have been both national and provincial in scope and focused on various competencies/content areas.
UNESCO (2001) provides an excellent summary of previous assessment work in Pakistan and the summaries
below draw from this document.
26 This document is based on the test feasibility report prepared by the authors of this report together with Duriya Farooqi, who
was at Harvard University at the time of the report preparation.
Nadia
Highlight
127
Early Studies – 1980s
A1.3 The first two major assessments of primary education in Pakistan were the World Bank’s Primary
Education Project in 1984 and the BRIDGES project of the Harvard Institute of International Development
in 1988-89.
A1.4 The Primary Education Project study compared Science and Mathematics achievement of 3,300
students of grades 4 and 5 in a representative sample of project and non-project schools in Punjab, Sindh and
the North-Western Frontier Province (NWFP). Shah (1984) summarizes the results. In all three provinces,
girls scored higher in sciences while boys scored higher in mathematics. However, achievement for all groups
was low and based on these results the author suggests that schools should primarily focus on ensuring that
students acquire basic competencies rather than increasing peripheral luxuries in the curriculum. Interestingly,
the correlation between professional teacher qualifications and test outcomes was fairly weak, with a
significant positive correlation only in one province.
A1.5 The BRIDGES project collected student achievement data from a random sample of about 11,000
students in grades 4 and 5 and 1,000 teachers from 500 schools using the same instrument as the Primary
Education Project study described above. The test showed a decline in both Science and Mathematics scores
between 1984 and 1989. The study also collected information on student and teacher background
characteristics and classroom practices, in an effort to relate these teacher characteristics to student outcomes.
Later Studies – 1990s
A1.6 Testing activity in Pakistan increased significantly during the 1990s as a result of the Education For
All (EFA) declaration and the associated UNESCO-UNICEF initiative. These studies focused on a broad
variety of topics. The results are briefly overviewed below.
A1.7 Mirza and Hameed (1994) explored the effectiveness of various school types. These types were: 1)
mosque school, 2) two teacher primary school, 3) five teacher primary school, 4) primary section with middle
school and 5) primary section with high school. Three test instruments were administered. The first two
covered Mathematics, Science, Social Studies and Dinyat (the study of the practical laws and ideology of
Islam). The third attempted to assess students’ behavior as measured by classroom participation, motivation,
cooperation and socialization, discipline, cleanliness, carefulness and regularity and punctuality. The sample
consisted of 15,991 students in grades 3 and 5 from 472 schools selected from the four provinces of
Balochistan, M.W.F.P., Punjab and Sindh. Mosque schools had the lowest gross achievement and gross
128
behavior scores. Primary sections of middle schools performed best on the achievement score and primary
sections of high schools ranked first for behavior. Five teacher primary schools were the most cost-effective
in terms of cognitive achievement. However overall, the correlation between achievement scores and per-
student cost was extremely weak.
A1.8 Pervez (1995) attempted to determine the degree to which students possess basic competencies. The
testing instrument was a semi-structured questionnaire covering life skills, reading competence, writing
competence, counting and arithmetic, mental arithmetic and Holy Qur’an. The sample consisted of a
representative sample (multi-stage, systematic-random sampling design) of 1,241 rural and 1,341 urban 11-12
year olds. One of the unique characteristics of Pervez’s study was the use of a household rather than school
based sampling frame. Thus, children from the appropriate age group were sampled from households
irrespective of whether they were currently enrolled in school or not—as a result, the test outcomes are a
snapshot of learning achievement for the entire age-specific population, rather than a selected school-going
group. Perhaps as a result of this unique sampling frame, only 20.7% of children were competent at levels
considered basic. Competency was lowest for letter writing whereas numerical skills, arithmetic, rote-reading
and writing from dictation were deemed acceptable. As a result, Pervez (1995) concludes that Pakistani
schools should shift away from teaching only rote-memorization-based skills.27
A1.9 The national survey conducted by the Multi-Donor Support Unit for the Social Action Program in
1995 aimed at determining the critical variables impacting academic achievement at the primary school level.
Basic information was collected on 527 schools throughout the country. Academic achievement in
mathematics, general knowledge and comprehension was tested for 914 teachers and 11,563 students in grade
5 (although data from the Sindh province was later discarded). The test instruments were based on textbook
materials for grades 3 and 4. The survey found student performance to be satisfactory. There were three
interesting correlations reported from this study:
1. Teacher qualifications improved student scores (teacher performance varied across provinces from a
high of 91% in Punjab to a low of 77% in the Northern Areas (FANA). This effect was particularly
pronounced in rural areas where trained teachers accounted for a 12 percent increase in student
scores.
2. Students taught in mixes settings or by female teachers generally outperformed their peers.
3. Private school consistently scored better than government schools.
27 Since the document does not provide detailed breakdowns by the schooling status of the child, we are unclear for the basis of
this statement.
129
A1.10 The NGO Action Aid Pakistan conducted an assessment of Mathematics, Urdu and General
knowledge on 965 students in 50 schools sampled from six districts in the four major provinces and AJK. In
addition, the study included focal group sessions as well and interviews with community leaders. Private
schools performed significantly better than NGO and government schools in all categories. The difference
between NGO and government schools was negligible. These results matched the opinions expressed in
focal groups and interviews.
A1.11 Khan et al (1999) assessed learning achievement in Science, Mathematics, and Language (Urdu) for
grade 4 students. The test instruments were based directly on the curriculum. In total, the sample consisted
of 145 schools and 2794 students from 28 districts (he sample was not random). The results mirrored earlier
studies. Girls performed better in Science and Urdu whereas boys were better in Mathematics. Urban
students scored higher on all three sections than rural students and children in Sindh ranked first, followed by
Punjab and NWFP and, significantly lower, FATA, FANA, AJK and Balochistan.
A1.12 Arif et al (1999) explored the factors expounded by head teachers, teachers, learning coordinators,
parents and students for low educational outcomes. Additionally an achievement test in Social Studies,
Mathematics and Urdu was given to 200 students. Generally head teachers criticized the standard of teaching,
absenteeism of teachers, and lack of support provided to students at home. Teachers predominantly blamed
low performance of the lack of adequate facilities and physical resources. Learning coordinators also focuses
on the lack of physical resources in addition to teacher absenteeism and, poor school administration and non-
cooperation between teachers and the community.
A1.13 Studies by Haque et al (2000), the Bureau of Curriculum Development and Extension Servicess,
N.W.F.P, (1999) and the Bureau of Curriculum and Extension Centre, Balochistan, (2000) have similarly
explored the factors responsible for poor performances. Questionnaires in these studies were submitted to
head teachers, teacher and learning coordinators along with achievement tests for students. Complaints were
similar to those found by Arif et al (1999).
A1.14 Punjab Literacy Watch (1999) tested students from 31 schools (16 boys public schools, 14 girls public
schools and one co-educational private school), 822 boys and 549 girls, to determine competency in
Mathematics and Urdu. For the choice of schools, District Educational Officers from two districts in each of
Northern, Central and Southern Punjab were asked to select equal numbers of good, average and weak
schools. The test instruments were designed based on the complete common curriculum. Students did well
130
on simple and mechanical mathematical problems and tasks like joining letters into words, making sentences
and comprehension. In contrast, students performed poorly on geometry, fractions, decimals, and problems
involving thinking or application of knowledge as well as grammar, letter writing and arrangements in
alphabetical order.
A1.15 This array of tests and outcomes is summarized in the table in Annexure 1. A surprising fact that
emerges from the summary below is that although a large number of assessments have been undertaken in
Pakistan, there has been little (if at all, any) coordination between the different testing bodies, and as a result,
there is no systematic reporting of information. For instance, UNESCO (2000) in their document on
Assessing Learning Achievement specifies that a `good survey’ should include at the very minimal, careful
documentation of the sampling methodology (with standard errors), as well as instrument construction and
validation. As our summary below shows, only in a very few cases are we able to learn these essential test-
characteristics from available documentation.28 As a result, there is almost no comparability of these different
tests- while they each provide an individual snapshot that can be used to understand variation within the
testing sample, they cannot be used to further our understanding of changes in achievement over time (for
instance, we have no idea whether students score higher in one Urdu test compared to another because of
learning or because of differences in the test instrument).
II. THE LEAPS TEST INSTRUMENT
A1.16 Our description of the test instruments as well as the testing environment is organized as follows: We
start with an overview of the aims of the test instruments as well as the general principles used in the overall
selection of test items. We then outline the basic structure of the three tests, with specific emphasis on the
content domain and a discussion of our instrument in the context of testing frameworks that have been
developed by other organizations.
What should we test?
A1.17 Schools serve multiple purposes and teach a diverse range of subjects, skills as well as morals and
attitudes (see Box A.1). As such, measuring their output is difficult and controversial. The test instrument
developed here attempts to roughly quantify a small set of a school’s output. Accordingly, the test only
includes sections on English, Urdu, and Mathematics. Although far from measuring the total “output” of a
28 We are currently in the process of trying to contact each individual author to update this review, but in a number of cases, instruments have been discarded and published documents remain the only source of information.
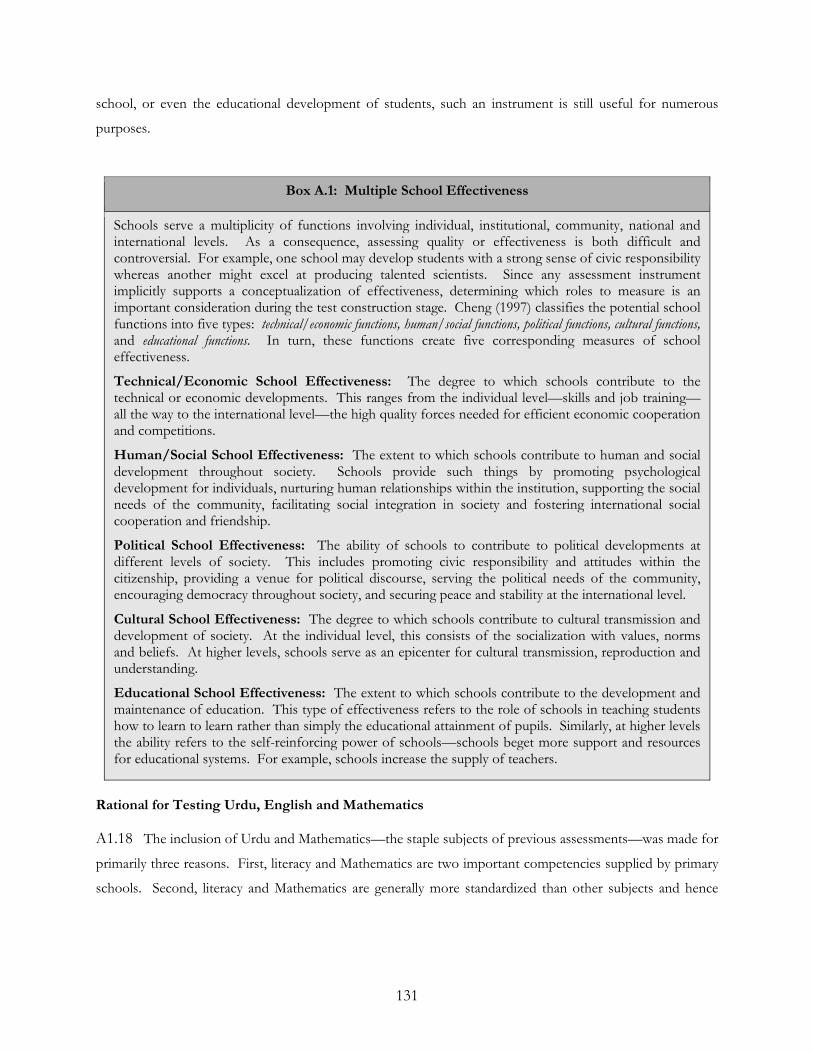
131
school, or even the educational development of students, such an instrument is still useful for numerous
purposes.
Box A.1: Multiple School Effectiveness
Schools serve a multiplicity of functions involving individual, institutional, community, national and international levels. As a consequence, assessing quality or effectiveness is both difficult and controversial. For example, one school may develop students with a strong sense of civic responsibility whereas another might excel at producing talented scientists. Since any assessment instrument implicitly supports a conceptualization of effectiveness, determining which roles to measure is an important consideration during the test construction stage. Cheng (1997) classifies the potential school functions into five types: technical/economic functions, human/social functions, political functions, cultural functions, and educational functions. In turn, these functions create five corresponding measures of school effectiveness.
Technical/Economic School Effectiveness: The degree to which schools contribute to the technical or economic developments. This ranges from the individual level—skills and job training—all the way to the international level—the high quality forces needed for efficient economic cooperation and competitions.
Human/Social School Effectiveness: The extent to which schools contribute to human and social development throughout society. Schools provide such things by promoting psychological development for individuals, nurturing human relationships within the institution, supporting the social needs of the community, facilitating social integration in society and fostering international social cooperation and friendship.
Political School Effectiveness: The ability of schools to contribute to political developments at different levels of society. This includes promoting civic responsibility and attitudes within the citizenship, providing a venue for political discourse, serving the political needs of the community, encouraging democracy throughout society, and securing peace and stability at the international level.
Cultural School Effectiveness: The degree to which schools contribute to cultural transmission and development of society. At the individual level, this consists of the socialization with values, norms and beliefs. At higher levels, schools serve as an epicenter for cultural transmission, reproduction and understanding.
Educational School Effectiveness: The extent to which schools contribute to the development and maintenance of education. This type of effectiveness refers to the role of schools in teaching students how to learn to learn rather than simply the educational attainment of pupils. Similarly, at higher levels the ability refers to the self-reinforcing power of schools—schools beget more support and resources for educational systems. For example, schools increase the supply of teachers.
Rational for Testing Urdu, English and Mathematics
A1.18 The inclusion of Urdu and Mathematics—the staple subjects of previous assessments—was made for
primarily three reasons. First, literacy and Mathematics are two important competencies supplied by primary
schools. Second, literacy and Mathematics are generally more standardized than other subjects and hence
132
lend themselves to greater cross-school comparability.29 Third, most subjects besides Urdu and Mathematics
are based almost exclusively on rote-memorization at the primary school level. Hence, the chosen subjects
have the additional benefit of testing reasoning and logical analysis as well as critical and complex thinking.
A1.19 The inclusion of English separates this assessment from most previous studies. The primary ground
for its inclusion is that it can be considered a core competency, which is now part of the official curriculum of
the country. There are also more subtle reasons. For instance, there may be a specific connection between
English achievement and private school fees. This suggestion is motivated by the prevalence of schools
advertising English language instruction. English instruction may also serve as an important signaling
mechanism indicating quality for both employers and parents. For these reasons, the assessment of English
achievement is particularly interesting.
Development and Selection of Test Items - Overall
A1.20 The principles and frameworks prevalent in the learning assessment literature have been useful as
guiding principles for designing the test but they have not been treated as rigid structures that the test must
conform to. Many of the frameworks are formulated in the context of developed countries and thus are not
entirely well suited for settings in which the national distribution of achievement is dramatically dispersed
(even across the same grade). In the design of the pre-test, we chose not to administer a criterion-referenced
test since an explicit goal in the future for such tests would be to relate test outcomes to educational inputs
(such as teacher quality) that we believe are important. As such, it was important that the test should measure
learning with high precision levels at all levels of knowledge- while a criterion-referenced test would distinguish
sharply between students who meet (do not meet) the specified criteria, it may not yield any information of
those below (or above) the critical level.
A1.21 The use of a norm-referenced test creates special needs in the case of Pakistan: although the test will
be administered to Pakistani children who have all completed the third grade, there is wide variation in
learning across schools and provinces, and it is expected that many of the children tested may not be familiar
even with the content of the first grade curriculum. This places special demands on test construction even if a
norm-referenced test is used.
29 For example, due to the nature of the subject matter, the progression of social studies and life sciences can easily diverge significantly from curricular guidelines. Indeed, even the curricular guidelines for social studies indicate a substantial degree of flexibility, stating “much of the learning of pupils in the early years should be based on direct experience and practical activities, achieved as far as possible through the exploration of their immediate environment.”
133
A1.22 Specifically, to use a norm-referenced test properly, we need to first know what the lower and upper
bounds of learning in the grades to be tested are; this is particularly important in the case of value-added
assessment, where the test has to try and cover children at all levels of knowledge in the population. Because
of the huge differences in learning across schools, it is important to ascertain carefully the questions that can
be used in a norm-referenced test. Prior to the design and administration of the final LEAPS test, an
extensive pilot was used to identify lower and upper limits of learning in the population and provide an
analysis of the validity and reliability of the instrument used. The data from this phase was then used to refine
the final test used in the LEAPS project.
A1.23 The choice and structure of content for English, Urdu, and Math was based on an attempt to
optimize on the following:
• Breadth of content: The test should cover the general range of content taught to children by the time
they reach fifth grade.
• Range of difficulty: The range of difficulty should be varied across skills (questions) as well as within
each skill (question) to better capture variation in achievement.
• Distribution of ability type: The test should call upon the different cognitive abilities relevant for
understanding the content in question (for example, in Mathematics: conceptual, procedural and
problem solving).
• Variation in type of questions: Depending on the content being tested, there should be some
variation in type of questions, including multiple-choice questions, short answers and long answers.
Each type connotes a different level of prerequisite skill as well.
A1.24 In addition to these general principles, other rules followed for wording and compiling each question
included the following criteria:
• Easy to understand: Formats that are familiar to children should be used and understanding the
question should not require an ability greater than that which is being tested by the question.
• Easy to administer: Questions that required additional materials can be discriminatory. Such
questions should only be considered if they are feasible to administer properly.
• Unbiased instrument with respect to socio-economic status: References to items that children from
particular socio-economic backgrounds will have no exposure to can create bias. Such references
should be avoided.
134
A1.25 The initial version of the test followed the curricular standards for Grade 3 and 4 closely. However, it
was quickly noted that the performance of children was considerably below what the curriculum stated it
should be, thus further validating the choice of a norm-referenced test rather than a criterion-referenced test
based on the curriculum. For the first week of pilot testing (6 schools) parts of the test were reconstructed
after each test to minimize the problems discussed above and improve the precision of ability/learning
estimates across the range of students. Although all the content of the final version was checked for
consistency with the Pakistan’s curricular standards and some material was added based on emphasis in the
curriculum, the instrument is designed to test basic competencies rather than comprehensive knowledge of
specific curricular items. The content for the portions of the test specific to Grade 3 and 4 (the medium and
difficult sections) follows frameworks prevalent in the learning assessment literature (see Annexure 1).
Development and Selection of Test Items
Urdu and English
A1.26 Literacy frameworks used by other assessments (see Annexure 1) categorize the different purposes of
reading and writing that should be assessed. However, these frameworks assume that the pupil will have the
basic ability to do some reading and writing. We have not made this assumption while constructing the
instrument. Hence both the English and Urdu sections begin with the alphabet and progress through the
basic elements of writing: word construction, grammar, vocabulary, sentence construction, and conclude with
a reading comprehension and essay exercise.
A1.27 The instruments included in the Urdu and English sections were adapted from a variety of sources30.
The two sections cover a comparable range of content and difficulty: Both sections begin with alphabet
recognition and end with an essay question and the tests maintain consistency in content, structure and
intellectual demands. Table I below summarizes the content areas of the Urdu and English sections.
30 Many questions in the Urdu section were adapted from instruments included in Kizilbash (1997). Other than tests and exams
administered by teachers in schools, we were unable to find suitable instruments for the English component and in addition to
designing questions ourselves, web-based resources for educationists were used to fill this gap. Based on Dr. Catherine Snow’s (Harvard School of Education) suggestion a cloze passage (every fifth word or so blanked out) was included in the English
section (source: www.tut-world.org) and Urdu section.
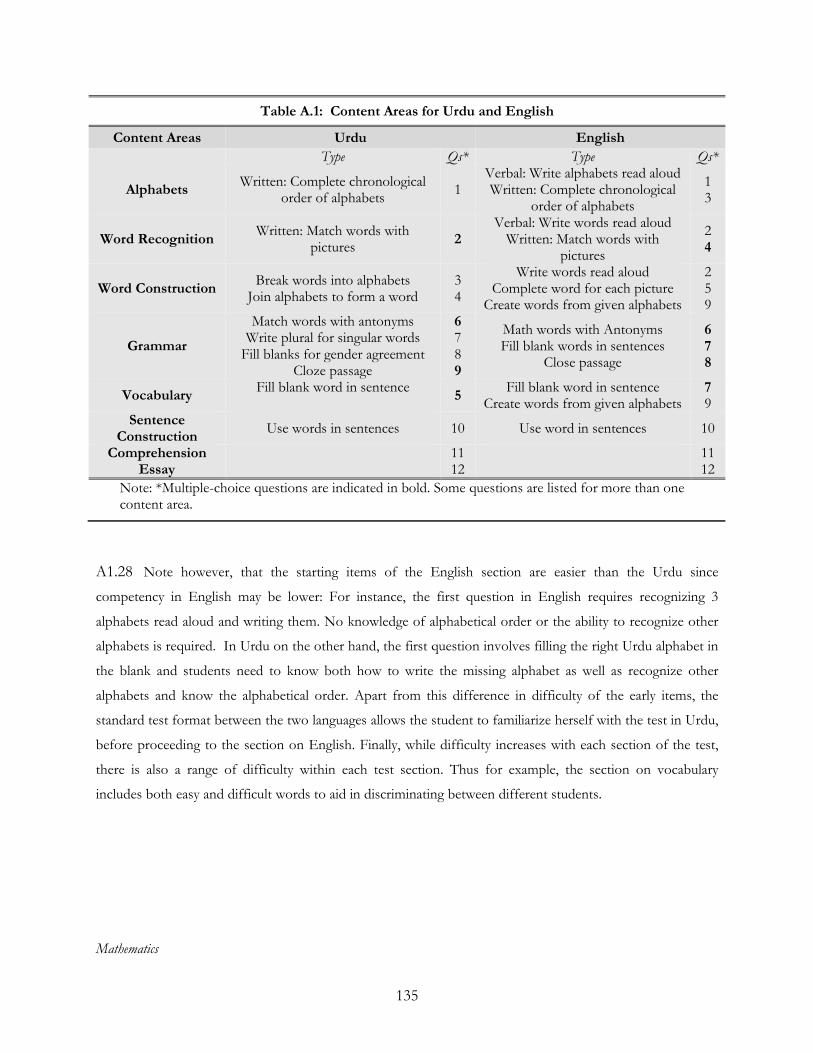
135
Table A.1: Content Areas for Urdu and English
Content Areas Urdu English
Type Qs* Type Qs*
Alphabets Written: Complete chronological
order of alphabets 1
Verbal: Write alphabets read aloud Written: Complete chronological
order of alphabets
1 3
Word Recognition Written: Match words with
pictures 2
Verbal: Write words read aloud Written: Match words with
pictures
2 4
Word Construction Break words into alphabets
Join alphabets to form a word 3 4
Write words read aloud Complete word for each picture
Create words from given alphabets
2 5 9
Grammar
Match words with antonyms Write plural for singular words Fill blanks for gender agreement
Cloze passage
6 7 8 9
Math words with Antonyms Fill blank words in sentences
Close passage
6 7 8
Vocabulary Fill blank word in sentence
5
Fill blank word in sentence Create words from given alphabets
7 9
Sentence Construction
Use words in sentences 10 Use word in sentences 10
Comprehension 11 11 Essay 12 12
Note: *Multiple-choice questions are indicated in bold. Some questions are listed for more than one content area.
A1.28 Note however, that the starting items of the English section are easier than the Urdu since
competency in English may be lower: For instance, the first question in English requires recognizing 3
alphabets read aloud and writing them. No knowledge of alphabetical order or the ability to recognize other
alphabets is required. In Urdu on the other hand, the first question involves filling the right Urdu alphabet in
the blank and students need to know both how to write the missing alphabet as well as recognize other
alphabets and know the alphabetical order. Apart from this difference in difficulty of the early items, the
standard test format between the two languages allows the student to familiarize herself with the test in Urdu,
before proceeding to the section on English. Finally, while difficulty increases with each section of the test,
there is also a range of difficulty within each test section. Thus for example, the section on vocabulary
includes both easy and difficult words to aid in discriminating between different students.
Mathematics
136
A1.29 For the Mathematics test, we have adapted frameworks used by other assessments that outline the
content domains to be assessed. The five major domains that are identified under these outlines are31:
• Number sense, properties, and operations (40%);
• Measurement (20%);
• Geometry and spatial sense (15%);
• Data analysis, statistics, and probability (15%); and
• Algebra and functions (15%).
A1.30 While we have followed a similar pattern, greater emphasis is placed in our math test on the first
major domain- Number sense, properties and operations. During the initial fielding of the test instrument in
6 schools, it was noted that performance in math was lower than expected, and the test was not providing
adequate information for children at the lower end of the knowledge distribution. Thus, additional items were
added covering the first domain to obtain finer partitions of knowledge for this subset of test-takers. The
content and cognitive demand of the final test is summarized below:
Table A.2: Content and Cognitive Domain for Mathematics with Question Examples
Content Domains (example Qs from test) Cognitive Domains (example Qs from test)
a) Number Operations (1-5) b) Measurement (15) c) Geometry (22) d) Algebra (11 and 20) e) Data Analysis (21)
1. Conceptual Understanding (4 and 11) 2. Procedural Knowledge (5, 10, 13) 3. Problem Solving (9, 12, 14)
A1.31 The more advanced content domains such as algebra have only been conceptually tested, whereas
more rudimentary elements such as addition, subtraction, multiplication and division have been tested both
procedurally and through problem solving. As with the English and Urdu tests, the range of difficulty varies
within math skills tested (e.g. Addition: single digit, two digit, three digit with carry, decimal with carry) as well
as across math skills tested (counting to percentages and fractions). In addition to better capturing variation in
achievement, the test design could also be useful in identifying particular `stumbling blocks’ for students with
regard to particular skills (for example, difficulty with `division’) or particular levels of difficulty (for example,
difficulty with 2 digit division/multiplication). The order of questions and progression of content is based on
31 See Appendix 1 for a detailed description
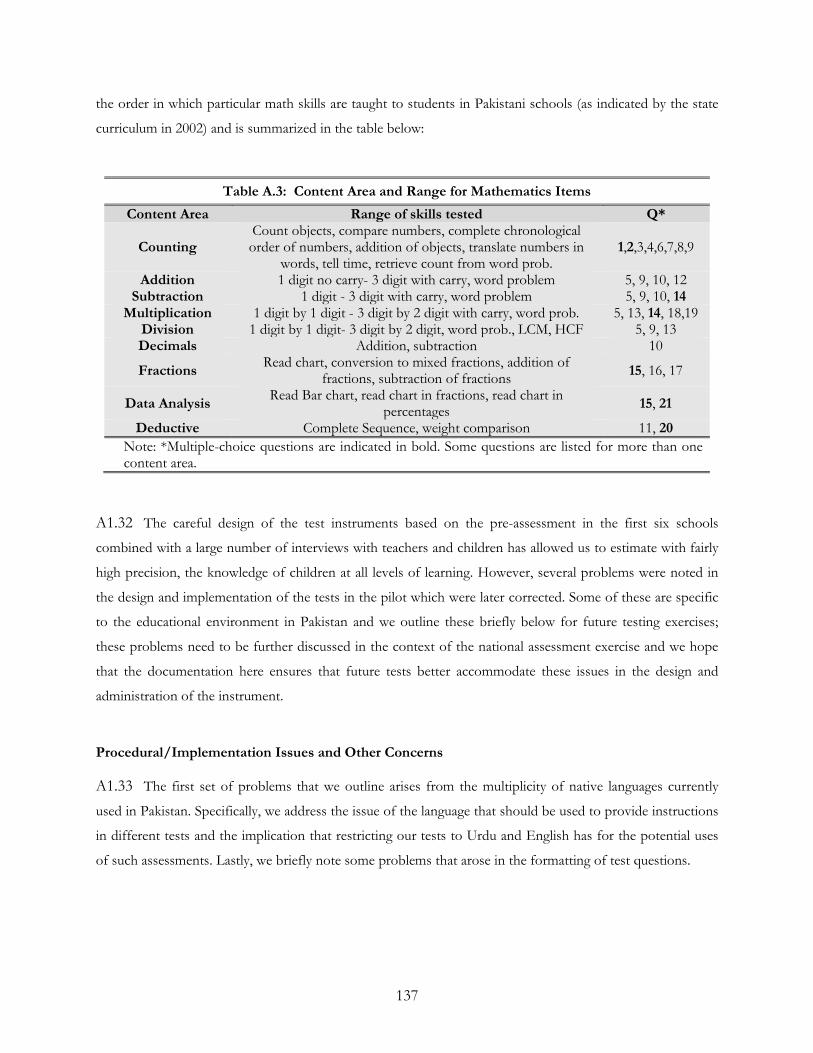
137
the order in which particular math skills are taught to students in Pakistani schools (as indicated by the state
curriculum in 2002) and is summarized in the table below:
Table A.3: Content Area and Range for Mathematics Items
Content Area Range of skills tested Q*
Counting Count objects, compare numbers, complete chronological order of numbers, addition of objects, translate numbers in
words, tell time, retrieve count from word prob. 1,2,3,4,6,7,8,9
Addition 1 digit no carry- 3 digit with carry, word problem 5, 9, 10, 12 Subtraction 1 digit - 3 digit with carry, word problem 5, 9, 10, 14
Multiplication 1 digit by 1 digit - 3 digit by 2 digit with carry, word prob. 5, 13, 14, 18,19 Division 1 digit by 1 digit- 3 digit by 2 digit, word prob., LCM, HCF 5, 9, 13 Decimals Addition, subtraction 10
Fractions Read chart, conversion to mixed fractions, addition of
fractions, subtraction of fractions 15, 16, 17
Data Analysis Read Bar chart, read chart in fractions, read chart in
percentages 15, 21
Deductive Complete Sequence, weight comparison 11, 20
Note: *Multiple-choice questions are indicated in bold. Some questions are listed for more than one content area.
A1.32 The careful design of the test instruments based on the pre-assessment in the first six schools
combined with a large number of interviews with teachers and children has allowed us to estimate with fairly
high precision, the knowledge of children at all levels of learning. However, several problems were noted in
the design and implementation of the tests in the pilot which were later corrected. Some of these are specific
to the educational environment in Pakistan and we outline these briefly below for future testing exercises;
these problems need to be further discussed in the context of the national assessment exercise and we hope
that the documentation here ensures that future tests better accommodate these issues in the design and
administration of the instrument.
Procedural/Implementation Issues and Other Concerns
A1.33 The first set of problems that we outline arises from the multiplicity of native languages currently
used in Pakistan. Specifically, we address the issue of the language that should be used to provide instructions
in different tests and the implication that restricting our tests to Urdu and English has for the potential uses
of such assessments. Lastly, we briefly note some problems that arose in the formatting of test questions.
138
The Interpretation of Literacy Scores
A1.34 The exclusive use of Urdu in our test instrument places limits on the interpretation of literacy scores.
Functional literacy, in terms of the ability of individuals to participate in society, may diverge significantly
from Urdu literacy if Urdu is used primarily as a `second-language’ in the region considered. This limits the
use of the literacy score in certain types of analysis. For example, using Urdu literacy as a proxy for human
capital may underestimate human capital in areas where Urdu is not the primary language. This would suggest
the expansion of the test-instrument to include testing in the vernacular, particularly, Saraiki, Pashto and
Punjabi for Punjab province.
A1.35 On the other hand, this does not significantly affect the value of Urdu literacy scores for other
potential questions. Since Urdu literacy is a core competency in Pakistan’s curricular standards, Urdu literacy
scores provide valuable information on educational attainment in different schools. Thus, the decision to test
in the vernacular as opposed to (or in addition to) testing in Urdu must be based on the aim of the test
instrument—if the main aim of the test instrument is to assess functional literacy, vernacular testing would be
essential, but if the primary focus is on learning in schools (or value-added learning), restriction to testing in
Urdu would yield significant insights.
Literacy Bias in Mathematics
A1.36 Pakistan’s linguistic fractionalization also has implications for the language used in providing
instructions for the test instrument. For our pilot, we chose Urdu and English primarily due to high uniform
exposure from early childhood and to ensure compatibility with the Pakistan Education Ministry in their
Strategic Framework for National Education Assessment 2001.
A1.37 Despite the fact that our tests were administered in areas where Urdu is not a second language, the
use of two languages for instructions raised important issues in the Math assessment as a result of the
interaction between language skills and math skills in the design of the instrument. This interaction was noted
in two different areas of the test: the medium of instruction, and the design of questions that required
conceptual translations between language and math.
Medium of Instruction
A1.38 In the schools for the pilot test, which included top private schools in urban areas, all language
statements (including instructions) in the mathematics section were either in Urdu or English depending on
the language of instruction. The need for separate languages arises due to the presence of different language
139
“mediums” for school instruction (note though, that this is an issue only if the sample includes urban schools;
for the rural sample of the LEAPS project, all instructions were in Urdu). Specifically, in `English-medium’
schools exposure to mathematical terminology may be only in English, and the use of only Urdu terminology
would lead to problems in comparisons across schools: For instance, children in English (Urdu) medium
schools may be familiar with the English (Urdu) but not the Urdu (English) concept of the “lowest common
multiple” of two numbers.
A1.39 Although an effort was made to limit unneeded verbiage in the mathematics section of the test,
significant portions still required a basic level of literacy. The choice to include written instructions with
mathematical terminology and some word problems is intentional, and is intended to test the ability of the
student to mathematically interpret common (verbal) situations.
A1.40 However, this prerequisite of basic literacy, although reasonable, may bias the use of test scores as a
measure of students’ skills and competencies in mathematics, if language skills are poor32. Future tests need to
carefully consider the implications of using verbal statements in mathematics exams, especially in the context
of students who may not have attained any degree of literacy by the time the test is administered. This
problem is further compounded in regions where the vernacular language is different from Urdu—in these
cases, test designers need to assess the degree to which the use of vernacular instructions would help in
ensuring that the test instrument is valid as a measure of learning in mathematics.
Vocabulary Sets
A1.41 A second, perhaps subtler problem was the requirement of different levels of vocabulary in the translation
of language to mathematical statements, depending on the medium of instruction. One item that led to such a
problem was the translation of numbers in words to numbers in numerals. The choice of one particular
number, “65” raises a direct issue, since in English, to write numbers in words till “100” requires
memorization of each number till the “20” as well as the specific numbers “30”, “40” etc. In Urdu however,
this requirement requires the memorization of all numbers till “100”: and it is common to find students with
the same mathematical skills who differ along this particular dimension. Particular care needs to be taken that
when instructions and items are translated, the size of the required vocabulary set is the same in all languages used
for test administration.
32 For example, Howie and Plomp (2001) find a relationship between the number of first language speakers in a class and pupils’
achievement in mathematics in their analysis of South African school level TIMSS data. Similarly, The SAP National Survey
(1995) found similar literacy effects when testing teacher skills. Both male and female teachers from urban and rural areas
scored worse on narrative questions as compared to numerical questions.
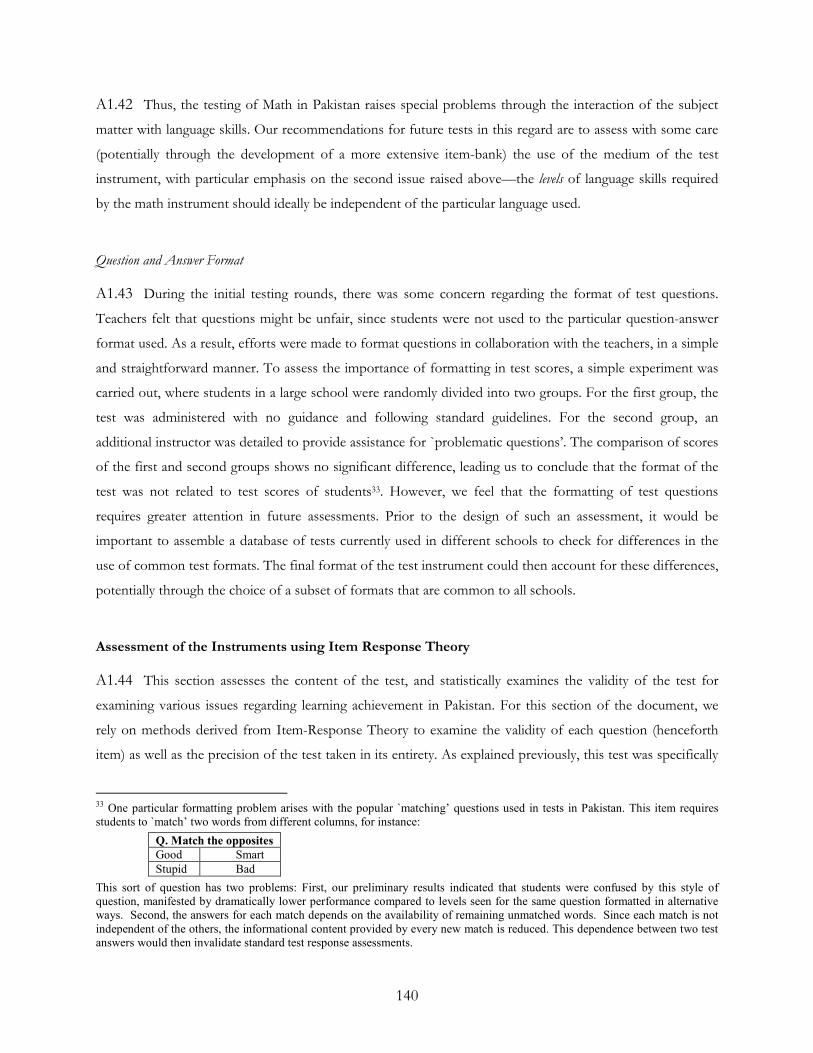
140
A1.42 Thus, the testing of Math in Pakistan raises special problems through the interaction of the subject
matter with language skills. Our recommendations for future tests in this regard are to assess with some care
(potentially through the development of a more extensive item-bank) the use of the medium of the test
instrument, with particular emphasis on the second issue raised above—the levels of language skills required
by the math instrument should ideally be independent of the particular language used.
Question and Answer Format
A1.43 During the initial testing rounds, there was some concern regarding the format of test questions.
Teachers felt that questions might be unfair, since students were not used to the particular question-answer
format used. As a result, efforts were made to format questions in collaboration with the teachers, in a simple
and straightforward manner. To assess the importance of formatting in test scores, a simple experiment was
carried out, where students in a large school were randomly divided into two groups. For the first group, the
test was administered with no guidance and following standard guidelines. For the second group, an
additional instructor was detailed to provide assistance for `problematic questions’. The comparison of scores
of the first and second groups shows no significant difference, leading us to conclude that the format of the
test was not related to test scores of students33. However, we feel that the formatting of test questions
requires greater attention in future assessments. Prior to the design of such an assessment, it would be
important to assemble a database of tests currently used in different schools to check for differences in the
use of common test formats. The final format of the test instrument could then account for these differences,
potentially through the choice of a subset of formats that are common to all schools.
Assessment of the Instruments using Item Response Theory
A1.44 This section assesses the content of the test, and statistically examines the validity of the test for
examining various issues regarding learning achievement in Pakistan. For this section of the document, we
rely on methods derived from Item-Response Theory to examine the validity of each question (henceforth
item) as well as the precision of the test taken in its entirety. As explained previously, this test was specifically
33 One particular formatting problem arises with the popular `matching’ questions used in tests in Pakistan. This item requires
students to `match’ two words from different columns, for instance:
Q. Match the opposites
Good Smart
Stupid Bad
This sort of question has two problems: First, our preliminary results indicated that students were confused by this style of
question, manifested by dramatically lower performance compared to levels seen for the same question formatted in alternative
ways. Second, the answers for each match depends on the availability of remaining unmatched words. Since each match is not
independent of the others, the informational content provided by every new match is reduced. This dependence between two test
answers would then invalidate standard test response assessments.
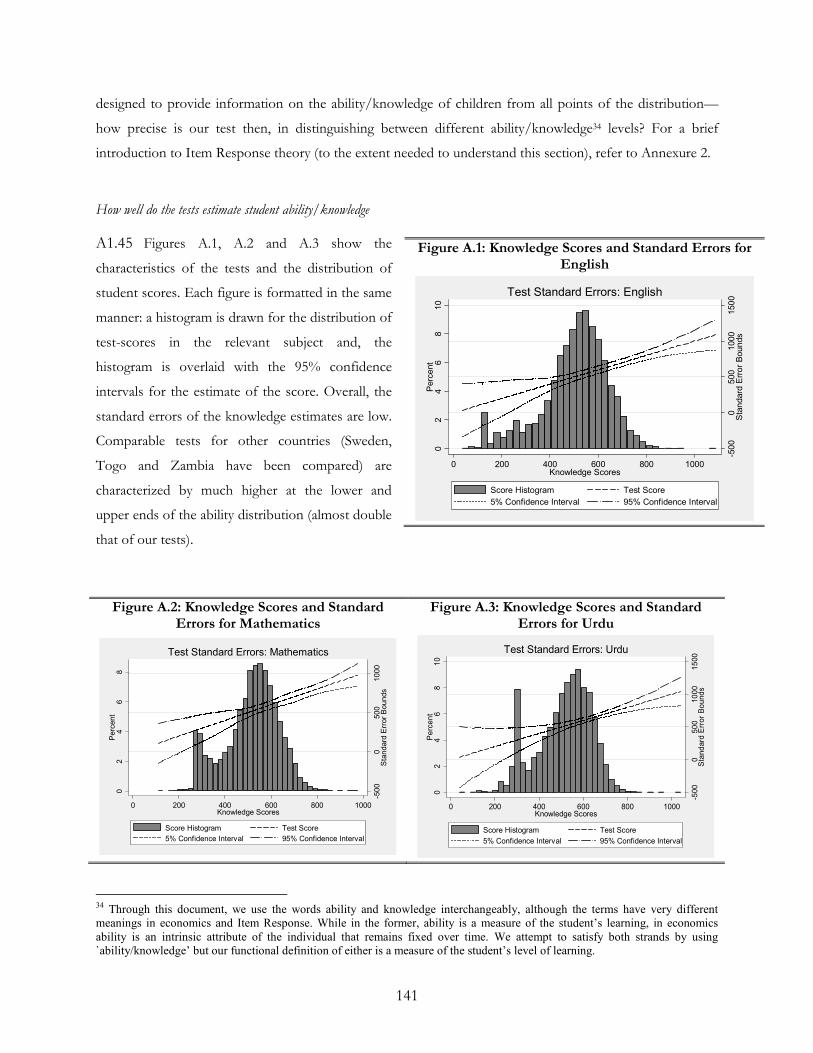
141
designed to provide information on the ability/knowledge of children from all points of the distribution—
how precise is our test then, in distinguishing between different ability/knowledge34 levels? For a brief
introduction to Item Response theory (to the extent needed to understand this section), refer to Annexure 2.
How well do the tests estimate student ability/knowledge
A1.45 Figures A.1, A.2 and A.3 show the
characteristics of the tests and the distribution of
student scores. Each figure is formatted in the same
manner: a histogram is drawn for the distribution of
test-scores in the relevant subject and, the
histogram is overlaid with the 95% confidence
intervals for the estimate of the score. Overall, the
standard errors of the knowledge estimates are low.
Comparable tests for other countries (Sweden,
Togo and Zambia have been compared) are
characterized by much higher at the lower and
upper ends of the ability distribution (almost double
that of our tests).
Figure A.2: Knowledge Scores and Standard Errors for Mathematics
Figure A.3: Knowledge Scores and Standard Errors for Urdu
34 Through this document, we use the words ability and knowledge interchangeably, although the terms have very different
meanings in economics and Item Response. While in the former, ability is a measure of the student’s learning, in economics
ability is an intrinsic attribute of the individual that remains fixed over time. We attempt to satisfy both strands by using
`ability/knowledge’ but our functional definition of either is a measure of the student’s level of learning.
-500
0500
1000
Sta
ndard
Err
or
Bounds
02
46
8P
erc
ent
0 200 400 600 800 1000Knowledge Scores
Score Histogram Test Score
5% Confidence Interval 95% Confidence Interval
Test Standard Errors: Mathematics
-500
05
00
10
00
15
00
Sta
nd
ard
Err
or
Bo
und
s
02
46
81
0P
erc
en
t
0 200 400 600 800 1000Knowledge Scores
Score Histogram Test Score
5% Confidence Interval 95% Confidence Interval
Test Standard Errors: Urdu
Figure A.1: Knowledge Scores and Standard Errors for English
-50
00
500
1000
150
0S
tan
dard
Err
or
Boun
ds
02
46
81
0P
erc
ent
0 200 400 600 800 1000Knowledge Scores
Score Histogram Test Score
5% Confidence Interval 95% Confidence Interval
Test Standard Errors: English
142
A1.46 Nevertheless, the graphs show that our estimates around the middle of the distribution are far better
than at the ends of the distribution—this is a standard issue with all tests, since items designed for providing
information at the extremes of the distribution also add to information for the mean, but not necessarily the
other way around. The problem is compounded in our case because the distribution of knowledge scores
appears to be a mixture consisting of a “hump” of students who perform extremely poorly combined with a
standard normal distribution. This hump is the group of students who know so little that even the LEAPS
test, which starts with the basics, does not yield much information about their knowledge—we know they are
doing badly, but not how badly they are doing. Clearly, it is possible to rectify this for Urdu by starting the
test with asking children to write alphabets, rather than fill in the order. Similarly for Mathematics, the test
could start with asking children to write down numbers next to a collection of objects. For English, we don’t
see any alternative at all, since the test started with the easiest possible question that can be used without
involving supervisors more integrally—something that usually causes biases and greater error due to
supervisor-specific effects.
III. CONCLUSION
A1.47 This document provides a detailed description of the testing environment in Pakistan as well as
documentation and analysis of a pre-pilot test carried out in private and public schools in Pakistan. The
analysis of this test shows that while there are some areas for improvement, on the whole the test has
performed extremely well in its ability to distinguish between students of different caliber. Nevertheless,
valuable lessons were learnt, relating to the issues of testing in a linguistically fractionalized region and these
should be carefully noted, especially with regards to the upcoming national assessment program.
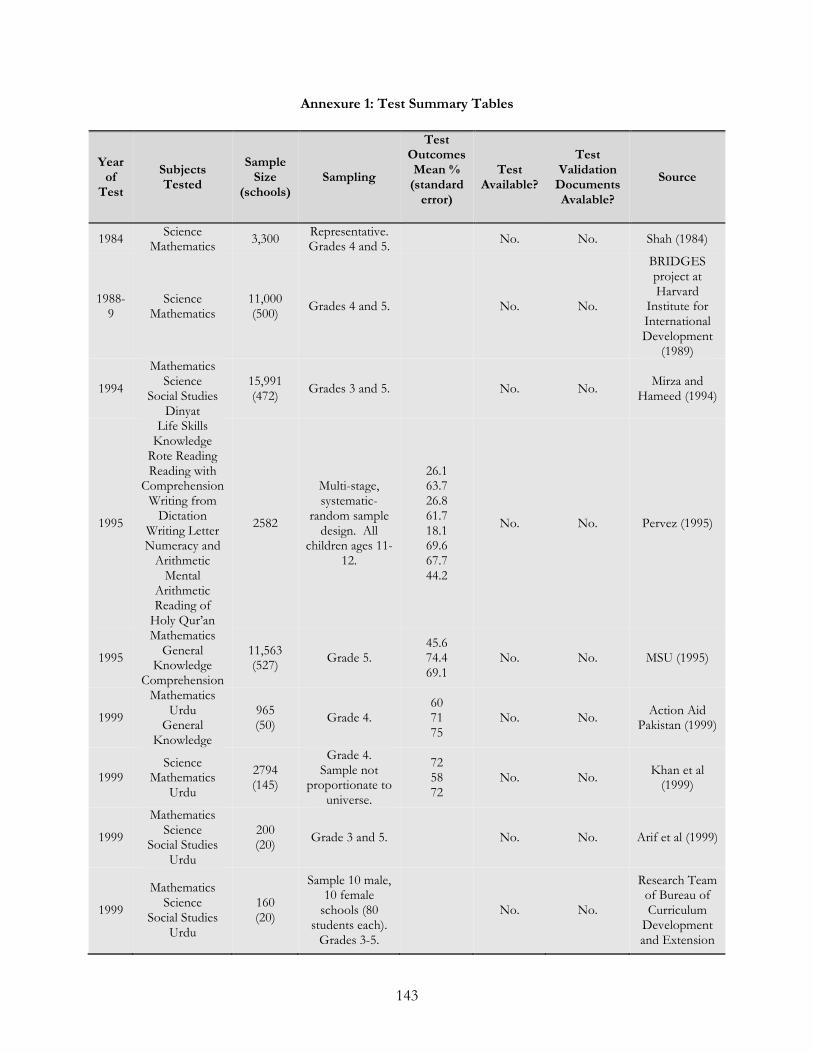
143
Annexure 1: Test Summary Tables
Year of
Test
Subjects Tested
Sample Size
(schools) Sampling
Test Outcomes Mean % (standard error)
Test Available?
Test Validation Documents Avalable?
Source
1984 Science
Mathematics 3,300
Representative. Grades 4 and 5.
No. No. Shah (1984)
1988-9
Science Mathematics
11,000 (500)
Grades 4 and 5. No. No.
BRIDGES project at Harvard
Institute for International Development
(1989)
1994
Mathematics Science
Social Studies Dinyat
15,991 (472)
Grades 3 and 5. No. No. Mirza and
Hameed (1994)
1995
Life Skills Knowledge Rote Reading Reading with
Comprehension Writing from Dictation
Writing Letter Numeracy and Arithmetic Mental
Arithmetic Reading of Holy Qur’an
2582
Multi-stage, systematic-
random sample design. All
children ages 11-12.
26.1 63.7 26.8 61.7 18.1 69.6 67.7 44.2
No. No. Pervez (1995)
1995
Mathematics General
Knowledge Comprehension
11,563 (527)
Grade 5. 45.6 74.4 69.1
No. No. MSU (1995)
1999
Mathematics Urdu
General Knowledge
965 (50)
Grade 4. 60 71 75
No. No. Action Aid
Pakistan (1999)
1999 Science
Mathematics Urdu
2794 (145)
Grade 4. Sample not
proportionate to universe.
72 58 72
No. No. Khan et al (1999)
1999
Mathematics Science
Social Studies Urdu
200 (20)
Grade 3 and 5. No. No. Arif et al (1999)
1999
Mathematics Science
Social Studies Urdu
160 (20)
Sample 10 male, 10 female schools (80
students each). Grades 3-5.
No. No.
Research Team of Bureau of Curriculum Development and Extension
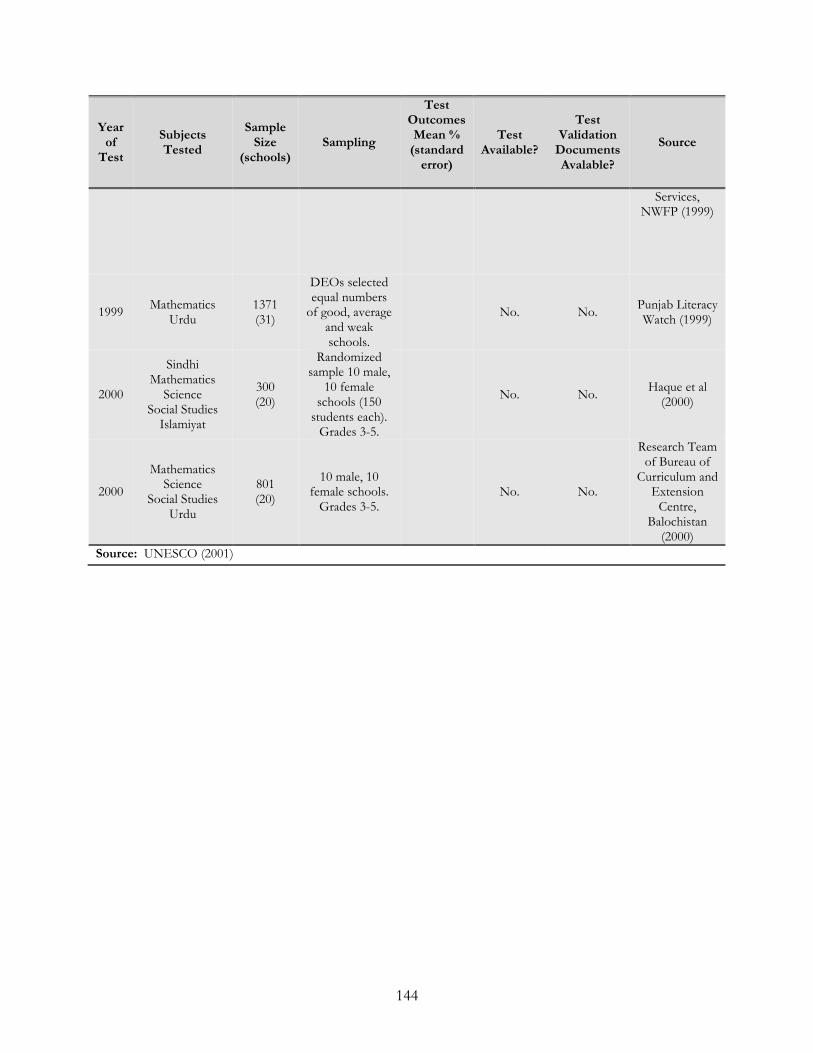
144
Year of
Test
Subjects Tested
Sample Size
(schools) Sampling
Test Outcomes Mean % (standard error)
Test Available?
Test Validation Documents Avalable?
Source
Services, NWFP (1999)
1999 Mathematics
Urdu 1371 (31)
DEOs selected equal numbers of good, average
and weak schools.
No. No. Punjab Literacy Watch (1999)
2000
Sindhi Mathematics
Science Social Studies Islamiyat
300 (20)
Randomized sample 10 male,
10 female schools (150 students each). Grades 3-5.
No. No. Haque et al (2000)
2000
Mathematics Science
Social Studies Urdu
801 (20)
10 male, 10 female schools. Grades 3-5.
No. No.
Research Team of Bureau of
Curriculum and Extension Centre,
Balochistan (2000)
Source: UNESCO (2001)
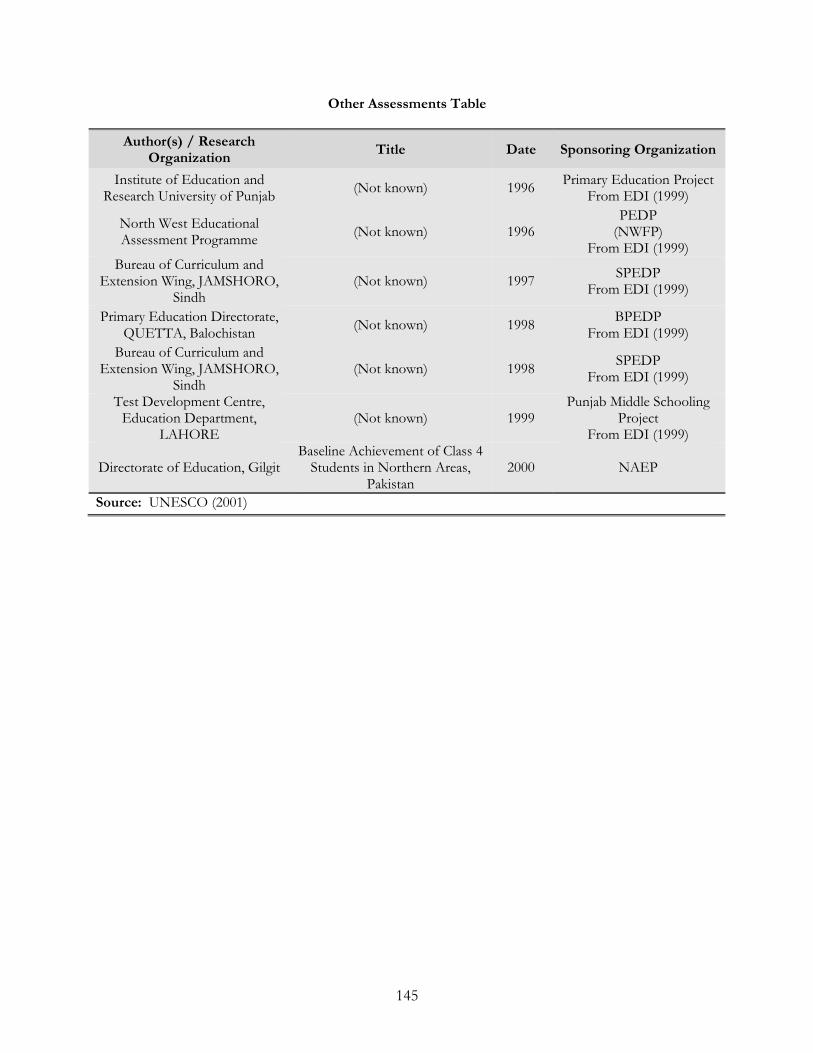
145
Other Assessments Table
Author(s) / Research Organization
Title Date Sponsoring Organization
Institute of Education and Research University of Punjab
(Not known) 1996 Primary Education Project
From EDI (1999)
North West Educational Assessment Programme
(Not known) 1996 PEDP (NWFP)
From EDI (1999) Bureau of Curriculum and
Extension Wing, JAMSHORO, Sindh
(Not known) 1997 SPEDP
From EDI (1999)
Primary Education Directorate, QUETTA, Balochistan
(Not known) 1998 BPEDP
From EDI (1999)
Bureau of Curriculum and Extension Wing, JAMSHORO,
Sindh (Not known) 1998
SPEDP From EDI (1999)
Test Development Centre, Education Department,
LAHORE (Not known) 1999
Punjab Middle Schooling Project
From EDI (1999)
Directorate of Education, Gilgit Baseline Achievement of Class 4 Students in Northern Areas,
Pakistan 2000 NAEP
Source: UNESCO (2001)
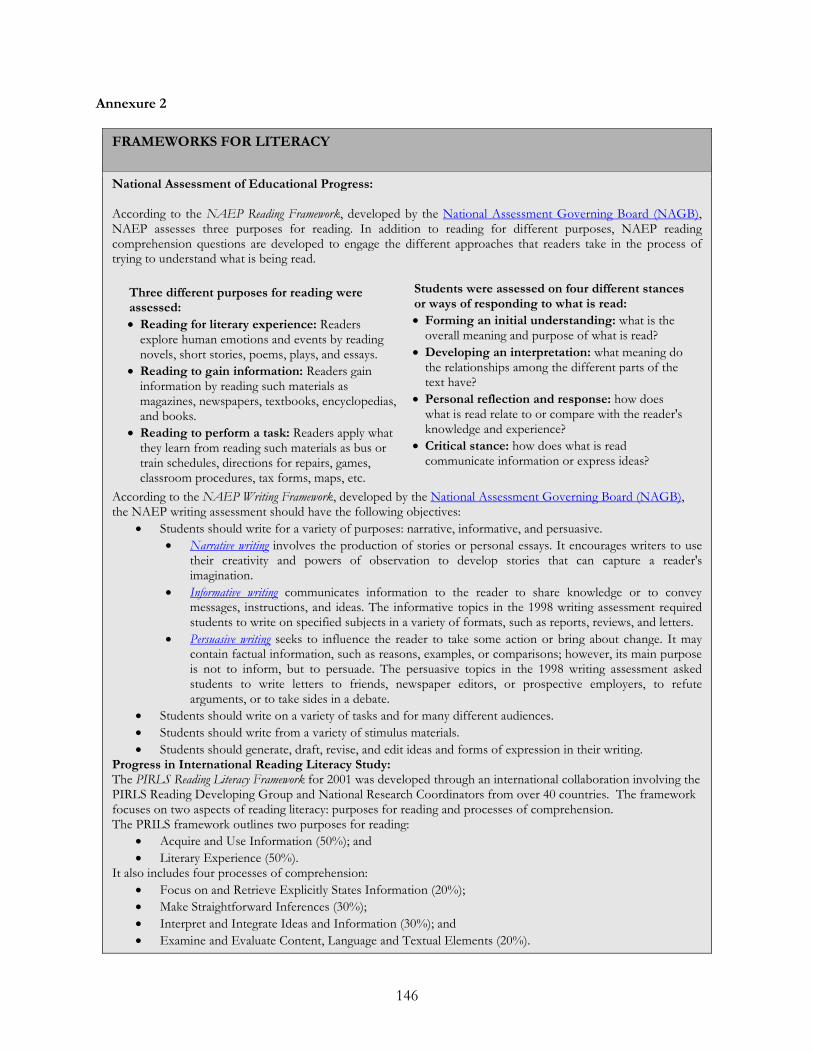
146
Annexure 2
FRAMEWORKS FOR LITERACY
National Assessment of Educational Progress: According to the NAEP Reading Framework, developed by the National Assessment Governing Board (NAGB), NAEP assesses three purposes for reading. In addition to reading for different purposes, NAEP reading comprehension questions are developed to engage the different approaches that readers take in the process of trying to understand what is being read.
Three different purposes for reading were assessed:
• Reading for literary experience: Readers explore human emotions and events by reading novels, short stories, poems, plays, and essays.
• Reading to gain information: Readers gain information by reading such materials as magazines, newspapers, textbooks, encyclopedias, and books.
• Reading to perform a task: Readers apply what they learn from reading such materials as bus or train schedules, directions for repairs, games, classroom procedures, tax forms, maps, etc.
Students were assessed on four different stances or ways of responding to what is read:
• Forming an initial understanding: what is the overall meaning and purpose of what is read?
• Developing an interpretation: what meaning do the relationships among the different parts of the text have?
• Personal reflection and response: how does what is read relate to or compare with the reader's knowledge and experience?
• Critical stance: how does what is read communicate information or express ideas?
According to the NAEP Writing Framework, developed by the National Assessment Governing Board (NAGB), the NAEP writing assessment should have the following objectives:
• Students should write for a variety of purposes: narrative, informative, and persuasive.
• Narrative writing involves the production of stories or personal essays. It encourages writers to use their creativity and powers of observation to develop stories that can capture a reader's imagination.
• Informative writing communicates information to the reader to share knowledge or to convey messages, instructions, and ideas. The informative topics in the 1998 writing assessment required students to write on specified subjects in a variety of formats, such as reports, reviews, and letters.
• Persuasive writing seeks to influence the reader to take some action or bring about change. It may contain factual information, such as reasons, examples, or comparisons; however, its main purpose is not to inform, but to persuade. The persuasive topics in the 1998 writing assessment asked students to write letters to friends, newspaper editors, or prospective employers, to refute arguments, or to take sides in a debate.
• Students should write on a variety of tasks and for many different audiences.
• Students should write from a variety of stimulus materials.
• Students should generate, draft, revise, and edit ideas and forms of expression in their writing. Progress in International Reading Literacy Study: The PIRLS Reading Literacy Framework for 2001 was developed through an international collaboration involving the PIRLS Reading Developing Group and National Research Coordinators from over 40 countries. The framework focuses on two aspects of reading literacy: purposes for reading and processes of comprehension. The PRILS framework outlines two purposes for reading:
• Acquire and Use Information (50%); and
• Literary Experience (50%). It also includes four processes of comprehension:
• Focus on and Retrieve Explicitly States Information (20%);
• Make Straightforward Inferences (30%);
• Interpret and Integrate Ideas and Information (30%); and
• Examine and Evaluate Content, Language and Textual Elements (20%).
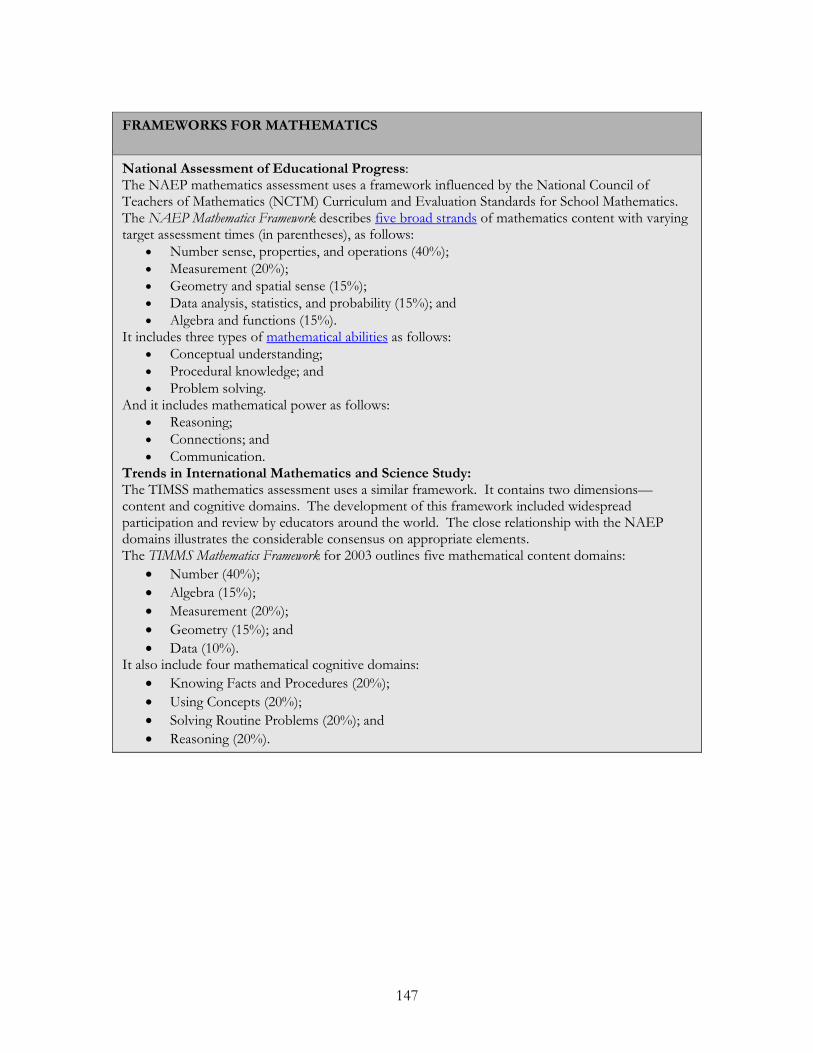
147
FRAMEWORKS FOR MATHEMATICS
National Assessment of Educational Progress: The NAEP mathematics assessment uses a framework influenced by the National Council of Teachers of Mathematics (NCTM) Curriculum and Evaluation Standards for School Mathematics. The NAEP Mathematics Framework describes five broad strands of mathematics content with varying target assessment times (in parentheses), as follows:
• Number sense, properties, and operations (40%); • Measurement (20%); • Geometry and spatial sense (15%); • Data analysis, statistics, and probability (15%); and • Algebra and functions (15%).
It includes three types of mathematical abilities as follows: • Conceptual understanding; • Procedural knowledge; and • Problem solving.
And it includes mathematical power as follows: • Reasoning; • Connections; and • Communication.
Trends in International Mathematics and Science Study: The TIMSS mathematics assessment uses a similar framework. It contains two dimensions—content and cognitive domains. The development of this framework included widespread participation and review by educators around the world. The close relationship with the NAEP domains illustrates the considerable consensus on appropriate elements. The TIMMS Mathematics Framework for 2003 outlines five mathematical content domains:
• Number (40%);
• Algebra (15%);
• Measurement (20%);
• Geometry (15%); and
• Data (10%). It also include four mathematical cognitive domains:
• Knowing Facts and Procedures (20%);
• Using Concepts (20%);
• Solving Routine Problems (20%); and
• Reasoning (20%).
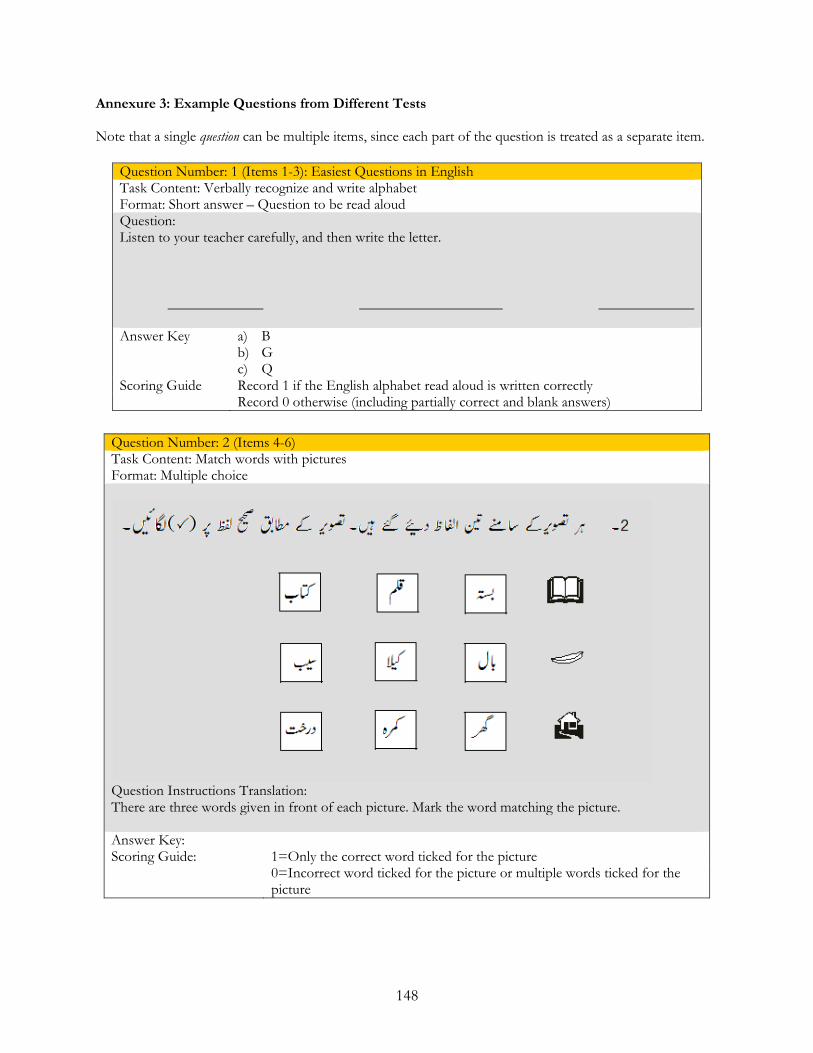
148
Annexure 3: Example Questions from Different Tests
Note that a single question can be multiple items, since each part of the question is treated as a separate item.
Question Number: 1 (Items 1-3): Easiest Questions in English Task Content: Verbally recognize and write alphabet Format: Short answer – Question to be read aloud Question: Listen to your teacher carefully, and then write the letter.
Answer Key a) B
b) G c) Q
Scoring Guide Record 1 if the English alphabet read aloud is written correctly Record 0 otherwise (including partially correct and blank answers)
Question Number: 2 (Items 4-6) Task Content: Match words with pictures Format: Multiple choice
Question Instructions Translation: There are three words given in front of each picture. Mark the word matching the picture.
Answer Key: Scoring Guide: 1=Only the correct word ticked for the picture 0=Incorrect word ticked for the picture or multiple words ticked for the
picture
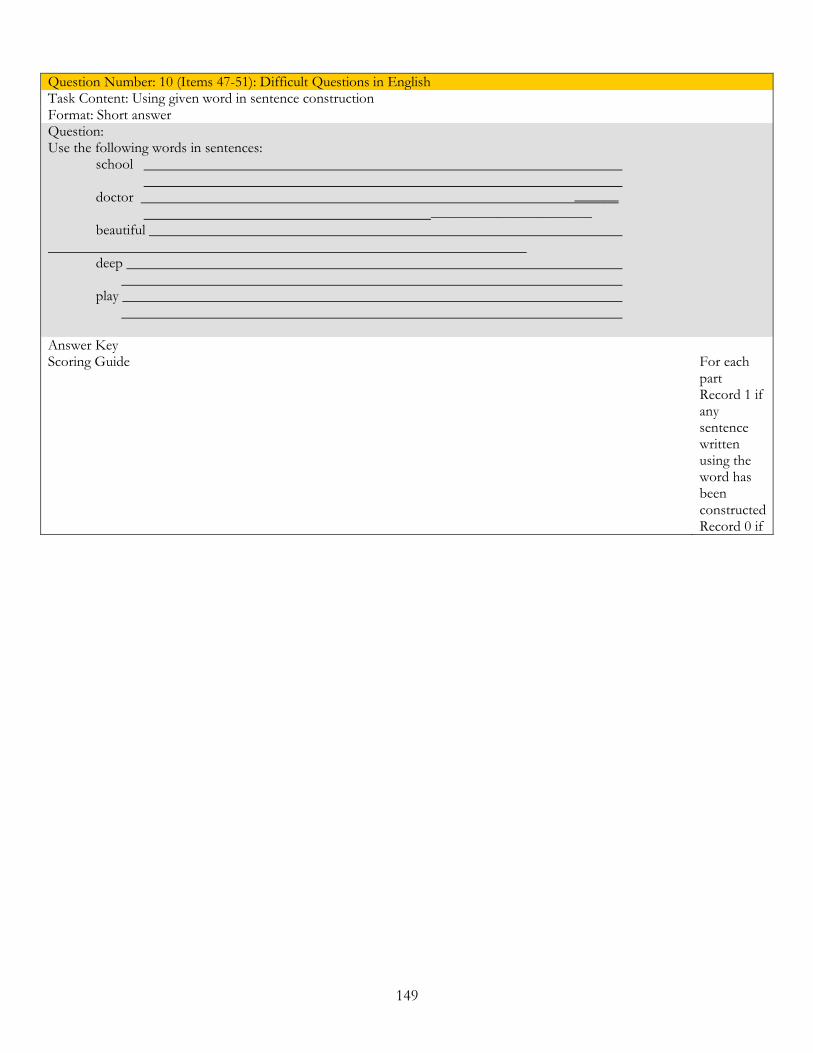
149
Question Number: 10 (Items 47-51): Difficult Questions in English Task Content: Using given word in sentence construction Format: Short answer Question: Use the following words in sentences:
school doctor ______
______________________ beautiful
deep play
Answer Key Scoring Guide For each
part Record 1 if any sentence written using the word has been constructed
Record 0 if
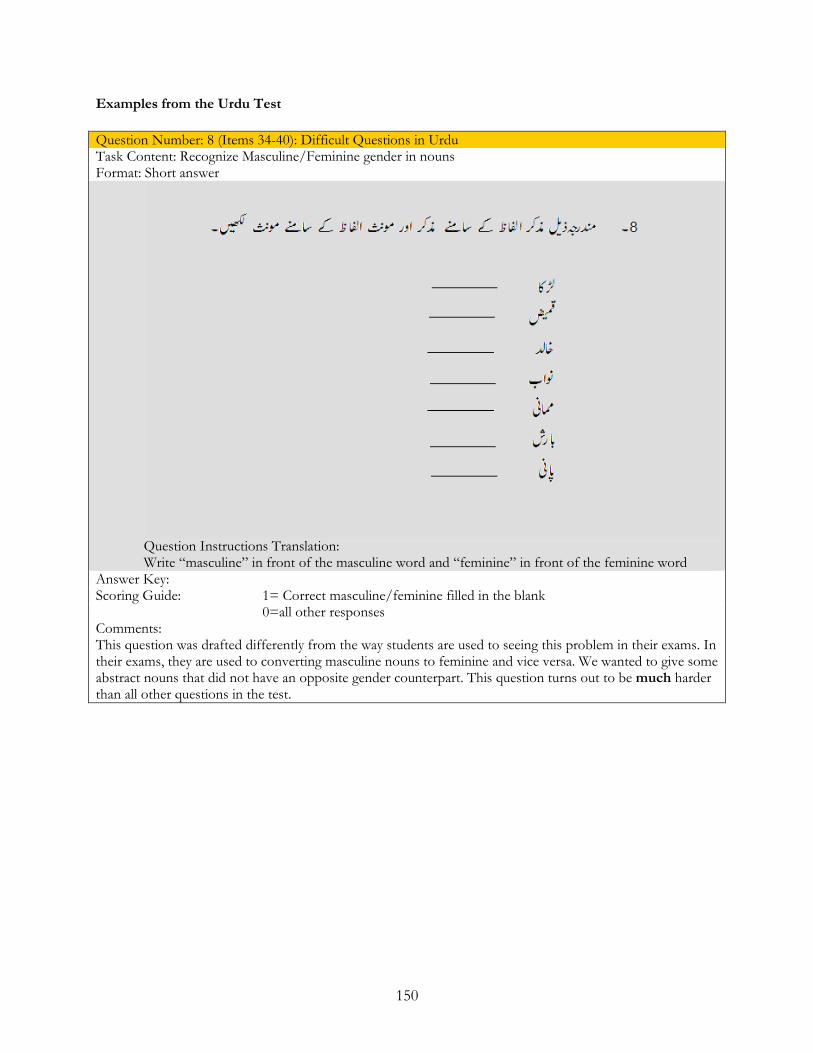
150
Examples from the Urdu Test
Question Number: 8 (Items 34-40): Difficult Questions in Urdu Task Content: Recognize Masculine/Feminine gender in nouns Format: Short answer
Question Instructions Translation: Write “masculine” in front of the masculine word and “feminine” in front of the feminine word
Answer Key: Scoring Guide: 1= Correct masculine/feminine filled in the blank 0=all other responses Comments: This question was drafted differently from the way students are used to seeing this problem in their exams. In their exams, they are used to converting masculine nouns to feminine and vice versa. We wanted to give some abstract nouns that did not have an opposite gender counterpart. This question turns out to be much harder than all other questions in the test.
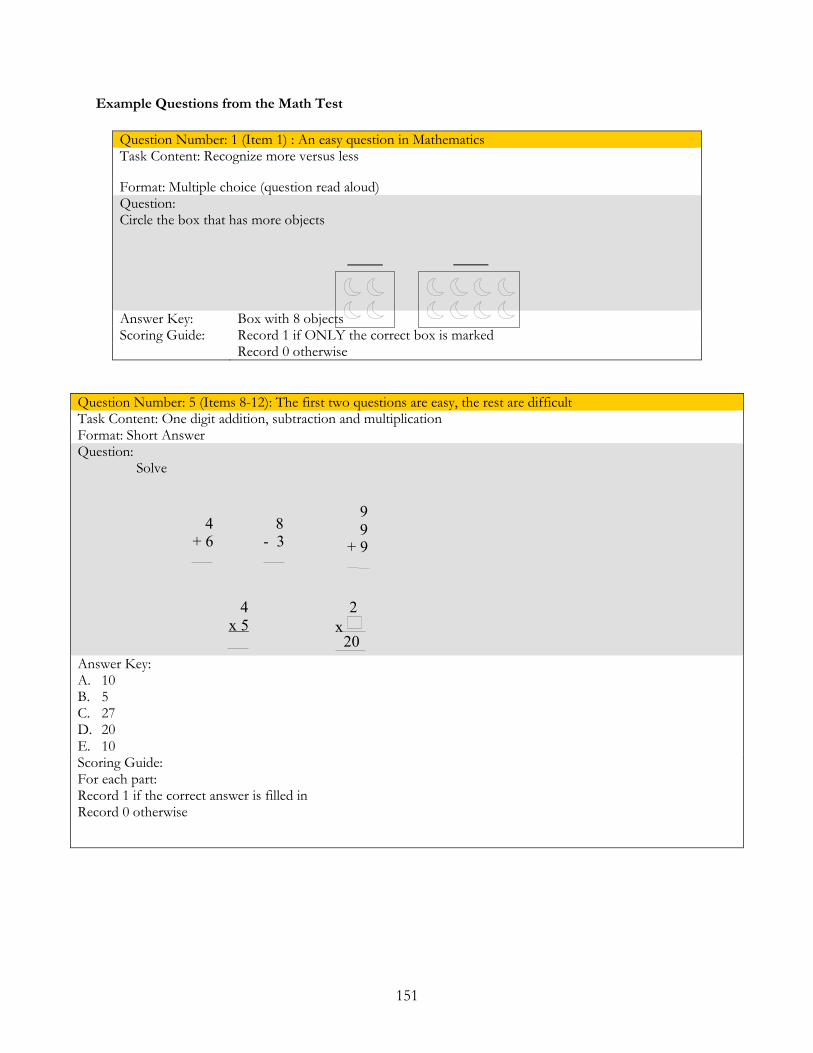
151
Example Questions from the Math Test
Question Number: 5 (Items 8-12): The first two questions are easy, the rest are difficult Task Content: One digit addition, subtraction and multiplication Format: Short Answer Question: Solve
Answer Key: A. 10 B. 5 C. 27 D. 20 E. 10 Scoring Guide: For each part: Record 1 if the correct answer is filled in Record 0 otherwise
Question Number: 1 (Item 1) : An easy question in Mathematics Task Content: Recognize more versus less
Format: Multiple choice (question read aloud) Question: Circle the box that has more objects
Answer Key: Box with 8 objects Scoring Guide: Record 1 if ONLY the correct box is marked Record 0 otherwise
4 + 6
8 - 3
9 9
+ 9
4 x 5
2 x 20
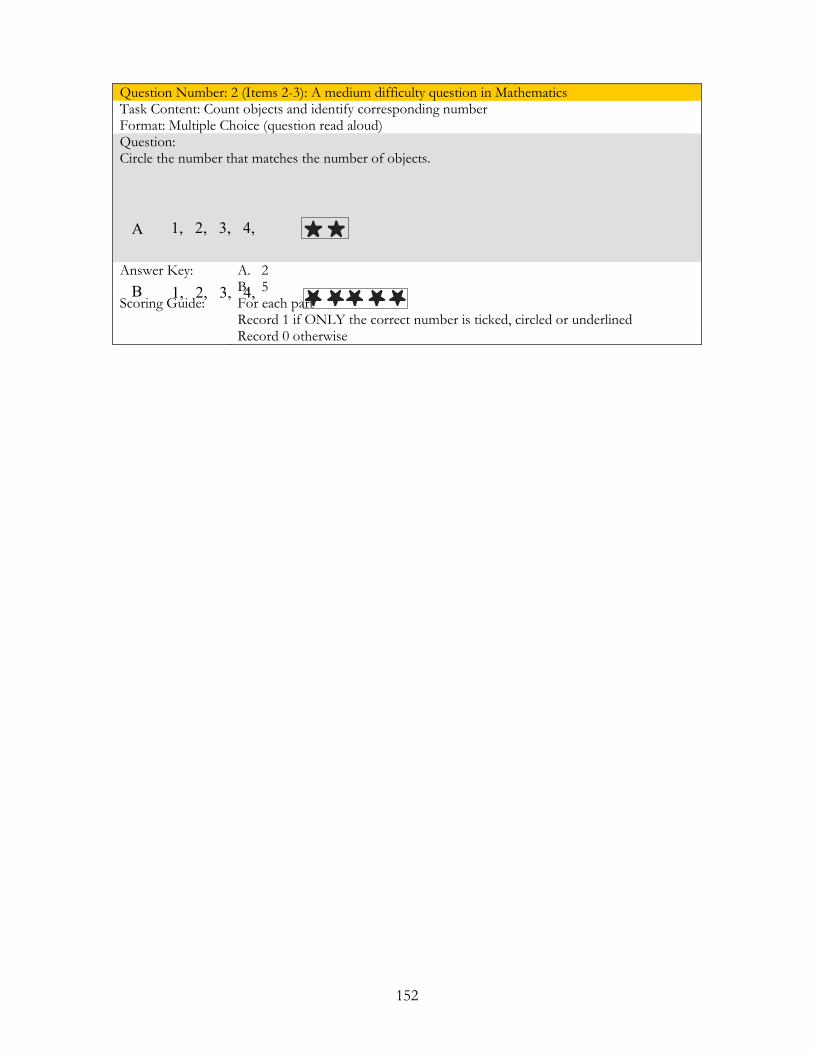
152
Question Number: 2 (Items 2-3): A medium difficulty question in Mathematics Task Content: Count objects and identify corresponding number Format: Multiple Choice (question read aloud) Question: Circle the number that matches the number of objects.
Answer Key: A. 2 B. 5
Scoring Guide: For each part Record 1 if ONLY the correct number is ticked, circled or underlined
Record 0 otherwise
1, 2, 3, 4,
5 A
1, 2, 3, 4,
5 B
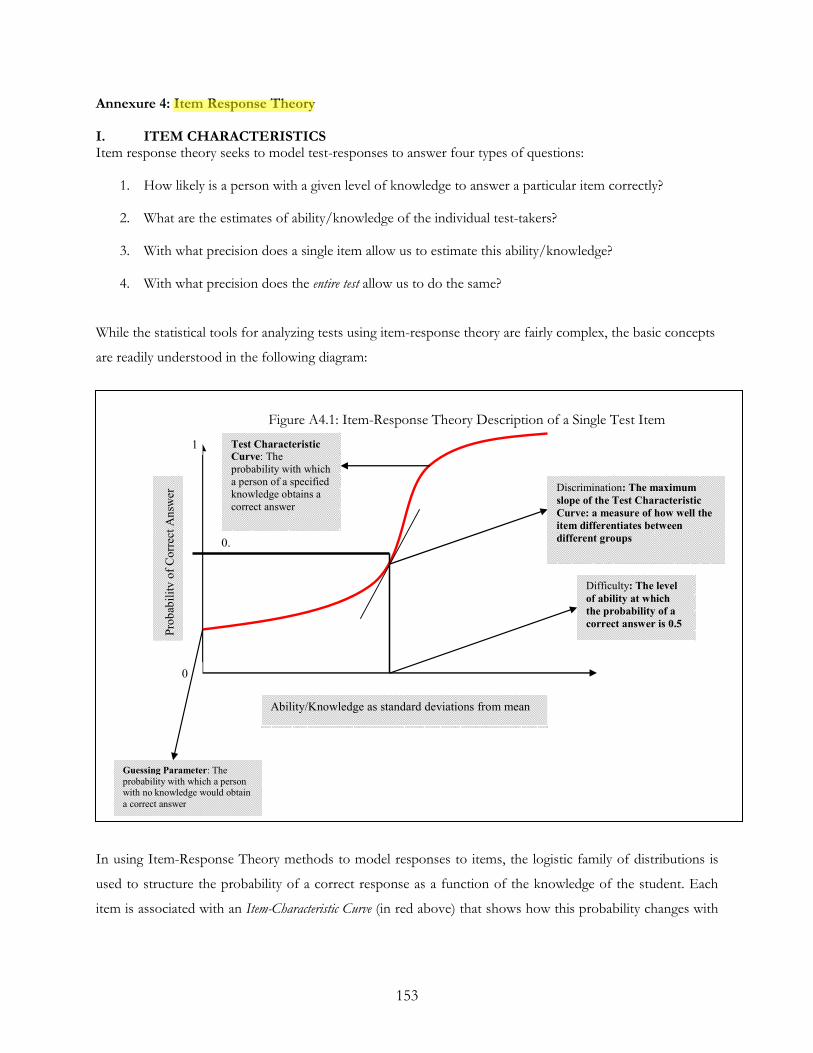
153
Figure A4.1: Item-Response Theory Description of a Single Test Item
Probab
ility of Correc
t Answ
er
0
1
0.
Ability/Knowledge as standard deviations from mean
Difficulty: The level
of ability at which
the probability of a
correct answer is 0.5
Guessing Parameter: The
probability with which a person with no knowledge would obtain
a correct answer
Discrimination: The maximum
slope of the Test Characteristic
Curve: a measure of how well the
item differentiates between
different groups
Test Characteristic
Curve: The
probability with which
a person of a specified
knowledge obtains a
correct answer
Annexure 4: Item Response Theory
I. ITEM CHARACTERISTICS Item response theory seeks to model test-responses to answer four types of questions:
1. How likely is a person with a given level of knowledge to answer a particular item correctly?
2. What are the estimates of ability/knowledge of the individual test-takers?
3. With what precision does a single item allow us to estimate this ability/knowledge?
4. With what precision does the entire test allow us to do the same?
While the statistical tools for analyzing tests using item-response theory are fairly complex, the basic concepts
are readily understood in the following diagram:
In using Item-Response Theory methods to model responses to items, the logistic family of distributions is
used to structure the probability of a correct response as a function of the knowledge of the student. Each
item is associated with an Item-Characteristic Curve (in red above) that shows how this probability changes with
Nadia
Highlight
154
the knowledge of the student. Further, for each question, there are three related parameters that fully define
this Item Characteristic Curve:
1. Difficulty: As suggested by the term, the more `difficult’ a question, the lower the probability that a
student of a given ability will obtain a correct answer. In terms of the diagram above, increasing the
difficulty of the item will shift the item-characteristic curve to the right- a student at the same level of
knowledge will have a lower probability of obtaining a correct answer (technically, the difficulty of
the question is the ability/knowledge required to obtain a correct answer with a 50% probability).
2. Discrimination: While the difficulty of an item tells us something about the probability with which a
person will answer the question correctly, it does not tell us much about the ability of the item to
distinguish (or `discriminate’) between individuals of differing ability/knowledge. This ability to
discriminate is described by the discrimination of the item, which measures the slope of the
characteristic curve at the point of inflection (equivalent to the maximum slope) - the greater the
slope at this point, the greater the ability of the item to discriminate between students above or below
the point at which the slope is measured. The discrimination parameter lends itself easily to an intuitive
formulation: suppose that both students of ability 1 and students of ability 2 had an equal probability
of answering an item correctly- in this case, the item would be unable to discriminate between these
two types of students, and, drawn between these two ability types, the slope of the characteristic
curve would be 0. However, if it were the case that all students of ability 1 had a 0 probability of
answering the question correctly, and all students of ability 2 had a probability 1 of answering the
question correctly, then the item would discriminate perfectly between these two groups, as in the
diagram below.
3. Guessing Parameter: The final parameter associated with an item is a `guessing parameter’ that is
an estimate of the probability with which a student with no knowledge of the item can obtain a
correct response. One way to think about this parameter is in the case of multiple choice questions-
if there are four options, random-guessing would imply that the probability of a correct answer is at
least 0.25. Note however, that the guessing parameter in this case may actually be higher than 0.25, if
there is reason to favor one sort of answer for the question- the notion of the `educated guess’.
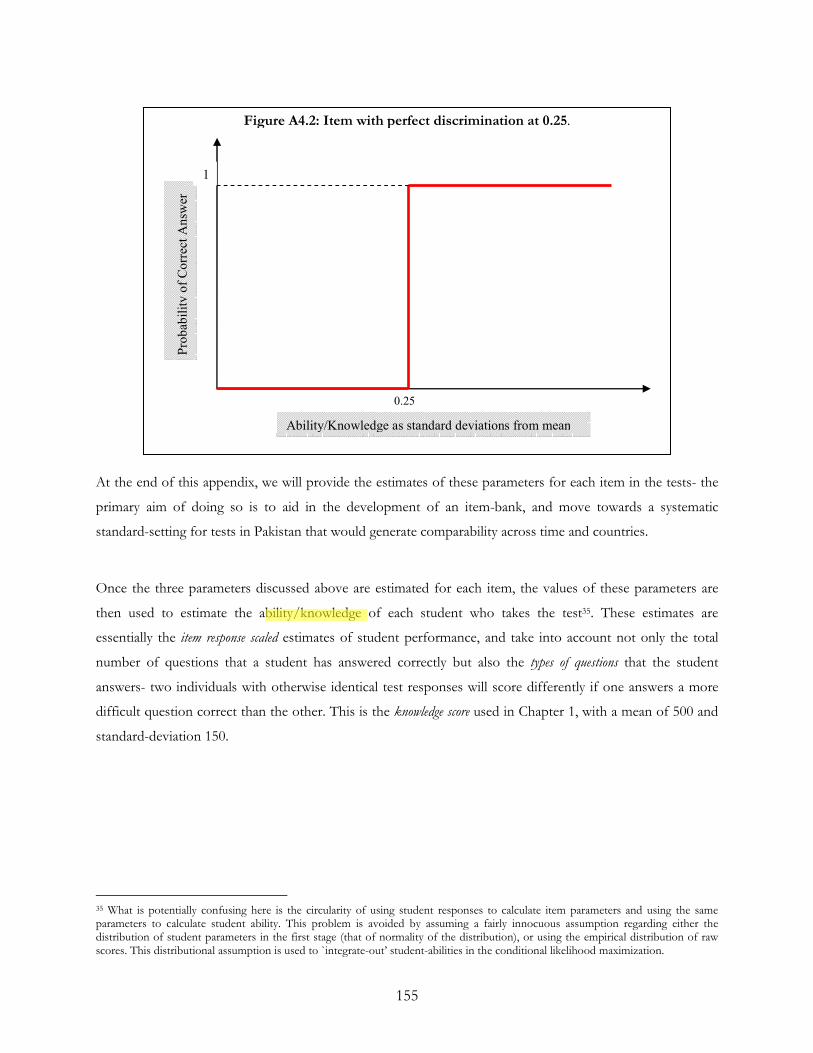
155
Figure A4.2: Item with perfect discrimination at 0.25.
Probab
ility of Correc
t Answ
er
Ability/Knowledge as standard deviations from mean
1
0.25
At the end of this appendix, we will provide the estimates of these parameters for each item in the tests- the
primary aim of doing so is to aid in the development of an item-bank, and move towards a systematic
standard-setting for tests in Pakistan that would generate comparability across time and countries.
Once the three parameters discussed above are estimated for each item, the values of these parameters are
then used to estimate the ability/knowledge of each student who takes the test35. These estimates are
essentially the item response scaled estimates of student performance, and take into account not only the total
number of questions that a student has answered correctly but also the types of questions that the student
answers- two individuals with otherwise identical test responses will score differently if one answers a more
difficult question correct than the other. This is the knowledge score used in Chapter 1, with a mean of 500 and
standard-deviation 150.
35 What is potentially confusing here is the circularity of using student responses to calculate item parameters and using the same parameters to calculate student ability. This problem is avoided by assuming a fairly innocuous assumption regarding either the distribution of student parameters in the first stage (that of normality of the distribution), or using the empirical distribution of raw scores. This distributional assumption is used to `integrate-out’ student-abilities in the conditional likelihood maximization.
Nadia
Highlight
156
II. TEST CHARACTERISTICS
While the three parameters above provide a description of every item in the test, we are also interested in
overall test characteristics- particularly the ability of the test to be able to accurately assess the knowledge of
students that we estimated at all points in the distribution. Two additional concepts are used to present this
information. The first is the item-information, which shows for each item the amount of information the item
reveals about the knowledge of students at various points in the distribution. Intuitively, a the perfectly
discriminating item in Figure A5.1 would yield a lot of information regarding students of knowledge 0.25, but
no information about those either below or above this level of knowledge. The information for each item can
then be aggregated to provide test-information, which as the term suggests is a measure of how informative the
test, taken in its entirety, is for estimating the distribution of knowledge. The standard error of the test- which is
the error in estimating knowledge- is then a function of the inverse of the test information. Ultimately, the
plot of standard error vs. knowledge/ability will tell us the accuracy with which our test is able to distinguish
between different students in the knowledge distribution, as in Figures 1, 2 and 3 in the main text above.
III. GOODNESS OF FIT
We may also be concerned about the assumptions of Item-Response Theory for the modeling of our test-
responses. Each of the items in the pilot was put through a battery of standard goodness-of-fit tests; briefly,
these compare the predicted answers for children in different parts of the knowledge distribution with the
actual answers in the test. Items where there is a large difference between the predicted answers from the
structural modeling and the actual answers were re-examined and the final LEAPS test items are selected
accordingly. The test statistic used to assess goodness-of-fit was the chi2 goodness-of-fit statistics that
compare the observed proportion of correct responses to predicted responses obtained from the logistic
model. Finally, the unidimensionality assumption was tested for every test using the eigenvalues following
from factor analysis. For all 3 tests, the first eigenvalue was at least 8 times as high as the second, with very
little difference between the second and consequent eigenvalues. This suggests that the tests assessed a single
dimension, which we call knowledge.
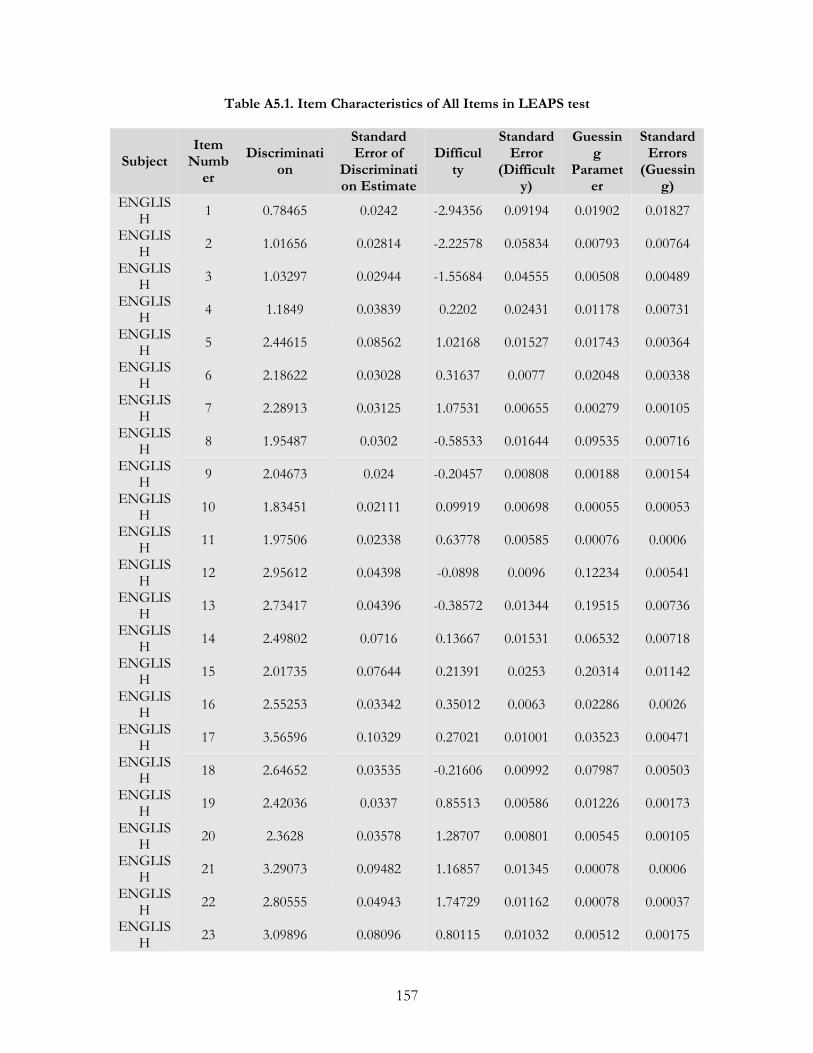
157
Table A5.1. Item Characteristics of All Items in LEAPS test
Subject Item Number
Discrimination
Standard Error of
Discrimination Estimate
Difficulty
Standard Error
(Difficulty)
Guessing
Parameter
Standard Errors
(Guessing)
ENGLISH
1 0.78465 0.0242 -2.94356 0.09194 0.01902 0.01827
ENGLISH
2 1.01656 0.02814 -2.22578 0.05834 0.00793 0.00764
ENGLISH
3 1.03297 0.02944 -1.55684 0.04555 0.00508 0.00489
ENGLISH
4 1.1849 0.03839 0.2202 0.02431 0.01178 0.00731
ENGLISH
5 2.44615 0.08562 1.02168 0.01527 0.01743 0.00364
ENGLISH
6 2.18622 0.03028 0.31637 0.0077 0.02048 0.00338
ENGLISH
7 2.28913 0.03125 1.07531 0.00655 0.00279 0.00105
ENGLISH
8 1.95487 0.0302 -0.58533 0.01644 0.09535 0.00716
ENGLISH
9 2.04673 0.024 -0.20457 0.00808 0.00188 0.00154
ENGLISH
10 1.83451 0.02111 0.09919 0.00698 0.00055 0.00053
ENGLISH
11 1.97506 0.02338 0.63778 0.00585 0.00076 0.0006
ENGLISH
12 2.95612 0.04398 -0.0898 0.0096 0.12234 0.00541
ENGLISH
13 2.73417 0.04396 -0.38572 0.01344 0.19515 0.00736
ENGLISH
14 2.49802 0.0716 0.13667 0.01531 0.06532 0.00718
ENGLISH
15 2.01735 0.07644 0.21391 0.0253 0.20314 0.01142
ENGLISH
16 2.55253 0.03342 0.35012 0.0063 0.02286 0.0026
ENGLISH
17 3.56596 0.10329 0.27021 0.01001 0.03523 0.00471
ENGLISH
18 2.64652 0.03535 -0.21606 0.00992 0.07987 0.00503
ENGLISH
19 2.42036 0.0337 0.85513 0.00586 0.01226 0.00173
ENGLISH
20 2.3628 0.03578 1.28707 0.00801 0.00545 0.00105
ENGLISH
21 3.29073 0.09482 1.16857 0.01345 0.00078 0.0006
ENGLISH
22 2.80555 0.04943 1.74729 0.01162 0.00078 0.00037
ENGLISH
23 3.09896 0.08096 0.80115 0.01032 0.00512 0.00175
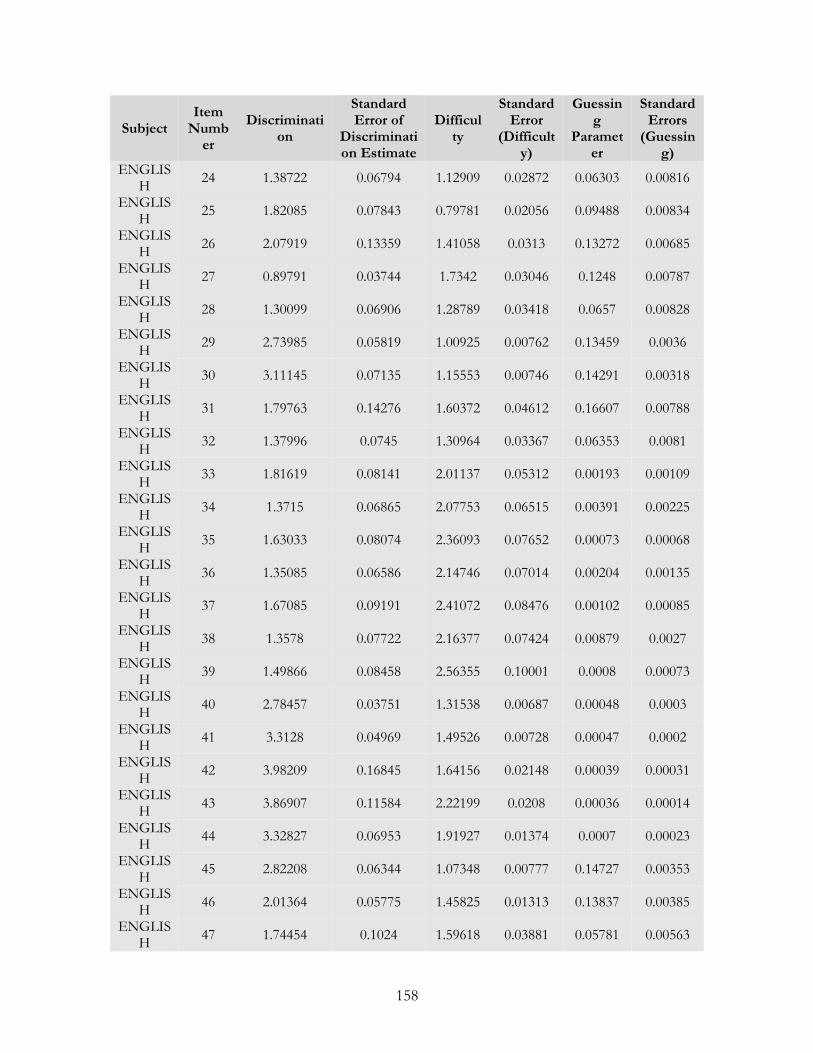
158
Subject Item Number
Discrimination
Standard Error of
Discrimination Estimate
Difficulty
Standard Error
(Difficulty)
Guessing
Parameter
Standard Errors
(Guessing)
ENGLISH
24 1.38722 0.06794 1.12909 0.02872 0.06303 0.00816
ENGLISH
25 1.82085 0.07843 0.79781 0.02056 0.09488 0.00834
ENGLISH
26 2.07919 0.13359 1.41058 0.0313 0.13272 0.00685
ENGLISH
27 0.89791 0.03744 1.7342 0.03046 0.1248 0.00787
ENGLISH
28 1.30099 0.06906 1.28789 0.03418 0.0657 0.00828
ENGLISH
29 2.73985 0.05819 1.00925 0.00762 0.13459 0.0036
ENGLISH
30 3.11145 0.07135 1.15553 0.00746 0.14291 0.00318
ENGLISH
31 1.79763 0.14276 1.60372 0.04612 0.16607 0.00788
ENGLISH
32 1.37996 0.0745 1.30964 0.03367 0.06353 0.0081
ENGLISH
33 1.81619 0.08141 2.01137 0.05312 0.00193 0.00109
ENGLISH
34 1.3715 0.06865 2.07753 0.06515 0.00391 0.00225
ENGLISH
35 1.63033 0.08074 2.36093 0.07652 0.00073 0.00068
ENGLISH
36 1.35085 0.06586 2.14746 0.07014 0.00204 0.00135
ENGLISH
37 1.67085 0.09191 2.41072 0.08476 0.00102 0.00085
ENGLISH
38 1.3578 0.07722 2.16377 0.07424 0.00879 0.0027
ENGLISH
39 1.49866 0.08458 2.56355 0.10001 0.0008 0.00073
ENGLISH
40 2.78457 0.03751 1.31538 0.00687 0.00048 0.0003
ENGLISH
41 3.3128 0.04969 1.49526 0.00728 0.00047 0.0002
ENGLISH
42 3.98209 0.16845 1.64156 0.02148 0.00039 0.00031
ENGLISH
43 3.86907 0.11584 2.22199 0.0208 0.00036 0.00014
ENGLISH
44 3.32827 0.06953 1.91927 0.01374 0.0007 0.00023
ENGLISH
45 2.82208 0.06344 1.07348 0.00777 0.14727 0.00353
ENGLISH
46 2.01364 0.05775 1.45825 0.01313 0.13837 0.00385
ENGLISH
47 1.74454 0.1024 1.59618 0.03881 0.05781 0.00563
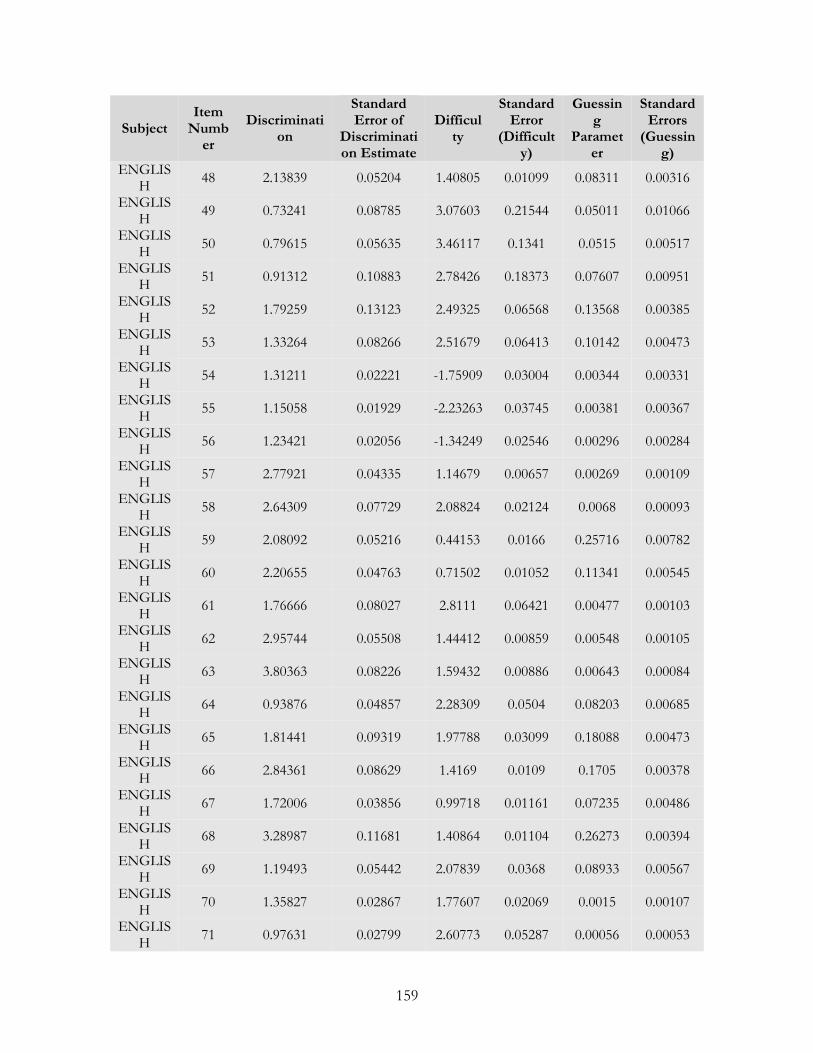
159
Subject Item Number
Discrimination
Standard Error of
Discrimination Estimate
Difficulty
Standard Error
(Difficulty)
Guessing
Parameter
Standard Errors
(Guessing)
ENGLISH
48 2.13839 0.05204 1.40805 0.01099 0.08311 0.00316
ENGLISH
49 0.73241 0.08785 3.07603 0.21544 0.05011 0.01066
ENGLISH
50 0.79615 0.05635 3.46117 0.1341 0.0515 0.00517
ENGLISH
51 0.91312 0.10883 2.78426 0.18373 0.07607 0.00951
ENGLISH
52 1.79259 0.13123 2.49325 0.06568 0.13568 0.00385
ENGLISH
53 1.33264 0.08266 2.51679 0.06413 0.10142 0.00473
ENGLISH
54 1.31211 0.02221 -1.75909 0.03004 0.00344 0.00331
ENGLISH
55 1.15058 0.01929 -2.23263 0.03745 0.00381 0.00367
ENGLISH
56 1.23421 0.02056 -1.34249 0.02546 0.00296 0.00284
ENGLISH
57 2.77921 0.04335 1.14679 0.00657 0.00269 0.00109
ENGLISH
58 2.64309 0.07729 2.08824 0.02124 0.0068 0.00093
ENGLISH
59 2.08092 0.05216 0.44153 0.0166 0.25716 0.00782
ENGLISH
60 2.20655 0.04763 0.71502 0.01052 0.11341 0.00545
ENGLISH
61 1.76666 0.08027 2.8111 0.06421 0.00477 0.00103
ENGLISH
62 2.95744 0.05508 1.44412 0.00859 0.00548 0.00105
ENGLISH
63 3.80363 0.08226 1.59432 0.00886 0.00643 0.00084
ENGLISH
64 0.93876 0.04857 2.28309 0.0504 0.08203 0.00685
ENGLISH
65 1.81441 0.09319 1.97788 0.03099 0.18088 0.00473
ENGLISH
66 2.84361 0.08629 1.4169 0.0109 0.1705 0.00378
ENGLISH
67 1.72006 0.03856 0.99718 0.01161 0.07235 0.00486
ENGLISH
68 3.28987 0.11681 1.40864 0.01104 0.26273 0.00394
ENGLISH
69 1.19493 0.05442 2.07839 0.0368 0.08933 0.00567
ENGLISH
70 1.35827 0.02867 1.77607 0.02069 0.0015 0.00107
ENGLISH
71 0.97631 0.02799 2.60773 0.05287 0.00056 0.00053
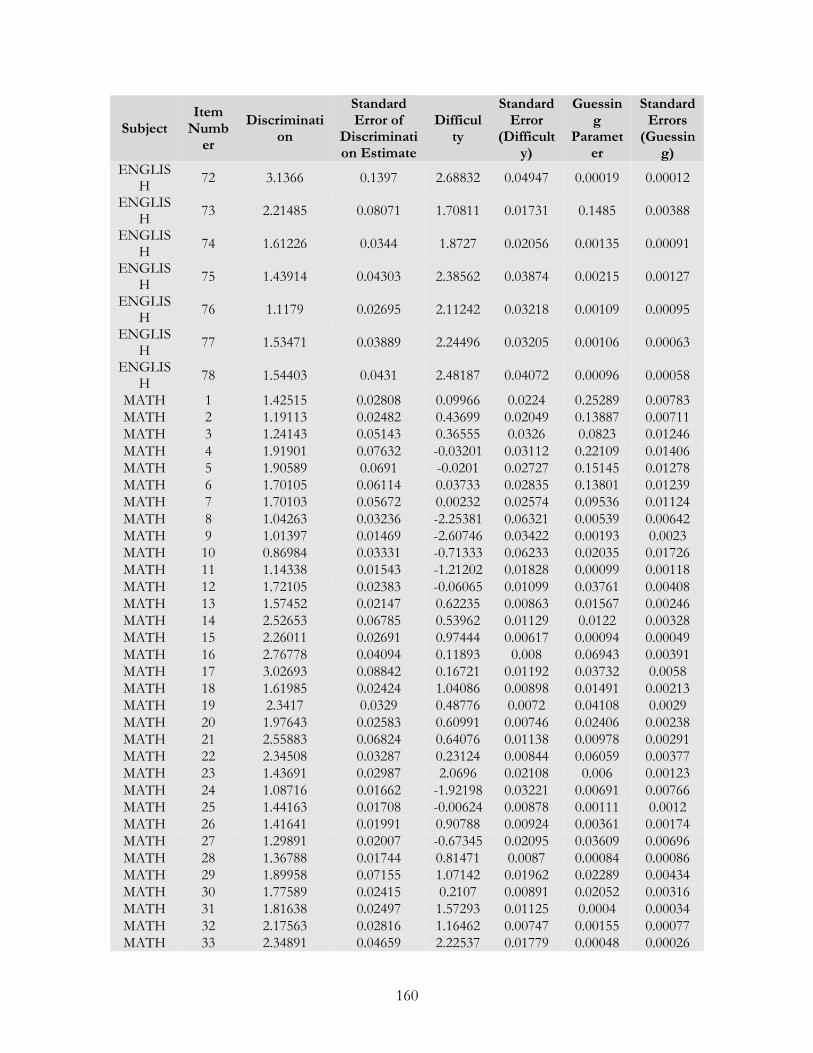
160
Subject Item Number
Discrimination
Standard Error of
Discrimination Estimate
Difficulty
Standard Error
(Difficulty)
Guessing
Parameter
Standard Errors
(Guessing)
ENGLISH
72 3.1366 0.1397 2.68832 0.04947 0.00019 0.00012
ENGLISH
73 2.21485 0.08071 1.70811 0.01731 0.1485 0.00388
ENGLISH
74 1.61226 0.0344 1.8727 0.02056 0.00135 0.00091
ENGLISH
75 1.43914 0.04303 2.38562 0.03874 0.00215 0.00127
ENGLISH
76 1.1179 0.02695 2.11242 0.03218 0.00109 0.00095
ENGLISH
77 1.53471 0.03889 2.24496 0.03205 0.00106 0.00063
ENGLISH
78 1.54403 0.0431 2.48187 0.04072 0.00096 0.00058
MATH 1 1.42515 0.02808 0.09966 0.0224 0.25289 0.00783 MATH 2 1.19113 0.02482 0.43699 0.02049 0.13887 0.00711 MATH 3 1.24143 0.05143 0.36555 0.0326 0.0823 0.01246 MATH 4 1.91901 0.07632 -0.03201 0.03112 0.22109 0.01406 MATH 5 1.90589 0.0691 -0.0201 0.02727 0.15145 0.01278 MATH 6 1.70105 0.06114 0.03733 0.02835 0.13801 0.01239 MATH 7 1.70103 0.05672 0.00232 0.02574 0.09536 0.01124 MATH 8 1.04263 0.03236 -2.25381 0.06321 0.00539 0.00642 MATH 9 1.01397 0.01469 -2.60746 0.03422 0.00193 0.0023 MATH 10 0.86984 0.03331 -0.71333 0.06233 0.02035 0.01726 MATH 11 1.14338 0.01543 -1.21202 0.01828 0.00099 0.00118 MATH 12 1.72105 0.02383 -0.06065 0.01099 0.03761 0.00408 MATH 13 1.57452 0.02147 0.62235 0.00863 0.01567 0.00246 MATH 14 2.52653 0.06785 0.53962 0.01129 0.0122 0.00328 MATH 15 2.26011 0.02691 0.97444 0.00617 0.00094 0.00049 MATH 16 2.76778 0.04094 0.11893 0.008 0.06943 0.00391 MATH 17 3.02693 0.08842 0.16721 0.01192 0.03732 0.0058 MATH 18 1.61985 0.02424 1.04086 0.00898 0.01491 0.00213 MATH 19 2.3417 0.0329 0.48776 0.0072 0.04108 0.0029 MATH 20 1.97643 0.02583 0.60991 0.00746 0.02406 0.00238 MATH 21 2.55883 0.06824 0.64076 0.01138 0.00978 0.00291 MATH 22 2.34508 0.03287 0.23124 0.00844 0.06059 0.00377 MATH 23 1.43691 0.02987 2.0696 0.02108 0.006 0.00123 MATH 24 1.08716 0.01662 -1.92198 0.03221 0.00691 0.00766 MATH 25 1.44163 0.01708 -0.00624 0.00878 0.00111 0.0012 MATH 26 1.41641 0.01991 0.90788 0.00924 0.00361 0.00174 MATH 27 1.29891 0.02007 -0.67345 0.02095 0.03609 0.00696 MATH 28 1.36788 0.01744 0.81471 0.0087 0.00084 0.00086 MATH 29 1.89958 0.07155 1.07142 0.01962 0.02289 0.00434 MATH 30 1.77589 0.02415 0.2107 0.00891 0.02052 0.00316 MATH 31 1.81638 0.02497 1.57293 0.01125 0.0004 0.00034 MATH 32 2.17563 0.02816 1.16462 0.00747 0.00155 0.00077 MATH 33 2.34891 0.04659 2.22537 0.01779 0.00048 0.00026
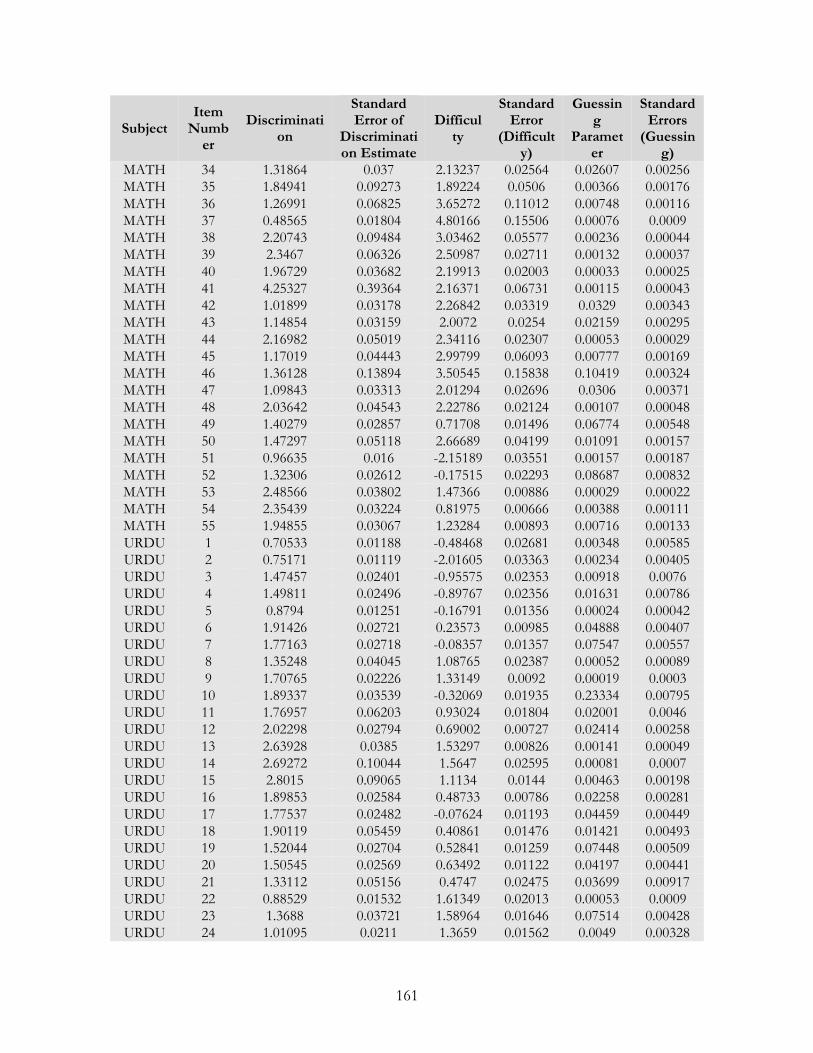
161
Subject Item Number
Discrimination
Standard Error of
Discrimination Estimate
Difficulty
Standard Error
(Difficulty)
Guessing
Parameter
Standard Errors
(Guessing)
MATH 34 1.31864 0.037 2.13237 0.02564 0.02607 0.00256 MATH 35 1.84941 0.09273 1.89224 0.0506 0.00366 0.00176 MATH 36 1.26991 0.06825 3.65272 0.11012 0.00748 0.00116 MATH 37 0.48565 0.01804 4.80166 0.15506 0.00076 0.0009 MATH 38 2.20743 0.09484 3.03462 0.05577 0.00236 0.00044 MATH 39 2.3467 0.06326 2.50987 0.02711 0.00132 0.00037 MATH 40 1.96729 0.03682 2.19913 0.02003 0.00033 0.00025 MATH 41 4.25327 0.39364 2.16371 0.06731 0.00115 0.00043 MATH 42 1.01899 0.03178 2.26842 0.03319 0.0329 0.00343 MATH 43 1.14854 0.03159 2.0072 0.0254 0.02159 0.00295 MATH 44 2.16982 0.05019 2.34116 0.02307 0.00053 0.00029 MATH 45 1.17019 0.04443 2.99799 0.06093 0.00777 0.00169 MATH 46 1.36128 0.13894 3.50545 0.15838 0.10419 0.00324 MATH 47 1.09843 0.03313 2.01294 0.02696 0.0306 0.00371 MATH 48 2.03642 0.04543 2.22786 0.02124 0.00107 0.00048 MATH 49 1.40279 0.02857 0.71708 0.01496 0.06774 0.00548 MATH 50 1.47297 0.05118 2.66689 0.04199 0.01091 0.00157 MATH 51 0.96635 0.016 -2.15189 0.03551 0.00157 0.00187 MATH 52 1.32306 0.02612 -0.17515 0.02293 0.08687 0.00832 MATH 53 2.48566 0.03802 1.47366 0.00886 0.00029 0.00022 MATH 54 2.35439 0.03224 0.81975 0.00666 0.00388 0.00111 MATH 55 1.94855 0.03067 1.23284 0.00893 0.00716 0.00133 URDU 1 0.70533 0.01188 -0.48468 0.02681 0.00348 0.00585 URDU 2 0.75171 0.01119 -2.01605 0.03363 0.00234 0.00405 URDU 3 1.47457 0.02401 -0.95575 0.02353 0.00918 0.0076 URDU 4 1.49811 0.02496 -0.89767 0.02356 0.01631 0.00786 URDU 5 0.8794 0.01251 -0.16791 0.01356 0.00024 0.00042 URDU 6 1.91426 0.02721 0.23573 0.00985 0.04888 0.00407 URDU 7 1.77163 0.02718 -0.08357 0.01357 0.07547 0.00557 URDU 8 1.35248 0.04045 1.08765 0.02387 0.00052 0.00089 URDU 9 1.70765 0.02226 1.33149 0.0092 0.00019 0.0003 URDU 10 1.89337 0.03539 -0.32069 0.01935 0.23334 0.00795 URDU 11 1.76957 0.06203 0.93024 0.01804 0.02001 0.0046 URDU 12 2.02298 0.02794 0.69002 0.00727 0.02414 0.00258 URDU 13 2.63928 0.0385 1.53297 0.00826 0.00141 0.00049 URDU 14 2.69272 0.10044 1.5647 0.02595 0.00081 0.0007 URDU 15 2.8015 0.09065 1.1134 0.0144 0.00463 0.00198 URDU 16 1.89853 0.02584 0.48733 0.00786 0.02258 0.00281 URDU 17 1.77537 0.02482 -0.07624 0.01193 0.04459 0.00449 URDU 18 1.90119 0.05459 0.40861 0.01476 0.01421 0.00493 URDU 19 1.52044 0.02704 0.52841 0.01259 0.07448 0.00509 URDU 20 1.50545 0.02569 0.63492 0.01122 0.04197 0.00441 URDU 21 1.33112 0.05156 0.4747 0.02475 0.03699 0.00917 URDU 22 0.88529 0.01532 1.61349 0.02013 0.00053 0.0009 URDU 23 1.3688 0.03721 1.58964 0.01646 0.07514 0.00428 URDU 24 1.01095 0.0211 1.3659 0.01562 0.0049 0.00328
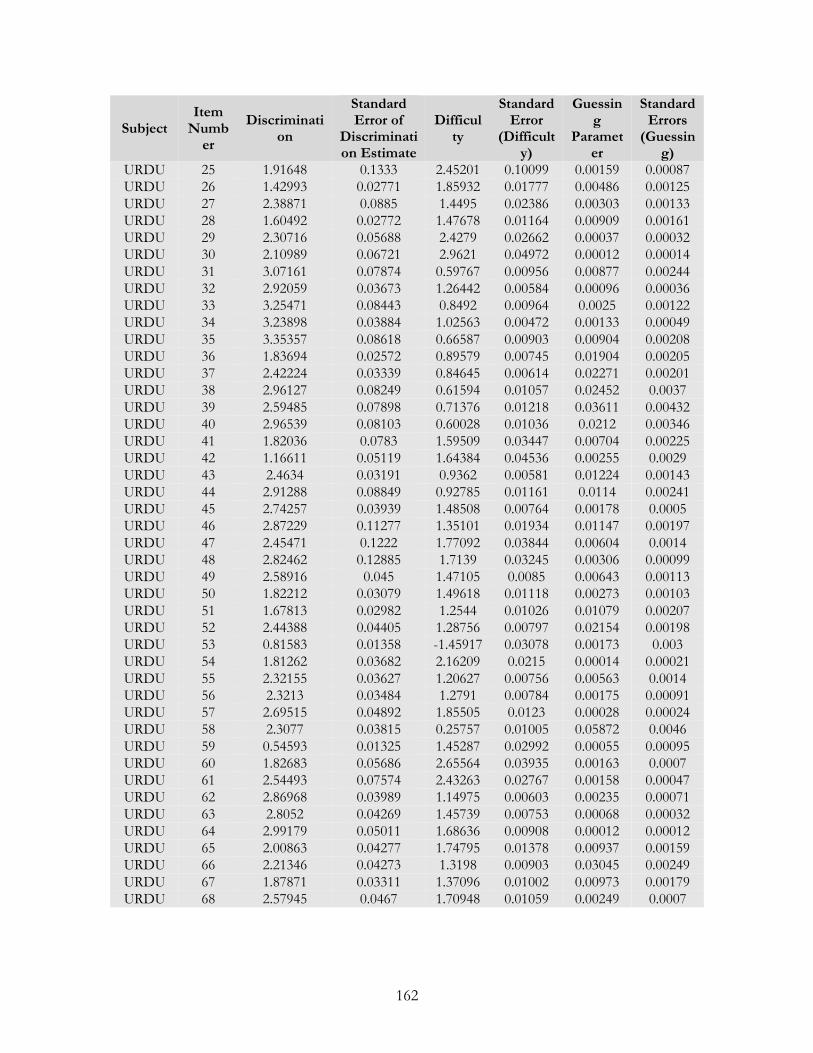
162
Subject Item Number
Discrimination
Standard Error of
Discrimination Estimate
Difficulty
Standard Error
(Difficulty)
Guessing
Parameter
Standard Errors
(Guessing)
URDU 25 1.91648 0.1333 2.45201 0.10099 0.00159 0.00087 URDU 26 1.42993 0.02771 1.85932 0.01777 0.00486 0.00125 URDU 27 2.38871 0.0885 1.4495 0.02386 0.00303 0.00133 URDU 28 1.60492 0.02772 1.47678 0.01164 0.00909 0.00161 URDU 29 2.30716 0.05688 2.4279 0.02662 0.00037 0.00032 URDU 30 2.10989 0.06721 2.9621 0.04972 0.00012 0.00014 URDU 31 3.07161 0.07874 0.59767 0.00956 0.00877 0.00244 URDU 32 2.92059 0.03673 1.26442 0.00584 0.00096 0.00036 URDU 33 3.25471 0.08443 0.8492 0.00964 0.0025 0.00122 URDU 34 3.23898 0.03884 1.02563 0.00472 0.00133 0.00049 URDU 35 3.35357 0.08618 0.66587 0.00903 0.00904 0.00208 URDU 36 1.83694 0.02572 0.89579 0.00745 0.01904 0.00205 URDU 37 2.42224 0.03339 0.84645 0.00614 0.02271 0.00201 URDU 38 2.96127 0.08249 0.61594 0.01057 0.02452 0.0037 URDU 39 2.59485 0.07898 0.71376 0.01218 0.03611 0.00432 URDU 40 2.96539 0.08103 0.60028 0.01036 0.0212 0.00346 URDU 41 1.82036 0.0783 1.59509 0.03447 0.00704 0.00225 URDU 42 1.16611 0.05119 1.64384 0.04536 0.00255 0.0029 URDU 43 2.4634 0.03191 0.9362 0.00581 0.01224 0.00143 URDU 44 2.91288 0.08849 0.92785 0.01161 0.0114 0.00241 URDU 45 2.74257 0.03939 1.48508 0.00764 0.00178 0.0005 URDU 46 2.87229 0.11277 1.35101 0.01934 0.01147 0.00197 URDU 47 2.45471 0.1222 1.77092 0.03844 0.00604 0.0014 URDU 48 2.82462 0.12885 1.7139 0.03245 0.00306 0.00099 URDU 49 2.58916 0.045 1.47105 0.0085 0.00643 0.00113 URDU 50 1.82212 0.03079 1.49618 0.01118 0.00273 0.00103 URDU 51 1.67813 0.02982 1.2544 0.01026 0.01079 0.00207 URDU 52 2.44388 0.04405 1.28756 0.00797 0.02154 0.00198 URDU 53 0.81583 0.01358 -1.45917 0.03078 0.00173 0.003 URDU 54 1.81262 0.03682 2.16209 0.0215 0.00014 0.00021 URDU 55 2.32155 0.03627 1.20627 0.00756 0.00563 0.0014 URDU 56 2.3213 0.03484 1.2791 0.00784 0.00175 0.00091 URDU 57 2.69515 0.04892 1.85505 0.0123 0.00028 0.00024 URDU 58 2.3077 0.03815 0.25757 0.01005 0.05872 0.0046 URDU 59 0.54593 0.01325 1.45287 0.02992 0.00055 0.00095 URDU 60 1.82683 0.05686 2.65564 0.03935 0.00163 0.0007 URDU 61 2.54493 0.07574 2.43263 0.02767 0.00158 0.00047 URDU 62 2.86968 0.03989 1.14975 0.00603 0.00235 0.00071 URDU 63 2.8052 0.04269 1.45739 0.00753 0.00068 0.00032 URDU 64 2.99179 0.05011 1.68636 0.00908 0.00012 0.00012 URDU 65 2.00863 0.04277 1.74795 0.01378 0.00937 0.00159 URDU 66 2.21346 0.04273 1.3198 0.00903 0.03045 0.00249 URDU 67 1.87871 0.03311 1.37096 0.01002 0.00973 0.00179 URDU 68 2.57945 0.0467 1.70948 0.01059 0.00249 0.0007
Related Documents