LEAGUE LEADERS & TEAM STATISTICS THROUGH WEEK 12 UPDATED ON 11/26/19

Welcome message from author
This document is posted to help you gain knowledge. Please leave a comment to let me know what you think about it! Share it to your friends and learn new things together.
Transcript
LEAGUE LEADERS & TEAM STATISTICS
THROUGH WEEK 12
UPDATED ON 11/26/19

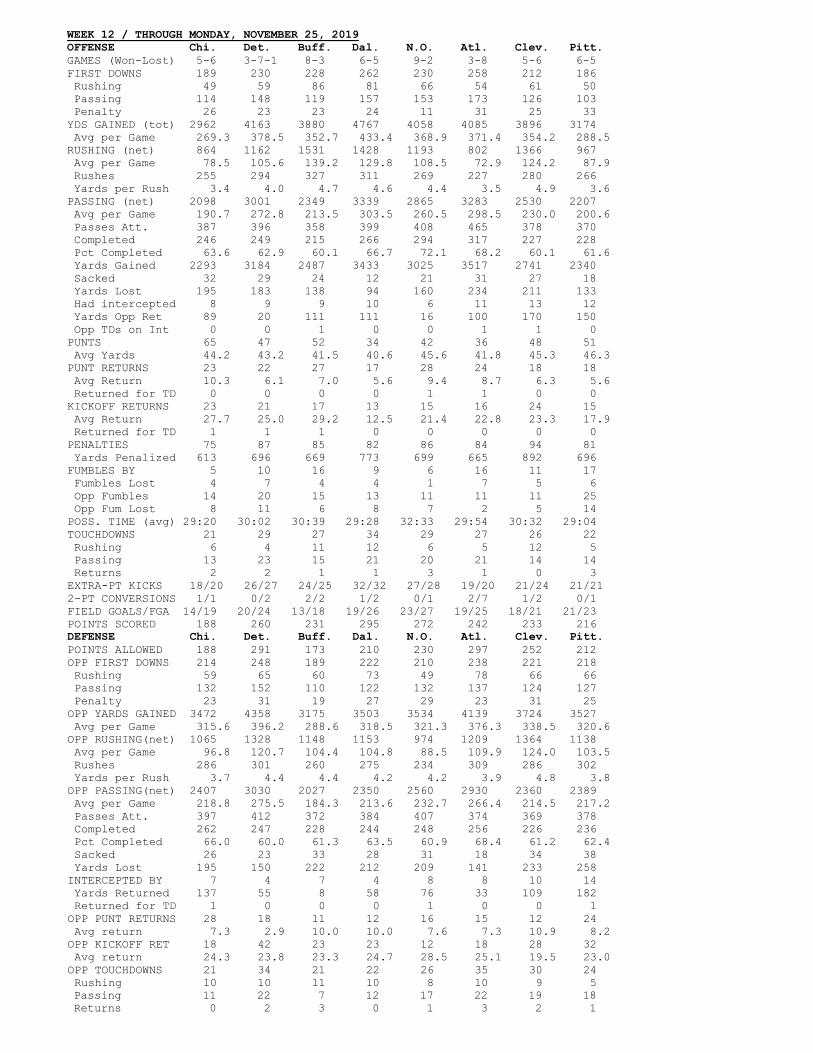
WEEK 12 / THROUGH MONDAY, NOVEMBER 25, 2019 OFFENSE Chi. Det. Buff. Dal. N.O. Atl. Clev. Pitt. GAMES (Won-Lost) 5-6 3-7-1 8-3 6-5 9-2 3-8 5-6 6-5 FIRST DOWNS 189 230 228 262 230 258 212 186 Rushing 49 59 86 81 66 54 61 50 Passing 114 148 119 157 153 173 126 103 Penalty 26 23 23 24 11 31 25 33 YDS GAINED (tot) 2962 4163 3880 4767 4058 4085 3896 3174 Avg per Game 269.3 378.5 352.7 433.4 368.9 371.4 354.2 288.5 RUSHING (net) 864 1162 1531 1428 1193 802 1366 967 Avg per Game 78.5 105.6 139.2 129.8 108.5 72.9 124.2 87.9 Rushes 255 294 327 311 269 227 280 266 Yards per Rush 3.4 4.0 4.7 4.6 4.4 3.5 4.9 3.6 PASSING (net) 2098 3001 2349 3339 2865 3283 2530 2207 Avg per Game 190.7 272.8 213.5 303.5 260.5 298.5 230.0 200.6 Passes Att. 387 396 358 399 408 465 378 370 Completed 246 249 215 266 294 317 227 228 Pct Completed 63.6 62.9 60.1 66.7 72.1 68.2 60.1 61.6 Yards Gained 2293 3184 2487 3433 3025 3517 2741 2340 Sacked 32 29 24 12 21 31 27 18 Yards Lost 195 183 138 94 160 234 211 133 Had intercepted 8 9 9 10 6 11 13 12 Yards Opp Ret 89 20 111 111 16 100 170 150 Opp TDs on Int 0 0 1 0 0 1 1 0 PUNTS 65 47 52 34 42 36 48 51 Avg Yards 44.2 43.2 41.5 40.6 45.6 41.8 45.3 46.3 PUNT RETURNS 23 22 27 17 28 24 18 18 Avg Return 10.3 6.1 7.0 5.6 9.4 8.7 6.3 5.6 Returned for TD 0 0 0 0 1 1 0 0 KICKOFF RETURNS 23 21 17 13 15 16 24 15 Avg Return 27.7 25.0 29.2 12.5 21.4 22.8 23.3 17.9 Returned for TD 1 1 1 0 0 0 0 0 PENALTIES 75 87 85 82 86 84 94 81 Yards Penalized 613 696 669 773 699 665 892 696 FUMBLES BY 5 10 16 9 6 16 11 17 Fumbles Lost 4 7 4 4 1 7 5 6 Opp Fumbles 14 20 15 13 11 11 11 25 Opp Fum Lost 8 11 6 8 7 2 5 14 POSS. TIME (avg) 29:20 30:02 30:39 29:28 32:33 29:54 30:32 29:04 TOUCHDOWNS 21 29 27 34 29 27 26 22 Rushing 6 4 11 12 6 5 12 5 Passing 13 23 15 21 20 21 14 14 Returns 2 2 1 1 3 1 0 3 EXTRA-PT KICKS 18/20 26/27 24/25 32/32 27/28 19/20 21/24 21/21 2-PT CONVERSIONS 1/1 0/2 2/2 1/2 0/1 2/7 1/2 0/1 FIELD GOALS/FGA 14/19 20/24 13/18 19/26 23/27 19/25 18/21 21/23 POINTS SCORED 188 260 231 295 272 242 233 216 DEFENSE Chi. Det. Buff. Dal. N.O. Atl. Clev. Pitt. POINTS ALLOWED 188 291 173 210 230 297 252 212 OPP FIRST DOWNS 214 248 189 222 210 238 221 218 Rushing 59 65 60 73 49 78 66 66 Passing 132 152 110 122 132 137 124 127 Penalty 23 31 19 27 29 23 31 25 OPP YARDS GAINED 3472 4358 3175 3503 3534 4139 3724 3527 Avg per Game 315.6 396.2 288.6 318.5 321.3 376.3 338.5 320.6 OPP RUSHING(net) 1065 1328 1148 1153 974 1209 1364 1138 Avg per Game 96.8 120.7 104.4 104.8 88.5 109.9 124.0 103.5 Rushes 286 301 260 275 234 309 286 302 Yards per Rush 3.7 4.4 4.4 4.2 4.2 3.9 4.8 3.8 OPP PASSING(net) 2407 3030 2027 2350 2560 2930 2360 2389 Avg per Game 218.8 275.5 184.3 213.6 232.7 266.4 214.5 217.2 Passes Att. 397 412 372 384 407 374 369 378 Completed 262 247 228 244 248 256 226 236 Pct Completed 66.0 60.0 61.3 63.5 60.9 68.4 61.2 62.4 Sacked 26 23 33 28 31 18 34 38 Yards Lost 195 150 222 212 209 141 233 258 INTERCEPTED BY 7 4 7 4 8 8 10 14 Yards Returned 137 55 8 58 76 33 109 182 Returned for TD 1 0 0 0 1 0 0 1 OPP PUNT RETURNS 28 18 11 12 16 15 12 24 Avg return 7.3 2.9 10.0 10.0 7.6 7.3 10.9 8.2 OPP KICKOFF RET 18 42 23 23 12 18 28 32 Avg return 24.3 23.8 23.3 24.7 28.5 25.1 19.5 23.0 OPP TOUCHDOWNS 21 34 21 22 26 35 30 24 Rushing 10 10 11 10 8 10 9 5 Passing 11 22 7 12 17 22 19 18 Returns 0 2 3 0 1 3 2 1
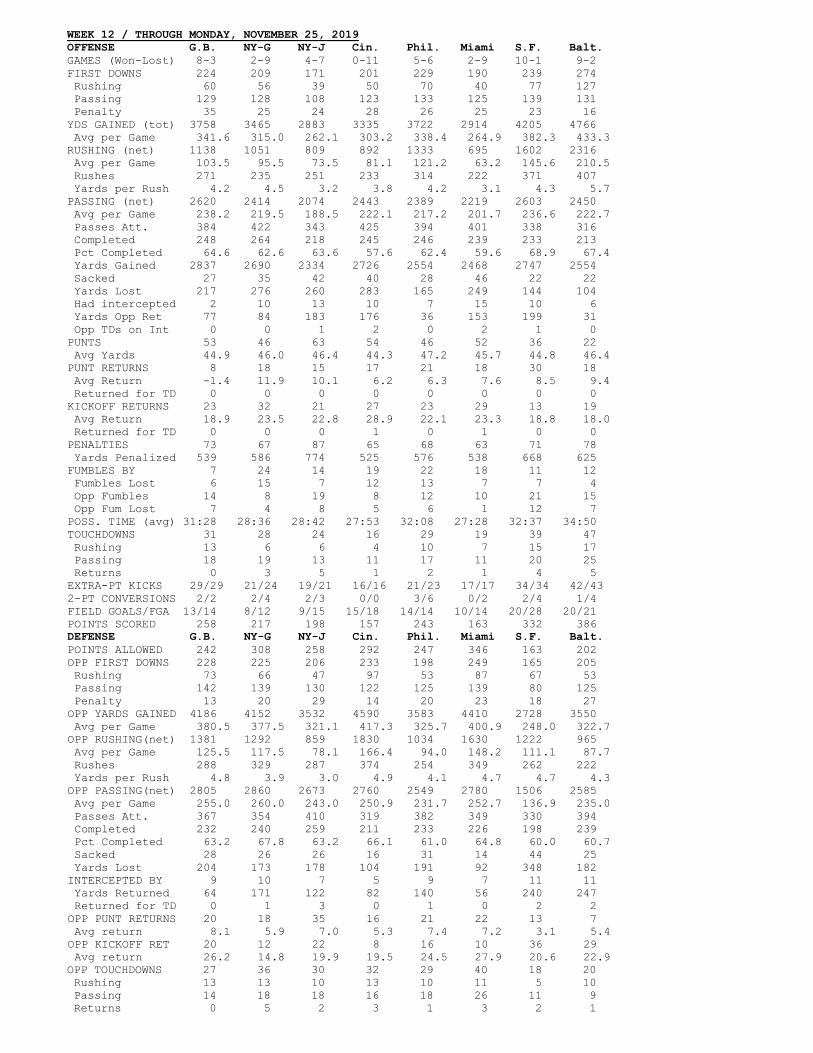
WEEK 12 / THROUGH MONDAY, NOVEMBER 25, 2019 OFFENSE G.B. NY-G NY-J Cin. Phil. Miami S.F. Balt. GAMES (Won-Lost) 8-3 2-9 4-7 0-11 5-6 2-9 10-1 9-2 FIRST DOWNS 224 209 171 201 229 190 239 274 Rushing 60 56 39 50 70 40 77 127 Passing 129 128 108 123 133 125 139 131 Penalty 35 25 24 28 26 25 23 16 YDS GAINED (tot) 3758 3465 2883 3335 3722 2914 4205 4766 Avg per Game 341.6 315.0 262.1 303.2 338.4 264.9 382.3 433.3 RUSHING (net) 1138 1051 809 892 1333 695 1602 2316 Avg per Game 103.5 95.5 73.5 81.1 121.2 63.2 145.6 210.5 Rushes 271 235 251 233 314 222 371 407 Yards per Rush 4.2 4.5 3.2 3.8 4.2 3.1 4.3 5.7 PASSING (net) 2620 2414 2074 2443 2389 2219 2603 2450 Avg per Game 238.2 219.5 188.5 222.1 217.2 201.7 236.6 222.7 Passes Att. 384 422 343 425 394 401 338 316 Completed 248 264 218 245 246 239 233 213 Pct Completed 64.6 62.6 63.6 57.6 62.4 59.6 68.9 67.4 Yards Gained 2837 2690 2334 2726 2554 2468 2747 2554 Sacked 27 35 42 40 28 46 22 22 Yards Lost 217 276 260 283 165 249 144 104 Had intercepted 2 10 13 10 7 15 10 6 Yards Opp Ret 77 84 183 176 36 153 199 31 Opp TDs on Int 0 0 1 2 0 2 1 0 PUNTS 53 46 63 54 46 52 36 22 Avg Yards 44.9 46.0 46.4 44.3 47.2 45.7 44.8 46.4 PUNT RETURNS 8 18 15 17 21 18 30 18 Avg Return -1.4 11.9 10.1 6.2 6.3 7.6 8.5 9.4 Returned for TD 0 0 0 0 0 0 0 0 KICKOFF RETURNS 23 32 21 27 23 29 13 19 Avg Return 18.9 23.5 22.8 28.9 22.1 23.3 18.8 18.0 Returned for TD 0 0 0 1 0 1 0 0 PENALTIES 73 67 87 65 68 63 71 78 Yards Penalized 539 586 774 525 576 538 668 625 FUMBLES BY 7 24 14 19 22 18 11 12 Fumbles Lost 6 15 7 12 13 7 7 4 Opp Fumbles 14 8 19 8 12 10 21 15 Opp Fum Lost 7 4 8 5 6 1 12 7 POSS. TIME (avg) 31:28 28:36 28:42 27:53 32:08 27:28 32:37 34:50 TOUCHDOWNS 31 28 24 16 29 19 39 47 Rushing 13 6 6 4 10 7 15 17 Passing 18 19 13 11 17 11 20 25 Returns 0 3 5 1 2 1 4 5 EXTRA-PT KICKS 29/29 21/24 19/21 16/16 21/23 17/17 34/34 42/43 2-PT CONVERSIONS 2/2 2/4 2/3 0/0 3/6 0/2 2/4 1/4 FIELD GOALS/FGA 13/14 8/12 9/15 15/18 14/14 10/14 20/28 20/21 POINTS SCORED 258 217 198 157 243 163 332 386 DEFENSE G.B. NY-G NY-J Cin. Phil. Miami S.F. Balt. POINTS ALLOWED 242 308 258 292 247 346 163 202 OPP FIRST DOWNS 228 225 206 233 198 249 165 205 Rushing 73 66 47 97 53 87 67 53 Passing 142 139 130 122 125 139 80 125 Penalty 13 20 29 14 20 23 18 27 OPP YARDS GAINED 4186 4152 3532 4590 3583 4410 2728 3550 Avg per Game 380.5 377.5 321.1 417.3 325.7 400.9 248.0 322.7 OPP RUSHING(net) 1381 1292 859 1830 1034 1630 1222 965 Avg per Game 125.5 117.5 78.1 166.4 94.0 148.2 111.1 87.7 Rushes 288 329 287 374 254 349 262 222 Yards per Rush 4.8 3.9 3.0 4.9 4.1 4.7 4.7 4.3 OPP PASSING(net) 2805 2860 2673 2760 2549 2780 1506 2585 Avg per Game 255.0 260.0 243.0 250.9 231.7 252.7 136.9 235.0 Passes Att. 367 354 410 319 382 349 330 394 Completed 232 240 259 211 233 226 198 239 Pct Completed 63.2 67.8 63.2 66.1 61.0 64.8 60.0 60.7 Sacked 28 26 26 16 31 14 44 25 Yards Lost 204 173 178 104 191 92 348 182 INTERCEPTED BY 9 10 7 5 9 7 11 11 Yards Returned 64 171 122 82 140 56 240 247 Returned for TD 0 1 3 0 1 0 2 2 OPP PUNT RETURNS 20 18 35 16 21 22 13 7 Avg return 8.1 5.9 7.0 5.3 7.4 7.2 3.1 5.4 OPP KICKOFF RET 20 12 22 8 16 10 36 29 Avg return 26.2 14.8 19.9 19.5 24.5 27.9 20.6 22.9 OPP TOUCHDOWNS 27 36 30 32 29 40 18 20 Rushing 13 13 10 13 10 11 5 10 Passing 14 18 18 16 18 26 11 9 Returns 0 5 2 3 1 3 2 1
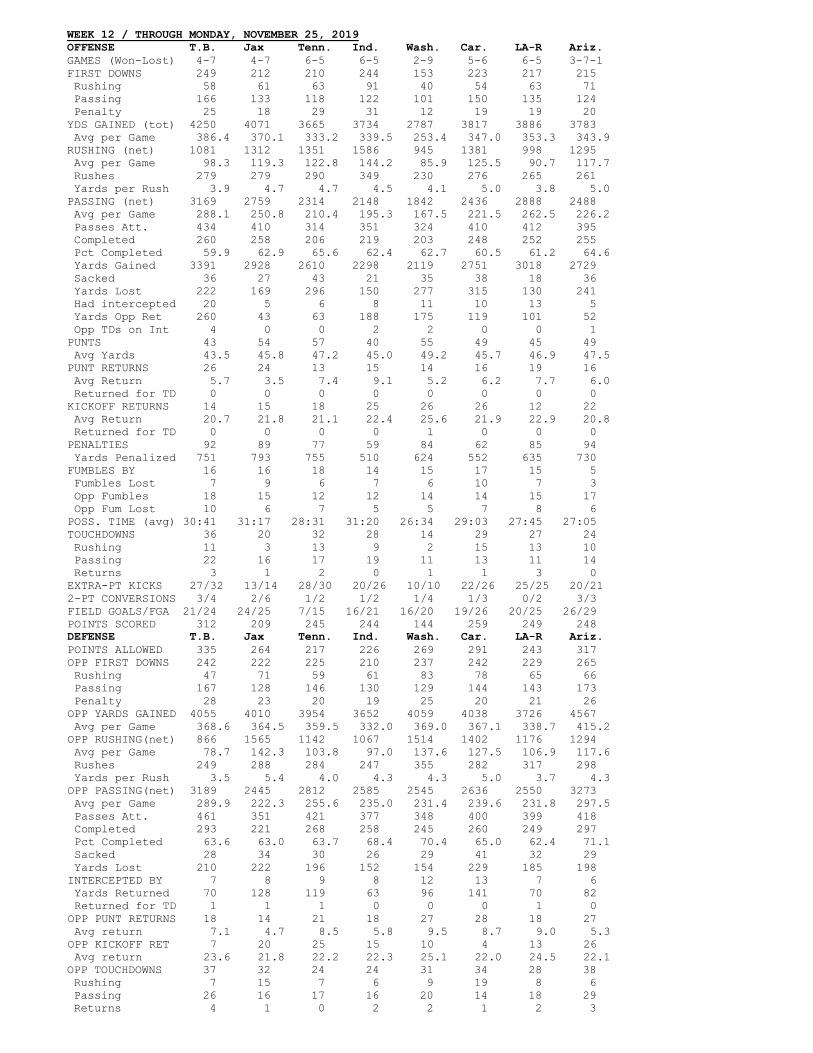
WEEK 12 / THROUGH MONDAY, NOVEMBER 25, 2019 OFFENSE T.B. Jax Tenn. Ind. Wash. Car. LA-R Ariz. GAMES (Won-Lost) 4-7 4-7 6-5 6-5 2-9 5-6 6-5 3-7-1 FIRST DOWNS 249 212 210 244 153 223 217 215 Rushing 58 61 63 91 40 54 63 71 Passing 166 133 118 122 101 150 135 124 Penalty 25 18 29 31 12 19 19 20 YDS GAINED (tot) 4250 4071 3665 3734 2787 3817 3886 3783 Avg per Game 386.4 370.1 333.2 339.5 253.4 347.0 353.3 343.9 RUSHING (net) 1081 1312 1351 1586 945 1381 998 1295 Avg per Game 98.3 119.3 122.8 144.2 85.9 125.5 90.7 117.7 Rushes 279 279 290 349 230 276 265 261 Yards per Rush 3.9 4.7 4.7 4.5 4.1 5.0 3.8 5.0 PASSING (net) 3169 2759 2314 2148 1842 2436 2888 2488 Avg per Game 288.1 250.8 210.4 195.3 167.5 221.5 262.5 226.2 Passes Att. 434 410 314 351 324 410 412 395 Completed 260 258 206 219 203 248 252 255 Pct Completed 59.9 62.9 65.6 62.4 62.7 60.5 61.2 64.6 Yards Gained 3391 2928 2610 2298 2119 2751 3018 2729 Sacked 36 27 43 21 35 38 18 36 Yards Lost 222 169 296 150 277 315 130 241 Had intercepted 20 5 6 8 11 10 13 5 Yards Opp Ret 260 43 63 188 175 119 101 52 Opp TDs on Int 4 0 0 2 2 0 0 1 PUNTS 43 54 57 40 55 49 45 49 Avg Yards 43.5 45.8 47.2 45.0 49.2 45.7 46.9 47.5 PUNT RETURNS 26 24 13 15 14 16 19 16 Avg Return 5.7 3.5 7.4 9.1 5.2 6.2 7.7 6.0 Returned for TD 0 0 0 0 0 0 0 0 KICKOFF RETURNS 14 15 18 25 26 26 12 22 Avg Return 20.7 21.8 21.1 22.4 25.6 21.9 22.9 20.8 Returned for TD 0 0 0 0 1 0 0 0 PENALTIES 92 89 77 59 84 62 85 94 Yards Penalized 751 793 755 510 624 552 635 730 FUMBLES BY 16 16 18 14 15 17 15 5 Fumbles Lost 7 9 6 7 6 10 7 3 Opp Fumbles 18 15 12 12 14 14 15 17 Opp Fum Lost 10 6 7 5 5 7 8 6 POSS. TIME (avg) 30:41 31:17 28:31 31:20 26:34 29:03 27:45 27:05 TOUCHDOWNS 36 20 32 28 14 29 27 24 Rushing 11 3 13 9 2 15 13 10 Passing 22 16 17 19 11 13 11 14 Returns 3 1 2 0 1 1 3 0 EXTRA-PT KICKS 27/32 13/14 28/30 20/26 10/10 22/26 25/25 20/21 2-PT CONVERSIONS 3/4 2/6 1/2 1/2 1/4 1/3 0/2 3/3 FIELD GOALS/FGA 21/24 24/25 7/15 16/21 16/20 19/26 20/25 26/29 POINTS SCORED 312 209 245 244 144 259 249 248 DEFENSE T.B. Jax Tenn. Ind. Wash. Car. LA-R Ariz. POINTS ALLOWED 335 264 217 226 269 291 243 317 OPP FIRST DOWNS 242 222 225 210 237 242 229 265 Rushing 47 71 59 61 83 78 65 66 Passing 167 128 146 130 129 144 143 173 Penalty 28 23 20 19 25 20 21 26 OPP YARDS GAINED 4055 4010 3954 3652 4059 4038 3726 4567 Avg per Game 368.6 364.5 359.5 332.0 369.0 367.1 338.7 415.2 OPP RUSHING(net) 866 1565 1142 1067 1514 1402 1176 1294 Avg per Game 78.7 142.3 103.8 97.0 137.6 127.5 106.9 117.6 Rushes 249 288 284 247 355 282 317 298 Yards per Rush 3.5 5.4 4.0 4.3 4.3 5.0 3.7 4.3 OPP PASSING(net) 3189 2445 2812 2585 2545 2636 2550 3273 Avg per Game 289.9 222.3 255.6 235.0 231.4 239.6 231.8 297.5 Passes Att. 461 351 421 377 348 400 399 418 Completed 293 221 268 258 245 260 249 297 Pct Completed 63.6 63.0 63.7 68.4 70.4 65.0 62.4 71.1 Sacked 28 34 30 26 29 41 32 29 Yards Lost 210 222 196 152 154 229 185 198 INTERCEPTED BY 7 8 9 8 12 13 7 6 Yards Returned 70 128 119 63 96 141 70 82 Returned for TD 1 1 1 0 0 0 1 0 OPP PUNT RETURNS 18 14 21 18 27 28 18 27 Avg return 7.1 4.7 8.5 5.8 9.5 8.7 9.0 5.3 OPP KICKOFF RET 7 20 25 15 10 4 13 26 Avg return 23.6 21.8 22.2 22.3 25.1 22.0 24.5 22.1 OPP TOUCHDOWNS 37 32 24 24 31 34 28 38 Rushing 7 15 7 6 9 19 8 6 Passing 26 16 17 16 20 14 18 29 Returns 4 1 0 2 2 1 2 3
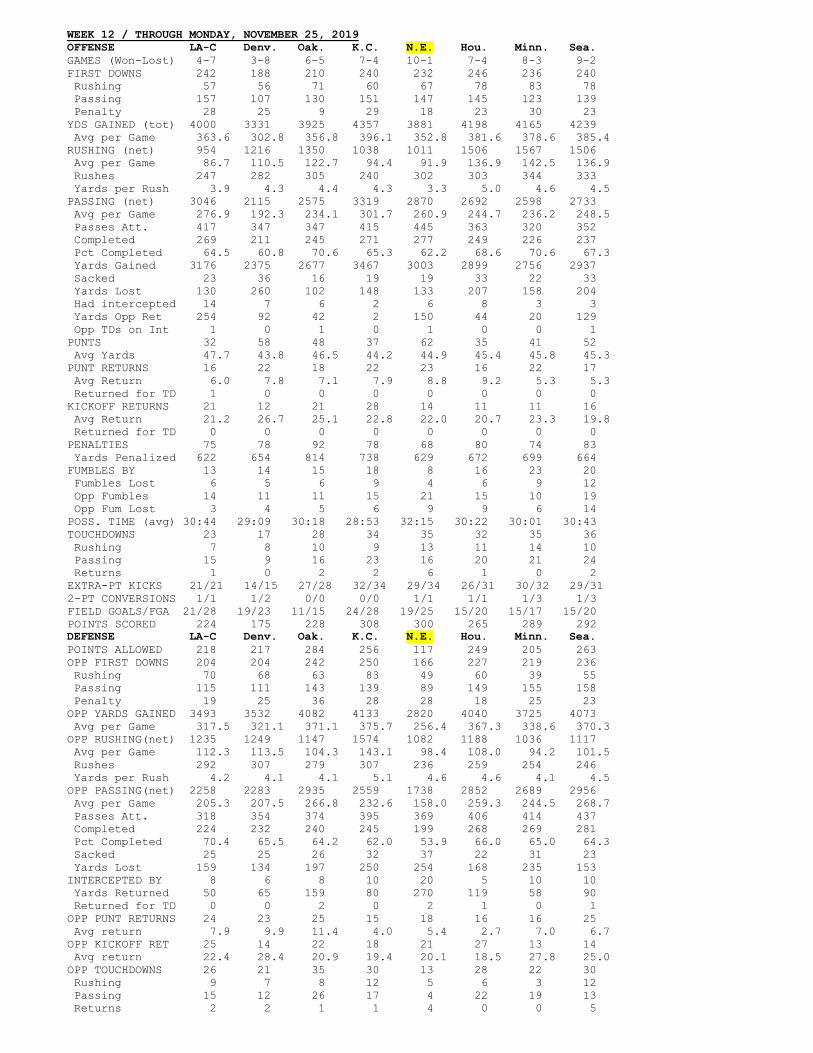
WEEK 12 / THROUGH MONDAY, NOVEMBER 25, 2019 OFFENSE LA-C Denv. Oak. K.C. N.E. Hou. Minn. Sea. GAMES (Won-Lost) 4-7 3-8 6-5 7-4 10-1 7-4 8-3 9-2 FIRST DOWNS 242 188 210 240 232 246 236 240 Rushing 57 56 71 60 67 78 83 78 Passing 157 107 130 151 147 145 123 139 Penalty 28 25 9 29 18 23 30 23 YDS GAINED (tot) 4000 3331 3925 4357 3881 4198 4165 4239 Avg per Game 363.6 302.8 356.8 396.1 352.8 381.6 378.6 385.4 RUSHING (net) 954 1216 1350 1038 1011 1506 1567 1506 Avg per Game 86.7 110.5 122.7 94.4 91.9 136.9 142.5 136.9 Rushes 247 282 305 240 302 303 344 333 Yards per Rush 3.9 4.3 4.4 4.3 3.3 5.0 4.6 4.5 PASSING (net) 3046 2115 2575 3319 2870 2692 2598 2733 Avg per Game 276.9 192.3 234.1 301.7 260.9 244.7 236.2 248.5 Passes Att. 417 347 347 415 445 363 320 352 Completed 269 211 245 271 277 249 226 237 Pct Completed 64.5 60.8 70.6 65.3 62.2 68.6 70.6 67.3 Yards Gained 3176 2375 2677 3467 3003 2899 2756 2937 Sacked 23 36 16 19 19 33 22 33 Yards Lost 130 260 102 148 133 207 158 204 Had intercepted 14 7 6 2 6 8 3 3 Yards Opp Ret 254 92 42 2 150 44 20 129 Opp TDs on Int 1 0 1 0 1 0 0 1 PUNTS 32 58 48 37 62 35 41 52 Avg Yards 47.7 43.8 46.5 44.2 44.9 45.4 45.8 45.3 PUNT RETURNS 16 22 18 22 23 16 22 17 Avg Return 6.0 7.8 7.1 7.9 8.8 9.2 5.3 5.3 Returned for TD 1 0 0 0 0 0 0 0 KICKOFF RETURNS 21 12 21 28 14 11 11 16 Avg Return 21.2 26.7 25.1 22.8 22.0 20.7 23.3 19.8 Returned for TD 0 0 0 0 0 0 0 0 PENALTIES 75 78 92 78 68 80 74 83 Yards Penalized 622 654 814 738 629 672 699 664 FUMBLES BY 13 14 15 18 8 16 23 20 Fumbles Lost 6 5 6 9 4 6 9 12 Opp Fumbles 14 11 11 15 21 15 10 19 Opp Fum Lost 3 4 5 6 9 9 6 14 POSS. TIME (avg) 30:44 29:09 30:18 28:53 32:15 30:22 30:01 30:43 TOUCHDOWNS 23 17 28 34 35 32 35 36 Rushing 7 8 10 9 13 11 14 10 Passing 15 9 16 23 16 20 21 24 Returns 1 0 2 2 6 1 0 2 EXTRA-PT KICKS 21/21 14/15 27/28 32/34 29/34 26/31 30/32 29/31 2-PT CONVERSIONS 1/1 1/2 0/0 0/0 1/1 1/1 1/3 1/3 FIELD GOALS/FGA 21/28 19/23 11/15 24/28 19/25 15/20 15/17 15/20 POINTS SCORED 224 175 228 308 300 265 289 292 DEFENSE LA-C Denv. Oak. K.C. N.E. Hou. Minn. Sea. POINTS ALLOWED 218 217 284 256 117 249 205 263 OPP FIRST DOWNS 204 204 242 250 166 227 219 236 Rushing 70 68 63 83 49 60 39 55 Passing 115 111 143 139 89 149 155 158 Penalty 19 25 36 28 28 18 25 23 OPP YARDS GAINED 3493 3532 4082 4133 2820 4040 3725 4073 Avg per Game 317.5 321.1 371.1 375.7 256.4 367.3 338.6 370.3 OPP RUSHING(net) 1235 1249 1147 1574 1082 1188 1036 1117 Avg per Game 112.3 113.5 104.3 143.1 98.4 108.0 94.2 101.5 Rushes 292 307 279 307 236 259 254 246 Yards per Rush 4.2 4.1 4.1 5.1 4.6 4.6 4.1 4.5 OPP PASSING(net) 2258 2283 2935 2559 1738 2852 2689 2956 Avg per Game 205.3 207.5 266.8 232.6 158.0 259.3 244.5 268.7 Passes Att. 318 354 374 395 369 406 414 437 Completed 224 232 240 245 199 268 269 281 Pct Completed 70.4 65.5 64.2 62.0 53.9 66.0 65.0 64.3 Sacked 25 25 26 32 37 22 31 23 Yards Lost 159 134 197 250 254 168 235 153 INTERCEPTED BY 8 6 8 10 20 5 10 10 Yards Returned 50 65 159 80 270 119 58 90 Returned for TD 0 0 2 0 2 1 0 1 OPP PUNT RETURNS 24 23 25 15 18 16 16 25 Avg return 7.9 9.9 11.4 4.0 5.4 2.7 7.0 6.7 OPP KICKOFF RET 25 14 22 18 21 27 13 14 Avg return 22.4 28.4 20.9 19.4 20.1 18.5 27.8 25.0 OPP TOUCHDOWNS 26 21 35 30 13 28 22 30 Rushing 9 7 8 12 5 6 3 12 Passing 15 12 26 17 4 22 19 13 Returns 2 2 1 1 4 0 0 5
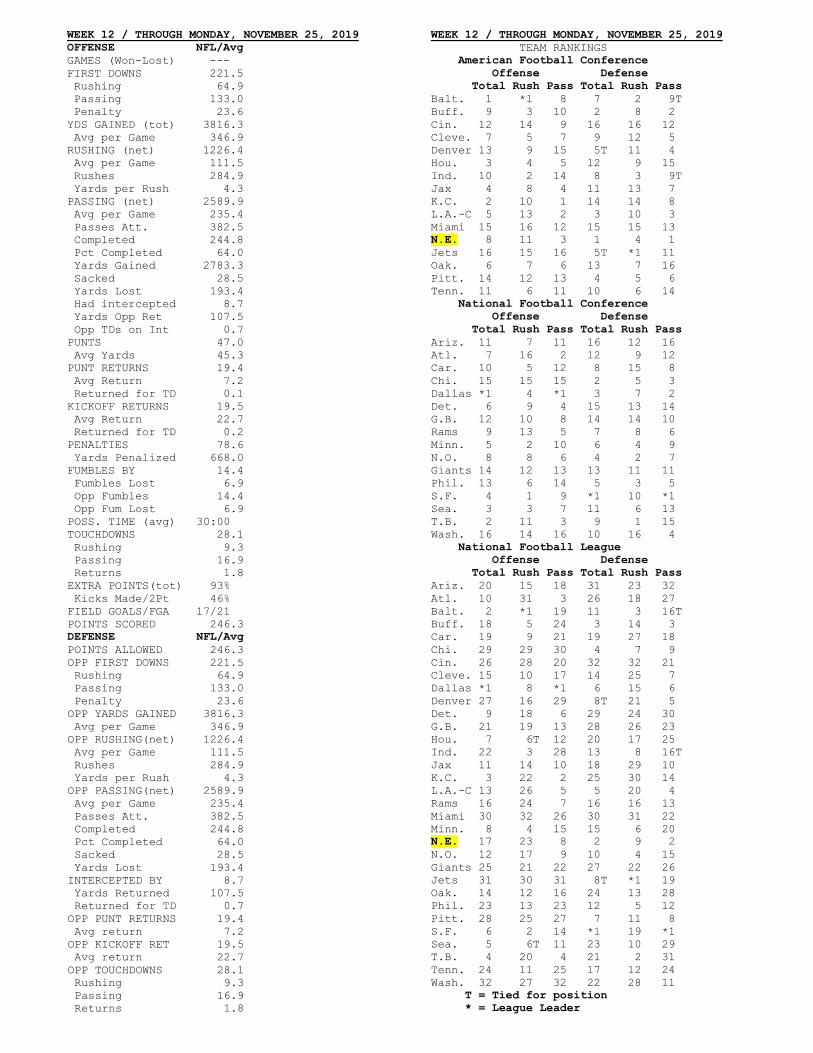
WEEK 12 / THROUGH MONDAY, NOVEMBER 25, 2019 OFFENSE NFL/Avg GAMES (Won-Lost) --- FIRST DOWNS 221.5 Rushing 64.9 Passing 133.0 Penalty 23.6 YDS GAINED (tot) 3816.3 Avg per Game 346.9 RUSHING (net) 1226.4 Avg per Game 111.5 Rushes 284.9 Yards per Rush 4.3 PASSING (net) 2589.9 Avg per Game 235.4 Passes Att. 382.5 Completed 244.8 Pct Completed 64.0 Yards Gained 2783.3 Sacked 28.5 Yards Lost 193.4 Had intercepted 8.7 Yards Opp Ret 107.5 Opp TDs on Int 0.7 PUNTS 47.0 Avg Yards 45.3 PUNT RETURNS 19.4 Avg Return 7.2 Returned for TD 0.1 KICKOFF RETURNS 19.5 Avg Return 22.7 Returned for TD 0.2 PENALTIES 78.6 Yards Penalized 668.0 FUMBLES BY 14.4 Fumbles Lost 6.9 Opp Fumbles 14.4 Opp Fum Lost 6.9 POSS. TIME (avg) 30:00 TOUCHDOWNS 28.1 Rushing 9.3 Passing 16.9 Returns 1.8 EXTRA POINTS(tot) 93% Kicks Made/2Pt 46% FIELD GOALS/FGA 17/21 POINTS SCORED 246.3 DEFENSE NFL/Avg POINTS ALLOWED 246.3 OPP FIRST DOWNS 221.5 Rushing 64.9 Passing 133.0 Penalty 23.6 OPP YARDS GAINED 3816.3 Avg per Game 346.9 OPP RUSHING(net) 1226.4 Avg per Game 111.5 Rushes 284.9 Yards per Rush 4.3 OPP PASSING(net) 2589.9 Avg per Game 235.4 Passes Att. 382.5 Completed 244.8 Pct Completed 64.0 Sacked 28.5 Yards Lost 193.4 INTERCEPTED BY 8.7 Yards Returned 107.5 Returned for TD 0.7 OPP PUNT RETURNS 19.4 Avg return 7.2 OPP KICKOFF RET 19.5 Avg return 22.7 OPP TOUCHDOWNS 28.1 Rushing 9.3 Passing 16.9 Returns 1.8
WEEK 12 / THROUGH MONDAY, NOVEMBER 25, 2019 TEAM RANKINGS American Football Conference Offense Defense Total Rush Pass Total Rush Pass Balt. 1 *1 8 7 2 9T Buff. 9 3 10 2 8 2 Cin. 12 14 9 16 16 12 Cleve. 7 5 7 9 12 5 Denver 13 9 15 5T 11 4 Hou. 3 4 5 12 9 15 Ind. 10 2 14 8 3 9T Jax 4 8 4 11 13 7 K.C. 2 10 1 14 14 8 L.A.-C 5 13 2 3 10 3 Miami 15 16 12 15 15 13 N.E. 8 11 3 1 4 1 Jets 16 15 16 5T *1 11 Oak. 6 7 6 13 7 16 Pitt. 14 12 13 4 5 6 Tenn. 11 6 11 10 6 14 National Football Conference Offense Defense Total Rush Pass Total Rush Pass Ariz. 11 7 11 16 12 16 Atl. 7 16 2 12 9 12 Car. 10 5 12 8 15 8 Chi. 15 15 15 2 5 3 Dallas *1 4 *1 3 7 2 Det. 6 9 4 15 13 14 G.B. 12 10 8 14 14 10 Rams 9 13 5 7 8 6 Minn. 5 2 10 6 4 9 N.O. 8 8 6 4 2 7 Giants 14 12 13 13 11 11 Phil. 13 6 14 5 3 5 S.F. 4 1 9 *1 10 *1 Sea. 3 3 7 11 6 13 T.B. 2 11 3 9 1 15 Wash. 16 14 16 10 16 4 National Football League Offense Defense Total Rush Pass Total Rush Pass Ariz. 20 15 18 31 23 32 Atl. 10 31 3 26 18 27 Balt. 2 *1 19 11 3 16T Buff. 18 5 24 3 14 3 Car. 19 9 21 19 27 18 Chi. 29 29 30 4 7 9 Cin. 26 28 20 32 32 21 Cleve. 15 10 17 14 25 7 Dallas *1 8 *1 6 15 6 Denver 27 16 29 8T 21 5 Det. 9 18 6 29 24 30 G.B. 21 19 13 28 26 23 Hou. 7 6T 12 20 17 25 Ind. 22 3 28 13 8 16T Jax 11 14 10 18 29 10 K.C. 3 22 2 25 30 14 L.A.-C 13 26 5 5 20 4 Rams 16 24 7 16 16 13 Miami 30 32 26 30 31 22 Minn. 8 4 15 15 6 20 N.E. 17 23 8 2 9 2 N.O. 12 17 9 10 4 15 Giants 25 21 22 27 22 26 Jets 31 30 31 8T *1 19 Oak. 14 12 16 24 13 28 Phil. 23 13 23 12 5 12 Pitt. 28 25 27 7 11 8 S.F. 6 2 14 *1 19 *1 Sea. 5 6T 11 23 10 29 T.B. 4 20 4 21 2 31 Tenn. 24 11 25 17 12 24 Wash. 32 27 32 22 28 11 T = Tied for position * = League Leader
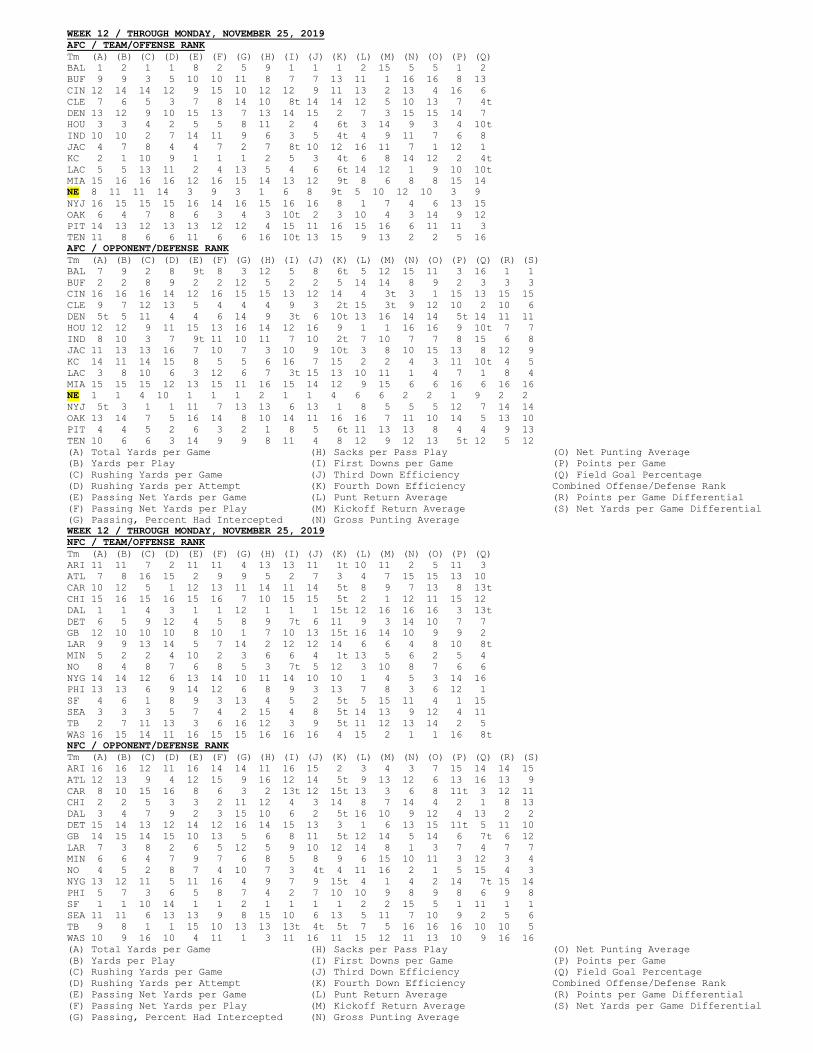
WEEK 12 / THROUGH MONDAY, NOVEMBER 25, 2019 AFC / TEAM/OFFENSE RANK Tm (A) (B) (C) (D) (E) (F) (G) (H) (I) (J) (K) (L) (M) (N) (O) (P) (Q) BAL 1 2 1 1 8 2 5 9 1 1 1 2 15 5 5 1 2 BUF 9 9 3 5 10 10 11 8 7 7 13 11 1 16 16 8 13 CIN 12 14 14 12 9 15 10 12 12 9 11 13 2 13 4 16 6 CLE 7 6 5 3 7 8 14 10 8t 14 14 12 5 10 13 7 4t DEN 13 12 9 10 15 13 7 13 14 15 2 7 3 15 15 14 7 HOU 3 3 4 2 5 5 8 11 2 4 6t 3 14 9 3 4 10t IND 10 10 2 7 14 11 9 6 3 5 4t 4 9 11 7 6 8 JAC 4 7 8 4 4 7 2 7 8t 10 12 16 11 7 1 12 1 KC 2 1 10 9 1 1 1 2 5 3 4t 6 8 14 12 2 4t LAC 5 5 13 11 2 4 13 5 4 6 6t 14 12 1 9 10 10t MIA 15 16 16 16 12 16 15 14 13 12 9t 8 6 8 8 15 14 NE 8 11 11 14 3 9 3 1 6 8 9t 5 10 12 10 3 9 NYJ 16 15 15 15 16 14 16 15 16 16 8 1 7 4 6 13 15 OAK 6 4 7 8 6 3 4 3 10t 2 3 10 4 3 14 9 12 PIT 14 13 12 13 13 12 12 4 15 11 16 15 16 6 11 11 3 TEN 11 8 6 6 11 6 6 16 10t 13 15 9 13 2 2 5 16 AFC / OPPONENT/DEFENSE RANK Tm (A) (B) (C) (D) (E) (F) (G) (H) (I) (J) (K) (L) (M) (N) (O) (P) (Q) (R) (S) BAL 7 9 2 8 9t 8 3 12 5 8 6t 5 12 15 11 3 16 1 1 BUF 2 2 8 9 2 2 12 5 2 2 5 14 14 8 9 2 3 3 3 CIN 16 16 16 14 12 16 15 15 13 12 14 4 3t 3 1 15 13 15 15 CLE 9 7 12 13 5 4 4 4 9 3 2t 15 3t 9 12 10 2 10 6 DEN 5t 5 11 4 4 6 14 9 3t 6 10t 13 16 14 14 5t 14 11 11 HOU 12 12 9 11 15 13 16 14 12 16 9 1 1 16 16 9 10t 7 7 IND 8 10 3 7 9t 11 10 11 7 10 2t 7 10 7 7 8 15 6 8 JAC 11 13 13 16 7 10 7 3 10 9 10t 3 8 10 15 13 8 12 9 KC 14 11 14 15 8 5 5 6 16 7 15 2 2 4 3 11 10t 4 5 LAC 3 8 10 6 3 12 6 7 3t 15 13 10 11 1 4 7 1 8 4 MIA 15 15 15 12 13 15 11 16 15 14 12 9 15 6 6 16 6 16 16 NE 1 1 4 10 1 1 1 2 1 1 4 6 6 2 2 1 9 2 2 NYJ 5t 3 1 1 11 7 13 13 6 13 1 8 5 5 5 12 7 14 14 OAK 13 14 7 5 16 14 8 10 14 11 16 16 7 11 10 14 5 13 10 PIT 4 4 5 2 6 3 2 1 8 5 6t 11 13 13 8 4 4 9 13 TEN 10 6 6 3 14 9 9 8 11 4 8 12 9 12 13 5t 12 5 12 (A) Total Yards per Game (B) Yards per Play (C) Rushing Yards per Game (D) Rushing Yards per Attempt (E) Passing Net Yards per Game (F) Passing Net Yards per Play (G) Passing, Percent Had Intercepted
(H) Sacks per Pass Play (I) First Downs per Game (J) Third Down Efficiency (K) Fourth Down Efficiency (L) Punt Return Average (M) Kickoff Return Average (N) Gross Punting Average
(O) Net Punting Average (P) Points per Game (Q) Field Goal Percentage Combined Offense/Defense Rank (R) Points per Game Differential (S) Net Yards per Game Differential
WEEK 12 / THROUGH MONDAY, NOVEMBER 25, 2019 NFC / TEAM/OFFENSE RANK Tm (A) (B) (C) (D) (E) (F) (G) (H) (I) (J) (K) (L) (M) (N) (O) (P) (Q) ARI 11 11 7 2 11 11 4 13 13 11 1t 10 11 2 5 11 3 ATL 7 8 16 15 2 9 9 5 2 7 3 4 7 15 15 13 10 CAR 10 12 5 1 12 13 11 14 11 14 5t 8 9 7 13 8 13t CHI 15 16 15 16 15 16 7 10 15 15 5t 2 1 12 11 15 12 DAL 1 1 4 3 1 1 12 1 1 1 15t 12 16 16 16 3 13t DET 6 5 9 12 4 5 8 9 7t 6 11 9 3 14 10 7 7 GB 12 10 10 10 8 10 1 7 10 13 15t 16 14 10 9 9 2 LAR 9 9 13 14 5 7 14 2 12 12 14 6 6 4 8 10 8t MIN 5 2 2 4 10 2 3 6 6 4 1t 13 5 6 2 5 4 NO 8 4 8 7 6 8 5 3 7t 5 12 3 10 8 7 6 6 NYG 14 14 12 6 13 14 10 11 14 10 10 1 4 5 3 14 16 PHI 13 13 6 9 14 12 6 8 9 3 13 7 8 3 6 12 1 SF 4 6 1 8 9 3 13 4 5 2 5t 5 15 11 4 1 15 SEA 3 3 3 5 7 4 2 15 4 8 5t 14 13 9 12 4 11 TB 2 7 11 13 3 6 16 12 3 9 5t 11 12 13 14 2 5 WAS 16 15 14 11 16 15 15 16 16 16 4 15 2 1 1 16 8t NFC / OPPONENT/DEFENSE RANK Tm (A) (B) (C) (D) (E) (F) (G) (H) (I) (J) (K) (L) (M) (N) (O) (P) (Q) (R) (S) ARI 16 16 12 11 16 14 14 11 16 15 2 3 4 3 7 15 14 14 15 ATL 12 13 9 4 12 15 9 16 12 14 5t 9 13 12 6 13 16 13 9 CAR 8 10 15 16 8 6 3 2 13t 12 15t 13 3 6 8 11t 3 12 11 CHI 2 2 5 3 3 2 11 12 4 3 14 8 7 14 4 2 1 8 13 DAL 3 4 7 9 2 3 15 10 6 2 5t 16 10 9 12 4 13 2 2 DET 15 14 13 12 14 12 16 14 15 13 3 1 6 13 15 11t 5 11 10 GB 14 15 14 15 10 13 5 6 8 11 5t 12 14 5 14 6 7t 6 12 LAR 7 3 8 2 6 5 12 5 9 10 12 14 8 1 3 7 4 7 7 MIN 6 6 4 7 9 7 6 8 5 8 9 6 15 10 11 3 12 3 4 NO 4 5 2 8 7 4 10 7 3 4t 4 11 16 2 1 5 15 4 3 NYG 13 12 11 5 11 16 4 9 7 9 15t 4 1 4 2 14 7t 15 14 PHI 5 7 3 6 5 8 7 4 2 7 10 10 9 8 9 8 6 9 8 SF 1 1 10 14 1 1 2 1 1 1 1 2 2 15 5 1 11 1 1 SEA 11 11 6 13 13 9 8 15 10 6 13 5 11 7 10 9 2 5 6 TB 9 8 1 1 15 10 13 13 13t 4t 5t 7 5 16 16 16 10 10 5 WAS 10 9 16 10 4 11 1 3 11 16 11 15 12 11 13 10 9 16 16 (A) Total Yards per Game (B) Yards per Play (C) Rushing Yards per Game (D) Rushing Yards per Attempt (E) Passing Net Yards per Game (F) Passing Net Yards per Play (G) Passing, Percent Had Intercepted
(H) Sacks per Pass Play (I) First Downs per Game (J) Third Down Efficiency (K) Fourth Down Efficiency (L) Punt Return Average (M) Kickoff Return Average (N) Gross Punting Average
(O) Net Punting Average (P) Points per Game (Q) Field Goal Percentage Combined Offense/Defense Rank (R) Points per Game Differential (S) Net Yards per Game Differential
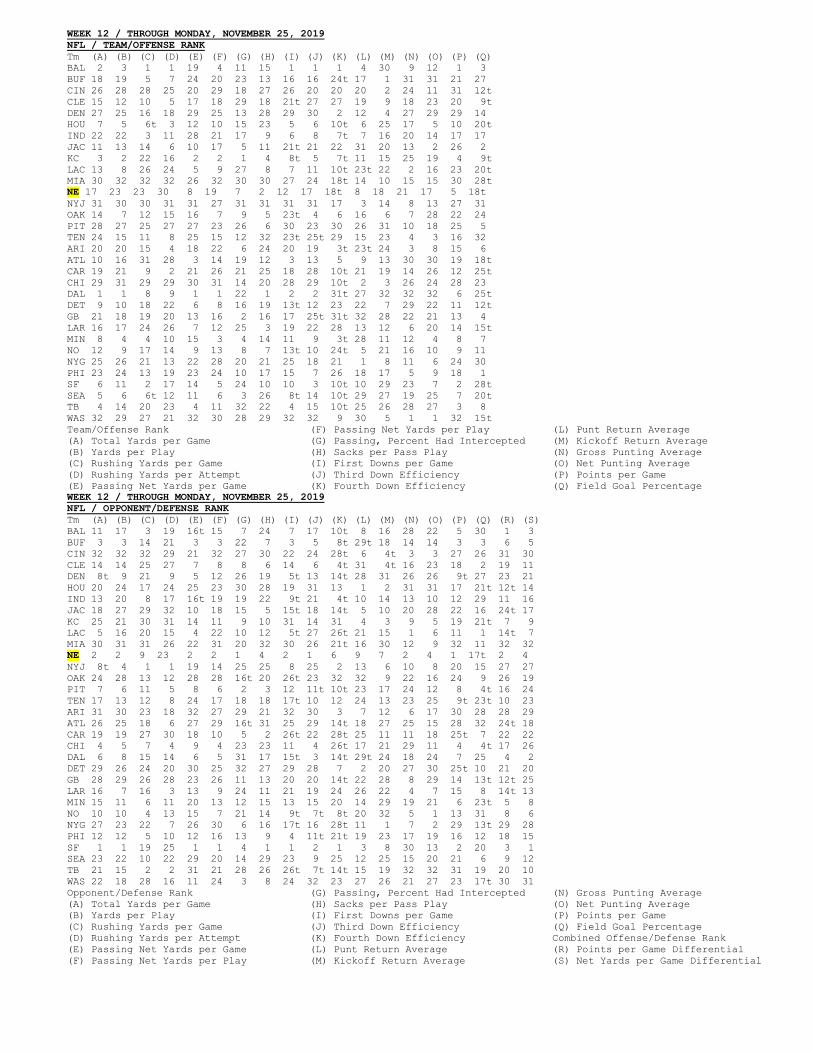
WEEK 12 / THROUGH MONDAY, NOVEMBER 25, 2019 NFL / TEAM/OFFENSE RANK Tm (A) (B) (C) (D) (E) (F) (G) (H) (I) (J) (K) (L) (M) (N) (O) (P) (Q) BAL 2 3 1 1 19 4 11 15 1 1 1 4 30 9 12 1 3 BUF 18 19 5 7 24 20 23 13 16 16 24t 17 1 31 31 21 27 CIN 26 28 28 25 20 29 18 27 26 20 20 20 2 24 11 31 12t CLE 15 12 10 5 17 18 29 18 21t 27 27 19 9 18 23 20 9t DEN 27 25 16 18 29 25 13 28 29 30 2 12 4 27 29 29 14 HOU 7 5 6t 3 12 10 15 23 5 6 10t 6 25 17 5 10 20t IND 22 22 3 11 28 21 17 9 6 8 7t 7 16 20 14 17 17 JAC 11 13 14 6 10 17 5 11 21t 21 22 31 20 13 2 26 2 KC 3 2 22 16 2 2 1 4 8t 5 7t 11 15 25 19 4 9t LAC 13 8 26 24 5 9 27 8 7 11 10t 23t 22 2 16 23 20t MIA 30 32 32 32 26 32 30 30 27 24 18t 14 10 15 15 30 28t NE 17 23 23 30 8 19 7 2 12 17 18t 8 18 21 17 5 18t NYJ 31 30 30 31 31 27 31 31 31 31 17 3 14 8 13 27 31 OAK 14 7 12 15 16 7 9 5 23t 4 6 16 6 7 28 22 24 PIT 28 27 25 27 27 23 26 6 30 23 30 26 31 10 18 25 5 TEN 24 15 11 8 25 15 12 32 23t 25t 29 15 23 4 3 16 32 ARI 20 20 15 4 18 22 6 24 20 19 3t 23t 24 3 8 15 6 ATL 10 16 31 28 3 14 19 12 3 13 5 9 13 30 30 19 18t CAR 19 21 9 2 21 26 21 25 18 28 10t 21 19 14 26 12 25t CHI 29 31 29 29 30 31 14 20 28 29 10t 2 3 26 24 28 23 DAL 1 1 8 9 1 1 22 1 2 2 31t 27 32 32 32 6 25t DET 9 10 18 22 6 8 16 19 13t 12 23 22 7 29 22 11 12t GB 21 18 19 20 13 16 2 16 17 25t 31t 32 28 22 21 13 4 LAR 16 17 24 26 7 12 25 3 19 22 28 13 12 6 20 14 15t MIN 8 4 4 10 15 3 4 14 11 9 3t 28 11 12 4 8 7 NO 12 9 17 14 9 13 8 7 13t 10 24t 5 21 16 10 9 11 NYG 25 26 21 13 22 28 20 21 25 18 21 1 8 11 6 24 30 PHI 23 24 13 19 23 24 10 17 15 7 26 18 17 5 9 18 1 SF 6 11 2 17 14 5 24 10 10 3 10t 10 29 23 7 2 28t SEA 5 6 6t 12 11 6 3 26 8t 14 10t 29 27 19 25 7 20t TB 4 14 20 23 4 11 32 22 4 15 10t 25 26 28 27 3 8 WAS 32 29 27 21 32 30 28 29 32 32 9 30 5 1 1 32 15t Team/Offense Rank (A) Total Yards per Game (B) Yards per Play (C) Rushing Yards per Game (D) Rushing Yards per Attempt (E) Passing Net Yards per Game
(F) Passing Net Yards per Play (G) Passing, Percent Had Intercepted (H) Sacks per Pass Play (I) First Downs per Game (J) Third Down Efficiency (K) Fourth Down Efficiency
(L) Punt Return Average (M) Kickoff Return Average (N) Gross Punting Average (O) Net Punting Average (P) Points per Game (Q) Field Goal Percentage
WEEK 12 / THROUGH MONDAY, NOVEMBER 25, 2019 NFL / OPPONENT/DEFENSE RANK Tm (A) (B) (C) (D) (E) (F) (G) (H) (I) (J) (K) (L) (M) (N) (O) (P) (Q) (R) (S) BAL 11 17 3 19 16t 15 7 24 7 17 10t 8 16 28 22 5 30 1 3 BUF 3 3 14 21 3 3 22 7 3 5 8t 29t 18 14 14 3 3 6 5 CIN 32 32 32 29 21 32 27 30 22 24 28t 6 4t 3 3 27 26 31 30 CLE 14 14 25 27 7 8 8 6 14 6 4t 31 4t 16 23 18 2 19 11 DEN 8t 9 21 9 5 12 26 19 5t 13 14t 28 31 26 26 9t 27 23 21 HOU 20 24 17 24 25 23 30 28 19 31 13 1 2 31 31 17 21t 12t 14 IND 13 20 8 17 16t 19 19 22 9t 21 4t 10 14 13 10 12 29 11 16 JAC 18 27 29 32 10 18 15 5 15t 18 14t 5 10 20 28 22 16 24t 17 KC 25 21 30 31 14 11 9 10 31 14 31 4 3 9 5 19 21t 7 9 LAC 5 16 20 15 4 22 10 12 5t 27 26t 21 15 1 6 11 1 14t 7 MIA 30 31 31 26 22 31 20 32 30 26 21t 16 30 12 9 32 11 32 32 NE 2 2 9 23 2 2 1 4 2 1 6 9 7 2 4 1 17t 2 4 NYJ 8t 4 1 1 19 14 25 25 8 25 2 13 6 10 8 20 15 27 27 OAK 24 28 13 12 28 28 16t 20 26t 23 32 32 9 22 16 24 9 26 19 PIT 7 6 11 5 8 6 2 3 12 11t 10t 23 17 24 12 8 4t 16 24 TEN 17 13 12 8 24 17 18 18 17t 10 12 24 13 23 25 9t 23t 10 23 ARI 31 30 23 18 32 27 29 21 32 30 3 7 12 6 17 30 28 28 29 ATL 26 25 18 6 27 29 16t 31 25 29 14t 18 27 25 15 28 32 24t 18 CAR 19 19 27 30 18 10 5 2 26t 22 28t 25 11 11 18 25t 7 22 22 CHI 4 5 7 4 9 4 23 23 11 4 26t 17 21 29 11 4 4t 17 26 DAL 6 8 15 14 6 5 31 17 15t 3 14t 29t 24 18 24 7 25 4 2 DET 29 26 24 20 30 25 32 27 29 28 7 2 20 27 30 25t 10 21 20 GB 28 29 26 28 23 26 11 13 20 20 14t 22 28 8 29 14 13t 12t 25 LAR 16 7 16 3 13 9 24 11 21 19 24 26 22 4 7 15 8 14t 13 MIN 15 11 6 11 20 13 12 15 13 15 20 14 29 19 21 6 23t 5 8 NO 10 10 4 13 15 7 21 14 9t 7t 8t 20 32 5 1 13 31 8 6 NYG 27 23 22 7 26 30 6 16 17t 16 28t 11 1 7 2 29 13t 29 28 PHI 12 12 5 10 12 16 13 9 4 11t 21t 19 23 17 19 16 12 18 15 SF 1 1 19 25 1 1 4 1 1 2 1 3 8 30 13 2 20 3 1 SEA 23 22 10 22 29 20 14 29 23 9 25 12 25 15 20 21 6 9 12 TB 21 15 2 2 31 21 28 26 26t 7t 14t 15 19 32 32 31 19 20 10 WAS 22 18 28 16 11 24 3 8 24 32 23 27 26 21 27 23 17t 30 31 Opponent/Defense Rank (A) Total Yards per Game (B) Yards per Play (C) Rushing Yards per Game (D) Rushing Yards per Attempt (E) Passing Net Yards per Game (F) Passing Net Yards per Play
(G) Passing, Percent Had Intercepted (H) Sacks per Pass Play (I) First Downs per Game (J) Third Down Efficiency (K) Fourth Down Efficiency (L) Punt Return Average (M) Kickoff Return Average
(N) Gross Punting Average (O) Net Punting Average (P) Points per Game (Q) Field Goal Percentage Combined Offense/Defense Rank (R) Points per Game Differential (S) Net Yards per Game Differential
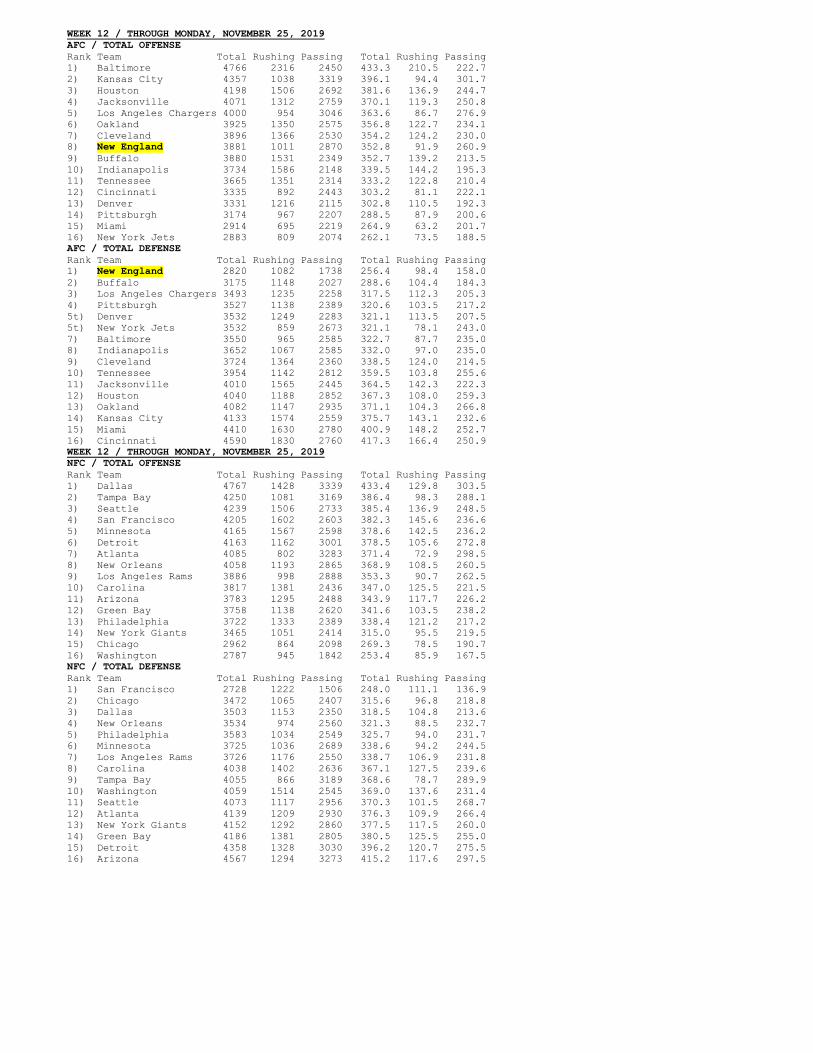
WEEK 12 / THROUGH MONDAY, NOVEMBER 25, 2019 AFC / TOTAL OFFENSE Rank Team Total Rushing Passing Total Rushing Passing 1) Baltimore 4766 2316 2450 433.3 210.5 222.7 2) Kansas City 4357 1038 3319 396.1 94.4 301.7 3) Houston 4198 1506 2692 381.6 136.9 244.7 4) Jacksonville 4071 1312 2759 370.1 119.3 250.8 5) Los Angeles Chargers 4000 954 3046 363.6 86.7 276.9 6) Oakland 3925 1350 2575 356.8 122.7 234.1 7) Cleveland 3896 1366 2530 354.2 124.2 230.0 8) New England 3881 1011 2870 352.8 91.9 260.9 9) Buffalo 3880 1531 2349 352.7 139.2 213.5 10) Indianapolis 3734 1586 2148 339.5 144.2 195.3 11) Tennessee 3665 1351 2314 333.2 122.8 210.4 12) Cincinnati 3335 892 2443 303.2 81.1 222.1 13) Denver 3331 1216 2115 302.8 110.5 192.3 14) Pittsburgh 3174 967 2207 288.5 87.9 200.6 15) Miami 2914 695 2219 264.9 63.2 201.7 16) New York Jets 2883 809 2074 262.1 73.5 188.5 AFC / TOTAL DEFENSE Rank Team Total Rushing Passing Total Rushing Passing 1) New England 2820 1082 1738 256.4 98.4 158.0 2) Buffalo 3175 1148 2027 288.6 104.4 184.3 3) Los Angeles Chargers 3493 1235 2258 317.5 112.3 205.3 4) Pittsburgh 3527 1138 2389 320.6 103.5 217.2 5t) Denver 3532 1249 2283 321.1 113.5 207.5 5t) New York Jets 3532 859 2673 321.1 78.1 243.0 7) Baltimore 3550 965 2585 322.7 87.7 235.0 8) Indianapolis 3652 1067 2585 332.0 97.0 235.0 9) Cleveland 3724 1364 2360 338.5 124.0 214.5 10) Tennessee 3954 1142 2812 359.5 103.8 255.6 11) Jacksonville 4010 1565 2445 364.5 142.3 222.3 12) Houston 4040 1188 2852 367.3 108.0 259.3 13) Oakland 4082 1147 2935 371.1 104.3 266.8 14) Kansas City 4133 1574 2559 375.7 143.1 232.6 15) Miami 4410 1630 2780 400.9 148.2 252.7 16) Cincinnati 4590 1830 2760 417.3 166.4 250.9 WEEK 12 / THROUGH MONDAY, NOVEMBER 25, 2019 NFC / TOTAL OFFENSE Rank Team Total Rushing Passing Total Rushing Passing 1) Dallas 4767 1428 3339 433.4 129.8 303.5 2) Tampa Bay 4250 1081 3169 386.4 98.3 288.1 3) Seattle 4239 1506 2733 385.4 136.9 248.5 4) San Francisco 4205 1602 2603 382.3 145.6 236.6 5) Minnesota 4165 1567 2598 378.6 142.5 236.2 6) Detroit 4163 1162 3001 378.5 105.6 272.8 7) Atlanta 4085 802 3283 371.4 72.9 298.5 8) New Orleans 4058 1193 2865 368.9 108.5 260.5 9) Los Angeles Rams 3886 998 2888 353.3 90.7 262.5 10) Carolina 3817 1381 2436 347.0 125.5 221.5 11) Arizona 3783 1295 2488 343.9 117.7 226.2 12) Green Bay 3758 1138 2620 341.6 103.5 238.2 13) Philadelphia 3722 1333 2389 338.4 121.2 217.2 14) New York Giants 3465 1051 2414 315.0 95.5 219.5 15) Chicago 2962 864 2098 269.3 78.5 190.7 16) Washington 2787 945 1842 253.4 85.9 167.5 NFC / TOTAL DEFENSE Rank Team Total Rushing Passing Total Rushing Passing 1) San Francisco 2728 1222 1506 248.0 111.1 136.9 2) Chicago 3472 1065 2407 315.6 96.8 218.8 3) Dallas 3503 1153 2350 318.5 104.8 213.6 4) New Orleans 3534 974 2560 321.3 88.5 232.7 5) Philadelphia 3583 1034 2549 325.7 94.0 231.7 6) Minnesota 3725 1036 2689 338.6 94.2 244.5 7) Los Angeles Rams 3726 1176 2550 338.7 106.9 231.8 8) Carolina 4038 1402 2636 367.1 127.5 239.6 9) Tampa Bay 4055 866 3189 368.6 78.7 289.9 10) Washington 4059 1514 2545 369.0 137.6 231.4 11) Seattle 4073 1117 2956 370.3 101.5 268.7 12) Atlanta 4139 1209 2930 376.3 109.9 266.4 13) New York Giants 4152 1292 2860 377.5 117.5 260.0 14) Green Bay 4186 1381 2805 380.5 125.5 255.0 15) Detroit 4358 1328 3030 396.2 120.7 275.5 16) Arizona 4567 1294 3273 415.2 117.6 297.5
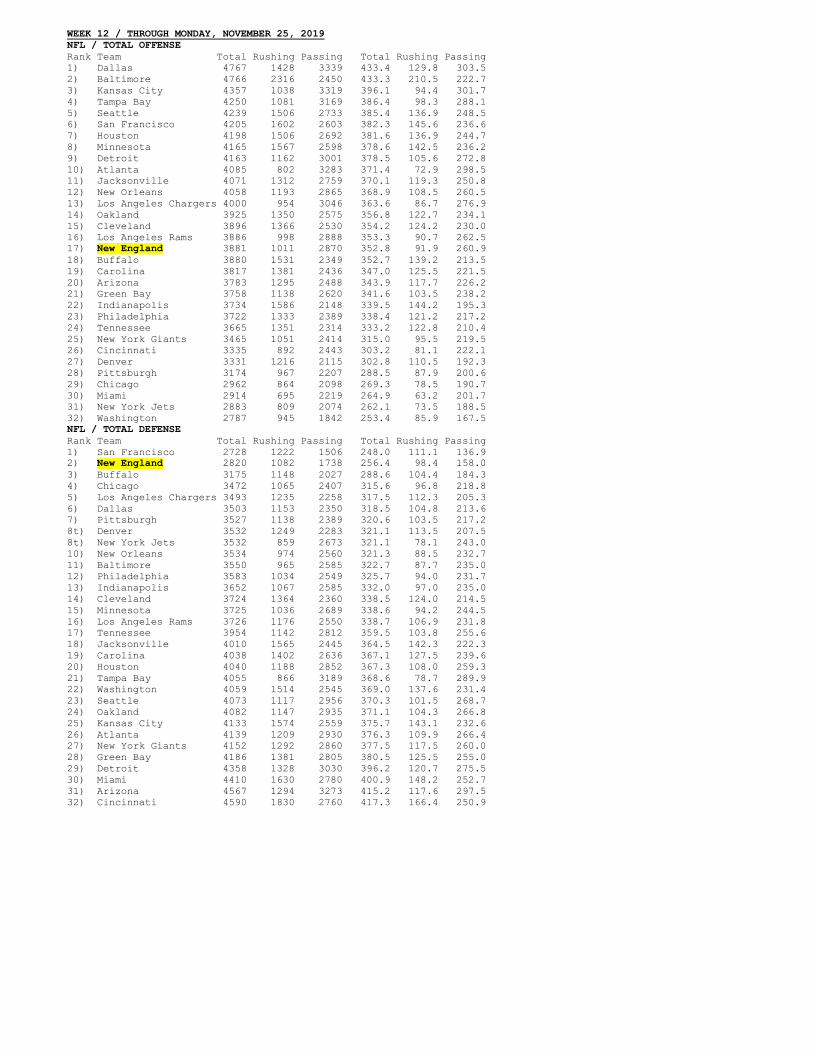
WEEK 12 / THROUGH MONDAY, NOVEMBER 25, 2019 NFL / TOTAL OFFENSE Rank Team Total Rushing Passing Total Rushing Passing 1) Dallas 4767 1428 3339 433.4 129.8 303.5 2) Baltimore 4766 2316 2450 433.3 210.5 222.7 3) Kansas City 4357 1038 3319 396.1 94.4 301.7 4) Tampa Bay 4250 1081 3169 386.4 98.3 288.1 5) Seattle 4239 1506 2733 385.4 136.9 248.5 6) San Francisco 4205 1602 2603 382.3 145.6 236.6 7) Houston 4198 1506 2692 381.6 136.9 244.7 8) Minnesota 4165 1567 2598 378.6 142.5 236.2 9) Detroit 4163 1162 3001 378.5 105.6 272.8 10) Atlanta 4085 802 3283 371.4 72.9 298.5 11) Jacksonville 4071 1312 2759 370.1 119.3 250.8 12) New Orleans 4058 1193 2865 368.9 108.5 260.5 13) Los Angeles Chargers 4000 954 3046 363.6 86.7 276.9 14) Oakland 3925 1350 2575 356.8 122.7 234.1 15) Cleveland 3896 1366 2530 354.2 124.2 230.0 16) Los Angeles Rams 3886 998 2888 353.3 90.7 262.5 17) New England 3881 1011 2870 352.8 91.9 260.9 18) Buffalo 3880 1531 2349 352.7 139.2 213.5 19) Carolina 3817 1381 2436 347.0 125.5 221.5 20) Arizona 3783 1295 2488 343.9 117.7 226.2 21) Green Bay 3758 1138 2620 341.6 103.5 238.2 22) Indianapolis 3734 1586 2148 339.5 144.2 195.3 23) Philadelphia 3722 1333 2389 338.4 121.2 217.2 24) Tennessee 3665 1351 2314 333.2 122.8 210.4 25) New York Giants 3465 1051 2414 315.0 95.5 219.5 26) Cincinnati 3335 892 2443 303.2 81.1 222.1 27) Denver 3331 1216 2115 302.8 110.5 192.3 28) Pittsburgh 3174 967 2207 288.5 87.9 200.6 29) Chicago 2962 864 2098 269.3 78.5 190.7 30) Miami 2914 695 2219 264.9 63.2 201.7 31) New York Jets 2883 809 2074 262.1 73.5 188.5 32) Washington 2787 945 1842 253.4 85.9 167.5 NFL / TOTAL DEFENSE Rank Team Total Rushing Passing Total Rushing Passing 1) San Francisco 2728 1222 1506 248.0 111.1 136.9 2) New England 2820 1082 1738 256.4 98.4 158.0 3) Buffalo 3175 1148 2027 288.6 104.4 184.3 4) Chicago 3472 1065 2407 315.6 96.8 218.8 5) Los Angeles Chargers 3493 1235 2258 317.5 112.3 205.3 6) Dallas 3503 1153 2350 318.5 104.8 213.6 7) Pittsburgh 3527 1138 2389 320.6 103.5 217.2 8t) Denver 3532 1249 2283 321.1 113.5 207.5 8t) New York Jets 3532 859 2673 321.1 78.1 243.0 10) New Orleans 3534 974 2560 321.3 88.5 232.7 11) Baltimore 3550 965 2585 322.7 87.7 235.0 12) Philadelphia 3583 1034 2549 325.7 94.0 231.7 13) Indianapolis 3652 1067 2585 332.0 97.0 235.0 14) Cleveland 3724 1364 2360 338.5 124.0 214.5 15) Minnesota 3725 1036 2689 338.6 94.2 244.5 16) Los Angeles Rams 3726 1176 2550 338.7 106.9 231.8 17) Tennessee 3954 1142 2812 359.5 103.8 255.6 18) Jacksonville 4010 1565 2445 364.5 142.3 222.3 19) Carolina 4038 1402 2636 367.1 127.5 239.6 20) Houston 4040 1188 2852 367.3 108.0 259.3 21) Tampa Bay 4055 866 3189 368.6 78.7 289.9 22) Washington 4059 1514 2545 369.0 137.6 231.4 23) Seattle 4073 1117 2956 370.3 101.5 268.7 24) Oakland 4082 1147 2935 371.1 104.3 266.8 25) Kansas City 4133 1574 2559 375.7 143.1 232.6 26) Atlanta 4139 1209 2930 376.3 109.9 266.4 27) New York Giants 4152 1292 2860 377.5 117.5 260.0 28) Green Bay 4186 1381 2805 380.5 125.5 255.0 29) Detroit 4358 1328 3030 396.2 120.7 275.5 30) Miami 4410 1630 2780 400.9 148.2 252.7 31) Arizona 4567 1294 3273 415.2 117.6 297.5 32) Cincinnati 4590 1830 2760 417.3 166.4 250.9
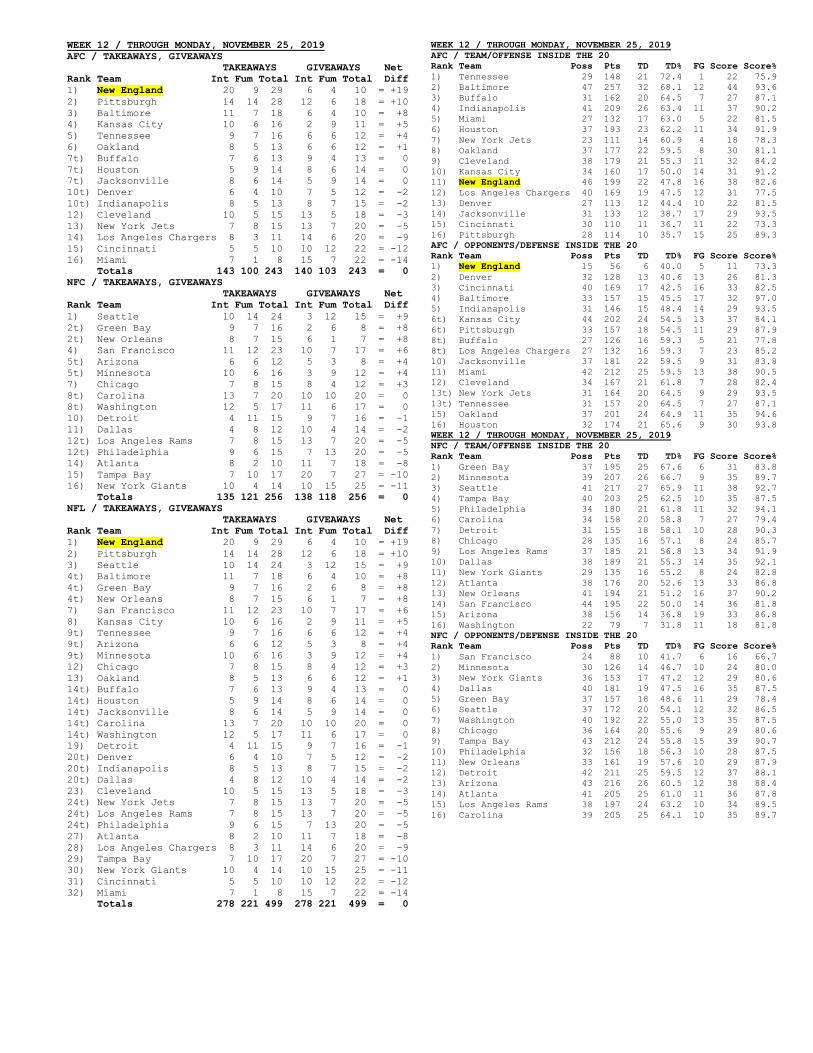
WEEK 12 / THROUGH MONDAY, NOVEMBER 25, 2019 AFC / TAKEAWAYS, GIVEAWAYS TAKEAWAYS GIVEAWAYS Net Rank Team Int Fum Total Int Fum Total Diff 1) New England 20 9 29 6 4 10 = +19 2) Pittsburgh 14 14 28 12 6 18 = +10 3) Baltimore 11 7 18 6 4 10 = +8 4) Kansas City 10 6 16 2 9 11 = +5 5) Tennessee 9 7 16 6 6 12 = +4 6) Oakland 8 5 13 6 6 12 = +1 7t) Buffalo 7 6 13 9 4 13 = 0 7t) Houston 5 9 14 8 6 14 = 0 7t) Jacksonville 8 6 14 5 9 14 = 0 10t) Denver 6 4 10 7 5 12 = -2 10t) Indianapolis 8 5 13 8 7 15 = -2 12) Cleveland 10 5 15 13 5 18 = -3 13) New York Jets 7 8 15 13 7 20 = -5 14) Los Angeles Chargers 8 3 11 14 6 20 = -9 15) Cincinnati 5 5 10 10 12 22 = -12 16) Miami 7 1 8 15 7 22 = -14 Totals 143 100 243 140 103 243 = 0 NFC / TAKEAWAYS, GIVEAWAYS TAKEAWAYS GIVEAWAYS Net Rank Team Int Fum Total Int Fum Total Diff 1) Seattle 10 14 24 3 12 15 = +9 2t) Green Bay 9 7 16 2 6 8 = +8 2t) New Orleans 8 7 15 6 1 7 = +8 4) San Francisco 11 12 23 10 7 17 = +6 5t) Arizona 6 6 12 5 3 8 = +4 5t) Minnesota 10 6 16 3 9 12 = +4 7) Chicago 7 8 15 8 4 12 = +3 8t) Carolina 13 7 20 10 10 20 = 0 8t) Washington 12 5 17 11 6 17 = 0 10) Detroit 4 11 15 9 7 16 = -1 11) Dallas 4 8 12 10 4 14 = -2 12t) Los Angeles Rams 7 8 15 13 7 20 = -5 12t) Philadelphia 9 6 15 7 13 20 = -5 14) Atlanta 8 2 10 11 7 18 = -8 15) Tampa Bay 7 10 17 20 7 27 = -10 16) New York Giants 10 4 14 10 15 25 = -11 Totals 135 121 256 138 118 256 = 0 NFL / TAKEAWAYS, GIVEAWAYS TAKEAWAYS GIVEAWAYS Net Rank Team Int Fum Total Int Fum Total Diff 1) New England 20 9 29 6 4 10 = +19 2) Pittsburgh 14 14 28 12 6 18 = +10 3) Seattle 10 14 24 3 12 15 = +9 4t) Baltimore 11 7 18 6 4 10 = +8 4t) Green Bay 9 7 16 2 6 8 = +8 4t) New Orleans 8 7 15 6 1 7 = +8 7) San Francisco 11 12 23 10 7 17 = +6 8) Kansas City 10 6 16 2 9 11 = +5 9t) Tennessee 9 7 16 6 6 12 = +4 9t) Arizona 6 6 12 5 3 8 = +4 9t) Minnesota 10 6 16 3 9 12 = +4 12) Chicago 7 8 15 8 4 12 = +3 13) Oakland 8 5 13 6 6 12 = +1 14t) Buffalo 7 6 13 9 4 13 = 0 14t) Houston 5 9 14 8 6 14 = 0 14t) Jacksonville 8 6 14 5 9 14 = 0 14t) Carolina 13 7 20 10 10 20 = 0 14t) Washington 12 5 17 11 6 17 = 0 19) Detroit 4 11 15 9 7 16 = -1 20t) Denver 6 4 10 7 5 12 = -2 20t) Indianapolis 8 5 13 8 7 15 = -2 20t) Dallas 4 8 12 10 4 14 = -2 23) Cleveland 10 5 15 13 5 18 = -3 24t) New York Jets 7 8 15 13 7 20 = -5 24t) Los Angeles Rams 7 8 15 13 7 20 = -5 24t) Philadelphia 9 6 15 7 13 20 = -5 27) Atlanta 8 2 10 11 7 18 = -8 28) Los Angeles Chargers 8 3 11 14 6 20 = -9 29) Tampa Bay 7 10 17 20 7 27 = -10 30) New York Giants 10 4 14 10 15 25 = -11 31) Cincinnati 5 5 10 10 12 22 = -12 32) Miami 7 1 8 15 7 22 = -14 Totals 278 221 499 278 221 499 = 0
WEEK 12 / THROUGH MONDAY, NOVEMBER 25, 2019 AFC / TEAM/OFFENSE INSIDE THE 20 Rank Team Poss Pts TD TD% FG Score Score% 1) Tennessee 29 148 21 72.4 1 22 75.9 2) Baltimore 47 257 32 68.1 12 44 93.6 3) Buffalo 31 162 20 64.5 7 27 87.1 4) Indianapolis 41 209 26 63.4 11 37 90.2 5) Miami 27 132 17 63.0 5 22 81.5 6) Houston 37 193 23 62.2 11 34 91.9 7) New York Jets 23 111 14 60.9 4 18 78.3 8) Oakland 37 177 22 59.5 8 30 81.1 9) Cleveland 38 179 21 55.3 11 32 84.2 10) Kansas City 34 160 17 50.0 14 31 91.2 11) New England 46 199 22 47.8 16 38 82.6 12) Los Angeles Chargers 40 169 19 47.5 12 31 77.5 13) Denver 27 113 12 44.4 10 22 81.5 14) Jacksonville 31 133 12 38.7 17 29 93.5 15) Cincinnati 30 110 11 36.7 11 22 73.3 16) Pittsburgh 28 114 10 35.7 15 25 89.3 AFC / OPPONENTS/DEFENSE INSIDE THE 20 Rank Team Poss Pts TD TD% FG Score Score% 1) New England 15 56 6 40.0 5 11 73.3 2) Denver 32 128 13 40.6 13 26 81.3 3) Cincinnati 40 169 17 42.5 16 33 82.5 4) Baltimore 33 157 15 45.5 17 32 97.0 5) Indianapolis 31 146 15 48.4 14 29 93.5 6t) Kansas City 44 202 24 54.5 13 37 84.1 6t) Pittsburgh 33 157 18 54.5 11 29 87.9 8t) Buffalo 27 126 16 59.3 5 21 77.8 8t) Los Angeles Chargers 27 132 16 59.3 7 23 85.2 10) Jacksonville 37 181 22 59.5 9 31 83.8 11) Miami 42 212 25 59.5 13 38 90.5 12) Cleveland 34 167 21 61.8 7 28 82.4 13t) New York Jets 31 164 20 64.5 9 29 93.5 13t) Tennessee 31 157 20 64.5 7 27 87.1 15) Oakland 37 201 24 64.9 11 35 94.6 16) Houston 32 174 21 65.6 9 30 93.8 WEEK 12 / THROUGH MONDAY, NOVEMBER 25, 2019 NFC / TEAM/OFFENSE INSIDE THE 20 Rank Team Poss Pts TD TD% FG Score Score% 1) Green Bay 37 195 25 67.6 6 31 83.8 2) Minnesota 39 207 26 66.7 9 35 89.7 3) Seattle 41 217 27 65.9 11 38 92.7 4) Tampa Bay 40 203 25 62.5 10 35 87.5 5) Philadelphia 34 180 21 61.8 11 32 94.1 6) Carolina 34 158 20 58.8 7 27 79.4 7) Detroit 31 155 18 58.1 10 28 90.3 8) Chicago 28 135 16 57.1 8 24 85.7 9) Los Angeles Rams 37 185 21 56.8 13 34 91.9 10) Dallas 38 189 21 55.3 14 35 92.1 11) New York Giants 29 135 16 55.2 8 24 82.8 12) Atlanta 38 176 20 52.6 13 33 86.8 13) New Orleans 41 194 21 51.2 16 37 90.2 14) San Francisco 44 195 22 50.0 14 36 81.8 15) Arizona 38 156 14 36.8 19 33 86.8 16) Washington 22 79 7 31.8 11 18 81.8 NFC / OPPONENTS/DEFENSE INSIDE THE 20 Rank Team Poss Pts TD TD% FG Score Score% 1) San Francisco 24 88 10 41.7 6 16 66.7 2) Minnesota 30 126 14 46.7 10 24 80.0 3) New York Giants 36 153 17 47.2 12 29 80.6 4) Dallas 40 181 19 47.5 16 35 87.5 5) Green Bay 37 157 18 48.6 11 29 78.4 6) Seattle 37 172 20 54.1 12 32 86.5 7) Washington 40 192 22 55.0 13 35 87.5 8) Chicago 36 164 20 55.6 9 29 80.6 9) Tampa Bay 43 212 24 55.8 15 39 90.7 10) Philadelphia 32 156 18 56.3 10 28 87.5 11) New Orleans 33 161 19 57.6 10 29 87.9 12) Detroit 42 211 25 59.5 12 37 88.1 13) Arizona 43 216 26 60.5 12 38 88.4 14) Atlanta 41 205 25 61.0 11 36 87.8 15) Los Angeles Rams 38 197 24 63.2 10 34 89.5 16) Carolina 39 205 25 64.1 10 35 89.7
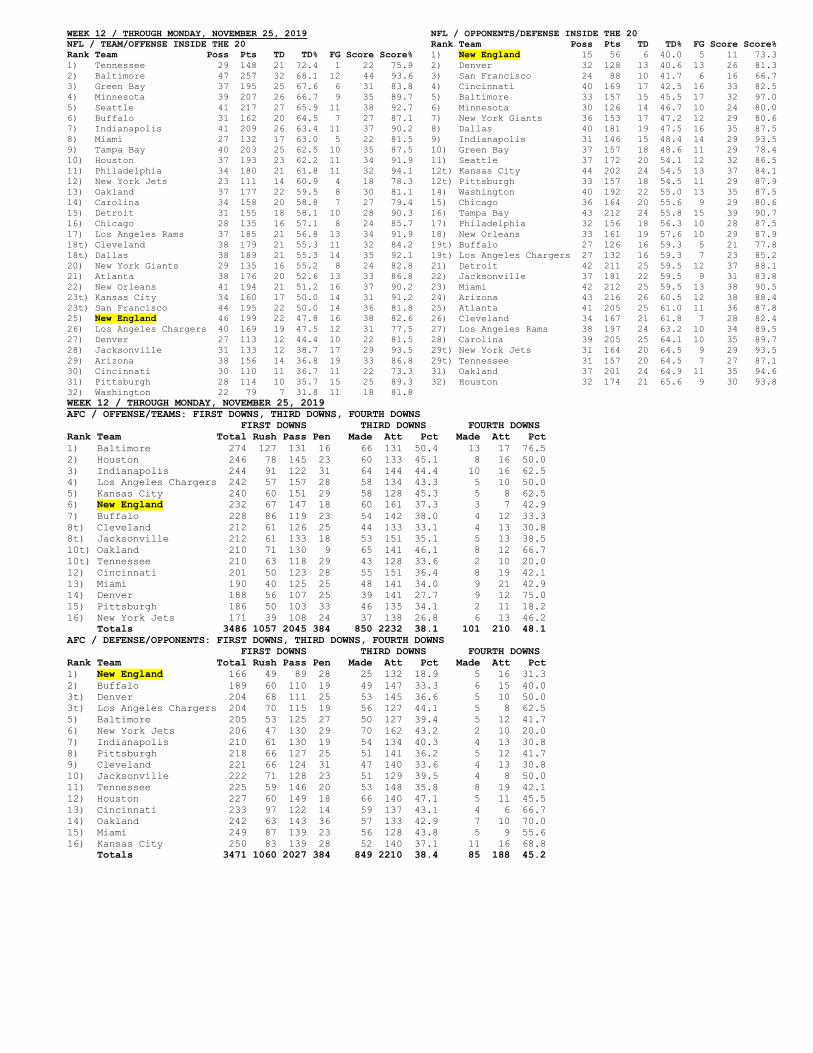
WEEK 12 / THROUGH MONDAY, NOVEMBER 25, 2019 NFL / TEAM/OFFENSE INSIDE THE 20 Rank Team Poss Pts TD TD% FG Score Score% 1) Tennessee 29 148 21 72.4 1 22 75.9 2) Baltimore 47 257 32 68.1 12 44 93.6 3) Green Bay 37 195 25 67.6 6 31 83.8 4) Minnesota 39 207 26 66.7 9 35 89.7 5) Seattle 41 217 27 65.9 11 38 92.7 6) Buffalo 31 162 20 64.5 7 27 87.1 7) Indianapolis 41 209 26 63.4 11 37 90.2 8) Miami 27 132 17 63.0 5 22 81.5 9) Tampa Bay 40 203 25 62.5 10 35 87.5 10) Houston 37 193 23 62.2 11 34 91.9 11) Philadelphia 34 180 21 61.8 11 32 94.1 12) New York Jets 23 111 14 60.9 4 18 78.3 13) Oakland 37 177 22 59.5 8 30 81.1 14) Carolina 34 158 20 58.8 7 27 79.4 15) Detroit 31 155 18 58.1 10 28 90.3 16) Chicago 28 135 16 57.1 8 24 85.7 17) Los Angeles Rams 37 185 21 56.8 13 34 91.9 18t) Cleveland 38 179 21 55.3 11 32 84.2 18t) Dallas 38 189 21 55.3 14 35 92.1 20) New York Giants 29 135 16 55.2 8 24 82.8 21) Atlanta 38 176 20 52.6 13 33 86.8 22) New Orleans 41 194 21 51.2 16 37 90.2 23t) Kansas City 34 160 17 50.0 14 31 91.2 23t) San Francisco 44 195 22 50.0 14 36 81.8 25) New England 46 199 22 47.8 16 38 82.6 26) Los Angeles Chargers 40 169 19 47.5 12 31 77.5 27) Denver 27 113 12 44.4 10 22 81.5 28) Jacksonville 31 133 12 38.7 17 29 93.5 29) Arizona 38 156 14 36.8 19 33 86.8 30) Cincinnati 30 110 11 36.7 11 22 73.3 31) Pittsburgh 28 114 10 35.7 15 25 89.3 32) Washington 22 79 7 31.8 11 18 81.8
NFL / OPPONENTS/DEFENSE INSIDE THE 20 Rank Team Poss Pts TD TD% FG Score Score% 1) New England 15 56 6 40.0 5 11 73.3 2) Denver 32 128 13 40.6 13 26 81.3 3) San Francisco 24 88 10 41.7 6 16 66.7 4) Cincinnati 40 169 17 42.5 16 33 82.5 5) Baltimore 33 157 15 45.5 17 32 97.0 6) Minnesota 30 126 14 46.7 10 24 80.0 7) New York Giants 36 153 17 47.2 12 29 80.6 8) Dallas 40 181 19 47.5 16 35 87.5 9) Indianapolis 31 146 15 48.4 14 29 93.5 10) Green Bay 37 157 18 48.6 11 29 78.4 11) Seattle 37 172 20 54.1 12 32 86.5 12t) Kansas City 44 202 24 54.5 13 37 84.1 12t) Pittsburgh 33 157 18 54.5 11 29 87.9 14) Washington 40 192 22 55.0 13 35 87.5 15) Chicago 36 164 20 55.6 9 29 80.6 16) Tampa Bay 43 212 24 55.8 15 39 90.7 17) Philadelphia 32 156 18 56.3 10 28 87.5 18) New Orleans 33 161 19 57.6 10 29 87.9 19t) Buffalo 27 126 16 59.3 5 21 77.8 19t) Los Angeles Chargers 27 132 16 59.3 7 23 85.2 21) Detroit 42 211 25 59.5 12 37 88.1 22) Jacksonville 37 181 22 59.5 9 31 83.8 23) Miami 42 212 25 59.5 13 38 90.5 24) Arizona 43 216 26 60.5 12 38 88.4 25) Atlanta 41 205 25 61.0 11 36 87.8 26) Cleveland 34 167 21 61.8 7 28 82.4 27) Los Angeles Rams 38 197 24 63.2 10 34 89.5 28) Carolina 39 205 25 64.1 10 35 89.7 29t) New York Jets 31 164 20 64.5 9 29 93.5 29t) Tennessee 31 157 20 64.5 7 27 87.1 31) Oakland 37 201 24 64.9 11 35 94.6 32) Houston 32 174 21 65.6 9 30 93.8
WEEK 12 / THROUGH MONDAY, NOVEMBER 25, 2019 AFC / OFFENSE/TEAMS: FIRST DOWNS, THIRD DOWNS, FOURTH DOWNS FIRST DOWNS THIRD DOWNS FOURTH DOWNS Rank Team Total Rush Pass Pen Made Att Pct Made Att Pct 1) Baltimore 274 127 131 16 66 131 50.4 13 17 76.5 2) Houston 246 78 145 23 60 133 45.1 8 16 50.0 3) Indianapolis 244 91 122 31 64 144 44.4 10 16 62.5 4) Los Angeles Chargers 242 57 157 28 58 134 43.3 5 10 50.0 5) Kansas City 240 60 151 29 58 128 45.3 5 8 62.5 6) New England 232 67 147 18 60 161 37.3 3 7 42.9 7) Buffalo 228 86 119 23 54 142 38.0 4 12 33.3 8t) Cleveland 212 61 126 25 44 133 33.1 4 13 30.8 8t) Jacksonville 212 61 133 18 53 151 35.1 5 13 38.5 10t) Oakland 210 71 130 9 65 141 46.1 8 12 66.7 10t) Tennessee 210 63 118 29 43 128 33.6 2 10 20.0 12) Cincinnati 201 50 123 28 55 151 36.4 8 19 42.1 13) Miami 190 40 125 25 48 141 34.0 9 21 42.9 14) Denver 188 56 107 25 39 141 27.7 9 12 75.0 15) Pittsburgh 186 50 103 33 46 135 34.1 2 11 18.2 16) New York Jets 171 39 108 24 37 138 26.8 6 13 46.2 Totals 3486 1057 2045 384 850 2232 38.1 101 210 48.1 AFC / DEFENSE/OPPONENTS: FIRST DOWNS, THIRD DOWNS, FOURTH DOWNS FIRST DOWNS THIRD DOWNS FOURTH DOWNS Rank Team Total Rush Pass Pen Made Att Pct Made Att Pct 1) New England 166 49 89 28 25 132 18.9 5 16 31.3 2) Buffalo 189 60 110 19 49 147 33.3 6 15 40.0 3t) Denver 204 68 111 25 53 145 36.6 5 10 50.0 3t) Los Angeles Chargers 204 70 115 19 56 127 44.1 5 8 62.5 5) Baltimore 205 53 125 27 50 127 39.4 5 12 41.7 6) New York Jets 206 47 130 29 70 162 43.2 2 10 20.0 7) Indianapolis 210 61 130 19 54 134 40.3 4 13 30.8 8) Pittsburgh 218 66 127 25 51 141 36.2 5 12 41.7 9) Cleveland 221 66 124 31 47 140 33.6 4 13 30.8 10) Jacksonville 222 71 128 23 51 129 39.5 4 8 50.0 11) Tennessee 225 59 146 20 53 148 35.8 8 19 42.1 12) Houston 227 60 149 18 66 140 47.1 5 11 45.5 13) Cincinnati 233 97 122 14 59 137 43.1 4 6 66.7 14) Oakland 242 63 143 36 57 133 42.9 7 10 70.0 15) Miami 249 87 139 23 56 128 43.8 5 9 55.6 16) Kansas City 250 83 139 28 52 140 37.1 11 16 68.8 Totals 3471 1060 2027 384 849 2210 38.4 85 188 45.2
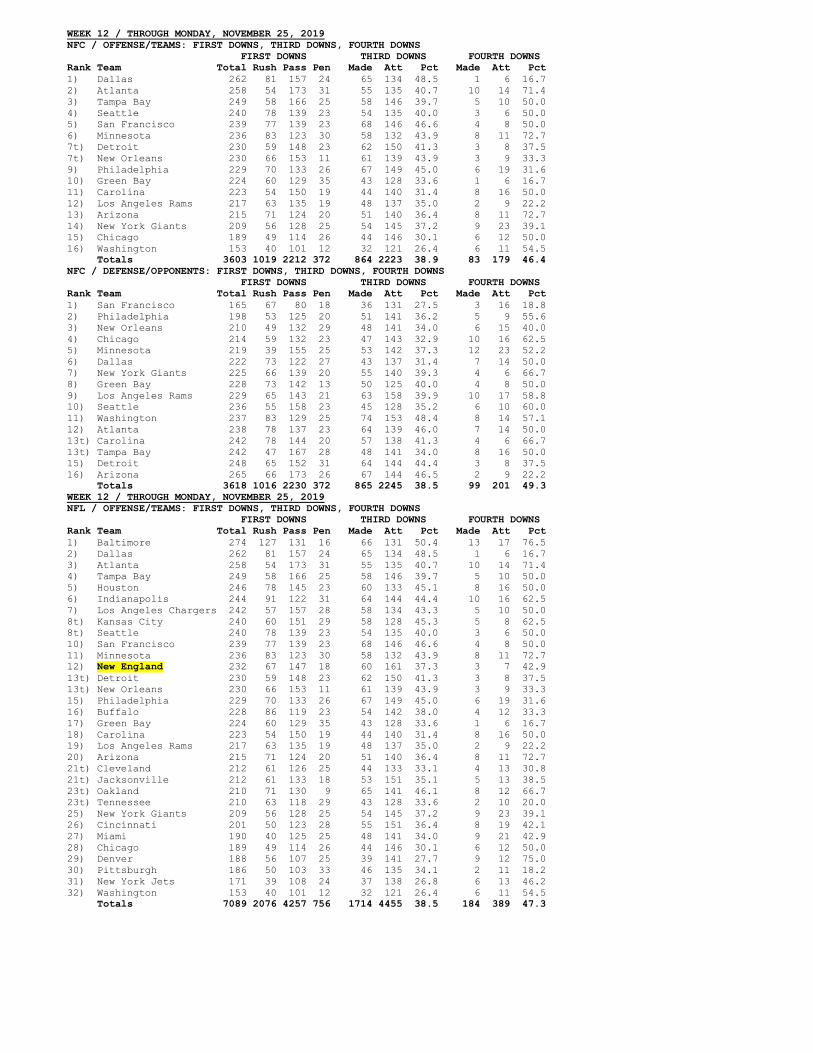
WEEK 12 / THROUGH MONDAY, NOVEMBER 25, 2019 NFC / OFFENSE/TEAMS: FIRST DOWNS, THIRD DOWNS, FOURTH DOWNS FIRST DOWNS THIRD DOWNS FOURTH DOWNS Rank Team Total Rush Pass Pen Made Att Pct Made Att Pct 1) Dallas 262 81 157 24 65 134 48.5 1 6 16.7 2) Atlanta 258 54 173 31 55 135 40.7 10 14 71.4 3) Tampa Bay 249 58 166 25 58 146 39.7 5 10 50.0 4) Seattle 240 78 139 23 54 135 40.0 3 6 50.0 5) San Francisco 239 77 139 23 68 146 46.6 4 8 50.0 6) Minnesota 236 83 123 30 58 132 43.9 8 11 72.7 7t) Detroit 230 59 148 23 62 150 41.3 3 8 37.5 7t) New Orleans 230 66 153 11 61 139 43.9 3 9 33.3 9) Philadelphia 229 70 133 26 67 149 45.0 6 19 31.6 10) Green Bay 224 60 129 35 43 128 33.6 1 6 16.7 11) Carolina 223 54 150 19 44 140 31.4 8 16 50.0 12) Los Angeles Rams 217 63 135 19 48 137 35.0 2 9 22.2 13) Arizona 215 71 124 20 51 140 36.4 8 11 72.7 14) New York Giants 209 56 128 25 54 145 37.2 9 23 39.1 15) Chicago 189 49 114 26 44 146 30.1 6 12 50.0 16) Washington 153 40 101 12 32 121 26.4 6 11 54.5 Totals 3603 1019 2212 372 864 2223 38.9 83 179 46.4 NFC / DEFENSE/OPPONENTS: FIRST DOWNS, THIRD DOWNS, FOURTH DOWNS FIRST DOWNS THIRD DOWNS FOURTH DOWNS Rank Team Total Rush Pass Pen Made Att Pct Made Att Pct 1) San Francisco 165 67 80 18 36 131 27.5 3 16 18.8 2) Philadelphia 198 53 125 20 51 141 36.2 5 9 55.6 3) New Orleans 210 49 132 29 48 141 34.0 6 15 40.0 4) Chicago 214 59 132 23 47 143 32.9 10 16 62.5 5) Minnesota 219 39 155 25 53 142 37.3 12 23 52.2 6) Dallas 222 73 122 27 43 137 31.4 7 14 50.0 7) New York Giants 225 66 139 20 55 140 39.3 4 6 66.7 8) Green Bay 228 73 142 13 50 125 40.0 4 8 50.0 9) Los Angeles Rams 229 65 143 21 63 158 39.9 10 17 58.8 10) Seattle 236 55 158 23 45 128 35.2 6 10 60.0 11) Washington 237 83 129 25 74 153 48.4 8 14 57.1 12) Atlanta 238 78 137 23 64 139 46.0 7 14 50.0 13t) Carolina 242 78 144 20 57 138 41.3 4 6 66.7 13t) Tampa Bay 242 47 167 28 48 141 34.0 8 16 50.0 15) Detroit 248 65 152 31 64 144 44.4 3 8 37.5 16) Arizona 265 66 173 26 67 144 46.5 2 9 22.2 Totals 3618 1016 2230 372 865 2245 38.5 99 201 49.3 WEEK 12 / THROUGH MONDAY, NOVEMBER 25, 2019 NFL / OFFENSE/TEAMS: FIRST DOWNS, THIRD DOWNS, FOURTH DOWNS FIRST DOWNS THIRD DOWNS FOURTH DOWNS Rank Team Total Rush Pass Pen Made Att Pct Made Att Pct 1) Baltimore 274 127 131 16 66 131 50.4 13 17 76.5 2) Dallas 262 81 157 24 65 134 48.5 1 6 16.7 3) Atlanta 258 54 173 31 55 135 40.7 10 14 71.4 4) Tampa Bay 249 58 166 25 58 146 39.7 5 10 50.0 5) Houston 246 78 145 23 60 133 45.1 8 16 50.0 6) Indianapolis 244 91 122 31 64 144 44.4 10 16 62.5 7) Los Angeles Chargers 242 57 157 28 58 134 43.3 5 10 50.0 8t) Kansas City 240 60 151 29 58 128 45.3 5 8 62.5 8t) Seattle 240 78 139 23 54 135 40.0 3 6 50.0 10) San Francisco 239 77 139 23 68 146 46.6 4 8 50.0 11) Minnesota 236 83 123 30 58 132 43.9 8 11 72.7 12) New England 232 67 147 18 60 161 37.3 3 7 42.9 13t) Detroit 230 59 148 23 62 150 41.3 3 8 37.5 13t) New Orleans 230 66 153 11 61 139 43.9 3 9 33.3 15) Philadelphia 229 70 133 26 67 149 45.0 6 19 31.6 16) Buffalo 228 86 119 23 54 142 38.0 4 12 33.3 17) Green Bay 224 60 129 35 43 128 33.6 1 6 16.7 18) Carolina 223 54 150 19 44 140 31.4 8 16 50.0 19) Los Angeles Rams 217 63 135 19 48 137 35.0 2 9 22.2 20) Arizona 215 71 124 20 51 140 36.4 8 11 72.7 21t) Cleveland 212 61 126 25 44 133 33.1 4 13 30.8 21t) Jacksonville 212 61 133 18 53 151 35.1 5 13 38.5 23t) Oakland 210 71 130 9 65 141 46.1 8 12 66.7 23t) Tennessee 210 63 118 29 43 128 33.6 2 10 20.0 25) New York Giants 209 56 128 25 54 145 37.2 9 23 39.1 26) Cincinnati 201 50 123 28 55 151 36.4 8 19 42.1 27) Miami 190 40 125 25 48 141 34.0 9 21 42.9 28) Chicago 189 49 114 26 44 146 30.1 6 12 50.0 29) Denver 188 56 107 25 39 141 27.7 9 12 75.0 30) Pittsburgh 186 50 103 33 46 135 34.1 2 11 18.2 31) New York Jets 171 39 108 24 37 138 26.8 6 13 46.2 32) Washington 153 40 101 12 32 121 26.4 6 11 54.5 Totals 7089 2076 4257 756 1714 4455 38.5 184 389 47.3
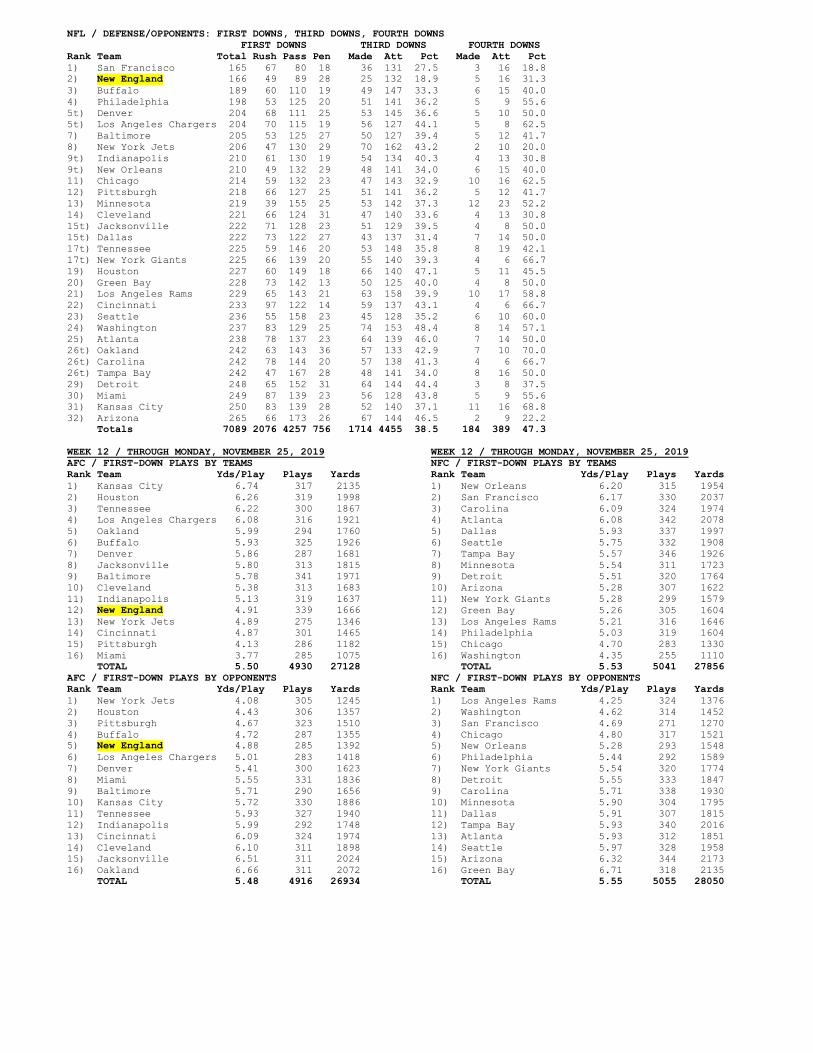
NFL / DEFENSE/OPPONENTS: FIRST DOWNS, THIRD DOWNS, FOURTH DOWNS FIRST DOWNS THIRD DOWNS FOURTH DOWNS Rank Team Total Rush Pass Pen Made Att Pct Made Att Pct 1) San Francisco 165 67 80 18 36 131 27.5 3 16 18.8 2) New England 166 49 89 28 25 132 18.9 5 16 31.3 3) Buffalo 189 60 110 19 49 147 33.3 6 15 40.0 4) Philadelphia 198 53 125 20 51 141 36.2 5 9 55.6 5t) Denver 204 68 111 25 53 145 36.6 5 10 50.0 5t) Los Angeles Chargers 204 70 115 19 56 127 44.1 5 8 62.5 7) Baltimore 205 53 125 27 50 127 39.4 5 12 41.7 8) New York Jets 206 47 130 29 70 162 43.2 2 10 20.0 9t) Indianapolis 210 61 130 19 54 134 40.3 4 13 30.8 9t) New Orleans 210 49 132 29 48 141 34.0 6 15 40.0 11) Chicago 214 59 132 23 47 143 32.9 10 16 62.5 12) Pittsburgh 218 66 127 25 51 141 36.2 5 12 41.7 13) Minnesota 219 39 155 25 53 142 37.3 12 23 52.2 14) Cleveland 221 66 124 31 47 140 33.6 4 13 30.8 15t) Jacksonville 222 71 128 23 51 129 39.5 4 8 50.0 15t) Dallas 222 73 122 27 43 137 31.4 7 14 50.0 17t) Tennessee 225 59 146 20 53 148 35.8 8 19 42.1 17t) New York Giants 225 66 139 20 55 140 39.3 4 6 66.7 19) Houston 227 60 149 18 66 140 47.1 5 11 45.5 20) Green Bay 228 73 142 13 50 125 40.0 4 8 50.0 21) Los Angeles Rams 229 65 143 21 63 158 39.9 10 17 58.8 22) Cincinnati 233 97 122 14 59 137 43.1 4 6 66.7 23) Seattle 236 55 158 23 45 128 35.2 6 10 60.0 24) Washington 237 83 129 25 74 153 48.4 8 14 57.1 25) Atlanta 238 78 137 23 64 139 46.0 7 14 50.0 26t) Oakland 242 63 143 36 57 133 42.9 7 10 70.0 26t) Carolina 242 78 144 20 57 138 41.3 4 6 66.7 26t) Tampa Bay 242 47 167 28 48 141 34.0 8 16 50.0 29) Detroit 248 65 152 31 64 144 44.4 3 8 37.5 30) Miami 249 87 139 23 56 128 43.8 5 9 55.6 31) Kansas City 250 83 139 28 52 140 37.1 11 16 68.8 32) Arizona 265 66 173 26 67 144 46.5 2 9 22.2 Totals 7089 2076 4257 756 1714 4455 38.5 184 389 47.3 WEEK 12 / THROUGH MONDAY, NOVEMBER 25, 2019 AFC / FIRST-DOWN PLAYS BY TEAMS Rank Team Yds/Play Plays Yards 1) Kansas City 6.74 317 2135 2) Houston 6.26 319 1998 3) Tennessee 6.22 300 1867 4) Los Angeles Chargers 6.08 316 1921 5) Oakland 5.99 294 1760 6) Buffalo 5.93 325 1926 7) Denver 5.86 287 1681 8) Jacksonville 5.80 313 1815 9) Baltimore 5.78 341 1971 10) Cleveland 5.38 313 1683 11) Indianapolis 5.13 319 1637 12) New England 4.91 339 1666 13) New York Jets 4.89 275 1346 14) Cincinnati 4.87 301 1465 15) Pittsburgh 4.13 286 1182 16) Miami 3.77 285 1075 TOTAL 5.50 4930 27128 AFC / FIRST-DOWN PLAYS BY OPPONENTS Rank Team Yds/Play Plays Yards 1) New York Jets 4.08 305 1245 2) Houston 4.43 306 1357 3) Pittsburgh 4.67 323 1510 4) Buffalo 4.72 287 1355 5) New England 4.88 285 1392 6) Los Angeles Chargers 5.01 283 1418 7) Denver 5.41 300 1623 8) Miami 5.55 331 1836 9) Baltimore 5.71 290 1656 10) Kansas City 5.72 330 1886 11) Tennessee 5.93 327 1940 12) Indianapolis 5.99 292 1748 13) Cincinnati 6.09 324 1974 14) Cleveland 6.10 311 1898 15) Jacksonville 6.51 311 2024 16) Oakland 6.66 311 2072 TOTAL 5.48 4916 26934
WEEK 12 / THROUGH MONDAY, NOVEMBER 25, 2019 NFC / FIRST-DOWN PLAYS BY TEAMS Rank Team Yds/Play Plays Yards 1) New Orleans 6.20 315 1954 2) San Francisco 6.17 330 2037 3) Carolina 6.09 324 1974 4) Atlanta 6.08 342 2078 5) Dallas 5.93 337 1997 6) Seattle 5.75 332 1908 7) Tampa Bay 5.57 346 1926 8) Minnesota 5.54 311 1723 9) Detroit 5.51 320 1764 10) Arizona 5.28 307 1622 11) New York Giants 5.28 299 1579 12) Green Bay 5.26 305 1604 13) Los Angeles Rams 5.21 316 1646 14) Philadelphia 5.03 319 1604 15) Chicago 4.70 283 1330 16) Washington 4.35 255 1110 TOTAL 5.53 5041 27856 NFC / FIRST-DOWN PLAYS BY OPPONENTS Rank Team Yds/Play Plays Yards 1) Los Angeles Rams 4.25 324 1376 2) Washington 4.62 314 1452 3) San Francisco 4.69 271 1270 4) Chicago 4.80 317 1521 5) New Orleans 5.28 293 1548 6) Philadelphia 5.44 292 1589 7) New York Giants 5.54 320 1774 8) Detroit 5.55 333 1847 9) Carolina 5.71 338 1930 10) Minnesota 5.90 304 1795 11) Dallas 5.91 307 1815 12) Tampa Bay 5.93 340 2016 13) Atlanta 5.93 312 1851 14) Seattle 5.97 328 1958 15) Arizona 6.32 344 2173 16) Green Bay 6.71 318 2135 TOTAL 5.55 5055 28050
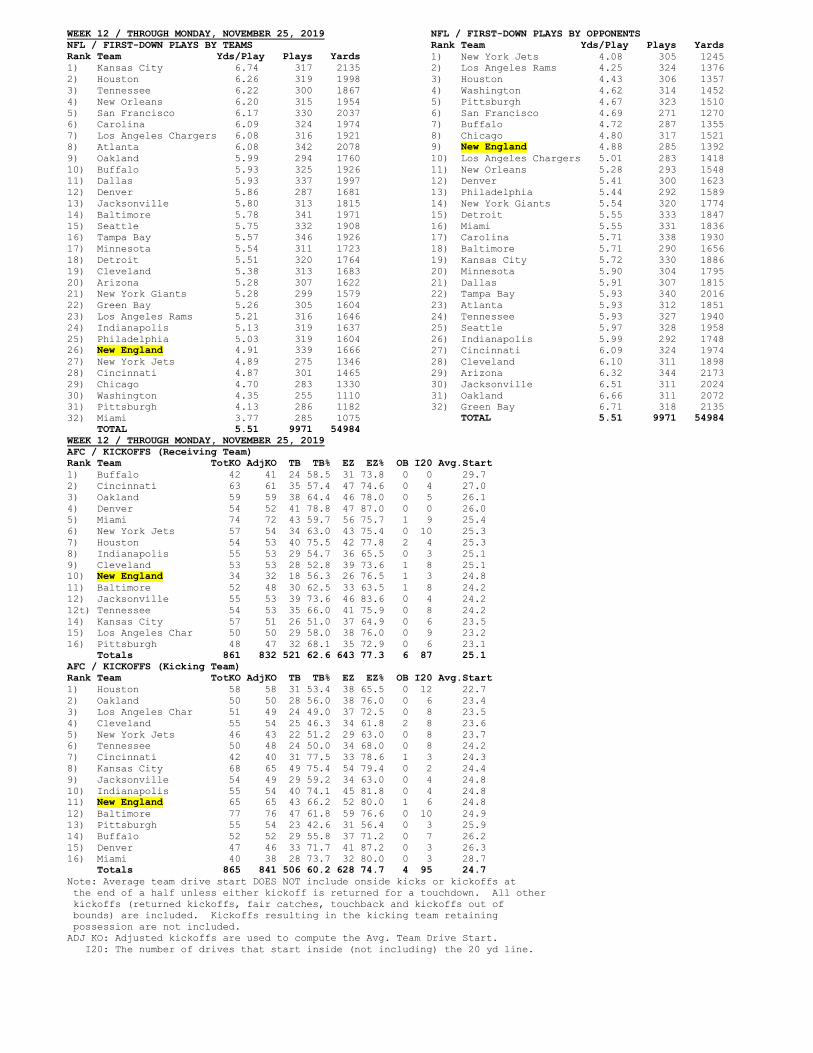
WEEK 12 / THROUGH MONDAY, NOVEMBER 25, 2019 NFL / FIRST-DOWN PLAYS BY TEAMS Rank Team Yds/Play Plays Yards 1) Kansas City 6.74 317 2135 2) Houston 6.26 319 1998 3) Tennessee 6.22 300 1867 4) New Orleans 6.20 315 1954 5) San Francisco 6.17 330 2037 6) Carolina 6.09 324 1974 7) Los Angeles Chargers 6.08 316 1921 8) Atlanta 6.08 342 2078 9) Oakland 5.99 294 1760 10) Buffalo 5.93 325 1926 11) Dallas 5.93 337 1997 12) Denver 5.86 287 1681 13) Jacksonville 5.80 313 1815 14) Baltimore 5.78 341 1971 15) Seattle 5.75 332 1908 16) Tampa Bay 5.57 346 1926 17) Minnesota 5.54 311 1723 18) Detroit 5.51 320 1764 19) Cleveland 5.38 313 1683 20) Arizona 5.28 307 1622 21) New York Giants 5.28 299 1579 22) Green Bay 5.26 305 1604 23) Los Angeles Rams 5.21 316 1646 24) Indianapolis 5.13 319 1637 25) Philadelphia 5.03 319 1604 26) New England 4.91 339 1666 27) New York Jets 4.89 275 1346 28) Cincinnati 4.87 301 1465 29) Chicago 4.70 283 1330 30) Washington 4.35 255 1110 31) Pittsburgh 4.13 286 1182 32) Miami 3.77 285 1075 TOTAL 5.51 9971 54984
NFL / FIRST-DOWN PLAYS BY OPPONENTS Rank Team Yds/Play Plays Yards 1) New York Jets 4.08 305 1245 2) Los Angeles Rams 4.25 324 1376 3) Houston 4.43 306 1357 4) Washington 4.62 314 1452 5) Pittsburgh 4.67 323 1510 6) San Francisco 4.69 271 1270 7) Buffalo 4.72 287 1355 8) Chicago 4.80 317 1521 9) New England 4.88 285 1392 10) Los Angeles Chargers 5.01 283 1418 11) New Orleans 5.28 293 1548 12) Denver 5.41 300 1623 13) Philadelphia 5.44 292 1589 14) New York Giants 5.54 320 1774 15) Detroit 5.55 333 1847 16) Miami 5.55 331 1836 17) Carolina 5.71 338 1930 18) Baltimore 5.71 290 1656 19) Kansas City 5.72 330 1886 20) Minnesota 5.90 304 1795 21) Dallas 5.91 307 1815 22) Tampa Bay 5.93 340 2016 23) Atlanta 5.93 312 1851 24) Tennessee 5.93 327 1940 25) Seattle 5.97 328 1958 26) Indianapolis 5.99 292 1748 27) Cincinnati 6.09 324 1974 28) Cleveland 6.10 311 1898 29) Arizona 6.32 344 2173 30) Jacksonville 6.51 311 2024 31) Oakland 6.66 311 2072 32) Green Bay 6.71 318 2135 TOTAL 5.51 9971 54984
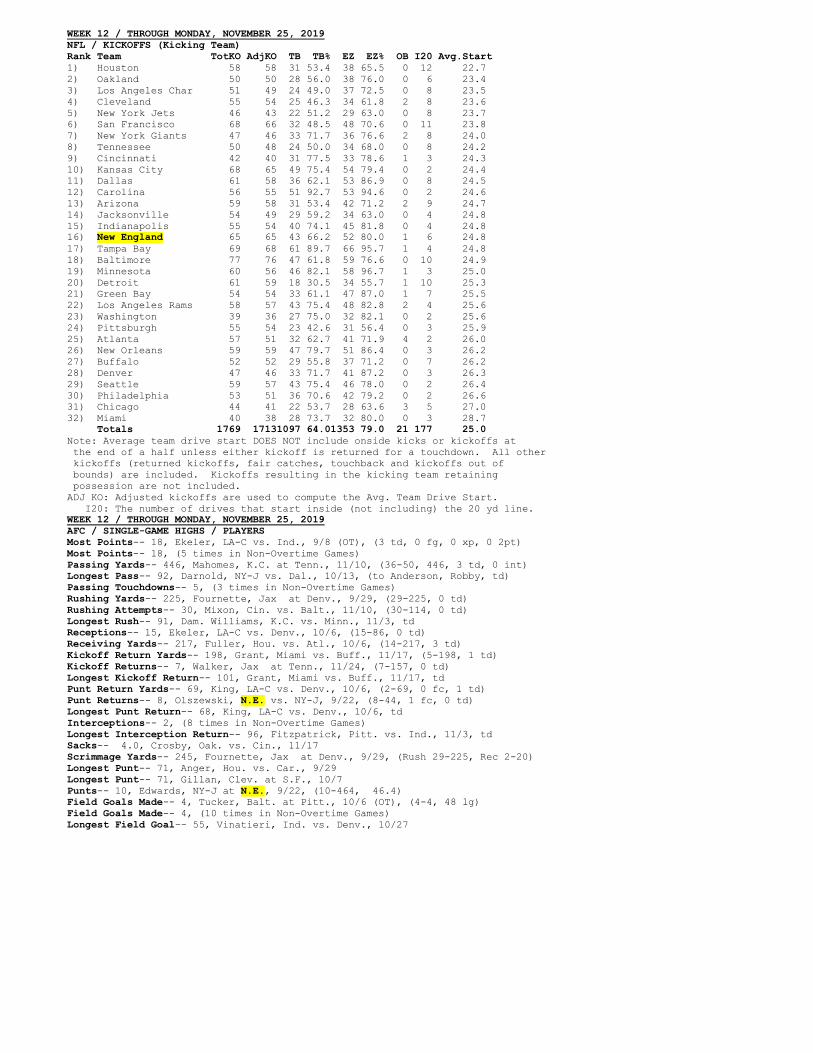
WEEK 12 / THROUGH MONDAY, NOVEMBER 25, 2019 AFC / KICKOFFS (Receiving Team) Rank Team TotKO AdjKO TB TB% EZ EZ% OB I20 Avg.Start 1) Buffalo 42 41 24 58.5 31 73.8 0 0 29.7 2) Cincinnati 63 61 35 57.4 47 74.6 0 4 27.0 3) Oakland 59 59 38 64.4 46 78.0 0 5 26.1 4) Denver 54 52 41 78.8 47 87.0 0 0 26.0 5) Miami 74 72 43 59.7 56 75.7 1 9 25.4 6) New York Jets 57 54 34 63.0 43 75.4 0 10 25.3 7) Houston 54 53 40 75.5 42 77.8 2 4 25.3 8) Indianapolis 55 53 29 54.7 36 65.5 0 3 25.1 9) Cleveland 53 53 28 52.8 39 73.6 1 8 25.1 10) New England 34 32 18 56.3 26 76.5 1 3 24.8 11) Baltimore 52 48 30 62.5 33 63.5 1 8 24.2 12) Jacksonville 55 53 39 73.6 46 83.6 0 4 24.2 12t) Tennessee 54 53 35 66.0 41 75.9 0 8 24.2 14) Kansas City 57 51 26 51.0 37 64.9 0 6 23.5 15) Los Angeles Char 50 50 29 58.0 38 76.0 0 9 23.2 16) Pittsburgh 48 47 32 68.1 35 72.9 0 6 23.1 Totals 861 832 521 62.6 643 77.3 6 87 25.1 AFC / KICKOFFS (Kicking Team) Rank Team TotKO AdjKO TB TB% EZ EZ% OB I20 Avg.Start 1) Houston 58 58 31 53.4 38 65.5 0 12 22.7 2) Oakland 50 50 28 56.0 38 76.0 0 6 23.4 3) Los Angeles Char 51 49 24 49.0 37 72.5 0 8 23.5 4) Cleveland 55 54 25 46.3 34 61.8 2 8 23.6 5) New York Jets 46 43 22 51.2 29 63.0 0 8 23.7 6) Tennessee 50 48 24 50.0 34 68.0 0 8 24.2 7) Cincinnati 42 40 31 77.5 33 78.6 1 3 24.3 8) Kansas City 68 65 49 75.4 54 79.4 0 2 24.4 9) Jacksonville 54 49 29 59.2 34 63.0 0 4 24.8 10) Indianapolis 55 54 40 74.1 45 81.8 0 4 24.8 11) New England 65 65 43 66.2 52 80.0 1 6 24.8 12) Baltimore 77 76 47 61.8 59 76.6 0 10 24.9 13) Pittsburgh 55 54 23 42.6 31 56.4 0 3 25.9 14) Buffalo 52 52 29 55.8 37 71.2 0 7 26.2 15) Denver 47 46 33 71.7 41 87.2 0 3 26.3 16) Miami 40 38 28 73.7 32 80.0 0 3 28.7 Totals 865 841 506 60.2 628 74.7 4 95 24.7 Note: Average team drive start DOES NOT include onside kicks or kickoffs at the end of a half unless either kickoff is returned for a touchdown. All other kickoffs (returned kickoffs, fair catches, touchback and kickoffs out of bounds) are included. Kickoffs resulting in the kicking team retaining possession are not included. ADJ KO: Adjusted kickoffs are used to compute the Avg. Team Drive Start. I20: The number of drives that start inside (not including) the 20 yd line.

WEEK 12 / THROUGH MONDAY, NOVEMBER 25, 2019 NFC / KICKOFFS (Receiving Team) Rank Team TotKO AdjKO TB TB% EZ EZ% OB I20 Avg.Start 1) Chicago 45 43 20 46.5 35 77.8 2 3 26.2 2) Washington 59 57 32 56.1 40 67.8 0 8 25.9 3) Minnesota 50 47 38 80.9 44 88.0 0 0 25.8 4) Detroit 61 58 38 65.5 49 80.3 1 5 25.8 5) Philadelphia 53 51 28 54.9 37 69.8 1 6 25.5 6) Carolina 64 63 36 57.1 48 75.0 1 9 25.4 7) Tampa Bay 71 70 54 77.1 60 84.5 2 4 25.2 8) New Orleans 53 49 34 69.4 41 77.4 2 3 24.9 9) Atlanta 63 62 46 74.2 54 85.7 1 7 24.6 10) Los Angeles Rams 54 52 40 76.9 43 79.6 1 3 24.6 11) Green Bay 55 55 30 54.5 35 63.6 2 5 24.5 12) New York Giants 64 62 31 50.0 50 78.1 1 12 24.5 13) Seattle 62 58 43 74.1 48 77.4 1 3 24.4 14) San Francisco 39 39 26 66.7 28 71.8 0 5 24.2 15) Arizona 65 65 43 66.2 57 87.7 0 8 23.8 16) Dallas 50 50 37 74.0 41 82.0 0 9 23.2 Totals 908 881 576 65.4 710 80.6 15 90 24.9 NFC / KICKOFFS (Kicking Team) Rank Team TotKO AdjKO TB TB% EZ EZ% OB I20 Avg.Start 1) San Francisco 68 66 32 48.5 48 70.6 0 11 23.8 2) New York Giants 47 46 33 71.7 36 76.6 2 8 24.0 3) Dallas 61 58 36 62.1 53 86.9 0 8 24.5 4) Carolina 56 55 51 92.7 53 94.6 0 2 24.6 5) Arizona 59 58 31 53.4 42 71.2 2 9 24.7 6) Tampa Bay 69 68 61 89.7 66 95.7 1 4 24.8 7) Minnesota 60 56 46 82.1 58 96.7 1 3 25.0 8) Detroit 61 59 18 30.5 34 55.7 1 10 25.3 9) Green Bay 54 54 33 61.1 47 87.0 1 7 25.5 10) Los Angeles Rams 58 57 43 75.4 48 82.8 2 4 25.6 11) Washington 39 36 27 75.0 32 82.1 0 2 25.6 12) Atlanta 57 51 32 62.7 41 71.9 4 2 26.0 13) New Orleans 59 59 47 79.7 51 86.4 0 3 26.2 14) Seattle 59 57 43 75.4 46 78.0 0 2 26.4 15) Philadelphia 53 51 36 70.6 42 79.2 0 2 26.6 16) Chicago 44 41 22 53.7 28 63.6 3 5 27.0 Totals 904 872 591 67.8 725 83.1 17 82 25.3 Note: Average team drive start DOES NOT include onside kicks or kickoffs at the end of a half unless either kickoff is returned for a touchdown. All other kickoffs (returned kickoffs, fair catches, touchback and kickoffs out of bounds) are included. Kickoffs resulting in the kicking team retaining possession are not included. ADJ KO: Adjusted kickoffs are used to compute the Avg. Team Drive Start. I20: The number of drives that start inside (not including) the 20 yd line. WEEK 12 / THROUGH MONDAY, NOVEMBER 25, 2019 NFL / KICKOFFS (Receiving Team) Rank Team TotKO AdjKO TB TB% EZ EZ% OB I20 Avg.Start 1) Buffalo 42 41 24 58.5 31 73.8 0 0 29.7 2) Cincinnati 63 61 35 57.4 47 74.6 0 4 27.0 3) Chicago 45 43 20 46.5 35 77.8 2 3 26.2 4) Oakland 59 59 38 64.4 46 78.0 0 5 26.1 5) Denver 54 52 41 78.8 47 87.0 0 0 26.0 6) Washington 59 57 32 56.1 40 67.8 0 8 25.9 7) Minnesota 50 47 38 80.9 44 88.0 0 0 25.8 8) Detroit 61 58 38 65.5 49 80.3 1 5 25.8 9) Philadelphia 53 51 28 54.9 37 69.8 1 6 25.5 10) Miami 74 72 43 59.7 56 75.7 1 9 25.4 11) Carolina 64 63 36 57.1 48 75.0 1 9 25.4 12) New York Jets 57 54 34 63.0 43 75.4 0 10 25.3 13) Houston 54 53 40 75.5 42 77.8 2 4 25.3 14) Tampa Bay 71 70 54 77.1 60 84.5 2 4 25.2 15) Indianapolis 55 53 29 54.7 36 65.5 0 3 25.1 16) Cleveland 53 53 28 52.8 39 73.6 1 8 25.1 17) New Orleans 53 49 34 69.4 41 77.4 2 3 24.9 18) New England 34 32 18 56.3 26 76.5 1 3 24.8 19) Atlanta 63 62 46 74.2 54 85.7 1 7 24.6 20) Los Angeles Rams 54 52 40 76.9 43 79.6 1 3 24.6 21) Green Bay 55 55 30 54.5 35 63.6 2 5 24.5 22) New York Giants 64 62 31 50.0 50 78.1 1 12 24.5 23) Seattle 62 58 43 74.1 48 77.4 1 3 24.4 24) San Francisco 39 39 26 66.7 28 71.8 0 5 24.2 25) Baltimore 52 48 30 62.5 33 63.5 1 8 24.2 26) Jacksonville 55 53 39 73.6 46 83.6 0 4 24.2 26t) Tennessee 54 53 35 66.0 41 75.9 0 8 24.2 28) Arizona 65 65 43 66.2 57 87.7 0 8 23.8 29) Kansas City 57 51 26 51.0 37 64.9 0 6 23.5 30) Dallas 50 50 37 74.0 41 82.0 0 9 23.2 30t) Los Angeles Char 50 50 29 58.0 38 76.0 0 9 23.2 32) Pittsburgh 48 47 32 68.1 35 72.9 0 6 23.1 Totals 1769 17131097 64.01353 79.0 21 177 25.0 Note: Average opponent drive start DOES NOT include onside kicks or kickoffs at the end of a half unless either kickoff is returned for a touchdown. All other kickoffs (returned kickoffs, fair catches, touchback and kickoffs out of bounds) are included. Kickoffs resulting in the kicking team retaining possession are not included. ADJ KO: Adjusted kickoffs are used to compute the Avg. Team Drive Start. I20: The number of drives that start inside (not including) the 20 yd line.
WEEK 12 / THROUGH MONDAY, NOVEMBER 25, 2019 NFL / KICKOFFS (Kicking Team) Rank Team TotKO AdjKO TB TB% EZ EZ% OB I20 Avg.Start 1) Houston 58 58 31 53.4 38 65.5 0 12 22.7 2) Oakland 50 50 28 56.0 38 76.0 0 6 23.4 3) Los Angeles Char 51 49 24 49.0 37 72.5 0 8 23.5 4) Cleveland 55 54 25 46.3 34 61.8 2 8 23.6 5) New York Jets 46 43 22 51.2 29 63.0 0 8 23.7 6) San Francisco 68 66 32 48.5 48 70.6 0 11 23.8 7) New York Giants 47 46 33 71.7 36 76.6 2 8 24.0 8) Tennessee 50 48 24 50.0 34 68.0 0 8 24.2 9) Cincinnati 42 40 31 77.5 33 78.6 1 3 24.3 10) Kansas City 68 65 49 75.4 54 79.4 0 2 24.4 11) Dallas 61 58 36 62.1 53 86.9 0 8 24.5 12) Carolina 56 55 51 92.7 53 94.6 0 2 24.6 13) Arizona 59 58 31 53.4 42 71.2 2 9 24.7 14) Jacksonville 54 49 29 59.2 34 63.0 0 4 24.8 15) Indianapolis 55 54 40 74.1 45 81.8 0 4 24.8 16) New England 65 65 43 66.2 52 80.0 1 6 24.8 17) Tampa Bay 69 68 61 89.7 66 95.7 1 4 24.8 18) Baltimore 77 76 47 61.8 59 76.6 0 10 24.9 19) Minnesota 60 56 46 82.1 58 96.7 1 3 25.0 20) Detroit 61 59 18 30.5 34 55.7 1 10 25.3 21) Green Bay 54 54 33 61.1 47 87.0 1 7 25.5 22) Los Angeles Rams 58 57 43 75.4 48 82.8 2 4 25.6 23) Washington 39 36 27 75.0 32 82.1 0 2 25.6 24) Pittsburgh 55 54 23 42.6 31 56.4 0 3 25.9 25) Atlanta 57 51 32 62.7 41 71.9 4 2 26.0 26) New Orleans 59 59 47 79.7 51 86.4 0 3 26.2 27) Buffalo 52 52 29 55.8 37 71.2 0 7 26.2 28) Denver 47 46 33 71.7 41 87.2 0 3 26.3 29) Seattle 59 57 43 75.4 46 78.0 0 2 26.4 30) Philadelphia 53 51 36 70.6 42 79.2 0 2 26.6 31) Chicago 44 41 22 53.7 28 63.6 3 5 27.0 32) Miami 40 38 28 73.7 32 80.0 0 3 28.7 Totals 1769 17131097 64.01353 79.0 21 177 25.0 Note: Average team drive start DOES NOT include onside kicks or kickoffs at the end of a half unless either kickoff is returned for a touchdown. All other kickoffs (returned kickoffs, fair catches, touchback and kickoffs out of bounds) are included. Kickoffs resulting in the kicking team retaining possession are not included. ADJ KO: Adjusted kickoffs are used to compute the Avg. Team Drive Start. I20: The number of drives that start inside (not including) the 20 yd line. WEEK 12 / THROUGH MONDAY, NOVEMBER 25, 2019 AFC / SINGLE-GAME HIGHS / PLAYERS Most Points-- 18, Ekeler, LA-C vs. Ind., 9/8 (OT), (3 td, 0 fg, 0 xp, 0 2pt) Most Points-- 18, (5 times in Non-Overtime Games) Passing Yards-- 446, Mahomes, K.C. at Tenn., 11/10, (36-50, 446, 3 td, 0 int) Longest Pass-- 92, Darnold, NY-J vs. Dal., 10/13, (to Anderson, Robby, td) Passing Touchdowns-- 5, (3 times in Non-Overtime Games) Rushing Yards-- 225, Fournette, Jax at Denv., 9/29, (29-225, 0 td) Rushing Attempts-- 30, Mixon, Cin. vs. Balt., 11/10, (30-114, 0 td) Longest Rush-- 91, Dam. Williams, K.C. vs. Minn., 11/3, td Receptions-- 15, Ekeler, LA-C vs. Denv., 10/6, (15-86, 0 td) Receiving Yards-- 217, Fuller, Hou. vs. Atl., 10/6, (14-217, 3 td) Kickoff Return Yards-- 198, Grant, Miami vs. Buff., 11/17, (5-198, 1 td) Kickoff Returns-- 7, Walker, Jax at Tenn., 11/24, (7-157, 0 td) Longest Kickoff Return-- 101, Grant, Miami vs. Buff., 11/17, td Punt Return Yards-- 69, King, LA-C vs. Denv., 10/6, (2-69, 0 fc, 1 td) Punt Returns-- 8, Olszewski, N.E. vs. NY-J, 9/22, (8-44, 1 fc, 0 td) Longest Punt Return-- 68, King, LA-C vs. Denv., 10/6, td Interceptions-- 2, (8 times in Non-Overtime Games) Longest Interception Return-- 96, Fitzpatrick, Pitt. vs. Ind., 11/3, td Sacks-- 4.0, Crosby, Oak. vs. Cin., 11/17 Scrimmage Yards-- 245, Fournette, Jax at Denv., 9/29, (Rush 29-225, Rec 2-20) Longest Punt-- 71, Anger, Hou. vs. Car., 9/29 Longest Punt-- 71, Gillan, Clev. at S.F., 10/7 Punts-- 10, Edwards, NY-J at N.E., 9/22, (10-464, 46.4) Field Goals Made-- 4, Tucker, Balt. at Pitt., 10/6 (OT), (4-4, 48 lg) Field Goals Made-- 4, (10 times in Non-Overtime Games) Longest Field Goal-- 55, Vinatieri, Ind. vs. Denv., 10/27
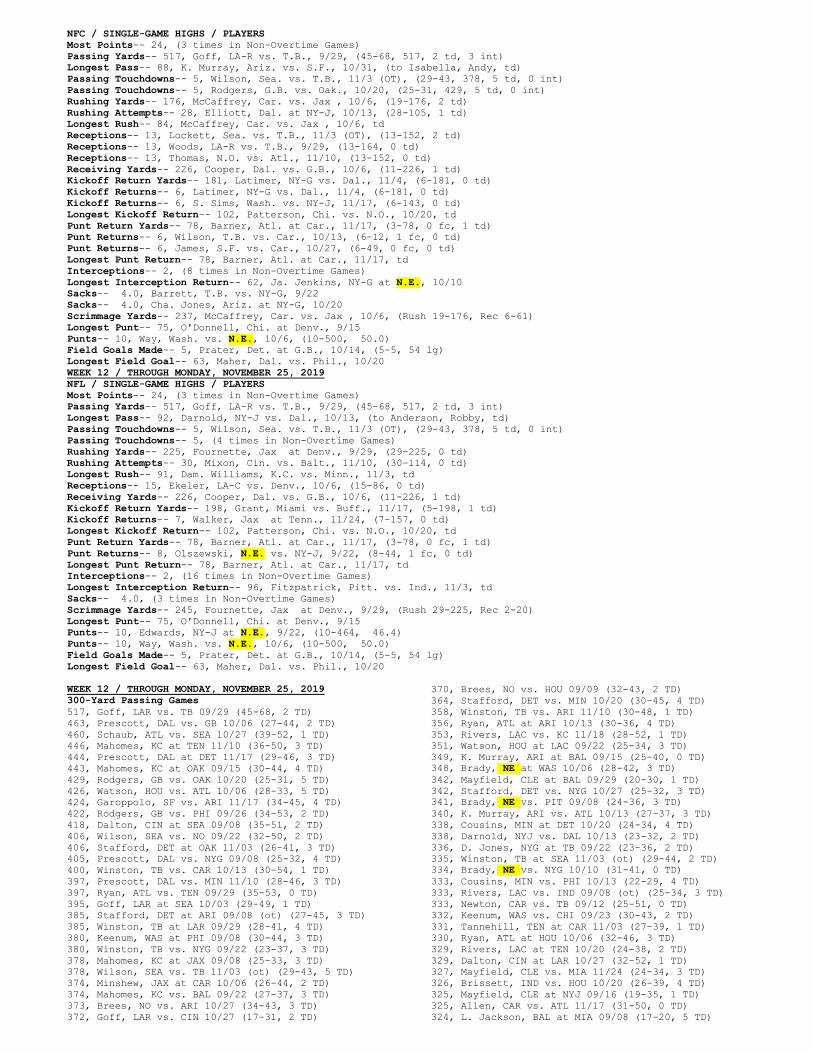
NFC / SINGLE-GAME HIGHS / PLAYERS Most Points-- 24, (3 times in Non-Overtime Games) Passing Yards-- 517, Goff, LA-R vs. T.B., 9/29, (45-68, 517, 2 td, 3 int) Longest Pass-- 88, K. Murray, Ariz. vs. S.F., 10/31, (to Isabella, Andy, td) Passing Touchdowns-- 5, Wilson, Sea. vs. T.B., 11/3 (OT), (29-43, 378, 5 td, 0 int) Passing Touchdowns-- 5, Rodgers, G.B. vs. Oak., 10/20, (25-31, 429, 5 td, 0 int) Rushing Yards-- 176, McCaffrey, Car. vs. Jax , 10/6, (19-176, 2 td) Rushing Attempts-- 28, Elliott, Dal. at NY-J, 10/13, (28-105, 1 td) Longest Rush-- 84, McCaffrey, Car. vs. Jax , 10/6, td Receptions-- 13, Lockett, Sea. vs. T.B., 11/3 (OT), (13-152, 2 td) Receptions-- 13, Woods, LA-R vs. T.B., 9/29, (13-164, 0 td) Receptions-- 13, Thomas, N.O. vs. Atl., 11/10, (13-152, 0 td) Receiving Yards-- 226, Cooper, Dal. vs. G.B., 10/6, (11-226, 1 td) Kickoff Return Yards-- 181, Latimer, NY-G vs. Dal., 11/4, (6-181, 0 td) Kickoff Returns-- 6, Latimer, NY-G vs. Dal., 11/4, (6-181, 0 td) Kickoff Returns-- 6, S. Sims, Wash. vs. NY-J, 11/17, (6-143, 0 td) Longest Kickoff Return-- 102, Patterson, Chi. vs. N.O., 10/20, td Punt Return Yards-- 78, Barner, Atl. at Car., 11/17, (3-78, 0 fc, 1 td) Punt Returns-- 6, Wilson, T.B. vs. Car., 10/13, (6-12, 1 fc, 0 td) Punt Returns-- 6, James, S.F. vs. Car., 10/27, (6-49, 0 fc, 0 td) Longest Punt Return-- 78, Barner, Atl. at Car., 11/17, td Interceptions-- 2, (8 times in Non-Overtime Games) Longest Interception Return-- 62, Ja. Jenkins, NY-G at N.E., 10/10 Sacks-- 4.0, Barrett, T.B. vs. NY-G, 9/22 Sacks-- 4.0, Cha. Jones, Ariz. at NY-G, 10/20 Scrimmage Yards-- 237, McCaffrey, Car. vs. Jax , 10/6, (Rush 19-176, Rec 6-61) Longest Punt-- 75, O'Donnell, Chi. at Denv., 9/15 Punts-- 10, Way, Wash. vs. N.E., 10/6, (10-500, 50.0) Field Goals Made-- 5, Prater, Det. at G.B., 10/14, (5-5, 54 lg) Longest Field Goal-- 63, Maher, Dal. vs. Phil., 10/20 WEEK 12 / THROUGH MONDAY, NOVEMBER 25, 2019 NFL / SINGLE-GAME HIGHS / PLAYERS Most Points-- 24, (3 times in Non-Overtime Games) Passing Yards-- 517, Goff, LA-R vs. T.B., 9/29, (45-68, 517, 2 td, 3 int) Longest Pass-- 92, Darnold, NY-J vs. Dal., 10/13, (to Anderson, Robby, td) Passing Touchdowns-- 5, Wilson, Sea. vs. T.B., 11/3 (OT), (29-43, 378, 5 td, 0 int) Passing Touchdowns-- 5, (4 times in Non-Overtime Games) Rushing Yards-- 225, Fournette, Jax at Denv., 9/29, (29-225, 0 td) Rushing Attempts-- 30, Mixon, Cin. vs. Balt., 11/10, (30-114, 0 td) Longest Rush-- 91, Dam. Williams, K.C. vs. Minn., 11/3, td Receptions-- 15, Ekeler, LA-C vs. Denv., 10/6, (15-86, 0 td) Receiving Yards-- 226, Cooper, Dal. vs. G.B., 10/6, (11-226, 1 td) Kickoff Return Yards-- 198, Grant, Miami vs. Buff., 11/17, (5-198, 1 td) Kickoff Returns-- 7, Walker, Jax at Tenn., 11/24, (7-157, 0 td) Longest Kickoff Return-- 102, Patterson, Chi. vs. N.O., 10/20, td Punt Return Yards-- 78, Barner, Atl. at Car., 11/17, (3-78, 0 fc, 1 td) Punt Returns-- 8, Olszewski, N.E. vs. NY-J, 9/22, (8-44, 1 fc, 0 td) Longest Punt Return-- 78, Barner, Atl. at Car., 11/17, td Interceptions-- 2, (16 times in Non-Overtime Games) Longest Interception Return-- 96, Fitzpatrick, Pitt. vs. Ind., 11/3, td Sacks-- 4.0, (3 times in Non-Overtime Games) Scrimmage Yards-- 245, Fournette, Jax at Denv., 9/29, (Rush 29-225, Rec 2-20) Longest Punt-- 75, O'Donnell, Chi. at Denv., 9/15 Punts-- 10, Edwards, NY-J at N.E., 9/22, (10-464, 46.4) Punts-- 10, Way, Wash. vs. N.E., 10/6, (10-500, 50.0) Field Goals Made-- 5, Prater, Det. at G.B., 10/14, (5-5, 54 lg) Longest Field Goal-- 63, Maher, Dal. vs. Phil., 10/20 WEEK 12 / THROUGH MONDAY, NOVEMBER 25, 2019 300-Yard Passing Games 517, Goff, LAR vs. TB 09/29 (45-68, 2 TD) 463, Prescott, DAL vs. GB 10/06 (27-44, 2 TD) 460, Schaub, ATL vs. SEA 10/27 (39-52, 1 TD) 446, Mahomes, KC at TEN 11/10 (36-50, 3 TD) 444, Prescott, DAL at DET 11/17 (29-46, 3 TD) 443, Mahomes, KC at OAK 09/15 (30-44, 4 TD) 429, Rodgers, GB vs. OAK 10/20 (25-31, 5 TD) 426, Watson, HOU vs. ATL 10/06 (28-33, 5 TD) 424, Garoppolo, SF vs. ARI 11/17 (34-45, 4 TD) 422, Rodgers, GB vs. PHI 09/26 (34-53, 2 TD) 418, Dalton, CIN at SEA 09/08 (35-51, 2 TD) 406, Wilson, SEA vs. NO 09/22 (32-50, 2 TD) 406, Stafford, DET at OAK 11/03 (26-41, 3 TD) 405, Prescott, DAL vs. NYG 09/08 (25-32, 4 TD) 400, Winston, TB vs. CAR 10/13 (30-54, 1 TD) 397, Prescott, DAL vs. MIN 11/10 (28-46, 3 TD) 397, Ryan, ATL vs. TEN 09/29 (35-53, 0 TD) 395, Goff, LAR at SEA 10/03 (29-49, 1 TD) 385, Stafford, DET at ARI 09/08 (ot) (27-45, 3 TD) 385, Winston, TB at LAR 09/29 (28-41, 4 TD) 380, Keenum, WAS at PHI 09/08 (30-44, 3 TD) 380, Winston, TB vs. NYG 09/22 (23-37, 3 TD) 378, Mahomes, KC at JAX 09/08 (25-33, 3 TD) 378, Wilson, SEA vs. TB 11/03 (ot) (29-43, 5 TD) 374, Minshew, JAX at CAR 10/06 (26-44, 2 TD) 374, Mahomes, KC vs. BAL 09/22 (27-37, 3 TD) 373, Brees, NO vs. ARI 10/27 (34-43, 3 TD) 372, Goff, LAR vs. CIN 10/27 (17-31, 2 TD)
370, Brees, NO vs. HOU 09/09 (32-43, 2 TD) 364, Stafford, DET vs. MIN 10/20 (30-45, 4 TD) 358, Winston, TB vs. ARI 11/10 (30-48, 1 TD) 356, Ryan, ATL at ARI 10/13 (30-36, 4 TD) 353, Rivers, LAC vs. KC 11/18 (28-52, 1 TD) 351, Watson, HOU at LAC 09/22 (25-34, 3 TD) 349, K. Murray, ARI at BAL 09/15 (25-40, 0 TD) 348, Brady, NE at WAS 10/06 (28-42, 3 TD) 342, Mayfield, CLE at BAL 09/29 (20-30, 1 TD) 342, Stafford, DET vs. NYG 10/27 (25-32, 3 TD) 341, Brady, NE vs. PIT 09/08 (24-36, 3 TD) 340, K. Murray, ARI vs. ATL 10/13 (27-37, 3 TD) 338, Cousins, MIN at DET 10/20 (24-34, 4 TD) 338, Darnold, NYJ vs. DAL 10/13 (23-32, 2 TD) 336, D. Jones, NYG at TB 09/22 (23-36, 2 TD) 335, Winston, TB at SEA 11/03 (ot) (29-44, 2 TD) 334, Brady, NE vs. NYG 10/10 (31-41, 0 TD) 333, Cousins, MIN vs. PHI 10/13 (22-29, 4 TD) 333, Rivers, LAC vs. IND 09/08 (ot) (25-34, 3 TD) 333, Newton, CAR vs. TB 09/12 (25-51, 0 TD) 332, Keenum, WAS vs. CHI 09/23 (30-43, 2 TD) 331, Tannehill, TEN at CAR 11/03 (27-39, 1 TD) 330, Ryan, ATL at HOU 10/06 (32-46, 3 TD) 329, Rivers, LAC at TEN 10/20 (24-38, 2 TD) 329, Dalton, CIN at LAR 10/27 (32-52, 1 TD) 327, Mayfield, CLE vs. MIA 11/24 (24-34, 3 TD) 326, Brissett, IND vs. HOU 10/20 (26-39, 4 TD) 325, Mayfield, CLE at NYJ 09/16 (19-35, 1 TD) 325, Allen, CAR vs. ATL 11/17 (31-50, 0 TD) 324, L. Jackson, BAL at MIA 09/08 (17-20, 5 TD)
300-Yard Passing Games (CONTINUED) 324, K. Murray, ARI at TB 11/10 (27-44, 3 TD) 323, R. Fitzpatrick, MIA vs. BUF 11/17 (32-45, 0 TD) 322, D. Jones, NYG at DET 10/27 (28-41, 4 TD) 321, Mahomes, KC vs. IND 10/06 (22-39, 1 TD) 320, Rivers, LAC vs. PIT 10/13 (26-44, 2 TD) 320, Ryan, ATL vs. PHI 09/15 (27-43, 3 TD) 319, Cousins, MIN vs. DEN 11/17 (29-35, 3 TD) 318, Rivers, LAC vs. HOU 09/22 (31-46, 2 TD) 317, Garoppolo, SF at ARI 10/31 (28-37, 4 TD) 315, Mahomes, KC at DET 09/29 (24-42, 0 TD) 315, Darnold, NYJ vs. OAK 11/24 (20-29, 2 TD) 314, Bridgewater, NO vs. TB 10/06 (26-34, 4 TD) 313, Wentz, PHI vs. WAS 09/08 (28-39, 3 TD) 313, Winston, TB at ATL 11/24 (18-28, 3 TD) 313, Winston, TB vs. NO 11/17 (30-51, 2 TD) 312, Tannehill, TEN vs. LAC 10/20 (23-29, 2 TD) 311, Dalton, CIN vs. SF 09/15 (26-42, 2 TD) 311, Ryan, ATL at CAR 11/17 (21-31, 1 TD) 311, Brees, NO vs. CAR 11/24 (30-39, 3 TD) 310, Rivers, LAC at MIA 09/29 (24-30, 2 TD) 310, Brissett, IND vs. ATL 09/22 (28-37, 2 TD) 309, Minshew, JAX vs. HOU 11/03 (27-47, 0 TD) 308, K. Murray, ARI vs. DET 09/08 (ot) (29-54, 2 TD) 308, Watson, HOU at IND 10/20 (23-34, 1 TD) 308, D. Jones, NYG at NYJ 11/10 (26-40, 4 TD) 307, Allen, CAR at GB 11/10 (28-43, 1 TD) 306, Wentz, PHI at MIN 10/13 (26-40, 2 TD) 306, Manning, NYG at DAL 09/08 (30-44, 1 TD) 306, Cousins, MIN at NYG 10/06 (22-27, 2 TD) 306, Brady, NE vs. NYJ 09/22 (28-42, 2 TD) 305, Rodgers, GB at KC 10/27 (23-33, 3 TD) 304, Mariota, TEN at JAX 09/19 (23-40, 0 TD) 304, Ryan, ATL at IND 09/22 (29-34, 3 TD) 304, Ryan, ATL at MIN 09/08 (33-46, 2 TD) 303, Flacco, DEN vs. JAX 09/29 (22-38, 3 TD) 301, Winston, TB at TEN 10/27 (21-43, 2 TD) 300, Wilson, SEA at PIT 09/15 (29-35, 3 TD) WEEK 12 / THROUGH MONDAY, NOVEMBER 25, 2019 100-Yard Receiving Games 226, Cooper, DAL vs. GB 10/06 (11 rec., 1 TD) 220, C. Kupp, LAR vs. CIN 10/27 (7 rec., 1 TD) 217, Fuller, HOU vs. ATL 10/06 (14 rec., 3 TD) 198, M. Evans, TB at TEN 10/27 (11 rec., 2 TD) 198, Watkins, KC at JAX 09/08 (9 rec., 3 TD) 190, M. Evans, TB vs. NYG 09/22 (8 rec., 3 TD) 184, Godwin, TB at ATL 11/24 (7 rec., 2 TD) 183, K. Allen, LAC vs. HOU 09/22 (13 rec., 2 TD) 182, Thomas, NO vs. TB 10/06 (11 rec., 2 TD) 180, M. Evans, TB at SEA 11/03 (ot) (12 rec., 1 TD) 180, D. Adams, GB vs. PHI 09/26 (10 rec., 0 TD) 172, Godwin, TB at LAR 09/29 (12 rec., 2 TD) 172, Robinson, KC at OAK 09/15 (6 rec., 2 TD) 167, Landry, CLE at BAL 09/29 (8 rec., 0 TD) 167, Diggs, MIN vs. PHI 10/13 (7 rec., 3 TD) 164, Woods, LAR vs. TB 09/29 (13 rec., 0 TD) 164, Chark, JAX at CAR 10/06 (8 rec., 2 TD) 161, Beckham, CLE at NYJ 09/16 (6 rec., 1 TD) 159, A. Jones, GB at KC 10/27 (7 rec., 2 TD) 158, Ross, CIN at SEA 09/08 (7 rec., 2 TD) 158, Gallup, DAL vs. NYG 09/08 (7 rec., 0 TD) 157, Hill, KC at TEN 11/10 (11 rec., 1 TD) 154, D. Jackson, PHI vs. WAS 09/08 (8 rec., 2 TD) 154, Lockett, SEA vs. NO 09/22 (11 rec., 1 TD) 152, J. Jones, ATL vs. SEA 10/27 (10 rec., 0 TD) 152, Thomas, NO vs. ATL 11/10 (13 rec., 0 TD) 152, Lockett, SEA vs. TB 11/03 (ot) (13 rec., 2 TD) 151, Godwin, TB vs. CAR 10/13 (10 rec., 0 TD) 148, Gallup, DAL at DET 11/17 (9 rec., 0 TD) 148, Landry, CLE vs. MIA 11/24 (10 rec., 2 TD) 147, Cooper, DAL vs. MIN 11/10 (11 rec., 1 TD) 147, M. Brown, BAL at MIA 09/08 (4 rec., 2 TD) 146, Chark, JAX vs. KC 09/08 (4 rec., 1 TD) 143, Diggs, MIN vs. WAS 10/24 (7 rec., 0 TD) 143, Ridley, ATL at CAR 11/17 (8 rec., 1 TD) 143, Diggs, MIN at DET 10/20 (7 rec., 0 TD) 140, Fuller, HOU vs. IND 11/21 (7 rec., 0 TD) 140, Hill, KC vs. MIN 11/03 (6 rec., 1 TD) 138, Kirk, ARI at TB 11/10 (6 rec., 3 TD) 137, Erickson, CIN vs. JAX 10/20 (8 rec., 0 TD) 137, Brown, BUF at MIA 11/17 (9 rec., 2 TD) 136, Everett, LAR at SEA 10/03 (7 rec., 0 TD) 135, A. Brown, TEN vs. JAX 11/24 (4 rec., 1 TD) 135, D. Parker, MIA vs. BUF 11/17 (7 rec., 0 TD) 134, Waller, OAK at MIN 09/22 (13 rec., 0 TD) 134, Samuel, SF vs. ARI 11/17 (8 rec., 0 TD) 133, Valdes-Scantling, GB vs. OAK 10/20 (2 rec., 1 TD) 132, Golladay, DET at OAK 11/03 (4 rec., 1 TD)
131, Thomas, NO at CHI 10/20 (9 rec., 0 TD) 131, Hockenson, DET at ARI 09/08 (ot) (6 rec., 1 TD) 131, Robinson, CHI vs. NYG 11/24 (6 rec., 1 TD) 130, Thielen, MIN at NYG 10/06 (7 rec., 2 TD) 130, Hooper, ATL vs. TEN 09/29 (9 rec., 0 TD) 129, Kittle, SF vs. GB 11/24 (6 rec., 1 TD) 128, J. Jones, ATL at IND 09/22 (8 rec., 1 TD) 126, M. Jones, DET at OAK 11/03 (8 rec., 1 TD) 126, Moore, CAR at NO 11/24 (6 rec., 2 TD) 126, Waller, OAK at GB 10/20 (7 rec., 2 TD) 125, R. Anderson, NYJ vs. DAL 10/13 (5 rec., 1 TD) 125, Godwin, TB at NO 10/06 (7 rec., 2 TD) 125, McLaurin, WAS at PHI 09/08 (5 rec., 1 TD) 123, K. Allen, LAC vs. IND 09/08 (ot) (8 rec., 1 TD) 123, Brown, BUF at NYJ 09/08 (7 rec., 1 TD) 123, Thomas, NO vs. HOU 09/09 (10 rec., 0 TD) 123, Golladay, DET vs. NYG 10/27 (6 rec., 2 TD) 123, T. Boyd, CIN vs. ARI 10/06 (10 rec., 1 TD) 123, Metcalf, SEA vs. TB 11/03 (ot) (6 rec., 1 TD) 122, T. Boyd, CIN vs. SF 09/15 (10 rec., 0 TD) 121, Diggs, MIN vs. DEN 11/17 (5 rec., 1 TD) 121, D. Slayton, NYG at NYJ 11/10 (10 rec., 2 TD) 121, Golladay, DET at GB 10/14 (5 rec., 0 TD) 121, C. Kupp, LAR vs. TB 09/29 (9 rec., 1 TD) 121, Godwin, TB at CAR 09/12 (8 rec., 1 TD) 121, McCaffrey, CAR vs. ATL 11/17 (11 rec., 0 TD) 120, Moore, CAR at GB 11/10 (9 rec., 0 TD) 120, Sutton, DEN at OAK 09/09 (7 rec., 0 TD) 120, C. Kupp, LAR vs. NO 09/15 (5 rec., 0 TD) 118, D. Adams, GB vs. CAR 11/10 (7 rec., 0 TD) 118, Ekeler, LAC at TEN 10/20 (7 rec., 1 TD) 117, C. Kupp, LAR at SEA 10/03 (9 rec., 1 TD) 117, Hooper, ATL at ARI 10/13 (8 rec., 1 TD) 117, Golladay, DET vs. LAC 09/15 (8 rec., 1 TD) 116, Engram, NYG at DAL 09/08 (11 rec., 1 TD) 115, Fant, DEN vs. CLE 11/03 (3 rec., 1 TD) 115, Cobb, DAL at DET 11/17 (4 rec., 1 TD) 114, Thomas, NO at TB 11/17 (8 rec., 1 TD) 114, Kirk, ARI at BAL 09/15 (6 rec., 0 TD) 113, Gallup, DAL vs. GB 10/06 (7 rec., 1 TD) 113, Engram, NYG at TB 09/22 (6 rec., 1 TD) 113, Fitzgerald, ARI vs. DET 09/08 (ot) (8 rec., 1 TD) 113, Edelman, NE vs. NYG 10/10 (9 rec., 0 TD) 113, Sutton, DEN at MIN 11/17 (5 rec., 0 TD) 112, Thomas, NO vs. ARI 10/27 (11 rec., 1 TD) 112, Ross, CIN vs. SF 09/15 (4 rec., 1 TD) 112, Andrews, BAL vs. ARI 09/15 (8 rec., 1 TD) 112, Sanders, SF at ARI 10/31 (7 rec., 1 TD) 112, Cooks, LAR at CLE 09/22 (8 rec., 0 TD) 112, Samuel, SF vs. SEA 11/11 (ot) (8 rec., 0 TD) 111, M. Williams, LAC vs. GB 11/03 (3 rec., 0 TD) 111, Hopkins, HOU at NO 09/09 (8 rec., 2 TD) 110, Edelman, NE at WAS 10/06 (8 rec., 1 TD) 110, Olsen, CAR vs. TB 09/12 (6 rec., 0 TD) 109, Griffin, NYJ at WAS 11/17 (5 rec., 1 TD) 109, Hopkins, HOU vs. OAK 10/27 (11 rec., 0 TD) 108, Andrews, BAL at MIA 09/08 (8 rec., 1 TD) 108, Ekeler, LAC vs. KC 11/18 (8 rec., 0 TD) 108, Diggs, MIN at CHI 09/29 (7 rec., 0 TD) 108, J. Jones, ATL at ARI 10/13 (8 rec., 0 TD) 107, Kelce, KC at OAK 09/15 (7 rec., 1 TD) 107, Agholor, PHI at ATL 09/15 (8 rec., 1 TD) 106, D. Adams, GB vs. MIN 09/15 (7 rec., 0 TD) 106, Pascal, IND vs. HOU 10/20 (6 rec., 2 TD) 106, Cooper, DAL vs. PHI 10/20 (5 rec., 0 TD) 106, Cooper, DAL vs. NYG 09/08 (6 rec., 1 TD) 106, Cobb, DAL vs. MIN 11/10 (6 rec., 1 TD) 106, Hopkins, HOU at IND 10/20 (9 rec., 1 TD) 106, J. Jones, ATL vs. PHI 09/15 (5 rec., 2 TD) 105, Amendola, DET vs. MIN 10/20 (8 rec., 0 TD) 105, Ridley, ATL vs. PHI 09/15 (8 rec., 1 TD) 105, Williams, OAK vs. DEN 09/09 (6 rec., 1 TD) 105, Stills, HOU at IND 10/20 (4 rec., 0 TD) 104, Amendola, DET at ARI 09/08 (ot) (7 rec., 1 TD) 104, Sanders, DEN vs. JAX 09/29 (5 rec., 0 TD) 104, Chark, JAX at IND 11/17 (8 rec., 2 TD) 104, Fitzgerald, ARI at BAL 09/15 (5 rec., 0 TD) 103, Ertz, PHI vs. CHI 11/03 (9 rec., 1 TD) 103, Pringle, KC vs. IND 10/06 (6 rec., 1 TD) 103, Westbrook, JAX at CIN 10/20 (6 rec., 0 TD) 103, Smith-Schuster, PIT vs. MIA 10/28 (5 rec., 1 TD) 103, Conley, JAX vs. NYJ 10/27 (4 rec., 1 TD) 103, Kittle, SF at LAR 10/13 (8 rec., 0 TD) 102, Tate, NYG at NE 10/10 (6 rec., 1 TD) 102, Robinson, CHI vs. GB 09/05 (7 rec., 0 TD) 101, Beckham, CLE vs. SEA 10/13 (6 rec., 0 TD) 101, M. Jones, DET at PHI 09/22 (6 rec., 1 TD) 101, Ginn, NO vs. HOU 09/09 (7 rec., 0 TD)
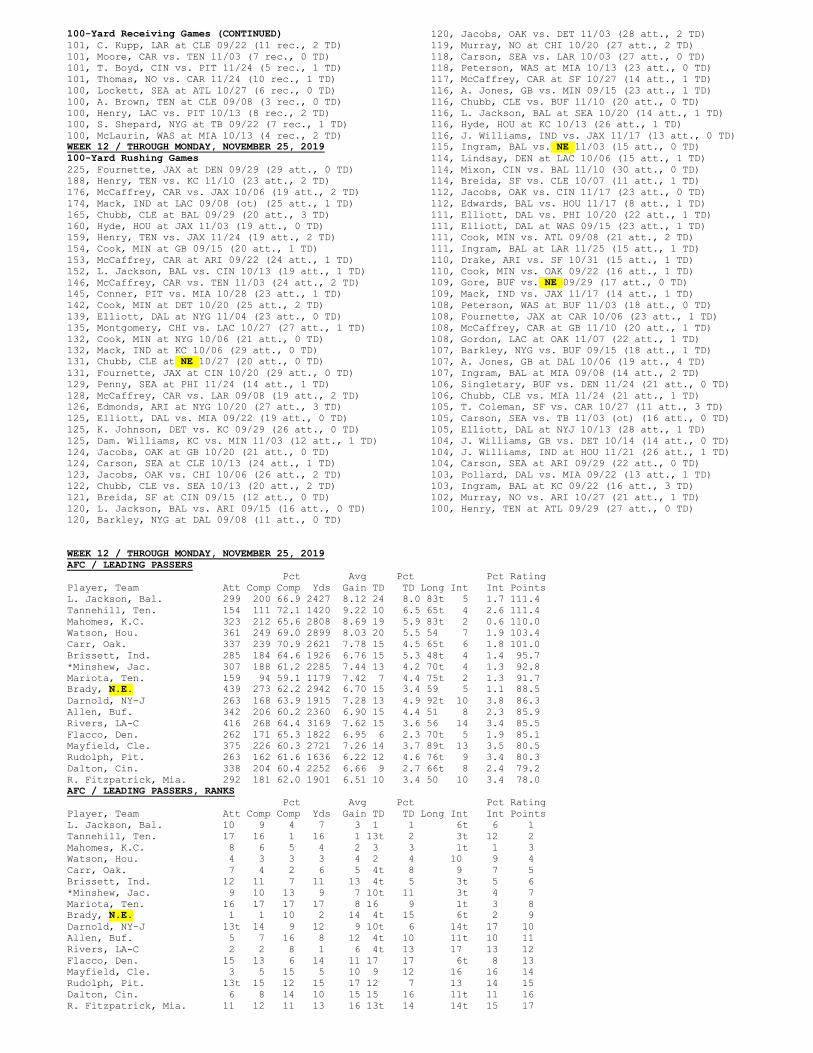
100-Yard Receiving Games (CONTINUED) 101, C. Kupp, LAR at CLE 09/22 (11 rec., 2 TD) 101, Moore, CAR vs. TEN 11/03 (7 rec., 0 TD) 101, T. Boyd, CIN vs. PIT 11/24 (5 rec., 1 TD) 101, Thomas, NO vs. CAR 11/24 (10 rec., 1 TD) 100, Lockett, SEA at ATL 10/27 (6 rec., 0 TD) 100, A. Brown, TEN at CLE 09/08 (3 rec., 0 TD) 100, Henry, LAC vs. PIT 10/13 (8 rec., 2 TD) 100, S. Shepard, NYG at TB 09/22 (7 rec., 1 TD) 100, McLaurin, WAS at MIA 10/13 (4 rec., 2 TD) WEEK 12 / THROUGH MONDAY, NOVEMBER 25, 2019 100-Yard Rushing Games 225, Fournette, JAX at DEN 09/29 (29 att., 0 TD) 188, Henry, TEN vs. KC 11/10 (23 att., 2 TD) 176, McCaffrey, CAR vs. JAX 10/06 (19 att., 2 TD) 174, Mack, IND at LAC 09/08 (ot) (25 att., 1 TD) 165, Chubb, CLE at BAL 09/29 (20 att., 3 TD) 160, Hyde, HOU at JAX 11/03 (19 att., 0 TD) 159, Henry, TEN vs. JAX 11/24 (19 att., 2 TD) 154, Cook, MIN at GB 09/15 (20 att., 1 TD) 153, McCaffrey, CAR at ARI 09/22 (24 att., 1 TD) 152, L. Jackson, BAL vs. CIN 10/13 (19 att., 1 TD) 146, McCaffrey, CAR vs. TEN 11/03 (24 att., 2 TD) 145, Conner, PIT vs. MIA 10/28 (23 att., 1 TD) 142, Cook, MIN at DET 10/20 (25 att., 2 TD) 139, Elliott, DAL at NYG 11/04 (23 att., 0 TD) 135, Montgomery, CHI vs. LAC 10/27 (27 att., 1 TD) 132, Cook, MIN at NYG 10/06 (21 att., 0 TD) 132, Mack, IND at KC 10/06 (29 att., 0 TD) 131, Chubb, CLE at NE 10/27 (20 att., 0 TD) 131, Fournette, JAX at CIN 10/20 (29 att., 0 TD) 129, Penny, SEA at PHI 11/24 (14 att., 1 TD) 128, McCaffrey, CAR vs. LAR 09/08 (19 att., 2 TD) 126, Edmonds, ARI at NYG 10/20 (27 att., 3 TD) 125, Elliott, DAL vs. MIA 09/22 (19 att., 0 TD) 125, K. Johnson, DET vs. KC 09/29 (26 att., 0 TD) 125, Dam. Williams, KC vs. MIN 11/03 (12 att., 1 TD) 124, Jacobs, OAK at GB 10/20 (21 att., 0 TD) 124, Carson, SEA at CLE 10/13 (24 att., 1 TD) 123, Jacobs, OAK vs. CHI 10/06 (26 att., 2 TD) 122, Chubb, CLE vs. SEA 10/13 (20 att., 2 TD) 121, Breida, SF at CIN 09/15 (12 att., 0 TD) 120, L. Jackson, BAL vs. ARI 09/15 (16 att., 0 TD) 120, Barkley, NYG at DAL 09/08 (11 att., 0 TD)
120, Jacobs, OAK vs. DET 11/03 (28 att., 2 TD) 119, Murray, NO at CHI 10/20 (27 att., 2 TD) 118, Carson, SEA vs. LAR 10/03 (27 att., 0 TD) 118, Peterson, WAS at MIA 10/13 (23 att., 0 TD) 117, McCaffrey, CAR at SF 10/27 (14 att., 1 TD) 116, A. Jones, GB vs. MIN 09/15 (23 att., 1 TD) 116, Chubb, CLE vs. BUF 11/10 (20 att., 0 TD) 116, L. Jackson, BAL at SEA 10/20 (14 att., 1 TD) 116, Hyde, HOU at KC 10/13 (26 att., 1 TD) 116, J. Williams, IND vs. JAX 11/17 (13 att., 0 TD) 115, Ingram, BAL vs. NE 11/03 (15 att., 0 TD) 114, Lindsay, DEN at LAC 10/06 (15 att., 1 TD) 114, Mixon, CIN vs. BAL 11/10 (30 att., 0 TD) 114, Breida, SF vs. CLE 10/07 (11 att., 1 TD) 112, Jacobs, OAK vs. CIN 11/17 (23 att., 0 TD) 112, Edwards, BAL vs. HOU 11/17 (8 att., 1 TD) 111, Elliott, DAL vs. PHI 10/20 (22 att., 1 TD) 111, Elliott, DAL at WAS 09/15 (23 att., 1 TD) 111, Cook, MIN vs. ATL 09/08 (21 att., 2 TD) 111, Ingram, BAL at LAR 11/25 (15 att., 1 TD) 110, Drake, ARI vs. SF 10/31 (15 att., 1 TD) 110, Cook, MIN vs. OAK 09/22 (16 att., 1 TD) 109, Gore, BUF vs. NE 09/29 (17 att., 0 TD) 109, Mack, IND vs. JAX 11/17 (14 att., 1 TD) 108, Peterson, WAS at BUF 11/03 (18 att., 0 TD) 108, Fournette, JAX at CAR 10/06 (23 att., 1 TD) 108, McCaffrey, CAR at GB 11/10 (20 att., 1 TD) 108, Gordon, LAC at OAK 11/07 (22 att., 1 TD) 107, Barkley, NYG vs. BUF 09/15 (18 att., 1 TD) 107, A. Jones, GB at DAL 10/06 (19 att., 4 TD) 107, Ingram, BAL at MIA 09/08 (14 att., 2 TD) 106, Singletary, BUF vs. DEN 11/24 (21 att., 0 TD) 106, Chubb, CLE vs. MIA 11/24 (21 att., 1 TD) 105, T. Coleman, SF vs. CAR 10/27 (11 att., 3 TD) 105, Carson, SEA vs. TB 11/03 (ot) (16 att., 0 TD) 105, Elliott, DAL at NYJ 10/13 (28 att., 1 TD) 104, J. Williams, GB vs. DET 10/14 (14 att., 0 TD) 104, J. Williams, IND at HOU 11/21 (26 att., 1 TD) 104, Carson, SEA at ARI 09/29 (22 att., 0 TD) 103, Pollard, DAL vs. MIA 09/22 (13 att., 1 TD) 103, Ingram, BAL at KC 09/22 (16 att., 3 TD) 102, Murray, NO vs. ARI 10/27 (21 att., 1 TD) 100, Henry, TEN at ATL 09/29 (27 att., 0 TD)
WEEK 12 / THROUGH MONDAY, NOVEMBER 25, 2019 AFC / LEADING PASSERS Pct Avg Pct Pct Rating Player, Team Att Comp Comp Yds Gain TD TD Long Int Int Points L. Jackson, Bal. 299 200 66.9 2427 8.12 24 8.0 83t 5 1.7 111.4 Tannehill, Ten. 154 111 72.1 1420 9.22 10 6.5 65t 4 2.6 111.4 Mahomes, K.C. 323 212 65.6 2808 8.69 19 5.9 83t 2 0.6 110.0 Watson, Hou. 361 249 69.0 2899 8.03 20 5.5 54 7 1.9 103.4 Carr, Oak. 337 239 70.9 2621 7.78 15 4.5 65t 6 1.8 101.0 Brissett, Ind. 285 184 64.6 1926 6.76 15 5.3 48t 4 1.4 95.7 *Minshew, Jac. 307 188 61.2 2285 7.44 13 4.2 70t 4 1.3 92.8 Mariota, Ten. 159 94 59.1 1179 7.42 7 4.4 75t 2 1.3 91.7 Brady, N.E. 439 273 62.2 2942 6.70 15 3.4 59 5 1.1 88.5 Darnold, NY-J 263 168 63.9 1915 7.28 13 4.9 92t 10 3.8 86.3 Allen, Buf. 342 206 60.2 2360 6.90 15 4.4 51 8 2.3 85.9 Rivers, LA-C 416 268 64.4 3169 7.62 15 3.6 56 14 3.4 85.5 Flacco, Den. 262 171 65.3 1822 6.95 6 2.3 70t 5 1.9 85.1 Mayfield, Cle. 375 226 60.3 2721 7.26 14 3.7 89t 13 3.5 80.5 Rudolph, Pit. 263 162 61.6 1636 6.22 12 4.6 76t 9 3.4 80.3 Dalton, Cin. 338 204 60.4 2252 6.66 9 2.7 66t 8 2.4 79.2 R. Fitzpatrick, Mia. 292 181 62.0 1901 6.51 10 3.4 50 10 3.4 78.0 AFC / LEADING PASSERS, RANKS Pct Avg Pct Pct Rating Player, Team Att Comp Comp Yds Gain TD TD Long Int Int Points L. Jackson, Bal. 10 9 4 7 3 1 1 6t 6 1 Tannehill, Ten. 17 16 1 16 1 13t 2 3t 12 2 Mahomes, K.C. 8 6 5 4 2 3 3 1t 1 3 Watson, Hou. 4 3 3 3 4 2 4 10 9 4 Carr, Oak. 7 4 2 6 5 4t 8 9 7 5 Brissett, Ind. 12 11 7 11 13 4t 5 3t 5 6 *Minshew, Jac. 9 10 13 9 7 10t 11 3t 4 7 Mariota, Ten. 16 17 17 17 8 16 9 1t 3 8 Brady, N.E. 1 1 10 2 14 4t 15 6t 2 9 Darnold, NY-J 13t 14 9 12 9 10t 6 14t 17 10 Allen, Buf. 5 7 16 8 12 4t 10 11t 10 11 Rivers, LA-C 2 2 8 1 6 4t 13 17 13 12 Flacco, Den. 15 13 6 14 11 17 17 6t 8 13 Mayfield, Cle. 3 5 15 5 10 9 12 16 16 14 Rudolph, Pit. 13t 15 12 15 17 12 7 13 14 15 Dalton, Cin. 6 8 14 10 15 15 16 11t 11 16 R. Fitzpatrick, Mia. 11 12 11 13 16 13t 14 14t 15 17
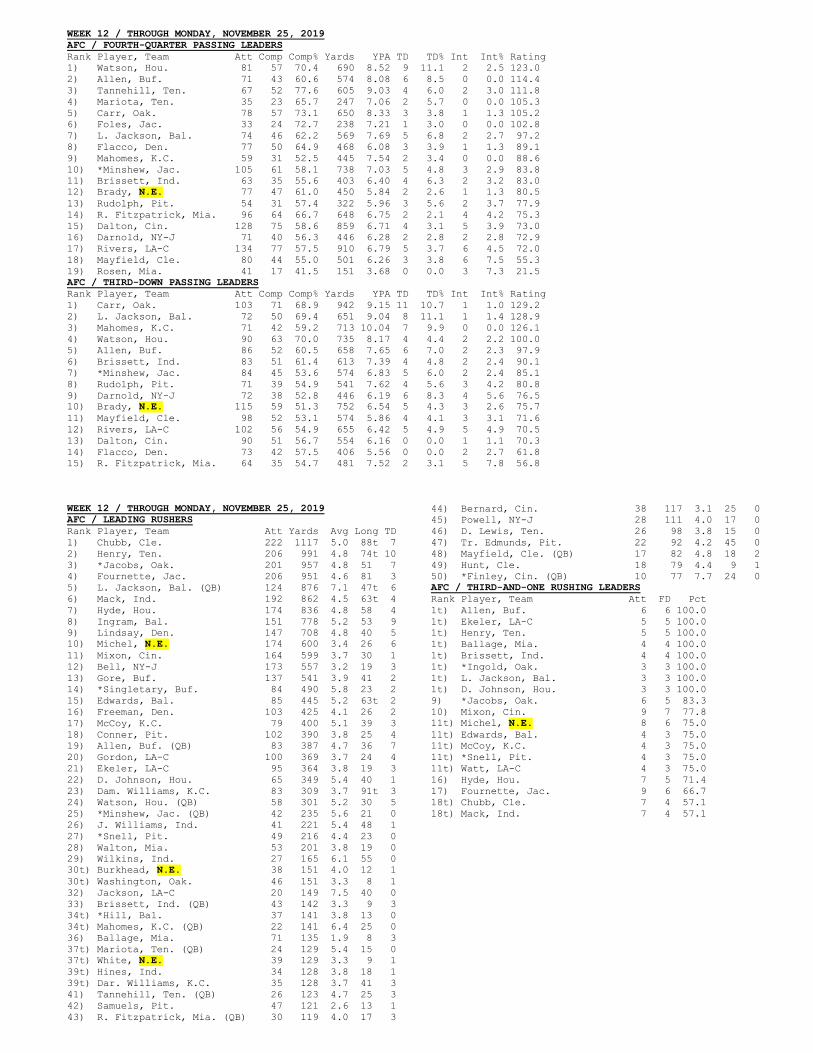
WEEK 12 / THROUGH MONDAY, NOVEMBER 25, 2019 AFC / FOURTH-QUARTER PASSING LEADERS Rank Player, Team Att Comp Comp% Yards YPA TD TD% Int Int% Rating 1) Watson, Hou. 81 57 70.4 690 8.52 9 11.1 2 2.5 123.0 2) Allen, Buf. 71 43 60.6 574 8.08 6 8.5 0 0.0 114.4 3) Tannehill, Ten. 67 52 77.6 605 9.03 4 6.0 2 3.0 111.8 4) Mariota, Ten. 35 23 65.7 247 7.06 2 5.7 0 0.0 105.3 5) Carr, Oak. 78 57 73.1 650 8.33 3 3.8 1 1.3 105.2 6) Foles, Jac. 33 24 72.7 238 7.21 1 3.0 0 0.0 102.8 7) L. Jackson, Bal. 74 46 62.2 569 7.69 5 6.8 2 2.7 97.2 8) Flacco, Den. 77 50 64.9 468 6.08 3 3.9 1 1.3 89.1 9) Mahomes, K.C. 59 31 52.5 445 7.54 2 3.4 0 0.0 88.6 10) *Minshew, Jac. 105 61 58.1 738 7.03 5 4.8 3 2.9 83.8 11) Brissett, Ind. 63 35 55.6 403 6.40 4 6.3 2 3.2 83.0 12) Brady, N.E. 77 47 61.0 450 5.84 2 2.6 1 1.3 80.5 13) Rudolph, Pit. 54 31 57.4 322 5.96 3 5.6 2 3.7 77.9 14) R. Fitzpatrick, Mia. 96 64 66.7 648 6.75 2 2.1 4 4.2 75.3 15) Dalton, Cin. 128 75 58.6 859 6.71 4 3.1 5 3.9 73.0 16) Darnold, NY-J 71 40 56.3 446 6.28 2 2.8 2 2.8 72.9 17) Rivers, LA-C 134 77 57.5 910 6.79 5 3.7 6 4.5 72.0 18) Mayfield, Cle. 80 44 55.0 501 6.26 3 3.8 6 7.5 55.3 19) Rosen, Mia. 41 17 41.5 151 3.68 0 0.0 3 7.3 21.5 AFC / THIRD-DOWN PASSING LEADERS Rank Player, Team Att Comp Comp% Yards YPA TD TD% Int Int% Rating 1) Carr, Oak. 103 71 68.9 942 9.15 11 10.7 1 1.0 129.2 2) L. Jackson, Bal. 72 50 69.4 651 9.04 8 11.1 1 1.4 128.9 3) Mahomes, K.C. 71 42 59.2 713 10.04 7 9.9 0 0.0 126.1 4) Watson, Hou. 90 63 70.0 735 8.17 4 4.4 2 2.2 100.0 5) Allen, Buf. 86 52 60.5 658 7.65 6 7.0 2 2.3 97.9 6) Brissett, Ind. 83 51 61.4 613 7.39 4 4.8 2 2.4 90.1 7) *Minshew, Jac. 84 45 53.6 574 6.83 5 6.0 2 2.4 85.1 8) Rudolph, Pit. 71 39 54.9 541 7.62 4 5.6 3 4.2 80.8 9) Darnold, NY-J 72 38 52.8 446 6.19 6 8.3 4 5.6 76.5 10) Brady, N.E. 115 59 51.3 752 6.54 5 4.3 3 2.6 75.7 11) Mayfield, Cle. 98 52 53.1 574 5.86 4 4.1 3 3.1 71.6 12) Rivers, LA-C 102 56 54.9 655 6.42 5 4.9 5 4.9 70.5 13) Dalton, Cin. 90 51 56.7 554 6.16 0 0.0 1 1.1 70.3 14) Flacco, Den. 73 42 57.5 406 5.56 0 0.0 2 2.7 61.8 15) R. Fitzpatrick, Mia. 64 35 54.7 481 7.52 2 3.1 5 7.8 56.8 WEEK 12 / THROUGH MONDAY, NOVEMBER 25, 2019 AFC / LEADING RUSHERS Rank Player, Team Att Yards Avg Long TD 1) Chubb, Cle. 222 1117 5.0 88t 7 2) Henry, Ten. 206 991 4.8 74t 10 3) *Jacobs, Oak. 201 957 4.8 51 7 4) Fournette, Jac. 206 951 4.6 81 3 5) L. Jackson, Bal. (QB) 124 876 7.1 47t 6 6) Mack, Ind. 192 862 4.5 63t 4 7) Hyde, Hou. 174 836 4.8 58 4 8) Ingram, Bal. 151 778 5.2 53 9 9) Lindsay, Den. 147 708 4.8 40 5 10) Michel, N.E. 174 600 3.4 26 6 11) Mixon, Cin. 164 599 3.7 30 1 12) Bell, NY-J 173 557 3.2 19 3 13) Gore, Buf. 137 541 3.9 41 2 14) *Singletary, Buf. 84 490 5.8 23 2 15) Edwards, Bal. 85 445 5.2 63t 2 16) Freeman, Den. 103 425 4.1 26 2 17) McCoy, K.C. 79 400 5.1 39 3 18) Conner, Pit. 102 390 3.8 25 4 19) Allen, Buf. (QB) 83 387 4.7 36 7 20) Gordon, LA-C 100 369 3.7 24 4 21) Ekeler, LA-C 95 364 3.8 19 3 22) D. Johnson, Hou. 65 349 5.4 40 1 23) Dam. Williams, K.C. 83 309 3.7 91t 3 24) Watson, Hou. (QB) 58 301 5.2 30 5 25) *Minshew, Jac. (QB) 42 235 5.6 21 0 26) J. Williams, Ind. 41 221 5.4 48 1 27) *Snell, Pit. 49 216 4.4 23 0 28) Walton, Mia. 53 201 3.8 19 0 29) Wilkins, Ind. 27 165 6.1 55 0 30t) Burkhead, N.E. 38 151 4.0 12 1 30t) Washington, Oak. 46 151 3.3 8 1 32) Jackson, LA-C 20 149 7.5 40 0 33) Brissett, Ind. (QB) 43 142 3.3 9 3 34t) *Hill, Bal. 37 141 3.8 13 0 34t) Mahomes, K.C. (QB) 22 141 6.4 25 0 36) Ballage, Mia. 71 135 1.9 8 3 37t) Mariota, Ten. (QB) 24 129 5.4 15 0 37t) White, N.E. 39 129 3.3 9 1 39t) Hines, Ind. 34 128 3.8 18 1 39t) Dar. Williams, K.C. 35 128 3.7 41 3 41) Tannehill, Ten. (QB) 26 123 4.7 25 3 42) Samuels, Pit. 47 121 2.6 13 1 43) R. Fitzpatrick, Mia. (QB) 30 119 4.0 17 3
44) Bernard, Cin. 38 117 3.1 25 0 45) Powell, NY-J 28 111 4.0 17 0 46) D. Lewis, Ten. 26 98 3.8 15 0 47) Tr. Edmunds, Pit. 22 92 4.2 45 0 48) Mayfield, Cle. (QB) 17 82 4.8 18 2 49) Hunt, Cle. 18 79 4.4 9 1 50) *Finley, Cin. (QB) 10 77 7.7 24 0 AFC / THIRD-AND-ONE RUSHING LEADERS Rank Player, Team Att FD Pct 1t) Allen, Buf. 6 6 100.0 1t) Ekeler, LA-C 5 5 100.0 1t) Henry, Ten. 5 5 100.0 1t) Ballage, Mia. 4 4 100.0 1t) Brissett, Ind. 4 4 100.0 1t) *Ingold, Oak. 3 3 100.0 1t) L. Jackson, Bal. 3 3 100.0 1t) D. Johnson, Hou. 3 3 100.0 9) *Jacobs, Oak. 6 5 83.3 10) Mixon, Cin. 9 7 77.8 11t) Michel, N.E. 8 6 75.0 11t) Edwards, Bal. 4 3 75.0 11t) McCoy, K.C. 4 3 75.0 11t) *Snell, Pit. 4 3 75.0 11t) Watt, LA-C 4 3 75.0 16) Hyde, Hou. 7 5 71.4 17) Fournette, Jac. 9 6 66.7 18t) Chubb, Cle. 7 4 57.1 18t) Mack, Ind. 7 4 57.1
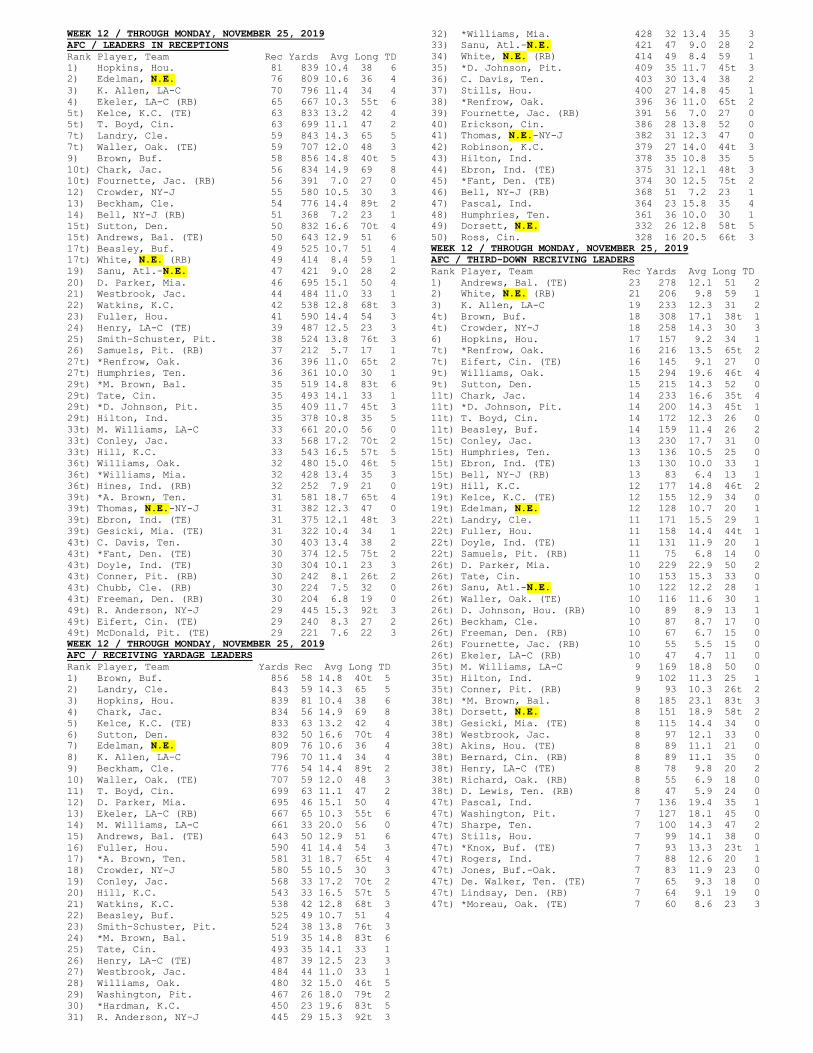
WEEK 12 / THROUGH MONDAY, NOVEMBER 25, 2019 AFC / LEADERS IN RECEPTIONS Rank Player, Team Rec Yards Avg Long TD 1) Hopkins, Hou. 81 839 10.4 38 6 2) Edelman, N.E. 76 809 10.6 36 4 3) K. Allen, LA-C 70 796 11.4 34 4 4) Ekeler, LA-C (RB) 65 667 10.3 55t 6 5t) Kelce, K.C. (TE) 63 833 13.2 42 4 5t) T. Boyd, Cin. 63 699 11.1 47 2 7t) Landry, Cle. 59 843 14.3 65 5 7t) Waller, Oak. (TE) 59 707 12.0 48 3 9) Brown, Buf. 58 856 14.8 40t 5 10t) Chark, Jac. 56 834 14.9 69 8 10t) Fournette, Jac. (RB) 56 391 7.0 27 0 12) Crowder, NY-J 55 580 10.5 30 3 13) Beckham, Cle. 54 776 14.4 89t 2 14) Bell, NY-J (RB) 51 368 7.2 23 1 15t) Sutton, Den. 50 832 16.6 70t 4 15t) Andrews, Bal. (TE) 50 643 12.9 51 6 17t) Beasley, Buf. 49 525 10.7 51 4 17t) White, N.E. (RB) 49 414 8.4 59 1 19) Sanu, Atl.-N.E. 47 421 9.0 28 2 20) D. Parker, Mia. 46 695 15.1 50 4 21) Westbrook, Jac. 44 484 11.0 33 1 22) Watkins, K.C. 42 538 12.8 68t 3 23) Fuller, Hou. 41 590 14.4 54 3 24) Henry, LA-C (TE) 39 487 12.5 23 3 25) Smith-Schuster, Pit. 38 524 13.8 76t 3 26) Samuels, Pit. (RB) 37 212 5.7 17 1 27t) *Renfrow, Oak. 36 396 11.0 65t 2 27t) Humphries, Ten. 36 361 10.0 30 1 29t) *M. Brown, Bal. 35 519 14.8 83t 6 29t) Tate, Cin. 35 493 14.1 33 1 29t) *D. Johnson, Pit. 35 409 11.7 45t 3 29t) Hilton, Ind. 35 378 10.8 35 5 33t) M. Williams, LA-C 33 661 20.0 56 0 33t) Conley, Jac. 33 568 17.2 70t 2 33t) Hill, K.C. 33 543 16.5 57t 5 36t) Williams, Oak. 32 480 15.0 46t 5 36t) *Williams, Mia. 32 428 13.4 35 3 36t) Hines, Ind. (RB) 32 252 7.9 21 0 39t) *A. Brown, Ten. 31 581 18.7 65t 4 39t) Thomas, N.E.-NY-J 31 382 12.3 47 0 39t) Ebron, Ind. (TE) 31 375 12.1 48t 3 39t) Gesicki, Mia. (TE) 31 322 10.4 34 1 43t) C. Davis, Ten. 30 403 13.4 38 2 43t) *Fant, Den. (TE) 30 374 12.5 75t 2 43t) Doyle, Ind. (TE) 30 304 10.1 23 3 43t) Conner, Pit. (RB) 30 242 8.1 26t 2 43t) Chubb, Cle. (RB) 30 224 7.5 32 0 43t) Freeman, Den. (RB) 30 204 6.8 19 0 49t) R. Anderson, NY-J 29 445 15.3 92t 3 49t) Eifert, Cin. (TE) 29 240 8.3 27 2 49t) McDonald, Pit. (TE) 29 221 7.6 22 3 WEEK 12 / THROUGH MONDAY, NOVEMBER 25, 2019 AFC / RECEIVING YARDAGE LEADERS Rank Player, Team Yards Rec Avg Long TD 1) Brown, Buf. 856 58 14.8 40t 5 2) Landry, Cle. 843 59 14.3 65 5 3) Hopkins, Hou. 839 81 10.4 38 6 4) Chark, Jac. 834 56 14.9 69 8 5) Kelce, K.C. (TE) 833 63 13.2 42 4 6) Sutton, Den. 832 50 16.6 70t 4 7) Edelman, N.E. 809 76 10.6 36 4 8) K. Allen, LA-C 796 70 11.4 34 4 9) Beckham, Cle. 776 54 14.4 89t 2 10) Waller, Oak. (TE) 707 59 12.0 48 3 11) T. Boyd, Cin. 699 63 11.1 47 2 12) D. Parker, Mia. 695 46 15.1 50 4 13) Ekeler, LA-C (RB) 667 65 10.3 55t 6 14) M. Williams, LA-C 661 33 20.0 56 0 15) Andrews, Bal. (TE) 643 50 12.9 51 6 16) Fuller, Hou. 590 41 14.4 54 3 17) *A. Brown, Ten. 581 31 18.7 65t 4 18) Crowder, NY-J 580 55 10.5 30 3 19) Conley, Jac. 568 33 17.2 70t 2 20) Hill, K.C. 543 33 16.5 57t 5 21) Watkins, K.C. 538 42 12.8 68t 3 22) Beasley, Buf. 525 49 10.7 51 4 23) Smith-Schuster, Pit. 524 38 13.8 76t 3 24) *M. Brown, Bal. 519 35 14.8 83t 6 25) Tate, Cin. 493 35 14.1 33 1 26) Henry, LA-C (TE) 487 39 12.5 23 3 27) Westbrook, Jac. 484 44 11.0 33 1 28) Williams, Oak. 480 32 15.0 46t 5 29) Washington, Pit. 467 26 18.0 79t 2 30) *Hardman, K.C. 450 23 19.6 83t 5 31) R. Anderson, NY-J 445 29 15.3 92t 3
32) *Williams, Mia. 428 32 13.4 35 3 33) Sanu, Atl.-N.E. 421 47 9.0 28 2 34) White, N.E. (RB) 414 49 8.4 59 1 35) *D. Johnson, Pit. 409 35 11.7 45t 3 36) C. Davis, Ten. 403 30 13.4 38 2 37) Stills, Hou. 400 27 14.8 45 1 38) *Renfrow, Oak. 396 36 11.0 65t 2 39) Fournette, Jac. (RB) 391 56 7.0 27 0 40) Erickson, Cin. 386 28 13.8 52 0 41) Thomas, N.E.-NY-J 382 31 12.3 47 0 42) Robinson, K.C. 379 27 14.0 44t 3 43) Hilton, Ind. 378 35 10.8 35 5 44) Ebron, Ind. (TE) 375 31 12.1 48t 3 45) *Fant, Den. (TE) 374 30 12.5 75t 2 46) Bell, NY-J (RB) 368 51 7.2 23 1 47) Pascal, Ind. 364 23 15.8 35 4 48) Humphries, Ten. 361 36 10.0 30 1 49) Dorsett, N.E. 332 26 12.8 58t 5 50) Ross, Cin. 328 16 20.5 66t 3 WEEK 12 / THROUGH MONDAY, NOVEMBER 25, 2019 AFC / THIRD-DOWN RECEIVING LEADERS Rank Player, Team Rec Yards Avg Long TD 1) Andrews, Bal. (TE) 23 278 12.1 51 2 2) White, N.E. (RB) 21 206 9.8 59 1 3) K. Allen, LA-C 19 233 12.3 31 2 4t) Brown, Buf. 18 308 17.1 38t 1 4t) Crowder, NY-J 18 258 14.3 30 3 6) Hopkins, Hou. 17 157 9.2 34 1 7t) *Renfrow, Oak. 16 216 13.5 65t 2 7t) Eifert, Cin. (TE) 16 145 9.1 27 0 9t) Williams, Oak. 15 294 19.6 46t 4 9t) Sutton, Den. 15 215 14.3 52 0 11t) Chark, Jac. 14 233 16.6 35t 4 11t) *D. Johnson, Pit. 14 200 14.3 45t 1 11t) T. Boyd, Cin. 14 172 12.3 26 0 11t) Beasley, Buf. 14 159 11.4 26 2 15t) Conley, Jac. 13 230 17.7 31 0 15t) Humphries, Ten. 13 136 10.5 25 0 15t) Ebron, Ind. (TE) 13 130 10.0 33 1 15t) Bell, NY-J (RB) 13 83 6.4 13 1 19t) Hill, K.C. 12 177 14.8 46t 2 19t) Kelce, K.C. (TE) 12 155 12.9 34 0 19t) Edelman, N.E. 12 128 10.7 20 1 22t) Landry, Cle. 11 171 15.5 29 1 22t) Fuller, Hou. 11 158 14.4 44t 1 22t) Doyle, Ind. (TE) 11 131 11.9 20 1 22t) Samuels, Pit. (RB) 11 75 6.8 14 0 26t) D. Parker, Mia. 10 229 22.9 50 2 26t) Tate, Cin. 10 153 15.3 33 0 26t) Sanu, Atl.-N.E. 10 122 12.2 28 1 26t) Waller, Oak. (TE) 10 116 11.6 30 1 26t) D. Johnson, Hou. (RB) 10 89 8.9 13 1 26t) Beckham, Cle. 10 87 8.7 17 0 26t) Freeman, Den. (RB) 10 67 6.7 15 0 26t) Fournette, Jac. (RB) 10 55 5.5 15 0 26t) Ekeler, LA-C (RB) 10 47 4.7 11 0 35t) M. Williams, LA-C 9 169 18.8 50 0 35t) Hilton, Ind. 9 102 11.3 25 1 35t) Conner, Pit. (RB) 9 93 10.3 26t 2 38t) *M. Brown, Bal. 8 185 23.1 83t 3 38t) Dorsett, N.E. 8 151 18.9 58t 2 38t) Gesicki, Mia. (TE) 8 115 14.4 34 0 38t) Westbrook, Jac. 8 97 12.1 33 0 38t) Akins, Hou. (TE) 8 89 11.1 21 0 38t) Bernard, Cin. (RB) 8 89 11.1 35 0 38t) Henry, LA-C (TE) 8 78 9.8 20 2 38t) Richard, Oak. (RB) 8 55 6.9 18 0 38t) D. Lewis, Ten. (RB) 8 47 5.9 24 0 47t) Pascal, Ind. 7 136 19.4 35 1 47t) Washington, Pit. 7 127 18.1 45 0 47t) Sharpe, Ten. 7 100 14.3 47 2 47t) Stills, Hou. 7 99 14.1 38 0 47t) *Knox, Buf. (TE) 7 93 13.3 23t 1 47t) Rogers, Ind. 7 88 12.6 20 1 47t) Jones, Buf.-Oak. 7 83 11.9 23 0 47t) De. Walker, Ten. (TE) 7 65 9.3 18 0 47t) Lindsay, Den. (RB) 7 64 9.1 19 0 47t) *Moreau, Oak. (TE) 7 60 8.6 23 3
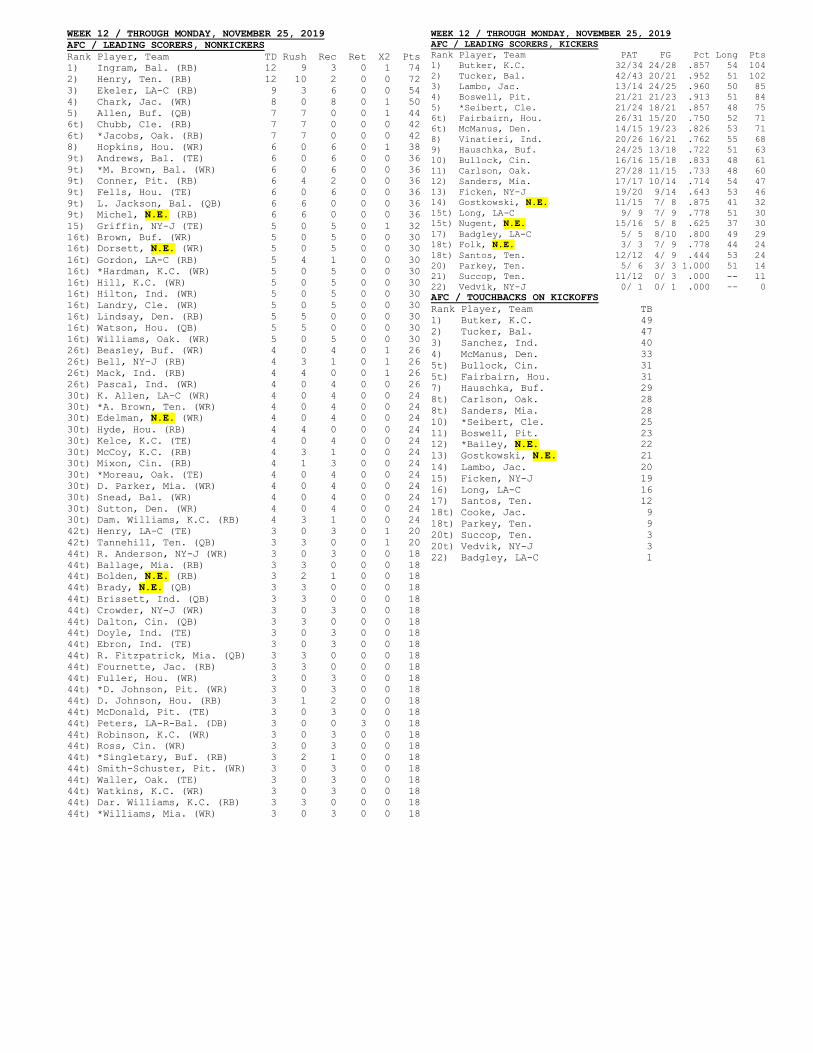
WEEK 12 / THROUGH MONDAY, NOVEMBER 25, 2019 AFC / LEADING SCORERS, NONKICKERS Rank Player, Team TD Rush Rec Ret X2 Pts 1) Ingram, Bal. (RB) 12 9 3 0 1 74 2) Henry, Ten. (RB) 12 10 2 0 0 72 3) Ekeler, LA-C (RB) 9 3 6 0 0 54 4) Chark, Jac. (WR) 8 0 8 0 1 50 5) Allen, Buf. (QB) 7 7 0 0 1 44 6t) Chubb, Cle. (RB) 7 7 0 0 0 42 6t) *Jacobs, Oak. (RB) 7 7 0 0 0 42 8) Hopkins, Hou. (WR) 6 0 6 0 1 38 9t) Andrews, Bal. (TE) 6 0 6 0 0 36 9t) *M. Brown, Bal. (WR) 6 0 6 0 0 36 9t) Conner, Pit. (RB) 6 4 2 0 0 36 9t) Fells, Hou. (TE) 6 0 6 0 0 36 9t) L. Jackson, Bal. (QB) 6 6 0 0 0 36 9t) Michel, N.E. (RB) 6 6 0 0 0 36 15) Griffin, NY-J (TE) 5 0 5 0 1 32 16t) Brown, Buf. (WR) 5 0 5 0 0 30 16t) Dorsett, N.E. (WR) 5 0 5 0 0 30 16t) Gordon, LA-C (RB) 5 4 1 0 0 30 16t) *Hardman, K.C. (WR) 5 0 5 0 0 30 16t) Hill, K.C. (WR) 5 0 5 0 0 30 16t) Hilton, Ind. (WR) 5 0 5 0 0 30 16t) Landry, Cle. (WR) 5 0 5 0 0 30 16t) Lindsay, Den. (RB) 5 5 0 0 0 30 16t) Watson, Hou. (QB) 5 5 0 0 0 30 16t) Williams, Oak. (WR) 5 0 5 0 0 30 26t) Beasley, Buf. (WR) 4 0 4 0 1 26 26t) Bell, NY-J (RB) 4 3 1 0 1 26 26t) Mack, Ind. (RB) 4 4 0 0 1 26 26t) Pascal, Ind. (WR) 4 0 4 0 0 26 30t) K. Allen, LA-C (WR) 4 0 4 0 0 24 30t) *A. Brown, Ten. (WR) 4 0 4 0 0 24 30t) Edelman, N.E. (WR) 4 0 4 0 0 24 30t) Hyde, Hou. (RB) 4 4 0 0 0 24 30t) Kelce, K.C. (TE) 4 0 4 0 0 24 30t) McCoy, K.C. (RB) 4 3 1 0 0 24 30t) Mixon, Cin. (RB) 4 1 3 0 0 24 30t) *Moreau, Oak. (TE) 4 0 4 0 0 24 30t) D. Parker, Mia. (WR) 4 0 4 0 0 24 30t) Snead, Bal. (WR) 4 0 4 0 0 24 30t) Sutton, Den. (WR) 4 0 4 0 0 24 30t) Dam. Williams, K.C. (RB) 4 3 1 0 0 24 42t) Henry, LA-C (TE) 3 0 3 0 1 20 42t) Tannehill, Ten. (QB) 3 3 0 0 1 20 44t) R. Anderson, NY-J (WR) 3 0 3 0 0 18 44t) Ballage, Mia. (RB) 3 3 0 0 0 18 44t) Bolden, N.E. (RB) 3 2 1 0 0 18 44t) Brady, N.E. (QB) 3 3 0 0 0 18 44t) Brissett, Ind. (QB) 3 3 0 0 0 18 44t) Crowder, NY-J (WR) 3 0 3 0 0 18 44t) Dalton, Cin. (QB) 3 3 0 0 0 18 44t) Doyle, Ind. (TE) 3 0 3 0 0 18 44t) Ebron, Ind. (TE) 3 0 3 0 0 18 44t) R. Fitzpatrick, Mia. (QB) 3 3 0 0 0 18 44t) Fournette, Jac. (RB) 3 3 0 0 0 18 44t) Fuller, Hou. (WR) 3 0 3 0 0 18 44t) *D. Johnson, Pit. (WR) 3 0 3 0 0 18 44t) D. Johnson, Hou. (RB) 3 1 2 0 0 18 44t) McDonald, Pit. (TE) 3 0 3 0 0 18 44t) Peters, LA-R-Bal. (DB) 3 0 0 3 0 18 44t) Robinson, K.C. (WR) 3 0 3 0 0 18 44t) Ross, Cin. (WR) 3 0 3 0 0 18 44t) *Singletary, Buf. (RB) 3 2 1 0 0 18 44t) Smith-Schuster, Pit. (WR) 3 0 3 0 0 18 44t) Waller, Oak. (TE) 3 0 3 0 0 18 44t) Watkins, K.C. (WR) 3 0 3 0 0 18 44t) Dar. Williams, K.C. (RB) 3 3 0 0 0 18 44t) *Williams, Mia. (WR) 3 0 3 0 0 18
WEEK 12 / THROUGH MONDAY, NOVEMBER 25, 2019 AFC / LEADING SCORERS, KICKERS Rank Player, Team PAT FG Pct Long Pts 1) Butker, K.C. 32/34 24/28 .857 54 104 2) Tucker, Bal. 42/43 20/21 .952 51 102 3) Lambo, Jac. 13/14 24/25 .960 50 85 4) Boswell, Pit. 21/21 21/23 .913 51 84 5) *Seibert, Cle. 21/24 18/21 .857 48 75 6t) Fairbairn, Hou. 26/31 15/20 .750 52 71 6t) McManus, Den. 14/15 19/23 .826 53 71 8) Vinatieri, Ind. 20/26 16/21 .762 55 68 9) Hauschka, Buf. 24/25 13/18 .722 51 63 10) Bullock, Cin. 16/16 15/18 .833 48 61 11) Carlson, Oak. 27/28 11/15 .733 48 60 12) Sanders, Mia. 17/17 10/14 .714 54 47 13) Ficken, NY-J 19/20 9/14 .643 53 46 14) Gostkowski, N.E. 11/15 7/ 8 .875 41 32 15t) Long, LA-C 9/ 9 7/ 9 .778 51 30 15t) Nugent, N.E. 15/16 5/ 8 .625 37 30 17) Badgley, LA-C 5/ 5 8/10 .800 49 29 18t) Folk, N.E. 3/ 3 7/ 9 .778 44 24 18t) Santos, Ten. 12/12 4/ 9 .444 53 24 20) Parkey, Ten. 5/ 6 3/ 3 1.000 51 14 21) Succop, Ten. 11/12 0/ 3 .000 -- 11 22) Vedvik, NY-J 0/ 1 0/ 1 .000 -- 0 AFC / TOUCHBACKS ON KICKOFFS Rank Player, Team TB 1) Butker, K.C. 49 2) Tucker, Bal. 47 3) Sanchez, Ind. 40 4) McManus, Den. 33 5t) Bullock, Cin. 31 5t) Fairbairn, Hou. 31 7) Hauschka, Buf. 29 8t) Carlson, Oak. 28 8t) Sanders, Mia. 28 10) *Seibert, Cle. 25 11) Boswell, Pit. 23 12) *Bailey, N.E. 22 13) Gostkowski, N.E. 21 14) Lambo, Jac. 20 15) Ficken, NY-J 19 16) Long, LA-C 16 17) Santos, Ten. 12 18t) Cooke, Jac. 9 18t) Parkey, Ten. 9 20t) Succop, Ten. 3 20t) Vedvik, NY-J 3 22) Badgley, LA-C 1
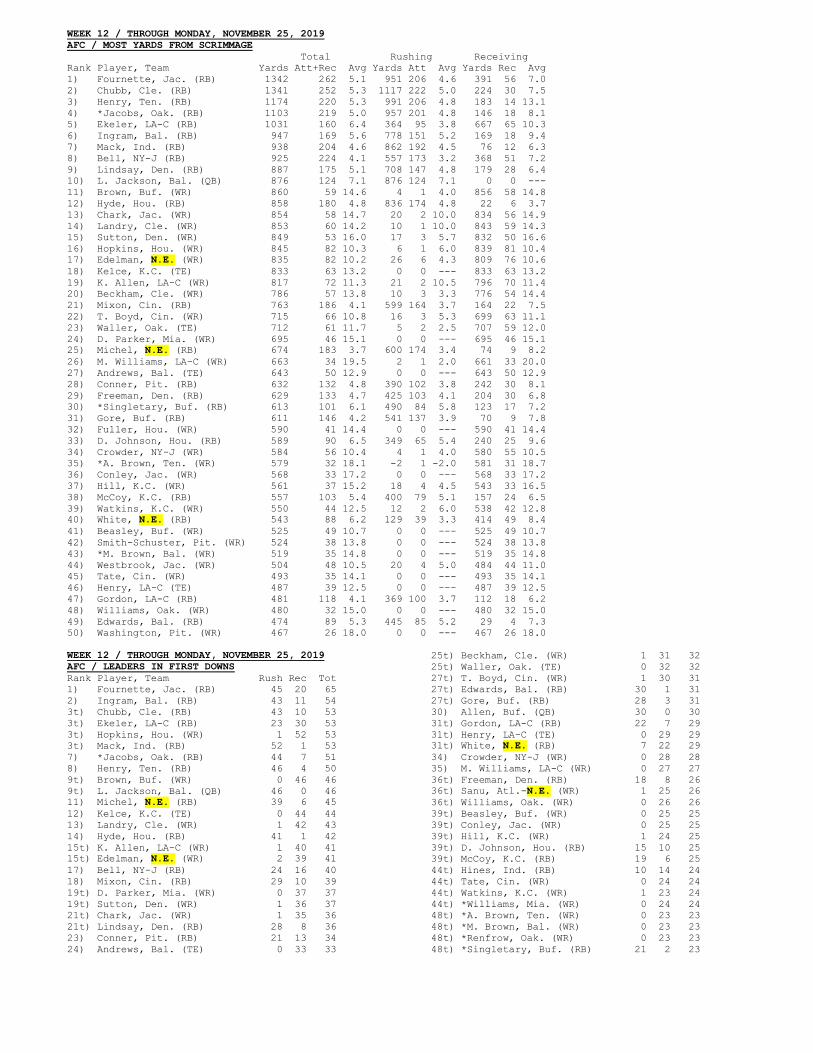
WEEK 12 / THROUGH MONDAY, NOVEMBER 25, 2019 AFC / MOST YARDS FROM SCRIMMAGE Total Rushing Receiving Rank Player, Team Yards Att+Rec Avg Yards Att Avg Yards Rec Avg 1) Fournette, Jac. (RB) 1342 262 5.1 951 206 4.6 391 56 7.0 2) Chubb, Cle. (RB) 1341 252 5.3 1117 222 5.0 224 30 7.5 3) Henry, Ten. (RB) 1174 220 5.3 991 206 4.8 183 14 13.1 4) *Jacobs, Oak. (RB) 1103 219 5.0 957 201 4.8 146 18 8.1 5) Ekeler, LA-C (RB) 1031 160 6.4 364 95 3.8 667 65 10.3 6) Ingram, Bal. (RB) 947 169 5.6 778 151 5.2 169 18 9.4 7) Mack, Ind. (RB) 938 204 4.6 862 192 4.5 76 12 6.3 8) Bell, NY-J (RB) 925 224 4.1 557 173 3.2 368 51 7.2 9) Lindsay, Den. (RB) 887 175 5.1 708 147 4.8 179 28 6.4 10) L. Jackson, Bal. (QB) 876 124 7.1 876 124 7.1 0 0 --- 11) Brown, Buf. (WR) 860 59 14.6 4 1 4.0 856 58 14.8 12) Hyde, Hou. (RB) 858 180 4.8 836 174 4.8 22 6 3.7 13) Chark, Jac. (WR) 854 58 14.7 20 2 10.0 834 56 14.9 14) Landry, Cle. (WR) 853 60 14.2 10 1 10.0 843 59 14.3 15) Sutton, Den. (WR) 849 53 16.0 17 3 5.7 832 50 16.6 16) Hopkins, Hou. (WR) 845 82 10.3 6 1 6.0 839 81 10.4 17) Edelman, N.E. (WR) 835 82 10.2 26 6 4.3 809 76 10.6 18) Kelce, K.C. (TE) 833 63 13.2 0 0 --- 833 63 13.2 19) K. Allen, LA-C (WR) 817 72 11.3 21 2 10.5 796 70 11.4 20) Beckham, Cle. (WR) 786 57 13.8 10 3 3.3 776 54 14.4 21) Mixon, Cin. (RB) 763 186 4.1 599 164 3.7 164 22 7.5 22) T. Boyd, Cin. (WR) 715 66 10.8 16 3 5.3 699 63 11.1 23) Waller, Oak. (TE) 712 61 11.7 5 2 2.5 707 59 12.0 24) D. Parker, Mia. (WR) 695 46 15.1 0 0 --- 695 46 15.1 25) Michel, N.E. (RB) 674 183 3.7 600 174 3.4 74 9 8.2 26) M. Williams, LA-C (WR) 663 34 19.5 2 1 2.0 661 33 20.0 27) Andrews, Bal. (TE) 643 50 12.9 0 0 --- 643 50 12.9 28) Conner, Pit. (RB) 632 132 4.8 390 102 3.8 242 30 8.1 29) Freeman, Den. (RB) 629 133 4.7 425 103 4.1 204 30 6.8 30) *Singletary, Buf. (RB) 613 101 6.1 490 84 5.8 123 17 7.2 31) Gore, Buf. (RB) 611 146 4.2 541 137 3.9 70 9 7.8 32) Fuller, Hou. (WR) 590 41 14.4 0 0 --- 590 41 14.4 33) D. Johnson, Hou. (RB) 589 90 6.5 349 65 5.4 240 25 9.6 34) Crowder, NY-J (WR) 584 56 10.4 4 1 4.0 580 55 10.5 35) *A. Brown, Ten. (WR) 579 32 18.1 -2 1 -2.0 581 31 18.7 36) Conley, Jac. (WR) 568 33 17.2 0 0 --- 568 33 17.2 37) Hill, K.C. (WR) 561 37 15.2 18 4 4.5 543 33 16.5 38) McCoy, K.C. (RB) 557 103 5.4 400 79 5.1 157 24 6.5 39) Watkins, K.C. (WR) 550 44 12.5 12 2 6.0 538 42 12.8 40) White, N.E. (RB) 543 88 6.2 129 39 3.3 414 49 8.4 41) Beasley, Buf. (WR) 525 49 10.7 0 0 --- 525 49 10.7 42) Smith-Schuster, Pit. (WR) 524 38 13.8 0 0 --- 524 38 13.8 43) *M. Brown, Bal. (WR) 519 35 14.8 0 0 --- 519 35 14.8 44) Westbrook, Jac. (WR) 504 48 10.5 20 4 5.0 484 44 11.0 45) Tate, Cin. (WR) 493 35 14.1 0 0 --- 493 35 14.1 46) Henry, LA-C (TE) 487 39 12.5 0 0 --- 487 39 12.5 47) Gordon, LA-C (RB) 481 118 4.1 369 100 3.7 112 18 6.2 48) Williams, Oak. (WR) 480 32 15.0 0 0 --- 480 32 15.0 49) Edwards, Bal. (RB) 474 89 5.3 445 85 5.2 29 4 7.3 50) Washington, Pit. (WR) 467 26 18.0 0 0 --- 467 26 18.0 WEEK 12 / THROUGH MONDAY, NOVEMBER 25, 2019 AFC / LEADERS IN FIRST DOWNS Rank Player, Team Rush Rec Tot 1) Fournette, Jac. (RB) 45 20 65 2) Ingram, Bal. (RB) 43 11 54 3t) Chubb, Cle. (RB) 43 10 53 3t) Ekeler, LA-C (RB) 23 30 53 3t) Hopkins, Hou. (WR) 1 52 53 3t) Mack, Ind. (RB) 52 1 53 7) *Jacobs, Oak. (RB) 44 7 51 8) Henry, Ten. (RB) 46 4 50 9t) Brown, Buf. (WR) 0 46 46 9t) L. Jackson, Bal. (QB) 46 0 46 11) Michel, N.E. (RB) 39 6 45 12) Kelce, K.C. (TE) 0 44 44 13) Landry, Cle. (WR) 1 42 43 14) Hyde, Hou. (RB) 41 1 42 15t) K. Allen, LA-C (WR) 1 40 41 15t) Edelman, N.E. (WR) 2 39 41 17) Bell, NY-J (RB) 24 16 40 18) Mixon, Cin. (RB) 29 10 39 19t) D. Parker, Mia. (WR) 0 37 37 19t) Sutton, Den. (WR) 1 36 37 21t) Chark, Jac. (WR) 1 35 36 21t) Lindsay, Den. (RB) 28 8 36 23) Conner, Pit. (RB) 21 13 34 24) Andrews, Bal. (TE) 0 33 33
25t) Beckham, Cle. (WR) 1 31 32 25t) Waller, Oak. (TE) 0 32 32 27t) T. Boyd, Cin. (WR) 1 30 31 27t) Edwards, Bal. (RB) 30 1 31 27t) Gore, Buf. (RB) 28 3 31 30) Allen, Buf. (QB) 30 0 30 31t) Gordon, LA-C (RB) 22 7 29 31t) Henry, LA-C (TE) 0 29 29 31t) White, N.E. (RB) 7 22 29 34) Crowder, NY-J (WR) 0 28 28 35) M. Williams, LA-C (WR) 0 27 27 36t) Freeman, Den. (RB) 18 8 26 36t) Sanu, Atl.-N.E. (WR) 1 25 26 36t) Williams, Oak. (WR) 0 26 26 39t) Beasley, Buf. (WR) 0 25 25 39t) Conley, Jac. (WR) 0 25 25 39t) Hill, K.C. (WR) 1 24 25 39t) D. Johnson, Hou. (RB) 15 10 25 39t) McCoy, K.C. (RB) 19 6 25 44t) Hines, Ind. (RB) 10 14 24 44t) Tate, Cin. (WR) 0 24 24 44t) Watkins, K.C. (WR) 1 23 24 44t) *Williams, Mia. (WR) 0 24 24 48t) *A. Brown, Ten. (WR) 0 23 23 48t) *M. Brown, Bal. (WR) 0 23 23 48t) *Renfrow, Oak. (WR) 0 23 23 48t) *Singletary, Buf. (RB) 21 2 23
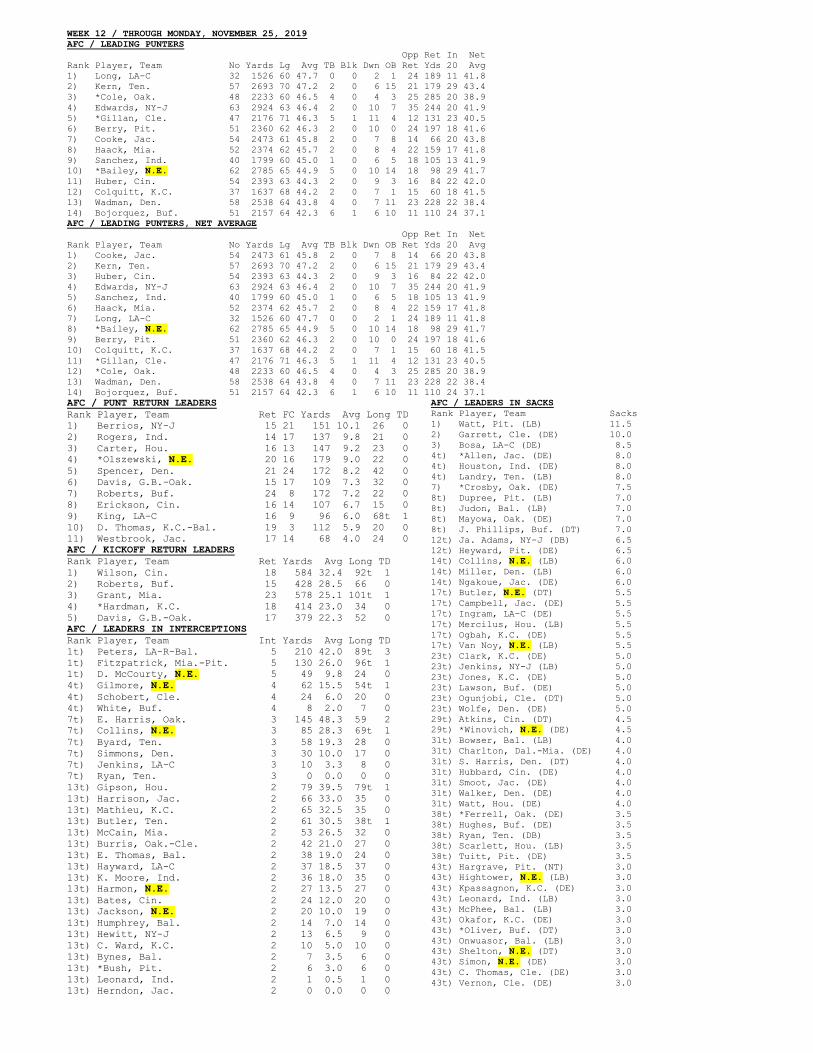
WEEK 12 / THROUGH MONDAY, NOVEMBER 25, 2019 AFC / LEADING PUNTERS Opp Ret In Net Rank Player, Team No Yards Lg Avg TB Blk Dwn OB Ret Yds 20 Avg 1) Long, LA-C 32 1526 60 47.7 0 0 2 1 24 189 11 41.8 2) Kern, Ten. 57 2693 70 47.2 2 0 6 15 21 179 29 43.4 3) *Cole, Oak. 48 2233 60 46.5 4 0 4 3 25 285 20 38.9 4) Edwards, NY-J 63 2924 63 46.4 2 0 10 7 35 244 20 41.9 5) *Gillan, Cle. 47 2176 71 46.3 5 1 11 4 12 131 23 40.5 6) Berry, Pit. 51 2360 62 46.3 2 0 10 0 24 197 18 41.6 7) Cooke, Jac. 54 2473 61 45.8 2 0 7 8 14 66 20 43.8 8) Haack, Mia. 52 2374 62 45.7 2 0 8 4 22 159 17 41.8 9) Sanchez, Ind. 40 1799 60 45.0 1 0 6 5 18 105 13 41.9 10) *Bailey, N.E. 62 2785 65 44.9 5 0 10 14 18 98 29 41.7 11) Huber, Cin. 54 2393 63 44.3 2 0 9 3 16 84 22 42.0 12) Colquitt, K.C. 37 1637 68 44.2 2 0 7 1 15 60 18 41.5 13) Wadman, Den. 58 2538 64 43.8 4 0 7 11 23 228 22 38.4 14) Bojorquez, Buf. 51 2157 64 42.3 6 1 6 10 11 110 24 37.1 AFC / LEADING PUNTERS, NET AVERAGE Opp Ret In Net Rank Player, Team No Yards Lg Avg TB Blk Dwn OB Ret Yds 20 Avg 1) Cooke, Jac. 54 2473 61 45.8 2 0 7 8 14 66 20 43.8 2) Kern, Ten. 57 2693 70 47.2 2 0 6 15 21 179 29 43.4 3) Huber, Cin. 54 2393 63 44.3 2 0 9 3 16 84 22 42.0 4) Edwards, NY-J 63 2924 63 46.4 2 0 10 7 35 244 20 41.9 5) Sanchez, Ind. 40 1799 60 45.0 1 0 6 5 18 105 13 41.9 6) Haack, Mia. 52 2374 62 45.7 2 0 8 4 22 159 17 41.8 7) Long, LA-C 32 1526 60 47.7 0 0 2 1 24 189 11 41.8 8) *Bailey, N.E. 62 2785 65 44.9 5 0 10 14 18 98 29 41.7 9) Berry, Pit. 51 2360 62 46.3 2 0 10 0 24 197 18 41.6 10) Colquitt, K.C. 37 1637 68 44.2 2 0 7 1 15 60 18 41.5 11) *Gillan, Cle. 47 2176 71 46.3 5 1 11 4 12 131 23 40.5 12) *Cole, Oak. 48 2233 60 46.5 4 0 4 3 25 285 20 38.9 13) Wadman, Den. 58 2538 64 43.8 4 0 7 11 23 228 22 38.4 14) Bojorquez, Buf. 51 2157 64 42.3 6 1 6 10 11 110 24 37.1 AFC / PUNT RETURN LEADERS Rank Player, Team Ret FC Yards Avg Long TD 1) Berrios, NY-J 15 21 151 10.1 26 0 2) Rogers, Ind. 14 17 137 9.8 21 0 3) Carter, Hou. 16 13 147 9.2 23 0 4) *Olszewski, N.E. 20 16 179 9.0 22 0 5) Spencer, Den. 21 24 172 8.2 42 0 6) Davis, G.B.-Oak. 15 17 109 7.3 32 0 7) Roberts, Buf. 24 8 172 7.2 22 0 8) Erickson, Cin. 16 14 107 6.7 15 0 9) King, LA-C 16 9 96 6.0 68t 1 10) D. Thomas, K.C.-Bal. 19 3 112 5.9 20 0 11) Westbrook, Jac. 17 14 68 4.0 24 0 AFC / KICKOFF RETURN LEADERS Rank Player, Team Ret Yards Avg Long TD 1) Wilson, Cin. 18 584 32.4 92t 1 2) Roberts, Buf. 15 428 28.5 66 0 3) Grant, Mia. 23 578 25.1 101t 1 4) *Hardman, K.C. 18 414 23.0 34 0 5) Davis, G.B.-Oak. 17 379 22.3 52 0 AFC / LEADERS IN INTERCEPTIONS Rank Player, Team Int Yards Avg Long TD 1t) Peters, LA-R-Bal. 5 210 42.0 89t 3 1t) Fitzpatrick, Mia.-Pit. 5 130 26.0 96t 1 1t) D. McCourty, N.E. 5 49 9.8 24 0 4t) Gilmore, N.E. 4 62 15.5 54t 1 4t) Schobert, Cle. 4 24 6.0 20 0 4t) White, Buf. 4 8 2.0 7 0 7t) E. Harris, Oak. 3 145 48.3 59 2 7t) Collins, N.E. 3 85 28.3 69t 1 7t) Byard, Ten. 3 58 19.3 28 0 7t) Simmons, Den. 3 30 10.0 17 0 7t) Jenkins, LA-C 3 10 3.3 8 0 7t) Ryan, Ten. 3 0 0.0 0 0 13t) Gipson, Hou. 2 79 39.5 79t 1 13t) Harrison, Jac. 2 66 33.0 35 0 13t) Mathieu, K.C. 2 65 32.5 35 0 13t) Butler, Ten. 2 61 30.5 38t 1 13t) McCain, Mia. 2 53 26.5 32 0 13t) Burris, Oak.-Cle. 2 42 21.0 27 0 13t) E. Thomas, Bal. 2 38 19.0 24 0 13t) Hayward, LA-C 2 37 18.5 37 0 13t) K. Moore, Ind. 2 36 18.0 35 0 13t) Harmon, N.E. 2 27 13.5 27 0 13t) Bates, Cin. 2 24 12.0 20 0 13t) Jackson, N.E. 2 20 10.0 19 0 13t) Humphrey, Bal. 2 14 7.0 14 0 13t) Hewitt, NY-J 2 13 6.5 9 0 13t) C. Ward, K.C. 2 10 5.0 10 0 13t) Bynes, Bal. 2 7 3.5 6 0 13t) *Bush, Pit. 2 6 3.0 6 0 13t) Leonard, Ind. 2 1 0.5 1 0 13t) Herndon, Jac. 2 0 0.0 0 0
AFC / LEADERS IN SACKS Rank Player, Team Sacks 1) Watt, Pit. (LB) 11.5 2) Garrett, Cle. (DE) 10.0 3) Bosa, LA-C (DE) 8.5 4t) *Allen, Jac. (DE) 8.0 4t) Houston, Ind. (DE) 8.0 4t) Landry, Ten. (LB) 8.0 7) *Crosby, Oak. (DE) 7.5 8t) Dupree, Pit. (LB) 7.0 8t) Judon, Bal. (LB) 7.0 8t) Mayowa, Oak. (DE) 7.0 8t) J. Phillips, Buf. (DT) 7.0 12t) Ja. Adams, NY-J (DB) 6.5 12t) Heyward, Pit. (DE) 6.5 14t) Collins, N.E. (LB) 6.0 14t) Miller, Den. (LB) 6.0 14t) Ngakoue, Jac. (DE) 6.0 17t) Butler, N.E. (DT) 5.5 17t) Campbell, Jac. (DE) 5.5 17t) Ingram, LA-C (DE) 5.5 17t) Mercilus, Hou. (LB) 5.5 17t) Ogbah, K.C. (DE) 5.5 17t) Van Noy, N.E. (LB) 5.5 23t) Clark, K.C. (DE) 5.0 23t) Jenkins, NY-J (LB) 5.0 23t) Jones, K.C. (DE) 5.0 23t) Lawson, Buf. (DE) 5.0 23t) Ogunjobi, Cle. (DT) 5.0 23t) Wolfe, Den. (DE) 5.0 29t) Atkins, Cin. (DT) 4.5 29t) *Winovich, N.E. (DE) 4.5 31t) Bowser, Bal. (LB) 4.0 31t) Charlton, Dal.-Mia. (DE) 4.0 31t) S. Harris, Den. (DT) 4.0 31t) Hubbard, Cin. (DE) 4.0 31t) Smoot, Jac. (DE) 4.0 31t) Walker, Den. (DE) 4.0 31t) Watt, Hou. (DE) 4.0 38t) *Ferrell, Oak. (DE) 3.5 38t) Hughes, Buf. (DE) 3.5 38t) Ryan, Ten. (DB) 3.5 38t) Scarlett, Hou. (LB) 3.5 38t) Tuitt, Pit. (DE) 3.5 43t) Hargrave, Pit. (NT) 3.0 43t) Hightower, N.E. (LB) 3.0 43t) Kpassagnon, K.C. (DE) 3.0 43t) Leonard, Ind. (LB) 3.0 43t) McPhee, Bal. (LB) 3.0 43t) Okafor, K.C. (DE) 3.0 43t) *Oliver, Buf. (DT) 3.0 43t) Onwuasor, Bal. (LB) 3.0 43t) Shelton, N.E. (DT) 3.0 43t) Simon, N.E. (DE) 3.0 43t) C. Thomas, Cle. (DE) 3.0 43t) Vernon, Cle. (DE) 3.0
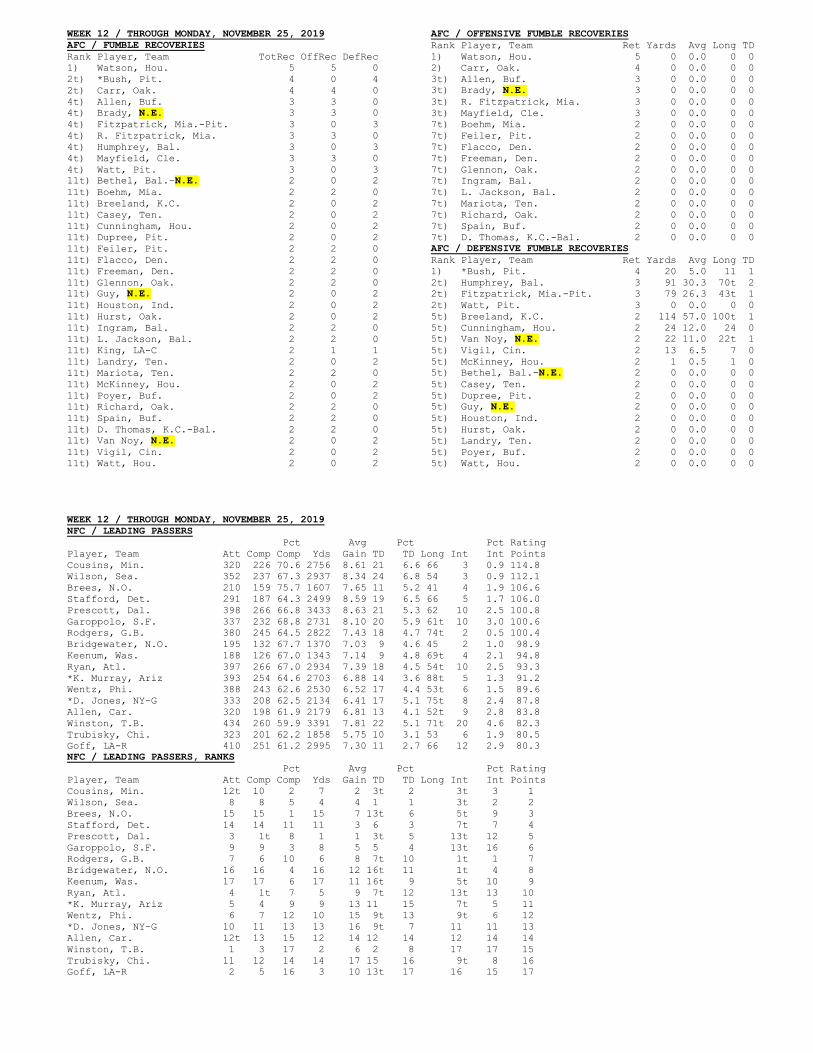
WEEK 12 / THROUGH MONDAY, NOVEMBER 25, 2019 AFC / FUMBLE RECOVERIES Rank Player, Team TotRec OffRec DefRec 1) Watson, Hou. 5 5 0 2t) *Bush, Pit. 4 0 4 2t) Carr, Oak. 4 4 0 4t) Allen, Buf. 3 3 0 4t) Brady, N.E. 3 3 0 4t) Fitzpatrick, Mia.-Pit. 3 0 3 4t) R. Fitzpatrick, Mia. 3 3 0 4t) Humphrey, Bal. 3 0 3 4t) Mayfield, Cle. 3 3 0 4t) Watt, Pit. 3 0 3 11t) Bethel, Bal.-N.E. 2 0 2 11t) Boehm, Mia. 2 2 0 11t) Breeland, K.C. 2 0 2 11t) Casey, Ten. 2 0 2 11t) Cunningham, Hou. 2 0 2 11t) Dupree, Pit. 2 0 2 11t) Feiler, Pit. 2 2 0 11t) Flacco, Den. 2 2 0 11t) Freeman, Den. 2 2 0 11t) Glennon, Oak. 2 2 0 11t) Guy, N.E. 2 0 2 11t) Houston, Ind. 2 0 2 11t) Hurst, Oak. 2 0 2 11t) Ingram, Bal. 2 2 0 11t) L. Jackson, Bal. 2 2 0 11t) King, LA-C 2 1 1 11t) Landry, Ten. 2 0 2 11t) Mariota, Ten. 2 2 0 11t) McKinney, Hou. 2 0 2 11t) Poyer, Buf. 2 0 2 11t) Richard, Oak. 2 2 0 11t) Spain, Buf. 2 2 0 11t) D. Thomas, K.C.-Bal. 2 2 0 11t) Van Noy, N.E. 2 0 2 11t) Vigil, Cin. 2 0 2 11t) Watt, Hou. 2 0 2
AFC / OFFENSIVE FUMBLE RECOVERIES Rank Player, Team Ret Yards Avg Long TD 1) Watson, Hou. 5 0 0.0 0 0 2) Carr, Oak. 4 0 0.0 0 0 3t) Allen, Buf. 3 0 0.0 0 0 3t) Brady, N.E. 3 0 0.0 0 0 3t) R. Fitzpatrick, Mia. 3 0 0.0 0 0 3t) Mayfield, Cle. 3 0 0.0 0 0 7t) Boehm, Mia. 2 0 0.0 0 0 7t) Feiler, Pit. 2 0 0.0 0 0 7t) Flacco, Den. 2 0 0.0 0 0 7t) Freeman, Den. 2 0 0.0 0 0 7t) Glennon, Oak. 2 0 0.0 0 0 7t) Ingram, Bal. 2 0 0.0 0 0 7t) L. Jackson, Bal. 2 0 0.0 0 0 7t) Mariota, Ten. 2 0 0.0 0 0 7t) Richard, Oak. 2 0 0.0 0 0 7t) Spain, Buf. 2 0 0.0 0 0 7t) D. Thomas, K.C.-Bal. 2 0 0.0 0 0 AFC / DEFENSIVE FUMBLE RECOVERIES Rank Player, Team Ret Yards Avg Long TD 1) *Bush, Pit. 4 20 5.0 11 1 2t) Humphrey, Bal. 3 91 30.3 70t 2 2t) Fitzpatrick, Mia.-Pit. 3 79 26.3 43t 1 2t) Watt, Pit. 3 0 0.0 0 0 5t) Breeland, K.C. 2 114 57.0 100t 1 5t) Cunningham, Hou. 2 24 12.0 24 0 5t) Van Noy, N.E. 2 22 11.0 22t 1 5t) Vigil, Cin. 2 13 6.5 7 0 5t) McKinney, Hou. 2 1 0.5 1 0 5t) Bethel, Bal.-N.E. 2 0 0.0 0 0 5t) Casey, Ten. 2 0 0.0 0 0 5t) Dupree, Pit. 2 0 0.0 0 0 5t) Guy, N.E. 2 0 0.0 0 0 5t) Houston, Ind. 2 0 0.0 0 0 5t) Hurst, Oak. 2 0 0.0 0 0 5t) Landry, Ten. 2 0 0.0 0 0 5t) Poyer, Buf. 2 0 0.0 0 0 5t) Watt, Hou. 2 0 0.0 0 0
WEEK 12 / THROUGH MONDAY, NOVEMBER 25, 2019 NFC / LEADING PASSERS Pct Avg Pct Pct Rating Player, Team Att Comp Comp Yds Gain TD TD Long Int Int Points Cousins, Min. 320 226 70.6 2756 8.61 21 6.6 66 3 0.9 114.8 Wilson, Sea. 352 237 67.3 2937 8.34 24 6.8 54 3 0.9 112.1 Brees, N.O. 210 159 75.7 1607 7.65 11 5.2 41 4 1.9 106.6 Stafford, Det. 291 187 64.3 2499 8.59 19 6.5 66 5 1.7 106.0 Prescott, Dal. 398 266 66.8 3433 8.63 21 5.3 62 10 2.5 100.8 Garoppolo, S.F. 337 232 68.8 2731 8.10 20 5.9 61t 10 3.0 100.6 Rodgers, G.B. 380 245 64.5 2822 7.43 18 4.7 74t 2 0.5 100.4 Bridgewater, N.O. 195 132 67.7 1370 7.03 9 4.6 45 2 1.0 98.9 Keenum, Was. 188 126 67.0 1343 7.14 9 4.8 69t 4 2.1 94.8 Ryan, Atl. 397 266 67.0 2934 7.39 18 4.5 54t 10 2.5 93.3 *K. Murray, Ariz 393 254 64.6 2703 6.88 14 3.6 88t 5 1.3 91.2 Wentz, Phi. 388 243 62.6 2530 6.52 17 4.4 53t 6 1.5 89.6 *D. Jones, NY-G 333 208 62.5 2134 6.41 17 5.1 75t 8 2.4 87.8 Allen, Car. 320 198 61.9 2179 6.81 13 4.1 52t 9 2.8 83.8 Winston, T.B. 434 260 59.9 3391 7.81 22 5.1 71t 20 4.6 82.3 Trubisky, Chi. 323 201 62.2 1858 5.75 10 3.1 53 6 1.9 80.5 Goff, LA-R 410 251 61.2 2995 7.30 11 2.7 66 12 2.9 80.3 NFC / LEADING PASSERS, RANKS Pct Avg Pct Pct Rating Player, Team Att Comp Comp Yds Gain TD TD Long Int Int Points Cousins, Min. 12t 10 2 7 2 3t 2 3t 3 1 Wilson, Sea. 8 8 5 4 4 1 1 3t 2 2 Brees, N.O. 15 15 1 15 7 13t 6 5t 9 3 Stafford, Det. 14 14 11 11 3 6 3 7t 7 4 Prescott, Dal. 3 1t 8 1 1 3t 5 13t 12 5 Garoppolo, S.F. 9 9 3 8 5 5 4 13t 16 6 Rodgers, G.B. 7 6 10 6 8 7t 10 1t 1 7 Bridgewater, N.O. 16 16 4 16 12 16t 11 1t 4 8 Keenum, Was. 17 17 6 17 11 16t 9 5t 10 9 Ryan, Atl. 4 1t 7 5 9 7t 12 13t 13 10 *K. Murray, Ariz 5 4 9 9 13 11 15 7t 5 11 Wentz, Phi. 6 7 12 10 15 9t 13 9t 6 12 *D. Jones, NY-G 10 11 13 13 16 9t 7 11 11 13 Allen, Car. 12t 13 15 12 14 12 14 12 14 14 Winston, T.B. 1 3 17 2 6 2 8 17 17 15 Trubisky, Chi. 11 12 14 14 17 15 16 9t 8 16 Goff, LA-R 2 5 16 3 10 13t 17 16 15 17
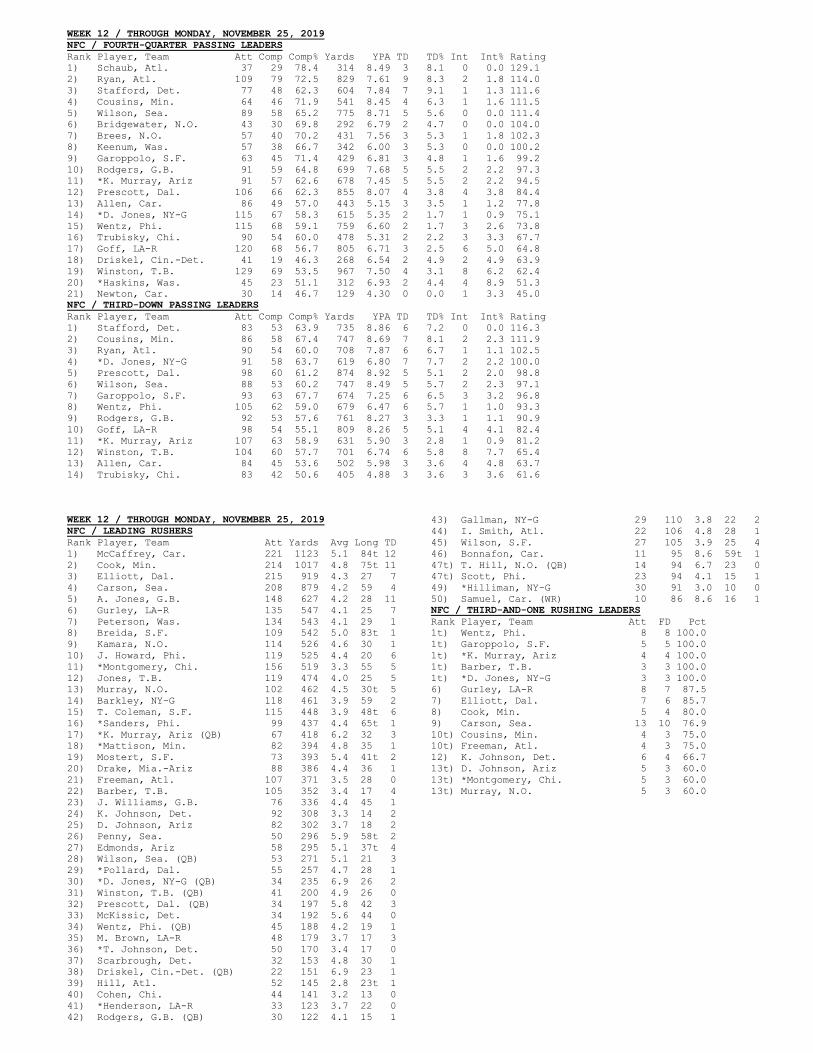
WEEK 12 / THROUGH MONDAY, NOVEMBER 25, 2019 NFC / FOURTH-QUARTER PASSING LEADERS Rank Player, Team Att Comp Comp% Yards YPA TD TD% Int Int% Rating 1) Schaub, Atl. 37 29 78.4 314 8.49 3 8.1 0 0.0 129.1 2) Ryan, Atl. 109 79 72.5 829 7.61 9 8.3 2 1.8 114.0 3) Stafford, Det. 77 48 62.3 604 7.84 7 9.1 1 1.3 111.6 4) Cousins, Min. 64 46 71.9 541 8.45 4 6.3 1 1.6 111.5 5) Wilson, Sea. 89 58 65.2 775 8.71 5 5.6 0 0.0 111.4 6) Bridgewater, N.O. 43 30 69.8 292 6.79 2 4.7 0 0.0 104.0 7) Brees, N.O. 57 40 70.2 431 7.56 3 5.3 1 1.8 102.3 8) Keenum, Was. 57 38 66.7 342 6.00 3 5.3 0 0.0 100.2 9) Garoppolo, S.F. 63 45 71.4 429 6.81 3 4.8 1 1.6 99.2 10) Rodgers, G.B. 91 59 64.8 699 7.68 5 5.5 2 2.2 97.3 11) *K. Murray, Ariz 91 57 62.6 678 7.45 5 5.5 2 2.2 94.5 12) Prescott, Dal. 106 66 62.3 855 8.07 4 3.8 4 3.8 84.4 13) Allen, Car. 86 49 57.0 443 5.15 3 3.5 1 1.2 77.8 14) *D. Jones, NY-G 115 67 58.3 615 5.35 2 1.7 1 0.9 75.1 15) Wentz, Phi. 115 68 59.1 759 6.60 2 1.7 3 2.6 73.8 16) Trubisky, Chi. 90 54 60.0 478 5.31 2 2.2 3 3.3 67.7 17) Goff, LA-R 120 68 56.7 805 6.71 3 2.5 6 5.0 64.8 18) Driskel, Cin.-Det. 41 19 46.3 268 6.54 2 4.9 2 4.9 63.9 19) Winston, T.B. 129 69 53.5 967 7.50 4 3.1 8 6.2 62.4 20) *Haskins, Was. 45 23 51.1 312 6.93 2 4.4 4 8.9 51.3 21) Newton, Car. 30 14 46.7 129 4.30 0 0.0 1 3.3 45.0 NFC / THIRD-DOWN PASSING LEADERS Rank Player, Team Att Comp Comp% Yards YPA TD TD% Int Int% Rating 1) Stafford, Det. 83 53 63.9 735 8.86 6 7.2 0 0.0 116.3 2) Cousins, Min. 86 58 67.4 747 8.69 7 8.1 2 2.3 111.9 3) Ryan, Atl. 90 54 60.0 708 7.87 6 6.7 1 1.1 102.5 4) *D. Jones, NY-G 91 58 63.7 619 6.80 7 7.7 2 2.2 100.0 5) Prescott, Dal. 98 60 61.2 874 8.92 5 5.1 2 2.0 98.8 6) Wilson, Sea. 88 53 60.2 747 8.49 5 5.7 2 2.3 97.1 7) Garoppolo, S.F. 93 63 67.7 674 7.25 6 6.5 3 3.2 96.8 8) Wentz, Phi. 105 62 59.0 679 6.47 6 5.7 1 1.0 93.3 9) Rodgers, G.B. 92 53 57.6 761 8.27 3 3.3 1 1.1 90.9 10) Goff, LA-R 98 54 55.1 809 8.26 5 5.1 4 4.1 82.4 11) *K. Murray, Ariz 107 63 58.9 631 5.90 3 2.8 1 0.9 81.2 12) Winston, T.B. 104 60 57.7 701 6.74 6 5.8 8 7.7 65.4 13) Allen, Car. 84 45 53.6 502 5.98 3 3.6 4 4.8 63.7 14) Trubisky, Chi. 83 42 50.6 405 4.88 3 3.6 3 3.6 61.6 WEEK 12 / THROUGH MONDAY, NOVEMBER 25, 2019 NFC / LEADING RUSHERS Rank Player, Team Att Yards Avg Long TD 1) McCaffrey, Car. 221 1123 5.1 84t 12 2) Cook, Min. 214 1017 4.8 75t 11 3) Elliott, Dal. 215 919 4.3 27 7 4) Carson, Sea. 208 879 4.2 59 4 5) A. Jones, G.B. 148 627 4.2 28 11 6) Gurley, LA-R 135 547 4.1 25 7 7) Peterson, Was. 134 543 4.1 29 1 8) Breida, S.F. 109 542 5.0 83t 1 9) Kamara, N.O. 114 526 4.6 30 1 10) J. Howard, Phi. 119 525 4.4 20 6 11) *Montgomery, Chi. 156 519 3.3 55 5 12) Jones, T.B. 119 474 4.0 25 5 13) Murray, N.O. 102 462 4.5 30t 5 14) Barkley, NY-G 118 461 3.9 59 2 15) T. Coleman, S.F. 115 448 3.9 48t 6 16) *Sanders, Phi. 99 437 4.4 65t 1 17) *K. Murray, Ariz (QB) 67 418 6.2 32 3 18) *Mattison, Min. 82 394 4.8 35 1 19) Mostert, S.F. 73 393 5.4 41t 2 20) Drake, Mia.-Ariz 88 386 4.4 36 1 21) Freeman, Atl. 107 371 3.5 28 0 22) Barber, T.B. 105 352 3.4 17 4 23) J. Williams, G.B. 76 336 4.4 45 1 24) K. Johnson, Det. 92 308 3.3 14 2 25) D. Johnson, Ariz 82 302 3.7 18 2 26) Penny, Sea. 50 296 5.9 58t 2 27) Edmonds, Ariz 58 295 5.1 37t 4 28) Wilson, Sea. (QB) 53 271 5.1 21 3 29) *Pollard, Dal. 55 257 4.7 28 1 30) *D. Jones, NY-G (QB) 34 235 6.9 26 2 31) Winston, T.B. (QB) 41 200 4.9 26 0 32) Prescott, Dal. (QB) 34 197 5.8 42 3 33) McKissic, Det. 34 192 5.6 44 0 34) Wentz, Phi. (QB) 45 188 4.2 19 1 35) M. Brown, LA-R 48 179 3.7 17 3 36) *T. Johnson, Det. 50 170 3.4 17 0 37) Scarbrough, Det. 32 153 4.8 30 1 38) Driskel, Cin.-Det. (QB) 22 151 6.9 23 1 39) Hill, Atl. 52 145 2.8 23t 1 40) Cohen, Chi. 44 141 3.2 13 0 41) *Henderson, LA-R 33 123 3.7 22 0 42) Rodgers, G.B. (QB) 30 122 4.1 15 1
43) Gallman, NY-G 29 110 3.8 22 2 44) I. Smith, Atl. 22 106 4.8 28 1 45) Wilson, S.F. 27 105 3.9 25 4 46) Bonnafon, Car. 11 95 8.6 59t 1 47t) T. Hill, N.O. (QB) 14 94 6.7 23 0 47t) Scott, Phi. 23 94 4.1 15 1 49) *Hilliman, NY-G 30 91 3.0 10 0 50) Samuel, Car. (WR) 10 86 8.6 16 1 NFC / THIRD-AND-ONE RUSHING LEADERS Rank Player, Team Att FD Pct 1t) Wentz, Phi. 8 8 100.0 1t) Garoppolo, S.F. 5 5 100.0 1t) *K. Murray, Ariz 4 4 100.0 1t) Barber, T.B. 3 3 100.0 1t) *D. Jones, NY-G 3 3 100.0 6) Gurley, LA-R 8 7 87.5 7) Elliott, Dal. 7 6 85.7 8) Cook, Min. 5 4 80.0 9) Carson, Sea. 13 10 76.9 10t) Cousins, Min. 4 3 75.0 10t) Freeman, Atl. 4 3 75.0 12) K. Johnson, Det. 6 4 66.7 13t) D. Johnson, Ariz 5 3 60.0 13t) *Montgomery, Chi. 5 3 60.0 13t) Murray, N.O. 5 3 60.0
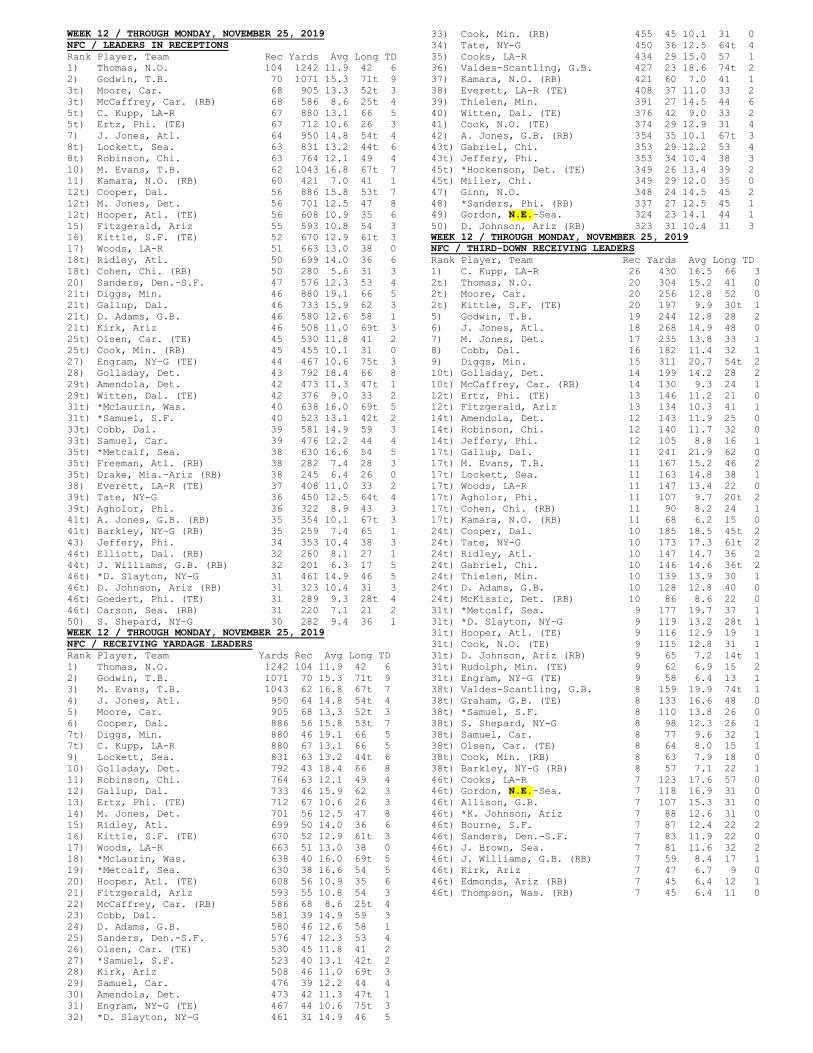
WEEK 12 / THROUGH MONDAY, NOVEMBER 25, 2019 NFC / LEADERS IN RECEPTIONS Rank Player, Team Rec Yards Avg Long TD 1) Thomas, N.O. 104 1242 11.9 42 6 2) Godwin, T.B. 70 1071 15.3 71t 9 3t) Moore, Car. 68 905 13.3 52t 3 3t) McCaffrey, Car. (RB) 68 586 8.6 25t 4 5t) C. Kupp, LA-R 67 880 13.1 66 5 5t) Ertz, Phi. (TE) 67 712 10.6 26 3 7) J. Jones, Atl. 64 950 14.8 54t 4 8t) Lockett, Sea. 63 831 13.2 44t 6 8t) Robinson, Chi. 63 764 12.1 49 4 10) M. Evans, T.B. 62 1043 16.8 67t 7 11) Kamara, N.O. (RB) 60 421 7.0 41 1 12t) Cooper, Dal. 56 886 15.8 53t 7 12t) M. Jones, Det. 56 701 12.5 47 8 12t) Hooper, Atl. (TE) 56 608 10.9 35 6 15) Fitzgerald, Ariz 55 593 10.8 54 3 16) Kittle, S.F. (TE) 52 670 12.9 61t 3 17) Woods, LA-R 51 663 13.0 38 0 18t) Ridley, Atl. 50 699 14.0 36 6 18t) Cohen, Chi. (RB) 50 280 5.6 31 3 20) Sanders, Den.-S.F. 47 576 12.3 53 4 21t) Diggs, Min. 46 880 19.1 66 5 21t) Gallup, Dal. 46 733 15.9 62 3 21t) D. Adams, G.B. 46 580 12.6 58 1 21t) Kirk, Ariz 46 508 11.0 69t 3 25t) Olsen, Car. (TE) 45 530 11.8 41 2 25t) Cook, Min. (RB) 45 455 10.1 31 0 27) Engram, NY-G (TE) 44 467 10.6 75t 3 28) Golladay, Det. 43 792 18.4 66 8 29t) Amendola, Det. 42 473 11.3 47t 1 29t) Witten, Dal. (TE) 42 376 9.0 33 2 31t) *McLaurin, Was. 40 638 16.0 69t 5 31t) *Samuel, S.F. 40 523 13.1 42t 2 33t) Cobb, Dal. 39 581 14.9 59 3 33t) Samuel, Car. 39 476 12.2 44 4 35t) *Metcalf, Sea. 38 630 16.6 54 5 35t) Freeman, Atl. (RB) 38 282 7.4 28 3 35t) Drake, Mia.-Ariz (RB) 38 245 6.4 26 0 38) Everett, LA-R (TE) 37 408 11.0 33 2 39t) Tate, NY-G 36 450 12.5 64t 4 39t) Agholor, Phi. 36 322 8.9 43 3 41t) A. Jones, G.B. (RB) 35 354 10.1 67t 3 41t) Barkley, NY-G (RB) 35 259 7.4 65 1 43) Jeffery, Phi. 34 353 10.4 38 3 44t) Elliott, Dal. (RB) 32 260 8.1 27 1 44t) J. Williams, G.B. (RB) 32 201 6.3 17 5 46t) *D. Slayton, NY-G 31 461 14.9 46 5 46t) D. Johnson, Ariz (RB) 31 323 10.4 31 3 46t) Goedert, Phi. (TE) 31 289 9.3 28t 4 46t) Carson, Sea. (RB) 31 220 7.1 21 2 50) S. Shepard, NY-G 30 282 9.4 36 1 WEEK 12 / THROUGH MONDAY, NOVEMBER 25, 2019 NFC / RECEIVING YARDAGE LEADERS Rank Player, Team Yards Rec Avg Long TD 1) Thomas, N.O. 1242 104 11.9 42 6 2) Godwin, T.B. 1071 70 15.3 71t 9 3) M. Evans, T.B. 1043 62 16.8 67t 7 4) J. Jones, Atl. 950 64 14.8 54t 4 5) Moore, Car. 905 68 13.3 52t 3 6) Cooper, Dal. 886 56 15.8 53t 7 7t) Diggs, Min. 880 46 19.1 66 5 7t) C. Kupp, LA-R 880 67 13.1 66 5 9) Lockett, Sea. 831 63 13.2 44t 6 10) Golladay, Det. 792 43 18.4 66 8 11) Robinson, Chi. 764 63 12.1 49 4 12) Gallup, Dal. 733 46 15.9 62 3 13) Ertz, Phi. (TE) 712 67 10.6 26 3 14) M. Jones, Det. 701 56 12.5 47 8 15) Ridley, Atl. 699 50 14.0 36 6 16) Kittle, S.F. (TE) 670 52 12.9 61t 3 17) Woods, LA-R 663 51 13.0 38 0 18) *McLaurin, Was. 638 40 16.0 69t 5 19) *Metcalf, Sea. 630 38 16.6 54 5 20) Hooper, Atl. (TE) 608 56 10.9 35 6 21) Fitzgerald, Ariz 593 55 10.8 54 3 22) McCaffrey, Car. (RB) 586 68 8.6 25t 4 23) Cobb, Dal. 581 39 14.9 59 3 24) D. Adams, G.B. 580 46 12.6 58 1 25) Sanders, Den.-S.F. 576 47 12.3 53 4 26) Olsen, Car. (TE) 530 45 11.8 41 2 27) *Samuel, S.F. 523 40 13.1 42t 2 28) Kirk, Ariz 508 46 11.0 69t 3 29) Samuel, Car. 476 39 12.2 44 4 30) Amendola, Det. 473 42 11.3 47t 1 31) Engram, NY-G (TE) 467 44 10.6 75t 3 32) *D. Slayton, NY-G 461 31 14.9 46 5
33) Cook, Min. (RB) 455 45 10.1 31 0 34) Tate, NY-G 450 36 12.5 64t 4 35) Cooks, LA-R 434 29 15.0 57 1 36) Valdes-Scantling, G.B. 427 23 18.6 74t 2 37) Kamara, N.O. (RB) 421 60 7.0 41 1 38) Everett, LA-R (TE) 408 37 11.0 33 2 39) Thielen, Min. 391 27 14.5 44 6 40) Witten, Dal. (TE) 376 42 9.0 33 2 41) Cook, N.O. (TE) 374 29 12.9 31 4 42) A. Jones, G.B. (RB) 354 35 10.1 67t 3 43t) Gabriel, Chi. 353 29 12.2 53 4 43t) Jeffery, Phi. 353 34 10.4 38 3 45t) *Hockenson, Det. (TE) 349 26 13.4 39 2 45t) Miller, Chi. 349 29 12.0 35 0 47) Ginn, N.O. 348 24 14.5 45 2 48) *Sanders, Phi. (RB) 337 27 12.5 45 1 49) Gordon, N.E.-Sea. 324 23 14.1 44 1 50) D. Johnson, Ariz (RB) 323 31 10.4 31 3 WEEK 12 / THROUGH MONDAY, NOVEMBER 25, 2019 NFC / THIRD-DOWN RECEIVING LEADERS Rank Player, Team Rec Yards Avg Long TD 1) C. Kupp, LA-R 26 430 16.5 66 3 2t) Thomas, N.O. 20 304 15.2 41 0 2t) Moore, Car. 20 256 12.8 52 0 2t) Kittle, S.F. (TE) 20 197 9.9 30t 1 5) Godwin, T.B. 19 244 12.8 28 2 6) J. Jones, Atl. 18 268 14.9 48 0 7) M. Jones, Det. 17 235 13.8 33 1 8) Cobb, Dal. 16 182 11.4 32 1 9) Diggs, Min. 15 311 20.7 54t 2 10t) Golladay, Det. 14 199 14.2 28 2 10t) McCaffrey, Car. (RB) 14 130 9.3 24 1 12t) Ertz, Phi. (TE) 13 146 11.2 21 0 12t) Fitzgerald, Ariz 13 134 10.3 41 1 14t) Amendola, Det. 12 143 11.9 25 0 14t) Robinson, Chi. 12 140 11.7 32 0 14t) Jeffery, Phi. 12 105 8.8 16 1 17t) Gallup, Dal. 11 241 21.9 62 0 17t) M. Evans, T.B. 11 167 15.2 46 2 17t) Lockett, Sea. 11 163 14.8 38 1 17t) Woods, LA-R 11 147 13.4 22 0 17t) Agholor, Phi. 11 107 9.7 20t 2 17t) Cohen, Chi. (RB) 11 90 8.2 24 1 17t) Kamara, N.O. (RB) 11 68 6.2 15 0 24t) Cooper, Dal. 10 185 18.5 45t 2 24t) Tate, NY-G 10 173 17.3 61t 2 24t) Ridley, Atl. 10 147 14.7 36 2 24t) Gabriel, Chi. 10 146 14.6 36t 2 24t) Thielen, Min. 10 139 13.9 30 1 24t) D. Adams, G.B. 10 128 12.8 40 0 24t) McKissic, Det. (RB) 10 86 8.6 22 0 31t) *Metcalf, Sea. 9 177 19.7 37 1 31t) *D. Slayton, NY-G 9 119 13.2 28t 1 31t) Hooper, Atl. (TE) 9 116 12.9 19 1 31t) Cook, N.O. (TE) 9 115 12.8 31 1 31t) D. Johnson, Ariz (RB) 9 65 7.2 14t 1 31t) Rudolph, Min. (TE) 9 62 6.9 15 2 31t) Engram, NY-G (TE) 9 58 6.4 13 1 38t) Valdes-Scantling, G.B. 8 159 19.9 74t 1 38t) Graham, G.B. (TE) 8 133 16.6 48 0 38t) *Samuel, S.F. 8 110 13.8 26 0 38t) S. Shepard, NY-G 8 98 12.3 26 1 38t) Samuel, Car. 8 77 9.6 32 1 38t) Olsen, Car. (TE) 8 64 8.0 15 1 38t) Cook, Min. (RB) 8 63 7.9 18 0 38t) Barkley, NY-G (RB) 8 57 7.1 22 1 46t) Cooks, LA-R 7 123 17.6 57 0 46t) Gordon, N.E.-Sea. 7 118 16.9 31 0 46t) Allison, G.B. 7 107 15.3 31 0 46t) *K. Johnson, Ariz 7 88 12.6 31 0 46t) Bourne, S.F. 7 87 12.4 22 2 46t) Sanders, Den.-S.F. 7 83 11.9 22 0 46t) J. Brown, Sea. 7 81 11.6 32 2 46t) J. Williams, G.B. (RB) 7 59 8.4 17 1 46t) Kirk, Ariz 7 47 6.7 9 0 46t) Edmonds, Ariz (RB) 7 45 6.4 12 1 46t) Thompson, Was. (RB) 7 45 6.4 11 0
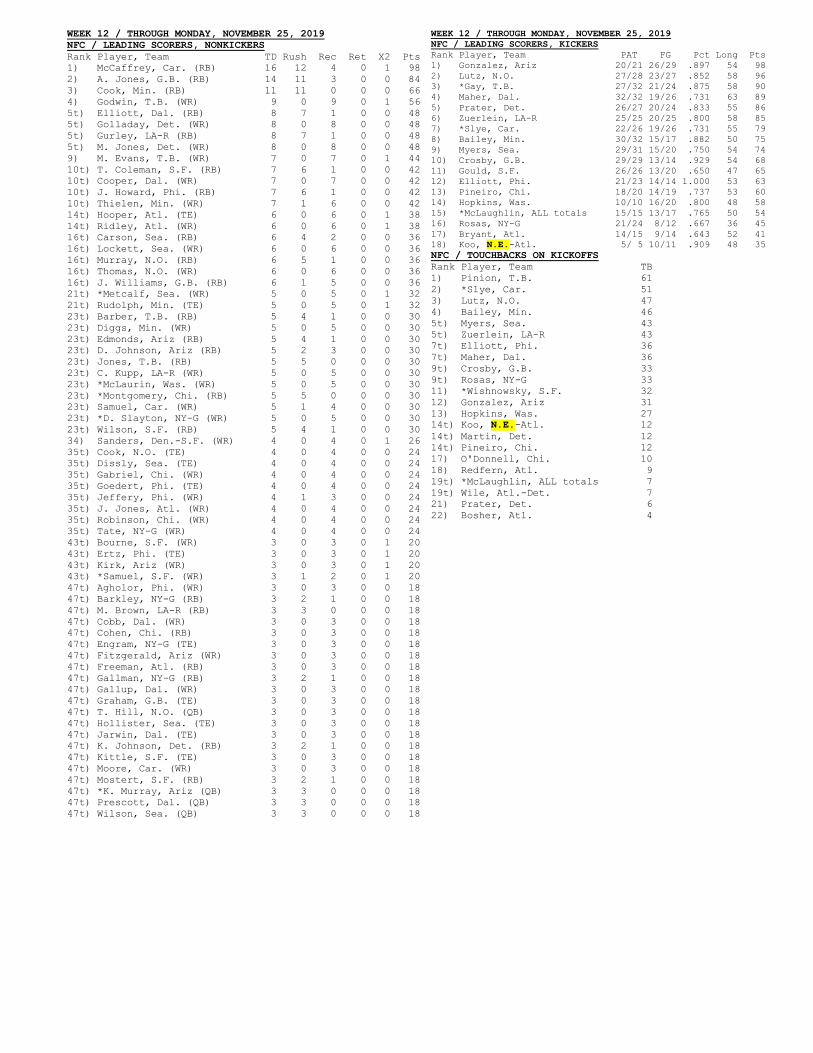
WEEK 12 / THROUGH MONDAY, NOVEMBER 25, 2019 NFC / LEADING SCORERS, NONKICKERS Rank Player, Team TD Rush Rec Ret X2 Pts 1) McCaffrey, Car. (RB) 16 12 4 0 1 98 2) A. Jones, G.B. (RB) 14 11 3 0 0 84 3) Cook, Min. (RB) 11 11 0 0 0 66 4) Godwin, T.B. (WR) 9 0 9 0 1 56 5t) Elliott, Dal. (RB) 8 7 1 0 0 48 5t) Golladay, Det. (WR) 8 0 8 0 0 48 5t) Gurley, LA-R (RB) 8 7 1 0 0 48 5t) M. Jones, Det. (WR) 8 0 8 0 0 48 9) M. Evans, T.B. (WR) 7 0 7 0 1 44 10t) T. Coleman, S.F. (RB) 7 6 1 0 0 42 10t) Cooper, Dal. (WR) 7 0 7 0 0 42 10t) J. Howard, Phi. (RB) 7 6 1 0 0 42 10t) Thielen, Min. (WR) 7 1 6 0 0 42 14t) Hooper, Atl. (TE) 6 0 6 0 1 38 14t) Ridley, Atl. (WR) 6 0 6 0 1 38 16t) Carson, Sea. (RB) 6 4 2 0 0 36 16t) Lockett, Sea. (WR) 6 0 6 0 0 36 16t) Murray, N.O. (RB) 6 5 1 0 0 36 16t) Thomas, N.O. (WR) 6 0 6 0 0 36 16t) J. Williams, G.B. (RB) 6 1 5 0 0 36 21t) *Metcalf, Sea. (WR) 5 0 5 0 1 32 21t) Rudolph, Min. (TE) 5 0 5 0 1 32 23t) Barber, T.B. (RB) 5 4 1 0 0 30 23t) Diggs, Min. (WR) 5 0 5 0 0 30 23t) Edmonds, Ariz (RB) 5 4 1 0 0 30 23t) D. Johnson, Ariz (RB) 5 2 3 0 0 30 23t) Jones, T.B. (RB) 5 5 0 0 0 30 23t) C. Kupp, LA-R (WR) 5 0 5 0 0 30 23t) *McLaurin, Was. (WR) 5 0 5 0 0 30 23t) *Montgomery, Chi. (RB) 5 5 0 0 0 30 23t) Samuel, Car. (WR) 5 1 4 0 0 30 23t) *D. Slayton, NY-G (WR) 5 0 5 0 0 30 23t) Wilson, S.F. (RB) 5 4 1 0 0 30 34) Sanders, Den.-S.F. (WR) 4 0 4 0 1 26 35t) Cook, N.O. (TE) 4 0 4 0 0 24 35t) Dissly, Sea. (TE) 4 0 4 0 0 24 35t) Gabriel, Chi. (WR) 4 0 4 0 0 24 35t) Goedert, Phi. (TE) 4 0 4 0 0 24 35t) Jeffery, Phi. (WR) 4 1 3 0 0 24 35t) J. Jones, Atl. (WR) 4 0 4 0 0 24 35t) Robinson, Chi. (WR) 4 0 4 0 0 24 35t) Tate, NY-G (WR) 4 0 4 0 0 24 43t) Bourne, S.F. (WR) 3 0 3 0 1 20 43t) Ertz, Phi. (TE) 3 0 3 0 1 20 43t) Kirk, Ariz (WR) 3 0 3 0 1 20 43t) *Samuel, S.F. (WR) 3 1 2 0 1 20 47t) Agholor, Phi. (WR) 3 0 3 0 0 18 47t) Barkley, NY-G (RB) 3 2 1 0 0 18 47t) M. Brown, LA-R (RB) 3 3 0 0 0 18 47t) Cobb, Dal. (WR) 3 0 3 0 0 18 47t) Cohen, Chi. (RB) 3 0 3 0 0 18 47t) Engram, NY-G (TE) 3 0 3 0 0 18 47t) Fitzgerald, Ariz (WR) 3 0 3 0 0 18 47t) Freeman, Atl. (RB) 3 0 3 0 0 18 47t) Gallman, NY-G (RB) 3 2 1 0 0 18 47t) Gallup, Dal. (WR) 3 0 3 0 0 18 47t) Graham, G.B. (TE) 3 0 3 0 0 18 47t) T. Hill, N.O. (QB) 3 0 3 0 0 18 47t) Hollister, Sea. (TE) 3 0 3 0 0 18 47t) Jarwin, Dal. (TE) 3 0 3 0 0 18 47t) K. Johnson, Det. (RB) 3 2 1 0 0 18 47t) Kittle, S.F. (TE) 3 0 3 0 0 18 47t) Moore, Car. (WR) 3 0 3 0 0 18 47t) Mostert, S.F. (RB) 3 2 1 0 0 18 47t) *K. Murray, Ariz (QB) 3 3 0 0 0 18 47t) Prescott, Dal. (QB) 3 3 0 0 0 18 47t) Wilson, Sea. (QB) 3 3 0 0 0 18
WEEK 12 / THROUGH MONDAY, NOVEMBER 25, 2019 NFC / LEADING SCORERS, KICKERS Rank Player, Team PAT FG Pct Long Pts 1) Gonzalez, Ariz 20/21 26/29 .897 54 98 2) Lutz, N.O. 27/28 23/27 .852 58 96 3) *Gay, T.B. 27/32 21/24 .875 58 90 4) Maher, Dal. 32/32 19/26 .731 63 89 5) Prater, Det. 26/27 20/24 .833 55 86 6) Zuerlein, LA-R 25/25 20/25 .800 58 85 7) *Slye, Car. 22/26 19/26 .731 55 79 8) Bailey, Min. 30/32 15/17 .882 50 75 9) Myers, Sea. 29/31 15/20 .750 54 74 10) Crosby, G.B. 29/29 13/14 .929 54 68 11) Gould, S.F. 26/26 13/20 .650 47 65 12) Elliott, Phi. 21/23 14/14 1.000 53 63 13) Pineiro, Chi. 18/20 14/19 .737 53 60 14) Hopkins, Was. 10/10 16/20 .800 48 58 15) *McLaughlin, ALL totals 15/15 13/17 .765 50 54 16) Rosas, NY-G 21/24 8/12 .667 36 45 17) Bryant, Atl. 14/15 9/14 .643 52 41 18) Koo, N.E.-Atl. 5/ 5 10/11 .909 48 35 NFC / TOUCHBACKS ON KICKOFFS Rank Player, Team TB 1) Pinion, T.B. 61 2) *Slye, Car. 51 3) Lutz, N.O. 47 4) Bailey, Min. 46 5t) Myers, Sea. 43 5t) Zuerlein, LA-R 43 7t) Elliott, Phi. 36 7t) Maher, Dal. 36 9t) Crosby, G.B. 33 9t) Rosas, NY-G 33 11) *Wishnowsky, S.F. 32 12) Gonzalez, Ariz 31 13) Hopkins, Was. 27 14t) Koo, N.E.-Atl. 12 14t) Martin, Det. 12 14t) Pineiro, Chi. 12 17) O'Donnell, Chi. 10 18) Redfern, Atl. 9 19t) *McLaughlin, ALL totals 7 19t) Wile, Atl.-Det. 7 21) Prater, Det. 6 22) Bosher, Atl. 4
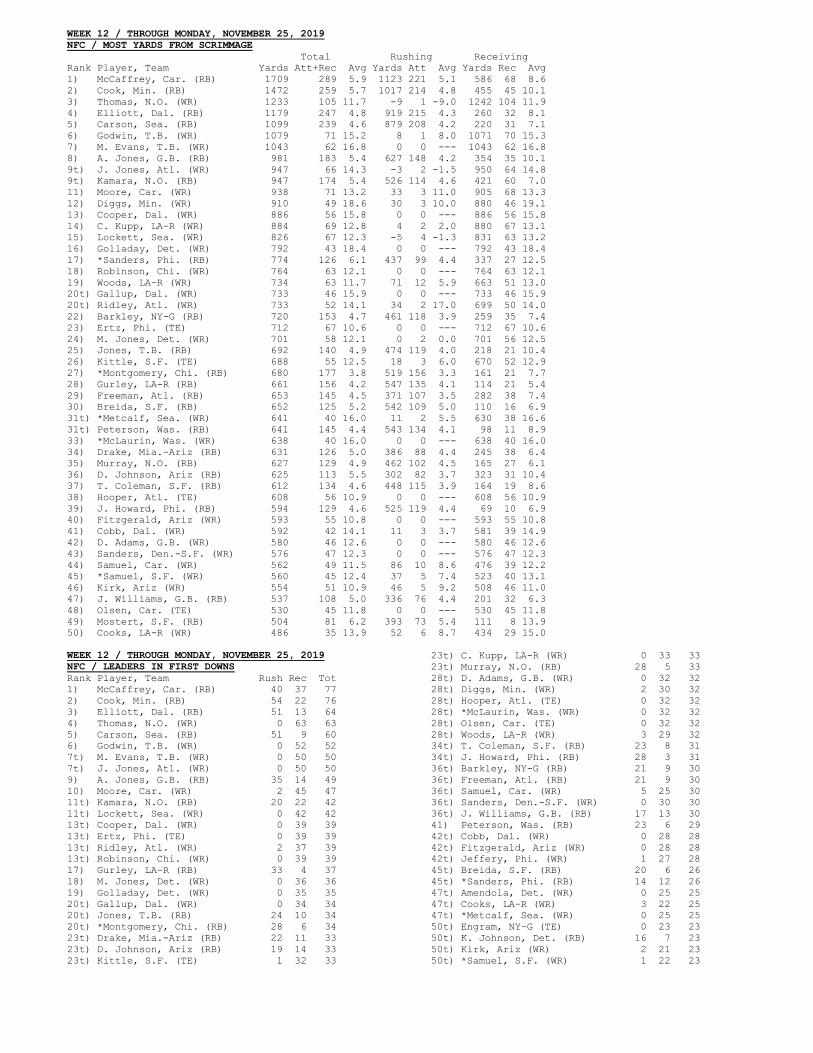
WEEK 12 / THROUGH MONDAY, NOVEMBER 25, 2019 NFC / MOST YARDS FROM SCRIMMAGE Total Rushing Receiving Rank Player, Team Yards Att+Rec Avg Yards Att Avg Yards Rec Avg 1) McCaffrey, Car. (RB) 1709 289 5.9 1123 221 5.1 586 68 8.6 2) Cook, Min. (RB) 1472 259 5.7 1017 214 4.8 455 45 10.1 3) Thomas, N.O. (WR) 1233 105 11.7 -9 1 -9.0 1242 104 11.9 4) Elliott, Dal. (RB) 1179 247 4.8 919 215 4.3 260 32 8.1 5) Carson, Sea. (RB) 1099 239 4.6 879 208 4.2 220 31 7.1 6) Godwin, T.B. (WR) 1079 71 15.2 8 1 8.0 1071 70 15.3 7) M. Evans, T.B. (WR) 1043 62 16.8 0 0 --- 1043 62 16.8 8) A. Jones, G.B. (RB) 981 183 5.4 627 148 4.2 354 35 10.1 9t) J. Jones, Atl. (WR) 947 66 14.3 -3 2 -1.5 950 64 14.8 9t) Kamara, N.O. (RB) 947 174 5.4 526 114 4.6 421 60 7.0 11) Moore, Car. (WR) 938 71 13.2 33 3 11.0 905 68 13.3 12) Diggs, Min. (WR) 910 49 18.6 30 3 10.0 880 46 19.1 13) Cooper, Dal. (WR) 886 56 15.8 0 0 --- 886 56 15.8 14) C. Kupp, LA-R (WR) 884 69 12.8 4 2 2.0 880 67 13.1 15) Lockett, Sea. (WR) 826 67 12.3 -5 4 -1.3 831 63 13.2 16) Golladay, Det. (WR) 792 43 18.4 0 0 --- 792 43 18.4 17) *Sanders, Phi. (RB) 774 126 6.1 437 99 4.4 337 27 12.5 18) Robinson, Chi. (WR) 764 63 12.1 0 0 --- 764 63 12.1 19) Woods, LA-R (WR) 734 63 11.7 71 12 5.9 663 51 13.0 20t) Gallup, Dal. (WR) 733 46 15.9 0 0 --- 733 46 15.9 20t) Ridley, Atl. (WR) 733 52 14.1 34 2 17.0 699 50 14.0 22) Barkley, NY-G (RB) 720 153 4.7 461 118 3.9 259 35 7.4 23) Ertz, Phi. (TE) 712 67 10.6 0 0 --- 712 67 10.6 24) M. Jones, Det. (WR) 701 58 12.1 0 2 0.0 701 56 12.5 25) Jones, T.B. (RB) 692 140 4.9 474 119 4.0 218 21 10.4 26) Kittle, S.F. (TE) 688 55 12.5 18 3 6.0 670 52 12.9 27) *Montgomery, Chi. (RB) 680 177 3.8 519 156 3.3 161 21 7.7 28) Gurley, LA-R (RB) 661 156 4.2 547 135 4.1 114 21 5.4 29) Freeman, Atl. (RB) 653 145 4.5 371 107 3.5 282 38 7.4 30) Breida, S.F. (RB) 652 125 5.2 542 109 5.0 110 16 6.9 31t) *Metcalf, Sea. (WR) 641 40 16.0 11 2 5.5 630 38 16.6 31t) Peterson, Was. (RB) 641 145 4.4 543 134 4.1 98 11 8.9 33) *McLaurin, Was. (WR) 638 40 16.0 0 0 --- 638 40 16.0 34) Drake, Mia.-Ariz (RB) 631 126 5.0 386 88 4.4 245 38 6.4 35) Murray, N.O. (RB) 627 129 4.9 462 102 4.5 165 27 6.1 36) D. Johnson, Ariz (RB) 625 113 5.5 302 82 3.7 323 31 10.4 37) T. Coleman, S.F. (RB) 612 134 4.6 448 115 3.9 164 19 8.6 38) Hooper, Atl. (TE) 608 56 10.9 0 0 --- 608 56 10.9 39) J. Howard, Phi. (RB) 594 129 4.6 525 119 4.4 69 10 6.9 40) Fitzgerald, Ariz (WR) 593 55 10.8 0 0 --- 593 55 10.8 41) Cobb, Dal. (WR) 592 42 14.1 11 3 3.7 581 39 14.9 42) D. Adams, G.B. (WR) 580 46 12.6 0 0 --- 580 46 12.6 43) Sanders, Den.-S.F. (WR) 576 47 12.3 0 0 --- 576 47 12.3 44) Samuel, Car. (WR) 562 49 11.5 86 10 8.6 476 39 12.2 45) *Samuel, S.F. (WR) 560 45 12.4 37 5 7.4 523 40 13.1 46) Kirk, Ariz (WR) 554 51 10.9 46 5 9.2 508 46 11.0 47) J. Williams, G.B. (RB) 537 108 5.0 336 76 4.4 201 32 6.3 48) Olsen, Car. (TE) 530 45 11.8 0 0 --- 530 45 11.8 49) Mostert, S.F. (RB) 504 81 6.2 393 73 5.4 111 8 13.9 50) Cooks, LA-R (WR) 486 35 13.9 52 6 8.7 434 29 15.0 WEEK 12 / THROUGH MONDAY, NOVEMBER 25, 2019 NFC / LEADERS IN FIRST DOWNS Rank Player, Team Rush Rec Tot 1) McCaffrey, Car. (RB) 40 37 77 2) Cook, Min. (RB) 54 22 76 3) Elliott, Dal. (RB) 51 13 64 4) Thomas, N.O. (WR) 0 63 63 5) Carson, Sea. (RB) 51 9 60 6) Godwin, T.B. (WR) 0 52 52 7t) M. Evans, T.B. (WR) 0 50 50 7t) J. Jones, Atl. (WR) 0 50 50 9) A. Jones, G.B. (RB) 35 14 49 10) Moore, Car. (WR) 2 45 47 11t) Kamara, N.O. (RB) 20 22 42 11t) Lockett, Sea. (WR) 0 42 42 13t) Cooper, Dal. (WR) 0 39 39 13t) Ertz, Phi. (TE) 0 39 39 13t) Ridley, Atl. (WR) 2 37 39 13t) Robinson, Chi. (WR) 0 39 39 17) Gurley, LA-R (RB) 33 4 37 18) M. Jones, Det. (WR) 0 36 36 19) Golladay, Det. (WR) 0 35 35 20t) Gallup, Dal. (WR) 0 34 34 20t) Jones, T.B. (RB) 24 10 34 20t) *Montgomery, Chi. (RB) 28 6 34 23t) Drake, Mia.-Ariz (RB) 22 11 33 23t) D. Johnson, Ariz (RB) 19 14 33 23t) Kittle, S.F. (TE) 1 32 33
23t) C. Kupp, LA-R (WR) 0 33 33 23t) Murray, N.O. (RB) 28 5 33 28t) D. Adams, G.B. (WR) 0 32 32 28t) Diggs, Min. (WR) 2 30 32 28t) Hooper, Atl. (TE) 0 32 32 28t) *McLaurin, Was. (WR) 0 32 32 28t) Olsen, Car. (TE) 0 32 32 28t) Woods, LA-R (WR) 3 29 32 34t) T. Coleman, S.F. (RB) 23 8 31 34t) J. Howard, Phi. (RB) 28 3 31 36t) Barkley, NY-G (RB) 21 9 30 36t) Freeman, Atl. (RB) 21 9 30 36t) Samuel, Car. (WR) 5 25 30 36t) Sanders, Den.-S.F. (WR) 0 30 30 36t) J. Williams, G.B. (RB) 17 13 30 41) Peterson, Was. (RB) 23 6 29 42t) Cobb, Dal. (WR) 0 28 28 42t) Fitzgerald, Ariz (WR) 0 28 28 42t) Jeffery, Phi. (WR) 1 27 28 45t) Breida, S.F. (RB) 20 6 26 45t) *Sanders, Phi. (RB) 14 12 26 47t) Amendola, Det. (WR) 0 25 25 47t) Cooks, LA-R (WR) 3 22 25 47t) *Metcalf, Sea. (WR) 0 25 25 50t) Engram, NY-G (TE) 0 23 23 50t) K. Johnson, Det. (RB) 16 7 23 50t) Kirk, Ariz (WR) 2 21 23 50t) *Samuel, S.F. (WR) 1 22 23
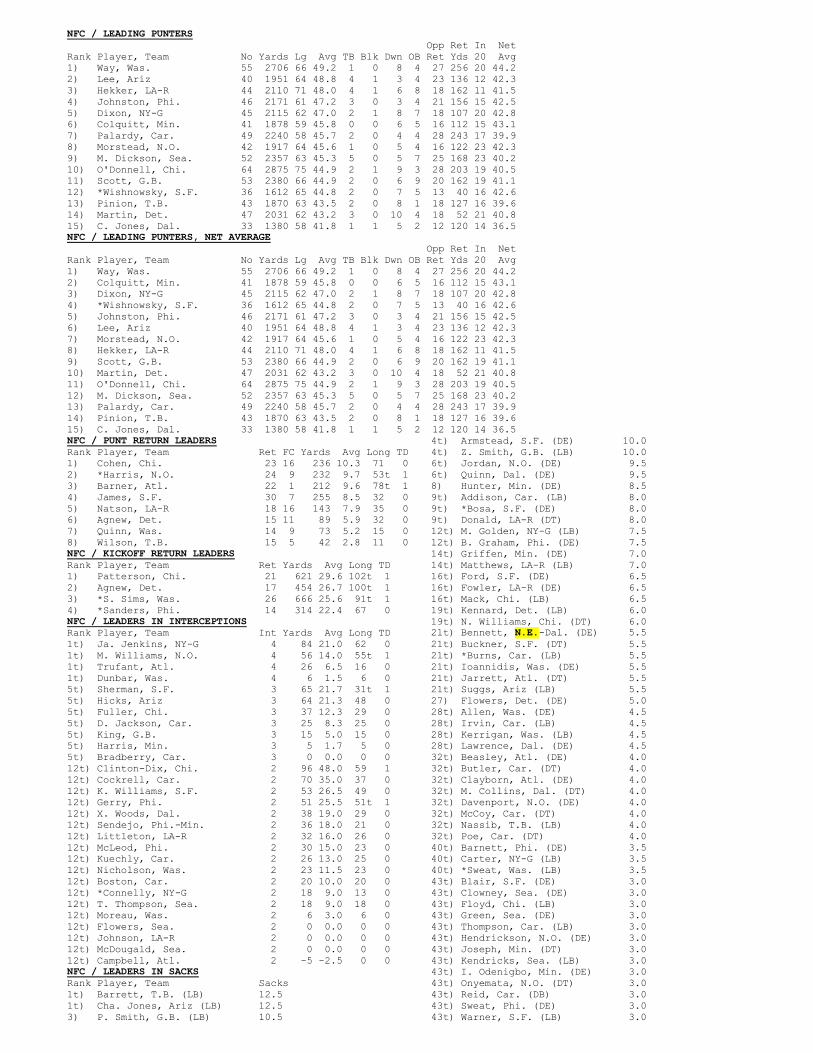
NFC / LEADING PUNTERS Opp Ret In Net Rank Player, Team No Yards Lg Avg TB Blk Dwn OB Ret Yds 20 Avg 1) Way, Was. 55 2706 66 49.2 1 0 8 4 27 256 20 44.2 2) Lee, Ariz 40 1951 64 48.8 4 1 3 4 23 136 12 42.3 3) Hekker, LA-R 44 2110 71 48.0 4 1 6 8 18 162 11 41.5 4) Johnston, Phi. 46 2171 61 47.2 3 0 3 4 21 156 15 42.5 5) Dixon, NY-G 45 2115 62 47.0 2 1 8 7 18 107 20 42.8 6) Colquitt, Min. 41 1878 59 45.8 0 0 6 5 16 112 15 43.1 7) Palardy, Car. 49 2240 58 45.7 2 0 4 4 28 243 17 39.9 8) Morstead, N.O. 42 1917 64 45.6 1 0 5 4 16 122 23 42.3 9) M. Dickson, Sea. 52 2357 63 45.3 5 0 5 7 25 168 23 40.2 10) O'Donnell, Chi. 64 2875 75 44.9 2 1 9 3 28 203 19 40.5 11) Scott, G.B. 53 2380 66 44.9 2 0 6 9 20 162 19 41.1 12) *Wishnowsky, S.F. 36 1612 65 44.8 2 0 7 5 13 40 16 42.6 13) Pinion, T.B. 43 1870 63 43.5 2 0 8 1 18 127 16 39.6 14) Martin, Det. 47 2031 62 43.2 3 0 10 4 18 52 21 40.8 15) C. Jones, Dal. 33 1380 58 41.8 1 1 5 2 12 120 14 36.5 NFC / LEADING PUNTERS, NET AVERAGE Opp Ret In Net Rank Player, Team No Yards Lg Avg TB Blk Dwn OB Ret Yds 20 Avg 1) Way, Was. 55 2706 66 49.2 1 0 8 4 27 256 20 44.2 2) Colquitt, Min. 41 1878 59 45.8 0 0 6 5 16 112 15 43.1 3) Dixon, NY-G 45 2115 62 47.0 2 1 8 7 18 107 20 42.8 4) *Wishnowsky, S.F. 36 1612 65 44.8 2 0 7 5 13 40 16 42.6 5) Johnston, Phi. 46 2171 61 47.2 3 0 3 4 21 156 15 42.5 6) Lee, Ariz 40 1951 64 48.8 4 1 3 4 23 136 12 42.3 7) Morstead, N.O. 42 1917 64 45.6 1 0 5 4 16 122 23 42.3 8) Hekker, LA-R 44 2110 71 48.0 4 1 6 8 18 162 11 41.5 9) Scott, G.B. 53 2380 66 44.9 2 0 6 9 20 162 19 41.1 10) Martin, Det. 47 2031 62 43.2 3 0 10 4 18 52 21 40.8 11) O'Donnell, Chi. 64 2875 75 44.9 2 1 9 3 28 203 19 40.5 12) M. Dickson, Sea. 52 2357 63 45.3 5 0 5 7 25 168 23 40.2 13) Palardy, Car. 49 2240 58 45.7 2 0 4 4 28 243 17 39.9 14) Pinion, T.B. 43 1870 63 43.5 2 0 8 1 18 127 16 39.6 15) C. Jones, Dal. 33 1380 58 41.8 1 1 5 2 12 120 14 36.5 NFC / PUNT RETURN LEADERS Rank Player, Team Ret FC Yards Avg Long TD 1) Cohen, Chi. 23 16 236 10.3 71 0 2) *Harris, N.O. 24 9 232 9.7 53t 1 3) Barner, Atl. 22 1 212 9.6 78t 1 4) James, S.F. 30 7 255 8.5 32 0 5) Natson, LA-R 18 16 143 7.9 35 0 6) Agnew, Det. 15 11 89 5.9 32 0 7) Quinn, Was. 14 9 73 5.2 15 0 8) Wilson, T.B. 15 5 42 2.8 11 0 NFC / KICKOFF RETURN LEADERS Rank Player, Team Ret Yards Avg Long TD 1) Patterson, Chi. 21 621 29.6 102t 1 2) Agnew, Det. 17 454 26.7 100t 1 3) *S. Sims, Was. 26 666 25.6 91t 1 4) *Sanders, Phi. 14 314 22.4 67 0 NFC / LEADERS IN INTERCEPTIONS Rank Player, Team Int Yards Avg Long TD 1t) Ja. Jenkins, NY-G 4 84 21.0 62 0 1t) M. Williams, N.O. 4 56 14.0 55t 1 1t) Trufant, Atl. 4 26 6.5 16 0 1t) Dunbar, Was. 4 6 1.5 6 0 5t) Sherman, S.F. 3 65 21.7 31t 1 5t) Hicks, Ariz 3 64 21.3 48 0 5t) Fuller, Chi. 3 37 12.3 29 0 5t) D. Jackson, Car. 3 25 8.3 25 0 5t) King, G.B. 3 15 5.0 15 0 5t) Harris, Min. 3 5 1.7 5 0 5t) Bradberry, Car. 3 0 0.0 0 0 12t) Clinton-Dix, Chi. 2 96 48.0 59 1 12t) Cockrell, Car. 2 70 35.0 37 0 12t) K. Williams, S.F. 2 53 26.5 49 0 12t) Gerry, Phi. 2 51 25.5 51t 1 12t) X. Woods, Dal. 2 38 19.0 29 0 12t) Sendejo, Phi.-Min. 2 36 18.0 21 0 12t) Littleton, LA-R 2 32 16.0 26 0 12t) McLeod, Phi. 2 30 15.0 23 0 12t) Kuechly, Car. 2 26 13.0 25 0 12t) Nicholson, Was. 2 23 11.5 23 0 12t) Boston, Car. 2 20 10.0 20 0 12t) *Connelly, NY-G 2 18 9.0 13 0 12t) T. Thompson, Sea. 2 18 9.0 18 0 12t) Moreau, Was. 2 6 3.0 6 0 12t) Flowers, Sea. 2 0 0.0 0 0 12t) Johnson, LA-R 2 0 0.0 0 0 12t) McDougald, Sea. 2 0 0.0 0 0 12t) Campbell, Atl. 2 -5 -2.5 0 0 NFC / LEADERS IN SACKS Rank Player, Team Sacks 1t) Barrett, T.B. (LB) 12.5 1t) Cha. Jones, Ariz (LB) 12.5 3) P. Smith, G.B. (LB) 10.5
4t) Armstead, S.F. (DE) 10.0 4t) Z. Smith, G.B. (LB) 10.0 6t) Jordan, N.O. (DE) 9.5 6t) Quinn, Dal. (DE) 9.5 8) Hunter, Min. (DE) 8.5 9t) Addison, Car. (LB) 8.0 9t) *Bosa, S.F. (DE) 8.0 9t) Donald, LA-R (DT) 8.0 12t) M. Golden, NY-G (LB) 7.5 12t) B. Graham, Phi. (DE) 7.5 14t) Griffen, Min. (DE) 7.0 14t) Matthews, LA-R (LB) 7.0 16t) Ford, S.F. (DE) 6.5 16t) Fowler, LA-R (DE) 6.5 16t) Mack, Chi. (LB) 6.5 19t) Kennard, Det. (LB) 6.0 19t) N. Williams, Chi. (DT) 6.0 21t) Bennett, N.E.-Dal. (DE) 5.5 21t) Buckner, S.F. (DT) 5.5 21t) *Burns, Car. (LB) 5.5 21t) Ioannidis, Was. (DE) 5.5 21t) Jarrett, Atl. (DT) 5.5 21t) Suggs, Ariz (LB) 5.5 27) Flowers, Det. (DE) 5.0 28t) Allen, Was. (DE) 4.5 28t) Irvin, Car. (LB) 4.5 28t) Kerrigan, Was. (LB) 4.5 28t) Lawrence, Dal. (DE) 4.5 32t) Beasley, Atl. (DE) 4.0 32t) Butler, Car. (DT) 4.0 32t) Clayborn, Atl. (DE) 4.0 32t) M. Collins, Dal. (DT) 4.0 32t) Davenport, N.O. (DE) 4.0 32t) McCoy, Car. (DT) 4.0 32t) Nassib, T.B. (LB) 4.0 32t) Poe, Car. (DT) 4.0 40t) Barnett, Phi. (DE) 3.5 40t) Carter, NY-G (LB) 3.5 40t) *Sweat, Was. (LB) 3.5 43t) Blair, S.F. (DE) 3.0 43t) Clowney, Sea. (DE) 3.0 43t) Floyd, Chi. (LB) 3.0 43t) Green, Sea. (DE) 3.0 43t) Thompson, Car. (LB) 3.0 43t) Hendrickson, N.O. (DE) 3.0 43t) Joseph, Min. (DT) 3.0 43t) Kendricks, Sea. (LB) 3.0 43t) I. Odenigbo, Min. (DE) 3.0 43t) Onyemata, N.O. (DT) 3.0 43t) Reid, Car. (DB) 3.0 43t) Sweat, Phi. (DE) 3.0 43t) Warner, S.F. (LB) 3.0
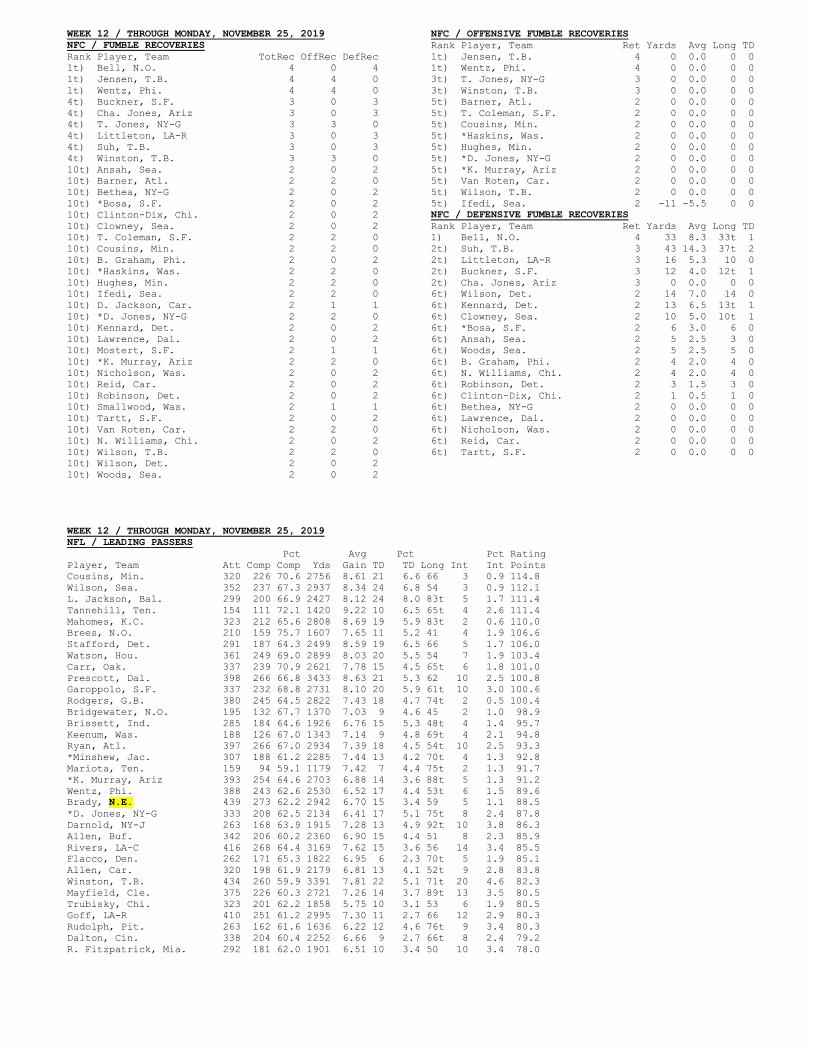
WEEK 12 / THROUGH MONDAY, NOVEMBER 25, 2019 NFC / FUMBLE RECOVERIES Rank Player, Team TotRec OffRec DefRec 1t) Bell, N.O. 4 0 4 1t) Jensen, T.B. 4 4 0 1t) Wentz, Phi. 4 4 0 4t) Buckner, S.F. 3 0 3 4t) Cha. Jones, Ariz 3 0 3 4t) T. Jones, NY-G 3 3 0 4t) Littleton, LA-R 3 0 3 4t) Suh, T.B. 3 0 3 4t) Winston, T.B. 3 3 0 10t) Ansah, Sea. 2 0 2 10t) Barner, Atl. 2 2 0 10t) Bethea, NY-G 2 0 2 10t) *Bosa, S.F. 2 0 2 10t) Clinton-Dix, Chi. 2 0 2 10t) Clowney, Sea. 2 0 2 10t) T. Coleman, S.F. 2 2 0 10t) Cousins, Min. 2 2 0 10t) B. Graham, Phi. 2 0 2 10t) *Haskins, Was. 2 2 0 10t) Hughes, Min. 2 2 0 10t) Ifedi, Sea. 2 2 0 10t) D. Jackson, Car. 2 1 1 10t) *D. Jones, NY-G 2 2 0 10t) Kennard, Det. 2 0 2 10t) Lawrence, Dal. 2 0 2 10t) Mostert, S.F. 2 1 1 10t) *K. Murray, Ariz 2 2 0 10t) Nicholson, Was. 2 0 2 10t) Reid, Car. 2 0 2 10t) Robinson, Det. 2 0 2 10t) Smallwood, Was. 2 1 1 10t) Tartt, S.F. 2 0 2 10t) Van Roten, Car. 2 2 0 10t) N. Williams, Chi. 2 0 2 10t) Wilson, T.B. 2 2 0 10t) Wilson, Det. 2 0 2 10t) Woods, Sea. 2 0 2
NFC / OFFENSIVE FUMBLE RECOVERIES Rank Player, Team Ret Yards Avg Long TD 1t) Jensen, T.B. 4 0 0.0 0 0 1t) Wentz, Phi. 4 0 0.0 0 0 3t) T. Jones, NY-G 3 0 0.0 0 0 3t) Winston, T.B. 3 0 0.0 0 0 5t) Barner, Atl. 2 0 0.0 0 0 5t) T. Coleman, S.F. 2 0 0.0 0 0 5t) Cousins, Min. 2 0 0.0 0 0 5t) *Haskins, Was. 2 0 0.0 0 0 5t) Hughes, Min. 2 0 0.0 0 0 5t) *D. Jones, NY-G 2 0 0.0 0 0 5t) *K. Murray, Ariz 2 0 0.0 0 0 5t) Van Roten, Car. 2 0 0.0 0 0 5t) Wilson, T.B. 2 0 0.0 0 0 5t) Ifedi, Sea. 2 -11 -5.5 0 0 NFC / DEFENSIVE FUMBLE RECOVERIES Rank Player, Team Ret Yards Avg Long TD 1) Bell, N.O. 4 33 8.3 33t 1 2t) Suh, T.B. 3 43 14.3 37t 2 2t) Littleton, LA-R 3 16 5.3 10 0 2t) Buckner, S.F. 3 12 4.0 12t 1 2t) Cha. Jones, Ariz 3 0 0.0 0 0 6t) Wilson, Det. 2 14 7.0 14 0 6t) Kennard, Det. 2 13 6.5 13t 1 6t) Clowney, Sea. 2 10 5.0 10t 1 6t) *Bosa, S.F. 2 6 3.0 6 0 6t) Ansah, Sea. 2 5 2.5 3 0 6t) Woods, Sea. 2 5 2.5 5 0 6t) B. Graham, Phi. 2 4 2.0 4 0 6t) N. Williams, Chi. 2 4 2.0 4 0 6t) Robinson, Det. 2 3 1.5 3 0 6t) Clinton-Dix, Chi. 2 1 0.5 1 0 6t) Bethea, NY-G 2 0 0.0 0 0 6t) Lawrence, Dal. 2 0 0.0 0 0 6t) Nicholson, Was. 2 0 0.0 0 0 6t) Reid, Car. 2 0 0.0 0 0 6t) Tartt, S.F. 2 0 0.0 0 0
WEEK 12 / THROUGH MONDAY, NOVEMBER 25, 2019 NFL / LEADING PASSERS Pct Avg Pct Pct Rating Player, Team Att Comp Comp Yds Gain TD TD Long Int Int Points Cousins, Min. 320 226 70.6 2756 8.61 21 6.6 66 3 0.9 114.8 Wilson, Sea. 352 237 67.3 2937 8.34 24 6.8 54 3 0.9 112.1 L. Jackson, Bal. 299 200 66.9 2427 8.12 24 8.0 83t 5 1.7 111.4 Tannehill, Ten. 154 111 72.1 1420 9.22 10 6.5 65t 4 2.6 111.4 Mahomes, K.C. 323 212 65.6 2808 8.69 19 5.9 83t 2 0.6 110.0 Brees, N.O. 210 159 75.7 1607 7.65 11 5.2 41 4 1.9 106.6 Stafford, Det. 291 187 64.3 2499 8.59 19 6.5 66 5 1.7 106.0 Watson, Hou. 361 249 69.0 2899 8.03 20 5.5 54 7 1.9 103.4 Carr, Oak. 337 239 70.9 2621 7.78 15 4.5 65t 6 1.8 101.0 Prescott, Dal. 398 266 66.8 3433 8.63 21 5.3 62 10 2.5 100.8 Garoppolo, S.F. 337 232 68.8 2731 8.10 20 5.9 61t 10 3.0 100.6 Rodgers, G.B. 380 245 64.5 2822 7.43 18 4.7 74t 2 0.5 100.4 Bridgewater, N.O. 195 132 67.7 1370 7.03 9 4.6 45 2 1.0 98.9 Brissett, Ind. 285 184 64.6 1926 6.76 15 5.3 48t 4 1.4 95.7 Keenum, Was. 188 126 67.0 1343 7.14 9 4.8 69t 4 2.1 94.8 Ryan, Atl. 397 266 67.0 2934 7.39 18 4.5 54t 10 2.5 93.3 *Minshew, Jac. 307 188 61.2 2285 7.44 13 4.2 70t 4 1.3 92.8 Mariota, Ten. 159 94 59.1 1179 7.42 7 4.4 75t 2 1.3 91.7 *K. Murray, Ariz 393 254 64.6 2703 6.88 14 3.6 88t 5 1.3 91.2 Wentz, Phi. 388 243 62.6 2530 6.52 17 4.4 53t 6 1.5 89.6 Brady, N.E. 439 273 62.2 2942 6.70 15 3.4 59 5 1.1 88.5 *D. Jones, NY-G 333 208 62.5 2134 6.41 17 5.1 75t 8 2.4 87.8 Darnold, NY-J 263 168 63.9 1915 7.28 13 4.9 92t 10 3.8 86.3 Allen, Buf. 342 206 60.2 2360 6.90 15 4.4 51 8 2.3 85.9 Rivers, LA-C 416 268 64.4 3169 7.62 15 3.6 56 14 3.4 85.5 Flacco, Den. 262 171 65.3 1822 6.95 6 2.3 70t 5 1.9 85.1 Allen, Car. 320 198 61.9 2179 6.81 13 4.1 52t 9 2.8 83.8 Winston, T.B. 434 260 59.9 3391 7.81 22 5.1 71t 20 4.6 82.3 Mayfield, Cle. 375 226 60.3 2721 7.26 14 3.7 89t 13 3.5 80.5 Trubisky, Chi. 323 201 62.2 1858 5.75 10 3.1 53 6 1.9 80.5 Goff, LA-R 410 251 61.2 2995 7.30 11 2.7 66 12 2.9 80.3 Rudolph, Pit. 263 162 61.6 1636 6.22 12 4.6 76t 9 3.4 80.3 Dalton, Cin. 338 204 60.4 2252 6.66 9 2.7 66t 8 2.4 79.2 R. Fitzpatrick, Mia. 292 181 62.0 1901 6.51 10 3.4 50 10 3.4 78.0
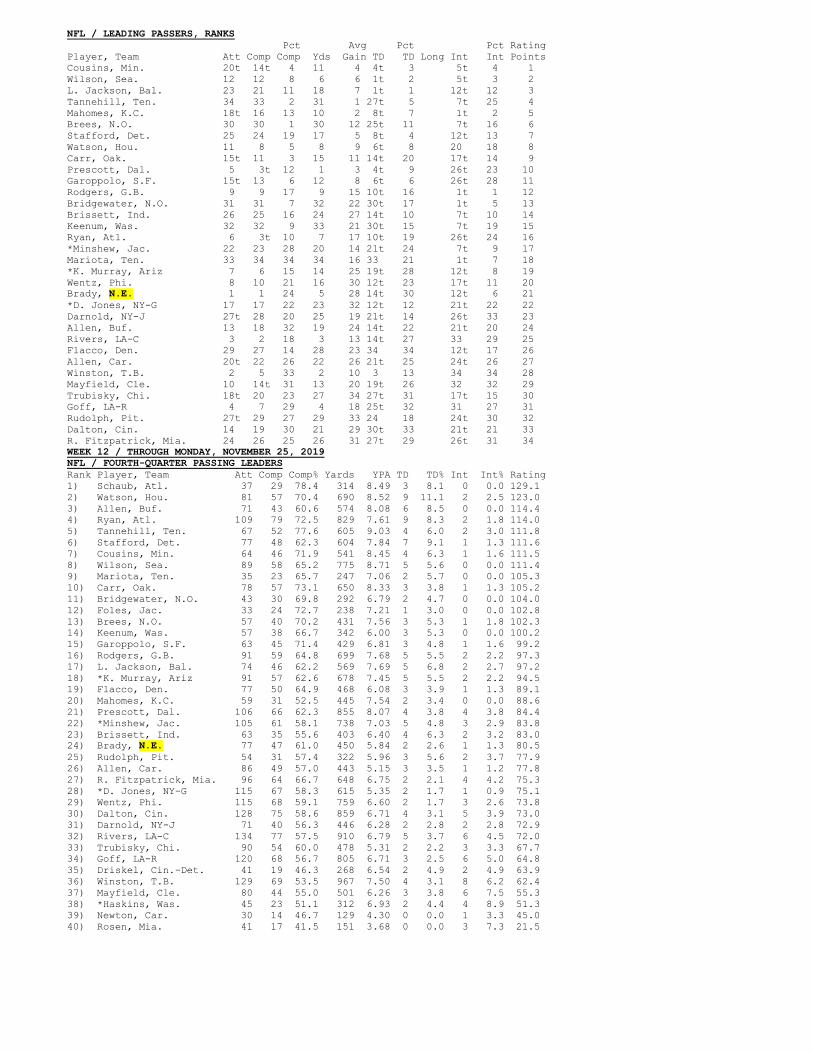
NFL / LEADING PASSERS, RANKS Pct Avg Pct Pct Rating Player, Team Att Comp Comp Yds Gain TD TD Long Int Int Points Cousins, Min. 20t 14t 4 11 4 4t 3 5t 4 1 Wilson, Sea. 12 12 8 6 6 1t 2 5t 3 2 L. Jackson, Bal. 23 21 11 18 7 1t 1 12t 12 3 Tannehill, Ten. 34 33 2 31 1 27t 5 7t 25 4 Mahomes, K.C. 18t 16 13 10 2 8t 7 1t 2 5 Brees, N.O. 30 30 1 30 12 25t 11 7t 16 6 Stafford, Det. 25 24 19 17 5 8t 4 12t 13 7 Watson, Hou. 11 8 5 8 9 6t 8 20 18 8 Carr, Oak. 15t 11 3 15 11 14t 20 17t 14 9 Prescott, Dal. 5 3t 12 1 3 4t 9 26t 23 10 Garoppolo, S.F. 15t 13 6 12 8 6t 6 26t 28 11 Rodgers, G.B. 9 9 17 9 15 10t 16 1t 1 12 Bridgewater, N.O. 31 31 7 32 22 30t 17 1t 5 13 Brissett, Ind. 26 25 16 24 27 14t 10 7t 10 14 Keenum, Was. 32 32 9 33 21 30t 15 7t 19 15 Ryan, Atl. 6 3t 10 7 17 10t 19 26t 24 16 *Minshew, Jac. 22 23 28 20 14 21t 24 7t 9 17 Mariota, Ten. 33 34 34 34 16 33 21 1t 7 18 *K. Murray, Ariz 7 6 15 14 25 19t 28 12t 8 19 Wentz, Phi. 8 10 21 16 30 12t 23 17t 11 20 Brady, N.E. 1 1 24 5 28 14t 30 12t 6 21 *D. Jones, NY-G 17 17 22 23 32 12t 12 21t 22 22 Darnold, NY-J 27t 28 20 25 19 21t 14 26t 33 23 Allen, Buf. 13 18 32 19 24 14t 22 21t 20 24 Rivers, LA-C 3 2 18 3 13 14t 27 33 29 25 Flacco, Den. 29 27 14 28 23 34 34 12t 17 26 Allen, Car. 20t 22 26 22 26 21t 25 24t 26 27 Winston, T.B. 2 5 33 2 10 3 13 34 34 28 Mayfield, Cle. 10 14t 31 13 20 19t 26 32 32 29 Trubisky, Chi. 18t 20 23 27 34 27t 31 17t 15 30 Goff, LA-R 4 7 29 4 18 25t 32 31 27 31 Rudolph, Pit. 27t 29 27 29 33 24 18 24t 30 32 Dalton, Cin. 14 19 30 21 29 30t 33 21t 21 33 R. Fitzpatrick, Mia. 24 26 25 26 31 27t 29 26t 31 34 WEEK 12 / THROUGH MONDAY, NOVEMBER 25, 2019 NFL / FOURTH-QUARTER PASSING LEADERS Rank Player, Team Att Comp Comp% Yards YPA TD TD% Int Int% Rating 1) Schaub, Atl. 37 29 78.4 314 8.49 3 8.1 0 0.0 129.1 2) Watson, Hou. 81 57 70.4 690 8.52 9 11.1 2 2.5 123.0 3) Allen, Buf. 71 43 60.6 574 8.08 6 8.5 0 0.0 114.4 4) Ryan, Atl. 109 79 72.5 829 7.61 9 8.3 2 1.8 114.0 5) Tannehill, Ten. 67 52 77.6 605 9.03 4 6.0 2 3.0 111.8 6) Stafford, Det. 77 48 62.3 604 7.84 7 9.1 1 1.3 111.6 7) Cousins, Min. 64 46 71.9 541 8.45 4 6.3 1 1.6 111.5 8) Wilson, Sea. 89 58 65.2 775 8.71 5 5.6 0 0.0 111.4 9) Mariota, Ten. 35 23 65.7 247 7.06 2 5.7 0 0.0 105.3 10) Carr, Oak. 78 57 73.1 650 8.33 3 3.8 1 1.3 105.2 11) Bridgewater, N.O. 43 30 69.8 292 6.79 2 4.7 0 0.0 104.0 12) Foles, Jac. 33 24 72.7 238 7.21 1 3.0 0 0.0 102.8 13) Brees, N.O. 57 40 70.2 431 7.56 3 5.3 1 1.8 102.3 14) Keenum, Was. 57 38 66.7 342 6.00 3 5.3 0 0.0 100.2 15) Garoppolo, S.F. 63 45 71.4 429 6.81 3 4.8 1 1.6 99.2 16) Rodgers, G.B. 91 59 64.8 699 7.68 5 5.5 2 2.2 97.3 17) L. Jackson, Bal. 74 46 62.2 569 7.69 5 6.8 2 2.7 97.2 18) *K. Murray, Ariz 91 57 62.6 678 7.45 5 5.5 2 2.2 94.5 19) Flacco, Den. 77 50 64.9 468 6.08 3 3.9 1 1.3 89.1 20) Mahomes, K.C. 59 31 52.5 445 7.54 2 3.4 0 0.0 88.6 21) Prescott, Dal. 106 66 62.3 855 8.07 4 3.8 4 3.8 84.4 22) *Minshew, Jac. 105 61 58.1 738 7.03 5 4.8 3 2.9 83.8 23) Brissett, Ind. 63 35 55.6 403 6.40 4 6.3 2 3.2 83.0 24) Brady, N.E. 77 47 61.0 450 5.84 2 2.6 1 1.3 80.5 25) Rudolph, Pit. 54 31 57.4 322 5.96 3 5.6 2 3.7 77.9 26) Allen, Car. 86 49 57.0 443 5.15 3 3.5 1 1.2 77.8 27) R. Fitzpatrick, Mia. 96 64 66.7 648 6.75 2 2.1 4 4.2 75.3 28) *D. Jones, NY-G 115 67 58.3 615 5.35 2 1.7 1 0.9 75.1 29) Wentz, Phi. 115 68 59.1 759 6.60 2 1.7 3 2.6 73.8 30) Dalton, Cin. 128 75 58.6 859 6.71 4 3.1 5 3.9 73.0 31) Darnold, NY-J 71 40 56.3 446 6.28 2 2.8 2 2.8 72.9 32) Rivers, LA-C 134 77 57.5 910 6.79 5 3.7 6 4.5 72.0 33) Trubisky, Chi. 90 54 60.0 478 5.31 2 2.2 3 3.3 67.7 34) Goff, LA-R 120 68 56.7 805 6.71 3 2.5 6 5.0 64.8 35) Driskel, Cin.-Det. 41 19 46.3 268 6.54 2 4.9 2 4.9 63.9 36) Winston, T.B. 129 69 53.5 967 7.50 4 3.1 8 6.2 62.4 37) Mayfield, Cle. 80 44 55.0 501 6.26 3 3.8 6 7.5 55.3 38) *Haskins, Was. 45 23 51.1 312 6.93 2 4.4 4 8.9 51.3 39) Newton, Car. 30 14 46.7 129 4.30 0 0.0 1 3.3 45.0 40) Rosen, Mia. 41 17 41.5 151 3.68 0 0.0 3 7.3 21.5
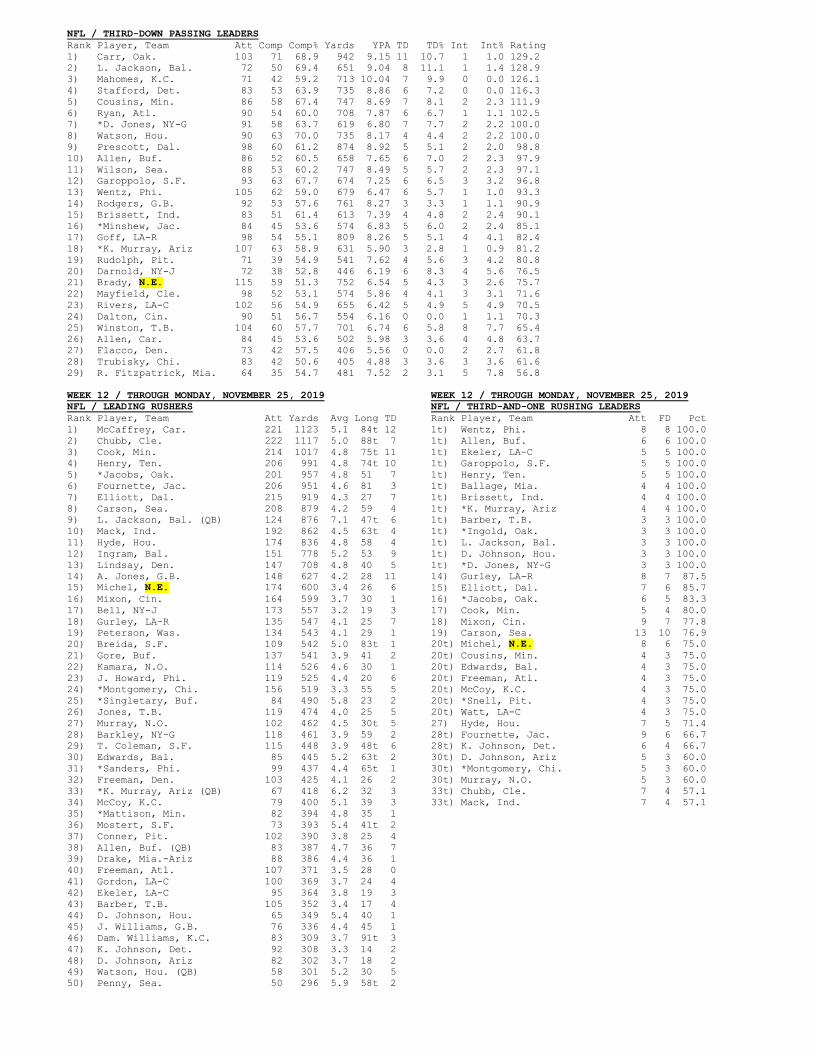
NFL / THIRD-DOWN PASSING LEADERS Rank Player, Team Att Comp Comp% Yards YPA TD TD% Int Int% Rating 1) Carr, Oak. 103 71 68.9 942 9.15 11 10.7 1 1.0 129.2 2) L. Jackson, Bal. 72 50 69.4 651 9.04 8 11.1 1 1.4 128.9 3) Mahomes, K.C. 71 42 59.2 713 10.04 7 9.9 0 0.0 126.1 4) Stafford, Det. 83 53 63.9 735 8.86 6 7.2 0 0.0 116.3 5) Cousins, Min. 86 58 67.4 747 8.69 7 8.1 2 2.3 111.9 6) Ryan, Atl. 90 54 60.0 708 7.87 6 6.7 1 1.1 102.5 7) *D. Jones, NY-G 91 58 63.7 619 6.80 7 7.7 2 2.2 100.0 8) Watson, Hou. 90 63 70.0 735 8.17 4 4.4 2 2.2 100.0 9) Prescott, Dal. 98 60 61.2 874 8.92 5 5.1 2 2.0 98.8 10) Allen, Buf. 86 52 60.5 658 7.65 6 7.0 2 2.3 97.9 11) Wilson, Sea. 88 53 60.2 747 8.49 5 5.7 2 2.3 97.1 12) Garoppolo, S.F. 93 63 67.7 674 7.25 6 6.5 3 3.2 96.8 13) Wentz, Phi. 105 62 59.0 679 6.47 6 5.7 1 1.0 93.3 14) Rodgers, G.B. 92 53 57.6 761 8.27 3 3.3 1 1.1 90.9 15) Brissett, Ind. 83 51 61.4 613 7.39 4 4.8 2 2.4 90.1 16) *Minshew, Jac. 84 45 53.6 574 6.83 5 6.0 2 2.4 85.1 17) Goff, LA-R 98 54 55.1 809 8.26 5 5.1 4 4.1 82.4 18) *K. Murray, Ariz 107 63 58.9 631 5.90 3 2.8 1 0.9 81.2 19) Rudolph, Pit. 71 39 54.9 541 7.62 4 5.6 3 4.2 80.8 20) Darnold, NY-J 72 38 52.8 446 6.19 6 8.3 4 5.6 76.5 21) Brady, N.E. 115 59 51.3 752 6.54 5 4.3 3 2.6 75.7 22) Mayfield, Cle. 98 52 53.1 574 5.86 4 4.1 3 3.1 71.6 23) Rivers, LA-C 102 56 54.9 655 6.42 5 4.9 5 4.9 70.5 24) Dalton, Cin. 90 51 56.7 554 6.16 0 0.0 1 1.1 70.3 25) Winston, T.B. 104 60 57.7 701 6.74 6 5.8 8 7.7 65.4 26) Allen, Car. 84 45 53.6 502 5.98 3 3.6 4 4.8 63.7 27) Flacco, Den. 73 42 57.5 406 5.56 0 0.0 2 2.7 61.8 28) Trubisky, Chi. 83 42 50.6 405 4.88 3 3.6 3 3.6 61.6 29) R. Fitzpatrick, Mia. 64 35 54.7 481 7.52 2 3.1 5 7.8 56.8 WEEK 12 / THROUGH MONDAY, NOVEMBER 25, 2019 NFL / LEADING RUSHERS Rank Player, Team Att Yards Avg Long TD 1) McCaffrey, Car. 221 1123 5.1 84t 12 2) Chubb, Cle. 222 1117 5.0 88t 7 3) Cook, Min. 214 1017 4.8 75t 11 4) Henry, Ten. 206 991 4.8 74t 10 5) *Jacobs, Oak. 201 957 4.8 51 7 6) Fournette, Jac. 206 951 4.6 81 3 7) Elliott, Dal. 215 919 4.3 27 7 8) Carson, Sea. 208 879 4.2 59 4 9) L. Jackson, Bal. (QB) 124 876 7.1 47t 6 10) Mack, Ind. 192 862 4.5 63t 4 11) Hyde, Hou. 174 836 4.8 58 4 12) Ingram, Bal. 151 778 5.2 53 9 13) Lindsay, Den. 147 708 4.8 40 5 14) A. Jones, G.B. 148 627 4.2 28 11 15) Michel, N.E. 174 600 3.4 26 6 16) Mixon, Cin. 164 599 3.7 30 1 17) Bell, NY-J 173 557 3.2 19 3 18) Gurley, LA-R 135 547 4.1 25 7 19) Peterson, Was. 134 543 4.1 29 1 20) Breida, S.F. 109 542 5.0 83t 1 21) Gore, Buf. 137 541 3.9 41 2 22) Kamara, N.O. 114 526 4.6 30 1 23) J. Howard, Phi. 119 525 4.4 20 6 24) *Montgomery, Chi. 156 519 3.3 55 5 25) *Singletary, Buf. 84 490 5.8 23 2 26) Jones, T.B. 119 474 4.0 25 5 27) Murray, N.O. 102 462 4.5 30t 5 28) Barkley, NY-G 118 461 3.9 59 2 29) T. Coleman, S.F. 115 448 3.9 48t 6 30) Edwards, Bal. 85 445 5.2 63t 2 31) *Sanders, Phi. 99 437 4.4 65t 1 32) Freeman, Den. 103 425 4.1 26 2 33) *K. Murray, Ariz (QB) 67 418 6.2 32 3 34) McCoy, K.C. 79 400 5.1 39 3 35) *Mattison, Min. 82 394 4.8 35 1 36) Mostert, S.F. 73 393 5.4 41t 2 37) Conner, Pit. 102 390 3.8 25 4 38) Allen, Buf. (QB) 83 387 4.7 36 7 39) Drake, Mia.-Ariz 88 386 4.4 36 1 40) Freeman, Atl. 107 371 3.5 28 0 41) Gordon, LA-C 100 369 3.7 24 4 42) Ekeler, LA-C 95 364 3.8 19 3 43) Barber, T.B. 105 352 3.4 17 4 44) D. Johnson, Hou. 65 349 5.4 40 1 45) J. Williams, G.B. 76 336 4.4 45 1 46) Dam. Williams, K.C. 83 309 3.7 91t 3 47) K. Johnson, Det. 92 308 3.3 14 2 48) D. Johnson, Ariz 82 302 3.7 18 2 49) Watson, Hou. (QB) 58 301 5.2 30 5 50) Penny, Sea. 50 296 5.9 58t 2
WEEK 12 / THROUGH MONDAY, NOVEMBER 25, 2019 NFL / THIRD-AND-ONE RUSHING LEADERS Rank Player, Team Att FD Pct 1t) Wentz, Phi. 8 8 100.0 1t) Allen, Buf. 6 6 100.0 1t) Ekeler, LA-C 5 5 100.0 1t) Garoppolo, S.F. 5 5 100.0 1t) Henry, Ten. 5 5 100.0 1t) Ballage, Mia. 4 4 100.0 1t) Brissett, Ind. 4 4 100.0 1t) *K. Murray, Ariz 4 4 100.0 1t) Barber, T.B. 3 3 100.0 1t) *Ingold, Oak. 3 3 100.0 1t) L. Jackson, Bal. 3 3 100.0 1t) D. Johnson, Hou. 3 3 100.0 1t) *D. Jones, NY-G 3 3 100.0 14) Gurley, LA-R 8 7 87.5 15) Elliott, Dal. 7 6 85.7 16) *Jacobs, Oak. 6 5 83.3 17) Cook, Min. 5 4 80.0 18) Mixon, Cin. 9 7 77.8 19) Carson, Sea. 13 10 76.9 20t) Michel, N.E. 8 6 75.0 20t) Cousins, Min. 4 3 75.0 20t) Edwards, Bal. 4 3 75.0 20t) Freeman, Atl. 4 3 75.0 20t) McCoy, K.C. 4 3 75.0 20t) *Snell, Pit. 4 3 75.0 20t) Watt, LA-C 4 3 75.0 27) Hyde, Hou. 7 5 71.4 28t) Fournette, Jac. 9 6 66.7 28t) K. Johnson, Det. 6 4 66.7 30t) D. Johnson, Ariz 5 3 60.0 30t) *Montgomery, Chi. 5 3 60.0 30t) Murray, N.O. 5 3 60.0 33t) Chubb, Cle. 7 4 57.1 33t) Mack, Ind. 7 4 57.1
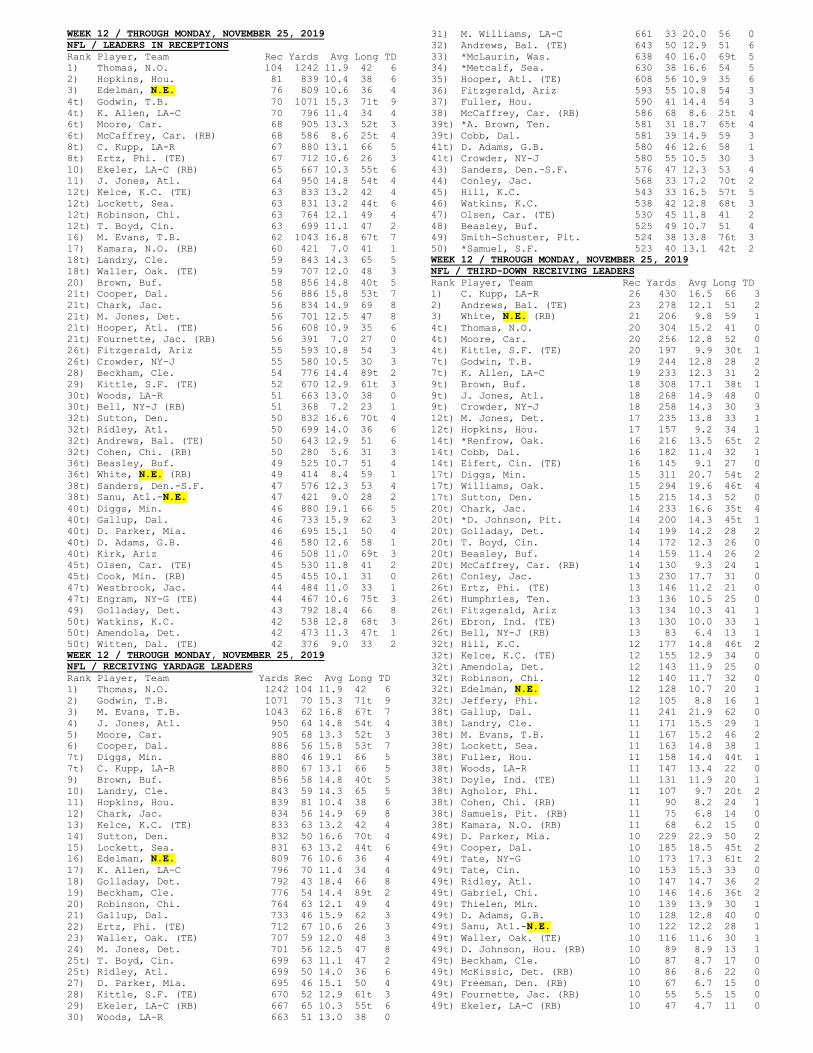
WEEK 12 / THROUGH MONDAY, NOVEMBER 25, 2019 NFL / LEADERS IN RECEPTIONS Rank Player, Team Rec Yards Avg Long TD 1) Thomas, N.O. 104 1242 11.9 42 6 2) Hopkins, Hou. 81 839 10.4 38 6 3) Edelman, N.E. 76 809 10.6 36 4 4t) Godwin, T.B. 70 1071 15.3 71t 9 4t) K. Allen, LA-C 70 796 11.4 34 4 6t) Moore, Car. 68 905 13.3 52t 3 6t) McCaffrey, Car. (RB) 68 586 8.6 25t 4 8t) C. Kupp, LA-R 67 880 13.1 66 5 8t) Ertz, Phi. (TE) 67 712 10.6 26 3 10) Ekeler, LA-C (RB) 65 667 10.3 55t 6 11) J. Jones, Atl. 64 950 14.8 54t 4 12t) Kelce, K.C. (TE) 63 833 13.2 42 4 12t) Lockett, Sea. 63 831 13.2 44t 6 12t) Robinson, Chi. 63 764 12.1 49 4 12t) T. Boyd, Cin. 63 699 11.1 47 2 16) M. Evans, T.B. 62 1043 16.8 67t 7 17) Kamara, N.O. (RB) 60 421 7.0 41 1 18t) Landry, Cle. 59 843 14.3 65 5 18t) Waller, Oak. (TE) 59 707 12.0 48 3 20) Brown, Buf. 58 856 14.8 40t 5 21t) Cooper, Dal. 56 886 15.8 53t 7 21t) Chark, Jac. 56 834 14.9 69 8 21t) M. Jones, Det. 56 701 12.5 47 8 21t) Hooper, Atl. (TE) 56 608 10.9 35 6 21t) Fournette, Jac. (RB) 56 391 7.0 27 0 26t) Fitzgerald, Ariz 55 593 10.8 54 3 26t) Crowder, NY-J 55 580 10.5 30 3 28) Beckham, Cle. 54 776 14.4 89t 2 29) Kittle, S.F. (TE) 52 670 12.9 61t 3 30t) Woods, LA-R 51 663 13.0 38 0 30t) Bell, NY-J (RB) 51 368 7.2 23 1 32t) Sutton, Den. 50 832 16.6 70t 4 32t) Ridley, Atl. 50 699 14.0 36 6 32t) Andrews, Bal. (TE) 50 643 12.9 51 6 32t) Cohen, Chi. (RB) 50 280 5.6 31 3 36t) Beasley, Buf. 49 525 10.7 51 4 36t) White, N.E. (RB) 49 414 8.4 59 1 38t) Sanders, Den.-S.F. 47 576 12.3 53 4 38t) Sanu, Atl.-N.E. 47 421 9.0 28 2 40t) Diggs, Min. 46 880 19.1 66 5 40t) Gallup, Dal. 46 733 15.9 62 3 40t) D. Parker, Mia. 46 695 15.1 50 4 40t) D. Adams, G.B. 46 580 12.6 58 1 40t) Kirk, Ariz 46 508 11.0 69t 3 45t) Olsen, Car. (TE) 45 530 11.8 41 2 45t) Cook, Min. (RB) 45 455 10.1 31 0 47t) Westbrook, Jac. 44 484 11.0 33 1 47t) Engram, NY-G (TE) 44 467 10.6 75t 3 49) Golladay, Det. 43 792 18.4 66 8 50t) Watkins, K.C. 42 538 12.8 68t 3 50t) Amendola, Det. 42 473 11.3 47t 1 50t) Witten, Dal. (TE) 42 376 9.0 33 2 WEEK 12 / THROUGH MONDAY, NOVEMBER 25, 2019 NFL / RECEIVING YARDAGE LEADERS Rank Player, Team Yards Rec Avg Long TD 1) Thomas, N.O. 1242 104 11.9 42 6 2) Godwin, T.B. 1071 70 15.3 71t 9 3) M. Evans, T.B. 1043 62 16.8 67t 7 4) J. Jones, Atl. 950 64 14.8 54t 4 5) Moore, Car. 905 68 13.3 52t 3 6) Cooper, Dal. 886 56 15.8 53t 7 7t) Diggs, Min. 880 46 19.1 66 5 7t) C. Kupp, LA-R 880 67 13.1 66 5 9) Brown, Buf. 856 58 14.8 40t 5 10) Landry, Cle. 843 59 14.3 65 5 11) Hopkins, Hou. 839 81 10.4 38 6 12) Chark, Jac. 834 56 14.9 69 8 13) Kelce, K.C. (TE) 833 63 13.2 42 4 14) Sutton, Den. 832 50 16.6 70t 4 15) Lockett, Sea. 831 63 13.2 44t 6 16) Edelman, N.E. 809 76 10.6 36 4 17) K. Allen, LA-C 796 70 11.4 34 4 18) Golladay, Det. 792 43 18.4 66 8 19) Beckham, Cle. 776 54 14.4 89t 2 20) Robinson, Chi. 764 63 12.1 49 4 21) Gallup, Dal. 733 46 15.9 62 3 22) Ertz, Phi. (TE) 712 67 10.6 26 3 23) Waller, Oak. (TE) 707 59 12.0 48 3 24) M. Jones, Det. 701 56 12.5 47 8 25t) T. Boyd, Cin. 699 63 11.1 47 2 25t) Ridley, Atl. 699 50 14.0 36 6 27) D. Parker, Mia. 695 46 15.1 50 4 28) Kittle, S.F. (TE) 670 52 12.9 61t 3 29) Ekeler, LA-C (RB) 667 65 10.3 55t 6 30) Woods, LA-R 663 51 13.0 38 0
31) M. Williams, LA-C 661 33 20.0 56 0 32) Andrews, Bal. (TE) 643 50 12.9 51 6 33) *McLaurin, Was. 638 40 16.0 69t 5 34) *Metcalf, Sea. 630 38 16.6 54 5 35) Hooper, Atl. (TE) 608 56 10.9 35 6 36) Fitzgerald, Ariz 593 55 10.8 54 3 37) Fuller, Hou. 590 41 14.4 54 3 38) McCaffrey, Car. (RB) 586 68 8.6 25t 4 39t) *A. Brown, Ten. 581 31 18.7 65t 4 39t) Cobb, Dal. 581 39 14.9 59 3 41t) D. Adams, G.B. 580 46 12.6 58 1 41t) Crowder, NY-J 580 55 10.5 30 3 43) Sanders, Den.-S.F. 576 47 12.3 53 4 44) Conley, Jac. 568 33 17.2 70t 2 45) Hill, K.C. 543 33 16.5 57t 5 46) Watkins, K.C. 538 42 12.8 68t 3 47) Olsen, Car. (TE) 530 45 11.8 41 2 48) Beasley, Buf. 525 49 10.7 51 4 49) Smith-Schuster, Pit. 524 38 13.8 76t 3 50) *Samuel, S.F. 523 40 13.1 42t 2 WEEK 12 / THROUGH MONDAY, NOVEMBER 25, 2019 NFL / THIRD-DOWN RECEIVING LEADERS Rank Player, Team Rec Yards Avg Long TD 1) C. Kupp, LA-R 26 430 16.5 66 3 2) Andrews, Bal. (TE) 23 278 12.1 51 2 3) White, N.E. (RB) 21 206 9.8 59 1 4t) Thomas, N.O. 20 304 15.2 41 0 4t) Moore, Car. 20 256 12.8 52 0 4t) Kittle, S.F. (TE) 20 197 9.9 30t 1 7t) Godwin, T.B. 19 244 12.8 28 2 7t) K. Allen, LA-C 19 233 12.3 31 2 9t) Brown, Buf. 18 308 17.1 38t 1 9t) J. Jones, Atl. 18 268 14.9 48 0 9t) Crowder, NY-J 18 258 14.3 30 3 12t) M. Jones, Det. 17 235 13.8 33 1 12t) Hopkins, Hou. 17 157 9.2 34 1 14t) *Renfrow, Oak. 16 216 13.5 65t 2 14t) Cobb, Dal. 16 182 11.4 32 1 14t) Eifert, Cin. (TE) 16 145 9.1 27 0 17t) Diggs, Min. 15 311 20.7 54t 2 17t) Williams, Oak. 15 294 19.6 46t 4 17t) Sutton, Den. 15 215 14.3 52 0 20t) Chark, Jac. 14 233 16.6 35t 4 20t) *D. Johnson, Pit. 14 200 14.3 45t 1 20t) Golladay, Det. 14 199 14.2 28 2 20t) T. Boyd, Cin. 14 172 12.3 26 0 20t) Beasley, Buf. 14 159 11.4 26 2 20t) McCaffrey, Car. (RB) 14 130 9.3 24 1 26t) Conley, Jac. 13 230 17.7 31 0 26t) Ertz, Phi. (TE) 13 146 11.2 21 0 26t) Humphries, Ten. 13 136 10.5 25 0 26t) Fitzgerald, Ariz 13 134 10.3 41 1 26t) Ebron, Ind. (TE) 13 130 10.0 33 1 26t) Bell, NY-J (RB) 13 83 6.4 13 1 32t) Hill, K.C. 12 177 14.8 46t 2 32t) Kelce, K.C. (TE) 12 155 12.9 34 0 32t) Amendola, Det. 12 143 11.9 25 0 32t) Robinson, Chi. 12 140 11.7 32 0 32t) Edelman, N.E. 12 128 10.7 20 1 32t) Jeffery, Phi. 12 105 8.8 16 1 38t) Gallup, Dal. 11 241 21.9 62 0 38t) Landry, Cle. 11 171 15.5 29 1 38t) M. Evans, T.B. 11 167 15.2 46 2 38t) Lockett, Sea. 11 163 14.8 38 1 38t) Fuller, Hou. 11 158 14.4 44t 1 38t) Woods, LA-R 11 147 13.4 22 0 38t) Doyle, Ind. (TE) 11 131 11.9 20 1 38t) Agholor, Phi. 11 107 9.7 20t 2 38t) Cohen, Chi. (RB) 11 90 8.2 24 1 38t) Samuels, Pit. (RB) 11 75 6.8 14 0 38t) Kamara, N.O. (RB) 11 68 6.2 15 0 49t) D. Parker, Mia. 10 229 22.9 50 2 49t) Cooper, Dal. 10 185 18.5 45t 2 49t) Tate, NY-G 10 173 17.3 61t 2 49t) Tate, Cin. 10 153 15.3 33 0 49t) Ridley, Atl. 10 147 14.7 36 2 49t) Gabriel, Chi. 10 146 14.6 36t 2 49t) Thielen, Min. 10 139 13.9 30 1 49t) D. Adams, G.B. 10 128 12.8 40 0 49t) Sanu, Atl.-N.E. 10 122 12.2 28 1 49t) Waller, Oak. (TE) 10 116 11.6 30 1 49t) D. Johnson, Hou. (RB) 10 89 8.9 13 1 49t) Beckham, Cle. 10 87 8.7 17 0 49t) McKissic, Det. (RB) 10 86 8.6 22 0 49t) Freeman, Den. (RB) 10 67 6.7 15 0 49t) Fournette, Jac. (RB) 10 55 5.5 15 0 49t) Ekeler, LA-C (RB) 10 47 4.7 11 0
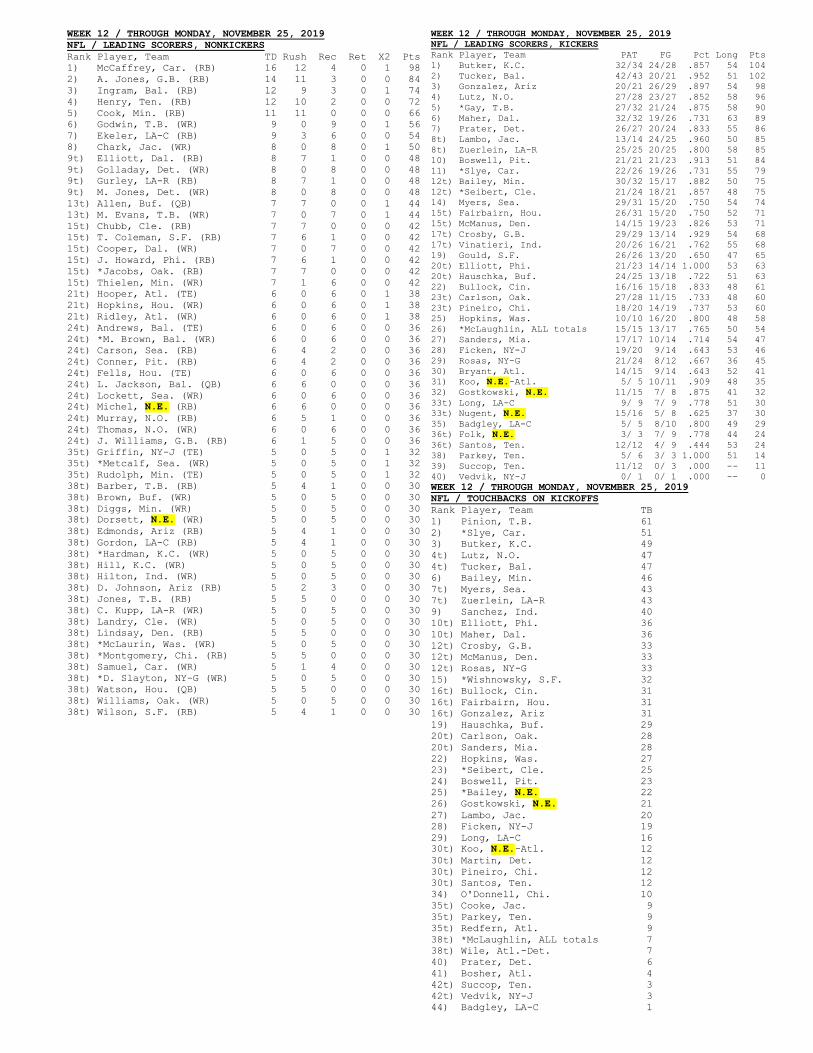
WEEK 12 / THROUGH MONDAY, NOVEMBER 25, 2019 NFL / LEADING SCORERS, NONKICKERS Rank Player, Team TD Rush Rec Ret X2 Pts 1) McCaffrey, Car. (RB) 16 12 4 0 1 98 2) A. Jones, G.B. (RB) 14 11 3 0 0 84 3) Ingram, Bal. (RB) 12 9 3 0 1 74 4) Henry, Ten. (RB) 12 10 2 0 0 72 5) Cook, Min. (RB) 11 11 0 0 0 66 6) Godwin, T.B. (WR) 9 0 9 0 1 56 7) Ekeler, LA-C (RB) 9 3 6 0 0 54 8) Chark, Jac. (WR) 8 0 8 0 1 50 9t) Elliott, Dal. (RB) 8 7 1 0 0 48 9t) Golladay, Det. (WR) 8 0 8 0 0 48 9t) Gurley, LA-R (RB) 8 7 1 0 0 48 9t) M. Jones, Det. (WR) 8 0 8 0 0 48 13t) Allen, Buf. (QB) 7 7 0 0 1 44 13t) M. Evans, T.B. (WR) 7 0 7 0 1 44 15t) Chubb, Cle. (RB) 7 7 0 0 0 42 15t) T. Coleman, S.F. (RB) 7 6 1 0 0 42 15t) Cooper, Dal. (WR) 7 0 7 0 0 42 15t) J. Howard, Phi. (RB) 7 6 1 0 0 42 15t) *Jacobs, Oak. (RB) 7 7 0 0 0 42 15t) Thielen, Min. (WR) 7 1 6 0 0 42 21t) Hooper, Atl. (TE) 6 0 6 0 1 38 21t) Hopkins, Hou. (WR) 6 0 6 0 1 38 21t) Ridley, Atl. (WR) 6 0 6 0 1 38 24t) Andrews, Bal. (TE) 6 0 6 0 0 36 24t) *M. Brown, Bal. (WR) 6 0 6 0 0 36 24t) Carson, Sea. (RB) 6 4 2 0 0 36 24t) Conner, Pit. (RB) 6 4 2 0 0 36 24t) Fells, Hou. (TE) 6 0 6 0 0 36 24t) L. Jackson, Bal. (QB) 6 6 0 0 0 36 24t) Lockett, Sea. (WR) 6 0 6 0 0 36 24t) Michel, N.E. (RB) 6 6 0 0 0 36 24t) Murray, N.O. (RB) 6 5 1 0 0 36 24t) Thomas, N.O. (WR) 6 0 6 0 0 36 24t) J. Williams, G.B. (RB) 6 1 5 0 0 36 35t) Griffin, NY-J (TE) 5 0 5 0 1 32 35t) *Metcalf, Sea. (WR) 5 0 5 0 1 32 35t) Rudolph, Min. (TE) 5 0 5 0 1 32 38t) Barber, T.B. (RB) 5 4 1 0 0 30 38t) Brown, Buf. (WR) 5 0 5 0 0 30 38t) Diggs, Min. (WR) 5 0 5 0 0 30 38t) Dorsett, N.E. (WR) 5 0 5 0 0 30 38t) Edmonds, Ariz (RB) 5 4 1 0 0 30 38t) Gordon, LA-C (RB) 5 4 1 0 0 30 38t) *Hardman, K.C. (WR) 5 0 5 0 0 30 38t) Hill, K.C. (WR) 5 0 5 0 0 30 38t) Hilton, Ind. (WR) 5 0 5 0 0 30 38t) D. Johnson, Ariz (RB) 5 2 3 0 0 30 38t) Jones, T.B. (RB) 5 5 0 0 0 30 38t) C. Kupp, LA-R (WR) 5 0 5 0 0 30 38t) Landry, Cle. (WR) 5 0 5 0 0 30 38t) Lindsay, Den. (RB) 5 5 0 0 0 30 38t) *McLaurin, Was. (WR) 5 0 5 0 0 30 38t) *Montgomery, Chi. (RB) 5 5 0 0 0 30 38t) Samuel, Car. (WR) 5 1 4 0 0 30 38t) *D. Slayton, NY-G (WR) 5 0 5 0 0 30 38t) Watson, Hou. (QB) 5 5 0 0 0 30 38t) Williams, Oak. (WR) 5 0 5 0 0 30 38t) Wilson, S.F. (RB) 5 4 1 0 0 30
WEEK 12 / THROUGH MONDAY, NOVEMBER 25, 2019 NFL / LEADING SCORERS, KICKERS Rank Player, Team PAT FG Pct Long Pts 1) Butker, K.C. 32/34 24/28 .857 54 104 2) Tucker, Bal. 42/43 20/21 .952 51 102 3) Gonzalez, Ariz 20/21 26/29 .897 54 98 4) Lutz, N.O. 27/28 23/27 .852 58 96 5) *Gay, T.B. 27/32 21/24 .875 58 90 6) Maher, Dal. 32/32 19/26 .731 63 89 7) Prater, Det. 26/27 20/24 .833 55 86 8t) Lambo, Jac. 13/14 24/25 .960 50 85 8t) Zuerlein, LA-R 25/25 20/25 .800 58 85 10) Boswell, Pit. 21/21 21/23 .913 51 84 11) *Slye, Car. 22/26 19/26 .731 55 79 12t) Bailey, Min. 30/32 15/17 .882 50 75 12t) *Seibert, Cle. 21/24 18/21 .857 48 75 14) Myers, Sea. 29/31 15/20 .750 54 74 15t) Fairbairn, Hou. 26/31 15/20 .750 52 71 15t) McManus, Den. 14/15 19/23 .826 53 71 17t) Crosby, G.B. 29/29 13/14 .929 54 68 17t) Vinatieri, Ind. 20/26 16/21 .762 55 68 19) Gould, S.F. 26/26 13/20 .650 47 65 20t) Elliott, Phi. 21/23 14/14 1.000 53 63 20t) Hauschka, Buf. 24/25 13/18 .722 51 63 22) Bullock, Cin. 16/16 15/18 .833 48 61 23t) Carlson, Oak. 27/28 11/15 .733 48 60 23t) Pineiro, Chi. 18/20 14/19 .737 53 60 25) Hopkins, Was. 10/10 16/20 .800 48 58 26) *McLaughlin, ALL totals 15/15 13/17 .765 50 54 27) Sanders, Mia. 17/17 10/14 .714 54 47 28) Ficken, NY-J 19/20 9/14 .643 53 46 29) Rosas, NY-G 21/24 8/12 .667 36 45 30) Bryant, Atl. 14/15 9/14 .643 52 41 31) Koo, N.E.-Atl. 5/ 5 10/11 .909 48 35 32) Gostkowski, N.E. 11/15 7/ 8 .875 41 32 33t) Long, LA-C 9/ 9 7/ 9 .778 51 30 33t) Nugent, N.E. 15/16 5/ 8 .625 37 30 35) Badgley, LA-C 5/ 5 8/10 .800 49 29 36t) Folk, N.E. 3/ 3 7/ 9 .778 44 24 36t) Santos, Ten. 12/12 4/ 9 .444 53 24 38) Parkey, Ten. 5/ 6 3/ 3 1.000 51 14 39) Succop, Ten. 11/12 0/ 3 .000 -- 11 40) Vedvik, NY-J 0/ 1 0/ 1 .000 -- 0 WEEK 12 / THROUGH MONDAY, NOVEMBER 25, 2019 NFL / TOUCHBACKS ON KICKOFFS Rank Player, Team TB 1) Pinion, T.B. 61 2) *Slye, Car. 51 3) Butker, K.C. 49 4t) Lutz, N.O. 47 4t) Tucker, Bal. 47 6) Bailey, Min. 46 7t) Myers, Sea. 43 7t) Zuerlein, LA-R 43 9) Sanchez, Ind. 40 10t) Elliott, Phi. 36 10t) Maher, Dal. 36 12t) Crosby, G.B. 33 12t) McManus, Den. 33 12t) Rosas, NY-G 33 15) *Wishnowsky, S.F. 32 16t) Bullock, Cin. 31 16t) Fairbairn, Hou. 31 16t) Gonzalez, Ariz 31 19) Hauschka, Buf. 29 20t) Carlson, Oak. 28 20t) Sanders, Mia. 28 22) Hopkins, Was. 27 23) *Seibert, Cle. 25 24) Boswell, Pit. 23 25) *Bailey, N.E. 22 26) Gostkowski, N.E. 21 27) Lambo, Jac. 20 28) Ficken, NY-J 19 29) Long, LA-C 16 30t) Koo, N.E.-Atl. 12 30t) Martin, Det. 12 30t) Pineiro, Chi. 12 30t) Santos, Ten. 12 34) O'Donnell, Chi. 10 35t) Cooke, Jac. 9 35t) Parkey, Ten. 9 35t) Redfern, Atl. 9 38t) *McLaughlin, ALL totals 7 38t) Wile, Atl.-Det. 7 40) Prater, Det. 6 41) Bosher, Atl. 4 42t) Succop, Ten. 3 42t) Vedvik, NY-J 3 44) Badgley, LA-C 1
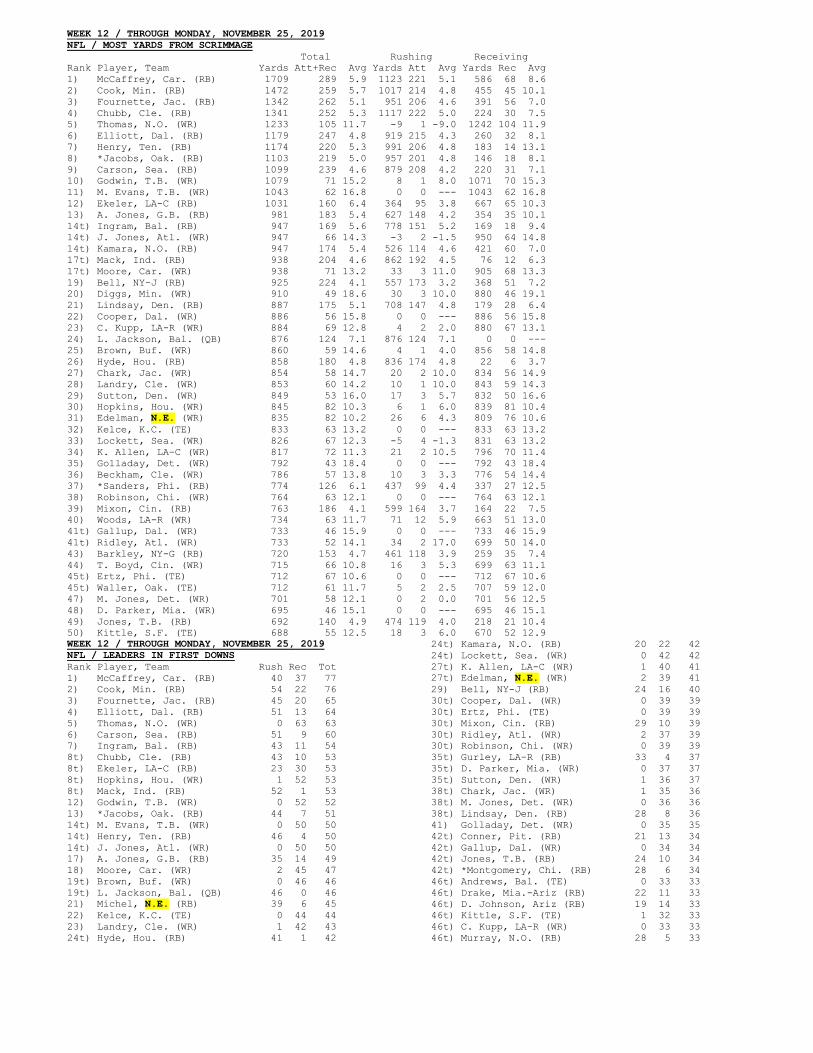
WEEK 12 / THROUGH MONDAY, NOVEMBER 25, 2019 NFL / MOST YARDS FROM SCRIMMAGE Total Rushing Receiving Rank Player, Team Yards Att+Rec Avg Yards Att Avg Yards Rec Avg 1) McCaffrey, Car. (RB) 1709 289 5.9 1123 221 5.1 586 68 8.6 2) Cook, Min. (RB) 1472 259 5.7 1017 214 4.8 455 45 10.1 3) Fournette, Jac. (RB) 1342 262 5.1 951 206 4.6 391 56 7.0 4) Chubb, Cle. (RB) 1341 252 5.3 1117 222 5.0 224 30 7.5 5) Thomas, N.O. (WR) 1233 105 11.7 -9 1 -9.0 1242 104 11.9 6) Elliott, Dal. (RB) 1179 247 4.8 919 215 4.3 260 32 8.1 7) Henry, Ten. (RB) 1174 220 5.3 991 206 4.8 183 14 13.1 8) *Jacobs, Oak. (RB) 1103 219 5.0 957 201 4.8 146 18 8.1 9) Carson, Sea. (RB) 1099 239 4.6 879 208 4.2 220 31 7.1 10) Godwin, T.B. (WR) 1079 71 15.2 8 1 8.0 1071 70 15.3 11) M. Evans, T.B. (WR) 1043 62 16.8 0 0 --- 1043 62 16.8 12) Ekeler, LA-C (RB) 1031 160 6.4 364 95 3.8 667 65 10.3 13) A. Jones, G.B. (RB) 981 183 5.4 627 148 4.2 354 35 10.1 14t) Ingram, Bal. (RB) 947 169 5.6 778 151 5.2 169 18 9.4 14t) J. Jones, Atl. (WR) 947 66 14.3 -3 2 -1.5 950 64 14.8 14t) Kamara, N.O. (RB) 947 174 5.4 526 114 4.6 421 60 7.0 17t) Mack, Ind. (RB) 938 204 4.6 862 192 4.5 76 12 6.3 17t) Moore, Car. (WR) 938 71 13.2 33 3 11.0 905 68 13.3 19) Bell, NY-J (RB) 925 224 4.1 557 173 3.2 368 51 7.2 20) Diggs, Min. (WR) 910 49 18.6 30 3 10.0 880 46 19.1 21) Lindsay, Den. (RB) 887 175 5.1 708 147 4.8 179 28 6.4 22) Cooper, Dal. (WR) 886 56 15.8 0 0 --- 886 56 15.8 23) C. Kupp, LA-R (WR) 884 69 12.8 4 2 2.0 880 67 13.1 24) L. Jackson, Bal. (QB) 876 124 7.1 876 124 7.1 0 0 --- 25) Brown, Buf. (WR) 860 59 14.6 4 1 4.0 856 58 14.8 26) Hyde, Hou. (RB) 858 180 4.8 836 174 4.8 22 6 3.7 27) Chark, Jac. (WR) 854 58 14.7 20 2 10.0 834 56 14.9 28) Landry, Cle. (WR) 853 60 14.2 10 1 10.0 843 59 14.3 29) Sutton, Den. (WR) 849 53 16.0 17 3 5.7 832 50 16.6 30) Hopkins, Hou. (WR) 845 82 10.3 6 1 6.0 839 81 10.4 31) Edelman, N.E. (WR) 835 82 10.2 26 6 4.3 809 76 10.6 32) Kelce, K.C. (TE) 833 63 13.2 0 0 --- 833 63 13.2 33) Lockett, Sea. (WR) 826 67 12.3 -5 4 -1.3 831 63 13.2 34) K. Allen, LA-C (WR) 817 72 11.3 21 2 10.5 796 70 11.4 35) Golladay, Det. (WR) 792 43 18.4 0 0 --- 792 43 18.4 36) Beckham, Cle. (WR) 786 57 13.8 10 3 3.3 776 54 14.4 37) *Sanders, Phi. (RB) 774 126 6.1 437 99 4.4 337 27 12.5 38) Robinson, Chi. (WR) 764 63 12.1 0 0 --- 764 63 12.1 39) Mixon, Cin. (RB) 763 186 4.1 599 164 3.7 164 22 7.5 40) Woods, LA-R (WR) 734 63 11.7 71 12 5.9 663 51 13.0 41t) Gallup, Dal. (WR) 733 46 15.9 0 0 --- 733 46 15.9 41t) Ridley, Atl. (WR) 733 52 14.1 34 2 17.0 699 50 14.0 43) Barkley, NY-G (RB) 720 153 4.7 461 118 3.9 259 35 7.4 44) T. Boyd, Cin. (WR) 715 66 10.8 16 3 5.3 699 63 11.1 45t) Ertz, Phi. (TE) 712 67 10.6 0 0 --- 712 67 10.6 45t) Waller, Oak. (TE) 712 61 11.7 5 2 2.5 707 59 12.0 47) M. Jones, Det. (WR) 701 58 12.1 0 2 0.0 701 56 12.5 48) D. Parker, Mia. (WR) 695 46 15.1 0 0 --- 695 46 15.1 49) Jones, T.B. (RB) 692 140 4.9 474 119 4.0 218 21 10.4 50) Kittle, S.F. (TE) 688 55 12.5 18 3 6.0 670 52 12.9 WEEK 12 / THROUGH MONDAY, NOVEMBER 25, 2019 NFL / LEADERS IN FIRST DOWNS Rank Player, Team Rush Rec Tot 1) McCaffrey, Car. (RB) 40 37 77 2) Cook, Min. (RB) 54 22 76 3) Fournette, Jac. (RB) 45 20 65 4) Elliott, Dal. (RB) 51 13 64 5) Thomas, N.O. (WR) 0 63 63 6) Carson, Sea. (RB) 51 9 60 7) Ingram, Bal. (RB) 43 11 54 8t) Chubb, Cle. (RB) 43 10 53 8t) Ekeler, LA-C (RB) 23 30 53 8t) Hopkins, Hou. (WR) 1 52 53 8t) Mack, Ind. (RB) 52 1 53 12) Godwin, T.B. (WR) 0 52 52 13) *Jacobs, Oak. (RB) 44 7 51 14t) M. Evans, T.B. (WR) 0 50 50 14t) Henry, Ten. (RB) 46 4 50 14t) J. Jones, Atl. (WR) 0 50 50 17) A. Jones, G.B. (RB) 35 14 49 18) Moore, Car. (WR) 2 45 47 19t) Brown, Buf. (WR) 0 46 46 19t) L. Jackson, Bal. (QB) 46 0 46 21) Michel, N.E. (RB) 39 6 45 22) Kelce, K.C. (TE) 0 44 44 23) Landry, Cle. (WR) 1 42 43 24t) Hyde, Hou. (RB) 41 1 42
24t) Kamara, N.O. (RB) 20 22 42 24t) Lockett, Sea. (WR) 0 42 42 27t) K. Allen, LA-C (WR) 1 40 41 27t) Edelman, N.E. (WR) 2 39 41 29) Bell, NY-J (RB) 24 16 40 30t) Cooper, Dal. (WR) 0 39 39 30t) Ertz, Phi. (TE) 0 39 39 30t) Mixon, Cin. (RB) 29 10 39 30t) Ridley, Atl. (WR) 2 37 39 30t) Robinson, Chi. (WR) 0 39 39 35t) Gurley, LA-R (RB) 33 4 37 35t) D. Parker, Mia. (WR) 0 37 37 35t) Sutton, Den. (WR) 1 36 37 38t) Chark, Jac. (WR) 1 35 36 38t) M. Jones, Det. (WR) 0 36 36 38t) Lindsay, Den. (RB) 28 8 36 41) Golladay, Det. (WR) 0 35 35 42t) Conner, Pit. (RB) 21 13 34 42t) Gallup, Dal. (WR) 0 34 34 42t) Jones, T.B. (RB) 24 10 34 42t) *Montgomery, Chi. (RB) 28 6 34 46t) Andrews, Bal. (TE) 0 33 33 46t) Drake, Mia.-Ariz (RB) 22 11 33 46t) D. Johnson, Ariz (RB) 19 14 33 46t) Kittle, S.F. (TE) 1 32 33 46t) C. Kupp, LA-R (WR) 0 33 33 46t) Murray, N.O. (RB) 28 5 33
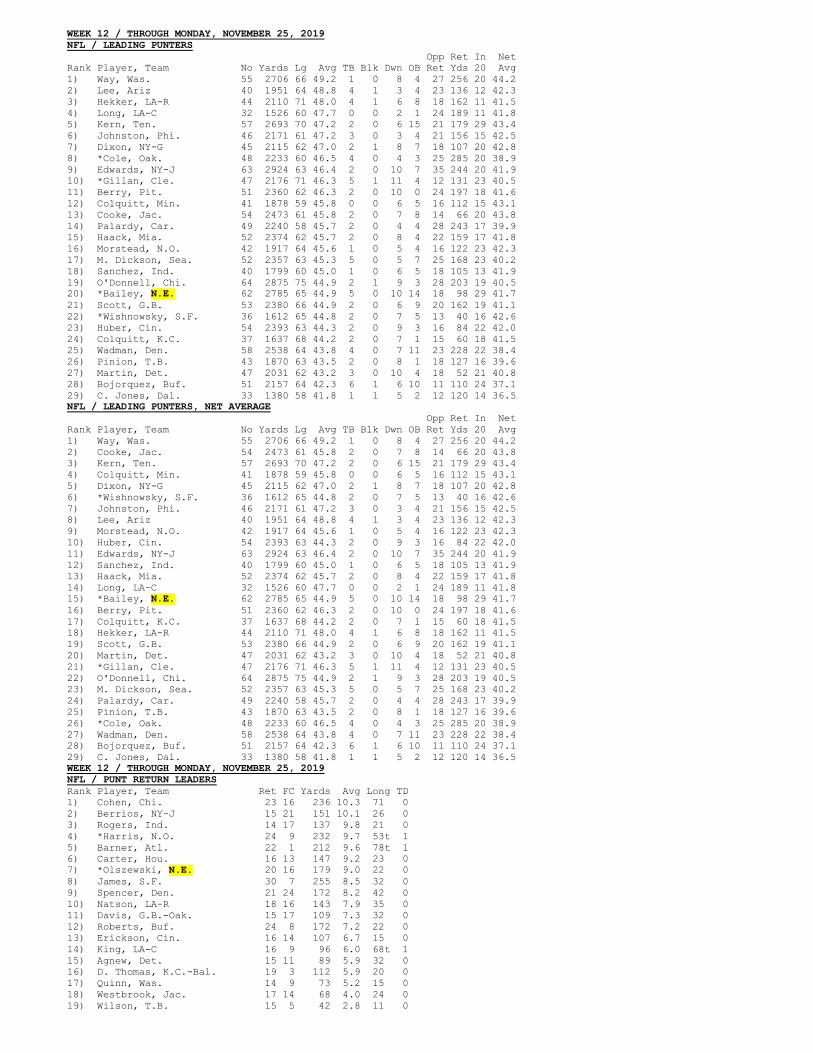
WEEK 12 / THROUGH MONDAY, NOVEMBER 25, 2019 NFL / LEADING PUNTERS Opp Ret In Net Rank Player, Team No Yards Lg Avg TB Blk Dwn OB Ret Yds 20 Avg 1) Way, Was. 55 2706 66 49.2 1 0 8 4 27 256 20 44.2 2) Lee, Ariz 40 1951 64 48.8 4 1 3 4 23 136 12 42.3 3) Hekker, LA-R 44 2110 71 48.0 4 1 6 8 18 162 11 41.5 4) Long, LA-C 32 1526 60 47.7 0 0 2 1 24 189 11 41.8 5) Kern, Ten. 57 2693 70 47.2 2 0 6 15 21 179 29 43.4 6) Johnston, Phi. 46 2171 61 47.2 3 0 3 4 21 156 15 42.5 7) Dixon, NY-G 45 2115 62 47.0 2 1 8 7 18 107 20 42.8 8) *Cole, Oak. 48 2233 60 46.5 4 0 4 3 25 285 20 38.9 9) Edwards, NY-J 63 2924 63 46.4 2 0 10 7 35 244 20 41.9 10) *Gillan, Cle. 47 2176 71 46.3 5 1 11 4 12 131 23 40.5 11) Berry, Pit. 51 2360 62 46.3 2 0 10 0 24 197 18 41.6 12) Colquitt, Min. 41 1878 59 45.8 0 0 6 5 16 112 15 43.1 13) Cooke, Jac. 54 2473 61 45.8 2 0 7 8 14 66 20 43.8 14) Palardy, Car. 49 2240 58 45.7 2 0 4 4 28 243 17 39.9 15) Haack, Mia. 52 2374 62 45.7 2 0 8 4 22 159 17 41.8 16) Morstead, N.O. 42 1917 64 45.6 1 0 5 4 16 122 23 42.3 17) M. Dickson, Sea. 52 2357 63 45.3 5 0 5 7 25 168 23 40.2 18) Sanchez, Ind. 40 1799 60 45.0 1 0 6 5 18 105 13 41.9 19) O'Donnell, Chi. 64 2875 75 44.9 2 1 9 3 28 203 19 40.5 20) *Bailey, N.E. 62 2785 65 44.9 5 0 10 14 18 98 29 41.7 21) Scott, G.B. 53 2380 66 44.9 2 0 6 9 20 162 19 41.1 22) *Wishnowsky, S.F. 36 1612 65 44.8 2 0 7 5 13 40 16 42.6 23) Huber, Cin. 54 2393 63 44.3 2 0 9 3 16 84 22 42.0 24) Colquitt, K.C. 37 1637 68 44.2 2 0 7 1 15 60 18 41.5 25) Wadman, Den. 58 2538 64 43.8 4 0 7 11 23 228 22 38.4 26) Pinion, T.B. 43 1870 63 43.5 2 0 8 1 18 127 16 39.6 27) Martin, Det. 47 2031 62 43.2 3 0 10 4 18 52 21 40.8 28) Bojorquez, Buf. 51 2157 64 42.3 6 1 6 10 11 110 24 37.1 29) C. Jones, Dal. 33 1380 58 41.8 1 1 5 2 12 120 14 36.5 NFL / LEADING PUNTERS, NET AVERAGE Opp Ret In Net Rank Player, Team No Yards Lg Avg TB Blk Dwn OB Ret Yds 20 Avg 1) Way, Was. 55 2706 66 49.2 1 0 8 4 27 256 20 44.2 2) Cooke, Jac. 54 2473 61 45.8 2 0 7 8 14 66 20 43.8 3) Kern, Ten. 57 2693 70 47.2 2 0 6 15 21 179 29 43.4 4) Colquitt, Min. 41 1878 59 45.8 0 0 6 5 16 112 15 43.1 5) Dixon, NY-G 45 2115 62 47.0 2 1 8 7 18 107 20 42.8 6) *Wishnowsky, S.F. 36 1612 65 44.8 2 0 7 5 13 40 16 42.6 7) Johnston, Phi. 46 2171 61 47.2 3 0 3 4 21 156 15 42.5 8) Lee, Ariz 40 1951 64 48.8 4 1 3 4 23 136 12 42.3 9) Morstead, N.O. 42 1917 64 45.6 1 0 5 4 16 122 23 42.3 10) Huber, Cin. 54 2393 63 44.3 2 0 9 3 16 84 22 42.0 11) Edwards, NY-J 63 2924 63 46.4 2 0 10 7 35 244 20 41.9 12) Sanchez, Ind. 40 1799 60 45.0 1 0 6 5 18 105 13 41.9 13) Haack, Mia. 52 2374 62 45.7 2 0 8 4 22 159 17 41.8 14) Long, LA-C 32 1526 60 47.7 0 0 2 1 24 189 11 41.8 15) *Bailey, N.E. 62 2785 65 44.9 5 0 10 14 18 98 29 41.7 16) Berry, Pit. 51 2360 62 46.3 2 0 10 0 24 197 18 41.6 17) Colquitt, K.C. 37 1637 68 44.2 2 0 7 1 15 60 18 41.5 18) Hekker, LA-R 44 2110 71 48.0 4 1 6 8 18 162 11 41.5 19) Scott, G.B. 53 2380 66 44.9 2 0 6 9 20 162 19 41.1 20) Martin, Det. 47 2031 62 43.2 3 0 10 4 18 52 21 40.8 21) *Gillan, Cle. 47 2176 71 46.3 5 1 11 4 12 131 23 40.5 22) O'Donnell, Chi. 64 2875 75 44.9 2 1 9 3 28 203 19 40.5 23) M. Dickson, Sea. 52 2357 63 45.3 5 0 5 7 25 168 23 40.2 24) Palardy, Car. 49 2240 58 45.7 2 0 4 4 28 243 17 39.9 25) Pinion, T.B. 43 1870 63 43.5 2 0 8 1 18 127 16 39.6 26) *Cole, Oak. 48 2233 60 46.5 4 0 4 3 25 285 20 38.9 27) Wadman, Den. 58 2538 64 43.8 4 0 7 11 23 228 22 38.4 28) Bojorquez, Buf. 51 2157 64 42.3 6 1 6 10 11 110 24 37.1 29) C. Jones, Dal. 33 1380 58 41.8 1 1 5 2 12 120 14 36.5 WEEK 12 / THROUGH MONDAY, NOVEMBER 25, 2019 NFL / PUNT RETURN LEADERS Rank Player, Team Ret FC Yards Avg Long TD 1) Cohen, Chi. 23 16 236 10.3 71 0 2) Berrios, NY-J 15 21 151 10.1 26 0 3) Rogers, Ind. 14 17 137 9.8 21 0 4) *Harris, N.O. 24 9 232 9.7 53t 1 5) Barner, Atl. 22 1 212 9.6 78t 1 6) Carter, Hou. 16 13 147 9.2 23 0 7) *Olszewski, N.E. 20 16 179 9.0 22 0 8) James, S.F. 30 7 255 8.5 32 0 9) Spencer, Den. 21 24 172 8.2 42 0 10) Natson, LA-R 18 16 143 7.9 35 0 11) Davis, G.B.-Oak. 15 17 109 7.3 32 0 12) Roberts, Buf. 24 8 172 7.2 22 0 13) Erickson, Cin. 16 14 107 6.7 15 0 14) King, LA-C 16 9 96 6.0 68t 1 15) Agnew, Det. 15 11 89 5.9 32 0 16) D. Thomas, K.C.-Bal. 19 3 112 5.9 20 0 17) Quinn, Was. 14 9 73 5.2 15 0 18) Westbrook, Jac. 17 14 68 4.0 24 0 19) Wilson, T.B. 15 5 42 2.8 11 0
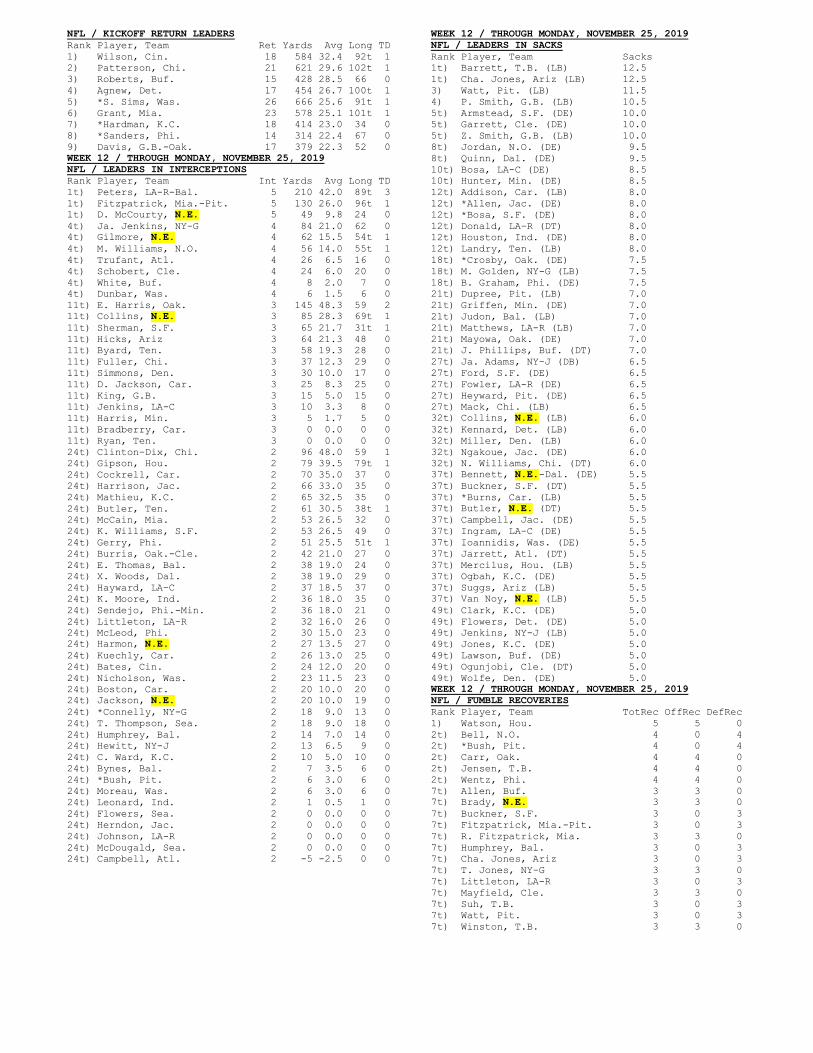
NFL / KICKOFF RETURN LEADERS Rank Player, Team Ret Yards Avg Long TD 1) Wilson, Cin. 18 584 32.4 92t 1 2) Patterson, Chi. 21 621 29.6 102t 1 3) Roberts, Buf. 15 428 28.5 66 0 4) Agnew, Det. 17 454 26.7 100t 1 5) *S. Sims, Was. 26 666 25.6 91t 1 6) Grant, Mia. 23 578 25.1 101t 1 7) *Hardman, K.C. 18 414 23.0 34 0 8) *Sanders, Phi. 14 314 22.4 67 0 9) Davis, G.B.-Oak. 17 379 22.3 52 0 WEEK 12 / THROUGH MONDAY, NOVEMBER 25, 2019 NFL / LEADERS IN INTERCEPTIONS Rank Player, Team Int Yards Avg Long TD 1t) Peters, LA-R-Bal. 5 210 42.0 89t 3 1t) Fitzpatrick, Mia.-Pit. 5 130 26.0 96t 1 1t) D. McCourty, N.E. 5 49 9.8 24 0 4t) Ja. Jenkins, NY-G 4 84 21.0 62 0 4t) Gilmore, N.E. 4 62 15.5 54t 1 4t) M. Williams, N.O. 4 56 14.0 55t 1 4t) Trufant, Atl. 4 26 6.5 16 0 4t) Schobert, Cle. 4 24 6.0 20 0 4t) White, Buf. 4 8 2.0 7 0 4t) Dunbar, Was. 4 6 1.5 6 0 11t) E. Harris, Oak. 3 145 48.3 59 2 11t) Collins, N.E. 3 85 28.3 69t 1 11t) Sherman, S.F. 3 65 21.7 31t 1 11t) Hicks, Ariz 3 64 21.3 48 0 11t) Byard, Ten. 3 58 19.3 28 0 11t) Fuller, Chi. 3 37 12.3 29 0 11t) Simmons, Den. 3 30 10.0 17 0 11t) D. Jackson, Car. 3 25 8.3 25 0 11t) King, G.B. 3 15 5.0 15 0 11t) Jenkins, LA-C 3 10 3.3 8 0 11t) Harris, Min. 3 5 1.7 5 0 11t) Bradberry, Car. 3 0 0.0 0 0 11t) Ryan, Ten. 3 0 0.0 0 0 24t) Clinton-Dix, Chi. 2 96 48.0 59 1 24t) Gipson, Hou. 2 79 39.5 79t 1 24t) Cockrell, Car. 2 70 35.0 37 0 24t) Harrison, Jac. 2 66 33.0 35 0 24t) Mathieu, K.C. 2 65 32.5 35 0 24t) Butler, Ten. 2 61 30.5 38t 1 24t) McCain, Mia. 2 53 26.5 32 0 24t) K. Williams, S.F. 2 53 26.5 49 0 24t) Gerry, Phi. 2 51 25.5 51t 1 24t) Burris, Oak.-Cle. 2 42 21.0 27 0 24t) E. Thomas, Bal. 2 38 19.0 24 0 24t) X. Woods, Dal. 2 38 19.0 29 0 24t) Hayward, LA-C 2 37 18.5 37 0 24t) K. Moore, Ind. 2 36 18.0 35 0 24t) Sendejo, Phi.-Min. 2 36 18.0 21 0 24t) Littleton, LA-R 2 32 16.0 26 0 24t) McLeod, Phi. 2 30 15.0 23 0 24t) Harmon, N.E. 2 27 13.5 27 0 24t) Kuechly, Car. 2 26 13.0 25 0 24t) Bates, Cin. 2 24 12.0 20 0 24t) Nicholson, Was. 2 23 11.5 23 0 24t) Boston, Car. 2 20 10.0 20 0 24t) Jackson, N.E. 2 20 10.0 19 0 24t) *Connelly, NY-G 2 18 9.0 13 0 24t) T. Thompson, Sea. 2 18 9.0 18 0 24t) Humphrey, Bal. 2 14 7.0 14 0 24t) Hewitt, NY-J 2 13 6.5 9 0 24t) C. Ward, K.C. 2 10 5.0 10 0 24t) Bynes, Bal. 2 7 3.5 6 0 24t) *Bush, Pit. 2 6 3.0 6 0 24t) Moreau, Was. 2 6 3.0 6 0 24t) Leonard, Ind. 2 1 0.5 1 0 24t) Flowers, Sea. 2 0 0.0 0 0 24t) Herndon, Jac. 2 0 0.0 0 0 24t) Johnson, LA-R 2 0 0.0 0 0 24t) McDougald, Sea. 2 0 0.0 0 0 24t) Campbell, Atl. 2 -5 -2.5 0 0
WEEK 12 / THROUGH MONDAY, NOVEMBER 25, 2019 NFL / LEADERS IN SACKS Rank Player, Team Sacks 1t) Barrett, T.B. (LB) 12.5 1t) Cha. Jones, Ariz (LB) 12.5 3) Watt, Pit. (LB) 11.5 4) P. Smith, G.B. (LB) 10.5 5t) Armstead, S.F. (DE) 10.0 5t) Garrett, Cle. (DE) 10.0 5t) Z. Smith, G.B. (LB) 10.0 8t) Jordan, N.O. (DE) 9.5 8t) Quinn, Dal. (DE) 9.5 10t) Bosa, LA-C (DE) 8.5 10t) Hunter, Min. (DE) 8.5 12t) Addison, Car. (LB) 8.0 12t) *Allen, Jac. (DE) 8.0 12t) *Bosa, S.F. (DE) 8.0 12t) Donald, LA-R (DT) 8.0 12t) Houston, Ind. (DE) 8.0 12t) Landry, Ten. (LB) 8.0 18t) *Crosby, Oak. (DE) 7.5 18t) M. Golden, NY-G (LB) 7.5 18t) B. Graham, Phi. (DE) 7.5 21t) Dupree, Pit. (LB) 7.0 21t) Griffen, Min. (DE) 7.0 21t) Judon, Bal. (LB) 7.0 21t) Matthews, LA-R (LB) 7.0 21t) Mayowa, Oak. (DE) 7.0 21t) J. Phillips, Buf. (DT) 7.0 27t) Ja. Adams, NY-J (DB) 6.5 27t) Ford, S.F. (DE) 6.5 27t) Fowler, LA-R (DE) 6.5 27t) Heyward, Pit. (DE) 6.5 27t) Mack, Chi. (LB) 6.5 32t) Collins, N.E. (LB) 6.0 32t) Kennard, Det. (LB) 6.0 32t) Miller, Den. (LB) 6.0 32t) Ngakoue, Jac. (DE) 6.0 32t) N. Williams, Chi. (DT) 6.0 37t) Bennett, N.E.-Dal. (DE) 5.5 37t) Buckner, S.F. (DT) 5.5 37t) *Burns, Car. (LB) 5.5 37t) Butler, N.E. (DT) 5.5 37t) Campbell, Jac. (DE) 5.5 37t) Ingram, LA-C (DE) 5.5 37t) Ioannidis, Was. (DE) 5.5 37t) Jarrett, Atl. (DT) 5.5 37t) Mercilus, Hou. (LB) 5.5 37t) Ogbah, K.C. (DE) 5.5 37t) Suggs, Ariz (LB) 5.5 37t) Van Noy, N.E. (LB) 5.5 49t) Clark, K.C. (DE) 5.0 49t) Flowers, Det. (DE) 5.0 49t) Jenkins, NY-J (LB) 5.0 49t) Jones, K.C. (DE) 5.0 49t) Lawson, Buf. (DE) 5.0 49t) Ogunjobi, Cle. (DT) 5.0 49t) Wolfe, Den. (DE) 5.0 WEEK 12 / THROUGH MONDAY, NOVEMBER 25, 2019 NFL / FUMBLE RECOVERIES Rank Player, Team TotRec OffRec DefRec 1) Watson, Hou. 5 5 0 2t) Bell, N.O. 4 0 4 2t) *Bush, Pit. 4 0 4 2t) Carr, Oak. 4 4 0 2t) Jensen, T.B. 4 4 0 2t) Wentz, Phi. 4 4 0 7t) Allen, Buf. 3 3 0 7t) Brady, N.E. 3 3 0 7t) Buckner, S.F. 3 0 3 7t) Fitzpatrick, Mia.-Pit. 3 0 3 7t) R. Fitzpatrick, Mia. 3 3 0 7t) Humphrey, Bal. 3 0 3 7t) Cha. Jones, Ariz 3 0 3 7t) T. Jones, NY-G 3 3 0 7t) Littleton, LA-R 3 0 3 7t) Mayfield, Cle. 3 3 0 7t) Suh, T.B. 3 0 3 7t) Watt, Pit. 3 0 3 7t) Winston, T.B. 3 3 0
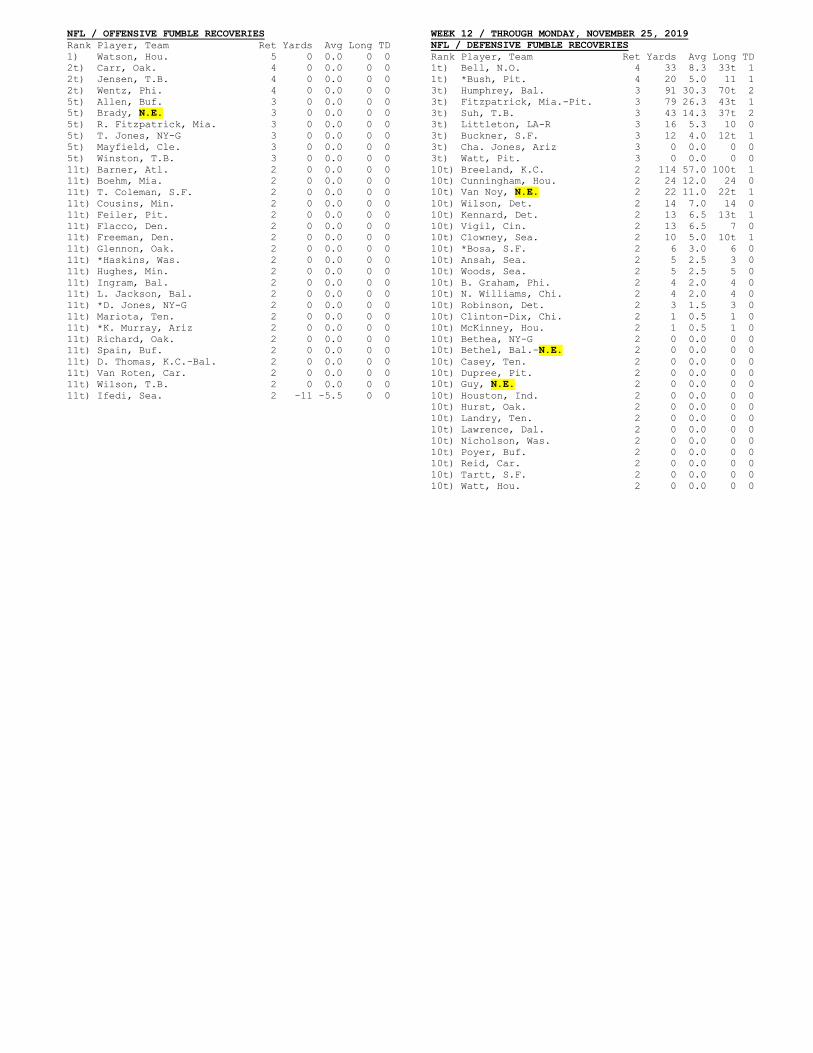
NFL / OFFENSIVE FUMBLE RECOVERIES Rank Player, Team Ret Yards Avg Long TD 1) Watson, Hou. 5 0 0.0 0 0 2t) Carr, Oak. 4 0 0.0 0 0 2t) Jensen, T.B. 4 0 0.0 0 0 2t) Wentz, Phi. 4 0 0.0 0 0 5t) Allen, Buf. 3 0 0.0 0 0 5t) Brady, N.E. 3 0 0.0 0 0 5t) R. Fitzpatrick, Mia. 3 0 0.0 0 0 5t) T. Jones, NY-G 3 0 0.0 0 0 5t) Mayfield, Cle. 3 0 0.0 0 0 5t) Winston, T.B. 3 0 0.0 0 0 11t) Barner, Atl. 2 0 0.0 0 0 11t) Boehm, Mia. 2 0 0.0 0 0 11t) T. Coleman, S.F. 2 0 0.0 0 0 11t) Cousins, Min. 2 0 0.0 0 0 11t) Feiler, Pit. 2 0 0.0 0 0 11t) Flacco, Den. 2 0 0.0 0 0 11t) Freeman, Den. 2 0 0.0 0 0 11t) Glennon, Oak. 2 0 0.0 0 0 11t) *Haskins, Was. 2 0 0.0 0 0 11t) Hughes, Min. 2 0 0.0 0 0 11t) Ingram, Bal. 2 0 0.0 0 0 11t) L. Jackson, Bal. 2 0 0.0 0 0 11t) *D. Jones, NY-G 2 0 0.0 0 0 11t) Mariota, Ten. 2 0 0.0 0 0 11t) *K. Murray, Ariz 2 0 0.0 0 0 11t) Richard, Oak. 2 0 0.0 0 0 11t) Spain, Buf. 2 0 0.0 0 0 11t) D. Thomas, K.C.-Bal. 2 0 0.0 0 0 11t) Van Roten, Car. 2 0 0.0 0 0 11t) Wilson, T.B. 2 0 0.0 0 0 11t) Ifedi, Sea. 2 -11 -5.5 0 0
WEEK 12 / THROUGH MONDAY, NOVEMBER 25, 2019 NFL / DEFENSIVE FUMBLE RECOVERIES Rank Player, Team Ret Yards Avg Long TD 1t) Bell, N.O. 4 33 8.3 33t 1 1t) *Bush, Pit. 4 20 5.0 11 1 3t) Humphrey, Bal. 3 91 30.3 70t 2 3t) Fitzpatrick, Mia.-Pit. 3 79 26.3 43t 1 3t) Suh, T.B. 3 43 14.3 37t 2 3t) Littleton, LA-R 3 16 5.3 10 0 3t) Buckner, S.F. 3 12 4.0 12t 1 3t) Cha. Jones, Ariz 3 0 0.0 0 0 3t) Watt, Pit. 3 0 0.0 0 0 10t) Breeland, K.C. 2 114 57.0 100t 1 10t) Cunningham, Hou. 2 24 12.0 24 0 10t) Van Noy, N.E. 2 22 11.0 22t 1 10t) Wilson, Det. 2 14 7.0 14 0 10t) Kennard, Det. 2 13 6.5 13t 1 10t) Vigil, Cin. 2 13 6.5 7 0 10t) Clowney, Sea. 2 10 5.0 10t 1 10t) *Bosa, S.F. 2 6 3.0 6 0 10t) Ansah, Sea. 2 5 2.5 3 0 10t) Woods, Sea. 2 5 2.5 5 0 10t) B. Graham, Phi. 2 4 2.0 4 0 10t) N. Williams, Chi. 2 4 2.0 4 0 10t) Robinson, Det. 2 3 1.5 3 0 10t) Clinton-Dix, Chi. 2 1 0.5 1 0 10t) McKinney, Hou. 2 1 0.5 1 0 10t) Bethea, NY-G 2 0 0.0 0 0 10t) Bethel, Bal.-N.E. 2 0 0.0 0 0 10t) Casey, Ten. 2 0 0.0 0 0 10t) Dupree, Pit. 2 0 0.0 0 0 10t) Guy, N.E. 2 0 0.0 0 0 10t) Houston, Ind. 2 0 0.0 0 0 10t) Hurst, Oak. 2 0 0.0 0 0 10t) Landry, Ten. 2 0 0.0 0 0 10t) Lawrence, Dal. 2 0 0.0 0 0 10t) Nicholson, Was. 2 0 0.0 0 0 10t) Poyer, Buf. 2 0 0.0 0 0 10t) Reid, Car. 2 0 0.0 0 0 10t) Tartt, S.F. 2 0 0.0 0 0 10t) Watt, Hou. 2 0 0.0 0 0
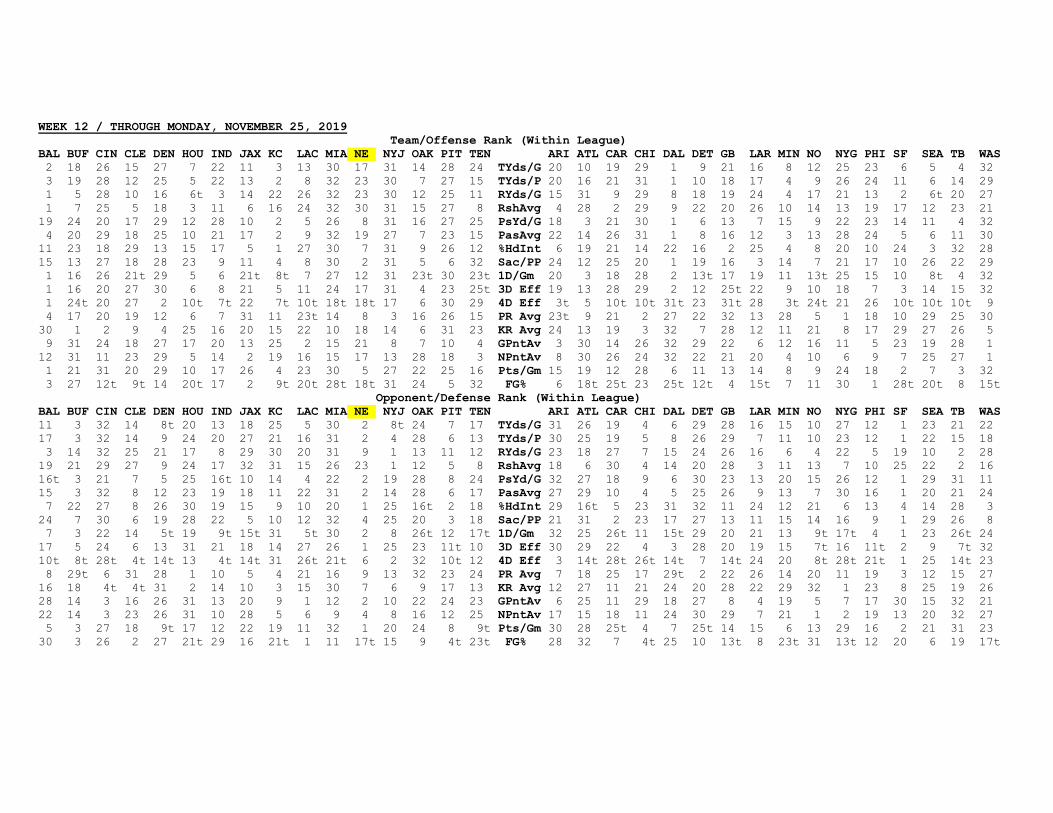
WEEK 12 / THROUGH MONDAY, NOVEMBER 25, 2019 Team/Offense Rank (Within League) BAL BUF CIN CLE DEN HOU IND JAX KC LAC MIA NE NYJ OAK PIT TEN ARI ATL CAR CHI DAL DET GB LAR MIN NO NYG PHI SF SEA TB WAS 2 18 26 15 27 7 22 11 3 13 30 17 31 14 28 24 TYds/G 20 10 19 29 1 9 21 16 8 12 25 23 6 5 4 32 3 19 28 12 25 5 22 13 2 8 32 23 30 7 27 15 TYds/P 20 16 21 31 1 10 18 17 4 9 26 24 11 6 14 29 1 5 28 10 16 6t 3 14 22 26 32 23 30 12 25 11 RYds/G 15 31 9 29 8 18 19 24 4 17 21 13 2 6t 20 27 1 7 25 5 18 3 11 6 16 24 32 30 31 15 27 8 RshAvg 4 28 2 29 9 22 20 26 10 14 13 19 17 12 23 21 19 24 20 17 29 12 28 10 2 5 26 8 31 16 27 25 PsYd/G 18 3 21 30 1 6 13 7 15 9 22 23 14 11 4 32 4 20 29 18 25 10 21 17 2 9 32 19 27 7 23 15 PasAvg 22 14 26 31 1 8 16 12 3 13 28 24 5 6 11 30 11 23 18 29 13 15 17 5 1 27 30 7 31 9 26 12 %HdInt 6 19 21 14 22 16 2 25 4 8 20 10 24 3 32 28 15 13 27 18 28 23 9 11 4 8 30 2 31 5 6 32 Sac/PP 24 12 25 20 1 19 16 3 14 7 21 17 10 26 22 29 1 16 26 21t 29 5 6 21t 8t 7 27 12 31 23t 30 23t 1D/Gm 20 3 18 28 2 13t 17 19 11 13t 25 15 10 8t 4 32 1 16 20 27 30 6 8 21 5 11 24 17 31 4 23 25t 3D Eff 19 13 28 29 2 12 25t 22 9 10 18 7 3 14 15 32 1 24t 20 27 2 10t 7t 22 7t 10t 18t 18t 17 6 30 29 4D Eff 3t 5 10t 10t 31t 23 31t 28 3t 24t 21 26 10t 10t 10t 9 4 17 20 19 12 6 7 31 11 23t 14 8 3 16 26 15 PR Avg 23t 9 21 2 27 22 32 13 28 5 1 18 10 29 25 30 30 1 2 9 4 25 16 20 15 22 10 18 14 6 31 23 KR Avg 24 13 19 3 32 7 28 12 11 21 8 17 29 27 26 5 9 31 24 18 27 17 20 13 25 2 15 21 8 7 10 4 GPntAv 3 30 14 26 32 29 22 6 12 16 11 5 23 19 28 1 12 31 11 23 29 5 14 2 19 16 15 17 13 28 18 3 NPntAv 8 30 26 24 32 22 21 20 4 10 6 9 7 25 27 1 1 21 31 20 29 10 17 26 4 23 30 5 27 22 25 16 Pts/Gm 15 19 12 28 6 11 13 14 8 9 24 18 2 7 3 32 3 27 12t 9t 14 20t 17 2 9t 20t 28t 18t 31 24 5 32 FG% 6 18t 25t 23 25t 12t 4 15t 7 11 30 1 28t 20t 8 15t Opponent/Defense Rank (Within League) BAL BUF CIN CLE DEN HOU IND JAX KC LAC MIA NE NYJ OAK PIT TEN ARI ATL CAR CHI DAL DET GB LAR MIN NO NYG PHI SF SEA TB WAS 11 3 32 14 8t 20 13 18 25 5 30 2 8t 24 7 17 TYds/G 31 26 19 4 6 29 28 16 15 10 27 12 1 23 21 22 17 3 32 14 9 24 20 27 21 16 31 2 4 28 6 13 TYds/P 30 25 19 5 8 26 29 7 11 10 23 12 1 22 15 18 3 14 32 25 21 17 8 29 30 20 31 9 1 13 11 12 RYds/G 23 18 27 7 15 24 26 16 6 4 22 5 19 10 2 28 19 21 29 27 9 24 17 32 31 15 26 23 1 12 5 8 RshAvg 18 6 30 4 14 20 28 3 11 13 7 10 25 22 2 16 16t 3 21 7 5 25 16t 10 14 4 22 2 19 28 8 24 PsYd/G 32 27 18 9 6 30 23 13 20 15 26 12 1 29 31 11 15 3 32 8 12 23 19 18 11 22 31 2 14 28 6 17 PasAvg 27 29 10 4 5 25 26 9 13 7 30 16 1 20 21 24 7 22 27 8 26 30 19 15 9 10 20 1 25 16t 2 18 %HdInt 29 16t 5 23 31 32 11 24 12 21 6 13 4 14 28 3 24 7 30 6 19 28 22 5 10 12 32 4 25 20 3 18 Sac/PP 21 31 2 23 17 27 13 11 15 14 16 9 1 29 26 8 7 3 22 14 5t 19 9t 15t 31 5t 30 2 8 26t 12 17t 1D/Gm 32 25 26t 11 15t 29 20 21 13 9t 17t 4 1 23 26t 24 17 5 24 6 13 31 21 18 14 27 26 1 25 23 11t 10 3D Eff 30 29 22 4 3 28 20 19 15 7t 16 11t 2 9 7t 32 10t 8t 28t 4t 14t 13 4t 14t 31 26t 21t 6 2 32 10t 12 4D Eff 3 14t 28t 26t 14t 7 14t 24 20 8t 28t 21t 1 25 14t 23 8 29t 6 31 28 1 10 5 4 21 16 9 13 32 23 24 PR Avg 7 18 25 17 29t 2 22 26 14 20 11 19 3 12 15 27 16 18 4t 4t 31 2 14 10 3 15 30 7 6 9 17 13 KR Avg 12 27 11 21 24 20 28 22 29 32 1 23 8 25 19 26 28 14 3 16 26 31 13 20 9 1 12 2 10 22 24 23 GPntAv 6 25 11 29 18 27 8 4 19 5 7 17 30 15 32 21 22 14 3 23 26 31 10 28 5 6 9 4 8 16 12 25 NPntAv 17 15 18 11 24 30 29 7 21 1 2 19 13 20 32 27 5 3 27 18 9t 17 12 22 19 11 32 1 20 24 8 9t Pts/Gm 30 28 25t 4 7 25t 14 15 6 13 29 16 2 21 31 23 30 3 26 2 27 21t 29 16 21t 1 11 17t 15 9 4t 23t FG% 28 32 7 4t 25 10 13t 8 23t 31 13t 12 20 6 19 17t
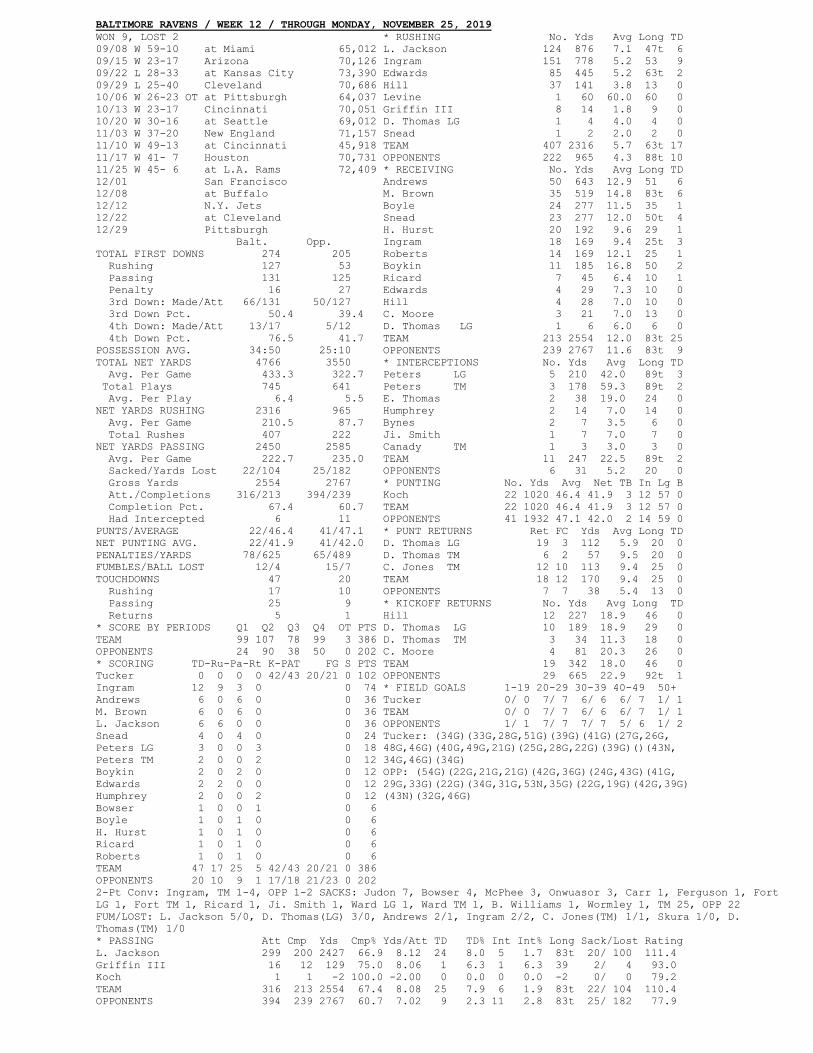
BALTIMORE RAVENS / WEEK 12 / THROUGH MONDAY, NOVEMBER 25, 2019 WON 9, LOST 2 * RUSHING No. Yds Avg Long TD 09/08 W 59-10 at Miami 65,012 L. Jackson 124 876 7.1 47t 6 09/15 W 23-17 Arizona 70,126 Ingram 151 778 5.2 53 9 09/22 L 28-33 at Kansas City 73,390 Edwards 85 445 5.2 63t 2 09/29 L 25-40 Cleveland 70,686 Hill 37 141 3.8 13 0 10/06 W 26-23 OT at Pittsburgh 64,037 Levine 1 60 60.0 60 0 10/13 W 23-17 Cincinnati 70,051 Griffin III 8 14 1.8 9 0 10/20 W 30-16 at Seattle 69,012 D. Thomas LG 1 4 4.0 4 0 11/03 W 37-20 New England 71,157 Snead 1 2 2.0 2 0 11/10 W 49-13 at Cincinnati 45,918 TEAM 407 2316 5.7 63t 17 11/17 W 41- 7 Houston 70,731 OPPONENTS 222 965 4.3 88t 10 11/25 W 45- 6 at L.A. Rams 72,409 * RECEIVING No. Yds Avg Long TD 12/01 San Francisco Andrews 50 643 12.9 51 6 12/08 at Buffalo M. Brown 35 519 14.8 83t 6 12/12 N.Y. Jets Boyle 24 277 11.5 35 1 12/22 at Cleveland Snead 23 277 12.0 50t 4 12/29 Pittsburgh H. Hurst 20 192 9.6 29 1 Balt. Opp. Ingram 18 169 9.4 25t 3 TOTAL FIRST DOWNS 274 205 Roberts 14 169 12.1 25 1 Rushing 127 53 Boykin 11 185 16.8 50 2 Passing 131 125 Ricard 7 45 6.4 10 1 Penalty 16 27 Edwards 4 29 7.3 10 0 3rd Down: Made/Att 66/131 50/127 Hill 4 28 7.0 10 0 3rd Down Pct. 50.4 39.4 C. Moore 3 21 7.0 13 0 4th Down: Made/Att 13/17 5/12 D. Thomas LG 1 6 6.0 6 0 4th Down Pct. 76.5 41.7 TEAM 213 2554 12.0 83t 25 POSSESSION AVG. 34:50 25:10 OPPONENTS 239 2767 11.6 83t 9 TOTAL NET YARDS 4766 3550 * INTERCEPTIONS No. Yds Avg Long TD Avg. Per Game 433.3 322.7 Peters LG 5 210 42.0 89t 3 Total Plays 745 641 Peters TM 3 178 59.3 89t 2 Avg. Per Play 6.4 5.5 E. Thomas 2 38 19.0 24 0 NET YARDS RUSHING 2316 965 Humphrey 2 14 7.0 14 0 Avg. Per Game 210.5 87.7 Bynes 2 7 3.5 6 0 Total Rushes 407 222 Ji. Smith 1 7 7.0 7 0 NET YARDS PASSING 2450 2585 Canady TM 1 3 3.0 3 0 Avg. Per Game 222.7 235.0 TEAM 11 247 22.5 89t 2 Sacked/Yards Lost 22/104 25/182 OPPONENTS 6 31 5.2 20 0 Gross Yards 2554 2767 * PUNTING No. Yds Avg Net TB In Lg B Att./Completions 316/213 394/239 Koch 22 1020 46.4 41.9 3 12 57 0 Completion Pct. 67.4 60.7 TEAM 22 1020 46.4 41.9 3 12 57 0 Had Intercepted 6 11 OPPONENTS 41 1932 47.1 42.0 2 14 59 0 PUNTS/AVERAGE 22/46.4 41/47.1 * PUNT RETURNS Ret FC Yds Avg Long TD NET PUNTING AVG. 22/41.9 41/42.0 D. Thomas LG 19 3 112 5.9 20 0 PENALTIES/YARDS 78/625 65/489 D. Thomas TM 6 2 57 9.5 20 0 FUMBLES/BALL LOST 12/4 15/7 C. Jones TM 12 10 113 9.4 25 0 TOUCHDOWNS 47 20 TEAM 18 12 170 9.4 25 0 Rushing 17 10 OPPONENTS 7 7 38 5.4 13 0 Passing 25 9 * KICKOFF RETURNS No. Yds Avg Long TD Returns 5 1 Hill 12 227 18.9 46 0 * SCORE BY PERIODS Q1 Q2 Q3 Q4 OT PTS D. Thomas LG 10 189 18.9 29 0 TEAM 99 107 78 99 3 386 D. Thomas TM 3 34 11.3 18 0 OPPONENTS 24 90 38 50 0 202 C. Moore 4 81 20.3 26 0 * SCORING TD-Ru-Pa-Rt K-PAT FG S PTS TEAM 19 342 18.0 46 0 Tucker 0 0 0 0 42/43 20/21 0 102 OPPONENTS 29 665 22.9 92t 1 Ingram 12 9 3 0 0 74 * FIELD GOALS 1-19 20-29 30-39 40-49 50+ Andrews 6 0 6 0 0 36 Tucker 0/ 0 7/ 7 6/ 6 6/ 7 1/ 1 M. Brown 6 0 6 0 0 36 TEAM 0/ 0 7/ 7 6/ 6 6/ 7 1/ 1 L. Jackson 6 6 0 0 0 36 OPPONENTS 1/ 1 7/ 7 7/ 7 5/ 6 1/ 2 Snead 4 0 4 0 0 24 Tucker: (34G)(33G,28G,51G)(39G)(41G)(27G,26G, Peters LG 3 0 0 3 0 18 48G,46G)(40G,49G,21G)(25G,28G,22G)(39G)()(43N, Peters TM 2 0 0 2 0 12 34G,46G)(34G) Boykin 2 0 2 0 0 12 OPP: (54G)(22G,21G,21G)(42G,36G)(24G,43G)(41G, Edwards 2 2 0 0 0 12 29G,33G)(22G)(34G,31G,53N,35G)(22G,19G)(42G,39G) Humphrey 2 0 0 2 0 12 (43N)(32G,46G) Bowser 1 0 0 1 0 6 Boyle 1 0 1 0 0 6 H. Hurst 1 0 1 0 0 6 Ricard 1 0 1 0 0 6 Roberts 1 0 1 0 0 6 TEAM 47 17 25 5 42/43 20/21 0 386 OPPONENTS 20 10 9 1 17/18 21/23 0 202 2-Pt Conv: Ingram, TM 1-4, OPP 1-2 SACKS: Judon 7, Bowser 4, McPhee 3, Onwuasor 3, Carr 1, Ferguson 1, Fort LG 1, Fort TM 1, Ricard 1, Ji. Smith 1, Ward LG 1, Ward TM 1, B. Williams 1, Wormley 1, TM 25, OPP 22 FUM/LOST: L. Jackson 5/0, D. Thomas(LG) 3/0, Andrews 2/1, Ingram 2/2, C. Jones(TM) 1/1, Skura 1/0, D. Thomas(TM) 1/0 * PASSING Att Cmp Yds Cmp% Yds/Att TD TD% Int Int% Long Sack/Lost Rating L. Jackson 299 200 2427 66.9 8.12 24 8.0 5 1.7 83t 20/ 100 111.4 Griffin III 16 12 129 75.0 8.06 1 6.3 1 6.3 39 2/ 4 93.0 Koch 1 1 -2 100.0 -2.00 0 0.0 0 0.0 -2 0/ 0 79.2 TEAM 316 213 2554 67.4 8.08 25 7.9 6 1.9 83t 22/ 104 110.4 OPPONENTS 394 239 2767 60.7 7.02 9 2.3 11 2.8 83t 25/ 182 77.9
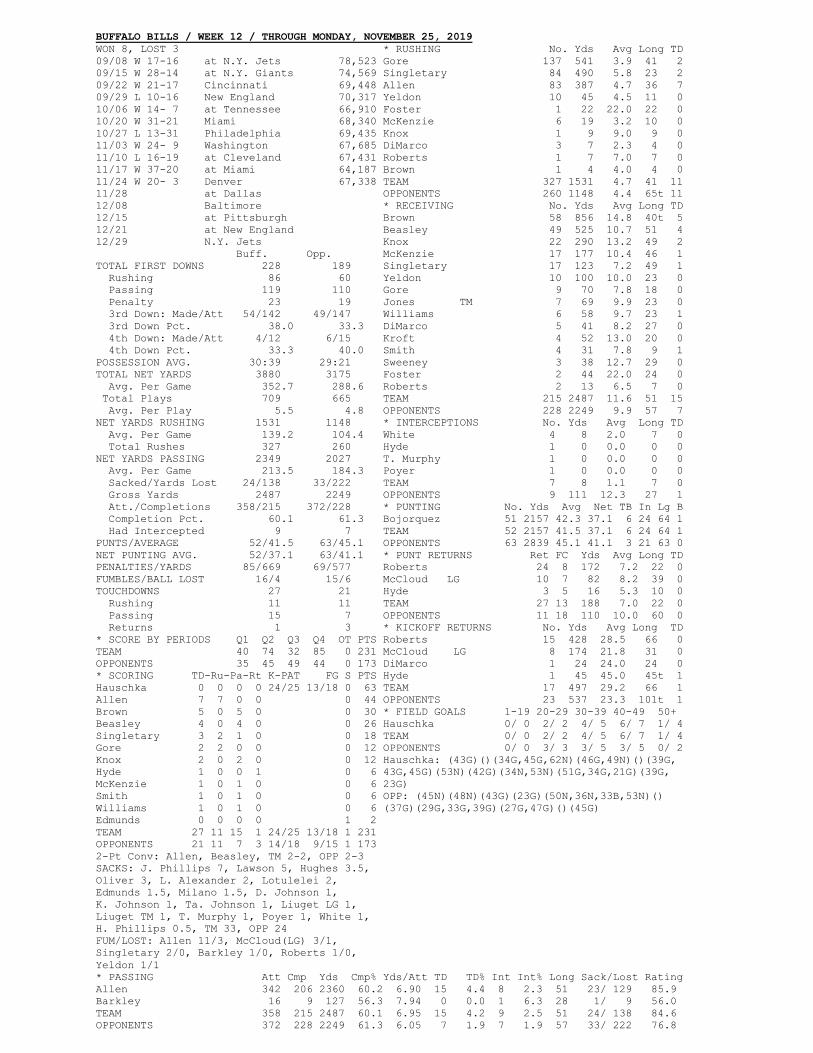
BUFFALO BILLS / WEEK 12 / THROUGH MONDAY, NOVEMBER 25, 2019 WON 8, LOST 3 * RUSHING No. Yds Avg Long TD 09/08 W 17-16 at N.Y. Jets 78,523 Gore 137 541 3.9 41 2 09/15 W 28-14 at N.Y. Giants 74,569 Singletary 84 490 5.8 23 2 09/22 W 21-17 Cincinnati 69,448 Allen 83 387 4.7 36 7 09/29 L 10-16 New England 70,317 Yeldon 10 45 4.5 11 0 10/06 W 14- 7 at Tennessee 66,910 Foster 1 22 22.0 22 0 10/20 W 31-21 Miami 68,340 McKenzie 6 19 3.2 10 0 10/27 L 13-31 Philadelphia 69,435 Knox 1 9 9.0 9 0 11/03 W 24- 9 Washington 67,685 DiMarco 3 7 2.3 4 0 11/10 L 16-19 at Cleveland 67,431 Roberts 1 7 7.0 7 0 11/17 W 37-20 at Miami 64,187 Brown 1 4 4.0 4 0 11/24 W 20- 3 Denver 67,338 TEAM 327 1531 4.7 41 11 11/28 at Dallas OPPONENTS 260 1148 4.4 65t 11 12/08 Baltimore * RECEIVING No. Yds Avg Long TD 12/15 at Pittsburgh Brown 58 856 14.8 40t 5 12/21 at New England Beasley 49 525 10.7 51 4 12/29 N.Y. Jets Knox 22 290 13.2 49 2 Buff. Opp. McKenzie 17 177 10.4 46 1 TOTAL FIRST DOWNS 228 189 Singletary 17 123 7.2 49 1 Rushing 86 60 Yeldon 10 100 10.0 23 0 Passing 119 110 Gore 9 70 7.8 18 0 Penalty 23 19 Jones TM 7 69 9.9 23 0 3rd Down: Made/Att 54/142 49/147 Williams 6 58 9.7 23 1 3rd Down Pct. 38.0 33.3 DiMarco 5 41 8.2 27 0 4th Down: Made/Att 4/12 6/15 Kroft 4 52 13.0 20 0 4th Down Pct. 33.3 40.0 Smith 4 31 7.8 9 1 POSSESSION AVG. 30:39 29:21 Sweeney 3 38 12.7 29 0 TOTAL NET YARDS 3880 3175 Foster 2 44 22.0 24 0 Avg. Per Game 352.7 288.6 Roberts 2 13 6.5 7 0 Total Plays 709 665 TEAM 215 2487 11.6 51 15 Avg. Per Play 5.5 4.8 OPPONENTS 228 2249 9.9 57 7 NET YARDS RUSHING 1531 1148 * INTERCEPTIONS No. Yds Avg Long TD Avg. Per Game 139.2 104.4 White 4 8 2.0 7 0 Total Rushes 327 260 Hyde 1 0 0.0 0 0 NET YARDS PASSING 2349 2027 T. Murphy 1 0 0.0 0 0 Avg. Per Game 213.5 184.3 Poyer 1 0 0.0 0 0 Sacked/Yards Lost 24/138 33/222 TEAM 7 8 1.1 7 0 Gross Yards 2487 2249 OPPONENTS 9 111 12.3 27 1 Att./Completions 358/215 372/228 * PUNTING No. Yds Avg Net TB In Lg B Completion Pct. 60.1 61.3 Bojorquez 51 2157 42.3 37.1 6 24 64 1 Had Intercepted 9 7 TEAM 52 2157 41.5 37.1 6 24 64 1 PUNTS/AVERAGE 52/41.5 63/45.1 OPPONENTS 63 2839 45.1 41.1 3 21 63 0 NET PUNTING AVG. 52/37.1 63/41.1 * PUNT RETURNS Ret FC Yds Avg Long TD PENALTIES/YARDS 85/669 69/577 Roberts 24 8 172 7.2 22 0 FUMBLES/BALL LOST 16/4 15/6 McCloud LG 10 7 82 8.2 39 0 TOUCHDOWNS 27 21 Hyde 3 5 16 5.3 10 0 Rushing 11 11 TEAM 27 13 188 7.0 22 0 Passing 15 7 OPPONENTS 11 18 110 10.0 60 0 Returns 1 3 * KICKOFF RETURNS No. Yds Avg Long TD * SCORE BY PERIODS Q1 Q2 Q3 Q4 OT PTS Roberts 15 428 28.5 66 0 TEAM 40 74 32 85 0 231 McCloud LG 8 174 21.8 31 0 OPPONENTS 35 45 49 44 0 173 DiMarco 1 24 24.0 24 0 * SCORING TD-Ru-Pa-Rt K-PAT FG S PTS Hyde 1 45 45.0 45t 1 Hauschka 0 0 0 0 24/25 13/18 0 63 TEAM 17 497 29.2 66 1 Allen 7 7 0 0 0 44 OPPONENTS 23 537 23.3 101t 1 Brown 5 0 5 0 0 30 * FIELD GOALS 1-19 20-29 30-39 40-49 50+ Beasley 4 0 4 0 0 26 Hauschka 0/ 0 2/ 2 4/ 5 6/ 7 1/ 4 Singletary 3 2 1 0 0 18 TEAM 0/ 0 2/ 2 4/ 5 6/ 7 1/ 4 Gore 2 2 0 0 0 12 OPPONENTS 0/ 0 3/ 3 3/ 5 3/ 5 0/ 2 Knox 2 0 2 0 0 12 Hauschka: (43G)()(34G,45G,62N)(46G,49N)()(39G, Hyde 1 0 0 1 0 6 43G,45G)(53N)(42G)(34N,53N)(51G,34G,21G)(39G, McKenzie 1 0 1 0 0 6 23G) Smith 1 0 1 0 0 6 OPP: (45N)(48N)(43G)(23G)(50N,36N,33B,53N)() Williams 1 0 1 0 0 6 (37G)(29G,33G,39G)(27G,47G)()(45G) Edmunds 0 0 0 0 1 2 TEAM 27 11 15 1 24/25 13/18 1 231 OPPONENTS 21 11 7 3 14/18 9/15 1 173 2-Pt Conv: Allen, Beasley, TM 2-2, OPP 2-3 SACKS: J. Phillips 7, Lawson 5, Hughes 3.5, Oliver 3, L. Alexander 2, Lotulelei 2, Edmunds 1.5, Milano 1.5, D. Johnson 1, K. Johnson 1, Ta. Johnson 1, Liuget LG 1, Liuget TM 1, T. Murphy 1, Poyer 1, White 1, H. Phillips 0.5, TM 33, OPP 24 FUM/LOST: Allen 11/3, McCloud(LG) 3/1, Singletary 2/0, Barkley 1/0, Roberts 1/0, Yeldon 1/1 * PASSING Att Cmp Yds Cmp% Yds/Att TD TD% Int Int% Long Sack/Lost Rating Allen 342 206 2360 60.2 6.90 15 4.4 8 2.3 51 23/ 129 85.9 Barkley 16 9 127 56.3 7.94 0 0.0 1 6.3 28 1/ 9 56.0 TEAM 358 215 2487 60.1 6.95 15 4.2 9 2.5 51 24/ 138 84.6 OPPONENTS 372 228 2249 61.3 6.05 7 1.9 7 1.9 57 33/ 222 76.8
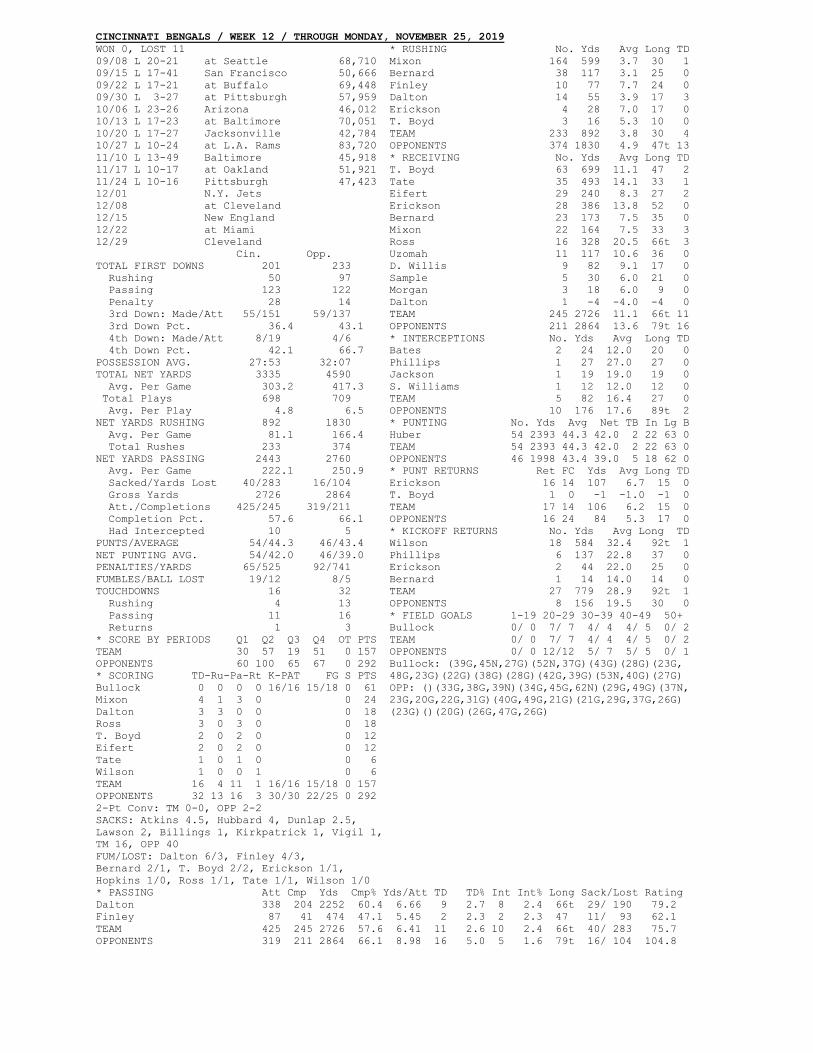
CINCINNATI BENGALS / WEEK 12 / THROUGH MONDAY, NOVEMBER 25, 2019 WON 0, LOST 11 * RUSHING No. Yds Avg Long TD 09/08 L 20-21 at Seattle 68,710 Mixon 164 599 3.7 30 1 09/15 L 17-41 San Francisco 50,666 Bernard 38 117 3.1 25 0 09/22 L 17-21 at Buffalo 69,448 Finley 10 77 7.7 24 0 09/30 L 3-27 at Pittsburgh 57,959 Dalton 14 55 3.9 17 3 10/06 L 23-26 Arizona 46,012 Erickson 4 28 7.0 17 0 10/13 L 17-23 at Baltimore 70,051 T. Boyd 3 16 5.3 10 0 10/20 L 17-27 Jacksonville 42,784 TEAM 233 892 3.8 30 4 10/27 L 10-24 at L.A. Rams 83,720 OPPONENTS 374 1830 4.9 47t 13 11/10 L 13-49 Baltimore 45,918 * RECEIVING No. Yds Avg Long TD 11/17 L 10-17 at Oakland 51,921 T. Boyd 63 699 11.1 47 2 11/24 L 10-16 Pittsburgh 47,423 Tate 35 493 14.1 33 1 12/01 N.Y. Jets Eifert 29 240 8.3 27 2 12/08 at Cleveland Erickson 28 386 13.8 52 0 12/15 New England Bernard 23 173 7.5 35 0 12/22 at Miami Mixon 22 164 7.5 33 3 12/29 Cleveland Ross 16 328 20.5 66t 3 Cin. Opp. Uzomah 11 117 10.6 36 0 TOTAL FIRST DOWNS 201 233 D. Willis 9 82 9.1 17 0 Rushing 50 97 Sample 5 30 6.0 21 0 Passing 123 122 Morgan 3 18 6.0 9 0 Penalty 28 14 Dalton 1 -4 -4.0 -4 0 3rd Down: Made/Att 55/151 59/137 TEAM 245 2726 11.1 66t 11 3rd Down Pct. 36.4 43.1 OPPONENTS 211 2864 13.6 79t 16 4th Down: Made/Att 8/19 4/6 * INTERCEPTIONS No. Yds Avg Long TD 4th Down Pct. 42.1 66.7 Bates 2 24 12.0 20 0 POSSESSION AVG. 27:53 32:07 Phillips 1 27 27.0 27 0 TOTAL NET YARDS 3335 4590 Jackson 1 19 19.0 19 0 Avg. Per Game 303.2 417.3 S. Williams 1 12 12.0 12 0 Total Plays 698 709 TEAM 5 82 16.4 27 0 Avg. Per Play 4.8 6.5 OPPONENTS 10 176 17.6 89t 2 NET YARDS RUSHING 892 1830 * PUNTING No. Yds Avg Net TB In Lg B Avg. Per Game 81.1 166.4 Huber 54 2393 44.3 42.0 2 22 63 0 Total Rushes 233 374 TEAM 54 2393 44.3 42.0 2 22 63 0 NET YARDS PASSING 2443 2760 OPPONENTS 46 1998 43.4 39.0 5 18 62 0 Avg. Per Game 222.1 250.9 * PUNT RETURNS Ret FC Yds Avg Long TD Sacked/Yards Lost 40/283 16/104 Erickson 16 14 107 6.7 15 0 Gross Yards 2726 2864 T. Boyd 1 0 -1 -1.0 -1 0 Att./Completions 425/245 319/211 TEAM 17 14 106 6.2 15 0 Completion Pct. 57.6 66.1 OPPONENTS 16 24 84 5.3 17 0 Had Intercepted 10 5 * KICKOFF RETURNS No. Yds Avg Long TD PUNTS/AVERAGE 54/44.3 46/43.4 Wilson 18 584 32.4 92t 1 NET PUNTING AVG. 54/42.0 46/39.0 Phillips 6 137 22.8 37 0 PENALTIES/YARDS 65/525 92/741 Erickson 2 44 22.0 25 0 FUMBLES/BALL LOST 19/12 8/5 Bernard 1 14 14.0 14 0 TOUCHDOWNS 16 32 TEAM 27 779 28.9 92t 1 Rushing 4 13 OPPONENTS 8 156 19.5 30 0 Passing 11 16 * FIELD GOALS 1-19 20-29 30-39 40-49 50+ Returns 1 3 Bullock 0/ 0 7/ 7 4/ 4 4/ 5 0/ 2 * SCORE BY PERIODS Q1 Q2 Q3 Q4 OT PTS TEAM 0/ 0 7/ 7 4/ 4 4/ 5 0/ 2 TEAM 30 57 19 51 0 157 OPPONENTS 0/ 0 12/12 5/ 7 5/ 5 0/ 1 OPPONENTS 60 100 65 67 0 292 Bullock: (39G,45N,27G)(52N,37G)(43G)(28G)(23G, * SCORING TD-Ru-Pa-Rt K-PAT FG S PTS 48G,23G)(22G)(38G)(28G)(42G,39G)(53N,40G)(27G) Bullock 0 0 0 0 16/16 15/18 0 61 OPP: ()(33G,38G,39N)(34G,45G,62N)(29G,49G)(37N, Mixon 4 1 3 0 0 24 23G,20G,22G,31G)(40G,49G,21G)(21G,29G,37G,26G) Dalton 3 3 0 0 0 18 (23G)()(20G)(26G,47G,26G) Ross 3 0 3 0 0 18 T. Boyd 2 0 2 0 0 12 Eifert 2 0 2 0 0 12 Tate 1 0 1 0 0 6 Wilson 1 0 0 1 0 6 TEAM 16 4 11 1 16/16 15/18 0 157 OPPONENTS 32 13 16 3 30/30 22/25 0 292 2-Pt Conv: TM 0-0, OPP 2-2 SACKS: Atkins 4.5, Hubbard 4, Dunlap 2.5, Lawson 2, Billings 1, Kirkpatrick 1, Vigil 1, TM 16, OPP 40 FUM/LOST: Dalton 6/3, Finley 4/3, Bernard 2/1, T. Boyd 2/2, Erickson 1/1, Hopkins 1/0, Ross 1/1, Tate 1/1, Wilson 1/0 * PASSING Att Cmp Yds Cmp% Yds/Att TD TD% Int Int% Long Sack/Lost Rating Dalton 338 204 2252 60.4 6.66 9 2.7 8 2.4 66t 29/ 190 79.2 Finley 87 41 474 47.1 5.45 2 2.3 2 2.3 47 11/ 93 62.1 TEAM 425 245 2726 57.6 6.41 11 2.6 10 2.4 66t 40/ 283 75.7 OPPONENTS 319 211 2864 66.1 8.98 16 5.0 5 1.6 79t 16/ 104 104.8
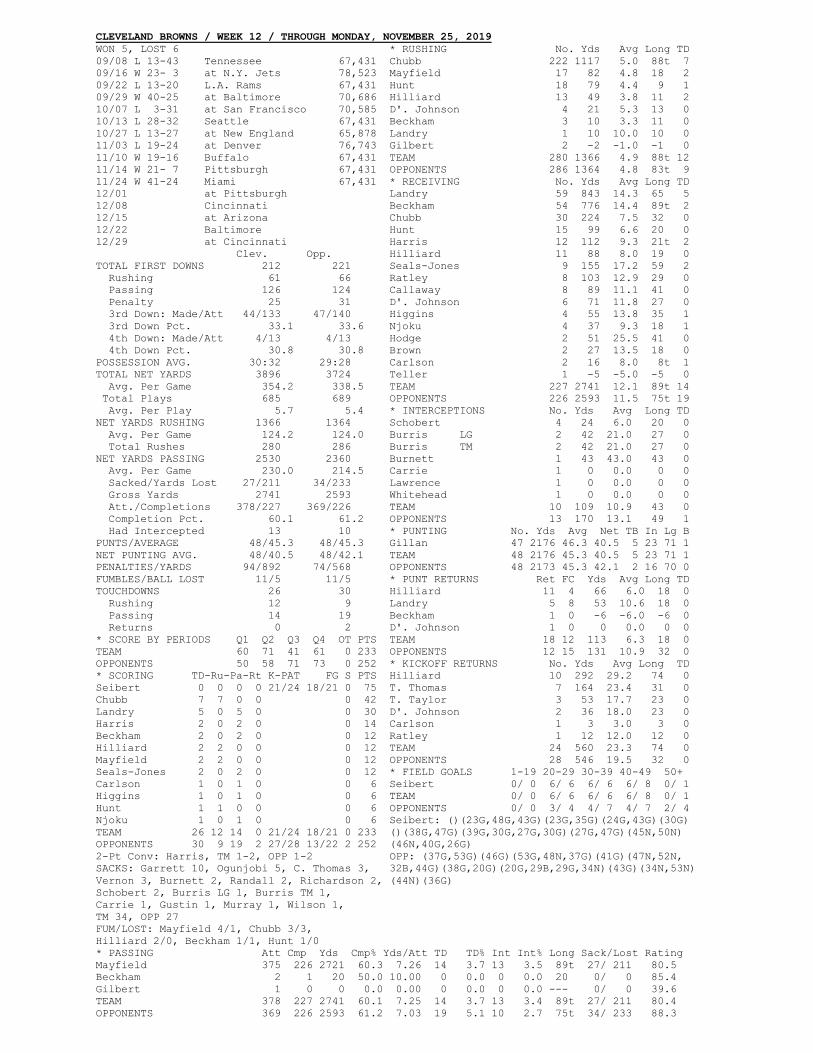
CLEVELAND BROWNS / WEEK 12 / THROUGH MONDAY, NOVEMBER 25, 2019 WON 5, LOST 6 * RUSHING No. Yds Avg Long TD 09/08 L 13-43 Tennessee 67,431 Chubb 222 1117 5.0 88t 7 09/16 W 23- 3 at N.Y. Jets 78,523 Mayfield 17 82 4.8 18 2 09/22 L 13-20 L.A. Rams 67,431 Hunt 18 79 4.4 9 1 09/29 W 40-25 at Baltimore 70,686 Hilliard 13 49 3.8 11 2 10/07 L 3-31 at San Francisco 70,585 D'. Johnson 4 21 5.3 13 0 10/13 L 28-32 Seattle 67,431 Beckham 3 10 3.3 11 0 10/27 L 13-27 at New England 65,878 Landry 1 10 10.0 10 0 11/03 L 19-24 at Denver 76,743 Gilbert 2 -2 -1.0 -1 0 11/10 W 19-16 Buffalo 67,431 TEAM 280 1366 4.9 88t 12 11/14 W 21- 7 Pittsburgh 67,431 OPPONENTS 286 1364 4.8 83t 9 11/24 W 41-24 Miami 67,431 * RECEIVING No. Yds Avg Long TD 12/01 at Pittsburgh Landry 59 843 14.3 65 5 12/08 Cincinnati Beckham 54 776 14.4 89t 2 12/15 at Arizona Chubb 30 224 7.5 32 0 12/22 Baltimore Hunt 15 99 6.6 20 0 12/29 at Cincinnati Harris 12 112 9.3 21t 2 Clev. Opp. Hilliard 11 88 8.0 19 0 TOTAL FIRST DOWNS 212 221 Seals-Jones 9 155 17.2 59 2 Rushing 61 66 Ratley 8 103 12.9 29 0 Passing 126 124 Callaway 8 89 11.1 41 0 Penalty 25 31 D'. Johnson 6 71 11.8 27 0 3rd Down: Made/Att 44/133 47/140 Higgins 4 55 13.8 35 1 3rd Down Pct. 33.1 33.6 Njoku 4 37 9.3 18 1 4th Down: Made/Att 4/13 4/13 Hodge 2 51 25.5 41 0 4th Down Pct. 30.8 30.8 Brown 2 27 13.5 18 0 POSSESSION AVG. 30:32 29:28 Carlson 2 16 8.0 8t 1 TOTAL NET YARDS 3896 3724 Teller 1 -5 -5.0 -5 0 Avg. Per Game 354.2 338.5 TEAM 227 2741 12.1 89t 14 Total Plays 685 689 OPPONENTS 226 2593 11.5 75t 19 Avg. Per Play 5.7 5.4 * INTERCEPTIONS No. Yds Avg Long TD NET YARDS RUSHING 1366 1364 Schobert 4 24 6.0 20 0 Avg. Per Game 124.2 124.0 Burris LG 2 42 21.0 27 0 Total Rushes 280 286 Burris TM 2 42 21.0 27 0 NET YARDS PASSING 2530 2360 Burnett 1 43 43.0 43 0 Avg. Per Game 230.0 214.5 Carrie 1 0 0.0 0 0 Sacked/Yards Lost 27/211 34/233 Lawrence 1 0 0.0 0 0 Gross Yards 2741 2593 Whitehead 1 0 0.0 0 0 Att./Completions 378/227 369/226 TEAM 10 109 10.9 43 0 Completion Pct. 60.1 61.2 OPPONENTS 13 170 13.1 49 1 Had Intercepted 13 10 * PUNTING No. Yds Avg Net TB In Lg B PUNTS/AVERAGE 48/45.3 48/45.3 Gillan 47 2176 46.3 40.5 5 23 71 1 NET PUNTING AVG. 48/40.5 48/42.1 TEAM 48 2176 45.3 40.5 5 23 71 1 PENALTIES/YARDS 94/892 74/568 OPPONENTS 48 2173 45.3 42.1 2 16 70 0 FUMBLES/BALL LOST 11/5 11/5 * PUNT RETURNS Ret FC Yds Avg Long TD TOUCHDOWNS 26 30 Hilliard 11 4 66 6.0 18 0 Rushing 12 9 Landry 5 8 53 10.6 18 0 Passing 14 19 Beckham 1 0 -6 -6.0 -6 0 Returns 0 2 D'. Johnson 1 0 0 0.0 0 0 * SCORE BY PERIODS Q1 Q2 Q3 Q4 OT PTS TEAM 18 12 113 6.3 18 0 TEAM 60 71 41 61 0 233 OPPONENTS 12 15 131 10.9 32 0 OPPONENTS 50 58 71 73 0 252 * KICKOFF RETURNS No. Yds Avg Long TD * SCORING TD-Ru-Pa-Rt K-PAT FG S PTS Hilliard 10 292 29.2 74 0 Seibert 0 0 0 0 21/24 18/21 0 75 T. Thomas 7 164 23.4 31 0 Chubb 7 7 0 0 0 42 T. Taylor 3 53 17.7 23 0 Landry 5 0 5 0 0 30 D'. Johnson 2 36 18.0 23 0 Harris 2 0 2 0 0 14 Carlson 1 3 3.0 3 0 Beckham 2 0 2 0 0 12 Ratley 1 12 12.0 12 0 Hilliard 2 2 0 0 0 12 TEAM 24 560 23.3 74 0 Mayfield 2 2 0 0 0 12 OPPONENTS 28 546 19.5 32 0 Seals-Jones 2 0 2 0 0 12 * FIELD GOALS 1-19 20-29 30-39 40-49 50+ Carlson 1 0 1 0 0 6 Seibert 0/ 0 6/ 6 6/ 6 6/ 8 0/ 1 Higgins 1 0 1 0 0 6 TEAM 0/ 0 6/ 6 6/ 6 6/ 8 0/ 1 Hunt 1 1 0 0 0 6 OPPONENTS 0/ 0 3/ 4 4/ 7 4/ 7 2/ 4 Njoku 1 0 1 0 0 6 Seibert: ()(23G,48G,43G)(23G,35G)(24G,43G)(30G) TEAM 26 12 14 0 21/24 18/21 0 233 ()(38G,47G)(39G,30G,27G,30G)(27G,47G)(45N,50N) OPPONENTS 30 9 19 2 27/28 13/22 2 252 (46N,40G,26G) 2-Pt Conv: Harris, TM 1-2, OPP 1-2 OPP: (37G,53G)(46G)(53G,48N,37G)(41G)(47N,52N, SACKS: Garrett 10, Ogunjobi 5, C. Thomas 3, 32B,44G)(38G,20G)(20G,29B,29G,34N)(43G)(34N,53N) Vernon 3, Burnett 2, Randall 2, Richardson 2, (44N)(36G) Schobert 2, Burris LG 1, Burris TM 1, Carrie 1, Gustin 1, Murray 1, Wilson 1, TM 34, OPP 27 FUM/LOST: Mayfield 4/1, Chubb 3/3, Hilliard 2/0, Beckham 1/1, Hunt 1/0 * PASSING Att Cmp Yds Cmp% Yds/Att TD TD% Int Int% Long Sack/Lost Rating Mayfield 375 226 2721 60.3 7.26 14 3.7 13 3.5 89t 27/ 211 80.5 Beckham 2 1 20 50.0 10.00 0 0.0 0 0.0 20 0/ 0 85.4 Gilbert 1 0 0 0.0 0.00 0 0.0 0 0.0 --- 0/ 0 39.6 TEAM 378 227 2741 60.1 7.25 14 3.7 13 3.4 89t 27/ 211 80.4 OPPONENTS 369 226 2593 61.2 7.03 19 5.1 10 2.7 75t 34/ 233 88.3
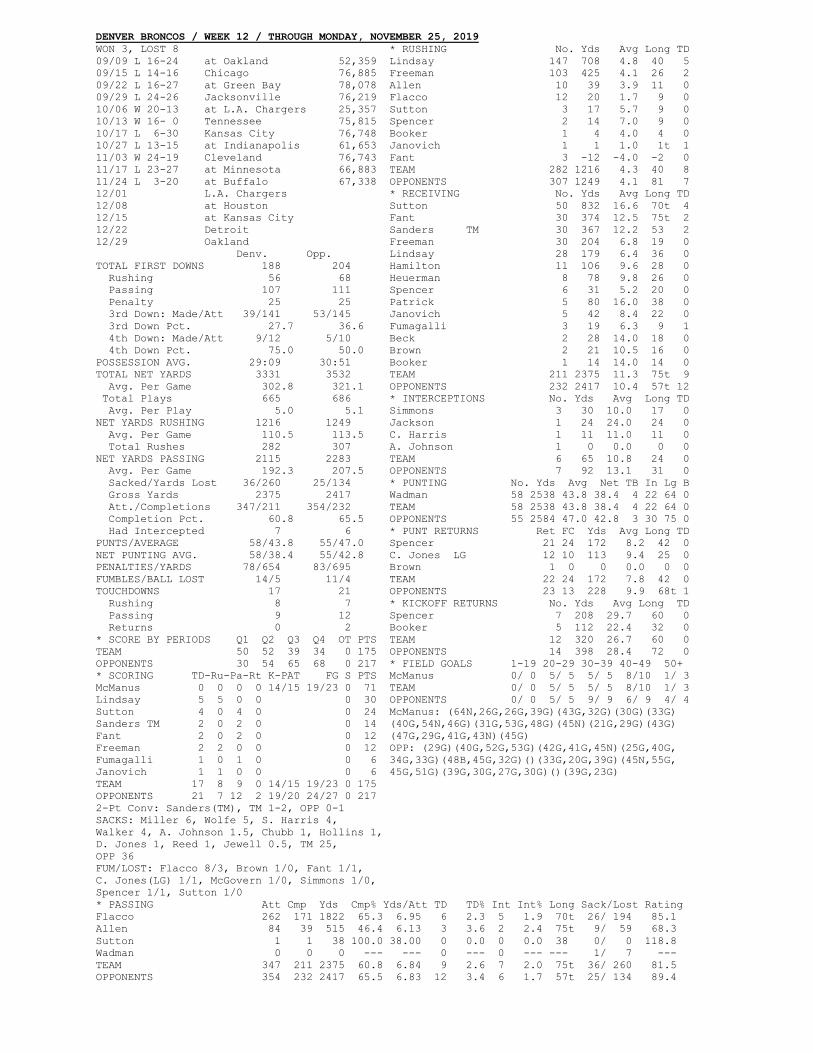
DENVER BRONCOS / WEEK 12 / THROUGH MONDAY, NOVEMBER 25, 2019 WON 3, LOST 8 * RUSHING No. Yds Avg Long TD 09/09 L 16-24 at Oakland 52,359 Lindsay 147 708 4.8 40 5 09/15 L 14-16 Chicago 76,885 Freeman 103 425 4.1 26 2 09/22 L 16-27 at Green Bay 78,078 Allen 10 39 3.9 11 0 09/29 L 24-26 Jacksonville 76,219 Flacco 12 20 1.7 9 0 10/06 W 20-13 at L.A. Chargers 25,357 Sutton 3 17 5.7 9 0 10/13 W 16- 0 Tennessee 75,815 Spencer 2 14 7.0 9 0 10/17 L 6-30 Kansas City 76,748 Booker 1 4 4.0 4 0 10/27 L 13-15 at Indianapolis 61,653 Janovich 1 1 1.0 1t 1 11/03 W 24-19 Cleveland 76,743 Fant 3 -12 -4.0 -2 0 11/17 L 23-27 at Minnesota 66,883 TEAM 282 1216 4.3 40 8 11/24 L 3-20 at Buffalo 67,338 OPPONENTS 307 1249 4.1 81 7 12/01 L.A. Chargers * RECEIVING No. Yds Avg Long TD 12/08 at Houston Sutton 50 832 16.6 70t 4 12/15 at Kansas City Fant 30 374 12.5 75t 2 12/22 Detroit Sanders TM 30 367 12.2 53 2 12/29 Oakland Freeman 30 204 6.8 19 0 Denv. Opp. Lindsay 28 179 6.4 36 0 TOTAL FIRST DOWNS 188 204 Hamilton 11 106 9.6 28 0 Rushing 56 68 Heuerman 8 78 9.8 26 0 Passing 107 111 Spencer 6 31 5.2 20 0 Penalty 25 25 Patrick 5 80 16.0 38 0 3rd Down: Made/Att 39/141 53/145 Janovich 5 42 8.4 22 0 3rd Down Pct. 27.7 36.6 Fumagalli 3 19 6.3 9 1 4th Down: Made/Att 9/12 5/10 Beck 2 28 14.0 18 0 4th Down Pct. 75.0 50.0 Brown 2 21 10.5 16 0 POSSESSION AVG. 29:09 30:51 Booker 1 14 14.0 14 0 TOTAL NET YARDS 3331 3532 TEAM 211 2375 11.3 75t 9 Avg. Per Game 302.8 321.1 OPPONENTS 232 2417 10.4 57t 12 Total Plays 665 686 * INTERCEPTIONS No. Yds Avg Long TD Avg. Per Play 5.0 5.1 Simmons 3 30 10.0 17 0 NET YARDS RUSHING 1216 1249 Jackson 1 24 24.0 24 0 Avg. Per Game 110.5 113.5 C. Harris 1 11 11.0 11 0 Total Rushes 282 307 A. Johnson 1 0 0.0 0 0 NET YARDS PASSING 2115 2283 TEAM 6 65 10.8 24 0 Avg. Per Game 192.3 207.5 OPPONENTS 7 92 13.1 31 0 Sacked/Yards Lost 36/260 25/134 * PUNTING No. Yds Avg Net TB In Lg B Gross Yards 2375 2417 Wadman 58 2538 43.8 38.4 4 22 64 0 Att./Completions 347/211 354/232 TEAM 58 2538 43.8 38.4 4 22 64 0 Completion Pct. 60.8 65.5 OPPONENTS 55 2584 47.0 42.8 3 30 75 0 Had Intercepted 7 6 * PUNT RETURNS Ret FC Yds Avg Long TD PUNTS/AVERAGE 58/43.8 55/47.0 Spencer 21 24 172 8.2 42 0 NET PUNTING AVG. 58/38.4 55/42.8 C. Jones LG 12 10 113 9.4 25 0 PENALTIES/YARDS 78/654 83/695 Brown 1 0 0 0.0 0 0 FUMBLES/BALL LOST 14/5 11/4 TEAM 22 24 172 7.8 42 0 TOUCHDOWNS 17 21 OPPONENTS 23 13 228 9.9 68t 1 Rushing 8 7 * KICKOFF RETURNS No. Yds Avg Long TD Passing 9 12 Spencer 7 208 29.7 60 0 Returns 0 2 Booker 5 112 22.4 32 0 * SCORE BY PERIODS Q1 Q2 Q3 Q4 OT PTS TEAM 12 320 26.7 60 0 TEAM 50 52 39 34 0 175 OPPONENTS 14 398 28.4 72 0 OPPONENTS 30 54 65 68 0 217 * FIELD GOALS 1-19 20-29 30-39 40-49 50+ * SCORING TD-Ru-Pa-Rt K-PAT FG S PTS McManus 0/ 0 5/ 5 5/ 5 8/10 1/ 3 McManus 0 0 0 0 14/15 19/23 0 71 TEAM 0/ 0 5/ 5 5/ 5 8/10 1/ 3 Lindsay 5 5 0 0 0 30 OPPONENTS 0/ 0 5/ 5 9/ 9 6/ 9 4/ 4 Sutton 4 0 4 0 0 24 McManus: (64N,26G,26G,39G)(43G,32G)(30G)(33G) Sanders TM 2 0 2 0 0 14 (40G,54N,46G)(31G,53G,48G)(45N)(21G,29G)(43G) Fant 2 0 2 0 0 12 (47G,29G,41G,43N)(45G) Freeman 2 2 0 0 0 12 OPP: (29G)(40G,52G,53G)(42G,41G,45N)(25G,40G, Fumagalli 1 0 1 0 0 6 34G,33G)(48B,45G,32G)()(33G,20G,39G)(45N,55G, Janovich 1 1 0 0 0 6 45G,51G)(39G,30G,27G,30G)()(39G,23G) TEAM 17 8 9 0 14/15 19/23 0 175 OPPONENTS 21 7 12 2 19/20 24/27 0 217 2-Pt Conv: Sanders(TM), TM 1-2, OPP 0-1 SACKS: Miller 6, Wolfe 5, S. Harris 4, Walker 4, A. Johnson 1.5, Chubb 1, Hollins 1, D. Jones 1, Reed 1, Jewell 0.5, TM 25, OPP 36 FUM/LOST: Flacco 8/3, Brown 1/0, Fant 1/1, C. Jones(LG) 1/1, McGovern 1/0, Simmons 1/0, Spencer 1/1, Sutton 1/0 * PASSING Att Cmp Yds Cmp% Yds/Att TD TD% Int Int% Long Sack/Lost Rating Flacco 262 171 1822 65.3 6.95 6 2.3 5 1.9 70t 26/ 194 85.1 Allen 84 39 515 46.4 6.13 3 3.6 2 2.4 75t 9/ 59 68.3 Sutton 1 1 38 100.0 38.00 0 0.0 0 0.0 38 0/ 0 118.8 Wadman 0 0 0 --- --- 0 --- 0 --- --- 1/ 7 --- TEAM 347 211 2375 60.8 6.84 9 2.6 7 2.0 75t 36/ 260 81.5 OPPONENTS 354 232 2417 65.5 6.83 12 3.4 6 1.7 57t 25/ 134 89.4
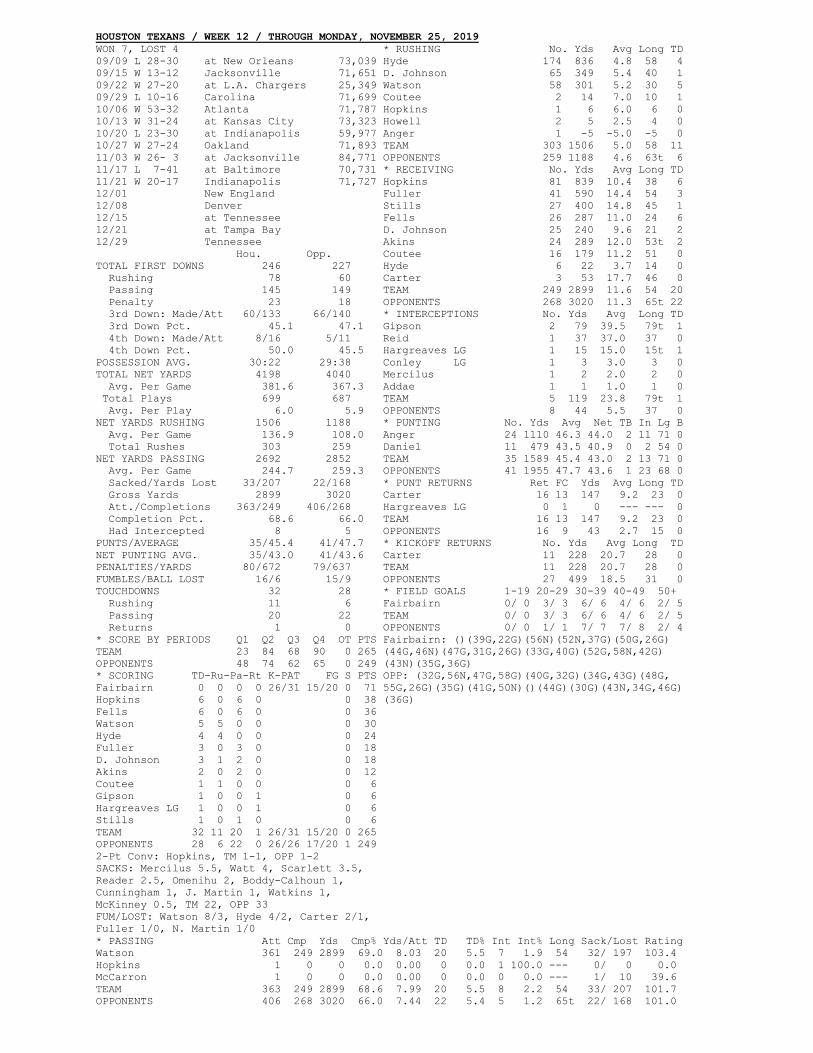
HOUSTON TEXANS / WEEK 12 / THROUGH MONDAY, NOVEMBER 25, 2019 WON 7, LOST 4 * RUSHING No. Yds Avg Long TD 09/09 L 28-30 at New Orleans 73,039 Hyde 174 836 4.8 58 4 09/15 W 13-12 Jacksonville 71,651 D. Johnson 65 349 5.4 40 1 09/22 W 27-20 at L.A. Chargers 25,349 Watson 58 301 5.2 30 5 09/29 L 10-16 Carolina 71,699 Coutee 2 14 7.0 10 1 10/06 W 53-32 Atlanta 71,787 Hopkins 1 6 6.0 6 0 10/13 W 31-24 at Kansas City 73,323 Howell 2 5 2.5 4 0 10/20 L 23-30 at Indianapolis 59,977 Anger 1 -5 -5.0 -5 0 10/27 W 27-24 Oakland 71,893 TEAM 303 1506 5.0 58 11 11/03 W 26- 3 at Jacksonville 84,771 OPPONENTS 259 1188 4.6 63t 6 11/17 L 7-41 at Baltimore 70,731 * RECEIVING No. Yds Avg Long TD 11/21 W 20-17 Indianapolis 71,727 Hopkins 81 839 10.4 38 6 12/01 New England Fuller 41 590 14.4 54 3 12/08 Denver Stills 27 400 14.8 45 1 12/15 at Tennessee Fells 26 287 11.0 24 6 12/21 at Tampa Bay D. Johnson 25 240 9.6 21 2 12/29 Tennessee Akins 24 289 12.0 53t 2 Hou. Opp. Coutee 16 179 11.2 51 0 TOTAL FIRST DOWNS 246 227 Hyde 6 22 3.7 14 0 Rushing 78 60 Carter 3 53 17.7 46 0 Passing 145 149 TEAM 249 2899 11.6 54 20 Penalty 23 18 OPPONENTS 268 3020 11.3 65t 22 3rd Down: Made/Att 60/133 66/140 * INTERCEPTIONS No. Yds Avg Long TD 3rd Down Pct. 45.1 47.1 Gipson 2 79 39.5 79t 1 4th Down: Made/Att 8/16 5/11 Reid 1 37 37.0 37 0 4th Down Pct. 50.0 45.5 Hargreaves LG 1 15 15.0 15t 1 POSSESSION AVG. 30:22 29:38 Conley LG 1 3 3.0 3 0 TOTAL NET YARDS 4198 4040 Mercilus 1 2 2.0 2 0 Avg. Per Game 381.6 367.3 Addae 1 1 1.0 1 0 Total Plays 699 687 TEAM 5 119 23.8 79t 1 Avg. Per Play 6.0 5.9 OPPONENTS 8 44 5.5 37 0 NET YARDS RUSHING 1506 1188 * PUNTING No. Yds Avg Net TB In Lg B Avg. Per Game 136.9 108.0 Anger 24 1110 46.3 44.0 2 11 71 0 Total Rushes 303 259 Daniel 11 479 43.5 40.9 0 2 54 0 NET YARDS PASSING 2692 2852 TEAM 35 1589 45.4 43.0 2 13 71 0 Avg. Per Game 244.7 259.3 OPPONENTS 41 1955 47.7 43.6 1 23 68 0 Sacked/Yards Lost 33/207 22/168 * PUNT RETURNS Ret FC Yds Avg Long TD Gross Yards 2899 3020 Carter 16 13 147 9.2 23 0 Att./Completions 363/249 406/268 Hargreaves LG 0 1 0 --- --- 0 Completion Pct. 68.6 66.0 TEAM 16 13 147 9.2 23 0 Had Intercepted 8 5 OPPONENTS 16 9 43 2.7 15 0 PUNTS/AVERAGE 35/45.4 41/47.7 * KICKOFF RETURNS No. Yds Avg Long TD NET PUNTING AVG. 35/43.0 41/43.6 Carter 11 228 20.7 28 0 PENALTIES/YARDS 80/672 79/637 TEAM 11 228 20.7 28 0 FUMBLES/BALL LOST 16/6 15/9 OPPONENTS 27 499 18.5 31 0 TOUCHDOWNS 32 28 * FIELD GOALS 1-19 20-29 30-39 40-49 50+ Rushing 11 6 Fairbairn 0/ 0 3/ 3 6/ 6 4/ 6 2/ 5 Passing 20 22 TEAM 0/ 0 3/ 3 6/ 6 4/ 6 2/ 5 Returns 1 0 OPPONENTS 0/ 0 1/ 1 7/ 7 7/ 8 2/ 4 * SCORE BY PERIODS Q1 Q2 Q3 Q4 OT PTS Fairbairn: ()(39G,22G)(56N)(52N,37G)(50G,26G) TEAM 23 84 68 90 0 265 (44G,46N)(47G,31G,26G)(33G,40G)(52G,58N,42G) OPPONENTS 48 74 62 65 0 249 (43N)(35G,36G) * SCORING TD-Ru-Pa-Rt K-PAT FG S PTS OPP: (32G,56N,47G,58G)(40G,32G)(34G,43G)(48G, Fairbairn 0 0 0 0 26/31 15/20 0 71 55G,26G)(35G)(41G,50N)()(44G)(30G)(43N,34G,46G) Hopkins 6 0 6 0 0 38 (36G) Fells 6 0 6 0 0 36 Watson 5 5 0 0 0 30 Hyde 4 4 0 0 0 24 Fuller 3 0 3 0 0 18 D. Johnson 3 1 2 0 0 18 Akins 2 0 2 0 0 12 Coutee 1 1 0 0 0 6 Gipson 1 0 0 1 0 6 Hargreaves LG 1 0 0 1 0 6 Stills 1 0 1 0 0 6 TEAM 32 11 20 1 26/31 15/20 0 265 OPPONENTS 28 6 22 0 26/26 17/20 1 249 2-Pt Conv: Hopkins, TM 1-1, OPP 1-2 SACKS: Mercilus 5.5, Watt 4, Scarlett 3.5, Reader 2.5, Omenihu 2, Boddy-Calhoun 1, Cunningham 1, J. Martin 1, Watkins 1, McKinney 0.5, TM 22, OPP 33 FUM/LOST: Watson 8/3, Hyde 4/2, Carter 2/1, Fuller 1/0, N. Martin 1/0 * PASSING Att Cmp Yds Cmp% Yds/Att TD TD% Int Int% Long Sack/Lost Rating Watson 361 249 2899 69.0 8.03 20 5.5 7 1.9 54 32/ 197 103.4 Hopkins 1 0 0 0.0 0.00 0 0.0 1 100.0 --- 0/ 0 0.0 McCarron 1 0 0 0.0 0.00 0 0.0 0 0.0 --- 1/ 10 39.6 TEAM 363 249 2899 68.6 7.99 20 5.5 8 2.2 54 33/ 207 101.7 OPPONENTS 406 268 3020 66.0 7.44 22 5.4 5 1.2 65t 22/ 168 101.0
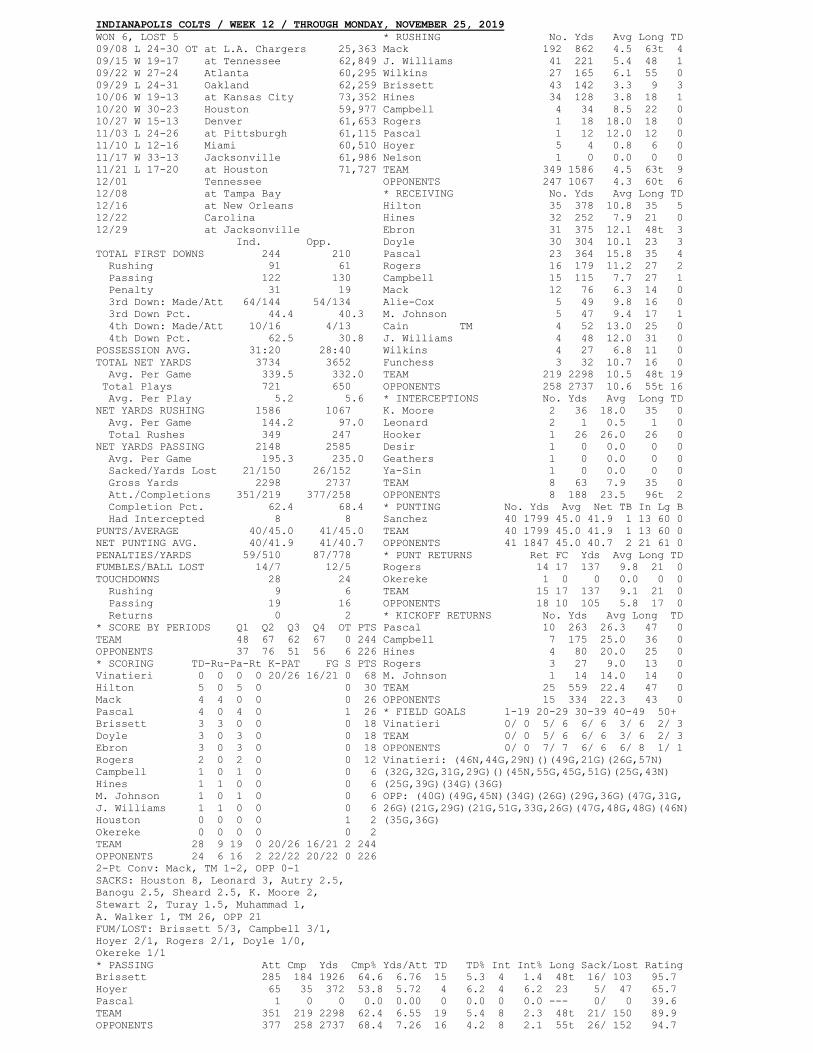
INDIANAPOLIS COLTS / WEEK 12 / THROUGH MONDAY, NOVEMBER 25, 2019 WON 6, LOST 5 * RUSHING No. Yds Avg Long TD 09/08 L 24-30 OT at L.A. Chargers 25,363 Mack 192 862 4.5 63t 4 09/15 W 19-17 at Tennessee 62,849 J. Williams 41 221 5.4 48 1 09/22 W 27-24 Atlanta 60,295 Wilkins 27 165 6.1 55 0 09/29 L 24-31 Oakland 62,259 Brissett 43 142 3.3 9 3 10/06 W 19-13 at Kansas City 73,352 Hines 34 128 3.8 18 1 10/20 W 30-23 Houston 59,977 Campbell 4 34 8.5 22 0 10/27 W 15-13 Denver 61,653 Rogers 1 18 18.0 18 0 11/03 L 24-26 at Pittsburgh 61,115 Pascal 1 12 12.0 12 0 11/10 L 12-16 Miami 60,510 Hoyer 5 4 0.8 6 0 11/17 W 33-13 Jacksonville 61,986 Nelson 1 0 0.0 0 0 11/21 L 17-20 at Houston 71,727 TEAM 349 1586 4.5 63t 9 12/01 Tennessee OPPONENTS 247 1067 4.3 60t 6 12/08 at Tampa Bay * RECEIVING No. Yds Avg Long TD 12/16 at New Orleans Hilton 35 378 10.8 35 5 12/22 Carolina Hines 32 252 7.9 21 0 12/29 at Jacksonville Ebron 31 375 12.1 48t 3 Ind. Opp. Doyle 30 304 10.1 23 3 TOTAL FIRST DOWNS 244 210 Pascal 23 364 15.8 35 4 Rushing 91 61 Rogers 16 179 11.2 27 2 Passing 122 130 Campbell 15 115 7.7 27 1 Penalty 31 19 Mack 12 76 6.3 14 0 3rd Down: Made/Att 64/144 54/134 Alie-Cox 5 49 9.8 16 0 3rd Down Pct. 44.4 40.3 M. Johnson 5 47 9.4 17 1 4th Down: Made/Att 10/16 4/13 Cain TM 4 52 13.0 25 0 4th Down Pct. 62.5 30.8 J. Williams 4 48 12.0 31 0 POSSESSION AVG. 31:20 28:40 Wilkins 4 27 6.8 11 0 TOTAL NET YARDS 3734 3652 Funchess 3 32 10.7 16 0 Avg. Per Game 339.5 332.0 TEAM 219 2298 10.5 48t 19 Total Plays 721 650 OPPONENTS 258 2737 10.6 55t 16 Avg. Per Play 5.2 5.6 * INTERCEPTIONS No. Yds Avg Long TD NET YARDS RUSHING 1586 1067 K. Moore 2 36 18.0 35 0 Avg. Per Game 144.2 97.0 Leonard 2 1 0.5 1 0 Total Rushes 349 247 Hooker 1 26 26.0 26 0 NET YARDS PASSING 2148 2585 Desir 1 0 0.0 0 0 Avg. Per Game 195.3 235.0 Geathers 1 0 0.0 0 0 Sacked/Yards Lost 21/150 26/152 Ya-Sin 1 0 0.0 0 0 Gross Yards 2298 2737 TEAM 8 63 7.9 35 0 Att./Completions 351/219 377/258 OPPONENTS 8 188 23.5 96t 2 Completion Pct. 62.4 68.4 * PUNTING No. Yds Avg Net TB In Lg B Had Intercepted 8 8 Sanchez 40 1799 45.0 41.9 1 13 60 0 PUNTS/AVERAGE 40/45.0 41/45.0 TEAM 40 1799 45.0 41.9 1 13 60 0 NET PUNTING AVG. 40/41.9 41/40.7 OPPONENTS 41 1847 45.0 40.7 2 21 61 0 PENALTIES/YARDS 59/510 87/778 * PUNT RETURNS Ret FC Yds Avg Long TD FUMBLES/BALL LOST 14/7 12/5 Rogers 14 17 137 9.8 21 0 TOUCHDOWNS 28 24 Okereke 1 0 0 0.0 0 0 Rushing 9 6 TEAM 15 17 137 9.1 21 0 Passing 19 16 OPPONENTS 18 10 105 5.8 17 0 Returns 0 2 * KICKOFF RETURNS No. Yds Avg Long TD * SCORE BY PERIODS Q1 Q2 Q3 Q4 OT PTS Pascal 10 263 26.3 47 0 TEAM 48 67 62 67 0 244 Campbell 7 175 25.0 36 0 OPPONENTS 37 76 51 56 6 226 Hines 4 80 20.0 25 0 * SCORING TD-Ru-Pa-Rt K-PAT FG S PTS Rogers 3 27 9.0 13 0 Vinatieri 0 0 0 0 20/26 16/21 0 68 M. Johnson 1 14 14.0 14 0 Hilton 5 0 5 0 0 30 TEAM 25 559 22.4 47 0 Mack 4 4 0 0 0 26 OPPONENTS 15 334 22.3 43 0 Pascal 4 0 4 0 1 26 * FIELD GOALS 1-19 20-29 30-39 40-49 50+ Brissett 3 3 0 0 0 18 Vinatieri 0/ 0 5/ 6 6/ 6 3/ 6 2/ 3 Doyle 3 0 3 0 0 18 TEAM 0/ 0 5/ 6 6/ 6 3/ 6 2/ 3 Ebron 3 0 3 0 0 18 OPPONENTS 0/ 0 7/ 7 6/ 6 6/ 8 1/ 1 Rogers 2 0 2 0 0 12 Vinatieri: (46N,44G,29N)()(49G,21G)(26G,57N) Campbell 1 0 1 0 0 6 (32G,32G,31G,29G)()(45N,55G,45G,51G)(25G,43N) Hines 1 1 0 0 0 6 (25G,39G)(34G)(36G) M. Johnson 1 0 1 0 0 6 OPP: (40G)(49G,45N)(34G)(26G)(29G,36G)(47G,31G, J. Williams 1 1 0 0 0 6 26G)(21G,29G)(21G,51G,33G,26G)(47G,48G,48G)(46N) Houston 0 0 0 0 1 2 (35G,36G) Okereke 0 0 0 0 0 2 TEAM 28 9 19 0 20/26 16/21 2 244 OPPONENTS 24 6 16 2 22/22 20/22 0 226 2-Pt Conv: Mack, TM 1-2, OPP 0-1 SACKS: Houston 8, Leonard 3, Autry 2.5, Banogu 2.5, Sheard 2.5, K. Moore 2, Stewart 2, Turay 1.5, Muhammad 1, A. Walker 1, TM 26, OPP 21 FUM/LOST: Brissett 5/3, Campbell 3/1, Hoyer 2/1, Rogers 2/1, Doyle 1/0, Okereke 1/1 * PASSING Att Cmp Yds Cmp% Yds/Att TD TD% Int Int% Long Sack/Lost Rating Brissett 285 184 1926 64.6 6.76 15 5.3 4 1.4 48t 16/ 103 95.7 Hoyer 65 35 372 53.8 5.72 4 6.2 4 6.2 23 5/ 47 65.7 Pascal 1 0 0 0.0 0.00 0 0.0 0 0.0 --- 0/ 0 39.6 TEAM 351 219 2298 62.4 6.55 19 5.4 8 2.3 48t 21/ 150 89.9 OPPONENTS 377 258 2737 68.4 7.26 16 4.2 8 2.1 55t 26/ 152 94.7
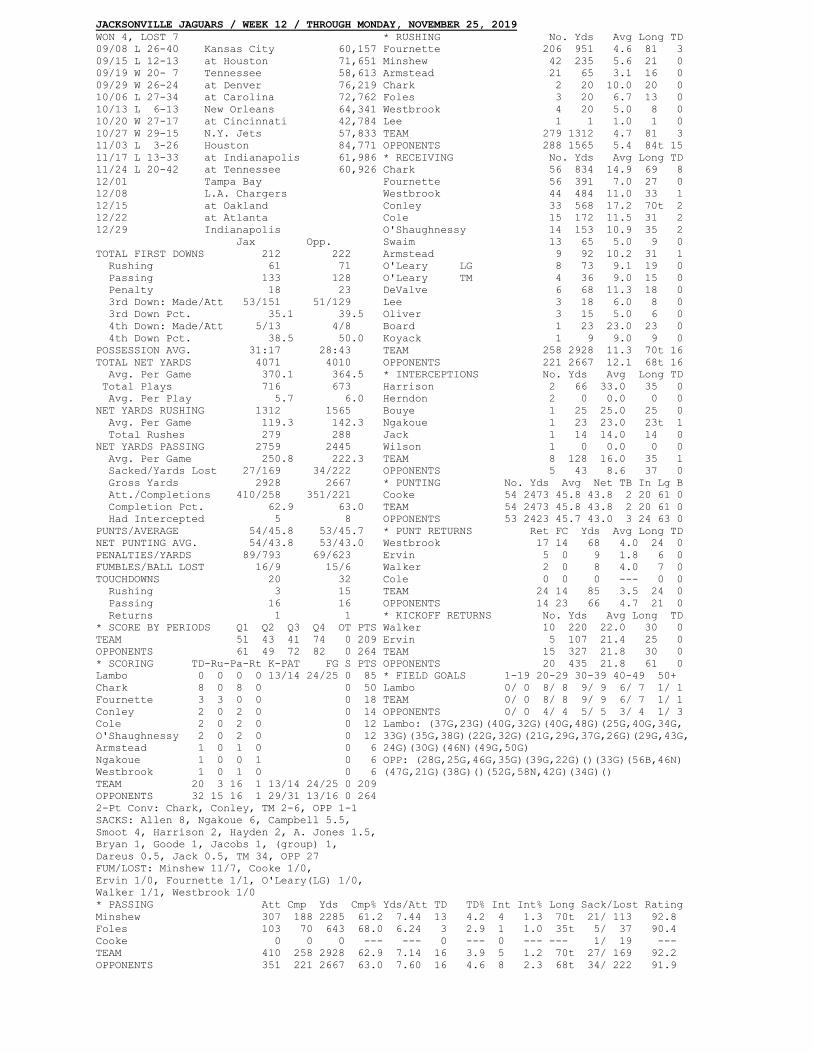
JACKSONVILLE JAGUARS / WEEK 12 / THROUGH MONDAY, NOVEMBER 25, 2019 WON 4, LOST 7 * RUSHING No. Yds Avg Long TD 09/08 L 26-40 Kansas City 60,157 Fournette 206 951 4.6 81 3 09/15 L 12-13 at Houston 71,651 Minshew 42 235 5.6 21 0 09/19 W 20- 7 Tennessee 58,613 Armstead 21 65 3.1 16 0 09/29 W 26-24 at Denver 76,219 Chark 2 20 10.0 20 0 10/06 L 27-34 at Carolina 72,762 Foles 3 20 6.7 13 0 10/13 L 6-13 New Orleans 64,341 Westbrook 4 20 5.0 8 0 10/20 W 27-17 at Cincinnati 42,784 Lee 1 1 1.0 1 0 10/27 W 29-15 N.Y. Jets 57,833 TEAM 279 1312 4.7 81 3 11/03 L 3-26 Houston 84,771 OPPONENTS 288 1565 5.4 84t 15 11/17 L 13-33 at Indianapolis 61,986 * RECEIVING No. Yds Avg Long TD 11/24 L 20-42 at Tennessee 60,926 Chark 56 834 14.9 69 8 12/01 Tampa Bay Fournette 56 391 7.0 27 0 12/08 L.A. Chargers Westbrook 44 484 11.0 33 1 12/15 at Oakland Conley 33 568 17.2 70t 2 12/22 at Atlanta Cole 15 172 11.5 31 2 12/29 Indianapolis O'Shaughnessy 14 153 10.9 35 2 Jax Opp. Swaim 13 65 5.0 9 0 TOTAL FIRST DOWNS 212 222 Armstead 9 92 10.2 31 1 Rushing 61 71 O'Leary LG 8 73 9.1 19 0 Passing 133 128 O'Leary TM 4 36 9.0 15 0 Penalty 18 23 DeValve 6 68 11.3 18 0 3rd Down: Made/Att 53/151 51/129 Lee 3 18 6.0 8 0 3rd Down Pct. 35.1 39.5 Oliver 3 15 5.0 6 0 4th Down: Made/Att 5/13 4/8 Board 1 23 23.0 23 0 4th Down Pct. 38.5 50.0 Koyack 1 9 9.0 9 0 POSSESSION AVG. 31:17 28:43 TEAM 258 2928 11.3 70t 16 TOTAL NET YARDS 4071 4010 OPPONENTS 221 2667 12.1 68t 16 Avg. Per Game 370.1 364.5 * INTERCEPTIONS No. Yds Avg Long TD Total Plays 716 673 Harrison 2 66 33.0 35 0 Avg. Per Play 5.7 6.0 Herndon 2 0 0.0 0 0 NET YARDS RUSHING 1312 1565 Bouye 1 25 25.0 25 0 Avg. Per Game 119.3 142.3 Ngakoue 1 23 23.0 23t 1 Total Rushes 279 288 Jack 1 14 14.0 14 0 NET YARDS PASSING 2759 2445 Wilson 1 0 0.0 0 0 Avg. Per Game 250.8 222.3 TEAM 8 128 16.0 35 1 Sacked/Yards Lost 27/169 34/222 OPPONENTS 5 43 8.6 37 0 Gross Yards 2928 2667 * PUNTING No. Yds Avg Net TB In Lg B Att./Completions 410/258 351/221 Cooke 54 2473 45.8 43.8 2 20 61 0 Completion Pct. 62.9 63.0 TEAM 54 2473 45.8 43.8 2 20 61 0 Had Intercepted 5 8 OPPONENTS 53 2423 45.7 43.0 3 24 63 0 PUNTS/AVERAGE 54/45.8 53/45.7 * PUNT RETURNS Ret FC Yds Avg Long TD NET PUNTING AVG. 54/43.8 53/43.0 Westbrook 17 14 68 4.0 24 0 PENALTIES/YARDS 89/793 69/623 Ervin 5 0 9 1.8 6 0 FUMBLES/BALL LOST 16/9 15/6 Walker 2 0 8 4.0 7 0 TOUCHDOWNS 20 32 Cole 0 0 0 --- 0 0 Rushing 3 15 TEAM 24 14 85 3.5 24 0 Passing 16 16 OPPONENTS 14 23 66 4.7 21 0 Returns 1 1 * KICKOFF RETURNS No. Yds Avg Long TD * SCORE BY PERIODS Q1 Q2 Q3 Q4 OT PTS Walker 10 220 22.0 30 0 TEAM 51 43 41 74 0 209 Ervin 5 107 21.4 25 0 OPPONENTS 61 49 72 82 0 264 TEAM 15 327 21.8 30 0 * SCORING TD-Ru-Pa-Rt K-PAT FG S PTS OPPONENTS 20 435 21.8 61 0 Lambo 0 0 0 0 13/14 24/25 0 85 * FIELD GOALS 1-19 20-29 30-39 40-49 50+ Chark 8 0 8 0 0 50 Lambo 0/ 0 8/ 8 9/ 9 6/ 7 1/ 1 Fournette 3 3 0 0 0 18 TEAM 0/ 0 8/ 8 9/ 9 6/ 7 1/ 1 Conley 2 0 2 0 0 14 OPPONENTS 0/ 0 4/ 4 5/ 5 3/ 4 1/ 3 Cole 2 0 2 0 0 12 Lambo: (37G,23G)(40G,32G)(40G,48G)(25G,40G,34G, O'Shaughnessy 2 0 2 0 0 12 33G)(35G,38G)(22G,32G)(21G,29G,37G,26G)(29G,43G, Armstead 1 0 1 0 0 6 24G)(30G)(46N)(49G,50G) Ngakoue 1 0 0 1 0 6 OPP: (28G,25G,46G,35G)(39G,22G)()(33G)(56B,46N) Westbrook 1 0 1 0 0 6 (47G,21G)(38G)()(52G,58N,42G)(34G)() TEAM 20 3 16 1 13/14 24/25 0 209 OPPONENTS 32 15 16 1 29/31 13/16 0 264 2-Pt Conv: Chark, Conley, TM 2-6, OPP 1-1 SACKS: Allen 8, Ngakoue 6, Campbell 5.5, Smoot 4, Harrison 2, Hayden 2, A. Jones 1.5, Bryan 1, Goode 1, Jacobs 1, (group) 1, Dareus 0.5, Jack 0.5, TM 34, OPP 27 FUM/LOST: Minshew 11/7, Cooke 1/0, Ervin 1/0, Fournette 1/1, O'Leary(LG) 1/0, Walker 1/1, Westbrook 1/0 * PASSING Att Cmp Yds Cmp% Yds/Att TD TD% Int Int% Long Sack/Lost Rating Minshew 307 188 2285 61.2 7.44 13 4.2 4 1.3 70t 21/ 113 92.8 Foles 103 70 643 68.0 6.24 3 2.9 1 1.0 35t 5/ 37 90.4 Cooke 0 0 0 --- --- 0 --- 0 --- --- 1/ 19 --- TEAM 410 258 2928 62.9 7.14 16 3.9 5 1.2 70t 27/ 169 92.2 OPPONENTS 351 221 2667 63.0 7.60 16 4.6 8 2.3 68t 34/ 222 91.9
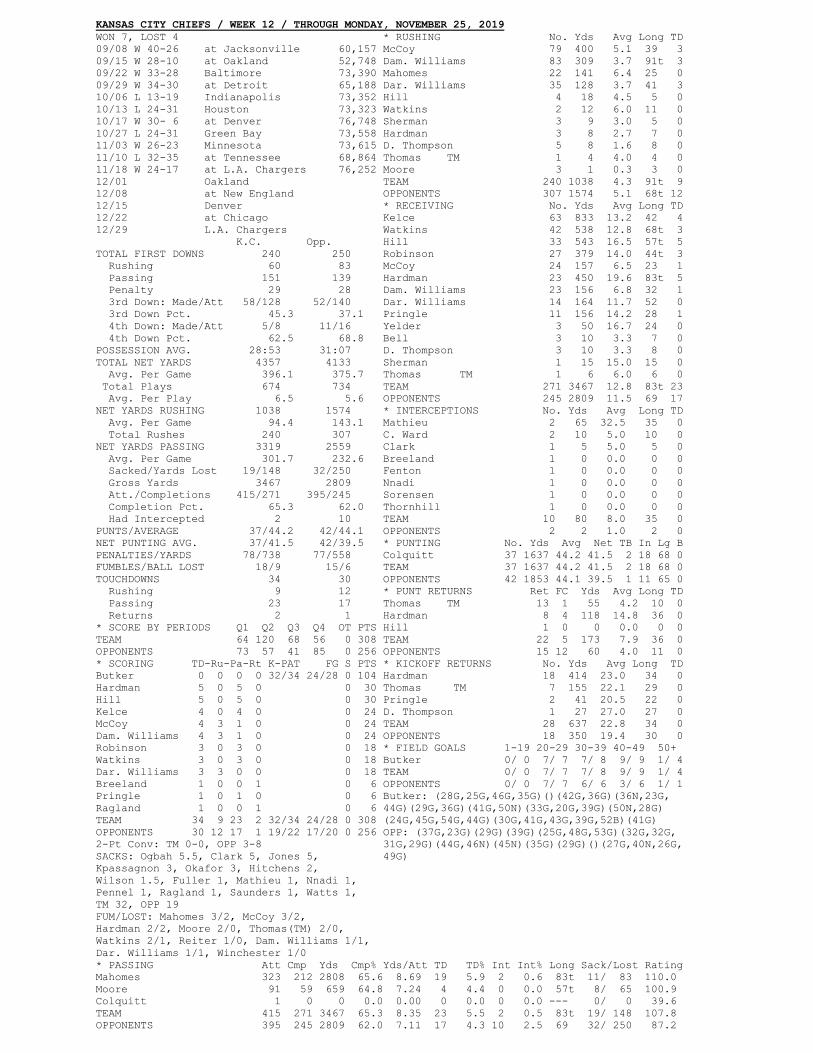
KANSAS CITY CHIEFS / WEEK 12 / THROUGH MONDAY, NOVEMBER 25, 2019 WON 7, LOST 4 * RUSHING No. Yds Avg Long TD 09/08 W 40-26 at Jacksonville 60,157 McCoy 79 400 5.1 39 3 09/15 W 28-10 at Oakland 52,748 Dam. Williams 83 309 3.7 91t 3 09/22 W 33-28 Baltimore 73,390 Mahomes 22 141 6.4 25 0 09/29 W 34-30 at Detroit 65,188 Dar. Williams 35 128 3.7 41 3 10/06 L 13-19 Indianapolis 73,352 Hill 4 18 4.5 5 0 10/13 L 24-31 Houston 73,323 Watkins 2 12 6.0 11 0 10/17 W 30- 6 at Denver 76,748 Sherman 3 9 3.0 5 0 10/27 L 24-31 Green Bay 73,558 Hardman 3 8 2.7 7 0 11/03 W 26-23 Minnesota 73,615 D. Thompson 5 8 1.6 8 0 11/10 L 32-35 at Tennessee 68,864 Thomas TM 1 4 4.0 4 0 11/18 W 24-17 at L.A. Chargers 76,252 Moore 3 1 0.3 3 0 12/01 Oakland TEAM 240 1038 4.3 91t 9 12/08 at New England OPPONENTS 307 1574 5.1 68t 12 12/15 Denver * RECEIVING No. Yds Avg Long TD 12/22 at Chicago Kelce 63 833 13.2 42 4 12/29 L.A. Chargers Watkins 42 538 12.8 68t 3 K.C. Opp. Hill 33 543 16.5 57t 5 TOTAL FIRST DOWNS 240 250 Robinson 27 379 14.0 44t 3 Rushing 60 83 McCoy 24 157 6.5 23 1 Passing 151 139 Hardman 23 450 19.6 83t 5 Penalty 29 28 Dam. Williams 23 156 6.8 32 1 3rd Down: Made/Att 58/128 52/140 Dar. Williams 14 164 11.7 52 0 3rd Down Pct. 45.3 37.1 Pringle 11 156 14.2 28 1 4th Down: Made/Att 5/8 11/16 Yelder 3 50 16.7 24 0 4th Down Pct. 62.5 68.8 Bell 3 10 3.3 7 0 POSSESSION AVG. 28:53 31:07 D. Thompson 3 10 3.3 8 0 TOTAL NET YARDS 4357 4133 Sherman 1 15 15.0 15 0 Avg. Per Game 396.1 375.7 Thomas TM 1 6 6.0 6 0 Total Plays 674 734 TEAM 271 3467 12.8 83t 23 Avg. Per Play 6.5 5.6 OPPONENTS 245 2809 11.5 69 17 NET YARDS RUSHING 1038 1574 * INTERCEPTIONS No. Yds Avg Long TD Avg. Per Game 94.4 143.1 Mathieu 2 65 32.5 35 0 Total Rushes 240 307 C. Ward 2 10 5.0 10 0 NET YARDS PASSING 3319 2559 Clark 1 5 5.0 5 0 Avg. Per Game 301.7 232.6 Breeland 1 0 0.0 0 0 Sacked/Yards Lost 19/148 32/250 Fenton 1 0 0.0 0 0 Gross Yards 3467 2809 Nnadi 1 0 0.0 0 0 Att./Completions 415/271 395/245 Sorensen 1 0 0.0 0 0 Completion Pct. 65.3 62.0 Thornhill 1 0 0.0 0 0 Had Intercepted 2 10 TEAM 10 80 8.0 35 0 PUNTS/AVERAGE 37/44.2 42/44.1 OPPONENTS 2 2 1.0 2 0 NET PUNTING AVG. 37/41.5 42/39.5 * PUNTING No. Yds Avg Net TB In Lg B PENALTIES/YARDS 78/738 77/558 Colquitt 37 1637 44.2 41.5 2 18 68 0 FUMBLES/BALL LOST 18/9 15/6 TEAM 37 1637 44.2 41.5 2 18 68 0 TOUCHDOWNS 34 30 OPPONENTS 42 1853 44.1 39.5 1 11 65 0 Rushing 9 12 * PUNT RETURNS Ret FC Yds Avg Long TD Passing 23 17 Thomas TM 13 1 55 4.2 10 0 Returns 2 1 Hardman 8 4 118 14.8 36 0 * SCORE BY PERIODS Q1 Q2 Q3 Q4 OT PTS Hill 1 0 0 0.0 0 0 TEAM 64 120 68 56 0 308 TEAM 22 5 173 7.9 36 0 OPPONENTS 73 57 41 85 0 256 OPPONENTS 15 12 60 4.0 11 0 * SCORING TD-Ru-Pa-Rt K-PAT FG S PTS * KICKOFF RETURNS No. Yds Avg Long TD Butker 0 0 0 0 32/34 24/28 0 104 Hardman 18 414 23.0 34 0 Hardman 5 0 5 0 0 30 Thomas TM 7 155 22.1 29 0 Hill 5 0 5 0 0 30 Pringle 2 41 20.5 22 0 Kelce 4 0 4 0 0 24 D. Thompson 1 27 27.0 27 0 McCoy 4 3 1 0 0 24 TEAM 28 637 22.8 34 0 Dam. Williams 4 3 1 0 0 24 OPPONENTS 18 350 19.4 30 0 Robinson 3 0 3 0 0 18 * FIELD GOALS 1-19 20-29 30-39 40-49 50+ Watkins 3 0 3 0 0 18 Butker 0/ 0 7/ 7 7/ 8 9/ 9 1/ 4 Dar. Williams 3 3 0 0 0 18 TEAM 0/ 0 7/ 7 7/ 8 9/ 9 1/ 4 Breeland 1 0 0 1 0 6 OPPONENTS 0/ 0 7/ 7 6/ 6 3/ 6 1/ 1 Pringle 1 0 1 0 0 6 Butker: (28G,25G,46G,35G)()(42G,36G)(36N,23G, Ragland 1 0 0 1 0 6 44G)(29G,36G)(41G,50N)(33G,20G,39G)(50N,28G) TEAM 34 9 23 2 32/34 24/28 0 308 (24G,45G,54G,44G)(30G,41G,43G,39G,52B)(41G) OPPONENTS 30 12 17 1 19/22 17/20 0 256 OPP: (37G,23G)(29G)(39G)(25G,48G,53G)(32G,32G, 2-Pt Conv: TM 0-0, OPP 3-8 31G,29G)(44G,46N)(45N)(35G)(29G)()(27G,40N,26G, SACKS: Ogbah 5.5, Clark 5, Jones 5, 49G) Kpassagnon 3, Okafor 3, Hitchens 2, Wilson 1.5, Fuller 1, Mathieu 1, Nnadi 1, Pennel 1, Ragland 1, Saunders 1, Watts 1, TM 32, OPP 19 FUM/LOST: Mahomes 3/2, McCoy 3/2, Hardman 2/2, Moore 2/0, Thomas(TM) 2/0, Watkins 2/1, Reiter 1/0, Dam. Williams 1/1, Dar. Williams 1/1, Winchester 1/0 * PASSING Att Cmp Yds Cmp% Yds/Att TD TD% Int Int% Long Sack/Lost Rating Mahomes 323 212 2808 65.6 8.69 19 5.9 2 0.6 83t 11/ 83 110.0 Moore 91 59 659 64.8 7.24 4 4.4 0 0.0 57t 8/ 65 100.9 Colquitt 1 0 0 0.0 0.00 0 0.0 0 0.0 --- 0/ 0 39.6 TEAM 415 271 3467 65.3 8.35 23 5.5 2 0.5 83t 19/ 148 107.8 OPPONENTS 395 245 2809 62.0 7.11 17 4.3 10 2.5 69 32/ 250 87.2
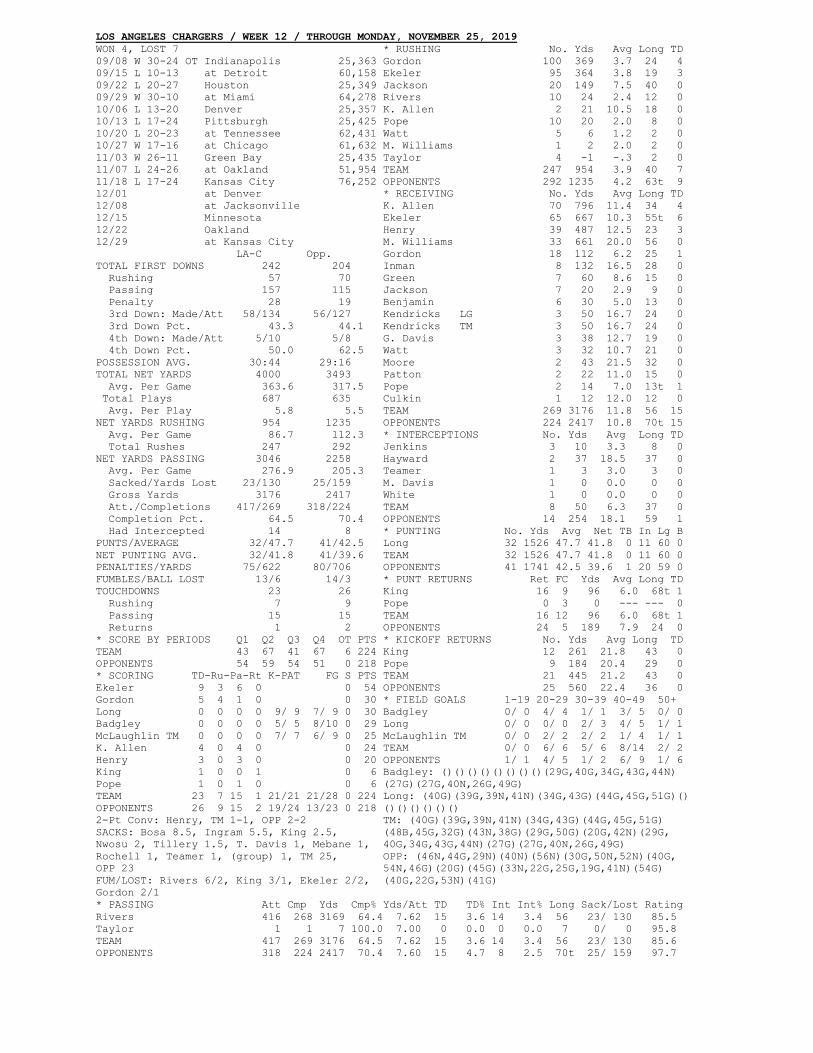
LOS ANGELES CHARGERS / WEEK 12 / THROUGH MONDAY, NOVEMBER 25, 2019 WON 4, LOST 7 * RUSHING No. Yds Avg Long TD 09/08 W 30-24 OT Indianapolis 25,363 Gordon 100 369 3.7 24 4 09/15 L 10-13 at Detroit 60,158 Ekeler 95 364 3.8 19 3 09/22 L 20-27 Houston 25,349 Jackson 20 149 7.5 40 0 09/29 W 30-10 at Miami 64,278 Rivers 10 24 2.4 12 0 10/06 L 13-20 Denver 25,357 K. Allen 2 21 10.5 18 0 10/13 L 17-24 Pittsburgh 25,425 Pope 10 20 2.0 8 0 10/20 L 20-23 at Tennessee 62,431 Watt 5 6 1.2 2 0 10/27 W 17-16 at Chicago 61,632 M. Williams 1 2 2.0 2 0 11/03 W 26-11 Green Bay 25,435 Taylor 4 -1 -.3 2 0 11/07 L 24-26 at Oakland 51,954 TEAM 247 954 3.9 40 7 11/18 L 17-24 Kansas City 76,252 OPPONENTS 292 1235 4.2 63t 9 12/01 at Denver * RECEIVING No. Yds Avg Long TD 12/08 at Jacksonville K. Allen 70 796 11.4 34 4 12/15 Minnesota Ekeler 65 667 10.3 55t 6 12/22 Oakland Henry 39 487 12.5 23 3 12/29 at Kansas City M. Williams 33 661 20.0 56 0 LA-C Opp. Gordon 18 112 6.2 25 1 TOTAL FIRST DOWNS 242 204 Inman 8 132 16.5 28 0 Rushing 57 70 Green 7 60 8.6 15 0 Passing 157 115 Jackson 7 20 2.9 9 0 Penalty 28 19 Benjamin 6 30 5.0 13 0 3rd Down: Made/Att 58/134 56/127 Kendricks LG 3 50 16.7 24 0 3rd Down Pct. 43.3 44.1 Kendricks TM 3 50 16.7 24 0 4th Down: Made/Att 5/10 5/8 G. Davis 3 38 12.7 19 0 4th Down Pct. 50.0 62.5 Watt 3 32 10.7 21 0 POSSESSION AVG. 30:44 29:16 Moore 2 43 21.5 32 0 TOTAL NET YARDS 4000 3493 Patton 2 22 11.0 15 0 Avg. Per Game 363.6 317.5 Pope 2 14 7.0 13t 1 Total Plays 687 635 Culkin 1 12 12.0 12 0 Avg. Per Play 5.8 5.5 TEAM 269 3176 11.8 56 15 NET YARDS RUSHING 954 1235 OPPONENTS 224 2417 10.8 70t 15 Avg. Per Game 86.7 112.3 * INTERCEPTIONS No. Yds Avg Long TD Total Rushes 247 292 Jenkins 3 10 3.3 8 0 NET YARDS PASSING 3046 2258 Hayward 2 37 18.5 37 0 Avg. Per Game 276.9 205.3 Teamer 1 3 3.0 3 0 Sacked/Yards Lost 23/130 25/159 M. Davis 1 0 0.0 0 0 Gross Yards 3176 2417 White 1 0 0.0 0 0 Att./Completions 417/269 318/224 TEAM 8 50 6.3 37 0 Completion Pct. 64.5 70.4 OPPONENTS 14 254 18.1 59 1 Had Intercepted 14 8 * PUNTING No. Yds Avg Net TB In Lg B PUNTS/AVERAGE 32/47.7 41/42.5 Long 32 1526 47.7 41.8 0 11 60 0 NET PUNTING AVG. 32/41.8 41/39.6 TEAM 32 1526 47.7 41.8 0 11 60 0 PENALTIES/YARDS 75/622 80/706 OPPONENTS 41 1741 42.5 39.6 1 20 59 0 FUMBLES/BALL LOST 13/6 14/3 * PUNT RETURNS Ret FC Yds Avg Long TD TOUCHDOWNS 23 26 King 16 9 96 6.0 68t 1 Rushing 7 9 Pope 0 3 0 --- --- 0 Passing 15 15 TEAM 16 12 96 6.0 68t 1 Returns 1 2 OPPONENTS 24 5 189 7.9 24 0 * SCORE BY PERIODS Q1 Q2 Q3 Q4 OT PTS * KICKOFF RETURNS No. Yds Avg Long TD TEAM 43 67 41 67 6 224 King 12 261 21.8 43 0 OPPONENTS 54 59 54 51 0 218 Pope 9 184 20.4 29 0 * SCORING TD-Ru-Pa-Rt K-PAT FG S PTS TEAM 21 445 21.2 43 0 Ekeler 9 3 6 0 0 54 OPPONENTS 25 560 22.4 36 0 Gordon 5 4 1 0 0 30 * FIELD GOALS 1-19 20-29 30-39 40-49 50+ Long 0 0 0 0 9/ 9 7/ 9 0 30 Badgley 0/ 0 4/ 4 1/ 1 3/ 5 0/ 0 Badgley 0 0 0 0 5/ 5 8/10 0 29 Long 0/ 0 0/ 0 2/ 3 4/ 5 1/ 1 McLaughlin TM 0 0 0 0 7/ 7 6/ 9 0 25 McLaughlin TM 0/ 0 2/ 2 2/ 2 1/ 4 1/ 1 K. Allen 4 0 4 0 0 24 TEAM 0/ 0 6/ 6 5/ 6 8/14 2/ 2 Henry 3 0 3 0 0 20 OPPONENTS 1/ 1 4/ 5 1/ 2 6/ 9 1/ 6 King 1 0 0 1 0 6 Badgley: ()()()()()()()()(29G,40G,34G,43G,44N) Pope 1 0 1 0 0 6 (27G)(27G,40N,26G,49G) TEAM 23 7 15 1 21/21 21/28 0 224 Long: (40G)(39G,39N,41N)(34G,43G)(44G,45G,51G)() OPPONENTS 26 9 15 2 19/24 13/23 0 218 ()()()()()() 2-Pt Conv: Henry, TM 1-1, OPP 2-2 TM: (40G)(39G,39N,41N)(34G,43G)(44G,45G,51G) SACKS: Bosa 8.5, Ingram 5.5, King 2.5, (48B,45G,32G)(43N,38G)(29G,50G)(20G,42N)(29G, Nwosu 2, Tillery 1.5, T. Davis 1, Mebane 1, 40G,34G,43G,44N)(27G)(27G,40N,26G,49G) Rochell 1, Teamer 1, (group) 1, TM 25, OPP: (46N,44G,29N)(40N)(56N)(30G,50N,52N)(40G, OPP 23 54N,46G)(20G)(45G)(33N,22G,25G,19G,41N)(54G) FUM/LOST: Rivers 6/2, King 3/1, Ekeler 2/2, (40G,22G,53N)(41G) Gordon 2/1 * PASSING Att Cmp Yds Cmp% Yds/Att TD TD% Int Int% Long Sack/Lost Rating Rivers 416 268 3169 64.4 7.62 15 3.6 14 3.4 56 23/ 130 85.5 Taylor 1 1 7 100.0 7.00 0 0.0 0 0.0 7 0/ 0 95.8 TEAM 417 269 3176 64.5 7.62 15 3.6 14 3.4 56 23/ 130 85.6 OPPONENTS 318 224 2417 70.4 7.60 15 4.7 8 2.5 70t 25/ 159 97.7
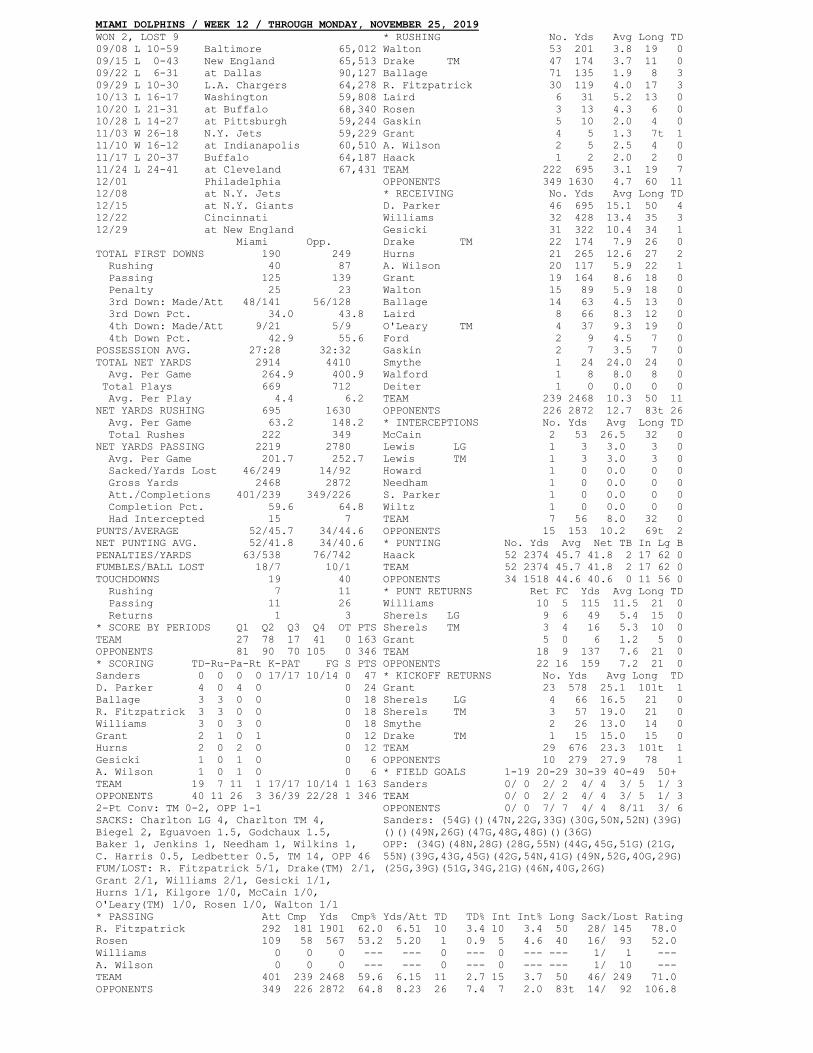
MIAMI DOLPHINS / WEEK 12 / THROUGH MONDAY, NOVEMBER 25, 2019 WON 2, LOST 9 * RUSHING No. Yds Avg Long TD 09/08 L 10-59 Baltimore 65,012 Walton 53 201 3.8 19 0 09/15 L 0-43 New England 65,513 Drake TM 47 174 3.7 11 0 09/22 L 6-31 at Dallas 90,127 Ballage 71 135 1.9 8 3 09/29 L 10-30 L.A. Chargers 64,278 R. Fitzpatrick 30 119 4.0 17 3 10/13 L 16-17 Washington 59,808 Laird 6 31 5.2 13 0 10/20 L 21-31 at Buffalo 68,340 Rosen 3 13 4.3 6 0 10/28 L 14-27 at Pittsburgh 59,244 Gaskin 5 10 2.0 4 0 11/03 W 26-18 N.Y. Jets 59,229 Grant 4 5 1.3 7t 1 11/10 W 16-12 at Indianapolis 60,510 A. Wilson 2 5 2.5 4 0 11/17 L 20-37 Buffalo 64,187 Haack 1 2 2.0 2 0 11/24 L 24-41 at Cleveland 67,431 TEAM 222 695 3.1 19 7 12/01 Philadelphia OPPONENTS 349 1630 4.7 60 11 12/08 at N.Y. Jets * RECEIVING No. Yds Avg Long TD 12/15 at N.Y. Giants D. Parker 46 695 15.1 50 4 12/22 Cincinnati Williams 32 428 13.4 35 3 12/29 at New England Gesicki 31 322 10.4 34 1 Miami Opp. Drake TM 22 174 7.9 26 0 TOTAL FIRST DOWNS 190 249 Hurns 21 265 12.6 27 2 Rushing 40 87 A. Wilson 20 117 5.9 22 1 Passing 125 139 Grant 19 164 8.6 18 0 Penalty 25 23 Walton 15 89 5.9 18 0 3rd Down: Made/Att 48/141 56/128 Ballage 14 63 4.5 13 0 3rd Down Pct. 34.0 43.8 Laird 8 66 8.3 12 0 4th Down: Made/Att 9/21 5/9 O'Leary TM 4 37 9.3 19 0 4th Down Pct. 42.9 55.6 Ford 2 9 4.5 7 0 POSSESSION AVG. 27:28 32:32 Gaskin 2 7 3.5 7 0 TOTAL NET YARDS 2914 4410 Smythe 1 24 24.0 24 0 Avg. Per Game 264.9 400.9 Walford 1 8 8.0 8 0 Total Plays 669 712 Deiter 1 0 0.0 0 0 Avg. Per Play 4.4 6.2 TEAM 239 2468 10.3 50 11 NET YARDS RUSHING 695 1630 OPPONENTS 226 2872 12.7 83t 26 Avg. Per Game 63.2 148.2 * INTERCEPTIONS No. Yds Avg Long TD Total Rushes 222 349 McCain 2 53 26.5 32 0 NET YARDS PASSING 2219 2780 Lewis LG 1 3 3.0 3 0 Avg. Per Game 201.7 252.7 Lewis TM 1 3 3.0 3 0 Sacked/Yards Lost 46/249 14/92 Howard 1 0 0.0 0 0 Gross Yards 2468 2872 Needham 1 0 0.0 0 0 Att./Completions 401/239 349/226 S. Parker 1 0 0.0 0 0 Completion Pct. 59.6 64.8 Wiltz 1 0 0.0 0 0 Had Intercepted 15 7 TEAM 7 56 8.0 32 0 PUNTS/AVERAGE 52/45.7 34/44.6 OPPONENTS 15 153 10.2 69t 2 NET PUNTING AVG. 52/41.8 34/40.6 * PUNTING No. Yds Avg Net TB In Lg B PENALTIES/YARDS 63/538 76/742 Haack 52 2374 45.7 41.8 2 17 62 0 FUMBLES/BALL LOST 18/7 10/1 TEAM 52 2374 45.7 41.8 2 17 62 0 TOUCHDOWNS 19 40 OPPONENTS 34 1518 44.6 40.6 0 11 56 0 Rushing 7 11 * PUNT RETURNS Ret FC Yds Avg Long TD Passing 11 26 Williams 10 5 115 11.5 21 0 Returns 1 3 Sherels LG 9 6 49 5.4 15 0 * SCORE BY PERIODS Q1 Q2 Q3 Q4 OT PTS Sherels TM 3 4 16 5.3 10 0 TEAM 27 78 17 41 0 163 Grant 5 0 6 1.2 5 0 OPPONENTS 81 90 70 105 0 346 TEAM 18 9 137 7.6 21 0 * SCORING TD-Ru-Pa-Rt K-PAT FG S PTS OPPONENTS 22 16 159 7.2 21 0 Sanders 0 0 0 0 17/17 10/14 0 47 * KICKOFF RETURNS No. Yds Avg Long TD D. Parker 4 0 4 0 0 24 Grant 23 578 25.1 101t 1 Ballage 3 3 0 0 0 18 Sherels LG 4 66 16.5 21 0 R. Fitzpatrick 3 3 0 0 0 18 Sherels TM 3 57 19.0 21 0 Williams 3 0 3 0 0 18 Smythe 2 26 13.0 14 0 Grant 2 1 0 1 0 12 Drake TM 1 15 15.0 15 0 Hurns 2 0 2 0 0 12 TEAM 29 676 23.3 101t 1 Gesicki 1 0 1 0 0 6 OPPONENTS 10 279 27.9 78 1 A. Wilson 1 0 1 0 0 6 * FIELD GOALS 1-19 20-29 30-39 40-49 50+ TEAM 19 7 11 1 17/17 10/14 1 163 Sanders 0/ 0 2/ 2 4/ 4 3/ 5 1/ 3 OPPONENTS 40 11 26 3 36/39 22/28 1 346 TEAM 0/ 0 2/ 2 4/ 4 3/ 5 1/ 3 2-Pt Conv: TM 0-2, OPP 1-1 OPPONENTS 0/ 0 7/ 7 4/ 4 8/11 3/ 6 SACKS: Charlton LG 4, Charlton TM 4, Sanders: (54G)()(47N,22G,33G)(30G,50N,52N)(39G) Biegel 2, Eguavoen 1.5, Godchaux 1.5, ()()(49N,26G)(47G,48G,48G)()(36G) Baker 1, Jenkins 1, Needham 1, Wilkins 1, OPP: (34G)(48N,28G)(28G,55N)(44G,45G,51G)(21G, C. Harris 0.5, Ledbetter 0.5, TM 14, OPP 46 55N)(39G,43G,45G)(42G,54N,41G)(49N,52G,40G,29G) FUM/LOST: R. Fitzpatrick 5/1, Drake(TM) 2/1, (25G,39G)(51G,34G,21G)(46N,40G,26G) Grant 2/1, Williams 2/1, Gesicki 1/1, Hurns 1/1, Kilgore 1/0, McCain 1/0, O'Leary(TM) 1/0, Rosen 1/0, Walton 1/1 * PASSING Att Cmp Yds Cmp% Yds/Att TD TD% Int Int% Long Sack/Lost Rating R. Fitzpatrick 292 181 1901 62.0 6.51 10 3.4 10 3.4 50 28/ 145 78.0 Rosen 109 58 567 53.2 5.20 1 0.9 5 4.6 40 16/ 93 52.0 Williams 0 0 0 --- --- 0 --- 0 --- --- 1/ 1 --- A. Wilson 0 0 0 --- --- 0 --- 0 --- --- 1/ 10 --- TEAM 401 239 2468 59.6 6.15 11 2.7 15 3.7 50 46/ 249 71.0 OPPONENTS 349 226 2872 64.8 8.23 26 7.4 7 2.0 83t 14/ 92 106.8

NEW ENGLAND PATRIOTS / WEEK 12 / THROUGH MONDAY, NOVEMBER 25, 2019 WON 10, LOST 1 * RUSHING No. Yds Avg Long TD 09/08 W 33- 3 Pittsburgh 65,878 Michel 174 600 3.4 26 6 09/15 W 43- 0 at Miami 65,513 Burkhead 38 151 4.0 12 1 09/22 W 30-14 N.Y. Jets 65,878 White 39 129 3.3 9 1 09/29 W 16-10 at Buffalo 70,317 Bolden 14 58 4.1 21 2 10/06 W 33- 7 at Washington 76,483 Edelman 6 26 4.3 9 0 10/10 W 35-14 N.Y. Giants 65,878 Dorsett 3 21 7.0 9 0 10/21 W 33- 0 at N.Y. Jets 78,523 Harris 4 12 3.0 13 0 10/27 W 27-13 Cleveland 65,878 Sanu LG 3 11 3.7 8 0 11/03 L 20-37 at Baltimore 71,157 Sanu TM 1 8 8.0 8 0 11/17 W 17-10 at Philadelphia 69,796 Brown 1 5 5.0 5 0 11/24 W 13- 9 Dallas 65,878 Develin 2 3 1.5 2 0 12/01 at Houston Gordon TM 1 1 1.0 1 0 12/08 Kansas City Brady 17 -1 -.1 2 3 12/15 at Cincinnati Stidham 2 -2 -1.0 -1 0 12/21 Buffalo TEAM 302 1011 3.3 26 13 12/29 Miami OPPONENTS 236 1082 4.6 65t 5 N.E. Opp. * RECEIVING No. Yds Avg Long TD TOTAL FIRST DOWNS 232 166 Edelman 76 809 10.6 36 4 Rushing 67 49 White 49 414 8.4 59 1 Passing 147 89 Sanu LG 47 421 9.0 28 2 Penalty 18 28 Sanu TM 14 108 7.7 19 1 3rd Down: Made/Att 60/161 25/132 Dorsett 26 332 12.8 58t 5 3rd Down Pct. 37.3 18.9 Gordon TM 20 287 14.4 44 1 4th Down: Made/Att 3/7 5/16 Burkhead 20 190 9.5 32 0 4th Down Pct. 42.9 31.3 Meyers 19 253 13.3 32 0 POSSESSION AVG. 32:15 27:45 Watson 11 124 11.3 26 0 TOTAL NET YARDS 3881 2820 Bolden 9 111 12.3 29t 1 Avg. Per Game 352.8 256.4 Michel 9 74 8.2 19 0 Total Plays 766 642 Izzo 6 114 19.0 41 1 Avg. Per Play 5.1 4.4 LaCosse 6 63 10.5 23 0 NET YARDS RUSHING 1011 1082 Brown 4 56 14.0 20t 1 Avg. Per Game 91.9 98.4 Harry 4 28 7.0 11 1 Total Rushes 302 236 Olszewski 2 34 17.0 29 0 NET YARDS PASSING 2870 1738 Johnson 1 5 5.0 5 0 Avg. Per Game 260.9 158.0 Tomlinson LG 1 1 1.0 1 0 Sacked/Yards Lost 19/133 37/254 Tomlinson TM 1 1 1.0 1 0 Gross Yards 3003 1992 TEAM 277 3003 10.8 59 16 Att./Completions 445/277 369/199 OPPONENTS 199 1992 10.0 64t 4 Completion Pct. 62.2 53.9 * INTERCEPTIONS No. Yds Avg Long TD Had Intercepted 6 20 D. McCourty 5 49 9.8 24 0 PUNTS/AVERAGE 62/44.9 68/42.9 Gilmore 4 62 15.5 54t 1 NET PUNTING AVG. 62/41.7 68/39.1 Collins 3 85 28.3 69t 1 PENALTIES/YARDS 68/629 73/599 Harmon 2 27 13.5 27 0 FUMBLES/BALL LOST 8/4 21/9 Jackson 2 20 10.0 19 0 TOUCHDOWNS 35 13 J. McCourty 1 16 16.0 16 0 Rushing 13 5 Simon 1 6 6.0 6 0 Passing 16 4 Guy 1 5 5.0 5 0 Returns 6 4 T. Brooks 1 0 0.0 0 0 * SCORE BY PERIODS Q1 Q2 Q3 Q4 OT PTS TEAM 20 270 13.5 69t 2 TEAM 94 78 71 57 0 300 OPPONENTS 6 150 25.0 62 1 OPPONENTS 20 44 27 26 0 117 * PUNTING No. Yds Avg Net TB In Lg B * SCORING TD-Ru-Pa-Rt K-PAT FG S PTS Bailey 62 2785 44.9 41.7 5 29 65 0 Michel 6 6 0 0 0 36 TEAM 62 2785 44.9 41.7 5 29 65 0 Gostkowski 0 0 0 0 11/15 7/ 8 0 32 OPPONENTS 68 2920 42.9 39.1 3 22 63 3 Dorsett 5 0 5 0 0 30 * PUNT RETURNS Ret FC Yds Avg Long TD Nugent 0 0 0 0 15/16 5/ 8 0 30 Olszewski 20 16 179 9.0 22 0 Edelman 4 0 4 0 0 24 Sanu LG 4 1 25 6.3 14 0 Folk 0 0 0 0 3/ 3 7/ 9 0 24 Sanu TM 3 1 23 7.7 14 0 Bolden 3 2 1 0 0 18 Burkhead 0 1 0 --- --- 0 Brady 3 3 0 0 0 18 TEAM 23 18 202 8.8 22 0 White 2 1 1 0 0 14 OPPONENTS 18 15 98 5.4 13 0 Sanu LG 2 0 2 0 0 12 * KICKOFF RETURNS No. Yds Avg Long TD Sanu TM 1 0 1 0 0 6 Bolden 12 269 22.4 28 0 Brown 1 0 1 0 0 6 Edelman 1 19 19.0 19 0 Burkhead 1 1 0 0 0 6 White 1 20 20.0 20 0 Collins 1 0 0 1 0 6 TEAM 14 308 22.0 28 0 Gilmore 1 0 0 1 0 6 OPPONENTS 21 423 20.1 40 0 Gordon TM 1 0 1 0 0 6 * FIELD GOALS 1-19 20-29 30-39 40-49 50+ Harry 1 0 1 0 0 6 Folk 1/ 1 2/ 2 2/ 2 2/ 4 0/ 0 Hightower 1 0 0 1 0 6 Gostkowski 0/ 0 3/ 3 3/ 3 1/ 2 0/ 0 Izzo 1 0 1 0 0 6 Nugent 0/ 0 3/ 4 2/ 3 0/ 1 0/ 0 Slater 1 0 0 1 0 6 TEAM 1/ 1 8/ 9 7/ 8 3/ 7 0/ 0 Van Noy 1 0 0 1 0 6 OPPONENTS 1/ 1 2/ 2 2/ 2 4/ 6 0/ 0 Winovich 1 0 0 1 0 6 Folk: ()()()()()()()()(22G,19G)(35G,22G,39G) TEAM 35 13 16 6 29/34 19/25 1 300 (44G,46N,48N,42G) OPPONENTS 13 5 4 4 12/13 9/11 0 117 Gostkowski: (25G,41G,35G,39G)(48N,28G)(37G)(23G) 2-Pt Conv: White, TM 1-1, OPP 0-0 ()()()()()()() SACKS: Collins 6, Butler 5.5, Van Noy 5.5, Nugent: ()()()()(37G,23G)(40N)(34G)(20G,29B,29G, Winovich 4.5, Hightower 3, Shelton 3, 34N)()()() Simon 3, Bennett TM 2.5, Guy 1, E. Roberts 1, OPP: (19G)()()(46G,49N)()()()(38G,47G)(39G)(42G) Wise 1, (group) 1, TM 37, OPP 19 (46N,46G,27G,29G) FUM/LOST: Brady 4/1, Edelman 2/1, Michel 1/1, Olszewski 1/1 * PASSING Att Cmp Yds Cmp% Yds/Att TD TD% Int Int% Long Sack/Lost Rating Brady 439 273 2942 62.2 6.70 15 3.4 5 1.1 59 18/ 126 88.5 Stidham 4 2 14 50.0 3.50 0 0.0 1 25.0 11 1/ 7 18.8 Edelman 2 2 47 100.0 23.50 1 50.0 0 0.0 32 0/ 0 158.3 TEAM 445 277 3003 62.2 6.75 16 3.6 6 1.3 59 19/ 133 88.4 OPPONENTS 369 199 1992 53.9 5.40 4 1.1 20 5.4 64t 37/ 254 50.5
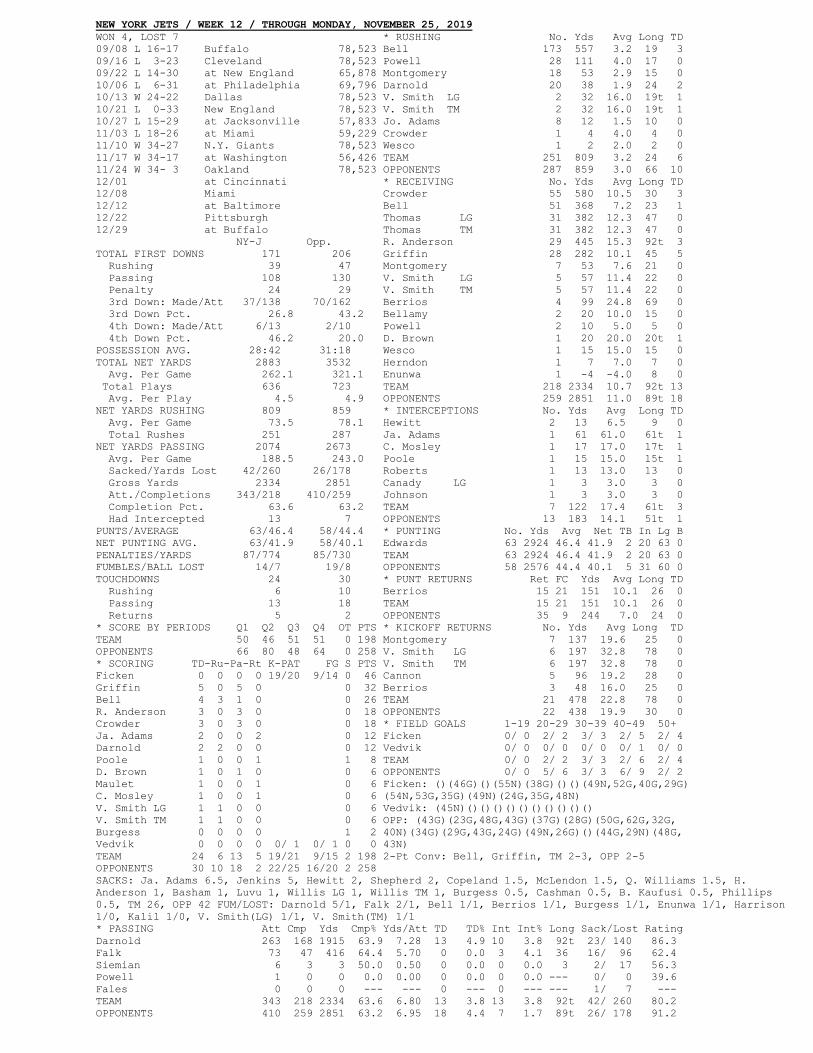
NEW YORK JETS / WEEK 12 / THROUGH MONDAY, NOVEMBER 25, 2019 WON 4, LOST 7 * RUSHING No. Yds Avg Long TD 09/08 L 16-17 Buffalo 78,523 Bell 173 557 3.2 19 3 09/16 L 3-23 Cleveland 78,523 Powell 28 111 4.0 17 0 09/22 L 14-30 at New England 65,878 Montgomery 18 53 2.9 15 0 10/06 L 6-31 at Philadelphia 69,796 Darnold 20 38 1.9 24 2 10/13 W 24-22 Dallas 78,523 V. Smith LG 2 32 16.0 19t 1 10/21 L 0-33 New England 78,523 V. Smith TM 2 32 16.0 19t 1 10/27 L 15-29 at Jacksonville 57,833 Jo. Adams 8 12 1.5 10 0 11/03 L 18-26 at Miami 59,229 Crowder 1 4 4.0 4 0 11/10 W 34-27 N.Y. Giants 78,523 Wesco 1 2 2.0 2 0 11/17 W 34-17 at Washington 56,426 TEAM 251 809 3.2 24 6 11/24 W 34- 3 Oakland 78,523 OPPONENTS 287 859 3.0 66 10 12/01 at Cincinnati * RECEIVING No. Yds Avg Long TD 12/08 Miami Crowder 55 580 10.5 30 3 12/12 at Baltimore Bell 51 368 7.2 23 1 12/22 Pittsburgh Thomas LG 31 382 12.3 47 0 12/29 at Buffalo Thomas TM 31 382 12.3 47 0 NY-J Opp. R. Anderson 29 445 15.3 92t 3 TOTAL FIRST DOWNS 171 206 Griffin 28 282 10.1 45 5 Rushing 39 47 Montgomery 7 53 7.6 21 0 Passing 108 130 V. Smith LG 5 57 11.4 22 0 Penalty 24 29 V. Smith TM 5 57 11.4 22 0 3rd Down: Made/Att 37/138 70/162 Berrios 4 99 24.8 69 0 3rd Down Pct. 26.8 43.2 Bellamy 2 20 10.0 15 0 4th Down: Made/Att 6/13 2/10 Powell 2 10 5.0 5 0 4th Down Pct. 46.2 20.0 D. Brown 1 20 20.0 20t 1 POSSESSION AVG. 28:42 31:18 Wesco 1 15 15.0 15 0 TOTAL NET YARDS 2883 3532 Herndon 1 7 7.0 7 0 Avg. Per Game 262.1 321.1 Enunwa 1 -4 -4.0 8 0 Total Plays 636 723 TEAM 218 2334 10.7 92t 13 Avg. Per Play 4.5 4.9 OPPONENTS 259 2851 11.0 89t 18 NET YARDS RUSHING 809 859 * INTERCEPTIONS No. Yds Avg Long TD Avg. Per Game 73.5 78.1 Hewitt 2 13 6.5 9 0 Total Rushes 251 287 Ja. Adams 1 61 61.0 61t 1 NET YARDS PASSING 2074 2673 C. Mosley 1 17 17.0 17t 1 Avg. Per Game 188.5 243.0 Poole 1 15 15.0 15t 1 Sacked/Yards Lost 42/260 26/178 Roberts 1 13 13.0 13 0 Gross Yards 2334 2851 Canady LG 1 3 3.0 3 0 Att./Completions 343/218 410/259 Johnson 1 3 3.0 3 0 Completion Pct. 63.6 63.2 TEAM 7 122 17.4 61t 3 Had Intercepted 13 7 OPPONENTS 13 183 14.1 51t 1 PUNTS/AVERAGE 63/46.4 58/44.4 * PUNTING No. Yds Avg Net TB In Lg B NET PUNTING AVG. 63/41.9 58/40.1 Edwards 63 2924 46.4 41.9 2 20 63 0 PENALTIES/YARDS 87/774 85/730 TEAM 63 2924 46.4 41.9 2 20 63 0 FUMBLES/BALL LOST 14/7 19/8 OPPONENTS 58 2576 44.4 40.1 5 31 60 0 TOUCHDOWNS 24 30 * PUNT RETURNS Ret FC Yds Avg Long TD Rushing 6 10 Berrios 15 21 151 10.1 26 0 Passing 13 18 TEAM 15 21 151 10.1 26 0 Returns 5 2 OPPONENTS 35 9 244 7.0 24 0 * SCORE BY PERIODS Q1 Q2 Q3 Q4 OT PTS * KICKOFF RETURNS No. Yds Avg Long TD TEAM 50 46 51 51 0 198 Montgomery 7 137 19.6 25 0 OPPONENTS 66 80 48 64 0 258 V. Smith LG 6 197 32.8 78 0 * SCORING TD-Ru-Pa-Rt K-PAT FG S PTS V. Smith TM 6 197 32.8 78 0 Ficken 0 0 0 0 19/20 9/14 0 46 Cannon 5 96 19.2 28 0 Griffin 5 0 5 0 0 32 Berrios 3 48 16.0 25 0 Bell 4 3 1 0 0 26 TEAM 21 478 22.8 78 0 R. Anderson 3 0 3 0 0 18 OPPONENTS 22 438 19.9 30 0 Crowder 3 0 3 0 0 18 * FIELD GOALS 1-19 20-29 30-39 40-49 50+ Ja. Adams 2 0 0 2 0 12 Ficken 0/ 0 2/ 2 3/ 3 2/ 5 2/ 4 Darnold 2 2 0 0 0 12 Vedvik 0/ 0 0/ 0 0/ 0 0/ 1 0/ 0 Poole 1 0 0 1 1 8 TEAM 0/ 0 2/ 2 3/ 3 2/ 6 2/ 4 D. Brown 1 0 1 0 0 6 OPPONENTS 0/ 0 5/ 6 3/ 3 6/ 9 2/ 2 Maulet 1 0 0 1 0 6 Ficken: ()(46G)()(55N)(38G)()()(49N,52G,40G,29G) C. Mosley 1 0 0 1 0 6 (54N,53G,35G)(49N)(24G,35G,48N) V. Smith LG 1 1 0 0 0 6 Vedvik: (45N)()()()()()()()()()() V. Smith TM 1 1 0 0 0 6 OPP: (43G)(23G,48G,43G)(37G)(28G)(50G,62G,32G, Burgess 0 0 0 0 1 2 40N)(34G)(29G,43G,24G)(49N,26G)()(44G,29N)(48G, Vedvik 0 0 0 0 0/ 1 0/ 1 0 0 43N) TEAM 24 6 13 5 19/21 9/15 2 198 2-Pt Conv: Bell, Griffin, TM 2-3, OPP 2-5 OPPONENTS 30 10 18 2 22/25 16/20 2 258 SACKS: Ja. Adams 6.5, Jenkins 5, Hewitt 2, Shepherd 2, Copeland 1.5, McLendon 1.5, Q. Williams 1.5, H. Anderson 1, Basham 1, Luvu 1, Willis LG 1, Willis TM 1, Burgess 0.5, Cashman 0.5, B. Kaufusi 0.5, Phillips 0.5, TM 26, OPP 42 FUM/LOST: Darnold 5/1, Falk 2/1, Bell 1/1, Berrios 1/1, Burgess 1/1, Enunwa 1/1, Harrison 1/0, Kalil 1/0, V. Smith(LG) 1/1, V. Smith(TM) 1/1 * PASSING Att Cmp Yds Cmp% Yds/Att TD TD% Int Int% Long Sack/Lost Rating Darnold 263 168 1915 63.9 7.28 13 4.9 10 3.8 92t 23/ 140 86.3 Falk 73 47 416 64.4 5.70 0 0.0 3 4.1 36 16/ 96 62.4 Siemian 6 3 3 50.0 0.50 0 0.0 0 0.0 3 2/ 17 56.3 Powell 1 0 0 0.0 0.00 0 0.0 0 0.0 --- 0/ 0 39.6 Fales 0 0 0 --- --- 0 --- 0 --- --- 1/ 7 --- TEAM 343 218 2334 63.6 6.80 13 3.8 13 3.8 92t 42/ 260 80.2 OPPONENTS 410 259 2851 63.2 6.95 18 4.4 7 1.7 89t 26/ 178 91.2
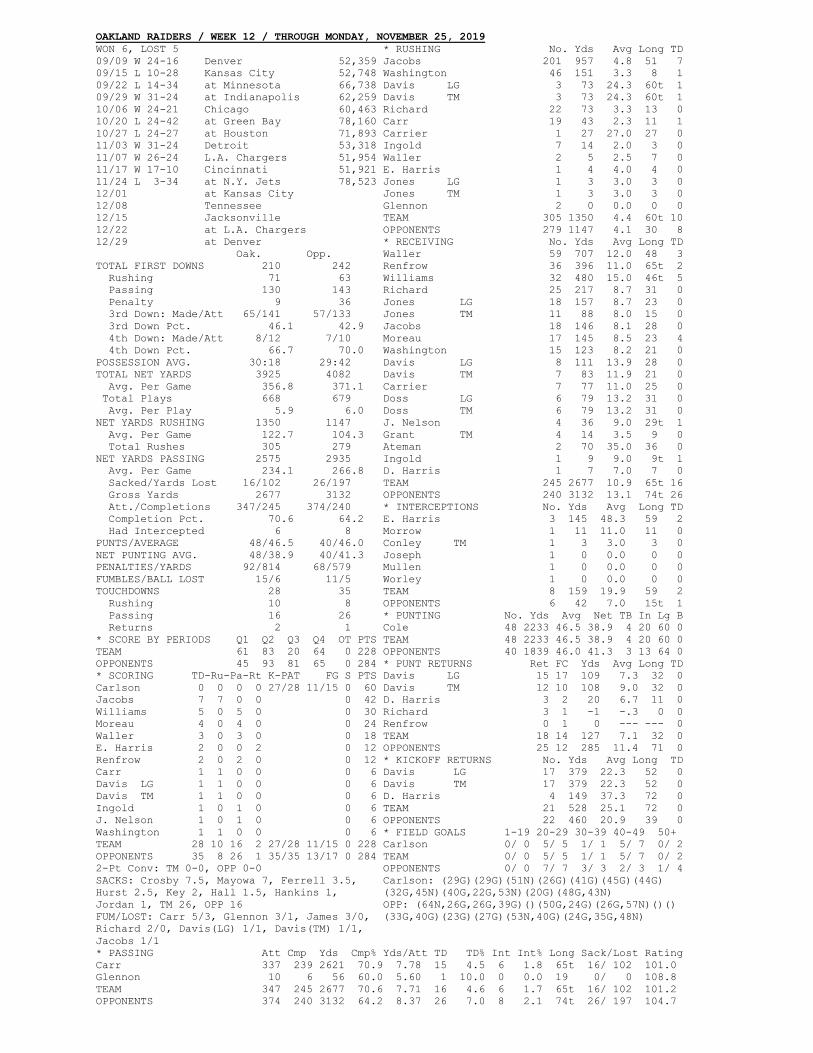
OAKLAND RAIDERS / WEEK 12 / THROUGH MONDAY, NOVEMBER 25, 2019 WON 6, LOST 5 * RUSHING No. Yds Avg Long TD 09/09 W 24-16 Denver 52,359 Jacobs 201 957 4.8 51 7 09/15 L 10-28 Kansas City 52,748 Washington 46 151 3.3 8 1 09/22 L 14-34 at Minnesota 66,738 Davis LG 3 73 24.3 60t 1 09/29 W 31-24 at Indianapolis 62,259 Davis TM 3 73 24.3 60t 1 10/06 W 24-21 Chicago 60,463 Richard 22 73 3.3 13 0 10/20 L 24-42 at Green Bay 78,160 Carr 19 43 2.3 11 1 10/27 L 24-27 at Houston 71,893 Carrier 1 27 27.0 27 0 11/03 W 31-24 Detroit 53,318 Ingold 7 14 2.0 3 0 11/07 W 26-24 L.A. Chargers 51,954 Waller 2 5 2.5 7 0 11/17 W 17-10 Cincinnati 51,921 E. Harris 1 4 4.0 4 0 11/24 L 3-34 at N.Y. Jets 78,523 Jones LG 1 3 3.0 3 0 12/01 at Kansas City Jones TM 1 3 3.0 3 0 12/08 Tennessee Glennon 2 0 0.0 0 0 12/15 Jacksonville TEAM 305 1350 4.4 60t 10 12/22 at L.A. Chargers OPPONENTS 279 1147 4.1 30 8 12/29 at Denver * RECEIVING No. Yds Avg Long TD Oak. Opp. Waller 59 707 12.0 48 3 TOTAL FIRST DOWNS 210 242 Renfrow 36 396 11.0 65t 2 Rushing 71 63 Williams 32 480 15.0 46t 5 Passing 130 143 Richard 25 217 8.7 31 0 Penalty 9 36 Jones LG 18 157 8.7 23 0 3rd Down: Made/Att 65/141 57/133 Jones TM 11 88 8.0 15 0 3rd Down Pct. 46.1 42.9 Jacobs 18 146 8.1 28 0 4th Down: Made/Att 8/12 7/10 Moreau 17 145 8.5 23 4 4th Down Pct. 66.7 70.0 Washington 15 123 8.2 21 0 POSSESSION AVG. 30:18 29:42 Davis LG 8 111 13.9 28 0 TOTAL NET YARDS 3925 4082 Davis TM 7 83 11.9 21 0 Avg. Per Game 356.8 371.1 Carrier 7 77 11.0 25 0 Total Plays 668 679 Doss LG 6 79 13.2 31 0 Avg. Per Play 5.9 6.0 Doss TM 6 79 13.2 31 0 NET YARDS RUSHING 1350 1147 J. Nelson 4 36 9.0 29t 1 Avg. Per Game 122.7 104.3 Grant TM 4 14 3.5 9 0 Total Rushes 305 279 Ateman 2 70 35.0 36 0 NET YARDS PASSING 2575 2935 Ingold 1 9 9.0 9t 1 Avg. Per Game 234.1 266.8 D. Harris 1 7 7.0 7 0 Sacked/Yards Lost 16/102 26/197 TEAM 245 2677 10.9 65t 16 Gross Yards 2677 3132 OPPONENTS 240 3132 13.1 74t 26 Att./Completions 347/245 374/240 * INTERCEPTIONS No. Yds Avg Long TD Completion Pct. 70.6 64.2 E. Harris 3 145 48.3 59 2 Had Intercepted 6 8 Morrow 1 11 11.0 11 0 PUNTS/AVERAGE 48/46.5 40/46.0 Conley TM 1 3 3.0 3 0 NET PUNTING AVG. 48/38.9 40/41.3 Joseph 1 0 0.0 0 0 PENALTIES/YARDS 92/814 68/579 Mullen 1 0 0.0 0 0 FUMBLES/BALL LOST 15/6 11/5 Worley 1 0 0.0 0 0 TOUCHDOWNS 28 35 TEAM 8 159 19.9 59 2 Rushing 10 8 OPPONENTS 6 42 7.0 15t 1 Passing 16 26 * PUNTING No. Yds Avg Net TB In Lg B Returns 2 1 Cole 48 2233 46.5 38.9 4 20 60 0 * SCORE BY PERIODS Q1 Q2 Q3 Q4 OT PTS TEAM 48 2233 46.5 38.9 4 20 60 0 TEAM 61 83 20 64 0 228 OPPONENTS 40 1839 46.0 41.3 3 13 64 0 OPPONENTS 45 93 81 65 0 284 * PUNT RETURNS Ret FC Yds Avg Long TD * SCORING TD-Ru-Pa-Rt K-PAT FG S PTS Davis LG 15 17 109 7.3 32 0 Carlson 0 0 0 0 27/28 11/15 0 60 Davis TM 12 10 108 9.0 32 0 Jacobs 7 7 0 0 0 42 D. Harris 3 2 20 6.7 11 0 Williams 5 0 5 0 0 30 Richard 3 1 -1 -.3 0 0 Moreau 4 0 4 0 0 24 Renfrow 0 1 0 --- --- 0 Waller 3 0 3 0 0 18 TEAM 18 14 127 7.1 32 0 E. Harris 2 0 0 2 0 12 OPPONENTS 25 12 285 11.4 71 0 Renfrow 2 0 2 0 0 12 * KICKOFF RETURNS No. Yds Avg Long TD Carr 1 1 0 0 0 6 Davis LG 17 379 22.3 52 0 Davis LG 1 1 0 0 0 6 Davis TM 17 379 22.3 52 0 Davis TM 1 1 0 0 0 6 D. Harris 4 149 37.3 72 0 Ingold 1 0 1 0 0 6 TEAM 21 528 25.1 72 0 J. Nelson 1 0 1 0 0 6 OPPONENTS 22 460 20.9 39 0 Washington 1 1 0 0 0 6 * FIELD GOALS 1-19 20-29 30-39 40-49 50+ TEAM 28 10 16 2 27/28 11/15 0 228 Carlson 0/ 0 5/ 5 1/ 1 5/ 7 0/ 2 OPPONENTS 35 8 26 1 35/35 13/17 0 284 TEAM 0/ 0 5/ 5 1/ 1 5/ 7 0/ 2 2-Pt Conv: TM 0-0, OPP 0-0 OPPONENTS 0/ 0 7/ 7 3/ 3 2/ 3 1/ 4 SACKS: Crosby 7.5, Mayowa 7, Ferrell 3.5, Carlson: (29G)(29G)(51N)(26G)(41G)(45G)(44G) Hurst 2.5, Key 2, Hall 1.5, Hankins 1, (32G,45N)(40G,22G,53N)(20G)(48G,43N) Jordan 1, TM 26, OPP 16 OPP: (64N,26G,26G,39G)()(50G,24G)(26G,57N)()() FUM/LOST: Carr 5/3, Glennon 3/1, James 3/0, (33G,40G)(23G)(27G)(53N,40G)(24G,35G,48N) Richard 2/0, Davis(LG) 1/1, Davis(TM) 1/1, Jacobs 1/1 * PASSING Att Cmp Yds Cmp% Yds/Att TD TD% Int Int% Long Sack/Lost Rating Carr 337 239 2621 70.9 7.78 15 4.5 6 1.8 65t 16/ 102 101.0 Glennon 10 6 56 60.0 5.60 1 10.0 0 0.0 19 0/ 0 108.8 TEAM 347 245 2677 70.6 7.71 16 4.6 6 1.7 65t 16/ 102 101.2 OPPONENTS 374 240 3132 64.2 8.37 26 7.0 8 2.1 74t 26/ 197 104.7
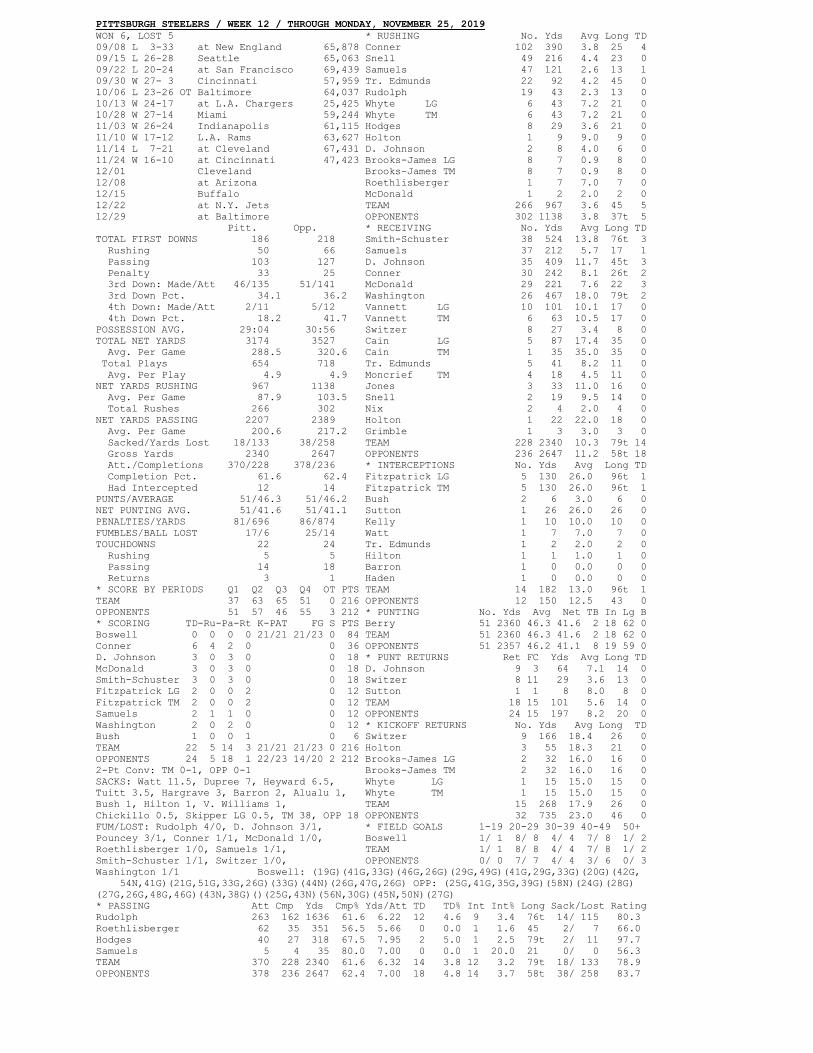
PITTSBURGH STEELERS / WEEK 12 / THROUGH MONDAY, NOVEMBER 25, 2019 WON 6, LOST 5 * RUSHING No. Yds Avg Long TD 09/08 L 3-33 at New England 65,878 Conner 102 390 3.8 25 4 09/15 L 26-28 Seattle 65,063 Snell 49 216 4.4 23 0 09/22 L 20-24 at San Francisco 69,439 Samuels 47 121 2.6 13 1 09/30 W 27- 3 Cincinnati 57,959 Tr. Edmunds 22 92 4.2 45 0 10/06 L 23-26 OT Baltimore 64,037 Rudolph 19 43 2.3 13 0 10/13 W 24-17 at L.A. Chargers 25,425 Whyte LG 6 43 7.2 21 0 10/28 W 27-14 Miami 59,244 Whyte TM 6 43 7.2 21 0 11/03 W 26-24 Indianapolis 61,115 Hodges 8 29 3.6 21 0 11/10 W 17-12 L.A. Rams 63,627 Holton 1 9 9.0 9 0 11/14 L 7-21 at Cleveland 67,431 D. Johnson 2 8 4.0 6 0 11/24 W 16-10 at Cincinnati 47,423 Brooks-James LG 8 7 0.9 8 0 12/01 Cleveland Brooks-James TM 8 7 0.9 8 0 12/08 at Arizona Roethlisberger 1 7 7.0 7 0 12/15 Buffalo McDonald 1 2 2.0 2 0 12/22 at N.Y. Jets TEAM 266 967 3.6 45 5 12/29 at Baltimore OPPONENTS 302 1138 3.8 37t 5 Pitt. Opp. * RECEIVING No. Yds Avg Long TD TOTAL FIRST DOWNS 186 218 Smith-Schuster 38 524 13.8 76t 3 Rushing 50 66 Samuels 37 212 5.7 17 1 Passing 103 127 D. Johnson 35 409 11.7 45t 3 Penalty 33 25 Conner 30 242 8.1 26t 2 3rd Down: Made/Att 46/135 51/141 McDonald 29 221 7.6 22 3 3rd Down Pct. 34.1 36.2 Washington 26 467 18.0 79t 2 4th Down: Made/Att 2/11 5/12 Vannett LG 10 101 10.1 17 0 4th Down Pct. 18.2 41.7 Vannett TM 6 63 10.5 17 0 POSSESSION AVG. 29:04 30:56 Switzer 8 27 3.4 8 0 TOTAL NET YARDS 3174 3527 Cain LG 5 87 17.4 35 0 Avg. Per Game 288.5 320.6 Cain TM 1 35 35.0 35 0 Total Plays 654 718 Tr. Edmunds 5 41 8.2 11 0 Avg. Per Play 4.9 4.9 Moncrief TM 4 18 4.5 11 0 NET YARDS RUSHING 967 1138 Jones 3 33 11.0 16 0 Avg. Per Game 87.9 103.5 Snell 2 19 9.5 14 0 Total Rushes 266 302 Nix 2 4 2.0 4 0 NET YARDS PASSING 2207 2389 Holton 1 22 22.0 18 0 Avg. Per Game 200.6 217.2 Grimble 1 3 3.0 3 0 Sacked/Yards Lost 18/133 38/258 TEAM 228 2340 10.3 79t 14 Gross Yards 2340 2647 OPPONENTS 236 2647 11.2 58t 18 Att./Completions 370/228 378/236 * INTERCEPTIONS No. Yds Avg Long TD Completion Pct. 61.6 62.4 Fitzpatrick LG 5 130 26.0 96t 1 Had Intercepted 12 14 Fitzpatrick TM 5 130 26.0 96t 1 PUNTS/AVERAGE 51/46.3 51/46.2 Bush 2 6 3.0 6 0 NET PUNTING AVG. 51/41.6 51/41.1 Sutton 1 26 26.0 26 0 PENALTIES/YARDS 81/696 86/874 Kelly 1 10 10.0 10 0 FUMBLES/BALL LOST 17/6 25/14 Watt 1 7 7.0 7 0 TOUCHDOWNS 22 24 Tr. Edmunds 1 2 2.0 2 0 Rushing 5 5 Hilton 1 1 1.0 1 0 Passing 14 18 Barron 1 0 0.0 0 0 Returns 3 1 Haden 1 0 0.0 0 0 * SCORE BY PERIODS Q1 Q2 Q3 Q4 OT PTS TEAM 14 182 13.0 96t 1 TEAM 37 63 65 51 0 216 OPPONENTS 12 150 12.5 43 0 OPPONENTS 51 57 46 55 3 212 * PUNTING No. Yds Avg Net TB In Lg B * SCORING TD-Ru-Pa-Rt K-PAT FG S PTS Berry 51 2360 46.3 41.6 2 18 62 0 Boswell 0 0 0 0 21/21 21/23 0 84 TEAM 51 2360 46.3 41.6 2 18 62 0 Conner 6 4 2 0 0 36 OPPONENTS 51 2357 46.2 41.1 8 19 59 0 D. Johnson 3 0 3 0 0 18 * PUNT RETURNS Ret FC Yds Avg Long TD McDonald 3 0 3 0 0 18 D. Johnson 9 3 64 7.1 14 0 Smith-Schuster 3 0 3 0 0 18 Switzer 8 11 29 3.6 13 0 Fitzpatrick LG 2 0 0 2 0 12 Sutton 1 1 8 8.0 8 0 Fitzpatrick TM 2 0 0 2 0 12 TEAM 18 15 101 5.6 14 0 Samuels 2 1 1 0 0 12 OPPONENTS 24 15 197 8.2 20 0 Washington 2 0 2 0 0 12 * KICKOFF RETURNS No. Yds Avg Long TD Bush 1 0 0 1 0 6 Switzer 9 166 18.4 26 0 TEAM 22 5 14 3 21/21 21/23 0 216 Holton 3 55 18.3 21 0 OPPONENTS 24 5 18 1 22/23 14/20 2 212 Brooks-James LG 2 32 16.0 16 0 2-Pt Conv: TM 0-1, OPP 0-1 Brooks-James TM 2 32 16.0 16 0 SACKS: Watt 11.5, Dupree 7, Heyward 6.5, Whyte LG 1 15 15.0 15 0 Tuitt 3.5, Hargrave 3, Barron 2, Alualu 1, Whyte TM 1 15 15.0 15 0 Bush 1, Hilton 1, V. Williams 1, TEAM 15 268 17.9 26 0 Chickillo 0.5, Skipper LG 0.5, TM 38, OPP 18 OPPONENTS 32 735 23.0 46 0 FUM/LOST: Rudolph 4/0, D. Johnson 3/1, * FIELD GOALS 1-19 20-29 30-39 40-49 50+ Pouncey 3/1, Conner 1/1, McDonald 1/0, Boswell 1/ 1 8/ 8 4/ 4 7/ 8 1/ 2 Roethlisberger 1/0, Samuels 1/1, TEAM 1/ 1 8/ 8 4/ 4 7/ 8 1/ 2 Smith-Schuster 1/1, Switzer 1/0, OPPONENTS 0/ 0 7/ 7 4/ 4 3/ 6 0/ 3 Washington 1/1 Boswell: (19G)(41G,33G)(46G,26G)(29G,49G)(41G,29G,33G)(20G)(42G, 54N,41G)(21G,51G,33G,26G)(33G)(44N)(26G,47G,26G) OPP: (25G,41G,35G,39G)(58N)(24G)(28G) (27G,26G,48G,46G)(43N,38G)()(25G,43N)(56N,30G)(45N,50N)(27G) * PASSING Att Cmp Yds Cmp% Yds/Att TD TD% Int Int% Long Sack/Lost Rating Rudolph 263 162 1636 61.6 6.22 12 4.6 9 3.4 76t 14/ 115 80.3 Roethlisberger 62 35 351 56.5 5.66 0 0.0 1 1.6 45 2/ 7 66.0 Hodges 40 27 318 67.5 7.95 2 5.0 1 2.5 79t 2/ 11 97.7 Samuels 5 4 35 80.0 7.00 0 0.0 1 20.0 21 0/ 0 56.3 TEAM 370 228 2340 61.6 6.32 14 3.8 12 3.2 79t 18/ 133 78.9 OPPONENTS 378 236 2647 62.4 7.00 18 4.8 14 3.7 58t 38/ 258 83.7
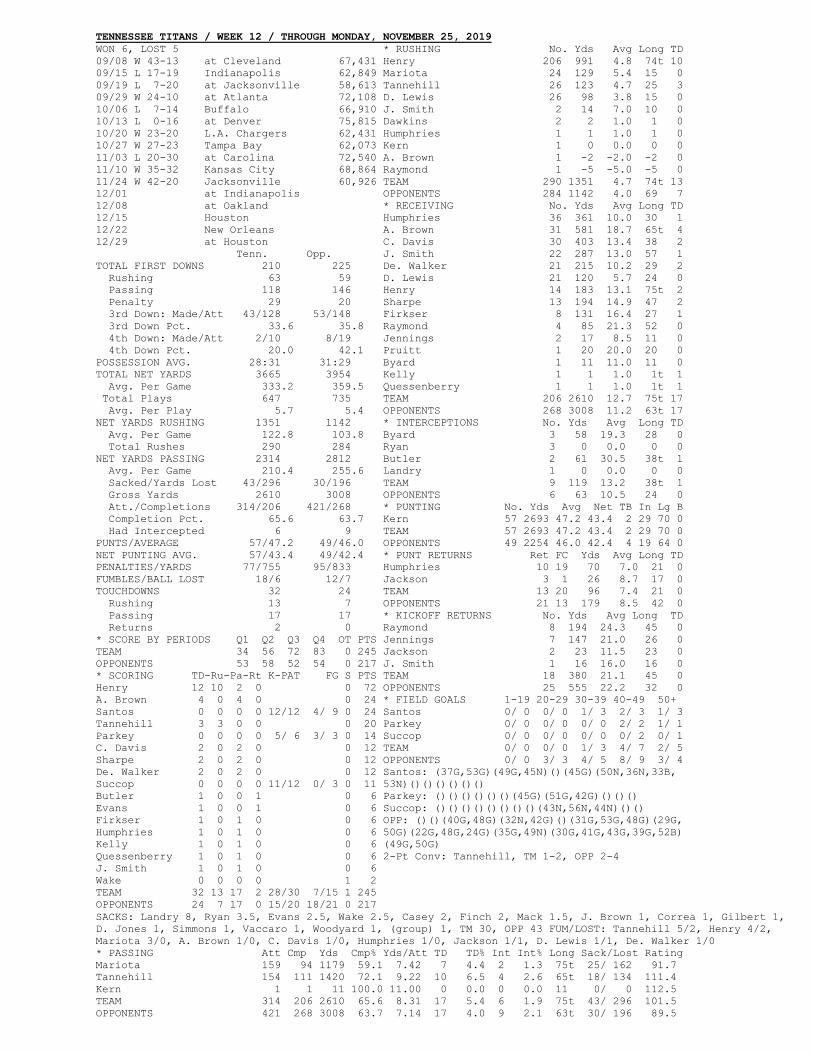
TENNESSEE TITANS / WEEK 12 / THROUGH MONDAY, NOVEMBER 25, 2019 WON 6, LOST 5 * RUSHING No. Yds Avg Long TD 09/08 W 43-13 at Cleveland 67,431 Henry 206 991 4.8 74t 10 09/15 L 17-19 Indianapolis 62,849 Mariota 24 129 5.4 15 0 09/19 L 7-20 at Jacksonville 58,613 Tannehill 26 123 4.7 25 3 09/29 W 24-10 at Atlanta 72,108 D. Lewis 26 98 3.8 15 0 10/06 L 7-14 Buffalo 66,910 J. Smith 2 14 7.0 10 0 10/13 L 0-16 at Denver 75,815 Dawkins 2 2 1.0 1 0 10/20 W 23-20 L.A. Chargers 62,431 Humphries 1 1 1.0 1 0 10/27 W 27-23 Tampa Bay 62,073 Kern 1 0 0.0 0 0 11/03 L 20-30 at Carolina 72,540 A. Brown 1 -2 -2.0 -2 0 11/10 W 35-32 Kansas City 68,864 Raymond 1 -5 -5.0 -5 0 11/24 W 42-20 Jacksonville 60,926 TEAM 290 1351 4.7 74t 13 12/01 at Indianapolis OPPONENTS 284 1142 4.0 69 7 12/08 at Oakland * RECEIVING No. Yds Avg Long TD 12/15 Houston Humphries 36 361 10.0 30 1 12/22 New Orleans A. Brown 31 581 18.7 65t 4 12/29 at Houston C. Davis 30 403 13.4 38 2 Tenn. Opp. J. Smith 22 287 13.0 57 1 TOTAL FIRST DOWNS 210 225 De. Walker 21 215 10.2 29 2 Rushing 63 59 D. Lewis 21 120 5.7 24 0 Passing 118 146 Henry 14 183 13.1 75t 2 Penalty 29 20 Sharpe 13 194 14.9 47 2 3rd Down: Made/Att 43/128 53/148 Firkser 8 131 16.4 27 1 3rd Down Pct. 33.6 35.8 Raymond 4 85 21.3 52 0 4th Down: Made/Att 2/10 8/19 Jennings 2 17 8.5 11 0 4th Down Pct. 20.0 42.1 Pruitt 1 20 20.0 20 0 POSSESSION AVG. 28:31 31:29 Byard 1 11 11.0 11 0 TOTAL NET YARDS 3665 3954 Kelly 1 1 1.0 1t 1 Avg. Per Game 333.2 359.5 Quessenberry 1 1 1.0 1t 1 Total Plays 647 735 TEAM 206 2610 12.7 75t 17 Avg. Per Play 5.7 5.4 OPPONENTS 268 3008 11.2 63t 17 NET YARDS RUSHING 1351 1142 * INTERCEPTIONS No. Yds Avg Long TD Avg. Per Game 122.8 103.8 Byard 3 58 19.3 28 0 Total Rushes 290 284 Ryan 3 0 0.0 0 0 NET YARDS PASSING 2314 2812 Butler 2 61 30.5 38t 1 Avg. Per Game 210.4 255.6 Landry 1 0 0.0 0 0 Sacked/Yards Lost 43/296 30/196 TEAM 9 119 13.2 38t 1 Gross Yards 2610 3008 OPPONENTS 6 63 10.5 24 0 Att./Completions 314/206 421/268 * PUNTING No. Yds Avg Net TB In Lg B Completion Pct. 65.6 63.7 Kern 57 2693 47.2 43.4 2 29 70 0 Had Intercepted 6 9 TEAM 57 2693 47.2 43.4 2 29 70 0 PUNTS/AVERAGE 57/47.2 49/46.0 OPPONENTS 49 2254 46.0 42.4 4 19 64 0 NET PUNTING AVG. 57/43.4 49/42.4 * PUNT RETURNS Ret FC Yds Avg Long TD PENALTIES/YARDS 77/755 95/833 Humphries 10 19 70 7.0 21 0 FUMBLES/BALL LOST 18/6 12/7 Jackson 3 1 26 8.7 17 0 TOUCHDOWNS 32 24 TEAM 13 20 96 7.4 21 0 Rushing 13 7 OPPONENTS 21 13 179 8.5 42 0 Passing 17 17 * KICKOFF RETURNS No. Yds Avg Long TD Returns 2 0 Raymond 8 194 24.3 45 0 * SCORE BY PERIODS Q1 Q2 Q3 Q4 OT PTS Jennings 7 147 21.0 26 0 TEAM 34 56 72 83 0 245 Jackson 2 23 11.5 23 0 OPPONENTS 53 58 52 54 0 217 J. Smith 1 16 16.0 16 0 * SCORING TD-Ru-Pa-Rt K-PAT FG S PTS TEAM 18 380 21.1 45 0 Henry 12 10 2 0 0 72 OPPONENTS 25 555 22.2 32 0 A. Brown 4 0 4 0 0 24 * FIELD GOALS 1-19 20-29 30-39 40-49 50+ Santos 0 0 0 0 12/12 4/ 9 0 24 Santos 0/ 0 0/ 0 1/ 3 2/ 3 1/ 3 Tannehill 3 3 0 0 0 20 Parkey 0/ 0 0/ 0 0/ 0 2/ 2 1/ 1 Parkey 0 0 0 0 5/ 6 3/ 3 0 14 Succop 0/ 0 0/ 0 0/ 0 0/ 2 0/ 1 C. Davis 2 0 2 0 0 12 TEAM 0/ 0 0/ 0 1/ 3 4/ 7 2/ 5 Sharpe 2 0 2 0 0 12 OPPONENTS 0/ 0 3/ 3 4/ 5 8/ 9 3/ 4 De. Walker 2 0 2 0 0 12 Santos: (37G,53G)(49G,45N)()(45G)(50N,36N,33B, Succop 0 0 0 0 11/12 0/ 3 0 11 53N)()()()()()() Butler 1 0 0 1 0 6 Parkey: ()()()()()()(45G)(51G,42G)()()() Evans 1 0 0 1 0 6 Succop: ()()()()()()()()(43N,56N,44N)()() Firkser 1 0 1 0 0 6 OPP: ()()(40G,48G)(32N,42G)()(31G,53G,48G)(29G, Humphries 1 0 1 0 0 6 50G)(22G,48G,24G)(35G,49N)(30G,41G,43G,39G,52B) Kelly 1 0 1 0 0 6 (49G,50G) Quessenberry 1 0 1 0 0 6 2-Pt Conv: Tannehill, TM 1-2, OPP 2-4 J. Smith 1 0 1 0 0 6 Wake 0 0 0 0 1 2 TEAM 32 13 17 2 28/30 7/15 1 245 OPPONENTS 24 7 17 0 15/20 18/21 0 217 SACKS: Landry 8, Ryan 3.5, Evans 2.5, Wake 2.5, Casey 2, Finch 2, Mack 1.5, J. Brown 1, Correa 1, Gilbert 1, D. Jones 1, Simmons 1, Vaccaro 1, Woodyard 1, (group) 1, TM 30, OPP 43 FUM/LOST: Tannehill 5/2, Henry 4/2, Mariota 3/0, A. Brown 1/0, C. Davis 1/0, Humphries 1/0, Jackson 1/1, D. Lewis 1/1, De. Walker 1/0 * PASSING Att Cmp Yds Cmp% Yds/Att TD TD% Int Int% Long Sack/Lost Rating Mariota 159 94 1179 59.1 7.42 7 4.4 2 1.3 75t 25/ 162 91.7 Tannehill 154 111 1420 72.1 9.22 10 6.5 4 2.6 65t 18/ 134 111.4 Kern 1 1 11 100.0 11.00 0 0.0 0 0.0 11 0/ 0 112.5 TEAM 314 206 2610 65.6 8.31 17 5.4 6 1.9 75t 43/ 296 101.5 OPPONENTS 421 268 3008 63.7 7.14 17 4.0 9 2.1 63t 30/ 196 89.5
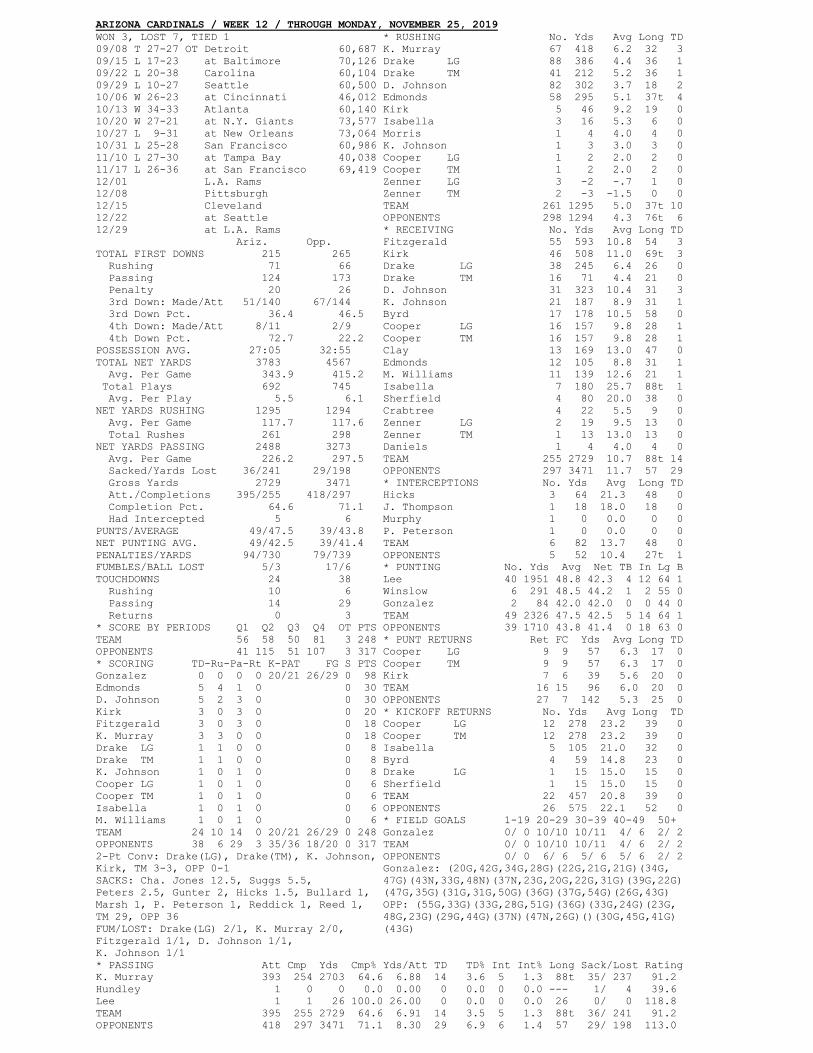
ARIZONA CARDINALS / WEEK 12 / THROUGH MONDAY, NOVEMBER 25, 2019 WON 3, LOST 7, TIED 1 * RUSHING No. Yds Avg Long TD 09/08 T 27-27 OT Detroit 60,687 K. Murray 67 418 6.2 32 3 09/15 L 17-23 at Baltimore 70,126 Drake LG 88 386 4.4 36 1 09/22 L 20-38 Carolina 60,104 Drake TM 41 212 5.2 36 1 09/29 L 10-27 Seattle 60,500 D. Johnson 82 302 3.7 18 2 10/06 W 26-23 at Cincinnati 46,012 Edmonds 58 295 5.1 37t 4 10/13 W 34-33 Atlanta 60,140 Kirk 5 46 9.2 19 0 10/20 W 27-21 at N.Y. Giants 73,577 Isabella 3 16 5.3 6 0 10/27 L 9-31 at New Orleans 73,064 Morris 1 4 4.0 4 0 10/31 L 25-28 San Francisco 60,986 K. Johnson 1 3 3.0 3 0 11/10 L 27-30 at Tampa Bay 40,038 Cooper LG 1 2 2.0 2 0 11/17 L 26-36 at San Francisco 69,419 Cooper TM 1 2 2.0 2 0 12/01 L.A. Rams Zenner LG 3 -2 -.7 1 0 12/08 Pittsburgh Zenner TM 2 -3 -1.5 0 0 12/15 Cleveland TEAM 261 1295 5.0 37t 10 12/22 at Seattle OPPONENTS 298 1294 4.3 76t 6 12/29 at L.A. Rams * RECEIVING No. Yds Avg Long TD Ariz. Opp. Fitzgerald 55 593 10.8 54 3 TOTAL FIRST DOWNS 215 265 Kirk 46 508 11.0 69t 3 Rushing 71 66 Drake LG 38 245 6.4 26 0 Passing 124 173 Drake TM 16 71 4.4 21 0 Penalty 20 26 D. Johnson 31 323 10.4 31 3 3rd Down: Made/Att 51/140 67/144 K. Johnson 21 187 8.9 31 1 3rd Down Pct. 36.4 46.5 Byrd 17 178 10.5 58 0 4th Down: Made/Att 8/11 2/9 Cooper LG 16 157 9.8 28 1 4th Down Pct. 72.7 22.2 Cooper TM 16 157 9.8 28 1 POSSESSION AVG. 27:05 32:55 Clay 13 169 13.0 47 0 TOTAL NET YARDS 3783 4567 Edmonds 12 105 8.8 31 1 Avg. Per Game 343.9 415.2 M. Williams 11 139 12.6 21 1 Total Plays 692 745 Isabella 7 180 25.7 88t 1 Avg. Per Play 5.5 6.1 Sherfield 4 80 20.0 38 0 NET YARDS RUSHING 1295 1294 Crabtree 4 22 5.5 9 0 Avg. Per Game 117.7 117.6 Zenner LG 2 19 9.5 13 0 Total Rushes 261 298 Zenner TM 1 13 13.0 13 0 NET YARDS PASSING 2488 3273 Daniels 1 4 4.0 4 0 Avg. Per Game 226.2 297.5 TEAM 255 2729 10.7 88t 14 Sacked/Yards Lost 36/241 29/198 OPPONENTS 297 3471 11.7 57 29 Gross Yards 2729 3471 * INTERCEPTIONS No. Yds Avg Long TD Att./Completions 395/255 418/297 Hicks 3 64 21.3 48 0 Completion Pct. 64.6 71.1 J. Thompson 1 18 18.0 18 0 Had Intercepted 5 6 Murphy 1 0 0.0 0 0 PUNTS/AVERAGE 49/47.5 39/43.8 P. Peterson 1 0 0.0 0 0 NET PUNTING AVG. 49/42.5 39/41.4 TEAM 6 82 13.7 48 0 PENALTIES/YARDS 94/730 79/739 OPPONENTS 5 52 10.4 27t 1 FUMBLES/BALL LOST 5/3 17/6 * PUNTING No. Yds Avg Net TB In Lg B TOUCHDOWNS 24 38 Lee 40 1951 48.8 42.3 4 12 64 1 Rushing 10 6 Winslow 6 291 48.5 44.2 1 2 55 0 Passing 14 29 Gonzalez 2 84 42.0 42.0 0 0 44 0 Returns 0 3 TEAM 49 2326 47.5 42.5 5 14 64 1 * SCORE BY PERIODS Q1 Q2 Q3 Q4 OT PTS OPPONENTS 39 1710 43.8 41.4 0 18 63 0 TEAM 56 58 50 81 3 248 * PUNT RETURNS Ret FC Yds Avg Long TD OPPONENTS 41 115 51 107 3 317 Cooper LG 9 9 57 6.3 17 0 * SCORING TD-Ru-Pa-Rt K-PAT FG S PTS Cooper TM 9 9 57 6.3 17 0 Gonzalez 0 0 0 0 20/21 26/29 0 98 Kirk 7 6 39 5.6 20 0 Edmonds 5 4 1 0 0 30 TEAM 16 15 96 6.0 20 0 D. Johnson 5 2 3 0 0 30 OPPONENTS 27 7 142 5.3 25 0 Kirk 3 0 3 0 0 20 * KICKOFF RETURNS No. Yds Avg Long TD Fitzgerald 3 0 3 0 0 18 Cooper LG 12 278 23.2 39 0 K. Murray 3 3 0 0 0 18 Cooper TM 12 278 23.2 39 0 Drake LG 1 1 0 0 0 8 Isabella 5 105 21.0 32 0 Drake TM 1 1 0 0 0 8 Byrd 4 59 14.8 23 0 K. Johnson 1 0 1 0 0 8 Drake LG 1 15 15.0 15 0 Cooper LG 1 0 1 0 0 6 Sherfield 1 15 15.0 15 0 Cooper TM 1 0 1 0 0 6 TEAM 22 457 20.8 39 0 Isabella 1 0 1 0 0 6 OPPONENTS 26 575 22.1 52 0 M. Williams 1 0 1 0 0 6 * FIELD GOALS 1-19 20-29 30-39 40-49 50+ TEAM 24 10 14 0 20/21 26/29 0 248 Gonzalez 0/ 0 10/10 10/11 4/ 6 2/ 2 OPPONENTS 38 6 29 3 35/36 18/20 0 317 TEAM 0/ 0 10/10 10/11 4/ 6 2/ 2 2-Pt Conv: Drake(LG), Drake(TM), K. Johnson, OPPONENTS 0/ 0 6/ 6 5/ 6 5/ 6 2/ 2 Kirk, TM 3-3, OPP 0-1 Gonzalez: (20G,42G,34G,28G)(22G,21G,21G)(34G, SACKS: Cha. Jones 12.5, Suggs 5.5, 47G)(43N,33G,48N)(37N,23G,20G,22G,31G)(39G,22G) Peters 2.5, Gunter 2, Hicks 1.5, Bullard 1, (47G,35G)(31G,31G,50G)(36G)(37G,54G)(26G,43G) Marsh 1, P. Peterson 1, Reddick 1, Reed 1, OPP: (55G,33G)(33G,28G,51G)(36G)(33G,24G)(23G, TM 29, OPP 36 48G,23G)(29G,44G)(37N)(47N,26G)()(30G,45G,41G) FUM/LOST: Drake(LG) 2/1, K. Murray 2/0, (43G) Fitzgerald 1/1, D. Johnson 1/1, K. Johnson 1/1 * PASSING Att Cmp Yds Cmp% Yds/Att TD TD% Int Int% Long Sack/Lost Rating K. Murray 393 254 2703 64.6 6.88 14 3.6 5 1.3 88t 35/ 237 91.2 Hundley 1 0 0 0.0 0.00 0 0.0 0 0.0 --- 1/ 4 39.6 Lee 1 1 26 100.0 26.00 0 0.0 0 0.0 26 0/ 0 118.8 TEAM 395 255 2729 64.6 6.91 14 3.5 5 1.3 88t 36/ 241 91.2 OPPONENTS 418 297 3471 71.1 8.30 29 6.9 6 1.4 57 29/ 198 113.0
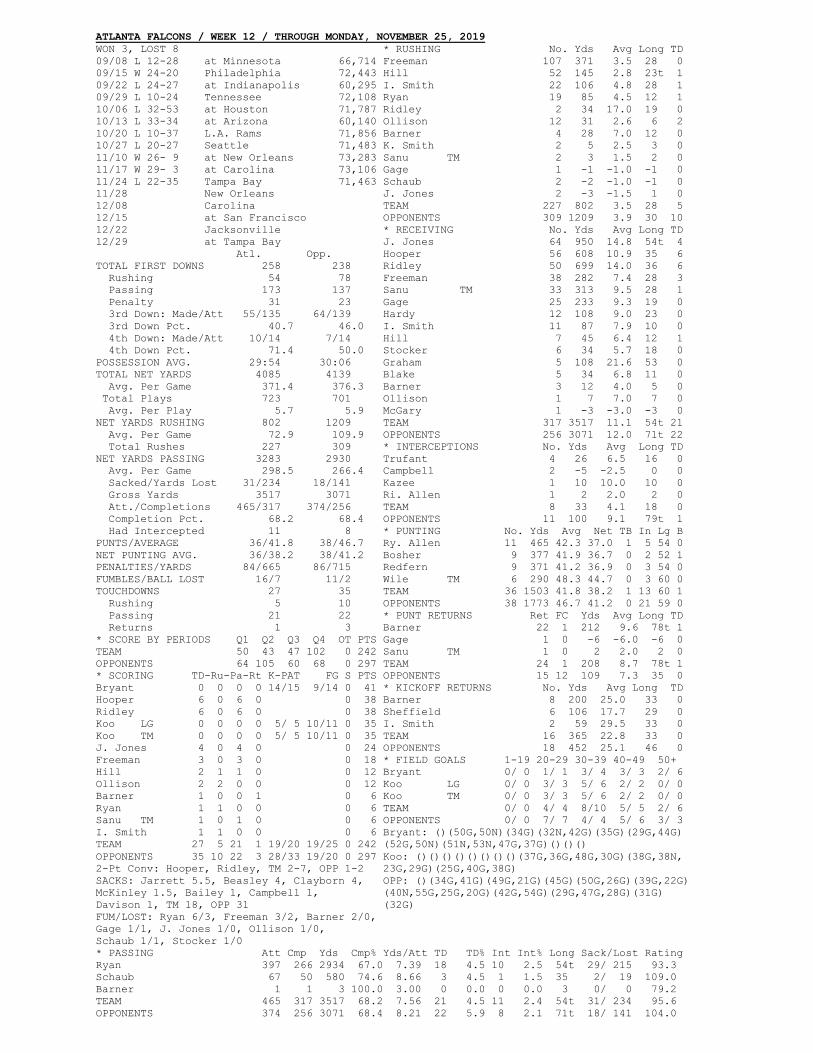
ATLANTA FALCONS / WEEK 12 / THROUGH MONDAY, NOVEMBER 25, 2019 WON 3, LOST 8 * RUSHING No. Yds Avg Long TD 09/08 L 12-28 at Minnesota 66,714 Freeman 107 371 3.5 28 0 09/15 W 24-20 Philadelphia 72,443 Hill 52 145 2.8 23t 1 09/22 L 24-27 at Indianapolis 60,295 I. Smith 22 106 4.8 28 1 09/29 L 10-24 Tennessee 72,108 Ryan 19 85 4.5 12 1 10/06 L 32-53 at Houston 71,787 Ridley 2 34 17.0 19 0 10/13 L 33-34 at Arizona 60,140 Ollison 12 31 2.6 6 2 10/20 L 10-37 L.A. Rams 71,856 Barner 4 28 7.0 12 0 10/27 L 20-27 Seattle 71,483 K. Smith 2 5 2.5 3 0 11/10 W 26- 9 at New Orleans 73,283 Sanu TM 2 3 1.5 2 0 11/17 W 29- 3 at Carolina 73,106 Gage 1 -1 -1.0 -1 0 11/24 L 22-35 Tampa Bay 71,463 Schaub 2 -2 -1.0 -1 0 11/28 New Orleans J. Jones 2 -3 -1.5 1 0 12/08 Carolina TEAM 227 802 3.5 28 5 12/15 at San Francisco OPPONENTS 309 1209 3.9 30 10 12/22 Jacksonville * RECEIVING No. Yds Avg Long TD 12/29 at Tampa Bay J. Jones 64 950 14.8 54t 4 Atl. Opp. Hooper 56 608 10.9 35 6 TOTAL FIRST DOWNS 258 238 Ridley 50 699 14.0 36 6 Rushing 54 78 Freeman 38 282 7.4 28 3 Passing 173 137 Sanu TM 33 313 9.5 28 1 Penalty 31 23 Gage 25 233 9.3 19 0 3rd Down: Made/Att 55/135 64/139 Hardy 12 108 9.0 23 0 3rd Down Pct. 40.7 46.0 I. Smith 11 87 7.9 10 0 4th Down: Made/Att 10/14 7/14 Hill 7 45 6.4 12 1 4th Down Pct. 71.4 50.0 Stocker 6 34 5.7 18 0 POSSESSION AVG. 29:54 30:06 Graham 5 108 21.6 53 0 TOTAL NET YARDS 4085 4139 Blake 5 34 6.8 11 0 Avg. Per Game 371.4 376.3 Barner 3 12 4.0 5 0 Total Plays 723 701 Ollison 1 7 7.0 7 0 Avg. Per Play 5.7 5.9 McGary 1 -3 -3.0 -3 0 NET YARDS RUSHING 802 1209 TEAM 317 3517 11.1 54t 21 Avg. Per Game 72.9 109.9 OPPONENTS 256 3071 12.0 71t 22 Total Rushes 227 309 * INTERCEPTIONS No. Yds Avg Long TD NET YARDS PASSING 3283 2930 Trufant 4 26 6.5 16 0 Avg. Per Game 298.5 266.4 Campbell 2 -5 -2.5 0 0 Sacked/Yards Lost 31/234 18/141 Kazee 1 10 10.0 10 0 Gross Yards 3517 3071 Ri. Allen 1 2 2.0 2 0 Att./Completions 465/317 374/256 TEAM 8 33 4.1 18 0 Completion Pct. 68.2 68.4 OPPONENTS 11 100 9.1 79t 1 Had Intercepted 11 8 * PUNTING No. Yds Avg Net TB In Lg B PUNTS/AVERAGE 36/41.8 38/46.7 Ry. Allen 11 465 42.3 37.0 1 5 54 0 NET PUNTING AVG. 36/38.2 38/41.2 Bosher 9 377 41.9 36.7 0 2 52 1 PENALTIES/YARDS 84/665 86/715 Redfern 9 371 41.2 36.9 0 3 54 0 FUMBLES/BALL LOST 16/7 11/2 Wile TM 6 290 48.3 44.7 0 3 60 0 TOUCHDOWNS 27 35 TEAM 36 1503 41.8 38.2 1 13 60 1 Rushing 5 10 OPPONENTS 38 1773 46.7 41.2 0 21 59 0 Passing 21 22 * PUNT RETURNS Ret FC Yds Avg Long TD Returns 1 3 Barner 22 1 212 9.6 78t 1 * SCORE BY PERIODS Q1 Q2 Q3 Q4 OT PTS Gage 1 0 -6 -6.0 -6 0 TEAM 50 43 47 102 0 242 Sanu TM 1 0 2 2.0 2 0 OPPONENTS 64 105 60 68 0 297 TEAM 24 1 208 8.7 78t 1 * SCORING TD-Ru-Pa-Rt K-PAT FG S PTS OPPONENTS 15 12 109 7.3 35 0 Bryant 0 0 0 0 14/15 9/14 0 41 * KICKOFF RETURNS No. Yds Avg Long TD Hooper 6 0 6 0 0 38 Barner 8 200 25.0 33 0 Ridley 6 0 6 0 0 38 Sheffield 6 106 17.7 29 0 Koo LG 0 0 0 0 5/ 5 10/11 0 35 I. Smith 2 59 29.5 33 0 Koo TM 0 0 0 0 5/ 5 10/11 0 35 TEAM 16 365 22.8 33 0 J. Jones 4 0 4 0 0 24 OPPONENTS 18 452 25.1 46 0 Freeman 3 0 3 0 0 18 * FIELD GOALS 1-19 20-29 30-39 40-49 50+ Hill 2 1 1 0 0 12 Bryant 0/ 0 1/ 1 3/ 4 3/ 3 2/ 6 Ollison 2 2 0 0 0 12 Koo LG 0/ 0 3/ 3 5/ 6 2/ 2 0/ 0 Barner 1 0 0 1 0 6 Koo TM 0/ 0 3/ 3 5/ 6 2/ 2 0/ 0 Ryan 1 1 0 0 0 6 TEAM 0/ 0 4/ 4 8/10 5/ 5 2/ 6 Sanu TM 1 0 1 0 0 6 OPPONENTS 0/ 0 7/ 7 4/ 4 5/ 6 3/ 3 I. Smith 1 1 0 0 0 6 Bryant: ()(50G,50N)(34G)(32N,42G)(35G)(29G,44G) TEAM 27 5 21 1 19/20 19/25 0 242 (52G,50N)(51N,53N,47G,37G)()()() OPPONENTS 35 10 22 3 28/33 19/20 0 297 Koo: ()()()()()()()()(37G,36G,48G,30G)(38G,38N, 2-Pt Conv: Hooper, Ridley, TM 2-7, OPP 1-2 23G,29G)(25G,40G,38G) SACKS: Jarrett 5.5, Beasley 4, Clayborn 4, OPP: ()(34G,41G)(49G,21G)(45G)(50G,26G)(39G,22G) McKinley 1.5, Bailey 1, Campbell 1, (40N,55G,25G,20G)(42G,54G)(29G,47G,28G)(31G) Davison 1, TM 18, OPP 31 (32G) FUM/LOST: Ryan 6/3, Freeman 3/2, Barner 2/0, Gage 1/1, J. Jones 1/0, Ollison 1/0, Schaub 1/1, Stocker 1/0 * PASSING Att Cmp Yds Cmp% Yds/Att TD TD% Int Int% Long Sack/Lost Rating Ryan 397 266 2934 67.0 7.39 18 4.5 10 2.5 54t 29/ 215 93.3 Schaub 67 50 580 74.6 8.66 3 4.5 1 1.5 35 2/ 19 109.0 Barner 1 1 3 100.0 3.00 0 0.0 0 0.0 3 0/ 0 79.2 TEAM 465 317 3517 68.2 7.56 21 4.5 11 2.4 54t 31/ 234 95.6 OPPONENTS 374 256 3071 68.4 8.21 22 5.9 8 2.1 71t 18/ 141 104.0
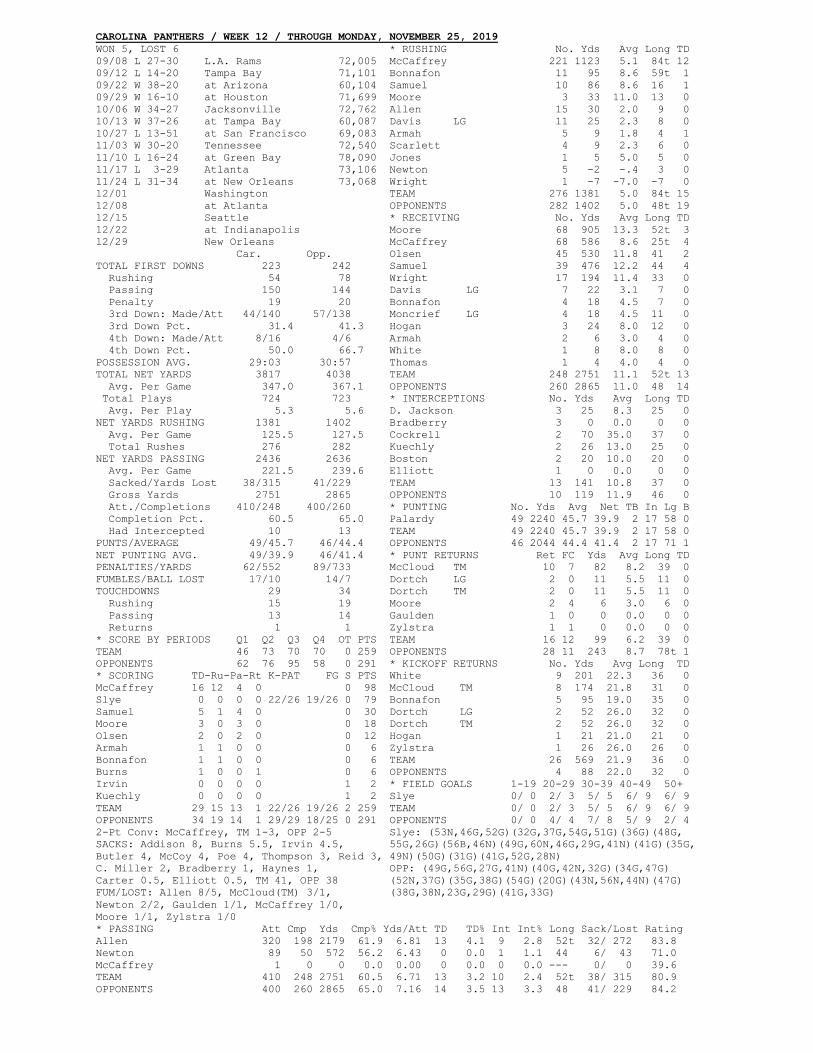
CAROLINA PANTHERS / WEEK 12 / THROUGH MONDAY, NOVEMBER 25, 2019 WON 5, LOST 6 * RUSHING No. Yds Avg Long TD 09/08 L 27-30 L.A. Rams 72,005 McCaffrey 221 1123 5.1 84t 12 09/12 L 14-20 Tampa Bay 71,101 Bonnafon 11 95 8.6 59t 1 09/22 W 38-20 at Arizona 60,104 Samuel 10 86 8.6 16 1 09/29 W 16-10 at Houston 71,699 Moore 3 33 11.0 13 0 10/06 W 34-27 Jacksonville 72,762 Allen 15 30 2.0 9 0 10/13 W 37-26 at Tampa Bay 60,087 Davis LG 11 25 2.3 8 0 10/27 L 13-51 at San Francisco 69,083 Armah 5 9 1.8 4 1 11/03 W 30-20 Tennessee 72,540 Scarlett 4 9 2.3 6 0 11/10 L 16-24 at Green Bay 78,090 Jones 1 5 5.0 5 0 11/17 L 3-29 Atlanta 73,106 Newton 5 -2 -.4 3 0 11/24 L 31-34 at New Orleans 73,068 Wright 1 -7 -7.0 -7 0 12/01 Washington TEAM 276 1381 5.0 84t 15 12/08 at Atlanta OPPONENTS 282 1402 5.0 48t 19 12/15 Seattle * RECEIVING No. Yds Avg Long TD 12/22 at Indianapolis Moore 68 905 13.3 52t 3 12/29 New Orleans McCaffrey 68 586 8.6 25t 4 Car. Opp. Olsen 45 530 11.8 41 2 TOTAL FIRST DOWNS 223 242 Samuel 39 476 12.2 44 4 Rushing 54 78 Wright 17 194 11.4 33 0 Passing 150 144 Davis LG 7 22 3.1 7 0 Penalty 19 20 Bonnafon 4 18 4.5 7 0 3rd Down: Made/Att 44/140 57/138 Moncrief LG 4 18 4.5 11 0 3rd Down Pct. 31.4 41.3 Hogan 3 24 8.0 12 0 4th Down: Made/Att 8/16 4/6 Armah 2 6 3.0 4 0 4th Down Pct. 50.0 66.7 White 1 8 8.0 8 0 POSSESSION AVG. 29:03 30:57 Thomas 1 4 4.0 4 0 TOTAL NET YARDS 3817 4038 TEAM 248 2751 11.1 52t 13 Avg. Per Game 347.0 367.1 OPPONENTS 260 2865 11.0 48 14 Total Plays 724 723 * INTERCEPTIONS No. Yds Avg Long TD Avg. Per Play 5.3 5.6 D. Jackson 3 25 8.3 25 0 NET YARDS RUSHING 1381 1402 Bradberry 3 0 0.0 0 0 Avg. Per Game 125.5 127.5 Cockrell 2 70 35.0 37 0 Total Rushes 276 282 Kuechly 2 26 13.0 25 0 NET YARDS PASSING 2436 2636 Boston 2 20 10.0 20 0 Avg. Per Game 221.5 239.6 Elliott 1 0 0.0 0 0 Sacked/Yards Lost 38/315 41/229 TEAM 13 141 10.8 37 0 Gross Yards 2751 2865 OPPONENTS 10 119 11.9 46 0 Att./Completions 410/248 400/260 * PUNTING No. Yds Avg Net TB In Lg B Completion Pct. 60.5 65.0 Palardy 49 2240 45.7 39.9 2 17 58 0 Had Intercepted 10 13 TEAM 49 2240 45.7 39.9 2 17 58 0 PUNTS/AVERAGE 49/45.7 46/44.4 OPPONENTS 46 2044 44.4 41.4 2 17 71 1 NET PUNTING AVG. 49/39.9 46/41.4 * PUNT RETURNS Ret FC Yds Avg Long TD PENALTIES/YARDS 62/552 89/733 McCloud TM 10 7 82 8.2 39 0 FUMBLES/BALL LOST 17/10 14/7 Dortch LG 2 0 11 5.5 11 0 TOUCHDOWNS 29 34 Dortch TM 2 0 11 5.5 11 0 Rushing 15 19 Moore 2 4 6 3.0 6 0 Passing 13 14 Gaulden 1 0 0 0.0 0 0 Returns 1 1 Zylstra 1 1 0 0.0 0 0 * SCORE BY PERIODS Q1 Q2 Q3 Q4 OT PTS TEAM 16 12 99 6.2 39 0 TEAM 46 73 70 70 0 259 OPPONENTS 28 11 243 8.7 78t 1 OPPONENTS 62 76 95 58 0 291 * KICKOFF RETURNS No. Yds Avg Long TD * SCORING TD-Ru-Pa-Rt K-PAT FG S PTS White 9 201 22.3 36 0 McCaffrey 16 12 4 0 0 98 McCloud TM 8 174 21.8 31 0 Slye 0 0 0 0 22/26 19/26 0 79 Bonnafon 5 95 19.0 35 0 Samuel 5 1 4 0 0 30 Dortch LG 2 52 26.0 32 0 Moore 3 0 3 0 0 18 Dortch TM 2 52 26.0 32 0 Olsen 2 0 2 0 0 12 Hogan 1 21 21.0 21 0 Armah 1 1 0 0 0 6 Zylstra 1 26 26.0 26 0 Bonnafon 1 1 0 0 0 6 TEAM 26 569 21.9 36 0 Burns 1 0 0 1 0 6 OPPONENTS 4 88 22.0 32 0 Irvin 0 0 0 0 1 2 * FIELD GOALS 1-19 20-29 30-39 40-49 50+ Kuechly 0 0 0 0 1 2 Slye 0/ 0 2/ 3 5/ 5 6/ 9 6/ 9 TEAM 29 15 13 1 22/26 19/26 2 259 TEAM 0/ 0 2/ 3 5/ 5 6/ 9 6/ 9 OPPONENTS 34 19 14 1 29/29 18/25 0 291 OPPONENTS 0/ 0 4/ 4 7/ 8 5/ 9 2/ 4 2-Pt Conv: McCaffrey, TM 1-3, OPP 2-5 Slye: (53N,46G,52G)(32G,37G,54G,51G)(36G)(48G, SACKS: Addison 8, Burns 5.5, Irvin 4.5, 55G,26G)(56B,46N)(49G,60N,46G,29G,41N)(41G)(35G, Butler 4, McCoy 4, Poe 4, Thompson 3, Reid 3, 49N)(50G)(31G)(41G,52G,28N) C. Miller 2, Bradberry 1, Haynes 1, OPP: (49G,56G,27G,41N)(40G,42N,32G)(34G,47G) Carter 0.5, Elliott 0.5, TM 41, OPP 38 (52N,37G)(35G,38G)(54G)(20G)(43N,56N,44N)(47G) FUM/LOST: Allen 8/5, McCloud(TM) 3/1, (38G,38N,23G,29G)(41G,33G) Newton 2/2, Gaulden 1/1, McCaffrey 1/0, Moore 1/1, Zylstra 1/0 * PASSING Att Cmp Yds Cmp% Yds/Att TD TD% Int Int% Long Sack/Lost Rating Allen 320 198 2179 61.9 6.81 13 4.1 9 2.8 52t 32/ 272 83.8 Newton 89 50 572 56.2 6.43 0 0.0 1 1.1 44 6/ 43 71.0 McCaffrey 1 0 0 0.0 0.00 0 0.0 0 0.0 --- 0/ 0 39.6 TEAM 410 248 2751 60.5 6.71 13 3.2 10 2.4 52t 38/ 315 80.9 OPPONENTS 400 260 2865 65.0 7.16 14 3.5 13 3.3 48 41/ 229 84.2
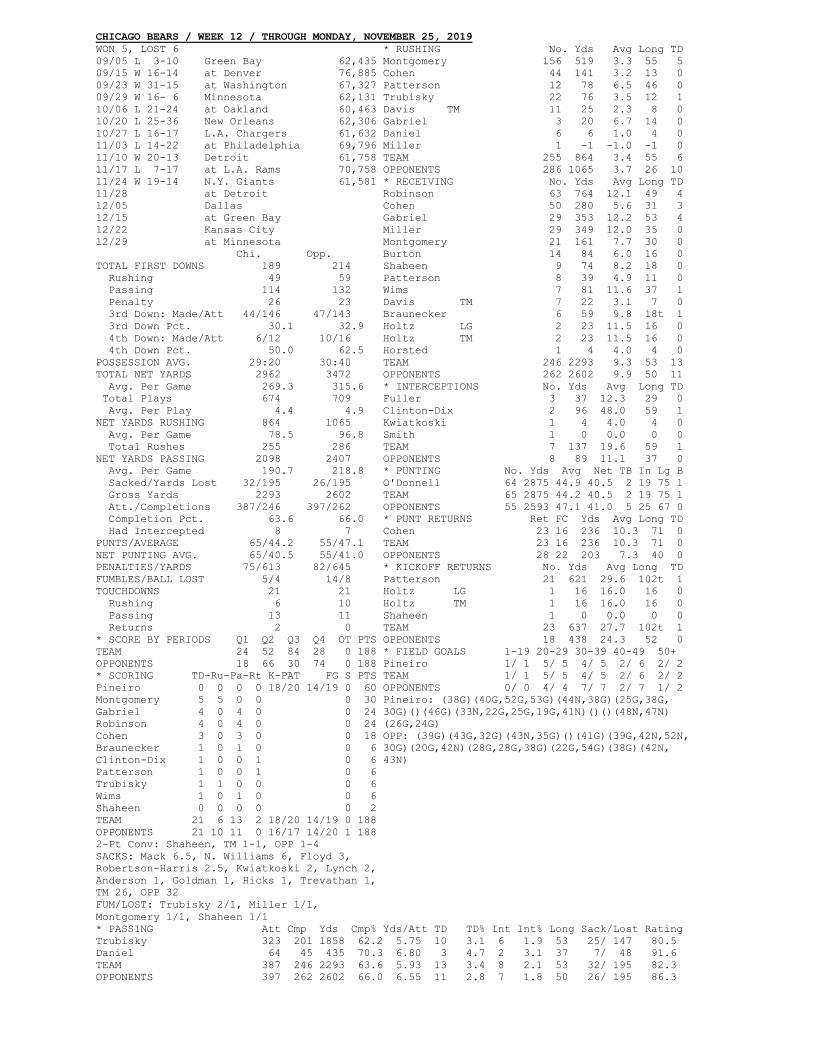
CHICAGO BEARS / WEEK 12 / THROUGH MONDAY, NOVEMBER 25, 2019 WON 5, LOST 6 * RUSHING No. Yds Avg Long TD 09/05 L 3-10 Green Bay 62,435 Montgomery 156 519 3.3 55 5 09/15 W 16-14 at Denver 76,885 Cohen 44 141 3.2 13 0 09/23 W 31-15 at Washington 67,327 Patterson 12 78 6.5 46 0 09/29 W 16- 6 Minnesota 62,131 Trubisky 22 76 3.5 12 1 10/06 L 21-24 at Oakland 60,463 Davis TM 11 25 2.3 8 0 10/20 L 25-36 New Orleans 62,306 Gabriel 3 20 6.7 14 0 10/27 L 16-17 L.A. Chargers 61,632 Daniel 6 6 1.0 4 0 11/03 L 14-22 at Philadelphia 69,796 Miller 1 -1 -1.0 -1 0 11/10 W 20-13 Detroit 61,758 TEAM 255 864 3.4 55 6 11/17 L 7-17 at L.A. Rams 70,758 OPPONENTS 286 1065 3.7 26 10 11/24 W 19-14 N.Y. Giants 61,581 * RECEIVING No. Yds Avg Long TD 11/28 at Detroit Robinson 63 764 12.1 49 4 12/05 Dallas Cohen 50 280 5.6 31 3 12/15 at Green Bay Gabriel 29 353 12.2 53 4 12/22 Kansas City Miller 29 349 12.0 35 0 12/29 at Minnesota Montgomery 21 161 7.7 30 0 Chi. Opp. Burton 14 84 6.0 16 0 TOTAL FIRST DOWNS 189 214 Shaheen 9 74 8.2 18 0 Rushing 49 59 Patterson 8 39 4.9 11 0 Passing 114 132 Wims 7 81 11.6 37 1 Penalty 26 23 Davis TM 7 22 3.1 7 0 3rd Down: Made/Att 44/146 47/143 Braunecker 6 59 9.8 18t 1 3rd Down Pct. 30.1 32.9 Holtz LG 2 23 11.5 16 0 4th Down: Made/Att 6/12 10/16 Holtz TM 2 23 11.5 16 0 4th Down Pct. 50.0 62.5 Horsted 1 4 4.0 4 0 POSSESSION AVG. 29:20 30:40 TEAM 246 2293 9.3 53 13 TOTAL NET YARDS 2962 3472 OPPONENTS 262 2602 9.9 50 11 Avg. Per Game 269.3 315.6 * INTERCEPTIONS No. Yds Avg Long TD Total Plays 674 709 Fuller 3 37 12.3 29 0 Avg. Per Play 4.4 4.9 Clinton-Dix 2 96 48.0 59 1 NET YARDS RUSHING 864 1065 Kwiatkoski 1 4 4.0 4 0 Avg. Per Game 78.5 96.8 Smith 1 0 0.0 0 0 Total Rushes 255 286 TEAM 7 137 19.6 59 1 NET YARDS PASSING 2098 2407 OPPONENTS 8 89 11.1 37 0 Avg. Per Game 190.7 218.8 * PUNTING No. Yds Avg Net TB In Lg B Sacked/Yards Lost 32/195 26/195 O'Donnell 64 2875 44.9 40.5 2 19 75 1 Gross Yards 2293 2602 TEAM 65 2875 44.2 40.5 2 19 75 1 Att./Completions 387/246 397/262 OPPONENTS 55 2593 47.1 41.0 5 25 67 0 Completion Pct. 63.6 66.0 * PUNT RETURNS Ret FC Yds Avg Long TD Had Intercepted 8 7 Cohen 23 16 236 10.3 71 0 PUNTS/AVERAGE 65/44.2 55/47.1 TEAM 23 16 236 10.3 71 0 NET PUNTING AVG. 65/40.5 55/41.0 OPPONENTS 28 22 203 7.3 40 0 PENALTIES/YARDS 75/613 82/645 * KICKOFF RETURNS No. Yds Avg Long TD FUMBLES/BALL LOST 5/4 14/8 Patterson 21 621 29.6 102t 1 TOUCHDOWNS 21 21 Holtz LG 1 16 16.0 16 0 Rushing 6 10 Holtz TM 1 16 16.0 16 0 Passing 13 11 Shaheen 1 0 0.0 0 0 Returns 2 0 TEAM 23 637 27.7 102t 1 * SCORE BY PERIODS Q1 Q2 Q3 Q4 OT PTS OPPONENTS 18 438 24.3 52 0 TEAM 24 52 84 28 0 188 * FIELD GOALS 1-19 20-29 30-39 40-49 50+ OPPONENTS 18 66 30 74 0 188 Pineiro 1/ 1 5/ 5 4/ 5 2/ 6 2/ 2 * SCORING TD-Ru-Pa-Rt K-PAT FG S PTS TEAM 1/ 1 5/ 5 4/ 5 2/ 6 2/ 2 Pineiro 0 0 0 0 18/20 14/19 0 60 OPPONENTS 0/ 0 4/ 4 7/ 7 2/ 7 1/ 2 Montgomery 5 5 0 0 0 30 Pineiro: (38G)(40G,52G,53G)(44N,38G)(25G,38G, Gabriel 4 0 4 0 0 24 30G)()(46G)(33N,22G,25G,19G,41N)()()(48N,47N) Robinson 4 0 4 0 0 24 (26G,24G) Cohen 3 0 3 0 0 18 OPP: (39G)(43G,32G)(43N,35G)()(41G)(39G,42N,52N, Braunecker 1 0 1 0 0 6 30G)(20G,42N)(28G,28G,38G)(22G,54G)(38G)(42N, Clinton-Dix 1 0 0 1 0 6 43N) Patterson 1 0 0 1 0 6 Trubisky 1 1 0 0 0 6 Wims 1 0 1 0 0 6 Shaheen 0 0 0 0 0 2 TEAM 21 6 13 2 18/20 14/19 0 188 OPPONENTS 21 10 11 0 16/17 14/20 1 188 2-Pt Conv: Shaheen, TM 1-1, OPP 1-4 SACKS: Mack 6.5, N. Williams 6, Floyd 3, Robertson-Harris 2.5, Kwiatkoski 2, Lynch 2, Anderson 1, Goldman 1, Hicks 1, Trevathan 1, TM 26, OPP 32 FUM/LOST: Trubisky 2/1, Miller 1/1, Montgomery 1/1, Shaheen 1/1 * PASSING Att Cmp Yds Cmp% Yds/Att TD TD% Int Int% Long Sack/Lost Rating Trubisky 323 201 1858 62.2 5.75 10 3.1 6 1.9 53 25/ 147 80.5 Daniel 64 45 435 70.3 6.80 3 4.7 2 3.1 37 7/ 48 91.6 TEAM 387 246 2293 63.6 5.93 13 3.4 8 2.1 53 32/ 195 82.3 OPPONENTS 397 262 2602 66.0 6.55 11 2.8 7 1.8 50 26/ 195 86.3
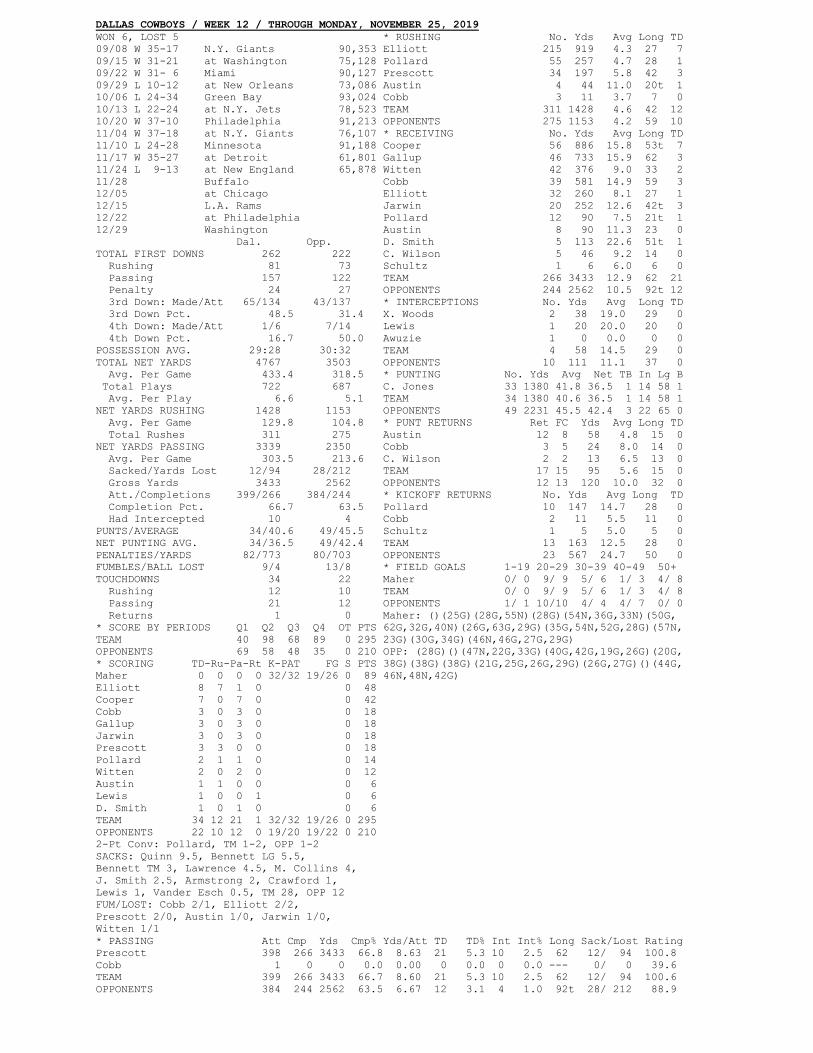
DALLAS COWBOYS / WEEK 12 / THROUGH MONDAY, NOVEMBER 25, 2019 WON 6, LOST 5 * RUSHING No. Yds Avg Long TD 09/08 W 35-17 N.Y. Giants 90,353 Elliott 215 919 4.3 27 7 09/15 W 31-21 at Washington 75,128 Pollard 55 257 4.7 28 1 09/22 W 31- 6 Miami 90,127 Prescott 34 197 5.8 42 3 09/29 L 10-12 at New Orleans 73,086 Austin 4 44 11.0 20t 1 10/06 L 24-34 Green Bay 93,024 Cobb 3 11 3.7 7 0 10/13 L 22-24 at N.Y. Jets 78,523 TEAM 311 1428 4.6 42 12 10/20 W 37-10 Philadelphia 91,213 OPPONENTS 275 1153 4.2 59 10 11/04 W 37-18 at N.Y. Giants 76,107 * RECEIVING No. Yds Avg Long TD 11/10 L 24-28 Minnesota 91,188 Cooper 56 886 15.8 53t 7 11/17 W 35-27 at Detroit 61,801 Gallup 46 733 15.9 62 3 11/24 L 9-13 at New England 65,878 Witten 42 376 9.0 33 2 11/28 Buffalo Cobb 39 581 14.9 59 3 12/05 at Chicago Elliott 32 260 8.1 27 1 12/15 L.A. Rams Jarwin 20 252 12.6 42t 3 12/22 at Philadelphia Pollard 12 90 7.5 21t 1 12/29 Washington Austin 8 90 11.3 23 0 Dal. Opp. D. Smith 5 113 22.6 51t 1 TOTAL FIRST DOWNS 262 222 C. Wilson 5 46 9.2 14 0 Rushing 81 73 Schultz 1 6 6.0 6 0 Passing 157 122 TEAM 266 3433 12.9 62 21 Penalty 24 27 OPPONENTS 244 2562 10.5 92t 12 3rd Down: Made/Att 65/134 43/137 * INTERCEPTIONS No. Yds Avg Long TD 3rd Down Pct. 48.5 31.4 X. Woods 2 38 19.0 29 0 4th Down: Made/Att 1/6 7/14 Lewis 1 20 20.0 20 0 4th Down Pct. 16.7 50.0 Awuzie 1 0 0.0 0 0 POSSESSION AVG. 29:28 30:32 TEAM 4 58 14.5 29 0 TOTAL NET YARDS 4767 3503 OPPONENTS 10 111 11.1 37 0 Avg. Per Game 433.4 318.5 * PUNTING No. Yds Avg Net TB In Lg B Total Plays 722 687 C. Jones 33 1380 41.8 36.5 1 14 58 1 Avg. Per Play 6.6 5.1 TEAM 34 1380 40.6 36.5 1 14 58 1 NET YARDS RUSHING 1428 1153 OPPONENTS 49 2231 45.5 42.4 3 22 65 0 Avg. Per Game 129.8 104.8 * PUNT RETURNS Ret FC Yds Avg Long TD Total Rushes 311 275 Austin 12 8 58 4.8 15 0 NET YARDS PASSING 3339 2350 Cobb 3 5 24 8.0 14 0 Avg. Per Game 303.5 213.6 C. Wilson 2 2 13 6.5 13 0 Sacked/Yards Lost 12/94 28/212 TEAM 17 15 95 5.6 15 0 Gross Yards 3433 2562 OPPONENTS 12 13 120 10.0 32 0 Att./Completions 399/266 384/244 * KICKOFF RETURNS No. Yds Avg Long TD Completion Pct. 66.7 63.5 Pollard 10 147 14.7 28 0 Had Intercepted 10 4 Cobb 2 11 5.5 11 0 PUNTS/AVERAGE 34/40.6 49/45.5 Schultz 1 5 5.0 5 0 NET PUNTING AVG. 34/36.5 49/42.4 TEAM 13 163 12.5 28 0 PENALTIES/YARDS 82/773 80/703 OPPONENTS 23 567 24.7 50 0 FUMBLES/BALL LOST 9/4 13/8 * FIELD GOALS 1-19 20-29 30-39 40-49 50+ TOUCHDOWNS 34 22 Maher 0/ 0 9/ 9 5/ 6 1/ 3 4/ 8 Rushing 12 10 TEAM 0/ 0 9/ 9 5/ 6 1/ 3 4/ 8 Passing 21 12 OPPONENTS 1/ 1 10/10 4/ 4 4/ 7 0/ 0 Returns 1 0 Maher: ()(25G)(28G,55N)(28G)(54N,36G,33N)(50G, * SCORE BY PERIODS Q1 Q2 Q3 Q4 OT PTS 62G,32G,40N)(26G,63G,29G)(35G,54N,52G,28G)(57N, TEAM 40 98 68 89 0 295 23G)(30G,34G)(46N,46G,27G,29G) OPPONENTS 69 58 48 35 0 210 OPP: (28G)()(47N,22G,33G)(40G,42G,19G,26G)(20G, * SCORING TD-Ru-Pa-Rt K-PAT FG S PTS 38G)(38G)(38G)(21G,25G,26G,29G)(26G,27G)()(44G, Maher 0 0 0 0 32/32 19/26 0 89 46N,48N,42G) Elliott 8 7 1 0 0 48 Cooper 7 0 7 0 0 42 Cobb 3 0 3 0 0 18 Gallup 3 0 3 0 0 18 Jarwin 3 0 3 0 0 18 Prescott 3 3 0 0 0 18 Pollard 2 1 1 0 0 14 Witten 2 0 2 0 0 12 Austin 1 1 0 0 0 6 Lewis 1 0 0 1 0 6 D. Smith 1 0 1 0 0 6 TEAM 34 12 21 1 32/32 19/26 0 295 OPPONENTS 22 10 12 0 19/20 19/22 0 210 2-Pt Conv: Pollard, TM 1-2, OPP 1-2 SACKS: Quinn 9.5, Bennett LG 5.5, Bennett TM 3, Lawrence 4.5, M. Collins 4, J. Smith 2.5, Armstrong 2, Crawford 1, Lewis 1, Vander Esch 0.5, TM 28, OPP 12 FUM/LOST: Cobb 2/1, Elliott 2/2, Prescott 2/0, Austin 1/0, Jarwin 1/0, Witten 1/1 * PASSING Att Cmp Yds Cmp% Yds/Att TD TD% Int Int% Long Sack/Lost Rating Prescott 398 266 3433 66.8 8.63 21 5.3 10 2.5 62 12/ 94 100.8 Cobb 1 0 0 0.0 0.00 0 0.0 0 0.0 --- 0/ 0 39.6 TEAM 399 266 3433 66.7 8.60 21 5.3 10 2.5 62 12/ 94 100.6 OPPONENTS 384 244 2562 63.5 6.67 12 3.1 4 1.0 92t 28/ 212 88.9
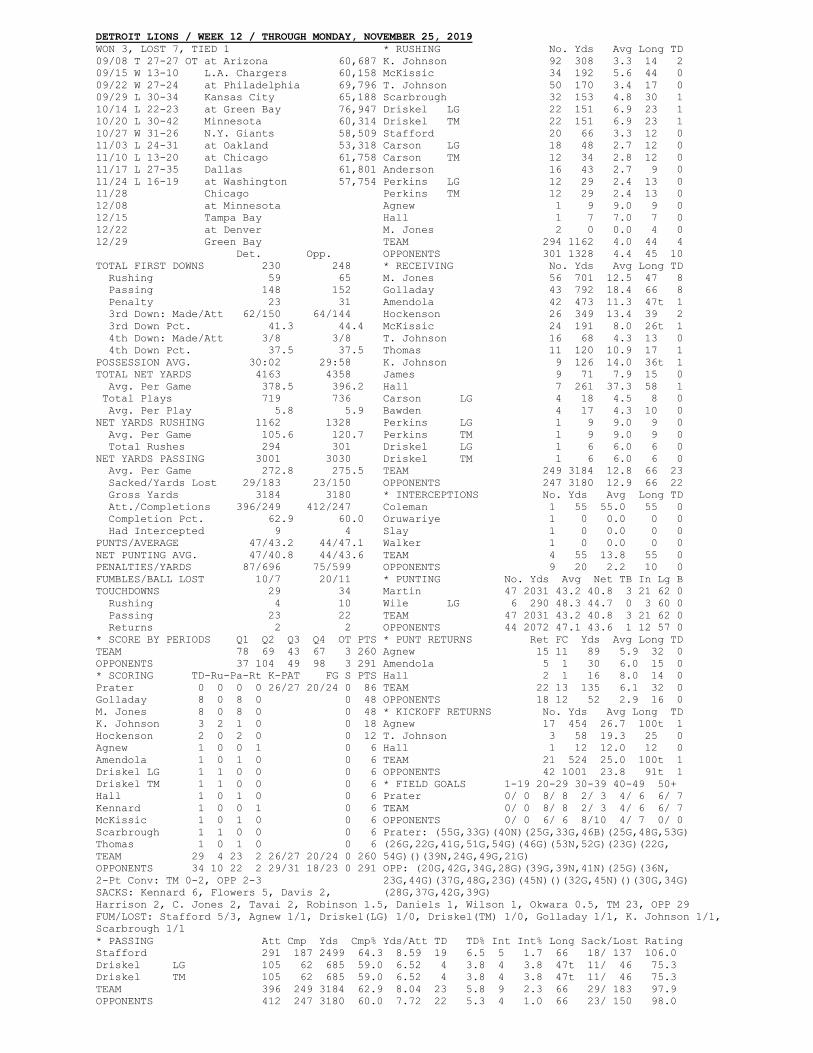
DETROIT LIONS / WEEK 12 / THROUGH MONDAY, NOVEMBER 25, 2019 WON 3, LOST 7, TIED 1 * RUSHING No. Yds Avg Long TD 09/08 T 27-27 OT at Arizona 60,687 K. Johnson 92 308 3.3 14 2 09/15 W 13-10 L.A. Chargers 60,158 McKissic 34 192 5.6 44 0 09/22 W 27-24 at Philadelphia 69,796 T. Johnson 50 170 3.4 17 0 09/29 L 30-34 Kansas City 65,188 Scarbrough 32 153 4.8 30 1 10/14 L 22-23 at Green Bay 76,947 Driskel LG 22 151 6.9 23 1 10/20 L 30-42 Minnesota 60,314 Driskel TM 22 151 6.9 23 1 10/27 W 31-26 N.Y. Giants 58,509 Stafford 20 66 3.3 12 0 11/03 L 24-31 at Oakland 53,318 Carson LG 18 48 2.7 12 0 11/10 L 13-20 at Chicago 61,758 Carson TM 12 34 2.8 12 0 11/17 L 27-35 Dallas 61,801 Anderson 16 43 2.7 9 0 11/24 L 16-19 at Washington 57,754 Perkins LG 12 29 2.4 13 0 11/28 Chicago Perkins TM 12 29 2.4 13 0 12/08 at Minnesota Agnew 1 9 9.0 9 0 12/15 Tampa Bay Hall 1 7 7.0 7 0 12/22 at Denver M. Jones 2 0 0.0 4 0 12/29 Green Bay TEAM 294 1162 4.0 44 4 Det. Opp. OPPONENTS 301 1328 4.4 45 10 TOTAL FIRST DOWNS 230 248 * RECEIVING No. Yds Avg Long TD Rushing 59 65 M. Jones 56 701 12.5 47 8 Passing 148 152 Golladay 43 792 18.4 66 8 Penalty 23 31 Amendola 42 473 11.3 47t 1 3rd Down: Made/Att 62/150 64/144 Hockenson 26 349 13.4 39 2 3rd Down Pct. 41.3 44.4 McKissic 24 191 8.0 26t 1 4th Down: Made/Att 3/8 3/8 T. Johnson 16 68 4.3 13 0 4th Down Pct. 37.5 37.5 Thomas 11 120 10.9 17 1 POSSESSION AVG. 30:02 29:58 K. Johnson 9 126 14.0 36t 1 TOTAL NET YARDS 4163 4358 James 9 71 7.9 15 0 Avg. Per Game 378.5 396.2 Hall 7 261 37.3 58 1 Total Plays 719 736 Carson LG 4 18 4.5 8 0 Avg. Per Play 5.8 5.9 Bawden 4 17 4.3 10 0 NET YARDS RUSHING 1162 1328 Perkins LG 1 9 9.0 9 0 Avg. Per Game 105.6 120.7 Perkins TM 1 9 9.0 9 0 Total Rushes 294 301 Driskel LG 1 6 6.0 6 0 NET YARDS PASSING 3001 3030 Driskel TM 1 6 6.0 6 0 Avg. Per Game 272.8 275.5 TEAM 249 3184 12.8 66 23 Sacked/Yards Lost 29/183 23/150 OPPONENTS 247 3180 12.9 66 22 Gross Yards 3184 3180 * INTERCEPTIONS No. Yds Avg Long TD Att./Completions 396/249 412/247 Coleman 1 55 55.0 55 0 Completion Pct. 62.9 60.0 Oruwariye 1 0 0.0 0 0 Had Intercepted 9 4 Slay 1 0 0.0 0 0 PUNTS/AVERAGE 47/43.2 44/47.1 Walker 1 0 0.0 0 0 NET PUNTING AVG. 47/40.8 44/43.6 TEAM 4 55 13.8 55 0 PENALTIES/YARDS 87/696 75/599 OPPONENTS 9 20 2.2 10 0 FUMBLES/BALL LOST 10/7 20/11 * PUNTING No. Yds Avg Net TB In Lg B TOUCHDOWNS 29 34 Martin 47 2031 43.2 40.8 3 21 62 0 Rushing 4 10 Wile LG 6 290 48.3 44.7 0 3 60 0 Passing 23 22 TEAM 47 2031 43.2 40.8 3 21 62 0 Returns 2 2 OPPONENTS 44 2072 47.1 43.6 1 12 57 0 * SCORE BY PERIODS Q1 Q2 Q3 Q4 OT PTS * PUNT RETURNS Ret FC Yds Avg Long TD TEAM 78 69 43 67 3 260 Agnew 15 11 89 5.9 32 0 OPPONENTS 37 104 49 98 3 291 Amendola 5 1 30 6.0 15 0 * SCORING TD-Ru-Pa-Rt K-PAT FG S PTS Hall 2 1 16 8.0 14 0 Prater 0 0 0 0 26/27 20/24 0 86 TEAM 22 13 135 6.1 32 0 Golladay 8 0 8 0 0 48 OPPONENTS 18 12 52 2.9 16 0 M. Jones 8 0 8 0 0 48 * KICKOFF RETURNS No. Yds Avg Long TD K. Johnson 3 2 1 0 0 18 Agnew 17 454 26.7 100t 1 Hockenson 2 0 2 0 0 12 T. Johnson 3 58 19.3 25 0 Agnew 1 0 0 1 0 6 Hall 1 12 12.0 12 0 Amendola 1 0 1 0 0 6 TEAM 21 524 25.0 100t 1 Driskel LG 1 1 0 0 0 6 OPPONENTS 42 1001 23.8 91t 1 Driskel TM 1 1 0 0 0 6 * FIELD GOALS 1-19 20-29 30-39 40-49 50+ Hall 1 0 1 0 0 6 Prater 0/ 0 8/ 8 2/ 3 4/ 6 6/ 7 Kennard 1 0 0 1 0 6 TEAM 0/ 0 8/ 8 2/ 3 4/ 6 6/ 7 McKissic 1 0 1 0 0 6 OPPONENTS 0/ 0 6/ 6 8/10 4/ 7 0/ 0 Scarbrough 1 1 0 0 0 6 Prater: (55G,33G)(40N)(25G,33G,46B)(25G,48G,53G) Thomas 1 0 1 0 0 6 (26G,22G,41G,51G,54G)(46G)(53N,52G)(23G)(22G, TEAM 29 4 23 2 26/27 20/24 0 260 54G)()(39N,24G,49G,21G) OPPONENTS 34 10 22 2 29/31 18/23 0 291 OPP: (20G,42G,34G,28G)(39G,39N,41N)(25G)(36N, 2-Pt Conv: TM 0-2, OPP 2-3 23G,44G)(37G,48G,23G)(45N)()(32G,45N)()(30G,34G) SACKS: Kennard 6, Flowers 5, Davis 2, (28G,37G,42G,39G) Harrison 2, C. Jones 2, Tavai 2, Robinson 1.5, Daniels 1, Wilson 1, Okwara 0.5, TM 23, OPP 29 FUM/LOST: Stafford 5/3, Agnew 1/1, Driskel(LG) 1/0, Driskel(TM) 1/0, Golladay 1/1, K. Johnson 1/1, Scarbrough 1/1 * PASSING Att Cmp Yds Cmp% Yds/Att TD TD% Int Int% Long Sack/Lost Rating Stafford 291 187 2499 64.3 8.59 19 6.5 5 1.7 66 18/ 137 106.0 Driskel LG 105 62 685 59.0 6.52 4 3.8 4 3.8 47t 11/ 46 75.3 Driskel TM 105 62 685 59.0 6.52 4 3.8 4 3.8 47t 11/ 46 75.3 TEAM 396 249 3184 62.9 8.04 23 5.8 9 2.3 66 29/ 183 97.9 OPPONENTS 412 247 3180 60.0 7.72 22 5.3 4 1.0 66 23/ 150 98.0
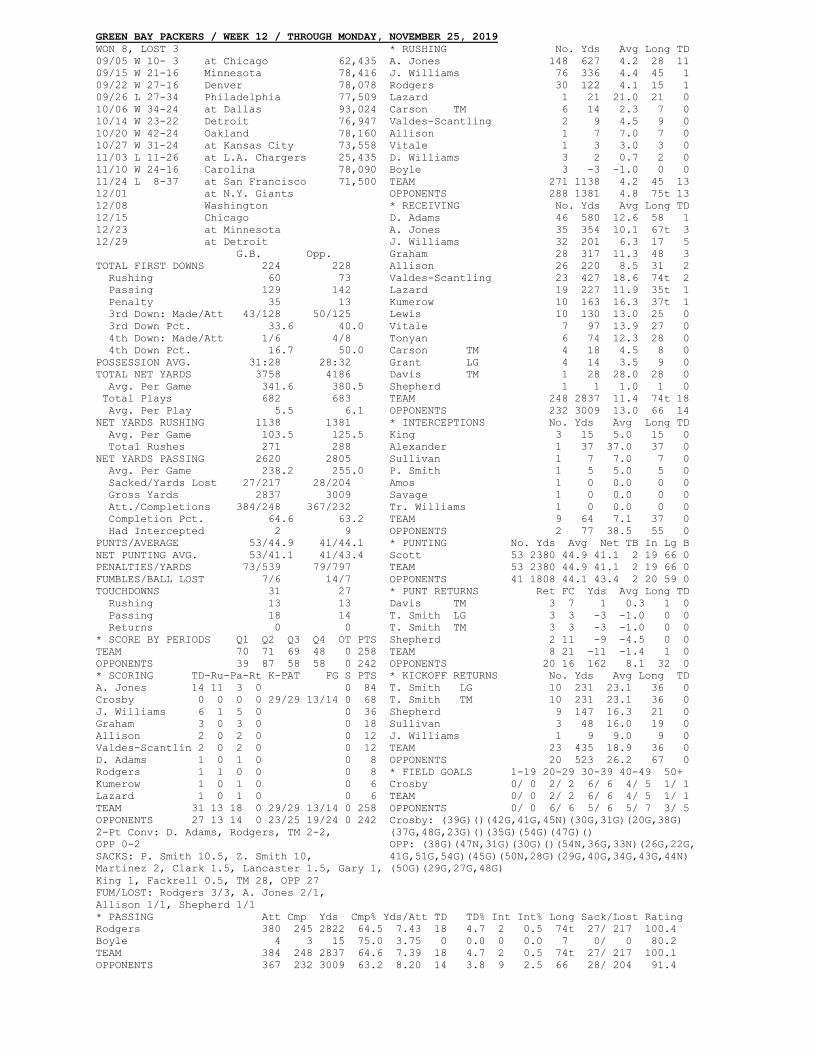
GREEN BAY PACKERS / WEEK 12 / THROUGH MONDAY, NOVEMBER 25, 2019 WON 8, LOST 3 * RUSHING No. Yds Avg Long TD 09/05 W 10- 3 at Chicago 62,435 A. Jones 148 627 4.2 28 11 09/15 W 21-16 Minnesota 78,416 J. Williams 76 336 4.4 45 1 09/22 W 27-16 Denver 78,078 Rodgers 30 122 4.1 15 1 09/26 L 27-34 Philadelphia 77,509 Lazard 1 21 21.0 21 0 10/06 W 34-24 at Dallas 93,024 Carson TM 6 14 2.3 7 0 10/14 W 23-22 Detroit 76,947 Valdes-Scantling 2 9 4.5 9 0 10/20 W 42-24 Oakland 78,160 Allison 1 7 7.0 7 0 10/27 W 31-24 at Kansas City 73,558 Vitale 1 3 3.0 3 0 11/03 L 11-26 at L.A. Chargers 25,435 D. Williams 3 2 0.7 2 0 11/10 W 24-16 Carolina 78,090 Boyle 3 -3 -1.0 0 0 11/24 L 8-37 at San Francisco 71,500 TEAM 271 1138 4.2 45 13 12/01 at N.Y. Giants OPPONENTS 288 1381 4.8 75t 13 12/08 Washington * RECEIVING No. Yds Avg Long TD 12/15 Chicago D. Adams 46 580 12.6 58 1 12/23 at Minnesota A. Jones 35 354 10.1 67t 3 12/29 at Detroit J. Williams 32 201 6.3 17 5 G.B. Opp. Graham 28 317 11.3 48 3 TOTAL FIRST DOWNS 224 228 Allison 26 220 8.5 31 2 Rushing 60 73 Valdes-Scantling 23 427 18.6 74t 2 Passing 129 142 Lazard 19 227 11.9 35t 1 Penalty 35 13 Kumerow 10 163 16.3 37t 1 3rd Down: Made/Att 43/128 50/125 Lewis 10 130 13.0 25 0 3rd Down Pct. 33.6 40.0 Vitale 7 97 13.9 27 0 4th Down: Made/Att 1/6 4/8 Tonyan 6 74 12.3 28 0 4th Down Pct. 16.7 50.0 Carson TM 4 18 4.5 8 0 POSSESSION AVG. 31:28 28:32 Grant LG 4 14 3.5 9 0 TOTAL NET YARDS 3758 4186 Davis TM 1 28 28.0 28 0 Avg. Per Game 341.6 380.5 Shepherd 1 1 1.0 1 0 Total Plays 682 683 TEAM 248 2837 11.4 74t 18 Avg. Per Play 5.5 6.1 OPPONENTS 232 3009 13.0 66 14 NET YARDS RUSHING 1138 1381 * INTERCEPTIONS No. Yds Avg Long TD Avg. Per Game 103.5 125.5 King 3 15 5.0 15 0 Total Rushes 271 288 Alexander 1 37 37.0 37 0 NET YARDS PASSING 2620 2805 Sullivan 1 7 7.0 7 0 Avg. Per Game 238.2 255.0 P. Smith 1 5 5.0 5 0 Sacked/Yards Lost 27/217 28/204 Amos 1 0 0.0 0 0 Gross Yards 2837 3009 Savage 1 0 0.0 0 0 Att./Completions 384/248 367/232 Tr. Williams 1 0 0.0 0 0 Completion Pct. 64.6 63.2 TEAM 9 64 7.1 37 0 Had Intercepted 2 9 OPPONENTS 2 77 38.5 55 0 PUNTS/AVERAGE 53/44.9 41/44.1 * PUNTING No. Yds Avg Net TB In Lg B NET PUNTING AVG. 53/41.1 41/43.4 Scott 53 2380 44.9 41.1 2 19 66 0 PENALTIES/YARDS 73/539 79/797 TEAM 53 2380 44.9 41.1 2 19 66 0 FUMBLES/BALL LOST 7/6 14/7 OPPONENTS 41 1808 44.1 43.4 2 20 59 0 TOUCHDOWNS 31 27 * PUNT RETURNS Ret FC Yds Avg Long TD Rushing 13 13 Davis TM 3 7 1 0.3 1 0 Passing 18 14 T. Smith LG 3 3 -3 -1.0 0 0 Returns 0 0 T. Smith TM 3 3 -3 -1.0 0 0 * SCORE BY PERIODS Q1 Q2 Q3 Q4 OT PTS Shepherd 2 11 -9 -4.5 0 0 TEAM 70 71 69 48 0 258 TEAM 8 21 -11 -1.4 1 0 OPPONENTS 39 87 58 58 0 242 OPPONENTS 20 16 162 8.1 32 0 * SCORING TD-Ru-Pa-Rt K-PAT FG S PTS * KICKOFF RETURNS No. Yds Avg Long TD A. Jones 14 11 3 0 0 84 T. Smith LG 10 231 23.1 36 0 Crosby 0 0 0 0 29/29 13/14 0 68 T. Smith TM 10 231 23.1 36 0 J. Williams 6 1 5 0 0 36 Shepherd 9 147 16.3 21 0 Graham 3 0 3 0 0 18 Sullivan 3 48 16.0 19 0 Allison 2 0 2 0 0 12 J. Williams 1 9 9.0 9 0 Valdes-Scantlin 2 0 2 0 0 12 TEAM 23 435 18.9 36 0 D. Adams 1 0 1 0 0 8 OPPONENTS 20 523 26.2 67 0 Rodgers 1 1 0 0 0 8 * FIELD GOALS 1-19 20-29 30-39 40-49 50+ Kumerow 1 0 1 0 0 6 Crosby 0/ 0 2/ 2 6/ 6 4/ 5 1/ 1 Lazard 1 0 1 0 0 6 TEAM 0/ 0 2/ 2 6/ 6 4/ 5 1/ 1 TEAM 31 13 18 0 29/29 13/14 0 258 OPPONENTS 0/ 0 6/ 6 5/ 6 5/ 7 3/ 5 OPPONENTS 27 13 14 0 23/25 19/24 0 242 Crosby: (39G)()(42G,41G,45N)(30G,31G)(20G,38G) 2-Pt Conv: D. Adams, Rodgers, TM 2-2, (37G,48G,23G)()(35G)(54G)(47G)() OPP 0-2 OPP: (38G)(47N,31G)(30G)()(54N,36G,33N)(26G,22G, SACKS: P. Smith 10.5, Z. Smith 10, 41G,51G,54G)(45G)(50N,28G)(29G,40G,34G,43G,44N) Martinez 2, Clark 1.5, Lancaster 1.5, Gary 1, (50G)(29G,27G,48G) King 1, Fackrell 0.5, TM 28, OPP 27 FUM/LOST: Rodgers 3/3, A. Jones 2/1, Allison 1/1, Shepherd 1/1 * PASSING Att Cmp Yds Cmp% Yds/Att TD TD% Int Int% Long Sack/Lost Rating Rodgers 380 245 2822 64.5 7.43 18 4.7 2 0.5 74t 27/ 217 100.4 Boyle 4 3 15 75.0 3.75 0 0.0 0 0.0 7 0/ 0 80.2 TEAM 384 248 2837 64.6 7.39 18 4.7 2 0.5 74t 27/ 217 100.1 OPPONENTS 367 232 3009 63.2 8.20 14 3.8 9 2.5 66 28/ 204 91.4
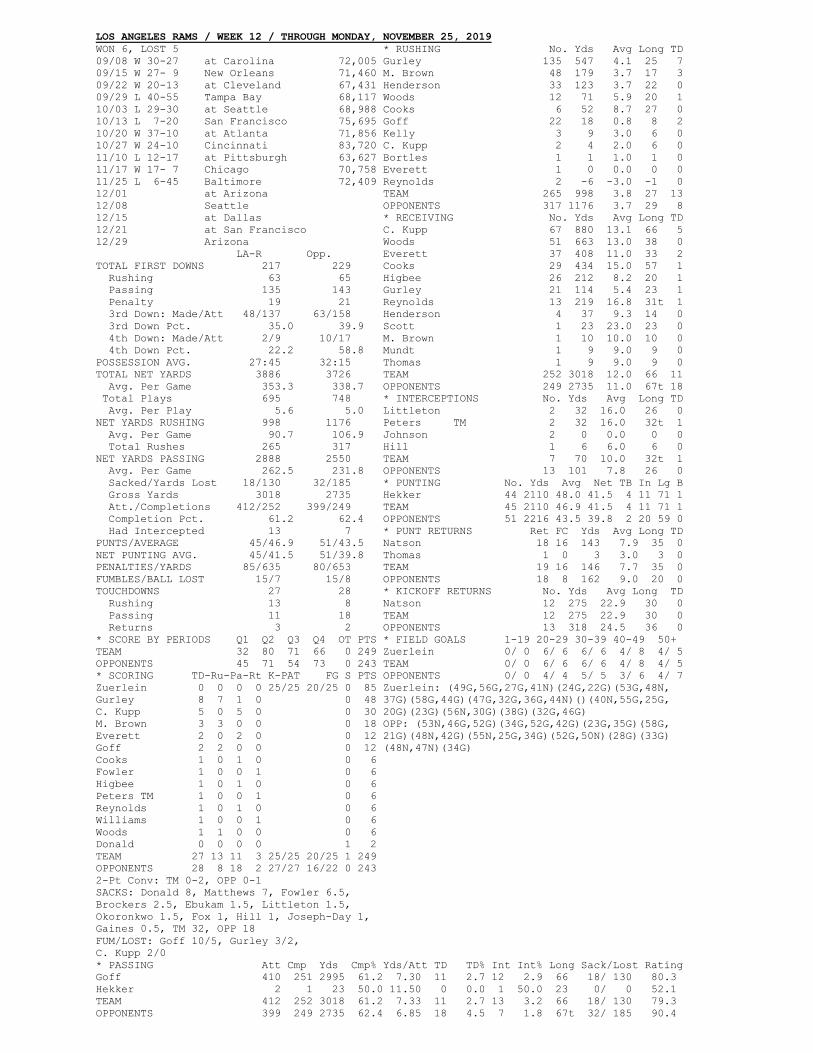
LOS ANGELES RAMS / WEEK 12 / THROUGH MONDAY, NOVEMBER 25, 2019 WON 6, LOST 5 * RUSHING No. Yds Avg Long TD 09/08 W 30-27 at Carolina 72,005 Gurley 135 547 4.1 25 7 09/15 W 27- 9 New Orleans 71,460 M. Brown 48 179 3.7 17 3 09/22 W 20-13 at Cleveland 67,431 Henderson 33 123 3.7 22 0 09/29 L 40-55 Tampa Bay 68,117 Woods 12 71 5.9 20 1 10/03 L 29-30 at Seattle 68,988 Cooks 6 52 8.7 27 0 10/13 L 7-20 San Francisco 75,695 Goff 22 18 0.8 8 2 10/20 W 37-10 at Atlanta 71,856 Kelly 3 9 3.0 6 0 10/27 W 24-10 Cincinnati 83,720 C. Kupp 2 4 2.0 6 0 11/10 L 12-17 at Pittsburgh 63,627 Bortles 1 1 1.0 1 0 11/17 W 17- 7 Chicago 70,758 Everett 1 0 0.0 0 0 11/25 L 6-45 Baltimore 72,409 Reynolds 2 -6 -3.0 -1 0 12/01 at Arizona TEAM 265 998 3.8 27 13 12/08 Seattle OPPONENTS 317 1176 3.7 29 8 12/15 at Dallas * RECEIVING No. Yds Avg Long TD 12/21 at San Francisco C. Kupp 67 880 13.1 66 5 12/29 Arizona Woods 51 663 13.0 38 0 LA-R Opp. Everett 37 408 11.0 33 2 TOTAL FIRST DOWNS 217 229 Cooks 29 434 15.0 57 1 Rushing 63 65 Higbee 26 212 8.2 20 1 Passing 135 143 Gurley 21 114 5.4 23 1 Penalty 19 21 Reynolds 13 219 16.8 31t 1 3rd Down: Made/Att 48/137 63/158 Henderson 4 37 9.3 14 0 3rd Down Pct. 35.0 39.9 Scott 1 23 23.0 23 0 4th Down: Made/Att 2/9 10/17 M. Brown 1 10 10.0 10 0 4th Down Pct. 22.2 58.8 Mundt 1 9 9.0 9 0 POSSESSION AVG. 27:45 32:15 Thomas 1 9 9.0 9 0 TOTAL NET YARDS 3886 3726 TEAM 252 3018 12.0 66 11 Avg. Per Game 353.3 338.7 OPPONENTS 249 2735 11.0 67t 18 Total Plays 695 748 * INTERCEPTIONS No. Yds Avg Long TD Avg. Per Play 5.6 5.0 Littleton 2 32 16.0 26 0 NET YARDS RUSHING 998 1176 Peters TM 2 32 16.0 32t 1 Avg. Per Game 90.7 106.9 Johnson 2 0 0.0 0 0 Total Rushes 265 317 Hill 1 6 6.0 6 0 NET YARDS PASSING 2888 2550 TEAM 7 70 10.0 32t 1 Avg. Per Game 262.5 231.8 OPPONENTS 13 101 7.8 26 0 Sacked/Yards Lost 18/130 32/185 * PUNTING No. Yds Avg Net TB In Lg B Gross Yards 3018 2735 Hekker 44 2110 48.0 41.5 4 11 71 1 Att./Completions 412/252 399/249 TEAM 45 2110 46.9 41.5 4 11 71 1 Completion Pct. 61.2 62.4 OPPONENTS 51 2216 43.5 39.8 2 20 59 0 Had Intercepted 13 7 * PUNT RETURNS Ret FC Yds Avg Long TD PUNTS/AVERAGE 45/46.9 51/43.5 Natson 18 16 143 7.9 35 0 NET PUNTING AVG. 45/41.5 51/39.8 Thomas 1 0 3 3.0 3 0 PENALTIES/YARDS 85/635 80/653 TEAM 19 16 146 7.7 35 0 FUMBLES/BALL LOST 15/7 15/8 OPPONENTS 18 8 162 9.0 20 0 TOUCHDOWNS 27 28 * KICKOFF RETURNS No. Yds Avg Long TD Rushing 13 8 Natson 12 275 22.9 30 0 Passing 11 18 TEAM 12 275 22.9 30 0 Returns 3 2 OPPONENTS 13 318 24.5 36 0 * SCORE BY PERIODS Q1 Q2 Q3 Q4 OT PTS * FIELD GOALS 1-19 20-29 30-39 40-49 50+ TEAM 32 80 71 66 0 249 Zuerlein 0/ 0 6/ 6 6/ 6 4/ 8 4/ 5 OPPONENTS 45 71 54 73 0 243 TEAM 0/ 0 6/ 6 6/ 6 4/ 8 4/ 5 * SCORING TD-Ru-Pa-Rt K-PAT FG S PTS OPPONENTS 0/ 0 4/ 4 5/ 5 3/ 6 4/ 7 Zuerlein 0 0 0 0 25/25 20/25 0 85 Zuerlein: (49G,56G,27G,41N)(24G,22G)(53G,48N, Gurley 8 7 1 0 0 48 37G)(58G,44G)(47G,32G,36G,44N)()(40N,55G,25G, C. Kupp 5 0 5 0 0 30 20G)(23G)(56N,30G)(38G)(32G,46G) M. Brown 3 3 0 0 0 18 OPP: (53N,46G,52G)(34G,52G,42G)(23G,35G)(58G, Everett 2 0 2 0 0 12 21G)(48N,42G)(55N,25G,34G)(52G,50N)(28G)(33G) Goff 2 2 0 0 0 12 (48N,47N)(34G) Cooks 1 0 1 0 0 6 Fowler 1 0 0 1 0 6 Higbee 1 0 1 0 0 6 Peters TM 1 0 0 1 0 6 Reynolds 1 0 1 0 0 6 Williams 1 0 0 1 0 6 Woods 1 1 0 0 0 6 Donald 0 0 0 0 1 2 TEAM 27 13 11 3 25/25 20/25 1 249 OPPONENTS 28 8 18 2 27/27 16/22 0 243 2-Pt Conv: TM 0-2, OPP 0-1 SACKS: Donald 8, Matthews 7, Fowler 6.5, Brockers 2.5, Ebukam 1.5, Littleton 1.5, Okoronkwo 1.5, Fox 1, Hill 1, Joseph-Day 1, Gaines 0.5, TM 32, OPP 18 FUM/LOST: Goff 10/5, Gurley 3/2, C. Kupp 2/0 * PASSING Att Cmp Yds Cmp% Yds/Att TD TD% Int Int% Long Sack/Lost Rating Goff 410 251 2995 61.2 7.30 11 2.7 12 2.9 66 18/ 130 80.3 Hekker 2 1 23 50.0 11.50 0 0.0 1 50.0 23 0/ 0 52.1 TEAM 412 252 3018 61.2 7.33 11 2.7 13 3.2 66 18/ 130 79.3 OPPONENTS 399 249 2735 62.4 6.85 18 4.5 7 1.8 67t 32/ 185 90.4
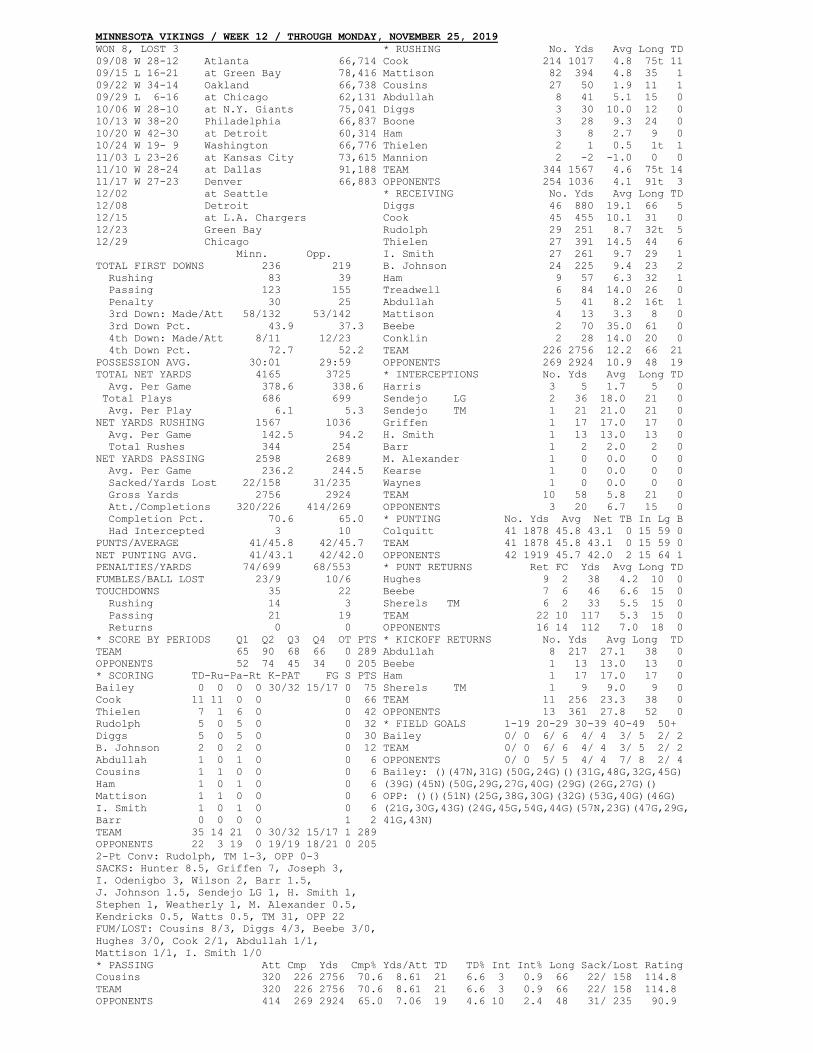
MINNESOTA VIKINGS / WEEK 12 / THROUGH MONDAY, NOVEMBER 25, 2019 WON 8, LOST 3 * RUSHING No. Yds Avg Long TD 09/08 W 28-12 Atlanta 66,714 Cook 214 1017 4.8 75t 11 09/15 L 16-21 at Green Bay 78,416 Mattison 82 394 4.8 35 1 09/22 W 34-14 Oakland 66,738 Cousins 27 50 1.9 11 1 09/29 L 6-16 at Chicago 62,131 Abdullah 8 41 5.1 15 0 10/06 W 28-10 at N.Y. Giants 75,041 Diggs 3 30 10.0 12 0 10/13 W 38-20 Philadelphia 66,837 Boone 3 28 9.3 24 0 10/20 W 42-30 at Detroit 60,314 Ham 3 8 2.7 9 0 10/24 W 19- 9 Washington 66,776 Thielen 2 1 0.5 1t 1 11/03 L 23-26 at Kansas City 73,615 Mannion 2 -2 -1.0 0 0 11/10 W 28-24 at Dallas 91,188 TEAM 344 1567 4.6 75t 14 11/17 W 27-23 Denver 66,883 OPPONENTS 254 1036 4.1 91t 3 12/02 at Seattle * RECEIVING No. Yds Avg Long TD 12/08 Detroit Diggs 46 880 19.1 66 5 12/15 at L.A. Chargers Cook 45 455 10.1 31 0 12/23 Green Bay Rudolph 29 251 8.7 32t 5 12/29 Chicago Thielen 27 391 14.5 44 6 Minn. Opp. I. Smith 27 261 9.7 29 1 TOTAL FIRST DOWNS 236 219 B. Johnson 24 225 9.4 23 2 Rushing 83 39 Ham 9 57 6.3 32 1 Passing 123 155 Treadwell 6 84 14.0 26 0 Penalty 30 25 Abdullah 5 41 8.2 16t 1 3rd Down: Made/Att 58/132 53/142 Mattison 4 13 3.3 8 0 3rd Down Pct. 43.9 37.3 Beebe 2 70 35.0 61 0 4th Down: Made/Att 8/11 12/23 Conklin 2 28 14.0 20 0 4th Down Pct. 72.7 52.2 TEAM 226 2756 12.2 66 21 POSSESSION AVG. 30:01 29:59 OPPONENTS 269 2924 10.9 48 19 TOTAL NET YARDS 4165 3725 * INTERCEPTIONS No. Yds Avg Long TD Avg. Per Game 378.6 338.6 Harris 3 5 1.7 5 0 Total Plays 686 699 Sendejo LG 2 36 18.0 21 0 Avg. Per Play 6.1 5.3 Sendejo TM 1 21 21.0 21 0 NET YARDS RUSHING 1567 1036 Griffen 1 17 17.0 17 0 Avg. Per Game 142.5 94.2 H. Smith 1 13 13.0 13 0 Total Rushes 344 254 Barr 1 2 2.0 2 0 NET YARDS PASSING 2598 2689 M. Alexander 1 0 0.0 0 0 Avg. Per Game 236.2 244.5 Kearse 1 0 0.0 0 0 Sacked/Yards Lost 22/158 31/235 Waynes 1 0 0.0 0 0 Gross Yards 2756 2924 TEAM 10 58 5.8 21 0 Att./Completions 320/226 414/269 OPPONENTS 3 20 6.7 15 0 Completion Pct. 70.6 65.0 * PUNTING No. Yds Avg Net TB In Lg B Had Intercepted 3 10 Colquitt 41 1878 45.8 43.1 0 15 59 0 PUNTS/AVERAGE 41/45.8 42/45.7 TEAM 41 1878 45.8 43.1 0 15 59 0 NET PUNTING AVG. 41/43.1 42/42.0 OPPONENTS 42 1919 45.7 42.0 2 15 64 1 PENALTIES/YARDS 74/699 68/553 * PUNT RETURNS Ret FC Yds Avg Long TD FUMBLES/BALL LOST 23/9 10/6 Hughes 9 2 38 4.2 10 0 TOUCHDOWNS 35 22 Beebe 7 6 46 6.6 15 0 Rushing 14 3 Sherels TM 6 2 33 5.5 15 0 Passing 21 19 TEAM 22 10 117 5.3 15 0 Returns 0 0 OPPONENTS 16 14 112 7.0 18 0 * SCORE BY PERIODS Q1 Q2 Q3 Q4 OT PTS * KICKOFF RETURNS No. Yds Avg Long TD TEAM 65 90 68 66 0 289 Abdullah 8 217 27.1 38 0 OPPONENTS 52 74 45 34 0 205 Beebe 1 13 13.0 13 0 * SCORING TD-Ru-Pa-Rt K-PAT FG S PTS Ham 1 17 17.0 17 0 Bailey 0 0 0 0 30/32 15/17 0 75 Sherels TM 1 9 9.0 9 0 Cook 11 11 0 0 0 66 TEAM 11 256 23.3 38 0 Thielen 7 1 6 0 0 42 OPPONENTS 13 361 27.8 52 0 Rudolph 5 0 5 0 0 32 * FIELD GOALS 1-19 20-29 30-39 40-49 50+ Diggs 5 0 5 0 0 30 Bailey 0/ 0 6/ 6 4/ 4 3/ 5 2/ 2 B. Johnson 2 0 2 0 0 12 TEAM 0/ 0 6/ 6 4/ 4 3/ 5 2/ 2 Abdullah 1 0 1 0 0 6 OPPONENTS 0/ 0 5/ 5 4/ 4 7/ 8 2/ 4 Cousins 1 1 0 0 0 6 Bailey: ()(47N,31G)(50G,24G)()(31G,48G,32G,45G) Ham 1 0 1 0 0 6 (39G)(45N)(50G,29G,27G,40G)(29G)(26G,27G)() Mattison 1 1 0 0 0 6 OPP: ()()(51N)(25G,38G,30G)(32G)(53G,40G)(46G) I. Smith 1 0 1 0 0 6 (21G,30G,43G)(24G,45G,54G,44G)(57N,23G)(47G,29G, Barr 0 0 0 0 1 2 41G,43N) TEAM 35 14 21 0 30/32 15/17 1 289 OPPONENTS 22 3 19 0 19/19 18/21 0 205 2-Pt Conv: Rudolph, TM 1-3, OPP 0-3 SACKS: Hunter 8.5, Griffen 7, Joseph 3, I. Odenigbo 3, Wilson 2, Barr 1.5, J. Johnson 1.5, Sendejo LG 1, H. Smith 1, Stephen 1, Weatherly 1, M. Alexander 0.5, Kendricks 0.5, Watts 0.5, TM 31, OPP 22 FUM/LOST: Cousins 8/3, Diggs 4/3, Beebe 3/0, Hughes 3/0, Cook 2/1, Abdullah 1/1, Mattison 1/1, I. Smith 1/0 * PASSING Att Cmp Yds Cmp% Yds/Att TD TD% Int Int% Long Sack/Lost Rating Cousins 320 226 2756 70.6 8.61 21 6.6 3 0.9 66 22/ 158 114.8 TEAM 320 226 2756 70.6 8.61 21 6.6 3 0.9 66 22/ 158 114.8 OPPONENTS 414 269 2924 65.0 7.06 19 4.6 10 2.4 48 31/ 235 90.9
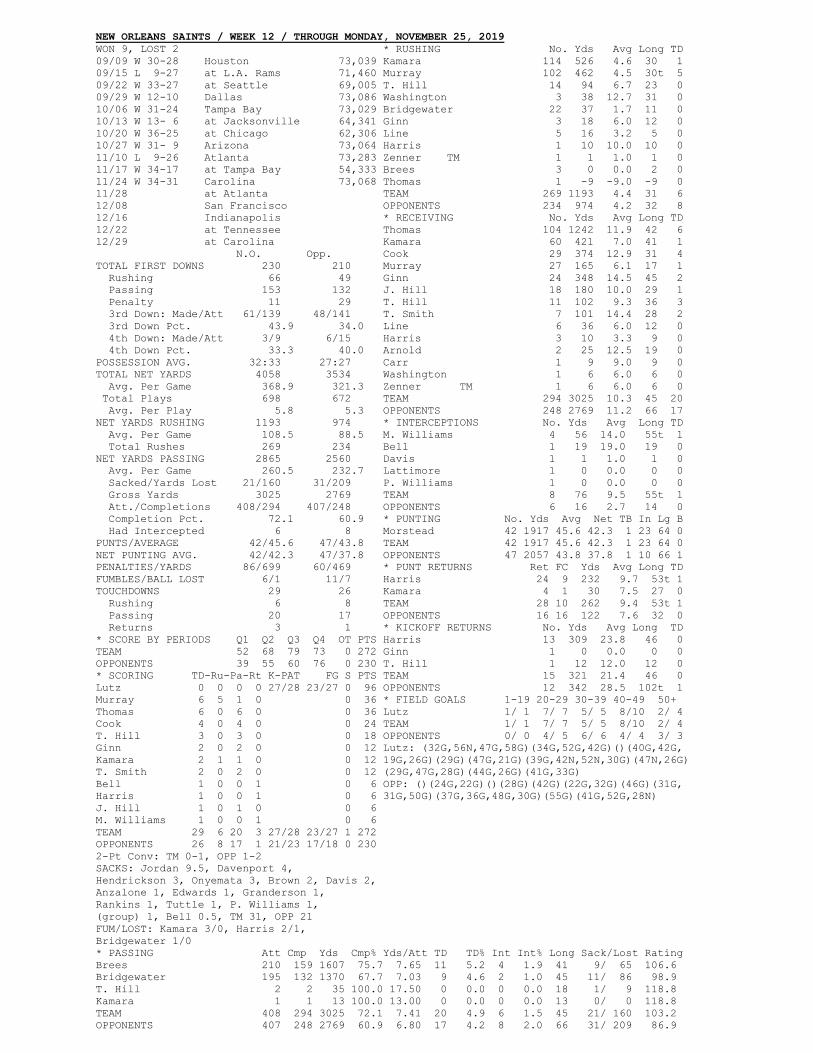
NEW ORLEANS SAINTS / WEEK 12 / THROUGH MONDAY, NOVEMBER 25, 2019 WON 9, LOST 2 * RUSHING No. Yds Avg Long TD 09/09 W 30-28 Houston 73,039 Kamara 114 526 4.6 30 1 09/15 L 9-27 at L.A. Rams 71,460 Murray 102 462 4.5 30t 5 09/22 W 33-27 at Seattle 69,005 T. Hill 14 94 6.7 23 0 09/29 W 12-10 Dallas 73,086 Washington 3 38 12.7 31 0 10/06 W 31-24 Tampa Bay 73,029 Bridgewater 22 37 1.7 11 0 10/13 W 13- 6 at Jacksonville 64,341 Ginn 3 18 6.0 12 0 10/20 W 36-25 at Chicago 62,306 Line 5 16 3.2 5 0 10/27 W 31- 9 Arizona 73,064 Harris 1 10 10.0 10 0 11/10 L 9-26 Atlanta 73,283 Zenner TM 1 1 1.0 1 0 11/17 W 34-17 at Tampa Bay 54,333 Brees 3 0 0.0 2 0 11/24 W 34-31 Carolina 73,068 Thomas 1 -9 -9.0 -9 0 11/28 at Atlanta TEAM 269 1193 4.4 31 6 12/08 San Francisco OPPONENTS 234 974 4.2 32 8 12/16 Indianapolis * RECEIVING No. Yds Avg Long TD 12/22 at Tennessee Thomas 104 1242 11.9 42 6 12/29 at Carolina Kamara 60 421 7.0 41 1 N.O. Opp. Cook 29 374 12.9 31 4 TOTAL FIRST DOWNS 230 210 Murray 27 165 6.1 17 1 Rushing 66 49 Ginn 24 348 14.5 45 2 Passing 153 132 J. Hill 18 180 10.0 29 1 Penalty 11 29 T. Hill 11 102 9.3 36 3 3rd Down: Made/Att 61/139 48/141 T. Smith 7 101 14.4 28 2 3rd Down Pct. 43.9 34.0 Line 6 36 6.0 12 0 4th Down: Made/Att 3/9 6/15 Harris 3 10 3.3 9 0 4th Down Pct. 33.3 40.0 Arnold 2 25 12.5 19 0 POSSESSION AVG. 32:33 27:27 Carr 1 9 9.0 9 0 TOTAL NET YARDS 4058 3534 Washington 1 6 6.0 6 0 Avg. Per Game 368.9 321.3 Zenner TM 1 6 6.0 6 0 Total Plays 698 672 TEAM 294 3025 10.3 45 20 Avg. Per Play 5.8 5.3 OPPONENTS 248 2769 11.2 66 17 NET YARDS RUSHING 1193 974 * INTERCEPTIONS No. Yds Avg Long TD Avg. Per Game 108.5 88.5 M. Williams 4 56 14.0 55t 1 Total Rushes 269 234 Bell 1 19 19.0 19 0 NET YARDS PASSING 2865 2560 Davis 1 1 1.0 1 0 Avg. Per Game 260.5 232.7 Lattimore 1 0 0.0 0 0 Sacked/Yards Lost 21/160 31/209 P. Williams 1 0 0.0 0 0 Gross Yards 3025 2769 TEAM 8 76 9.5 55t 1 Att./Completions 408/294 407/248 OPPONENTS 6 16 2.7 14 0 Completion Pct. 72.1 60.9 * PUNTING No. Yds Avg Net TB In Lg B Had Intercepted 6 8 Morstead 42 1917 45.6 42.3 1 23 64 0 PUNTS/AVERAGE 42/45.6 47/43.8 TEAM 42 1917 45.6 42.3 1 23 64 0 NET PUNTING AVG. 42/42.3 47/37.8 OPPONENTS 47 2057 43.8 37.8 1 10 66 1 PENALTIES/YARDS 86/699 60/469 * PUNT RETURNS Ret FC Yds Avg Long TD FUMBLES/BALL LOST 6/1 11/7 Harris 24 9 232 9.7 53t 1 TOUCHDOWNS 29 26 Kamara 4 1 30 7.5 27 0 Rushing 6 8 TEAM 28 10 262 9.4 53t 1 Passing 20 17 OPPONENTS 16 16 122 7.6 32 0 Returns 3 1 * KICKOFF RETURNS No. Yds Avg Long TD * SCORE BY PERIODS Q1 Q2 Q3 Q4 OT PTS Harris 13 309 23.8 46 0 TEAM 52 68 79 73 0 272 Ginn 1 0 0.0 0 0 OPPONENTS 39 55 60 76 0 230 T. Hill 1 12 12.0 12 0 * SCORING TD-Ru-Pa-Rt K-PAT FG S PTS TEAM 15 321 21.4 46 0 Lutz 0 0 0 0 27/28 23/27 0 96 OPPONENTS 12 342 28.5 102t 1 Murray 6 5 1 0 0 36 * FIELD GOALS 1-19 20-29 30-39 40-49 50+ Thomas 6 0 6 0 0 36 Lutz 1/ 1 7/ 7 5/ 5 8/10 2/ 4 Cook 4 0 4 0 0 24 TEAM 1/ 1 7/ 7 5/ 5 8/10 2/ 4 T. Hill 3 0 3 0 0 18 OPPONENTS 0/ 0 4/ 5 6/ 6 4/ 4 3/ 3 Ginn 2 0 2 0 0 12 Lutz: (32G,56N,47G,58G)(34G,52G,42G)()(40G,42G, Kamara 2 1 1 0 0 12 19G,26G)(29G)(47G,21G)(39G,42N,52N,30G)(47N,26G) T. Smith 2 0 2 0 0 12 (29G,47G,28G)(44G,26G)(41G,33G) Bell 1 0 0 1 0 6 OPP: ()(24G,22G)()(28G)(42G)(22G,32G)(46G)(31G, Harris 1 0 0 1 0 6 31G,50G)(37G,36G,48G,30G)(55G)(41G,52G,28N) J. Hill 1 0 1 0 0 6 M. Williams 1 0 0 1 0 6 TEAM 29 6 20 3 27/28 23/27 1 272 OPPONENTS 26 8 17 1 21/23 17/18 0 230 2-Pt Conv: TM 0-1, OPP 1-2 SACKS: Jordan 9.5, Davenport 4, Hendrickson 3, Onyemata 3, Brown 2, Davis 2, Anzalone 1, Edwards 1, Granderson 1, Rankins 1, Tuttle 1, P. Williams 1, (group) 1, Bell 0.5, TM 31, OPP 21 FUM/LOST: Kamara 3/0, Harris 2/1, Bridgewater 1/0 * PASSING Att Cmp Yds Cmp% Yds/Att TD TD% Int Int% Long Sack/Lost Rating Brees 210 159 1607 75.7 7.65 11 5.2 4 1.9 41 9/ 65 106.6 Bridgewater 195 132 1370 67.7 7.03 9 4.6 2 1.0 45 11/ 86 98.9 T. Hill 2 2 35 100.0 17.50 0 0.0 0 0.0 18 1/ 9 118.8 Kamara 1 1 13 100.0 13.00 0 0.0 0 0.0 13 0/ 0 118.8 TEAM 408 294 3025 72.1 7.41 20 4.9 6 1.5 45 21/ 160 103.2 OPPONENTS 407 248 2769 60.9 6.80 17 4.2 8 2.0 66 31/ 209 86.9
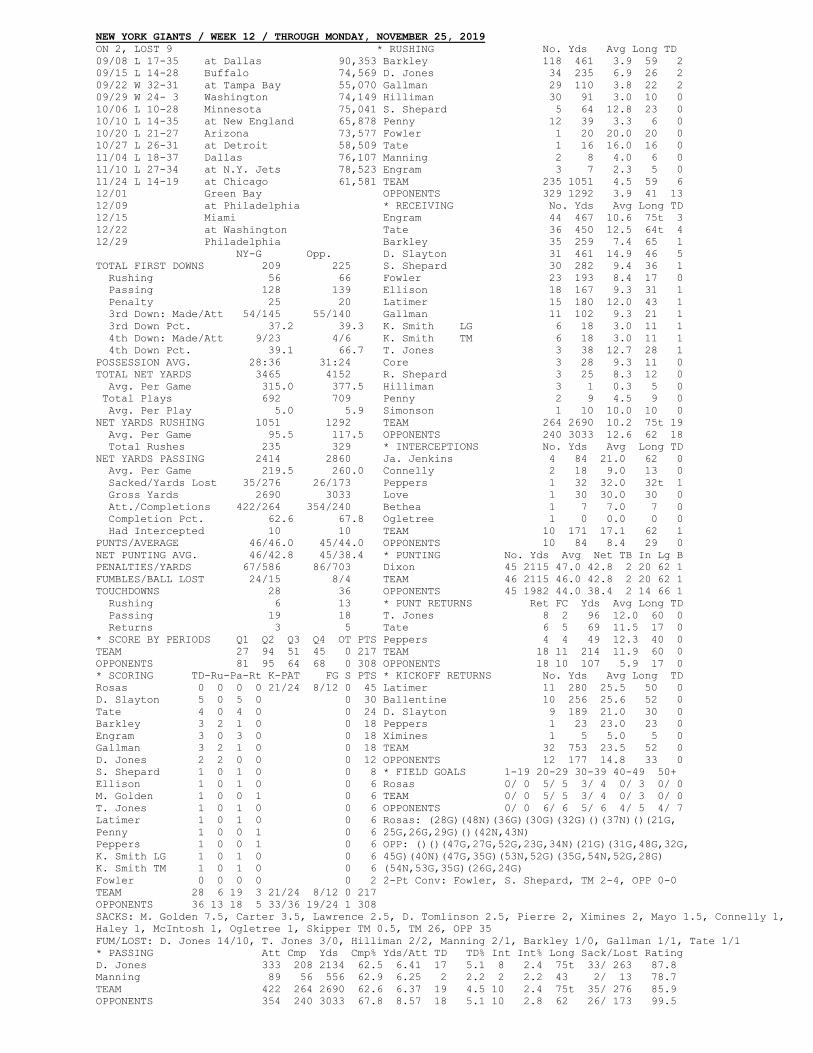
NEW YORK GIANTS / WEEK 12 / THROUGH MONDAY, NOVEMBER 25, 2019 ON 2, LOST 9 * RUSHING No. Yds Avg Long TD 09/08 L 17-35 at Dallas 90,353 Barkley 118 461 3.9 59 2 09/15 L 14-28 Buffalo 74,569 D. Jones 34 235 6.9 26 2 09/22 W 32-31 at Tampa Bay 55,070 Gallman 29 110 3.8 22 2 09/29 W 24- 3 Washington 74,149 Hilliman 30 91 3.0 10 0 10/06 L 10-28 Minnesota 75,041 S. Shepard 5 64 12.8 23 0 10/10 L 14-35 at New England 65,878 Penny 12 39 3.3 6 0 10/20 L 21-27 Arizona 73,577 Fowler 1 20 20.0 20 0 10/27 L 26-31 at Detroit 58,509 Tate 1 16 16.0 16 0 11/04 L 18-37 Dallas 76,107 Manning 2 8 4.0 6 0 11/10 L 27-34 at N.Y. Jets 78,523 Engram 3 7 2.3 5 0 11/24 L 14-19 at Chicago 61,581 TEAM 235 1051 4.5 59 6 12/01 Green Bay OPPONENTS 329 1292 3.9 41 13 12/09 at Philadelphia * RECEIVING No. Yds Avg Long TD 12/15 Miami Engram 44 467 10.6 75t 3 12/22 at Washington Tate 36 450 12.5 64t 4 12/29 Philadelphia Barkley 35 259 7.4 65 1 NY-G Opp. D. Slayton 31 461 14.9 46 5 TOTAL FIRST DOWNS 209 225 S. Shepard 30 282 9.4 36 1 Rushing 56 66 Fowler 23 193 8.4 17 0 Passing 128 139 Ellison 18 167 9.3 31 1 Penalty 25 20 Latimer 15 180 12.0 43 1 3rd Down: Made/Att 54/145 55/140 Gallman 11 102 9.3 21 1 3rd Down Pct. 37.2 39.3 K. Smith LG 6 18 3.0 11 1 4th Down: Made/Att 9/23 4/6 K. Smith TM 6 18 3.0 11 1 4th Down Pct. 39.1 66.7 T. Jones 3 38 12.7 28 1 POSSESSION AVG. 28:36 31:24 Core 3 28 9.3 11 0 TOTAL NET YARDS 3465 4152 R. Shepard 3 25 8.3 12 0 Avg. Per Game 315.0 377.5 Hilliman 3 1 0.3 5 0 Total Plays 692 709 Penny 2 9 4.5 9 0 Avg. Per Play 5.0 5.9 Simonson 1 10 10.0 10 0 NET YARDS RUSHING 1051 1292 TEAM 264 2690 10.2 75t 19 Avg. Per Game 95.5 117.5 OPPONENTS 240 3033 12.6 62 18 Total Rushes 235 329 * INTERCEPTIONS No. Yds Avg Long TD NET YARDS PASSING 2414 2860 Ja. Jenkins 4 84 21.0 62 0 Avg. Per Game 219.5 260.0 Connelly 2 18 9.0 13 0 Sacked/Yards Lost 35/276 26/173 Peppers 1 32 32.0 32t 1 Gross Yards 2690 3033 Love 1 30 30.0 30 0 Att./Completions 422/264 354/240 Bethea 1 7 7.0 7 0 Completion Pct. 62.6 67.8 Ogletree 1 0 0.0 0 0 Had Intercepted 10 10 TEAM 10 171 17.1 62 1 PUNTS/AVERAGE 46/46.0 45/44.0 OPPONENTS 10 84 8.4 29 0 NET PUNTING AVG. 46/42.8 45/38.4 * PUNTING No. Yds Avg Net TB In Lg B PENALTIES/YARDS 67/586 86/703 Dixon 45 2115 47.0 42.8 2 20 62 1 FUMBLES/BALL LOST 24/15 8/4 TEAM 46 2115 46.0 42.8 2 20 62 1 TOUCHDOWNS 28 36 OPPONENTS 45 1982 44.0 38.4 2 14 66 1 Rushing 6 13 * PUNT RETURNS Ret FC Yds Avg Long TD Passing 19 18 T. Jones 8 2 96 12.0 60 0 Returns 3 5 Tate 6 5 69 11.5 17 0 * SCORE BY PERIODS Q1 Q2 Q3 Q4 OT PTS Peppers 4 4 49 12.3 40 0 TEAM 27 94 51 45 0 217 TEAM 18 11 214 11.9 60 0 OPPONENTS 81 95 64 68 0 308 OPPONENTS 18 10 107 5.9 17 0 * SCORING TD-Ru-Pa-Rt K-PAT FG S PTS * KICKOFF RETURNS No. Yds Avg Long TD Rosas 0 0 0 0 21/24 8/12 0 45 Latimer 11 280 25.5 50 0 D. Slayton 5 0 5 0 0 30 Ballentine 10 256 25.6 52 0 Tate 4 0 4 0 0 24 D. Slayton 9 189 21.0 30 0 Barkley 3 2 1 0 0 18 Peppers 1 23 23.0 23 0 Engram 3 0 3 0 0 18 Ximines 1 5 5.0 5 0 Gallman 3 2 1 0 0 18 TEAM 32 753 23.5 52 0 D. Jones 2 2 0 0 0 12 OPPONENTS 12 177 14.8 33 0 S. Shepard 1 0 1 0 0 8 * FIELD GOALS 1-19 20-29 30-39 40-49 50+ Ellison 1 0 1 0 0 6 Rosas 0/ 0 5/ 5 3/ 4 0/ 3 0/ 0 M. Golden 1 0 0 1 0 6 TEAM 0/ 0 5/ 5 3/ 4 0/ 3 0/ 0 T. Jones 1 0 1 0 0 6 OPPONENTS 0/ 0 6/ 6 5/ 6 4/ 5 4/ 7 Latimer 1 0 1 0 0 6 Rosas: (28G)(48N)(36G)(30G)(32G)()(37N)()(21G, Penny 1 0 0 1 0 6 25G,26G,29G)()(42N,43N) Peppers 1 0 0 1 0 6 OPP: ()()(47G,27G,52G,23G,34N)(21G)(31G,48G,32G, K. Smith LG 1 0 1 0 0 6 45G)(40N)(47G,35G)(53N,52G)(35G,54N,52G,28G) K. Smith TM 1 0 1 0 0 6 (54N,53G,35G)(26G,24G) Fowler 0 0 0 0 0 2 2-Pt Conv: Fowler, S. Shepard, TM 2-4, OPP 0-0 TEAM 28 6 19 3 21/24 8/12 0 217 OPPONENTS 36 13 18 5 33/36 19/24 1 308 SACKS: M. Golden 7.5, Carter 3.5, Lawrence 2.5, D. Tomlinson 2.5, Pierre 2, Ximines 2, Mayo 1.5, Connelly 1, Haley 1, McIntosh 1, Ogletree 1, Skipper TM 0.5, TM 26, OPP 35 FUM/LOST: D. Jones 14/10, T. Jones 3/0, Hilliman 2/2, Manning 2/1, Barkley 1/0, Gallman 1/1, Tate 1/1 * PASSING Att Cmp Yds Cmp% Yds/Att TD TD% Int Int% Long Sack/Lost Rating D. Jones 333 208 2134 62.5 6.41 17 5.1 8 2.4 75t 33/ 263 87.8 Manning 89 56 556 62.9 6.25 2 2.2 2 2.2 43 2/ 13 78.7 TEAM 422 264 2690 62.6 6.37 19 4.5 10 2.4 75t 35/ 276 85.9 OPPONENTS 354 240 3033 67.8 8.57 18 5.1 10 2.8 62 26/ 173 99.5
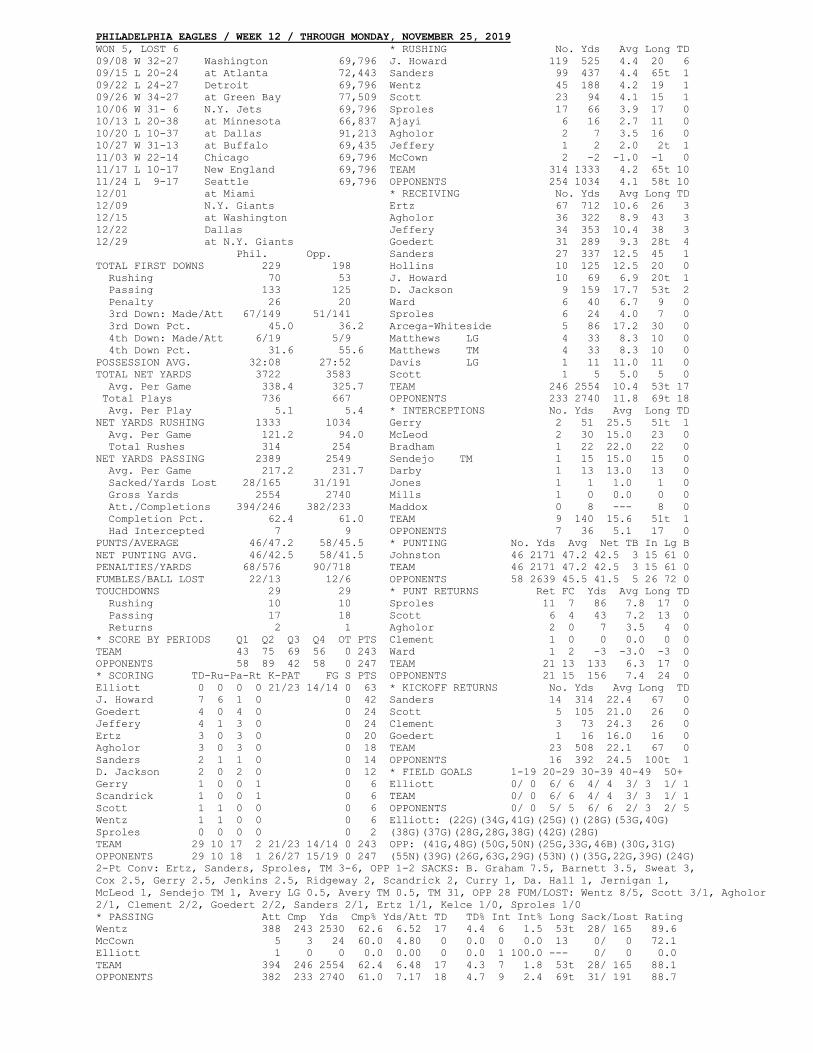
PHILADELPHIA EAGLES / WEEK 12 / THROUGH MONDAY, NOVEMBER 25, 2019 WON 5, LOST 6 * RUSHING No. Yds Avg Long TD 09/08 W 32-27 Washington 69,796 J. Howard 119 525 4.4 20 6 09/15 L 20-24 at Atlanta 72,443 Sanders 99 437 4.4 65t 1 09/22 L 24-27 Detroit 69,796 Wentz 45 188 4.2 19 1 09/26 W 34-27 at Green Bay 77,509 Scott 23 94 4.1 15 1 10/06 W 31- 6 N.Y. Jets 69,796 Sproles 17 66 3.9 17 0 10/13 L 20-38 at Minnesota 66,837 Ajayi 6 16 2.7 11 0 10/20 L 10-37 at Dallas 91,213 Agholor 2 7 3.5 16 0 10/27 W 31-13 at Buffalo 69,435 Jeffery 1 2 2.0 2t 1 11/03 W 22-14 Chicago 69,796 McCown 2 -2 -1.0 -1 0 11/17 L 10-17 New England 69,796 TEAM 314 1333 4.2 65t 10 11/24 L 9-17 Seattle 69,796 OPPONENTS 254 1034 4.1 58t 10 12/01 at Miami * RECEIVING No. Yds Avg Long TD 12/09 N.Y. Giants Ertz 67 712 10.6 26 3 12/15 at Washington Agholor 36 322 8.9 43 3 12/22 Dallas Jeffery 34 353 10.4 38 3 12/29 at N.Y. Giants Goedert 31 289 9.3 28t 4 Phil. Opp. Sanders 27 337 12.5 45 1 TOTAL FIRST DOWNS 229 198 Hollins 10 125 12.5 20 0 Rushing 70 53 J. Howard 10 69 6.9 20t 1 Passing 133 125 D. Jackson 9 159 17.7 53t 2 Penalty 26 20 Ward 6 40 6.7 9 0 3rd Down: Made/Att 67/149 51/141 Sproles 6 24 4.0 7 0 3rd Down Pct. 45.0 36.2 Arcega-Whiteside 5 86 17.2 30 0 4th Down: Made/Att 6/19 5/9 Matthews LG 4 33 8.3 10 0 4th Down Pct. 31.6 55.6 Matthews TM 4 33 8.3 10 0 POSSESSION AVG. 32:08 27:52 Davis LG 1 11 11.0 11 0 TOTAL NET YARDS 3722 3583 Scott 1 5 5.0 5 0 Avg. Per Game 338.4 325.7 TEAM 246 2554 10.4 53t 17 Total Plays 736 667 OPPONENTS 233 2740 11.8 69t 18 Avg. Per Play 5.1 5.4 * INTERCEPTIONS No. Yds Avg Long TD NET YARDS RUSHING 1333 1034 Gerry 2 51 25.5 51t 1 Avg. Per Game 121.2 94.0 McLeod 2 30 15.0 23 0 Total Rushes 314 254 Bradham 1 22 22.0 22 0 NET YARDS PASSING 2389 2549 Sendejo TM 1 15 15.0 15 0 Avg. Per Game 217.2 231.7 Darby 1 13 13.0 13 0 Sacked/Yards Lost 28/165 31/191 Jones 1 1 1.0 1 0 Gross Yards 2554 2740 Mills 1 0 0.0 0 0 Att./Completions 394/246 382/233 Maddox 0 8 --- 8 0 Completion Pct. 62.4 61.0 TEAM 9 140 15.6 51t 1 Had Intercepted 7 9 OPPONENTS 7 36 5.1 17 0 PUNTS/AVERAGE 46/47.2 58/45.5 * PUNTING No. Yds Avg Net TB In Lg B NET PUNTING AVG. 46/42.5 58/41.5 Johnston 46 2171 47.2 42.5 3 15 61 0 PENALTIES/YARDS 68/576 90/718 TEAM 46 2171 47.2 42.5 3 15 61 0 FUMBLES/BALL LOST 22/13 12/6 OPPONENTS 58 2639 45.5 41.5 5 26 72 0 TOUCHDOWNS 29 29 * PUNT RETURNS Ret FC Yds Avg Long TD Rushing 10 10 Sproles 11 7 86 7.8 17 0 Passing 17 18 Scott 6 4 43 7.2 13 0 Returns 2 1 Agholor 2 0 7 3.5 4 0 * SCORE BY PERIODS Q1 Q2 Q3 Q4 OT PTS Clement 1 0 0 0.0 0 0 TEAM 43 75 69 56 0 243 Ward 1 2 -3 -3.0 -3 0 OPPONENTS 58 89 42 58 0 247 TEAM 21 13 133 6.3 17 0 * SCORING TD-Ru-Pa-Rt K-PAT FG S PTS OPPONENTS 21 15 156 7.4 24 0 Elliott 0 0 0 0 21/23 14/14 0 63 * KICKOFF RETURNS No. Yds Avg Long TD J. Howard 7 6 1 0 0 42 Sanders 14 314 22.4 67 0 Goedert 4 0 4 0 0 24 Scott 5 105 21.0 26 0 Jeffery 4 1 3 0 0 24 Clement 3 73 24.3 26 0 Ertz 3 0 3 0 0 20 Goedert 1 16 16.0 16 0 Agholor 3 0 3 0 0 18 TEAM 23 508 22.1 67 0 Sanders 2 1 1 0 0 14 OPPONENTS 16 392 24.5 100t 1 D. Jackson 2 0 2 0 0 12 * FIELD GOALS 1-19 20-29 30-39 40-49 50+ Gerry 1 0 0 1 0 6 Elliott 0/ 0 6/ 6 4/ 4 3/ 3 1/ 1 Scandrick 1 0 0 1 0 6 TEAM 0/ 0 6/ 6 4/ 4 3/ 3 1/ 1 Scott 1 1 0 0 0 6 OPPONENTS 0/ 0 5/ 5 6/ 6 2/ 3 2/ 5 Wentz 1 1 0 0 0 6 Elliott: (22G)(34G,41G)(25G)()(28G)(53G,40G) Sproles 0 0 0 0 0 2 (38G)(37G)(28G,28G,38G)(42G)(28G) TEAM 29 10 17 2 21/23 14/14 0 243 OPP: (41G,48G)(50G,50N)(25G,33G,46B)(30G,31G) OPPONENTS 29 10 18 1 26/27 15/19 0 247 (55N)(39G)(26G,63G,29G)(53N)()(35G,22G,39G)(24G) 2-Pt Conv: Ertz, Sanders, Sproles, TM 3-6, OPP 1-2 SACKS: B. Graham 7.5, Barnett 3.5, Sweat 3, Cox 2.5, Gerry 2.5, Jenkins 2.5, Ridgeway 2, Scandrick 2, Curry 1, Da. Hall 1, Jernigan 1, McLeod 1, Sendejo TM 1, Avery LG 0.5, Avery TM 0.5, TM 31, OPP 28 FUM/LOST: Wentz 8/5, Scott 3/1, Agholor 2/1, Clement 2/2, Goedert 2/2, Sanders 2/1, Ertz 1/1, Kelce 1/0, Sproles 1/0 * PASSING Att Cmp Yds Cmp% Yds/Att TD TD% Int Int% Long Sack/Lost Rating Wentz 388 243 2530 62.6 6.52 17 4.4 6 1.5 53t 28/ 165 89.6 McCown 5 3 24 60.0 4.80 0 0.0 0 0.0 13 0/ 0 72.1 Elliott 1 0 0 0.0 0.00 0 0.0 1 100.0 --- 0/ 0 0.0 TEAM 394 246 2554 62.4 6.48 17 4.3 7 1.8 53t 28/ 165 88.1 OPPONENTS 382 233 2740 61.0 7.17 18 4.7 9 2.4 69t 31/ 191 88.7
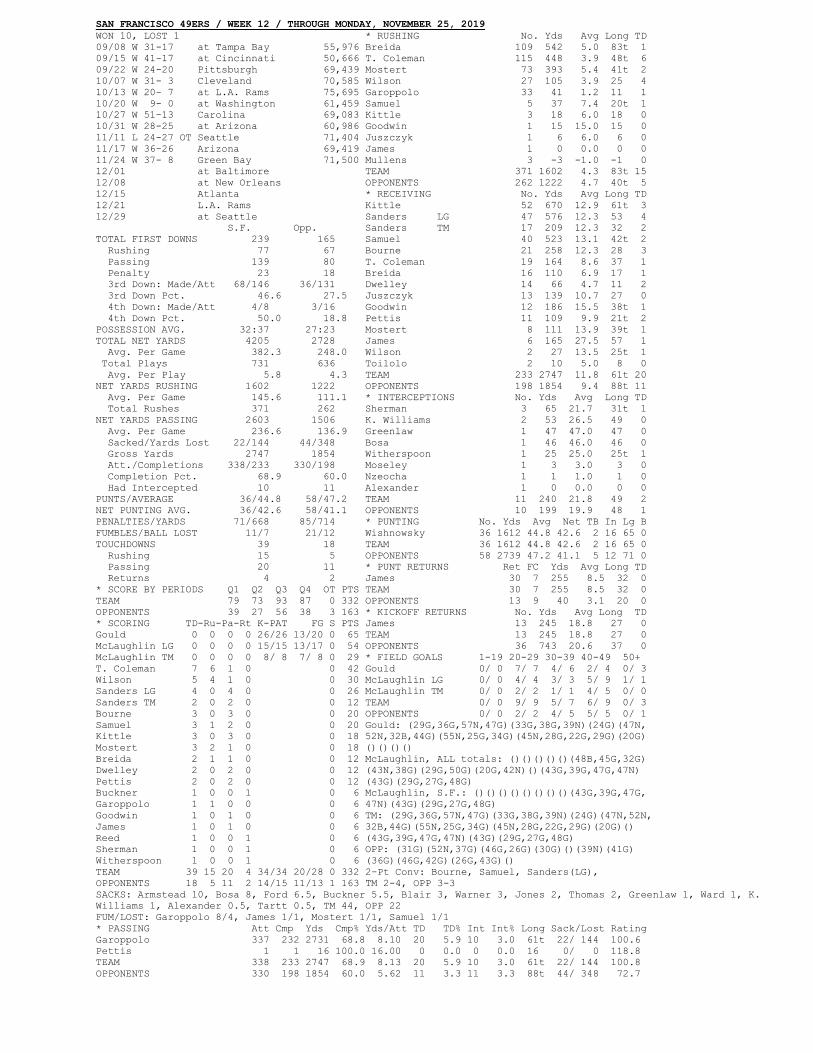
SAN FRANCISCO 49ERS / WEEK 12 / THROUGH MONDAY, NOVEMBER 25, 2019 WON 10, LOST 1 * RUSHING No. Yds Avg Long TD 09/08 W 31-17 at Tampa Bay 55,976 Breida 109 542 5.0 83t 1 09/15 W 41-17 at Cincinnati 50,666 T. Coleman 115 448 3.9 48t 6 09/22 W 24-20 Pittsburgh 69,439 Mostert 73 393 5.4 41t 2 10/07 W 31- 3 Cleveland 70,585 Wilson 27 105 3.9 25 4 10/13 W 20- 7 at L.A. Rams 75,695 Garoppolo 33 41 1.2 11 1 10/20 W 9- 0 at Washington 61,459 Samuel 5 37 7.4 20t 1 10/27 W 51-13 Carolina 69,083 Kittle 3 18 6.0 18 0 10/31 W 28-25 at Arizona 60,986 Goodwin 1 15 15.0 15 0 11/11 L 24-27 OT Seattle 71,404 Juszczyk 1 6 6.0 6 0 11/17 W 36-26 Arizona 69,419 James 1 0 0.0 0 0 11/24 W 37- 8 Green Bay 71,500 Mullens 3 -3 -1.0 -1 0 12/01 at Baltimore TEAM 371 1602 4.3 83t 15 12/08 at New Orleans OPPONENTS 262 1222 4.7 40t 5 12/15 Atlanta * RECEIVING No. Yds Avg Long TD 12/21 L.A. Rams Kittle 52 670 12.9 61t 3 12/29 at Seattle Sanders LG 47 576 12.3 53 4 S.F. Opp. Sanders TM 17 209 12.3 32 2 TOTAL FIRST DOWNS 239 165 Samuel 40 523 13.1 42t 2 Rushing 77 67 Bourne 21 258 12.3 28 3 Passing 139 80 T. Coleman 19 164 8.6 37 1 Penalty 23 18 Breida 16 110 6.9 17 1 3rd Down: Made/Att 68/146 36/131 Dwelley 14 66 4.7 11 2 3rd Down Pct. 46.6 27.5 Juszczyk 13 139 10.7 27 0 4th Down: Made/Att 4/8 3/16 Goodwin 12 186 15.5 38t 1 4th Down Pct. 50.0 18.8 Pettis 11 109 9.9 21t 2 POSSESSION AVG. 32:37 27:23 Mostert 8 111 13.9 39t 1 TOTAL NET YARDS 4205 2728 James 6 165 27.5 57 1 Avg. Per Game 382.3 248.0 Wilson 2 27 13.5 25t 1 Total Plays 731 636 Toilolo 2 10 5.0 8 0 Avg. Per Play 5.8 4.3 TEAM 233 2747 11.8 61t 20 NET YARDS RUSHING 1602 1222 OPPONENTS 198 1854 9.4 88t 11 Avg. Per Game 145.6 111.1 * INTERCEPTIONS No. Yds Avg Long TD Total Rushes 371 262 Sherman 3 65 21.7 31t 1 NET YARDS PASSING 2603 1506 K. Williams 2 53 26.5 49 0 Avg. Per Game 236.6 136.9 Greenlaw 1 47 47.0 47 0 Sacked/Yards Lost 22/144 44/348 Bosa 1 46 46.0 46 0 Gross Yards 2747 1854 Witherspoon 1 25 25.0 25t 1 Att./Completions 338/233 330/198 Moseley 1 3 3.0 3 0 Completion Pct. 68.9 60.0 Nzeocha 1 1 1.0 1 0 Had Intercepted 10 11 Alexander 1 0 0.0 0 0 PUNTS/AVERAGE 36/44.8 58/47.2 TEAM 11 240 21.8 49 2 NET PUNTING AVG. 36/42.6 58/41.1 OPPONENTS 10 199 19.9 48 1 PENALTIES/YARDS 71/668 85/714 * PUNTING No. Yds Avg Net TB In Lg B FUMBLES/BALL LOST 11/7 21/12 Wishnowsky 36 1612 44.8 42.6 2 16 65 0 TOUCHDOWNS 39 18 TEAM 36 1612 44.8 42.6 2 16 65 0 Rushing 15 5 OPPONENTS 58 2739 47.2 41.1 5 12 71 0 Passing 20 11 * PUNT RETURNS Ret FC Yds Avg Long TD Returns 4 2 James 30 7 255 8.5 32 0 * SCORE BY PERIODS Q1 Q2 Q3 Q4 OT PTS TEAM 30 7 255 8.5 32 0 TEAM 79 73 93 87 0 332 OPPONENTS 13 9 40 3.1 20 0 OPPONENTS 39 27 56 38 3 163 * KICKOFF RETURNS No. Yds Avg Long TD * SCORING TD-Ru-Pa-Rt K-PAT FG S PTS James 13 245 18.8 27 0 Gould 0 0 0 0 26/26 13/20 0 65 TEAM 13 245 18.8 27 0 McLaughlin LG 0 0 0 0 15/15 13/17 0 54 OPPONENTS 36 743 20.6 37 0 McLaughlin TM 0 0 0 0 8/ 8 7/ 8 0 29 * FIELD GOALS 1-19 20-29 30-39 40-49 50+ T. Coleman 7 6 1 0 0 42 Gould 0/ 0 7/ 7 4/ 6 2/ 4 0/ 3 Wilson 5 4 1 0 0 30 McLaughlin LG 0/ 0 4/ 4 3/ 3 5/ 9 1/ 1 Sanders LG 4 0 4 0 0 26 McLaughlin TM 0/ 0 2/ 2 1/ 1 4/ 5 0/ 0 Sanders TM 2 0 2 0 0 12 TEAM 0/ 0 9/ 9 5/ 7 6/ 9 0/ 3 Bourne 3 0 3 0 0 20 OPPONENTS 0/ 0 2/ 2 4/ 5 5/ 5 0/ 1 Samuel 3 1 2 0 0 20 Gould: (29G,36G,57N,47G)(33G,38G,39N)(24G)(47N, Kittle 3 0 3 0 0 18 52N,32B,44G)(55N,25G,34G)(45N,28G,22G,29G)(20G) Mostert 3 2 1 0 0 18 ()()()() Breida 2 1 1 0 0 12 McLaughlin, ALL totals: ()()()()()(48B,45G,32G) Dwelley 2 0 2 0 0 12 (43N,38G)(29G,50G)(20G,42N)()(43G,39G,47G,47N) Pettis 2 0 2 0 0 12 (43G)(29G,27G,48G) Buckner 1 0 0 1 0 6 McLaughlin, S.F.: ()()()()()()()()(43G,39G,47G, Garoppolo 1 1 0 0 0 6 47N)(43G)(29G,27G,48G) Goodwin 1 0 1 0 0 6 TM: (29G,36G,57N,47G)(33G,38G,39N)(24G)(47N,52N, James 1 0 1 0 0 6 32B,44G)(55N,25G,34G)(45N,28G,22G,29G)(20G)() Reed 1 0 0 1 0 6 (43G,39G,47G,47N)(43G)(29G,27G,48G) Sherman 1 0 0 1 0 6 OPP: (31G)(52N,37G)(46G,26G)(30G)()(39N)(41G) Witherspoon 1 0 0 1 0 6 (36G)(46G,42G)(26G,43G)() TEAM 39 15 20 4 34/34 20/28 0 332 2-Pt Conv: Bourne, Samuel, Sanders(LG), OPPONENTS 18 5 11 2 14/15 11/13 1 163 TM 2-4, OPP 3-3 SACKS: Armstead 10, Bosa 8, Ford 6.5, Buckner 5.5, Blair 3, Warner 3, Jones 2, Thomas 2, Greenlaw 1, Ward 1, K. Williams 1, Alexander 0.5, Tartt 0.5, TM 44, OPP 22 FUM/LOST: Garoppolo 8/4, James 1/1, Mostert 1/1, Samuel 1/1 * PASSING Att Cmp Yds Cmp% Yds/Att TD TD% Int Int% Long Sack/Lost Rating Garoppolo 337 232 2731 68.8 8.10 20 5.9 10 3.0 61t 22/ 144 100.6 Pettis 1 1 16 100.0 16.00 0 0.0 0 0.0 16 0/ 0 118.8 TEAM 338 233 2747 68.9 8.13 20 5.9 10 3.0 61t 22/ 144 100.8 OPPONENTS 330 198 1854 60.0 5.62 11 3.3 11 3.3 88t 44/ 348 72.7
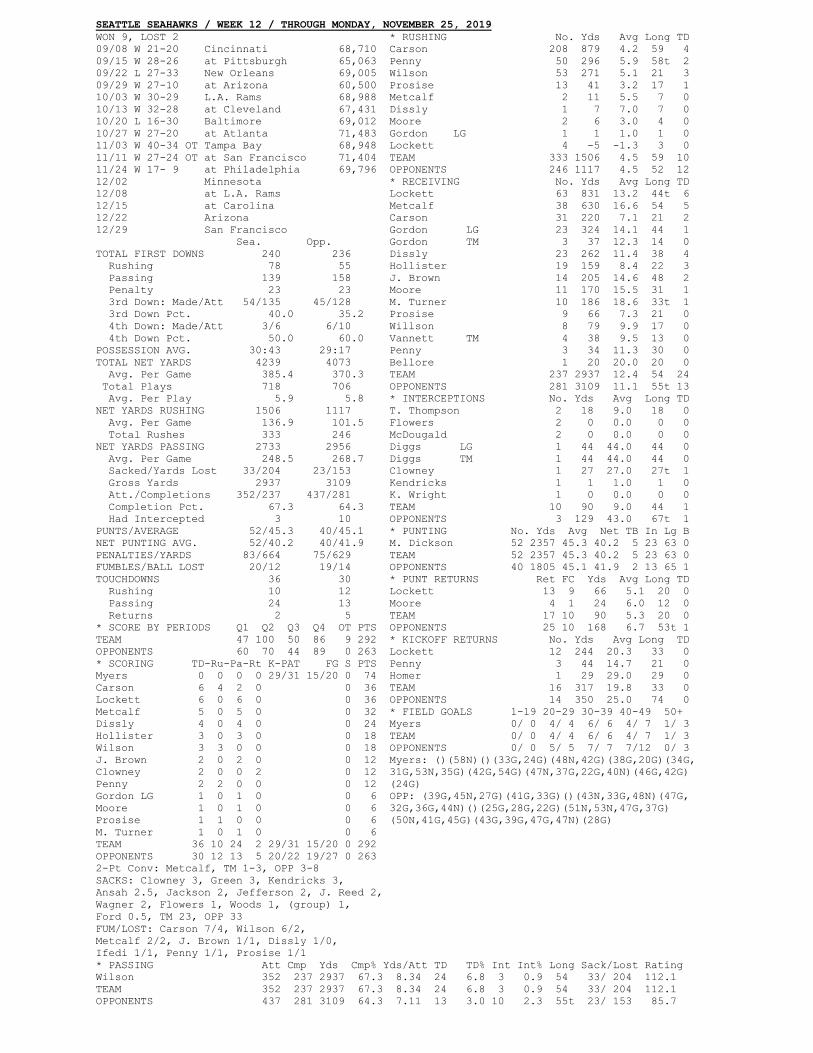
SEATTLE SEAHAWKS / WEEK 12 / THROUGH MONDAY, NOVEMBER 25, 2019 WON 9, LOST 2 * RUSHING No. Yds Avg Long TD 09/08 W 21-20 Cincinnati 68,710 Carson 208 879 4.2 59 4 09/15 W 28-26 at Pittsburgh 65,063 Penny 50 296 5.9 58t 2 09/22 L 27-33 New Orleans 69,005 Wilson 53 271 5.1 21 3 09/29 W 27-10 at Arizona 60,500 Prosise 13 41 3.2 17 1 10/03 W 30-29 L.A. Rams 68,988 Metcalf 2 11 5.5 7 0 10/13 W 32-28 at Cleveland 67,431 Dissly 1 7 7.0 7 0 10/20 L 16-30 Baltimore 69,012 Moore 2 6 3.0 4 0 10/27 W 27-20 at Atlanta 71,483 Gordon LG 1 1 1.0 1 0 11/03 W 40-34 OT Tampa Bay 68,948 Lockett 4 -5 -1.3 3 0 11/11 W 27-24 OT at San Francisco 71,404 TEAM 333 1506 4.5 59 10 11/24 W 17- 9 at Philadelphia 69,796 OPPONENTS 246 1117 4.5 52 12 12/02 Minnesota * RECEIVING No. Yds Avg Long TD 12/08 at L.A. Rams Lockett 63 831 13.2 44t 6 12/15 at Carolina Metcalf 38 630 16.6 54 5 12/22 Arizona Carson 31 220 7.1 21 2 12/29 San Francisco Gordon LG 23 324 14.1 44 1 Sea. Opp. Gordon TM 3 37 12.3 14 0 TOTAL FIRST DOWNS 240 236 Dissly 23 262 11.4 38 4 Rushing 78 55 Hollister 19 159 8.4 22 3 Passing 139 158 J. Brown 14 205 14.6 48 2 Penalty 23 23 Moore 11 170 15.5 31 1 3rd Down: Made/Att 54/135 45/128 M. Turner 10 186 18.6 33t 1 3rd Down Pct. 40.0 35.2 Prosise 9 66 7.3 21 0 4th Down: Made/Att 3/6 6/10 Willson 8 79 9.9 17 0 4th Down Pct. 50.0 60.0 Vannett TM 4 38 9.5 13 0 POSSESSION AVG. 30:43 29:17 Penny 3 34 11.3 30 0 TOTAL NET YARDS 4239 4073 Bellore 1 20 20.0 20 0 Avg. Per Game 385.4 370.3 TEAM 237 2937 12.4 54 24 Total Plays 718 706 OPPONENTS 281 3109 11.1 55t 13 Avg. Per Play 5.9 5.8 * INTERCEPTIONS No. Yds Avg Long TD NET YARDS RUSHING 1506 1117 T. Thompson 2 18 9.0 18 0 Avg. Per Game 136.9 101.5 Flowers 2 0 0.0 0 0 Total Rushes 333 246 McDougald 2 0 0.0 0 0 NET YARDS PASSING 2733 2956 Diggs LG 1 44 44.0 44 0 Avg. Per Game 248.5 268.7 Diggs TM 1 44 44.0 44 0 Sacked/Yards Lost 33/204 23/153 Clowney 1 27 27.0 27t 1 Gross Yards 2937 3109 Kendricks 1 1 1.0 1 0 Att./Completions 352/237 437/281 K. Wright 1 0 0.0 0 0 Completion Pct. 67.3 64.3 TEAM 10 90 9.0 44 1 Had Intercepted 3 10 OPPONENTS 3 129 43.0 67t 1 PUNTS/AVERAGE 52/45.3 40/45.1 * PUNTING No. Yds Avg Net TB In Lg B NET PUNTING AVG. 52/40.2 40/41.9 M. Dickson 52 2357 45.3 40.2 5 23 63 0 PENALTIES/YARDS 83/664 75/629 TEAM 52 2357 45.3 40.2 5 23 63 0 FUMBLES/BALL LOST 20/12 19/14 OPPONENTS 40 1805 45.1 41.9 2 13 65 1 TOUCHDOWNS 36 30 * PUNT RETURNS Ret FC Yds Avg Long TD Rushing 10 12 Lockett 13 9 66 5.1 20 0 Passing 24 13 Moore 4 1 24 6.0 12 0 Returns 2 5 TEAM 17 10 90 5.3 20 0 * SCORE BY PERIODS Q1 Q2 Q3 Q4 OT PTS OPPONENTS 25 10 168 6.7 53t 1 TEAM 47 100 50 86 9 292 * KICKOFF RETURNS No. Yds Avg Long TD OPPONENTS 60 70 44 89 0 263 Lockett 12 244 20.3 33 0 * SCORING TD-Ru-Pa-Rt K-PAT FG S PTS Penny 3 44 14.7 21 0 Myers 0 0 0 0 29/31 15/20 0 74 Homer 1 29 29.0 29 0 Carson 6 4 2 0 0 36 TEAM 16 317 19.8 33 0 Lockett 6 0 6 0 0 36 OPPONENTS 14 350 25.0 74 0 Metcalf 5 0 5 0 0 32 * FIELD GOALS 1-19 20-29 30-39 40-49 50+ Dissly 4 0 4 0 0 24 Myers 0/ 0 4/ 4 6/ 6 4/ 7 1/ 3 Hollister 3 0 3 0 0 18 TEAM 0/ 0 4/ 4 6/ 6 4/ 7 1/ 3 Wilson 3 3 0 0 0 18 OPPONENTS 0/ 0 5/ 5 7/ 7 7/12 0/ 3 J. Brown 2 0 2 0 0 12 Myers: ()(58N)()(33G,24G)(48N,42G)(38G,20G)(34G, Clowney 2 0 0 2 0 12 31G,53N,35G)(42G,54G)(47N,37G,22G,40N)(46G,42G) Penny 2 2 0 0 0 12 (24G) Gordon LG 1 0 1 0 0 6 OPP: (39G,45N,27G)(41G,33G)()(43N,33G,48N)(47G, Moore 1 0 1 0 0 6 32G,36G,44N)()(25G,28G,22G)(51N,53N,47G,37G) Prosise 1 1 0 0 0 6 (50N,41G,45G)(43G,39G,47G,47N)(28G) M. Turner 1 0 1 0 0 6 TEAM 36 10 24 2 29/31 15/20 0 292 OPPONENTS 30 12 13 5 20/22 19/27 0 263 2-Pt Conv: Metcalf, TM 1-3, OPP 3-8 SACKS: Clowney 3, Green 3, Kendricks 3, Ansah 2.5, Jackson 2, Jefferson 2, J. Reed 2, Wagner 2, Flowers 1, Woods 1, (group) 1, Ford 0.5, TM 23, OPP 33 FUM/LOST: Carson 7/4, Wilson 6/2, Metcalf 2/2, J. Brown 1/1, Dissly 1/0, Ifedi 1/1, Penny 1/1, Prosise 1/1 * PASSING Att Cmp Yds Cmp% Yds/Att TD TD% Int Int% Long Sack/Lost Rating Wilson 352 237 2937 67.3 8.34 24 6.8 3 0.9 54 33/ 204 112.1 TEAM 352 237 2937 67.3 8.34 24 6.8 3 0.9 54 33/ 204 112.1 OPPONENTS 437 281 3109 64.3 7.11 13 3.0 10 2.3 55t 23/ 153 85.7
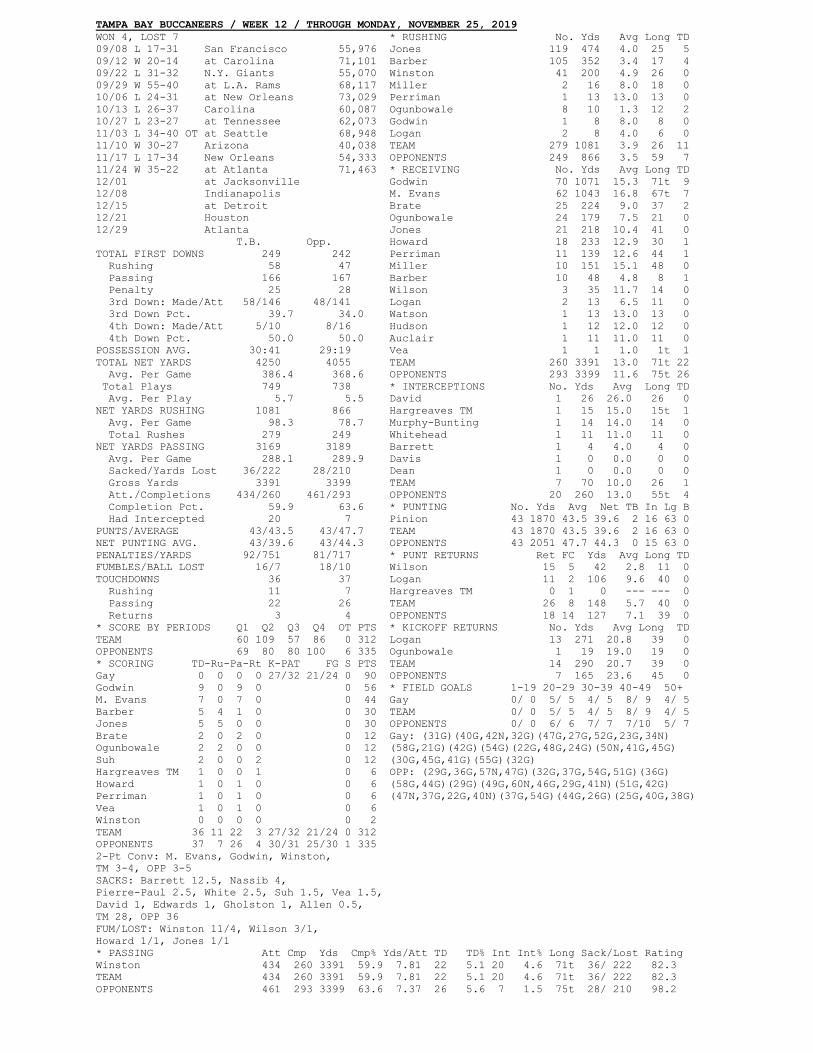
TAMPA BAY BUCCANEERS / WEEK 12 / THROUGH MONDAY, NOVEMBER 25, 2019 WON 4, LOST 7 * RUSHING No. Yds Avg Long TD 09/08 L 17-31 San Francisco 55,976 Jones 119 474 4.0 25 5 09/12 W 20-14 at Carolina 71,101 Barber 105 352 3.4 17 4 09/22 L 31-32 N.Y. Giants 55,070 Winston 41 200 4.9 26 0 09/29 W 55-40 at L.A. Rams 68,117 Miller 2 16 8.0 18 0 10/06 L 24-31 at New Orleans 73,029 Perriman 1 13 13.0 13 0 10/13 L 26-37 Carolina 60,087 Ogunbowale 8 10 1.3 12 2 10/27 L 23-27 at Tennessee 62,073 Godwin 1 8 8.0 8 0 11/03 L 34-40 OT at Seattle 68,948 Logan 2 8 4.0 6 0 11/10 W 30-27 Arizona 40,038 TEAM 279 1081 3.9 26 11 11/17 L 17-34 New Orleans 54,333 OPPONENTS 249 866 3.5 59 7 11/24 W 35-22 at Atlanta 71,463 * RECEIVING No. Yds Avg Long TD 12/01 at Jacksonville Godwin 70 1071 15.3 71t 9 12/08 Indianapolis M. Evans 62 1043 16.8 67t 7 12/15 at Detroit Brate 25 224 9.0 37 2 12/21 Houston Ogunbowale 24 179 7.5 21 0 12/29 Atlanta Jones 21 218 10.4 41 0 T.B. Opp. Howard 18 233 12.9 30 1 TOTAL FIRST DOWNS 249 242 Perriman 11 139 12.6 44 1 Rushing 58 47 Miller 10 151 15.1 48 0 Passing 166 167 Barber 10 48 4.8 8 1 Penalty 25 28 Wilson 3 35 11.7 14 0 3rd Down: Made/Att 58/146 48/141 Logan 2 13 6.5 11 0 3rd Down Pct. 39.7 34.0 Watson 1 13 13.0 13 0 4th Down: Made/Att 5/10 8/16 Hudson 1 12 12.0 12 0 4th Down Pct. 50.0 50.0 Auclair 1 11 11.0 11 0 POSSESSION AVG. 30:41 29:19 Vea 1 1 1.0 1t 1 TOTAL NET YARDS 4250 4055 TEAM 260 3391 13.0 71t 22 Avg. Per Game 386.4 368.6 OPPONENTS 293 3399 11.6 75t 26 Total Plays 749 738 * INTERCEPTIONS No. Yds Avg Long TD Avg. Per Play 5.7 5.5 David 1 26 26.0 26 0 NET YARDS RUSHING 1081 866 Hargreaves TM 1 15 15.0 15t 1 Avg. Per Game 98.3 78.7 Murphy-Bunting 1 14 14.0 14 0 Total Rushes 279 249 Whitehead 1 11 11.0 11 0 NET YARDS PASSING 3169 3189 Barrett 1 4 4.0 4 0 Avg. Per Game 288.1 289.9 Davis 1 0 0.0 0 0 Sacked/Yards Lost 36/222 28/210 Dean 1 0 0.0 0 0 Gross Yards 3391 3399 TEAM 7 70 10.0 26 1 Att./Completions 434/260 461/293 OPPONENTS 20 260 13.0 55t 4 Completion Pct. 59.9 63.6 * PUNTING No. Yds Avg Net TB In Lg B Had Intercepted 20 7 Pinion 43 1870 43.5 39.6 2 16 63 0 PUNTS/AVERAGE 43/43.5 43/47.7 TEAM 43 1870 43.5 39.6 2 16 63 0 NET PUNTING AVG. 43/39.6 43/44.3 OPPONENTS 43 2051 47.7 44.3 0 15 63 0 PENALTIES/YARDS 92/751 81/717 * PUNT RETURNS Ret FC Yds Avg Long TD FUMBLES/BALL LOST 16/7 18/10 Wilson 15 5 42 2.8 11 0 TOUCHDOWNS 36 37 Logan 11 2 106 9.6 40 0 Rushing 11 7 Hargreaves TM 0 1 0 --- --- 0 Passing 22 26 TEAM 26 8 148 5.7 40 0 Returns 3 4 OPPONENTS 18 14 127 7.1 39 0 * SCORE BY PERIODS Q1 Q2 Q3 Q4 OT PTS * KICKOFF RETURNS No. Yds Avg Long TD TEAM 60 109 57 86 0 312 Logan 13 271 20.8 39 0 OPPONENTS 69 80 80 100 6 335 Ogunbowale 1 19 19.0 19 0 * SCORING TD-Ru-Pa-Rt K-PAT FG S PTS TEAM 14 290 20.7 39 0 Gay 0 0 0 0 27/32 21/24 0 90 OPPONENTS 7 165 23.6 45 0 Godwin 9 0 9 0 0 56 * FIELD GOALS 1-19 20-29 30-39 40-49 50+ M. Evans 7 0 7 0 0 44 Gay 0/ 0 5/ 5 4/ 5 8/ 9 4/ 5 Barber 5 4 1 0 0 30 TEAM 0/ 0 5/ 5 4/ 5 8/ 9 4/ 5 Jones 5 5 0 0 0 30 OPPONENTS 0/ 0 6/ 6 7/ 7 7/10 5/ 7 Brate 2 0 2 0 0 12 Gay: (31G)(40G,42N,32G)(47G,27G,52G,23G,34N) Ogunbowale 2 2 0 0 0 12 (58G,21G)(42G)(54G)(22G,48G,24G)(50N,41G,45G) Suh 2 0 0 2 0 12 (30G,45G,41G)(55G)(32G) Hargreaves TM 1 0 0 1 0 6 OPP: (29G,36G,57N,47G)(32G,37G,54G,51G)(36G) Howard 1 0 1 0 0 6 (58G,44G)(29G)(49G,60N,46G,29G,41N)(51G,42G) Perriman 1 0 1 0 0 6 (47N,37G,22G,40N)(37G,54G)(44G,26G)(25G,40G,38G) Vea 1 0 1 0 0 6 Winston 0 0 0 0 0 2 TEAM 36 11 22 3 27/32 21/24 0 312 OPPONENTS 37 7 26 4 30/31 25/30 1 335 2-Pt Conv: M. Evans, Godwin, Winston, TM 3-4, OPP 3-5 SACKS: Barrett 12.5, Nassib 4, Pierre-Paul 2.5, White 2.5, Suh 1.5, Vea 1.5, David 1, Edwards 1, Gholston 1, Allen 0.5, TM 28, OPP 36 FUM/LOST: Winston 11/4, Wilson 3/1, Howard 1/1, Jones 1/1 * PASSING Att Cmp Yds Cmp% Yds/Att TD TD% Int Int% Long Sack/Lost Rating Winston 434 260 3391 59.9 7.81 22 5.1 20 4.6 71t 36/ 222 82.3 TEAM 434 260 3391 59.9 7.81 22 5.1 20 4.6 71t 36/ 222 82.3 OPPONENTS 461 293 3399 63.6 7.37 26 5.6 7 1.5 75t 28/ 210 98.2
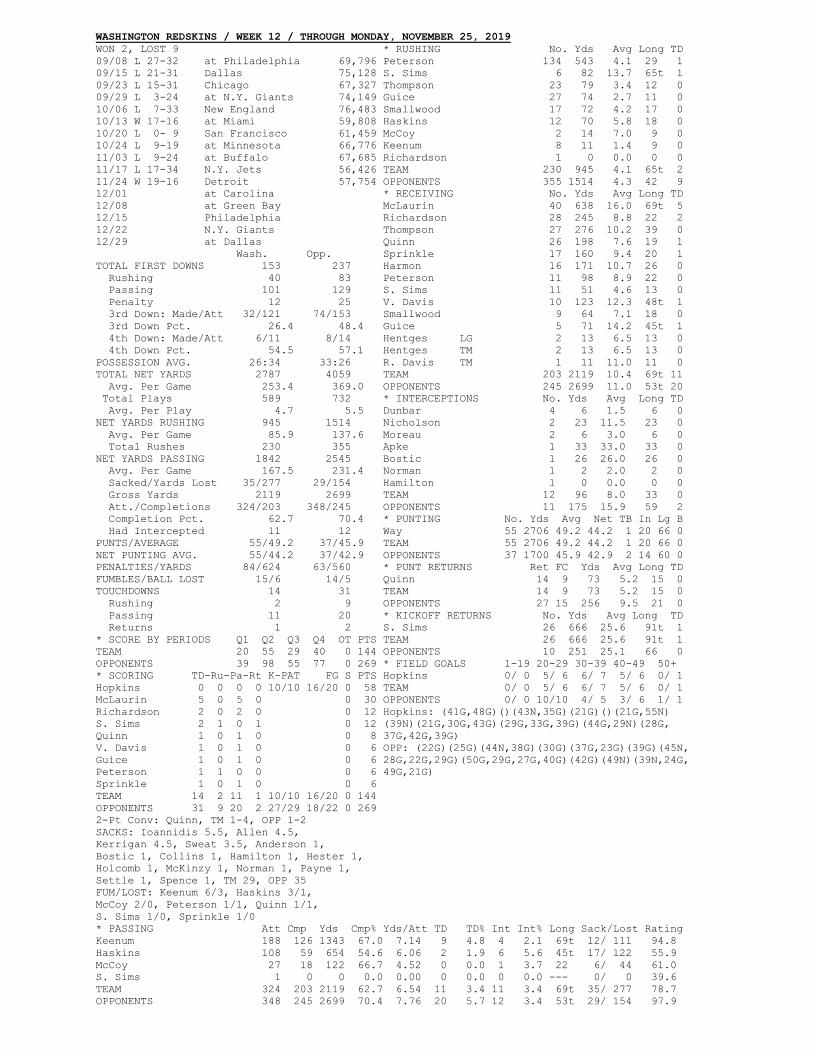
WASHINGTON REDSKINS / WEEK 12 / THROUGH MONDAY, NOVEMBER 25, 2019 WON 2, LOST 9 * RUSHING No. Yds Avg Long TD 09/08 L 27-32 at Philadelphia 69,796 Peterson 134 543 4.1 29 1 09/15 L 21-31 Dallas 75,128 S. Sims 6 82 13.7 65t 1 09/23 L 15-31 Chicago 67,327 Thompson 23 79 3.4 12 0 09/29 L 3-24 at N.Y. Giants 74,149 Guice 27 74 2.7 11 0 10/06 L 7-33 New England 76,483 Smallwood 17 72 4.2 17 0 10/13 W 17-16 at Miami 59,808 Haskins 12 70 5.8 18 0 10/20 L 0- 9 San Francisco 61,459 McCoy 2 14 7.0 9 0 10/24 L 9-19 at Minnesota 66,776 Keenum 8 11 1.4 9 0 11/03 L 9-24 at Buffalo 67,685 Richardson 1 0 0.0 0 0 11/17 L 17-34 N.Y. Jets 56,426 TEAM 230 945 4.1 65t 2 11/24 W 19-16 Detroit 57,754 OPPONENTS 355 1514 4.3 42 9 12/01 at Carolina * RECEIVING No. Yds Avg Long TD 12/08 at Green Bay McLaurin 40 638 16.0 69t 5 12/15 Philadelphia Richardson 28 245 8.8 22 2 12/22 N.Y. Giants Thompson 27 276 10.2 39 0 12/29 at Dallas Quinn 26 198 7.6 19 1 Wash. Opp. Sprinkle 17 160 9.4 20 1 TOTAL FIRST DOWNS 153 237 Harmon 16 171 10.7 26 0 Rushing 40 83 Peterson 11 98 8.9 22 0 Passing 101 129 S. Sims 11 51 4.6 13 0 Penalty 12 25 V. Davis 10 123 12.3 48t 1 3rd Down: Made/Att 32/121 74/153 Smallwood 9 64 7.1 18 0 3rd Down Pct. 26.4 48.4 Guice 5 71 14.2 45t 1 4th Down: Made/Att 6/11 8/14 Hentges LG 2 13 6.5 13 0 4th Down Pct. 54.5 57.1 Hentges TM 2 13 6.5 13 0 POSSESSION AVG. 26:34 33:26 R. Davis TM 1 11 11.0 11 0 TOTAL NET YARDS 2787 4059 TEAM 203 2119 10.4 69t 11 Avg. Per Game 253.4 369.0 OPPONENTS 245 2699 11.0 53t 20 Total Plays 589 732 * INTERCEPTIONS No. Yds Avg Long TD Avg. Per Play 4.7 5.5 Dunbar 4 6 1.5 6 0 NET YARDS RUSHING 945 1514 Nicholson 2 23 11.5 23 0 Avg. Per Game 85.9 137.6 Moreau 2 6 3.0 6 0 Total Rushes 230 355 Apke 1 33 33.0 33 0 NET YARDS PASSING 1842 2545 Bostic 1 26 26.0 26 0 Avg. Per Game 167.5 231.4 Norman 1 2 2.0 2 0 Sacked/Yards Lost 35/277 29/154 Hamilton 1 0 0.0 0 0 Gross Yards 2119 2699 TEAM 12 96 8.0 33 0 Att./Completions 324/203 348/245 OPPONENTS 11 175 15.9 59 2 Completion Pct. 62.7 70.4 * PUNTING No. Yds Avg Net TB In Lg B Had Intercepted 11 12 Way 55 2706 49.2 44.2 1 20 66 0 PUNTS/AVERAGE 55/49.2 37/45.9 TEAM 55 2706 49.2 44.2 1 20 66 0 NET PUNTING AVG. 55/44.2 37/42.9 OPPONENTS 37 1700 45.9 42.9 2 14 60 0 PENALTIES/YARDS 84/624 63/560 * PUNT RETURNS Ret FC Yds Avg Long TD FUMBLES/BALL LOST 15/6 14/5 Quinn 14 9 73 5.2 15 0 TOUCHDOWNS 14 31 TEAM 14 9 73 5.2 15 0 Rushing 2 9 OPPONENTS 27 15 256 9.5 21 0 Passing 11 20 * KICKOFF RETURNS No. Yds Avg Long TD Returns 1 2 S. Sims 26 666 25.6 91t 1 * SCORE BY PERIODS Q1 Q2 Q3 Q4 OT PTS TEAM 26 666 25.6 91t 1 TEAM 20 55 29 40 0 144 OPPONENTS 10 251 25.1 66 0 OPPONENTS 39 98 55 77 0 269 * FIELD GOALS 1-19 20-29 30-39 40-49 50+ * SCORING TD-Ru-Pa-Rt K-PAT FG S PTS Hopkins 0/ 0 5/ 6 6/ 7 5/ 6 0/ 1 Hopkins 0 0 0 0 10/10 16/20 0 58 TEAM 0/ 0 5/ 6 6/ 7 5/ 6 0/ 1 McLaurin 5 0 5 0 0 30 OPPONENTS 0/ 0 10/10 4/ 5 3/ 6 1/ 1 Richardson 2 0 2 0 0 12 Hopkins: (41G,48G)()(43N,35G)(21G)()(21G,55N) S. Sims 2 1 0 1 0 12 (39N)(21G,30G,43G)(29G,33G,39G)(44G,29N)(28G, Quinn 1 0 1 0 0 8 37G,42G,39G) V. Davis 1 0 1 0 0 6 OPP: (22G)(25G)(44N,38G)(30G)(37G,23G)(39G)(45N, Guice 1 0 1 0 0 6 28G,22G,29G)(50G,29G,27G,40G)(42G)(49N)(39N,24G, Peterson 1 1 0 0 0 6 49G,21G) Sprinkle 1 0 1 0 0 6 TEAM 14 2 11 1 10/10 16/20 0 144 OPPONENTS 31 9 20 2 27/29 18/22 0 269 2-Pt Conv: Quinn, TM 1-4, OPP 1-2 SACKS: Ioannidis 5.5, Allen 4.5, Kerrigan 4.5, Sweat 3.5, Anderson 1, Bostic 1, Collins 1, Hamilton 1, Hester 1, Holcomb 1, McKinzy 1, Norman 1, Payne 1, Settle 1, Spence 1, TM 29, OPP 35 FUM/LOST: Keenum 6/3, Haskins 3/1, McCoy 2/0, Peterson 1/1, Quinn 1/1, S. Sims 1/0, Sprinkle 1/0 * PASSING Att Cmp Yds Cmp% Yds/Att TD TD% Int Int% Long Sack/Lost Rating Keenum 188 126 1343 67.0 7.14 9 4.8 4 2.1 69t 12/ 111 94.8 Haskins 108 59 654 54.6 6.06 2 1.9 6 5.6 45t 17/ 122 55.9 McCoy 27 18 122 66.7 4.52 0 0.0 1 3.7 22 6/ 44 61.0 S. Sims 1 0 0 0.0 0.00 0 0.0 0 0.0 --- 0/ 0 39.6 TEAM 324 203 2119 62.7 6.54 11 3.4 11 3.4 69t 35/ 277 78.7 OPPONENTS 348 245 2699 70.4 7.76 20 5.7 12 3.4 53t 29/ 154 97.9
Related Documents