Pavement Life-Cycle Cost Analysis (LCCA) Project Example – Ramp for RealCost Version 2.5CA Updated 05-09-14 INTRODUCTION This example project will go through the entire Life-Cycle Cost Analysis (LCCA) process to determine the most cost-effective pavement alternative. It will follow step by step procedures found in the 2013 LCCA Procedures Manual. This example project proposes to construct a new interchange at Duncan Canyon Road and Interstate 15 (I-15) in San Bernardino County (Post Mile 11). Figure 1. Project Location Map Page 1 of 42

Welcome message from author
This document is posted to help you gain knowledge. Please leave a comment to let me know what you think about it! Share it to your friends and learn new things together.
Transcript

Pavement Life-Cycle Cost Analysis (LCCA)Project Example – Ramp for RealCost Version 2.5CA
Updated 05-09-14
INTRODUCTION
This example project will go through the entire Life-Cycle Cost Analysis (LCCA) process to determine the most cost-effective pavement alternative. It will follow step by step procedures found in the 2013 LCCA Procedures Manual.
This example project proposes to construct a new interchange at Duncan Canyon Road and Interstate 15 (I-15) in San Bernardino County (Post Mile 11).
Figure 1. Project Location Map
Page 1 of 35

Pavement Life-Cycle Cost Analysis (LCCA)Project Example – Ramp for RealCost Version 2.5CA
Updated 05-09-14
Step 1: Since this project is a new interchange construction, determine the pavement alternatives from the LCCA New Construction and Reconstruction Pavement Type Selection Flowchart (Figure 2).
Figure 2. LCCA New Construction Flowchart
From the flowchart, it is recommended to perform LCCA for the following pavement alternatives: Pavement Alternative 1:
20-yr Flexible; HMA over Class 2 AB Pavement Alternative 2:
40-yr Flexible; Hot Mix Asphalt (HMA) with Rubberized Hot mix Asphalt (RHMA), over Class 2 AB
Pavement Alternative 3: 40-yr Jointed Plain Concrete Pavement (JPCP); JPCP with Lean Concrete Base (LCB) and Aggregate Subbase (AS)
Step 2: Traffic data and pavement structure for each alternative.
Table 1 is the traffic forecasting data summary from District Traffic Forecasting Unit. Annual growth rate is 1%. It is not necessary to perform LCCA for each individual ramp. Select one off-ramp which has the highest traffic volume, which is the northbound off-ramp. Therefore, LCCA will be conducted only on the northbound off-ramp. Appendix 6 of the LCCA Manual shows the formulas and methods for determining the annual growth rate and determining the AADT for the construction year.
Table 1 – 2030/2050 Projected Traffic Volumes & Traffic IndexLocation 2013 ADT 2030 ADT 2050 ADT 40-Year TI
RampsNB Off 15,500 19,400 23,300 12SB Off 3,700 4,600 5,500 10
Page 2 of 35
Follow the “Ramp” arrow, and go to the “Compare” box, which gives 3 pavement alternatives to compare.

Pavement Life-Cycle Cost Analysis (LCCA)Project Example – Ramp for RealCost Version 2.5CA
Updated 05-09-14
From District Materials Unit, the following pavement structure in Table 2 was provided.
Table 2 – Summary of Structural Sections for the RampsPavement Design Alternative
Design Life (year)
Ramp TI SectionMaterial Thickness (ft)
1- HMA 20 10 HMA 0.60Class 2 AB 1.35
2-RHMA 40 12RHMA-O 0.10RHMA-G 0.20
HMA 1.15Class 2 AB 0.50
3-JPCP 40 12JPCP 0.9LCB 0.35AS 0.60
From the Traffic Data Branch website, the following traffic data was obtained in Table 3 and 4. Since this project is a new interchange, the average between the upstream and downstream location was calculated. (https://dot.ca.gov/programs/traffic-operations/census)
Table 3. I-15 Traffic Counts
Page 3 of 35

Pavement Life-Cycle Cost Analysis (LCCA)Project Example – Ramp for RealCost Version 2.5CA
Updated 05-09-14
Table 4—Truck Information
Figure 3 depicts approximate schematics of the traffic flow.
Figure 3. Schematic of I-15 and Ramps
Page 4 of 35

Pavement Life-Cycle Cost Analysis (LCCA)Project Example – Ramp for RealCost Version 2.5CA
Updated 05-09-14
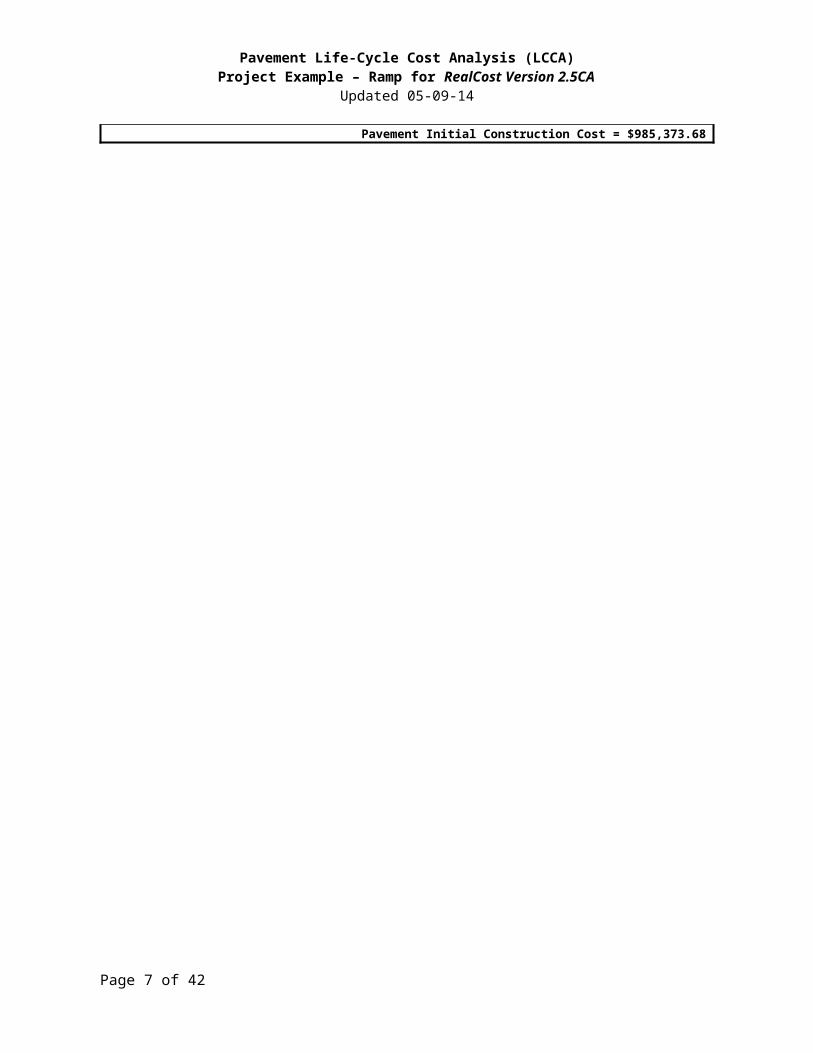
Step 3: Develop Initial Construction Costs for Each Pavement Alternative Initial pavement construction cost for the northbound off-ramp were calculated based on the pavement item quantity calculations and the 2012 weighted average unit prices for these items. Table 5 shows the cost breakdown for each pavement alternative. The items which are the same between the alternatives may be omitted from the initial construction cost calculation.
Table 5 – Initial Construction Cost EstimatePavement Alternative 1: 20-yr HMA NB Off-Ramp
Material Description
Area (SF) Depth (LF) Volume (CF)
Unit Weight (PCF)
Quantity Unit Unit Price Cost
Aggregate Base 95040 1.35 128304 4752 CY $35.00 $166,320.00Hot Mix Asphalt (TypeA)
95040 0.60 57024 149 TON$90.00 $382,345.92
Pavement Initial Construction Cost = $548,665.92
Pavement Alternative 2: 40-yr HMA w/RHMA-G w/RHMA-O NB Off-Ramp
Material Description
Area (SF) Depth (LF) Volume (CF)
Unit Weight (PCF)
Quantity Unit Unit Price Cost
Aggregate Base 95040 0.5 47520 1760 CY $35.00 $ 61,000.00Hot Mix Asphalt (TypeA)
95040 1.15 109296 149 8143 TON $90.00 $732,829.6
8
Rubberized Hot Mix Asphalt (Type G)
95040 0.20 19008 149 1416 TON $95.00 $134,520.00
Rubberized Hot Mix Asphalt (Type O)
95040 0.10 9504 120 570 TON $100.00 $ 57,024
Pavement Initial Construction Cost = $985,373.68
Page 5 of 35

Pavement Life-Cycle Cost Analysis (LCCA)Project Example – Ramp for RealCost Version 2.5CA
Updated 05-09-14
Pavement Alternative 3: 40-yr JPCP NB Off-Ramp
Material Description
Area (SF) Depth (LF) Volume (CF)
Unit Weight (PCF)
Quantity Unit Unit Price Cost
Import Borrow 9504 352 CY $30.00 $ 10,560.00Aggregate Base 95040 0.6 57024 2112 CY $35.00 $ 73,920.00Lean Concrete Base (LCB) 95040 0.35 33264 1232 CY $105.00
$129,360.00
Jointed Plain Concrete Pavement (JPCP)
95040 0.90 85536 3168 CY $180.00 $570,240.00
Pavement Initial Construction Cost = $784,080.00
Step 4: Run the most current RealCost Version 2.5.4CA (ZIP)
Figure 4 shows the “Switchboard,” which is the main menu that allows navigation between panels.
Figure 4. Switchboard
“Project Details” panel is shown in Figure 5. Enter project information.
Page 6 of 35
Pavement Life-Cycle Cost Analysis (LCCA)Project Example – Ramp for RealCost Version 2.5CA
Updated 05-09-14
Figure 5. Project Details
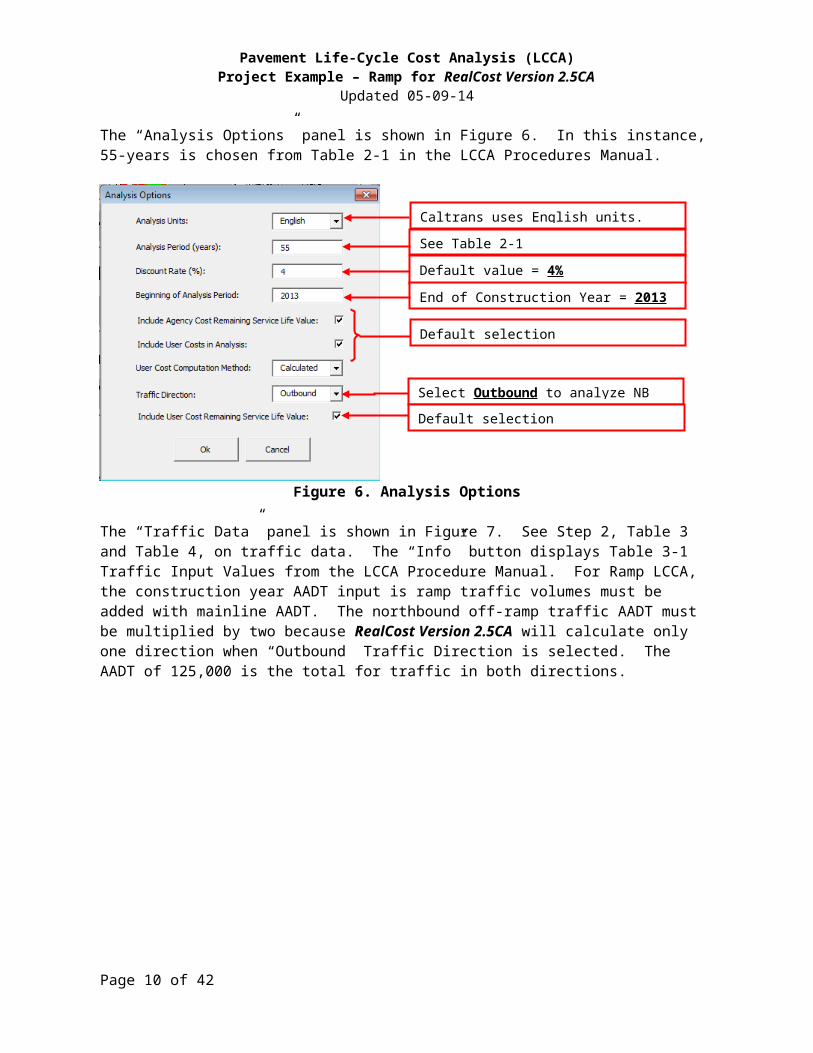
The “Analysis Options” panel is shown in Figure 6. In this instance, 55-years is chosen from Table 2-1 in the LCCA Procedures Manual.
Figure 6. Analysis Options
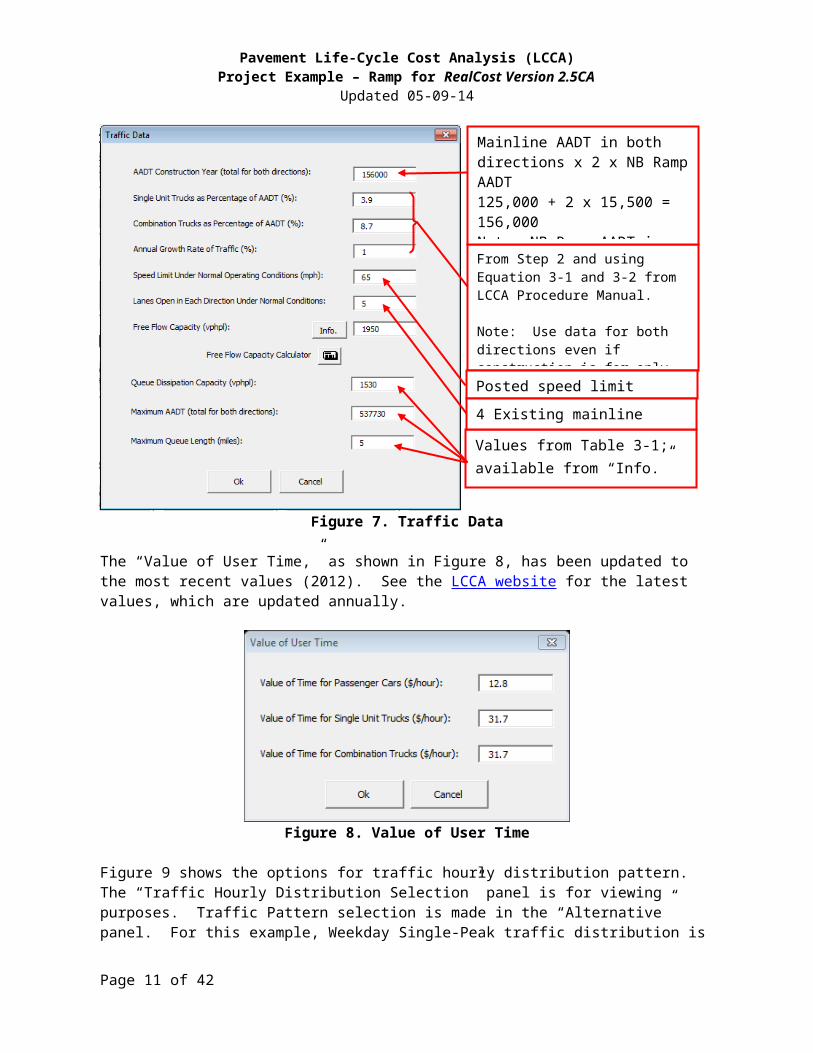
The “Traffic Data” panel is shown in Figure 7. See Step 2, Table 3 and Table 4, on traffic data. The “Info” button displays Table 3-1 Traffic Input Values from the LCCA Procedure Manual. For Ramp LCCA, the construction year AADT input is ramp traffic volumes must be added with mainline AADT. The northbound off-ramp traffic AADT must be multiplied by two because RealCost Version 2.5CA will calculate only one direction when “Outbound” Traffic Direction is selected. The AADT of 125,000 is the total for traffic in both directions.
Page 7 of 35
Approximate length of off-ramp in miles.
Default value = 4%
End of Construction Year = 2013
Select Outbound to analyze NB off-ramp
Default selection
Default selection
See Table 2-1
Caltrans uses English units.

Pavement Life-Cycle Cost Analysis (LCCA)Project Example – Ramp for RealCost Version 2.5CA
Updated 05-09-14
Figure 7. Traffic Data
The “Value of User Time,” as shown in Figure 8, has been updated to the most recent values (2012). See the LCCA website for the latest values, which are updated annually.
Figure 8. Value of User Time
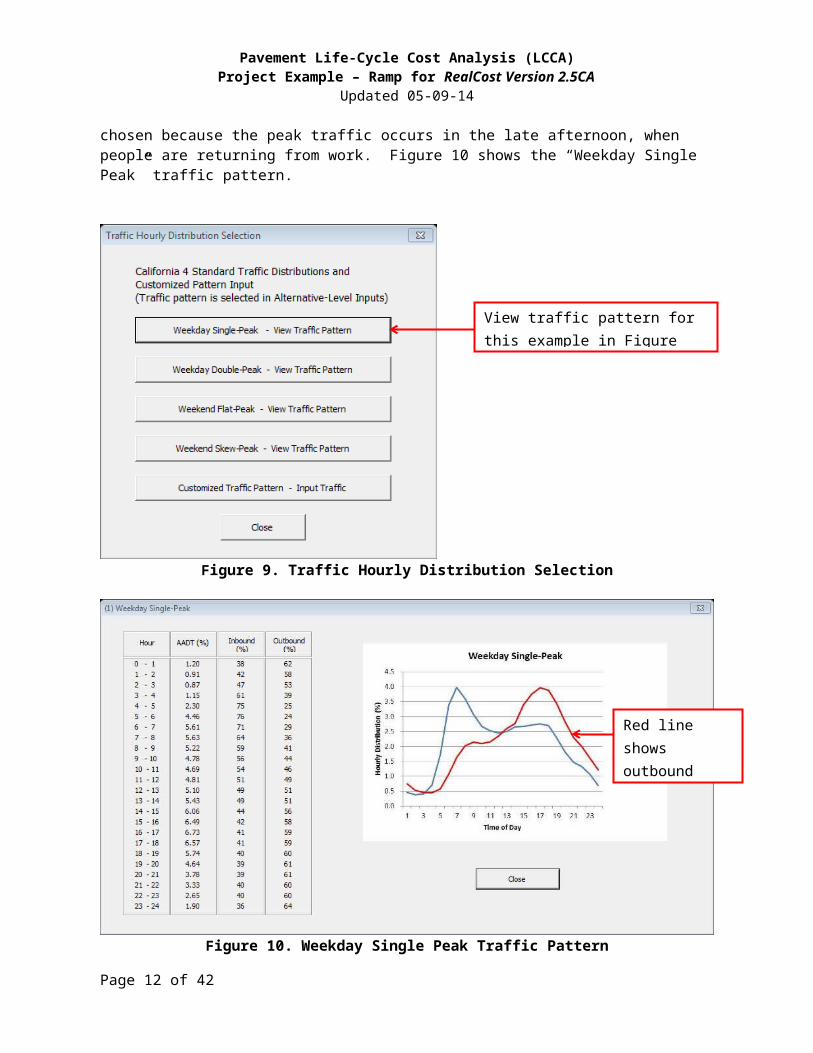
Figure 9 shows the options for traffic hourly distribution pattern. The “Traffic Hourly Distribution Selection” panel is for viewing purposes. Traffic Pattern selection is made in the “Alternative” panel. For this example, Weekday Single-Peak traffic distribution is chosen because the peak traffic occurs in the late afternoon, when people are returning from work. Figure 10 shows the “Weekday Single Peak” traffic pattern.
Page 8 of 35
Values from Table 3-1; available from “Info.” button.
From Step 2 and using Equation 3-1 and 3-2 from LCCA Procedure Manual.
Note: Use data for both directions even if construction is for only one direction.
Posted speed limit
4 Existing mainline lanes + 1 ramp lane
Mainline AADT in both directions x 2 x NB Ramp AADT125,000 + 2 x 15,500 = 156,000Note: NB Ramp AADT is multiplied twice since Outbound analysis was selected.

Pavement Life-Cycle Cost Analysis (LCCA)Project Example – Ramp for RealCost Version 2.5CA
Updated 05-09-14
Figure 9. Traffic Hourly Distribution Selection
Figure 10. Weekday Single Peak Traffic Pattern
Figure 11 shows the “Added Time and Vehicle Stopping Costs” panel. Update to the most current Consumer Price Index (CPI) value with the “Current Year” as the end of construction year. Visit the LCCA website for the most current CPI information, which is updated annually.
Page 9 of 35
View traffic pattern for this example in Figure 10.
Red line shows outbound traffic distribution.
Pavement Life-Cycle Cost Analysis (LCCA)Project Example – Ramp for RealCost Version 2.5CA
Updated 05-09-14
Figure 11. Escalated Values for “Added Time and Vehicle Stopping Costs”
With the “Project Level Input” completed, the “Alternative Level Inputs” are started with the “M & R Sequence Selection” as shown in Figure 12. Per the flowchart shown in Figure 2, three alternatives are chosen, HMA (20 Year), HMA W/RHMA (40 Year), and JPCP (40 Year). A check mark must be selected by each pavement alternative to be analyzed. Up to four pavement alternatives may be chosen for LCCA per run. Future M&R sequences are automatically transferred to the “Alternative” panel.
Page 10 of 35
Update to most recent CPI Value
End of construction year
Click “Escalate” once.
Pavement Life-Cycle Cost Analysis (LCCA)Project Example – Ramp for RealCost Version 2.5CA
Updated 05-09-14
Figure 12. “M & R Selection Sequence”
Figure 13 shows “Alternative 1”, with “Activity 1”. “Activity 1” for each pavement alternative is the initial construction, and the “Agency Construction Cost” must be manually computed and entered. For this example, refer to Table 5 for the three “Activity 1” cost estimates.
The lane closure times were received from the Traffic Management Unit, and the military time is used with hours only. It is assumed that during initial construction, the ramp lane will be closed 24 hours behind k-rail, and it is estimated that it will take 20 lane closure days to construction the ramp.
Estimate the total number of closure days to construct the ramp and enter the value in Work Zone Duration.
Page 11 of 35
Check here for each pavement alternative to be analyzed.
Pavement Life-Cycle Cost Analysis (LCCA)Project Example – Ramp for RealCost Version 2.5CA
Updated 05-09-14
Figure 13. Alternative 1, Activity 1, HMA (20 Year) Initial Construction
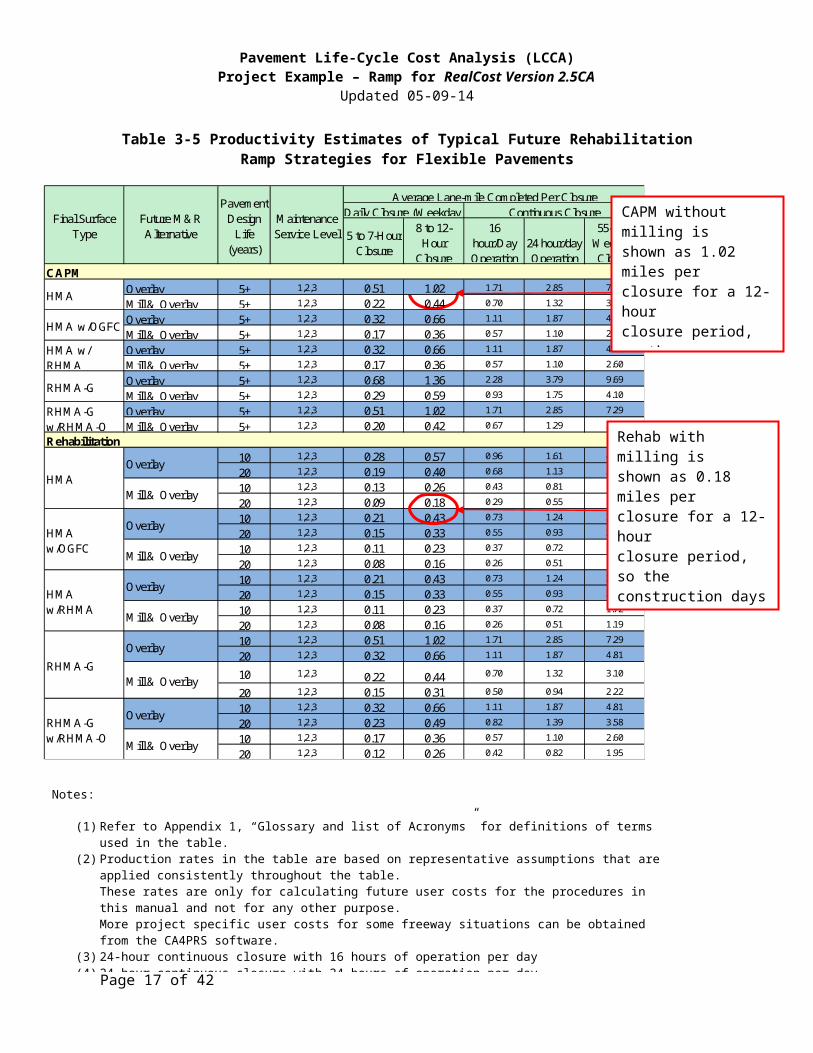
Use the production rate tables to develop Work Zone Duration Days. Use Table 3-5, “Productivity Estimates of Typical Future Rehabilitation Ramp Strategies for Flexible Pavements” from the LCCA Procedures Manual for this pavement alternative. Figure 14 illustrates the use of Table 3-5 to determine “Work Zone Duration”.
Figure 15 shows the next activity, “Activity 2”.
Page 12 of 35
“Agency Construction Cost” to be manually calculated and entered for “Activity 1”
Manually calculate/input for widening projects.
Project length x # lanes in a direction x Annual maintenance cost

Pavement Life-Cycle Cost Analysis (LCCA)Project Example – Ramp for RealCost Version 2.5CA
Updated 05-09-14
Table 3-5 Productivity Estimates of Typical Future Rehabilitation Ramp Strategies for Flexible Pavements
Page 13 of 35
Notes:
(1) Refer to Appendix 1, “Glossary and list of Acronyms” for definitions of terms used in the table.(2) Production rates in the table are based on representative assumptions that are applied consistently throughout the
table. These rates are only for calculating future user costs for the procedures in this manual and not for any other purpose. More project specific user costs for some freeway situations can be obtained from the CA4PRS software.
(3) 24-hour continuous closure with 16 hours of operation per day(4) 24-hour continuous closure with 24 hours of operation per day(5) 55-hour extended closure over the weekend
Figure 14. Illustration of use of Table 3.5
5 to 7-Hour Closure
8 to 12-Hour
Closure
16 hour/Day Operation
24 hour/day Operation
55-hour Weekend Closure
Overlay 5+ 1,2,3 0.51 1.02 1.71 2.85 7.29
Mill & Overlay 5+ 1,2,3 0.22 0.44 0.70 1.32 3.10
Overlay 5+ 1,2,3 0.32 0.66 1.11 1.87 4.81
Mill & Overlay 5+ 1,2,3 0.17 0.36 0.57 1.10 2.60
Overlay 5+ 1,2,3 0.32 0.66 1.11 1.87 4.81
Mill & Overlay 5+ 1,2,3 0.17 0.36 0.57 1.10 2.60
Overlay 5+ 1,2,3 0.68 1.36 2.28 3.79 9.69
Mill & Overlay 5+ 1,2,3 0.29 0.59 0.93 1.75 4.10
Overlay 5+ 1,2,3 0.51 1.02 1.71 2.85 7.29
Mill & Overlay 5+ 1,2,3 0.20 0.42 0.67 1.29 3.05
10 1,2,3 0.28 0.57 0.96 1.61 4.13
20 1,2,3 0.19 0.40 0.68 1.13 2.90
10 1,2,3 0.13 0.26 0.43 0.81 1.92
20 1,2,3 0.09 0.18 0.29 0.55 1.30
10 1,2,3 0.21 0.43 0.73 1.24 3.19
20 1,2,3 0.15 0.33 0.55 0.93 2.40
10 1,2,3 0.11 0.23 0.37 0.72 1.72
20 1,2,3 0.08 0.16 0.26 0.51 1.19
10 1,2,3 0.21 0.43 0.73 1.24 3.19
20 1,2,3 0.15 0.33 0.55 0.93 2.40
10 1,2,3 0.11 0.23 0.37 0.72 1.72
20 1,2,3 0.08 0.16 0.26 0.51 1.19
10 1,2,3 0.51 1.02 1.71 2.85 7.29
20 1,2,3 0.32 0.66 1.11 1.87 4.81
10 1,2,3 0.22 0.44 0.70 1.32 3.10
20 1,2,3 0.15 0.31 0.50 0.94 2.22
10 1,2,3 0.32 0.66 1.11 1.87 4.81
20 1,2,3 0.23 0.49 0.82 1.39 3.58
10 1,2,3 0.17 0.36 0.57 1.10 2.60
20 1,2,3 0.12 0.26 0.42 0.82 1.95
HMA w/ RHMA
HMA
HMA w/OGFC
Final Surface Type
Future M&R Alternative
Pavement Design
Life (years)
Maintenance Service Level
Average Lane-mile Completed Per ClosureDaily Closure (Weekday) Continuous Closure
CAPM
Rehabilitation
HMAOverlay
Mill & Overlay
RHMA-G
RHMA-G w/RHMA-O
Mill & Overlay
HMA w/RHMA
Overlay
HMA w/OGFC
Mill & Overlay
Overlay
RHMA-G w/RHMA-O
Overlay
RHMA-G
Mill & Overlay
Mill & Overlay
Overlay
CAPM without milling is shown as 1.02 miles per closure for a 12-hourclosure period, so the construction days for Activity 2 would be “1” since the ramp is 0.5 mile in length. (Act. 2)
Rehab with milling is shown as 0.18 miles per closure for a 12-hourclosure period, so the construction days for Activity 2 would be “3” since the ramp is 0.5 mile in length. (Act. 3)Ramp length/production rate= construction days

Pavement Life-Cycle Cost Analysis (LCCA)Project Example – Ramp for RealCost Version 2.5CA
Updated 05-09-14
Figure 15. “Alternative 1”, “Activity 2” HMA CAPM
To estimate the Agency Construction Cost, select the “Cost” button. Since this activity is a CAPM, select the CAPM “Flexible or Composite” button, as shown in Figure 16.
Figure 16. Cost Estimate Calculator Panel
Page 14 of 35
Use this calculator button for “Alternative 1”, “Activity 2”, CAPM
“Agency Construction Cost” for Activity 2 and beyond to be calculated by the RealCost Version 2.5CA program calculator for all activities except for “Activity 1”.

Pavement Life-Cycle Cost Analysis (LCCA)Project Example – Ramp for RealCost Version 2.5CA
Updated 05-09-14
After the “Flexible or Composite” button is selected, the “CAPM Flexible or Composite Pavement” panel as shown in Figure 17. The inputs for CAPM are Pavement Area, Milling Area, and RHMA or HMA choice of pavement.
Assumptions:
1. There is no milling. 2. The area is calculated to be 10,560 sq. yd. from Table 5.3. The overlay is HMA.
Figure 17. CAPM for Flexible or Composite Pavement Cost Calculator
By selecting the “OK” button, the “Agency Construction Cost” is automatically entered on the “Alternative 1, Activity 2” panel as shown in Figure 15. Next, select the “Alternative 1”, “Activity 3” button, which leads to a “Rehabilitation” activity in the “M&R Sequence”.
Again, enter the activity description as shown in Figure 18. Then select the “Cost” button. For this activity, select the Rehabilitation “Flexible or Composite” cost estimate button as shown in Figure 19.
Page 15 of 35
Manually enter the Pavement Area (SY) Total Project Cost is automatically entered on the “Alternative 1” panel

Pavement Life-Cycle Cost Analysis (LCCA)Project Example – Ramp for RealCost Version 2.5CA
Updated 05-09-14
Figure 18. Alternative 1, Activity 3, M & R Rehabilitation
Figure 19. Cost Estimate Calculator Panel
After the “Flexible or Composite” button is selected, the “Rehabilitation Flexible or Composite Pavement” panel as shown in Figure 19. The inputs for Rehabilitation are Pavement Area, Milling Area, and RHMA or HMA choice of pavement.
Page 16 of 35
Use this calculator button for Alternative 1, Activity 3, Rehab
Pavement Life-Cycle Cost Analysis (LCCA)Project Example – Ramp for RealCost Version 2.5CA
Updated 05-09-14
Assumptions:1. There is milling. 2. The area is calculated to be 10,560 sq. yd. from Table 5.3. The overlay is HMA and RHMA.
Table 3-5, “Productivity Estimates of Typical Future Rehabilitation Ramp Strategies for Flexible Pavements” as shown in Figure 14 calculates to be 3 days.
Click on the Pavement Cost button as shown in Figure 20 to begin the Rehabilitation Cost Estimate.
Figure 20. Rehabilitation Flexible or Composite Pavement Cost Calculator
After the “Pavement Cost” button is selected, the “Pavement Selection” panel estimates the future Rehabilitation pavement structure. Enter or select the Traffic Index and the existing structure depth. Select the Pavement Option for “Overlay” or “Mill and Overlay”. Finally, click on “Use Selected Structure” to estimate the pavement cost as shown in Figure 21.
Page 17 of 35
“Pavement Cost” button allows a pavement structure to be selected based on TI.

Pavement Life-Cycle Cost Analysis (LCCA)Project Example – Ramp for RealCost Version 2.5CA
Updated 05-09-14
Figure 21. Pavement Structure Selection Section
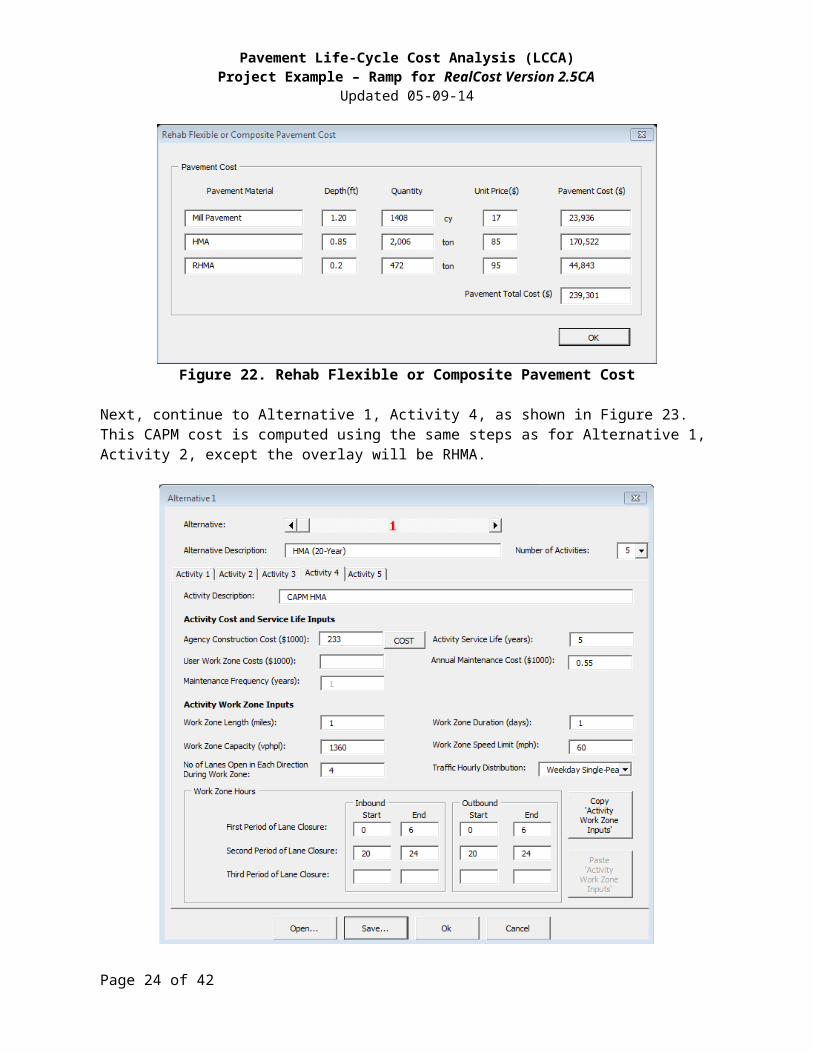
When the “Use Selected Structure” key is selected in Figure 21, the panel for “Rehab Flexible or Composite Pavement Cost” is shown in Figure 22. When the “OK” button is clicked, the “Alternative 1” panel is shown with the computed cost.
Figure 22. Rehab Flexible or Composite Pavement Cost
Page 18 of 35
13
HDM designates TI’s for ramps based on surrounding areas.

Pavement Life-Cycle Cost Analysis (LCCA)Project Example – Ramp for RealCost Version 2.5CA
Updated 05-09-14
Next, continue to Alternative 1, Activity 4, as shown in Figure 23. This CAPM cost is computed using the same steps as for Alternative 1, Activity 2, except the overlay will be RHMA.
Figure 23. Alternative 1, Activity 4, CAPM with Program Calculated “Agency Construction Cost”
Next go to Alternative 1, Activity 5, which is another Rehabilitation as shown in Figure 24. This Rehabilitation cost is computed the same way as Alternative 1, Activity 3 was computed.
Assumptions:1. There is milling. 2. The area is calculated to be 10,560 sq. yd. from Table 5.3. The overlay is HMA and RHMA.
Table 3-5, “Productivity Estimates of Typical Future Rehabilitation Ramp Strategies for Flexible Pavements” as shown in Figure 14 calculates to be 3 days.
Page 19 of 35

Pavement Life-Cycle Cost Analysis (LCCA)Project Example – Ramp for RealCost Version 2.5CA
Updated 05-09-14
Figure 24. Alternative 1, Activity 5, REHAB with Program Calculated “Agency Construction Cost”
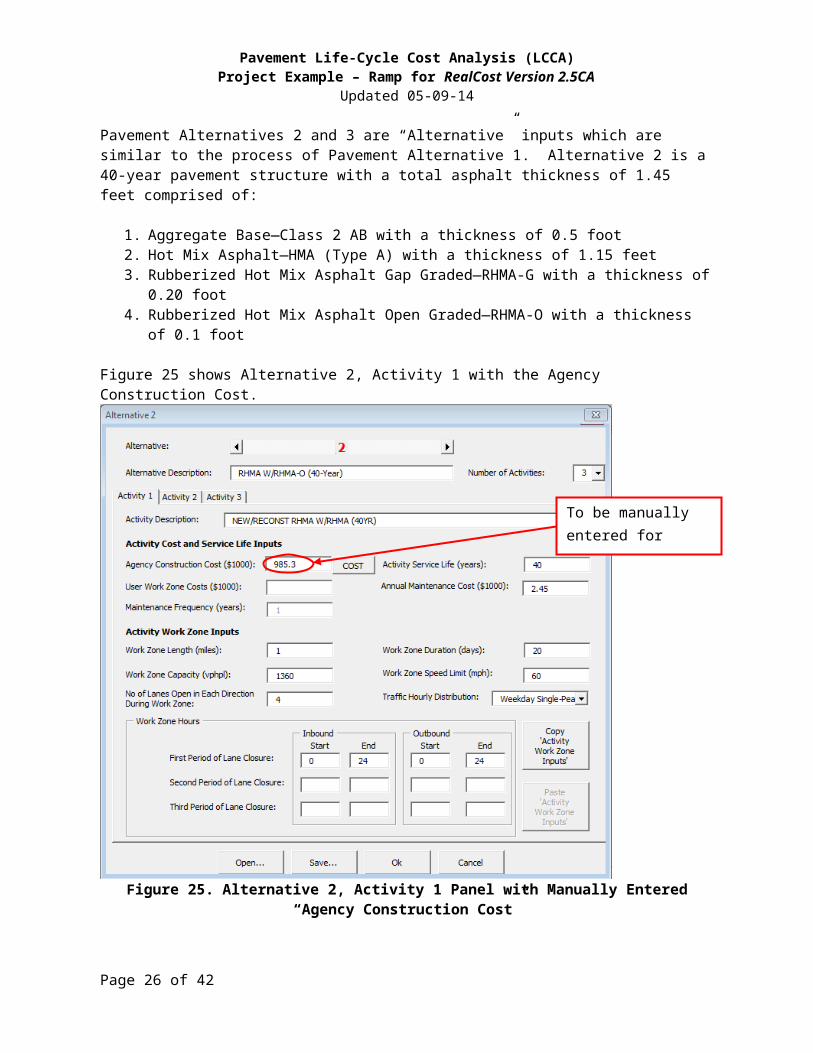
Pavement Alternatives 2 and 3 are “Alternative” inputs which are similar to the process of Pavement Alternative 1. Alternative 2 is a 40-year pavement structure with a total asphalt thickness of 1.45 feet comprised of:
1. Aggregate Base—Class 2 AB with a thickness of 0.5 foot2. Hot Mix Asphalt—HMA (Type A) with a thickness of 1.15 feet3. Rubberized Hot Mix Asphalt Gap Graded—RHMA-G with a thickness of 0.20 foot4. Rubberized Hot Mix Asphalt Open Graded—RHMA-O with a thickness of 0.1 foot
Figure 25 shows Alternative 2, Activity 1 with the Agency Construction Cost.
Page 20 of 35

Pavement Life-Cycle Cost Analysis (LCCA)Project Example – Ramp for RealCost Version 2.5CA
Updated 05-09-14
Figure 25. Alternative 2, Activity 1 Panel with Manually Entered “Agency Construction Cost”
Next go to Alternative 2, Activity 2, as shown in Figure 26, for the next M & R sequence which is a CAPM. Click on the “Cost” button for the program to go to the “Cost Calculator” panel and choose the CAPM “Flexible or Composite” calculator button.
Page 21 of 35
To be manually entered for Activity 1

Pavement Life-Cycle Cost Analysis (LCCA)Project Example – Ramp for RealCost Version 2.5CA
Updated 05-09-14
Figure 26. Alternative 2, Activity 2
Figure 27. Cost Estimate Calculator Panel
Page 22 of 35
Use this calculator button for Alternative 2, Activity 2, CAPM

Pavement Life-Cycle Cost Analysis (LCCA)Project Example – Ramp for RealCost Version 2.5CA
Updated 05-09-14
Figure 28 shows the “CAPM Flexible or Composite Pavement” panel which computes the CAPM cost when the “Pavement Area (sy)” is entered, and the milling or no milling option is chosen. When the “OK” button is selected, the estimate is entered on Figure 28, Alternative 2, Activity 2. Next Alternative 2, Activity 3 is selected, as shown in Figure 29.
Figure 28. Alternative 2, Activity 2, CAPM Cost Calculator Panel
Page 23 of 35
Pavement Life-Cycle Cost Analysis (LCCA)Project Example – Ramp for RealCost Version 2.5CA
Updated 05-09-14
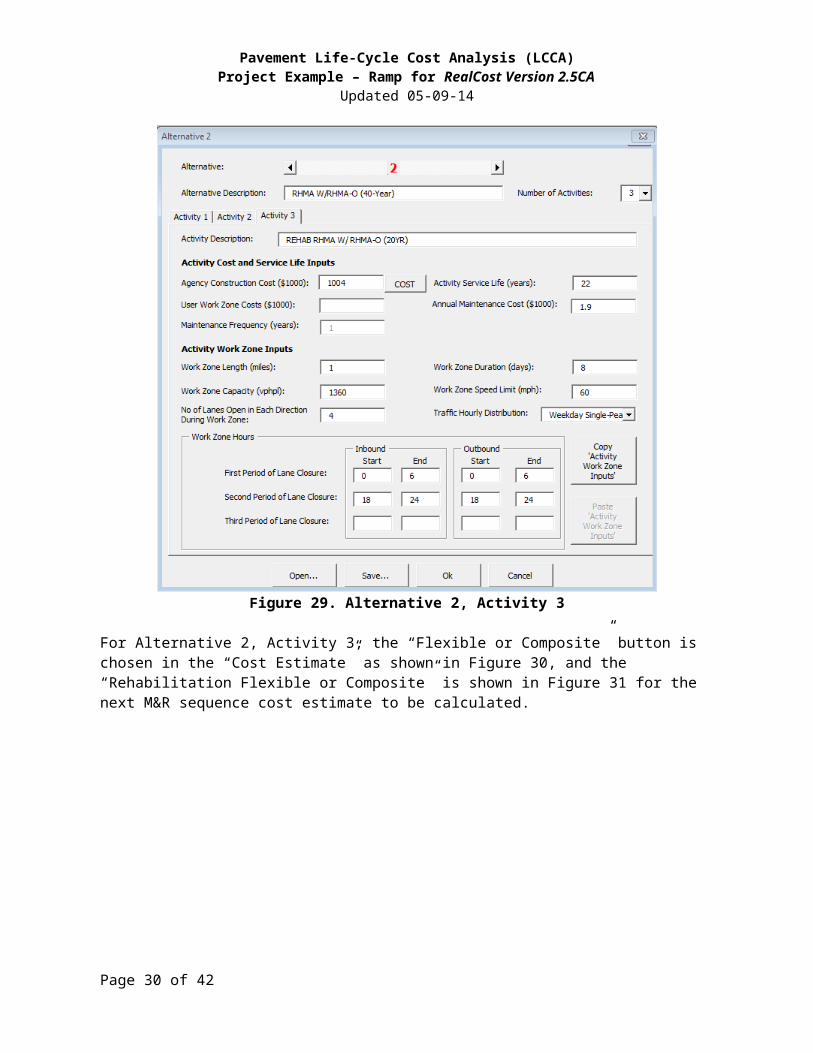
Figure 29. Alternative 2, Activity 3
For Alternative 2, Activity 3, the “Flexible or Composite” button is chosen in the “Cost Estimate” as shown in Figure 30, and the “Rehabilitation Flexible or Composite” is shown in Figure 31 for the next M&R sequence cost estimate to be calculated.
Figure 30. Cost Estimate Selection Panel
Page 24 of 35
Use this calculator button for Alternative 2, Activity 3, CAPM

Pavement Life-Cycle Cost Analysis (LCCA)Project Example – Ramp for RealCost Version 2.5CA
Updated 05-09-14
When the “Flexible or Composite” button is selected, Figure 31 appears. This panel allows the rehabilitation costs to be computed. For this example, there is a sacrificial RHMA-O that must be removed as part of the rehabilitation, and the flexible shoulder area needed to be part of the input, as well and “Pavement Cost”. When the cost button is selected, Figure 32, the “Traffic Index” panel is the next action.
Figure 31. Alternative 2, Activity 3, Rehabilitation Cost Calculator Panel
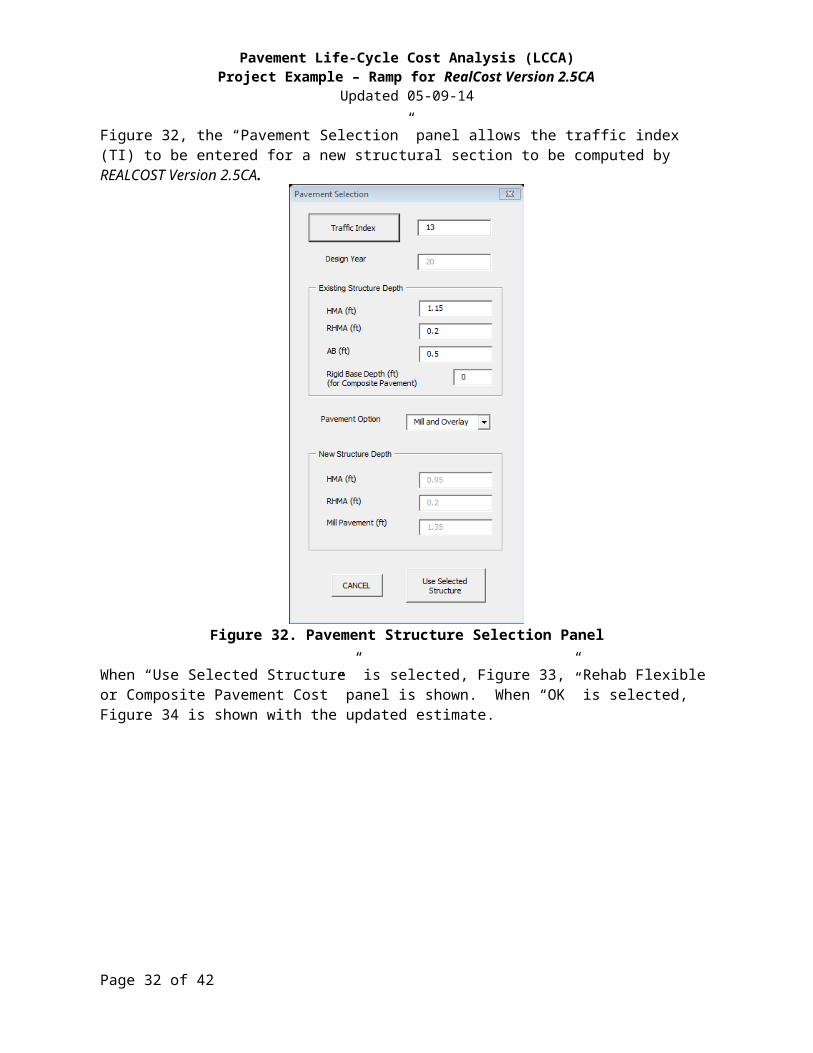
Figure 32, the “Pavement Selection” panel allows the traffic index (TI) to be entered for a new structural section to be computed by REALCOST Version 2.5CA.
Page 25 of 35
“Pavement Cost” button allows a pavement structure to be selected based on TI.
Pavement Life-Cycle Cost Analysis (LCCA)Project Example – Ramp for RealCost Version 2.5CA
Updated 05-09-14
Figure 32. Pavement Structure Selection Panel
When “Use Selected Structure” is selected, Figure 33,” Rehab Flexible or Composite Pavement Cost” panel is shown. When “OK” is selected, Figure 34 is shown with the updated estimate.
Figure 33. Rehabilitation for Flexible or Composite Pavement with Milling
Page 26 of 35

Pavement Life-Cycle Cost Analysis (LCCA)Project Example – Ramp for RealCost Version 2.5CA
Updated 05-09-14
Figure 34. Alternative 2, Activity 3 REHAB with Calculated Cost from RealCost Version 2.5CA
With Alternative 2 completed, scroll to Alternative 3.
Alternative 3 is a 40-year pavement structure with a total structure thickness of 1.85 feet comprised of:
1. Aggregate Base—Class 2 AB with a thickness of 0.6 foot2. Lean Concrete Base—LCB with a thickness of 0.35 foot3. Jointed Plain Concrete Pavement—JPCP with a thickness of 0.90 foot
Page 27 of 35

Pavement Life-Cycle Cost Analysis (LCCA)Project Example – Ramp for RealCost Version 2.5CA
Updated 05-09-14
Figure 35. Alternative 3, Activity 1 with Manually Entered “Agency Construction Cost”
Next, scroll to “Activity 2” which is a CAPM with 2% distressed concrete panels for JPCP. Select the “Cost” button and Figure 37, will be shown. Select “CAPM”, “Rigid Pavement” from the “Cost Estimate” panel. Figure 38, “CAPM Rigid Pavement” panel is shown, next select CPR Type C for 2% Distress Panels with the proper input for concrete depth (feet), and area (square yards). The cost is computed, and when the “OK” button is selected, the Alternative 3, Activity 2 panel has the updated “Agency Construction Cost”.
Page 28 of 35
To be manually calculated entered for Activity 1

Pavement Life-Cycle Cost Analysis (LCCA)Project Example – Ramp for RealCost Version 2.5CA
Updated 05-09-14
Figure 36. Alternative 3, Activity 2 for JPCP
Figure 37. Cost Estimate Calculator Panel
Next for Figure 38, “CAPM Rigid Pavement” panel, input the % distress, pavement area mainline, pavement area shoulders, and pavement depth and select “OK”.
Page 29 of 35
Use this calculator button for Alternative 3, Activity 2, CAPM
Pavement Life-Cycle Cost Analysis (LCCA)Project Example – Ramp for RealCost Version 2.5CA
Updated 05-09-14
Figure 38. CAPM Rigid Pavement Panel with CPR Type C for 2% Distress Panels
After “OK” is selected in Figure 38, the Alternative panel appears with updated costs, as shown in Figure 39, “Alternative 3”. Next, scroll to “Activity 3” in this panel. Figure 40 shows “Alternative 3”, “Activity 3”.
Page 30 of 35

Pavement Life-Cycle Cost Analysis (LCCA)Project Example – Ramp for RealCost Version 2.5CA
Updated 05-09-14
Figure 39. Alternative 3, Activity 2 with Program Generated “Agency Construction Cost”
Page 31 of 35
Pavement Life-Cycle Cost Analysis (LCCA)Project Example – Ramp for RealCost Version 2.5CA
Updated 05-09-14
Figure 40. Alternative 3, Activity 3 for CPR B, or 5% Distress
The “Cost” button is selected, and Figure 41, the “Cost Estimate” panel is shown. Select the CAPM Rigid button, and the “CAPM Rigid Pavement” panel is shown in Figure 42.
Figure 41. Cost Estimate Calculator PanelNext for Figure 42, “CAPM Rigid Pavement” panel, input the % distress, pavement area mainline, pavement area shoulders, and pavement depth and select “OK”.
Page 32 of 35
Use this calculator button for Alternative 3, Activity 3, CAPM

Pavement Life-Cycle Cost Analysis (LCCA)Project Example – Ramp for RealCost Version 2.5CA
Updated 05-09-14
Figure 42. CAPM Rigid Pavement Panel for CPR B or 5% Distress
After “OK” is selected in Figure 42, the Alternative panel appears with updated costs, as shown in Figure 43, “Alternative 3”. This concludes the cost estimates for all the alternatives and activities.
Page 33 of 35

Pavement Life-Cycle Cost Analysis (LCCA)Project Example – Ramp for RealCost Version 2.5CA
Updated 05-09-14
Figure 43. Alternative 3, Activity 3 after Program Cost Calculated by RealCost Version 2.5CA
Step 5. Conclusion Once all inputs are entered and warnings checked, Figure 44 shows the Deterministic Results.
Figure 44. Deterministic Results Generated by RealCost
Page 34 of 35

Pavement Life-Cycle Cost Analysis (LCCA)Project Example – Ramp for RealCost Version 2.5CA
Updated 05-09-14
The total life-cycle cost is the sum of the total agency cost and total user cost as summarized in Table 6 below:
Table 6 – Summary of Total CostsPavement Alternatives Total Life-Cycle Cost for 55 Year Analysis Period (Present Value)
Alt. No. Alternative Description Total Life-Cycle Cost1 Hot Mix Asphalt (20-Year) $3,701,6002 Hot Mix Asphalt with Rubberized Hot Mix Asphalt (40-Year) $3,421,1403 Jointed Plain Concrete Pavement (40-Year) $3,038,330
Result of this analysis has confirmed that Pavement Alternative 3, JPCP, has the lowest overall cost of construction, maintenance and user delay; therefore, JPCP will be the preferred pavement alternative for this interchange project.
Step 6. Documentation
To document life-cycle costs in project documents follow the procedures in Appendix O-O of the Project Development Procedures Manual (PDPM). When the pavement alternative with the lowest life-cycle cost is not selected, the reasons must also be documented.
Also, submit your LCCA to HQ for data collection. Per PDPM Appendix O-O, a copy of the completed project initiation document, project report, or project scope summary report with life-cycle costs included shall be sent to:
Attn: HQ Program AdvisorHQ Division of Maintenance, Pavement Program2389 Gateway Oaks, Suite 200, MS 91Sacramento, CA 95833
Or
An alternative is to submit a RealCost LCCA Report.
Page 35 of 35
Related Documents