LCCA Design and Maintenance John Cunningham Iowa Concrete Paving Association ASCE Conference November 6, 2013 www.iowaconcretepaving.org

Welcome message from author
This document is posted to help you gain knowledge. Please leave a comment to let me know what you think about it! Share it to your friends and learn new things together.
Transcript

LCCA Design and
Maintenance John Cunningham
Iowa Concrete Paving Association ASCE Conference November 6, 2013
www.iowaconcretepaving.org

Life Cycle Cost Analysis
Life cycle cost analysis (LCCA) is an economic
procedure to compare competing design alternates…
www.iowaconcretepaving.org
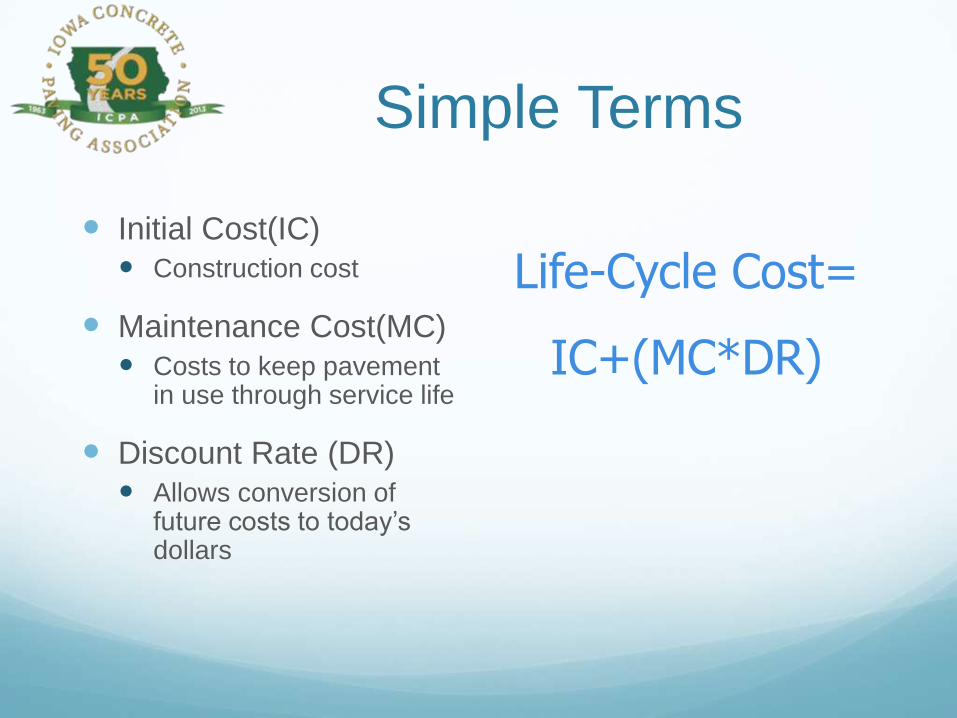
Simple Terms
Initial Cost(IC)
Construction cost
Maintenance Cost(MC)
Costs to keep pavement in use through service life
Discount Rate (DR)
Allows conversion of future costs to today’s dollars
Life-Cycle Cost=
IC+(MC*DR)
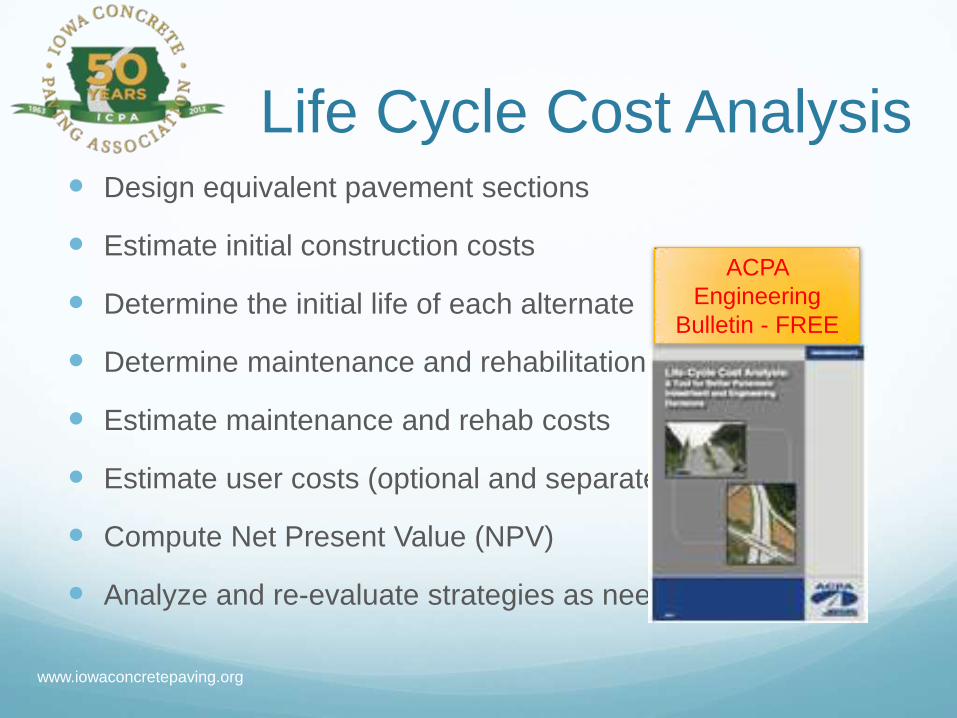
Life Cycle Cost Analysis Design equivalent pavement sections
Estimate initial construction costs
Determine the initial life of each alternate
Determine maintenance and rehabilitation
Estimate maintenance and rehab costs
Estimate user costs (optional and separate)
Compute Net Present Value (NPV)
Analyze and re-evaluate strategies as needed
ACPA
Engineering
Bulletin - FREE
www.iowaconcretepaving.org

Life Cycle Cost Analysis
Design
Maintenance
Analysis
Engineering factors
Economic factors
It’s important
to remember
the context of
the process as
a comparison
www.iowaconcretepaving.org

Bear Traps Appropriate analysis period
Equivalent designs
Realistic maintenance activities
Accurate cost estimates
Correct discount rate
www.iowaconcretepaving.org

Design Full-depth or overlay?
Equivalent design life
Sets the LCCA term or analysis period
AASHTO design guides
Darwin ME
MEPDG
AASHTO 93
ACPA
StreetPave
WinPAS
Both have LCCA components
Both available free from ICPA
www.iowaconcretepaving.org
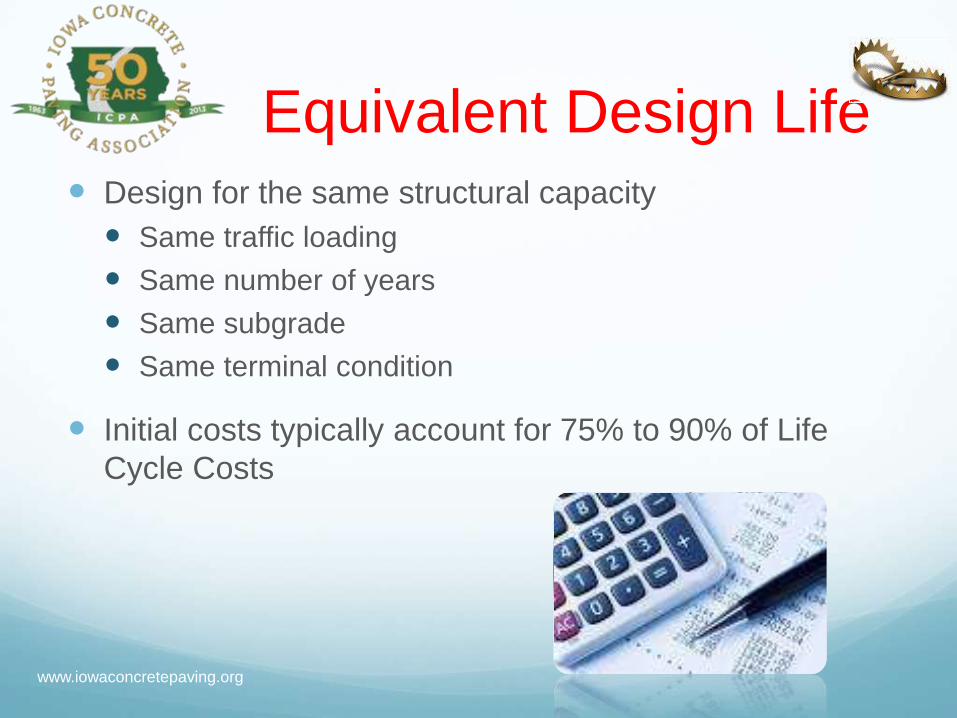
Equivalent Design Life Design for the same structural capacity
Same traffic loading
Same number of years
Same subgrade
Same terminal condition
Initial costs typically account for 75% to 90% of Life
Cycle Costs
www.iowaconcretepaving.org

Equivalent Design Life Same traffic loading
Same number of years
Same and reasonable subgrade support value
Vast variability in Iowa soils
Research is suggesting lower than estimated values
Caution if…
K > 200
CBR > 3
MR > 3,100
www.iowaconcretepaving.org
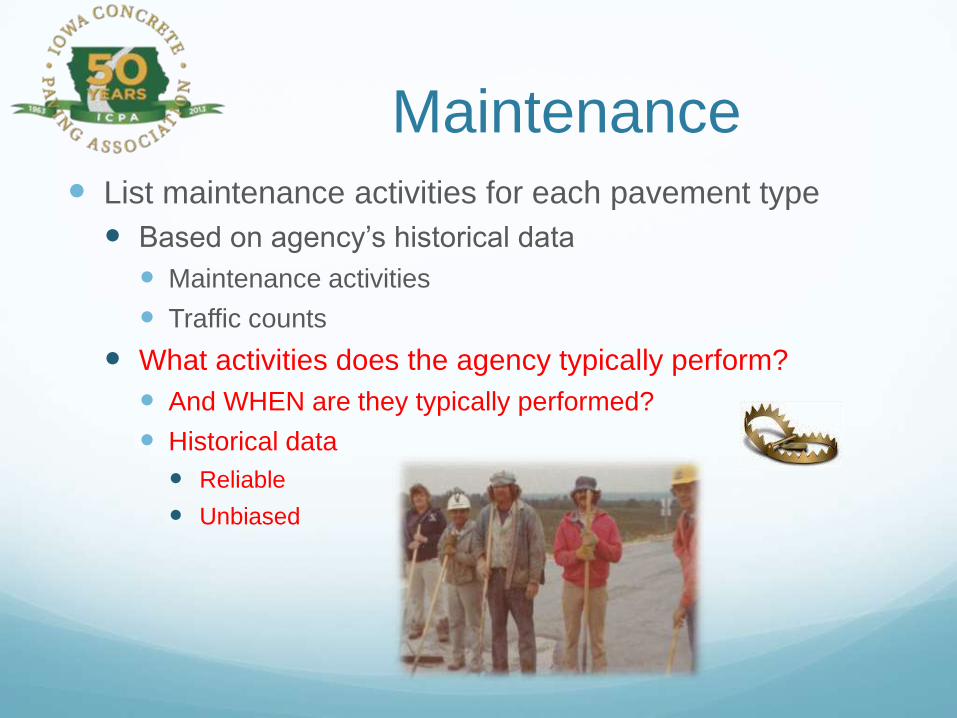
Maintenance List maintenance activities for each pavement type
Based on agency’s historical data
Maintenance activities
Traffic counts
What activities does the agency typically perform?
And WHEN are they typically performed?
Historical data
Reliable
Unbiased

30 Year
Analysis
Concrete Asphalt
Year 0 (construction) (construction)
Year 10 •Joint rehab --
Year 15 -- •Patching
•Overlay
•Base clean &
prep
•Binder
•Surface
•Asphalt
cement
•Shoulders
•Traffic control
•Mobilization
•Samples
•Lab
Year 20 •Joint rehab --
Year 30 •Joint rehab
•Patching
•Structural
overlay
•Shouldering
•Milling
•Patching
•Structural
overlay
•Shouldering
Example of LCCA
(Iowa DOT)

30 Year
Analysis
Concrete Asphalt
Year 0 (construction) (construction)
Year 10 •Joint rehab --
Year 15 -- •Patching
•Overlay
•Base clean &
prep
•Binder
•Surface
•Asphalt
cement
•Shoulders
•Traffic control
•Mobilization
•Samples
•Lab
Year 20 •Joint rehab --
Year 30 •Joint rehab
•Patching
•Structural
overlay
•Shouldering
•Milling
•Patching
•Structural
overlay
•Shouldering

Analysis Estimate initial costs
Estimate maintenance costs
Convert costs to present value
Estimating how economic factors of inflation and interest
might impact our comparison
After all, it is an economic comparison

Cost Estimates Calculate in today’s dollars
Based on actual cost data
Bid tabulations
From similar projects
ICPA retains files of bid tabs
Iowa DOT’s Price Trend Index Report
Concrete is reported by the square yard for 9” dowelled
Asphalt is reported by the ton
Indicator of trends

Cost Estimates Account for differential inflation rates
Each material has experienced different rates
LCCA is a comparison
The different rates must be accounted for
In order to get an accurate comparison of future costs
Mechanism for this is escalation

Escalation To account for differences in material specific inflation
rates, good economic practices say that we should use
a process known as “escalation”.
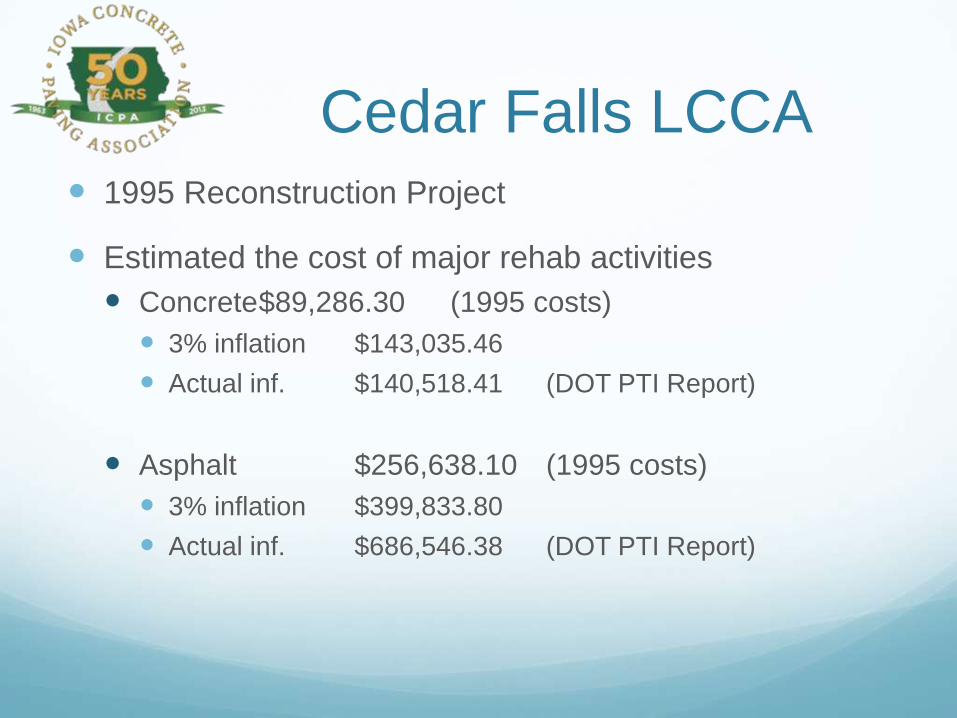
Cedar Falls LCCA 1995 Reconstruction Project
Estimated the cost of major rehab activities
Concrete $89,286.30 (1995 costs)
3% inflation $143,035.46
Actual inf. $140,518.41 (DOT PTI Report)
Asphalt $256,638.10 (1995 costs)
3% inflation $399,833.80
Actual inf. $686,546.38 (DOT PTI Report)

Cedar Falls LCCA

Escalation Gather actual rates of inflation for each material
Bureau of Labor Statistics
Producer Price Index
Iowa DOT
Price Trend Index Report
1986-2013
4.08% asphalt
3.04% concrete
Subtract general rate of inflation
Consumer price index
2.9%

Escalation Apply the difference to estimated costs
Concrete Costs X 1.0014 ^time to rehab
Asphalt Costs X 1.0118 ^time to rehab
Cedar Falls example
Concrete $39,432.57 X 1.0014 ^10 = $39,988.12
$49,853.73 X 1.0014 ^20 = $51,268.36
Asphalt $256,638.10 X 1.0118 ^15 = $306,013.97
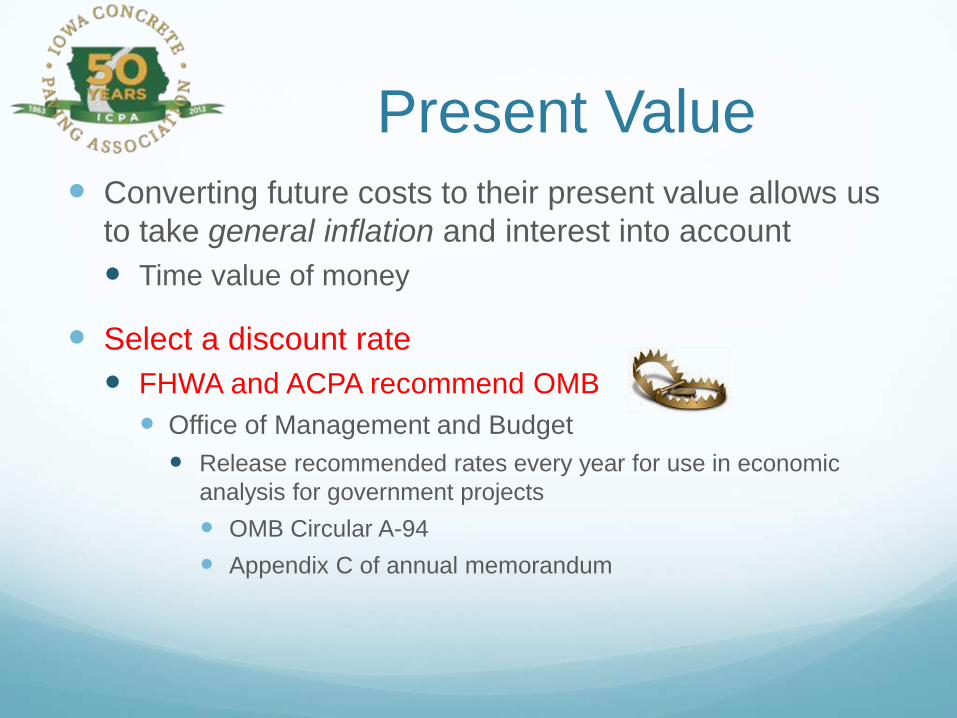
Present Value Converting future costs to their present value allows us
to take general inflation and interest into account
Time value of money
Select a discount rate
FHWA and ACPA recommend OMB
Office of Management and Budget
Release recommended rates every year for use in economic
analysis for government projects
OMB Circular A-94
Appendix C of annual memorandum
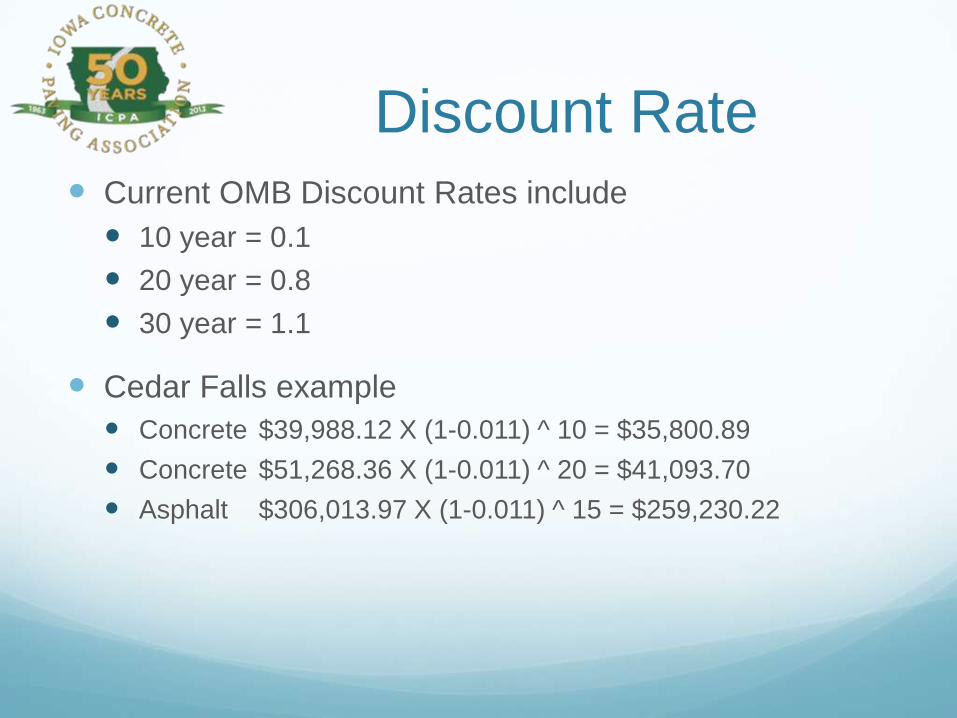
Discount Rate Current OMB Discount Rates include
10 year = 0.1
20 year = 0.8
30 year = 1.1
Cedar Falls example
Concrete $39,988.12 X (1-0.011) ^ 10 = $35,800.89
Concrete $51,268.36 X (1-0.011) ^ 20 = $41,093.70
Asphalt $306,013.97 X (1-0.011) ^ 15 = $259,230.22
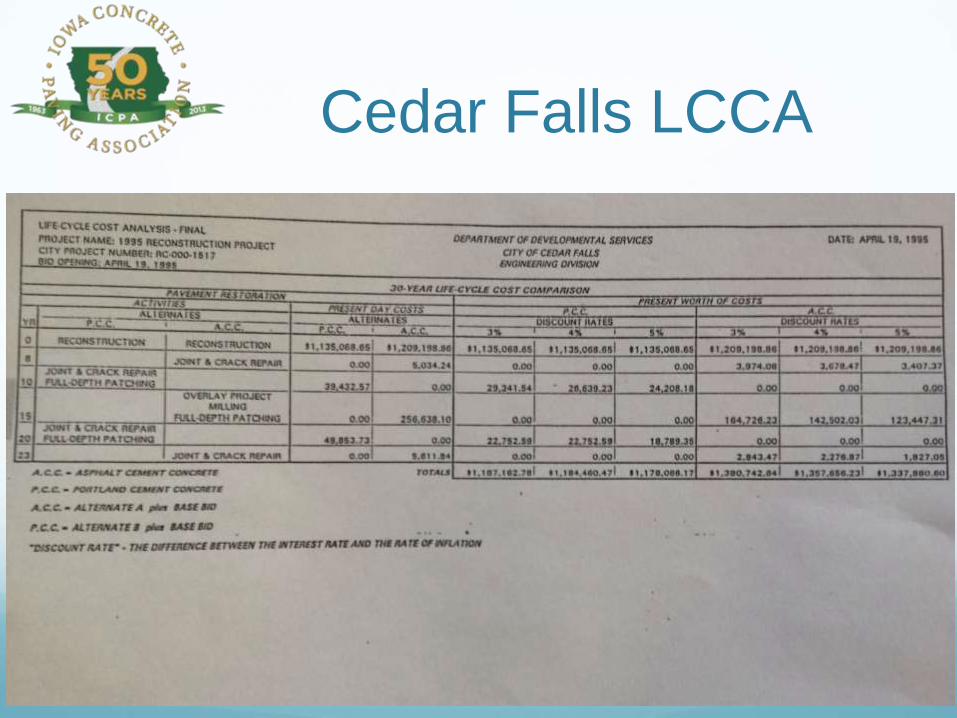
Cedar Falls LCCA

Questions?
Related Documents