79(2) 1 Kim Shelden ([email protected]), Julie Mocklin, Kim Goetz, Linda Vate Brattström, and Nancy Friday are with the Marine Mam- mal Laboratory (MML), Alaska Fisheries Sci- ence Center, National Marine Fisheries Service, NOAA, 7600 Sand Point Way N.E., Seattle, WA 98115-6349. Julie Mocklin and Linda Vate Brattström are currently with the Joint Institute for the Study of the Atmosphere and Ocean (JISAO), 3737 Brooklyn Ave NE, Seattle, WA 98105. Kim Goetz is currently with the National Late Summer Distribution of Cetaceans near Barrow, Alaska: Results from Aerial Surveys Conducted During the Bowhead Whale Feeding Ecology Study, 2007–11 KIM E. W. SHELDEN, JULIE A. MOCKLIN, KIMBERLY T. GOETZ, DAVID J. RUGH, LINDA VATE BRATTSTRÖM, and NANCY A. FRIDAY ABSTRACT—The aerial survey compo- nent of the Bowhead Whale Feeding Ecol- ogy Study (BOWFEST) was designed to document patterns and variability in the timing and distribution of bowhead whales, Balaena mysticetus, and to provide an es- timate of temporal and spatial habitat use near Barrow, Alaska. Aerial surveys were conducted from late August to mid-Septem- ber during the period 2007–11 for a total of 171.1 hours flown. In addition to the fo- cal species, observed species included gray whales, Eschrichtius robustus; one hump- back whale, Megaptera novaeangliae; be- luga whales, Delphinapterus leucas; ringed seals, Phoca hispida; bearded seals, Erigna- thus barbatus; walrus, Odobenus rosmarus; and polar bears, Ursus maritimus. Small pinnipeds, such as ringed seal and spotted seals, Phoca largha, were often difficult to differentiate and identify to species given the relatively high survey altitude of 310 m (1,000 ft). Habitat partitioning was evident among the cetacean species observed in great- est numbers: bowhead, gray, and beluga whales. Abundance estimates during this time period ranged from 22 (CV 0.80) to 213 (CV 0.30) bowhead whales, 1 (CV 1.01) to 18 (CV 0.28) gray whales, and 0 to 948 (CV 0.66) beluga whales. Standard deviation ellipses showed each species oc- cupied a unique region within the study area with slight overlaps occurring in some Introduction Bowhead whales, Balaena mystice- tus, are distributed in seasonally ice covered waters of the Arctic and sub- arctic. For management purposes, four bowhead whale stocks are currently recognized by the International Whal- ing Commission (IWC) (IWC, 2010) and are protected under the U.S. Ma- rine Mammal Protection Act and U.S. years. Bowhead distribution was oriented along the barrier islands and 20 m isobath on the continental shelf and also included parts of the Barrow Canyon and shelf break that were close to shore. Gray whale distri- bution oriented along the Barrow Canyon shelf break near the 50 m isobath; while beluga distribution ellipses centered over Barrow Canyon and offshore slope waters. A four-parameter presence-absence model (bathymetry, bathymetric slope, distance from shore, and distance from the shelf break) found both distance from shore and shelf break were significant in predicting the presence of bowhead whales. All four parameters were significant in predict- ing gray whale presence. Only bathymetry was significant in predicting beluga whale presence. During the 5-year study, 664 unique bow- head whales were identified from 1,415 pho- tographic images. Observers noted feeding behavior during 7–50% of sightings and 15–49% of photographed whales exhibited feeding behavior in any given year. Of the individual whales that were visually or pho- tographically identified as feeding, 81–90% were in shelf waters, and the majority of those were clustered around the 20 m iso- bath. More feeding behavior was observed and photographed during years when most sightings occurred on the shelf (2007, 2009, and 2010) but not necessarily in years when bowheads were most abundant in the study Endangered Species Act (Muto et al., 2016). These stocks occur in the Okhotsk Sea (Russian waters), Da- vis Strait and Hudson Bay (western Greenland and eastern Canadian wa- ters), the eastern North Atlantic (the Spitsbergen stock near Svalbard), and the Bering/Chukchi/Beaufort seas. The latter is the Western Arctic stock, the largest remnant popula- tion and only stock found within U.S. waters (Rugh et al., 2003), gener- ally north of lat. 54°N and south of lat. 75°N in the western Arctic Ba- sin (Moore and Reeves, 1993). This area (e.g., 2008 and 2010). The lowest per- cent feeding both visually and photographi- cally occurred in 2008, the only year whale swim direction was predominately westerly, and open mouth (skim) feeding behavior was not observed. Although the paucity of individual re- sightings (based on photographic recap- tures) between survey days (3 matches out of 664 identified whales) suggested very low residence times, the photogrammetric sam- ple (654 whales) was largely comprised of juveniles (65%). Young whales typically are unmarked and, therefore, not matched (only 3–6% were highly or moderately marked in at least one zone on the body). All intrayear matched whales moved east of their original sighting location, which was not expected so close to the westbound fall migration. The BOWFEST aerial study provides a 5-year record of late summer presence of cetaceans in the western Beaufort Sea, adding to the growing body of knowledge on these species and their habitat prefer- ences in this region. This information is particularly important since the western Beaufort Sea is undergoing rapid change as the bowhead whale population con- tinues to grow, other species extend their ranges and increase their numbers in the area, and industrial activity, commercial fishing, and shipping operations are ex- pected to increase in the Arctic as sea ice decreases. Institute of Water and Atmospheric Research, Ltd., 301 Evans Bay Parade, Greta Point, Wel- lington 6021 NZ. Dave Rugh (retired MML) is at 17416 95th Ave. NE, Bothell, WA 98011. The findings and conclusions in this paper are those of the author(s) and do not necessarily represent the views of the National Marine Fisheries Ser- vice, NOAA. doi: https://doi.org/10.7755/MFR.79.2.1

Welcome message from author
This document is posted to help you gain knowledge. Please leave a comment to let me know what you think about it! Share it to your friends and learn new things together.
Transcript

79(2) 1
Kim Shelden ([email protected]), Julie Mocklin, Kim Goetz, Linda Vate Brattström, and Nancy Friday are with the Marine Mam-mal Laboratory (MML), Alaska Fisheries Sci-ence Center, National Marine Fisheries Service, NOAA, 7600 Sand Point Way N.E., Seattle, WA 98115-6349. Julie Mocklin and Linda Vate Brattström are currently with the Joint Institute for the Study of the Atmosphere and Ocean (JISAO), 3737 Brooklyn Ave NE, Seattle, WA 98105. Kim Goetz is currently with the National
Late Summer Distribution of Cetaceans near Barrow, Alaska: Results from Aerial Surveys Conducted During
the Bowhead Whale Feeding Ecology Study, 2007–11KIM E. W. SHELDEN, JULIE A. MOCKLIN, KIMBERLY T. GOETZ, DAVID J. RUGH,
LINDA VATE BRATTSTRÖM, and NANCY A. FRIDAY
ABSTRACT—The aerial survey compo-nent of the Bowhead Whale Feeding Ecol-ogy Study (BOWFEST) was designed to document patterns and variability in the timing and distribution of bowhead whales, Balaena mysticetus, and to provide an es-timate of temporal and spatial habitat use near Barrow, Alaska. Aerial surveys were conducted from late August to mid-Septem-ber during the period 2007–11 for a total of 171.1 hours flown. In addition to the fo-cal species, observed species included gray whales, Eschrichtius robustus; one hump-back whale, Megaptera novaeangliae; be-luga whales, Delphinapterus leucas; ringed seals, Phoca hispida; bearded seals, Erigna-thus barbatus; walrus, Odobenus rosmarus; and polar bears, Ursus maritimus. Small pinnipeds, such as ringed seal and spotted seals, Phoca largha, were often difficult to differentiate and identify to species given the relatively high survey altitude of 310 m (1,000 ft).
Habitat partitioning was evident among the cetacean species observed in great-est numbers: bowhead, gray, and beluga whales. Abundance estimates during this time period ranged from 22 (CV 0.80) to 213 (CV 0.30) bowhead whales, 1 (CV 1.01) to 18 (CV 0.28) gray whales, and 0 to 948 (CV 0.66) beluga whales. Standard deviation ellipses showed each species oc-cupied a unique region within the study area with slight overlaps occurring in some
Introduction
Bowhead whales, Balaena mystice-tus, are distributed in seasonally ice covered waters of the Arctic and sub-
arctic. For management purposes, four bowhead whale stocks are currently recognized by the International Whal-ing Commission (IWC) (IWC, 2010) and are protected under the U.S. Ma-rine Mammal Protection Act and U.S.
years. Bowhead distribution was oriented along the barrier islands and 20 m isobath on the continental shelf and also included parts of the Barrow Canyon and shelf break that were close to shore. Gray whale distri-bution oriented along the Barrow Canyon shelf break near the 50 m isobath; while beluga distribution ellipses centered over Barrow Canyon and offshore slope waters. A four-parameter presence-absence model (bathymetry, bathymetric slope, distance from shore, and distance from the shelf break) found both distance from shore and shelf break were significant in predicting the presence of bowhead whales. All four parameters were significant in predict-ing gray whale presence. Only bathymetry was significant in predicting beluga whale presence.
During the 5-year study, 664 unique bow-head whales were identified from 1,415 pho-tographic images. Observers noted feeding behavior during 7–50% of sightings and 15–49% of photographed whales exhibited feeding behavior in any given year. Of the individual whales that were visually or pho-tographically identified as feeding, 81–90% were in shelf waters, and the majority of those were clustered around the 20 m iso-bath. More feeding behavior was observed and photographed during years when most sightings occurred on the shelf (2007, 2009, and 2010) but not necessarily in years when bowheads were most abundant in the study
Endangered Species Act (Muto et al., 2016). These stocks occur in the Okhotsk Sea (Russian waters), Da-vis Strait and Hudson Bay (western Greenland and eastern Canadian wa-ters), the eastern North Atlantic (the Spitsbergen stock near Svalbard), and the Bering/Chukchi/Beaufort seas.
The latter is the Western Arctic stock, the largest remnant popula-tion and only stock found within U.S. waters (Rugh et al., 2003), gener-ally north of lat. 54°N and south of lat. 75°N in the western Arctic Ba-sin (Moore and Reeves, 1993). This
area (e.g., 2008 and 2010). The lowest per-cent feeding both visually and photographi-cally occurred in 2008, the only year whale swim direction was predominately westerly, and open mouth (skim) feeding behavior was not observed.
Although the paucity of individual re-sightings (based on photographic recap-tures) between survey days (3 matches out of 664 identified whales) suggested very low residence times, the photogrammetric sam-ple (654 whales) was largely comprised of juveniles (65%). Young whales typically are unmarked and, therefore, not matched (only 3–6% were highly or moderately marked in at least one zone on the body). All intrayear matched whales moved east of their original sighting location, which was not expected so close to the westbound fall migration.
The BOWFEST aerial study provides a 5-year record of late summer presence of cetaceans in the western Beaufort Sea, adding to the growing body of knowledge on these species and their habitat prefer-ences in this region. This information is particularly important since the western Beaufort Sea is undergoing rapid change as the bowhead whale population con-tinues to grow, other species extend their ranges and increase their numbers in the area, and industrial activity, commercial fishing, and shipping operations are ex-pected to increase in the Arctic as sea ice decreases.
Institute of Water and Atmospheric Research, Ltd., 301 Evans Bay Parade, Greta Point, Wel-lington 6021 NZ. Dave Rugh (retired MML) is at 17416 95th Ave. NE, Bothell, WA 98011. The findings and conclusions in this paper are those of the author(s) and do not necessarily represent the views of the National Marine Fisheries Ser-vice, NOAA.
doi: https://doi.org/10.7755/MFR.79.2.1

2 Marine Fisheries Review
stock migrates annually from the Ber-ing Sea through the Chukchi to the Beaufort Sea in the spring. During the spring migration, bowhead whales typically begin arriving in the Barrow (now Utqiagævik), Alaska, area in early April and continue migrating through until late June (Moore and Reeves, 1993). The fall migration generally begins in early September and con-tinues to mid-October as bowhead whales migrate west across inner shelf waters (Moore et al., 2000) out of the Beaufort and into the Chukchi Sea, as evidenced during previous aerial sur-veys (Moore et al., 1989; Moore and Clarke, 1992; Richardson1; Ljungblad et al.2) and satellite-tracking (Quaken-bush et al., 2010; Citta et al., 2015).
These whales are important to Na-tive subsistence hunters of Alaska, Russia, and Canada, and hunting is regulated through IWC quotas shared between Alaska and the Russian Fed-eration.3 Barrow is the largest of the Native subsistence whaling villages, landing roughly half of the total num-ber of bowhead whales hunted each year (Suydam and George4).
Bowhead whale feeding activity has been well documented in the eastern Beaufort Sea (e.g., Richardson1) but only occasionally observed in other areas along the migratory route, par-ticularly during the fall (Ljungblad et
1Richardson, W. J. (Editor). 1987. Importance of the eastern Alaskan Beaufort Sea to feeding bowhead whales, 1985-86. Rep. to U.S. Miner-als Manag. Serv. by LGL Inc., NTIS No. PB88-150271, 547 p.2Ljungblad, D. K., S. E. Moore, J. T. Clarke, and J. C. Bennett. 1987. Distribution, abun-dance, behavior and bioacoustics of endangered whales in the Alaskan Beaufort and Eastern Chukchi Seas, 1979-86. OCS Study MMS 87-0039, NOSC Tech. Rep. 1177 to U.S. Minerals Manag. Serv., Anchorage, Alaska, NTIS PB-88-116470, 391 p.3Canada withdrew from the IWC after enact-ment of the moratorium on commercial whaling in 1982. Currently, the Department of Fisher-ies and Oceans (DFO) manages Native sub-sistence requests to hunt bowheads by issuing licenses (http://www.sararegistry.gc.ca/default.asp?lang=En&n=D67BEABF-1, accessed 6 Apr. 2015)4Suydam, R. S., and J. C. George. 2012. Subsis-tence harvest of bowhead whales (Balaena mys-ticetus) by Alaskan Eskimos, 1974 to 2011. Pap. SC/64/AWMP8 pres. to IWC Sci. Committ., May 2012, 13 p.
al., 1986; Landino et al., 1994). Dur-ing the spring, most of the migration appears to be a steady flow of whales traveling from the Chukchi Sea to the Beaufort Sea; however, Carroll et al. (1987) reported what appeared to be feeding behavior (i.e., frequent turns) by some whales. Bowhead whales with mud on their dorsal surfaces were also seen during the spring migration near Barrow, indicating that they were near the sea bottom, presumably feeding on epibenthic prey (Mocklin et al., 2012).
Braham et al. (1979) stated that Es-kimo whalers had occasionally seen bowhead whales near Point Barrow during the summer, some of which were feeding east of Point Barrow close to shore. In 1989, bowhead whale feeding activity was reported off Barrow from late July to mid-Au-gust (George and Carroll5). Moore (1992) compiled additional records of bowhead whales in the northeastern Chukchi Sea, comprising 26 sightings that occurred from late July to early September between 1975 and 1991. These sightings indicated that bow-head whales may occupy areas near Barrow during the summer months.
In the early 2000’s, local hunters re-ported bowhead whales feeding in ech-elon formation (i.e., animals lined up in a v-shaped pattern, head to tail) near Barrow in late August (George et al.6). Whales with muddy heads and open mouths and lunge feeding were also ob-served in early September in 2005 and 2006 (Moore et al., 2010a, b). These observations suggested a need for a more systematic, scientific approach to assess the relative scale of feeding and the consistency of this behavior relative to season, year, age-class, etc., together with relevant ecological pa-
5George, J. C., and G. M. Carroll. 1989. Au-gust sightings of bowhead whales in the Point Barrow to Cape Simpson region. Unpubl. ms., Memorandum to Benjamin P. Nageak dated 21 August 1989. Avail. at North Slope Borough, Dep. Wildl. Manag., P.O. Box 69, Barrow, Alas-ka, 99723. 6George, J. C., S. Moore, W. Koski, and R. Suydam. 2006. Opportunistic photo identifica-tion survey: Barrow autumn 2005. Abstr. pres. at Workshop II: Bowhead whale stock structure studies in the Bering, Chukchi, and Beaufort Seas (BCBS) 21-22 March 2006, Seattle, Wash.
rameters, such as bathymetry, currents, temperatures, ice conditions, and prey availability.
The Bowhead Whale Feeding Ecol-ogy Study (BOWFEST) was initiated in May 2007 through an interagency agreement (formal title: “The bow-head whale feeding variability in the western Beaufort Sea: feeding obser-vations and oceanographic measure-ments and analyses”) between the U.S. Department of the Interior’s Minerals Management Service (MMS, now the Bureau of Ocean Energy Manage-ment, BOEM) and the Alaska Fisher-ies Science Center’s National Marine Mammal Laboratory (NMML, now Marine Mammal Laboratory, MML). The goal of this 5-year study was to facilitate future oil and gas develop-ment-related mitigation by estimating relationships among bowhead whale prey, oceanographic conditions, and bowhead whale feeding behavior in the western Beaufort Sea, with empha-sis on identifying predictable aspects in those relationships. The study fo-cused on late summer oceanography and prey densities relative to bow-head whale distribution over continen-tal shelf waters between the coast and lat. 72°N, and between long. 152ºW and 157ºW, which is north and east of Point Barrow, Alaska. Projects were timed to end at least one week before the bowhead whale subsistence hunt commenced.
The BOWFEST study included sev-eral components. Aerial surveys and passive acoustic monitoring provided information on the spatial and tempo-ral distribution of bowhead whales in the study area. Oceanographic sam-pling identified sources of zooplankton prey available to whales on the conti-nental shelf and the association of this prey with physical (hydrography, cur-rents) characteristics which may affect mechanisms of plankton aggregation. Prey distribution was characterized by examining temporal and spatial scales of the hydrographic and velocity fields in the study area, particularly relative to oceanic frontal features.
Reports compiling aerial survey data and other components of BOW-
79(2) 3
FEST (passive acoustics, oceanogra-phy, tagging, small boat surveys, and stomach analyses) were published an-nually to the MML website7 for each year (2007–11). Results of this re-search may help explain the increased occurrence of bowhead whales feed-ing in the western Beaufort Sea (U.S. waters), west of the typical summer feeding aggregations in the Canadian Beaufort Sea. Increased understanding of bowhead whale behavior and distri-bution is needed to minimize potential impacts from human development in the Arctic. Information from this study will be used by BOEM for pre- and post-lease analysis and documenta-tion under the National Environmental Policy Act (NEPA) for Beaufort and Chukchi Sea Lease Sales.
Here we present results from the 5 years of aerial survey data acquired during late summer, 2007–11. The BOWFEST aerial survey included a combination of systematic transects and photography to document patterns and variability in the occurrence of individual bowhead whales as well as provide descriptions of spatial habitat use within the sample period. Aerial project data were examined to deter-mine whether bowhead whales were traveling through the area or were ef-fectively residents during late summer. Time spent feeding near Barrow in late summer, as well as the consistency of this behavior relative to location with-in the study area, year, and age class (using whale size as a proxy for age) were also documented.
Methods
Study Area
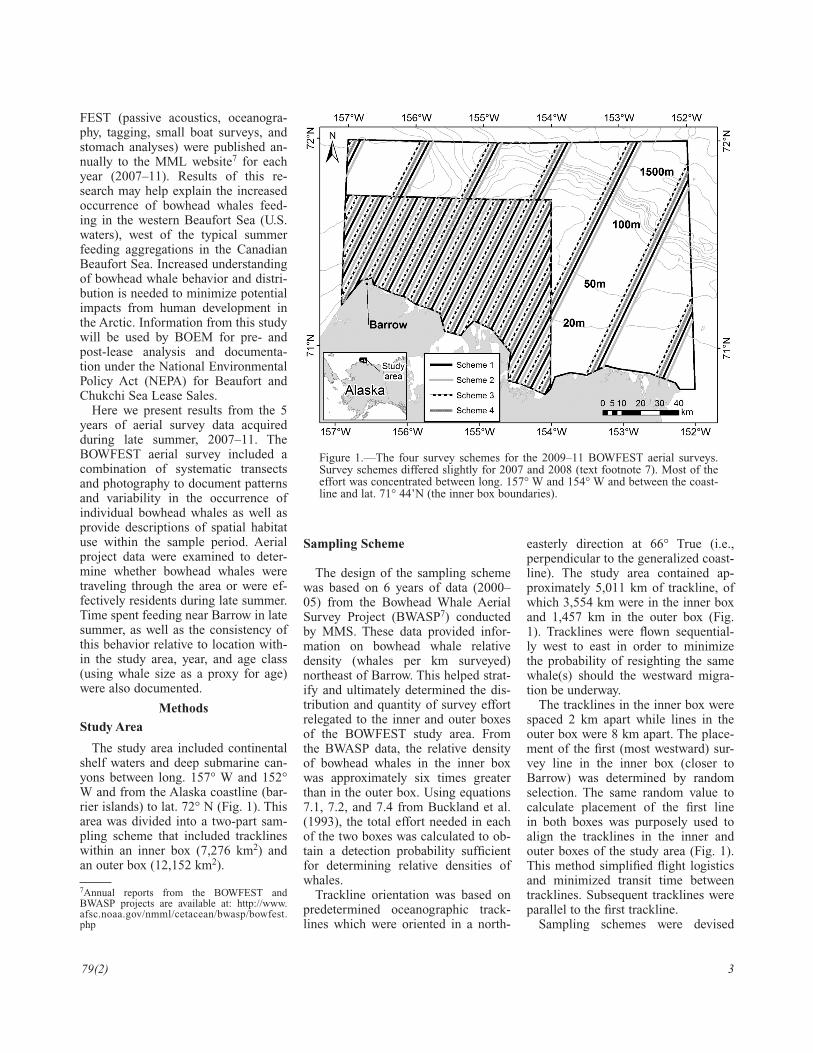
The study area included continental shelf waters and deep submarine can-yons between long. 157° W and 152° W and from the Alaska coastline (bar-rier islands) to lat. 72° N (Fig. 1). This area was divided into a two-part sam-pling scheme that included tracklines within an inner box (7,276 km2) and an outer box (12,152 km2).
7Annual reports from the BOWFEST and BWASP projects are available at: http://www.afsc.noaa.gov/nmml/cetacean/bwasp/bowfest.php
Sampling Scheme
The design of the sampling scheme was based on 6 years of data (2000–05) from the Bowhead Whale Aerial Survey Project (BWASP7) conducted by MMS. These data provided infor-mation on bowhead whale relative density (whales per km surveyed) northeast of Barrow. This helped strat-ify and ultimately determined the dis-tribution and quantity of survey effort relegated to the inner and outer boxes of the BOWFEST study area. From the BWASP data, the relative density of bowhead whales in the inner box was approximately six times greater than in the outer box. Using equations 7.1, 7.2, and 7.4 from Buckland et al. (1993), the total effort needed in each of the two boxes was calculated to ob-tain a detection probability sufficient for determining relative densities of whales.
Trackline orientation was based on predetermined oceanographic track-lines which were oriented in a north-
easterly direction at 66° True (i.e., perpendicular to the generalized coast-line). The study area contained ap-proximately 5,011 km of trackline, of which 3,554 km were in the inner box and 1,457 km in the outer box (Fig. 1). Tracklines were flown sequential-ly west to east in order to minimize the probability of resighting the same whale(s) should the westward migra-tion be underway.
The tracklines in the inner box were spaced 2 km apart while lines in the outer box were 8 km apart. The place-ment of the first (most westward) sur-vey line in the inner box (closer to Barrow) was determined by random selection. The same random value to calculate placement of the first line in both boxes was purposely used to align the tracklines in the inner and outer boxes of the study area (Fig. 1). This method simplified flight logistics and minimized transit time between tracklines. Subsequent tracklines were parallel to the first trackline.
Sampling schemes were devised
Figure 1.—The four survey schemes for the 2009–11 BOWFEST aerial surveys. Survey schemes differed slightly for 2007 and 2008 (text footnote 7). Most of the effort was concentrated between long. 157° W and 154° W and between the coast-line and lat. 71° 44’N (the inner box boundaries).
4 Marine Fisheries Review
by shifting the trackline array short distances to the east or west, remov-ing the likelihood that any tracklines would be flown twice within a season. The first scheme (Scheme 1) was cre-ated by selecting the first line from the west side of the study area and every fourth line thereafter. The three remaining schemes were created us-ing the same method, with the second through fourth lines from the west side of the study area. As a result, track-lines for each scheme were spaced ap-proximately 8 km apart in the inner box of the study area (Fig. 1).
Survey Protocol
The BOWFEST aerial survey air-craft was a NOAA Twin Otter.8 These aircraft have twin turbine engines, high wings, and approximately 5 h of flying endurance. Two large bub-ble windows provided views ahead of and beneath the plane for the left- and right-side observers. An open belly window/camera port allowed for ver-tical photography. Communication among observers, pilots, and the data recorder occurred via an intercom sys-tem. Aircraft speed was approximately 185 km/h (100 knots). Survey altitude was 310 m (1,000 ft); most photogra-phy passes were between 210 m (700 ft) and 240 m (800 ft).
During flight, effort was categorized as deadhead (transiting between track-lines or locations), trackline (system-atic search along designated transects), circling (breaking from the trackline mode to investigate a sighting), or photo mode (circling with the spe-cific intent to collect photographs of whales).
The data recorder used a custom-built aerial survey software program installed on a laptop computer which interfaced with a portable global po-sitioning system (GPS–Garmin 76 CSx). The program saved sighting in-formation, weather parameters, effort (on or off), crew position, and photo data into an Access database. Posi-tion information (latitude, longitude,
8Mention of trade names or commercial firms does not imply endorsement by the National Marine Fisheries Service, NOAA.
speed, altitude, and heading) was re-corded automatically every 5 sec via the GPS; all other data were entered manually including each start and stop of a trackline. Specific data entries for weather included overall percent ice cover, ice type (categorized using the Observers Guide to Sea Ice9), sky con-dition, and sea state (Beaufort scale). Glare, visibility angle, and visibility quality were recorded individually for each side of the aircraft.
To obtain the visibility angle, ob-servers used an inclinometer (0° = horizontal; 90° = straight down) to accurately determine the searchable distance out each side of the aircraft. Visibility quality within the given in-clinometer angle was one of five sub-jective categories from excellent to useless; for example, a record of “20° good” meant that from the trackline out to 20° (0.8 km), sighting condi-tions were good, and farther from the trackline (<20°) the visibility wors-ened and was not recorded. Unsur-veyed areas (i.e., off effort) included portions of the trackline where both observers rated visibility quality as poor or useless. All marine mammal sightings included date, time, observ-er, inclinometer angle, group size, reaction to plane, and species. For bowhead whale sightings, observers also reported calf number, travel direc-tion, sighting cue, dominant behavior, and group composition. Any vessels within the study area were also noted.
Immediately upon sighting a marine mammal, the observer reported group size and species to the data record-er. If the sightings occurred ahead of the aircraft an inclinometer angle and any observable reaction to the aircraft were recorded as the aircraft came abeam of the sighting. When a whale appeared to be swimming at a steady speed (i.e., not feeding, resting, or dis-playing any other type of cetacean be-havior), it was recorded as “traveling,” and a swim direction was given rela-tive to an analog clock (aircraft nose is 12 o’clock) and later converted rela-
9http://archive.orr.noaa.gov/book_shelf/695_seaice.pdf
tive to global directions (0°T = north). The aircraft deviated from the track-line only when an observer was un-able to identify the species of a large cetacean. If bowhead whale sightings occurred while on transect, the track-line was typically completed before going off effort to begin photographic passes. This method allowed for a sys-tematic search effort along tracklines and minimized confusion in reporting sightings while off effort.
Photographic Protocol
Objectives of the photographic por-tion of the BOWFEST aerial survey included
1) Examining bowhead images for within year (intrayear) match-es and across study year (in-teryear) matches to determine residency times and site fidelity, respectively;
2) Measuring bowhead lengths to determine age class distribution within the study area; and
3) Noting evidence of bowhead feeding behavior (such as mud on body, open mouth, and fecal plumes).
Photographs were taken through a port in the belly of the aircraft located aft of the landing gear. The port was covered in optical quality glass in 2007; how-ever, glare on the window was prob-lematic, so the glass was removed for the 2008–11 surveys. The photograph-ic system evolved over the course of the BOWFEST study. At minimum, two cameras were used with one dedi-cated to obtaining images for the age class study (photogrammetry) and the other to document residence times and feeding behavior (photo-identifi-cation). Date and time on all cameras were synchronized with the date and time on the GPS unit at the beginning of each survey. To obtain usable imag-es for photogrammetry, it was impor-tant to keep this camera level and the lens fixed and focused to near infinity and taped to impede rotation.
In 2007, when both cameras were handheld, the photographer using the small, fixed lens (55 or 85 mm) strove to hold the camera as level as possi-

79(2) 5
ble (no angling) to obtain usable im-ages for photogrammetry. In 2008 and 2009, the photogrammetry camera was housed in a forward motion com-pensation (FMC10) mount (installed on the port side of the belly window) which used a rocker mechanism to counter the forward velocity of the rel-ative ground speed. In 2010 and 2011, three cameras were installed side by side in an FMC mount. The center camera was prioritized for photogram-metry and the left and right cameras were set to overlap the center camera by 20% by angling them slightly in-ward. These cameras were integrated with an autonomous radar altimeter (Honeywell AA300 model) in order to collect precise altitudes each time the cameras were fired. Unlike the hand-held cameras, mounted cameras were fired using a custom built data acquisi-tion system that automated the retriev-al of data (i.e., altitude, time of camera firing, frame number, aircraft speed, and focal length of the camera lens). A keystroke on the computer triggered cameras to continuously fire so that each consecutive image overlapped the previous photo by 60%, adjusted for altitude.
Cameras recorded in RAW format, 21.0 megapixels (5616 x 3744) im-ages and were set to shutter priority (1/1000 sec) and ISO 400–800. After breaking trackline effort, passes were flown over each bowhead group un-til the observers were confident that most whales in the area had been pho-tographed. During each photographic pass, the forward observer provided a countdown to alert the photographer(s) and data recorder when a whale was about to appear under the aircraft.
Each year, calibration targets were photographed using the same cameras and lenses used to photograph bow-head whales. A land target was used in all years, and in 2008 and 2009, a floating water target was added to look for possible discrepancies between ra-dar altimeter performance over land and water (Mocklin et al., 2010). Alti-
10http://www.aerialimagingsolutions.com/fmc-mount.html
tudes for photogrammetric passes were at 30.5 m (100 ft) intervals ranging from 152 m (500 ft) to 457 m (1,500 ft), weather permitting. Measurements from the photographs provided a linear regression correction factor for the al-timeter readings. This correction fac-tor was then applied to photographs of bowhead whales used in the photo-grammetric study.
After each survey, all photographs were geo-referenced using Robo-GEO11, and RAW images were con-verted to TIFF (2007–09) or JPG (2010–11). Once geo-referenced, all images and associated metadata were sent to LGL, Inc. for analysis of whale lengths (Koski et al., 1992; 2006). Only images assigned grades of 1–6 were used in the photogrammetric analysis (Koski et al., 2006).
Processing for photo-identification of individual whales began with crop-ping and labeling of images. Whale images were scored for quality and identifiability (Rugh et al., 1998). Quality scores of 1+ (best), 1-, 2+, 2- or 3 (worst) were assigned to four zones on the whale’s body: rostrum, mid-back, lower back, and flukes. A zone scored as 3 was considered in-adequate for purposes of reidentify-ing a whale. Identifiability scores for each zone included H+ or H- (high-ly marked), M+ or M- (moderately marked), U+ or U- (unmarked), or X (meaning the zone was not depicted clearly enough in the photo to deter-mine mark status). Scores of X almost always corresponded to quality 3.
Data Analysis
Distribution maps for all cetacean sightings were created using ArcGIS 10.1 (ESRI, Redlands, CA, USA). Bowhead whale sightings were linked to a raster bathymetry file (name: IB-CAO_V3_500m_RR; Jakobsson et al., 2012) to determine depths (in meters) associated with each sight-ing. Trackline data were analyzed by day and scheme for each survey year. Segments of on-effort trackline with respective length were linked to each
11http://www.robogeo.com/home/
cetacean sighting that had an incli-nometer angle.
Abundance estimates and sighting rates were computed for the cetacean species most frequently encountered during the study: bowhead whales, gray whales, Eschrichtius robustus; and beluga whales, Delphinapterus leucas, using distance sampling meth-ods (Buckland et al., 2001, 2004) as implemented in the Mark-Recapture Distance Sampling (mrds) package (Laake et al., 2007) for R (R Develop-ment Core Team, 2008). Both conven-tional (CDS) and multiple covariate distance sampling (MCDS) approach-es were used. To increase the sample size when fitting the detection func-tion, sightings from all years were combined with additional-effort sight-ings from the transit legs.
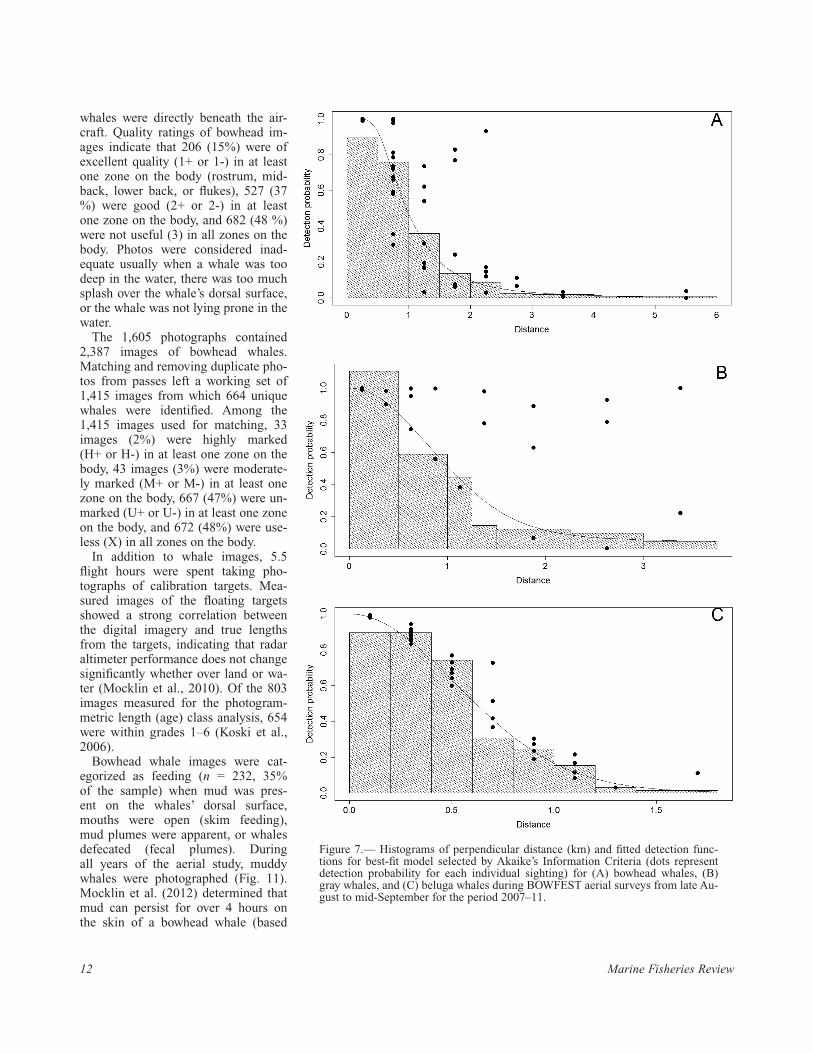
To improve the fit of the detection functions, the perpendicular distance data for bowhead whales were trun-cated at 6 km and binned into 0.5 km bins to 3 km and then 1 km bins to 6 km. It was not necessary to truncate the perpendicular distance data for beluga or gray whales. The perpen-dicular distance data for beluga whales was binned into 0.2 km bins and for gray whales into 0.25 km bins to 1.5 km and 0.75 km thereafter.
Five covariates were explored: sea state, group size (as square root), ob-server, glare, and sky condition. For gray whales, the four observers with seven or fewer sightings were com-bined into a single category and the sky variables of light fog, low ceil-ing, and precipitation were combined into a single category. Hazard-rate and half-normal models were fit without covariates, and with all possible com-binations of 1–5 covariates, result-ing in 64 candidate models for each species.
The best-fit model for the detection function was selected using Akaike’s Information Criteria (AIC) which seeks to maximize the likelihood and minimize the number of model param-eters (Burnham and Anderson, 2002). Models with ΔAIC ≤ 2 are considered well supported by the data and are pre-sented here for comparison, but densi-
6 Marine Fisheries Review
ty and abundance were computed with the best-fit model. On-effort sightings were separated by strata for estimating group size, sighting rates, density, and abundance. Data were not collected to determine animals missed on the trackline (perception bias) or animals submerged when the plane passed (availability bias). Therefore, correc-tions were not made for these biases and g(0), the sighting probability on the trackline, was assumed to be 1.
Distributions were also compared among these three cetacean species. Each species distribution each year was weighted by group size using 1SD “directional distribution” ellipses in ArcGIS which captured approximately 68% of the sightings. Additional anal-yses were conducted on sightings in the inner box then compared to com-bined inner and outer box sightings for all years to determine if distributions were significantly different.
To describe the presence or absence of sightings as a function of envi-ronmental, or explanatory, variables, all bowhead, gray, and beluga whale sightings within the inner box were
linked to bathymetric depth (BATHY), bathymetric slope (SLOPE), distance from the shelf break (100 m isobaths - DISTSHELF), and distance from shore (DISTSHORE). The resolution of all spatial data layers in ArcGIS was 100 × 100 m. For each whale species, random locations were generated to match the number of sightings within the inner box.
To examine the structure within the data, a logistic regression model was employed. After examining the vari-ables for colinearity, we used a back-ward elimination method to assess the significance of the environmental variables in predicting habitat use. AIC was used to select the final mod-el for each of the three species. The diagnostic accuracy of each of these models was determined using a re-ceiver operating characteristic (ROC) curve which is able to detect a sig-nal in the presence of noise. The area under the ROC curve (AUC) ranges from 0 (no discrimination ability) to 1 (perfect discrimination ability against false positives and false nega-tives). Values greater than or equal
to a threshold value (0.40 for beluga, 0.51 for bowhead, and 0.61 for gray whales) were classified as preferred habitat.
Swim direction at the time of each sighting was compared for all bowhead whales with travel noted as the prima-ry behavior. A Rayleigh uniformity test (KCS, 2012), run in the software program Oriana, determined whether clustering around a mean swim direc-tion occurred within each survey year. Feeding behaviors (mud on the whale, mouth open, and fecal plume) were re-ported by the observers and document-ed during the photography effort. We examined percentages of feeding be-havior reported by observers and cap-tured photographically each year. We also mapped the locations of sightings and photographs documenting these behaviors.
For residency times, all images were compared to determine if individual whales were photographed multiple times over multiple days (multiple im-ages of an individual obtained within a single day were considered to be a single sample). Following intrayear comparisons, whale images were com-pared across all BOWFEST years to look for evidence of seasonal site fi-delity. We also noted if any matched whales appeared to be feeding.
Using photogrammetric lengths, bowhead whales were sorted into spe-cific age classes (calf, juvenile, and adult per Koski et al. (1992, 2006)) to help determine age structure with-in the study area over the five-year period. Length data were binned and graphed by year and overall. We also present length data for the subset of whales that appeared to be feeding.
Results and Discussion
Survey Effort
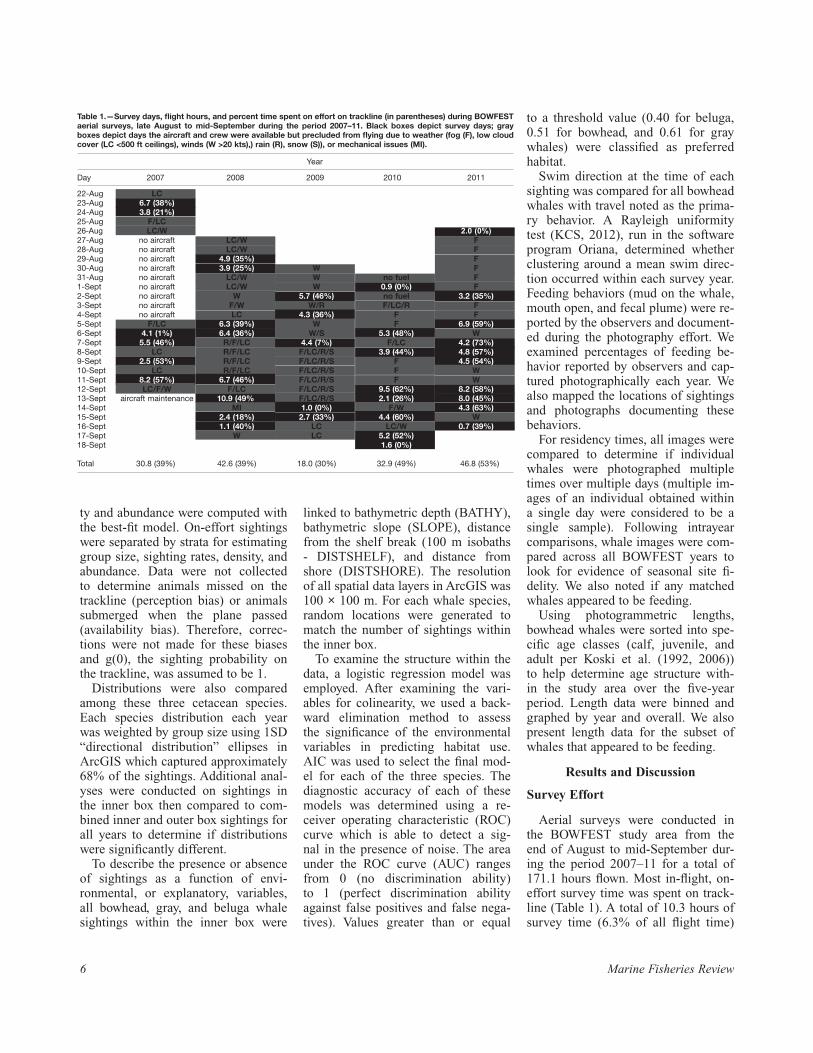
Aerial surveys were conducted in the BOWFEST study area from the end of August to mid-September dur-ing the period 2007–11 for a total of 171.1 hours flown. Most in-flight, on-effort survey time was spent on track-line (Table 1). A total of 10.3 hours of survey time (6.3% of all flight time)
Table 1.—Survey days, flight hours, and percent time spent on effort on trackline (in parentheses) during BOWFEST aerial surveys, late August to mid-September during the period 2007–11. Black boxes depict survey days; gray boxes depict days the aircraft and crew were available but precluded from flying due to weather (fog (F), low cloud cover (LC <500 ft ceilings), winds (W >20 kts),) rain (R), snow (S)), or mechanical issues (MI).
Year
Day 2007 2008 2009 2010 2011
22-Aug LC 23-Aug 6.7 (38%) 24-Aug 3.8 (21%) 25-Aug F/LC 26-Aug LC/W 2.0 (0%)27-Aug no aircraft LC/W F28-Aug no aircraft LC/W F29-Aug no aircraft 4.9 (35%) F30-Aug no aircraft 3.9 (25%) W F31-Aug no aircraft LC/W W no fuel F1-Sept no aircraft LC/W W 0.9 (0%) F2-Sept no aircraft W 5.7 (46%) no fuel 3.2 (35%)3-Sept no aircraft F/W W/R F/LC/R F4-Sept no aircraft LC 4.3 (36%) F F5-Sept F/LC 6.3 (39%) W F 6.9 (59%)6-Sept 4.1 (1%) 6.4 (36%) W/S 5.3 (48%) W7-Sept 5.5 (46%) R/F/LC 4.4 (7%) F/LC 4.2 (73%)8-Sept LC R/F/LC F/LC/R/S 3.9 (44%) 4.8 (57%)9-Sept 2.5 (53%) R/F/LC F/LC/R/S F 4.5 (54%)10-Sept LC R/F/LC F/LC/R/S F W11-Sept 8.2 (57%) 6.7 (46%) F/LC/R/S F W12-Sept LC/F/W F/LC F/LC/R/S 9.5 (62%) 8.2 (58%)13-Sept aircraft maintenance 10.9 (49%) F/LC/R/S 2.1 (26%) 8.0 (45%)14-Sept MI 1.0 (0%) F/W 4.3 (63%)15-Sept 2.4 (18%) 2.7 (33%) 4.4 (60%) W16-Sept 1.1 (40%) LC LC/W 0.7 (39%)17-Sept W LC 5.2 (52%) 18-Sept 1.6 (0%)
Total 30.8 (39%) 42.6 (39%) 18.0 (30%) 32.9 (49%) 46.8 (53%)

79(2) 7
was in poor or useless viewing condi-tions, and there were 57 days without surveys due to weather (56% of all days when the aircraft was available for flying).
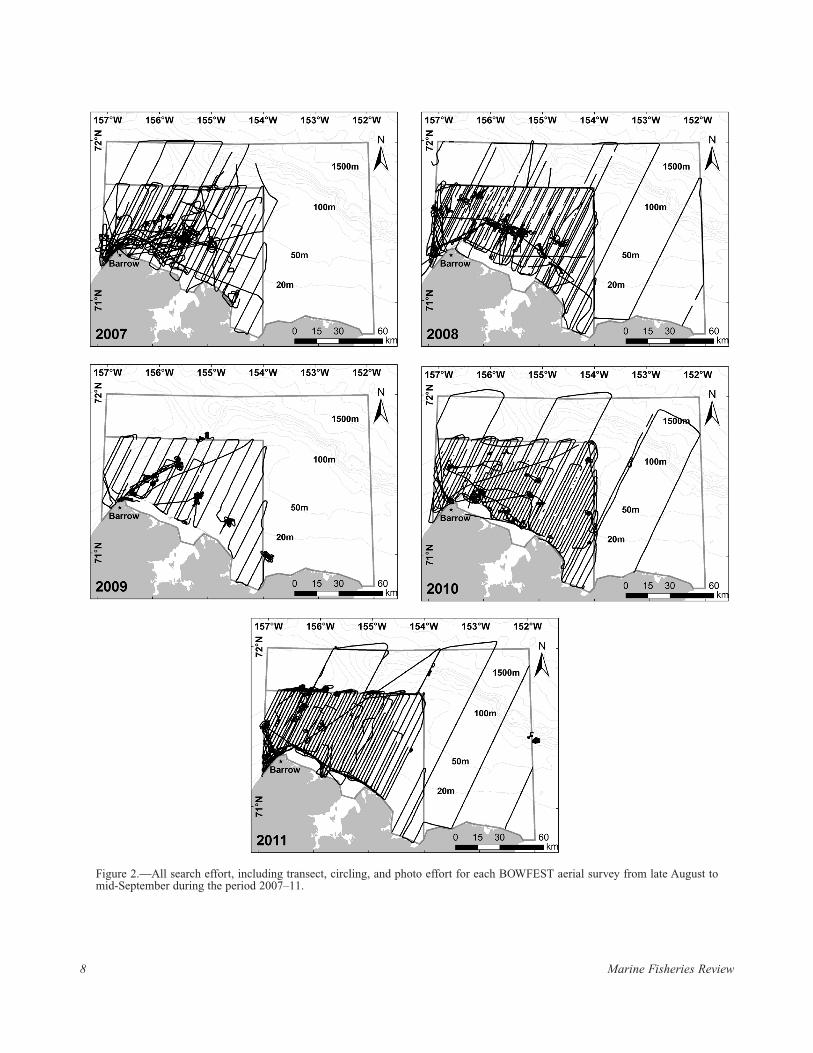
On flight days, 56% of the survey effort was over calm seas with few whitecaps (Beaufort Sea States 3 or lower). Sea states of 3 and lower are considered optimal for detecting most marine mammal species; however, ob-servers reported 91% of survey effort as “fair” or better, suggesting despite higher sea states the observers re-mained confident that bowhead whales could be detected. The greatest per-centage of effort was focused within the inner box of the study area (Table 2, Fig. 2).
Sightings
Marine mammals observed within the study area were identified to spe-cies whenever possible (Table 3). Over 1,000 sightings of marine mammals were recorded during the 5-year study. In addition to the focal species (bow-head whales) observed species includ-ed gray whales, one humpback whale, beluga whales, ringed seals, Phoca hispida; bearded seals, Erignathus barbatus; walrus, Odobenus rosma-rus; and polar bears, Ursus maritimus. Small pinnipeds, such as ringed seals and spotted seals, Phoca largha, were often difficult to differentiate and identify to species given the relatively high survey altitude of 310 m (1,000 ft) (Table 3).
Beluga whales were the only odon-tocetes observed (Fig. 3). Though not seen during BOWFEST aerial sur-veys, harbor porpoise, Phocoena pho-coena, also occur off Barrow (Suydam and George, 1992), and occasionally killer whales, Orcinus orca (Braham
and Dahlheim, 1982; Clarke et al.12). Beluga whales were seen in all years except 2009, and although survey ef-fort was limited that year, sighting numbers were also low the preceding and following year. In general, beluga whales were found in slope waters and over the deeper waters of Barrow Can-yon; however, in 2011, groups were also observed swimming near barrier islands (Fig. 3).
Three species of baleen whales were seen during BOWFEST: bow-head, humpback, and gray whales. In 2009, a lone humpback whale associ-ated with a group of gray whales was observed in shelf waters off Point Bar-row (Fig. 4). Gray whales were present during every survey year, and sighting numbers were consistent year to year with the exception of 2010 when their numbers were at their lowest and bow-head whales at their highest (Table 3). Almost all gray whale sightings oc-curred on the 50 m isobath along Bar-row Canyon (Fig. 4).
Bowhead whale presence and sight-ing numbers were variable from year to year (Table 3). There was no ap-parent increase in bowhead sightings during the survey period as might be expected with the onset of the fall migration (Table 4). Most sightings occurred over continental shelf wa-ters east of Point Barrow (Fig. 5). In 2007, the aerial team found whales in shelf waters (on the 20 m isobath) on 2 days in late August, but none
12Clarke, J. T., C. L. Christman, A. A. Brower, and M. C. Ferguson. 2013. Distribution and relative abundance of marine mammals in the northeastern Chukchi and western Beaufort seas, 2012. Annu. Rep., OCS Study BOEM 2013-00117, 364 p., Natl. Mar. Mammal Lab., Alaska Fish. Sci. Cent., NMFS, NOAA, 7600 Sand Point Way NE, F/AKC3, Seattle, WA 98115-6349 (http://www.afsc.noaa.gov/nmml/PDF/COMIDA-2012-Report.pdf)
were found in September. In 2008, aerial observations included a few whales scattered in Barrow Canyon, large groups along the canyon shelf break north of Barrow, some groups along the 20 m isobath on the shelf, and small numbers in deeper waters to the east. In 2009, most bowhead whale sightings occurred along the 20 m isobath, with a few whales in Barrow Canyon and along the shelf break near Barrow. In 2010, there was no inshore-offshore bias in bowhead whale distribution. The aerial team found large numbers of whales near the barrier islands, closer to shore than during any other study year, and spread across the shelf to the slope. In 2011, whales were in Barrow Canyon and deeper waters to the east, not on the shelf. Most sightings in 2011 oc-curred in waters >100 m deep. With sightings binned into four depth rang-es (Fig. 6), most bowhead whales were in relatively shallow water; 72% were in water depths < 30 m and 80% in waters < 50 m. The remaining bowhead whales were in waters be-tween 50 and 100 m (8%) and greater than 100 m (12%), the latter largely driven by distribution in 2011.
Abundance
The detection functions for the best-fit models (minimum AIC) for bowhead, gray, and beluga whales are shown in Figure 7. Table 5 includes all well-supported (ΔAIC ≤ 2) mod-els compared to the best-fit model for each species. For bowhead whales, the hazard rate model with the square root of group size and observer as covari-ates was the best-fit model. For gray whales and beluga whales, the half-normal model with the square root of group size as a covariate were the best-fit models. Group size was the most important variable as it was a covariate in all the models with ΔAIC ≤ 2 for all three species with the exception of one beluga model that had no covari-ates (Table 5). For bowhead whales, observer was also an important vari-able and present in all bowhead mod-els with ΔAIC ≤ 2.
Encounter rate, group size, density,
Table 2.—Survey trackline effort during BOWFEST aerial surveys within the inner and outer boxes of the study area from late August to mid-September during the period 2007–11.
Inner box Inner box Outer box Outer box Year (km surveyed) (% covered) (km surveyed) (% covered)
2007 2071.2 58% 208.6 4%2008 2637.3 74% 445.5 9%2009 1007.0 28% 0.0 0%2010 2653.0 75% 407.5 8%2011 4134.4 116% 476.5 10%
8 Marine Fisheries Review
Figure 2.—All search effort, including transect, circling, and photo effort for each BOWFEST aerial survey from late August to mid-September during the period 2007–11.

79(2) 9
the outer box of the study area (2007 and 2011), encounter rates were 2.6–8.2 times lower in the inner box (Table 6). Estimated abundance in 2007 and 2011, respectively, ranged from 21 (CV = 0.76) to 280 (CV = 0.90) (inner vs. outer box) and 123 (CV = 0.43) to 825 (CV = 0.75) (inner vs. outer box). When not present in the outer box, be-lugas were rarely encountered in the inner box of the study area (0.0004/km, CV = 1).
Habitat Preferences
Habitat partitioning between bow-head and gray whales was evident in all survey years, and among bowhead, gray, and beluga whales in those years when belugas were observed in large numbers (Fig. 8). The standard devia-tion ellipses show each species occu-pied a unique region within the study area with slight overlaps occurring in some years. Overall, bowhead distri-bution was oriented along the barrier islands and 20 m isobath on the con-tinental shelf and also included parts of the Barrow Canyon and shelf break that were close to shore (Fig. 8). Gray whale distribution oriented along the Barrow Canyon shelf break near the 50 m isobath; while beluga distribu-tion ellipses centered over Barrow Canyon and offshore slope waters (Fig. 8). This preference for particu-lar depth ranges was similar to that observed during surveys conducted in the 1980’s and early 1990’s (Clarke et al., 1993; Moore and DeMaster, 1998; Moore et al., 2000). However, ice con-ditions also appeared to affect bow-head distribution during these earlier years; in particular, heavy ice was as-sociated with whales occupying deep-er slope waters (Moore, 2000), which was not a factor during the BOWFEST surveys.
The ROC model examined four specific physical features within the inner box to describe preferred habi-tat for all three species. For bowhead whales, distance from shore and dis-tance from the shelf break were sig-nificant in predicting the presence of bowhead whales (p < 0.01, Table 8); therefore, their preferred habitat in-
Table 3.—Summary of marine mammal sightings and counts made during BOWFEST aerial surveys from late Au-gust to mid-September during the period 2007–11. Bowhead whale counts usually increased when off trackline to circle or photograph groups of whales (in parenthesis). Bowhead whales observed during transit between tran-sects were also included in the grand total number.
Sightings/count (count after departing trackline to circle) per year
Marine mammal 2007 2008 2009 2010 2011 Total
Bowhead whale 16/35(68) 56/191(195) 29/35(55) 102/396(452) 18/10(68) 221/667(838)Gray whale 20/29 22/39 22/30 6/10 26/34 96/142Beluga whale 18/30 2/2 2/5 95/460 117/497Humpback whale 1/1 1/1Ringed seal 73/119 4/6 2/2 8/40 87/167Bearded seal 31/89 9/9 6/6 3/3 21/22 70/129Walrus 65/255 3/12 1/2 69/269Polar bear 2/2 4/5 16/23 6/6 28/36Unid large cetacean 13/13 6/7 1/1 6/9 26/30Unid small cetacean 1/1 1/1Unid pinniped 10/12 86/139 25/52 61/86 117/237 299/526Total 235/571 196/404 94/145(162) 200/566(553) 290/779(836) 1,015/2,465(838)Sightings/km 0.103 0.064 0.093 0.065 0.063
Figure 3.—Locations of beluga whale sightings during BOWFEST aerial surveys from late August to mid-September during the period 2007–11. Note: there were no sightings in 2009.
and abundance were estimated using the best-fit detection function model and are presented in Tables 6 and 7 for each species by year and survey domain. Estimated encounter rates (#/km) (Table 6) and density (#/km2) (Ta-ble 7) for bowhead whales were gen-erally higher in the inner box of the study area in all years. With the ex-ception of 2007, estimated group sizes were < 3 whales (Table 6). Estimated abundance for the inner box was also
higher than in the outer box although the differences were not statistically significant (Table 7). Gray whales were only encountered in the inner box. Es-timated group sizes were < 2 whales in all years but 2008 (Table 6). Abun-dance estimates and densities were the lowest in 2010 (Table 7), following a decline in encounter rates and den-sity from 2007 to 2009. Gray whale numbers rebounded to 2007 levels in 2011. When belugas were present in

10 Marine Fisheries Review
cluded the nearshore region oriented east to west that included parts of Bar-row Canyon, the shelf break, and Bar-row Shelf (Fig. 9). Although these two parameters were significant in deter-mining preferred habitat, the AUC val-ue was 0.67, indicating that the model was only able to correctly discriminate between the presence (bowhead sight-ing) and absence (random points) 67% of the time. The 0.51 threshold value resulted in approximately 2,576 sq. km of preferred bowhead habitat (38% of the inner box).
All four parameters were significant in predicting gray whale presence (p < 0.01, Table 8). Gray whales preferred to be in shallow water that was closer to shore and aligned along the shelf break. A 0.96 value for the AUC indi-cated that the model was able to cor-rectly classify gray whale presence and absence 96% of the time. The 0.61 threshold value resulted in 802 km2 of preferred habitat, approximately 12% of the inner box of the BOWFEST study area (Fig. 9).
Of the four parameters included in the model, only bathymetry was sig-nificant in predicting beluga whale presence (p < 0.01, Table 8). These an-imals preferred to be in deeper water more than would be predicted at ran-dom. An AUC value of 0.82 indicates that the final model correctly discrimi-nated sightings from non-sightings 82% of the time and resulted in 1,948 sq. km of preferred habitat or approxi-mately 29% of the inner box of the BOWFEST study area (Fig. 9), pri-marily within Barrow Canyon. While there was a large portion of overlap in the predicted habitat for these spe-cies, there was clear spatial separation in their preferred habitat (Fig. 8 and 9, last panel).
Behaviors
The behaviors observed most of-ten were swimming or resting at the surface for most species. The only species, other than bowhead whales, observed feeding within the study area was gray whales. Large mud plumes were often listed as the sighting cue for gray whales. Of the bowhead whale
Table 4.—Survey days (black boxes) and all on/off trackline bowhead whale sightings and counts (in parentheses) during BOWFEST aerial surveys from late August to mid-September during the period 2007–11. Gray boxes de-pict days aircraft was available but unable to fly (due to weather or mechanical issues).
Year
Day 2007 2008 2009 2010 2011
22-Aug 23-Aug 10 (59) 24-Aug 6 (9) 25-Aug 26-Aug 027-Aug 28-Aug 29-Aug 2 (5) 30-Aug 3 (17) 31-Aug 1-Sep 0 2-Sep 5 (16) 1 (1)3-Sepr 4-Sep 9 (21) 5-Sep 5 (14) 4 (8)6-Sep 0 23 (103) 7 (33) 7-Sep 0 5 (5) 08-Sep 7 (11) 09-Sep 0 4 (17)10-Sep 11-Sep 0 9 (11) 12-Sep 21 (89) 3 (7)13-Sep 14 (45) 1 (2) 4 (31)14-Sep 0 2 (4)15-Sep 0 10 (13) 19 (68) 16-Sep 0 017-Sep 42 (223) 18-Sep 5 (26)
Total 16 (68) 56 (195) 29 (55) 102 (452) 18 (68)
Figure 4.—Locations of a humpback whale and gray whale sightings during BOWFEST aerial surveys from late August to mid-September during the period 2007–11.

79(2) 11
behaviors noted by observers, travel-ing was reported more often than feed-ing during most years (45% vs. 22% of all sightings, n = 221). Swim direc-tion was noted for 94% of the travel-ing bowhead whales (Table 9).
Presumably, if the fall migration was underway, most whales would be traveling in a westerly direction (be-tween 226° and 315°T); however, this was not evident in most years (Fig. 10). The sample size in 2007 was too small (only 2 of the 16 sightings noted travel as the primary behavior) to test for significance. In 2008, significantly more bowhead whales traveled in a westerly direction (i.e., about 295°T; Rayleigh’s uniformity test probability < 0.05). No significant travel direction was documented in 2009–11.
Aerial observations during the late August to mid-September study period included obvious feeding bouts: ob-servers noted feeding behavior during 7–50% of sightings among the 5 years of the study; and 15–49% of photo-graphed whales exhibited feeding be-havior in any given year (Fig. 11). Of the individual whales that were visu-ally or photographically identified as feeding, 81–90%, respectively, were in shelf waters, and the majority of those were clustered around the 20 m isobath (Fig. 12). More feeding behav-ior was observed and photographed during years when most sightings oc-curred on the shelf (2007, 2009, 2010) (Fig. 12) but not always in years when bowheads were most abundant (Fig. 13). The lowest percent feeding both visually and photographically occurred in 2008 (Fig. 11), the only year whale swim direction was predominately westerly (Table 9, Fig. 10). Feeding behavior, residency times and site fi-delity, and age classes of bowhead whales present within the study area were further explored through the pho-tographic component of BOWFEST.
Photographic Effort
Bowhead whales were photographed on 22 survey days across the five field seasons. In total, 16.7 hours were spent photographing bowhead whales, resulting in 1,605 pictures taken when
Figure 5.—Locations and group sizes of bowhead whales during BOWFEST aerial surveys from late August to mid-September during the period 2007–11.
Figure 6.—Depths at which bowhead whales were seen (using counts obtained af-ter departing the trackline to circle: Table 3) during BOWFEST aerial surveys from late August to mid September for the period 2007–11.
12 Marine Fisheries Review
whales were directly beneath the air-craft. Quality ratings of bowhead im-ages indicate that 206 (15%) were of excellent quality (1+ or 1-) in at least one zone on the body (rostrum, mid-back, lower back, or flukes), 527 (37 %) were good (2+ or 2-) in at least one zone on the body, and 682 (48 %) were not useful (3) in all zones on the body. Photos were considered inad-equate usually when a whale was too deep in the water, there was too much splash over the whale’s dorsal surface, or the whale was not lying prone in the water.
The 1,605 photographs contained 2,387 images of bowhead whales. Matching and removing duplicate pho-tos from passes left a working set of 1,415 images from which 664 unique whales were identified. Among the 1,415 images used for matching, 33 images (2%) were highly marked (H+ or H-) in at least one zone on the body, 43 images (3%) were moderate-ly marked (M+ or M-) in at least one zone on the body, 667 (47%) were un-marked (U+ or U-) in at least one zone on the body, and 672 (48%) were use-less (X) in all zones on the body.
In addition to whale images, 5.5 flight hours were spent taking pho-tographs of calibration targets. Mea-sured images of the floating targets showed a strong correlation between the digital imagery and true lengths from the targets, indicating that radar altimeter performance does not change significantly whether over land or wa-ter (Mocklin et al., 2010). Of the 803 images measured for the photogram-metric length (age) class analysis, 654 were within grades 1–6 (Koski et al., 2006).
Bowhead whale images were cat-egorized as feeding (n = 232, 35% of the sample) when mud was pres-ent on the whales’ dorsal surface, mouths were open (skim feeding), mud plumes were apparent, or whales defecated (fecal plumes). During all years of the aerial study, muddy whales were photographed (Fig. 11). Mocklin et al. (2012) determined that mud can persist for over 4 hours on the skin of a bowhead whale (based
Figure 7.— Histograms of perpendicular distance (km) and fitted detection func-tions for best-fit model selected by Akaike’s Information Criteria (dots represent detection probability for each individual sighting) for (A) bowhead whales, (B) gray whales, and (C) beluga whales during BOWFEST aerial surveys from late Au-gust to mid-September for the period 2007–11.

79(2) 13
Table 5.—Best-fit model proposed to fit perpendicular distance data for bowhead, gray, and beluga whales during BOWFEST aerial surveys from late August to mid-September for the period 2007–11. Summary of model selection for well-supported models with Akaike’s Information Criteria (ΔAIC ≤ 2) compared to the best-fit model. Models: hz = hazard rate and hn = half normal. Covariates: beaufort = Beaufort sea state, size.sqrt = square root of group size, obs = observer, glare = glare present or absent, sky = sky condition, wi = Akaike weight, P = average detec-tion probability, and CV = coefficient of variation of the average detection probability.
Model, covariates AIC ΔAIC wi Parameters P CV
Bowhead whales hz, size.sqrt + obs 551.69 0.00 0.310 9 0.19 0.09 hz, size.sqrt + obs + glare 552.62 0.93 0.195 10 0.19 0.09 hz, beaufort + size.sqrt + obs 553.54 1.85 0.123 10 0.19 0.09Gray whales hn, size.sqrt 251.82 0.00 0.135 2 0.32 0.08 hn, size.sqrt + sky 252.37 0.55 0.102 5 0.29 0.12 hn, beaufort + size.sqrt 252.75 0.93 0.085 3 0.32 0.10 hn, size.sqrt + obs 253.21 1.39 0.067 4 0.31 0.13 hr, size.sqrt 253.38 1.56 0.062 3 0.31 0.13 hn, size.sqrt + glare 253.60 1.78 0.055 3 0.32 0.09Beluga whales hn, size.sqrt 367.64 0.00 0.184 2 0.37 0.08 hn (no covariates) 368.71 1.06 0.108 1 0.37 0.07 hn, size.sqrt + glare 369.55 1.91 0.071 3 0.37 0.08 hn, beaufort + size.sqrt 369.55 1.91 0.071 3 0.37 0.08
Table 6.—Number of sightings (n), encounter rates (ER, #/km), encounter rate coefficient of variation (ER CV), estimated group size (ES), and estimated group size coefficient of variation (ES CV) for bowhead, gray, and beluga whales by year and domain during BOWFEST aerial surveys from late August to mid-September.
Bowhead whale Gray whale Beluga whale
Year and Domain n ER ER CV ES ES CV n ER ER CV ES ES CV n ER ER CV ES ES CV
2007 Inner 5 0.0025 0.71 4.60 0.58 9 0.0044 0.43 1.67 0.22 5 0.0025 0.66 1.60 0.37 Outer 0 0 - 0 - 0 0 - 0 - 4 0.0202 0.83 1.50 0.33 Total 5 0.0022 0.71 4.60 0.58 9 0.0040 0.44 1.67 0.22 9 0.0040 0.51 1.56 0.242008 Inner 45 0.0178 0.23 2.47 0.26 4 0.0016 0.61 3.25 0.69 1 0.0004 1.00 1.00 0.00 Outer 5 0.0117 0.60 1.20 0.17 0 0 - 0 - 0 0 - 0 - Total 50 0.0169 0.22 2.34 0.25 4 0.0014 0.61 3.25 0.69 1 0.0003 1.00 1.00 0.002009 Inner 16 0.0157 0.41 1.31 0.11 1 0.0010 1.00 1.00 0.00 0 0 - 0 - Outer - - - - - - - - - - - - - - - Total 16 0.0157 0.41 1.31 0.11 1 0.0010 1.00 1.00 0.00 0 0 - 0 -2010 Inner 71 0.0289 0.20 2.72 0.25 1 0.0004 1.00 1.00 0.00 1 0.0004 0.99 4.00 0.00 Outer 2 0.0053 0.96 1.00 0.00 0 0 - 0 - 0 0 - 0 - Total 73 0.0257 0.20 2.67 0.25 1 0.0004 1.00 1.00 0.00 1 0.0004 0.99 4.00 0.002011 Inner 6 0.0017 0.45 1.17 0.14 18 0.0051 0.27 1.44 0.14 41 0.0115 0.41 2.12 0.20 Outer 1 0.0017 1.10 1.00 0.00 0 0 - 0 - 18 0.0300 0.74 3.67 0.31 Total 7 0.0017 0.41 1.14 0.12 18 0.0043 0.27 1.44 0.14 59 0.0142 0.35 2.59 0.18
Table 7.—Number of sightings (n), estimated density (D, #/km2), estimated abundance (N), coefficient of variation (CV), and 95% confidence interval (CI) for bowhead, gray, and beluga whales by year and domain during BOWFEST aerial surveys from late August to mid-September.
Bowhead whale Gray whale Beluga whale
Year and Domain n D N CV Cl n D N CV Cl n D N CV Cl
2007 Inner 5 0.0035 25 0.82 6-106 9 0.0022 16 0.45 7-37 5 0.0029 21 0.76 5-83 Outer 0 0 0 0 0-0 0 0 0 0 0-0 4 0.0231 280 0.90 43-1,832 Total 5 0.0013 25 0.82 6-106 9 0.0008 16 0.45 7-37 9 0.0155 302 0.84 51-1,7782008 Inner 45 0.0138 100 0.35 51-196 4 0.0011 8 0.69 2-28 1 0.0003 2 1.00 0-12 Outer 5 0.0062 75 0.70 19-299 0 0 0 0 0-0 0 0 0 0 0-0 Total 50 0.0090 176 0.36 85-364 4 0.0004 8 0.69 2-28 1 0.0001 2 1.00 0-122009 Inner 16 0.0083 60 0.36 30-123 1 0.0005 4 1.01 1-20 0 0 0 0 0-0 Outer - - - - - - - - - Total 16 0.0083 60 0.36 30-123 1 0.0005 4 1.01 1-20 0 0 0 0 0-02010 Inner 71 0.0255 185 0.30 103-335 1 0.0002 1 1.01 0-8 1 0.0011 8 0.99 2-43 Outer 2 0.0023 27 0.97 3-218 0 0 0 0 0-0 0 0 0 0 0-0 Total 73 0.0110 213 0.30 120-379 1 0.00008 1 1.01 0-8 1 0.0004 8 0.99 2-432011 Inner 6 0.0011 8 0.55 3-22 18 0.0025 18 0.28 10-31 41 0.0169 123 0.43 54-280 Outer 1 0.0012 14 1.18 2-131 0 0 0 0 0-0 18 0.0679 825 0.75 150-4,530 Total 7 0.0011 22 0.80 4-111 18 0.0009 18 0.28 10-31 59 0.0112 948 0.66 208-4,320
on photo-recaptures), and potentially up to 9 hours or more (based on flow tank tests), depending on swim speed and location on the body. The authors concluded that a whale swimming at 3 km/hr could have been muddied 27 km away from its current location. Even if muddied 27 km away, 90% of the whales photographed during BOW-FEST would still be within the bound-aries of the inner box of the study area (Fig. 12b). An open mouth, however, suggests active feeding at the current location. This behavior was observed in all years but 2008 (Fig. 11).

14 Marine Fisheries Review
Figure 8.—Standard deviation ellipses (capturing approximately 68% of sightings weighted by group size) showing the regions occupied by bowhead, gray, and beluga whales during BOWFEST aerial surveys from late August to mid-September during the period 2007–11. Beluga sample sizes were too small during the period 2008–2010 to create ellipses. Given increased effort in the inner box (IB), the same analyses were run using only sightings within this region to confirm inner box distributions were not significantly different from sightings in the entire study area (SA) for all years combined (last panel).

79(2) 15
Table 8.—Logistic regression and ROC model results: final model parameters; AIC scores; AUC and threshold values; habitat preference areas; and the proportion of habitat in the inner box (IB) of the BOWFEST study area for bowhead, gray, and beluga whales.
Whale type Model parameters k AIC AUC Threshold Habitat area (km2) Percent of IB
Bowhead DISTSHORE + DISTSHELF 2 532.39 0.67 0.51 2575.81 37.96Gray BATHY+SLOPE+DISTSHORE+DISTSHELF 4 137.81 0.96 0.61 801.64 11.81Beluga BATHY 1 107.14 0.82 0.40 1947.94 28.71
Figure 9.—Late summer habitat probability (low/blue to high/red) and preference (black cross-hatch) for bowhead (stars), gray (crosses), and beluga (circles) whales near Barrow, Alaska, based on sightings within the inner box of the BOWFEST study area collected during late August to mid-September during the period 2007–11. Habitat preferences for all three species are shown in the last panel.
Table 9.—Bowhead whales observed traveling within the BOWFEST aerial survey study area from late August to mid-September during the period 2007–11. (Note: sample size was too small in 2007).
Year Sightings headed westerly (226°-315°) Total “travel” sightings with headings Percent heading westerly Rayleigh’s uniformity test (KCS, 2012) Grand mean vector
2007 2 –2008 12 21 57.1% Z = 7.103, p = 4.82E-4 294.774°2009 4 8 50.0% Z = 1.672, p = 0.1922010 16 52 30.8% Z = 0.414, p = 0.6612011 6 12 50.0% Z = 1.130, p = 0.33Total 38 93 40.9%

16 Marine Fisheries Review
Figure 10.—Swim directions of bowhead whales observed during BOWFEST aer-ial surveys from late August to mid-September during the period 2008–11 (Note: sample size was too small in 2007). Only 2008 showed a significant clustering of sightings in any direction (black line as opposed to red lines in other years).
During the aerial survey in 2010, groups of bowhead whales were ob-served with open mouths swimming in echelon formation, and in an un-usual position on their sides instead of upright (Fish et al., 2013). Ech-elon formation had been document-ed before for bowhead whales, but usually whales were upright (Wür-sig and Clark, 1993; George et al.6), though a lone whale skim feeding on its side was photographed in 2006 in the BOWFEST study area (Moore et al. 2010a). Moore et al. (2010a) also described “head lunging” bowhead whales observed on two occasions in 2006, a behavior not observed during
the BOWFEST aerial surveys. A fecal plume was evident on only one occa-sion during the BOWFEST study (Fig. 11).
Residency Times and Site Fidelity
Among the 664 unique whale im-ages, there were only three resightings of bowhead whales on different days within a study year (Fig. 14). These intrayear sightings occurred in 2009 (n = 1) and 2011 (n = 2). None of the whales had moved west of their initial sighting location as would be expect-ed if they were migrating past Barrow. The whale photographed two days later
in 2009 remained along the 20 m iso-bath, while the whales photographed five days later in 2011 had separated, but both remained in deeper waters (>100 m), one in Barrow Canyon and the other at the easternmost border of the study area (Fig. 14). The individual that remained in Barrow Canyon was the only intrayear-matched whale that appeared to have been feeding (fecal plume evident in the photograph taken on 9/9/2011).
There were three resightings of bowhead whales among the 5 years of BOWFEST photographs (Fig. 14). These interyear sightings included one whale photographed in 2007 and 2009, one in 2007 and 2011, and one in 2008 and 2010. Two of these whales were resighted along the 20 m isobath, near their initial sighting location two years earlier (Fig. 14). The third whale was first observed near the 20 m isobath but 5 years later was photographed in deep water (>100m) on the eastern-most boundary of the study area (Fig. 14). Both whales observed in 2007 appeared to be feeding (mud on ros-trums), but only the whale resighted in 2009 had evidence of feeding (mud on the rostrum). Mud was also on the rostrum of the whale observed again in 2010, but there was no evidence of feeding in the 2008 image.
In 2011, the bowhead aerial abun-dance spring survey (BAASS) flew in the Barrow area photographing whales from April to June (Mocklin et al.13). While analyses still continue on this dataset, a match between this dataset and BOWFEST included one bowhead whale mother with calf photographed in May and September (Fig. 14 and 15). Both sightings occurred over deep water (>100 m); at the easternmost border of the study area in the spring and in Barrow Canyon in late summer (Fig. 14). The mother had mud on her chin and tip of her rostrum in the pho-tograph taken during the spring mi-
13Mocklin, J., J. C. George, M. Ferguson, L. Vate Brattström, V. Beaver, B. Rone, C. Christman, A. Brower, B. Shea, C. Accardo. 2012. Aerial photography of bowhead whales near Barrow, Alaska, during the 2011 spring migration. Pap. SC/64/BRG3 pres. to IWC Sci. Committee, May 2012, 9 p.

79(2) 17
gration (possible evidence of feeding behavior) (Fig. 15A).
Age Classes
Using photogrammetric lengths, bowhead whales were sorted into spe-cific age classes: calf, juvenile, and adult (Fig. 16). Of the 654 images of sufficient quality to obtain length mea-surements (prior to matching), 65% were juveniles (between 6 and 13 m), 35% were adults (>13 m), and 1% were calves (<6 m). While there was no sta-tistical difference between percentages of juveniles and adults during the study period (paired t-test; p = 0.15), three of the 5 years (2008, 2010, 2011) included large numbers of younger juveniles in the photographic sample. Rugh (1990) noted that because young whales have fewer scars, which accumulate as bow-heads age, these whales may go un-recognized, and therefore, unmatched. Of 213 images classified as juveniles and assigned a unique whale number, only 6 (3%) were highly marked and 12 (6%) were moderately marked in at least one zone on the body. This likely contributed to the low number of pho-tographic resightings during the BOW-FEST study period.
Obtaining adequate lengths for feed-ing whales proved to be difficult. Im-age quality ratings for 276 feeding whales (including within day, intra-year, and interyear matches) were a 3 (i.e., not useful) for all zones of the body for 157 (58%) of these images. Lengths were obtained for about 34% of whales identified as feeding (Table 10). Of these, 46% were juveniles and 54% were adults.
Conclusions
The aerial survey component of BOWFEST was designed to docu-
Figure 11.—Percentage of bowhead whales (A) observed and (B) photographed displaying feeding behaviors during BOWFEST aerial surveys from late August to mid-September for the period 2007–11. Sample sizes are noted within each column.
Table 10.—Bowhead whales observed feeding within the BOWFEST aerial survey study area from late August to mid-September during the period 2007–11. Lengths (when available) were binned in meter increments.
Juveniles (6–<13m) Adults (>13m)
Year 7–<8 8–<9 9–<10 10–<11 11–<12 12–<13 13–<14 14–<15 15–<16 16–<17 17–<18 No length
2007 2 6 13 3 2 82008 1 2 4 4 1 3 3 1 72009 1 62010 1 1 2 1 5 1332011 1 2 4 5 7 1 2
Total 1 2 5 7 15 6 16 18 3 3 2 154

18 Marine Fisheries Review
Figure 12.—Locations of feeding bowhead whales (A) observed and (B) photo-graphed during BOWFEST aerial surveys from late August to mid-September for the period 2007–11.
ment patterns and variability in the timing and distribution of bowhead whales and to provide an estimate of temporal and spatial habitat use near Barrow, Alaska. Abundance estimates during this time period ranged from 22 (CV 0.80) to 213 (CV 0.30) bowhead whales within the combined study ar-eas. Traveling was the most commonly recorded behavior, but swim direction was highly variable among years, sug-gesting bowhead whales were not mi-grating through the area during the survey period. Only in 2008 was swim direction significantly clustered around a mean and clearly westward. This also coincided with the lowest percentage of whales photographed feeding dur-ing the study period, and the only year when skim feeding was not observed or photographed.
Most bowhead whales were locat-ed in shelf waters < 30 m deep when feeding behaviors were observed (81%) or photographed (90%). Habi-tat partitioning was evident among the cetacean species observed in greatest numbers: bowhead, gray, and beluga whales. Bowhead distribution aligned close to shore, extending from within Barrow Canyon on the western bound-ary of the study area toward the eastern edge, running along the 20 m iso-bath in almost all years. Gray whales aligned along the shelf break near Bar-row in all years, while belugas, when present, were primarily offshore over submarine canyon waters. This pat-terning among species was consis-tent with partitioning observed on a much larger scale across the Beaufort and Chukchi seas (e.g., Clarke et al., 2016). When modeling habitat prefer-ences based on all survey years, four parameters were considered: bathym-etry, bathymetric slope, distance from shore, and distance from the shelf break. Both distance from shore and distance from the shelf break were significant in predicting the presence of bowhead whales. All four parame-ters were significant in predicting gray whale presence. Only bathymetry was significant in predicting beluga whale presence.
Although the paucity of individual

79(2) 19
bowhead whale resightings between survey days suggested very low resi-dence times, we found the photogram-metric sample was largely comprised of juveniles. Young whales typical-ly are unmarked and, therefore, not matched. Only one instance of feed-ing was documented among the intra-year matches (6 images total) though the whales remained within the BOW-FEST study area. The across season match of a mother with calf had evi-dence of feeding during the spring but not late summer. Among the interyear matches, 4 of the 6 images document-ed feeding behaviors for each whale that was re-identified.
It appears that some whales re-turn to the region after initially head-ing west into the Chukchi Sea during what would be considered the migra-tory period. Quakenbush et al. (2010) performed a kernel density analysis of tagged whale movements that showed, in September, the area with the high-est probability of use was northeast of Barrow. Their satellite tag data also showed that bowhead whales do not move across the Beaufort Sea in a con-tinuous stream. Three of the 19 tagged whales left the Barrow area heading west, only to return and spend 13–32 days in the waters off Barrow (Quak-enbush et al., 2010). All of our intra-year matched whales moved east of their original sighting location, which was not expected so close to the west-bound fall migration.
Aggregations of bowhead whales have been linked to wind speeds and directions that in association with shelf and coastal currents, retain and concentrate their prey on the shelf near Barrow (Ashjian et al., 2010; Okkonen et al., 2011). Although, bowheads were most abundant in the BOWFEST survey area in 2008 and 2010, this did not necessarily mean that whales were feeding. Further analysis of the BOW-FEST dataset, in particular the whales displaying feeding behaviors, may pro-vide additional insights.
As the bowhead population contin-ues to grow and “there is no evidence that the population size is above the maximum net productivity level or
Figure 13.—Annual abundance estimates with associated confidence intervals (black bars) and number of unique bowhead whales photographed (ovals) dur-ing BOWFEST aerial surveys from late August to mid-September for the period 2007–11.
Figure 14.—Locations of bowhead whales with photographic matches. There were three intrayear BOWFEST matches (circle: first sighting; square subsequent), three interyear BOWFEST matches (triangles), and one intrayear match between spring (BAASS survey) to late summer (BOWFEST) (crosses).

20 Marine Fisheries Review
Figure 15.—Intrayear matches of a bowhead whale mother with calf observed (A) during the BAASS aerial survey April–June 2011 and (B) BOWFEST aerial surveys late August to mid-September 2011. Note the change in calf size relative to the adult. The mother had mud on her chin and tip of her rostrum in the spring photograph, possibly indicating feeding behavior.
Figure 16.—Age class distribution of bowhead whales during BOWFEST aerial surveys from late August to mid-September for the period 2007–11. Histogram shows percentage of whales per length bin in 10m increments for calves (black columns), juveniles (gray columns), and adults (white columns). Total percentage by age class is shown within each symbol for calves (diamonds), juveniles (circles), and adults (squares).
near carrying capacity” (Givens et al.14), more whales may seek foraging opportunities in the western Beau-fort and the Chukchi seas in response to increased feeding pressure in the eastern Beaufort Sea foraging areas. Other species have extended their ranges or are showing up in greater numbers in the Chukchi and western Beaufort seas —such as gray whales, humpback whales, fin whales, Balae-noptera physalus; minke whales, B. acutorostrata; and killer whales (e.g., Clarke et al., 2013). This suggests the potential for increasing prey compe-tition among zooplankton feeders, as well as increased predation by killer whales.
Industrial activity is also expected to increase in the Arctic (Reeves et al., 2012). Although bowhead whales are exposed to oil and gas develop-ment activities in the eastern Beaufort Sea and expanding activities (i.e., seis-mic exploration) in the Chukchi and western Beaufort seas (e.g., Moore et al., 2012), commercial fishing and most shipping operations have not yet
14Givens, G. H., S. L. Edmondson, J. C. George, R. Suydam, R. A. Charif, A. Rahaman, D. Haw-thorne, B. Tudor, R. A. DeLong, and C. W. Clark. 2013. Estimate of 2011 abundance of the Bering-Chukchi-Beaufort Seas bowhead whale population. Pap. SC/65a/BRG1 pres. to IWC Sci. Committee, May 2013, 30 p.
reached these regions. These activities will not only affect bowhead whales and other species endemic to the Arc-tic (Reeves et al., 2014), but potential-ly species expanding their range into this region. Mitigating the potential impacts on these species from these
activities will require putting preemp-tive measures in place (Moore et al., 2012; Reeves et al., 2012, 2014). The BOWFEST aerial study provides a 5-year record of late summer presence of cetaceans in the western Beaufort Sea, adding to the growing body of

79(2) 21
knowledge of these species and their habitat preferences in a region under-going rapid change.
Acknowledgments
Minerals Management Service (now the Bureau of Ocean Energy Manage-ment) funded the BOWFEST program through an Interagency Agreement be-tween BOEM and NMML (M08PG 20021), as part of the BOEM Alas-ka Environmental Studies Program. Charles Monnett (BOEM) provided guidance, support, and inspiration as project coordinator from 2007–2011. Jeffrey Denton (BOEM) saw BOW-FEST through to its conclusion in 2012.
NOAA’s Aircraft Operation Center provided the aircraft and crew. Our pi-lots were Jason Mansour, Wally Pierce, and Nicole Cabana in 2007; Nicholas Toth and Jon French in 2008; Nicholas Toth and Chris Daniels in 2009; Brad Fritzler and Rob Mitchell in 2010; and Brad Fritzler and Francisco Fuenmay-or in 2011. These pilots filled a criti-cal role in keeping the aircraft at the preferred altitude while flying intri-cate patterns over moving whales. Ron Pauley, Mike Merek, and Rob Militic provided mechanical support for the aircraft through these years. Dee Allen flew with us one day in 2009 (assisting with video photography) and Christy Sims joined the team in 2011.
Wayne Perryman loaned us a ra-dar altimeter and provided techni-cal advice, and Don LeRoi loaned us the FMC mount and assisted with the camera mount installation. Craig George provided the land calibration target. Noah Lawrence-Slavas assist-ed with the design of the water-borne target used in 2008–09, and Frederick Brower and Catherine Berchok towed this floating target array within the survey area. Janet Clarke provided the statistics and figure for the bowhead swim direction analysis and Rayleigh test. Alex Zerbini consulted on the dis-tance sampling analysis. This study was conducted under MMPA Scien-tific Research Permit No. 782-1719 (years 2007-10) and Permit No. 14245 (2011).
Literature CitedAshjian, C. J., S. R. Braund, R. G. Campbell,
J. C. George, J. Kruse, W. Maslowski, S. E. Moore, C. R. Nicolson, S. R. Okkonen, B. F. Sherr, E. B. Sherr, and Y. H. Spitz. 2010. Climate variability, oceanography, bow-head whale distribution, and Iñupiat subsis-tence whaling near Barrow, Alaska. Arctic 63:179–194.
Braham, H. W., and M. E. Dahlheim. 1982. Killer whales in Alaska documented in the Platforms of Opportunity Program. Rep. Int. Whal. Comm. 32:643–646.
Braham, H., B. Krogman, S. Leatherwood, W. Marquette, D. Rugh, M. Tillman, J. John-son, and G. Carroll. 1979. Preliminary report of the 1978 spring bowhead whale research program results. Rep. Int. Whal. Comm. 29:291–306.
Buckland, S. T., D. R. Anderson, K. P. Burnham, and J. L. Laake. 1993. Distance sampling: es-timating abundance of biological populations. Chapman and Hall, Lond., 446 p.
__________, __________, __________, __________, D. L. Borchers, and L. Thom-as. (Editors). 2001. Introduction to distance sampling: estimating abundance of biological populations. Oxford Univ. Press, N.Y., 448 p.
__________, __________, __________, __________, __________, and __________. (Editors). 2004. Advanced distance sampling: estimating abundance of biological popula-tions. Oxford Univ. Press, N.Y., 434 p.
Burnham, K. P., and D. R. Anderson. 2002. Model selection and multi-model inference: A practical information theoretic approach. Springer, N.Y., 2nd ed., 488 p.
Carroll, G. M., J. C. George, L. F. Lowry, and K. O. Coyle. 1987. Bowhead whale (Balaena mysticetus) feeding near Point Barrow, Alas-ka, during the 1985 spring migration. Arctic 40:105–110. (doi: https://doi.org/10.14430/arctic1754).
Citta, J. J., L. T. Quakenbush, S. R. Okkonen, M. L. Druckenmiller, W. Maslowski, J. Clem-ent-Kinney, J. C. George, H. Brower, R. J. Small, C. J. Ashjian, L. A. Harwood, and M. P. Heide-Jørgensen. 2015. Ecological char-acteristics of core-use areas used by Bering–Chukchi–Beaufort (BCB) bowhead whales, 2006–2012. Prog. Oceanogr. (136):201–222. (doi: https://doi.org/10.1016/j.pocean.2014.08.012).
Clarke, J. T., A. S. Kennedy, and M. F. Fergu-son. 2016. Bowhead and gray whale distribu-tions, sighting rates, and habitat associations in the eastern Chukchi Sea, summer and fall 2009–15, with a retrospective comparison to 1982–91. Arctic 69(4):359–377. (doi: https://doi.org/10.14430/arctic4597).
_______, S. E. Moore, and M. M. Johnson. 1993. Observations on beluga fall migration in the Alaskan Beaufort Sea and northeast-ern Chukchi Sea, 1982–91. Rep. Int. Whal. Comm. 43:387–396.
_______, K. Stafford, S. E. Moore, B. Rone, L. Aerts, and J. Crance. 2013. Subarctic ceta-ceans in the southern Chukchi Sea: Evidence of recovery or response to a changing eco-system. Oceanography 26(4):136–149. (doi: https://doi.org/10.5670/oceanog.2013.81).
Fish, F. E., K. T. Goetz, D. J. Rugh, and L. V. Brattström. 2013. Hydrodynamic patterns as-sociated with echelon formation swimming by feeding bowhead whales (Balaena mysti-cetus). Mar. Mammal Sci. 29(4):E498–E507.
IWC. 2010. Report of the Scientific Committee, Int. Whaling Comm., IWC/62/Rep 1, 91 p.
Jakobsson, M., L. A. B. Mayer, J. A. Coakley,S. Dowdeswell, B. Forbes, H. Fridman, R.Hodnesdal, R. Noormets, M. Pedersen, H. W. Rebesco, Y. Schenke, D. Zarayskaya, A. Accettella, R. M. Armstrong, P. Anderson, A. Bienhoff, C. Camerlenghi, I. Church, M. Ed-wards, J. V. Gardner, J. K. Hall, B. Hell, O. B. Hestvik, Y. Kristoffersen, R.Marcussen, D. Mohammad, S. V. Mosher, M. T. Nghiem, P. G. Pedrosa, P. Travaglini, and P. Weather-all. 2012. The International bathymetric chart of the Arctic Ocean (IBCAO) Version 3.0. Geophysical Res. Letters. (doi: https://doi.org/10.1029/2012GL052219).
KCS. 2012. Oriana Version 4.01. Kovach Com-puting Services. Anglesey, Wales (http://www.kovcomp.com).
Koski, W. R., R. A. Davis, G. W. Miller, and D. E. Withrow. 1992. Growth rates of bowhead whales as determined from low-level aerial photogrammetry. Rep. Int. Whal. Comm. 42:491–499.
__________, D. J. Rugh, A. E. Punt, and J. Zeh. 2006. An approach to minimize bias in esti-mation of the length-frequency distribution of bowhead whales (Balaena mysticetus) from aerial photogrammetric data. J. Cetacean Res. Manag. 8:45–54.
Laake, J., D. Borchers, L. Thomas, and D. Mill-er. 2007. Mark-recapture distance sampling (mrds). R package version 1.3.1.
Landino, S. W., S. D. Treacy, S. A. Zerwick, and J. B. Dunlap. 1994. A large aggregation of bowhead whales (Balaena mysticetus) feed-ing near Point Barrow, Alaska, in late Octo-ber 1992. Arctic 47(3):232–235. (doi: https://doi.org/10.14430/arctic1293).
Ljungblad, D. K., S. E. Moore, and J. T. Clarke. 1986. Assessment of bowhead whale (Balae-na mysticetus) feeding patterns in the Alas-kan Beaufort and northern Chukchi seas via aerial surveys, fall 1979–84. Rep. Int. Whal. Comm. 36:265–272.
Mocklin J., D. J. Rugh, W. R. Koski, and N. Lawrence-Slavas. 2010. Comparison of land-based vs. floating calibration targets used in aerial photogrammetric measure-ments of whale lengths. Mar. Mammal Sci. 26:969–976.
__________, D. Rugh, S. Moore, and R. An-gliss. 2012. Using aerial photography to in-vestigate evidence of feeding by bowhead whales. Mar. Mammal Sci. 28(3):602–619.
Moore, S. E. 1992. Summer records of bow-head whales in the northeastern Chukchi Sea. Arctic 45:398–400. (doi: https://doi.org/10.14430/arctic1419).
_________. 2000. Variability of cetacean dis-tribution and habitat selection in the Alaskan Arctic, autumn 1982–91. Arctic 53:448–460. (doi: https://doi.org/10.14430/arctic874).
__________ and J. T. Clarke. 1992. Patterns of bowhead whale distribution and abundance near Barrow, Alaska, in fall 1982–1989. Mar. Mammal Sci. 8(1):27–36.
__________ and R. R. Reeves. 1993. Distri-bution and movement. In J. J. Burns, J. J. Montague, and C.J. Cowles (Editors), The bowhead whale, p. 313–386. Spec. Publ. 2, Soc. Mar. Mammal., Lawrence, Kan., 787 p.
__________ and D. P. DeMaster. 1998. Cetacean habitats in the Alaskan Arctic. J. Northw. Atl. Fish. Sci. 22:55–69.
__________, J. C. Bennett, and D. K. Ljung-
22 Marine Fisheries Review
blad. 1989. Use of passive acoustics in con-junction with aerial surveys to monitor the fall bowhead whale (Balaena mysticetus) mi-gration. Rep. Int. Whal. Comm. 39:291–295.
_________, D. P. DeMaster, and P. K. Dayton. 2000. Cetacean habitat selection in the Alas-kan Arctic during summer and autumn. Arctic 53:432–447. (doi: https://doi.org/10.14430/arctic873).
__________, J. C. George, G. Sheffield, J. Ba-con, and C. Ashjian. 2010a. Bowhead whale distribution and feeding near Barrow, Alaska in late summer 2005–06. Arctic 63:195–205. (doi: https://doi.org/10.14430/arctic974).
_________, K. M. Stafford, and L. M. Munger. 2010b. Acoustic and visual surveys for bow-head whales in the western Beaufort and far northeastern Chukchi seas. Deep-Sea Res. II 57:153–157.
_________, R. R. Reeves, B. L. Southall, T. J. Ragen, R. S. Suydam, and C. W. Clark. 2012. A new framework for assessing the effects of anthropogenic sound on marine mammals in a rapidly changing Arctic. BioScience 62(3):289–295 (doi: https://doi.org/10.1525/bio.2012.62.3.10).
Muto, M. M., V. T. Helker, R. P. Angliss, B. A. Allen, P. L. Boveng, J. M. Breiwick, M. F. Cameron, P. J. Clapham, S. P. Dahle, M. E. Dahlheim, B. S. Fadely, M. C. Ferguson, L. W. Fritz, R. C. Hobbs, Y. V. Ivashchenko, A. S. Kennedy, J. M. London, S. A. Mizroch, R. R. Ream, E. L. Richmond, K. E. W. Shel-
den, R. G. Towell, P. R. Wade, J. M. Waite, and A. N. Zerbini. 2016. Alaska marine mammal stock assessments, 2015. U.S. Dep. Commer., NOAA Tech. Memo. NMFS-AF-SC-323, 300 p. (doi: https://doi.org/10.7289/V5/TM-AFSC-323).
Okkonen, S. R., C. Ashjian, R. G. Campbell, J. T. Clarke, S. E. Moore, and K. D. Taylor. 2011. Satellite observations of circulation features associated with a bowhead whale feeding ‘hotspot’ near Barrow, Alaska. Re-mote Sens. Environ. 115:2,168–2,174. (doi: https://doi.org/10.1016/j.rse.2011.04.024).
Quakenbush, L. T., J. J. Citta, J. C. George, R. J. Small, and M. P. Heide-Jørgensen. 2010. Fall and winter movements of bowhead whales (Balaena mysticetus) in the Chukchi Sea and within a potential petroleum development area. Arctic 63:289–307. (doi: https://doi.org/10.14430/arctic1493).
R Development Core Team, 2008. R: a language and environment for statistical computing, Vienna, Austria ed. R Foundation for Sta-tistical Computing, Vienna, Austria. ISBN 3-900051-07-0. URL: http://www.R-project.orgS.
Reeves, R., C. Rosa, J. C. George, G. Shef-field, and M. Moore. 2012. Implications of Arctic industrial growth and strategies to mitigate future vessel and fishing gear impacts on bowhead whales. Mar. Pol. 36:454–462. (doi: https://doi.org/10.1016/j.marpol.2011.08.005).
_________, P. J. Ewins, S. Agbayani, M. P. Heide-Jørgensen, K. M. Kovacs, C. Ly-dersen, R. Suydam, W. Elliot, G. Polet, Y. van Dijk, and R. Blijleven. 2014. Distribu-tion of endemic cetaceans in relation to hy-drocarbon development and commercial shipping in a warming Arctic. Mar. Pol. 44:375–389. (doi: https://doi.org/10.1016/j.marpol.2013.10.005).
Rugh, D. J. 1990. Bowhead whales reidentified through aerial photography near Point Bar-row, Alaska. Rep. Int. Whal. Comm. (SC/A88/ID15) Spec. Iss. 12:289–294.
_________, J. E. Zeh, W. R. Koski, L. S. Bar-aff, G. W. Miller, and K. E. W. Shelden. 1998. An improved system for scoring photo qual-ity and whale identifiability in aerial photo-graphs of bowhead whales. Rep. Int. Whal. Comm. (SC/49/AS19) 48:501–512.
_________, D. DeMaster, A. Rooney, J. Brei-wick, K. Shelden, and S. Moore. 2003. A review of bowhead whale (Balaena mystice-tus) stock identity. J. Cetacean Res. Manag. 5(3):267–279.
Suydam, R. S., and J. C. George. 1992. Recent sightings of harbour porpoises, Phocoena phocoena, near Point Barrow, Alaska. Can. Field-Nat. 106:489–492.
Würsig, B., and C. Clark. 1993. Behaviour. In J. J. Burns, J. J. Montague, and C. J. Cowles (Editors), The bowhead whale. Spec. Publ. 2., Soc. Mar. Mammal., Lawrence, Kan., 787 p.
Related Documents