CHUKCHI SEA COASTAL STUDIES: COASTAL GEOMORPHOLOGY, ENVIRONMENTAL SENSITIVITY, AND PERSISTENCE OF SPILLED OIL by Gordon A. Robilliard, John R. Harper, Jon Isaacs, and Carl Foget Woodward-Clyde Consultants One Walnut Creek Center 100 Pringle Avenue Walnut Creek, California 94596 Final Report Outer Continental Shelf Environmental Assessment Program Research Unit 644 March 1985 127

Welcome message from author
This document is posted to help you gain knowledge. Please leave a comment to let me know what you think about it! Share it to your friends and learn new things together.
Transcript

CHUKCHI SEA COASTAL STUDIES:COASTAL GEOMORPHOLOGY, ENVIRONMENTAL
SENSITIVITY, AND PERSISTENCE OF SPILLED OIL
by
Gordon A. Robilliard, John R. Harper,Jon Isaacs, and Carl Foget
Woodward-Clyde ConsultantsOne Walnut Creek Center
100 Pringle AvenueWalnut Creek, California 94596
Final Report
Outer Continental Shelf Environmental Assessment Program
Research Unit 644
March 1985
127

DEDICATION
This report is dedicated by threeof the authors to thememory of our
friend, colleague and fourth author, Carl Foget, who passed away before
this project could be completed. Carl was a true pioneer inthe art and
science of oil spill containment and cleanup technology. He taught many
of the present generation (including the three of us) much of what we know
about oil spill countermeasures. He always brought a very practical
engineering and operations-oriented perspective to the often esoteric
and impractical ideas manyof us had about dealing with oil spills in the
real world. This perspective is reflected in this report (Section 7.0)
andmanyothers. Carl is and will be truly missed as a friend, critic, and
colleague as well as an outstanding oil spill countermeasures engineer.

Successful completion of the field, analytical and mapping components
of the program which resulted in the Final Report, Maps, Resource Tables,
and Appendices reflects the cooperation and support of many people. The
authors are grateful to all, named below or not, who contributed to this
program. This study was funded in part by the Minerals Management
Service, Department of the Interior through an Interagency Agreement with
the National Oceanic and Atmospheric Administration, Department of
Commerce, as part of the Alaska Outer Continental Shelf Environmental
Assessment Program.
All authors were Woodward-Clyde Consultants (WCC) employees at the
beginning and for varying lengths of time in the program; however, all
have since left WCC. We are grateful to WCC, especially Mr. James D.
Sartor, for the continued support services (word processing, graphics,
reproduction) that allowed us to complete the report. We are also
grateful to our respective organizations for the continuing support that
allowed us to finish the report. They are ENTRIX INC. (Dr. Gordon
Robilliard), Dobrocky SEATECH (Dr. John Harper) and Jon Isaacs and
Associates (Jon Isaacs).
We are grateful to a large number of individuals and organizations
for their support, encouragement and patience throughout this project.
Special thanks go to: Mr. Lyman Thorsteinson, NOAA Alternative COTR, and
our principal NOAA contact on this project; Dr. M.J. Hameedi, NOAA COTR;
Amos Agnassagga, resident of Pt. Lay and field guide; Lt. Gary Vandenberg
(NOAA pilot) and Tony Accurso (NOAA flight engineer; Ben Mangina, WCC

field and VTR technician; Russ Geagel, NOAA field logistics coordinator;
Dr. Peter Connors, Bodega Research Associates, arctic shorebird
ecologist; Mike Joyce, ENTRIX INC., arctic waterfowl, seabird and
shoreline vegetation ecology; Brian Sawyer, map preparation and
production. A special note of appreciation goes to Kay Rooker and her
word processing staff at WCC for their “patience in deciphering our
handwriting and redoing this report several times. We apologize to those
whom we did not explicitly identify, however, we gratefully acknowledge
their support and we do not value their contribution any less.
130
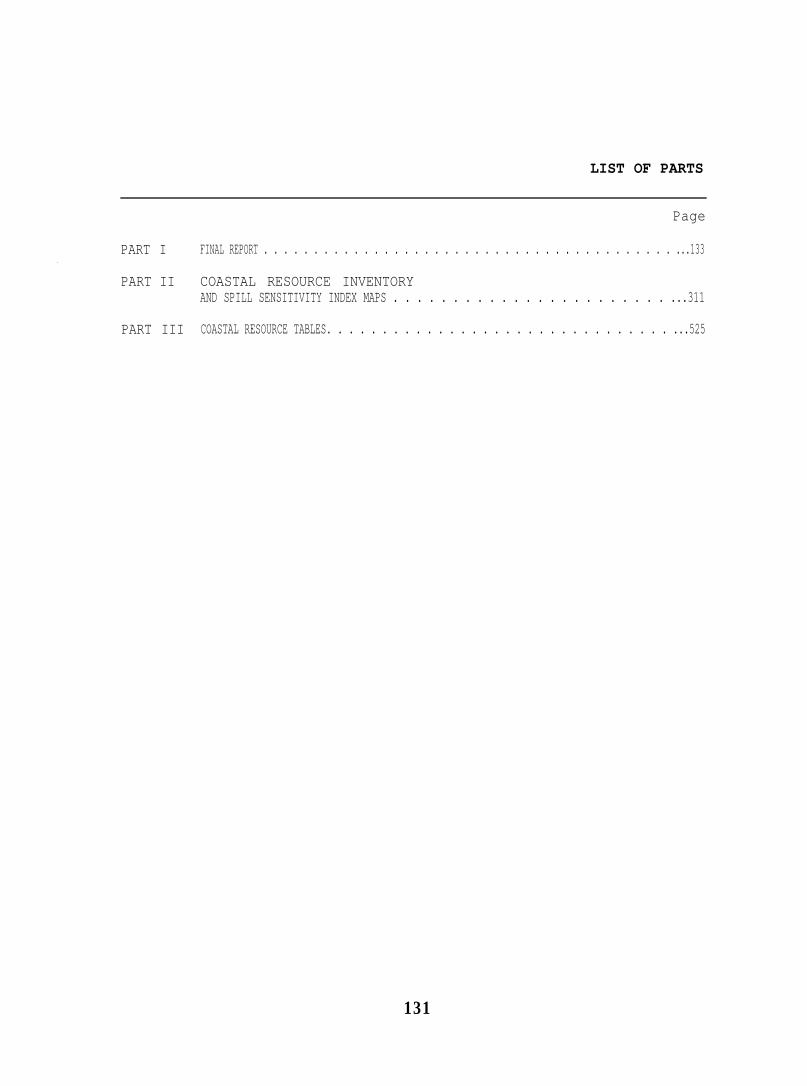
LIST OF PARTS
PART I
PART II
PART III
Page
FINAL REPORT . . . . . . . . . . . . . . . . . . . . . . . . . . . . . . . . . . . . . . . . . ...133
COASTAL RESOURCE INVENTORYAND SPILL SENSITIVITY INDEX MAPS . . . . . . . . . . . . . . . . . . . . . . . ...311
COASTAL RESOURCE TABLES. . . . . . . . . . . . . . . . . . . . . . . . . . . . . . . ...525
131

CHUKCHI SEA COASTAL STUDIESCOASTAL GEOMORPHOLOGY, ENVIRONMENTAL
SENSITIVITY, AND PERSISTENCE OF SPILLED OIL
PART I. FINAL REPORT
Gordon A. Robilliard,1 John R. Harper,2Jon Isaacs,3 and Carl Foget4
1 Present Address: ENTRIX INC., Concord, California2 Present Address: Dobrocky SEATECH, Sidney, British Columbia3 Present Address: Jon Isaacs and Assoc., Anchorage Alaska4 Deceased
133

TABLEOF CONTENTS
Page
1.0 INTRODUCTION
l.l Need for Study.... . . . . . . . . . . . . . . . . . . . . . . . . . . . . . . . . . . . . . ...1431.2 Study Area . . . . . . . . . . . . . . . . . . . . . . . . . . . . . . . . . . . . . . . . . . . . ...1441.3 0bjectives . . . . . . . . . . . . . . . . . . . . . . . . . . . . . . . . . . . . . . . . . . . . . . .1461.4 Background on Shore-zone Sensitivity Indices.. . . . . . . . . . . ...146
2.0 DESCRIPTION OF ENVIRONMENT
2.1 Physical Environment . . . . . . . . . . . . . . . . . . . . . . . . . . . . . . . . . . ...1512.1. l Meteorology . . . . . . . . . . . . . . . . . . . . . . . . . . . . . . . . . . . . . ...1512.1.2 0ceanography . . . . . . . . . . . . . . . . . . . . . . . . . . . . . . . . . . . . ...1522.1.3 Physiography and Geology . . . . . . . . . . . . . . . . . . . . . . . . ...155
2.2 Biological Environment . . . . . . . . . . . . . . . . . . . . . . . . . . . . . . . . ...1582.2.1 Introduction . . . . . . . . . . . . . . . . . . . . . . . . . . . . . . . . . . . . ...1582.2.2 Habitat Characteristics . . . . . . . . . . . . . . . . . . . . . . . . . ...1592.2.3 Important Species . . . . . . . . . . . . . . . . . . . . . . . . . . . . . . . ...159
2.3 Human Resources. . . . . . . . . . . . . . . . . . . . . . . . . . . . . . . . . . . . . . . ...1662.3.1 Introduction . . . . . . . . . . . . . . . . . . . . . . . . . . . . . . . . . . ...-.1662.3.2 Village Profiles . . . . . . . . . . . . . . . . . . . . . . . . . . . . . . . . ...1682.3.3 Residential Areas (Communities) . . . . . . . . . . . . . . . . . ...1702.3.4 Recreation Areas (Traditional Use Areas] . . . . . . . . . ...1702.3.5 Transportation Facilities . . . . . . . . . . . . . . . . . . . . . . . ...1712.3.6 Subsistence. . . . . . . . . . . . . . . . . . . . . . . . . . . . . ...--......1712.3.7 Cultural Resources . . . . . . . . . . . . . . . . . . . . . . . . . . . . . . ...174
3.0 FIELD AND DATA ANALYSIS METHODS
3.1 Introduction . . . . . . . . . . . . . . . . . . . . . . . . . . . . . . . . . . . . . . . . . . ...1853.2 Pre-Survey Planning . . . . . . . . . . . . . . . . . . . . . . . . . . . . . . . . ...-..1853.3 Field Survey . . . . . . . . . . . . . . . . . . . . . . . . . . ...................186
3.3. l Aerial Reconnaissance . . . . . . . . . . . . . . . . . . . . . . . . . . . ...1863.3.2 GroundTruth Survey . . . . . . . . . . . . . . . . . . . . . . . . . . . . . ...188
3.4 Post-Survey Data Reduction . . . . . . . . . . . . . . . . . . . . . . . . . . . . . ...1983.4 .l Mapping Techniques . . . . . . . . . . . . . . . . . . . . . . . . . . . . . . ...1983.4.2 Mapping Approach . . . . . . . . . . . . . . . . . . . . . . . . . . . . . . . . ...199
135

4.0 OIL RESIDUE
4.1 Introduction . . . . . . . . . . . . . . . . . . . . . . . . . . . . . . . . . . . . . . . . . . . ..2034.2 Previous Studies on Oil Persistence . . . . . . . . . . . . . . . . . . . . . ...203
4.2. 1 0il Spill Case Studies . . . . . . . . . . . . . . . . . . . . . . . . . . . ...2044.2.2 Baffin Island Oil Spill (BIOS) Experiment . . . . . . . . . ...2074.2.3 Oil Spill Sensitivity Studies in the Arctic . . . . . . . ...209
4.3 Development of an Oil Residence Index (ORI) . . . . . . . . . . . . . . . ..2114.3 .l Background . . . . . . . . . . . . . . . . . . . . . . . . . . . . . . . . . . . . . . ...2114.3.2 Basis for Oil Residence Index Development . . . . . . . . . ...2124.3.30il Residence Index (ORI] . . . . . . . . . . . . . . . . . . . . . . . . ...2154.3.4 Shore-Zone Types and Oil Residence . . . . . . . . . . . . . . . ...216
4.4 Shore-Zone Physical Characterization . . . . . . . . . . . . . . . . . . . . . . 2264.4.1 Repetitive Shore-Zone Components . . . . . . . . . . . . . . . . ...2264.4.2 Repetitive Shore-Zone Types . . . . . . . . . . . . . . . . . . . . . . ..230
4.5 Results . . . . . . . . . . . . . . . . . . . . . . . . . . . . . . . . . . . . . . . . . . . . . . ...-2314.5. l Resource Inventory . . . . . . . . . . . . . . . . . . . . . . . . . . . . . . ...2314.5.2 0il Residence Indices . . . . . . . . . . . . . . . . . . . . . . . . . . . ...241
4.6 Summary . . . . . . . . . . . . . . . . . . . . . . . . . . . . . . . . . . . . . . . . . . . . . . . ...243
5.0 BIOLOGICAL SENSITIVITY
5.1 Introduction . . . . . . . . . . . . . . . . . . . . . . . . . . . . . . . . . . . . . . . . . . ...2455.2 Conceptual Development of the Biological
Sensitivity Index (BSI). . . . . . . . . . . . . . . . . . . . . . . . . . . . . . . . ...2455.3 Limitations to the Biological Sensitivity Index . . . . . . . . . ...2485.4 Definition of Terms . . . . . . . . . . . . . . . . . . . . . . . . . . . . . . . . . . . . . ..24s
5.4 .l Vulnerability. . . . . . . . . . . . . . . . . . . . . . . . . . . . . . . . . . . ...2495.4.2 Sensitivity . . . . . . . . . . . . . . . . . . . . . . . . . . . . . . . ...-.....2495.4.3 Level of Concern . . . . . . . . . . . . . . . . . . . . . . . . . . . ...-....250
5.5 Habitats and Biological Resources Of Concern . . . . . . . . . . . . ...2525.5. l Habitats . . . . . . . . . . . . . . . . . . . . . . . . . . . . . . . . . . . . . . . . ...2525.5.2 Species . . . . . . . . . . . . . . . . . . . . . . . . . . . . . . . . . . . . . ...--..257
5.6 Results . . . . . . . . . . . . . . . . . . . . . . . . . . . . . . . . . . . . . . . . . . . . . . . ...2625.7 Summary . . . . . . . . . . . . . . . . . . . . . . . . . . . . . . . . . . . . . . . . . . . . . . . ...264
6.0 HUMAN USE SENSITIVITY
6.1 Background on Human Use Sensitivity . . . . . . . . . . . . . . . . . . . . . ...2656.2 Development of the Human Use Sensitivity Index (HUI) . . . . . ...2666.3 Application of the Human Use Sensitivity Index. . . . . . . . . . . ...268
6.3.1 Residential Areas (Villages) . . . . . . . . . . . . . . . . . . . . . . . 2686.3.2 Transportation Sites . . . . . . . . . . . . . . . . . . . . . . . . . . . . ...2686.3.3 Recreation Areas . . . . . . . . . . . . . . . . . . . . . . . . . . . . . . . . ...2696.3.4 Subsistence Resources . . . . . . . . . . . . . . . . . . . . . . . . . . . ...2706.3.5 Cultural Resources . . . . . . . . . . . . . . . . . . . . . . . . . . . . . . ...271
6.4 Methods . . . . . . . . . . . . . . . . . . . . . . . . . . . . . . . . . . . . . . . . . . . . . . . ...2716.4 .1 Literature Survey . . . . . . . . . . . . . . . . . . . . . . . . . . . . . . . ...2716.4 .2 Map Development. . . . . . . . . . . . . . . . . . . . . . . . . . . . . . . . . ...272
6.5 Results . . . . . . . . . . . . . . . . . . . . . . . . . . . . . . . . . . . . . . . . . . . . . . . ...2726.6 Summary . . . . . . . . . . . . . . . . . . . . . . . . . . . . . . . . . . . . . . . ...-.......274
136

7.0 OIL SPILL COUNTERMEASURES
7.1 Introduction . . . . . . . . . . . . . . . . . . . . . . . . . . . . . . . . . . . . . . . . . . ...2757.20verview of Oil Spill Impacts . . . . . . . . . . . . . . . . . . . . . . . . . . . ...2757.3 Seasonal Influence on Oil Spill Countermeasures . . . . . . . . . ...2777.4 Open Water Containment and Cleanup . . . . . . . . . . . . . . . . . . . . . . ...2787.5 Shoreline Protection . . . . . . . . . . . . . . . . . . . . . . . . . . . . . . . . . . ...279
7.5. l Methods . . . . . . . . . . . . . . . . . . . . . . . . . . . . . . . . . . . . . . . . . ...2797.5.20pen Water Season . . . . . . . . . . . . . . . . . . . . . . . . . . . . . . . ...2797.5.3 Transition Season . . . . . . . . . . . . . . . . . . . . . . . . . . . . . . . ...2807.5.4 Winter Season.. . . . . . . . . . . . . . . . . . . . . . . . . . . . . . . . . . ...280
7.6 Shoreline Cleanup Factors . . . . . . . . . . . . . . . . . . . . . . . . . . . . . . ...2827.7 Shoreline Cleanup Techniques . . . . . . . . . . . . . . . . . . . . . . . . . . . ...282
7.7. l Manual Cleanup.. . . . . . . . . . . . . . . . . . . . . . . . . . . . . . . . . ...2837.7.2 Heavy Equipment Cleanup . . . . . . . . . . . . . . . . . . . . . . . . . ...2837.7 .3 Light Equipment Cleanup . . . . . . . . . . . . . . . . . . . . . . . . . ...2857.7.4 Chemical Cleanup . . . . . . . . . . . . . . . . . . . . . . . . . . . . . . . . ...2857.7.51n Situ Burning. . . . . . . . . . . . . . . . . . . . . . . . . . . . . . . . . ...2857.7.6 Natural Cleaning . . . . . . . . . . . . . . . . . . . . . . . . . . . . . . . . ...285
7.8 Effectiveness of Cleanup Techniques on the Shore Zone . . . . ...2867.8. l Rock Cliffs . . . . . . . . . . . . . . . . . . . . . . . . . . . . . . . . . . . . . ...2867.8.2 Tundra Cliffs... . . . . . . . . . . . . . . . . . . . . . . . . . . . . . . . . ...2867.8.3 Barrier Islands Without Vegetation . . . . . . . . . . . . . . . ...2887.8.4 Barrier Islands With Vegetation . . . . . . . . . . . . . . . . . . . . . 2887.8.5 Wetlands . . . . . . . . . . . . . . . . . . . . . . . . . . . . . . . . . . . . . . . . ...2887.8.6 Delta Fronts... . . . . . . . . . . . . . . . . . . . . . . . . . . . . . . . . . ...289
7.9 Disposal of Contaminated Materials . . . . . . . . . . . . . . . . . . . . . . ..2897.10 Surmnary . . . . . . . . . . . . . . . . . . . . . . . . . . . . . . . . . . . . . . . . . . . . . . ...290
8. O SUMMARY . . . . . . . . . . . . . . . . . . . . . . . . . . . . . . . . . . . . . . . . . . . . . . . . . . . ...291
9. P REFERENCES . . . . . . . . . . . . . . . . . . . . . . . . . . . . . . . . . . . . . . . . . . . . . . . . ...301
Appendices and other deliverables submitted separatelytoNOAA include:
Appendix A. Aerial Videotape Manual (5 copies)
Appendix B. Original FieldData Sheets
One setof 21 20-minute%” Videotapes

LIST OF FIGURES
Figure Page
1.1
2.1
2.22.33.13.23.33.43.53.63.73.83.93.104.14.24.34.44.54.64.74.84.94.104.114.124.134.144.154.164.175.15.25.35.4
Study Area Extending from Pt. Barrow to Cape Thompson . . . . . . . ...145Longshore Drift Directions alongthe NorthernChukchi Sea coast.... . . . . . . . . . . . . . . . . . . . . . . . . . . . . . . . . . . . . ...154Physiographic Regionsof Northern Alaska . . . . . . . . . . . . . . . . . . ...156Traditional Land Use and Archaeological Areas . . . . . . . . . . . . . . ...175
Videotape Log Sheet... . . . . . . . . . . . . . . . . . . . . . . . . . . . . . . . . . . . ...187Color FilmLog Sheet.. . . . . . . . . . . . . . . . . . . . . . . . . . . . . . . . . . . . . ...189Location of Ground Truth Stations . . . . . . . . . . . . . . . . . . . . . . . . . ...190Location Description Sheet . . . . . . . . . . . . . . . . . . . . . . . . . . . . . . . ...191Sketch Sheet . . . . . . . . . . . . . . . . . . . . . . . . . . . . . . . . . . . . . . . . . . . . . ...192Beach Profile . . . . . . . . . . . . . . . . . . . . . . . . . . . . . . . . . . . . . . . . . . . . ...193Physical Observation Check List . . . . . . . . . . . . . . . . . . . . . . . . . . . ...194Grain Size Estimates. . . . . . . . . . . . . . . . . . . . . . . . . . . . . . . . . . . . . ...195Biological Observation Checklist Sheet . . . . . . . . . . . . . . . . . . . . . ..196Illustration of the Mapping Approach . . . . . . . . . . . . . . . . . . . . . . . . . 200
Rock Cliff near the Abandoned CorwinMine . . . . . . . . . . . . . . . . . . . . .217High Tundra Cliff to the South of Barrow . . . . . . . . . . . . . . . . . . . . ...217Barrier Spit onAhyougutuk Lake . . . . . . . . . . . . . . . . . . . . . . . . . . . ...219Close-up Photo of Barrier Island Sediment. . . . . . . . . . . . . . . . . . ...219An Inlet and Programing Recurve Spits . . . . . . . . . . . . . . . . . . . . . . ...220Wide Vegetated Barrier Island South ofPt. Lay . . . . . . . . . . . . . . . ..22OThick Vegetative Cover on a Barrier Island . . . . . . . . . . . . . . . . . ...222Small Recurve Spits in the Kuk River . . . . . . . . . . . . . . . . . . . . . . . ...222Ground Photo ofa Small Swash Ridge . . . . . . . . . . . . . . . . . . . . . . . . ...223Rapidly Retreating LowTundra Cliff in Kugrua Bay . . . . . . . . . . . ...223Small Estuary Immediately Southof Barrow. . . . . . . . . . . . . . . . . . ...225Sand Flats in the Upper Portionof the Kuk River Delta . . . . . . . ...225Mapping Patterns used for Shore-Zone Components . . . . . . . . . . ...-.227Oblique Aerial Photoof Ground-Ice . . . . . . . . . . . . . . . . . . . . . . . . ...236Ice Push on the Shore Southwest of Point Franklin . . . . . . . . . . . ...236Oblique Aerial Photoof Storm-Surge Log-Debris Lines . . . . . . . ...238Storm Surge Elevations along the Northern Chukchi Sea Coast . ...240Rock Cliffs East of Cape Lisburne . . . . . . . . . . . . . . . . . . . . . . . . . . ...253Barrier Island at Akoviknak Lagoon, East Of Point Hope . . . . . . ...253Wetlands onMainland Shore in Southern Kasegaluk Lagoon. . . . . ...254Zonation of Vegetated Shoreline . . . . . . . . . . . . . . . . . . . . . . . . . . . ...256
139
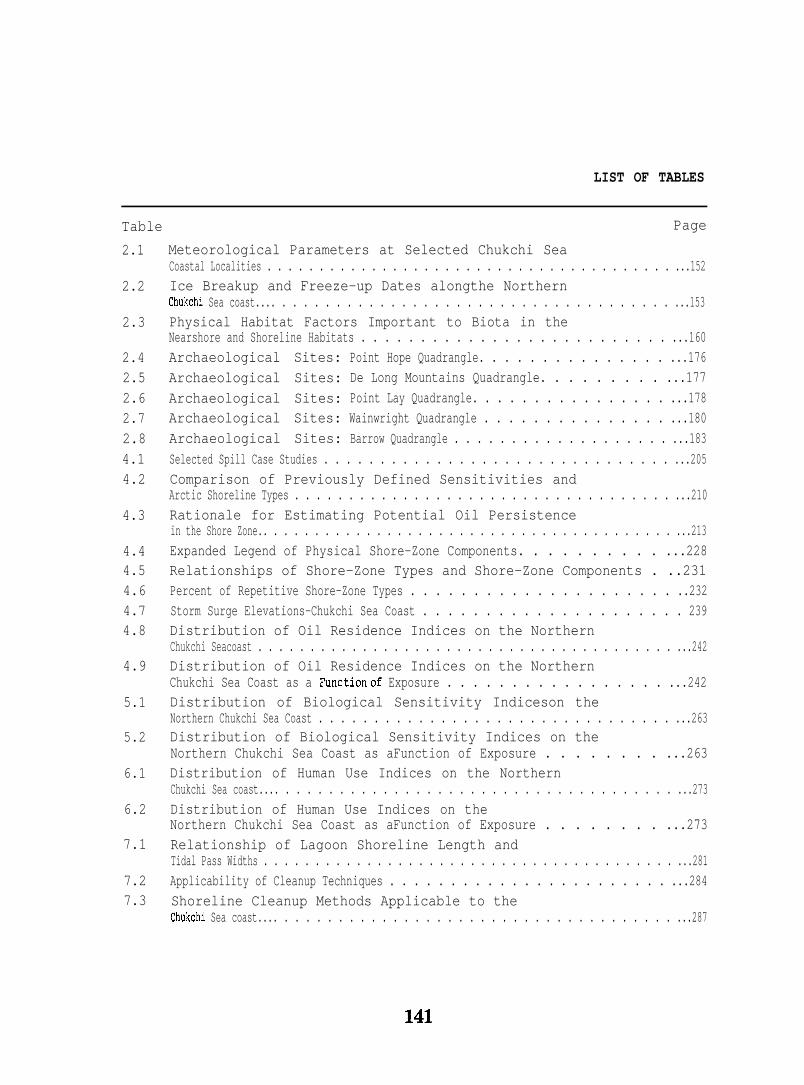
LIST OF TABLES
Table Page
2.1
2.2
2.3
2.42.52.62.72.84.14.2
4.3
4.44.54.64.74.8
4.9
5.1
5.2
6.1
6.2
7.1
7.27.3
Meteorological Parameters at Selected Chukchi SeaCoastal Localities . . . . . . . . . . . . . . . . . . . . . . . . . . . . . . . . . . . . . . . ...152Ice Breakup and Freeze-up Dates alongthe NorthernChukchi Sea coast.... . . . . . . . . . . . . . . . . . . . . . . . . . . . . . . . . . . . . ...153Physical Habitat Factors Important to Biota in theNearshore and Shoreline Habitats . . . . . . . . . . . . . . . . . . . . . . . . . . ...160Archaeological Sites:Archaeological Sites:Archaeological Sites:Archaeological Sites:Archaeological Sites:
Point Hope Quadrangle. . . . . . . . . . . . . . . ...176De Long Mountains Quadrangle. . . . . . . . . ...177Point Lay Quadrangle. . . . . . . . . . . . . . . . ...178Wainwright Quadrangle . . . . . . . . . . . . . . . ...180Barrow Quadrangle . . . . . . . . . . . . . . . . . . . ...183
Selected Spill Case Studies . . . . . . . . . . . . . . . . . . . . . . . . . . . . . . . ...205Comparison of Previously Defined Sensitivities andArctic Shoreline Types . . . . . . . . . . . . . . . . . . . . . . . . . . . . . . . . . . . ...210Rationale for Estimating Potential Oil Persistencein the Shore Zone.. . . . . . . . . . . . . . . . . . . . . . . . . . . . . . . . . . . . . . . . ...213Expanded Legend of Physical Shore-Zone Components. . . . . . . . . . ...228Relationships of Shore-Zone Types and Shore-Zone Components . ..231Percent of Repetitive Shore-Zone Types . . . . . . . . . . . . . . . . . . . . . ..232Storm Surge Elevations–Chukchi Sea Coast . . . . . . . . . . . . . . . . . . . . . 239Distribution of Oil Residence Indices on the NorthernChukchi Seacoast . . . . . . . . . . . . . . . . . . . . . . . . . . . . . . . . . . . . . . . . ...242Distribution of Oil Residence Indices on the NorthernChukchi Sea Coast as a Functionof Exposure . . . . . . . . . . . . . . . . . ...242Distribution of Biological Sensitivity Indiceson theNorthern Chukchi Sea Coast . . . . . . . . . . . . . . . . . . . . . . . . . . . . . . . . ...263Distribution of Biological Sensitivity Indices on theNorthern Chukchi Sea Coast as aFunction of Exposure . . . . . . . . ...263Distribution of Human Use Indices on the NorthernChukchi Sea coast.... . . . . . . . . . . . . . . . . . . . . . . . . . . . . . . . . . . . . ...273Distribution of Human Use Indices on theNorthern Chukchi Sea Coast as aFunction of Exposure . . . . . . . . ...273Relationship of Lagoon Shoreline Length andTidal Pass Widths . . . . . . . . . . . . . . . . . . . . . . . . . . . . . . . . . . . . . . . . ...281Applicability of Cleanup Techniques . . . . . . . . . . . . . . . . . . . . . . . ...284Shoreline Cleanup Methods Applicable to theChukchi Sea coast.... . . . . . . . . . . . . . . . . . . . . . . . . . . . . . . . . . . . . ...287

1.0INTRODUCTION
1.1 NEED FOR STUDY
The Outer Continental Shelf Environmental Assessment Program (OCSEAP)
was established to conduct environmental research in Alaska Outer
Continental Shelf (OCS) areas targeted for potential oil and gas
development. The OCSEAP is under the auspices of the National Oceanic
and Atmospheric Administration (NOM) within the Department of Commerce.
OCSEAP provides to agencies the scientific data and information needed to
predict environmental disturbances, to resolve multiple-use conflicts
associated with offshore oil and gas leasing and to make other resource
management decisions in Alaska.
One of the categories of information is the relative vulnerability
and sensitivity to spilled oil of Alaskan shorelines adjacent to areas
proposed for offshore oil and gas development. Much of the Alaskan
coastline has already been classified on this basis. Such
classifications are useful in pre-development planning and decisions
relating to shoreline protection and cleanup strategies in the event of
an actual spill. Coastal vulnerabilities are determined by an
integration of the major physical and biological features of a particular
region with emphasis on the physical features. NOAA-sponsored coastal
vulnerability studies have typically included analysis of coastal
oceanography and geomorphology data to predict the persistence of oil in
nearshore waters and beach sediments. Such information, when coupled
with biological attributes, forms the basis for oil spill response
decisions and environmental sensitivity assessments. Results from such
143

studies have been portrayed on a series of maps which rank the
vulnerabilities of each segment of the coastline.
The Chukchi Sea coastline has not been classified with regard to oil
spill sensitivity, vulnerability, persistence, etc. Some of the specific
information needs, identified by MMS for the oil and gas lease sale in
the Barrows Arch of the Chukchi Sea are: (a) identification and
characterization of the species and habitats at risk from and sensitive
to spilled oil, (b) persistence or residence of oil on the shoreline and
(c) realistic oil spill protection and cleanup strategies for the Chukchi
Sea coastline. To assist in management decisions, this information
should be compatible with and complement that which has already been done
and has produced coastal characterization and sensitivity maps.
1.2 STUDY AREA
The study area extends from Pt. Barrow in the northern Chukchi coast
southwards to Cape Thompson (Fig. 1.1), a coastline length of
approximately 675 Ian (420 miles). The study area includes a variety of
coastal environments including: barrier islands, coastal lagoons,
estuaries, deltas, tundra cliffs and a few bedrock exposures. The
resource description and sensitivity analyses are restricted to the zone
between the lower-low water level and the upper limit of normal
storm-surge action as defined by the most prominent log debris line. The
astronomical tidal range is less than 0.3 III (1 ft) but storm surges
conmonly exceed 2.0 m (6 ft) on some sections of the coast, and coastal
waters may innundate large areas of the tundra. The physical,
biological, and human use characteristics of the study area are decribed
in more detail in Section 2.0.
144

$0 166° 164° 162° 160° 166° 1660 l!
ChukchiSea
I 1 A 1 I I
e,. ,: ,..,%bine~., .:.. . .“ ,. “..
. . .. . .. ..,. .,... ,:
.. .. : .: :.,. .... . . . . . . . .point .:.:.... . .
Ho* ‘.”:.::::;::: :: tJY“.;::{:.. W Thonvson
4°
-70°
Figure 1-1. STUDY AREA EXTENDING FROM PT. BARROW TO CAPE THOMPSON
145

1.3 OBJECTIVES
The primary objectives of this program are:
(1) Describe the physical and biological characteristics of the
northern Chukchi Sea coastline, emphasizing shore
characteristics that influence the effect of oil spills or that
are likely to be affected by oil spills.
(2) Describe and map the level of oil persistence along the
shoreline.
(3) Describe and map the vulnerability and sensitivity of selected
coastal biological resources to spilled oil.
(4) Describe and map the sensitivity of selected human uses of the
shoreline to spilled oil.
(5) Describe the cleanup techniques and equipment available for use
in arctic conditions and recommend appropriate shoreline
countermeasures.
This report addresses each of these objectives and provides N04bWlMS
with the information required to make oil and gas leasing decisions.
1.4 BACKGROUND ON SHORE-ZONE SENSITIVITY INDICES
Prior to evaluating environmental impacts, identifying appropriate
countermeasures, or pre-planning in the oil spill contingency plan, the
vulnerability and sensitivity of shore-zone resources need to be
described in a way that is useful for impact assessment as well as for
spill countermeasure planning and implementation. Comprehensive, but
simple and practical oil spill sensitivity indices are a significant aid
in meeting these three needs.
146

Numerous indices have been proposed to represent the effect of oil on
biological, physical, human, or some combination of these resources of
the shore zone. However, most of the indices have been difficult to
apply in realistic situations. Some are too simple in that they do not
take into account essential information, especially related to temporal
distribution of resources. Others are too complex in that they include
all the essential information and attempt to present it as part of the
index. In most cases, indices have an implied or explicit ranking
mechanism built into them. The ranking system assigns fixed values
(implicitly or explicitly) and is often not flexible enough to account
for temporal or spatial variations in abundance, distribution, or
importance of the shore-zone resources of concern.
These spill indices for shorelines have undergone a considerable
evolution since Owens (1971) suggested the basic relationship between
shoreline type, oil persistence, and biological sensitivity. He also
defined nine shoreline types in terms of sensitivity to oil spills.
Hayes et al. (1976) defined and ranked ten shoreline types in terms of an
Oil Spill Susceptibility Index that was based on the physical longevity
of oil in each environment in the absence of cleanup efforts. Owens
(1977) described in detail the relationships between shoreline
sensitivity, oil persistence, and coastal processes. Ruby (1977),
Gundlach and Hayes (1978), Ruby and Hayes (1978), and Michel et al.
(1978) modified the Hayes et al. (1976) approach slightly to account for
persistence of oil in shoreline environments and to include some
biological considerations; they termed this revised approach the Oil
Spill Vulnerability Index.
Worbets (1979) added human sensitivity to the geological and
biological sensitivity scale defined by Hayes et al, (1976). Worbets
also introduced a weighted scale for the various shore–zone resources and
developed a numerical ranking system for use in the Canadian Beaufort
Sea. Nummedal (1980) defined eight shoreline types in terms of oil
persistence (“retention potential”) which is important in assessing the
longevity of impacts.
147
Foget et al. (1978) presented a sensitivity ranking, modified from
Hayes et al. (1976) that was based on: (a) type of oil, (b) oil
penetration and burial, (c) shoreline energy level, (d) ambient
temperature, (e) expected oil persistence, and (f) biological
sensitivity. The biological sensitivity was a subjective evaluation based
on the expected mortality levels of the dominant species, expected
recolonization by the ecologically dominant species, and overall rate of
recovery of the community. They then developed a matrix for sensitivity
levels and oil types. Gundlach et al. (1980) incorporated imPOrtant,
sensitive biological resources such as marine birds and mammals into the
vulnerability index of Gundlach and Hayes (1978b) and renamed the index
the Environmental Sensitivity Index. They also included location and
seasonal use information for each of the sensitive biological resources
on the maps.
Robilliard et al. (1980) defined a combined shoreline vulnerability
and sensitivity in terms of: (a) oil contamination potential, physical
characteristics of oil, and persistence of oil, (b) physical processes
(i.e., currents, meteorology) at the time of the spill, (c) biology, (d)
geology and sediments, (e) human use of the area, (f) operational
constraints (logistics, equipment performance, countermeasure,
feasibility and effectiveness), and (g) cleanup impacts. This last
‘*index” was a conceptual model developed specifically to assist both
environmental managers who are concerned with environmental impacts and
operations managers who are concerned with the feasibility of
implementing oil spill protection or cleanup countermeasures. However,
Robilliard et al. (1980) could not reduce this large amount of
information to a single index (number, graphic display, narrative) that
would be of practical use.
148

Subsequently, Woodward-Clyde Consultants (1982), Robilliard and Owens
(1981), and Robilliard et al. (1983a, 1983b) developed a 2 or 3-index
system with a single index for each of oil persistence, biological
sensitivity, and human use sensitivity. The level of concern or
sensitivity of each index is categorized as primary (or high), secondary
(or moderate) and tertiary (or low) which is operationally more realistic
than the multi-level ranking used for several other indices. The spatial
distribution of each level of concern for each index is presented on a
separate map while the temporal distribution is presented on accompanying
tables.
In summary, Owens (1971) established the basic relationship between
shoreline type, oil persistence, and biology; Hayes et al. (1976)
established the first specific ranking scheme; Worbets (1979) added human
sensitivity; and Foget et al. (1979) and Robilliard et al. (1980) added
oil type and operational feasibility and effectiveness. Finally
Woodward–Clyde Consultants (1982) and Robilliard et al. (1983) developed
a system which presented the spatial distribution of the resource
sensitivity or oil persistence on maps and the temporal distribution in
tabular format.
To be realistic and useful in a practical sense to decision makers,
environmental managers, and oil spill operations personnel, any oil spill
sensitivity index must be flexible enough to account for the temporal and
spatial variability in abundance, size, distribution, and activity of the
vulnerable and sensitive coastal resources (i.e., resources that could be
harmed by a potential oil spill).
This report presents a practical approach that identifies, describes
and maps the concerns related to potential impacts of an oil spill on
shore zone resources. The approach includes a mechanism for providing
relevant information on the temporal and spatial variability of abundance
and distribution of the resources. The information is provided in both
map and tabular forms and is described in detail in the following
chapters.

2.0
DESCRIPTION OF ENVIRONMENT
2.1 PHYSICAL ENVIRONMENT
The physical (i.e., meteorological, oceanographic, and geological)
components resources of the study area are described briefly in this
section. For more detailed graphic and tabular summaries of the northern
Chukchi Sea coast, the reader is referred to La Belle (1975), National
Petroleum Reserve of Alaska Task Force (1978) and Selkregg (1975).
2.1.1 Meteorology
The local meteorological conditions along the Chukchi Sea coast have
a major influence on the potential persistence of oil on the coast and
thus sensitivity of the coast to oil spills. The climate not only
directly influences weathering rates of stranded oil, but also controls
ice distribution patterns, seasonal migration of animals and vegetation
growth patterns.
The Maritime arctic climate of the Chukchi
by subzero mean annual temperatures and little
2.1). Mean monthly temperatures are less than
Sea coast is characterized
precipitation (Table
freezing for all but June,
July and August (Selkregg 1975). Low mean annual temperatures result in
the formation of permafrost onshore and of sea ice offshore.
Winds are dominated by easterlies throughout the year (Table 2.1)
although summer storm winds from the west are not uncommon (I?atural
Petroleum Reserve of Chukchi Task Force 1978).

TABLE 2.1 METEOROLOGICAL PARAMETERS AT SELECTED CHUKCHI SEA COASTAL
LOCALITIES (after Brewer et al., 1977).
Mean Mean WindsAnnual Annual Prevailing Mean
Temperature Precipitation Direction Speed(“c) (cm (in.)) (knots)
Barrow -12.6 12.4 (4.9) E 11.8
Wainwright -11.7 13.0 (5.1) E --
Point Lay -10.6 17.0 (6.7) NE --
Cape Lisburne -7.8 28.7 (11.3) E 12.1
—
2.1.2 Oceanography
The most significant feature of the northern Chukchi Sea chest
oceanographic system is the presence of ice from October to June. The
sea ice limits wave exposure and in general reduces the magnitude of
circulation processes. The ice also has direct effects on the shore
processes as a result of shore/ice interactions.
Sea ice breakup dates for the major villages of the northern Chukchi
Sea coast are listed in Table 2.2. Of particular significance is the
progressively shorter open-water season as one progresses from south to
north (e.g. open–water season is 30 days or 25% shorter at Wainwright
than in areas to the south).
152

The offshore area to the south of Icy Cape is generally ice-free
during August and September with open–water extending westward to the
Siberian coast (La Belle 1975). However, to the north of Icy Cape, large
ice floes persist throughout the summer with August and September
concentrations typically in the range of 10 to 20 percent cover.
Ice cover is nearly complete for winter months (La Belle 1975) but
persistent easterly winds during the winter do cause quasi-permanent
shore–leads (W. Stringer, Univ. of Alaska, personal conmmnication 1983),
which serve as important migration corridors for marine maxmnals.
The extensive ice cover during most of the year limits wave action
and most waves are less than 1 m in height. However, westerly and
southwesterly storms are capable of generating waves in excess of two
meters in height (Hume and Schalk 1967). Wave approach directions are
predominantly from the west and southwest as a result of fetch
limitations to the north. The wave approach direction drives a
predominantly northward longshore drift, except in the lee of major
headlands (Figure 2.1).
TABLE 2.2 ICE BREAKUP AND FREEZE-UP DATES ALONG THE NORTHERN CHUKCHI SEA COAST (after La
Belle 1975)
Break-up Freeze-uvMean Range ?lean Range
Barrow 22 July 15 June to 22 August 3 October 31 August to 19 December
Wainwright 29 June 7 June to 26 July 2 October 26 September to 9 October
Point Lay 24 June 1 June to 10 July 4 November 12 October to 27 November
Cape Lisburne 5 July 18 June to 16 July 29 October 13 October to 11 November
Point. Hope 20 June 30 May to 8 July 11 November 6 October to 19 November
153

~o 166° 164° 162° 160° 1 !56°
&/
o~w
kilometers
Chukchi
Sw
a
70°
Figure 2-1. LONGSHORE DRIFT DIRECTIONS ALONG THE NORTHERNCHUKCH I SEA COAST (afier Wi=man a d, 1973)
154

A major northward flowing current system occurs in offshore areas and
is called the Alaskan Coastal Current (Paquette and Bourke 1974, Lewbel
and Gallaway 1984). Current velocities are typically in the order of 10
cm/s. Winter long-term average velocities are 1-5 cm/s with summer
storm-generated currents up to 200 cm/s, but more often 50-80 cm/s.
Reversals in flow occur occasionally, especially in winter (L.
Hochmeister, Science Applications Inc., Personal Communication 1983). In
addition, a well-developed coastal jet is a dominant mode of summer
coastal circulation for most of the northern Chukchi Sea coast (Wiseman
and Rouse 1980). The alongshore flows in these jets may reach 70 cm/s
and are commonly near 40 cm/s (Lewbel and Gallaway 1984).
2.1.3 PhysiograPhy and Geology
The Chukchi Sea coast study area extends from Pt. Barrow in the north
to Pt. Hope and includes two major physiographic regions with contrasting
terrain and relief conditions (lrJahrhaftig 1965). The Alaskan Arctic
Coast Plain which comprises much of the North Slope (Fig. 2.2) is
characterized by low topographic relief, numerous thaw lakes and
wetlands, and meandering streams (Black 1969; Walker 1973). Coastal
relief is rarely in excess of 15 m (50 ft) and is nowhere greater than 30
m (100 ft). The Arctic Foothills Province lies between the Arctic
Coastal Plain to the north and the Brooks Range to the south and extends
to the coastline between Pt. Lay and Pt. Hope (Fig. 2.2). The Foothills,
which include both northern and southern components (Fig. 2.2), consist
generally of broad, rounded ridges (in the north) and numerous irregular
buttes, mesas, and long linear ridges with intervening plains and
plateaus (in the south). Topographic relief is much greater than in the
Coastal Plain with elevations of 600 m (2000 ft) occurring near the coast
at Cape Lisburne. Drainage is well developed and lakes are rare (Black
1969; Walker 1973).
The physiography of the study area is strongly related to the
geology. The Coastal Plain is primarily a surface of deposition with
unconsolidated surface sediments ranging in size from clays to gravels.

Figure 2-2. PHYSIOGRAPHIC REGIONS OF NORTHERN ALASKA(from National Petroleum Reserve of Alaska Task Force, 1978;after Wahrhaftig, 1965)
156

Although the Coastal Plain was unglaciated, outwash streams from the
glaciers carried sand and gravel to the coast. Several recent marine
transgressions over the coastal plain resulted in the redistribution of
coarse stream sediments and in the extensive deposition of marine silts
and clays (Black 1969; McCulloch et al. 1965; Williams et al. 1977).
Consequently, a wide range of coastal deposits including beds of marine
clays and silts, relict beaches, relict dunes and alluvium occur within
the study area.
The Foothills Province is an area where surficial deposits are thin
and resistant bedrock outcrops are common. Bedrock is comprised of
resistant Mesozoic and Paleozoic sedimentary rocks (Beikman and Lathram
1976; Selkregg 1975). Resistant limestones, shales, and conglomerates
crop out along the coastline near Cape Lisburne and form near-vertical
coastal cliffs.
The entire study area is underlain by thick continuous permafrost
(Ferrians 1965). The offshore extent of permafrost along this coast is
unknown; however, permafrost does exist beneath offshore barrier islands
(Owens and Harper 1977) and is probably present beneath shallow coastal
lagoons. The presence of permafrost in the sediments has an important
influence on the stability of coastal tundra cliffs (Harper 1978), but
its influence on beach and barrier island stability is uncertain (Owens
and Harper 1983).
Offshore from the coast, the shelf for the most part is mantelled by
thin gravel and sand deposits although local sedimentary sandstones crop
out directly on the seabed (L. Phillips. USGS, personal communication,
1983) . Thick accumulations of sand occur as broad shoals near Icy Cape
and Pt. Franklin. The occurrence of large-scale bedforms on the seabed
and the predominance of coarse-grained sediments suggests that seabed
energy levels are relatively high in these areas.

2.2 BIOLOGICAL ENVIRONMENT
2.2.1 Introduction
In the nearshore and shoreline communities of the Chukchi Sea coast,
the principal biotic components of direct concern in an oil spill include
beluga whales, spotted seals, several species each of seabirds,
waterfowl, and shorebirds, and several species of anadromous fishes. The
area hosts few winter or year-round residents so most of the concern
focuses on the ice-free season,
Physical habitat factors strongly influence the distribution and
abundance of many species in the near-shore zone. Ice distribution and
quality dictate the distribution patterns of nearly all mammals, birds,
and anadromous fishes at some time of year. The morphological
configuration of coastal water bodies and substrates (e.g., existence of
bays, barrier islands, lagoons and inlets) and the associated water
quality affect the habitat use patterns of some mammals and most birds
and anadromous fishes. Large-scale water mass movements and points of
riv’er entry affect distributions of fishes and perhaps some of their
consumers (e.g., seabirds, belugas, spotted seals).
Approximately 10 coastal sites have been identified as areas where
biota concentrate for specific activities and are likely to be
particularly sensitive to impacts of oil and gas development (Truett
1984) . These include the annually recurring Chukchi Polynya; coastal
lagoons and bays and the associated barrier islands and spits; coastal
cliffs and the adjacent waters; river deltas and inlets; and an area of
sea cliffs that support kelp beds.
The following subsections describing the important species and
habitats in the study area are based on and liberally abstracted from a
recent synthesis by Truett (1984).
158

2,2.2 Habitat Characteristics
The nearshore habitats include include the coastal estuaries,
lagoons, and semi–enclosed bays plus associated wetlands and shoreline
habitats. The water mass is frequently brackish and warm. In the
shallow nearshore, the consumers (spotted seal, beluga whale, Brant,
oldsquaw, eiders, marsh and mudflat birds, beach birds, and anadromous
and marine fishes) are with few exceptions summer and early fall
inhabitants of the area. Except for terrestrial and wetland vegetation
and for zooplankton transported largely from offshore, the food base is
primarily benthic invertebrates.
The distribution and abundance of the important species is strongly
influenced by physical attributes of the area. In the fall-spring
period, the presence of shorefast sea ice plus snow cover on-land
effectively eliminates most of shoreline habitat from use by birds or
mamma 1s.
In summer and fall, the important physical habitat factors include
(1) the required presence of coastal cliffs and barrier islands for
certain nesting and feeding birds, (2) the presence of salt marshes and
mud flats for feeding brant and some shorebirds, (3) the presence of
warm, semi-enclosed lagoon and bay waters for anadromous fishes, (4) the
complexity of mainland and island shorelines in relation to foraging
beach birds, and (5) the proximity to coastal sites of natal streams of
anadromous fishes (Table 2–3).
Where and when the biota respond to these physical habitat factors
have strong implications regarding the potential sensitivity of the biota
to oil spills.
2.2,3 Important Species
Though a large number of species or groups of species occur in the
nearshore and shoreline habitats, a limited number of marine mammals,

TABLE 2.3 PHYSICAL HABITAT FACTORS IMPORTANT TO BIOTA IN THE NEARSHORE AND SHORELINEHABI TATS. (adapted f ram Truett 1984)
Species Habitat Factors Time Place
Marine manwnals
Spotted seal
Beluga whale
Seabi rds
Alcids
Ki I-ti wakes
Glaucous gull
Waterfowl
Eiders
Oldsquaw
Black bran+
Shorebirds of marshesand mud flats
Beach birds
Phalaropes, Sabine’sgull, and arc+ic tern
Anadromous fishes
Secluded ice-freenear-shore waters
Ice-free (warm?)near-shore waters
Coastal cliffs
Open leads in ice
Barrier islands
Barrier islands
Protected bays,I agoons
Salt marshes
Tidal flats, saltmarshes
Presence of spitsand islands
Warm, brackish water
Proximity of natalstreams
Sumner
Sumner
Sumner
Spring
Sumner
Sumner
Sumner
Sumner, fall
Sunner
Sumner
Sumner
Sumner, fall
River mouths, Iagmns
River mouths, Iagwns
Cape Lisburne area
Cape Lisburne area
Kasegaluk Lagoon,Icy Capa, Peard Bay
Kasegaluk Lagoon,Icy Cape, Peard Bay
Kasegaluk LagounIcy Cape, Peard Bay
Icy Cape, Peard Bay
Vicinity of IcyCape, Peard Bay
Kasegaluk Lagoon,Icy Cape, Peard Bay
Protected lagoons andbays
Vicinity of mouths oflarge streams
160

birds and anadromous fish are considered important to the native groups,
public and other decision makers. Most of these species are important as
a subsistence resource or are protected under federal regulations. The
temporal and spatial distribution, shoreline use, and importance of each
species or group of species is briefly described below and in more detail
in Truett (1984).
Spotted Seal
Spotted seals are relatively abundant in the northern Chukchi Sea
from breakup to freeze-up (approximately July through October) when they
congregate in the coastal waters. They are excluded from the area in
winter by the presence of heavy ice.
Spotted seals move northward from the Bering Sea in early summer to
assemble and haul out along the Chukchi coast in lagoons and bays and
near river mouths. Major concentrations occur at Kasegaluk Lagoon
(2000-3000 seals), at the mouth of the Kuk River near Wainwright, and at
the mouth of the Kugrua River in Peard Bay. Kasegaluk Lagoon has the
largest number; major haulouts here are Utokok and Akoliakakat passes.
Their main uses of these coastal localities are hauling out on sand
beaches and feeding.
Though their importance to subsistence hunters is low relative to
that of bearded and ringed seals, spotted seals are relatively accessible
in summer and any disturbance due to an oil spill could reduce their
availability to hunters.
Beluga Whale
The summer belugas (2,000-3,000 individuals) congregate in Chukchi
Sea coastal waters, arriving from the south in mid- to late-June and
remaining until late July to mid-August. They seem to remain most of the
time in shallow waters just outside lagoons and bays; occasionally they
are encountered inside lagoons. They are observed most frequently in the
vicinity of major passes in Kasegaluk Lagoon - Kukpowruk, Utokok,
161
Akoliakakat - within 0.5–1.8 km of shore. They are also frequently seen
near Icy Cape and occasionally at Wainwright and Peard Bay.
The summer belugas appear to use the coastal zone for calving,
feeding, and perhaps for molting. Young are frequently seen with
adults. The sites where they congregate are good locations for belugas
to find anadroxnous fishes in relative abundance. The relatively warm
waters of the lagoons and bays may offer a benign calving and molting
environment.
Seabirds: Alcids
In summer, thousands of cliff-nesting alcids use nearshore waters of
the Chukchi Sea. Of these, approximately 79 percent are thick-billed
murres, 29 percent are common murres, 1 percent are tufted and horned
puffins, and less than 1 percent are other species.
These seabirds arrive about mid–May and stay until approximately
mid-September. Their distribution is regulated by how far they forage
from nesting cliffs in the Cape Lisburne and Cape Thompson areas. In
general they do not use lagoons and enclosed bays, but feed in deeper
parts of the nearshore zone and in shelf areas beyond the nearshore.
Alcids use the nearshore (and offshore) waters for collecting prey
for themselves and their young. Their main prey is forage fishes.
Two habitat features (in addition to the availability of coast,al
nesting cliffs) are important to these birds. One is the availability of
open water in leads in spring when they first arrive. Years with little
open water in late spring prevent the birds from readily gaining access
to prey. Second, the availability of high–density concentrations of prey
affects foraging efficiency.
162

Food availability (controlled by late spring ice conditions and prey
density) appears to be a major factor regulating the annual productivity
of these birds. A series of poor food years results in low reproductive
success and, subsequently, lower population levels.
Seabirds: Kittiwakes and Gulls
Kittiwakes and large gulls are the most abundant surface-feeding
seabirds of the northeastern Chukchi Sea. This group is dominated in
number by kittiwakes,
In general, these species are present from May through October.
Kittiwakes, like alcids, nest on cliffs at Cape Lisburne, Cape Lewis, and
Cape Thompson, foraging up to 60 km offshore. The also congregate all
summer on the deltas of the Pitmegea River and Thetis Creek to bathe and
rest. Glaucous gulls nest in small coastal colonies on islands and
spits, foraging coastwide throughout summer.
Habitat factors important to these birds in the coastal zone include
nesting habitat (for kittiwakes and glaucous gulls), extent of open water
in spring, ice conditions, and prey depth in the water column. Because
all these birds feed at the top of the water column, prey must be
available at the surface.
Waterfowl: Eiders and Oldsquaws
Oldsquaws and eiders (mostly common and king eiders) are the
waterfowl of greatest concern in coastal habitats. These birds migrate
over and feed in coastal waters (over a million eiders pass through
annually); some (common eiders) find important nesting habitat in the
area.
In general, oldsquaws and eiders use the nearshore zone from early
May through October. The earliest use is by migrating eiders. In June,
a few thousand conunon eiders nest on small barrier islands bordering
Kasegaluk Lagoon. In July and August, post-nesting oldsquaws and eiders

congregate in coastal lagoons and protected bays to molt, stage, and
feed. Fall oldsquaw migrants continue to use the lagoons and bays
through October.
Important habitat factors include the presence of protected bays and
lagoons for molting and staging oldsquaws in summer and fall, and the
presence of predator-free islands for common eiders to nest on in early
summer. Islands secluded from human use may be important to molting
oldsquaws.
Waterfowl: Black Brant
The coastal zone is especially important to black brant. It provides
the only known fall staging area north of the Alaska Peninsula for the
largest arctic Alaska nesting population of brant. Smaller numbers of
locally nesting birds also use the areas.
Brant use the coastal salt marshes, particularly those in the
vicinity of Icy Cape and Peard Bay, between early June and late
September. They are particularly abundant there as spring migrants in
June (-37,000 birds) and again in late August and September as fall
migrants (70,000-80,000 birds).
In these staging habitats, they feed on salt marsh vegetation
(grasses, sedges). The presence of salt marshes relatively free from
human disturbance appears to be the most important habitat factor
affecting brant.
Shorebirds of Marshes and Mudflats
In July and August, post-nesting shorebirds of several species
congregate in saltmarsh and mudflat habitats.
The distribution of these staging shorebirds is dictated by the
presence of the saltmarsh and mudflat habitats in which the birds feed.
164
The most extensive of these habitats are in the northern part of
Kasegaluk Lagoon, especially near Icy Cape. Less extensive habitats
occur on the spits and mainland shores of Peard Bay. Small areas occur
near Point Hope, but the importance of these to shorebirds is not known.
Beach Birds
Representative of three groups of birds - shorebirds, gulls, and
terns - concentrate their feeding activities along or very near beaches.
The principal species are red and red-necked phalaropes, Sabine’s gull,
and arctic tern; other gull and sandpiper species are present in low
numbers.
As a group these birds are found along beaches of barrier island,
spits, river deltas, and the mainland from June to early October.
Primary places of concentration include Point Franklin, Seahorse Island,
Icy Cape, the entire length of Kasegaluk Lagoon, and perhaps Point Hope.
Habitat factors important to these birds are the local complexity of
shoreline substrates and habitats, shoreline configuration (e.g., points
of land appear to attract feeding birds), the presence of beach-grounded
pack ice, and (for arctic terns) the presence of islands on which to nest:
@adromous Fishes
The principal species of anadromous fishes in the coastal zone are
pink and chum salmon, Arctic char, boreal smelt, small numbers of least
cisco, and perhaps some whitefishes.
Temporal and spatial distributions are related to general habitat
preferences and to timing of spawning runs, Specific distributions in
coastal waters vary among species, though little is known about
distributions of some. Juvenile salmon are found near river mouths for
short periods in summer; returning adults are found coastwide in the
nearshore in summer, though numbers are thought to be lower in the
northerly areas. Char and especially ciscoes and whitefishes are
relatively abundant in lagoons, bays,and estuaries near their natal

streams during the open–water season; char are more abundant in southern
parts of the study area. Boreal smelt apparently overwinter in relative
abundance in Kuk Inlet prior to spring spawning.
Habitat factors that are thought to influence the abundance of
anadromous fishes in coastal waters are nearness of natal streams
(especially for smelt, ciscoes, and whitefishes), presence of suitable
overwintering sites, and water temperature and salinity. The size, type,
and availability of overwintering and spawning areas appear to limit
their populations.
2.3 HUMAN RESOURCES
2.3.1 Introduction
Human resources, defined as resources (i.e., property, public
facilities, subsistence resources, cultural resources), and shoreline
uses (transportation, fishing sites, boat storage) are a major concern
during an accidental oil spill event. Along with sensitive biological
resources and shoreline types, human resources strongly influence
priorities for spill countermeasures.
The study area is located within the boundaries of the North Slope
Borough. Through its coastal management and comprehensive planning
programs, the Borough has expressed concern about potential oil spill
impacts on subsistence resources and activities. Four predominantly
Inupiat Eskimo communities are located along the Chukchi Sea Coast:
Barrow, Wainwright, Point Lay, and Point Hope. Human use patterns of the
coastline can be identified with individual communities, although the
patterns also reflect traditional uses that preceded the formation of
permanent communities. Activities are intense in the immediate vicinity
of each village, and include subsistence hunting and gathering,
transportation (boat traffic and storage on the beach, airstrips with
daily scheduled traffic) and excursions to traditional use sites.
However, local residents travel extensively outside their communities to
harvest subsistence resources so village use areas extend tens of miles
from the permanent communities.
Other human resources are less identifiable with individual
communities, Because of its long history of human habitation, the
Chukchi Sea coast is rich in cultural resources. This includes
prehistoric, historic, and traditional land use sites. The general
frequency of cultural resources sites is high, and density increases in
areas there the distribution of subsistence resources is concentrated.
Favorable topography, water supply, and other factors have contributed to
human habitation of specific sites over time. Distant Early Warning
(DEW) Line Sites also constitute a human resource; several are located in
the study area. Active sites generate air traffic in support of their
mission; inactive sites are often used to support research or resource
exploration teams and can be used during emergencies.
Because the scope of this investigation is limited to the shoreline,
lagoons, and estuaries, the human resource inventory addresses only these
areas. It does not include offshore areas which are significant for
year-round subsistence activities and can be sensitive to oil spill
events. Similarly, this inventory only addresses the open water season
(June, July, August, September, and October) on the assumption that an
oil spill is unlikely to reach the shoreline during the rest of the year.
A brief description of each of the four communities will be
presented, including the area traditionally used by community residents.
This will be followed by a discussion of human resources important to
this study.

2.3,2 Village Profiles
Barrow
Barrow is the regional center of the North Slope Borough; its 1982
population was 2882. Scheduled daily commercial jet service connects
Barrow with Fairbanks, Anchorage, and Prudhoe Bay. The beach at Barrow
is intensively used during periods in late August-early September, when
the ice moves far enough offshore to offload construction supplies and
general cargo. Small boats are also stored along the beach during the
summer to be used for travel between communities and for subsistence
activities.
Barrow has been occupied by a series of northern groups over the last
3400 years (Maynard and Partch, and Woodward–Clyde Consultants 1981). As
in other areas of the North Slope, the number and proximity of
subsistence resources can vary widely from year to year, and therefore a
large area is utilized for harvesting resources. This is particularly
true in Barrow, where the population is several times larger than other
North Slope communities. Within the study area, the Barrow use zone
extends from Elson Lagoon to the east and to Peard Bay and Point Franklin
to the southeast. Important open-water subsistence resources harvested
within the coastal strip include fish (char, cisco, and salmon) ~
waterfowl, bird eggs, and spotted seal.
Wainwright
The village of Wainwright is located 90 miles southwest of Barrow.
The 1983 population of Wainwright was 483, making it the third largest
community in the North Slope Borough. As in Barrow, the shoreline in
front of Wainwright is intensively used for boat storage and
transportation; supplies are also brought in annually once the ice goes
out .
168

Many of the people of Wainwright are descended from the Kuk and
Utukok River peoples (Kuugmiut and Utuqaqmiut). Coastal and inland areas
near Wainwright have been occupied continuously over the past 7000
years. With the exception of caribou, Wainwright’s major subsistence
resources derive from the marine and river environments. Fish (char,
salmon, and cisco) and waterfowl are important resources harvested along
the coastline, along with beluga whales and spotted seals. The coastal
area used by Wainwright residents extends from Peard Bay-Point Franklin
southwest to Icy Cape, and up the Kuk River past the area of tidal
influence.
Point Lay
The present village of Point Lay is located near the mouth of the
Kokolik River, overlooking Kasegaluk Lagoon, across from the historic
village site on a barrier island, The village is approximately 188 miles
southwest of Barrow. The North Slope Borough estimated the Point Lay
population at 94 in 1980 and 126 in 1983 (North Slope Borough 1980,
Alaska Consultants et al 1983). A DEW Line Station and its associated
airstrip is located due south of the village.
Ouring the summer, boats are pulled up onto the beach in front of the
village, Residents regularly travel north and south along Kasegaluk
Lagoon and up several of the rivers in pursuit of subsistence resources
or traveling summer camps.
While Point Lay itself has been resettled relatively recently, most
Eskimo residents are descendants of Inupiat people who traditionally
inhabited the Chukchi Sea Coast between Cape Beaufort and Icy Cape
(Alaska Consultants et al 1983). In a recent survey, Point Lay residents
identified caribou as the most important subsistence resource. However,
hunting beluga whales is extremely important, both as a communal activity
and in quantity of food. Other important coastal subsistence resources
include fish (salmon, char, herring, and ciscos), spotted seals,
migratory birds, and bird eggs. The coastal use area of the Point Lay
residents extends from Icy Cape of Cape Beaufort, but focuses on
Kasegaluk Lagoon and its passes to the Chukchi Sea.
169

~oint Hope
Point Hope is located approximately “15 miles southwest of .Barrow and
140 Miles northwest of Kotzebue, near the end of a spit jutting 15 miles
to the west of the Lisburne Peninsula. The second largest community in
the North Slope Borough, Point Hope had a 1983 population of 570. The
old village of Point Hope, abandoned due to flooding and coastal erosion,
lies one mile west of the present village. The community’s airstrip is
located due south of the old village. During the summer, boats are
hauled up on the inner shoreline of Marryat Inlet. Boats are used
primarily in the Inlet, and along coastal areas to the north. Beaches on
both sides of the spit are heavily used by three-wheelers.
Point Hope is a traditional whaling village and has been continually
occupied for at least 2000 years (Burch 1981). The lifestyle of Point
Hope people has always been strongly oriented towards utilizing marine
marmnals. Bowhead whales are by far the most important subsistence
resource. Important shoreline resources include fish (salmon and char),
beluga whale, waterfowl, seabird eggs, and spotted seal. The coastal
subsistence use areas extend from Cape Lisburne south to Cape Thompson.
2.3.3 Residential Areas (Communities)
As the center of local resident activity, the concentration of
private property, and presence of transportation facilities, the four
Chukchi Sea communities constitute a resource that is sensitive to an oil
spill event. Use of the surrounding coastal area, and hence boat and
three-wheeler transportation originates from these communities. During
the summer months, boats and other subsistence-related gear (such as
nets) are stored along the beach in front of communities.
2.3.4 Recreation Areas (Traditional Use Areas)
Recreation is a word that is foreign to the Inupiat language.
Hunting and fishing are not considered recreation, but rather as
necessary for cultural and economic survival. However, many of the
communities have certain areas that are traditionally used for family and
170

group excursions not necessarily associated with subsistence activities.
The popularity of these areas gives them value. For the purposes of this
study, they have been labeled recreation areas, primarily to conform with
a consistent system of oil spill sensitivity analysis.
In Barrow, this area includes the coastline between Point Barrow and
the Wiley Post/Will Rogers monument. Many ● ’duck shacks’* are located
along Point Barrow and receive frequent use. The old village sites have
the same value in Point Lay and Point Hope, and are frequently visited
during the summer. Other beach areas near these communities have a
similar value.
2.3.5 Transportation Facilities
Two types of transportation facilities and routes are located in the
study area. The first consists of specific airstrips and roads. These
are concentrated at communities and at DEW Line sites. A few of these
facilities, particularly roads, are located at a low enough elevation to
be inundated during storm surges. Airstrips are located at Barrow,
Wainwright, Point Lay, Point Hope, Icy Cape DEW Line, Cape Beaufort DEW
Line, Cape Lisburne DEW Line, and at Cape Thompson.
Informal transportation routes are equally important to local
residents. Beaches are heavily used by three wheelers for subsistence
activities and travel to summer camps. Small boats travel along coastal
waters and lagoons for the same purposes. All navigable rivers in the
area are used of subsistence or summer/fall camp locations.
2.3.6 Subsistence
The value of subsistence resources and associated activities to local
residents cannot be over-emphasized. It has provided the basis of the
North Slope community culture and economy and continues to do so, even in
the present time. Community residents range over a large area harvesting
a variety of subsistence resources. Harvesting can be particularly
intense during spring and summer months. The areas and species utilized
171

can very widely, depending on their relative abundance and the individual
village population.
As previously mentioned, this study focuses on resources and
activities occurring in the immediate coastal strip during the open water
season. Many important resources such as bowhead whale, oogrook (bearded
seal), walrus, and, in some cases, beluga whale are not included. The
major resources and harvest activities are described below.
Beluga Whale
They are an important resource for all four communities particularly
Point Lay due to the communal effort and volume of harvest involved.
However each community harvests a varying number of beluga whale within
the specific study area. Beluga are considered a secondary resource by
the residents of Barrow; they are hunted offshore in conjunction with the
bowhead whale migration and in the waters of Elson Lagoon during the
summer, Beluga are more heavily utilized by Wainwright and Point Hope.
As in Barrow, some hunting takes place offshore in the spring during the
bowhead whaling season. Summer hunting in the waters of Kasegaluk Lagoon
and Peard Bay (Wainwright) and Marryat Inlet (Point Hope) occurs in June
and July. At Point Lay, beluga provide a greater quantity of food than
any other source (Alaska Consultants et al. 1983). Harvesting is
concentrated in July on
village. Residents use
Kasegaluk Lagoon, where
sometimes continue into
Spotted Seals
barrier island passes just south and north of the
boats to drive whales through the passes into
they are harvested. Beluga harvests at Point Lay
mid–August.
Spotted seals are hunted in much of the same areas and during the
same time as beluga whales. In addition to their meat, spotted seals
have valuable pelts. Seals are shot from the shoreline or from small
boats in Elson Lagoon (Barrow), Peard Bay and Kasegaluk Lagoon
(Wainwright), Kasegaluk Lagoon (Point Lay) and on the north shore of the
spit and at Sinuk Pass (Point Hope). Spotted seals are less important as
a subsistence resource compared to beluga whale and fish.
172
~
Salmon, char, and cisco provide a large quantity of subsistence food
to communities in the study area. Fish are harvested primarily from the
shoreline using set nets and beach seines. Fishing generally occurs
throughout the summer season, and both boats and three-wheelers are used
for access to fishing sites. Elson Lagoon is used extensively by Barrow
residents, who also set nets along the coast in conjunction with other
subsistence activities. However, most fishing for Barrow residents.
occurs at inland camps along rivers. Fishing patterns in Wainwright are
similar to Barrow, The Kuk Lagoon and River system is extremely
important, although Avak Inlet and Kugrua Bay are also used, as is the
general shoreline between Point Franklin and Icy Cape, Point Lay
residents fish along the barrier island shorelines of Kasegaluk Lagoon
during July and August. Fish camps upriver on the Kakpowruk and Utukok
rivers are also important. At Point Hope, set nets and beach seines are
used in late June, July, and August. Fishing occurs from the shoreline
along both sides of the Point Hope spit and inside Sinuk Pass.
~igratory Birds and Eggs
Waterfowl, migratory birds, and their eggs appear to be more
important to residents of Point Hope and Point Lay. In Barrow, waterfowl
harvesting increases after the bowhead whaling season, concentrating on
eider ducks and geese. Waterfowl are hunted in the spring before the ice
goes out and also during August and September. Point Barrow and the
shoreline of Elson Lagoon are particularly important; many families have
hunting cabins at Point Barrow. Collection of birds eggs are incidental
to other activities. Hunting at Wainwright also occurs in late spring
and late summer. While hunting takes place throughout the area, the
Peard Bay/Kugrua Bay and Avak Inlet areas are important. Hunting and egg
gathering areas in Point Lay are close to the village. They include the
barrier from Kukpowruk and Akunik Passes and the corresponding mainland
shoreline. Point Hope utilizes bird eggs more than any other village,
harvesting from bird colonies between Cape Lisburne and Cape Thompson.
173

Brant eider
conjunction
return from
and geese are harvested during
with bowhead whaling, and also
summer breeding grounds.
2.3.7 Cultural Resources
Cultural resources include traditional
late spring, often in
during September as they
features and localities which
display physical evidence of cultural activity, such as structures or
artifacts. The study area is rich in cultural resource and traditional
land use inventory sites. Two inventories of cultural resource and
traditional use sites are maintained: the State of Alaska’s Alaska
Heritage Resources Survey (AHRS) and the North Slope Borough’s
Traditional Land Use Inventory (TLUI). The TLUI is concerned primarily
with cultural resources sites directly relevant to current residents and
is based on current use or oral history of past use. Sites from the AHRS
inventory include historical and prehistorical sites dating back to 3000
B.C.
Figure 2.3 shows the relative density of these sites within the North
Slope Borough. Tables 2.4 to 2.8 provide a listing of these sites by
USGS Quadrangle (1:250,000 scale). In the tables, archaeological sites
have an ‘8X” prefix, followed by a series of two or three letters
corresponding to the appropriate map. The TLUI sites have a three letter
prefix based on the several master lists compiled by the North Slope
Borough. In the Point Hope area, some sites are prefixed by a single
letter, in which case they are not listed yet by TLUI designation but are
instead correlated with sites listed by Burch (1981). An asterisk after
the initial entry under the site heading indicates that the site is on or
declared eligible to the National Register of Historic Places, or h,as
been declared a National Historic Landmark.
174

—
\m
-m
. .‘/ ‘, ~.
\‘! -,
,’f-
{.-
/< m
--
—
--
--
-
[\—
-
—-
--
..-—
--—
___ ___
\-
--
--
‘i. t.
T-...?:m” ‘----’i
II
175 “
U
%=a

Table 2-4. ARCHAEOLOGICAL SITES: POINT HOPE QUADRANGLE [1:250 000 SCALE)
_ LOCATIOU
68” 20’ N166” 37’ w
FEATURES & ARTIFACTS COINiENTS
Burials on beach ridges 13-18; Whale hunting site, c. 1000 A.D.
REFERENCES
XPHOOI*, oldTigara, PH189,E-7, PH186,PH188
Larson & Rainey 194BGiddhgs 1962, 1967Hosley 1972
midden on beach ridges 18-2B
Thirty large dwellings.
to present. Western Thule Cul-ture and Recent. Damaged byshore erosion and gravel pits.
Whale hunting site, c. 1000 A.D.to Present. Western Thule Cul–ture and Commercial Whaling Per-iod . (older than Old Tigara,younger than Ipiutak).
Type site for Ipiutak Culture,0-500 A.D.
XPHO02, Jab-bertown,Cooper, PH188,PH189, F-1
68” 20’ 30” H166” 37’ 30’” w
Giddinga 1962, 1967Hosley 1972:18
XPHO03*Ipiutak Site
689 21* 1O- N
166” 42’ 00’” UEight hundredtomb burials.
dwellings, log Larson & Rainey 1948Rainey 1962, 1971Giddings 1967Hoaley 1972
XPHO04, Ipnot,Anaaraq?PH220?, F-22?
68* 11’ N166” 01’ w
Ru ina, Reported in 1880 U.S. census. Petroff 1884
XPHO05, Init-qualik, PH23,B-3
68” 52’ 15”’ u165” 09’ 00” W
Ruins. Identified as relating to TUZ-royluk family in TLUI. May beactually on DeLong Utna map.
Operated commercially for earlywhaling ships and Point Hopeand Jabbertown, 1B50-1904 A.D.
Reported in 18B0 U.S. census tohave 74 people.
XPHO06, CorwinMine, PH20,B-6
68- 59’ 05” U165” 08’ 15” W
Coal mines, facilities, andruins.
Ruins.
Modern village.
Traditional sod house.
Includes Tigara (XPOO1), andIpiutak Site (XPHO03), andrecent structures.
Collier 1906Burch 1981:68
XPHO07, NunsPH189, S-7
68” 21’ w166* 47’ N
Petroff 1884
XPHO08, PointHope, PH190,E-7
68” 20’ M166” 50’ w
Present village location dateaat leaat to lB90a; several tra-ditional structures.
Whalebone frame & entrance, cov-ered with planks from old whal-ing ahip.
Approx. 3100 acres of beach rid-ges showing contlnuoua occupationfor the last 2000 years.
Burch 1981Van Stone 1962
XPHO09, ths-mie UyatuanHouse, PH 189
68” 21’ 00’” N166” 50’ 00’” w
XPHOO1, @iU-
tak Arch.District
68= 21’ 10” N166” 42’ 00”’ W
Rainey 1941, 1942,1962, 1971
Lareon & Rainey 194BGiddinga 1962, 1967Hoeley 1972Collins 1954Larson 1954
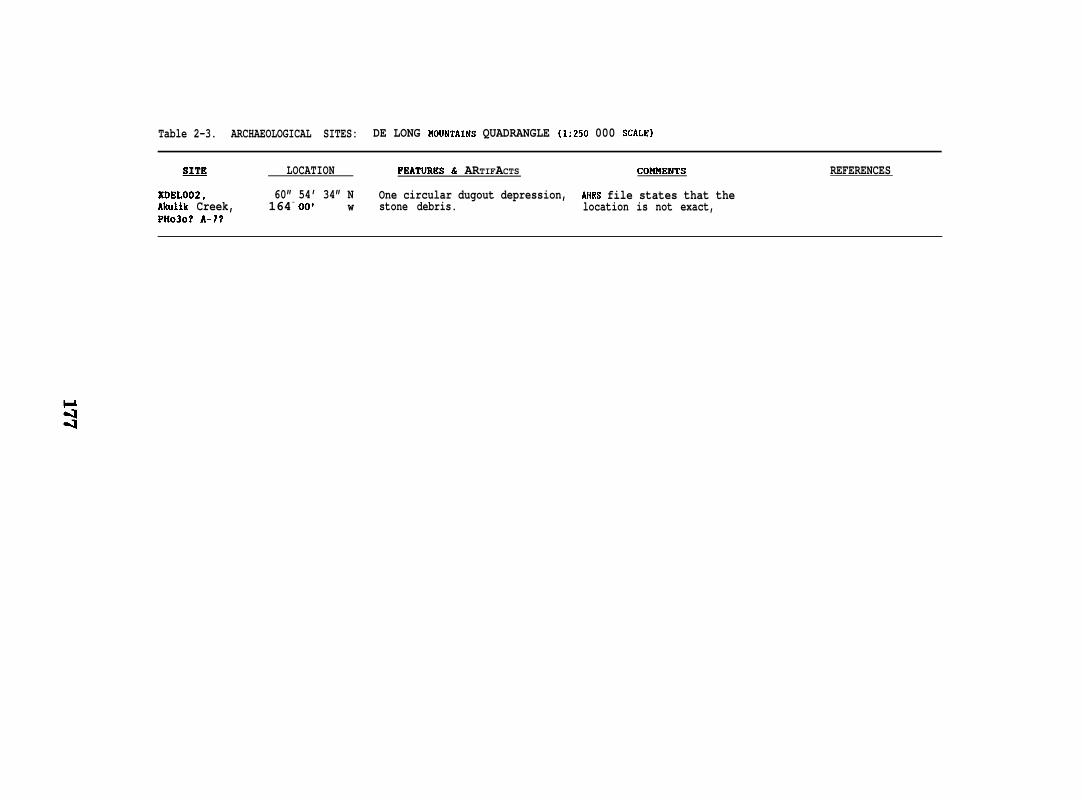
Table 2-3. ARCHAEOLOGICAL SITES: DE LONG HOUNTAINS QUADRANGLE (1:250 000 SCALE)
LOCATION FEATuREs & ARTIFACTS CONNENTS
XDEL002V 60” 54’ 34” N One circular dugout depression, ANRS file states that theAkulik Creek, 164- 00’ w stone debris. location is not exact,PH030? A-7P
REFERENCES

Table 2-6. ARCHAEOLOGICAL SITES: POINT LAY QUADRANGLE (1:250 000 SCALE)
g
XPLOO1 ,Kukpowruk
XPLO02 ,Koko 1 ik
XPLO03 ,Amatusuk, PL2
XPLO05Kahatak Ridga
XPLO06 ,Kahatak C!:eek
XPL036, FieldU139
XPL037, Field#145
XPL038, Field#14 7
XPL039, Field#132
XPL040, Field#133
XPL041, Field#134
XPL042, Field?7144
XPL043, Field#143
XPL044, Field#141
LOCATION
69” 36’ 40” N163” 00’ 00” W
69” 45’ 00” N163° 00’ 00” W
69- 06’ 30” N163°.37’ 00” W
69” 03” H163” 47’ u
69” 03’ N163” 46* 30” W
69” 16’ 35” U162” 3?* 15” W
69° 17’ 00” N162” 36’ 15” W
69- 20’ 15” N162” 33’ 30” W
69” 14’ 15” N162” 42’ 00” W
69+ 14’ 05” N162° 43’ 45” W
69” 14’ 45” N162” 48’ 00” W
69” 16’ 00” N162” 41’ 00” W
69° 17’ 30” N162” 40’ 45” W
69° 17’ 20”’ N162° 38’ 30” W
FEATURES & ARTIFAcTs
Former native village site.
Former nat we village site.
Ruins of five houses, scatterof recent debrle.
Scatter of chipped stonedebris, stone tools.
Hidden deposit containing bonesof whale, dog, fox, possiblehuman.
Chipped stone artifacta.
Chipped stone artifacts.
Chipped stone artifacts.
Chipped stone artifacts;core and blade material.
Chipped stone artifacts.
Chipped stone artifacts.
Chipped stone artifacts.
Chipped stone artifacts.
Chipped stone artifacts.
CO?IHENTS REFERENCES
Village was observed historically Brewer 1944:25in 1884 and 1918. Stuck 1920:182
AHRS files are vague, map locationcorresponds to TLUI map locationof site L26. Site was noted on1899 USGS map.
AHRS map location corresponds tothe north dot of the two maplocations plotted for TLUI sitePL2 .
Some bones displayed sawn sur-faces, suggesting recent origin.
Solecki 1950:66-69Matthews 1964
Solecki 1950:66-69Ilatthewa 1964
AHRS map location is within%mile of TLUI site PL43.
Solecki 1950:66-69Matthews 1964
Solecki 1950:66-69Matthews 1964
Solecki 1950:66-69Hatthewa 1964
Solecki 1950:66-69Matthews 1964
Solecki 1950:66-69Matthews 1964
Solecki 1950:66-69Matthews 1964
Solecki 1950:66-69Hatthews 1964

Table 2-6 (concluded). ARCHAEOLOGICAL SITES: POINT LAY QUADRANGLE (1:250 000 SCALE)
LOCATION FEATURES & ARTIFACTS
Chipped stone artifacts.
CON?IENTS REFERENCES
XPL046, Field#146
69” 18’ 15”’ N162” 38’ 00” W
Solecki 1950:66-69Hatthews 1964
XPL047, Field#149
69* 23’ 15’” N162” 38’ 10’” W
Chipped atone artifacts. Solecki 1950:66-69Hatthews 1964
XPL048, Field#150
69° 26* 30’” N162” 40’ 45” W
Chipped stone artifacts. Solecki 1950:66-69Flatthewa 1964
XPL049, Field#151
69” 31* 45” N162” 50’ 00” W
Chipped stone artifacta. AHRS msp location is within % Solecki 1950:66-69mile of TLUI site PL40. Hatthews 1964
XPL050, Field#152
69” 35’ 20”’ M162” 56’ 30” W
Chipped stone artifacts, Solecki 1950:66-69Matthews 1964
XPL051, Field#153
69” 33’ 50” u163* 00’ 00” W
Chipped stone artifacta. Solecki 1950:66-69Hatthews 1964
XPL053, PointLay, PL25(?)
Site dates to 1900-1953, still Schneider 1980seasonally occupied. TLUI site Bland 1973
69” 45’ 28”’ H163” 03’ 08” U
Former native village siteconsisting of 20 buildings.
correspondence ia in question.

Table 2-7. ARCHAEOLOGICAL sITEs: WAINWRIGHT QUADRANGLE (1:250 000 SCALE)
~
XWAIOO1 ,Uunagiak, WA19
XWA[O02 ,Kilamitagvik,WA182
LOCATION FEATURES & ARTIFACTS COKNENTS REFERENCES
Bandi 196970” 48* N159° 40’ w
Two historic cabins, old sodhouse ruins,
AHRS files say Thule Site ispresent.
70° 29’ 30” N160” 26’ 00” w
Eight sod house pits, dryingracks, 14 caches, sod cuttingareas, artifacts present.
Large historic and probable pre-historic villages; pothuntingand erosion have destroyed overhalf of the site. Observed byLt. Zagoakin in 1800.
Orth 1967Ford 1959Smith & lferne 1930
XWAIO03 ,Kuk
XWAIO04 ,Atanik, WA14
70” 36’ l?160” 07’ w
Ruins of native village. Play be correlated with TLUI citesWA121, WA122, or WA123.
70” 50’ N159” 21’ w
Ruins of native village.TLUI reporte cabins, sodhouse ruins, graves.
Observed by Lt. Zagoakin in 1847as Atinikg, 1890 ceneus reports34 people.
XWAIO05 ,Haudheim
70” 36’ N160” 06’ w
Roald Amundsen built a small camphere prior to his North Poleflight in 1925.
XWAIO06 ,Hiliktagvik,WA186
KWAIOO 7,Kayaasiuvkk,Icy Cape,WAI105
70” 24’ 20” N160” 37* 00” W
Nine sod houses, 7 caches,stone and historic artifacts.
Abandoned in 1930s. AHRS andTLUI map locations differ byone mile.
Ford 1949
70” 20’ N161* 52’ w
Former native village site. As map location indicates, siteis now under water. Observed byLt. Zagoskin in 1847. AHRS andTLUI map locations differ bythree miles.
XWAIO17 ,Ahaliraq,WA120
KWAI018 ,Tulagiak, wA1113
XWAI019 ,Akinak, U4i191
KWAI020 ,Akeonik, WA1106
XWAI020 ,Akoliskatat,
70” 37* 49” N160” 03’ 10” W
Several sod houeee and caches,one drying rack.
Former residents moved to presentvillage of Wainright. Site isseverely pothunted and eroded.
70” 03’ 19” N162° 27’ 15” W
Poesible confusion with TLUISite WA1114.
At leaet two large house ruinsare present, others probable.
Larson & Rainey 1948
Smith & Herne 1930
70° 22’ 18” H160s 47’ 25” W
Two sod houses. one grave. TLUI and ANRS map locationsdiffer by one mile.
70- 169 48” N161° 56’ 35” W
Seventeen houses, 5 caches,one cabin.
Larson 6 Bodfish excavated in1942, but did not report.
70” 18’ 14” N161° 12* 45”’ W
Possible midden area. Known camp site in historicperiod.
WAI95

Table 2-7 (continued). ARCHAEOLOGICAL SITES: WAINWRIGHT QUADRANGLE (1:250 000 SCALE)
~
KWAI022 ,Nokotlek, WA193
XWAI023
KWAI025 ,t?evat, UA199
XWAI026, Avak,WAI103
XWAI027, Avak
XWAI091 ,Tunalik
ZWAI093 ,Pingorarok Hill,WA189
XUAI094
XWAI095
XWAI096 ,Pingasagruk,WA12
XWAI097
ZWAI098
KWAI099
XWAI1OO,Kilimintavi,WA182
XWAI101
LOCATION
70° 19’ 38”’ N161” 01’ 09”’ W
70° 18’ 28’” N161” 03’ OO’s W
70” 15’ 00” N161” 22’ 00” W
70” 15 ‘ 00’” N161” 34’ 30” W
70” 14” 34”’ V161* 38’ 55” W
70” 12’ 05” u160” 15” 55”’ W
70” 22* 09” B1160” 43’ 00’” W
?0” 25” 40” M160” 34’ 30” W
70” 499 22” N159* 30’ 20’” w
70” 52’ 43” u159” 07’ 34” u
(see map)
(see map)
(see map)
(see map)
(see map)
FEATURES & ARTIFACTS
Two frame houses, other misc.features. historic artifacts.
Two eod houses ruins, otherslikely.
Several sod houees, cabin, icecellar.
!4any sod house ruins, most areeroded. Many stone artifacts.
One sod house ruin, cache,stone artifacte.
tlany lithic artifacta, inclu4-ing microblade material.
Stone artifacts of microbladetechnology, sod house ruins,
Stone artifacts.
Wine house pits, caches, dry-ing racks, built of ship tim-bers. Historic artifacts.
House pits, some of whale boneconstruction. Hany artifacts.
Stone artifact.
Stone artifact.
Stone artifacts.
Four sod house ruins.
Stone artifacts.
COUNENTS REFERENCES
Occupied at least between 1900sand 1930s.
Possibly associated with TLUIsite wA194, across the river.
Occupied from late 1800s to1940s .
Prehistoric and historic compo-nents present.
Note that both ZWAI026 & KWAI027are termed “’Avak”.
AHRS file states that site was Gal 1978, 1980destroyed by runway construction Bowers & Kunz 1980and collecting by workers.
AHRS files do not note the sod Hall 1978house ruins, which TLUI doesmention.
Hay be correlatedsites WA16, WA17,
Tested by Larson.
Isolated find.
Isolated find.
Hall 1978
with TLUI Hall 1978or WA18.
Hall 1978
Hall 1980
Hall 1980
Wedge-shaped cores suggestAmerican Paleo-Arctic Tradition.
Recorded by Lt. Zagoskin in Hall 19801824-1844 as Kyiyamigatvik.
Hall 1980

Table 2-7 (concluded). ARCHAEOLOGICAL SITES: UAINWRIGHT QUADRANGLE (1:250 000 SCALE)
~ LOCATION FEATURES & ANTIFACTS COlfHENTS REFERENCES
XWAI102 (see map) Stone artifact. Isolated find. Hall 1980
XWAI103 (see map) Stone artifacts. Possibly a Denbigh-related site. Hall 1980
XWAI104
XWAI105
XUAI106
XWAI107
XUAI108
XWAI109
XWAI11O
XUAI1ll
XUAI029
XWAI030
KMAI031
(see map)
(see map)
(see map)
(see” map)
(see maP)
(see map)
(see map)
(see map)
(eee map)
(see map)
(see map)
Stone artifact. Isolated find.
Stone artifacts. Wedge-shaped cores suggestAmerican Paleo-Arctic Trad
Stone artifacts.
Stone artifacts.
Stone artifacts.
Stone artifacts.
Stone artifacts.
Stone artifact.
Stone artifects.
Stone artifacts.
Stone artifacts.
Hall 1980
t
Hall 1980
Wedge-shaped cores suggestAmerican Paleo-Arctic Tradition.
Hall 1980
Wedge-shaped cores suggestAmerican Paleo-Arctic Tradition.
Isolated find.
Hall 1980
Hall 1980
Hall 1980
Hall 1980
Hall 1980

Table 2-6. ARCHAEOLOGICAL SITES: BARROW QUADIWNGLE (1:250 000 SCALE)
~ LOCATION
XBAROO1,* 71° 20’ 52’8 NBimirk, BAR2, 156” 35’ 33” UPigniq
XBARO02,* 71° 17’ 25”” NUtkiavik, 156” 47’ 40s’ UBAR6
XBARO03 , 71” 16* 30”” UKugusugamk 150” 50’ 00” u
XBARO04 , 71* 17’ 20” NRussIan Utkaeayuk 156” 49’ 00’” WHission Church
XBARO05, WillRogeralblile.yPost Memorial,BAR12, Halikpa
XBARO07 ,Browerville
XBARO08, Iren-iViO, BAR113,Igniviq
XBARO09, ISut-kwa, BARO05
XBARO1O,Napawrax
XBARO1l ,Nuwuk ,BAR1
71* 09’ 18” N157” 03’ 30”’ u
71- 17” 55” N156” 46’ 15” W
71- 07’ 00” N157” 09’ 00’” H
71* 17’ 20” N156” 49’ 00” U
71* 11’ 00” M157” 01’ 00”’ u
71° 23’ 10” N156” 28’ 10” W
FEATURES & ARTIFACTS
Sixteen house mounds arrangedin three rows parallel to theshore. Hidden deposit.
Many stratified house mounds,midden mounds, and burialmounds.
Burials.
Historic church.
One pink granite monument,one concrete monument.
Hodem and historic habita-tions, now part of Barrow.
Hodern and historic habita-tions, now part of Barrow,
Ruins of sod houses,
COHNENTS REFERENCES
Type site for the Bimirk Bandi 1969culture, dated to 500 A.D. Collins 1951
Ford 1959Taylor 1963
Major site representing Ford 1959occupation since 3000 B.C. Stanford 1976
Yarborough 1901Aigner and Brooks 19?7Aigner and Shi.nkwin 1974
Bimirk culture. Excavated in Ford 19591917-1919 by Van Valin. Bandi 1969
Yarborough 19B1:13-14
Location of fatal plane crashof Hill Rogers and Wiley Postin 1935.
warned for C.D. Brewer, whalingstation chief and trader.
Brewer IQ42Potter 1947
Ray 1B85
First reported Ln 1892 by Sgt.John Uurdoch.
AHRS map location coincides Spender 1959with TLUI map location for site Ray 1885:55BAR1l ,
Occupied during prehistoric Ray 1885and historic period. Hurdock 1888
Ford 1959llason 1928Carter 1966Yarborough 1981:14

Table 2-8 (concluded). ARCHAEOLOGICAL SITES: WAINWRIGHT QUADRANGLE (1:250 000 SCALE)
~
XBAR012,* Pt.Barrow RefugeStation, BAR 6
XBARO13 ,Walakpa,BAR12
XBAR014 ,Coffin Site
XBAR015 ,BAR6
XBAR016 ,Elavgak House,BAR 6
XBAR091 ,Kahraok Site
XBAR093
XBAR094 ,Brant Point(Arguqqaq),BAR4
LOCATIOti
71° 17’ 34” N156° 47’ 38” W
71” 09’ lB” N157” 03” 30” w
71* 08’ 58” N157” 02’ 35” u
71” 17’ 30” N156” 47’ 15” W
71” 17* 55”’ N156” 46’ 20”’ W
71” 08’ 53” U157” 02’ 25”’ W
71” 05’ 18*” N154” 48’ 20” W
71” 20’ 02” N156- 33’ 45” W
FEATURES & ARTIFACTS
Two-story frame building inuse as a cafe in Barrow.
Stratified series of historicand prehistoric houses.
Sod house.
Frame house.
Stone artifacts.
Sod house ruin, possiblecache pit.
One sod house ruin, other cul-tural features (mounds) beingused for duck blinds now.Graves. Tent mounds.
CONHENTS REFERENCES
Built In 1893--oldest frame Bockstoce 1979building in the Arctic. Wasa U.S. govt. whaler refugestation, trading peat.
Cultures represented include Stanford 1976Akmak, Norton, and Thule. SiteXBARO05--the Will Rogers/WileyPost Honument-- is located withinthe XBAR013 perimeter.
Late Denbigh/Choris culturesrepresented.
Dates to 1880s, shows archi-tectural transition from sodto frame construction.
Believed to have been built1B90s from lumber left overfrom constmction of RefugeStation (XBAR012).
Diverse assemblage possibly
Stanford 1976
relating to Akmak assemblage.
Suffering tidal erosion.
in Brewer
Stanford 1976:16
Hail 197B

3.0
FIELD AND DATA ANALYSIS METHODS
3.1 INTRODUCTION
General shore-zone types were identified on the basis of
information including hydrographic charts, topographic maps,
existing
aerial
photographs and previous experience. However, additional detail was
required to map the distribution of these shore-zone types in sufficient
detail for oil spill sensitivity mapping. The general approach for
obtaining the additional detail on the distribution of shore zone types
was to conduct an aerial reconnaissance of the entire coastline and a
limited ground-truth survey to verify aerial interpretations. Details of
the approach are outlined
3.2 PRE-SURVEY PLANNING
A preliminary mapping
in the following sections.
exercise was conducted to delineate the
approximate distribution of shore-zone types within the study area. This
exercise provided insight into the distribution of potentially sensitive
resources and therefore provided a basis for concentrating field efforts
on (a) sensitive areas and (b) poorly understood areas. A set of
1:50,000 scale strip maps made up from topographic maps, were used to map
existing information and for planning purposes.
Overflights were scheduled to maximize the aircraft supported survey
by (a) minimizing the number of base camps and (b) minimizing
non-productive traveling time. Appropriate borough and regulatory
agencies were advised of preliminary scheduling.
3.3 FIELD SURVEY
3,3.1 Aerial Reconnaissance
Our aerial reconnaissance survey utilized a NOM turbine helicopter
(Bell-204) and a portable videotape recording (VTR) system plus 35Imn
still camera for recording coastline imagery and audio commentary. The
entire shoreline was flown, including the mainland lagoon shore, at
altitudes of 150 to 300 feet. The videotapes show detailed shore zone
morphology and also include a biophysical description of the shore zone
on the audio soundtrack. All of the outer coast, as well as the Kuk
River and Peard Bay, were videotaped from the right side of the aircraft
whereas the mainland shore of Kasegaluk Lagoon was videotaped from the
left. side of the aircraft. The color 35–mm slides provide more detail on
selected locations and features,
The field crew consisted of a coastal geologist, a coastal ecologist,
a VTR technician, the NOAA pilot and the NOAA flight engineer, During
the overflight, a communications system was used for general
communications among field crew members. This system recorded all
communications onto the audio soundtrack of the VTR. These
communications included real–time description of shore-zone character,
biological resources, color slide locations and geographic location
information.
Twenty-one videotapes were recorded during the survey. The location
and time of each video tape was recorded on a video tape log sheet
(Figure 3-l). The tape quality ranged from good to excellent, except
over one 20 km section of coast where fog was encountered. This section
was later reflown. The videotapes were reviewed in the field each
evening to select exact locations for field ground-truth stations.
Detailed videotape logs and flight–line maps are included in a
separate report (Appendix A: Videotape Manual of the Northern Chukchi Sea
Coast) .

F@re3-1. Chukchi Sea Coast Aerial Survey
Videotape LOK Sheet
DateeTape
ILocation Location Time
Wmber Start stop MDT) Conunen ts
A
Woodwardcty’c+econsul tati @ Sheet
187

Color 35-mm slides were obtained for certain areas or features. The
location and time of each roll of film was recorded on a Color Film Log
Sheet (Figure 3-2). The location of each frame was noted on the audio
commentary of the VTR.
3,3.2 Ground-Truth Survey
A field ground-truth survey was conducted (a) to provide a basis for
“calibrating” observations made during the aerial reconnaissance, (b) to
collect topographic survey data (i.e., across–shore beach profiles) and
(c) to collect specimens or samples as appropriate. The ground-truth
survey was conducted using the NOAA helicopter support for
transportation. In addition to the helicopter crew (pilot and engineer),
a coastal geologist, coastal ecologist and field assistant comprised the
field crew. The ground–truth survey was conducted at the same time as
the aerial reconnaissance survey.
Ground-truth stations were selected on the basis of (a) providing an
approximate uniform distribution of sample stations, (b) providing a
representation of major coastal features within a geographic area and
(c) maximizing field effort. During the survey, 54 ground-truth stations
(Figure 3-3) were visited during seven complete survey days (two complete
days were lost due to weather).
At each ground-truth station, a series of standard observations and
measurements were made, and in some cases, samples were collected.
Observations were recorded on a set of standardized field data sheets to
assure uniformity of observations between stations. Data sheets (Figures
3-4 to 3–9) and associated observations included:
Data Sheet 1 – Location Description Sheet - geographic
location information and sketches sufficient to
relocate station if necessary

Fi~re 3-2. Chukchi Sea Coast Aerial Survey
Color Film Log Sheet
f Roll Location Location TimeNumber Start stop (AD?) Cements
WbodwardCiyde Consultants @ Sheet

POINT BNq#
POINT BARROW
/
~/
TO ICY CAPE 21
$~’7
/
,,/’ + “, / G
/
,“ ,
ANKI.IN— ..9 A+
// ICY
/ ’34 . . _CA~E
//“” ~’f}’
44 “46 45 .“” )
/ soCAPE 494 47saW . . . . . . ““”. . . . .
LISBURNE a33 ‘.
5 5
o 100km~
/
ICY CAPE TOCAPE THOMPSON
Figure 3-3. LOCATION OF GROUND TRUTH STATIONS
190

Figure 34. HOAA CHUS(CHI SEA COAST GROUND TRUTH STATION
LOCATION DESCRIPTION SHEET
Station or Profile Number ilecorder
Date Time
Location: Quad Sheet #
Chart #
Lat. and Long.
Description:
Profile Bearing (compass);
Bench Hark Description (if ● pplicable)
Bench Mark Status (recovery status and date)
Topographic Control horizontal
(true )
vertical
(TEN 1 always
Miscellaneous
landward–most) TBM 1
TBH 2
TBH 3
(sketches, range set-up, etc.)
Sheet Number
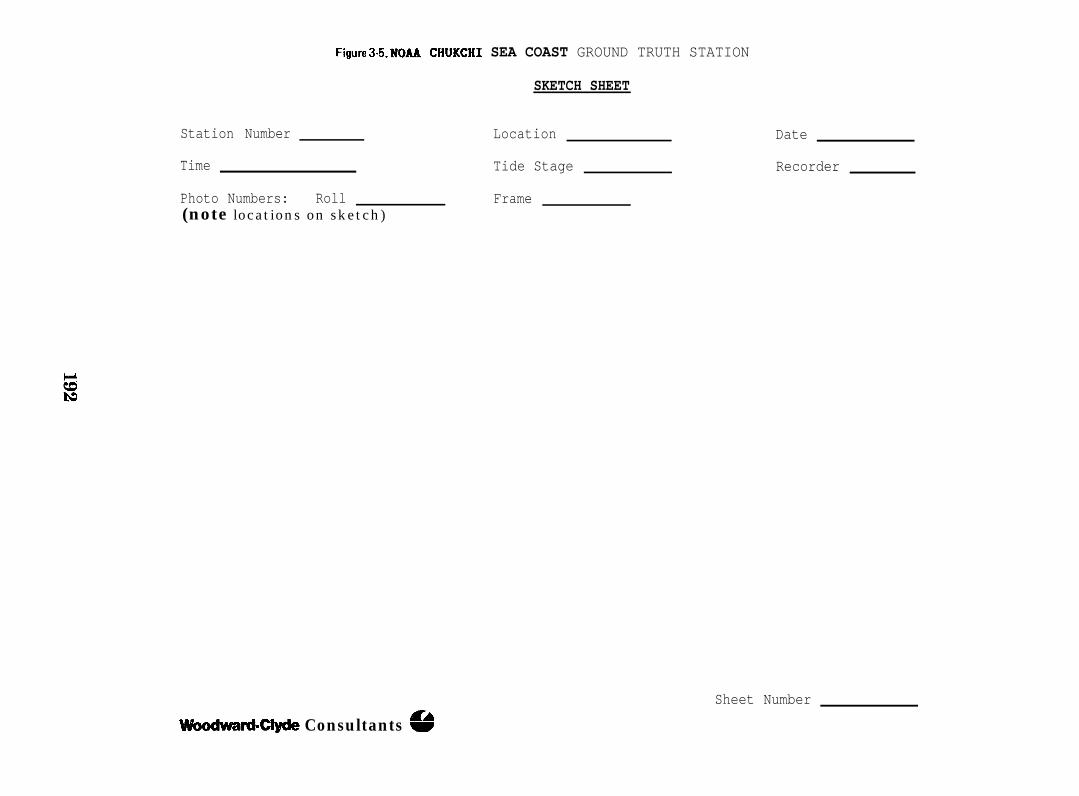
Figure 3-5. lJC)AA CHUKCHI SEA COAST GROUND TRUTH STATION
SKETCH SHEET
Station Number Location
Time Tide Stage
Photo Numbers: Roll Frame(note locations on sketch)
wDodward4xyde Consultants o
Date
Recorder
Sheet Number

Figure 3-6. NOAA CHUKCH1 SSA COAST GROUND TRUTH SURVEY
BSACH PROFILE
Station Number
Tide Sta6e
Date
Recorder
Time
Time Start , Finish
Sheet Wumber

Figure 3-7. NOM CHUKCHI SEA COAST GROUND TRUTH STATION
PHYSICAL OBSERVATION CHECK LIST
Station Number Date Time
Recorder
BEACH STABILITY
Long-term Change: Erosional Accretional Stable
Short-term Change: Erosional Accretional Stable
Mass-Wasting Features:
BBACH MORPHOLOGY
Storm Debris Line: Yes No Type
Evaluation
Rhythmic
Dominant
Topography or Bars
Longshore Transport: Direction
BIOLOGICAL FEATURES
Vegetation:
Indicators
Yes No Types
Sheet Number
Woodward=Ciyde Consuftan* @
194

Figuw ~ q. NOAA CHUKCHI SEA COAST GROUND TRUTH SURVRY
GRAIN SIZE ESTIUATES
Station Number
Recorder
I1Sample Locstionr Sample Number
I
I
SedimentType
(see rever8e)
Date The
?lemsize Sorting Cone
(0 orwn) (see over) Composition Penetrometeri
Sheet Number

Figure 3-9. Chukchi Sea Coast Ground Truth Survey
Biological Observation Checklist Sheet
Station,No. Date Time
Recorder:
Wave Exposure: High LowMed. —
Comnents:
Substrate:
Profile Sketch of Significant Across-shore Features:
Disturbance:
Vulnerability to Crude Oil Spills:
Estimated Recovery Potential:
Photos : Color Roll No. Frames Conunent
I.R. Roll Mo. Frames Comment
Samples:
Consnents:
Sheet
Woodward=ciyde ConBmants @

Data Sheet 2 - Sketch Sheet - a standardized sketch sheet
for drawing oblique perspective views of shore zone at
the ground-truth station
Data Sheet 3 – Beach Profile Sheet - a standardized format
for recording beach survey data
Data Sheet 4 – Physical Observation Checklist - a check list
that allowed important physical resource features to
be evaluated at each site
Data Sheet 5 - Grain Size Estimate - a log sheet for
recording sample locations (if any), sediment size,
sorting, and bearing strength of each morphological
across-shore component
Data Sheet 6 - Biological Observation Checklist - a
checklist for evaluating existing disturbance,
vulnerability to crude oil spills, recovery potential
and samples of biological resources at each
ground-truth station
Data sheets were completed at the ground–truth station and rechecked each
evening.
Topographic beach profiles were surveyed using the Emery profile
method (Emery 1960). This method provided a rapid survey technique for
documenting beach slope and width characteristics and for documenting
beach elevations, particularly log-debris line elevations.
Substrate character was recorded for each across–shore morphological
component on a separate data sheet (Data Sheet 5). Notes on sediment
character followed the terminology of Folk (1968). Both mean sediment
size and an index of sorting were recorded. Sediment samples were
collected at each site (locations indicated on sketch sheet) for
archiving purposes.

All field data sheets were bound into a separate field data report
(Appendix B: Field Data Sheets).
3.4 POST-SURVEY DATA REDUCTION
3.4.1 MappinR Techniciues
Several sources of information were used to compile the physical
shore-zone description that is shown on the resource maps (Volume 2).
The primary information sources were (a) the oblique aerial imagery
(videotapes and 35 mm color slides), (b) the field reconnaissance survey
and (c) previously existing data such as maps and aerial photographs.
These information sets were complementary, in that each information set
provided a different perspective of the shore zone character. The aerial
imagery provides a continuous record of shore–zone features with
dimensions greater than 1 m; the field survey data provides a high level
of detail at selected locations, and the previously collected data
provide an index of temporal variations in both shore-zone morphology and
sediment texture.
The aerial videotapes of the shore-zone were reviewed in our studio
by a coastal geologist and the information on shore-zone character was
transferred onto the 1:50,000 scale base maps (drawn from the
hydrographic charts of the study area). Information on sediment size was
also transferred to the maps and resource tables; recorded observations
on the VTR soundtrack and ground–truth station information were most
useful in estimating sediment characteristics.
The biological shore-zone information came from several sources. The
VTR and slides along with ground-truth stations provided data on the
distribution and size of wetland habitats, and of the major seabird
colonies. The location of waterfowl and gull or tern nesting areas,
small seabird colonies, and seal and beluga whale use areas was obtained
from published sources.
198

The location and use of human resource components was based primarily
on published information and unpublished data available to responsible
parties from the MMS,
3.4.2 Marwing Approach
The mapping approach utilizes a progressive subdivision or heirarchy
of shore-zone features, combined with a supplemental resource table
(Volume 3), for the description of physical features. The mapping
approach is flexible and has been applied to other oil spill risk
assessment studies (Owens 1981; Woodward–Clyde Consultants 1982) as well
as to land–use and recreational planning studies (Owens 1980; Owens et
al. 1981; Harper 1981).
In its simplest form, the mapping method defines a series of
shoreline units that are homogeneous along a section of coast (Figure
3-lo) . Each unit is then described in terms of a series of across–shore
components. The across-shore component subdivision is based on the
geomorphological and/or textural character of the intertidal zone, Thus
a picture is built up of each unit, with the components as the basic
building blocks from which the description of the unit is constructed.
● a unit is an association of across–shore physical components.—
that is continuous alongshore. For this study, at a 1:50,000
map scale, the minimum unit length is approximately 0.25 km
(0.5 cm on the map).
. within each unit (Figure 3.10), the across-shore physical
character is described in terms of geomorphological and
sedimentological components that are homogeneous both
across–shore and alongshore.

. .- . —_<> . .>
~ .---Q- —— ‘ -. -— -.-2
~,:- ---- -- —— - ”Sea ~--- -.. .— .
—-_—— __ . . . . . . ...=- .-—- ——
~~.— ——— — “Mwm.-— —
—— Fan-———— --. ,
—----- -’.-.=. - !ach Berm
)
(-:w~~’’’ --- - - - - - - - - -
\ACROSS-WORE COMPONENTS
Figure 3-10. ILLUSTRATION OF THE MAPPING APPROACH
200

The map format identifies the boundaries of units and the shore-zone
morphological and sedimentological character is illustrated using
components. Each component is shown on the map by a distinctive graphic
pattern (part II).
Details on the units and components are provided on a separate
resource table (Part III) which is keyed to the map by a unit
identifier. The resource table provides an additional level of detail on
across–shore morphological components and on substrate character. The
use of a separate -resource table to record shore-zone information allows
a comparatively simple map format to be retained while at the same time
recording a high level of detail on shore-zone character.
The location or boundaries for the biological and human use resources
are displayed on the same maps as the physical features (Part II),
However, the boundaries of biological and human use resources may not be
the same as those of the shoreline units. The biological resources shown
on the maps are primarily wetlands which are identified as a physical
unit and bird nesting areas or seabird colonies. Human use resources
which can be mapped as discrete sites are principally villages and
industrial/military areas. Transportation corridors, subsistence and
recreational areas are not as precisely defined and are shown with arrows
indicating the approximate distribution.
The biological and human use resources are described in more detail
in the separate resource table (Part 111). For convenience, they are
described within the unit identifier(s) describing the physical features
of the shoreline.

4.0
OIL RESIDENCE
4.1 INTRODUCTION
The potential persistence of oil in the shore zone is of primary
concern in the evaluation of sensitivity because biological and human-use
impact are often related directly to oil residence periods. In other
words , biological or human-use activities are more likely to be impacted
in areas where oil will remain for a long period of time than in areas
where oil residence is of short duration. This section of the report
provides some background on (a) observations of stranded oil, (b) the
Baffin Island Oil Spill Experiment and (c) previous sensitivity studies
in the arctic. Development of an oil spill residence index for the study
area is described and its application to the coastal environments of the
study area is summarized.
4.2 PREVIOUS STUDIES ON OIL PERSISTENCE
No large–scale spills of crude oil have occurred in the arctic, and
it is therefore not possible to make direct comparisons of actual spill
events within the study area. It is possible, however, to make indirect
inferences about the potential impact of an oil spill in the study area
from review of:
● spills in temperate environments
● results from the Baffin Island Oil Spill (BIOS) experiment
● similar oil spill sensitivity studies for the arctic.

Appropriate results from studies in these disciplines are summarized in
the following sections.
4.2.1 Oil Spill Case Studies
Observations from selected oil spill case studies are presented as
background to the development of an oil residence index for the Chukchi
Sea coast, Results from the Baffin Island Oil Spill (BIOS) program, an
experimental oil spill designed to evaluate the long–term impact of an
oil spill in the arctic, is presented separately in Section 4.2.2.
Selected spill studies included for discussion are: the ARROW spill
in Chedabucto Bay, Nova Scotia; the METULA spill in the Straits of
Magellan; the URQUIOLO spill in Spain; and the AMOCO CADIZ spill in
France (Table 4.1). These spills studies provide a range of different
spill types, spill volumes and coastal environments affected.
ARROW Spill
In 1970, the Tanker ARROW broke up in
spjlling a total of 18,000 tons of Bunker
surrounding shorelines were oiled, and an
Chedabucto Bay, Nova Scotia,
C fuel oil (Table 4.1). The
intensive cleanup effort
followed. Observations of the long-term fate of the oiled beaches were
made by Owens (1971, 1973, 1977, 1978), Rashid (1974), Owens and Rashid
(1976), Vandermeulen et al. (1972). Of special significance are the
following observations:
● oil persistence was directly related to mechanical wave energy
levels; high wave energy levels promoted rapid oil dispersion
and increased biodegradation rates whereas low wave enerEy
levels resulted in little natural dispersion and slower
biodegradation rates.
. burial of oil, caused by natural sedimentation processes or by
cleanup activities, decreased natural dispersal of oil and
retarded biodegradation of oil.
204

Table 4-1. SELECTED SPILL CASE STUDIES
Spill Type‘Location Date and Amount
ARRow ,ChedabuctoBay, NovaScotia
METULA, Straitof Magellan,Chile
URQUIOLA,La Coruna,Spain
AMOCO CADIZ,Brittany,France
Feb.1970
Aug.1974
May1976
Bunker C;18,220 tons total
Saudi Arabia Crude;53,000 tons total40,000 tons onshore
Persian Gulf Crude;110,000 tons total;25,000 to 30,000tons onshore
Arabian Gulf Crude;223,000 tons total64,000 tons onshore

● in areas of high wave exposure, oil was stranded only in the
upper parts of the intertidal zone, whereas in low exposure
areas, the oil covered the entire i.nkertidal zone.
● oil stranded above the normal limit of xnarine activity shows
little mechanical or biological degradation over time.
Long-temn observations of oil stranded on the sheltered beaches of
Chedabucto Bay (e.g. Black Duck Cove) have shown little change after the
first month of oiling, These beaches are very sheltered (fetch < 1 km)
and are comprised of coarse gravel
promotes adhesion to the particles
~ETULA Spill
The impact of the METULA Spill
Straits of Magellan was documented
material (pebbles and cobbles) which
and penetration into the sediment.
(Table 4.1) on the shore-zone of the
by Hayes and Gundlach (1975) and Hayes
et al. (1976). Oil accumulations were most common on mixed sand and
gravel beaches (a) near the high water line, (b) on washover fans and
(c) on gravelly low tide terraces. Penetration of oil up to 40 cm
occurred on gravelly beaches. Sheltered tidal flats and salt marshes
were heavily oiled and showed little change up to two years after the
spill. These observations suggest that oil would remain in these types
of environments for up to ten years (Hayes and Ruby 1979).
QRQUIOLA Spill
Short-term impacts of the URQUIOLA spill (Table 4.1) were observed by
Gundlach and Hayes (1977) and Gundlach et al. (1977). Of special
significance in this spill was the burial of large quantities of oil by
deposition of clean sediment over oiled sediment. If left to be removed
naturally, the oil could be reintroduced into the environment and
available to contaminate cleaned or previously affected areas. In
addition, large amounts of material would have to be removed in a
mechanical clean-up operation.
206

_MOCO CADIZ
Observations by Gundlach and Hayes (1978) of the AMOCO CADIZ spill in
France (Table 4.1) confirmed earlier observations (e.g. Owens 1971, 1978)
that wave action can be an effective natural clean-up process. Heavily
oiled rocky shorelines, exposed to significant wave action, were
generally cleared within one month, whereas protected shorelines such as
harbors and marshes remained heavily oiled even months after
contamination. Sand beaches tended to be naturally cleaned more rapidly
than rocky shorelines, Gravel beaches showed significant penetration of
oil and special clean-up procedures were required to flush oil from these
beaches.
Coastal sedimentation processes caused local burial and removal of
oil. In some locations, shorelines undergoing natural erosion were
cleaned rapidly, whereas at other locations deposition of sediment in the
form of berms and runnels caused rapid burial of oil.
Over the one month observations period following the spill, Hayes and
Gundlach (1979) noted an approximate 80 percent reduction in oil
quantities on the beaches, even though the total length of oiled
shoreline increased from 72 km to 389 km. The reduction of total oil
amount was a result of natural clean-up processes and clean-up activities
by man.
4.2.2 Baffin Island Oil Spill (BIOS) Experiment
The Baffin Island Oil Spill was designed to valuate the impact of
dispersants on arctic oil spills. Controlled experiments were conducted
in experimental test bays to compare impacts associated with a
non-treated crude oil spill and with a dispersant–treated crude oil
spill, Controlled experiments of oil spills beaches were also conducted
(Woodward-Clyde Consultants 1981; Owens et al. 1982a and b; Owens et al.
1983; Owens and Robson 1984). Observations on oil residence on beaches
with different wave exposures show that mechanical wave action is the
most important process controlling oil dispersal on beaches. On sriore

exposed beaches (fetch distance approximately 100 km), 75-80 percent of
the oil was removed from the test plots within the first 48 hours and, by
the end of the first open-water season, no oil remained on either of the
exposed test plots. On moderate exposure beaches, with limited fetch but
exposed to refracted swell, all traces of oil were removed within one
open-water season (approximately 30 days). On low wave-exposure
shorelines (fetch less than 5 km), tidal action removed 30-90 percent of
the oil from the test plots within one open-water season. After three
open-water seasons, approximately 25-50 percent of the original oil
volume still remains on the coarse-grained low energy test plots, whereas
all oil was removed from the fine sediment beaches.
Wave exposure was of primary importance in controlling natural
dispersal of oil, although substrate type and sediment transport were of
secondary importance. Substate type affected oil residence, particularly
on low energy beaches, as a result of (a) greater oil penetration into
the coarser sediments and (b) better oil adhesion to the larger pebbles
and cobbles than to the smaller sand particles. Much of the oil on silt
and sand beaches was removed within a few tidal cycles even on low energy
beaches due to poor adhesion properties to the fine sediments.
Sediment transport processes were locally important in controlling
the residence of spilled oil. On one of the high energy test plots,
oiled sediment was buried during a storm wave event by approximately 20
cm of *’clean”’ sediment. Where storm events are infrequent and where
other weathering processes are minimal, the potential for the oil to
remain in the sediments is high.
The BIOS experiments generally show that
environments is primarily controlled by wave
oil dispersal in arctic
exposure, with substrate
type and sedimentation processes as secondary factors. The main
difference in dispersal processes between the arctic and temperate
regions is that wave action occurs only during a limited 2-3 month
open-water season in the arctic as opposed to the longer (9–12 month)
208

open-water season in temperate regions. The lack of wave action during
the ice-covered season means that no natural degradation occurs during
those months. For oil stranded above the limit of normal wave actions,
weathering processes, principally microbial decomposition, are extremely
slow.
4.2.3 Oil Spill Sensitivity Studies in the Arctic
Oil spill sensitivity analyses have been conducted for other areas of
the arctic, including adjacent regions of the Chukchi Sea coast. Studies
have been conducted of the Canadian Beaufort Sea coast (Worbets 1979),
the Alaskan Beaufort Sea coast (Nummedal 1980) and the southern Chukchi
Sea coast (Hayes and Ruby 1979).
Worbets (1979) developed an oil spill protection and
strategy manual for the southern Beaufort Sea of Canada.
clean-up
The manual
provided a combined sensitivity index for geological, biological and
cultural sensitivities. The three sensitivities were combined into one
index by use of weighting factors, thus providing a single arithmetic
value for a given coastal segment that is easily compared with other
coastal segments. Four shoreline types were mapped to provide an index
of potential oil residence (Table 4.2), although no actual oil residence
periods were assigned to the different shoreline types.
Nummedal {1980) mapped eight shoreline types for the
Sea coast and developed a retention index for estimating
There is no assessment of biological effects assigned by
Alaskan Beaufort
persistence.
the index. The
Retention Index is based on (a) the level of mechanical degradation and
(b) efficiency of retaining factors. The eight-level index (Table 4.2)
assigns potential residence periods from days to weeks (Retention Index
1: steep cliffs) to 10 years {Retention Index 8: marshes).
Hayes and Ruby (1979) provide a Vulnerability Index of the southern
Chukchi Sea coast from Cape Prince of Wales to Point Hope (Table 4.2).
Their Vulnerability Index is modified from previous studies of a similar

Table 4–2. COMPARISON OF PREVIOUSLY DEFINED SEt?SITIVITIES1 AND ARCTICSHORELINE TYPES
CanadianEWllJfO~t Sea2 Alaskan Beaufort Sea3 South Chukchi Sea4
(1) Cliff; Wave-cut Platform
(2) Sand Beach;Mud Flat
(3) GravelBeach
(4) Estuary;Tidal Flat;Tundra Beach
(1) Steep Cliffs
(2) Steep beaches andbluffs of uncon-solidated sediment
(3) Exposed non.vegetated barriers
(4) Vegetated lowbarriers
(5) Lagoon-facingmainland shores
(6) Peat shores
(7) Sheltered tidalflats
(8) Marshes
(1) Rocky headlands
(2) Wave-cut platforms
(3) Flat, fine-grainedsandy beaches
(4) Steeper, medium tocoarse-grained sandybeaches
(5) Impermeable exposedtidal flats
(6) Mixed sand and gravelbeaches
(7) Gravel beaches
(8) Sheltered rockyheadlands
(9) Protected estuarinetidal flats
(10) Protected estuarinesalt marshes
1 Sensitivity of shorelines increases from (l), least sensitive, to (4, 8,or 10), most sensitive.
2 Worbets, 19793 Nummedal, 19804 Hayes and Ruby, 1979

nature (Gundlach et al. 1977; Hayes et al. 1977; Hichel et al. 1978; Ruby
1977; Ruby et al. 1977, 1978). The Vulnerability Index (more recently
revised as the Environmental Sensitivity Index - see Gundlach et al.
1980) uses ten repetitive shoreline types as an indirect index of
potential oil persistence on shorelines of the Chukchi Sea (Table 4.2).
Estimated oil persistence periods range from days to weeks (Vulnerability
Index 1: Straight rocky headlands) to 10 years (Vulnerability Index 10:
Protected estuarine salt marshes). The study results indicate that over
50 percent of the southern Chukchi Sea coast has high potential
persistence levels (Vulnerability Indices 9-10).
4.3 DEVELOPMENT OF AN OIL RESIDENCE INDEX (ORI)
4.3.1 Background
The primary objectives of this study are to (a) provide resource
managers with a regional assessment of coastal resource sensitivity to
oil spills (i.e., identify sensitive resources, show where they are, and
indicate when they are sensitive) and (b) provide a sensitivity
evaluation which provides a rationale for development of a contingency
plan (i.e., sensitivity assessment will provide a partial basis for
determining oil spill counter-measure priorities). As such, the
sensitivity evaluation must be necessarily general because of the
regional nature of the study yet must be of sufficient detail to be of
use for contingency planning. For these reasons, we developed a three
level index (primary, secondary and tertiary levels) to illustrate
sensitivities for (a) potential oil residence, (b) biological sensitivity
and (c) human-use sensitivity (Robilliard et al. 1983).
While the use of three levels of concern for the three resource types
is relatively simple, and therefore useful to resource managers, there
are 27 possible combinations possible. As such, the approach provides
planners with sufficient detail to develop priorities for the oil spill
211

contingency plan, The development of the biological and human–use
sensitivity indicies are discussed in Sections 5 and 6, respectively.
The Oil Residence Index is discussed in the following sections.
4.3.2 Basis for Oil Residence Index Develotxnent
Observations from previous spills (Owens 1971, 1978; Owens and Rashid
1977; Vandermeulen and Gordon 1976; Owens et al. 1982; Gundlach and Hayes
1977; Gundlach et al. 1977; Hayes and Gundlach 1975) indicate that
potential oil residence is determined by:
● wave exposure
● substrate type
● sedimentation processes
● oil type
● spill volume
● oil form at impact zone.
Many of these parameters cannot be determined until the time of the spill
so any g priori index must be necessarily general. Wave exposure,
substrate type and sedimentation processes can be evaluated prior to a
spill, however, and provide a basis for developing an oil residence index.
gave Exposure
The wave exposure is the primary process influencing potential
residence of oil (Owens 1971; 1978). Observations and measurements from
the Baffin Island Oil Spill Experiment (BIOS) support the concept that
waves provide an important dispersal mechanism even in the arctic (Owens
et al. 1982, 1983). Areas of low wave exposure, such as lagoons and
estuaries, are likely to have lengthy oil residence periods. The
relationship of wave exposure to the major shore-zone types of the study
area is illustrated in Table 4.3. It should be emphasized, however, that
wave exposure refers only to the open-water season. From approximately
October through June, ice cover is continuous in the Chukchi Sea and
there is no wave activity at the shore.
212

Table 4.3. RATIONALE FOR ESTIMATING POTENTIAL OIL PERSISTENCE IN THE SHORE-ZONE
Shore-zone Wave Substrate Coastal Level ofType Exposurel Type2 Stability Concern
Open Coast
Rock Cliffs High
Tundra Cliff Moderate
Barrier Island High
Barrier Islandwith Vegetation High
Lagoon Coast
Tundra Cliff Low
Barrier Island Low
Delta Low
Wet 1 and Low
Rock
Sandy gravel
Gravelly sand
Gravelly sand
Sandy gravel
Gravelly sand
Muddy sand,vegetation
Mud, peat,vegetation
Erosional
Erosional
Stable to erosional
Stable to accretional
Erosional
Stable
Accretional
Stable
Tertiary
Tertiary
Tertiary
Secondary totertiary
Primary tosecondary
Primary
Primary tosecondary
Primary
lExposure based on maximum open-water fetch lengthsHigh - fetch z 100 km
Floderate - fetch 10 to 100 kmLow - fetch .c1O km
2Terminology of Folk, 1968
213

The table illustrates that most outer coast areas are comparatively
exposed, with wave fetch distance exceeding 500 km during most open-water
seasons. Wave exposure is lower in the northern portion of the study
area, near Point Barrow, as a result of (a) the shorter open-water season
and (b) shorter fetches during the open water season due to the normal
proximity of pack ice.
Substrate Type
Observations of stranded oil in the shore-zone have indicated that
substrate type may influence potential residence (Owens 1971; Hayes and
Gundlach 1975). Coarse sediment beaches allow penetration of the oil
into the substrate where it is no longer exposed to mechanical wave
action. Consequently for beaches of equal wave exposure, persistence
will be greater on coarse–sediment beaches than fine–sediment beaches.
Similarly mud flats often have short oil residence periods because the
fine sediments and the associated high water content of the sediments
prevent the oil from penetrating or adhering to the substrate (Owens et
al. 1982, 1983). The relationship of substrate type t.o shore-zone types
of the study area is illustrated in Table 4.3.
Coastal Stability
Coastal stability and its effect on coastal sedimentation patterns
will influence potential oil residence periods. Eroding coastal areas,
by nature, will have short potential oil residence periods due to the
coastal retreat, particularly since retreat rates of 1 m/yr are not
uncommon (Harper 1978; Owens et al. 1980). Oil residence may be
increased, however, on accretional shorelines, where there is potential
for oil burial, hence removal from exposure to wave action. Such burial
of oil occurred locally on exposed beaches during the BIOS experiment
(Woodward-Clyde Consultants 1981). The relationship of coastal stability
to the major shore-zone types is illustrated in Table 4.3.
214

4.3.3 Oil Residence Index (ORI)
Levels of Concern.
The levels of concern associated with the oil residence index are
based on the estimated period of persistence of oil stranded in the
shore-zone. As discussed above, these levels of concern are only general
guidelines as to potential oil residence, as critical elements of the
spill character cannot be accurately estimated until the time of a spill
(e.g., spill size, oil type, oil form, etc.). Consideration of wave
exposure, substrate type and coastal stability are used to develop the
oil residence index for shore–zone types of the study area (Table 4.3.).
Primary Level of Concern.
Areas of primary concern are those areas where oil is likely to
persist for more than a few months of open water (oil residence is
discussed only in terms of open-water seasons because no natural
degradation of oil is expected to occur during the winter season). In
other words, oil is likely to persist in the shore zone for a period of
one year or more. Areas of primary concern closely coincide with zones
of low wave exposure. These zones include lagoons, ponds and estuaries
with limited wave fetch lengths (< 10 km). Coastal stability and
substrate type may influence residence periods, in that shorelines of
mudflats and eroding shorelines are likely to have shorter residence
periods than other shorelines in spite of the low wave exposure.
Secondary Level of Concern.
Areas of secondary concern coincide with shorelines of (a) primarily
low to moderate wave exposure, (b) fine sediment substrates or (c)
variable sedimentation patterns (Table 4.3). Estimated oil residence
period in these areas is less certain and could range from a few
open-water days to several open water months, depending on the nature of
the spill. Types of shore-zone considered to be of secondary concern
are:
215
● rapidly
e sand or
. exposed
exists.
eroding tundra cliffs in lagoon areas,
mud flats in relatively exposed sections of lagoons,
barrier islands or spits where sedimentation potential
Tertiary Level of Concern
Areas of tertiary level of concern generally coincide with high wave
exposure shorelines where natural wave activity would promote the rapid
mechanical degradation of oil (Table 4.3). Expected oil residence period
is in the order of days to weeks of open water. That is, oil residence
is likely to be less than one complete open-water season. Shore-zone
types of tertiary concern include exposed tundra cliff and barrier island
shores (Table 4.3), except where accretional sedimentation patterns could
cause burial of stranded oil (e.g., near recurve spits at inlets).
4.3.4 Shore-zone TYPes and Oil Residence
The coastline of the study area can be categorized in terms of eight
major shore–zone types. The purpose of this brief section is to describe
the relationship between the major shore-zone types and the oil residence
index. The two major categories of shore-zone types, open coast and
lagoon coast, are determined by wave exposure, the primary process
influencing potential oil persistence.
Open Coast Shorelines
Bock Cliff. Rock cliffs, with associated fringing gravel beaches, occur
along the open-coast near Cape Sabine, Cape Lisburne and Cape Thompson
(Fig. 4.11. The comparatively high wave exposure, and the substrate
type, which prevents oil penetration, would lead to rapid removal of
stranded oil and, therefore, these coastal sections are considered of
tertiary concern.
216

Figure 4-1. Rock cliff near the abandoned Corwin Mine. Cliff height isapproximately 100 meters. Note talus at cliff base.
Figure 4-2. High tundra cliff to the south of Barrow (cliff height 14 m).Note gravel beach and mud from surface wash erosionon cliff face.
217

Tundra Cliffs. Tundra cliffs are exposed along the outer coast in the
Peard Bay/Barrow area and also in the Cape Beaufort/Cape Sabine area
(Fig. 4.2). Cliffs range in height from 3 to 14 meters and a narrow
fringing gravel beach is usually present at the cliff base. Long-term
erosion rates are approximately 0.5 m/yr (Harper 1978) although
year-to-year and local variations occur.
Oil residence on these shorelines would be short duration in temns of
open–water days due to the comparatively high wave exposure and because
of the erosional nature of the cliffs. Consequently, these shoreline
types are assigned a tertiary level of concern. Beach sediments are
often coarse (gravel material consisting of granules, pebbles and
cobbles), which would promote oil penetration, but the rapid coastal
retreat associated with these beaches would lead to rapid exposure and
removal of buried oil.
Barrier Islands. Exposed barrier island shorelines (Fig. 4.3) occur
within much of the central portion of the study area (Kasegaluk Lagoon),
at Point Barrow and at Point Hope. Sediments are almost always comprised
of gravelly sand (> 50% sand) although in many areas a thin gravel lag
lies at the surface as a result of sand removal by wind (Fig. 4.4).
Extensive washover fans and channels and the lack of vegetation indicate
that the islands are frequently inundated during late summer storm surges.
Oil residence on these shorelines is estimated to be of short
duration in open–water days and, therefore, the shores are considered of
tertiary concern. The existence of relatively long open-water fetches
(> 100 km) during open-water seasons would result in rapid mechanical
removal of stranded oil. The sand matrix would prevent significant oil
penetration into the beach and hence promote mechanical dispersal by
waves. Local sedimentation events could cause oil burial; however,
because most shores are stable to erosional in nature, burial is likely
to occur only locally, primarily near inlets where many of the islands
have prograding recurved spits (Fig. 4.5).
218

Figure 4-3. Barrier spit on Ahyougutuk Lake. Note the well-developedstorm berm crest (elevation approximately 2 m above MWL).
219

Figure 4-5. An inlet and prograding recwve spits. Longshore transportis to the north.
220

Barrier Islands with vegetation. Many of the barrier islands along the
Chukchi Sea coast are vegetated with both dune type grasses and wetland
vegetation (Fig. 4.6 and 4.7). The presence of the dune vegetation
allows wind-blown sand to accumulate above the upper-limit of the storm
swash and, as a result, island freeboard (elevation above mean water
level) is usually higher on the vegetated barrier segments. The
increased freeboard is suggestive of greater coastal stability, although
no coastal erosion or accretion rates have been documented for these
barrier islands. A small storm-berm is often present seaward of the
vegetation.
Oil residence on these shorelines is estimated to be of comparatively
short duration in open–water days due to the generally exposed nature
(fetch distance >100 km) of these shorelines, and, therefore, the shores
are considered of tertiary concern. The significant sand component
(>50%) of the barrier island beaches would prevent penetration of oil
into the sediments. The stability of these barrier island segments is
probably greater than the unvegetated barriers, however, there is no
evidence of significant progradation, such as multiple beach ridges,
except in the Point Hope area, where a wide beach plain is present. For
most vegetated barrier island segments, therefore, there is no evidence
of long-term accretion and it is unlikely that oil would be buried in
significant quantities. The area of long–term accretion in the Point
Hope area is an exception to this trend. Also the barrier island
segments around inlets, particularly on the south sides of the inlets, do
show evidence of progradation, and are considered of secondary concern
because of the potential for oil burial within prograding recurve spits.
Lagoon Coasts
Barrier Islands. Low energy gravelly sand beaches occur along most of
the lagoon shores of the barrier islands (Fig. 4.8 and 4.9). These
beaches are (1) commonly narrow (<20 m in width), (2) are commonly
reworked washover fans and (3) may be interspersed with wetlands and sand
flats.
221

Figure 4-7. Thick vegetative cover on a barrier island along the southshore of the Pt. Hope cuspate foreland.
222

Figure 4-9. Ground photo of small swash ridge.Note coal and shingle-type sandstone beach sediments.
223

Oil residence on these shores would probably be lengthy, in terms of
open-water days, primarily due to the low wave exposure levels. For that
reason, the lagoon barrier island shores are assigned a primary level of
concern. A secondary level of concern is assigned to lagoon shorelines
with greater than 10 km fetch.
Tundra Cliffs. Low tundra cliffs (Fig. 4.10) occur along much of the
mainland coast of the major lagoons and estuaries (Peard Bay, Kugrua Bay,
the Kuk River Inlet, Kasegulak Lagoon and Uarryatt Inlet at Point Hope).
Cliff heights are usually low (<3 m) and the cliff material mostly fine
sand, unlike the ice-rich silty cliffs of the Beaufort Sea coast. A
narrow (<10 m) gravelly sand beach typically occurs near the cliff base,
although along some cliffs this may be absent or consist of thick (<1 m)
reworked peat deposits. In some areas of the Kuk River Inlet,
shingle-type cobble material occurs on these beaches.
Oil residence would be expected to be of long duration (i.e., of
primary concern) on stable, tundra cliffs because of low wave exposure.
However, where cliffs are rapidly eroding, persistence would probably be
short in terms of open-water days because of the natural tendency of oil
to be removed by erosion; on these coastal segments, a secondary level of
concern is assigned due to the uncertainty of oil removal rates in such a
low wave exposure environment.
Wetlands. Wetlands occur locally throughout the lagoons and estuaries.
Along smaller estuary shorelines (Fig. 4.11), salt tolerant wetland
vegetation typically rims the entire shoreline. In larger lagoons and
estuaries, wetlands typically occur in low wave exposure areas of the
lagoon; these areas include, swales between recurved spits, areas
landward of mud flats, and coastal deltas (vegetation types are described
in more detail in Section 5.0).
224

Figure 4-11. Small estuary immediately south of Barrow. Note the wet-land shores, the closed ephemeral inlet and the ice-pushedsediment on the cliff edge (arrow).
Figure 4-12. Sand flats in the upper portion of the Kuk River delta.
225

Oil which reached wetland areas would be likely to persist for a
lengthy time period and consequently wetlands are assigned a primary
level of concern. The low wave exposure levels typically associated with
wetlands would result in a slow rate of mechanical dispersal of oil in
wetlands.
Deltas. Deltas are associated with major rivers and streams of the study
area (Kugrua, Kuk, Nokotlek, Utukok, Kokolik, Kukpowruk and Kukpuk
Rivers) and occur within the lagoons along the mainland coast
(Fig. 4.12). The deltas have wide delta front flats grading from mud
near the low water limit to sand at the normal high water limit; these
flats are dissected by the river channels. Vegetation increases in
density landward of the high-water mark.
The potential oil residence period would be variable due to the
offsetting effects of wave exposure and substrate type. The low wave
exposure would normally result in lengthy oil persistence in the
shore-zone; however, the fine sediment size of the tidal flats prevents
oil penetration and would promote dispersal of the oil. The deltas are
therefore assigned a secondary level of concern due to the uncertainty in
potential persistence of oil.
4.4 SHORE ZONE PHYSICAL CHARACTERIZA1’ION
4.4.1 Repetitive Shore-Zone Components
Repetitive shore-zone components are used as a combined
representation of- morphology and substrate types in mapping the
shore–zone character of the Chukchi Sea coast. Each repetitive component
is indjcated by a distinctive pattern (Figure 4.13) on the physical
resource maps (Part II) . A detailed description of each repeatable
component is provided in an expanded legend (Table 4.4) and is
illustrated by a series of photographs.

FIHYWCAL RESOURCES
SHORE–ZONE COMF’ONENTS
ROCKCLIFF .——-— -------- ----.—
HIGH TUNDRA CLIFF —
LOW TUNDRA CLIFF -------—
MIXED SEDIMENT BEACH --------—
S A N D B E A C H - — - - - — - — - - - - - - - -
MUD/SAND FLATS -----—- ——-----
WETLANDS —------ - - - - - - - - - -----—--
LAGOONS/ESTUARIES -—----- -------.
INLETS{
Ephemeral ----------- -------Stable ---------------------
SHORE-ZONE MODIFIERS
WASHOVER CHANNELS AND FANS -——-
BARRIER ISLAND VEGETATION --------
Illllllllulllulml&gf;##&Jtij@J{*f*:yy$Jx#‘.% -:.., :.:6*:. ::::::, . .. . . . . .$%%’:..:::.:..:2.:..,,...+=..!%!%... !.*.... . ..e. ..v...——— —.-——————_—--————_—_—--——— —b=—==— _—ti~-aur==~~~ -
*
~
BIOLOGICAL RESOURCESMARINE BIRD AND WATERFOWLNESTING COLONIES ----- ---------------—-
GULL AND TERN NESTING AREAS ------------—-‘%
I HUMAN–USE RESOURCES
lNDUSTRfAL/MfLI TAR Y ‘-—-------- Izl
SUBSISTENCE -----—-—- ——--- ----.- ❑RECREA TIONAL--------—--———— --------- H
PERMANENT VILLAGE --------——-. - - - - - - - - m
I TI?A IVSPORTA TION CORRIDOR -—------------- m
Ground Truth Statkm -----------—— @to @
Intertidd Zone -----———- --—--- --- . . . . . . . . . . . . . . ...**
5rn Bathymetrk Contwr
10M BathymeiTk ConaxI;
20m Batiymarrk ContDur
Tcymg~hic ConiouIS (m)
-------- —— --- .4
—---_-------- -.— .d.~-------— -. .-. . —..
-———. ,- lm~ ~
Figure 4-13. MAPPING PAITERNS USED FOR SHORE-ZONE COMPONENTS
227

Table 4.4. EXPANDED LEGEND OF PHYSICAL SHORE-ZONE COMPONENTS
SHORE-ZONE COMPONENTS
Rock Cliffs - primary morphology is that of a steep cliff cut by wavesinto the bedrock substrate. Cliff slopes are typically steep(greater than 45”) and fringing beaches are rare. Pocket beachesof gravel sized material may occur in small indentations alongthe base of the cliffs. Bedrock types include sedimentarysandstones in the northern portion of the study area (SkullCliff, Peard Bay, Kuk River) to meta sedimentary and igneous inthe southern portion of the study area (Cape Sabine, CapeLisburne, Cape Thompson).
High Tundra Cliffs - wave–cut cliffs formed in unconsolidatedQuaternary sediments. Relief from cliff base to cliff edge isgreater than 5 m (approximately 15 ft). Cliff sediments arebonded by permafrost and are usually “ice-poor”, although massiveice beds do occur locally. Slopes are usually less than 45° andare dominated by surface wash and debris slide mass–wastingprocesses. Coastal retreat rates, where documented, are lessthan 1 m/yr. Fringing gravel beaches typically occur at thecliff base.
Low Tundra Cliffs - wave–cut cliffs formed in unconsolidatedQuaternary sediments. Relief from cliff base to cliff edge isless than 5 m (approximately 15 ftl. Cliff sediments are bondedby permafrost and are usually “ice rich.” These cliffs are mostcommon in lagoons and near open-coast river mouths. Coastalretreat con be rapid (> lm/yr) on some cliffs (usually steepslopes, >45”, indicate rapidly retreating cliffs), although mostcliffs appeared retreating only slowly in comparison with thoseof the Beaufort Sea coast. Narrow fringing sand or gravelbeaches are typically associated with these cliff types.
Mixed Sediment Beaches - the vast majority of beaches along theChukchi Sea coast are comprised of a mixture of sand andgravel-sized sediment. klixed-sediment beaches are widelydistributed and are associated with both/barrier islands andtundra cliffs. Additional detail on size composition of sedimentwithin the unit is provided in the resource tables. (Note:gravel includes sediment greater than 2 mm in diameter; sandincludes sediments with diameters of 0.06 to 2.0 mm).
Sand Beaches - sand beaches occur at the distal ends of some barrierspits (the eastern Peard Bay spit, for example). Sand-sizedmaterial comprises more than 80 percent of the total sedimentmass. Sand beaches may occur locally along the lagoon shores aswell.
228
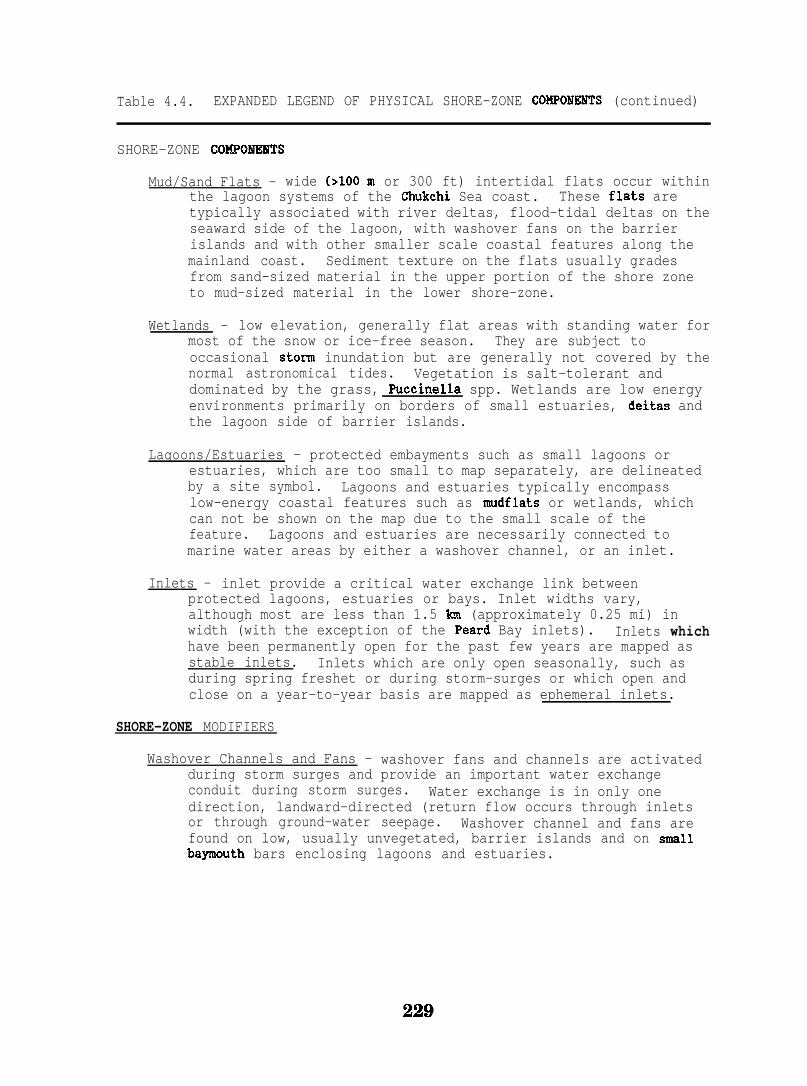
Table 4.4. EXPANDED LEGEND OF PHYSICAL SHORE-ZONE COHPOMENTS (continued)
SHORE-ZONE COMPOBTEHTS
Mud/Sand Flats - wide (>100 m or 300 ft) intertidal flats occur withinthe lagoon systems of the Chukchi Sea coast. These flats aretypically associated with river deltas, flood-tidal deltas on theseaward side of the lagoon, with washover fans on the barrierislands and with other smaller scale coastal features along themainland coast. Sediment texture on the flats usually gradesfrom sand-sized material in the upper portion of the shore zoneto mud-sized material in the lower shore-zone.
Wetlands - low elevation, generally flat areas with standing water formost of the snow or ice-free season. They are subject tooccasional stomn inundation but are generally not covered by thenormal astronomical tides. Vegetation is salt-tolerant anddominated by the grass, Puccinella spp. Wetlands are low energyenvironments primarily on borders of small estuaries, deitas andthe lagoon side of barrier islands.
Lagoons/Estuaries - protected embayments such as small lagoons orestuaries, which are too small to map separately, are delineatedby a site symbol. Lagoons and estuaries typically encompasslow-energy coastal features such as mudflats or wetlands, whichcan not be shown on the map due to the small scale of thefeature. Lagoons and estuaries are necessarily connected tomarine water areas by either a washover channel, or an inlet.
Inlets - inlet provide a critical water exchange link betweenprotected lagoons, estuaries or bays. Inlet widths vary,although most are less than 1.5 Ian (approximately 0.25 mi) inwidth (with the exception of the Peard Bay inlets). Inlets whichhave been permanently open for the past few years are mapped asstable inlets. Inlets which are only open seasonally, such asduring spring freshet or during storm-surges or which open andclose on a year-to–year basis are mapped as ephemeral inlets.
SHORE-ZONE MODIFIERS
Washover Channels and Fans - washover fans and channels are activatedduring storm surges and provide an important water exchangeconduit during storm surges. Water exchange is in only onedirection, landward-directed (return flow occurs through inletsor through ground-water seepage. Washover channel and fans arefound on low, usually unvegetated, barrier islands and on smallbaymouth bars enclosing lagoons and estuaries.

Table 4.4. EXPANDED LEGEND OF PHYSICAL SHORE-ZONE COHPOI?ENTS (concluded)
SHORE-ZONE COKPOI?ENTS
Barrier Island Vegetation – barrier island vegetation is mapped as ashore-zone modifier for open coast barrier islands wheresignificant densities of vegetation occur. Vegetation on theChukchi Sea side of the barrier islands is primarily dune grass(Elmus arenarius mollis). on the lagoon side, the vegetation istypically one for more species of grass, primarily PuccinellaSpp . The presence of vegetation usually indicates a greaterbarrier island stability (i.e., stable or accretional) and lessfrequent over-topping during storm surges.
More than one repetitive shore–zone component may occur within a
shore-zone unit. The repetitive components are not necessarily mutually
exclusive, and by combining two or more within a unit, a composite
picture of the shore-zone character is established. However, not all
components can be combined (e.g., rock cliffs and tundra cliffs cannot
occur within the same unit). Washover fans are used as a modifying
symbol within some units. These shore-zone modifiers differ from
shore-zone components in that they cannot be used alone to represent a
unit.
The expanded legend (Table 4.4) provides a concise su~arY of
shore–zone components and modifiers which are used on the maps (Volume 2).
4.4.2 Repetitive Shore-Zone Types
Repetitive shore-zone types represent a set of shore-zone components
that occur repeatedly in the same combination throughout the study area.
Repetitive shore-zone types provide a useful means for summarizing the
geomorphology of the study area. The physical shore-zone character of
the study area can be summarized in terms of the seven major shore zone
types (Table 4.5).
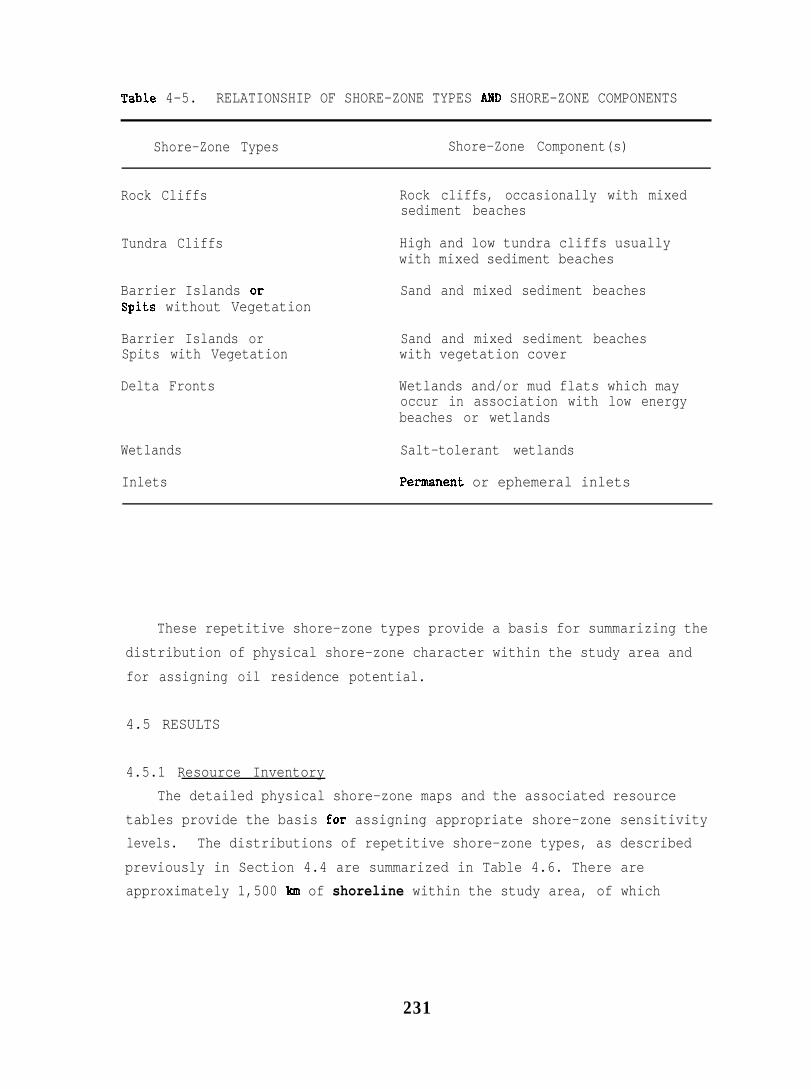
Table 4-5. RELATIONSHIP OF SHORE-ZONE TYPES AND SHORE-ZONE COMPONENTS
Shore-Zone Types Shore-Zone Component(s)
Rock Cliffs Rock cliffs, occasionally with mixedsediment beaches
Tundra Cliffs High and low tundra cliffs usuallywith mixed sediment beaches
Barrier Islands or Sand and mixed sediment beachesSpiks without Vegetation
Barrier Islands or Sand and mixed sediment beachesSpits with Vegetation with vegetation cover
Delta Fronts Wetlands and/or mud flats which mayoccur in association with low energybeaches or wetlands
Wetlands Salt-tolerant wetlands
Inlets Pemanent or ephemeral inlets
These repetitive shore-zone types provide a basis for summarizing the
distribution of physical shore-zone character within the study area and
for assigning oil residence potential.
4.5 RESULTS
4.5.1 Resource Inventory
The detailed physical shore-zone maps and the associated resource
tables provide the basis for assigning appropriate shore-zone sensitivity
levels. The distributions of repetitive shore–zone types, as described
previously in Section 4.4 are summarized in Table 4.6. There are
approximately 1,500 Ian of shoreline within the study area, of which
231

Table 4.6. PERCENT OF REPETITIVE SHORE-ZONE TYPES
Percent of Repetitive Shore-Zone TypesMaps 1-32 Maps 33-58 Maps 59-84 Total
Open Coast
Rock CliffTundra CliffBarrier Island
vegetationBarrier Island
vegetationInlet/Estuary
Subtotal
Lagoon Coast
Tundra Cliff
o 0 4.7 4.76.8 0 5.8 12.6
without4.9 8.2 4.3 17.5
with1.2 4.5 1.6 7.30.5 0.4 0.2 1.1
13.4 13.1 16.6 43.2
13.5 14.1 3.3 30.9Barriers or Spits 4.6 7.7 2.7 15.0Delta Fronts 0.1 1.8 0.1 2.1Mudflats 0.1 2.5 0.1 2.7Wetlands 0.1 4.9 0 5.1Inlets 0.4 0.4 0 0.8
Subtotals 18.8 31.4 6.2 56.8
TOTAL 32.2 44.5 22.8 100
2 3 2

650 km is classified as open–coast shoreline (exposed to maximum fetch
distances in excess of 10 km) and 850 km is classified as lagoon or
protected coast (maximum fetch distances are generally less than 10 km).
The geomorphology of the northern Chukchi Sea coast can be considered
in terms of three major sections of coastline:
(1) the northern Chukchi Sea coast (maps 1-32), which lies between
Pt. Barrow and Kasegaluk Lagoon and consists primarily of tundra
cliffs with two major embayment-type lagoons (Peard Bay and the
Kuk River Inlet)
(2) the Kasegaluk Lagoon coast (maPs 33-581, which consists of 200
km (approximately 110 n mi.) of barrier island coastline in the
central portion of the study area, including an extensive
barrier island lagoon system with almost 500 km (approximately
275 n mi.) of shoreline
(3) the Cape Beaufort-Cape Lisburne - Point Hope coast (maps 59-84),
which lies to the south of Kasegaluk Lagoon and includes a wide
variety of shoreline types from rock cliffs to protected lagoons.
The northern Chukchi Sea coast is principally comprised of eroding
tundra cliffs, cut into unconsolidated Quaternary deposits (Table 4.6).
In a few locations Cretaceus sandstone bedrock and coal seams crop out
in the cliffs. Barrier island and spit systems, consisting of gravelly
sand material and mostly without vegetation, occur at Point Barrow and at
Peard Bay. Two major embayment systems, Peard and Kugrua Bays and the
Kuk River Inlet, occur within this coastline section and comprise a
substantial segment of coastline (286 km). Shorelines of these
embayments are comprised primarily of rapidly retreating low tundra
cliffs, interspersed with small gravel spits (Table 4.6). Small river
systems have formed deltas at the mouth of both the Kugrua and Kuk Rivers.
233

“The central Kasegaluk Lagoon coast consists of a long (200 km),
narrow barrier island lagoon system with over 475 km of lagoon shoreline
(Table 4.6). Low, gravelly sand, barrier islands lie along the seaward
side of the lagoon. Vegetation occurs sporadically on the barrier
islands to the north of the Icy Cape suggesting that these barriers are
frequently overtopped during storm surges and are, therefore, more
dynamic than those to the south. Vegetation becomes increasingly common
on the barrier islands to the south of Icy Cape suggesting greater
stability; on many sections of the barriers, vegetation colonization
particularly noticeable on old recurve spits formed by northward tidal
pass migration.
The lagoon section of this coast includes a variety of coastal
landforms, the most common of which is the ubiquitous low tundra cliff
(Table 4.6). Gravelly sand beaches (on the lagoonal side of the barrier
islands), wetlands, mudflats and delta flats are also comparatively
common features of this coastline. Wetlands occur along the lagoonal
shores of the barrier islands, particularly in southern Kasegaluk Lagoon
and in association with the three major river deltas on the mainland
shore.
The southern-most section of the study area, to the south of
Kasegaluk Lagoon, includes a wide variety of coastal landfonw, the most
prominent of which is the resistant bedrock cliffs at Cape Lisburne
(Table 4.6). Rock cliffs occur to the east and south of Cape Lisburne,
as well as at Cape Thompson, and comprise approximately 70 km of
shoreline. Tundra cliffs are not uncommon, however, particularly between
Cape Sabine and Kasegaluk Lagoon, comprising an additional 89 km of coast
(Table 4.6). Barrier islands, both with and without vegetation are
extensive on the Point Hope cape–system and occur locally in association
with small lagoons east of Cape Lisburne. Lagoon coasts occur primarily
within the Point Hope cuspate foreland and consist of low tundra cliffs
and gravelly sand beaches along the barrier islands.
234
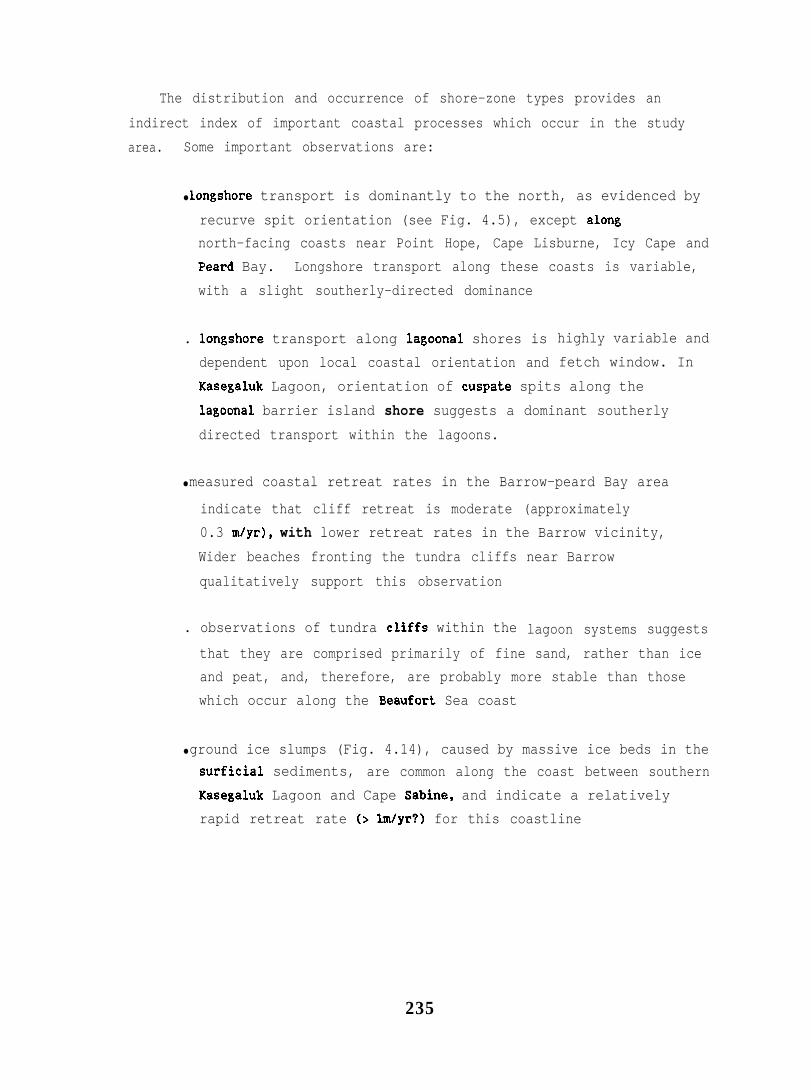
The distribution and occurrence of shore-zone types provides an
indirect index of important coastal processes which occur in the study
area. Some important observations are:
● longshore transport is dominantly to the north, as evidenced by
recurve spit orientation (see Fig. 4.5), except along
north-facing coasts near Point Hope, Cape Lisburne, Icy Cape and
Peard Bay. Longshore transport along these coasts is variable,
with a slight southerly-directed dominance
. longshore transport along lagoonal shores is
dependent upon local coastal orientation and
highly variable and
fetch window. In
Kasegaluk Lagoon, orientation of cuspate spits along the
lagoonal barrier island shore suggests a dominant southerly
directed transport within the lagoons.
● measured coastal retreat rates in the Barrow–peard Bay area
indicate that cliff retreat is moderate (approximately
0.3 m/yr), with lower retreat rates in the Barrow vicinity,
Wider beaches fronting the tundra cliffs
qualitatively support this observation
. observations of tundra cliffs within the
near Barrow
lagoon systems suggests
that they are comprised primarily of fine sand, rather than ice
and peat, and, therefore, are probably more stable than those
which occur along the Beaufort Sea coast
● ground ice slumps (Fig. 4.14), caused by massive ice beds in the
surficial sediments, are common along the coast between southern
Kasegaluk Lagoon and Cape Sabine$ and indicate a relatively
rapid retreat rate (> lm/yr?) for this coastline
235

Figure 4-14. Oblique aerial photo of, ground-ice slumps near CapeBeaufort. Note the massive ice in the scarp(approximately 5 m in height).
Figure 4-15. Ice push on the shore southwest of Pt. Franklin. Ice pushwas common near Pt. Franklin and Pt. Barrow.
236

e wide (and stable) barrier islands (Fig. 4.6) are mOSt COmmOn
where migrating tidal passes have produced (a) wide flood-tidal
deltas seaward of the barrier islands and (b) where recurve
spits increase the effective width of the barrier islands
. ice push (Fig. 4.11 and 4.15) was most notable in the Wainwright
to Point Franklin area and in the Will Rogers/Wiley Post
Monument to Point Barrow area, suggesting a greater intensity of
ice–shore interaction in these areas
The consequences of these coastal processes in relation to potential oil
residence is summarized in the following sections,
Storm surge elevations were estimated at the ground-truth stations by
surveying from the waterline to the highest log line (Fig, 4.16). Logs
were not always present and indirect measures, such as maximum storm-berm
elevation of the barrier islands, also provided an estimate of maximum
surge elevations. Measured values are listed in Table 4.7 and reliable
estimates (log lines and maximum berm crest elevations) are plotted in
Figure 4.17. It should be emphasized that estimates are approximate in
that (a) they are referenced to a water level that was assumed to be a
“mean water level” and (b) the estimates probably represent the
storm-surge elevation plus wave amplitude.
Some significant variations in measured surge elevations are evident
within the study area (Figure 4.17). Along the outer coast, storm-surge
elevations in the Peard Bay to Barrow area are greater than 2 m with
maximum values in the 2.7 to 2.9 m range. In the central barrier island
coastal area, including the open-coast to Cape Lisburne, the surge
elevations generally range from 2.0 to 2.5 m with a maximum barrier crest
elevation of 2.7 m to the south of Pt. Lay. The highest storm-surge
elevations documented in the study area occur in the Point Hope vicinity
with all measurements greater than 2.5 m and a maximum measured value of
3.8 m; the greater measured elevations in this area probably reflect
greater wave exposure rather than higher elevations.
237
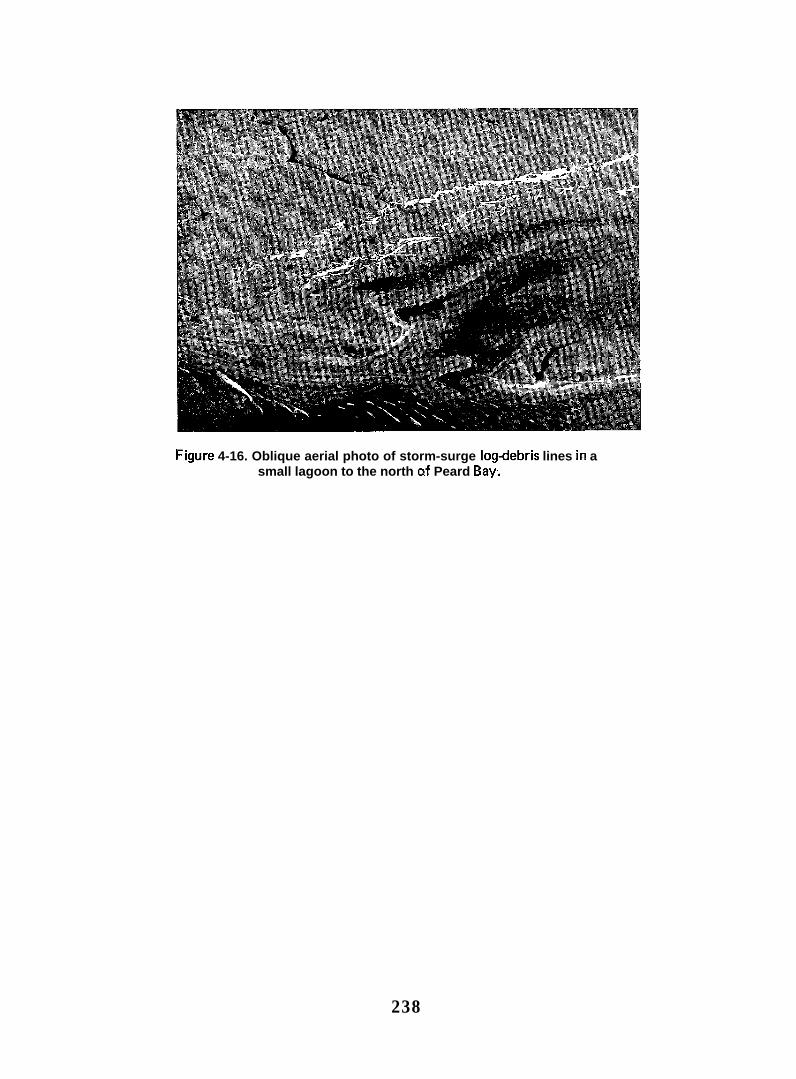
Figure 4-16. Oblique aerial photo of storm-surge Iogdebris lines in asmall lagoon to the north of Peard Bay;
238

Table 4 . 7 . STORM-SURGE ELEVATIONS - CHUKCHI SEA COAST
Ground- Elevation Ground- Elevationtruth Above truth AboveStation Surge Indicator M.w.r. (m) St.at.ion Surge Indicator H.W.L (m)
Cs-1CS-2CS-3CS-4Cs- 5CS-6Cs- 7CS-8Cs- 9
Cs- 10Cs-11
CS-12CS-13CS-14CS-15
CS- 16Cs- 17CS- 18CS-19
Cs- 20Cs-21CS-22CS-23CS-24CS-255-26
CS-27
NoneBase CliffBarrier crestLogsCliff baseBerm crestSnowBase cliffBerm crest.Logs in backshoreBase scarpLog lineBase cliff with logsBase cliffBerm crestLog lineLog line 1Log line 2
2.22.32.02.92.9
2.12.12.41.22.73.22.02.31.71.31.5
Max swash ridge height. 1.6NoneLog line 3.6Log line 1 1.6Log line 2 2.4Log line 3 3.1Log line 2.9Ridge crest 1.8Base dune, logs 1.8Log debris >0.9Berm crest >1.4Spit crest >0.7Log line >0.9Log line 1 1.7Log line 2 1.7Log line 3 2.3
CS-28CS-29CS-30CS–31CS-32CS-33CS-34CS–35CS-36CS-37CS-38CS-39CS-40CS-41CS-42CS-43CS-44
CS-45CS-46CS-47CS-48CS–49CS–50CS-51CS-52CS-53CS-54CS–55
Barrier crestLog debrisBase cliffLogsBarrier crestCliff baseBarrier crestLogsLogsLogsLogsLogsLogsLogsLogsLogsBeTmLogsLogsLogsCliff baseCliff baseLogsLogs/bermLogs/bermLogs/bermLogsLogsLogsBerm crest
>1.12.7
>1.31.8-2.1
1.72.5
1.4 i- 0.3 = 1.7*1.6 + 0.3 = 1.9*1.9 + 0.5 = 2.2*1.0 + 0.3 = 1.3*1.7 + 0.3 = 2.0*1.2 +0.3 = 1.5*1.5 + 0.3 = 1.8*2.2 +0.5 = 2.7*1.3 + 0.5 = 1.6*2.2 + 0.3 = 2.5*
2.12.02.61.30.81.02.42.03.0
2.5-2.73.03.83.53.1
Water levels on this day of the survey were noticeably higher than on previoussurvey days and an arbitrary 0.3 m was added to correct the ● ’mean water level”.

POINT BARROWE@mo
f
., .“ ,
TO ICY CAPE.
I2.7 , i 2.3
S’
P’ ‘ 2.22.9,,;:”
,.,, .
. .
# 2.0,WA’”’’”’-’-”-
3.6,
ICY .2.’ - A
‘:,. ,/- ~ ‘ POINT LA,~-
-// G ’
“b3.5 “ ) o 100 km-
ICY CAPE TOCAPE THOMPSON
Figure 4-17. STORM SURGE ELEVATIONS (inrneters) ALONG THE NORTHERNCHUKCHI SEA COAST
240

Significant variations also occur within the lagoons. Surge
elevations within Peard Bay are notably higher in the eastern portion of
the bay (-3.0 m) than in the western portion (0.9 m), suggesting that
local surge anomalies similar to that of the Beaufort Sea coast (Reimintz
and Mauer 1978) are generated by westerly winds. No surge anomalies are
apparent in the Kuk River, as would be expected due to the north-south
orientation of the lagoon and the restricted wave fetches. High storm
surge elevations (2.7 to 3.6 m) in northern Kasegaluk Lagoon with
decreasing elevations to the south support observations that westerly and
south-westerly winds cause local surge anomalies in the shallow lagoon.
4.5.2 Oil Residence Indices
Primary, secondary and tertiary Oil Residence Indices are mapped for
all segments of the northern Chukchi Sea coast, including major lagoon
shorelines. The oil residence indices are graphically illustrated on the
sensitivity maps (Volume 2 - Resource and Sensitivity Maps) and
quantitatively summarized in Tables 4.8 and 4.9.
The results indicate that approximately 30 percent of the coastline
is classified as primary concern (Table 4.8). Most of the primary
concern areas are in lagoons (25 percent - Table 4.9) and include (a) low
energy gravel beaches, (b) wetlands and (c) delta fronts (with associated
wetlands). These areas would be expected to have oil residence periods
longer than one open-water season. An additional 32 percent of the
coastline is classified as secondary concern (Table 4.8). These are
segments of coastline where residence time is uncertain and could range
from a month to more than one complete open-water season. Shore-zone
types included in this category include (a) actively eroding low tundra
cliffs along much of the mainland lagoon coast (Table 4.9) and (b)
recurve spits associated with barrier island tidal inlets. Potential oil
residence on these shorelines would depend heavily on environmental
conditions at the time of
example, if oiling levels
be expected to self–clean
stranding occurred during
the spill and the spill characteristics. For
were light, the tundra cliff shorelines would
in a matter of weeks. Similarly, if oil
relatively quiescent wave conditions, with no

Table 4.8. DISTRIBUTION OF OIL RESIDENCE INDICES ON THE NORTHERN CHUKCHI SEA
Level of Concern-—Region Primary (%) Secondary (%) Teritiary (%)
Northern 6.9 13.8 11.7(Maps 1-32)
Central 17.5 15.2 11.8(Maps 33-58)
Southern 5.3 3.3 14.4(Maps 59-84)
Total* 29.7 32.3 38.0
*Total coastline length 1523 km
Table 4.9. DISTRIBUTION OF OIL RESIDENCE INDICES ON THE NORTHERN CHUKCHI SEACOAST AS A FUNCTION OF EXPOSURE
Level of ConcernPrimary (%) Secondary (%) Tertiary (%)
Region ;pen Coast Lagoon Open Coast Lagoon ;pen Coast Lagoon
Northern 1.8 5.1 0 13.8 11.7 0(Maps 1-321
Central 0.8 16.7 0.5 14.7 11.8 0(Maps 33-58)
Southern 2.2 3.1 0.1 3.2(Maps 59-84)
14.4 0
Total* 4.7 25.0 0.6 31.8 38 0
*TOtal coastline length 1523 kmLagoon coastline length 864 kmOpen coast coastline length 659 km
242

storm surge, shorelines around inlets would quickly self-clean (days to
weeks of open-water season). If, however, oil were transported into
swales between the recurve ridges during a storm surge, potential oil
residence would likely be lengthy (greater than one complete open-water
season).
The remaining 38 percent of the study area shoreline is classified as
tertiary concern (Table 4.8). The areas of tertiary concern are
restricted to open-coast areas (Table 4.9), where higher wave energy
levels would likely cause natural dispersal of the oil within days to a
few weeks. Areas included in the tertiary concern category are: rock
cliffs, eroding tundra cliff, and gravelly–sand barrier island beaches.
It is also evident from the regional summaries (Table 4.8) that the
central portion of the study area has the greatest oil persistence
potential. Approximately half of the primary and secondary levels of
concern occur within the central coastal segment, primarily because of
the extensive lagoon systems with extensive wetland, delta front, and
low-energy beach shorelines (Table 4.9). The lowest proportion of
primary or secondary concern shoreline occurs within the southern
segment, which consists primarily of open-exposed coastline (Table 4.9).
The northern coastal segment has a comparatively small proportion of
primary concern shoreline, due to the low proportion of wetlands, deltas
and barrier beaches which occur within the lagoons. The higher
proportion of secondary concern shoreline in the northern segment is
attributable to the common occurrence of low tundra cliffs along most of
the lagoon shoreline (Table 4.9).
4.6 SUMMARY
Based on a detailed inventory of coastal landforms along the Chukchi
Sea and a review of oil persistence studies in other areas, approximately
30 percent of the northern Chukchi Sea coast is expected to have
potentially lengthy oil residence periods (greater than one open–water

season) (Table 4–8). Shore-zone types most susceptible to lengthy oil
persistence are low energy beaches, wetlands and river deltas of the
protected lagoon coast. An additional 32 percent is considered to have
variable residence periods, which will depend significantly on
environmental conditions at the time of the spill and on spill
characteristics. Residence periods of oil in the shore zone may range
from a few weeks to more than one open-water season. Shorelines included
in this category are prograding recurve spits near barrier island inlets
and eroding low tundra cliffs which occur along much of the mainland
lagoon coast. The remaining 38 percent of the coast is considered to
have comparatively short oil residence periods and under normal
open–water conditions would probably be self-cleaned in a period of days
to weeks by wave action. Experimental oil spill studies in the Canadian
arctic have shown that exposed shoreline (fetch distances greater than
100 km) can be cleaned rapidly (a few days) despite heavy oiling levels.
Shorelines included within this category are: rock cliff, eroding tundra
shorelines along the exposed Beaufort Sea coast, and exposed barrier
island shorelines.
The highest concentration of shoreline where oil persistence is
likely to be high occurs in the central portion of the study area where
over approximately 500 km of the lagoon shoreline is comprised of
extensive wetlands, river deltas and low energy beaches.
244
5.0
BIOLOGICAL SENSITIVITY
5.1 INTRODUCTION
The biological sensitivity to oil spills of the Chukchi Sea coast is
based on the species, habitats or other biological resources vulnerable
and sensitive to an oil spill. Identification of the sensitivity and
vulnerability of biological features is important for environmental
impact assessment. It is especially useful for the development of oil
spill countermeasure planning or implementation to protect sensitive
coastal biological resources. The Biological Sensitivity Index
complements the
(Section 6.0).
5.2 CONCEPTUAL
Oil Residence Index (Section 4.0) and the Human Use Index
DEVELOPMENT OF THE BIOLOGICAL SENSITIVITY INDEX (BSI)
Important elements of evaluating oil spill impacts and planning oil
sPill countermeasures are (a) an estimate of the potential vulnerability
and sensitivity of coastal biological resources when they come into
contact with the oil and (b) the ability of the resource to recover from
the effects of the oil. A Biological Sensitivity Index is one of the
several separate components or indices developed to fully assess the
impacts of an oil spill and to develop countermeasures (Owens and
Robilliard 1981a, 1981b). Thus, the Biological Sensitivity Index is
limited to “biological sensitivity and vulnerability”, which is a complex
enough evaluation in itself, and does not include elements of: (a)
“risk” index, (i.e. probability that an oil spill will occur and contact
the biological resource), (b) “persistence”, ‘*oil residence’* or “oil
retention” index, (c) “response and priority” index, (d) “human resource
use” index, or (e) ● ’cultural resource” index (Robilliard et al. 1980).

Most previous indices considered the biological characteristics to be
largely dependent upon the geological substratum and the physical coastal
processes. They largely ignored the substantial variability in, and
influence of, biological features and processes. This led to the
assumption that a shoreline characterization based primarily on
geological features and coastal processes is sufficient to determine
shoreline biological sensitivity (Owens and Robilliard 1981a). However,
sensitivity indices developed on this assumption often lead to false
impressions about coastal biological sensitivities and particularly about
the amount of temporal or seasonal variability in these sensitivities
(Owens and Robilliard 1981a).
These limitations led to the development of the Biological
Sensitivity Index based upon and reflecting the temporal and spatial
variability in abundance, distribution, and important activities of
species, habitats or other resources of real or perceived concerns
(Woodward-Clyde Consultants 1982, Robilliard et al. 1983a, b). The index
is flexible enough to accommodate natural variability and the consequent
temporal change in “importance” or “rank” of a coastal segment due to the
change in the biotic components present. Most previous sensitivity
indices did not explicitly take into account this temporal variation in
identifying the importance or sensitivity of a coastal segment and did
not provide a means of including this information in the index. However
Gundlach et al. (1980) modified their original approach and included the
seasonal importance of specific shoreline habitats to certain species
directly on the maps using specific symbols.
It i.s also not desirable to rank or weight q priori the sensitivity
indices in some fixed scale as has been done previously (Hayes et al.
1976, Worbets 1979, Forget et al. 1979, Gundlach and Hayes 1978, Gundlach
et al. 1980). Even though these approaches, as currently used, appear to
be easier to “understand’*, they do not take into account the seasonal
variability in the sensitivity level of the resource. The index must be
presented so that it is easily understood and correctly used by the
decision makers, environmental managers, and operations personnel.
246

Typically, this can be most readily accomplished by graphic and tabular,
rather than narrative, presentations.
As a general rule, the BSI as well as ~ priori oil spill
countermeasure planning should focus on those resources and their
activities that are predictable in a spatial context; that is, they are
“real-estate oriented”. Therefore, only the “real-estate oriented”
resources (e.g. wetlands) or activities (e.g. waterfowl nesting areas or
seabird colonies) are mapped. The resources which are not spatially
predictable except in a broad sense are usually mobile species like polar
bears, beluga whales, spotted seals and walrus, anadromous fish, rafting
or migrating waterfowl and marine birds, and most shore birds. They are
not. mapped because:
~ Putting symbols all over the map to reflect their distribution
defeats the purpose of identifying sensitive areas for ~ priori
spill countermeasure planning,
* putting symbols on a map implies that the resource is and will
be present where shown,
@ temporal abundance and distribution patterns at any particular
location are often widely variable,
e the data on temporal or spatial distribution of the resources
are generally inadequate, especially in the Arctic.
In this program, the Biological Sensitivity Index (BSI) directly
reflects the biological nature, not the physical nature, of the coastal
resources. The BSI displays the spatial and temporal sensitivity
associated with the biotic resources of the Chukchi Sea coast at 3 levels——Qf concern: Primary (high), Secondary (moderate) or Tertiary (1owI.
(See Section 5.4 for details.)
247

Once the level of concern for a coastal resource is identified, one
may compare the level of concern for that resource to the level of
concern for the same resource in other coastal segments, as well as to
other resources in the same or other coastal segments. This type of
comparison should assist decision makers, in the event of a spill, to
decide where and how to allocate resources in implementing oil spill
countermeasures.
5.3 LIMITATIONS OF THE BIOLOGICAL SENSITIVITY INDEX
The Biological Sensitivity Index, as used in this report and applied
on the accompanying maps, can only be used as a guideline for identifying
which sections of the coast m- have a high level of biological
sensitivity to oil spills. Because most biological resources may vary
considerably in spatial and temporal abundance, distribution, or
importance on a short-term basis, it would be preferable (and may even be
necessary) to verify the Biological Sensitivity Indices at the time of an
oil spill. This real-time verification is easily and rapidly done. It
is particularly desirable prior to any substantial implementation of
shoreline protection or cleanup countermeasures This verification can
minimize the time and money spent on protecting a resource that is not
actually present in a particular place at the time of the spill, even if
the Biological Sensitivity Index indicates that the resource is likely to
be there.
5.4 DEFINITION OF TERMS
Vulnerability and sensitivity are key components in defining the
level of concern for the biotic resources. For the purposes of this
report, the terms are defined as follows:
e Vulnerability is the likelihood that some portion of the biotic
resource of concern will come into contact with oil.
248
e Sensitivity is the response of the biotic resource to contact
with oil.
e Level of Concern reflects a combination of the vulnerability and
sensitivity levels of a particular biotic resource.
5.4.1 Vulnerability
Assessing the vulnerability of a biotic resource involves a
qualitative assessment of the proportion of the population or community
that could potentially come into contact with or be contracted by oil.
The levels of vulnerability (low, moderate, high) represent the
possibility that a substantial portion of the population/community will
come into contact with oil within the study area and that the loss of
this portion of the population/community could potentially affect overall
population numbers of the species in the study area.
The final vulnerability level represents a composite of several
factors (including abundance, distribution within the study area, and
behavior) which will identify the proportion of the population/community
which may come into contact with the oil. For example, clumped
resources, such as some of the nesting seabirds (e.g. , murres,
kittiwakes), are considered more vulnerable than those with non-clumped
widespread distributions, such as the cormorants and gulls. Seabirds,
such as the murres, which form large social flocks on the water in the
vicinity of their nesting colonies are considered more vulnerable than
species, such as the terns, which do not. Birds that dive for their food
(alcids) are considered more v u l n e r a b l e than those that d o not (gulls).
5.4.2. Sensitivity
The sensitivity of a resource is based on the expected response of
that resource to contact with oil. Response is evaluated in terms of
potential mortality or diminished reproductive capacity and of the
resilience of the potentially affected population/community. For
example, a highly sensitive resource would be one in which a large

portion of the population suffered ‘high mortalities and the population
took a long time (i.e. several generations) to recover to pre-spill
abundance.
5,4.3, Level of COnC9~
The level of concern of the BSI reflects the combination of
vulnerability and sensitivity of the particular population/conununity
being assessed.
We establish three levels of concern to oil spills and label them
primary, secondary, and tertiary concern. These levels of concern are
defined as follows:
e Primary (or High) Major change expected in distribution,
size, structure and/or function of
affected biotic resource (population,
community or habitat).
Recovery from these changes expected
to required long time periods
(variously defined as several years,
generations, ice-free seasons,
decades, etc. as appropriate for area
of concern).
e Secondary (or Moderate) – Moderate change expected in
distribution, size, structure and/or
function of affected biotic resource
(population, community or habitat)
Recovery from these changes expected
to require moderate time periods (see
above) .

@ Tertiary (or Low) - Little or no change expected in
distribution, size, structure and/or
function of affected biotic resources
(population, community or habitat).
- Recovery from any changes expected to
require short time periods (see above).
In practical terms, the three levels of concern, regarding any of the
components of the three resource categories, can be described in the
context of an actual oil spill. The PrimarY (or High) category has high
visibility with the public, government agencies, and other concerned
groups. There will be considerable public and official pressure to
implement protective or cleanup countermeasures with little regard to
cost or practicality. The majority of knowledgeable sources will agree
that there will be (or is perceived to be) a significant impact to the
resource if oil contacts it. The Tertiary (or low) category attracts
very little attention. There is little pressure from any knowledgeable
source to take countermeasure actions because there is general agreement
that the resources will not be affected. The Secondary (or moderate)
category, however, includes those situations where there is considerable
debate in the media and among knowledgeable sources about the importance
of the resource, the cost-effectiveness of countermeasures and the likely
impact of oil contacting the resource.
In most cases, decisions about the need to take countermeasure
actions in areas assigned Primary or Tertiary Levels of Concern will be
straight-forward (although the actual implementation may not be) and can
be planned for on an g priori basis. However, decisions in areas
assigned a Secondary Level of Concern are probably best made at the time
of the spill though some planning can take place on an a priori basis.
Not uncommonly, the level of concern is influenced or even
established by policy makers, government regulatory bodies, or the public
on the basis of perceived sensitivity of the biological or human use to
oil spills. This perceived sensitivity and usually high level of concern
may not reflect the real ecological or human use sensitivity. That is,
the species, habitat or human activities may not be substantially
affected by the oil, and on a strictly ecological or economic basis,
should be assigned a lower level of concern. For example, there is very
little evidence from past oil spills that pinnipeds or whales in open
water situations are adversely affected by oil spills, so long as the
pinnipeds or whales are allowed to move about on their own accord. Yet
pinnipeds and their haulout or shoreline rookery areas and whale
intensive-use areas are often assigned a high level of concern by
decision-makers and the lay public based on a perceived sensitivity.
Estimation of the level of concern is necessarily subjective due to
the large amount of uncertainty about the likely physical, biological and
human use conditions at the time of an actual spill and about the
characteristics of the spill itself. The indices or levels of concern do
not include an estimate of the likelihood of an oil spill occurring.—— The
levels of concern presented on the maps are based on the experience and
professional judgment of the authors and on the pertinent literature on
the short and long-term effects of spilled oil on shore-zone resources.
More accurate estimates of the level of concern, especially for Secondary
categories, can be made at the time of the spill when the numerous
variables affecting the level of impact can be evaluated in real time.
5.5 HABITATS AND BIOLOGICAL RESOURCES OF CONCERN
5.5.1 Habitats
There are five major shore zone habitats, from a biological
perspective, on the northern Chukchi Sea coast. The are:
e rock cliffs (Figures 4.1, 5.1)
● wetlands (Figure 4.11, 5.2, 5.3)
e barrier islands and spits (Figures 4.3, 4.5, 4,6, 4.7, 4.15, 5.2)
● tundra cliffs (Figures 4.2, 4.10)
e deltas (Figure 4.121
252

Figure 5-1.Rock cliffs, east of Cape Lisbu me. Arrowindicates beginning of the major seabird(kittiwake and murre) nesting colony.
Figure 5-2. Barrier Island at Akoviknak Lagoon, east of Point Hope. Open coast at lower left andlagoon coast at top of picture with brackish wetlands in direct communication withlagoon (large arrow) and fresh wetlands protected from lagoon waters (small arrow)
253

Figure 5-3. Wetlands on mainland shore in southern Kasegaluk Lagoon.River mouth is at top of picture and lagoon shore at bottom.
The physical characteristics of each type are described in Section 4.3.4.
Rock cliffs are important from a biological standpoint in the BSI
because at least some provide nesting habitat for seabirds, often in
large numbers. THe largest colonies are at Cape Lisburne (Figure 5.1)
and Point Thompson. Other rock cliff areas similar to those at Corwin
Bluff (Figure 4.1) support smaller seabird colonies. However cliffs like
those at Skull Cliffs (see cover) as not stable enough to provide much
seabird nesting habitat nor are they close enough to adequate
concentrations of food.
Wetlands in the study area can be classified as two principal types
in the shore zone. First are the salt or brackish ones which are usually
in direct communication with the marine or estuarine waters, usually on
the protected lagoon or bay shorelines (Figure 5.2, 4.11). The second,
more extensive, type of wetland are “fresh” ones which are above the
254

usual high water mark and are not usually directly affected by marine or
estuarine waters (Figure 5.2, 5.3). A third type, the freshwater tundra
ponds and lakes, are not included here because they are above the highest
storm surge lines and will not be directly effected by the oil spill
(although people and equipment involved in countermeasures may have an
impact) . The important wetlands are primarily found along Peard Bay,
Kasegaluk Lagoon, Wainwright Inlet and adjacent water bodies.
The brackish wetlands are directly vulnerable to spilled oil being
transported by lagoon or bay waters at normal water levels, i.e., without
the influence of significant storm surges. The **fresh*’ wetlands that are
in the shore zone below the primary storm surge elevation (about 2m above
high water; see Figure 4.17) are vulnerable to oil being deposited there
during storms, where it would remain for long periods (i.e, the Oil
Residence Index is primary or high).
Wetlands, especially the larger ones such as at Icy Cape, are a
biologically important and sensitive habitat for several reasons. They
are biologically important because marsh vegetation such as Puccinellia
phryganodes and P. langeana, Carex subpathacea and other species, algae,
and other aquatic higher plants are the principal food of Black Brant and
a few other species of waterfowl. Several species of shorebirds feed on
organisms in the water, on the bottom, or in the vegetation along the
shoreline. These are vulnerable as described above and’ because the oil
is likely to have a high residence time, the oil could have a
long-lasting effect on the vegetation as well as on the benthic or
planktonic organisms in the water. These impacts in turn could have
substantial effects on the waterfowl, shorebirds, and, possibly
indirectly some fish species which ultimately may effect the human uses
of subsistence hunting and fishing.
Barrier islands and spits range from low, narrow exposed ones that
are frequently overwashed by storm surges and ice to high, wide,
protected ones that are seldom directly affected by marine waters or
ice. The former are typically barren of animals or plants (Figures 4.3,
4.5) and generally do not support resting areas for gulls or waterfowl.
255

However, we did observe a pair of terns nesting on the spit shown in
Figure 4.3. On the other end of the spectrum are vegetated islands and
spits. Figures 4.15, 5.2, 4.6, 4.7 and 5.3 show a continuum from
sparsely vegetated (Figure 4.15) to densely vegetated (Figure 5.3) as a
function of exposure and elevation.
There is a general vegetation zonation pattern on all these vegetated
barrier islands and spits (Wiggins and Thomas, 1962) (Figure 5.4).
Nearest the waterline, especially on the open coast shore are scattered
patches of Honkenya mploides and possibly Mertensia maritima. Above
that is the dune grass, Elymus arenarius, often in dense mats (Figure
4.7). From the barrier island crest toward the protected shore there may
be a variety of grasses (W SPP.), willows (W&x SPP.) and other forbs
or herbs, depending on the elevation and horizontal extent of the area.
Toward the lagoon shore the wetlands begin to dominate and Carex spp.,
Puccinellia spp. and other wetland species dominate the vegetation down
to the waterline.. .
Figure 5-4. Zonation of vegetated shoreline. Mainland side ofSouthKasegaluk Lagoon.
256

For this study, the primary importance of the barrier island and
barrier spit habitats is for waterfowl and gull or tern nesting habitat.
The wetlands are considered separately. The isolated, vegetated barrier
islands generally support more nesting birds than barren or less isolated
islands and spits. The islands and spits themselves are not identified
as biologically sensitive habitats; instead the BSI is applied only for
areas where the nests have been reported and it was classified as
secondary or moderate.
Tundra cliffs, high (Figure 4.2) or low (Figure 4.10), do not
support important biological resources. In general the tundra community
is above even the storm surge line though tundra behind very low tundra
cliffs (e.g. <2m) may be inundated during the major storm surges.
Deltas (Figure 4.12) in the study area are generally not important
biological shore-zone habitats because most are not vegetated and they do
not support large infauna populations. The various river channels
through the deltas may be important however to anadromous fish,
especially as overwintering areas or juvenile rearing areas.
In summary, wetlands were the only habitat on the Chukchi Sea coast
classified biologically sensitive on a blanket basis. The level of
concern for the BSI applied to each wetland was based on the size, type,
abundance of vegetation and known or probable use by waterfowl and
shorebirds. The rock cliffs and barrier islands or spits, by themselves,
were not classified biologically sensitive; however, those sections used
by nesting birds were classified as such and appropriate level of concern
for the BSI was applied (see Section 5.5.2).
5.5.2 Species
There are several species or groups of species present in the Chukchi
Sea coastal zone that are generally considered important, most of them
because they are subsistence species. The principal list of species
which are considered vulnerable ~ sensitive to an oil spill and thus
classified as biologically sensitive is small. The rationale for

applying the BSI to these few species and not others is presented in this
section.
Anadromous fish may use the lagoons, bays, estuaries, deltas and
small river mouths as well as the nearshore zone for various of their
life history activities (Craig 1984). However, based on the few data
available, the populations of most species appear to be small and
scattered in time and space and they do not appear to comprise a major
biological resource in the northern Chukchi Sea. Therefore, the
anadromous fish population and habitats were not included in the BSI
(although the subsistence use of fish is included in the HUI; Section
6.0).
Spotted seals, walrus, and beluga whale are the most important marine
mammals on or near the shore zone in the ice free season. The few walrus
haul out near Cape Lisburne while seals haul out on numerous beaches,
especially on barrier islands of Peard Bay and Kasegaluk Lagoon (Frost et
al. 1983). There are no pinniped rockeries on land in the study area, so
only juveniles and adults may be affected within the shore zone. Beluga
whales are abundant in the ice free season in passes and the mouths of
major rivers. All these marine mammals would be highly vulnerable to oil
on or near the shore zone or in the lagoons. However, pinnipeds and
whales are not considered very sensitive to oil (Geraci and St. Aubin
1980 1982, Geraci and Smith 1976 1977, Geraci et al. 1983, Davis and
Thomson 1954, St. Aubin et al 1985) except under restrictive (and
unrealistic) scenarios or experimental conditions. Therefore, they were
assigned a BSI with a tertiary level of concern and not identified except
in the Coastal Resource Tables (Part III).
Shorebirds, except for phalaropes, spend most of their time wading or
on the shoreline and therefore are not likely to become oiled
sufficiently to cause mortality. However, they do feed in the intertidal
areas as well as the coastal wetlands and may ingest tainted prey.
Shorebirds are only considered moderately vulnerable or sensitive to oil
at the most. The likelihood of a major decline in population numbers of
258

shorebirds subjected to an oil spill is low, due t-o the large numbers of
birds and their wide distribution in the study area. Local phalarope
populations may suffer substantial mortality at the oil spill site but
the species is abundant and widely distributed so regional populations
are not likely to be substantially affected (Roseneau and Herter 1984).
Shorebirds were not included directly in the BSI, however the importance
of many wetlands was influenced by their expected importance to the
shorebirds (Peter Connors, Bodega Research Associates, personal
communication) .
Several species of seabirds (alcids, kittiwakes, gulls, terns) and
waterfowl (e.g. eiders, brant, oldsquaw) spend much to most of their time
on or in the marine and lagoon waters of the study area, and are thus
vulnerable to nearshore spilled oil. Most are also considered moderately
to highly sensitive to oil.
The vulnerability and sensitivity of seabirds and waterfowl are
determined by the following characteristics:
Vulnerability
e resting behavior
e feeding behavior
~ flocking behavior
e nesting behavior
@ breeding distribution
Sensitivity
e individual response to oil
@ life history characteristics
~ population size
Vulnerability of Seabirds
The vulnerability of seabirds such as Common and Thick-billed Hurres,
which spend a large amount of time resting on the water within the study
area are po~entially more vulnerable to oil than those, such as the
259

Glaucous Gull, which rests on land. Some seabhks, such as the
Black-1egged Ki.ttiwalees, often feed offshore outside the study area and
are less likely to encounter oil than speci.es$ such as the cormorants,
which forage nearer the coast or oldsquaw which molt in protected lagoons
and bays. Another consideration with respect to feeding behavior is the
mode of feeding. Diving birds (e.g. puffins and murres) are more likely
to become completely oiled compared to terns or gulls which do not dive
for food, feeding instead on the surface or on land as predators. Some
species, such as the alcids, typically form large flocks in the vicinity
of their nesting colonies, thus increasing the likelihood that a large
number of birds would be impacted by an oil spill reaching the study
area. Brant and oldsquaw, when they are migrating and molting also
congregate in large flocks thereby making a substantial portion of the
population vulnerable to nearshore spilled oil. Nesting eiders,
cormorants, and gulls tend not to form large flocks and are broadly
distributed, decreasing their vulnerability.
Sensitivity of Seabirds
The sensitivity of marine birds to oil has been amply documented in
the literature and information relevent to aquatic birds is summarized by
Roseneau Herter (1984). The effects of oiled pltuna~e on marine birds
will vary depending upon the type of oil, degree of contamination,
quantity of oil absorbed, environmental conditions, and condition of the
bird (Ohlendorf et al. 1978). Most of the immediate mortality of marine
birds upon contact with oil results from contamination of the feathers.
Oiling of a bird’s plumage leads to an increase in metabolism and to
potentially fatal hypothermia due to increased loss of body heat to the
surrounding water. Oiling of the plumage can also lead to mechanical
inability to fly or to forage underwater. Ingestion of oil during
preening of contaminated feathers can result in inflammation and
hemorrhaging of the intestine, impairment of the liver and kidney,
interference with ion transport and water balance, and decrease in growth
and reproductive potential.

Reproductive success may be lowered because adult birds may not
replace eggs that have died as a result of petroleum products, as they
normally do when clutch losses follow natural causes (Patten and Patten
1978) . 7.’h.e main loss in reproduction probably occurs as a result of oil
contamination of the eggs. Oil that adheres to the feet or feathers of
adult birds may be transferred to eggs during the process of egg laying
and/or incubation (Szaro et al. 1976, Holmes and Cronshaw 1978, Coon et
al. 1979, Patten and Patten 1978, Eastin and Hoffman 1978).
In addition to the sensitivity of individual birds to oil, life
history characteristics are important in determining the level of
sensitivity of birds, especially at the population level. Seabirds
generally have long lifespans, low adult mortality rates, relatively late
sexual maturity, and small clutch sizes (Sowls et al. 1980). Loss of a
substantial number of breeding adults could affect the breeding
population of a particular species for decades. Wiens et al (1979)
modeled the short- and long–term effects of oil to seabirds in Alaska and
detemnined that adult mortality was most critical to the seabirds
studied. Recovery time of the populations studied to pre–impact levels
was estimated to be on the order of decades. This can be attributed to
the life history traits of seabirds, which are not particularly conducive
to rapid recovery from catastrophic events affecting breeding age
adults. This is less of a problem for waterfowl.
For this study, the waterfowl nesting areas and seabird colonies were
included in the BSI. Colonies reported to be larger than or equal to 50
nesting pairs of birds of all species were arbitrarily assigned a primary
level of concern while all smaller colonies were assigned a secondary
level of concern. We recognize there may be large year-to-year
fluctuations in numbers of nesting birds (which supports our concern that
the BSI be used for ~ priori planning but that the actual conditions
should be checked at the time of the spill. The seabird colonies on
rocky cliffs near and south of Cape Lisbume and waterfowl nesting areas
on barrier spits and islands were selected for the BSI because they are
reasonably predictable in space; i.e. , they are “real-estate oriented”.

Large concentrations of oldsquaw, brant, eiders or seabirds feeding,
or molting and staging in lagoon or offshore waters ‘were not included in
the BSI, even though they are highly vulnerable and sensitive. It is
simply not practical to predict the temporal or spatial distribution of
these flocks except in very broad terms, which is not useful for a priori
countermeasure planning.
5.6 RESULTS
The ‘primary, secondary and tertiary Bological Sensitivity Index is
mapped for the northern Chukchi Sea Coast, including major lagoon, bay
and inlet shorelines. About 5 percent of the shoreline is classified
primary concern in an oil spill (Table 5.1) and most of this (3.8
percent) is on the Kasegaluk Lagoon coast of the central region (Table
5.2). The areas of primary concern in the central region are the major
wetlands, especially in the Icy Cape region, and the larger bird nesting
areas, espcially for eiders or terns. In the southern region, the main
areas of primary concern are the seabird colonies on rocky cliffs,
particularly Cape Lewis, Cape Lisburne and Point Thompson as well as
several smaller colonies. In the northern region, no areas of primary
concern were identified (Table 5.1) because there are few wetlands and no
significant seabird colonies or waterfowl nesting aqeas.
The secondary level of concern was applied to 11.3 percent of the
shoreline. The majority (5.8 percent) is in the southern region and
associated with the bird use of Elarryatt Inlet (4.2 percent; Table 5.2).
The rest (1.6 percent) in the southern region is associated with small
seabird colonies and lagoons or estuaries. Similar proportions of the
northern and central regions are classified as secondary level of concern
(2.8 and 2.7 percent, respectively) primarily for smaller wetlands and
smaller bird nesting areas. The reader should note that the 13SI
secondary level of concern shown on area water areas of Peard Bay, Kugura
Bay, Wainwright Lagoon, Kasegaluk Lagoon and Marryatt Inlet is not
included in Tables 5.1 or 5.2.

Table 5.1. DISTRIBUTION OF BIOLOGICAL SENSITIVITY INDICES ON THE NORTHERNCHUKCHI SEA COAST
Level of ConcernRegion =rirndry (%) Secondary (%) Ter tiary (%)
Northern o 2.8 29.5
(Maps 1-321
Central 4.0 2.7 38.0(Maps 33-58)
Southern 1.0 5.8 16.2(Haps 59-84)
Total* 5.0 11.3 83.7— --
*Total coastline length 1523 km
Table 5.2. DISTRIBUTION OF BIOLOGICAL SENSITIVITY INDICES ON THE NORTHERNCHUKCHI SEA COAST AS A FUNCTION OF EXPOSURE
Level of ConcernPrimary (%) Secondary (%) Tertiary (%)
Region Open Coast Lagoon Open Coast Lagoon Open Coast Lagoon—
Northern o 0 1.0 1.8 12.5 17.0(Maps 1-32)
Central 0.2 3.8 0.8 1.9 12.1 25.9(Maps 33-58)
Southern 0.8 0.2 1.6 4.2 14.3 1.9(Haps 59-84)
Total* 1.0 4.0 3.4 7.9 39.0 44.7
*Total coastline length 1523 kmLagoon coastline length 864 kmOpen coast coastline length 659 km

Most (83.7 percent) of the shoreline is classified as tertiary or low
level of concern (Table 5.1). This reflects the general lack of suitable
habitat for most species and probably the general low abundance of food
resources in the area for waterfowl, seabirds, fish, or marine mammals.
5.7 SUMMARY
Oil spill impacts in the open water season are likely to be ‘high for
about 5 percent of the shoreline. Most of these areas are wetlands in
Kasegaluk Lagoon or’ adjacent water bodies where the ORI is primary or
secondary; i.e., any oil that gets to these biologically sensitive areas
is likely to persist for several seasons. The other areas are waterfowl
nesting areas or seabird colonies which are not directly vulnerable
(although the nesting areas on barrier islands could be directly affected
if the oil spill occurred during a significant positive storm surge that
overwashed the island or spit).
Over 11 percent of the shoreline is classified as secondary concern,
primarily on the basis of smaller wetlands and smaller bird nesting or
seabird colonies. Any one of these areas may be as vulnerable or
sensitive as those classfied as primary level of concern, but on an
individual basis they are considered less important to the success of the
population.
That nearly 84 percent of the shoreline is classified tertiary level
of concern supports the general notion that most of the northern Chukchi
Sea coast is not particularly productive especially when compared to the
adjacent Beaufort and Bering Seas (Truett, 1984).

6.0
HUMAN USE SENSITIVITY
6.1 BACKGROUND ON HUMAN USE SENSITIVITY
The sensitivity of human resources to an oil spill is a function of
(a) spill characteristics, (b) vulnerability or risk that the resource
will be impacted and (c) the importance of the resource. The human use
sensitivity evaluation is similar in many ways to the biological
sensitivity evaluation because many of the human uses of the Chukchi Sea
shoreline are directly or indirectly based on biological resources. The
major difference is that human use sensitivity explicitly includes
peoples’ perceptions and importance values in the level of concern
applied to each coastal resource or area.
While large areas associated with each village are utilized, certain
areas are more important than others. “Importance’* depends on proximity
to the village(s), use or harvest levels, and uniqueness of the human
resources. In areas close to communities or of importance to local
residents, perceptions of potential impact may actually exceed real
impact. However, the concern over potential impact is very real and has
been often the principal criterion in responding to an oil spill event.
The impact on certain human resources, such as subsistence species,
may be closely related to biological sensitivity and oil persistence in
shoreline types. The human use sensitivity analysis does not directly
incorporate those analyses. However, when using resource and sensitivity
maps, areas of high subsistence sensitivity often coincide with areas of
high biological sensitivity and oil persistence. In addition, the human
use analysis does not include the effectiveness of oil spill
counter-measures or cleanup techniques.
6.2 DEVELOPMENT OF THE HUMAN USE SENSITIVITY INDEX (HUI)
The human use sensitivity index (HUI) has been developed for the
following human resources of the Chukchi Sea coastal environment:
(a) residential (communities), (b) transportations, (c) recreation
(special use) , (d) subsistence, and (e) cultural resources. The first
three resources are relatively fixed in location, and, once established,
the levels of concern or sensitivity values for these uses (e.g. presence
of a house) should not vary much over time or on a seasonal basis.
However, the location and harvest of subsistence resources and the
importance of their contribution to the community varies significantly on
a month-to-month basis and from year to year. This variation and
limitations to available data require some subjectivity in developing
sensitivity classifications. Cultural resources are also fixed at
specific areas. However, the importance of the same resource in
different areas can vary widely, and the specific location can influence
sensitivity to spill persistence and cleanup activities.
The vulnerability of resources and uses to oil spill impact !s an
important aspect of sensitivity. Some of the human uses are directly
vulnerable to oil spill impacts; i.e., spilled oil could directly contact
the resource or interfere with the activities of interest to people.
These uses include most of the subsistence hunting and fishing
activities, recreation where it depends on shoreline use or access, and
transportation. The recreation and transportation uses are most likely
to be affected during the containment and cleanup which may involve an
increase in people and vehicle activities and thus interference with
these uses. The subsistence hunting and fishing activity may be directly
affected because oil could ruin nets, foul boats, and generally be
unpleasant to work around; however, few of the resources except waterfowl
themselves are likely to be directly affected. Increased activity
associated with spill cleanup may also cause subsistence resources to
avoid the area.
Some human uses are not likely to be directly affected (vulnerable};
i.e., oil on the water or shoreline is not likely to directly contact
villages, military operations, most cultural resources, or even many
recreation or transportation uses. However, the oil spill cleanup
operations may have a major impact on these human uses, especially if
large amounts of equipment and number of people are moved into the area.
Development of the human use sensitivity index incorporates the
following human use criteria:
~ frequency of human use and presence
e relative distribution and abundance of the resource
o proximity of the resource to communities
o importance of the resource to local residents (cultural
significance, contribution to diet)
e characteristics of the oil spill (e.g., size, type of oil,
location of spill, etc.)
As with the ORI and BSI, the human use sensitivity index is
categorized in three levels of concern. They are defined as follows:
~ Primary Concern - Important or intensive human-use activities
likely to be disrupted for one or more
open–water seasons.
o Secondary Concern – Moderate impact of some human-use activities
for some portion of one open-water season.

e Tertiary concern - Non-intensive human-use activities unlikely
to be impacted for m o r e than a short period
of one open–water season.
Each explicitly identified human use resource is displayed on the
coastal resource maps. It has one of the three levels of concern
associated with it. If it is a primary or secondary level of concern,
then the seasonal characteristics are shown on the “’Seasonal Variability
of Indices” table for each map (Part II). Finally, in Part IIIJ there
is additional site-specific information regarding the type, distribution,
and seasonal use of each explicitly identified human use resource
6,3 APPLICATION OF THE XUHA.N USE SENSITIVITY INDEX
6.3.1 Residential Areas (Villages)
All four villages in the study area are classified as primary level
of concern or primary sensitivity areas. The villages are the centers of
permanent population and the sub-regional transportation hubs. The
residences border on the shoreline and the residents use the shoreline
for boat and gear storage.
potential impacts from an oil spill event include property damage
(land, boats, gear), aesthetic impacts, increased human and machinery
activity related to oil spill cleanup, and constraints to boat and
shoreline transportation. Relevant sensitivity factors include high
levels of human presence and use activities, and limited distribution of
habitation and boat storage sites.
6.3.2 Transportation Sites
Areas of primary, secondary, and tertiary levels of sensitivity have
been classified within the study area.
Of primary concern are boat storage areas, and three–wheeler
subsistence access ‘routes in immediate proximity to a village. Of
secondary concern are the less-frequently used three-wheeler subsistence
access routes. The airports and barge landing areas transportation sites
are of tertiary concern to an oil spill event.
PotenLlal impacts on transportation sites from an oil spill event
include fouling (short-term and long–term) of equipment and increased
traffic interference caused by containment and cleanup actions. Oil
fouling can affect boats stored on beaches or moving through spill
contaminated waters, and three–wheeler traffic on spill-contaminated
beaches. These impacts would tend to be short-term (under one oper) water
season and until cleanup activities are completed), except in areas where
a shoreline type results in increased oil persistence. Interference with
transportation activities can result from spill mobilization and actual
containment and cleanup actions (boom deployment, oil recovery from a
shoreline). Interference activities are likely to be short-term in
nature, i.e., for the duration of containment/cleanup activities and less
than one open water season.
6.3.3 Recreation Areas
The “recreation*’ or special use areas have been classified as of
primary and secondary sensitivity. Primary concern areas are those
(a) intensively used for specific activities in close proximity to a
village, (b) limited in abundance and distribution, or (c) of great
importance to village residents from traditional use. The secondary
concern areas are less intensively used, further from villages, and more
widely distributed (i.e., encompassing a large stretch of coastline).
Potential impacts include fouling and interference with use from
containment and cleanup activities. Fouling can affect shorelines,
structures, and stored equipment in these areas. Containment and cleanup
activities may interfere with or prevent use of these areas. Both
categories of impact may also be aesthetic in nature, diminishing value
of the use areas. Kiowever, all impacts are likely to be short-term (less
269
than open water season and/or the duration of containment/cleanup
activities) .
6.3.4 Subsistence Resources
Subsistence resources and harvest aresis are classified as primary,
secondary, and tertiary concern. Primary concern is designated for areas
of intensive use, areas in close proximity to villages, resources of
importance to village residents, and resources of limited distribution
and abundance. Secondary concern is assigned to resources which are of
importance to local residents but are more widely distributed and are
more abundant, or which are further away from villages. Tertiary concern
is assigned to resources/harvest areas that are relatively abundant or
widely distributed or to resources of lesser importance to specific
villages.
This system accounts for differences in harvest patterns and reliance
on resources by individual villages. Potential impacts include fouling
of resource habitat, toxicity to subsistence resources, interference with
subsistence activities, and avoidance of the spill area by subsistence
resources. Oil fouling of subsistence resource habitat, especially
wetlands, can occur; these impacts are discussed under the Biological
Sensitivity Analysis (Section 5.0). Fouling can result in contamination
and/or destruction of subsistence resource habitat, toxicity to
organisms, and cause organisms to avoid the spill area. The duration of
contamination effects to waterfowl and shorebird nesting habitat and fish
spawning and rearing areas would depend on the size, age~ or life history
stage of the organisms affected and the persistence of oil in the
habitat. Avoidance of the areas contaminated would depend on how long
oil is present, a function of cleanup by man (Section 6.0) and the
natural persistence of oil (Section 4.0).
Spill containment and cleanup activities can interfere with access to
and harvest of subsistence resources, depending on location. Fouling of
gear (boats and nets) needed for subsistence activities is also a
possibility. Activity associated with spill containment and cleanup
could also cause subsistence resources (i.e., whales, birds) to avoid the
area of activity.
6.3.5 Cultural Resources
All cultural resources listed in the State of Alaska’s Alaska
Heritage Resource Survey (AHRS) and the North Slope Borough’s Traditional
Land Use Inventory (TLUI) have been classified as of primary
sensitivity. There has not been an intensive inventory of cultural
resource sites in the study area, and additional undiscovered sites most
likely exist. These sites are equally protected by legislation.
Potential impacts to cultural resources include site contamination by
oil and damage resulting from containment and cleanup activities. Oil
contamination of artifacts and structures will vary in impact depending
on their nature and value. Natural removal of oil may mitigate impact.
Containment and cleanup activities with their associated vehicle and foot
traffic, represent the greatest potential for impact. Disturbance of the
site can impact the ability to understand site significance. Traffic and
removal of contaminated soil can damage or destroy artifacts and
structures. Unauthorized removal of artifacts and cultural resources can
also result during spill containment and cleanup activities.
6.4 METHODS
6.4.1 Literature Survey
Unlike the Oil Persistence and Biological Sensitivity Indices, the
Human Use Sensitivity index was prepared using existing literature and
related study programs being sponsored by the Minerals Management
Service. Recent studies include Alaska Consultants et al. (1983) ,
Maynard-Partch et al. (1982), Nelson (1981), Lowenstein (1981), and
Pedersen (1976). Reports were reviewed to obtain the following data:

@ distribution and abundance of uses and resources
@ timing and frequency of uses and resource harvests
o importance of resources and uses to village residents
e regulatory requirements
Data obtained were summarized is Section 2.3, displayed on the
Resource Haps (part II), and presented on the Coastal Resource Tables
(Part III).
6.4.2 Hap Development
TWO sets of Human Use maps have been developed much as described for
the OR1 and ~S1. The resource maps portray tlie irtfor-mat~on from
Section 2.3, under the categories of Residential (V), Transportation (T),
Recreational (R), and Subsistence (S) (part II). The nature of the
resource and seasonal characteristics are presented in the accompanying
resource tables (Part III). The Human Use Sensitivity Map (part II)
displays the sensitivity index developed in Section 6.2 and applied in
Section 6.3.
6.5 RESULTS
The primary, secondary and tertiary Human Use Index is mapped for all
sections of the northern Chukchi Sea coast, including major lagoon
shorelines. The results show that only about 7 percent of the coastline
is considered of primary concern in an oil spill (Table 6.1). Most of
the areas of primary concern are along the open coast (5.4 percent)
(Table 6.2). Most are associated with the major villages and nearby
subsistence areas especially those used for waterfowl hunting and egg
gathering. The high recreational use of the shoreline near Barrow, the
larges~ village accounts for some of the increased primary level of
concern in the northern region compared to the central or southern
regions (Table 6.1).
The secondary level of concern accounts for only about 1 percent more
of the coastline (Tale 6.1). The majority is on the open coast and
272

Table 6.1. DISTRIBUTION OF HUHAN USE INDICES ON THE NORTHERN CHUKCHI SEA COAST
Level of ConcernRegion - Primary (%) Secondary (%) Tertiary (%)
Northern 3.4 1.5 27.6(Maps 1-32)
Central 1.6 5.6 37.5(Maps 33-58)
Southern 1.6 3.4 17.4(Maps 59-84)
Total* 6.5 10.5 83.0
* Total coastline length 1523 km
Table 6.2. DISTRIBUTION OF HUMAN USE INDICES ON THE NORTHERN CHUKCHI SEA COASTAS A FUNCTION OF EXPOSURE
Level of ConcernPrimary (%) Secondary (%) Tertiary (%)
Region Open Coast Lagoon Open Coast Lagoon Open Coast Lagoon
Northern 2.4 1.0 1.0 0.5 10.2 17.4(Maps 1-32)
Central 1.3 0.3 2.0 3.6 10.0 27.5(Maps 33-58)
Southern 1.6 0 3.4 0 11.6 6.3(Maps 59-84)
Total* 5.4 1.4 6.4 4.1 31.8 51.2
* Total coastline length 1523 kmLagoon coastline length 864 kmOpen Coast coastline length 659 km
273
related to subsistence access and subsistence hunting and fishing.
However, the reader should note that the HUI secondary level of concern
shown in the open water areas on the maps covering Peard Bay, Kugrua Bay
(Haps 11-19), Wainwright Lagoon (Maps 23-30), Kasegaluk Lagoon–Avak Tnlet
(Haps 33-s4) and Harryatt Inlet (Map 79) is not included in the data
presented in Tables 6.1 or 6.2.
The remaining 83 percent of the shoreline is classified as
or low level of concern (Table 6.1). This reflects the sparse
terbiary
population, the small number of communities present in a long (1523 km)
coastline, and the difficulty of traveling long distances from these
communities on a regular basis.
6.6 SUMMARY
The oil spill impacts on the human uses of the Chukchi Sea coastline
during the open water season are likely to be high in only about 7
percent of the area. Most of these areas are along the open coast where
oil residence is typically low (Table 4.9). The major human uses in
these areas classified primary concern are villages, access to nearby
subsistence areas, and some subsistence fishing or hunting, especially
for waLcrfowl. Depending upon the circumstances of the spill, the oil
residence may be very short and the level of concern may be less than
predicted.
Oil residence is typically higher on the lagoon shorelines (Table
.4.9), but the human uses of most of the lagoon shores is typically less
important (Table
few of the major
6.2) except in the immediate vicinity of villages and a
passes.

7.0
OIL SPILL COUNTERMEASURES
7.1 INTRODUCTION
The primary objectives of this study are to identify (a) ~ coastal
resources are sensitive to an offshore oil spill, (b) where they are
located and (c) - they are sensitive. This study does @ evaluate
the risk that oil spill will occur and the probability that the sensitive
resources will be oiled. In addition to the vulnerability and
sensitivity analyses described in previous chapters, a complete risk
analysis would also require assessment of: (a) the probability of an
offshore oil spill occurring, (b) the probability that oil would be
transported to the shore, (c) the probability that oil would reach
sensitive environments and/or the probability that the resource would be
present, and (d) the effectiveness of oil spill countermeasures.
This section provides an overview of oil spill risks and impacts and
a review of potential spill countermeasures for the various shoreline
types along the Chukchi Sea coastline.
7.2 OVERVIEW OF OIL SPILL IMPACTS
An indication of the potential for spilled oil to reach sensitive
environments, most of which are located behind barrier beaches, can be
estimated by evaluating the storm surge elevations along the Chukchi Sea
coast.
275

Storm surge measurements indicate that the upper storm surge
elevations are almost all two meters or more above high tide
(Figure 4.17) even though the normal astronomical tidal range is less
than 20 cm. Observations of surges along the coast indicate that these
surges are associated with strong westerly or southwesterly wind events
which drive an onshore transport (Wiseman et al., 1973). Coastal
currents are primarily to the north during these wind events. Our field
observations suggest that storm surges are greatest in the northern and
eastern portions of the lagoons during these wind conditions.
Given the fact that storm surges occur in association with net
onshore (westward) transport, there appears to be a strong potential for
oiling of the shoreline to occur concurrently with a storm surge event.
Furthermore, potential for oiling of the biologically sensitive
environments such as wetlands, which are primarily confined to the
lagoons, would be greater in the north and eastern portions of lagoons.
Many of the wetlands, which are the most sensitive resource in terms of
impact potential, occur approximately 1 m above mean water level and
would require a 1 m plus surge event to be oiled.
Further observations of Kasegaluk Lagoon during a storm surge event
suggest that water inflow during storms is primarily through southern
inlets whereas outflow is through northern inlets (Wiseman et al.,
1973) . These observations suggest that oil would have to enter through
the southern inlets of Kasegaluk Lagoon to reach the sensitive wetland
areas around Icy Cape or at the northern end of the lagoon.
Major storms which may cause storm surge events during the open water
season are relatively rare. Wind data from the Chukchi Sea - Beaufort
Sea Climatological Atlas (Brewer, et al 1977) indicate that winds in
excess of 34 knots occur less than 1 percent of the time between January
and October and 1 to 3 percent of the time in November.

Therefore, in the unlikely event of a major oil spill (>1,000
barrels), there is a strong possibility that oil would not reach the
coastline and even a stronger possibility that oil would not reach the
sensitive environments, even without mitigation.
7.3 SEASONAL INFLUENCE ON OIL SPILL COUNTERMEASURES
When an offshore oil spill threatens to contaminate a nearby
shoreline, a typical sequence of response actions is:
@ containment of oil at the spill site using booms and cleanup of
contained and uncontained oil using skimmers and/or dispersents,
@ Protection of sensitive shoreline area using booms, berms, dikes
etc. ,
● cleanup of contaminated shorelines,
● disposal of recovered oil and of the oily debris and sediment
mixture,
o restoration Of disturbed shoreline areas.
The three seasons in the Chukchi sea would have a major influence on
this sequence. In the winter sea ice season, the sea is covered by ice
floes and the shoreline is covered with land-fast ice. In the
transitional season sea ice and land-fast ice is breaking up (Spring) or
forming (Fall). In the open water season (surmner), little or no sea ice
is present. The typical response sequence listed above would only occur
during the open water season.
In the winter sea ice season, an offshore oil spill, especially from
blowout, would initially tend to spread out under the ice sheet with some
oil concentrating in ice fissures, and the remainder pooling in
277

depressions under the ice. Response actions under winter sea ice
conditions would usually be limited to recovery via pumping of oil from
fissures and holes cut into oil pools under the ice.
In the transitional season, an oil spill from a blowout would be even
more difficult to deal with because of the dynamic nature of ice
movement. Spilled oil will tend to concentrate in open leads in the ice,
and the use of conventional booms and skimmers to control and cleanup oil
would be limited to large open leads where oil has collected. In situ——
burning of thick slicks in open leads may also be effective. Dispersants
also may be useful on oil slicks depending upon the nature of the oil.
If a major oil spill occurs during winter sea ice or transitional
seasons, the majority of the spilled oil would probably remain under
the surrounding ice and would have to be cleaned up during the following
open water season. Therefore, the following sections discuss the
effectiveness of cleanup and protection techniques in the open-water
season of the Chukchi Sea.
7.4 OPEN WATER CONTAINMENT AND CLEANUP
In the event of an oil spill from an offshore source in the Chukchi
Sea, the initial response would involve deployment of booms and a skimmer
to contain the spill at its source and to initiate cleanup. Additional
response actions would involve transportation to the site and deployment
of spill containment and cleanup equipment from the industry cooperative
Alaska Clean Seas. It may be practical to disperse the oil slick using
vessel or aircraft dispersant spraying techniques. The effectiveness of
these response actions to contain and cleanup oil on the open sea depends
on the volume of oil spilled, prevailing weather conditions, proximity of
the shoreline to the spill, proximity of sensitive biological or human
use resources, and the time required to mobilize, transport and deploy
oil spill equipment at the spill site. If a major spill occurs during
adverse weather conditions and onshore winds, it is probable that the

spill would contaminate nearby shorelines before the oil could be
contained or dispersed.
7.5 SHORELINE PROTECTION
7.5.1 Methods
The protection of sensitive shoreline areas along the Chukchi Sea
would primarily involve exclusion booming or blocking of lagoon inlets
and estuaries, and dispersing of oil slicks in the vicinity of sea bird
colonies. Almost fifty percent of the Chukchi sea shoreline is comprised
of barrier islands backed by shallow lagoons. The lagoons can be
protected from oil contamination by placing exclusion booms across the
lagoon entrances. The effectiveness of this technique is primarily
dependent on access to the lagoon entrances and the time required to
deploy booms across the entrances.
Rapid access to the lagoon entrances and quick deployment of
exclusion booms could be accomplished using helicopters for both boom
transport and placement. Protection of sea bird colonies from oil slicks
could be achieved by chemically dispersing a threatening oil slick before
it reached the vicinity of the colony. The use of chemicals to disperse
a slick on open water will also serve to protect a shoreline from oil
contamination although most of the shorelines in the vicinity of bird
colonies have low oil persistence levels. Tests in the BIOS experiment
have shown that dispersal of an oil slick with chemical dispersents did
not significantly contaminant an adjacent shoreline while an untreated
oil slick heavily contaminated the shoreline (Owens et al. 1982).
7.5.2 Open Water Season
An extensive section of the northern Chukchi Sea coast has lengthy
estimated oil residence periods (62% of the coastline is a primary or
secondary concern oil residence index). During a spill event, this large
area would receive a high priority in terms of protection. Host of the
high sensitivity shoreline is located inside the major lagoon systems of

the coast, and there is a strong potential for protection of these
sensitive resources. Exclusion booming or diversion booming of tidal
inlets during the open-water season could prevent oil from reaching the
lagoon shorelines. Table 7–1 provides a summary of tidal pass widths and
lagoon shoreline length of major lagoon systems. The data indicate that
with a minimal amount of booming, or in some cases diking, oil could be
excluded from most of the lagoon systems during the open-water season.
Only the entrance to Peard Bay would be difficult to boom because of its
width. Diversion booming, however, would be effective in reducing oil
contamination to Kugrua Bay. Therefore, 77% (732 km) of the Chukchi Sea
shoreline rated either primary or secondary concern in terms of oil
residence time could be protected by exclusion or diversion booming or
diking of the inlets.
Since it is unlikely that an oil spill would impact the entire
coastline simultaneously, only a small number of inlets would have to be
blocked to prevent oil reaching the lagoon shores. The significant point
is that it is possible to prevent oil from reaching a significant
proportion of the “sensitive” shorelines in the northern Chukchi Sea area
during the open water season.
7.5.3 Transition Season
The effectiveness of booming operations during broken ice seasons
(break-up and freeze-up) may be reduced, due to the presence of moving
ice pieces which could damage booms. However, during break up periods
there is a net flow of water seaward through most inlets due to river
runoff. This outward flow which would keep oil from entering the inlets
negating the need for booms. Where landward directed flows do occur,
much of the sea ice grounds on ebb-tidal deltas seaward of the inlets
forming a fairly effective natural barrier to oil intrusion.
7.5.4 Winter Season
Oil transport into the lagoons could occur during the winter but is
considered unlikely. Oil exploration programs are likely to be distant
280

Table 7-1. RELATIONSHIP OF LAGOON SHORELINE LENGTH AND TIDAL PASS WIDTHS
Lagoon Shoreline Tidal Pass Number ofSystem Length (km) Width (km) Tidal Passes
Peard 13ay/Kugrua Bay 115 8.4 2
Kuk River 160 0.3 1
Kasegaluk Lagoon 481 5.8 13
kfarrya~t Xnlet 94 0.2 1
TOTAL 850 14.7 17

from the coast and in the event
be transported as far as during
movement is most likely to move
of an oil spill under ice, oil would not
the open-water season. Also spill
alongshore rather than towards the shore.
Additionally, most of the lagoons are shallow and shorefast ice,
frozen almost to the bottom in many of the passes, would tend to keep oil
from
7.6
entering the lagoons.
SHORELINE CLEANUP FACTORS
Factors influencing the methods used for cleaning oil contaminated
shorelines are:
@ Type of shoreline substrate (i.e. sand, gravel, rock platform
etc.,)
~ Degree of shoreline oil contamination (i.e. light or heavy),
e Availability of
e Availability of
access to the shoreline,
cleanup equipment and manpower,
e Impacts of shoreline cleanup techniques, and
@ Options available for disposal of oil-contaminated material.
These factors all have to be considered in order to select the proper
cleanup technique for an oil contaminated shoreline.
7.7 SHORELINE CLEANUP
Cleanup techniques
can be classified into
TECHNIQUES
applicable to the shorelines of the Chukchi sea
six categories:
a Manual cleanup
@ Heavy equipment cleanup
0 Light equipment cleanup
e Chemical cleanup
o Insitu burning
e Natural Processes.
Logistical support associated with each technique are summarized in Table
7-2. Each technique is described briefly below.
7.7.1 Manual Cleanup
Manual cleanup includes removal of oiled sediments using shovels and
rakes, manual cutting of oiled vegetation and manual application and
removal of sorbents. The use of manual cleanup techniques is usually
limited to areas of light oil contamination or small areas of heavy oil
contamination. The major limitation of manual cleanup is the
availability of adequate manpower especially in remote areas such as the
Chukchi Sea Coast. Manual cleanup can be effective on all types of
shorelines but is time consuming and requires a major logistal effort
(housing, food, etc.) to support the large work crews in the field.
7.7.2 Heavy Equipment Cleanup
Earthmoving equipment is used to either remove oil sediments or to
disc or rototill oiled sediments beneath the beach surface. The use of
earthmoving equipment to cleanup oil contaminated sediment beaches can be
very effective. The major limitations to the use of heavy equipment are
(a) accessibility by land or water, (b) availability of heavy equipment,
and (c) the trafficability of the shoreline (trafficabjlity refers to
whether equipment can operate on a beach without getting stuck).
Additionally, if heavy equipment is used to remove sediment from a
shoreline rather than to disc contaminated material below the beach
surface, then proper disposal of the oiled sediments will be required.
283

Table 7–2. APPLICABILITY OF CLEANUP TECHNIQUES
!3nP
DegreeAccess Equipment Manpower Disposal of Oil
Requirements Requirements Requirements Requirements Contamination
Manual Cleanup
Heavy EquipmentCleanup
Light EquipmentCleanup
Chemical Cleanup
Insitu Burning
Natural Cleanup
Road, vessel,air, or foot
Road or vessel
Road, vesselor air
Road, vesselor air
Road, vessel,Air, or foot
None
Small handtools(shovels,rakes, etc.),cutting tools,sorbents
Earthmovingequipment
Pumps, hoses,hydroblasterssmall booms,and skimmers;storage equip–ment
Spray equippedplanes,truck equippedsprayers orbackpacksprayers
Propane weedburners
None
Large crewsand logisticsupport orga-nization
Severaltrained equip-ment operators
Small crews;2–3 men percleanup site
5–10 persons
3–5 persons
None
Portable in– Light or smallcineration or areas of heavysmall landfill contaminationsite
Large landfill Heavysite contamination
Portable in– Light to heavycineration contamination
None Light to heavycontamination
None Heavycontamination
None Light to heavycontamination
7.7.3 Light Equipment Cleanup
This includes the use of pumps and hoses for low pressure flushing,
and hydroblast equipment for high pressure water cleaning. The use of
low pressure water flushing on vegetated shorelines and on rock is
effective if the oil is not highly viscous and weathered. High pressure
water blasting equipment should only be used on rock substrates, where it
is effective in removing oil but is time consuming. Both these cleanup
techniques require the use of small booms and skimmers or sorbents to
contain and collect the oil flushed from vegetation or rock surfaces.
7.7.4 Chemical Cleanup
Dispersants may be applied manually, by vehicle or by aircraft on an
oil contaminated shoreline. The use of dispersants on oiled shorelines
(sediment or rock) can be very effective for both light and heavy oil
contamination if sufficient wave energy is present to mix the dispersants
and oil. This technique would be particularly effective in remote areas
with limited access as dispersants could be applied to shoreline using
aircraft. The major concern of dispersant use is the direct impact on
the nearshore benthic community and the indirect impact on fish, birds,
and manunals.
7.7.5 In-situ Burning
In-situ burning, the ignition and combustion of oil in place, should
be used only on heavily oil-contaminated, vegetation-covered shorelines,
where oil has already caused damage to the plants. If the oil has not
weathered severely, this technique can be effective. The major
limitation is the potential long–term damage to the plant communities,
however, if the burning is conducted when sufficient water is present to
cover the plant root systems, long-term damage may be minimized.
7.7.6 Natural Cleaning
Leaving oil in place and allowing natural degradation to remove the
oil can be effective in both light and heavy contamination cases if the
shoreline is exposed to mechanical wave action (i.e. open coast) or if
erosion is a major physical process. Natural cleaning would probably be
ineffective on most of the low energy shorelines such as those found
inside lagoons along the Chukchi coast. The major limitation to this
technique is that even on high energy shorelines, natural cleaning may
require weeks to several months to remove most of the contamination. If
the human or animal usage of the shoreline is high, the time required for
natural recovery may be unacceptable.
7.8 EFFECTIVENESS OF CLEANUP TECHNIQUES ON THE SHORE ZONE
Not all of the various cleanup techniques (Table 7.2) are appropriate
in all cases for treatment of shorelines in the study area due to the
uniquely arctic nature of many of the coastal landforms. Appropriate
cleanup techniques for the various shore–zone types that occur on the
northern Chukchi-Sea coast are summarized in Table 7.3 and are discussed
below.
7.8.1 Rock Cliffs
The high wave exposure that occurs along the rocky sections of the
northern Chukchi coast would result in relatively rapid removal of
stranded oil, making the natural cleaning the preferred cleanup
alternative. Light equipment cleanup with high and low pressure water
flushing could be used locally to remove high concentrations of oil.
Chemical treatment could also be used, however, the effectiveness of
natural cleaning and the uncertain biological effects of the dispersant
use make this the least preferred clean-up technique.
7.8.2 Tundra Cliffs
The erosional nature of tundra cliffs make natural cleaning the
preferred technique for treating most tundra cliff shorelines. High
concentrations of stranded oil could occur locally in the gravel and
gravelly sand beaches fronting tundra cliffs, but the high cliff retreat
rate would result in rapid removal of oil from the sediments as the beach
retreats with the cliffs. In general, beaches fronting tundra cliffs are

Table 7–3, SHORELINE CLEANUP METHODS APPLICABLE TO THE CHUKCHI SEA COAST.
Shore Heavy LightZone Manual Equipment Equipment Chemical Insitu NaturalType Cleanup Cleanup Cleanup Cleanup Burning Cleaning
Rock Cliffs
Tundra Cliffs
SedimentBeaches
Barrier Islandswlo vegetatation
Barrier Islandsw/o vegetation
Wetlands
Delta Fronts
-+ + + + + d
+ x + x + +
+ + + +- 4
< Recommended+ Applicable and Possibly UsefulX Not Recommended- Not Applicable
287

too narrow for use of heavy equipment. However, in the Barrow area, the
greater availability of equipment and wider beaches would allow surface
oil concentrations to be scraped by heavy equipment into the surf zone
where natural cleaning by wave action would be more effective. Manual
cleanup may be useful where high concentrations of oil occur or where
rapid oil removal is desirable (e.g., in areas used for recreation or
subsistence access areas around major villages).
7.8.3 Barrier Tslands Without Vegetation
Much of the barrier island coastline is exposed to comparatively high
levels of wave exposure and therefore natural clearing would be most
appropriate. If areas above the normal high water line are oiled,
additional cleanup may be required using heavy equipment or manual
techniques. Access to the islands and disposal of contaminated material
pose potential logistical problems. One means of alleviating disposal
problems is to push contaminated material into the surf zone where
mechanical wave action could disperse the oil naturally.
7.8.4 Barrier Islands With Vegetation
Techniques appropriate to unvegetated barrier islands may also be
used on vegetated barrier islands, although additional care must be used
to prevent damage to the vegetation. Vegetation damage is most likely to
occur with use of heavy equipment. In situ burning would be of limited
usefulness in most dune-like vegetation because of the low vegetation
density.
7.8.5 Wetlands
Wetland areas of the Chukchi Sea coast occur in protected lagoons and
therefore have potentially lengthy oil residence periods. Cleanup in
marsh areas is traditionally difficult, even with manual labor, as
extensive foot traffic can severely damage a wetland. If oil reaches the
wetland areas of the Chukchi coast, low pressure flushing is potentially
the most useful cleaning technique, however, even with this technique
vegetation damage may be a problem.
/ 288
7.8.6 Delta Fronts
A number of river deltas occur in the lagoons of the Chukchi coast
and consist of sand/mud flats backed by vegetated flats. Natural
cleaning of the sandhud flats may occur quickly even in areas of low
wave energy as a result of poor oil-to-sediment adhesion. Oil is likely
to concentrate at the high water line along the delta fronts and could be
cleaned using manual techniques or heavy equipment, although because of
poor access to these areas, and low bearing strength of some of the
sediment, aerial deployment of light-weight equipment may be required.
Low vegetation densities in the upper shore zone would probably reduce
effectivity of in situ burning.
7.9 DISPOSAL OF CONTAMINATED MATERIALS
The two primary options for disposal of oil–contaminated materials
are:
e Burial of oil–contaminated material in a landfill or in the
backshore of the contaminated beach, or
e Burning oil-contaminated material in an incinerator or in place.
There are limitations and problems associated with each of the
disposal options. Burial of contaminated material in a landfill would
involve special construction of a landfill site to isolate the
oil–contaminated material from leaking and causing thermoklast (melting
and erosion of permafrost). It would also require a means of
transporting the contaminated material from the shoreline to the landfill
site, which is usually accomplished by trucks for any significant amount
of contaminated material. Burial of oil–contaminated material in the
backshore of beach is easier to accomplish, however, normal beach erosion
may uncover the oil at a later date and leaking of oil from the buried
sediments to the beach groundwater system could occur.

Burning of oil-contaminated material in an incinerator is technically
feasible but is severely limited by the throughput of most portable
incinerators, which is in the range of approximately 1 ton/hr. In-s itu
burning of oil contaminated shorelines is effective only for oil
contaminated vegetation and is not feasible for oil contaminated
sediments (Owens et al. 1982).
7.10 SUMMARY
Oil is most likely to enter the lagoons and affect wetlands or other
sensitive habitats on the positive storm surges caused by the relatively
rare major storms in the ice-free season.
Most of the effective oil spill countermeasures will be limited to
the open water season. During the winter, most of the spilled oil would
remain offshore under the ice. Though open water containment and cleanup
countermeasures may be practical from a technological standpoint, there
may not be enough time to mobilize, transport and deploy the personnel
and equipment to the spill site before the oil reaches the shoreline.
Therefore, we focussed on shoreline protection methods.
Shoreline cleanup techniques that could be employed during the open
water season include use of manual labor, light or heavy equipment,
chemicals, in situ burning and natural processes. Each has its
advantages and limitations, depending upon the shore–zone type. However,
in many if not most cases, letting natural processes “clean up” the
shorelines may be the most environmentally, if not socially or
politically, effective and acceptable method.

8.0
SUMMARY
Minerals Management Service (MM) requires information on possible
environmental impacts and mitigation of offshore oil and gas leasing
actions in order to resolve multiple-use conflicts and make other
resource management decisions. Specific needs include (a)
characterization of the physical, biological, and human use resources of
the shore zone that influence the effect of or are affected by oil
spills, (b) evaluation of the sensitivity of these resources to an oil
spill, and (c) description of oil spill protection or cleanup
countermeasures.
In this 3–part report, we provide this information for the northern
Chukchi Sea coastline between Pt. Barrow and Cape Thomson (Figure l-l), a
distance of about 675 km (420 miles). The actual shoreline length is
about 1523 km (945 mi), comprised of about 864 km (536 mi) of protected
lagoons, bay, deltas, and estuaries and about 659 km (409 mi) of exposed
open coast (i.e., wind fetch distances are > 10 km). The resource
description and oil spill sensitivity analyses covered the zone between
the lower low water level and the higher storm surge elevations as
defined by the prominent log debris line (> 2.0 m above normal water
levels) (Table 4-7, Figures 4-16 and 4-17).
The physical resources, based on geomorphology, are considered in
terms of three major sections of coastline:
(1) The northern Chukchi Sea coast (Haps 1–32), which lies between
Pt. Barrow and Kasegaluk Lagoon and consists primarily of tundra
cliffs with two major embayment-type lagoons (Peard Bay and the
Kuk River inlet)

(2) ‘fhe KaseRaluk LaKoon coast (Maps 33-58), which consists of 200
km (approximately 110 n mi) of barrier island coastline in the
central portion of the study areat including an extensive
barrier island lagoon system with almost 500 km (approximately
275 n K&) of shoreline
(3) The Cape 53eaufort-Cape Lisburne - Point Hope coast (Maps 59-84),
which lies to the south of Kasegaluk Lagoon and includes a wide
variety of shoreline types from rock cliffs to protected lagoons
The northern Chukchi Sea coast is principally comprised of eroding
tundra cliffs, cut into unconsolidated Quaternary deposits (Table 4-6).
In a few locations Cretaceus sandstone bedrock and coal seams crop out
in the cliffs. Barrier island and spit systems, consisting of gravelly
sand material and mostly without vegetation, occur at Point Barrow and at
Peard Bay. TWO major embayment systems, Peard and Kugrua bays and the
Kuk River Inlet, occur within this coastline section and comprise a
substantial segment of coastline (286 km). Shorelines of these
embayments are comprised primarily of rapidly retreating low tundra
cliffs, interspersed with small gravel spits (Table 4–6). Small river
systems have formed deltas at the mouth of both the Kugrua and Kuk rivers.
The central Kasegaluk Lagoon coast consists of a long (200 km),
narrow barrier island lagoon system with over 475 km of lagoon shoreline
(Table 4-6). Low, gravelly sand, barrier islands lie along the seaward
side of the lagoon. Vegetation occurs sporadically on the barrier
islands to the north of the Icy Cape, suggesting that these barriers are
frequently overtopped during storm surges and are, therefore, more
dynamic than those to the south. Vegetation becomes increasingly common
on the barrier islands to the south of Icy Cape, suggesting greater
stability; on many sections of the barriers, vegetation colonization is
particularly noticeable on old recurve spits formed by northward tidal
pass migration.
292

The lagoon section of this coast includes a variety of coastal
Iandforms, the most common of which is the ubiquitous low tundra cliff
(Table 4-6). Gravelly sand beaches (on the lagoonal side of the barrier
islands), wetlands, mudflats, and delta flats are also comparatively
common features of this coastline. Wetlands occur along the lagoonal
shores of the barrier islands, particularly in southern Kasegaluk Lagoon
and in association with the three major river deltas on the mainland
shore.
The southemost section of the study area, to the south of Kasegaluk
Lagoon, includes a wide variety of coastal landforms, the most prominent
of which is the resistant bedrock cliffs at Cape Lisburne (Table 4-6).
Rock cliffs occur to the east and south of Cape Lisburne, as well as at
Cape Thompson, and comprise approximately 70 km of shoreline. Tundra
cliffs are not uncommon, however, particularly between Cape Sabine and
Kasegaluk Lagoon, comprising an additional 89 km of coast (Table 4-6).
Barrier islands, both with and without vegetation, are extensive on the
Point Hope cape-system and occur locally in association with small
lagoons east of Cape Lisburne. Lagoon coasts occur primarily within the
Point Hope cuspate foreland and consist of low tundra cliffs and gravelly
sand beaches along the barrier islands.
The biological resources can be classified in two non–mutually
exclusive categories–-habitats and species. The principal habitat types
are coastal estuaries and lagoons, wetlands, sand beaches, and rock
cliffs. In summer and fall, the important physical habitat factors
include (1) the required presence of coastal cliffs and barrier islands
for certain nesting and feeding birds, (2) the presence of salt marshes
and mud flats for feeding brant and some shorebirds, (3) the presence of
warm, semi-enclosed lagoon and bay waters for anadromous fishes, (4) the
complexity of mainland and island shorelines in relation to foraging
beach birds, and (5) the proximity to coastal sites of natal streams of
anadromous fishes (Table 2–3).

Though a large number of species or groups of species occur in the
nearshore and shoreline habitats of the study area, a limited number of ‘
birds, marine mammals, and anadromous fish are considered important by
the native groups, public, or decision makers because the species are
protected by regulations or are subsistence species. An even smaller
number are included in the biological sensitivity analysis and include
primarily nesting waterfowl, gulls and terns, and seabird colonies.
These are “real-estate oriented” species’ activities which could be
threatened and protected in oil spill ~ priori planning.
Human resources, defined as resources (i.e., property, public
facilities, subsistence resources, cultural resources), and shoreline
uses (transportation, fishing sites, boat storage) are a major concern
during an accidental oil spill event. Along with sensitive biological
resources and shoreline types, human resources strongly influence
priorities for spill countermeasures.
The study area is located within the boundaries of the North Slope
Borough. Through its coastal management and comprehensive planning
programs, the Borough has expressed concern about potential oil spill
impacts on subsistence resources and activities. Four predominantly
Inupiat Eskimo communities are located along the Chukchi Sea Coast:
Barrow, Wainwright, Point Lay, and Point Hope. Human use patterns of the
coastline can be identified with individual communities, although the
patterns also reflect traditional uses that preceded the formation of
permanent communities. Activities are intense in the immediate vicinity
of each village, and include subsistence hunting and gathering,
transportation (boat traffic and storage on the beach, airstrips with
daily scheduled traffic) and excursions to traditional use sites.
However, local residents travel extensively outside their communities to
harvest subsistence resources, so village use areas extend tens of miles
from the permanent communities.

Other human resources are less identifiable with individual
communities. Because of its long history of human habitation, the
Chukchi Sea coast is rich in cultural resources. This includes
prehistoric, historic, and traditional land use sites. The general
frequency of cultural resources sites is high, and density increases in
areas where the distribution of subsistence resources is concentrated.
Favorable topography, water supply, and other factors have contributed to
human habitation of specific sites over time. Distant Early Warning
(DEW) Line sites also constitute a human resource; several are located in
the study area. Active sites generate air traffic in support of their
mission; inactive sites are often used to support research or resource
exploration teams and can be used during emergencies.
To provide resource managers, decisionmakers, and planners with a
logical basis for determining oil spill countermeasure priorities, the
sensitivity evaluations must be general because of the regional nature of
the study, yet be presented clearly and in enough detail to be useful for
contingency planning. To accomplish this, we developed and applied a
three-level index (primary, secondary, and tertiary level of concern) to
show in map and table formats the (a) Oil Residence Index (ORI),
(b) Biological Sensitivity Index (BSI) and (c) Human Use Sensitivity
Index (HUI). The use of three levels of concern is relatively simple and
useful for resource management or decision making. However, with three
resource types, up to 27 combinations are possible, allowing contingency
planners sufficient detail to develop priorities for oil spill
contingency planning.
The Oil Residence Index indicates how long oil that reaches the
shoreline might be expected to persist. This is important because short
persistence on residence times may reduce the need for (or even the
possibility of) shoreline protection on cleanup countermeasures, and
short residence times may reduce impacts on biological or human use
resources. Expected long residence times, however, may require some
countermeasure actions.
potential oil residence is determined by:
@ Wave exposure
@ Substrate type
e Sedimentation processes
o Oil type
e Spill volume
@ Oil form at impact zone
Many of these parameters cannot be determined until the time of the
spill, so any 3 priori index must be necessarily general. Wave exposure,
substrate type, and sedimentation processes can be evaluated prior to a
spill, however, and provide a basis for developing the oil residence
index.
Based on a detailed inventory of coastal landforms along the Chukchi
Sea and a review of oil persistence studies in other areas, approximately
30 percent of the northern Chukchi Sea coast is expected to have
potentially lengthy oil residence periods (greater than one open–water
season) (Table 4-8). Shore-zone types most susceptible to lengthy oil
persistence are low–energy beaches, wetlands, and river deltas of the
protected lagoon coast. An additional 32 percent is considered to have
variable residence periods, which will depend significantly on
environmental conditions at the time of the spill and on spill
characteristics. Residence periods of oil in the shore zone may range
from a few weeks to more than one open-water season. Shorelines included
in this category are prograding recurve spits near barrier island inlets
and eroding low tundra cliffs which occur along much of the mainland
lagoon coast. The remaining 38 percent of the coast is considered to
have comparatively short oil residence periods and under normal
open-water conditions would probably be self–cleaned in a period of days
to weeks by wave action. Experimental oil spill studies in the Canadian
arctic have shown that exposed shoreline (fetch distances greater than
100 km) can be cleaned rapidly (a few days) despite heavy oiling levels.

Shorelines included within this category are rock cliff, eroding tundra
shorelines along the exposed Beaufort Sea coast, and exposed barrier
island shorelines.
The highest concentration of shoreline where oil persistence is
likely to be high occurs in the central portion of the study area, where
over approximately 500 km of the lagoon shoreline is comprised of
extensive wetlands, river deltas, and low-energy beaches.
The Biological Sensitivity Index (BSI) is a guideline for identifying
which sections of the shoreline rnn be considered sensitive to oil spills
because of the biological resources potentially present. The BSI levels
of concern are defined on the basis of (a) the potential population-level
effect an oil spill could have upon a sensitive *’target” population or
biological resource and (b) the potential recovery time. The BSI levels
of concern reflect the assessment of the vulnerability and biological
sensitivity of the particular population or community of concern.
Vulnerability is the likelihood that some portion of the biological
resource will actively or passively come into contact with oil if the oil
is in the same area as the resource. Vulnerability of a resource or
likelihood of contact involves a qualitative judgment based on abundance,
distribution, and behavior of the biological resource in the area and on
the spill characteristics, as well as weather and oceanographic
conditions. The low, moderate, and high levels of vulnerability reflect
the increasing proportion of the population/community that could come
into contact with oil and the potential increase in the portion of the
population/community potentially lost. Sensitivity is the expected
impact on and response of the biotic resource following contact with
oil. Response is evaluated in terms of potential mortality or diminished
reproductive capacity @ of the resilience of the potentially affected
population/community (i.e., how quickly it is likely to recover from the
oil spill impacts).

Oil spill impacts in the open-water season are likely to be high for
about 5 percent of the shoreline. Most of these areas are wetlands in
Kasegaluk Lagoon or adjacent water bodies where the ORI is primary or
secondary; i.e., any oil that gets to these biologically sensitive areas
is likely to persist for several seasons. The other areas are waterfowl
nesting areas or seabird colonies which are not directly vulnerable
(although the nesting areas on barrier islands could be directly affected
if the oil spill occurred during a significant positive storm surge that
overwashed the island or spit).
Over 11 percent of the shoreline is classified as secondary concern,
primarily on the basis of smaller wetlands and smaller bird nesting or
seabird colonies. Any one of these areas may be as vulnerable or
sensitive as those classified as primary level of concern, but on an
individual basis they are considered less important to the success of the
population.
That nearly 84 percent of the shoreline is classified tertiary level
of concern supports the general notion that most of the northern Chukchi
Sea coast is not particularly productive, especially when compared to the
adjacent Beaufort and Bering seas (Truett 1984).
The Human Use Sensitivity Index (HUI) explicitly includes people’s
perceptions and importance values in the evaluation of sensitivity and
thus to the level of concern applied to each coastal resource or area.
The human use sensitivity evaluation is similar in many ways to the
biological sensitivity evaluation because many of the human uses of the
Chukchi Sea shoreline are directly or indirectly based on biological
resources.
The sensitivity of human resources to an oil spill is a function of
(a) spill characteristics, (b) vulnerability or risk that the resource
will be impacted, and (c) the importance of the resource.
Development of the Human Use Sensitivity Index incorporates the
following human use criteria:

e Frequency of human use and presence
e Relative distribution and abundance of the resource
e Proximity of the resource to communities
e Importance of the resource to local residents (cultural
significance, contribution to diet)
@ Characteristics of the oil spill (e.g., size, type of oil,
location of spill, etc.)
While large areas associated with each village are utilized, certain
areas are more important than others. “Importance” depends on proximity
to the village(s), use or harvest levels, and uniqueness of the human
resources. In areas close to communities or of importance to local
residents, perceptions of potential impact may actually exceed real
impact.
The HUI has been developed for the following human resources of the
Chukchi Sea coastal environment: (a) residential (communities), (b)
transportation, (c) recreation (special use), (d) subsistence, and (e)cultural resources. The first three resources are relatively fixed in
location, and, once established, the levels of concern or sensitivity
values for these uses (e.g., presence of a house) should not vary much
over time or on a seasonal basis.
However, the location and harvest of subsistence resources and the
importance of their contribution to the community varies significantly on
a month–to–month basis and from year to year. This variation and
limitations to available data require some subjectivity in developing
sensitivity classifications. Cultural resources are also fixed at
specific areas. However, the importance of the same resource in
different areas can vary widely, and the specific location can influence
sensitivity to spill persistence and cleanup activities.
The oil spill impacts on the human uses of the Chukchi Sea coastline
during the open–water season are likely to be high in only about 7

percent of the area. Host of these areas are along the open coast where
oil residence is typically low (Table 4–9). The major human uses in
these areas classified primary concern are villages, access to nearby
subsistence areas, and some subsistence fishing or hunting, especially
for water-fowl. Depending upon the circumstances of the spill, the oil
residence may be very short and the level of concern may be less than
predicted.
Oil residence is typically higher on the lagoon shorelines (Table
4-9), but the human uses of most of the lagoon shores is typically less
important (Table 6–2), except in the immediate vicinity of villages and a
few of the major passes.
Oil is most likely to enter the lagoons and affect wetlands or other
sensitive habitats on the positive storm surges caused by the relatively
rare major storms in the ice-free season.
Most of the effective oil spill countermeasures will be limited to
the open water season. During the winter, most of the spilled oil would
remain offshore under the ice. Though open–water containment and cleanup
countermeasures may be practical from a technological standpoint, there
may not be enough time to mobilize, transport, and deploy the personnel
and equipment to the spill site before the oil reaches the shoreline.
Therefore, we focussed on shoreline protection methods.
Shoreline cleanup techniques that could be employed during the
open–water season include use of manual labor, light or heavy equipment,
chemicals, in situ burning, and natural processes. Each has its
advantages and limitations, depending upon the shore-zone type. However,
in many if not most cases, letting natural processes “clean up*’ the
shorelines may be the most environmentally, if not socially or
politically, effective and acceptable method.
300
9.0
REFERENCES
Alaska Consultants and S. Braund. 1984. Socio-cultural and SocioeconomicStudies of the Chukchi Sea. Prepared for Minerals Management Service,Anchorage, Alaska, 347 pp.
Barber, F. G. 1971. An Oiled Arctic Shore, Arctic 24(3): 229.
Bartonek, J. C. and C. J. Lensink. 1978. A Review of the Literatureand a Selected Bibliography of Published and Unpublished Literatureon Marine Birds of Alaska. Final Report. OCSEAP . vol. 1.Biological Studies, pp. 108-204.
Beikman, H. M. and E. H. Latham. 1976. Preliminary Geologic Map ofNorthern Alaska. U.S. Geological Survey, Miscellaneous Field StudiesMap EiF 789.
Black, 1?. F. 1969. Geology, Especially Geomorphology, of NorthernAlaska. Arctic 22(3): 283-299.
Blount, A. E. 1978. Two Years after the METULA Oil Spill, Strait ofMagellan, Chile: Oil Interaction with Coastal Environments.De@. No. 16-CRD, Coastal Res. Div., Dept. Geol., UniversityCarolina, Columbia, 214 pp.
Braham, H. W., W. M. Marquette, T. W. Bray and J. S. Leatherwood1980. The Bowhead Whale: Whaling and Biological Research.Fish. Rev. September-October, pp. 1-96.
Tech.of South
(eds.).Mar.
Breuel, A. 1981. Oil Spill Cleanup and Protection Techniques forShorelines and Marshlands. Poll. Tech. Review No. 78. Noyes DataCorporation, Park Ridge, New Jersey, 404 pp.
Brewer, W. A., H. F. Diaz, and A. S. Prechtel. 1977. Marine and CoastalClimatic Atlas. In Climatic Atlas of the Outer Continental ShelfWaters and Coasta~Regions of Alaska. Volume 111. Chukchi-BeaufortSea. U.S. Department of Commerce, National Oceanic and AtmosphericAdministration, Alaska OCSEAP Final Report Res. Unit 347.Anchorage: Arctic Environmental Information and Data Center.University of Alaska, pp. 28-407.
13urch, E. S. Jr. 1981. The Traditional Eskimo Hunters of Pt. Hope,Alaska. Prepared for North Slope Borough, Barrow, Alaska.
Childs, H.E., Jr. 1969. Birds and Mammals of the Pitmegea River Region,Cape Sabine, Northwestern Alaska. Biol. Pap. Univ. Alaska 10:1-76.
301

Connors, P.G. and R.N. Ri.sebrough. 1977. Shorebird Dependence onArctic Littoral Habitats. In: Environmental Assessment of theAlaskan Continental Shelf (~nual Reports), Vol. 3:402-524,
Connors, P.G., C.S. Connors, and K.G. Smith. 1982. Shorebird LittoralZone Ecology of the Alaskan 13eaufort Coast. Final Report submittedto OCSEAP.
coon, N.C., P.H. Albers and R.C. Szaro. 1979. No. 2 Fuel Oil DecreasesEmbryonic Survival of Great Black-Backed Gulls. Bull. Environ.Contain. Toxicol. 21:152-156.
Craig, Peter. 1984. Fish Resources. ed. J. Truett. The Barrow ArchEnvironment and Possible Consequen~s of Planned Offshore Oil and GasDevelopment. Proceedings of a Synthesis Meeting. OCSEAP, NOAA,Anchorage, AK. pp. 117-131.
Craig, P. C. and P. Skvore. 1982. Fish Resources of the Chukchi Sea:Status of Existing Information and Field Program Design. Preparedfor OCSEAP, Research Unit RU618, Anchorage, Alaska.
Davis, R.A. and D.H. Thomson. 1984. Marine Mammals. ed. J. Truett.The Barrow Arch Environment and Possible Consequenc~ of PlannedOffshore Oil and Gas Development. Proceedings of a SynthesisMeeting, OCSEAP, NOAA, Anchorage, AK. pp. 47-79.
Davis, W. P., G. I. Scott, C. D. Getter, M. O. Hayes and E. R. Gundlach.1980. Methodology for Environmental Assessments of Oil and HazardousSubstance Spills. Helgolander Meeresunters. 33: 246-256.
.Mvoky, G. ..7. 1978. Identification, Documentation, and Delineation ofCoastal Migratory Bird Habitat in Alaska. 1. Breeding Bird Use ofBarren Islands in the Northern Chukchi and Beaufort Seas. AnnualReport of Principal Invest. Volume 1. Receptors - Mammals andBirds, OCSEAP, Boulder, Colorado.
Divorky, G.J. and A.E. Good. 1979. The Distribution, Abundance, andFeeding Ecology of Birds Associated with Pack Ice. Pp. 330-599 In:Environmental Assess.
—of the Alaskan Cont. Shelf, Annual Report,
Vol 1.
East.in, W.C. and D.J. Hoffman. 1978. Biological Effects of Petroleum onAquatic Birds. In: Assessment Ecol. Impacts Oil Spills Conf.,Keystone, CO, June 14-17, 1978. Am. Inst. Biol. Sci.-API -et al.Proc. :pp. 561-82.
Emery, K. O. 1960. A Simple Method of Measuring Beach Profiles.Limnology and Oceanography 6: 90-93.
Far’low, J. S. and C. Swanson (eds.). 1980. Disposal of Oil and DebrisResulting from a Spill Cleanup Operation, ASTM Special TechnicalPublication 703, ASTM, Philadelphia, Pennsylvania.

Ferrians, 0. J. 1965. Permafrost ‘Map of Alaska. U.S. GeologicalSurvey, Miscellaneous Geological Investigations Map 1-44.
Foget, C. R., E. Schrier, M. Cramer, and R. W. Castle. 1979. Manual ofPractice for Protection and Cleanup of Shorelines. Report to U.S.Environmental Protection Agency by Woodward-Clyde Consultants,EPA-600/7-/78 - 187 (a and b), 283 pp.
Folk, R. V. 1968. Petrology of Sedimentary Rocks. Hemphills Publishing,Austin, Texas, 170 pp.
Frost, K. J., L, F. Lowry and J. J. Burns. 1983. Distribution of MarineMammals in the Coastal Zone of the Eastern Chukchi Sea During Summerand Autumn. Final Report Research Unit 613 for OCSEAP, Anchorage, AK.
Geraci, J.I?. and D.J. St. Aubin. 1980. Offshore Petroleum ResourceDevelopment and Marine Mammals: A Review and ResearchRecommendations. Mar-Fish. Rev, 912(11)1-12.
Geraci, J.R, and D.J. St. Aubin. 1982. Study of the Effects of Oil onCetaceans. Final Report to BLM by University of Guelph, 274 pp.
Geraci, J.R., D.J. St. Aubin and R.J. Reisman. 1983. BottlenoseDolphins, Tursiops truncatus, Can Detect Oil. Can. J. Fish. Aquat.Sci. 40:1516-1522.
Geraci, J.R. and T.G. Smith. 1976. Direct and Indirect Effects of Oilon Ringed Seals (Phoca hispida) of the Beaufort Sea. J. Fish, Res.Bd. Canada 39:1976-1984.
Geraci, J.R, and l’.G. Srni-tli. 1977. Consequences of Oil Fouling onMarine Mammals. In: D.C. Halins (cd). Effects of petroleum inArctic and Subarc~c Marine Environments and Organisms.VOI.2:379-410, Academic Press, New York.
Gundlach, E. R., D. D. Domeracki, C. D. Getter, and L. C, Thebeau. 1980.Field Report on the Sensitivity of Coastal Environments to SpilledOil, Commonwealth of Massachusetts. Unpublished technical reportprepared for Office of Marine Pollution, NOAA, Boulder, Colorado, byResearch Planning Institute, Columbia, S.C.
Gundlach, E. R., C. D. Getter, and M. 0. Hayes. 1980. Sensitivityof Coastal Environments to Spilled Oil: Strait of Juan De Fucaand Northern Puget Sound. Prepared for NOAA, ContractNO. NA79RACO016.
Gundlach, E. R. and M. O. Hayes. 1977. The URQUIOLA Oil Spill,La Coruna, Spain: Case History and Discussion of Methods of Controland Cleanup. Marine Pollution 8(6):132-136.
1978a. Investigations of Beach Processes, p. 85-196: InW, N. Hess (cd.) The AMOCO CADIZ Oil Spill. A Preliminary Scie~ificReport. NOAA/EPA Special Report, Environmental Research Laboratory,Boulder, Colorado, 349 pp.

e 1978b. Vulnerability of Coastal Environments to Oil SpillImpacts. J. Marine Technology Sot. 12:18-27.
Gundlach, E. l?., C. H. Ruby, M. 0. Hayes, and A. E. Blount. 1978.URQUIOLA Oil Spill, La Coruna, Spain: Initial Impact and Reaction onBeaches and Rocky Coasts. Environmental Geology 2(3):131-134.
Gundlach, E. R., J. Sadd, L. Scott, L. C. Thebeau, and D. J. Haiero.1981. Oil Spill Sensitivity of Coastal Environments and Wildlife:Norton Sound and Pribilof Islands, Alaska. Prepared for NOM (OHPA)- Alaska OCSEAP (RU59) Office, Juneau, Alaska, 171 pp..
Handel, C, M., M. R. Petersen, R. E. Gill, and C. J. Lensink. 1981. AnAnnotated Bibliography of Literature on Alaska Water Birds. U. S.Fish Wildlife Service. Publ. FWS/OBS-81/12. 515 pp.
Harm, R. W. 1974. Oil Pollution from the Tanker METULA. Texas A&MUniv., Civil Eng. Dept., Rept. U.S. Coast Guard, 61 pp.
Harper, J. R. 1978. The Physical Processes Affecting the Stability ofTundra Cliff Coasts. Unpublished Ph.D. Dissertation, Coastal StudiesInstitute, Louisiana State University, Baton Rouge, 212 pp.
. 1981. Coastal Landform Inventory of the West Coast Trail,Pacific Rim National Park. Woodward-Clyde Consultants, Victoria,B.C., Unpub. Report to Parks Canada (Western Region), Envir. Can.,Calgary, Alta., 143 pp.
Hayes, M. 0., P. J. Brown, and J. 14ichel. 1976. Coastal Morphology andSedimentation, Lower Cook Inlet, Alaska, with Emphasis on PotentialOil Spill Impacts. Coastal Research Division, Dept. of Geology,Univ. of South Carolina, Columbia, Technical Rept. No. 12-CRD.107 pp.
Hayes, H. 0., D, D. Domeracki, C. D. Getter, T. W. Karra and G. I. Scott.1980. Sensitivity of Coastal Environments to Spilled Oil, SouthTexas Coast (Rio Grande to Arkansas Pass). Unpublished technicalreport prepared for the Office of Marine Pollution, NOAA, Boulder,Colorado by Research Planning Institute, South Carolina.
Hayes, H. O. and E. R. Gundlach. 1975. Coastal Morphology andSedimentation of the METULA Oil Spill Site in the Strait ofMagellan. Final Report, Coastal Research Division, Univ. ofSouth Carolina, Columbia, 103 pp.
Hayes, M. 0., E. R. Gundlach, and L. D’Ozouville. 1979. Role ofDynamic Coastal Processes in the Impact and Disposal of the AMOCOCADIZ Oil Spill (March 1978), Brittany France: ~ Proc. 1979 OilSpill Conf., Los Angeles, CA, pp. 193-198.
Hayes, M. O., E. R. Gundlach, and C. D. Getter. 1980. SensitivityRanking of Energy Port Shorelines. Proceed. of the Specialty Conf.on Ports ’80, ASCE, N.Y., pp. 697-708.

H a y e s , M. O. , E. R. Gundlach, and R. M. Perhac. 1977. The GreatPatagonian Oil Spill. ABSTRACT in the Proc. of the Annual Meeting,American Association of Petroleum Geologists.
Hayes, M. O., J. Michel, and P. J. Brown. 1977. Vulnerability ofCoastal Environments of Lower Cook Inlet, Alaska to Oil SpillImpact. Proc. 4th Int. Conf. on Port and Ocean. Eng. under ArcticConditions (POAC), St, Johns, Newfoundland.
Hayes, H. 0. and C. H, Ruby. 1979. Oil Spill Vulnerability, CoastalMorphology and Sedimentation of Kotzebue Sound. UnpublishedAnnual Report 7:115-170, Research Unit 059 in the OCSEAP, NOAA,Anchorage, AK.
Holmes, W,N., and J. Cronshaw. 1977. Biological Effects of Petroleumon Marine Birds. In: 14alins, D.C., g@. Effects of Petroleum onArctic and Subarct~ Marine Environments and Organisms. AcademicPress, New YOrk. pp. 359-398.
Hsiao, S. 1. 1978. Effects of Crude Oils on the Growth of Arctic MarinePhytoplankton. Environmental Pollution 17:93-107.
Hulten, E. 1974. Flora of Alaska and Neighboring Territories. A Manualof the Vascular Plants. Stanford University Press, Stanford, CA.
Hume, J, D. and H. Schalk. 1967. Shoreline Processes Near Barrow, Alaska- A Comparison of the Normal and the Catastrophic. Arctic 20:86-103.
Johnson, L.L. 1971. The Migration, Harvest, and Importance of Waterfowlat Barrow, Alaska. M.S. Thesis, Univ. of Alaska, Fairbanks, 87 pp.
La Belle, J. C. 1975. Chukchi Sea: Bering Strait to Icy Cape.Physical and Biological Character of Alaska Coastal Zone and MarineEnvironment. Arctic Environmental Information and Data Center, Univ.of Alaska, Anchorage, 31 maps.
Lehnhansen, W.A. and S.E. Quinlan. 1981. Bird Migration and Habitat Useat Icy Cape, Alaska. Unpublished MS, US Fish and Wildlife Service,Anchorage, AK.
Lewbel, G. S. and B. J, Gallaway. 1984. Transport and Fate of SpilledOil. pp. 7-29. ed. J. Truett. The Barrow Arch Environment andPossible Conseque~es of Planned Offshore Oil and Gas Development.Proc, Synthesis Meeting, OCSEAP, NOAA, Anchorage, Alaska.
Lowenstein, T. 1981. Some Aspects of Sea-ice Subsistence Hunting inPt. Hope, Alaska. Prep. for North Slope Borough Coastal ManagementProgram, Barrow, AK. 83 pp.
Lowry, L., K. J. Frost, and J. J. Burns. 1980. Feeding of Bearded Sealsin the Bering and Chukchi Seas and Trophic Interaction with PacificWalruses. Arctic 33(2):330-342.

. 1981. ‘1’rophi_c Relationships among Lee-inhabiting Phocid—Seals and Functionally Related Marine Mammals in the Chukchi Sea.Final Rept. of Principal Investigators. Vol. II, Biological Studies.OCSEAP, Boulder, CO.
Halins, D. C. 1977. Effects of Petroleum on Arctic and Subarctic MarineEnvironments and Organisms. Vols. 1 and 2: Academic Press, NY.
Maynard and Partch, and Woodward–Clyde Consultants. 1984. North SlopeBorough Coastal Management Program. Background Report and ResourceAtlas . Prep. for North Slope Borough, Barrow, AK.
Mattson, C. P., N. C, Vallario, D. J. Smith, S. Anisfield, and G. Potera.1977. Hackensack Estuary Oil Spill: Cutting Oil-soaked Marsh Grassas an Innovative Damage Control Technique. American PetroleumInstitute 1977 Oil Spill Conference, pp. 243-246.
McCulloch, D. S., D. W. Taylor, and M. Rubin. 1965. Stratigraphy,Nonmarine Flolluscs, and Radiometric Dates from Quaternary Deposits inthe Kotzebue Sound Area, Western Alaska. Journal of Geology73(3):442-452.
Michel, J., H. O. Hayes, and P. J. Brown. 1978. Application of an OilSpill Vulnerability Index to the Shoreline of Lower Cook Inlet,Alaska. Environmental Geology 2:107-117.
Morris, B. F. 1981. Living Marine Resources of the Chukchi Sea.Resource Report for Chukchi Sea Oil and Gas Lease Sale No. 85, NMF’S,Anchorage, AK. 117 pp.
Natural Petroleum Reserve of Alaska Task Force. 1978. National PetroleumReserve in Alaska Physical Profile. U.S. Dept. of Xnterior, Land UseStudy Report No. 1, 124 PP.
Nelson, R. 1981. Harvest of the Sea: Coastal Subsistence in ModernWainwright. Prep. for North Slope Borough Coastal ManagementProgram, Barrow, AK.
North Slope Borough. 1981. Annual Overall Economic Development programreport. Barrow, AK.
lhunmedal, D. 1980. Persistence of Spilled Oil Along the Beaufort SeaCoast. Final Rept. NOAA-OCSEAP Contract 03-5022-82, Research Unit540, 48 pp.
Nunnnedal, D. and C. H. Ruby. 1979. Spilled Oil Retention Potential -Beaufort Sea Coast of Alaska. POAC Meeting, Norway Institute ofTechnology, 13-18 August 1977, Trondheim, p. 1-7.
Ohlendorf, H.M., R.W. Risebrough, and K. Vermeer. 1978. Exposure ofMarine Birds to Environmental Pollutants. U.S. Dept. of theInterior, Fish and Wildl. Serv., Wildlife Res. Rep. 9.
306

Owens, E. H. 1971. The Restoration of Beaches Contaminated by Oil,C.hedabucto Bay, Nova Scotia. Manuscript Report Series No. 19, MarineSciences Branch, Department of Energy, Hines and Resources, Ottawa,75 pp.
1977. Coastal Environments of Canada:— The Impacts andCleanup of Oil Spills. Dept. Fish. and Environment, Canada. Econ,Tech. Rev, Rep. EPA-3-EC-77-13, 413 pgs.
. 1978, Mechanical Dispersal of Oil Stranded in the LittoralZone. J. Fish. Res. Board. Canada 35:563-572.
. 1980. Physical Shore-zone Analysis, Salksprinfg Island, B.C.Woodward-Clyde Consultants, Victoria, B.c., unpub. Report to LandsDirectorate, Pacific and Yukon Region, Envir. Can., Vancouver, B.C.,155 pp.
. 1981. Pacific Coast Spill Response Manual-Pilot Study:Esquimalt to Bamfield. Woodward-Clyde Consultants, Victoria$ B.C.,Unpub. Report to Environmental Protection Service, Envir. Can. ,Vancouver, B.C.
Owens, E.H., C,R. Foget and W. Robson. 1982. Arctic ShorelineCountermeasure - Initial Results and Implications of BIOSExperiment. Proc. of 5th Arctic Marine Oil Spill Technical Seminar,Environmental Protection Service, Ottawa, Canada.
Owens, E. H., C. R. Foget, and W. Robson. 1982. Arctic ShorelineCounter-measures – 1981 Study Results. BIOS Working Report 81-4.
Owens, E, H., J. R. Harper, and C. R. Foget, 1983. Baffin Island OilSpill Project-1982 Shoreline Component. Unpub. Rept. to Env.Protection Service, Environment Canada, Hull, Quebec.
Owens, E. H. and J. R. Harper. 1977. Frost Table Depths and Depth ofThaw in the Littoral Zone near Peard Bay$ Alaska. Arctic 30:156-158.
.-. 1983. Arctic Coastal Processes: A State-of-KnowledgeReview. Proc. Canadian Coastal Conference. Vancouver, B.C.,National Research Council.
Owens, E, H., J. R. Harper, C. R. Foget, and W. Robson, 1983. ShorelineExperiments and the Persistence of Oil on Arctic Beaches. Proc. 1983Oil Spill Conf., San Antonio, TX (March 1983), American PetroleumInstitute, Washington, D.C., Pub. No. 4356, p. 261-268.
Owens, E. H. and M. A, Rashid. 1976. Coastal Environments and Oil SpillResidues in Chedabucto Bay, Nova Scotia. Canadian Journal EarthScience 13:908-918.
Owens, E. H. and G. A. Robilliard. 1981a, Shoreline Sensitivity and OilSpills - a Re-evaluation for the 1980’s. Marine Pollution Bulletin12:75-78.

.— 1981b. Spill Tmpacts and Shoreline Cleanup Operations onArctic and Sub-arctic coasts. In: Proceedings 1981 Oil SpillConference (Prevention, Behavior, Control, Cleanup) ‘March 2-5, 1981.Amer. Petrol. Inst. Publ, ‘No. 4334.
Owens, E. H. and W. Robson. 1984 (in press). %affin Island Oil SpillProject - 19$33 Shoreline Component. Unpublished technical reportprepared for Environmental Protection Service, Hull, Quebec bybJoodward-Clyde Oceaneering$ Aberdeen, Scotland.
Owens, E. H., R. B. Taylor, M. Miles, and D. L. Forbes. 1981. CoastalGeology Mapping: An Example from the Sverdrup Lowland, District ofFranklin. Geol. Surv. Can., Paper 81-13:37-49.
Paquette, R. G. and R. H. Bourke. 1974., Observations of the CoastalCurrent of Arctic Alaska. Journal of Marine Research 32(2):195-207,
Patten, S.?3. Jr. and L.R. Patten. 1978. Effects of Petroleum Exposureon the Breeding Ecology of the Gulf of Alaska Herring Gull Group(Larus argentatus and ~. glaucescens) and Reproductive Ecology ofLarge Gulls in the Northeast Gulf of Alaska. Annual Report. NOAAU.S. Dept. of Commerce.
Pedersen, S. 1979. Point Hope Synopsis. In Native Livelihood andDependence: A Study of Land Use Throug~’Eime. Prep. for NationalPetroleum Reserve in Alaska, Work Group 1, Dept. of Interior,Anchorage, AK.
Rashid, M. A. 1974. Degradation of Bunker C Oil Under Different CoastalEnvironments of Chedabucto Bay, Nova Scotia. Estuarine and CoastalMarine Science 2:137-144.
Robilliard, G. A. and M. Busdosh. 1981. Need for Real World Assessmentof the Environmental Effects of Oil Spills in Ice-infested MarineEnvironments. Proc. Sixth Inter. Conference on Port and OceanEngineering under Arctic Conditions, Quebec, Canada. Vol. 2:937-944.
Robilliard, G. A. and E. H. Owens. 1981. Intergrated Biological andPhysical Shoreline Classification Applicable to Oil Spill Counter-measure Planning. Proc. 4th Arctic Marine Oil Spill ProgramTechnical Seminar, Edmonton, Alberta.
Robilliard, G. A., E. H, Owens, R. W. Castle, and C. R. Foget. 1980.Arctic Shoreline Protection and/or Cleanup - How to Decide What toDo, When, and Where. In: Proceedings of the Third TechnicalSeminar, Arctic Marine Oil Spill Program, Environmental ProtectionService, Environment Canada, Ottawa, pp. 342-378.
Robilliard, G, A., E. Ii. Owens, J. R. Harper, and T. P. Winfield. 1983a,Oil Residence and Oil Spill Biological Sensitivity Indices forCoastal Marine Environments. Proc. 1983 Oil Spill Conference, SanAntonio, Texas, American Petroleum Institute. p. 581.

. 1983b. Biological Sensitivity, Oil Residence, and Human useIndices for Coastal Environments Threatened by Oil Spills. Proc. 3rdSymp. Coastal and Ocean Management, ASCE, Coastal Zone ’83. Vol. II,pp. 1374-1389.
Roseneau, K).G, and D.I?. Herter. 1984. Marine and Coastal Birds. ed.J. Truett. The Barrow Arch Environment and Possible Consequenc~ ofPlanned Offshore Oil and Gas Development. Proceedings of a SynthesisBieeting$ OCSEAP, NOAA, Anchorage, AK. pp. 117-131.
Ruby, C. H. 1977. Coastal Morphology, Sedimentation and Oil SpillVulnerability, Northern Gulf of Alaska. Technical Report No. lS-CRD,Coastal Research Division, Dept. Geology, Univ. South Carolina,Columbia, South Carolina.
Ruby, C. H. and M, O. Hayes. 1978. Application of an Oil SpillVulnerability Index to the Copper River Delta, Alaska. Coastal Zone‘78:2204-2220.
Ruby, C. R. , L. G. Ward, 1. A. Fischer, and P. J. Brown. 1977. BuzzardsBay Oil Spill - An Arctic Analogue. 4th International Conference onPort and Ocean Engineering under Arctic Conditions, St. Johns,Newfoundland.
St. Aubin, D. J., J. R. Geraci, T. G. Smith and T. G. Friesen. 1985.How Do Bottlenose Dolphins, l!ursiops truncatus, React to Oil Filmsunder Different Light Conditions. Can. J. Fish. Aquat. Sci.42:430-436.
Schulze, R. H., W. G. Grosskopf, J. C. Cox and L. A. Schulz. 1982. OilSpill Response Scenarios for Remote Arctic Environments. USEPAResearch and Development Project Summary EPA-600/S2-82-036.
Selkregg, L. L. 1975. Alaska Regional Profiles: Arctic Region. ArcticEnvironmental Information and Data Center, Univ. of Alaska, Anchorage,218 pp.
Sowls, A.L., A.R. DeGange, J.W. Nelson, and G.S. Lester. 1980. Catalogof California Seabird Colonies. U.S. Dept. of Interior, Fish andWildlife Service, Biological Services Program. FWS/OBS 37/80.371 pp.
Sowls, A. L., S. A. Hatch, and C. Y. Lensink. 1978. Catalog of AlaskanSeabird Colonies. U.S. Fish Wildlf. Serv. Publ. FWS/OBS-78/78.
Springer, A. and D. Roseneau. 1978. Ecological Studies of ColonialSeabirds at Cape Thompson and Cape Lisburne, Alaska. Ann. Rept. of .Principal Invest. Vol. 11, Receptors - Birds. OCSEAP, Boulder, CO.
Szaro, R.C., and P.H. Albers. 1976. Effects of External Applications ofOil on Common Eider Eggs. In: Wolfe, D., ed. Proceedings ofSymposium on Fate and Effec~ of Petroleum ~drocarbons in MarineEcosystems and Organisms. Pergamon Press, New York.

Thompson, D.Q., and R.A. Person. 1963. ‘l’he Eider Pass at Pt. Barrow,Alaska. J. Wildlife Hgmt. 27:348-356.
Truett, J. C. 1984. Coastal Ecosystems and Sensitivities. ed.J. Truett. The Barrow Arch Environment and Possible, Con~quences ofPlanned Offshore Oil and Gas Development. Proceedings of ‘SynthesisMeeting, OCSEAP, NOAA, Anchorage, AK. pp. 153-165.
Truett, J. C. (editor). 1984. The Barrow Arch Environment and PossibleConsequences of Planned Offshore Oil and Gas Development.Proceedings of Synthesis Meeting, OCSEAP, NOAA, fmchorage, AK. 229PP.
Vandermeulen, J. l). and D. C. Gordon. 1976. Reentry of .5-year-oldStranded Bunker C Fuel Oil from a Low-energy Beach into Water,Sediments and Eliota of Chedabucto Bay, Nova Scotia. Journal ofFisheries Research Board of Canada 33:2002-2010.
Vandermeulen, J. H., P. D. Keizer, and W. R. Penrose. 1972. Persistenceof Non-alkane Components of Bunker C Oil in Beach Sediments ofChedabucto Bay, and Lack of Their Metabolism by MOIIUSCS. Proc. OilSpill Conference,pp. 469-473,
Vermeer, K. and G. G.the Yukon Coast.
Wahrhaftig, C. 1965.
American Petroleum Institute, Washington, D.C.,
Anweiler. 1975. Oil Threat to Aquatic Birds AlongWilson Bulletin 87(4):467-480.
Physiographic Divisions of Alaska. U.S. GeologicalSurvey. Professional Paper 482, 52 pp.
Walker, H. V. 1973. Morphology of the North Slope. In: Alaskan Arctic—Tundra, Arctic Institute of North America, Technical Paper, No. 25,pp. 49-92.
Wiens, J.A., G. Ford, D. Heinemann, and C. J?ieber. 1979. SimulationModeling of Marine Bird Populations Energetic, Food Consumption, andSensitivity to Perturbation. Annual Report: Research Unit #108,Outer Continental Shelf Environmental Assessment Program.pp. 217-270,
Wiggins, I.L., and J.I-I. Thomas. 1962. A Flora of the Alaskan ArekicSlope. ATNA Spec. Publ. No. 4, University of Toronto Press,Toronto. 425 pp.
Williams, J. R., W. E. Yund, L. D. Carter, and T. D. ‘Hamilton. 1977.Preliminary Surficial Deposits Map of National Petroleum Reserve -Alaska. U.S. Geological Survey, Open-file Report 77-868.
310
Related Documents