SPECTROCHIMICA ACTA PART B ELSEVIER Spectrochimica Acta Part B 52 (1997) 1139-1149 Laser-enhanced ionization spectroscopy of mercury Rydberg states W.L. Clevenger, O.I. Matveev I, N. Omenetto 2, B.W. Smith, J.D. Winefordner* Department of Chemistry, University of Florida. Gainesville, FL 32611-7200. USA Received 12 December 1996; accepted 6 February 1997 Abstract The spectral characteristics of mercury Rydberg states (n = 10-42) were observed and studied. Each principal quantum number was observed as a triplet, and after observing a quartet of lines for n = 10, 11, and 12, these lines were assigned, from red to blue, as belonging to upper levels ~p0, 3p0, 3p10 ' and 3p0. These levels were studied as a function of variable applied high voltage (between the electrodes) and variable buffer gas pressure. In this way, the broadening and splitting caused by the influence of Stark effects and of increasing buffer gas pressure were observed for different n values. These observations will allow one to choose the optimal level for excitation, as well as the optimal operating conditions in terms of pressure and applied high voltage, for obtaining the best sensitivity and limit of detection by analytical laser-enhanced ionization spectroscopy. © 1997 Elsevier Science B.V. Keywords: Rydberg spectroscopy; Hg; Laser-enhanced ionization (LEI); Stark broadening; Pressure broadening; Pressure shifts I. Introduction In Part 1 of our work on analytical time-resolved laser enhanced ionization spectroscopy (TR-LEI) [1], time-resolved signals due to collisional and photo- ionization of mercury vapor were studied. In order to obtain the best signal-to-noise ratio using TR- LEI, one should determine directly the spectroscopic characteristics of the ionizing atoms, such as the line- width in a buffer gas and the splitting and shift of the lines in an electric field. It is interesting to note that Rydberg atoms were first studied by observations of the shifts and broadenings that occurred in their spec- tral lines due to electric field and pressure effects [2]. * Corresponding author. On leave from Department of Chemistry, Moscow State Univer- sity, Moscow, Russia. z Present address: Environment Institute, Joint Research Centre, lspra, (Va) Italy. Atoms are substantially affected by an applied external field when they are in highly excited, or Rydberg, states [2,3]. Here, the contribution of Stark effects to the level structure is substantial and some- times it even represents the dominating contribution. This is because of the large number of closely spaced states, with different orbital angular momentum, which can be easily mixed even in comparatively weak electric fields. In addition, mixing between states can also occur as transitions become unbound. Under these conditions, the selection rules governing the change in parity of states break down, and transi- tions from states of small values of orbital momentum into those with any value for a given n can occur. In this way, the number of potential spectral lines for an atom increases dramatically [3]. Stark structure obser- vations in Rydberg states have been made for lithium by flame LEI [4], for calcium by high-resolution laser- atomic-beam resonance ionization spectroscopy (RIS) 0584-8547/97/$17.00 © 1997 Elsevier Science B.V. All rights reserved. PII S05 84- 8547(97)00023-2

Welcome message from author
This document is posted to help you gain knowledge. Please leave a comment to let me know what you think about it! Share it to your friends and learn new things together.
Transcript
SPECTROCHIMICA ACTA
PART B
ELSEVIER Spectrochimica Acta Part B 52 (1997) 1139-1149
Laser-enhanced ionization spectroscopy of mercury Rydberg states
W.L. Clevenger, O.I. Matveev I, N. Omenetto 2, B.W. Smith, J.D. Winefordner*
Department of Chemistry, University of Florida. Gainesville, FL 32611-7200. USA
Received 12 December 1996; accepted 6 February 1997
Abstract
The spectral characteristics of mercury Rydberg states (n = 10-42) were observed and studied. Each principal quantum number was observed as a triplet, and after observing a quartet of lines for n = 10, 11, and 12, these lines were assigned, from red to blue, as belonging to upper levels ~p0, 3p0, 3p10 ' and 3p0. These levels were studied as a function of variable applied high voltage (between the electrodes) and variable buffer gas pressure. In this way, the broadening and splitting caused by the influence of Stark effects and of increasing buffer gas pressure were observed for different n values. These observations will allow one to choose the optimal level for excitation, as well as the optimal operating conditions in terms of pressure and applied high voltage, for obtaining the best sensitivity and limit of detection by analytical laser-enhanced ionization spectroscopy. © 1997 Elsevier Science B.V.
Keywords: Rydberg spectroscopy; Hg; Laser-enhanced ionization (LEI); Stark broadening; Pressure broadening; Pressure shifts
I. I n t r o d u c t i o n
In Part 1 of our work on analytical t ime-resolved laser enhanced ionization spectroscopy (TR-LEI) [1], t ime-resolved signals due to collisional and photo- ionization of mercury vapor were studied. In order to obtain the best signal-to-noise ratio using TR- LEI, one should determine directly the spectroscopic characteristics of the ionizing atoms, such as the line- width in a buffer gas and the splitting and shift of the lines in an electric field. It is interesting to note that Rydberg atoms were first studied by observations of the shifts and broadenings that occurred in their spec- tral lines due to electric field and pressure effects [2].
* Corresponding author. On leave from Department of Chemistry, Moscow State Univer-
sity, Moscow, Russia. z Present address: Environment Institute, Joint Research Centre,
lspra, (Va) Italy.
Atoms are substantially affected by an applied external field when they are in highly excited, or Rydberg, states [2,3]. Here, the contribution of Stark effects to the level structure is substantial and some- times it even represents the dominating contribution. This is because of the large number of closely spaced states, with different orbital angular momentum, which can be easily mixed even in comparatively weak electric fields. In addition, mixing between states can also occur as transitions become unbound. Under these conditions, the selection rules governing the change in parity of states break down, and transi- tions from states of small values of orbital momentum into those with any value for a given n can occur. In this way, the number of potential spectral lines for an atom increases dramatically [3]. Stark structure obser- vations in Rydberg states have been made for lithium by flame LEI [4], for calcium by high-resolution laser- a tomic-beam resonance ionization spectroscopy (RIS)
0584-8547/97/$17.00 © 1997 Elsevier Science B.V. All rights reserved. PII S05 84- 8547(97)00023-2
1140 W.L. Clevenger et al./Spectrochimica Acta Part B 52 (1997) 1139-1149
[5] and conventional RIS [6], for aluminum by con- ventional RIS [7], and for barium by high-resolution RIS [8].
The broadening and shifting of atomic lines due to collisions with a foreign gas has been studied and reviewed extensively [9]. The main cause of line broadening is the difference of the interaction ener- gies between the radiating atom, in both the initial and final steps of the radiative process, and the colliding atom or molecule. It is a combination of natural broadening, Doppler broadening (which prevails at low pressures) and Lorentz broadening (which domi- nates at pressures above a few Torr). Collisions of the absorbing atoms with foreign gas molecules induce radiationless transitions and result in a decrease in the lifetime of the excited states. By measuring the half-width of the spectral line, A/~L, one can calculate the number of collisions experienced per second by an atom. The first measurements of collision properties of Rydberg atoms were carried out by Amaldi and Segr6 [10], which involved the study of the spectrum of potassium in the presence of noble gases. Tech- niques used to measure line broadening and shifts include Doppler-free two-photon spectroscopy [11] and the tri-level echo technique [12].
In this work, the LEI spectroscopic characteristics of various Rydberg states for mercury in a buffer gas are studied. A three-step LEI scheme for mercury [13] was used, in which the third step excited the atom to a Rydberg level near the ionization continuum. Measurements were made in a quartz cell containing mercury vapor and buffer gas at varying pressures. Detection occurred via two electrodes, located within the cell, to which a variable high voltage was applied. In this way, the Rydberg lines were observed as a function of electric field and foreign gas pressure, the goal being to find the Rydberg level and the oper- ating conditions which provide the optimal detection of mercury in an analytical LEI method.
Although it is known that higher quantum number states provide a higher ionization yield, Stark and pressure broadening effects are expected to be more important for some (higher) levels than for others. The sensitivity of the LEI method would be decreased by Stark and pressure broadening effects encountered at unnecessarily high principal quantum numbers and excessively high voltages.
A set of conflicting requirements exists with respect
to the optimization of the signal-to-noise ratio. To increase the signal and to saturate the transitions, the power of the laser radiation should be increased. How- ever, in this case, parasitic signals due to multiphoton ionization of matrix gases could also be present to a greater extent. Due to the strong quenching of Hg excited states which occurs in air under atmospheric conditions, the laser radiation power necessary to saturate the Hg transitions must be increased by at least 100-500 times. To decrease the negative effects of quenching and multiphoton ionization, one can either decrease the pressure or mix the air containing Hg with Ar (0.1-10 Tort) in the cell in which Hg is measured. In this case, the laser power required to achieve saturation can be lowered by 2-3 orders of magnitude. Another contradiction lies in the necessity of measuring the signal using electrodes between which a high voltage must be applied. The electric field can induce Stark splitting and shifts of the levels. This would again require an increase in the laser power in order to achieve saturated transitions.
In view of these considerations, one can see that the development of a method for detecting very low con- centrations of mercury atoms in air, liquid, or solid samples using the LEI method requires the optimiza- tion of a significant number of parameters. By study- ing the spectral characteristics of the Rydberg levels, we can identify the optimal level to be reached in the LEI excitation scheme, as well as the pressure and voltage which should be used to attain the maximum sensitivity and the ultimate limit of detection.
2. Experimental
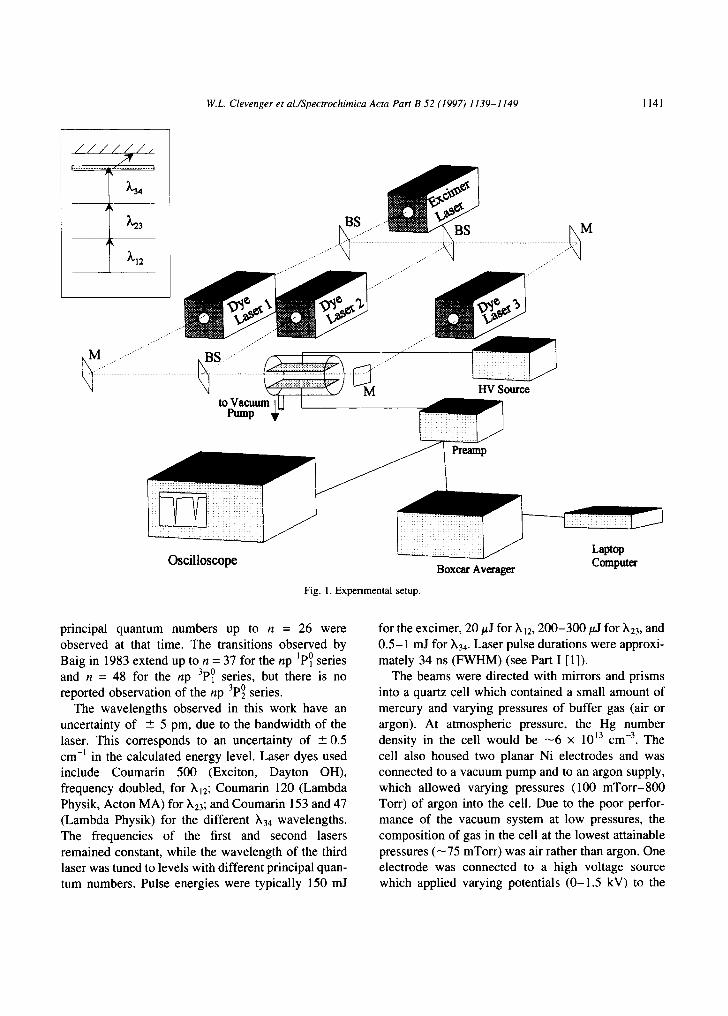
The experimental setup used in this work, shown in Fig. 1 for the sake of clarity, is similar to the one described in our previous paper [1]. Three dye lasers (laser 1, Molectron, Portland, OR; lasers 2 and 3, Model Scanmate 1, Lambda Physik, Acton, MA) were pumped by an excimer laser (Model LPX-240i, Lambda Physik, Acton, MA) operated with XeC1. The calculated wavelengths and corresponding energies of the three dye laser-connected transitions are listed in Table 1. In this table, the expected transitions as tabu- lated by Moore [14] and Baig [15], and as observed in this work, are listed. The data tabulated by Moore were collected from reports dating up to 1955. Only
W.L. Clevenger et al./Spectrochimica Acta Part B 52 (1997) 1139-1149 1141
////~¢/,
I ~'12
BS ................ ~ BS M
.................... ~:::::: ..................................... iiiiiiiiii: .................................................................. "::':i15-~
to Vacuum I[J I- lump ~/
I-IV Sourca
iiliii !iiSiiiiiii!!ii Preamp
! i: ~i!ili~iiiiiiiiiiii~ ,̧
Oscilloscope
Fig. 1. Experimental setup.
Boxcar Avecager
Laptop Computm
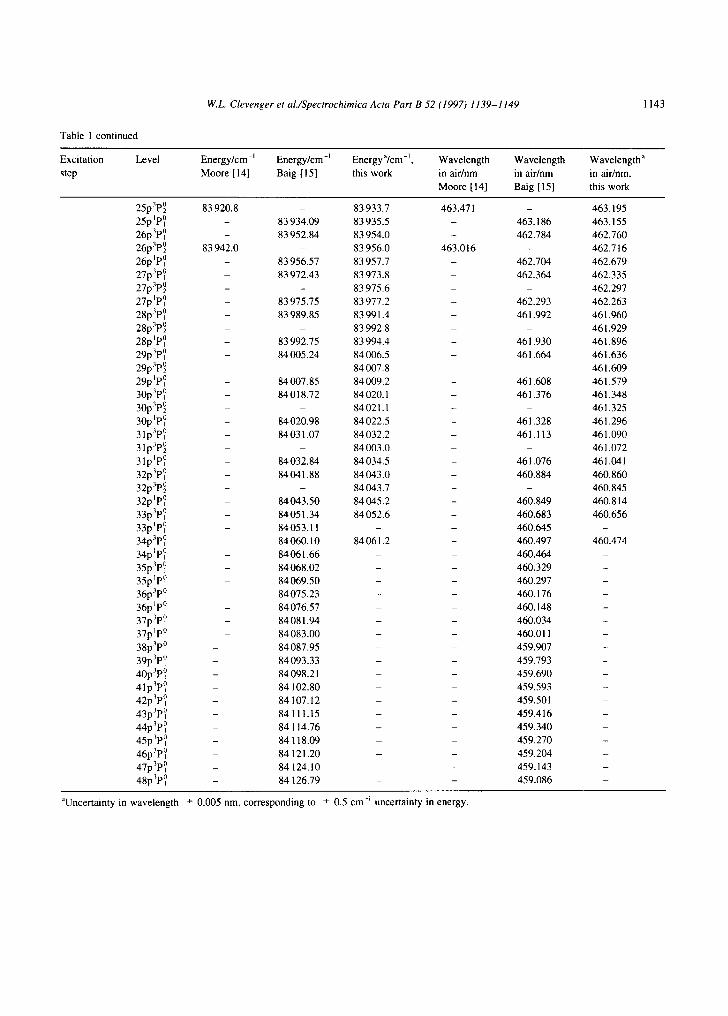
principal quantum numbers up to n = 26 were observed at that time. The transitions observed by Baig in 1983 extend up to n = 37 for the np Ip0 series and n = 48 for the np 3p0 series, but there is no reported observation of the np 3p0 series.
The wavelengths observed in this work have an uncertainty of ± 5 pm, due to the bandwidth of the laser. This corresponds to an uncertainty of ± 0.5 cm -] in the calculated energy level. Laser dyes used include Coumarin 500 (Exciton, Dayton OH), frequency doubled, for ~,12; Coumarin 120 (Lambda Physik, Acton MA) for ~,23; and Coumarin 153 and 47 (Lambda Physik) for the different )k34 wavelengths. The frequencies of the first and second lasers remained constant, while the wavelength of the third laser was tuned to levels with different principal quan- tum numbers. Pulse energies were typically 150 mJ
for the excimer, 20/.tJ for hi2, 200-300/~J for )~23, and 0.5-1 mJ for ~k34. Laser pulse durations were approxi- mately 34 ns (FWHM) (see Part I [1]).
The beams were directed with mirrors and prisms into a quartz cell which contained a small amount of mercury and varying pressures of buffer gas (air or argon). At atmospheric pressure, the Hg number density in the cell would be --6 × 10 ]3 cm -3. The cell also housed two planar Ni electrodes and was connected to a vacuum pump and to an argon supply, which allowed varying pressures (100 mTorr-800 Torr) of argon into the cell. Due to the poor perfor- mance of the vacuum system at low pressures, the composition of gas in the cell at the lowest attainable pressures ( - 7 5 mTorr) was air rather than argon. One electrode was connected to a high voltage source which applied varying potentials (0-1.5 kV) to the
1142 W.L. Clevenger et al./Spectrochimica A cta Part B 52 (1997) 1139-1149
Table 1 Excitation transit ions for Hg for laser-connected levels I, 2, 3, and 4 (Rydberg level)
Excitation Level Energy/cm -~ Energy /cm -~ Energy "/cm -j , Wavelength
step Moore [14] Baig [15] this work in air /nm
Moore [14]
Wavelength
in air /nm
Baig [15]
Wavelength a
in air/nm,
this work
)k12 h23
~34
6p3p~
7s~Si
10~3P~ 10 ~3pO IO)~P~
10) tP~
11 )3p~ 11 )3p0 11 ~3p~ 11 )lp0 12 )3p~ 12 )3p~ 12 )3P~ 12)lP~ 13p3p~
13p3P~
13p~P~ 14p3p~
14p3p~
14ptP~ 15p3p~
15p3p~
15pIP~ 16p3p~
16p3P~
16pIP~ 17p3P~
17p3P~
17pIP~ 18p3p~
18p3P~ 18p~P~ 19p3p~
19p3p~
19pIP~ 20p3p~
20p3P~
20pIP~ 21p3p~
21p3P~
21pIP~
22p3P~
22p~P~ 22pIP~
23p3P~ 23p3P~
23pIP~
24p3P~
24p3P~
24p~P~ 25p3P~
39412 .3 3 9 4 1 2 . 3 9 - 253.652 253.652 -
62 350.5 - - 435.832 - -
80 902.27 - - 538.882 - -
80916 .686 80916 .17 8 0 9 1 7 . 6 538.463 538.437 538.436
81 022.9 - 81 022.7 535.400 - 535.406
81 153.614 81 153.09 81 154.3 531.677 531.692 531.657
81 800.0 - 81 800.7 514.007 - 513.988
81 811.876 81 807.55 81 808.3 513.693 513.808 513.789
81 873.835 - 81 873.7 512.063 - 512.065
81 942.444 81 941.89 81 942.4 510.270 510.283 510.271
- - 82 374.6 - 499.258
82 379.0 82 378.09 82 378.9 499 .150 499 .172 499.151
82 422 .60 - 82 422.8 498.064 498.061
82 464.05 82 463.48 82 464.3 497.038 497.052 497.032
82 765.9 82 765.43 82 772.3 489.689 489.701 489.535
82 795.03 - 82 800.3 488.991 488.865
82 823.94 82 823.55 82 825.1 488.301 488 .310 488.273
83 039.3 83 040.20 83 041.2 483 .219 483.198 483.175
83 061.2 - 83 063.7 482.708 - 482.651
83 084.0 83 081.60 83 083.1 482.177 482.233 482 .199
83 240.1 83 242.25 83 242.9 478.573 478.524 478 .510
83 258.7 - 83 260.2 478.147 478.114
83 280.5 83 272.96 83 273.6 477.649 477.821 477.806
83 396.7 83 394.98 83 395.9 475.011 475 .050 475 .030
83 407.2 - 83 409.2 474.776 - 474.731
83 420.3 83 418.21 83 419.3 474.481 474.528 474.503
83 512.7 83 513.31 83 514.4 472.409 472.395 472.371
83 521.6 - 83 524.8 472 .210 - 472.138
83 530.7 83 531.65 83 532.7 472.007 471 .986 471.963
83 601.9 83 607.15 83 607.9 470.425 470.309 470.292
83 613.9 - 83 616.4 470 .160 - 470.105
83 619.9 83 621.62 83 622.5 470.027 469.989 469 .969
83 677.9 83 682.36 83 683.7 468.748 468 .650 468.621
83 686.0 - 83 690.3 468 .570 - 468 .476
83 691.3 83 693.92 83 695.3 468.454 468.396 468 .366
83 743.68 83 699.5 - 467.306 468.275
83 745.7 - 83 750.6 467.263 - 467.156
- 83 753.50 83 754.7 - 467.092 467.067
- 83 794.41 83 795.9 - 466.201 466.169
83 792.8 - 83 800.5 466 .236 - 466.068
- 83 802.49 83 803.9 - 466.025 465 .994
- 83 837.13 83 838.2 - 465 .274 465.251
83 834.5 - 83 842.0 465.331 - 465.168
- 83 843.73 83 844.9 - 465.131 465.105
- 83 873.06 83 874.3 - 464 .500 464.473
83 868.0 - 83 877.6 464 .609 - 464.402
- 83 878.61 83 880. I - 464 .380 464.348
- 83 903.74 83 904.9 - 463.838 463.813
83 892.6 - 83 907.7 464.078 - 463.753
- 83 908.46 83 909.9 463.737 463 .706
- 83 930.01 83 931.3 463 .274 463 .246
W.L. Clevenger et al./Spectrochimica Acta Part B 52 (1997) 1139-1149 1143
Table 1 con t inued
Exci ta t ion
step
Leve l Ene rgy / cm -~ E n e r g y / c m -~ Energya /cm -~ , W a v e l e n g t h W a v e l e n g t h W a v e l e n g t h a
Moore [14] Ba ig [15] this work in a i r /nm in a i r /nm in air /nm,
Moore [14] Ba ig [15] this work
25p3P~ 8 3 9 2 0 . 8 - 8 3 9 3 3 . 7 463.471
25p~P~ - 83 934 .09 83 935.5 -
26p3P~ 83 952 .84 83 954.0 -
26p3p~ 8 3 9 4 2 . 0 - 83 956.0 463 .016
26pIP~ - 8 3 9 5 6 . 5 7 83 957.7 -
27p3p~ - 83 972.43 8 3 9 7 3 . 8 -
27p3p~ - - 83 975.6 -
27p~P~ 8 3 9 7 5 . 7 5 8 3 9 7 7 . 2 -
28p3p~ 83 989.85 83 991.4 -
28p3P~ - 8 3 9 9 2 . 8 -
28p~P~ - 8 3 9 9 2 . 7 5 8 3 9 9 4 . 4 -
29p3P~ 8 4 0 0 5 . 2 4 8 4 0 0 6 . 5 -
29p3p~ - 84 007.8 -
29p~P~ 8 4 0 0 7 . 8 5 8 4 0 0 9 . 2 -
30p3p~ 8 4 0 1 8 . 7 2 84020 .1 -
30p3p~ - 84021 .1 -
30p~P~ 8 4 0 2 0 . 9 8 8 4 0 2 2 . 5 -
31p3p~ 8 4 0 3 1 . 0 7 8 4 0 3 2 . 2 -
31p3p~ - 8 4 0 0 3 . 0 -
31p~P~ 8 4 0 3 2 . 8 4 8 4 0 3 4 . 5 -
32p3p~ 8 4 0 4 1 . 8 8 8 4 0 4 3 . 0 -
32p3P~ - 8 4 0 4 3 . 7 -
32pIP~ 8 4 0 4 3 . 5 0 8 4 0 4 5 . 2 -
33p3P~ 8 4 0 5 1 . 3 4 8 4 0 5 2 . 6 -
33ptP~ - 84053 .11 - -
34p3p~ 8 4 0 6 0 . 1 0 8 4 0 6 1 . 2 -
34p~P~ - 8 4 0 6 1 . 6 6 - -
35p3p~ - 8 4 0 6 8 . 0 2 - -
35p~P~ - 8 4 0 6 9 . 5 0 - -
36p3P~ - 8 4 0 7 5 . 2 3 - -
36pIP~ - 8 4 0 7 6 . 5 7 - -
37p3P~ - 8 4 0 8 1 . 9 4 - -
37p tP~ - 8 4 0 8 3 . 0 0 - -
38p3P~ - 8 4 0 8 7 . 9 5 - -
39p3p~ - 8 4 0 9 3 . 3 3 - -
40p3p~ - 84098 .21 - -
41p3P~ - 84 102.80 - -
42p3P~ - 84 107.12 - -
43p3P~ - 84 111.15 - -
44p3P~ - 84 114.76 -
45p3P~ - 84 118.09 -
46p3p~ - 84 121.20 -
47p3p~ - 84 124.10 -
48p3p~ - 84 126.79 - -
463 .186
462 .784
462 .704
462 .364
462 .293
461 .992
461 .930
461 .664
461 .608
461 .376
461 .328
461 .113
461 .076
460 .884
460 .849
460 .683
460 .645
460 .497
460 .464
460 .329
460.297
460 .176
460 .148
460 .034
460.011
459 .907
459 .793
459 .690
459 .593
459.501
459 .416
459 .340
459 .270
459 .204
459 .143
459 .086
463 .195
463 .155
462 .760
462 .716
462 .679
462.335
462 .297
462 .263
461 .960
461 .929
461 .896
461 .636
461 .609
461 .579
461 .348
461 .325
461 .296
461 .090
461 .072
461.041
460 .860
460.845
460 .814
460 .656
460 .474
aUncertainty in w a v e l e n g t h _+ 0.005 nm, cor responding to -+ 0.5 cm -~ uncer ta inty in energy.
1144 W.L. Clevenger et al./Spectrochimica Acta Part B 52 (1997) 1139-1149
cell, while the other was connected to a low-noise charge-sensitive preamplifier (Avangard, Inc., Russia). The amplified signal was averaged using a boxcar averager (Model SR560, Stanford Research Systems, Sunnyvale, CA) and recorded on a laptop computer. In addition, the amplified LEI waveform was displayed on a fast digitizing oscil loscope (Model 620A, Tektronix, Beaverton, OR).
3 , R e s u l t s a n d d i s c u s s i o n
3.1. Assigning spectral lines
In order to observe the spectral lines that were
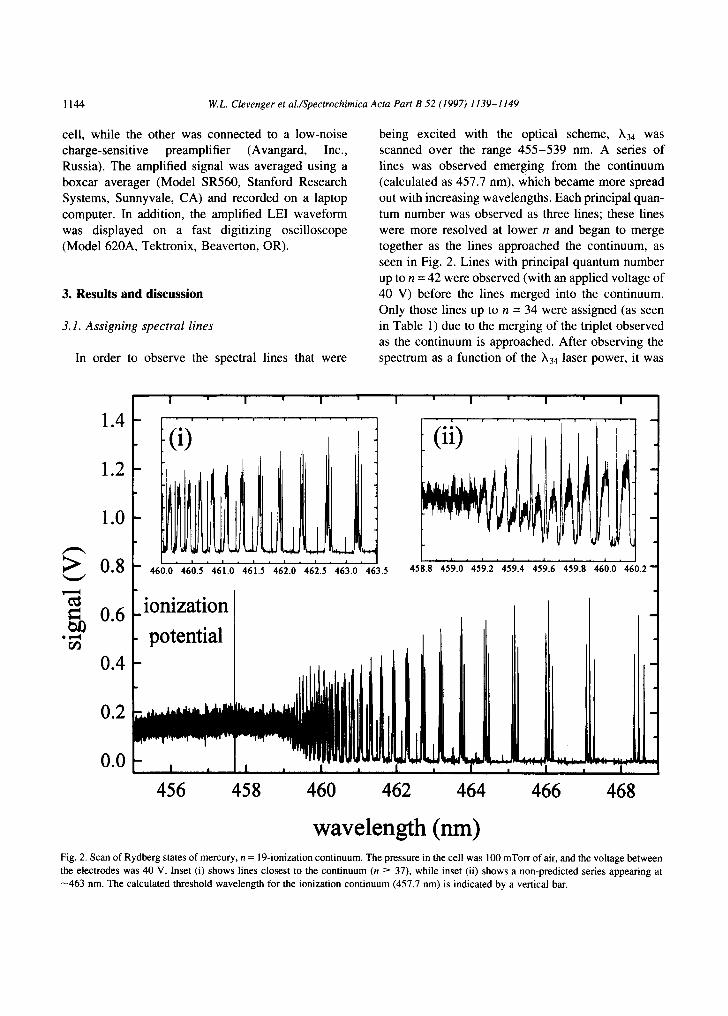
being excited with the optical scheme, )k34 was scanned over the range 455-539 nm. A series of lines was observed emerging from the continuum (calculated as 457.7 nm), which became more spread out with increasing wavelengths. Each principal quan- tum number was observed as three lines; these lines were more resolved at lower n and began to merge together as the lines approached the continuum, as seen in Fig. 2. Lines with principal quantum number up to n = 42 were observed (with an applied voltage of 40 V) before the lines merged into the continuum. Only those lines up to n = 34 were assigned (as seen in Table 1) due to the merging of the triplet observed as the continuum is approached. After observing the spectrum as a function of the )k34 laser power, it was
1.4
1.2
1.0
~" 0.8
= 0.6 * w,=,l
r~
0.4
0.2
0.0
I ' I ' I ' I ' I ' I ' I
i o
- 460.0 460.5 461.0 461.5 462.0 462.5 463.0 463.5 4 5 8 8 4 5 9 0 4 5 9 2 4 5 9 4 4 5 9 6 4 5 9 8 4 6 0 0 4 6 0 2
ionization
potential
I I I I I , I
456 458 460 462
d ~ I
,~ ~ :=._1. I . . . . . ~ . . . . . . . I I I . . . . " T ' - - ' ]
464 466 468
wavelength (nm) Fig. 2. Scan of Rydberg states of mercury, n = 19-ionization continuum. The pressure in the cell was 100 mTorr of air, and the voltage between the electrodes was 40 V. Inset (i) shows lines closest to the continuum (n -> 37), while inset (ii) shows a non-predicted series appearing at -463 nm. The calculated threshold wavelength for the ionization continuum (457.7 nm) is indicated by a vertical bar.
1146 W.L. Clevenger et al./Spectrochimica Acta Part B 52 (1997) 1139-1149
(a) 0.5 , ,
0.4
0.3
> 0.2
t~
0.1
0.0
-0.1 , [ 462.0 463.5
3 o
P2
1 , ot o [ P1 I P1
i I ~ I
462.5 463.0 w a v e l e n g t h (nm)
(b) I i
1.0 3p.
0.8
P1 3 o Pl
- n = 2 5
0.0 ~ ~
-0.2 , I , I , 462.0 462.5 463.0 463.5
w a v e l e n g t h (nm)
0.6
t~ 0.4
.,,-i
0.2
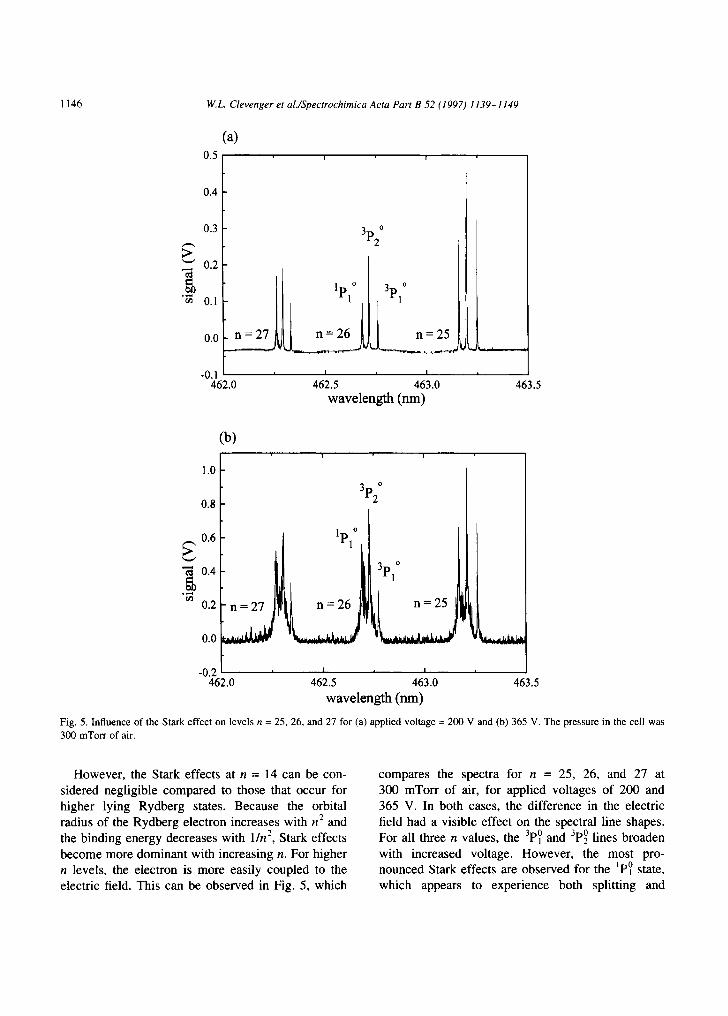
Fig. 5. Influence of the Stark effect on levels n = 25, 26, and 27 for (a) applied voltage = 200 V and (b) 365 V. The pressure in the cell was 300 mTorr of air.
However, the Stark effects at n = 14 can be con- sidered negligible compared to those that occur for higher lying Rydberg states. Because the orbital radius of the Rydberg electron increases with n 2 and the binding energy decreases with 1/n 2, Stark effects become more dominant with increasing n. For higher n levels, the electron is more easily coupled to the electric field. This can be observed in Fig. 5, which
compares the spectra for n = 25, 26, and 27 at 300 mTorr of air, for applied voltages of 200 and 365 V. In both cases, the difference in the electric field had a visible effect on the spectral line shapes. For all three n values, the 3p0 and 3p0 lines broaden
with increased voltage. However, the most pro- nounced Stark effects are observed for the ~p0 state, which appears to experience both splitting and
W.L. Clevenger et al./Spectrochimica Acta Part B 52 (1997) 1139-1149 1145
2.0
1.5
> 1.0
0.5
0.0
3 o
P1
i I i I i " I I I
499.15 499.20 499.25
wavelength (nm)
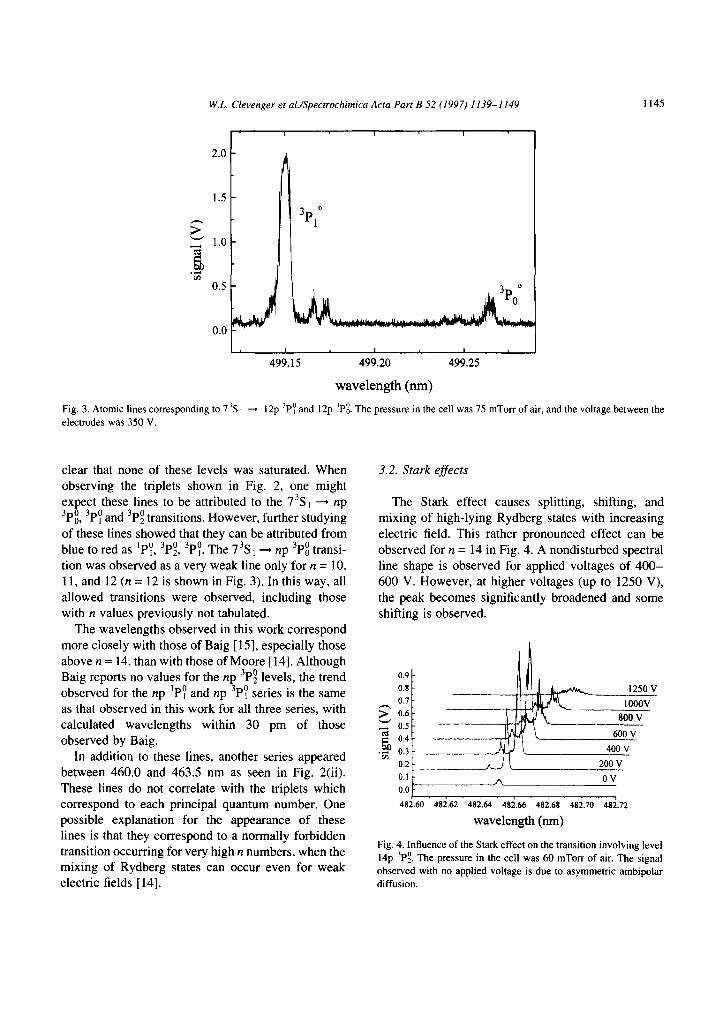
Fig. 3. Atomic lines corresponding to 73S ~ ~ 12p 3pO and 12p 3Po°. The pressure in the cell was 75 mTorr of air, and the voltage between the electrodes was 350 V.
clear that none of these levels was saturated. When observing the triplets shown in Fig. 2, one might expect these lines to be attributed to the 73S1 --~ np 3p00 ' 3p0 and 3p0 transitions. However, further studying of these lines showed that they can be attributed from blue to red as ip0, 3p0, 3p0. The 73S1 ~ np 3p0 transi- tion was observed as a very weak line only for n = 10, 11, and 12 (n = 12 is shown in Fig. 3). In this way, all allowed transitions were observed, including those with n values previously not tabulated.
The wavelengths observed in this work correspond more closely with those of Baig [15], especially those above n = 14, than with those of Moore [14]. Although Baig reports no values for the np 3p0 levels, the trend observed for the np 1p0 and np 3p0 series is the same as that observed in this work for all three series, with calculated wavelengths within 30 pm of those observed by Baig.
In addition to these lines, another series appeared between 460.0 and 463.5 nm as seen in Fig. 2(ii). These lines do not correlate with the triplets which correspond to each principal quantum number. One possible explanation for the appearance of these lines is that they correspond to a normally forbidden transition occurring for very high n numbers, when the mixing of Rydberg states can occur even for weak electric fields [14].
3.2. Stark effects
The Stark effect causes splitting, shifting, and mixing of high-lying Rydberg states with increasing electric field. This rather pronounced effect can be observed for n = 14 in Fig. 4. A nondisturbed spectral line shape is observed for applied voltages of 400- 600 V. However, at higher voltages (up to 1250 V), the peak becomes significantly broadened and some shifting is observed.
09
o.s 1250 v
0.7 1]1 ~ j ~ IO00V >. 0.6 - ~ ~ . 800 V
0.5 ' ¢¢ 600 v 0.4
• ~ 0.3 400 v 0.2 200 v
0.! ,..'N o v 0.0
- , - , • , • , • , ' i
482.60 482.62 482.64 482.66 482.68 482.70 482.72
wavelength (nm)
Fig. 4. Influence of the Stark effect on the transition involving level 14p 3p0. The pressure in the cell was 60 mTorr of air. The signal observed with no applied voltage is due to asymmetric ambipolar diffusion.
W.L. Clevenger et al./Spectrochimica Acta Part B 52 (1997) 1139-1149 1147
0.5
0.4
,'-, 0.3
"-~ 0.2
• ~ O.l
0.0
n
20 ~ _ ~
. , . , • , . , . , . , .
535.1 535.2 535.3 535.4 535.5 535.6 535.7
wavelength (nm)
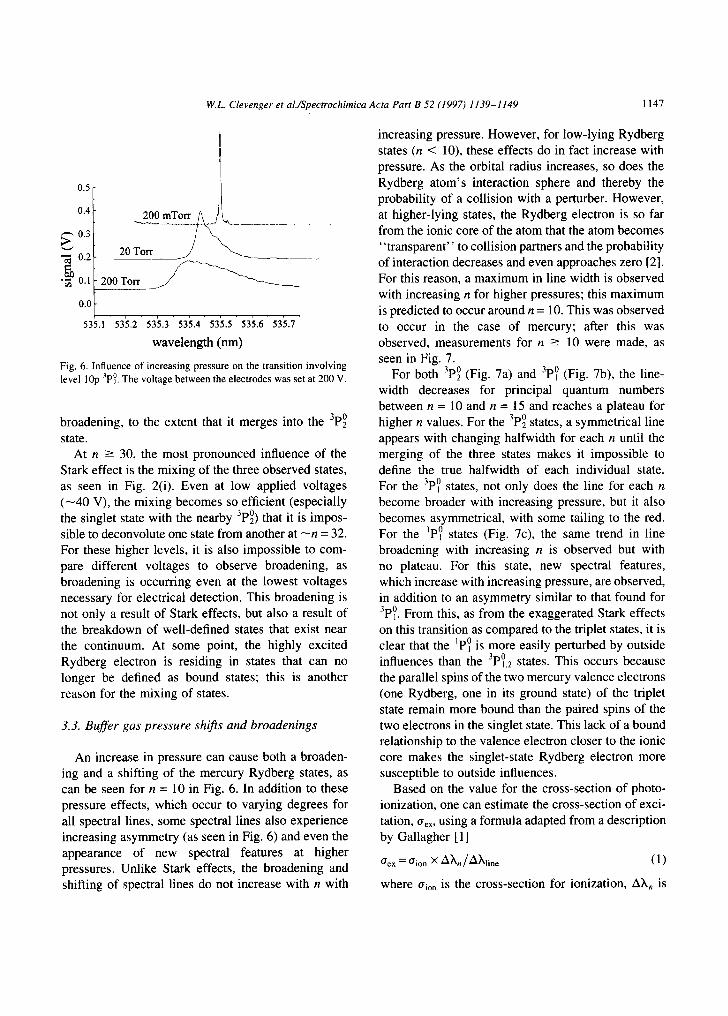
Fig. 6. Influence of increasing pressure on the transition involving level 10p 3p0. The voltage between the electrodes was set at 200 V.
broadening, to the extent that it merges into the 3p0 state.
At n --> 30, the most pronounced influence of the Stark effect is the mixing of the three observed states, as seen in Fig. 2(i). Even at low applied voltages ( - 4 0 V), the mixing becomes so efficient (especially the singlet state with the nearby 3p0) that it is impos- sible to deconvolute one state from another at - n = 32. For these higher levels, it is also impossible to com- pare different voltages to observe broadening, as broadening is occurring even at the lowest voltages necessary for electrical detection. This broadening is not only a result of Stark effects, but also a result of the breakdown of well-defined states that exist near the continuum. At some point, the highly excited Rydberg electron is residing in states that can no longer be defined as bound states; this is another reason for the mixing of states.
3.3. Buffer gas pressure shifts and broadenings
An increase in pressure can cause both a broaden- ing and a shifting of the mercury Rydberg states, as can be seen for n = 10 in Fig. 6. In addition to these pressure effects, which occur to varying degrees for all spectral lines, some spectral lines also experience increasing asymmetry (as seen in Fig. 6) and even the appearance of new spectral features at higher pressures. Unlike Stark effects, the broadening and shifting of spectral lines do not increase with n with
increasing pressure. However, for low-lying Rydberg states (n < 10), these effects do in fact increase with pressure. As the orbital radius increases, so does the Rydberg atom's interaction sphere and thereby the probability of a collision with a perturber. However, at higher-lying states, the Rydberg electron is so far from the ionic core of the atom that the atom becomes "transparent" to collision partners and the probability of interaction decreases and even approaches zero [2]. For this reason, a maximum in line width is observed with increasing n for higher pressures; this maximum is predicted to occur around n = 10. This was observed to occur in the case of mercury; after this was observed, measurements for n -> 10 were made, as seen in Fig. 7.
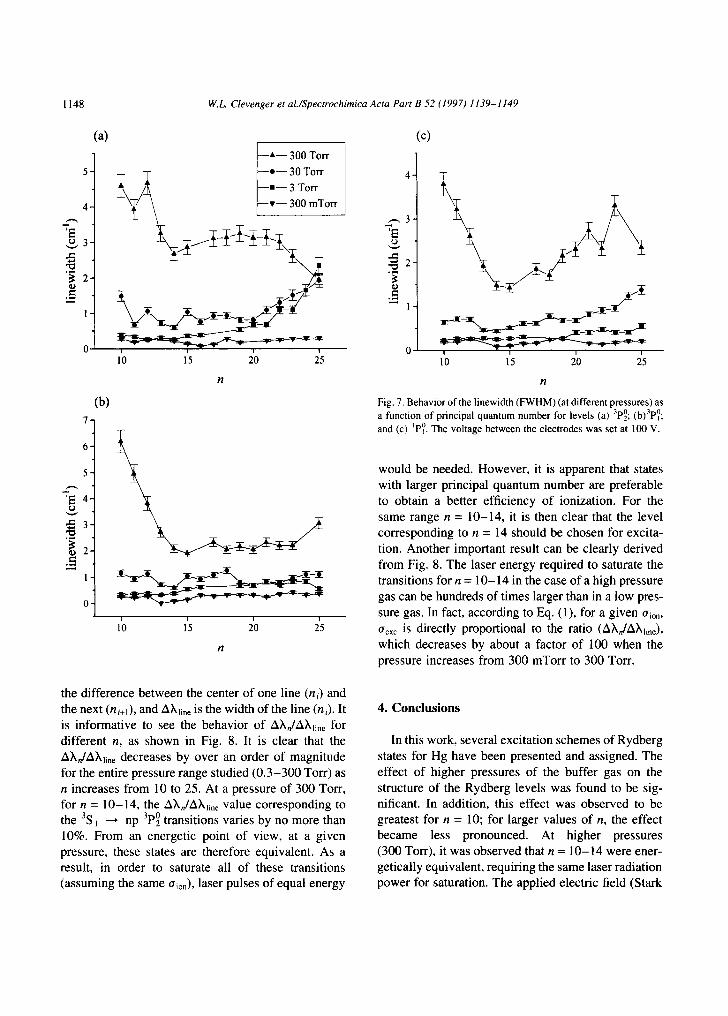
For both 3p0 (Fig. 7a) and 3pl° (Fig. 7b), the line- width decreases for principal quantum numbers between n = 10 and n = 15 and reaches a plateau for higher n values. For the 3p0 states, a symmetrical line appears with changing halfwidth for each n until the merging of the three states makes it impossible to define the true halfwidth of each individual state. For the 3p0 states, not only does the line for each n become broader with increasing pressure, but it also becomes asymmetrical, with some tailing to the red. For the ip0 states (Fig. 7c), the same trend in line broadening with increasing n is observed but with no plateau. For this state, new spectral features, which increase with increasing pressure, are observed, in addition to an asymmetry similar to that found for 3p°l. From this, as from the exaggerated Stark effects on this transition as compared to the triplet states, it is clear that the 1p0 is more easily perturbed by outside influences than the 3P°2 states. This occurs because the parallel spins of the two mercury valence electrons (one Rydberg, one in its ground state) of the triplet state remain more bound than the paired spins of the two electrons in the singlet state. This lack of a bound relationship to the valence electron closer to the ionic core makes the singlet-state Rydberg electron more susceptible to outside influences.
Based on the value for the cross-section of photo- ionization, one can estimate the cross-section of exci- tation, aex, using a formula adapted from a description by Gallagher [ 1 ]
O'ex ---- O'io n X m)kn/A)kline (1)
where trio n is the cross-section for ionization, AXn is
1148 W.L. Clevenger et al./Spectrochimica Acta Part B 52 (1997) 1139-1149
4 -
'6
o ~
~ 2 -
.=. m
1-
(a)
5-
7-
6-
5 -
'6 4-
~3. o ~
~2. 1-
o.
(b)
- - * - - 300 Torr ~- - - I - - 30 Torr /
/~, - -m-- 3 Torr ~ ] ~ - / / ~ - - v - - 300 mTorr
10 15 20 25
n
1'5 n
(c)
4.
, - , 3 . '6
~2
.,=
T
S
10 15 20 25
Fig. 7. Behavior of the linewidth (FWHM) (at different pressures) as a function of principal quantum number for levels (a) 3pO; (b)3p0; and (c) ~p0. The voltage between the electrodes was set at 100 V.
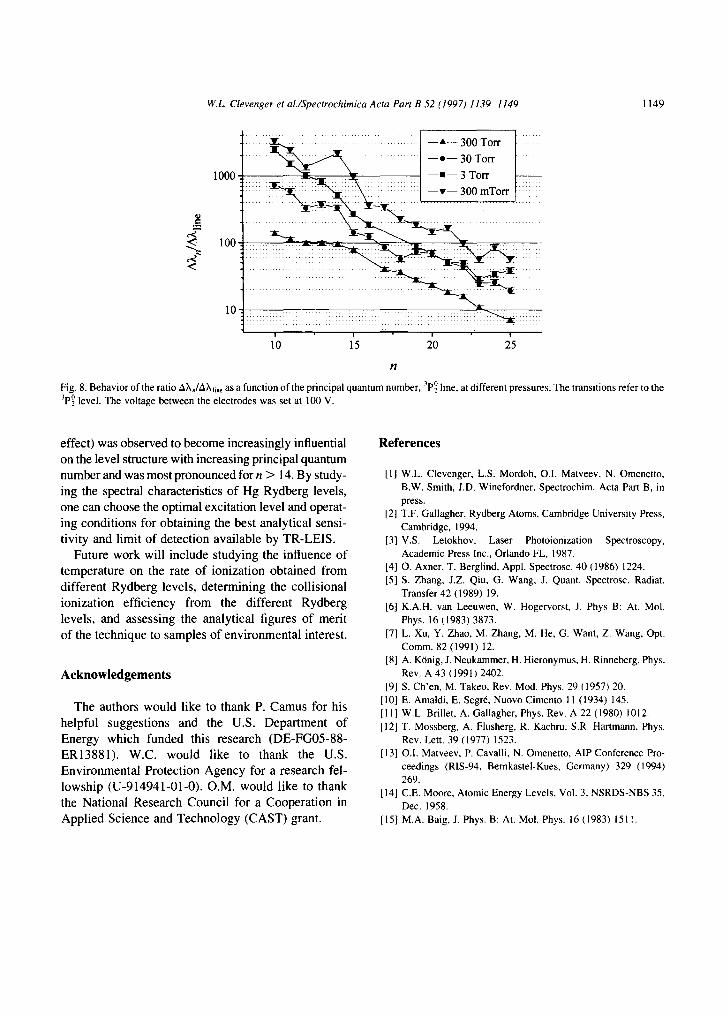
would be needed. However, it is apparent that states with larger principal quantum number are preferable to obtain a better efficiency of ionization. For the same range n = 10-14, it is then clear that the level corresponding to n = 14 should be chosen for excita- tion. Another important result can be clearly derived from Fig. 8. The laser energy required to saturate the transitions for n = 10-14 in the case of a high pressure gas can be hundreds of times larger than in a low pres- sure gas. In fact, according to Eq. (1), for a given O'ion, aexc is directly proportional to the ratio (A~,,,/A~li,¢), which decreases by about a factor of 100 when the pressure increases from 300 mTorr to 300 Torr.
the difference between the center of one line (ni) and the next (ni+l), and A~,line is the width of the line (ni). It is informative to see the behavior of A)kn/A)kline for different n, as shown in Fig. 8. It is clear that the A~,n/A~,~i,e decreases by over an order of magnitude for the entire pressure range studied (0 .3-300 Torr) as n increases from 10 to 25. At a pressure of 300 Torr, for n = 10-14, the A)kn/AXline value corresponding to the 3S j ~ np 3pO transitions varies by no more than 10%. From an energetic point of view, at a given pressure, these states are therefore equivalent. As a result, in order to saturate all of these transitions (assuming the s a m e trion), laser pulses of equal energy
4. C o n c l u s i o n s
In this work, several excitation schemes of Rydberg states for Hg have been presented and assigned. The effect of higher pressures of the buffer gas on the structure of the Rydberg levels was found to be sig- nificant. In addition, this effect was observed to be greatest for n = 10; for larger values of n, the effect became less pronounced. At higher pressures (300 Torr), it was observed that n = 10-14 were ener- getically equivalent, requiring the same laser radiation power for saturation. The applied electric field (Stark
W.L. Clevenger et al./Spectrochimica Acta Part B 52 (1997) 1139-1149 1149
. . . . . . % ~ . - - 3 0 T o ~ . . . . .
100 . . . . . . . . . . . . . . . . ..~ : : : : : : : " : ' : : : : : ::-::::::::!:!!!!Z!!!!
,o !
10 15 20 25
n
Fig. 8. Behavior of the ratio AX,~X,.e as a Nnction of the principal quantum number, 3p~ line, at d i ~ n t p~ssnres. The transitions ~ r to the 3p~ level. ~ e voltage between the electr~es was set at 1 ~ V.
effect) was observed to become increasingly influential on the level structure with increasing principal quantum number and was most pronounced for n > 14. By study- ing the spectral characteristics of Hg Rydberg levels, one can choose the optimal excitation level and operat- ing conditions for obtaining the best analytical sensi- tivity and limit of detection available by TR-LEIS.
Future work will include studying the influence of temperature on the rate of ionization obtained from different Rydberg levels, determining the collisional ionization efficiency from the different Rydberg levels, and assessing the analytical figures of merit of the technique to samples of environmental interest.
Acknowledgements
The authors would like to thank P. Camus for his helpful suggestions and the U.S. Department of Energy which funded this research (DE-FG05-88- ER13881). W.C. would like to thank the U.S. Environmental Protection Agency for a research fel- lowship (U-914941-01-0). O.M. would like to thank the National Research Council for a Cooperation in Applied Science and Technology (CAST) grant.
References
[1] W.L. Clevenger, L.S. Mordoh, O.I. Matveev, N. Omenetto, B.W. Smith, J.D. Winefordner, Spectrochim. Acta Part B, in press.
[2] T.F. Gallagher, Rydberg Atoms, Cambridge University Press, Cambridge, 1994.
[3] V.S. Letokhov, Laser Photoionization Spectroscopy, Academic Press Inc., Orlando FL, 1987.
[4] O. Axner, T. Berglind, Appl. Spectrosc. 40 (1986) 1224. [5] S. Zhang, J.Z. Qiu, G. Wang, J. Quant. Spectrosc. Radiat.
Transfer 42 (1989) 19. [6] K.A.H. van Leeuwen, W. Hogervorst, J. Phys B: At. Mol.
Phys. 16 (1983) 3873. [7] L. Xu, Y. Zhao, M. Zhang, M. He, G. Want, Z. Wang, Opt.
Comm. 82 (1991) 12. [8] A. Ktinig, J. Neukammer, H. Hieronymus, H. Rinneberg, Phys.
Rev. A 43 (1991) 2402. [9] S. Ch'en, M. Takeo, Rev. Mod. Phys. 29 (1957) 20.
[10] E. Amaldi, E. Segr6, Nuovo Cimento I1 (1934) 145. [ l l ] W.L. Brillet, A. Gallagher, Phys. Rev. A 22 (1980) 1012. [12] T. Mossberg, A. Flusherg, R. Kachru, S.R. Hartmann, Phys.
Rev. Lett. 39 (1977) 1523. [13] O.I. Matveev, P. Cavalli, N. Omenetto, AlP Conference Pro-
ceedings (RIS-94, Bemkastel-Kues, Germany) 329 (1994) 269.
[14] C.E. Moore, Atomic Energy Levels, Vol. 3, NSRDS-NBS 35, Dec. 1958.
[15] M.A. Baig, J. Phys. B: At. Mol. Phys. 16 (1983) 1511.
Related Documents


![Electron-Impact Excitation and Ionization in Airinitial and final states of the atom/molecule. The NIST database [18] lists 381 levels for N atom not counting the high Rydberg states.](https://static.cupdf.com/doc/110x72/612821a2f44e3444eb496479/electron-impact-excitation-and-ionization-in-air-initial-and-final-states-of-the.jpg)


