Large diurnal temperature fluctuations in the nearshore water column David M. Kaplan a, * , John L. Largier b , Sergio Navarrete a , Ricardo Guin˜ez a , Juan Carlos Castilla a a Centro de Estudios Avanzados en Ecologı´a and Biodiversidad and Estacio ´n Costera de Investigaciones Marinas, Pontificia Universidad Cato ´lica, Casilla 114-D, Santiago Chile b Scripps Institution of Oceanography, Integrative Oceanography Division, University of California, San Diego, 0209, La Jolla, CA 92093-0209, USA Received 22 April 2002; received in revised form 11 September 2002; accepted 18 September 2002 Abstract Large daily temperature fluctuations in the nearshore water column have been observed at several sites along the coast of central and northern Chile, particularly during summertime. These fluctuations are often on the order of the seasonal fluctuation in sea- surface temperature for the area and are capable, in certain locations, of penetrating deep (10–15 m) into the water column during the course of a single day. We explain this phenomenon by a combination of solar heating of the sea surface and wind-driven transport and accumulation of these warm, surface waters near shore. Measurements of surface heat flux agree roughly with observed daytime changes in the heat content of the nearshore water column. The strength of these diurnal fluctuations is shown to vary with the strength of coastal upwelling in the area. The potential consequences of this process for nearshore larval transport are unknown, but we briefly speculate about its importance. Ó 2003 Elsevier Science B.V. All rights reserved. Keywords: diurnal cycles; water temperature; coastal waters; wind; onshore transport; mixed layers; heat budget; upwelling; chile coast 1. Introduction In recent years, there has been much emphasis on better understanding the physical characteristics and variability of nearshore waters, particularly as they affect the basic biology, physiology, and ecology of benthic organisms (e.g. Connolly & Roughgarden, 1999; Farrell, Bracher, & Roughgarden, 1991; Graham & Largier, 1997; Leichter, Shellenbarger, Genovese, & Wing, 1998; Pineda, 1991, 1995; Sanford, 1999; Wing, Botsford, Largier, & Morgan, 1995; Witman, Leichter, Genovese, & Brooks, 1993). Great advances have been made in our basic understand- ing of nearshore oceanographic conditions. Different scales of variability have been identified and associated with specific processes. For example, on an inter-annual scale, the El Nin˜ o Southern Oscillation (ENSO)dramat- ically affects water temperatures and the strength of upwelling favorable winds in coastal areas, producing noticeable changes in several important physical variables (Lluch-Cota, Wooster, & Hare, 2001; Ramp, McClean, Collins, Semtner, & Hays, 1997), which in turn have important effects on benthic populations (Connolly & Roughgarden, 1999; Gaines, 1998). On the scale of months, seasonal changes in surface water temperature, produced by seasonal variation in solar radiation, are usually considered the largest environmental variability to which coastal organisms are subjected in temperate habitats (Pfister, 1997; Williams & Williams, 1997). On the scale of days to weeks, coastal upwelling dynamics is a major factor, producing large drops in sea-surface temperature, accompanied by increases in nutrient avail- ability and changes in the delivery of invertebrate larvae to benthic habitats (Graham, Field & Potts, 1992; Graham & Largier, 1997; Roughgarden, Pennington, Stoner, Alexander, & Miller, 1991; Shanks, Largier, & Brink, * Corresponding author. Department of Wildlife, Fish and Con- servation Biology, University of California, Davis, CA 95616, USA. E-mail address: [email protected] (D.M. Kaplan). Estuarine, Coastal and Shelf Science 57 (2003) 385–398 0272-7714/03/$ - see front matter Ó 2003 Elsevier Science B.V. All rights reserved. doi:10.1016/S0272-7714(02)00363-3

Welcome message from author
This document is posted to help you gain knowledge. Please leave a comment to let me know what you think about it! Share it to your friends and learn new things together.
Transcript
Estuarine, Coastal and Shelf Science 57 (2003) 385–398
Large diurnal temperature fluctuationsin the nearshore water column
David M. Kaplana,*, John L. Largierb, Sergio Navarretea,Ricardo Guineza, Juan Carlos Castillaa
aCentro de Estudios Avanzados en Ecologıa and Biodiversidad and Estacion Costera de Investigaciones Marinas,
Pontificia Universidad Catolica, Casilla 114-D, Santiago ChilebScripps Institution of Oceanography, Integrative Oceanography Division, University of California, San Diego, 0209, La Jolla, CA 92093-0209, USA
Received 22 April 2002; received in revised form 11 September 2002; accepted 18 September 2002
Abstract
Large daily temperature fluctuations in the nearshore water column have been observed at several sites along the coast of centraland northern Chile, particularly during summertime. These fluctuations are often on the order of the seasonal fluctuation in sea-
surface temperature for the area and are capable, in certain locations, of penetrating deep (10–15m) into the water column duringthe course of a single day. We explain this phenomenon by a combination of solar heating of the sea surface and wind-driventransport and accumulation of these warm, surface waters near shore. Measurements of surface heat flux agree roughly with
observed daytime changes in the heat content of the nearshore water column. The strength of these diurnal fluctuations is shown tovary with the strength of coastal upwelling in the area. The potential consequences of this process for nearshore larval transport areunknown, but we briefly speculate about its importance.� 2003 Elsevier Science B.V. All rights reserved.
Keywords: diurnal cycles; water temperature; coastal waters; wind; onshore transport; mixed layers; heat budget; upwelling; chile coast
1. Introduction
In recent years, there has beenmuch emphasis onbetterunderstanding the physical characteristics and variabilityof nearshore waters, particularly as they affect the basicbiology, physiology, and ecology of benthic organisms(e.g. Connolly &Roughgarden, 1999; Farrell, Bracher, &Roughgarden, 1991; Graham & Largier, 1997; Leichter,Shellenbarger, Genovese, & Wing, 1998; Pineda, 1991,1995; Sanford, 1999;Wing, Botsford, Largier, &Morgan,1995; Witman, Leichter, Genovese, & Brooks, 1993).Great advances have been made in our basic understand-ing of nearshore oceanographic conditions. Differentscales of variability have been identified and associatedwith specific processes. For example, on an inter-annual
* Corresponding author. Department of Wildlife, Fish and Con-
servation Biology, University of California, Davis, CA 95616, USA.
E-mail address: [email protected] (D.M. Kaplan).
0272-7714/03/$ - see front matter � 2003 Elsevier Science B.V. All rights r
doi:10.1016/S0272-7714(02)00363-3
scale, the El Nino Southern Oscillation (ENSO) dramat-ically affects water temperatures and the strength ofupwelling favorable winds in coastal areas, producingnoticeable changes in several important physical variables(Lluch-Cota, Wooster, & Hare, 2001; Ramp, McClean,Collins, Semtner, & Hays, 1997), which in turn haveimportant effects on benthic populations (Connolly &Roughgarden, 1999; Gaines, 1998). On the scale ofmonths, seasonal changes in surface water temperature,produced by seasonal variation in solar radiation, areusually considered the largest environmental variabilityto which coastal organisms are subjected in temperatehabitats (Pfister, 1997; Williams & Williams, 1997). Onthe scale of days to weeks, coastal upwelling dynamics is amajor factor, producing large drops in sea-surfacetemperature, accompanied by increases in nutrient avail-ability and changes in thedeliveryof invertebrate larvae tobenthic habitats (Graham, Field & Potts, 1992; Graham& Largier, 1997; Roughgarden, Pennington, Stoner,Alexander, & Miller, 1991; Shanks, Largier, & Brink,
eserved.
386 D.M. Kaplan et al. / Estuarine, Coastal and Shelf Science 57 (2003) 385–398
2000; Smith, Heburn, Barber, & O’Brien, 1983; Winget al., 1995). On shorter time scales (less than a day), therehas been an effort to describe and understand internaltidal waves and bores (Leichter et al., 1998; Pineda, 1991,1995, 1999; Shanks, 1998; Shanks&Wright, 1987;Winant& Bratkovich, 1981; Witman et al., 1993), as well as tides(Christy & Morgan, 1998; Morgan, 1996).
Here we describe large daily changes in the surfacetemperature of coastal waters that are not due to internaltide activity, but rather represent a diurnal (day–night)cycle. While diurnal warming has received attention (e.g.Price, Weller, & Pinkel, 1986), the importance of the sea-breeze and its interaction with daily warming of coastalwaters have received little recent attention in theliterature, either from oceanographers or biologists.Recent articles on coastal sea-breeze effects includeHyder, Simpson, and Christopoulos (2002), who modelthe current response to sea-breeze forcing, and Lerczak,Hensershott, and Winant (2001), who argue for aresonance of daily sea-breeze forcing with the inertialfrequency in a band of latitudes near 30�, due to vorticityin the mean flow (see also Foster, 1993; McCreary et al.,2001; Paduan & Cook, 1997). In this article we addressthe interaction of the diurnal warming and diurnal windcycles. Off central and northern Chile, regular diurnalchanges in temperature represent the largest short-termtemperature signal to which temperate nearshore hab-itats are subject. This may be equally true elsewhere andthese temperature fluctuations can be expected to haveimportant effects on the biology and ecology of benthicorganisms, as well as on their larval stages.
The daily warming of lake waters and its interactionwith diurnal winds is well understood, both experimen-tally and theoretically (Imberger, 1985; Imberger &Parker, 1985; Imberger & Patterson, 1981; Monismith,1985; Spigel, Imberger, & Rayner, 1986). Solar radiationproduces a warm, diurnal surface mixed layer during thecourse of the day. The development of this mixed layerdepends largely on wind intensity. At low to moderatewinds, the layer is stable, although deepening may occurslowly and in a horizontally uniform fashion. However,the surface layer is moved by the wind and, for moderatewinds, a significant tilt of the thermocline results withdeepening of the mixed layer at the downwind shore and/or a shoaling of the mixed layer at the upwind shore. Athigher wind speeds, this tilting of the thermocline leadsto internal shear and instabilities that result in thedisappearance of the surface mixed layer from the up-wind shore. In lake studies, the Wedderburn number,W,has been used to indicate the balance between windforcing and thermocline tilt (Imberger &Hamblin, 1982):
W¼ g9h2=u2�L
where g9 ¼ gDq=q is the reduced acceleration of gravitydue to the density step Dq, h is the depth of the diurnal
mixed layer, u� ¼ffiffiffiffiffiffiffiffis=q
pis the surface shear velocity due
to wind stess s, and L is the length of the lake in thedirection of the wind. For large W, the mixed layer isstable and will be transported in the wind direction.Consecutive days of relatively moderate winds mayproduce a series of thermoclines in the lake watercolumn, each one the result of a daily warming cycle inthe past. The seasonal thermocline is essentially the limitof this process.
Here we describe how these warming and mixingprocesses appear to play out in coastal ocean waters,and we indicate a series of factors which increase ordecrease the importance of this cycle. We begin bydescribing the temperature record at two representativesites on the Chilean coast. Both sites show large dailyvariations in surface water temperatures, but thesevariations penetrate down to depth at only one of thesites. We attribute this to the presence of a regular,relatively moderate sea-breeze (onshore winds in theafternoon and evening) at this site and the resultingonshore transport of surface waters. Next, we comparethe daily variations at a number of sites along theChilean coast. Here we find that the size of the diurnalfluctuation is greater at sites where local coastalupwelling is relatively weak (relatively warmer watertemperatures, indicating more sheltered locations).Finally, we describe the results of a repeated cross-shore CTD transect that confirm that changes in thenearshore water column are closely related to the dailywind cycle. We also find that river outflow can play animportant local role in structuring the diurnal stratifi-cation cycle.
2. Materials and methods
2.1. Location of study sites and Chilean coastaloceanography
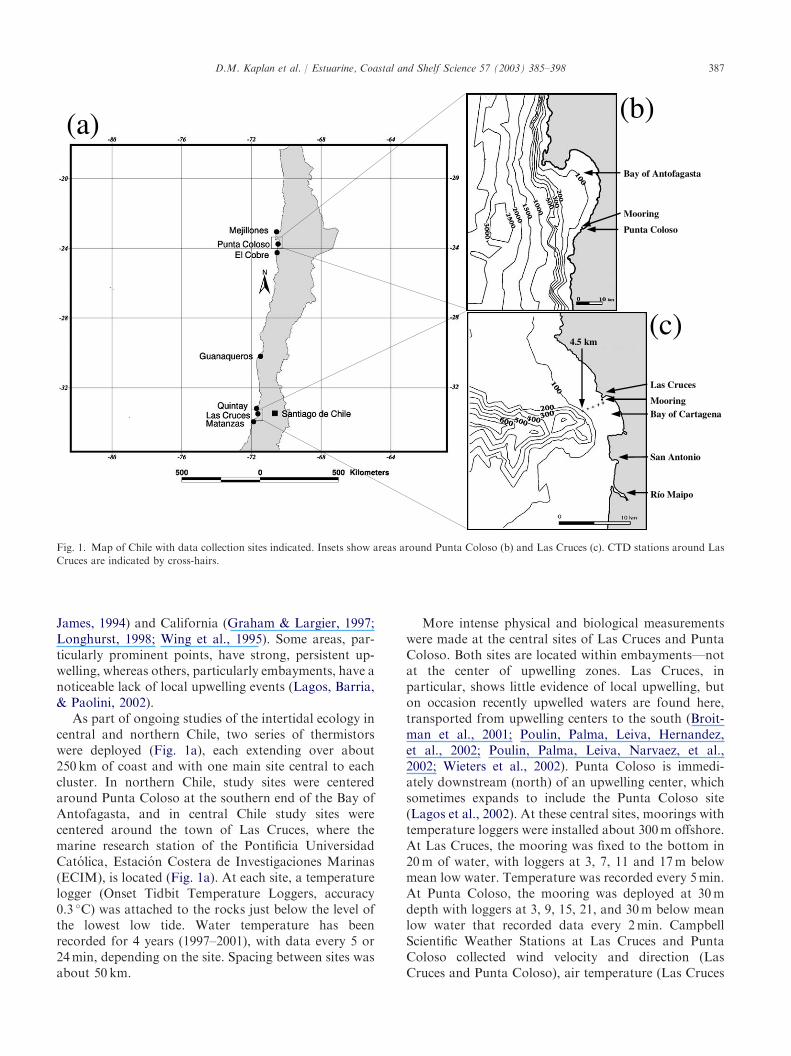
The study sites discussed in this paper are found incentral and northern Chile, between 24� and 34� latitude(Fig. 1a). This coastline is relatively straight, oriented ina North–South direction, and with few large bays orinlets. The continental shelf is generally narrow, rangingfrom a few to 20 km in width. This region is part of theHumboldt Current System (Santelices, 1991; Strub,Mesias, Montecino, Rutllant, & Salinas, 1998), withequatorward winds and currents—strongest in sum-mer—and important centers of coastal upwelling(Johnson, Fonseca, & Sievers, 1980; Longhurst, 1998).On closer examination of coastal temperature patternsone recognizes considerable patchiness in the distribu-tion of coastal upwelling (Broitman, Navarrete, Smith,& Gaines, 2001; Marın, Escribano, Delgado, Olivares, &Hidalgo, 2001; Strub et al., 1998; Wieters et al., 2003), asin Peru (Longhurst, 1998; Thomas, Huang, Strub, &
387D.M. Kaplan et al. / Estuarine, Coastal and Shelf Science 57 (2003) 385–398
Fig. 1. Map of Chile with data collection sites indicated. Insets show areas around Punta Coloso (b) and Las Cruces (c). CTD stations around Las
Cruces are indicated by cross-hairs.
James, 1994) and California (Graham & Largier, 1997;Longhurst, 1998; Wing et al., 1995). Some areas, par-ticularly prominent points, have strong, persistent up-welling, whereas others, particularly embayments, have anoticeable lack of local upwelling events (Lagos, Barria,& Paolini, 2002).
As part of ongoing studies of the intertidal ecology incentral and northern Chile, two series of thermistorswere deployed (Fig. 1a), each extending over about250 km of coast and with one main site central to eachcluster. In northern Chile, study sites were centeredaround Punta Coloso at the southern end of the Bay ofAntofagasta, and in central Chile study sites werecentered around the town of Las Cruces, where themarine research station of the Pontificia UniversidadCatolica, Estacion Costera de Investigaciones Marinas(ECIM), is located (Fig. 1a). At each site, a temperaturelogger (Onset Tidbit Temperature Loggers, accuracy0.3 �C) was attached to the rocks just below the level ofthe lowest low tide. Water temperature has beenrecorded for 4 years (1997–2001), with data every 5 or24min, depending on the site. Spacing between sites wasabout 50 km.
More intense physical and biological measurementswere made at the central sites of Las Cruces and PuntaColoso. Both sites are located within embayments—notat the center of upwelling zones. Las Cruces, inparticular, shows little evidence of local upwelling, buton occasion recently upwelled waters are found here,transported from upwelling centers to the south (Broit-man et al., 2001; Poulin, Palma, Leiva, Hernandez,et al., 2002; Poulin, Palma, Leiva, Narvaez, et al.,2002; Wieters et al., 2002). Punta Coloso is immedi-ately downstream (north) of an upwelling center, whichsometimes expands to include the Punta Coloso site(Lagos et al., 2002). At these central sites, moorings withtemperature loggers were installed about 300m offshore.At Las Cruces, the mooring was fixed to the bottom in20m of water, with loggers at 3, 7, 11 and 17m belowmean low water. Temperature was recorded every 5min.At Punta Coloso, the mooring was deployed at 30mdepth with loggers at 3, 9, 15, 21, and 30m below meanlow water that recorded data every 2min. CampbellScientific Weather Stations at Las Cruces and PuntaColoso collected wind velocity and direction (LasCruces and Punta Coloso), air temperature (Las Cruces
388 D.M. Kaplan et al. / Estuarine, Coastal and Shelf Science 57 (2003) 385–398
and Punta Coloso), humidity (Las Cruces only) andvisible radiation/PAR (Las Cruces only).
2.2. Repeated CTD transect
In addition to the time-series data, we conducted a12-hour CTD (conductivity–temperature–depth) surveyon December 5th, 2000, detailing how the verticalstructure of temperature and salinity changed over theday and with distance offshore from Las Cruces (Fig.1b). A line of five stations perpendicular to the coastlineand spaced 1 km apart was traveled 11 times during thecourse of the day. The first station was located 0.5 kmfrom shore. At each station vertical profiles of salinityand temperature were obtained with a SeaBird 19 CTD,a profile of chlorophyll fluorescence was obtained witha WET Labs WETSTAR mini-fluorometer. The resolu-tion of the different instruments was 0.01 �C fortemperature, 0.01% for salinity, 0.01m for depth, and0.03 lg/l for fluorescence.
2.3. Data analysis
Time-series analysis and data manipulation wereperformed using R (Ihaka & Gentleman, 1996). Long-term trends were removed by subtracting a 30-day
running-mean from the original data, and all data wereplaced on the same temporal scale. High-pass filteringwas also achieved by applying a 1-h running-mean to thedata. Spectral analyses were calculated on the filtereddata using a fast fourier transform, the result of whichwas later smoothed by applying a Daniell’s kernel(moving average) with a frequency bandwidth of 0.02per day. Hourly and day/night means were calculatedfor wind, air temperature and water temperature data.
3. Results
3.1. Temperature variability at Las Crucesand Punta Coloso
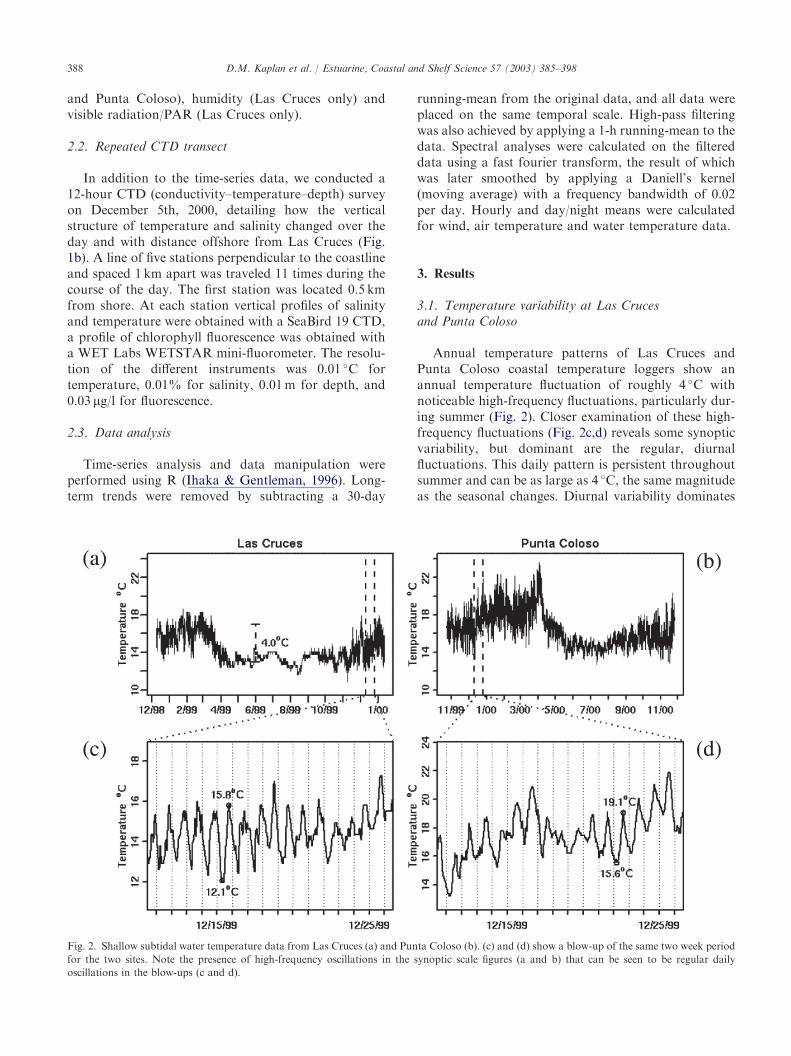
Annual temperature patterns of Las Cruces andPunta Coloso coastal temperature loggers show anannual temperature fluctuation of roughly 4 �C withnoticeable high-frequency fluctuations, particularly dur-ing summer (Fig. 2). Closer examination of these high-frequency fluctuations (Fig. 2c,d) reveals some synopticvariability, but dominant are the regular, diurnalfluctuations. This daily pattern is persistent throughoutsummer and can be as large as 4 �C, the same magnitudeas the seasonal changes. Diurnal variability dominates
Fig. 2. Shallow subtidal water temperature data from Las Cruces (a) and Punta Coloso (b). (c) and (d) show a blow-up of the same two week period
for the two sites. Note the presence of high-frequency oscillations in the synoptic scale figures (a and b) that can be seen to be regular daily
oscillations in the blow-ups (c and d).
389D.M. Kaplan et al. / Estuarine, Coastal and Shelf Science 57 (2003) 385–398
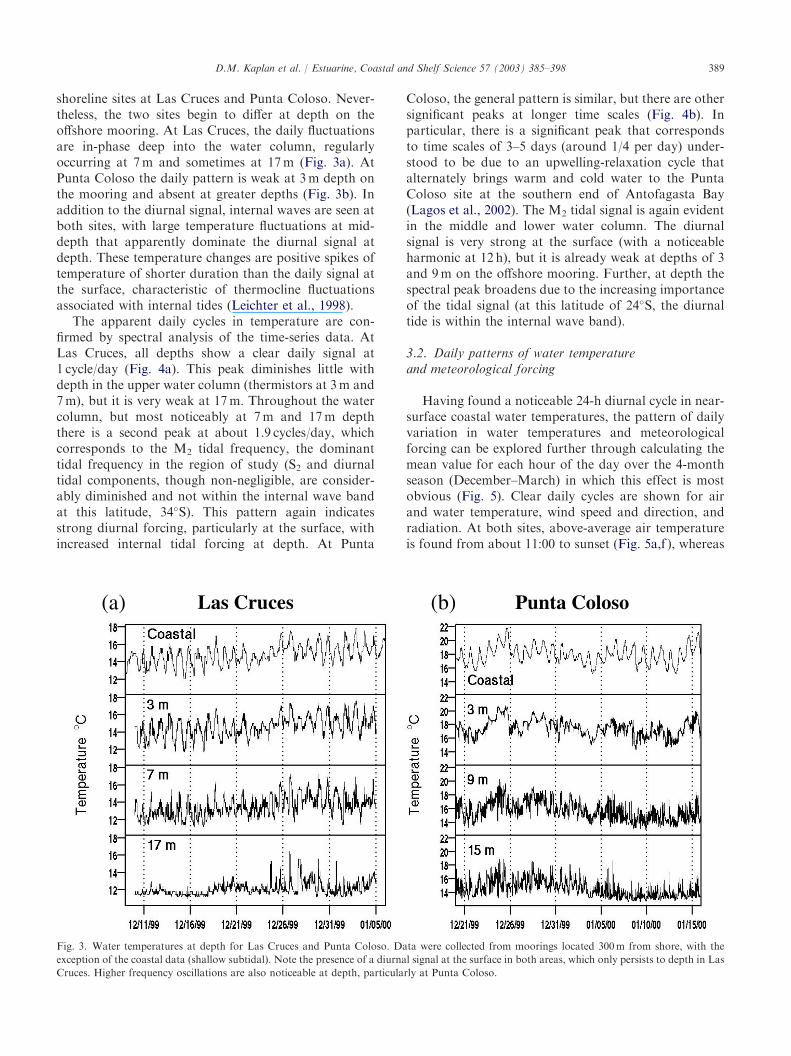
shoreline sites at Las Cruces and Punta Coloso. Never-theless, the two sites begin to differ at depth on theoffshore mooring. At Las Cruces, the daily fluctuationsare in-phase deep into the water column, regularlyoccurring at 7m and sometimes at 17m (Fig. 3a). AtPunta Coloso the daily pattern is weak at 3m depth onthe mooring and absent at greater depths (Fig. 3b). Inaddition to the diurnal signal, internal waves are seen atboth sites, with large temperature fluctuations at mid-depth that apparently dominate the diurnal signal atdepth. These temperature changes are positive spikes oftemperature of shorter duration than the daily signal atthe surface, characteristic of thermocline fluctuationsassociated with internal tides (Leichter et al., 1998).
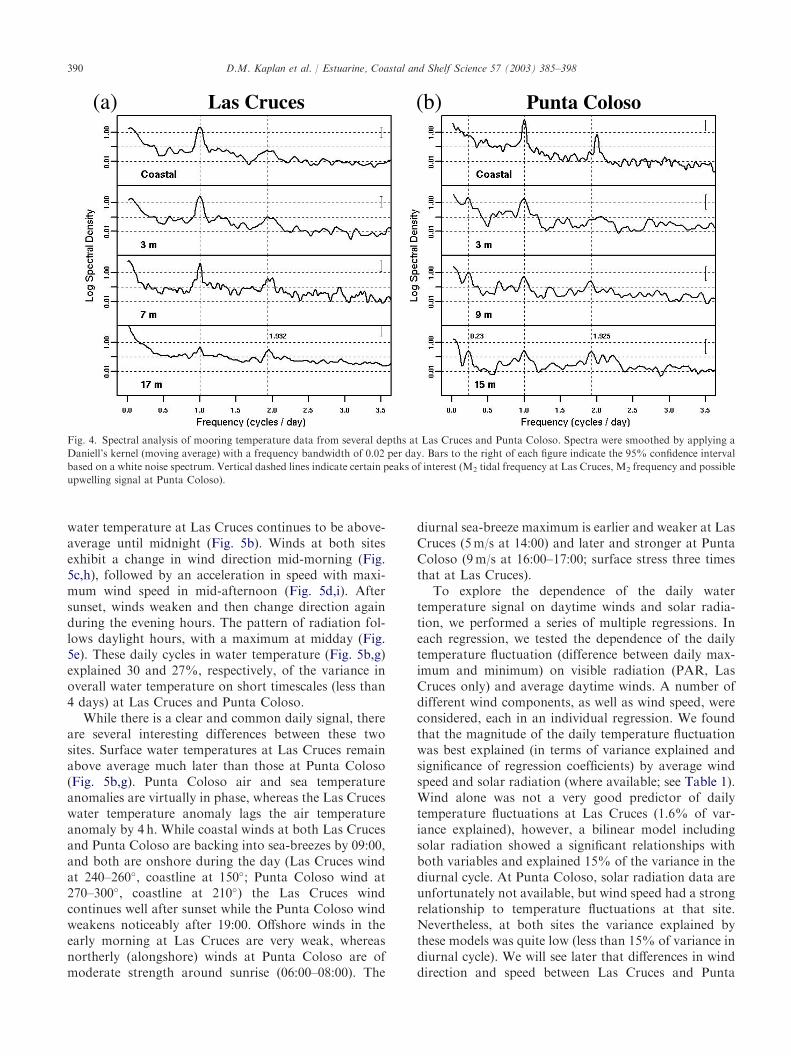
The apparent daily cycles in temperature are con-firmed by spectral analysis of the time-series data. AtLas Cruces, all depths show a clear daily signal at1 cycle/day (Fig. 4a). This peak diminishes little withdepth in the upper water column (thermistors at 3m and7m), but it is very weak at 17m. Throughout the watercolumn, but most noticeably at 7m and 17m depththere is a second peak at about 1.9 cycles/day, whichcorresponds to the M2 tidal frequency, the dominanttidal frequency in the region of study (S2 and diurnaltidal components, though non-negligible, are consider-ably diminished and not within the internal wave bandat this latitude, 34�S). This pattern again indicatesstrong diurnal forcing, particularly at the surface, withincreased internal tidal forcing at depth. At Punta
Coloso, the general pattern is similar, but there are othersignificant peaks at longer time scales (Fig. 4b). Inparticular, there is a significant peak that correspondsto time scales of 3–5 days (around 1/4 per day) under-stood to be due to an upwelling-relaxation cycle thatalternately brings warm and cold water to the PuntaColoso site at the southern end of Antofagasta Bay(Lagos et al., 2002). The M2 tidal signal is again evidentin the middle and lower water column. The diurnalsignal is very strong at the surface (with a noticeableharmonic at 12 h), but it is already weak at depths of 3and 9m on the offshore mooring. Further, at depth thespectral peak broadens due to the increasing importanceof the tidal signal (at this latitude of 24�S, the diurnaltide is within the internal wave band).
3.2. Daily patterns of water temperatureand meteorological forcing
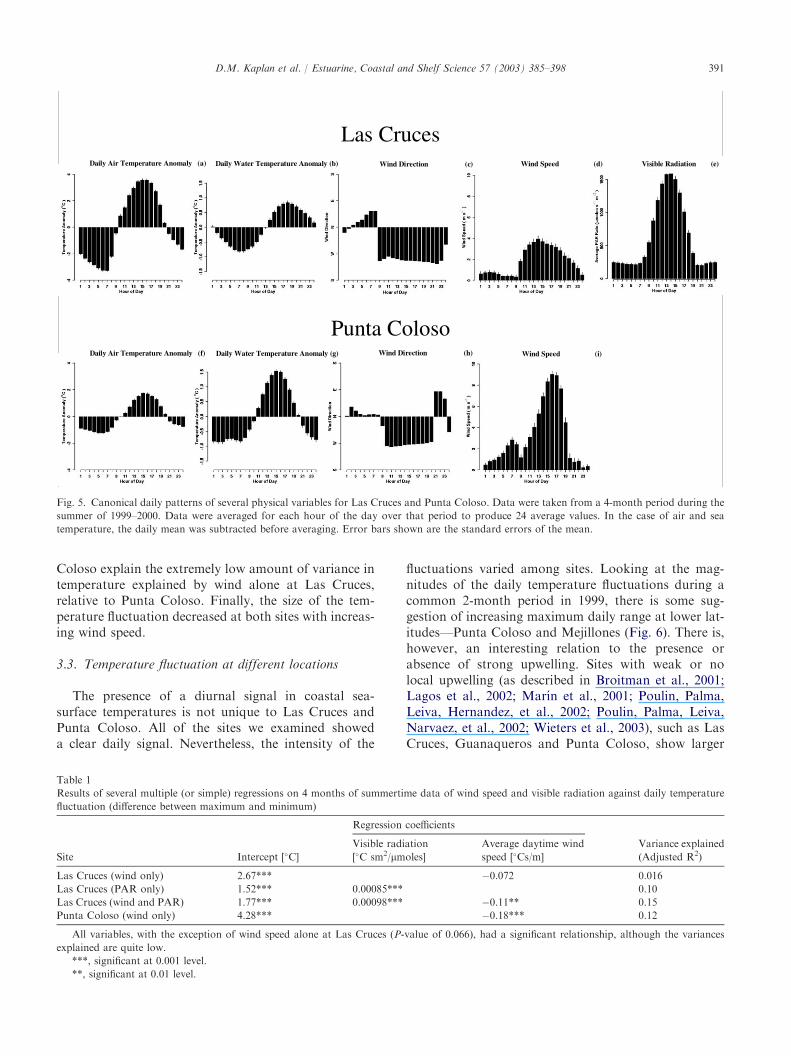
Having found a noticeable 24-h diurnal cycle in near-surface coastal water temperatures, the pattern of dailyvariation in water temperatures and meteorologicalforcing can be explored further through calculating themean value for each hour of the day over the 4-monthseason (December–March) in which this effect is mostobvious (Fig. 5). Clear daily cycles are shown for airand water temperature, wind speed and direction, andradiation. At both sites, above-average air temperatureis found from about 11:00 to sunset (Fig. 5a,f ), whereas
Fig. 3. Water temperatures at depth for Las Cruces and Punta Coloso. Data were collected from moorings located 300m from shore, with the
exception of the coastal data (shallow subtidal). Note the presence of a diurnal signal at the surface in both areas, which only persists to depth in Las
Cruces. Higher frequency oscillations are also noticeable at depth, particularly at Punta Coloso.
390 D.M. Kaplan et al. / Estuarine, Coastal and Shelf Science 57 (2003) 385–398
Fig. 4. Spectral analysis of mooring temperature data from several depths at Las Cruces and Punta Coloso. Spectra were smoothed by applying a
Daniell’s kernel (moving average) with a frequency bandwidth of 0.02 per day. Bars to the right of each figure indicate the 95% confidence interval
based on a white noise spectrum. Vertical dashed lines indicate certain peaks of interest (M2 tidal frequency at Las Cruces, M2 frequency and possible
upwelling signal at Punta Coloso).
water temperature at Las Cruces continues to be above-average until midnight (Fig. 5b). Winds at both sitesexhibit a change in wind direction mid-morning (Fig.5c,h), followed by an acceleration in speed with maxi-mum wind speed in mid-afternoon (Fig. 5d,i). Aftersunset, winds weaken and then change direction againduring the evening hours. The pattern of radiation fol-lows daylight hours, with a maximum at midday (Fig.5e). These daily cycles in water temperature (Fig. 5b,g)explained 30 and 27%, respectively, of the variance inoverall water temperature on short timescales (less than4 days) at Las Cruces and Punta Coloso.
While there is a clear and common daily signal, thereare several interesting differences between these twosites. Surface water temperatures at Las Cruces remainabove average much later than those at Punta Coloso(Fig. 5b,g). Punta Coloso air and sea temperatureanomalies are virtually in phase, whereas the Las Cruceswater temperature anomaly lags the air temperatureanomaly by 4 h. While coastal winds at both Las Crucesand Punta Coloso are backing into sea-breezes by 09:00,and both are onshore during the day (Las Cruces windat 240–260�, coastline at 150�; Punta Coloso wind at270–300�, coastline at 210�) the Las Cruces windcontinues well after sunset while the Punta Coloso windweakens noticeably after 19:00. Offshore winds in theearly morning at Las Cruces are very weak, whereasnortherly (alongshore) winds at Punta Coloso are ofmoderate strength around sunrise (06:00–08:00). The
diurnal sea-breeze maximum is earlier and weaker at LasCruces (5m/s at 14:00) and later and stronger at PuntaColoso (9m/s at 16:00–17:00; surface stress three timesthat at Las Cruces).
To explore the dependence of the daily watertemperature signal on daytime winds and solar radia-tion, we performed a series of multiple regressions. Ineach regression, we tested the dependence of the dailytemperature fluctuation (difference between daily max-imum and minimum) on visible radiation (PAR, LasCruces only) and average daytime winds. A number ofdifferent wind components, as well as wind speed, wereconsidered, each in an individual regression. We foundthat the magnitude of the daily temperature fluctuationwas best explained (in terms of variance explained andsignificance of regression coefficients) by average windspeed and solar radiation (where available; see Table 1).Wind alone was not a very good predictor of dailytemperature fluctuations at Las Cruces (1.6% of var-iance explained), however, a bilinear model includingsolar radiation showed a significant relationships withboth variables and explained 15% of the variance in thediurnal cycle. At Punta Coloso, solar radiation data areunfortunately not available, but wind speed had a strongrelationship to temperature fluctuations at that site.Nevertheless, at both sites the variance explained bythese models was quite low (less than 15% of variance indiurnal cycle). We will see later that differences in winddirection and speed between Las Cruces and Punta
391D.M. Kaplan et al. / Estuarine, Coastal and Shelf Science 57 (2003) 385–398
Fig. 5. Canonical daily patterns of several physical variables for Las Cruces and Punta Coloso. Data were taken from a 4-month period during the
summer of 1999–2000. Data were averaged for each hour of the day over that period to produce 24 average values. In the case of air and sea
temperature, the daily mean was subtracted before averaging. Error bars shown are the standard errors of the mean.
Coloso explain the extremely low amount of variance intemperature explained by wind alone at Las Cruces,relative to Punta Coloso. Finally, the size of the tem-perature fluctuation decreased at both sites with increas-ing wind speed.
3.3. Temperature fluctuation at different locations
The presence of a diurnal signal in coastal sea-surface temperatures is not unique to Las Cruces andPunta Coloso. All of the sites we examined showeda clear daily signal. Nevertheless, the intensity of the
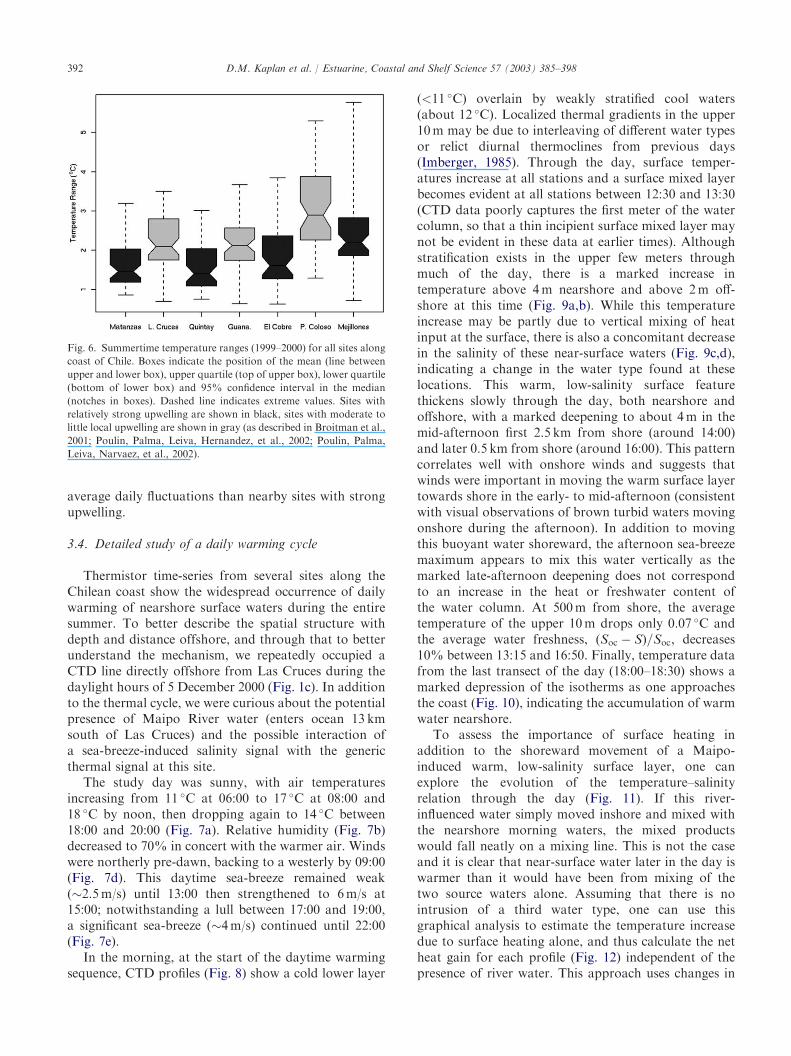
fluctuations varied among sites. Looking at the mag-nitudes of the daily temperature fluctuations during acommon 2-month period in 1999, there is some sug-gestion of increasing maximum daily range at lower lat-itudes—Punta Coloso and Mejillones (Fig. 6). There is,however, an interesting relation to the presence orabsence of strong upwelling. Sites with weak or nolocal upwelling (as described in Broitman et al., 2001;Lagos et al., 2002; Marın et al., 2001; Poulin, Palma,Leiva, Hernandez, et al., 2002; Poulin, Palma, Leiva,Narvaez, et al., 2002; Wieters et al., 2003), such as LasCruces, Guanaqueros and Punta Coloso, show larger
Table 1
Results of several multiple (or simple) regressions on 4 months of summertime data of wind speed and visible radiation against daily temperature
fluctuation (difference between maximum and minimum)
Site Intercept [�C]
Regression coefficients
Variance explained
(Adjusted R2)
Visible radiation
[�C sm2/lmoles]
Average daytime wind
speed [�Cs/m]
Las Cruces (wind only) 2.67*** �0.072 0.016
Las Cruces (PAR only) 1.52*** 0.00085*** 0.10
Las Cruces (wind and PAR) 1.77*** 0.00098*** �0.11** 0.15
Punta Coloso (wind only) 4.28*** �0.18*** 0.12
All variables, with the exception of wind speed alone at Las Cruces (P-value of 0.066), had a significant relationship, although the variances
explained are quite low.
***, significant at 0.001 level.
**, significant at 0.01 level.
392 D.M. Kaplan et al. / Estuarine, Coastal and Shelf Science 57 (2003) 385–398
average daily fluctuations than nearby sites with strongupwelling.
3.4. Detailed study of a daily warming cycle
Thermistor time-series from several sites along theChilean coast show the widespread occurrence of dailywarming of nearshore surface waters during the entiresummer. To better describe the spatial structure withdepth and distance offshore, and through that to betterunderstand the mechanism, we repeatedly occupied aCTD line directly offshore from Las Cruces during thedaylight hours of 5 December 2000 (Fig. 1c). In additionto the thermal cycle, we were curious about the potentialpresence of Maipo River water (enters ocean 13 kmsouth of Las Cruces) and the possible interaction ofa sea-breeze-induced salinity signal with the genericthermal signal at this site.
The study day was sunny, with air temperaturesincreasing from 11 �C at 06:00 to 17 �C at 08:00 and18 �C by noon, then dropping again to 14 �C between18:00 and 20:00 (Fig. 7a). Relative humidity (Fig. 7b)decreased to 70% in concert with the warmer air. Windswere northerly pre-dawn, backing to a westerly by 09:00(Fig. 7d). This daytime sea-breeze remained weak(�2.5m/s) until 13:00 then strengthened to 6m/s at15:00; notwithstanding a lull between 17:00 and 19:00,a significant sea-breeze (�4m/s) continued until 22:00(Fig. 7e).
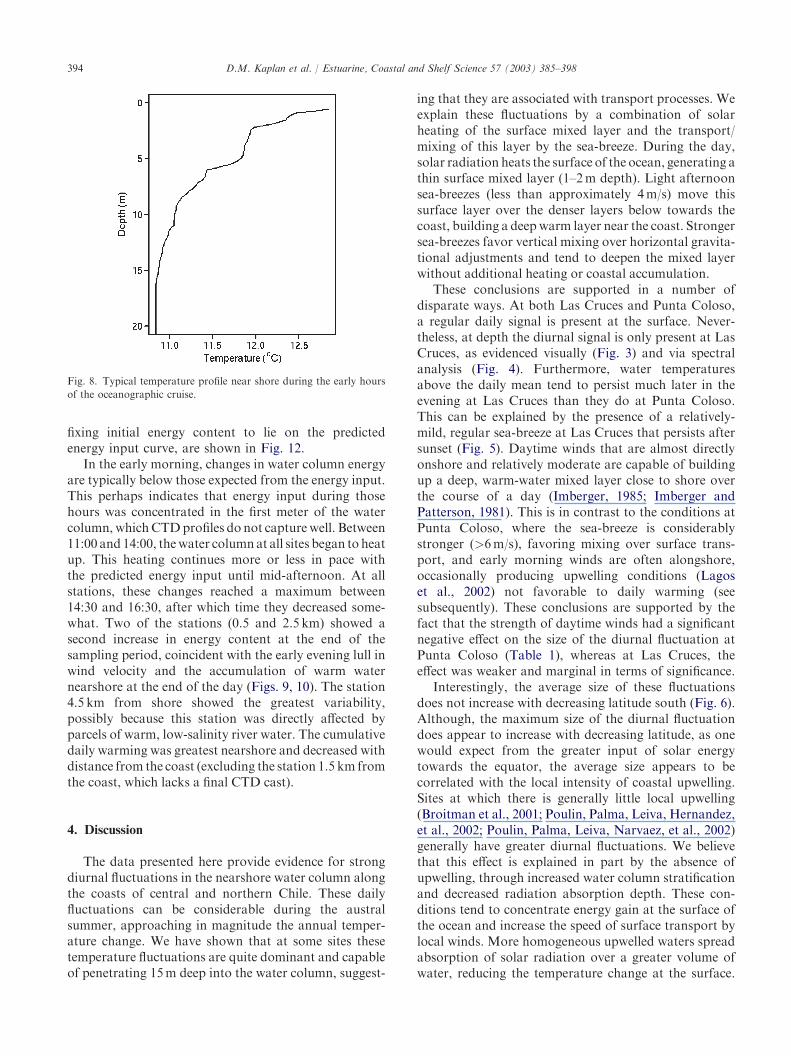
In the morning, at the start of the daytime warmingsequence, CTD profiles (Fig. 8) show a cold lower layer
Fig. 6. Summertime temperature ranges (1999–2000) for all sites along
coast of Chile. Boxes indicate the position of the mean (line between
upper and lower box), upper quartile (top of upper box), lower quartile
(bottom of lower box) and 95% confidence interval in the median
(notches in boxes). Dashed line indicates extreme values. Sites with
relatively strong upwelling are shown in black, sites with moderate to
little local upwelling are shown in gray (as described in Broitman et al.,
2001; Poulin, Palma, Leiva, Hernandez, et al., 2002; Poulin, Palma,
Leiva, Narvaez, et al., 2002).
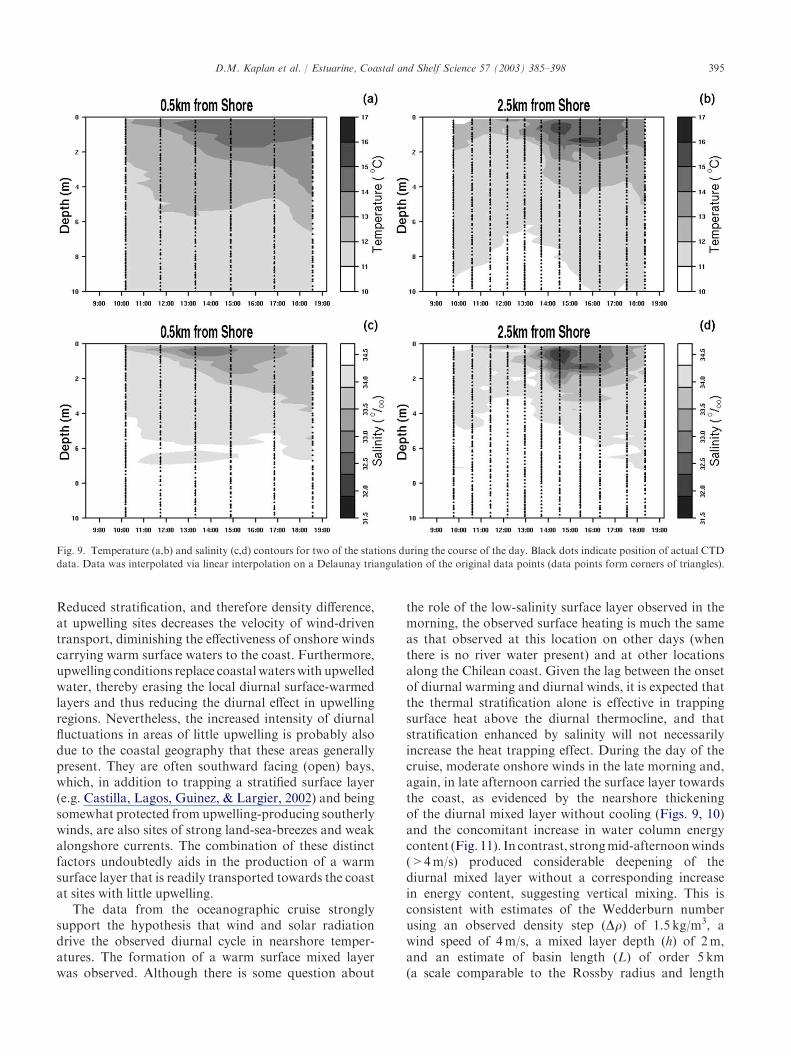
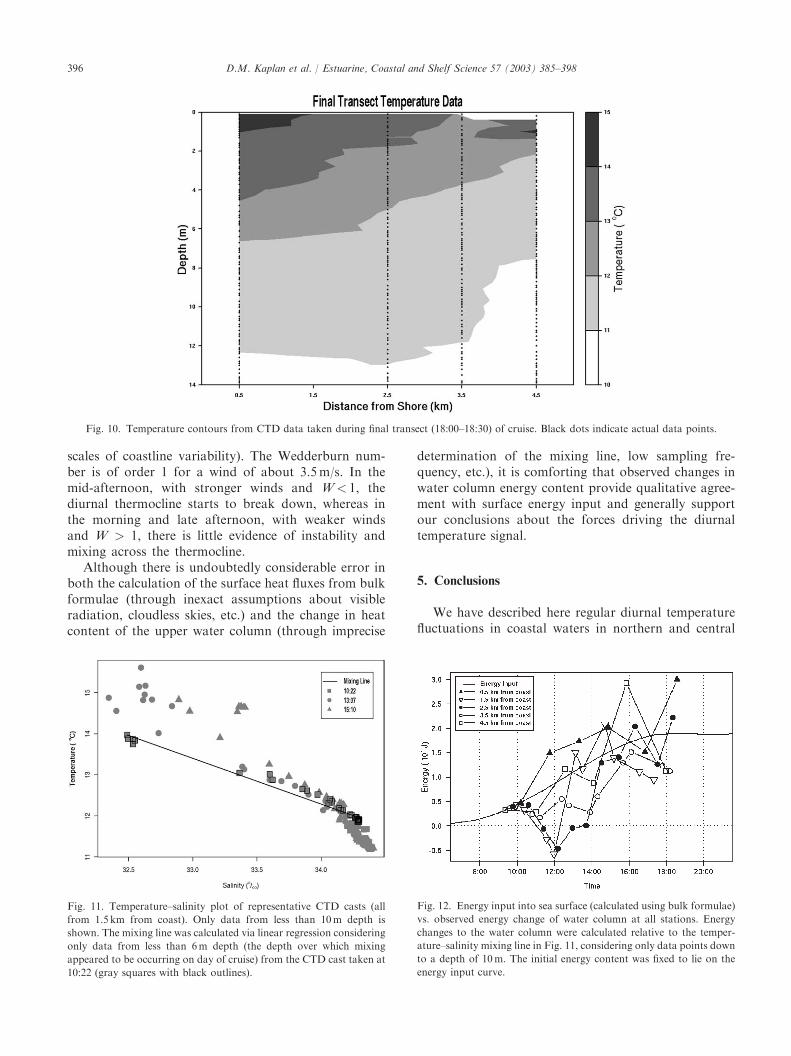
(<11 �C) overlain by weakly stratified cool waters(about 12 �C). Localized thermal gradients in the upper10m may be due to interleaving of different water typesor relict diurnal thermoclines from previous days(Imberger, 1985). Through the day, surface temper-atures increase at all stations and a surface mixed layerbecomes evident at all stations between 12:30 and 13:30(CTD data poorly captures the first meter of the watercolumn, so that a thin incipient surface mixed layer maynot be evident in these data at earlier times). Althoughstratification exists in the upper few meters throughmuch of the day, there is a marked increase intemperature above 4m nearshore and above 2m off-shore at this time (Fig. 9a,b). While this temperatureincrease may be partly due to vertical mixing of heatinput at the surface, there is also a concomitant decreasein the salinity of these near-surface waters (Fig. 9c,d),indicating a change in the water type found at theselocations. This warm, low-salinity surface featurethickens slowly through the day, both nearshore andoffshore, with a marked deepening to about 4m in themid-afternoon first 2.5 km from shore (around 14:00)and later 0.5 km from shore (around 16:00). This patterncorrelates well with onshore winds and suggests thatwinds were important in moving the warm surface layertowards shore in the early- to mid-afternoon (consistentwith visual observations of brown turbid waters movingonshore during the afternoon). In addition to movingthis buoyant water shoreward, the afternoon sea-breezemaximum appears to mix this water vertically as themarked late-afternoon deepening does not correspondto an increase in the heat or freshwater content ofthe water column. At 500m from shore, the averagetemperature of the upper 10m drops only 0.07 �C andthe average water freshness, (Soc � S)=Soc, decreases10% between 13:15 and 16:50. Finally, temperature datafrom the last transect of the day (18:00–18:30) shows amarked depression of the isotherms as one approachesthe coast (Fig. 10), indicating the accumulation of warmwater nearshore.
To assess the importance of surface heating inaddition to the shoreward movement of a Maipo-induced warm, low-salinity surface layer, one canexplore the evolution of the temperature–salinityrelation through the day (Fig. 11). If this river-influenced water simply moved inshore and mixed withthe nearshore morning waters, the mixed productswould fall neatly on a mixing line. This is not the caseand it is clear that near-surface water later in the day iswarmer than it would have been from mixing of thetwo source waters alone. Assuming that there is nointrusion of a third water type, one can use thisgraphical analysis to estimate the temperature increasedue to surface heating alone, and thus calculate the netheat gain for each profile (Fig. 12) independent of thepresence of river water. This approach uses changes in
393D.M. Kaplan et al. / Estuarine, Coastal and Shelf Science 57 (2003) 385–398
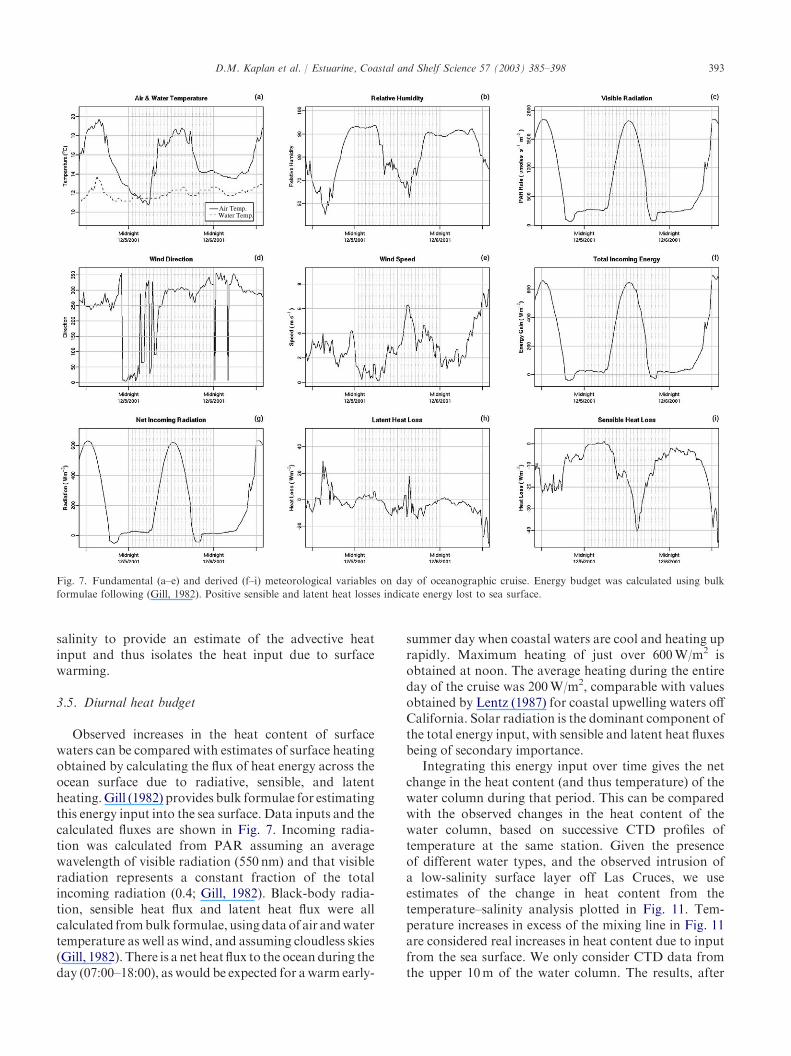
Fig. 7. Fundamental (a–e) and derived (f–i) meteorological variables on day of oceanographic cruise. Energy budget was calculated using bulk
formulae following (Gill, 1982). Positive sensible and latent heat losses indicate energy lost to sea surface.
salinity to provide an estimate of the advective heatinput and thus isolates the heat input due to surfacewarming.
3.5. Diurnal heat budget
Observed increases in the heat content of surfacewaters can be compared with estimates of surface heatingobtained by calculating the flux of heat energy across theocean surface due to radiative, sensible, and latentheating.Gill (1982) provides bulk formulae for estimatingthis energy input into the sea surface. Data inputs and thecalculated fluxes are shown in Fig. 7. Incoming radia-tion was calculated from PAR assuming an averagewavelength of visible radiation (550 nm) and that visibleradiation represents a constant fraction of the totalincoming radiation (0.4; Gill, 1982). Black-body radia-tion, sensible heat flux and latent heat flux were allcalculated frombulk formulae, usingdata of air andwatertemperature as well as wind, and assuming cloudless skies(Gill, 1982). There is a net heat flux to the ocean during theday (07:00–18:00), as would be expected for awarm early-
summer day when coastal waters are cool and heating uprapidly. Maximum heating of just over 600W/m2 isobtained at noon. The average heating during the entireday of the cruise was 200W/m2, comparable with valuesobtained by Lentz (1987) for coastal upwelling waters offCalifornia. Solar radiation is the dominant component ofthe total energy input, with sensible and latent heat fluxesbeing of secondary importance.
Integrating this energy input over time gives the netchange in the heat content (and thus temperature) of thewater column during that period. This can be comparedwith the observed changes in the heat content of thewater column, based on successive CTD profiles oftemperature at the same station. Given the presenceof different water types, and the observed intrusion ofa low-salinity surface layer off Las Cruces, we useestimates of the change in heat content from thetemperature–salinity analysis plotted in Fig. 11. Tem-perature increases in excess of the mixing line in Fig. 11are considered real increases in heat content due to inputfrom the sea surface. We only consider CTD data fromthe upper 10m of the water column. The results, after
394 D.M. Kaplan et al. / Estuarine, Coastal and Shelf Science 57 (2003) 385–398
fixing initial energy content to lie on the predictedenergy input curve, are shown in Fig. 12.
In the early morning, changes in water column energyare typically below those expected from the energy input.This perhaps indicates that energy input during thosehours was concentrated in the first meter of the watercolumn, whichCTDprofiles do not capturewell. Between11:00 and14:00, thewater columnat all sites began to heatup. This heating continues more or less in pace withthe predicted energy input until mid-afternoon. At allstations, these changes reached a maximum between14:30 and 16:30, after which time they decreased some-what. Two of the stations (0.5 and 2.5 km) showed asecond increase in energy content at the end of thesampling period, coincident with the early evening lull inwind velocity and the accumulation of warm waternearshore at the end of the day (Figs. 9, 10). The station4.5 km from shore showed the greatest variability,possibly because this station was directly affected byparcels of warm, low-salinity river water. The cumulativedaily warming was greatest nearshore and decreased withdistance from the coast (excluding the station 1.5 km fromthe coast, which lacks a final CTD cast).
4. Discussion
The data presented here provide evidence for strongdiurnal fluctuations in the nearshore water column alongthe coasts of central and northern Chile. These dailyfluctuations can be considerable during the australsummer, approaching in magnitude the annual temper-ature change. We have shown that at some sites thesetemperature fluctuations are quite dominant and capableof penetrating 15m deep into the water column, suggest-
Fig. 8. Typical temperature profile near shore during the early hours
of the oceanographic cruise.
ing that they are associated with transport processes. Weexplain these fluctuations by a combination of solarheating of the surface mixed layer and the transport/mixing of this layer by the sea-breeze. During the day,solar radiation heats the surface of the ocean, generating athin surface mixed layer (1–2m depth). Light afternoonsea-breezes (less than approximately 4m/s) move thissurface layer over the denser layers below towards thecoast, building a deepwarm layer near the coast. Strongersea-breezes favor vertical mixing over horizontal gravita-tional adjustments and tend to deepen the mixed layerwithout additional heating or coastal accumulation.
These conclusions are supported in a number ofdisparate ways. At both Las Cruces and Punta Coloso,a regular daily signal is present at the surface. Never-theless, at depth the diurnal signal is only present at LasCruces, as evidenced visually (Fig. 3) and via spectralanalysis (Fig. 4). Furthermore, water temperaturesabove the daily mean tend to persist much later in theevening at Las Cruces than they do at Punta Coloso.This can be explained by the presence of a relatively-mild, regular sea-breeze at Las Cruces that persists aftersunset (Fig. 5). Daytime winds that are almost directlyonshore and relatively moderate are capable of buildingup a deep, warm-water mixed layer close to shore overthe course of a day (Imberger, 1985; Imberger andPatterson, 1981). This is in contrast to the conditions atPunta Coloso, where the sea-breeze is considerablystronger (>6m/s), favoring mixing over surface trans-port, and early morning winds are often alongshore,occasionally producing upwelling conditions (Lagoset al., 2002) not favorable to daily warming (seesubsequently). These conclusions are supported by thefact that the strength of daytime winds had a significantnegative effect on the size of the diurnal fluctuation atPunta Coloso (Table 1), whereas at Las Cruces, theeffect was weaker and marginal in terms of significance.
Interestingly, the average size of these fluctuationsdoes not increase with decreasing latitude south (Fig. 6).Although, the maximum size of the diurnal fluctuationdoes appear to increase with decreasing latitude, as onewould expect from the greater input of solar energytowards the equator, the average size appears to becorrelated with the local intensity of coastal upwelling.Sites at which there is generally little local upwelling(Broitman et al., 2001; Poulin, Palma, Leiva, Hernandez,et al., 2002; Poulin, Palma, Leiva, Narvaez, et al., 2002)generally have greater diurnal fluctuations. We believethat this effect is explained in part by the absence ofupwelling, through increased water column stratificationand decreased radiation absorption depth. These con-ditions tend to concentrate energy gain at the surface ofthe ocean and increase the speed of surface transport bylocal winds. More homogeneous upwelled waters spreadabsorption of solar radiation over a greater volume ofwater, reducing the temperature change at the surface.
395D.M. Kaplan et al. / Estuarine, Coastal and Shelf Science 57 (2003) 385–398
Fig. 9. Temperature (a,b) and salinity (c,d) contours for two of the stations during the course of the day. Black dots indicate position of actual CTD
data. Data was interpolated via linear interpolation on a Delaunay triangulation of the original data points (data points form corners of triangles).
Reduced stratification, and therefore density difference,at upwelling sites decreases the velocity of wind-driventransport, diminishing the effectiveness of onshore windscarrying warm surface waters to the coast. Furthermore,upwelling conditions replace coastalwaterswith upwelledwater, thereby erasing the local diurnal surface-warmedlayers and thus reducing the diurnal effect in upwellingregions. Nevertheless, the increased intensity of diurnalfluctuations in areas of little upwelling is probably alsodue to the coastal geography that these areas generallypresent. They are often southward facing (open) bays,which, in addition to trapping a stratified surface layer(e.g. Castilla, Lagos, Guinez, & Largier, 2002) and beingsomewhat protected from upwelling-producing southerlywinds, are also sites of strong land-sea-breezes and weakalongshore currents. The combination of these distinctfactors undoubtedly aids in the production of a warmsurface layer that is readily transported towards the coastat sites with little upwelling.
The data from the oceanographic cruise stronglysupport the hypothesis that wind and solar radiationdrive the observed diurnal cycle in nearshore temper-atures. The formation of a warm surface mixed layerwas observed. Although there is some question about
the role of the low-salinity surface layer observed in themorning, the observed surface heating is much the sameas that observed at this location on other days (whenthere is no river water present) and at other locationsalong the Chilean coast. Given the lag between the onsetof diurnal warming and diurnal winds, it is expected thatthe thermal stratification alone is effective in trappingsurface heat above the diurnal thermocline, and thatstratification enhanced by salinity will not necessarilyincrease the heat trapping effect. During the day of thecruise, moderate onshore winds in the late morning and,again, in late afternoon carried the surface layer towardsthe coast, as evidenced by the nearshore thickeningof the diurnal mixed layer without cooling (Figs. 9, 10)and the concomitant increase in water column energycontent (Fig. 11). In contrast, strongmid-afternoonwinds(>4m/s) produced considerable deepening of thediurnal mixed layer without a corresponding increasein energy content, suggesting vertical mixing. This isconsistent with estimates of the Wedderburn numberusing an observed density step (Dq) of 1.5 kg/m3, awind speed of 4m/s, a mixed layer depth (h) of 2m,and an estimate of basin length (L) of order 5 km(a scale comparable to the Rossby radius and length
396 D.M. Kaplan et al. / Estuarine, Coastal and Shelf Science 57 (2003) 385–398
Fig. 10. Temperature contours from CTD data taken during final transect (18:00–18:30) of cruise. Black dots indicate actual data points.
scales of coastline variability). The Wedderburn num-ber is of order 1 for a wind of about 3.5m/s. In themid-afternoon, with stronger winds and W< 1, thediurnal thermocline starts to break down, whereas inthe morning and late afternoon, with weaker windsand W > 1, there is little evidence of instability andmixing across the thermocline.
Although there is undoubtedly considerable error inboth the calculation of the surface heat fluxes from bulkformulae (through inexact assumptions about visibleradiation, cloudless skies, etc.) and the change in heatcontent of the upper water column (through imprecise
Fig. 11. Temperature–salinity plot of representative CTD casts (all
from 1.5 km from coast). Only data from less than 10m depth is
shown. The mixing line was calculated via linear regression considering
only data from less than 6m depth (the depth over which mixing
appeared to be occurring on day of cruise) from the CTD cast taken at
10:22 (gray squares with black outlines).
determination of the mixing line, low sampling fre-quency, etc.), it is comforting that observed changes inwater column energy content provide qualitative agree-ment with surface energy input and generally supportour conclusions about the forces driving the diurnaltemperature signal.
5. Conclusions
We have described here regular diurnal temperaturefluctuations in coastal waters in northern and central
Fig. 12. Energy input into sea surface (calculated using bulk formulae)
vs. observed energy change of water column at all stations. Energy
changes to the water column were calculated relative to the temper-
ature–salinity mixing line in Fig. 11, considering only data points down
to a depth of 10m. The initial energy content was fixed to lie on the
energy input curve.
397D.M. Kaplan et al. / Estuarine, Coastal and Shelf Science 57 (2003) 385–398
Chile. These fluctuations are explained by a combina-tion of solar heating of the ocean surface and transport/mixing of this warm surface layer by the daytime sea-breeze. This effect can be felt over a distance of few/several kilometers from shore (or farther). It is clear thatthe processes described in this article are not limited inany way to the coast of Chile, but rather could andshould be present in a variety of coastal systems. We feelthat the importance of these processes has been under-estimated in the scientific literature until now and thatunderstanding them could be relevant for developing amore detailed knowledge of nearshore oceanography.
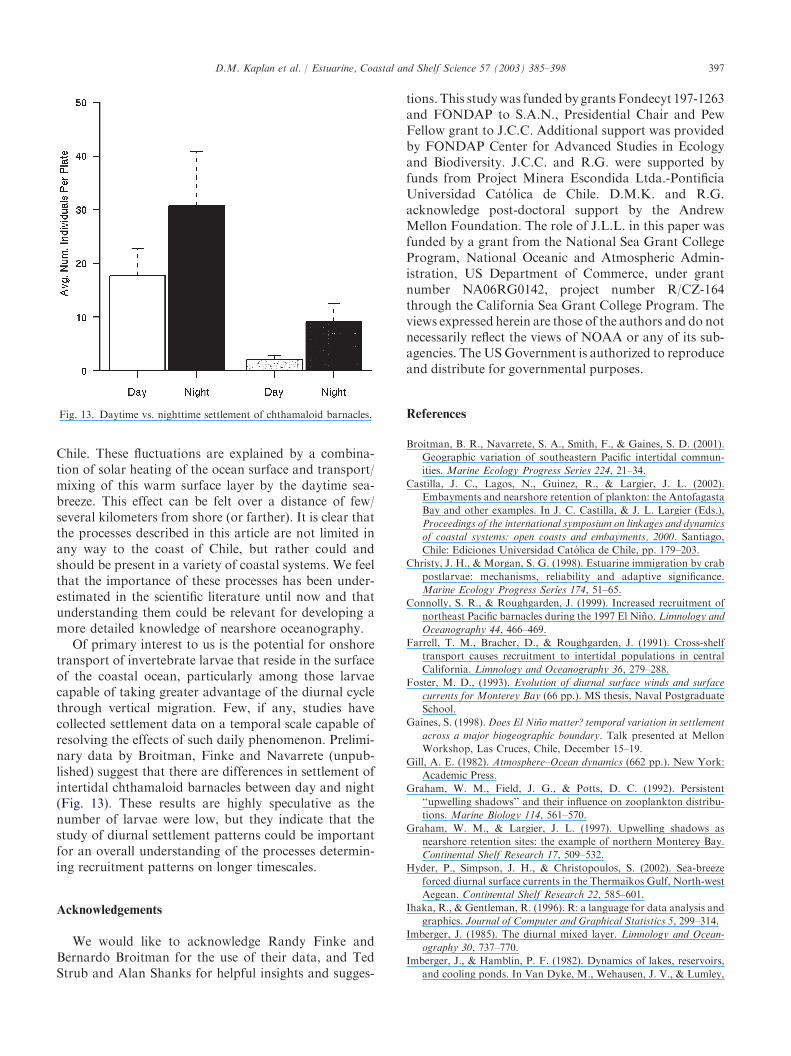
Of primary interest to us is the potential for onshoretransport of invertebrate larvae that reside in the surfaceof the coastal ocean, particularly among those larvaecapable of taking greater advantage of the diurnal cyclethrough vertical migration. Few, if any, studies havecollected settlement data on a temporal scale capable ofresolving the effects of such daily phenomenon. Prelimi-nary data by Broitman, Finke and Navarrete (unpub-lished) suggest that there are differences in settlement ofintertidal chthamaloid barnacles between day and night(Fig. 13). These results are highly speculative as thenumber of larvae were low, but they indicate that thestudy of diurnal settlement patterns could be importantfor an overall understanding of the processes determin-ing recruitment patterns on longer timescales.
Acknowledgements
We would like to acknowledge Randy Finke andBernardo Broitman for the use of their data, and TedStrub and Alan Shanks for helpful insights and sugges-
Fig. 13. Daytime vs. nighttime settlement of chthamaloid barnacles.
tions. This studywas funded by grants Fondecyt 197-1263and FONDAP to S.A.N., Presidential Chair and PewFellow grant to J.C.C. Additional support was providedby FONDAP Center for Advanced Studies in Ecologyand Biodiversity. J.C.C. and R.G. were supported byfunds from Project Minera Escondida Ltda.-PontificiaUniversidad Catolica de Chile. D.M.K. and R.G.acknowledge post-doctoral support by the AndrewMellon Foundation. The role of J.L.L. in this paper wasfunded by a grant from the National Sea Grant CollegeProgram, National Oceanic and Atmospheric Admin-istration, US Department of Commerce, under grantnumber NA06RG0142, project number R/CZ-164through the California Sea Grant College Program. Theviews expressed herein are those of the authors and do notnecessarily reflect the views of NOAA or any of its sub-agencies. TheUSGovernment is authorized to reproduceand distribute for governmental purposes.
References
Broitman, B. R., Navarrete, S. A., Smith, F., & Gaines, S. D. (2001).
Geographic variation of southeastern Pacific intertidal commun-
ities. Marine Ecology Progress Series 224, 21–34.
Castilla, J. C., Lagos, N., Guinez, R., & Largier, J. L. (2002).
Embayments and nearshore retention of plankton: the Antofagasta
Bay and other examples. In J. C. Castilla, & J. L. Largier (Eds.),
Proceedings of the international symposium on linkages and dynamics
of coastal systems: open coasts and embayments, 2000. Santiago,
Chile: Ediciones Universidad Catolica de Chile, pp. 179–203.
Christy, J. H., & Morgan, S. G. (1998). Estuarine immigration by crab
postlarvae: mechanisms, reliability and adaptive significance.
Marine Ecology Progress Series 174, 51–65.
Connolly, S. R., & Roughgarden, J. (1999). Increased recruitment of
northeast Pacific barnacles during the 1997 El Nino. Limnology and
Oceanography 44, 466–469.
Farrell, T. M., Bracher, D., & Roughgarden, J. (1991). Cross-shelf
transport causes recruitment to intertidal populations in central
California. Limnology and Oceanography 36, 279–288.
Foster, M. D., (1993). Evolution of diurnal surface winds and surface
currents for Monterey Bay (66 pp.). MS thesis, Naval Postgraduate
School.
Gaines, S. (1998). Does El Nino matter? temporal variation in settlement
across a major biogeographic boundary. Talk presented at Mellon
Workshop, Las Cruces, Chile, December 15–19.
Gill, A. E. (1982). Atmosphere–Ocean dynamics (662 pp.). New York:
Academic Press.
Graham, W. M., Field, J. G., & Potts, D. C. (1992). Persistent
‘‘upwelling shadows’’ and their influence on zooplankton distribu-
tions. Marine Biology 114, 561–570.
Graham, W. M., & Largier, J. L. (1997). Upwelling shadows as
nearshore retention sites: the example of northern Monterey Bay.
Continental Shelf Research 17, 509–532.
Hyder, P., Simpson, J. H., & Christopoulos, S. (2002). Sea-breeze
forced diurnal surface currents in the Thermaikos Gulf, North-west
Aegean. Continental Shelf Research 22, 585–601.
Ihaka, R., & Gentleman, R. (1996). R: a language for data analysis and
graphics. Journal of Computer and Graphical Statistics 5, 299–314.
Imberger, J. (1985). The diurnal mixed layer. Limnology and Ocean-
ography 30, 737–770.
Imberger, J., & Hamblin, P. F. (1982). Dynamics of lakes, reservoirs,
and cooling ponds. In Van Dyke, M., Wehausen, J. V., & Lumley,
398 D.M. Kaplan et al. / Estuarine, Coastal and Shelf Science 57 (2003) 385–398
J. L. (Eds.). Annual review of fluid mechanics. Annual reviews Vol.
14, 153–187.
Imberger, J., & Parker, G. (1985). Mixed layer dynamics in a lake
exposed to a spatially variable wind field. Limnology and Ocean-
ography 30, 473–488.
Imberger, J., & Patterson, J. C. (1981). A dynamic reservoir simulation
model-DYRESM:5. In H. B. Fischer (Ed.), Transport models for
inland and coastal waters (pp. 310–361). New York: Academic
Press.
Johnson, D. R., Fonseca, T., & Sievers, C. H. A. (1980). Upwelling
in the Humboldt Current near Valparaiso. Journal of Marine
Research 38, 1–16.
Lagos, N. A., Barria, I., & Paolini, P. (2002). Upwelling ecosystem of
northern Chile: integrating benthic ecology and coastal ocean-
ography through remote sensing. In J. C. Castilla, & J. L. Largier
(Eds.), Proceedings of the international symposium on linkages and
dynamics of coastal systems: open coasts and embayments, 2000.
Santiago, Chile: Ediciones Universidad Catolica de Chile, pp. 117–
141.
Leichter, J. J., Shellenbarger, G., Genovese, S. J., & Wing, S. R.
(1998). Breaking internal waves on a Florida (USA) coral reef: a
plankton pump at work? Marine Ecology Progress Series 166,
83–97.
Lentz, S. J. (1987). A heat budget for the Northern California Shelf
during CODE 2. Journal of Geophysical Research 92, 14491–14509.
Lerczak, J. A., Hensershott, M. C., & Winant, C. D. (2001).
Observations and modeling of coastal internal waves driven by a
diurnal sea breeze. Journal of Geophysical Research 106, 19715–
19729.
Lluch-Cota, D. B., Wooster, W. S., & Hare, S. R. (2001). Sea surface
temperature variability in coastal areas of the northeastern Pacific
related to El Nino-Southern Oscillation and the Pacific Decadal
Oscillations. Geophysical Research Letters 28, 2029–2032.
Longhurst, A. (1998). Ecological geography of the sea (pp. 398). New
York: Academic Press.
Marın, V. H., Escribano, R., Delgado, L. E., Olivares, G., & Hidalgo,
P. (2001). Nearshore circulation in a coastal upwelling site off the
Northern Humboldt current system. Continental Shelf Research 21,
1317–1329.
McCreary, J. P., Kohler, K. E., Hood, R. R., Smith, S., Kindle, J.,
Fischer, A. S., & Weller, R. A. (2001). Influences of diurnal and
intraseasonal forcing on mixed-layer dynamics in the central
Arabian Sea. Journal of Geophysical Research 106, 719–755.
Monismith, S. G. (1985). Wind-forced motions in stratified lakes and
their effect on mixed-layer shear. Limnology and Oceanography 30,
771–783.
Morgan, S. G. (1996). Influence of tidal variation on reproductive
timing. Journal of Experimental Marine Biology and Ecology 206,
237–251.
Paduan, J. D., & Cook, M. S. (1997). Mapping surface currents in
Monterey Bay with CODAR-type HF radar. Oceanography 10,
49–52.
Pfister, C. A. (1997). Demographic consequences of within-year var-
iation in recruitment.Marine Ecology Progress Series 153, 229–238.
Pineda, J. (1991). Predictable upwelling and the shoreward transport
of planktonic larvae by internal tidal bores. Science 253, 548–551.
Pineda, J. (1995). An internal tidal bore regime at nearshore stations
along western U.S.A.: predictable upwelling within the lunar cycle.
Continental Shelf Research 15, 1023–1041.
Pineda, J. (1999). Circulation and larval distribution in internal tidal
bore warm fronts. Limnology and Oceanography 44, 1400–1414.
Poulin, E., Palma, A. T., Leiva, G., Hernandez, E., Martinez, P.,
Navarrete, S. A., & Castilla, J. C. (2002). Temporal and spatial
variation in the distribution of premetamorphic larvae of
Concholepas concholepas (Gastropoda: Muricidae) along the
central coast of Chile. Marine Ecology Progress Series 229, 95–104.
Poulin, E., Palma, A. T., Leiva, G., Narvaez, D., Pacheco, C.,
Navarrete, S. A., & Castilla, J. C. (2002). Avoiding offshore
transport during upwelling events: the case of competent larvae of
the gastropod Concholepas concholepas. Limnology and Ocean-
ography (in press).
Price, J. F., Weller, R. A., & Pinkel, R. (1986). Diurnal cycling:
observations and models of the upper ocean response to diurnal
heating, cooling and mixing. Journal of Geophysical Research 91,
8411–8427.
Ramp, S. R., McClean, J. L., Collins, C. A., Semtner, A. J., & Hays,
K. A. S. (1997). Observations and modeling of the 1991–1992 El
Nino signal off central California. Journal of Geophysical Research
102, 5553–5582.
Roughgarden, J., Pennington, J. T., Stoner, D., Alexander, S., &
Miller, K. (1991). Collisions of upwelling fronts with the intertidal
zone: the cause of recruitment pulses in barnacle populations of
Central California. Acta Oecologica 12, 35–51.
Sanford, E. (1999). Regulation of keystone predation by small changes
in ocean temperature. Science 283, 2095–2097.
Santelices, B. (1991). Littoral and sublittoral communities of continental
Chile. In A. C. Mathieson, & P. H. Nienhuis (Eds.), Intertidal and
littoral ecosystems. Ecosystems of the World Vol. 24 (pp. 347–369).
New York: Elsevier.
Shanks, A. L. (1998). Abundance of post-larval Callinectes sapidus,
Penaeus spp., Uca spp., and Libinia spp. collected at an outer
coastal site and their cross-shelf transport. Marine Ecology
Progress Series 168, 57–69.
Shanks, A. L., Largier, J., & Brink, L. (2000). Demonstration of the
onshore transport of larval invertebrates by the shoreward move-
mentofanupwellingfront.LimnologyandOceanography45, 230–236.
Shanks, A. L., & Wright, W. G. (1987). Internal-wave-mediated
shoreward transport of cyprids, megalopae, and gammarids and
correlated longshore differences in the settling rate of intertidal
barnacles. Journal of Experimental Marine Biology and Ecology
114, 1–13.
Smith, W. O., Heburn, G. W., Barber, R. T., & O’Brien, J. J. (1983).
Regulation of phytoplankton communities by physical processes in
upwelling ecosystems. Journal of Marine Research 41, 539–556.
Spigel, R. H., Imberger, J., & Rayner, K. N. (1986). Modeling the
diurnal mixed layer. Limnology and Oceanography 31, 533–556.
Strub, T. P., Mesias, J. M., Montecino, V., Rutllant, J., & Salinas, S.
(1998). Coastal Ocean circulation off Western South America:
coastal segment (6,E). The Sea 11, 273–313.
Thomas, A. C., Huang, F., Strub, P. T., & James, C. (1994).
Comparison of the seasonal and interannual variability of
phytoplankton pigment concentrations in the Peru and California
Current system. Journal of Geophysical Research 99, 7355–7370.
Wieters, E. A., Kaplan, D. M., Sotomayor, A., Navarrete, S. A.,
Largier, J. L., & Nielsen, K. J. (2003). Small-scale alongshore
variability in chlorophyll-a levels in Chilean coastal waters. Marine
Ecology Progress Series, 249, 93–105.
Williams, D. D., & Williams, N. E. (1997). Seasonal variation, export
dynamics and consumption of freshwater invertebrates in an
estuarine environment. Estuarine, Coastal and Shelf Science 46,
393–410.
Winant, C. D., & Bratkovich, A. W. (1981). Temperature and currents
on the southern California shelf: a description of variability.
Journal of Physical Oceanography 11, 71–86.
Wing, S. R., Botsford, L. W., Largier, J. L., & Morgan, L. E. (1995).
Spatial structure of relaxation events and crab settlement in the
northern California upwelling system. Marine Ecology Progress
Series 128, 199–211.
Witman, J. D., Leichter, J. J., Genovese, S. J., & Brooks, D. A. (1993).
Pulsed phytoplankton supply to the rocky subtidal zone: influence
of internal waves. Proceedings of the National Academy of Sciences
of the United States of America 90, 1686–1690.
Related Documents