J. Hydrol. Hydromech., 58, 2010, 3, 149–162 DOI: 10.2478/v10098-010-0014-0 149 ARE DIURNAL FLUCTUATIONS IN STREAMFLOW REAL? JAIME G. CUEVAS 1*) , MATÍAS CALVO 2) , CHRISTIAN LITTLE 3,4) , MARIO PINO 2) , PAUL DASSORI 2) 1) Instituto de Investigaciones Agropecuarias, Oficina Técnica Valdivia, Campus Isla Teja s/n, Casilla 567, Valdivia, Chile; * Mailto: [email protected]. 2) Instituto de Geociencias, Universidad Austral de Chile, Campus Isla Teja s/n, Valdivia, Chile; Mailto: [email protected]. 3) Escuela de Graduados, Facultad de Ciencias Forestales y Recursos Naturales, Universidad Austral de Chile, Campus Isla Teja s/n, Valdivia, Chile. 4) Fundación Centro de los Bosques Nativos, FORECOS, Chile. Diurnal variations in streamflow (DVS) have been studied in detail by underwater pressure loggers. Some of this equipment requires barometric compensation with a logger or sensor located outside the water. Studies related to this topic have not offered a critical report of the validity of patterns inferred with these instruments. While studying a forested watershed in Southern Chile (40° S), we detected a DVS when the external logger was placed 1.5 m above ground, under a marked diurnal fluctuation in air temperature (amplitude 12.4 °C) and a dampened fluctuation in stream temperature (amplitude 1.4 °C). Synchronization was apparent between air and stream temperature in a direct relationship, but the synchronization between air/stream temperature and streamflow was negative, with some hours of lag time. In laboratory experiments, when the external logger is considerably warmer than the water-level logger, depth measurements can be underestimated by up to 1.5 cm. When the opposite occurs, water depths can be overestimated by up to 0.9 cm and are large instrumental/methodological artifacts compared to the field water diurnal variation of 1.3 cm. Finally, we relocated the external logger in front of the water-level logger and inside a weir, but exposed to the air. Results confirmed the pattern previously detected in the field, but streamflow fluctuations were 19% less accentuated. We conclude that the incorrect placement of the external logger, along with an instrumental artifact, can intensify a DVS pattern. KEY WORDS: Instrumental Analysis, Methodological Artifacts, Southern Rainforests, Stream and Air Temperatures. Jaime G. Cuevas, Matías Calvo, Christian Little, Mario Pino, Paul Dassori: SÚ DENNÉ FLUKTUÁCIE PRIETOKOV V TOKOCH REÁLNE? J. Hydrol. Hydromech., 58, 2010, 3; 43 lit., 7 obr., 2 tab. Počas dňa sme podrobne sledovali zmeny prietokov v tokoch tlakovými snímačmi, umiestnenými pod vodou. Niektoré z týchto zariadení vyžadujú barometrickú kompenzáciu snímačov, ktoré nie sú umiestnené vo vode. Štúdie z tejto oblasti obyčajne nehodnotia kriticky správnosť výsledkov meraní týmito zariadeniami. Počas meraní v zalesnenom povodí na juhu Chile (40° S), sme zistili zmeny prietokov v tokoch počas dňa, ak bol externý tlakový snímač (logger) uložený 1,5 m nad zemou, počas výrazných denných zmien teploty vzduchu (amplitúda 12.4 °C) a stlmené fluktuácie teploty vody v toku (amplitúda 1.4 °C). Synchronizácia medzi teplotami vody a vzduchu bola zrejmá, ale synchronizácia medzi teplotami vody v toku a prietokmi bola negatívna, s hodinovými posunmi voči sebe. V experimentoch v laboratóriu, keď bol externý snímač podstatne teplejší ako snímač vo vode, meranie hĺbok bolo podhodnotené až o 1,5 cm. V opačnom prípade, hĺbka hladiny vody bola nadhodnotená až o 0,9 cm a boli zistené významné inštrumentálne/metodologické artefakty v porovnaní s poľnými meraniami až o 1,3 cm. Nakoniec, externý snímač bol umiestnený pred snímač s údajmi o vodnej hladine a dovnútra prepadu, ale bol vo vzduchu. Výsledky meraní potvrdili chody prietokov namerané v teréne, ale fluktuácie prietokov boli nižšie o 19 %. Z toho vyplýva, že nesprávne umiestnenie externého snímača, spolu s prístrojovými artefaktmi, môžu intenzifikovať zmeny prietokov v tokoch počas dňa. KĽÚČOVÉ SLOVÁ: inštrumentálna analýza, metodologické artefakty, južné dažďové pralesy, teploty vzduchu a vody.

Welcome message from author
This document is posted to help you gain knowledge. Please leave a comment to let me know what you think about it! Share it to your friends and learn new things together.
Transcript

J. Hydrol. Hydromech., 58, 2010, 3, 149–162 DOI: 10.2478/v10098-010-0014-0
149
ARE DIURNAL FLUCTUATIONS IN STREAMFLOW REAL? JAIME G. CUEVAS1*), MATÍAS CALVO2), CHRISTIAN LITTLE3,4), MARIO PINO2), PAUL DASSORI2)
1)Instituto de Investigaciones Agropecuarias, Oficina Técnica Valdivia, Campus Isla Teja s/n, Casilla 567, Valdivia, Chile; *
Mailto: [email protected]. 2)Instituto de Geociencias, Universidad Austral de Chile, Campus Isla Teja s/n, Valdivia, Chile; Mailto: [email protected]. 3)Escuela de Graduados, Facultad de Ciencias Forestales y Recursos Naturales, Universidad Austral de Chile, Campus Isla Teja s/n, Valdivia, Chile. 4)Fundación Centro de los Bosques Nativos, FORECOS, Chile.
Diurnal variations in streamflow (DVS) have been studied in detail by underwater pressure loggers. Some of this equipment requires barometric compensation with a logger or sensor located outside the water. Studies related to this topic have not offered a critical report of the validity of patterns inferred with these instruments. While studying a forested watershed in Southern Chile (40° S), we detected a DVS when the external logger was placed 1.5 m above ground, under a marked diurnal fluctuation in air temperature (amplitude 12.4 °C) and a dampened fluctuation in stream temperature (amplitude 1.4 °C). Synchronization was apparent between air and stream temperature in a direct relationship, but the synchronization between air/stream temperature and streamflow was negative, with some hours of lag time. In laboratory experiments, when the external logger is considerably warmer than the water-level logger, depth measurements can be underestimated by up to 1.5 cm. When the opposite occurs, water depths can be overestimated by up to 0.9 cm and are large instrumental/methodological artifacts compared to the field water diurnal variation of 1.3 cm. Finally, we relocated the external logger in front of the water-level logger and inside a weir, but exposed to the air. Results confirmed the pattern previously detected in the field, but streamflow fluctuations were 19% less accentuated. We conclude that the incorrect placement of the external logger, along with an instrumental artifact, can intensify a DVS pattern.
KEY WORDS: Instrumental Analysis, Methodological Artifacts, Southern Rainforests, Stream and Air Temperatures.
Jaime G. Cuevas, Matías Calvo, Christian Little, Mario Pino, Paul Dassori: SÚ DENNÉ FLUKTUÁCIE PRIETOKOV V TOKOCH REÁLNE? J. Hydrol. Hydromech., 58, 2010, 3; 43 lit., 7 obr., 2 tab.
Počas dňa sme podrobne sledovali zmeny prietokov v tokoch tlakovými snímačmi, umiestnenými pod
vodou. Niektoré z týchto zariadení vyžadujú barometrickú kompenzáciu snímačov, ktoré nie sú umiestnené vo vode. Štúdie z tejto oblasti obyčajne nehodnotia kriticky správnosť výsledkov meraní týmito zariadeniami. Počas meraní v zalesnenom povodí na juhu Chile (40° S), sme zistili zmeny prietokov v tokoch počas dňa, ak bol externý tlakový snímač (logger) uložený 1,5 m nad zemou, počas výrazných denných zmien teploty vzduchu (amplitúda 12.4 °C) a stlmené fluktuácie teploty vody v toku (amplitúda 1.4 °C). Synchronizácia medzi teplotami vody a vzduchu bola zrejmá, ale synchronizácia medzi teplotami vody v toku a prietokmi bola negatívna, s hodinovými posunmi voči sebe. V experimentoch v laboratóriu, keď bol externý snímač podstatne teplejší ako snímač vo vode, meranie hĺbok bolo podhodnotené až o 1,5 cm. V opačnom prípade, hĺbka hladiny vody bola nadhodnotená až o 0,9 cm a boli zistené významné inštrumentálne/metodologické artefakty v porovnaní s poľnými meraniami až o 1,3 cm. Nakoniec, externý snímač bol umiestnený pred snímač s údajmi o vodnej hladine a dovnútra prepadu, ale bol vo vzduchu. Výsledky meraní potvrdili chody prietokov namerané v teréne, ale fluktuácie prietokov boli nižšie o 19 %. Z toho vyplýva, že nesprávne umiestnenie externého snímača, spolu s prístrojovými artefaktmi, môžu intenzifikovať zmeny prietokov v tokoch počas dňa.
KĽÚČOVÉ SLOVÁ: inštrumentálna analýza, metodologické artefakty, južné dažďové pralesy, teploty vzduchu a vody.
J. G. Cuevas, M. Calvo, Ch. Little, M. Pino, P. Dassori
150
1. Introduction
Streamflows are well known to vary seasonally (Ward, Trimble, 2003; Cuevas et al., 2006; Little et al., 2008; Lara et al., 2009), between years (Ward, Trimble, 2003; Lara et al., 2008; Little et al., 2009), and with the highest and lowest flows occurring in rainy and dry seasons or years, respectively. These variations, in addition to between-day fluctuations (daily), are mainly related to precipitation control (snow, rain; Graham, 1999; Tesař et al., 2008). Streamflow variations experienced in time periods of minutes or hours (diurnal) are not as well under-stood. The pattern of higher streamflow at dawn and lower streamflow during the afternoon was noted several decades ago (Troxell, 1936; Wicht, 1941), but it was only with the advent of automatic datalogger systems that these variations could be studied in detail. In this way, diurnal variations have been linked to a chain of causal factors, namely, solar radiation increases air temperature which then increases evapotranspiration (Monteith 1965), while decreasing water recharge towards groundwater (Hughes, 2010). Thus, the water table decreases, causing a diminution in streamflows (Szilágyi et al., 2008; Gribovszki et al., 2008). Some studies have shown that trees are mainly re-sponsible for evapotranspiration in a watershed (Bren, 1997) given that diurnal fluctuations have been observed in tree sapflows (Bond et al., 2002; Střelcová et al., 2009). Moreover, diurnal stream-flow variations can also occur in losing reaches as a consequence of increased streambed infiltration rates during the afternoon (Constantz, 1998). Lastly, snowmelt and freeze-thaw cycles can also contribute to diurnal variation in streamflows, espe-cially in alpine environments (Jordon, 1983; Caine, 1992). All cited processes have widely varying lag times (Constantz, 1998; Bond et al., 2002; Szilágyi et al., 2008).
In spite of the accepted concept of diurnal fluc-tuation of streamflows and ongoing research of this topic, related studies do not offer a critical report of the validity of patterns measured with different electronic devices (Constantz, 1998; Wondzell et al., 2007; Gribovszki et al., 2008). Common water-level loggers are pressure sensors that measure hydrostatic pressure in addition to atmospheric pressure, making it necessary to deduct the latter by putting another logger outside the water (baromet-ric compensation). In spite of the availability of differential water level sensors, which do not need a
second sensor as they have vented cables allowing compensation for barometric pressure changes (Acworth, Brain 2008; Cockburn, Lamoureux 2008a, 2008b), their use is not as common as non-vented water-level loggers. In the latter case, any error in separated instrumental records can have consequences on inferred water depths. Moreover, many electronic devices are sensitive to tempera-ture (Boylestad, Nashelsky, 1999; Cook, 1999; Paynter, 1999), which should not cause a problem if equipment is used to register temperature. How-ever, problems are likely to arise when other vari-ables, such as conductivity, pH, pressure, etc., are measured as a good temperature compensation for the circuits is required. If the thermal regime of both sensors is not comparable, their differential response to temperature may result in misleading measurements. Thus, we propose that this deduc-tion with the use of separate sensor records can generate a measurement error which is greater if the external logger is not correctly located.
The aim of this study was to evaluate the validity of diurnal water level variations in three situations: i) field measurements with an underwater logger and another located 10 m from it at 1.5 m above ground; ii) a detailed laboratory evaluation of log-ger behaviour under a controlled water level with known pressure and temperature variations; and iii) a re-evaluation of field measurements by relocating the barometric compensation logger in front of the submerged logger, inside a weir, but exposed to the air, and taking into account the patterns detected in ii). Thus, we aim to provide evidence that baromet-ric compensations that are not carefully carried out can generate errors in streamflow estimations, es-pecially when water discharges and fluctuations are relatively low. 2. Materials and methods 2.1 Study site
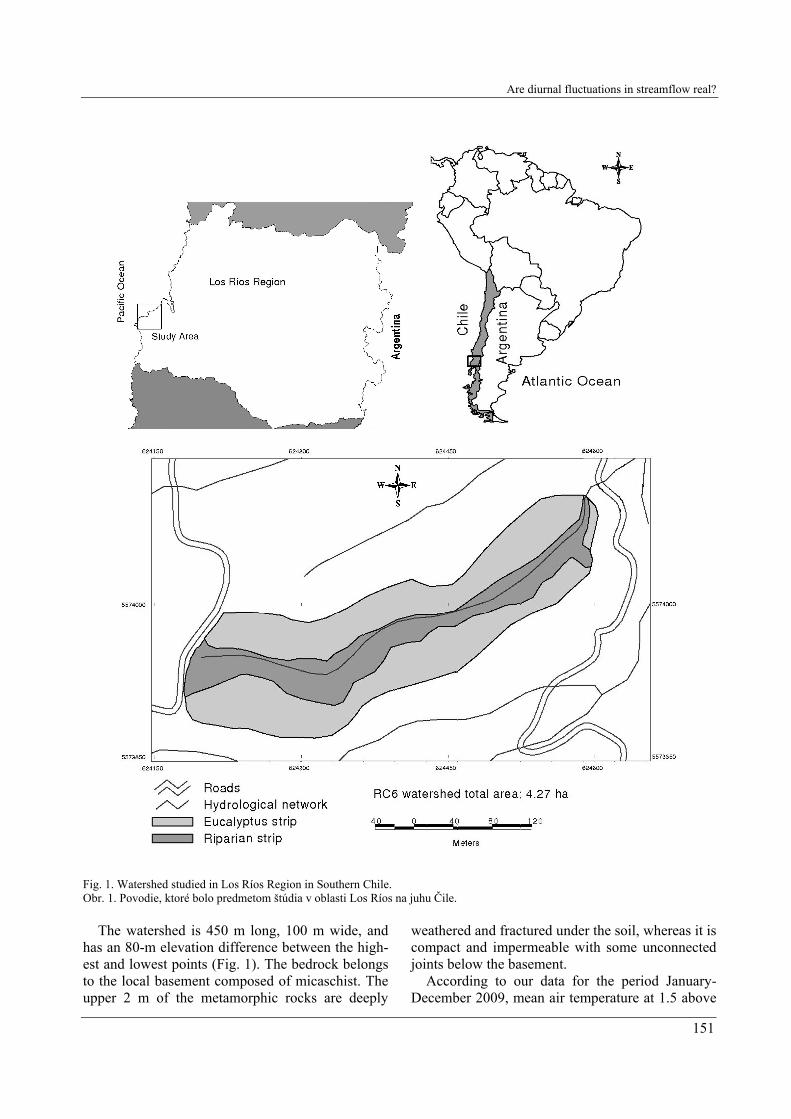
We studied a small watershed (42,600 m2) lo-cated in the Valdivia Rainforest Ecoregion of Southern Chile (40 °S, 73.5° W) (Fig. 1). This wa-tershed (RC6) consisted of native riparian vegeta-tion (26-m wide), surrounded by an exotic forest plantation of fast-growing Eucalyptus globulus trees. Common native species in the riparian strip were the Amomyrtus luma and Drimys winteri trees; Chusquea quila and Tepualia stipularis shrubs; Blechnum chilense and Lophosoria quadripinnata ferns; and the Lapageria rosea vine.
Are diurnal fluctuations in streamflow real?
151
Fig. 1. Watershed studied in Los Ríos Region in Southern Chile. Obr. 1. Povodie, ktoré bolo predmetom štúdia v oblasti Los Ríos na juhu Čile.
The watershed is 450 m long, 100 m wide, and has an 80-m elevation difference between the high-est and lowest points (Fig. 1). The bedrock belongs to the local basement composed of micaschist. The upper 2 m of the metamorphic rocks are deeply
weathered and fractured under the soil, whereas it is compact and impermeable with some unconnected joints below the basement.
According to our data for the period January-December 2009, mean air temperature at 1.5 above
J. G. Cuevas, M. Calvo, Ch. Little, M. Pino, P. Dassori
152
ground was 10.5 °C and mean runoff was 8.9 m3 h-1 (range 0.02–161.7). Stations close-by showed an annual rainfall of 1526 to 2046 mm, thus precipita-tion for RC6 is probably within these limits.
RC6 is neither inhabited nor used by humans, for example, there is no diversion of water for irriga-tion. Patterns reported in this study are representa-tive of six other watersheds examined in the same zone. 2.2 Field monitoring 1
We measured three variables: air temperature, streamflow, and stream temperature. Streamflow was determined by a V-notch weir (90°) and a pres-sure/temperature logger (HOBO U20-001-01, On-set Computer Corporation, Bourne, USA) to record data every 15 minutes. The logger was placed into a polyvinyl chloride (PVC) tube open at the bottom and perforated at intermediate levels to allow quick water flow inside the tube. The equipment was hung from a steel chain connected to the top cap of the tube.
The weir bottom was cleaned periodically of sediments, and the accumulation of leaves and branches on the V-notch was prevented by placing a metallic mesh in front of the notch, and arranged as a semicircle.
Streamflows were calibrated from logger records to make a linear regression with data from a staff gauge installed in the weir. Water levels were later converted to streamflows by calibrating flows di-rectly measured with a jar and a chronometer, at varying water depths. The regression model was a power function between water level and stream-flow.
According to the manufacturer, logger operation range is 0 to 207 kPa (approx. 0–9 m water depth at sea level), and from –20 to 50 °C. The typically reported error is 0.5 cm for water level and 0.37 °C (at 20 °C) for temperature, with a resolution of 0.02 kPa (0.21 cm water) and 0.1 °C (at 20 °C). Those errors should be kept in mind for all measurements reported in this paper.
We installed another logger of the same model for barometric compensation at 1.50 m above ground, 10 m apart and 3.5 m above the weir water level. The 1.50 m height is within the standard range for meteorological stations (1.2–2.0 m, WMO 2008). This instrument registered air temperature and atmospheric pressure and was protected in a gill-type radiation shield with 8 plates (Vaisala,
Helsinki, Finland) to avoid solar radiation. This meteorological station was also used to characterize the thermal environment within the forest, and to calculate the adiabatic lapse rate of air temperature comparing its records with another station located at a higher altitude in the zone (results not re-ported). The study period was from 8 December 2008 (spring) to 14 April 2009 (autumn). 2.3 Laboratory experiments
We put a logger into a test tube filled with water up to different depths depending on the experiment (22–39 cm; the water level range in logger field measurements was 19.0–22.5 cm). The test tube was closed, though not airtight, with a piece of plastic or aluminium film to prevent water evapora-tion. This seal was placed as an inverted cone to facilitate water return to the main body of water in case of evaporation. The test tube was cooled or warmed by using a freezer or oven, respectively, or, in some cases, ambient temperature was used when a difference existed between water and air tempera-ture. Data capture was every 15 s to 5 min depend-ing on experiment duration.
Several thermal and pressure regimes were tes-ted, for example, with nearly constant atmospheric pressure, enabling the assessment of water logger behaviour by only taking into account the water temperature variation. 2.4 Field monitoring 2
In another field monitoring from 17 December 2009 to 25 March 2010, we relocated the external station by placing the logger inside the weir, in front of the water-level logger, and both below the water table. However, the first logger was placed in a PVC tube that was closed at the bottom and open at the top to allow air and not water to enter. Thus, the logger inside responded mainly to atmospheric pressure variations, given that stream and air tem-perature variations were very narrow (see Results).
We validated data in both field studies by dis-carding rainy periods which could mislead possible associations between streamflow, air, and stream temperature. The anomalous patterns registered by logger readings were not considered to be attribut-able to watershed behaviour (e.g., when sensors were offloaded or when weirs were cleaned of sedi-ments).

Are diurnal fluctuations in streamflow real?
153
2.5 Statistical analyses
We used simple statistics, such as parametric lin-ear regression and Pearson correlation coefficients (r). Assumptions of regression analyses were checked by inspecting the normal residual distribu-tion. When these assumptions were not met, we used Kendall’s robust line-fit method, a non-parametric linear regression (Sokal, Rohlf, 1995) (the same method is also known as Theil-Sen re-gression; Theil, 1950; Sen, 1968). The non-parametric Gamma statistic (Г) was used as a measure of correlation, adequate when data contain many tied observations (Siegel, Castellan, 1988). All statistical analyses were carried out by means of the Statistica 6.0 software (StatSoft, Inc., Tulsa, Oklahoma, USA), except for the non-parametric regression performed by the R-software (R Devel-opment Core Team, 2009) and the ‘mblm’ package by Komsta (2007). 3. Results 3.1 Field monitoring 1
A representative record is shown in Fig. 2, with the compensation logger located 1.5 m above ground. Data exhibited a clear fluctuation in air temperatures with a mean maxima occurring at 13:35 h (range: 11:30–18:00 h)1) and minima at 08:47 h (range: 00:15–08:00 and 21:30–23:45 h). Maximum stream temperatures (see below) oc-curred at 14:34 h (range: 00:00–03:15 and 08:00– –23:45 h) and minimum temperatures at 06:57 h (range: 00:00–10:30 and 22:00–23:45 h). On the other hand, streamflow maxima (see below) oc-curred at 07:13 h (range: 00:00–08:00 and 20:15– –23:45 h) and minima at 13:42 h (range: 09:15– –18:15 h).
Tab. 1 shows stream temperature as never higher than 15.3 °C, with an absolute minimum of 10.8 °C (accuracy ± 0.37 °C). This caused diurnal fluctua-tions to be especially dampened with a mean of 1.4 °C throughout the day (range 0.2–2.2 °C). The opposite occurred for air temperature reaching val-ues as low as 3.8 °C and as high as 33.2 °C. How-
1)Hours are expressed according to the official Chilean hour during winter, which is GMT minus 4 hours. However, it should be GMT minus 5 hours according to the time zone where Chile is located. Thus, hours can be corrected discounting 1 h for a more accurate expression.
ever, daily thermal amplitude was generally 12.4 °C (range 2.9–23.9 °C).
Streamflow varied diurnally by a 1.9 factor (maximum streamflow/minimum streamflow, Qmax/Qmin) (range 1.43–3.22), with a mean minimum value of 1.73 m3 h-1 (range 0.84–2.85), and a mean maximum value of 3.29 m3 h-1 (range 1.87–4.81), equivalent to a 1.3 cm (range 0.7–2.4 cm) diurnal water level variation (measured with the logger).
Synchronization seems to be apparent between air and stream temperature cycles in a direct rela-tionship. Moreover, temperature maxima (air/stream) correspond to streamflow minima, and vice versa, with some hours of lag time (Fig. 2). 3.2 Laboratory experiments
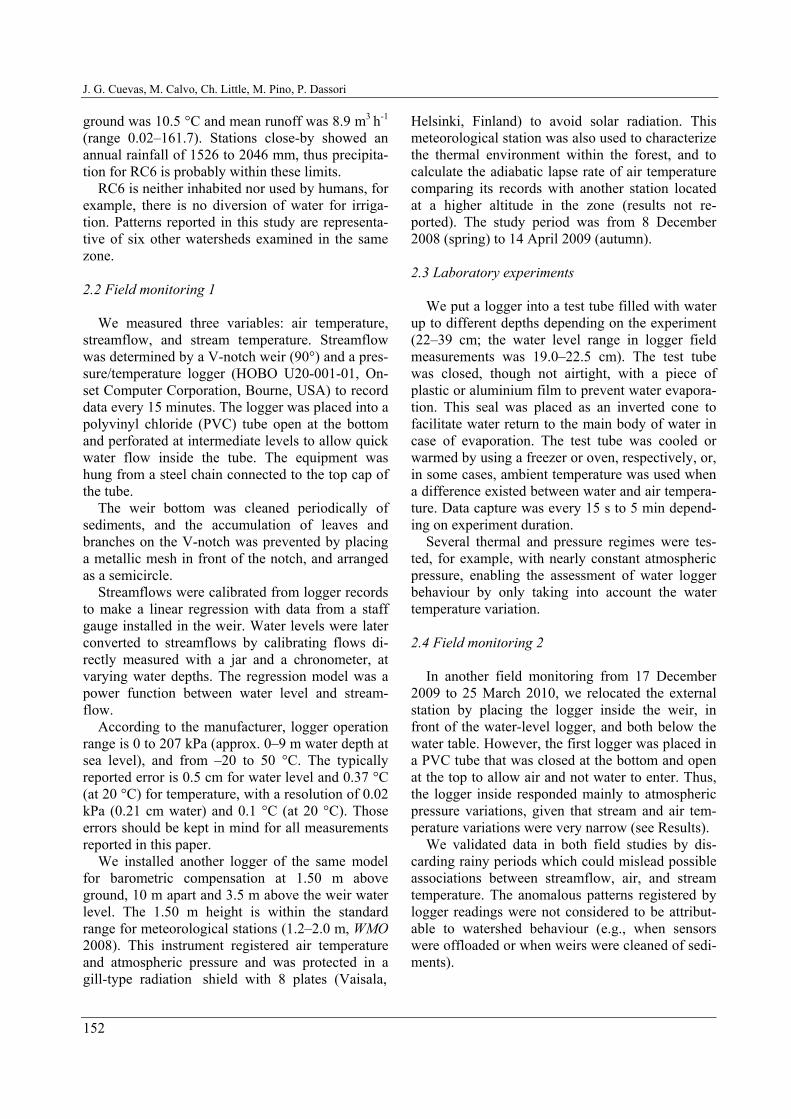
Experiment 1. This experiment was carried out with a fairly constant air temperature (22.3–23.3 °C), an atmospheric pressure variation of 83 Pa (Coeffi-cient of variation, CV = 0.02%), and lasted 68 min. Water was initially colder than air and warmed by placing the test tube on top of an oven (Fig. 3). The water level record is nearly constant above 7 °C with fluctuations attributable to instrumental error. However, below 7 °C water depth strongly and artificially decreased because this variable was kept constant in the experiment, and resulted in a 1.5 cm variation for the whole experiment. This sharp diminution occurs when air and water loggers differ more than 15 °C. If we project the range of stream temperature variation (10.8 + 2.2 °C, 15.3 – 2.2 °C) in this figure, we conclude that maximum mea-surement error is 0.41–0.43 cm and within instru-mental error (0.5 cm). If the true value is the mid-point of that range, the error would only be ± 0.2 cm. Thus, we can be confident that the logger is producing precise results in the above-mentioned range. Moreover, the deviation between true water depth and logger records is irrelevant due to the calibration between both variables when measured in the field (Materials and Methods).
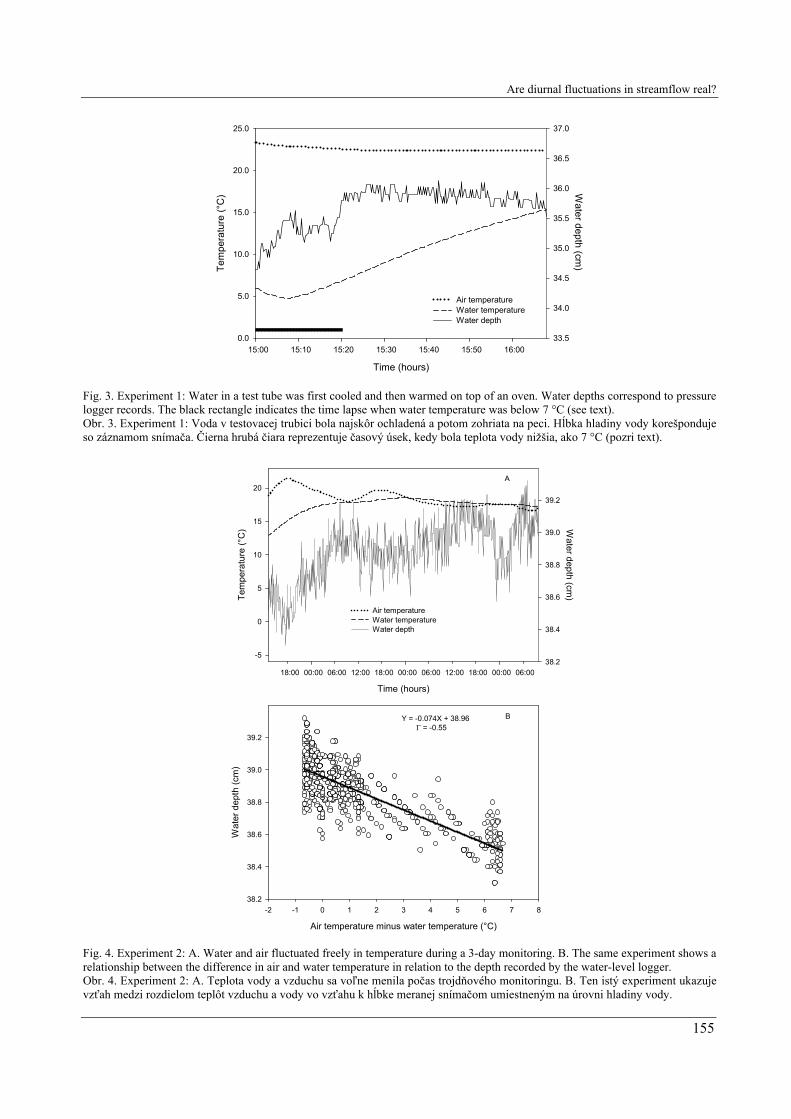
Experiment 2. This experiment lasted ca. 3 days. Air and water temperatures fluctuated passively in the laboratory (amplitude: 4.8 and 5.6 °C, respec-tively), as with the water depth records (Fig. 4A). When air and water temperature differences were higher (i.e., positive), water level records showed lower values than when such differences were small or even negative, with one possible exception to-wards the end of the experiment. The pattern is seen more clearly in Fig. 4B: as the difference

J. G. Cuevas, M. Calvo, Ch. Little, M. Pino, P. Dassori
154
Time (hours)
00:00 12:00 00:00 12:00 00:00 12:00 00:00 12:00 00:00 12:00 00:00 12:00 00:00 12:00 00:00
Tem
pera
ture
(o C)
0.0
5.0
10.0
15.0
20.0
25.0
30.0
Stream
flow (m
3 h-1)
0.0
2.0
4.0
6.0
8.0
10.0
12.0
Air temperature Stream temperatureStreamflow
Fig. 2. Daily records of streamflow and air/stream temperature during a representative week in December 2008 (Field monitoring 1). Logger for barometric compensation was placed 1.5 m above ground. Obr. 2. Denné záznamy prietokov a teplôt vody a vzduchu počas reprezentatívneho týždňa v decembri 2008 (poľné meranie 1). Snímač pre barometrickú kompenzáciu bol umiestnený 1,5 m nad povrchom. T a b l e 1. Diurnal fluctuations in stream and air temperature from December 2008 to April 2009. T a b u ľ k a 1. Denné fluktuácie teplôt vody a vzduchu od decembra do apríla 2009.
Maximum temperature Minimum temperature Diurnal amplitude Stream
Mean [°C] 13.5 12.2 1.4 Range [°C] 12.3–15.3 10.8–13.6 0.2–2.2
Air Mean [°C] 21.5 9.1 12.4 Range [°C] 13.8–33.2 3.8–15.7 2.9–23.9
between air and water temperature increased, the depth registered by the logger was lower (Gamma statistic, Г = –0.554, probability P < 0.001), in spite of the great dispersion of points around the curve. This dispersion is probably due to instrumental error for each specific temperature difference (0.4 to 0.6 °C).
Experiment 3. This experiment is a good exam-ple of a situation where both loggers did not experi-ence the same thermal and pressure regimes be-cause one logger was in the test tube inside the refrigerator, and another was outside the refrigera-tor. Atmospheric pressure and air temperature were very stable in the compensation logger (variation of 53 Pa, CV = 0.009%; and 1.8 °C, respectively). Decreasing water temperature was associated with a 1.2 cm diminution in water level records (Fig. 5A). As the difference between air and water tem-perature increased, the depth registered by the log-ger was lower (Fig. 5B; Pearson correlation coeffi-
cient, r = –0.90, P < 0.001). Dispersion of points around the curve was close to 0.4 °C.
Experiment 4. When both loggers were placed in the refrigerator, temperature curves followed a con-vergent trend. Greater differences between air and water temperatures (i.e., more negative) were asso-ciated with higher water depth records (Fig. 6A). When these differences were less negative, water depth records decreased up to 15:00 h, and then increased again. No clear relationship is seen be-tween water level and the difference in air and wa-ter temperature (Fig. 6B). Overall range of variation over the entire experiment was 0.69 cm.
Overall underestimation and overestimation. Us-ing results from all our experiments, both those shown and not shown, we determined that underes-timation in water depth in relation to the mean of a particular experiment can be as high as 1.5 cm (minimum 0.3). On the other hand, overestimation ranges between 0.3 and 0.9 cm.
Are diurnal fluctuations in streamflow real?
155
Time (hours)
15:00 15:10 15:20 15:30 15:40 15:50 16:00
Tem
pera
ture
(°C
)
0.0
5.0
10.0
15.0
20.0
25.0
Water depth (cm
)
33.5
34.0
34.5
35.0
35.5
36.0
36.5
37.0
Air temperatureWater temperatureWater depth
Fig. 3. Experiment 1: Water in a test tube was first cooled and then warmed on top of an oven. Water depths correspond to pressure logger records. The black rectangle indicates the time lapse when water temperature was below 7 °C (see text). Obr. 3. Experiment 1: Voda v testovacej trubici bola najskôr ochladená a potom zohriata na peci. Hĺbka hladiny vody korešponduje so záznamom snímača. Čierna hrubá čiara reprezentuje časový úsek, kedy bola teplota vody nižšia, ako 7 °C (pozri text).
Time (hours)
18:00 06:00 12:00 18:00 06:00 12:00 18:00 06:00 00:00 00:00 00:00
Tem
pera
ture
(°C
)
-5
0
5
10
15
20
Water depth (cm
)
38.2
38.4
38.6
38.8
39.0
39.2
Air temperatureWater temperatureWater depth
Air temperature minus water temperature (°C)
-2 -1 0 1 2 3 4 5 6 7 8
Wat
er d
epth
(cm
)
38.2
38.4
38.6
38.8
39.0
39.2
Y = -0.074X + 38.96 Γ = -0.55
A
B
Fig. 4. Experiment 2: A. Water and air fluctuated freely in temperature during a 3-day monitoring. B. The same experiment shows a relationship between the difference in air and water temperature in relation to the depth recorded by the water-level logger. Obr. 4. Experiment 2: A. Teplota vody a vzduchu sa voľne menila počas trojdňového monitoringu. B. Ten istý experiment ukazuje vzťah medzi rozdielom teplôt vzduchu a vody vo vzťahu k hĺbke meranej snímačom umiestneným na úrovni hladiny vody.
J. G. Cuevas, M. Calvo, Ch. Little, M. Pino, P. Dassori
156
Time (hours)
17:10 17:30 17:50 18:10 18:30 18:50
Tem
pera
ture
(°C
)
0.0
5.0
10.0
15.0
20.0
25.0
30.0
35.0
Water depth (cm
)
32.0
32.5
33.0
33.5
34.0
34.5
Air temperatureWater temperatureWater depth
Air temperature minus water temperature (°C)
-10 -8 -6 -4 -2 0 2 4 6 8 10
Wat
er d
epth
(cm
)
32.6
32.8
33.0
33.2
33.4
33.6
33.8
34.0
34.2
Y = -0.048X + 33.2 r = -0.90
A
B
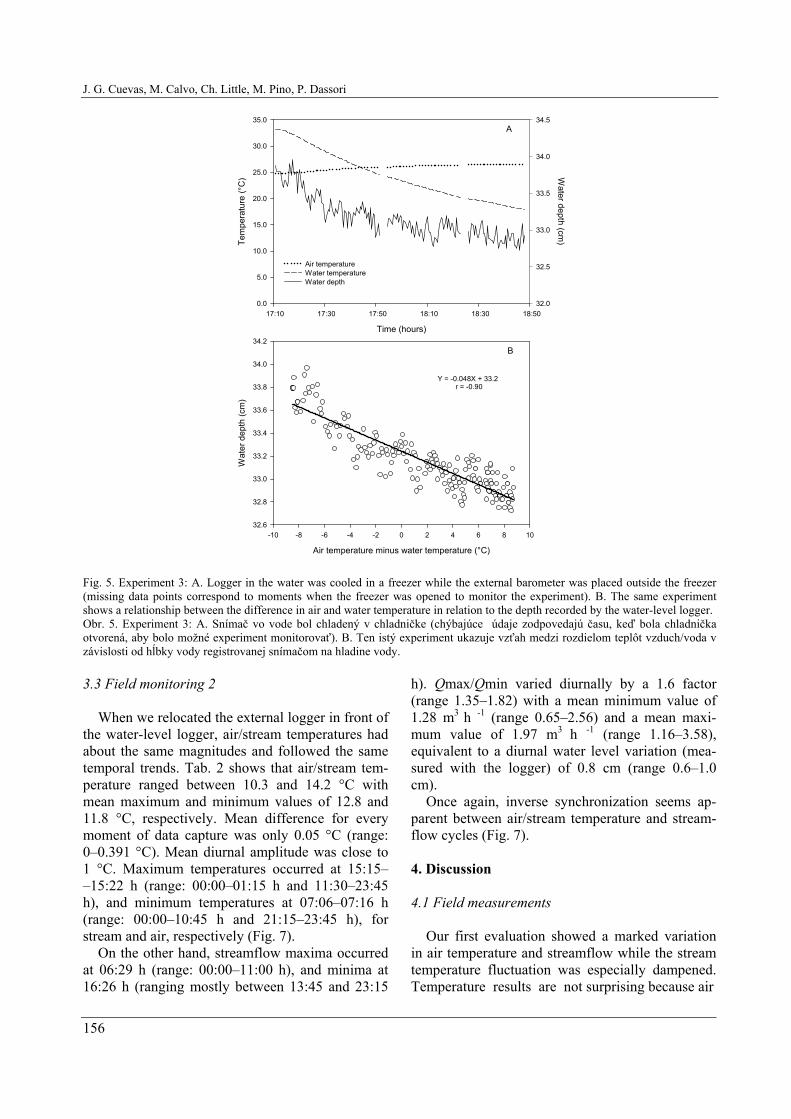
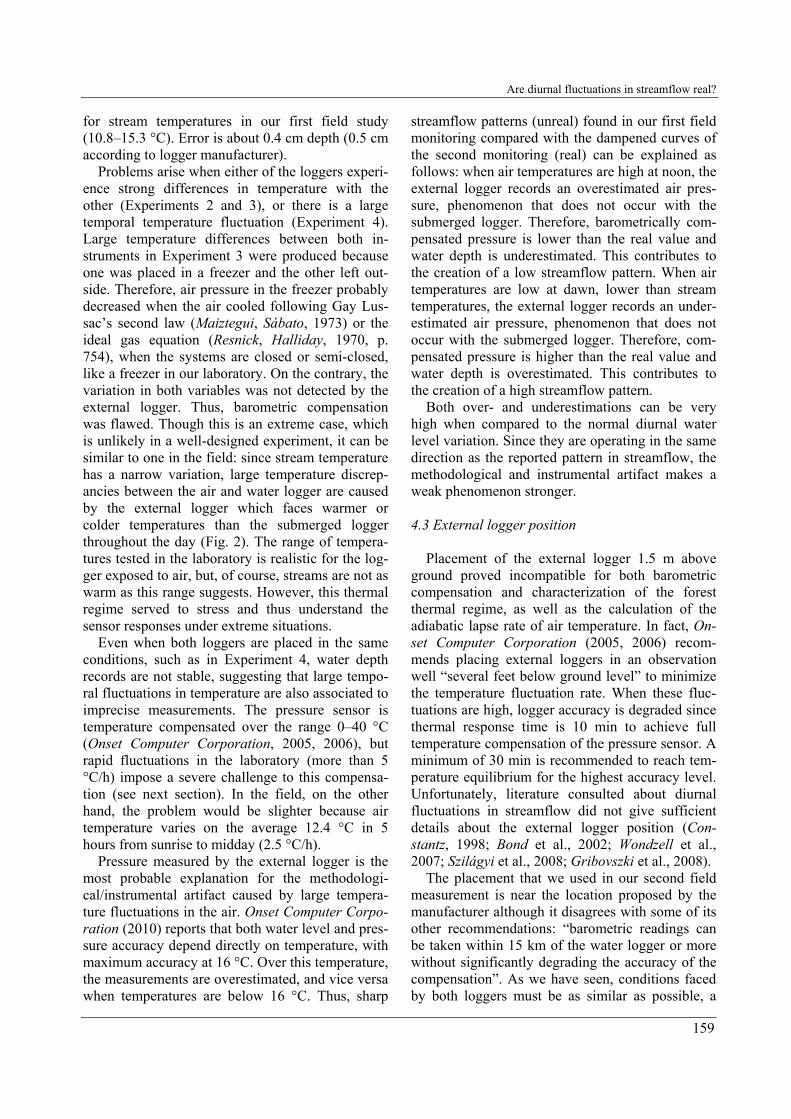
Fig. 5. Experiment 3: A. Logger in the water was cooled in a freezer while the external barometer was placed outside the freezer (missing data points correspond to moments when the freezer was opened to monitor the experiment). B. The same experiment shows a relationship between the difference in air and water temperature in relation to the depth recorded by the water-level logger. Obr. 5. Experiment 3: A. Snímač vo vode bol chladený v chladničke (chýbajúce údaje zodpovedajú času, keď bola chladnička otvorená, aby bolo možné experiment monitorovať). B. Ten istý experiment ukazuje vzťah medzi rozdielom teplôt vzduch/voda v závislosti od hĺbky vody registrovanej snímačom na hladine vody. 3.3 Field monitoring 2
When we relocated the external logger in front of the water-level logger, air/stream temperatures had about the same magnitudes and followed the same temporal trends. Tab. 2 shows that air/stream tem-perature ranged between 10.3 and 14.2 °C with mean maximum and minimum values of 12.8 and 11.8 °C, respectively. Mean difference for every moment of data capture was only 0.05 °C (range: 0–0.391 °C). Mean diurnal amplitude was close to 1 °C. Maximum temperatures occurred at 15:15– –15:22 h (range: 00:00–01:15 h and 11:30–23:45 h), and minimum temperatures at 07:06–07:16 h (range: 00:00–10:45 h and 21:15–23:45 h), for stream and air, respectively (Fig. 7).
On the other hand, streamflow maxima occurred at 06:29 h (range: 00:00–11:00 h), and minima at 16:26 h (ranging mostly between 13:45 and 23:15
h). Qmax/Qmin varied diurnally by a 1.6 factor (range 1.35–1.82) with a mean minimum value of 1.28 m3
h -1 (range 0.65–2.56) and a mean maxi-mum value of 1.97 m3
h -1 (range 1.16–3.58), equivalent to a diurnal water level variation (mea-sured with the logger) of 0.8 cm (range 0.6–1.0 cm).
Once again, inverse synchronization seems ap-parent between air/stream temperature and stream-flow cycles (Fig. 7). 4. Discussion 4.1 Field measurements
Our first evaluation showed a marked variation in air temperature and streamflow while the stream temperature fluctuation was especially dampened. Temperature results are not surprising because air

Are diurnal fluctuations in streamflow real?
157
Time (hours)
12:00 13:00 14:00 15:00 16:00 17:00 18:00
Tem
pera
ture
(°C
)
0
5
10
15
20
25
30
35
40
Water depth (cm
)
33.0
33.2
33.4
33.6
33.8
34.0
34.2
Air tremperatureWater temperatureWater depth
Air temperature minus water temperature (°C)
-14 -12 -10 -8 -6 -4 -2 0
Wat
er d
epth
(cm
)
33.4
33.5
33.6
33.7
33.8
33.9
34.0
34.1
34.2
A
B
Fig. 6. Experiment 4: A. Same setting as in Fig. 5, except that the barometer was placed inside the freezer. B. The same experiment shows the relationship between the difference in air and water temperature in relation to the depth recorded by the water-level logger. Obr. 6. Experiment 4: A. To isté, ako na obr. 5, s výnimkou toho, že barometer bol umiestnený v chladničke. B. Ten istý experi-ment znázorňuje vzťah medzi teplotami vzduchu a vody v závislosti od hĺbky vody registrovanej snímačom na hladine vody. T a b l e 2. Diurnal temperature variations for RC6 watershed from December 2009 to March 2010. T a b u ľ k a 2. Denné fluktuácie teplôt vody a vzduchu pre povodie RC6 od decembra do marca 2009.
Maximum temperature Minimum temperature Diurnal amplitude Stream
Mean [°C] 12.8 11.8 1.1 Range [°C] 11.2–14.0 10.3–13.1 0.4–1.8
Air Mean [°C] 12.9 11.7 1.2 Range [°C] 11.2–14.2 10.3–13.1 0.4–2.1
temperature at every height is more variable than the temperature of a body of water (Geiger, 1957; pp. 73, 157). When we placed the logger for baro-metric compensation immediately in front of the other, results confirmed the streamflow pattern previously detected in the field, but streamflow fluctuations were 19% less accentuated. Since air and stream temperatures were very similar and had the same temporal trend, streamflow pattern can no
longer be explained by a possible methodologi-cal/instrumental artifact.
Our results support a tight and inverse coupling between both air and stream temperature with streamflow. Other studies have found similar diur-nal fluctuations in streamflow, expressed as maxi-mum Q/minimum Q ratios, that do not surpass the value 2.0 (Constantz, 1998; Bond et al., 2002; Wondzell et al., 2007; Szilágyi et al., 2008). The reported association can be mediated by evapotran-

J. G. Cuevas, M. Calvo, Ch. Little, M. Pino, P. Dassori
158
Time (hours)
00:00 12:00 00:00 12:00 00:00 12:00 00:00 12:00 00:00 12:00 00:00 12:00 00:00 12:00 00:00
Tem
pera
ture
(o C)
-4.0
0.0
4.0
8.0
12.0
16.0
Stream
flow (m
3 h -1)
0.0
2.0
4.0
6.0
8.0
10.0
12.0
Air temperature Stream temperatureStreamflow
0:00 12:00 0:00 12:00 0:00 12:00 0:00 12:00 0:00 12:00 0:00 12:00 0:00 12:00 0:000.6
0.8
1.0
1.2
1.4
1.6
1.8
Stre
amflo
w (m
3 h-1
)
Time (hours)
Fig. 7. Diurnal variation in streamflow and air/stream temperature after relocation of the external barometer (inside the weir, but exposed to the air), for a representative week in January 2010 (Field monitoring 2). Streamflow is shown on the same scale as in Fig. 2, as well as an expanded scale (insert graph). Obr. 7. Denné variácie v prúdení vody a teplôt vzduch/voda po zmene umiestnenia externého barometra (vo vnútri priepadu, ale exponovaného na vzduchu), pre reprezentatívny týždeň v januári 2010. (Monitorovanie 2). Prietok je znázornený v tej istej mierke, ako je to na obr. 2, ako aj v rozšírenej mierke (vložený obrázok). spiration which increases with air temperature (Monteith, 1965), a phenomenon especially intense in trees (Bren, 1997; Bond et al., 2002; Střelcová et al., 2009). When evapotranspiration decreases wa-ter recharge to the soil (Hughes, 2010), the ground-water level is also expected to decrease. Moreover, Szilágyi et al. (2008) and Gribovszki et al. (2008) showed a direct coupling between groundwater level and streamflow, both phenomena associated to riparian vegetation in Hungary. We also showed that air temperature positively influences stream temperatures, an outcome already discussed in de-tail by Mohseni and Stefan (1999). Other explica-tive mechanisms for diurnal fluctuations in stream-flow are unlikely in our watershed because the schist under the stream is not permeable, thus mak-ing our stream a probable gaining stream rather than a losing reach that could lose water as a func-tion of stream temperature (Constantz, 1998). Lastly, snowmelt and freeze-thaw cycles do not occur in summer, and it does not snow during win-ter in our study site.
Streamflow maxima generally occurred early in the morning, as other studies have documented (Wondzell et al., 2007; Gribovszki et al., 2008), although Constantz (1998) showed maxima after 10 a.m. Regarding streamflow minima, our mean re-sults (13:42–16:26 h) are close to the findings of
the abovementioned studies, especially the later hour. Stream temperature maximum was at 14:34– –15:15 h and the minimum was at 06:57–07:06 h, both within the range reported by Constantz (1998).
Maximum and minimum air temperatures oc-curred at 13:35 and 08:47 h, respectively, times close to midday and sunrise which were reported as typical hours by Geiger et al. (2003, p. 73) (if we consider that Chilean time should be one hour less than the official hour). It is to be noted that in our second field monitoring, times for extreme air tem-peratures diverged from the first field monitoring, approaching corresponding times for stream tem-perature. This fact emphasized stream influence on the air surrounding the water table (Geiger et al., 2003, p. 157). 4.2 Generation of a methodological/ instrumental artifact
Water level is calculated by deducting atmos-pheric pressure from the pressure measured below water with both measurements coming from inde-pendent instruments; thus, any error in separated instrumental records can have consequences on inferred water depths. Experiment 1 showed that when air and atmospheric pressure are fairly stable, water level records are reliable in the realistic range
Are diurnal fluctuations in streamflow real?
159
for stream temperatures in our first field study (10.8–15.3 °C). Error is about 0.4 cm depth (0.5 cm according to logger manufacturer).
Problems arise when either of the loggers experi-ence strong differences in temperature with the other (Experiments 2 and 3), or there is a large temporal temperature fluctuation (Experiment 4). Large temperature differences between both in-struments in Experiment 3 were produced because one was placed in a freezer and the other left out-side. Therefore, air pressure in the freezer probably decreased when the air cooled following Gay Lus-sac’s second law (Maiztegui, Sábato, 1973) or the ideal gas equation (Resnick, Halliday, 1970, p. 754), when the systems are closed or semi-closed, like a freezer in our laboratory. On the contrary, the variation in both variables was not detected by the external logger. Thus, barometric compensation was flawed. Though this is an extreme case, which is unlikely in a well-designed experiment, it can be similar to one in the field: since stream temperature has a narrow variation, large temperature discrep-ancies between the air and water logger are caused by the external logger which faces warmer or colder temperatures than the submerged logger throughout the day (Fig. 2). The range of tempera-tures tested in the laboratory is realistic for the log-ger exposed to air, but, of course, streams are not as warm as this range suggests. However, this thermal regime served to stress and thus understand the sensor responses under extreme situations.
Even when both loggers are placed in the same conditions, such as in Experiment 4, water depth records are not stable, suggesting that large tempo-ral fluctuations in temperature are also associated to imprecise measurements. The pressure sensor is temperature compensated over the range 0–40 °C (Onset Computer Corporation, 2005, 2006), but rapid fluctuations in the laboratory (more than 5 °C/h) impose a severe challenge to this compensa-tion (see next section). In the field, on the other hand, the problem would be slighter because air temperature varies on the average 12.4 °C in 5 hours from sunrise to midday (2.5 °C/h).
Pressure measured by the external logger is the most probable explanation for the methodologi-cal/instrumental artifact caused by large tempera-ture fluctuations in the air. Onset Computer Corpo-ration (2010) reports that both water level and pres-sure accuracy depend directly on temperature, with maximum accuracy at 16 °C. Over this temperature, the measurements are overestimated, and vice versa when temperatures are below 16 °C. Thus, sharp
streamflow patterns (unreal) found in our first field monitoring compared with the dampened curves of the second monitoring (real) can be explained as follows: when air temperatures are high at noon, the external logger records an overestimated air pres-sure, phenomenon that does not occur with the submerged logger. Therefore, barometrically com-pensated pressure is lower than the real value and water depth is underestimated. This contributes to the creation of a low streamflow pattern. When air temperatures are low at dawn, lower than stream temperatures, the external logger records an under-estimated air pressure, phenomenon that does not occur with the submerged logger. Therefore, com-pensated pressure is higher than the real value and water depth is overestimated. This contributes to the creation of a high streamflow pattern.
Both over- and underestimations can be very high when compared to the normal diurnal water level variation. Since they are operating in the same direction as the reported pattern in streamflow, the methodological and instrumental artifact makes a weak phenomenon stronger. 4.3 External logger position
Placement of the external logger 1.5 m above ground proved incompatible for both barometric compensation and characterization of the forest thermal regime, as well as the calculation of the adiabatic lapse rate of air temperature. In fact, On-set Computer Corporation (2005, 2006) recom-mends placing external loggers in an observation well “several feet below ground level” to minimize the temperature fluctuation rate. When these fluc-tuations are high, logger accuracy is degraded since thermal response time is 10 min to achieve full temperature compensation of the pressure sensor. A minimum of 30 min is recommended to reach tem-perature equilibrium for the highest accuracy level. Unfortunately, literature consulted about diurnal fluctuations in streamflow did not give sufficient details about the external logger position (Con-stantz, 1998; Bond et al., 2002; Wondzell et al., 2007; Szilágyi et al., 2008; Gribovszki et al., 2008).
The placement that we used in our second field measurement is near the location proposed by the manufacturer although it disagrees with some of its other recommendations: “barometric readings can be taken within 15 km of the water logger or more without significantly degrading the accuracy of the compensation”. As we have seen, conditions faced by both loggers must be as similar as possible, a

J. G. Cuevas, M. Calvo, Ch. Little, M. Pino, P. Dassori
160
requirement difficult to meet at 15 km when con-sidering different continentality, altitude, microcli-mate, etc.
Relocation of the external logger is the most convenient and accurate strategy to detect diurnal patterns in streamflow. Thermal fluctuations of both loggers are especially dampened and have virtually the same magnitude and temporal trend. Thus, they are sensing temperature and atmospheric pressure in the same way. Another alternative would be to develop a correction factor for the measurements already taken. However, different experiments produce different slopes and intercepts of the depth-temperature difference curve making it difficult to choose which correction factor to use. 5. Conclusions
We conclude that diurnal fluctuations in stream-flow are real but can be intensified by an incorrect location of the barometric compensation logger. Our results are relevant depending on the range of the water level fluctuation and the frequency of data capture. For instance, Kröger et al. (2008) and Ostrander et al. (2008), with the same logger model that we used, measured streamflows and tide ampli-tudes, and placing the external logger at 1.5 or 4 m above ground, respectively. Both the purpose of those research studies and the temporal scale of measured water fluctuations did not show any of the possible instrumental and methodological un-certainties. Thus, no putative artifact is important in those cases. The reported artifact has great impor-tance when the objective is either to document small signals in streamflow, to know the exact value of streamflow, or for the assessment of statis-tical relationships between variables.
Finally, our field detection of diurnal streamflow variation is striking, considering that we used a water-level logger designed for the 0–9 m range and with a 0.21 cm resolution. There are other log-gers (e.g., U20-001-04, Onset Computer Corpora-tion; BaroDiver 11.11.55.01, Schlumberger) that have a narrow range (0–4 m; 0–1.5 m, respec-tively), with a better resolution (0.14–0.10 cm, re-spectively), and a lower typical error (0.3–0.45 cm, respectively). However, the dependency of mea-surements on air/water temperature must be tested as set forth in this study. Acknowledgement. We thank the FONDECYT grant no. 1085024 for founding this research. We also thank the FORECOS Foundation and Val-divian Coastal Reserve for providing equipment
and facilities for field work; Dr. Hamil Uribe for warning us about a possible methodologi-cal/instrumental artifact in our data; Anton Huber, José Luis Arumí, Robert Brümmer, Carlos Oyarzún and Diego Rivera for providing literature and help-ful advice; Miguel López and Marcel Fuentes who facilitated our data analyses work. We greatly ap-preciate the valuable comments that we received from two anonymous referees. A preliminary ver-sion of this manuscript was presented as a lecture at the 2nd International Biohydrology Conference 2009: “A Changing Climate for Biology and Soil Hydrology Interactions” held in Bratislava, Slova-kia from 21 September to 24 September 2009. We thank the organizing committee for inviting us to submit this paper to the journal. REFERENCES ACWORTH R.I., BRAIN T., 2008: Calculation of barometric
efficiency in shallow piezometers using water levels, at-mospheric and earth tide data. Hydrogeology J., 16, 1469– –1481.
BOND B.J., JONES J.A., MOORE G., PHILLIPS N., POST D., MCDONNEL J.J.L., 2002: The zone of vegetation in-fluence on baseflow revealed by diurnal patterns of stream-flow and vegetation water use in a headwater basin. Hydrol. Process., 16, 1671–1677.
BOYLESTAD R.L., NASHELSKY L., 1999: Electronic de-vices and circuit theory. Prentice Hall, Upple Saddle River, New Jersey, USA.
BREN L.J., 1997: Effects of slope vegetation removal on the diurnal variation of a small mountain stream. Wat. Resour. Res., 33, 321–331.
CAINE N., 1992: Modulation of the diurnal streamflow re-sponse by the seasonal snowcover of an alpine basin. J. Hy-drol., 137, 245–260.
COCKBURN J.M.H., LAMOUREUX S.F., 2008a: Inflow and lake controls on short-term mass accumulation and sedi-mentary particle size in a High Arctic lake: implications for interpreting varved lacustrine sedimentary records. J. Paleo-limnol., 40, 923–942.
COCKBURN J.M.H., LAMOUREUX S.F., 2008b: Hydrocli-mate controls over seasonal sediment yield in two adjacent High Arctic watersheds. Hydrol. Process., 22, 2013–2027.
CONSTANTZ J., 1998: Interaction between stream tempera-ture, streamflow, and groundwater exchanges in alpine streams. Wat. Resour. Res., 34, 1609–1615.
COOK N.P., 1999: A first course in digital electronics. Pren-tice Hall, Upple Saddle River, New Jersey, USA.
CUEVAS J.G., SOTO D., ARISMENDI I., PINO M., LARA A., OYARZÚN C., 2006: Relating land cover to stream properties in southern Chilean watersheds: trade-off be-tween geographical scale, sample size, and explicative power. Biogeochemistry, 81, 313–329.
GEIGER R., 1957: The climate near the ground. Second Edi-tion. Harvard University Press: Cambridge, Massachusetts, USA.
GEIGER R., ARON R.H., TODHUNTER P., 2003: The cli-mate near the ground. Sixth edition. Rowman and Littlefield Publishers Inc., Maryland, USA.

Are diurnal fluctuations in streamflow real?
161
GRAHAM L.P., 1999: Modeling runoff to the Baltic sea. Ambio, 28, 328–333.
GRIBOVSZKI Z., KALICZ P., SZILÁGYI J., KUCSARA M., 2008: Riparian zone evapotranspiration from diurnal groundwater level fluctuations. J. Hydrol., 349, 6–17.
HUGHES D.A., 2010: Unsaturated zone fracture flow contri-butions to stream flow: evidence for the process in South Africa and its importance. Hydrol. Process., 24, 767–774.
JORDON P., 1983: Meltwater movement in a deep snowpack. 1. Field observations. Wat. Resour. Res., 19, 971–978.
KOMSTA L., 2007: mblm: Median-Based Linear Models. R package version 0.11. URL: http://www.r-project.org, http://www.komsta.net/
KRÖGER R., HOLLAND M.M., MOORE M.T., COOPER C.M., 2008: Agricultural drainage ditches mitigate phospho-rus loads as a function of hydrological variability. J. Envi-ronmental Quality, 37, 107–113.
LARA A., VILLALBA R., URRUTIA R., 2008: A 400-year tree-ring record of the Puelo River summer–fall streamflow in the Valdivian Rainforest eco-region, Chile. Climatic Change, 86, 331–356.
LARA A., LITTLE C., URRUTIA R., MCPHEE J., ÁLVA-REZ-GARRETÓN C., OYARZÚN C., SOTO D., DONOSO P., NAHUELHUAL L., PINO M., ARISMENDI I., 2009: Assessment of ecosystem services as an opportu-nity for the conservation and management of native forests in Chile. Forest Ecol. Manage., 258, 415–424.
LITTLE C., SOTO D., LARA A., CUEVAS J.G., 2008: Nitro-gen exports at multiple-scales in a southern Chilean water-shed (Patagonian Lakes district). Biogeochemistry, 87, 297–309.
LITTLE C., LARA A., MCPHEE J., URRUTIA R., 2009: Revealing the impact of forest exotic plantations on water yield in large scale watersheds in South-Central Chile. J. Hydrol., 374, 162–170.
MAIZTEGUI A.P., SÁBATO J.A., 1973: Física, Tomo I, Novena Edición. Editorial Kapelusz, Buenos Aires, Argen-tina, p. 471.
MOHSENI O., STEFAN H.G., 1999: Stream temperature/air temperature relationship: a physical interpretation. J. Hy-drol., 218, 128–141.
MONTEITH J.L., 1965: Evaporation and environment. pp. 205–234. In G.E. Fogg (ed.) Symposium of the Society for Experimental Biology, The State and Movement of Water in Living Organisms, Vol. 19, Academic Press Inc., New York, USA.
ONSET COMPUTER CORPORATION, 2005, 2006: HOBO® U20 Water Level Logger (Part # U20-001-01). Doc # 8976-G, MAN-U20-001-01. Bourne, Massachusetts, USA.
ONSET COMPUTER CORPORATION, 2010: HOBO® Wa-ter Level Logger vs the Competition. URL: http://www.onsetcomp.com/waterlevelvscompetition. Ac-cessed 28 April 2010.
OSTRANDER CH.E., MCMANUS M.A., DECARLO E.H., MACKENZIE F.T., 2008: Temporal and spatial variability of freshwater plumes in a semienclosed estuarine–bay sys-tem. Estuaries and Coasts: J CERF, 31, 192–203.
PAYNTER R.T., 1999: Introductory electric circuits. Conven-tional flow version. Prentice Hall, Upple Saddle River, New Jersey, USA.
R DEVELOPMENT CORE TEAM, 2009: R: A language and environment for statistical computing. R Foundation for Statistical Computing, Vienna, Austria. ISBN 3-900051-07-0, URL: http://www.R-project.org.
RESNICK R., HALLIDAY D., 1970: Física Parte I. Compañía Editorial Continental, S.A. México-España-Argentina-Chile. p. 922. (Translation of the English original version: Physics.- For Students of Science and Engineering, 1966, John Wiley & Sons, Inc.).
SEN P.K., 1968: Estimates of the regression coefficient based on Kendall's tau. J. Amer. Statistic. Associat., 63, 1379– –1389.
SIEGEL S., CASTELLAN N.J., 1988: Nonparametric statistics for the behavioral sciences. Second edition. McGraw-Hill, New York, USA.
SOKAL R.R., ROHLF F.J., 1995: Biometry. The principles and practice of statistics in biological research. Third edi-tion. W.H. Freeman and Company, New York, USA.
STŘELCOVÁ K., KUČERA J., FLEISCHER P., GIORGI S., GÖMÖRYOVÁ E., ŠKVARENINA J., DITMAROVÁ Ľ., 2009: Canopy transpiration of mountain mixed forest as a function of environmental conditions in boundary layer. Biologia, 64, 507–511.
SZILÁGYI J., GRIBOVSZKI Z., KALICZ P., KUCSARA, M., 2008: On diurnal riparian zone groundwater-level and streamflow fluctuations. J. Hydrol., 349, 1–5.
TESAŘ M., ŠÍR M., LICHNER Ľ., FIŠÁK J., 2008: Extreme runoff formation in the Krkonoše Mts. in August 2002. Soil & Water Res., 3, (Special Issue 1), S147–S154.
THEIL H., 1950: A rank-invariant method of linear and poly-nomial regression analysis, III. Proceedings of the Koninkli-jke Nederlandse Akademie van Wetenschappen, A 53, 1397–1412.
TROXELL M.C., 1936: The diurnal fluctuation in the ground-water and flow of the Santa Ana River and its meaning. Transactions, American Geophysical Union, 17, 496–504.
WARD A.D., TRIMBLE S.W., 2003: Environmental Hydrol-ogy. Second edition. Lewis Publishers. Boca Raton, Lon-don, New York, Washington D.C. p. 475.
WICHT C.L., 1941. Diurnal fluctuations in Jonkershoek streams due to evaporation and transpiration. J. Southern African Forestry Assoc., 7, 34–49.
WMO, 2008: Chapter 2: Measurement of temperature. In: WMO (ed.) Guide to Meteorological Instruments and Methods of Observation. No. 8. Seventh edition. Geneva, Switzerland. p. I.2-1–I.2-20.
WONDZELL S.M., GOOSEFF M.N., MCGLYNN B.L., 2007: Flow velocity and the hydrologic behavior of streams dur-ing baseflow. Geophysical Research Letters, 34, L24404.
Received 30 April 2010 Accepted 23 June 2010
SÚ DENNÉ FLUKTUÁCIE PRIETOKOV V TOKOCH REÁLNE? Jaime G. Cuevas, Matías Calvo, Christian Little, Mario Pino, Paul Dassori
Z výsledkov štúdia vyplýva reálnosť denných fluk-tuácií prietokov v tokoch, tieto však môžu byť zintenzív-nené nevhodnou lokalizáciou barometricky kompen-zovaného snímača. Význam týchto výsledkov závisí od rozsahu fluktuácií vodných hladín a od frekvencie zápisu údajov. Napríklad Kröger et al. (2008) a Ostrander et al. (2008) použili ten istý snímač ako my na meranie prieto-
J. G. Cuevas, M. Calvo, Ch. Little, M. Pino, P. Dassori
162
kov v tokoch a amplitúdy prílivu, s umiestnením ex-terného snímača 1,5 a 4 m nad povrchom terénu. Účel a mierka času meraných fluktuácií vody v týchto štúdiách nenaznačovali možné metodické a inštrumentalistické nejasnosti. V tomto prípade nebol zistený žiadny všeobecne známy artefakt. Tu opísané artefakty sú významné, ak je cieľom meraní dokumentovať malé zmeny hladín v toku, získať presné hodnoty prietokov, alebo určiť štatistické závislosti medzi premennými.
Nakoniec, detekcia denných zmien prietokov v (malých) tokoch je prekvapujúca, berúc do úvahy fakt,
že bol použitý snímač na meranie hladín vody s rozsa-hom 0–9 m a rozlíšením 0,21 cm. Existujú aj iné snímač (napr., U20-001-04, Onset Computer Corporation; BaroDiver 11.11.55.01, Schlumberger) s užšími rozsahmi (0–4 m; 0–1,5 m), s lepším rozlíšením (0,14– –0,10 cm), a s nižšou chrakteristickou chybou merania (0,3–0,45 cm). Samozrejme, závislosť medzi meraním teplôt vzduchu a vody musí byť testovaná tak, ako to bolo urobené v tejto štúdii.
Related Documents