LAND USE CHANGE, WATER AVAILABILITY AND ADAPTATION STRATEGIES IN CHANGING AND VARIABLE CLIMATE IN KAJIADO NORTH, KENYA Mtisunge Mngoli A56/73262/2012 A thesis submitted in partial fulfillment of the requirements for the award of degree of Master of Science in Land and Water Management Department of Land Resource Management and Agricultural Technology (LARMAT) Faculty of Agriculture University of Nairobi 2014

Welcome message from author
This document is posted to help you gain knowledge. Please leave a comment to let me know what you think about it! Share it to your friends and learn new things together.
Transcript

LAND USE CHANGE, WATER AVAILABILITY AND ADAPTATION STRATEGIES
IN CHANGING AND VARIABLE CLIMATE IN KAJIADO NORTH, KENYA
Mtisunge Mngoli
A56/73262/2012
A thesis submitted in partial fulfillment of the requirements for the award of degree of
Master of Science
in
Land and Water Management
Department of Land Resource Management and Agricultural Technology (LARMAT)
Faculty of Agriculture
University of Nairobi
2014

i
DECLARATION
This thesis is my original work and has not been presented for award of a degree/research in any
other university.
………………………….. ………………………………
Mtisunge Mngoli Date
This thesis has been submitted with our approval as university supervisors.
……………………………… ………………………………….
Prof. G. Kironchi Date
Department of LARMAT
University of Nairobi
………………………………. …………………………………
Dr. V. M. Kathumo Date
Department of LARMAT
University of Nairobi

ii
TABLE OF CONTENTS
DECLARATION ............................................................................................................................. i
TABLE OF CONTENTS ................................................................................................................ ii
ACKNOWLEDGEMENT ............................................................................................................. vi
DEDICATION .............................................................................................................................. vii
ACRONYMS AND ABBREVIATIONS .................................................................................... viii
ABSTRACT ................................................................................................................................... ix
CHAPTER ONE: INTRODUCTION ............................................................................................. 1
1.1 Background information .................................................................................................. 1
1.2 Statement of the problem ................................................................................................. 3
1.3 Justification of the study .................................................................................................. 3
1.4 Research objectives ............................................................................................................... 5
1.4.1 Overall objective ............................................................................................................. 5
1.4.2 Specific objectives .................................................................................................... 5
1.5 Research questions ................................................................................................................ 5
CHAPTER TWO: LITERATURE REVIEW ................................................................................. 6
2.1 Global climate change ...................................................................................................... 6
2.2 Climate change in sub-Saharan Africa ............................................................................. 7
2.3 Climate change in Kenya ................................................................................................. 9
2.3.1 Impact of Climate change on water resources .......................................................... 9
2.3.2 Coping strategies to climate change ............................................................................. 11
2.4 Global land use change .................................................................................................. 12
2.5 Land use change in sub Saharan Africa ......................................................................... 13
2.6 Land use change in Kenya ............................................................................................. 13

iii
2.7 Land use change in Kajiado ........................................................................................... 14
2.7.1 Impact of land use changes on water resources ...................................................... 15
2.8 The use of Participatory GIS in determining land use change ....................................... 16
2.9 Overview of water resources in the World ..................................................................... 18
2.10 Overview of water resources in sub-Saharan Africa ...................................................... 19
2.11 Overview of water resources in Kenya .......................................................................... 21
2.12 Overview of water resources in Kajiado ........................................................................ 22
2.13 Rainwater harvesting in Sub-Saharan Africa ................................................................. 23
2.14 Rainwater harvesting in Kenya ...................................................................................... 25
2.15 Rainwater harvesting in Kajiado and the ASALS of Kenya .......................................... 26
CHAPTER THREE: MATERIALS AND METHODS ............................................................... 28
3.1 Description of the study area ............................................................................................... 28
3.2 Determining the magnitude and pattern of land use changes in the past 20 years .............. 30
3.3 Climate change effect on water resources and the perception of rainwater harvesting as a
coping strategy to climate change and variability ..................................................................... 31
3.3.1 Sampling size and sampling technique ......................................................................... 32
CHAPTER FOUR: RESULTS AND DISCUSSIONS ................................................................. 33
4.1 Magnitude and pattern of land use changes that have occurred in the past 20 years .......... 33
4.1.1 Changes in land use/cover for Kisaju sub-locations from 1990, 2000 and 2010 ......... 33
4.1.2 Changes in land use/cover for Matali sub-locations from 1990, 2000 and 2010 ......... 35
4.1.3 Changes in land use/cover for Nkoroi sub-locations from 1990, 2000 and 2010 ........ 36
4.1.4 Changes in land use/cover for Oloosidan sub-locations from 1990, 2000 and 2010 ... 39
4.2 Assessing the effect of climate change and variability on water resources ........................ 42
4.2.1 Establishing the available water resources ................................................................... 42
4.2.2 Effect of climate change and variability on water resources ........................................ 44
iv
4.3 Assessing the perception of rainwater harvesting as a coping strategy to climate change
and variability ............................................................................................................................ 46
4.3.1 Awareness on water harvesting .................................................................................... 46
4.3.2 Rainwater harvesting technologies existing in the area ................................................ 47
4.3.3 Institutions on rainwater harvesting ............................................................................. 49
4.3.4 Gender and rainwater harvesting .................................................................................. 50
4.3.5 Basis for not harvesting water ...................................................................................... 51
4.3.6 Duration of the harvested water.................................................................................... 52
4.3.7 Uses of the harvested water .......................................................................................... 53
4.3.8 How do they cope with the changing climate? ............................................................. 54
CHAPTER FIVE: CONCLUSION AND RECOMMENDATIONS ........................................... 57
5.1 CONCLUSION .............................................................................................................. 57
5.2 RECOMMENDATIONS .................................................................................................... 58
6.0 REFERENCES ....................................................................................................................... 59
7.0 APPENDICES ........................................................................................................................ 74
7.1 Appendix 1: Questionnaire.................................................................................................. 74
7.2 Appendix 2: Percentage changes in settlements, farmland, water bodies and grassland for
the 4 sub-locations ..................................................................................................................... 79
v
LIST OF FIGURES
Figure 1: Map of Kajiado showing Kajiado North 9Source; ThingLink) .................................... 29
Figure 2: Map of Kisaju sub location showing changes in land use from (a) 1990, (b) 2000 and
(c) 2010. ........................................................................................................................................ 34
Figure 3: Map of Matali sub location showing changes in land use from (a) 1990, (b) 2000 and
(c) 2010 ........................................................................................................................................ .36
Figure 4: Map of Nkoroi sub location showing changes in land use from (a) 1990, (b) 2000 and
(c) 2010 ......................................................................................................................................... 38
Figure 5: Map of Oloosidan sub location showing changes in land use from (a) 1990, (b) 2000
and (c) 2010 .................................................................................................................................. 40
Figure 6: Shows the main sources of water in Kajiado North ...................................................... 43
Figure 7: Shows the responses to the effect of climate change on water resources in Kajiado
North ............................................................................................................................................. 45
Figure 8: Shows the percentages of households who harvest water in Kajiado North ................. 46
Figure 9: Shows the rainwater harvesting technologies practiced in Kajiado North .................... 48
Figure 10: Shows the percentages of people who had contact with the extension officers in
Kajiado North................................................................................................................................ 49
Figure 11: Shows the involvement of men, women and children in rainwater harvesting in
Kajiado North................................................................................................................................ 50
Figure 12: Shows why farmers harvest water in Kajiado North ................................................... 51
Figure 13: Shows the amount of time harvested water last .......................................................... 52
Figure 14: Shows the uses of the harvested water ........................................................................ 54
Figure 15: Shows the coping strategies to climate change used in Kajiado North ....................... 55

vi
ACKNOWLEDGEMENT
First and foremost I thank God for giving me the strength, courage and wisdom to go on with my
masters despite all the troubles and discouragements. I want to take this opportunity to express
my heartfelt gratitude and appreciation to my supervisors Prof G. Kironchi and Dr V. Kathumo
for their enormous and outstanding contribution towards the success of my masters‟ studies at
University of Nairobi. You undertook to act as my supervisors despite your many other academic
and professional commitments. Your wisdom, knowledge and commitment to the highest
standards inspired and motivated me.
Special thanks to IDRC and ANAFE for funding my research project, providing financial
assistance in completing this project, to God be the glory. Special thanks to Mr Mkayenda for
helping me with the analysis, the people of Kajiado district, the agricultural officers, the people
who participated in the data collection and the residents of Kajiado for sharing their information
to me, May God bless you.
Special thanks go to my parents Ernest and Delia Mngoli who taught me to value myself and that
the sky is the limit, their guiding hands on my shoulder will remain with me forever. And to my
siblings Amos and Kitty Mngoli
Finally, my special appreciation goes to my sister from another mother Caroline Kamanga
Limuwa for making my life here bearable, she left foot prints on my heart and will always be
grateful, and my classmates for their remarkable support, encouragement and motivation
throughout my studies. To those I have worked with in the course of this study but not mentioned
above, I sincerely thank you and May God bless you abundantly.

vii
DEDICATION
I dedicate this work to my loving family; my parents Ernest and Delia Mngoli. My siblings
Amos and Kitty Mngoli for being there with me throughout my studies, providing financial and
moral support throughout my life, they are a gift from God, I am truly grateful.

viii
ACRONYMS AND ABBREVIATIONS
ADB Asian Development Bank
ASALs Arid and Semi-Arid Lands
CWR Crop Water Requirement
DDP District Development Plan
FAO Food and Agriculture Organization
FGDs Focus Group Discussions
GDP Gross Domestic Product
GIS Geographic Information System
GoK Government of Kenya
GPS Global Positioning System
IPCC Inter-governmental Panel on Climate Change
PGIS Participatory GIS
RELMA Regional Land Management Unit
SSA Sub-Saharan Africa
TISDA Transparency and Integrity Service Delivery in Africa
TISDA Transparency and Integrity Service Delivery in Africa
UNDP United Nations Development Programme
UNEP United Nations Environmental Programme
UNICEF United Nations Children‟s Fund

ix
ABSTRACT
Water is a fundamental natural resource for all life on the planet, as both social and economic
activities depend heavily on water. In Kenya like many other countries in sub Saharan Africa,
water resources are becoming scarce due to climate change, change in land use and high
population growth. The study was conducted in Kajiado North with principal objectives of (a)
determining the magnitude and pattern of land use changes that have occurred in the past 20
years in Kajiado North (b) assessing the effect of climate change and variability on water
resources and (c) assessing the perception of rainwater harvesting as a coping strategy to climate
change and variability. A semi-structured questionnaire was administered to 220 respondents
chosen randomly in Isinya and Ngong‟ sub-counties to explore the perceptions about rainwater
harvesting and the data analyzed using the Statistical Package for Social Scientists (SPSS). To
determine the magnitude and pattern of land use change, Participatory GIS (PGIS) and focus
group discussions were conducted from 4 sub locations within the study area and the PGIS maps
subjected to Arc view software and Map info for analysis. Results from PGIS maps revealed
significant increase in settlement of 3.75% from 1990-2000 and 6.5% from 2000 to 2010 and a
significant decrease in grassland of 4.6% from 1990 to 2000 and 7.2% from 2000 to 2010. The
main sources of water are boreholes (33.7%), followed by piped water (25.5%) and rainwater
harvesting was 15.8%. Climate change has affected water resources through drought (30%),
runoff and erosion (21%) and increased evaporation (20%). 100% of the respondents have heard
about rain water harvesting in one way or the other. 87% of the respondents harvest water. Some
harvest it on their households storing it in containers which take less than a month to finish.
Majority of the respondents (80.2%) use the harvested water for domestic use, (5.8%) of the
harvested water from the tanks is used for irrigating crops and the least (1.4%) is used for
x
livestock. There was no significant difference on the involvement in rainwater harvesting for
both men and women. Only 13% of the residents do not harvest water at all. This is because of
lack of equipments and storage facilities. In addition, there is lack of involvement of government
and other institutions in rain water harvesting. Based on the results, it was concluded that there is
a significant change in land use which has affected the communities both positively and
negatively. Climate change has a significant negative impact on agriculture activities in the area
as it leads to reduction in crop yields and increased food prices. People are aware of rainwater
harvesting but it is not being utilized to its full potential. However the level of income is the
major factor that influences the adoption of rain water harvesting at a large scale. The study
recommends that there is need for a constant monitoring of land use change for planning
purposes, with the change in climate appropriate adaptation are essential as the prices of
agricultural commodities are projected to increase in both domestic and world markets. Forming
associations on water harvesting and constructing dams at local level as a group can be used as a
solution to the water storage problems to improve Agriculture production. However,
involvement of institutions, especially for technical expertise would enhance the group water
harvesting interventions.

1
CHAPTER ONE: INTRODUCTION
1.1 Background information
Water is a precious resource that needs to be protected and properly managed so that an adequate
supply and acceptable quality of water can satisfy the increasing need for economic production
(World Bank, 2006). Water contributes tremendously to development and social well-being of
the human population as both social and economic activities rely heavily on the quantity and
quality of water. Water is crucial to plant life. Plants are 90% water and to survive plants require
water. To grow daily food needs; people require 3000 liters of water per person per day (Mati et
al., 2007). However, the agriculture sector is often criticized for high wastage and inefficient use
of water at the point of consumption encouraged by subsidized low charges for water use or low
energy tariffs for pumping, (FAO, 2004).
Change in land use and climate change has resulted in continuous pressure on the world‟s water
resources (Asian Development Bank, 2002). The world is expected to reach between 7.5 and
10.5 billion people by 2050, (United Nations, 2009). The total usable freshwater supply for
ecosystems and humans is about 200 000 km3 of water, less than 1% of all fresh water resources,
(Diop et al., 2002). The United Nations Environmental Programme estimates that by 2025, 1.8
billion people will be living in countries or regions with absolute water scarcity, and two-thirds
of the world population could be under stress conditions, (Alder et al., 2007). Climate change
would deeply modify future patterns of both water availability and use, thereby increasing levels
of water stress and insecurity, both at the global scale and in sectors that depend on water,
(Saunders et al., 2009). Adaptation to climate change and variability is important in agriculture

2
for impact and vulnerability assessment and for the development of climate change and
variability policy (Smit and Skinner, 2001).
The Intergovernmental Panel on Climate Change (IPCC) defines climate change as changes in
the mean and/or the variability of its properties that persists for an extended period, typically,
decades or longer. It is statistically significant decadal variation in either the mean state of the
climate or in its variability (IPCC, 2007). Climate variability refers to short-term fluctuations
around the mean climate state within an averaging period, typically, 30 years (Hare, 1985).
Kenya is described by the United Nations as a water scarce country where by the water demand
exceeds renewable fresh water sources and currently ranks 21st for the worst levels of access to
potable water in the world (United Nations, 2009). Climate change, increase in population and
change in land use has resulted in water resources degradation which has made people food
insecure. Agriculture is the mainstay of the country‟s economy contributing 29% of Kenya‟s
GDP and about 80% of Kenya‟s population is employed in the sector, (UNICEF, 2008). About
84% of the country is arid and semi-arid (GoK, 2010). Kenyan vision 2030 strategy aims to
conserve water sources and start new ways of harvesting and using rain and underground water
(Kenya Vision 2030, 2007).
Rainwater harvesting has been proved to be a sufficient water supply during water restrictions
for household needs in Kenya despite climate change, it is a form of managing risks during
weather variability, (Aroka, 2010). A 2006 report by the UNEP and World Agro-forestry Centre
found that in Africa the rainfall distribution is more than adequate to meet the needs of the
current population, and that water crisis is more of an economic problem from lack of
investment.

3
Kajiado North is one of the peri-urban areas of Kenya in desperate need of clean and safe water
for agricultural production. In recent years there have been long periods of drought when there
has been little or no rain and pressure on water resources by people migrating to this area. This
hampers efforts to encourage agriculture as an alternative to livestock production, (Bouwer,
2000).
1.2 Statement of the problem
Land use change and climate change brought about by drought has led to reduced availability of
water resources especially the permanent rivers in the area (UNDP, 2007). Kajiado is a semi-arid
area of Kenya and therefore access to water has remained a challenge, over the last 50 years, the
county has experienced drought which have had a negative impact on the standards of living of
the communities (Government of Kenya, 2007). Its population has increased rapidly over the
years with an estimated growth of 4.5% due to migration from other parts of Kenya and the
bordering areas of Tanzania, (Kajiado DDP 2002). The government of Kenya does not have the
sufficient funds to maintain strong piping systems, and about 80% of Kenya‟s water resources
are completely unprotected (UNDP, 2007). The pressure brought about by population continues
to increase while the economy and resources struggle to keep up putting pressure on water
resources through agriculture, land and energy uses.
1.3 Justification of the study
The changes in land use and the variability of weather patterns has reduced the agricultural yield
in Kajiado North because it is putting pressure on the available natural resources including water.
The growing concern on food security is that water resources are being degrades due to climate
4
change, leading to a reduction in both quality and quantity of water. With the increase in
population doubling every year, if the water problem is not addressed there is going to be a
tremendous decrease in agriculture production and other income generating activities. Although
many programs and projects in Kenya aim to modernize agriculture and double the food supply
by emphasizing on different mechanisms, most of the technologies are often not customized to
meet the needs and present conditions of smallholder farmers who are the majority of the
population.
However many future impacts of climate change can be reduced or avoided if the necessary
adaptation and coping strategies are implemented. Collecting rainwater for example is an
established practice in Africa. Rainwater is an increasingly promising complement to other
sources of household water, especially in the face of rising demand and drought. Although there
has been progress in achieving some of the water-related Millennium Development Goals
(MDGs) in certain counties and regions including Kenya, much work remains, particularly to
address the special needs of most vulnerable members of society, women and children who bear
the brunt of poverty worldwide.
This study will point out the potential water sources, the magnitude of land use change and
analyze the potential of water harvesting as a coping and adaptation strategy to climate change
and variability in Kajiado north district. The community has different demands from land and
water resources that result into conflicts, this study will help in creating awareness to the policy
makers on the main sources of water in Kajiado and how they can use it.

5
1.4 Research objectives
1.4.1 Overall objective
To contribute towards alleviating water scarcity through promoting rainwater harvesting and
sustainable water conservation measures in Kajiado North, Kenya
1.4.2 Specific objectives
1. To determine the magnitude and pattern of land use changes that have occurred in the
past 20 years
2. To assess the effect of climate change and variability on water resources
3. To assess the perception of rainwater harvesting as a coping strategy to climate change
and variability
1.5 Research questions
1. How has the land use changed in Kajiado north in the last 20 years?
2. What are the effects of land use change, and climate change and variability on water
resources?
3. What is the perception of rainwater harvesting in the area?
4. How is rainwater harvesting used to cope to climate change?

6
CHAPTER TWO: LITERATURE REVIEW
2.1 Global climate change
Models of climate change (GCMs) predict U.S. annual- mean temperatures to generally rise by
2° C to 3° C over the next 100 years, with greater increases in northern regions (5° C), and
northern Alaska (10° C). Numerous other climatic effects are also expected. For example, U.S.
precipitation, which increased by 5 to 10% over the 20th century, is predicted to continue to
increase overall. More specifically, an ensemble of GCMs predicts a 20% increase for northern
North America, a 15% increase in winter precipitation for northwestern regions, and a general
increase in winter precipitation for central and eastern regions (Chase et al., 2003).
Despite predictions of increased precipitation in most regions, net decreases in water availability
are expected in those areas, due to offsetting increases in evaporation (Boko et al., 2007). A 20%
decrease in summer precipitation, for example, is projected for southwestern regions, and a
general decrease in summer precipitation is projected for southern areas. Although projected
regional impacts of climate change are highly variable between models, the above impacts are
consistent across models. In recent decades, changes in climate have caused impacts on natural
and human systems on all continents and across the oceans (Falkenmark, 2003). Evidence of
climate-change impacts is strongest and most comprehensive for natural systems. Some impacts
on human systems have also been attributed to climate change, with a major or minor
contribution of climate change distinguishable from other influences (Kabat et al., 2003).
Some studies showing positive impacts relate mainly to high latitude regions, though it is not yet
clear whether the balance of impacts has been negative or positive in these regions. Climate
change has negatively affected wheat and maize yields for many regions and in the global
aggregate. Effects on rice and soybean yield have been smaller in major production regions and
7
globally, with a median change of zero across all available data (Houghton and Skole, 1990).
Observed impacts relate mainly to production aspects of food security rather than access or other
components of food security. Several periods of rapid food and cereal price increases following
climate extremes in key producing regions indicate a sensitivity of current markets to climate
extremes among other factors (IPCC, 2001).
2.2 Climate change in sub-Saharan Africa
Approximately 80 percent of poor people in Sub-Saharan Africa continue to depend on the
agricultural sector for their livelihoods (Kurukulasuriya et al., 2006)). However unlike in other
regions of the world, agriculture in Sub-Saharan Africa is characterized by very low yields due to
agro-ecological features, poor access to services, lack of knowledge and inputs, and low levels of
investment in infrastructure and irrigation. In addition, high population growth rates, especially
in rural areas, intensify pressure on agricultural production and natural resources and further
complicate the challenge of reducing poverty (Loveland et al., 1990). Against this background,
potential climate change poses a significant additional challenge to the future of agriculture in
the region. Climate change could cause serious deterioration of rural livelihoods and increase
food insecurity in Sub-Saharan Africa. Given these multiple challenges, the region‟s
smallholders and pastoralists must adapt, in particular by adopting technologies to increase
productivity and the stability and resilience of their production systems (Olomoda, 2003).
The Fourth Assessment Report of the IPCC highlighted the vulnerability of African agriculture
and all who depend on it for food security and livelihoods (IPCC 2007). Agriculture will be
affected by reduced growing seasons and higher temperatures. The IPCC predicted that rain-fed
crop yields in some countries will decrease by 50 percent, and that an estimated 50-250 million
Africans will face increased water stress by 2020. With only about 6 percent of African crop

8
lands irrigated, the impacts on smallholders could be catastrophic. These direct effects on
agricultural production and food security will be exacerbated by greater exposure to malaria and
other climate-influenced diseases that reduce labor productivity and employment opportunities.
According to FAO (2007), agricultural production and the biophysical, political and social
systems that determine food security in Africa are expected to be placed under considerable
additional stress by climate change (FAO, 2007). It is anticipated that adverse impacts on
agriculture sector will exacerbate the incidence of rural poverty (Dinar et al. 2008) Africa has
done the least to contribute to climate change, but will be hit hard by its impacts. Africa already
has a highly variable and unpredictable climate, and many countries are ill-equipped to respond
to existing climate pressures, such as periodic floods and drought. In 2002, 13 million people in
southern Africa needed food relief due to drought (Pielke et al., 2002). The frequency and
intensity of extreme weather in Africa is predicted to increase as a result of climate change. The
impacts on a continent in which 333 million people already live in extreme poverty threaten to be
devastating. Agricultural production, on which two out of three Africans rely for their living, is
projected to be severely compromised by climate change (Ramankutty, 1999).
More frequent floods and drought could reduce agricultural yields, affecting food supplies.
Climate change will also affect the supply and quality of water in Africa (Pitman et al., 2004).
Around 300 million people more than 40% of sub-Saharan Africa‟s population currently lack
access to safe drinking water. By 2020, an additional 75-250 million people could find water
supplies are more unreliable (Climate change could also change patterns of disease, increasing
pressure on underdeveloped health systems). If no action is taken to help developing countries
adapt and plan for the future, climate change threatens to undermine development gains made
over the past few decades (Saunders et al., 2009).

9
2.3 Climate change in Kenya
Kenya is an agricultural based economy, with majority of her people deriving their livelihood
from various forms of agriculture, (Smith and Karuga, 2004). As a result, different communities
practice various forms of land use based on their social-economic needs and cultural practices
and determined mainly by weather patterns, soil fertility, ecology and level of social
development.
The increase in population has also resulted in massive land sub divisions in the high and
medium potential areas, population pressures and the increased pace and scale of human
activities in watersheds are straining water supplies (Republic of Kenya, 2004).
2.3.1 Impact of climate change on water resources
Climate change impacts add to already difficult water management challenges in the arid and
semi-arid regions (Alder et al., 2007). More recently technological innovations especially deep
tube wells and high-powered pumps significantly altered water management behaviors. Deep
tube wells allowed continual, unsustainable drawdown of aquifers as well as access to fossil
water, wherever available. Pumps allowed faster abstraction from canals and rivers than
previously possible, disrupting historical patterns of consumption (Andares, 2000). As a
consequence, the possibility that water resources will limit the socio-economic development of
many arid and semi-arid regions has gained credence. Climate change will impact several sectors
of the economy and have worldwide ramifications (Bates et al., 2008).
The changes in other parts of the world will impact the economy of arid and semi-arid regions
too. Many countries in these regions depend on river flows originating in tropical or temperate
regions. The overall water stress will increase (Bouwer, 2000). Climate change is expected to

10
lead to declining precipitation in most parts of the world. But projected temperature increase will
imply higher evaporation and drier conditions. Rain is also expected to reduce in frequency but
increase in intensity; all these will result in frequent droughts and floods (Dinar et al., 2008).
Additional effects of climate change that have important implications for water resources include
increased evaporation rates, a higher proportion of precipitation received as rain, rather than
snow, earlier and shorter runoff seasons, increased water temperatures, and decreased water
quality in both inland and coastal areas (Diop et al., 2002). Increased evaporation rates are
expected to reduce water supplies in many regions. The greatest deficits are expected to occur in
the summer, leading to decreased soil moisture levels and more frequent and severe agricultural
drought.
Agricultural producers and urban areas are particularly vulnerable, by 2020; yields from rain-fed
agriculture could be reduced by as much as 50 percent in some countries (IPCC 2007). This will
adversely affect food security and further exacerbate malnutrition and poverty, especially in
SSA. The vulnerabilities and anticipated impacts of climate change will be observed at different
scales in different countries (IPCC 2001). These heterogeneous and inconsistent data impose
serious limitations in constructing scenarios of water resources in response to climate change and
land use change.
Several studies on water assessment and impact of climate change have been undertaken in
Africa (Kabat et al., 2003, Olomoda 2002, Gyau-Boakye and Tumbulto 2000, Falkenmark 2003
and Gleick 1998). The IPCC (2001) indicates that extreme events, including floods and droughts,
are becoming increasingly frequent and severe. Even countries that previously did not experience
floods, such as Burkina Faso, have recently reported severe flooding, notably in 2007. IPCC
(2001) noted that these challenges include population pressure, problems associated with land

11
use such as erosion/siltation and possible ecological consequences of land use change on the
hydrological cycle (Boko et al., 2007).
2.3.2 Coping strategies to climate change
Water resource users can reduce the negative effects of water shortages brought by climate
change and land use change through a number of strategies. These include revising water storage
and release programs for reservoirs, adopting crops and cropping practices that are robust over a
wider spectrum of water availability, expanding and adjusting crop insurance programs,
adjusting water prices to encourage conservation and the expansion of water supply
infrastructure, and supporting water transfer opportunities (Eriksen et al., 2008) The ability to
anticipate and efficiently prepare for future water resource management challenges is currently
limited, in part, by imprecise regional climate change models and long-term weather forecasts.
Uncertainty about future climate conditions makes it more difficult to optimally prepare for and
adapt to associated changes in water resource availability and quality (FAO, 2012).
Communities in Sub-Saharan Africa are already experiencing the impacts of climate change in a
very real way. These impacts, including rising temperatures, more erratic rainfall and increasing
frequency of droughts and floods, have critical consequences for livelihoods, particularly for the
poorest households in rural areas (Gleick, 1998). Despite this, vulnerable people across the
region are taking action to manage the risks that climate change poses to their livelihoods, and
are demanding right action by governments and other actors to support them in these efforts
(Kalnay and Cai, 2003).
Developing countries have very different individual circumstances and the specific impacts of
climate change on a country depend on the climate it experiences as well as its geographical,
social, cultural, economic and political situations (Liniger, 1995). As a result, countries require a

12
diversity of adaptation measures very much depending on individual circumstances. However
there are cross cutting issues which apply across countries and regions (Sala et al., 2000). The
same sectors are affected by climate change, albeit to differing degrees. These main sectors
include: agriculture, water resources, human health, terrestrial ecosystems and biodiversity and
coastal zones (Smit and Skinner, 2002).
2.4 Global land use change
Land-use and land-cover changes are so pervasive that, when aggregated globally they affect the
key aspects of the Earth System functioning. They directly impact biotic diversity worldwide
(Sala et al., 2000); contribute to local and regional climate change as well as to global climate
warming (Houghton et al., 1999); are the primary source of soil degradation (Tolba et al., 1992);
and, by altering ecosystem services, affect the ability of biological systems to support human
needs (Vitousek et al., 1997).
Such changes also determine, in part, the vulnerability of places and people to climatic,
economic or socio-political perturbations (Kasperson et al., 1995). Despite improvements in
land-cover characterization made possible by earth observing satellites (Loveland et al., 1999),
global and regional land covers and, in particular, land uses are poorly enumerated (IPCC, 2000).
Scientists recognize, however, that the magnitude of change is large. One estimate, for example,
holds that the global expansion of croplands since 1850 has converted some 6millionkm2 of
forests/woodlands and 4.7millionkm2 of savannas/grasslands/steppes. Within these categories,
respectively, 1.5 and 0.6 million km2 of cropland has been abandoned (Ramankutty and Foley,
1999).

13
2.5 Land use change in sub Saharan Africa
With the continued growth of the human population, competition for limited land resources has
steadily increased over recent years and most countries in sub-Saharan Africa have experienced a
progressive expansion of their agriculture and rural settlement, putting so much pressure on
water resources (FAO, 2011). Change in land use by humans and the resulting alterations in
surface features are major but poorly recognized drivers of long-term global climate patterns
(Pielke, 2002). The earth‟s surface is altered through different ways like urbanization and
deforestation. Kalnay and Cai, (2003) estimated 40% of the global temperature rises is coming
from land use changes which affect agriculture production in the long run (Kalnary and Cai,
2003).
Many of the water problems worldwide can be traced to land use activities. Change in land use
affects water quality, the hydrologic regime, volume of surface runoff and decreasing ground
water recharge (UNEP, 1996). This can induce increased flooding and lowered groundwater
levels. Large-scale increases in some rural land uses can change the way water moves through
the landscape by intercepting water before it reaches waterways, reservoirs and aquifers (The
state of Victoria Department of Sustainability and Environment, 2011).
2.6 Land use change in Kenya
The significance of land use change to emissions of Green House Gases is well recognized, with
approximately one-third of anthropogenic carbon dioxide emissions since 1850 attributed to land
use activities (IPCC, 1997). Likewise, extensive deforestation has been associated with reduced
rainfall, reduced cloud formation, and enhanced temperature (Pitman et al., 2004).
14
According to the Government of Kenya National Water Development Report of 2006, Kenya‟s
water resources have been mismanaged through unsustainable water and land use policies among
others. It was added that while proper land use management is central to conserving water
resources, it is also a lever for combating global climate change. Reports by Moraa et al., 2012
confirmed that many water problems in Kenya, Kajiado inclusive are caused by lack of a
comprehensive land policy: the owning of land in water catchment areas presents the many
challenges in the sector as such areas become degraded as the land owner develops the piece of
land leading to decreased water flows in rivers (Moraa et al., 2012).
2.7 Land use change in Kajiado
Land use is escalating in Kajiado North District, of Kenya. In the 1960s and 1970s, land used
communally by the Maasai was divided into group ranches with title held collectively by ranch
members (Behnke, 2011). Some ranches have since been divided into parcels owned by
individual members. Other sources of land use intensification include human population growth
and immigration, more intensive livestock management and a rapid diversification of livelihood
strategies (Western and Nightingale, 2006).
According to the study conducted by Boone Livestock keeping remains the dominant livelihood
strategy in the area, even though things are changing because of water scarcity and increase in
population. With the changes taking place farmers are now shifting to crop production to sustain
their livelihood (Boone et al., 2005).
Rapid human population growth and immigration have amplified food insecurity in Kajiado
North district (Kajiado District Strategic Plan, 2005-2010). Land tenure changes have reduced

15
livestock mobility in subdivided areas. Other sources of land use intensification include human
population growth and immigration by both Maasai and non-Maasai (Boone, 2005).
Land use is intensifying in southern Kajiado District, Kenya. In the 1960s and 1970s, land used
communally by Maasai was divided into group ranches with title held collectively by ranch
members (Moraa, 2012). Some ranches have since been divided into parcels owned by individual
members. Other sources of land use intensification include human population growth and
immigration, more intensive livestock management, and a rapid diversification of livelihood
strategies (Munale, 2000).
Livestock keeping remains the dominant livelihood strategy, but many practice rain-fed
agriculture, do intensive irrigated agriculture in the swamps, earn wages, or own businesses
(Ngigi, 2003). Land use intensification may be an inevitable or even desirable process in
Kajiado. However, there are many pathways to intensified use. Pathways will have deleterious
effects for some and positive effects for others. Other sources of land use intensification include
human population growth and immigration by both Maasai and non-Maasai (Thornton et al.,
2006).
2.7.1 Impact of land use changes on water resources
Land use changes have potentially large impacts on water resources (Stonestrom et al., 2009).
Rapid socio-economic development drives land use changes, which include changes of land use
classes, e.g., conversion of cropland to urban area due to urbanization, as well as changes within
classes such as a change of crops or crop rotations. Particularly in regions here water availability
is limited, land use changes could result in an increase of water scarcity and thus contribute to a
deterioration of living conditions. DeFries and Eshleman (2004) underline the importance of
16
understanding the impact of land use change on water resources, which they identify as a key
research topic for the decades ahead.
2.8 The use of Participatory GIS in determining land use change
Participatory GIS is a practice in which local communities share their knowledge and opinions to
help generate maps to inform management and decision-making (Carver et al., 2001).
Participatory GIS fosters discussion and collaboration among stakeholders and can capture
important knowledge from underrepresented groups (Elwood, 2002). Due to the changes of land
use and the effect it has on water resources, it is necessary to take a look at the present water
situation in the area and to conduct scientific studies towards water resource utilization and
management (Barndt, 2002). However, critical to this is the need for good information that
describes the condition, trend, spatial location, and variability of water resources in the given
area (Adjomah, 2010).
Forrester and Cinderby (2000) described Participatory GIS as the practice of gathering data using
traditional methods such as interviews, questions, focus groups, all using some form of paper
maps to allow participants to record spatial details (Cinderby, 2000). This information is then
digitalized so that it can be analyzed and interrogated using the power of the computer GIS
software. PGIS is described as „qualitative data‟ as it is based on people‟s knowledge, opinions
and perceptions (Al-kodmany, 2000). Also, the location and boundaries of areas that people draw
on the community maps may be of varying accuracy levels. PGIS practice is usually geared
towards community empowerment through measured, demand-driven, and user-friendly where
maps become a major conduit in the process (Chrisman, 1987).
17
Participatory GIS uses Geographic Information System (GIS) to involve people in planning and
design decisions using their spatial knowledge and discussion of virtual or physical, two or three-
dimensional maps and visualization aides (Haklay, 2003). The use of Participatory GIS often
promotes better integration of social issues with the ecological and technical land use issues
(Haining, 1990).
A good PGIS practice is embedded into long-lasting spatial decision-making processes, is
flexible, adapts to different socio-cultural and bio-physical environments, depends on
multidisciplinary facilitation and skills and builds essentially on visual language (Lake, 1993).
The practice integrates several tools and methods, it promotes interactive participation of
stakeholders in generating and managing spatial information and it uses information about
specific landscapes to facilitate broadly-based decision making processes that support effective
communication and community advocacy (Loukaitou-sideris, 1999). PGIS practice could protect
traditional knowledge and wisdom from external exploitation.
PGIS studies by several researchers have proved that PGIS has been adopted to protect
indigenous land rights (Jarvis and Stearman, 1995; Nietschmann, 1995), mitigate resource
conflicts (Kyem 2006), and to assess local needs (Craig and Elwood 1998; Ghose, 2001). Other
community-based GIS applications have sought to increase community access to information
and resources like water (Elwood 2002; Laituri, 2002) and enable a broader and more effective
participation of marginalized groups in the decision making process (Smith and Craglia, 2003;
Sawicki and Craig, 1996). GIS and related spatial technologies have therefore become invaluable
tools for creating access to information, natural resources, political access and legitimacy to
underrepresented groups in the society. Mapping is any method where people are encouraged to

18
use a map or maps in order to communicate their knowledge and ideas more clearly (Smith and
Craglia, 2003).
Geographic Information Systems (GIS) are increasingly used for the identification of
forestry/wildlife conflicts (Brown et al., 1994); land use conflicts (Carr and Zwick 2007) and
local government decision-making (O‟Looney 2003). Participatory GIS (PGIS) techniques are
also used to capture local community and stakeholder opinions. This application of PGIS is also
used in the identification of land use conflicts on a vulnerable coast with a high density of urban
settlement.
In African including Kenyan geographic research GIS approaches are also contributing
significantly to participatory planning and research as well as urban, environment, population,
climatic, land use and natural resource management studies (Kyem, 1999; NRC, 2002; Ottichilo
et al., 2002; Wafula 1994). As a tool for measuring change GIS is also enhancing African as well
as Kenyan urban studies and research.
2.9 Overview of water resources in the World
Water resources are sources of water that are useful or potentially useful. Uses of water include
agricultural, industrial, household, recreational and environmental activities (World Bank, 2009).
Rapid population growth, combined with industrialization, urbanization, and agricultural
intensification and water intensive lifestyles is resulting in a global water crisis. In 2000, at least
1.1 billion of the world‟s people about one in five did not have access to safe water. 39 percent
of the world‟s population lives without access to safe water (Tolba and El-Kholy, 1992. Due to
rapid population growth, the number of urban dwellers lacking access to safe water increasing
(Tumbulto, 2005).

19
Falling water tables are widespread and cause serious problems, both because they lead to water
shortages and, in coastal areas, to salt intrusion (Vitousek et al., 1997). The world supply of
freshwater cannot be increased (Wafula, 2010). More and more people are becoming dependent
on limited supplies of freshwater that are becoming more polluted. Water security, like food
security, is becoming a major national and regional priority in many areas of the world (Wheater
and Evans, 2010).
Throughout the world, water resource management will be one of the most important economic
and social issues of this century (World Bank 1993). In total, about a quarter of the continent‟s
entire population lives in water-stressed regions (UNEP 1999). Because the amount of available
fresh water is relatively finite, increases in population result in corresponding decreases in the
per capita water supply, while rising temperatures exacerbate an already alarming situation in
Africa (Human Impact Report 2009). In terms of fresh water, annual run-off and water
availability are projected to increase by 10-40 percent at high latitudes but to decrease by 10-30
percent over some dry regions at mid-latitudes and in the dry tropics (Falkenmark 2007). This
means that agricultural production is projected to be severely compromised in many regions by
these trends (UNFCC 2008). According to projections, there will be increasing challenges in
terms of increased water stress and areas suitable for agriculture along the margins of semi-arid
and arid areas are expected to decrease significantly (Falkenmark 2007).
2.10 Overview of water resources in sub-Saharan Africa
In Sub-Saharan Africa, the amount of water withdrawn for agricultural use amounts to about 3
percent of the internal renewable resources, and only 6 percent of agricultural land is under
irrigation (World Bank 2006). This may reflect a low level of development and use of water
resources in the continent (AWDR 2006). Annual freshwater withdrawals in East Africa are a

20
small percentage of the total available, ranging from less than 3 percent of the total resources
available in Burundi to 12 percent in Rwanda (UNEP 2002). However, despite the low utilization
of its renewable freshwater resources (WRI et al., 2000), water is becoming one of the most
critical natural resource issues in Africa, and the continent is one of the two regions in the world
facing serious water shortages (Hopkins, 1998).
Nearly two thirds of Africans rely on limited water sources prone to high yearly variability
(Vörösmarty et al., 2000). Africa‟s extreme variability of rainfall is reflected in an uneven
distribution of surface and groundwater resources, from areas of severe aridity with limited
freshwater resources such as the Sahara and Kalahari deserts, to the tropical belt of mid-Africa
typified by abundant freshwater resources (UNEP 2008). The availability of water varies
considerably, even within countries, and the situation is further complicated by frequent droughts
and inappropriate water management programs. The demand for water is increasing rapidly in
most countries due to population growth and economic development (AWDR, 2006). Most rivers
in Africa traverse semi-arid to arid lands on their way to the coast from the tropics, hence;
evaporative losses also are high in comparison to rivers in temperate regions (IPCC, 2001).
There is a significant poor management of water in Africa. Water management can be defined as
the planned development, distribution, and use of water resources in accordance with
predetermined objectives while respecting both the quantity and quality of water resources
(ICID, 2001). Arnell (1999) shows that the greatest reduction in run-off by 2050 will affect the
SSA‟s water withdrawals for agriculture amount to only 3 percent of its total renewable water
resources despite the highly spatial and temporal variability of rainfall and resultant low land
productivity and crop failures (UNECA, 2001; UNEP, 1999).

21
2.11 Overview of water resources in Kenya
Kenya as a country is facing a number of serious challenges related to water resources
management, some of the challenges include water borne or sanitation diseases and lack of water
resources mapping and management, (Pruss-Ustun et al., 2008). There are about 40 million
people living in Kenya, of which about 17 million (43 percent) do not have access to clean water
(World Bank, 2010) Due to continued population growth, it has been estimated that by the year
2025, Kenya‟s per capita water availability will be 235 cubic meters per year, about two-thirds
less than the current 650 cubic meters (Wafula, 2010).
A number of these challenges are as a result of factors both within and outside the water sector.
According to the third United Nations development report, it stated that climate variability and
increasing demand for water as a result of development and population pressure are some of the
causes of water stress (Ngigi, 2003) Surface and ground water resources in Kenya are
increasingly becoming polluted from both point and non-point sources caused by the activities of
agriculture and industries, all of which increase catchment degradation and reduce the quantity
and quality of water for agriculture production (UNEP, 2002).
Floods, droughts and landslides create severe stress on the people, the economy and on already
over-stretched water resources (UNESCO, 2004). According to the Kenyan Ministry of Water
and Irrigation, the 1998-2000 droughts in Kenya was classified as the third worst ever and
affected all sectors of the economy including energy and agriculture sectors (Mati et al., 2007).
Sustainable access to safe water is around 60% in the urban setting and drops to as low as 20% in
the settlements of the urban poor where half of the urban population lives (KIHBS 2005/2006/7).
Over 50% of Kenya‟s households do not have access to safe drinking water and the pro- portion

22
is higher for the poor (Marshall, 2011). In urban areas, large populations living in informal
settlements within the towns and cities have no access to safe water. In rural areas, there are
large disparities between geographic areas where in North Eastern and Eastern Provinces less
than 30% of the poor have access to safe water compared to some 60% in Western Province
(Social Policy in Kenya Report).
A case study conducted in Kangemi area by TISDA (Transparency and Integrity Service
Delivery in Africa) in 2011 revealed that many families in informal settlements such as Kangemi
suffer acute shortages of water because some landlords have illegally continued to control access
as well as the cost of water without approval from the water service provider or the regulator.
Such landlords determine when their tenants get water, how much water they get, and how much
money they pay for the water. This they have made certain by locking the yard taps which is the
main source of water for their tenants (TISDA, 2011).
2.12 Overview of water resources in Kajiado
Out of Kenya‟s population of approximately 38 million, a considerable portion (75 %) is living
in rural areas including Kajiado where rain-fed farming and livestock keeping are the main
livelihoods (UI, 1999). Moreover, the population is increasing at a rate of 2.6 % per year (World
Bank, 2010). Kajiado has no permanent rivers and it is considered as a dry area.
There is a high level of dependability on the seasonal rains. Kenya is classified as a water scarce
country with annual water supplies below 1000 m3 per person (UNEP, 2002). The situation is
predicted to worsen drastically within the near future. Kajiado as one of the semi-arid regions of
Kenya, temperatures are projected to increase and precipitation decline by 2030 due to climate
change (Malesu et al., 2007). Some figures estimate annual available freshwater at around 250

23
m3 per capita in 2025 (Malesu et al., 2007). This would be detrimental to the development of
agricultural activities in Kajiado and in Kenya as a country.
2.13 Rainwater harvesting in Sub-Saharan Africa
Water harvesting is the accumulation and deposition of rainwater for reuse before it reaches the
aquifer. Uses include water garden, water for livestock, water for irrigation (Kirk, 2009).
Rainwater harvesting provides the long-term answers to the problem of water scarcity, it offers
an ideal solution in areas where there is sufficient rain but inadequate ground water supply and
surface water resources are either lacking or are insufficient. There are a number of ways in
which water harvesting can benefit a community; water harvesting enables efficient collection
and storage of rainwater, makes it accessible and substitutes for poor quality water, helps smooth
out variation in water availability by collecting the rain and storing it more efficiently in closed
stores or in sandy riverbeds. In doing so, water harvesting assures a continuous and reliable
access to water (Mandloi et al., 2005).
The harvested water can be used as drinking water as well as for storage. Water harvesting
system is a complete system with a catchment, water collecting facilities and storage facilities.
However no system is best suited for a particular area, for example different area have different
soils, climate and topography therefore it is necessary to establish a system that best suits the
areas‟ characteristics (Mandloi et al., 2005).
Based on a report done by Frasier and Myers in 1983, water harvesting is believed to have
developed in ancient Iraq, 4,000 to 6,000 years ago, for supplying water to trade caravans. There
is evidence that similar systems were used 500 years ago by the Indians in the Southwestern
United States, (Frasier and Myers, 1983). Collecting rain water from roofs of buildings and
24
storing them in containers is still being used today as a means of storing water for domestic
purposes, (UNDP, 2007).
Harvested water is used to provide for domestic and stock water, concentration of runoff for
crops, fodder and tree production and less frequently water supply for fish and duck ponds
(Ngigi, 2003). Rain water harvesting improves access to relatively safe, clean water, sustained
water demands in times of drought, reduces pressure on surface and groundwater and also
contributes to the replenishment of groundwater, (Aroka, 2010). In addition it promotes gender
equity and female empowerment as it relieves the chore of collecting water from afar for many
rural women. Rainwater harvesting can be done in single households or as a joint community
venture (Clay, 2009). Water harvesting embraces a variety of different techniques, ranging from
the collection of runoff from roofs, rock catchments, artificial surfaces at ground level, land
surfaces and ephemeral streams (Hogg, 2008).
Water harvesting reduces the runoff volume and the peak flow, hence mitigating floods and
conserving the top soil, (Wheater and Evans, 2009). When the runoff is reduces water travels
slowly and ground water aquifers are recharged, mainly water harvesting reduces the cost per
liter of water since a large amount of power that is consumed while pumping water from
subsurface aquifers can be saved, (Munale, 2000).
In Africa to enhance resilience to future periods of drought stress it is essential to improve in
present rain fed farming systems through improvements in the physical infrastructure including
water harvesting, (Bates et al., 2008). The importance of building on traditional knowledge
related to water harvesting and use has been highlighted as one of the most important adaptation
requirements to cope with climate change, indicating the need for its incorporation into climate

25
change policies to ensure the development of effective adaptation strategies that are cost-
effective, participatory and sustainable, (Sivanappan, 2006).
Around the globe there is a need to revive the traditional technologies blending them with
modern methods to achieve the required present and future water need. Countries like Germany,
Japan, United States, and Singapore are also adopting rainwater harvesting with modern methods
(Kirk, 2009).
2.14 Rainwater harvesting in Kenya
Rainwater is a free source of nearly pure water and rainwater harvesting refers to collection and
storage of rainwater and other activities aimed at harvesting surface and ground water (Langat,
2000). It also includes prevention of losses through evaporation and seepage and all other
hydrological and engineering interventions, aimed at conservation and efficient utilization of the
limited water. There are many water harvesting opportunities on developed sites and it can easily
be planned into a new landscape during the design phase (Munale, 2000).
In Kenya today the key players in rainwater harvesting include the following government
ministries: Ministry of Water Resources Management and Development, Ministry of
Environment, Natural Resources and Wildlife and Ministry of Agriculture. Several NGOs and
other Community-Based Organizations at national and local levels have played a major role in
putting rainwater harvesting in the limelight. Through Southern and Eastern Africa Rainwater
Network (SearNet) established with the assistance of International Rainwater Catchment System
Association and the support of the Regional Land Management Unit of UNEP, Kenya has been
able to exchange information on rainwater harvesting with other countries in the east and
southern Africa sub-regions. At the local levels, church organizations and women Groups have
been very active in this field (Government of the Republic of Kenya, 2006).

26
Due to variability in rainfall a myriad of rainwater harvesting schemes have sprouted in recent
years, both in Kenya and in other water-stressed nations, with the aim to abate drought and water
shortages. Rainwater harvesting is simple, low-cost techniques that involve the capture and
storing of rainwater and/or groundwater (Hai, 1998). Such systems have been used all over the
world for long time periods and go under different names such as small-scale water system
innovations and rainwater catchment systems (Frasier and Myers, 1983). UNEP and other UN
agencies have conducted pilot projects and workshops in Kenya to promote rainwater harvesting
at national and local levels. Some bilateral development partners have also supported the use of
this technology. The private sector has been instrumental through manufacture of components
needed to implement rainwater harvesting projects such as gutters, roofing material, and concrete
and water tanks (UNEP, 2006).
2.15 Rainwater harvesting in Kajiado and the ASALS of Kenya
The Arid and semi-arid Lands (ASALs) make up more than 40% of the earth‟s surface and
provide livelihoods to more than one billion people. In Kenya, the ASALs occupy more than
80% of the country and are home to about 10 million people and approximately 70% of the
national livestock herd. The ASALs in Kenya have the lowest development indicators and the
highest incidence of poverty in the country (Ministry of Northern Kenya and other Arid Lands,
2009). The lack of water resources in Kajiado is a frequent problem, the access to safe drinking
water is difficult and becomes even more difficult during droughts, as only the urban population
is connected to the public water supply (Hauschild and Döll, 2000).
The costs of dealing with pressures have important implications in economic development. The
problem of having a limited water supply together with a gradually increasing water demand
implies that unless governments applies adequate policies, inadequacy in the quantity and quality

27
of water supply could reach a calamity level within a few years (Ragab and Hamdy, 2004). In
Kajiado, different types of rainwater harvesting management systems have been implemented
throughout as a strategy to secure water resources in rural areas (Langat, 2000). The selling point
for rainwater harvesting is that the methods are simple enough to organize and maintain at
individual or community level with little training from specialists or technicians, (Aroka, 2010).
The most common methods are the collection of rainwater falling on rooftops and the collection
of floodwater from watercourses for domestic use (Hai, 1998).
Most of the people in Kajiado rely on underground water sources which are more permanent and
boreholes have been drilled and fitted with equipment to pump water for both domestic and
livestock use. Some of these water infrastructures are 20-30 km away from households and date
as far back as the colonial era, often breaking down when overused, particularly during
prolonged dry spells or during drought. Different types of rainwater harvesting management
systems have been implemented throughout Kenya and in Kajiado as a strategy to secure water
resources in rural areas (Kenya Rainwater Association, 2010). Many reports have been written
on the potential benefits of rainwater harvesting for rural communities but there are few studies
describing the detailed effects of the schemes on water availability, demands, and vulnerability
in the case of climatic variations (RELMA, 2009).

28
CHAPTER THREE: MATERIALS AND METHODS
3.1 Description of the study area
The study was conducted in Kajiado County. It borders Nairobi to the north and the Republic of
Tanzania to the Southwest, Taita-Taveta County to the southeast, Machakos and Makueni
counties to the east, Kiambu County to the north and Narok County to the west. It lies between
longitudes 36º 5‟ and latitudes 37º 5‟ E and 1º 0‟ and 3º 0‟ S. It covers an area approximately
21,909.9 square kilometers with a population of 406, 054 (Government of Kenya, 2009).
The Kajiado County is divided into seven sub-counties - Central, Isinya, Loitokitok, Magadi,
Mashuru, Namanga, and Ngong‟. The study was conducted in Isinya and Ngong‟ sub-counties
which are in Kajiado North. Two locations were selected in each of the two sub-counties; Isinya
and Kitengela locations for Isinya sub-county and Ongata Rongai and South Keekonyoike
locations for Ngong‟ sub-county.
There are no permanent natural sources of surface water in the study area. Mean annual rainfall
ranges from 300 to 800 mm. Rainfall is bimodal, with "short rains" from October to December
and "long rains" from March to May. The distribution of rainfall between the two seasons
changes gradually from east to west across Kajiado County. Kajiado is one of the semi arid
areas in Kenya, in recent years there have been long periods of drought when there has been
little or no rains (Hallberg, 2011).
The lack of permanent sources of surface water led to the construction of several small dams and
the drilling of a large number of boreholes. Many dams have silted up or have been washed
away; the location of others have been forgotten (Dietz et al, 1986). Most of the older boreholes

29
have broken down. Within the county also a number of individually owned boreholes are
operating, but it seems obvious that the existing and functioning water facilities are far too few to
serve the population and their livestock. Running costs and maintenance are major problems.
Most boreholes are equipped with an electric or a diesel pumps and, thus, have high running
costs.
Figure 1: Map of Kajiado County showing Kajiado North where the study was carried out
(Source; ThingLink).
Crops grown in the area are tomatoes, okra, kales, cabbages, bananas and maize. Most of the
residents in Kajiado are pastoralists in which the majorities are small scale livestock farmers and
they face perennial livestock losses during drought and this has increased the number of people
facing extreme poverty and hunger.

30
3.2 Determining the magnitude and pattern of land use changes in the past 20 years
Participatory GIS fosters discussion and collaboration among stakeholders and can capture
important knowledge from underrepresented groups (Elwood, 2002). Due to the changes of land
use and the effect it has on water resources, it is necessary to take a look at the present water
situation in the area and to conduct scientific studies towards water resource utilization and
management (Barndt, 2002). PGIS practice is usually geared towards community empowerment
through measured, demand-driven, and user-friendly where maps become a major conduit in the
process (Chrisman, 1987).
Participatory GIS was used to assess the changes and pattern in land use change in the past 20
years. Four (4) sub locations were randomly picked to participate in the Participatory GIS
meetings. Kisaju sub location in Kitengela, Nkoroi Kadisi sub location in Ongata Rongai,
Oloosidan sub location in Isinya, and Oloika/Matali sub location in Isinya.
In each of the four selected sub-locations, twenty (20) respondents were purposively selected to
participate in the participatory GIS. The selection was based on gender and age. The group
consisted of five elderly men (above 50 years), five elderly women (above 50 years), five young
women (18 to 35 years) and five young men (18 to 35 years), to get an idea of the area for the
past 20 years.
The participants drew maps showing their location and the extent of land resources (water
sources, settlements, grass lands, roads, and farm lands) for years 1990, 2000 and 2010. These
years were chosen because they are also the ones that the government of Kenya published the
census so it was done on purpose to compare with the changes in population.

31
The participants selected the best three (3) PGIS maps (that is for 1990, 2000 and 2010) that
best describes their area properly. Then Focus Group Discussions were conducted to discuss the
changes that have taken place based on the maps they drew. The checklist consisted of the
following questions;
Main land use/land cover changes that have occurred in the area
Causes of the change
Positive effects of the change
Negative effects of the change
Coping strategies
Recommendations based on the undesirable effects
Photos of the maps were taken using a digital camera. The photos were exported to Arc GIS 9.3
software for geo-referencing. Areas under settlements, farming, grass lands and wetlands were
examined and analyzed using Map info professional v12.5 software. MapInfo is a versatile
Windows-based application that visualizes information on digital maps by linking data to
geography. It creates maps that present information for analysis and decision making. The maps
were analyzed for land use and land cover area changes and their percentage changes for the
period between 1990-2000 and 2000-2010 calculated.
3.3 Climate change effect on water resources and the perception of rainwater harvesting as
a coping strategy to climate change and variability
A semi structured questionnaire (Appendix 1) was used to collect information on the effects of
climate variability and change on agricultural activities, the coping and adaptation mechanisms

32
to climate change and variability, the current water sources and the rainwater harvesting
technologies in the area.
The method of using a questionnaire provided quantitative data required to determine impacts
and outcome indicators. In addition it helped to provide quantitative gender disaggregated data
while complementing the other qualitative methods by highlighting how different gender, age,
cultural and socio-economic groups‟ livelihoods impact on decision making.
3.3.1 Sampling size and sampling technique
Simple random sampling was used since the communities are spacely distributed, each
individual was chosen randomly and entirely by chance.
The questionnaire was administered to 220 respondents from the two sub-locations (Isinya and
Ngong‟), one hundred and twenty (120) in Isinya and one hundred (100) in Ngong‟.
In Ngong‟ sub-location two divisions were selected (Ongata Rongai and South Keekonyoke and
fifty respondents were administered in each. In Isinya sub-location two divisions were selected
as well (Isinya and Kitengela divisions) and sixty respondents were interviewed in each, making
the total of 220.
Data collected from the questionnaires was analyzed using the Statistical Package for Social
Scientists (SPSS). Descriptive statistics such as means, frequencies, percentages and cross
tabulations was used in the analysis.

33
CHAPTER FOUR: RESULTS AND DISCUSSIONS
4.1 Magnitude and pattern of land use change in the past 20 years
This section presents the results from the PGIS analysis of the four sub-locations namely Kisaju,
Matali, Nkoroi and Oloosidan showing changes in land use/cover from year 1990, 2000 and
2010.
4.1.1 Changes in land use/cover in Kisaju sub-location
As shown in the figure 2, Kisaju sub-location settlements and farmland their total area have
increased significantly (p<0.05) in 1990 to 2000 and 2000 to 2010 by 4.8% and 8.5% for
settlements respectively, and 3.1% and 5.9% for farmland respectively. There is a significant
(p<0.05) decrease in the grassland total area of 8% and 14.2% for 1990-2000 and 2000-2010
respectively.
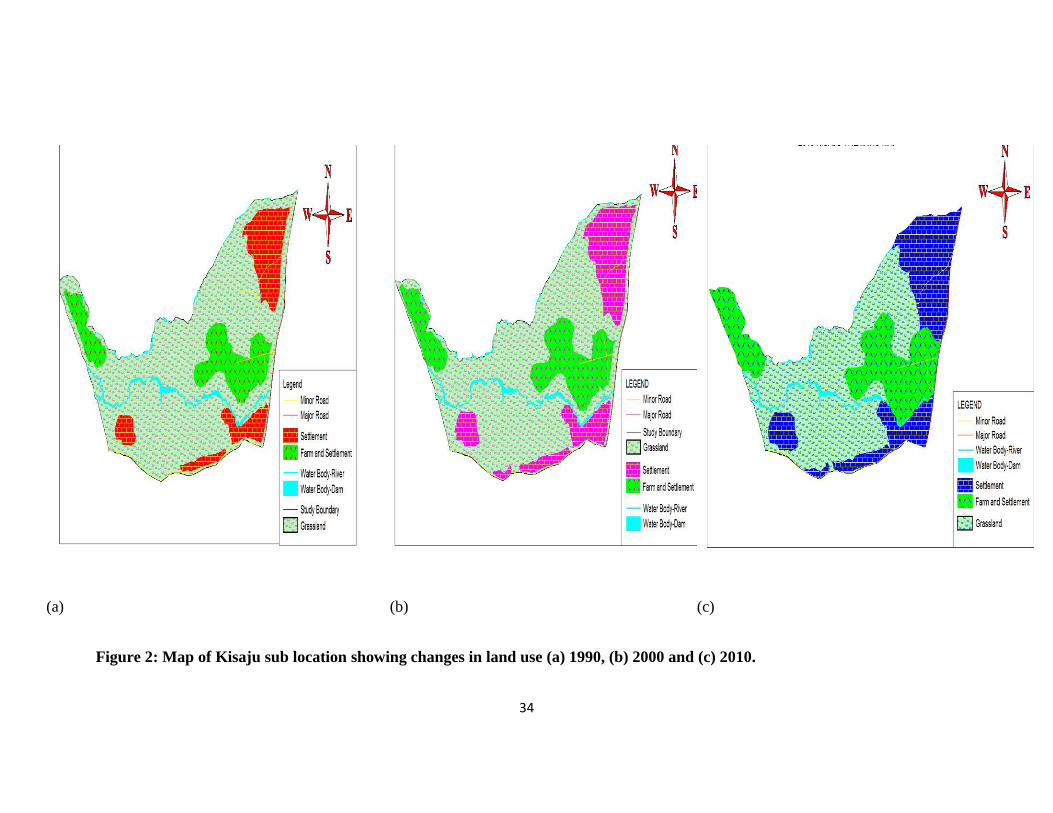
34
(a)
(b)
(c)
Figure 2: Map of Kisaju sub location showing changes in land use (a) 1990, (b) 2000 and (c) 2010.

35
4.1.2 Changes in land use/cover in Matali sub-location
Figure 3 shows Matali sub-location settlements area has increased significantly (p<0.05) by 2.4%
and 3.6% for 1990-2000 and 2000-2010 respectively, farmland has increased significantly
(p<0.05) by 2.5% and 5.5% for 1990-2000 and 2000-2010 respectively, and grassland decreased
significantly (p<0.05) by 4.9% and 9.1% for 1990-2000 and 2000-2010 respectively.
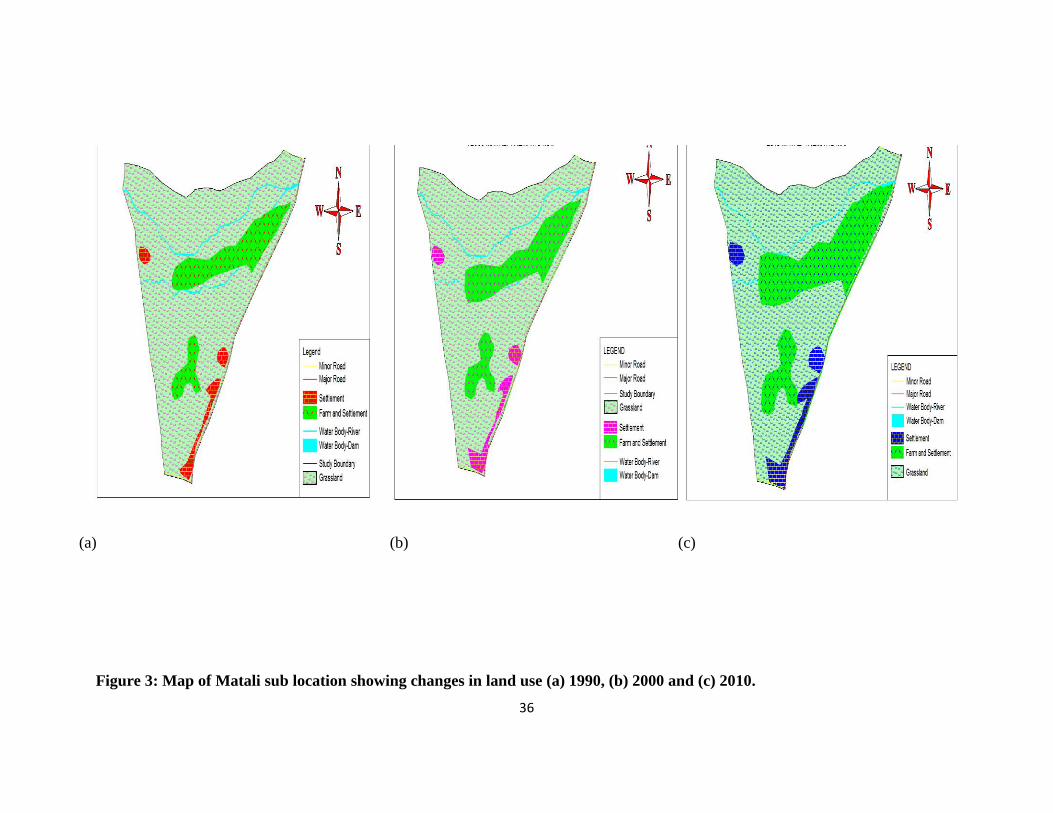
36
(a)
(b)
(c)
Figure 3: Map of Matali sub location showing changes in land use (a) 1990, (b) 2000 and (c) 2010.

37
4.1.3 Changes in land use/cover in Nkoroi sub-location
Figure 4 shows Nkoroi sub-location settlements area have increased significantly (p<0.05) by
5.7% and 9.5% for 1990-2000 and 2000-2010 respectively, farmland has increased significantly
(p<0.05) by 6.7% and 10% for 1990-2000 and 2000-2010 respectively, and grassland had a
significant decrease (p<0.05) by 12.3% and 19.6% for 1990-2000 and 2000-2010 respectively.
The highest increase in settlement and farmland area was observed in Nkoroi sublocation for
both 1990-2000 and 2000-2010. This was the same with the changes in grassland in which
Nkoroi showed the highest change. This can be because Nkoroi is close to the main road
therefore more people are moving to that area unlike the other sub-locations.
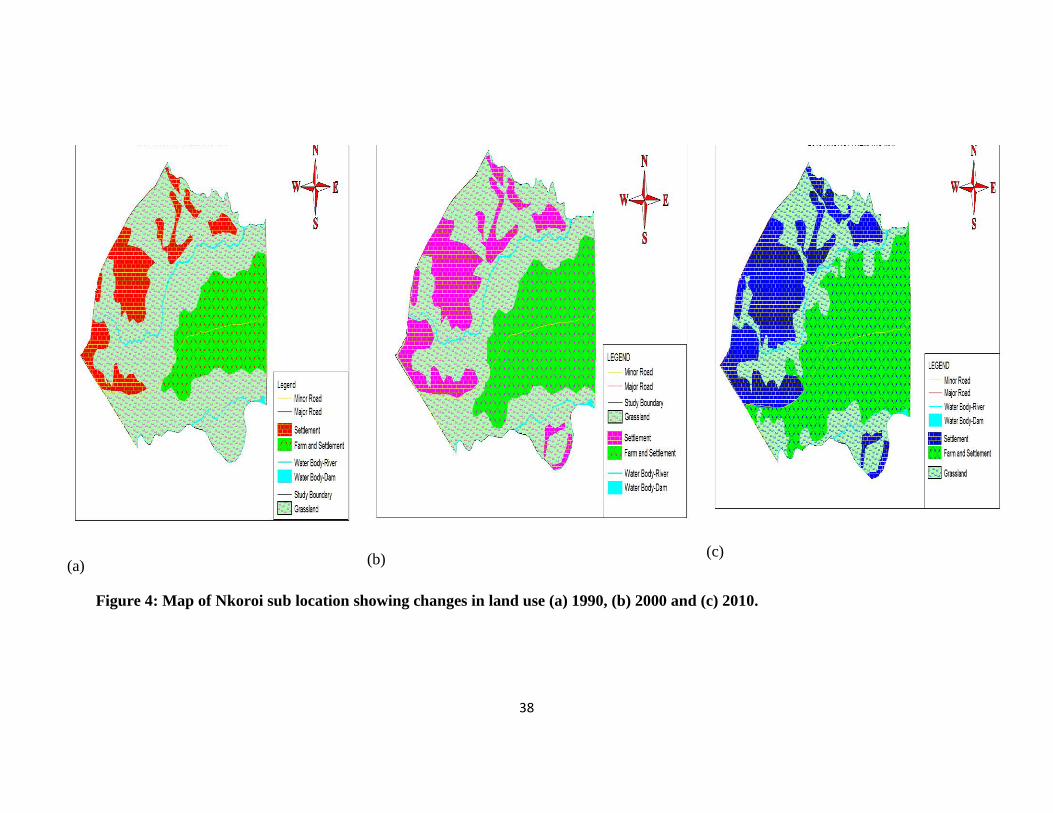
38
(a)
(b)
(c)
Figure 4: Map of Nkoroi sub location showing changes in land use (a) 1990, (b) 2000 and (c) 2010.
39
4.1.4 Changes in land use/cover in Oloosidan sub-location
Figure 5 shows Oloosidan sub-location settlements area have increased significantly (p<0.05) by
2.1% and 4.1% for 1990-2000 and 2000-2010 respectively, farmland has increased significantly
(p<0.05) by 7% and 14.1% for 1990-2000 and 2000-2010 respectively, and grassland decreased
significantly (p<0.05) by 9.1% and 18.2% for 1990-2000 and 2000-2010 respectively.
The lowest increase in settlement and farmland area was observed in Oloosidan. This is because
the area is far away from the main road.
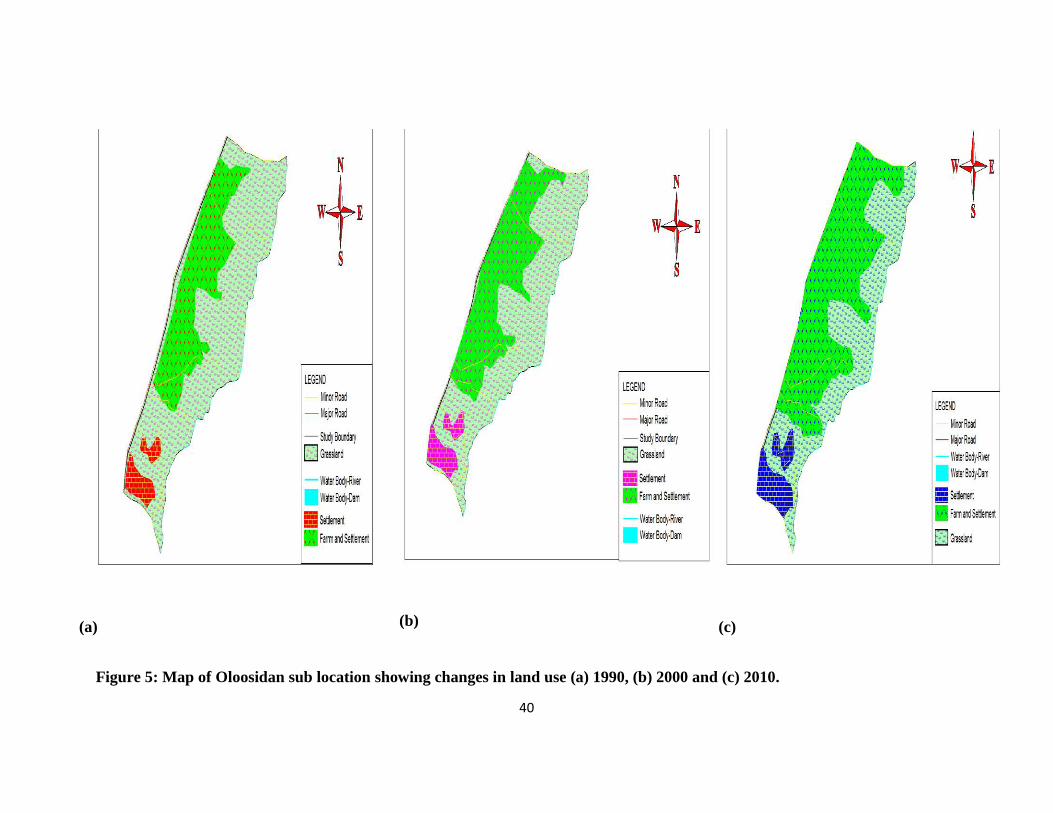
40
(a)
(b)
(c)
Figure 5: Map of Oloosidan sub location showing changes in land use (a) 1990, (b) 2000 and (c) 2010.

41
There was significant decrease in grassland for all the 4 sub-locations in years 1990-2000 and
2000 -2010 (P = 0.000) [See appendix 2]. There was also a significant increase in settlement and
farmland. However there was no significant land use change in water bodies (P >0.05) for all the
4 sub-locations. This is because the respondents did not observe the changes in the volume of the
water bodies but their main focus was on the level of the water. The increase in settlement and
the decrease in grassland are brought by the increase in population in the area in which there in a
high migration of people from Nairobi and the surrounding areas to Kajiado. This has also
resulted in many grasslands being converted to farm lands.
The results show that land use/cover is changing from grassland to settlements and farmland, as
the pastoralists community people are now combining livestock with crop production as shown
by the increase in the farmland area. This agrees with a report by the Government of Kenya in
2011 and the United Nations Environmental Programme (2009) which stated that over the last 30
years, human settlement and farmland has taken a complex pattern in Kenya due to rapid rural-
urban migration and rising occupation of the arid and semi-arid lands (ASALs). The rapid rural-
urban migration has led to unplanned informal settlements (slums) in the major urban areas.
The drift to the marginal areas has led to degradation of the fragile ASAL ecosystems, increased
human-wildlife conflicts as well as land use conflicts between agriculturalists and pastoralists
(GoK, 2011; UNEP, 2009). This agreed with report by the United Nations Environmental
Programme (1997) in which it was reported that the major land-cover types in Kenya are
grasslands, wetlands, fresh and saline water bodies, and deserts. These are used for agriculture,
pastoralism, water catchments, nature reserves, urban and rural settlements, industry, mining,
transport and communications, tourism, recreation (UNEP 1997).

42
In addition to this a study conducted by Boone (2005) reported that livestock keeping remains
the dominant livelihood strategy in Kajiado, even though things are changing because of water
scarcity and increase in population. With the changes taking place, farmers are now shifting to
crop production to sustain their livelihood therefore clearing the grassland (Boone et al., 2005).
Different land uses such as pastoralism and sedentary farming in ASALs compete. The people
living in a specific area usually consist of different groups with divergent interests in land and its
resources (Mwichabe et al., 2000).
4.2 Assessing the effect of climate change and variability on water resources
4.2.1 Establishing the available water resources
The following were listed as the available water sources in Kajiado North. 33.7% of the
respondents get their water from boreholes followed by piped water which is about 25.5%. The
third source of water is from rain water through water harvesting which is 15.8%, followed by
wells (9.2%) and the least is 7.6% from rivers. Most people choose bores as their main source of
water because once they are installed on the household they don‟t need to walk long distances to
fetch water, they are cheap and reliable. Piped water is also preferred because it is safe to drink
unlike borehole water which is usually saline. Rainwater is the third source of water because it is
seasonal and with the changes in climate it is unpredictable. Rivers are the least because there are
no permanent rivers in the area; soon after the rains it takes less than 2 months for the rivers to
start dry up. (See Figure 6)

43
Figure 6: The main sources of water in Kajiado North.
These results agree with those by the Kenya National Water Development report, 2006 which
reported that more than 40% of people in Kenya use borehole water, (Kenya National water
development report, 2006). A high percentage of Kenyans including Kajiado north residents use
unprotected sources of water mainly ponds, dams and streams. In some areas of the country
mostly arid areas in which Kajiado is part of, conflicts have risen amongst the various competing
sectors and users of water (ASAL Development Policy, 2002).
The lack of water resources is a frequent problem in semi-arid regions, where there is not enough
water to sustain agricultural production, for rural population, For rural population, the access to
safe drinking water is difficult and becomes even more difficult during droughts, as only the
urban population (or most part of it) is connected to the public water supply (Hauschild and Döll,
2000). The rainfall is erratic and sometimes falls in storms only a few days, making surface
water difficult to find unless, pans and dams have been constructed. In many cases most

44
communities in the ASALs have to rely on underground water sources which are more
permanent and boreholes have been drilled and fitted with equipment to pump water for both
domestic and livestock use. A study by Mvungi (2005) also reported that the majority of people
in the area use boreholes (Mvungi, 2005). Mwangi (1999) also reported that another reason for
the increase in boreholes in Kajiado District is political, especially at the end of the 1970s when
Stanley Oloitiptip, a Maasai minister, was at the height of his power, large amounts of money
were transferred to the Kajiado water sector in his constituency where a number of boreholes
were constructed later on 20 Other Maasai politicians, like former Vice President Saitoti,
followed his example (Mwangi, 1999).
4.2.2 Effect of climate change and variability on water resources
The following were listed as the effects of climate change and variability on water resources.
30% of the respondents reported that drought is the major effect of climate change, followed by
run off and erosion (21%), the third one is increased evaporation (20%), then changing in water
levels (17%) and the least impact is increased water temperature (12%). (See Figure 7)

45
Figure 7: The effects of climate change on water resources in Kajiado North.
These results are in line with the global aspect since at the global scale, there is also evidence of
a broadly coherent pattern of change in annual runoff, with some regions experiencing an
increase (Allan et al., 2005) particularly at higher latitudes, and others a decrease, for example in
parts of West Africa, southern Europe and southern Latin America (Beamish and Mahnken,
2001). The effects of climate change on river ecosystems are no longer just speculations Rivers
and lakes have been sensitive to consequences of climate change (Ormerod, 2009).
Droughts have become more common, especially in the tropics and sub-tropics, since the 1970s.
Decreased land precipitation and increased temperatures, which enhance evapotranspiration and
Reduce soil moisture, are important factors that have contributed to more regions experiencing
droughts, as measured by the Palmer Drought Severity Index (PDSI) (Bunnell and Squires, K.A.
2005).
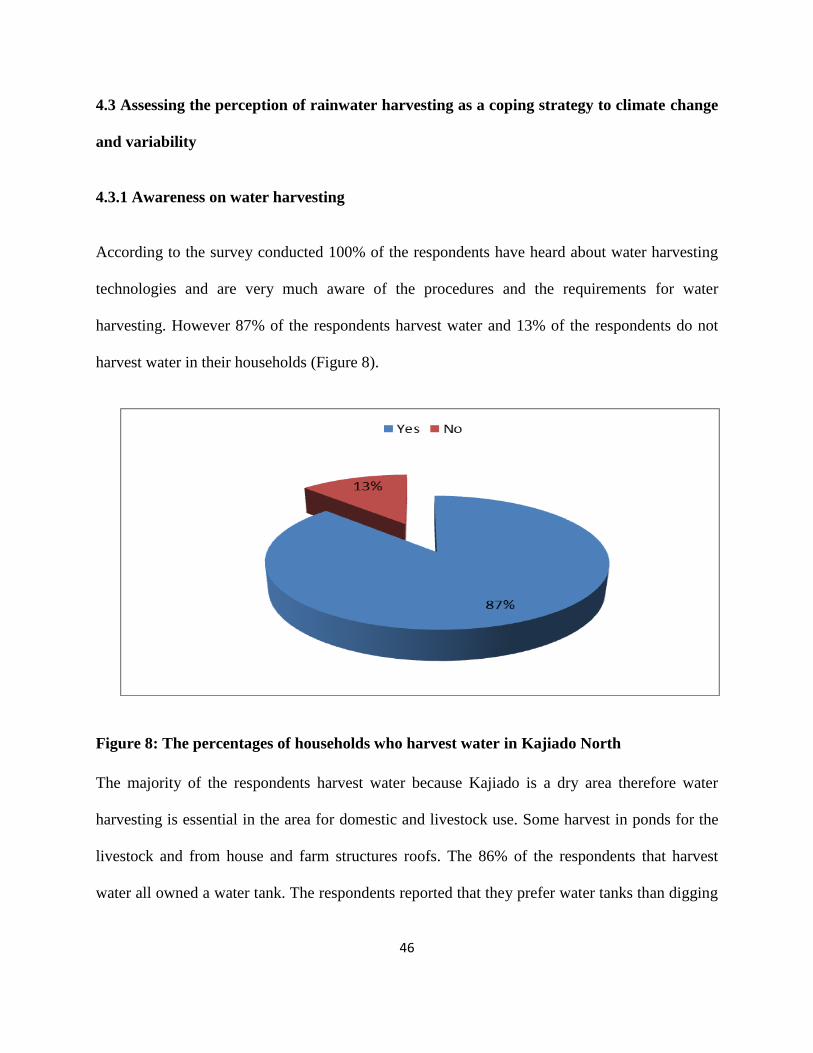
46
4.3 Assessing the perception of rainwater harvesting as a coping strategy to climate change
and variability
4.3.1 Awareness on water harvesting
According to the survey conducted 100% of the respondents have heard about water harvesting
technologies and are very much aware of the procedures and the requirements for water
harvesting. However 87% of the respondents harvest water and 13% of the respondents do not
harvest water in their households (Figure 8).
Figure 8: The percentages of households who harvest water in Kajiado North
The majority of the respondents harvest water because Kajiado is a dry area therefore water
harvesting is essential in the area for domestic and livestock use. Some harvest in ponds for the
livestock and from house and farm structures roofs. The 86% of the respondents that harvest
water all owned a water tank. The respondents reported that they prefer water tanks than digging

47
a ditch or using buckets, this could be because tanks are reliable, easy to manage and do not
require a lot of human labor to extract water from unlike a ditch which also requires a household
to have enough land and it is very expensive since it needs continuous maintenance.
Kenya‟s water policy takes into account all the relevant issues including water conservation and
preservation of its quality. In this regard, mainstreaming of rainwater harvesting is very
prominent. In Kenya today the key players in rainwater harvesting include the following
government ministries: Ministry of Water Resources Management and Development, Ministry of
Environment, Natural Resources and Wildlife and Ministry of Agriculture. Several NGOs and
other Community-Based Organizations at national and local levels have played a major role in
putting rainwater harvesting in the limelight (GoK, 2006).
Through Southern and Eastern Africa Rainwater Network (SearNet) established with the
assistance of International Rainwater Catchment System Association and the support of the
Regional Land Management Unit of UNEP, Kenya has been able to exchange information on
rainwater harvesting with other countries in the east and southern Africa sub-regions. At the
local levels, church organizations and women Groups have been very active in this field (GoK,
2011). Therefore this is in agreement with the results, there are a lot of awareness campaigns in
promoting water harvesting therefore more people are aware of the technology.
4.3.2 Rainwater harvesting technologies existing in the area
The results showed that 76.9% of the respondents harvest water from the rooftop, most
respondents had multiple responses and some were harvesting from both rooftop and infield
surface storage. The second type of water harvesting used was runoff (8.1%) in which they dig a

48
ditch either on the household or at the farm to collect runoff, most of this water is the one used to
feed the livestock. Household and infield water harvesting were 6.5% each. The harvested water
from households was mostly recycled for other uses like irrigating their gardens. The least water
harvesting practice used was surface storage which was only 2%. (See Figure 9.
Figure 9: The rainwater harvesting technologies practiced in Kajiado North.
Rooftop harvesting is preferred because it is easy to use and they just use buckets to collect water
from the roof; it does not require a lot of labour and equipments and the water is safe to drink
unlike infield and surface storage. Rooftop harvesting also provides safe and clean water which
can be used for different activities around the household unlike runoff. The other types of water
harvesting like infield and runoff were not preferred by the respondents because they require the
household to have land and install appropriate mechanism to harvest the water.

49
The results that were obtained agreed with those by Bharadwaj (2001) and Thomas and
Martinson (2007) that roof top water harvesting is the most preferred method of water harvesting
compared to other methods.
4.3.3 Institutions dealing with rainwater harvesting
The results show that the only institution working in the area on the issue of rainwater harvesting
is the extension services provided by the government, even though some don‟t have access to the
extension services. 65% of the respondents said they have had some sort of contact with the
extension officers on the issues of rain water harvesting and 35% said they have never had any
contact with the extension officers on the issue of rain water harvesting. (See Figure 10).
Figure 10: The percentage of people who had contact with the extension officers in Kajiado
North.
Although Kenya has a long tradition of rainwater harvesting, policies and interventions are
lacking behind as there are no enough capacity building interventions on rainwater harvesting for

50
agriculture (Berger, 2011). Therefore there is still need to explore the potentials for new Kenyan
policies on rainwater harvesting to ensure that farmers are benefiting.
4.3.4 Gender and rainwater harvesting
The respondents said both men and women are involved in water harvesting, they argued that
men take part in the construction of the water harvesting equipment and women are mostly
involved in collected the water. 30% of the respondents said that women are the mostly involved
than men, 23% said the men are the ones who are involved. (See Figure 11)
Figure 11: Involvement of men, women and children in rainwater harvesting in Kajiado
North.
There was no significant difference on who is more involved in water harvesting between men
and women. However previous studies show that women play a major role and take on a range of
other agricultural tasks to ensure food production for household sustenance as women are more
likely to invest the additional income in children and family therefore more involved in making
sure there is water in the household.
Therefore these consequences need to be addressed where the women have become increasingly
central in agricultural production and rainwater harvesting as men engage in migratory labour.
Even at local levels, church organizations and women groups have been very active in rainwater
harvesting (Baiphethi et al., 2009)

51
4.3.5 Basis for not harvesting water
It was reported that 14% of the respondents do not harvest water based on a number of reasons,
60.4% of the people that do not harvest water reported that they do not harvest water because it
is expensive, 24.6% said there is lack of information from experts like extension workers. Only
15% of the interviewed population said they do not harvest water because of lack of interest.
(See Figure 12)
Figure 12: Reasons for not harvesting water in Kajiado North.
Most people consider harvesting water expensive because of the equipments like gutters, pipes
and a tank that needs to be installed on the household. According to studies by the World Bank,
most of the urban poor Kenyans only have access to polluted water because of the high costs
associated with accessing water which has caused multiple problems that affect health and
livelihoods. Despite the critical shortage of clean water in Kenya‟s urban slums, there also is a
large rural to urban discrepancy in access to clean water in Kenya (World Bank, 2010).

52
4.3.6 Duration of the harvested water
The respondents who harvest water using different methods were asked on the time the harvested
water last. The harvested water mostly last for 2 to 3 months after the rains for the 35.4% of the
respondents who harvest water. Depending on the size of the tank or the size of the family the
harvested water may sometimes last for 6 months or even the whole year. Unfortunately only
16.3% of the respondents can have their harvested water for the whole year and 18.3% still have
their harvested water for 6 months. Lastly 30% of the total respondents interviewed can only
have the harvested water for less than a month, and the remaining time they have to source water
from other sources. (See Figure 13)
Figure 13: The amount of time that harvested water lasts.
During every prolonged dry spell or prolonged drought, pans dry out, shallow wells are not
recharged and the underground storage tanks empty quicker than normal (Aklilu and Wekesa,
2002). However results showed that due to this problem most households have the desire to
harvest water because of the water situation in the area. However they do not have enough

53
storage facilities that can enable them to harvest enough water to be used all year round. From
the 1970s onwards, individual Maasai have pointed at falling water levels in the rivers in Kajiado
District. Indeed, when comparing a list of rivers in the 1930s with the current situation we have
to conclude that more rivers nowadays should be labelled as „perennial‟ and fewer as
„permanent‟. It is hard to know the exact reason for this development but one could point at
causes such as increased demand, irrigated agriculture, deforestation and the loss of storing
capacity in the rivers because of sand mining (Wagura and Kanyanjua, 1992).
4.3.7 Uses of the harvested water
A high percentage of the harvested water around the household is used for domestic purposes
(80.2%). The domestic uses include bathing, washing dishes, washing clothes and cleaning the
house, 12.6% was not applicable as some did not have the tank or did not harvest water. A small
percentage (5.8%) of the harvested water from the tanks is used for irrigating crops and the least
(1.4%) is used for livestock. Domestic use was the main reason for harvesting water because
most households did not have the equipments to use the water for irrigation. (See Figure 14).
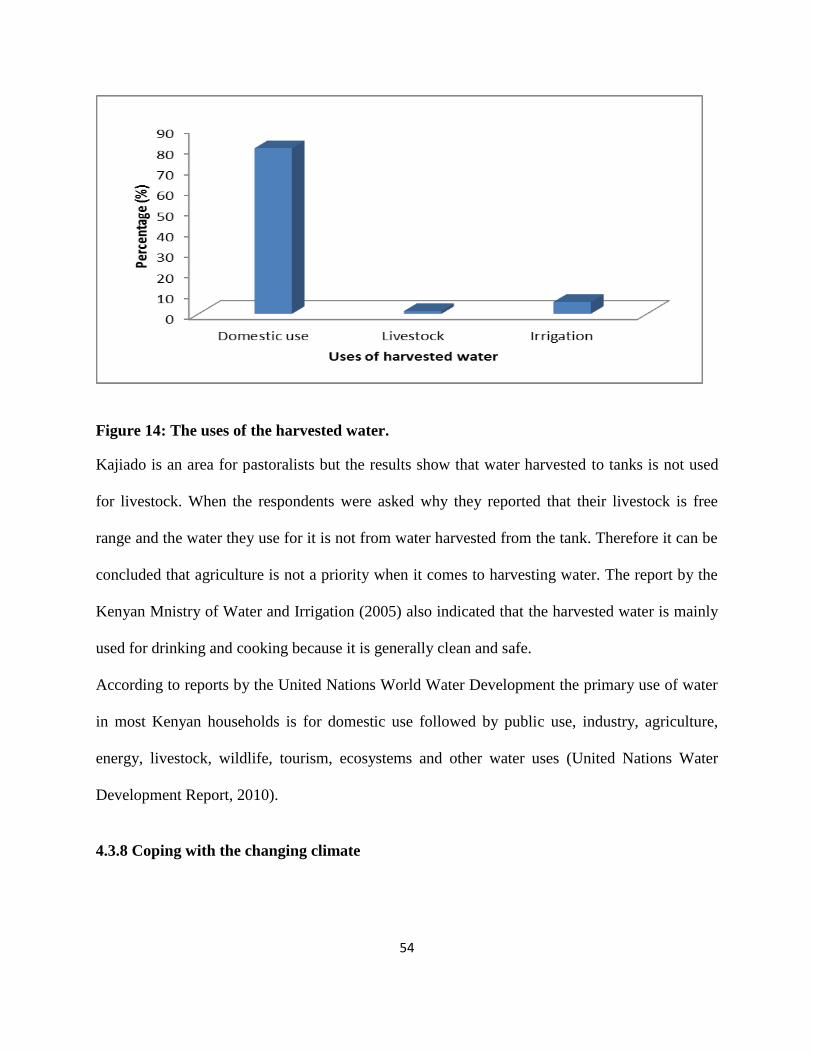
54
Figure 14: The uses of the harvested water.
Kajiado is an area for pastoralists but the results show that water harvested to tanks is not used
for livestock. When the respondents were asked why they reported that their livestock is free
range and the water they use for it is not from water harvested from the tank. Therefore it can be
concluded that agriculture is not a priority when it comes to harvesting water. The report by the
Kenyan Mnistry of Water and Irrigation (2005) also indicated that the harvested water is mainly
used for drinking and cooking because it is generally clean and safe.
According to reports by the United Nations World Water Development the primary use of water
in most Kenyan households is for domestic use followed by public use, industry, agriculture,
energy, livestock, wildlife, tourism, ecosystems and other water uses (United Nations Water
Development Report, 2010).
4.3.8 Coping with the changing climate

55
On the coping strategies to climate change used, 49.8% reported that they plant trees, drought
resistant crops (4.8%), irrigation (10.6%), rainwater harvesting (17.3%), early planting (1.4%),
soil and water conservation (4.7%), application of fertilizer and organic inputs (9%), and
changing from extensive to intensive farming (2.4%). This is because there are a lot of awareness
campaigns on tree planting either on radios and field days, therefore most people prefer planting
trees as the main coping strategy to climate change. The change from extensive to intensive
farming was the least because of the climatic conditions of the area. Kajiado is a semi-arid area
in which most of the crops do not do well. (See Figure 15)
Figure 15: The coping strategies to climate change used in Kajiado North.
Just like in Kajiado County, many regions in the world are already taking actions that will help
them manage the challenges of climate change like rainwater harvesting and irrigation. In Sub-
Saharan Africa, irrigated area is projected to grow more than twice as fast as rain-fed area over
the same period, (79 compared with 34 percent), but the share of irrigated area will be only 4.5
percent in 2050 compared with 3.4 percent in 2000 (IPCC, 2007). Factors like reduced rainfall

56
over time, population growth and water scarcity combine to contribute to the region‟s
considerable vulnerability to current climate variability and long-term climate change (Stern,
2006). As such, under a moderate climate change scenario without appropriate adaptation, the
prices of agricultural commodities are projected to increase in both domestic and world markets
(UNDP, 2004). Real commodity prices for all cereals are projected to rise by 2050 due to
increased land and water scarcity, as well as the impacts of climate change, biofuel development,
increased population, and income- and growth-driven demand for food diversification (IPCC,
2008).

57
CHAPTER FIVE: CONCLUSIONS AND RECOMMENDATIONS
5.1 CONCLUSIONS
Land use/land covers have changed over time in Kajiado North. There has been a decrease in
grassland and an increase in settlements, which means that more land is been used for
cultivation. The demand for water has also increased and the pastoralist‟s are now combining
livestock with crop production as shown by the increase in the farmland area. The maps revealed
a significant increase in settlement of 3.75% from 1990-2000 and 6.5% from 2000 to 2010 and a
significant decrease in grassland of 4.6% from 1990 to 2000 and 7.2% from 2000 to 2010.
Climate change has affected water resources in Kajiado North in terms of drought, runoff and
increased evaporation leading to communities relying on ground water as evident by the majority
of the respondents using boreholes as the main source of water. Vulnerability of rural Kenyans to
climate change stems from increasingly uncertain rainfall patterns and rapid population growth
as the agriculture in the area is purely rain-fed. Respondents in Kajiado are already taking actions
that will help them manage the challenges of climate change like rainwater harvesting and
planting trees.
Most of the respondents in the study area used unprotected sources of water mainly ponds, dams
and ephemeral streams. There are a lot of awareness campaigns in promoting rainwater
harvesting therefore more people are aware of the technology. The harvested water is mainly
used for drinking and cooking because it is generally clean and safe. Most people consider
harvesting water expensive because of lack of storage facilities and other equipments like
gutters, pipes and a tank that needs to be installed on the household. The respondents were able
to notice that water harvesting plays a vital role in promoting agriculture in the area. Most

58
respondents prefer rooftop rainwater harvesting because it is easy to use and manage and do not
require a lot of human labor to extract water unlike other rainwater harvesting technics like
infield rainwater harvesting which requires a household to have land and it is very expensive
since it needs continuous maintenance. The institutions that are working in the area on rainwater
harvesting are the extension officers.
5.2 RECOMMENDATIONS
1. Appropriate governance and land use policy needs to be revised and implemented to
ensure proper allocation and use of land for sustainable management of resources and
risk management at community level.
2. There is need for the government to monitor land use change/cover. This will help in
planning of future risks and uncertainties brought by the changes in land use
3. Efforts to increase the capacity of rural farmers to cope with and adapt to a greater
prevalence of drought due to climate change requires a holistic approach that addresses
their need for information, access to technology, capacity building, new livelihood
opportunities and a supportive policy regime.
4. Different stakeholders under the Ministry of Agriculture need to promote rain water
harvesting in their various programmes through awareness campaigns and field days in
order to enhance agriculture production
5. Further research is required on the effects of land use change on water resources and to
quantify the financial and other benefits of wider resilience building interventions such as
rainwater harvesting.

59
6.0 REFERENCES
Aklilu, Y. and Wekesa, M. (2002). Drought, Livestock and Livelihoods: Lessons from the 1999-
2001 Emergency Response in the Pastoral Sector in Kenya, Humanitarian Practice
Network Paper No. 40. Overseas Development Institute, London.
Alder, J., Chilton, J., Gaddis, E., Pietersen, K., and Zockler, C. (2007). Water. State and trends of
the environment. In Journal of Environment and Development 13:156-178.
Al-Kodmany, K. (2000). Extending geographic information systems (GIS) to meet neighborhood
planning needs: Recent developments in the work of the University of Illinois at Chicago.
URISA Journal 12(3): 19–37.
Allan, J.D., M. Palmer and N.L. Poff. (2005). Climate Change and Freshwater Ecosystems. In
Lovejoy and Hannah (eds.), Climate Change and Biodiversity.Yale University Press.
New Haven, Conn.
Andares, S.P. (2000). Crop water requirements for micro irrigated crops. Workshop on micro
irrigation. Feb 8, 2000, Jalgon, India. PP. 1-7.
Aroka, N. (2010). Rainwater Harvesting in Rural Kenya: Reliability in a variable and changing
climate. Stockholms University.
Asian Development Bank (ADB). (2002). Key Indicators 2002: Population and Human
Resources Trends and Challenges. ADB, Manila.

60
Baiphethi, M.N., Viljoen, M.F., and Kundhlande, G. (2009). Rural women and rainwater
harvesting and conservation: anecdotal evidence from the Free State and Eastern Cape
provinces. Human sciences research council.
Barndt, M. (2002). A model for evaluating public participation GIS. In Craig W, Harris T, and
Weiner D (eds) Community Participation and Geographic Information Systems . London,
Taylor and Francis: 346–56.
Bates, B., Kundzewicz, Z. W., Wu, S., and Palutikof, J. (2008). Climate Change and Water.
Technical Paper of the Intergovernmental Panel on Climate Change, IPCC Secretariat (
No. VI) (p. 210). Geneva: Institute for Climate Impact Research.
Beamish, R.J., Mahnken, C. (2001). A critical size and period hypothesis to explain natural
regulation of salmon abundance and the linkage to climate and climate change. Progress
in Oceanography 49: 423-437.
Behnke, R. (2011). USAID Pastoral land rights and resource governance, overview and
recommendations for managing conflicts and strengthening pastoralists rights property
rights and resource governance, Briefing Paper No.10.
Berger, M. (2011). Rainwater Harvesting in Kenya; How Do Institutions and Policies Hinder or
PromoteRainwater Harvesting?, Centre for Development and Environment (CDE),
Institute of Geography (GIUB), Nairobi, Kenya.
Boko. M., Niang, I., Nyong, A., Vogel, C., Githeko, A., Medany, M., Osman-Elasha, B., (2007).
Africa Climate Change: Impacts, Adaptation and Vulnerability. Contribution of Working

61
Group II to the Fourth Assessment and Vulnerability Report of the Inter-governmental
Panel on Climate Change.. Cambridge University Press, Cambridge UK, pp. 433-467.
Boone, R.B., BurnSilver, S.B., Thornton, P.K., Worden, J.S. and Galvin, K.A. (2005).
Quantifying declines in livestock due to land subdivision in Kajiado District, Kenya.
Rangeland Ecology and Management 58:523–532.
Bouwer, H. (2000). Integrated water management: emerging issues and challenges. Agricultural
Water Management, 45(3), 217–228.
Bunnell, F.L., Squires, K.A. (2005). Evaluating potential influences of climate change on
historical trends in bird species. Report to Jenny Fraser, BC Ministry of Land, Water,
and Air Protection, Victoria B.C.
Carver, S., Evans, A., Kingstone, R. and Turton, I. (2001) Public Participation, GIS, and
Cyberdemocracy: Evaluating On-Line Spatial Decision Support Systems. Environment
and Planning, 28, 907-21.
Chase, T.N., J.A. Knaff, R.A. Pielke, and E. Kalnay. (2003). Changes in global monsoon
circulations since 1950. Natural Hazards, 29, 229– 254.
Chrisman, N. (1987) Design of geographic information systems based on social and cultural
goals. Photogrammetric Engineering and Remote Sensing 53: 1367–70.
Clay, R. (2009). Rainwater Harvesting: A lifeline for human well-being (A report prepared for
UNEP). Stockholm Environmental Institute.

62
Critcheley, W., and Siegert, K. (1991). Water Harvesting. Food and Agriculture Organization of
the United Nations. Rome.
DeFries, R. and Eshleman, K. N. (2004). Land-use change and hydrologic processes: a major
focus for the future, Hydrological. Process, 18, 2183–2186.
Dinar, A., Hassan, R., Mendelsohn, R. and Benhin, J. (2008). Climate Change and Agriculture in
Africa: Impact Assessment and Adaptation Strategies. Earthscan, London.
Diop, S., M‟mayi, P., Lisbjerg, D., and Johnstone, R. (2002). Vital water graphics: an overview
of the state of the world’s fresh and marine waters (Vol. 1). UNEP/Earthprint.
Döll, P. (2002). Impact of climate change and variability on irrigation requirements: a global
perspective. Climatic Change, 54, pp 269–293.
Elwood, S. (2002). GIS use in community planning; A multidimensional Analysis of
empowerment, Environment and Planning A, 34, 905-922.
Eriksen, S., O‟Brien, K., and Rosentrater, L. (2008). Climate Change in Eastern and Southern
Africa Impacts, Vulnerability and Adaptation. Report 2008:2. Global Environmental
Change and Human Security. Oslo. pp. 25.
Falkenmark, M. (2003). Water Management and Ecosystems: Living with Change. Global Water
Partnership Technical Committee. Tec Backgroung Papers no 9. Elanders Novum,
Sweden 2003.

63
FAO, WFP and IFAD. (2012). The State of Food Insecurity in the World 2012. Economic growth
is necessary but not sufficient to accelerate reduction of hunger and malnutrition. Rome,
FAO.
FAO. (2004). Economic valuation of water resources in agriculture; from the sectoral to a
functional perspective of natural resource management. (No. 27). Centre for social and
Economic Research on the Global Environment: Zuckerman Institute for Connective
Environmental Research.
FAO. (2011). The state of the world’s land and water resources for food and agriculture
(SOLAW) – Managing systems at risk. Food and Agriculture Organization of the United
Nations, Rome and Earthscan, London.
FAO. (2012). Food Security and Agricultural Development in Sub- Saharan Africa Building a
case for more public support. Policy Brief No.2: Conceptual and Empirical Framework.
Forrester, J. and Cinderby, S. (2000). A guide to using community mapping and participatory
GIS. Environment Institute, University of York.
Frasier, G. and Myers, L. (1983). Handbook of Water Harvesting. ( No. 600). U.S: Department
of Agriculture.
Gleick, P.H. (1998). Water and conflict in the World's Water 1998-1999 (ed. P.M. Gleick),
Washington DC. Island Press, 105-135.

64
Government of Kenya. (2006). Kenya National Water Development Report, prepared for the
Second UN World Water: A shared responsibility‟ (Nairobi, Kenya: Government of the
Republic of Kenya, Ministry for Water and Irrigation).
Government of Kenya. (2007). Kajiado District Strategic Plan, for implementation of the
National Population Policy for Sustainable Development. National Coordination Agency
for Population and Development. Retrieved from
http://www.who.int/entity/medicines/areas/coordination/estonia_pharmaceutical_profile.
pdf.
Government of Kenya. (2009). Kajiado district Vision and Strategy: 2005-2015. Kenya: Office
of the prime minister.
Government of Kenya. (2011). Economic Survey, Nairobi.
Gyau-Boakye, Tumbulto, J., Gyau-Boakye and Tumbulto, J. (2000). The Volta Lake and
Declining Rainfall and Streamflows in the Volta River Basin. Environment, Development
and Streamflows in the Volta River Basin. Environment, Development and Sustainability.
Springer, Netherlands.
Hai, M.T. (1998). Water harvesting. RELMA Technical Handbook No. 16, Soil and Water
Conservation Branch, Ministry of Agriculture, Nairobi, Kenya.
Haining, R. (1990). Spatial data analysis in the social and environmental sciences. Cambridge
University Press, Cambridge.
Haklay, M. (2003). Review: Community Participation and Geographic Information Systems.
Environment and Planning P-30: 319–20.

65
Hallberg, D. (2011). The Kenyan “Digital Villages Project”from a behavioural perspective.
Advances in ICT for Emerging Regions (ICTer), 2011 International Conference on (pp.
71–76). Retrieved from http://ieeexplore.ieee.org/xpls/abs_all.jsp?arnumber=6075029.
Hare, F.K. (1985). Climatic variability and change. Ch 2 in R.W. Kates, J.H. Ausubel and M.
Berberian 9eds), Climate impact assessment; Studies of the ineraction of climate and
society, SCOPE 27, Wiley, Chichester, pp. 37-68.
Hauschild, M. and Döll, P. (2000). Water Use in Semi-arid Northeastern Brazil – Modeling and
Scenario Analysis. Report A0003, Center for Environmental Systems Research,
University of Kassel, Water Availability and Vulnerability of Ecosystems and Society in
the Northeast of Brazil Brazilian-German cooperation program.
Hogg, R. (2008). Water Harvesting and Agricultural Production in Semi-arid Kenya. Wiley
Online Library. Development and Change. Retrieved August 17, 2012, from
http://onlinelibrary.wiley.com/doi/10.1111/j.1467-7660.1988.tb00295.x/pdf.
Houghton, R.A. and Skole, D.L. (1990). Carbon in the earth as transformed by human action.
Turner, B.L., II, Clark, W.C., Kates, R.W., Richards, J.F., Mathews, J.T. and Meyer,
W.B. (eds). Cambridge University Press, Cambridge, p. 393-408.
Intergovernmental Panel on Climate Change (IPCC). (1997). Revised 1996 IPCC Guidelines for
National Greenhouse Gas Inventories: Reference Manual, Vol. 3. Ed. J. T. Houghton,
L.G. Meira, L.G. Filho, B. Lim B, K. Treanton, I. Mamaty, Y. Bonduki, D.J. Griggs, and
B.A. Callender. Geneva, Switzerland: Intergovernmental Panel on Climate Change.
66
Intergovernmental Panel on Climate Change (IPCC). (2001). Climate change 2001: impacts,
adaptation and vulnerability. Contribution of Working Group II to the Third Assessment
Report.
Intergovernmental Panel on Climate Change (IPCC). (2008). Climate Change and Water.
Intergovernmental Panel on Climate Change Technical Report IV. June 2008.
Kabat, P., Schulze, R.E., Hellmuth, M.E and Veraart, J.A (eds). (2003). Coping with Impacts of
Climate Variability and Climate Change in Water Management: A Scoping Paper. DWC-
Report No. DWCSSO-01 International Secretariat of the Dialogue on Water and Climate,
Wageningen, Netherlands.
Kalnay, E. and Cai, M. (2003). Impact of urbanization and land-use change on climate. Nature
423, 528 – 531.
Kasperson, J.X., Kasperson, R.E. and Turner B.L. (eds). (1995). Critical Environmental
Regions: International Comparisons. United Nations University Press, Tokyo. (In press).
Kirk, J. (2009). “It’s Now Legal to Catch a Raindrop in Colorado,” New York Times, June 28,
2009, available at http://www.nytimes. com/2009/06/29/us/29rain.html.
Kurukulasuriya, P., Mendelsohn, R., Hassan, R., Benhin, J., Deressa, T., Diop, M., Eid, H.M.,
Yerfi Fosu, K, Gbetibouo, G., Jain, S., Mahamadou, A., Mano, R., Kabubo-Mariara, J.,
El-Marsafawy, S., Molua, E., Ouda, S., Ouedraogo, M., Sene, I., Maddison, D., Seo, N.
and Dinar, A. (2006). Will African agriculture survive climate change? World Bank
Economic Review 20(3):367–388.

67
Lake, R. W. (1993). Planning and applied geography: positivism, ethics, and geographic
information systems, Progress in human geography, 17 404 – 413.
Langat, P.K. (2000). Rain Water Harvesting. Kenya, Technical handbook No. 11, Kenya
Agricultural Research Institute (KARI), KARI-Njoro, Kenya.
Liniger, H. (1995). Endangered Water: A global overview of degradation, conflicts and
strategies for improvement. Centre for Development and Environment, Institute of
Geography, University of Berne, Switzerland. Pp. 117.
Loukaitou-Sideris, A. (1999). Hot spots of bus stop crime: the importance of environmental
attributes. Journal of the American Planning Association, 65 395-411.
Loveland, T.R., Zhu, Z., Ohlen, D.O., Brown, J.F., Reed, B.C, Yang, L.M. (1999). An analysis of
the IGBP global land-cover characterization process. Photogrammetric Engineering and
Remote Sensing 65 (9), 1021–1032.
Mandloi, D., Khare, D., and Pareek, T. (2005). Rainwater Harvesting. Journal of Chemical,
Biological and Physical Sciences. Retrieved from
http://www.jcbsc.org/journal/Paper/Vol_1_I_1_2011/JCBPS%20NO.11.pdf.
Marshall, S. (2011). The water crisis in Kenya; Causes, Effects and Solutions. Global majority
E-Journal, Vol.2, No pp31-45.
Mati, B., Svendsen, M., Sadoff, C., Finlayson, C. M., Lannerstad, M., Manning, N., Molle, F.
(2007). Trends in water and agricultural development. Retrieved from
http://www.bscw.ihe.nl/pub/bscw.cgi/d2840559/2-Trends-Water%20n%20Agri.pdf.

68
Ministry of Water and Irrigation. (2005). Report on operationalization of the Water Act 2002 in
Water Resources Management. Kenya.
Ministry of Water Development Kajiado District. (2000). Kajiado Borehole Survey. Funded by
Arid and Semi-Arid Lands Programme, Kajiado District, 2000.
Moraa, H. (2012). Water governance in Kenya; Ensuring accessibility, service delivery and
citizen participation. iHub research, Nairobi, Kenya.
Munale, A. (2000). Flood and water quality management through targeted, temporary
restoration of landscape functions: paying upland farmers to control runoff. Journal of
soil and water conservation, 55(3), 285–295.
Mvungi, A., Mashauri, D. and Madulu, N.F. (2005). Management of water for irrigation
agriculture in semi-arid areas: Problems and prospects. Physics and Chemistry of the
Earth 30: 809–817.
Mwangi, M.N. (1999). Water Development in Kajiado District: Some Personal Remarks, In:
M.K. van Klinken and J. ole Seitah (eds), The Future of Maasai Pastoralists in Kajiado
District (Kenya), Proceedings of a Conference held in Brackenhurst Baptist International
Conference Centre Limuru, Kenya, 28-31 May 1989, ASAL Programme, Kajiado, pp.
114-119, 199).
Mwichabe, S., Gitau, M, and Lekupe, D. (2000). The land tenure (and use) Change scenario
study for improved productivity and environmental conservation of P&D Ranch,
Rumuruti Division, Laikipia District. Laikipia Wildlife Forum.
69
Ngigi, S. N. (2003). What is the limit of up-scaling rainwater harvesting in a river basin?
Physics and Chemistry of the Earth, Parts A/B/C, 28(20-27), 943–956.
doi:10.1016/j.pce.2003.08.015.
Olomoda, I. (2002). Impact of Climate Change on the River Niger Hydrology. River Symposium
2006, University of Queensland, Australia.
Ormerod, S.J. (Ed) (2009). Climate Change, River Conservation, and the Adaptation
Challenges; Aquatic Conservation. Marine and Fresh Water Ecosystems 19, gs 609-613.
Pielke, R.A., Marland, G., Betts, R.A., Chase, T.N., Eastman, J.L., Niles, J.O., Niyogi, D.D.S.,
and Running, S.W. (2002). The Influence of Land-use Change and Landscape Dynamics
on the Climate System: Relevance to Climate-Change Policy Beyond the Radiative Effect
of Greenhouse Gases.” Philosophical Transactions of the Royal Society of London.
A360:1705-1719.
Pitman, A. J., Narisma, G. T., Pielke, R. A., Holbrook, N. J. (2004). Impact of land cover change
on the climate of southwest Western Australia. Journal of Geography. Res. 2004, 109,
D18190.
Prinz, D. and Singh, A. K. (2000). Water Resources in Arid Regions and their Sustainable
Management. Annals of Arid Lands, Special Issue on Research.
Pruss-Ustun, Robert, and Jamie, B. (2008). “Safer Water, Better Health: Costs, benefits and
sustainability of interventions to protect and promote health,” World Health
Organization, p. 40.

70
Ramankutty, N., and Foley, J.A. (1999). Estimating historical changes in global land cover:
Croplands from 1700 to 1992. Global Biogeochem Cycles, 13(4), 997–1027.
RELMA (Regional Land Management Unit), (2007). Good to the last drop, Capturing Africa’s
potential for rainwater harvesting. RELMA, Nairobi: Available at:
<http://www.relma.org/PDFs/Issue%202%20%20Rainwater%20Harvesting.pdf>
[Accessed 2 December 2011].
Republic of Kenya. (2001). Kajiado District Development Plan. Government Printer, Nairobi.
Republic of Kenya. (2004). Strategy for Revitalizing Agriculture 2004-2014, Ministry of
Agriculture & Ministry of Livestock and Fisheries Development, Nairobi.
Sala, O.E., Chapin, F.S., Armesto, J.J., Berlow, E., Bloomfield, J., Dirzo, R., Huber-Sanwald, E.,
Huenneke, L.F., Jackson, R.B., Kinzig, A., Leemans, R., Lodge, D.M., Mooney, H.A.,
Oesterheld, M., Poff, N.L., Sykes, M.T., Walker, B.H., Walker, M., Wall, D.H. (2000).
Biodiversity: global biodiversity scenarios for the year 2100. Science 287, 1770–1774.
Saunders, M. I., Dische, S., Grosch, E. J., Fermont, D. C., Ashford, R. F. U., Maher, E. J., and
Makepeace, A. R. (2009). Water and Climate Change: Understanding the risks and
making Climate-Smart Investment Decisions. International Journal of Radiation
Oncology* Biology* Physics, 21(3), 871–878.
Silveira, S. (2005). Bioenergy: Realizing the potential. Elsevier Science.
Sivanappan, R. K. (2006). Rain water harvesting, conservation and management strategies for
urban and rural sectors. National Seminar on Rainwater Harvesting and Water
Management (pp. 11–12).

71
Smit, B and Skinner, M.W. (2002). Adaptation options in Agriculture to Climate Change:
Atypology. Journal of Mitigation and Adaptation Strategies for Global Change. 7:85-
114, 2002.
Smith, L. and Karuga, S. (2004). Agriculture in Kenya: What Shapes the Policy Environment?
Report to DFID, Oxford Policy Management.
The State of Victoria Department of Sustainability and Environment. (2011). Managing adverse
water resource impacts of land use changes. Policy paper. ISBN 978-1-74287-359-6.
Thomas, T.H and Martinson, D.B., (2007) Roofwater harvesting: A handbook for practitioners.
IRC International Water and Sanitation Centre. Available at: www.irc.nl/page/37471.
Thornton, P.K., BurnSilver, R.B., and Galvin, K.A. (2006). Modelling the impacts of group
ranch subdivision on agro-pastoral households in Kajiado, Kenya. Agricultural Systems
87:331-356.
TISDA Kenya. (December 2011). Water Governance. Launch of the National Water Integrity
Study (NWIS). Retrieved on July 2012 from http://tisdakenya.wordpress. com/.
Tolba, M.K., and El-Kholy, O.A. (Eds.). (1992). The World Environment 1972–1992: Two
Decades of Challenge. Chapman & Hall, London.
Tumbulto, J.W. (2005). A Study of Water Balance of the Pompon Sub-Catchment of the Densu
River Basin. Published Ph.D. Thesis, Department of Geology, University of Ghana,
Press, Legon, Accra, Ghana.

72
UNDP. (2004). Adaptation Policy Frameworks for Climate Change. Developing Strategies,
Policies and Measures, [Lim B, Spanger-Siegfried E (eds)], Cambridge University Press.
Cambridge, UK. ISBN-13: 9780521617604 / ISBN-10: 052161760X.
UNDP. (2007). Improving water governance in Kenya through the human rights-based
approach. A mapping and Baseline Report.
UNEP. (2009). Kenya: Atlas of Our Changing Environment. United Nations Environment
Programme (UNEP), Nairobi, Kenya.
UNICEF. (2008). Kenya Statistics, Accessed online 3/15/2011 at
http://www.unicef.org/infobycountry/kenya_statistics.html.
United Nations Water Development Report No:3. (2010): Water in the changing world.
United Nations. (2009). World Population Prospects: The 2008 Revision. Department of
Economic and Social Affairs, Population Division. New York.
Vitousek, P.M., Mooney, H.A., Lubchenco, J., Melillo, J.M. (1997). Human domination of
earth’s ecosystems. Science 277, 494–499. Walker, B.H., 1993. Rangeland ecology:
understanding and managing change. Ambio 22, 80–87.
Wafula, P. (2010). Lack of Investment in Water Sector Leaves Kenyan Towns Parched.
Wagura, J.M. and Kanyanjua. (1992). Rain Water Harvesting in Kajiado District as a Source of
Water Supply, paper presented at the 3rd National Conference on Rainwater Harvesting
Systems, Nairobi, 1992.

73
Western, D., and Nightingale, D.L.M. (2006). Environmental change and the vulnerability of
pastoralists to drought. A case study of the Maasai in Amboseli, Kenya. Africa
Environmental Outlook Report. UNEP: Nairobi.
Wheater, H., and Evans, E. (2009). Land use, water management and future flood risk. Land Use
Policy, 26, S251–S264. doi:10.1016/j.landusepol.2009.08.019.
World Bank. (2001). World Development Report 2000/2001: Attacking Poverty, New York:
Oxford University Press.
World Bank. (2006). Managing Water Resources to Maximize Sustainable Growth: A Country
Water Resources Assistance Strategy for Ethiopia. Washington, D.C.
World Bank. (2008). Competitive Commercial Agriculture in Sub–Saharan Africa (CCAA)
Study, Washington DC: World Bank.
World Bank. (2010). World Development Indicators (Washington, DC: The World Bank); as
posted on the World Bank website (downloaded on October 5, 2010).
Zhang, Y.G., Nearing, M.A,, Zhang, X.C., Xie, Y., Wei, H. (2010). Projected rainfall erosive
changes under climate change from multimodal and multiscenario projections in
northeast China. Journal of Hydrology 384:97-106.

74
7.0 APPENDICES
7.1 Appendix 1: Questionnaire
Farmer and site identification
Name of the respondent [_________________________________________]
District [__________________] Division [_______________] Location [_______________]
Date (dd/mm/yyyy) [__/__/____] Start time [________]
Year of settlement [______________]
0.0 Household characteristics
0.1 Age of the respondent [______]
0.2 Gender (1) female (2) male
0.3 Marital status (1) single (2) married (3)separated (4) widow/widower
0.4 Formal education level (years)
(1) None (2) primary (3) secondary (4) college/university (5) adult education
0.5 Total number of children [_____]
0.6 Source of income (1) formal employment (2) informal employment (3) formal
business (4) informal business (5) Crop farming (6) Livestock production (7)
Remittances (8) Other (specify)______________
1.0 Land use change
1.1 What was status of land cover by the time you settled?___________________

75
1.2 Are you aware of the land use changes that have occurred in the area in the last 20
years? (1) yes (2) no
1.3 If yes, what changes have taken place? ________________________________
1.4 Has the changes in land use affected you in any way? (1) yes (2) no
1.5 If yes are you better off now than you were before? (1) yes (2) no
Explain__________________________________________________________
1.6 What do you think can be done to adapt to the changes in land use?
2.0 Water availability
2.1 What is the main source of water for this household? (1) piped (2) river (3) well
(4) rain water (5) bore hole (6) other (specify)
2.2 How much do you pay for water per month? _____________(KSh)
2.3 Do you own a water storage tank? (1) yes (2) no. If yes, how many liters does
it hold? _________liters
2.4 If yes, what do you use the water it contains for? (1) domestic use (2) livestock
(3) irrigation
2.5 If no question 2.3, how long does it take to collect water for use in the household?
______hours
2.6 Do you use the water to irrigate your crops? (1) yes (2) no

76
3.0 Climate Change and water availability
3.1 Have you ever heard of climate change? (1) yes (2) no
3.2 If yes what are the impacts of climate change on water resources in this area?
3.3 How do you cope with the changes mentioned above?
4.0 Rainwater harvesting
4.1 Have you ever heard of water harvesting? (1) yes (2) no
4.2 Do you harvest water in your household/farm? (1) yes (2) no
4.3 If the answer to part 4.2 is no, why do you not use rain-water harvesting? (1) lack
of information/expertise (2) land constraint (3) laborious (4) expensive (5) not
interested (6) other (specify)
4.4 If yes in question 4.2 above, what type of water harvesting do you practice? (1)
rooftop harvesting (2) runoff harvesting (3) household water (4) in-field soil and
water management (5) surface storage (6) other (specify)
4.5 What is the nature of the water source from which you harvest from? (1) rainfall
(2) runoff (3) households (4) others (specify)
4.6 Who is mostly involved in water harvesting? (1) men (2) women (3) children (4)
all
4.7 Where do you collect the harvested water? (1) containers (2) dam (3) on the farm
(4) others (specify)

77
4.8 How do you conserve the harvested water? (1) polythene sheet lining (2)
cemented pan/dam (3) covering the water (4) others (specify)
4.9 What is the main purpose for harvesting water? (1) irrigation (2) domestic use (3)
livestock feeding (4) others (specify)
4.10 If the water harvested is used for irrigation, what type of irrigation do you use? (1)
drip irrigation (2) sprinkler irrigation (3) furrow (4) piped-gravity flow (5) piped-
motorized pump (6) bucket (7) other (specify)
5.0 Institutions on water harvesting
5.1 Have you ever had contact with any extension service? (1) no (2) yes
5.2 If yes, which organization(s)? __________________________
5.3 Have you received any information on rain-water harvesting from any extension
group?(1) Yes (2) No
5.4 If yes, what sort of information? ___________________________
5.5 Have you been trained on how to practice rain-water harvesting by any extension
group? (1) no (2) yes
5.6 If yes, what method were you trained on? ______________________
5.7 Which of the trained method do you practice? ___________________________
5.8 Are you a member of any rain water harvesting farmers group? (1) no (2) yes
5.9 If yes, state the farmer group and its activities__________________

78
5.10 Are you satisfied with the implementations governing water harvesting groups (1)
yes (2) no.
Explain your answer____________________________________________
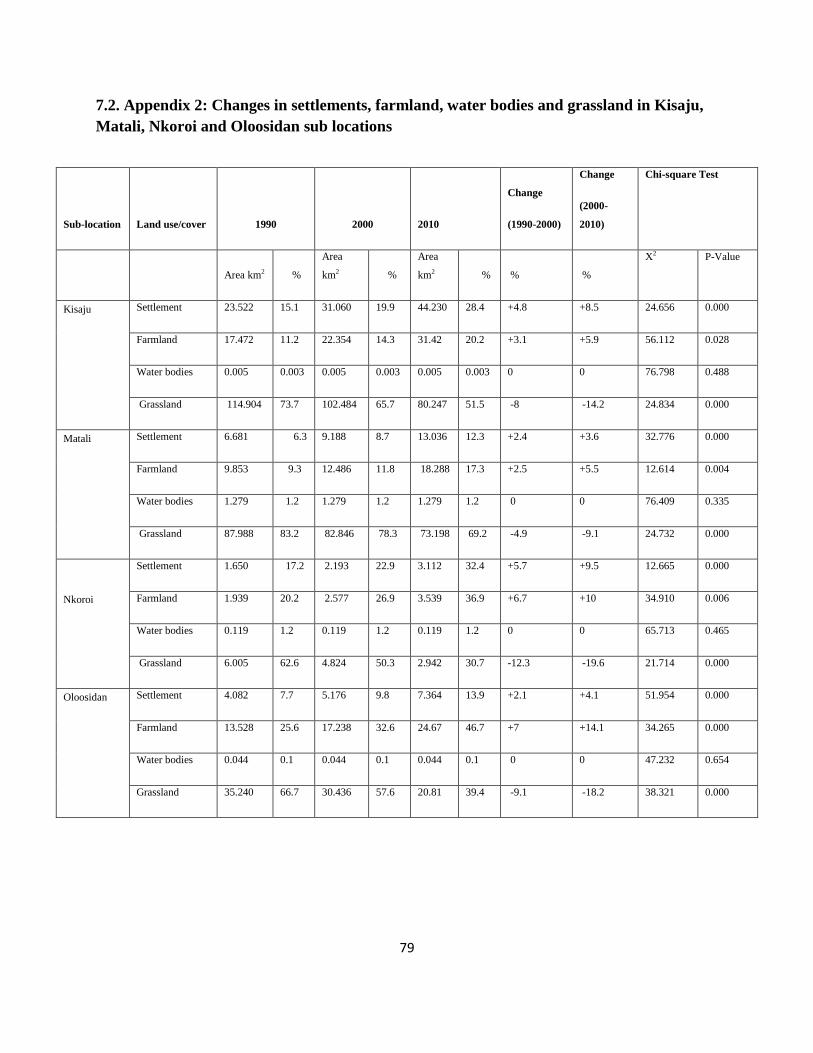
79
7.2. Appendix 2: Changes in settlements, farmland, water bodies and grassland in Kisaju,
Matali, Nkoroi and Oloosidan sub locations
Sub-location Land use/cover 1990 2000 2010
Change
(1990-2000)
Change
(2000-
2010)
Chi-square Test
Area km2 %
Area
km2 %
Area
km2 % % %
X2 P-Value
Kisaju
Settlement 23.522 15.1 31.060 19.9 44.230 28.4 +4.8 +8.5 24.656 0.000
Farmland 17.472 11.2 22.354 14.3 31.42 20.2 +3.1 +5.9 56.112 0.028
Water bodies 0.005 0.003 0.005 0.003 0.005 0.003 0 0 76.798 0.488
Grassland 114.904 73.7 102.484 65.7 80.247 51.5 -8 -14.2 24.834 0.000
Matali
Settlement 6.681 6.3 9.188 8.7 13.036 12.3 +2.4 +3.6 32.776 0.000
Farmland 9.853 9.3 12.486 11.8 18.288 17.3 +2.5 +5.5 12.614 0.004
Water bodies 1.279 1.2 1.279 1.2 1.279 1.2 0 0 76.409 0.335
Grassland 87.988 83.2 82.846 78.3 73.198 69.2 -4.9 -9.1 24.732 0.000
Nkoroi
Settlement 1.650 17.2 2.193 22.9 3.112 32.4 +5.7 +9.5 12.665 0.000
Farmland 1.939 20.2 2.577 26.9 3.539 36.9 +6.7 +10 34.910 0.006
Water bodies 0.119 1.2 0.119 1.2 0.119 1.2 0 0 65.713 0.465
Grassland 6.005 62.6 4.824 50.3 2.942 30.7 -12.3 -19.6 21.714 0.000
Oloosidan
Settlement 4.082 7.7 5.176 9.8 7.364 13.9 +2.1 +4.1 51.954 0.000
Farmland 13.528 25.6 17.238 32.6 24.67 46.7 +7 +14.1 34.265 0.000
Water bodies 0.044 0.1 0.044 0.1 0.044 0.1 0 0 47.232 0.654
Grassland 35.240 66.7 30.436 57.6 20.81 39.4 -9.1 -18.2 38.321 0.000
Related Documents