Ecological Indicators 45 (2014) 692–703 Contents lists available at ScienceDirect Ecological Indicators jo ur nal ho me page: www.elsevier.com/locate/ ecolind Land management implications for ecosystem services in a South African rangeland Katalin Petz a,∗ , Julia Glenday b,c , Rob Alkemade a,d a PBL Netherlands Environmental Assessment Agency, P.O. Box 303, 3720 AH Bilthoven, The Netherlands b Bren School of Environmental Science and Management, University of California Santa Barbara, 400 Bren Hall, Santa Barbara, CA 93106-5131, USA c Living Lands, P.O. Box 237, Patensie 6335, South Africa d Environmental Systems Analysis Group, Wageningen University, P.O. Box 47, 6700 AA Wageningen, The Netherlands a r t i c l e i n f o Article history: Received 2 November 2013 Received in revised form 19 May 2014 Accepted 21 May 2014 Keywords: GIS Mapping Ecosystem degradation Thicket restoration Scenario Environmental decision-making a b s t r a c t In South Africa, restoration and sustainable management of historically overgrazed and degraded range- lands are promoted to increase biodiversity and ecosystem service provision. This study evaluates different land management scenarios in terms of ecosystem services in a South African rangeland, the Baviaanskloof catchment. As measured data were limited, we used simple models to quantify and map the effect of the different combination of agricultural, nature conservation and restoration practices on multiple ecosystem services. The land management scenarios were evaluated against management tar- gets set for individual ecosystem services. Results highlight how the provision of ecosystem services is related to land management as unmanaged, pristine ecosystems provide a different mix of ecosystem services than ecosystems recently restored or managed as grazing lands. Results also indicate that histor- ically overgrazed lands provide no forage, may retain 40% less sediment and have 38% lower biodiversity, while providing 60% more fuel wood and supplying two and half times more water (i.e. retaining less water), than pristine or restored lands. We conclude that a combination of light grazing, low input agri- culture, nature conservation and restoration is the best for the sufficient provision of multiple ecosystem services. Applying such mixed management would improve biodiversity, ecotourism and maintain forage production and regulating services on farmers’ land. This management option also fits into and further optimizes local decision-makers’ vision regarding the future management of the area. © 2014 Elsevier Ltd. All rights reserved. 1. Introduction Land conversion and intensification are major drivers of ecosys- tem degradation, biodiversity loss and ecosystem services (ESs) depletion (Nelson and Daily, 2010; Pereira et al., 2010). The increas- ing international concern about biodiversity loss and ES depletion resulted in the inclusion of ESs in the 2020 Aichi targets set by the Convention on Biological Diversity (Larigauderie et al., 2012). In South Africa, land conversion and overgrazing related to pastoralism impaired biodiversity and ESs, such as long-term forage production and water supply (van Jaarsveld et al., 2005; Palmer et al., 2006; Le Maitre et al., 2007). Recently targeted gov- ernmental environmental programmes have been established to support ecosystem restoration, sustainable land management and ∗ Corresponding author. Tel.: +31 611738467. E-mail addresses: [email protected], [email protected] (K. Petz), [email protected] (J. Glenday), [email protected] (R. Alkemade). livelihood improvement (Milton et al., 2003). The Baviaanskloof catchment was chosen as a watershed-scale example of how policy and management changes could impact ES provision. Like much of Southern Africa, the Baviaanskloof catchment is a relatively data-poor environment. A few plot-scale studies have been performed on the quantitative effects of vegetation degradation on hydrological and ecological processes in the larger region (e.g. van Luijk et al. (2013), Mills and Cowling (2006) and Lechmere-Oertel et al. (2005a)), but there has been little quantita- tive monitoring of most ecosystem processes and functions. In such a setting, information on ESs derived from maps and models can improve land management decision-making. In South Africa some ESs have been mapped and modelled using proxies that relate to land cover and land use (e.g. Egoh et al. (2010) and Reyers et al. (2009)). The combination of different land management practices, their impacts on the resulting land cover and ESs, and the effect of potential future management changes have been less studied in the region. In general, the consequences of alternative land use and land management options for a broader range of ESs are poorly http://dx.doi.org/10.1016/j.ecolind.2014.05.023 1470-160X/© 2014 Elsevier Ltd. All rights reserved.

Welcome message from author
This document is posted to help you gain knowledge. Please leave a comment to let me know what you think about it! Share it to your friends and learn new things together.
Transcript

LA
Ka
b
c
d
a
ARRA
KGMETSE
1
tdirb2tfPes
j
h1
Ecological Indicators 45 (2014) 692–703
Contents lists available at ScienceDirect
Ecological Indicators
jo ur nal ho me page: www.elsev ier .com/ locate / ecol ind
and management implications for ecosystem services in a Southfrican rangeland
atalin Petza,∗, Julia Glendayb,c, Rob Alkemadea,d
PBL Netherlands Environmental Assessment Agency, P.O. Box 303, 3720 AH Bilthoven, The NetherlandsBren School of Environmental Science and Management, University of California Santa Barbara, 400 Bren Hall, Santa Barbara, CA 93106-5131, USALiving Lands, P.O. Box 237, Patensie 6335, South AfricaEnvironmental Systems Analysis Group, Wageningen University, P.O. Box 47, 6700 AA Wageningen, The Netherlands
r t i c l e i n f o
rticle history:eceived 2 November 2013eceived in revised form 19 May 2014ccepted 21 May 2014
eywords:ISapping
cosystem degradationhicket restorationcenarionvironmental decision-making
a b s t r a c t
In South Africa, restoration and sustainable management of historically overgrazed and degraded range-lands are promoted to increase biodiversity and ecosystem service provision. This study evaluatesdifferent land management scenarios in terms of ecosystem services in a South African rangeland, theBaviaanskloof catchment. As measured data were limited, we used simple models to quantify and mapthe effect of the different combination of agricultural, nature conservation and restoration practices onmultiple ecosystem services. The land management scenarios were evaluated against management tar-gets set for individual ecosystem services. Results highlight how the provision of ecosystem services isrelated to land management as unmanaged, pristine ecosystems provide a different mix of ecosystemservices than ecosystems recently restored or managed as grazing lands. Results also indicate that histor-ically overgrazed lands provide no forage, may retain 40% less sediment and have 38% lower biodiversity,while providing 60% more fuel wood and supplying two and half times more water (i.e. retaining less
water), than pristine or restored lands. We conclude that a combination of light grazing, low input agri-culture, nature conservation and restoration is the best for the sufficient provision of multiple ecosystemservices. Applying such mixed management would improve biodiversity, ecotourism and maintain forageproduction and regulating services on farmers’ land. This management option also fits into and furtheroptimizes local decision-makers’ vision regarding the future management of the area.© 2014 Elsevier Ltd. All rights reserved.
. Introduction
Land conversion and intensification are major drivers of ecosys-em degradation, biodiversity loss and ecosystem services (ESs)epletion (Nelson and Daily, 2010; Pereira et al., 2010). The increas-
ng international concern about biodiversity loss and ES depletionesulted in the inclusion of ESs in the 2020 Aichi targets sety the Convention on Biological Diversity (Larigauderie et al.,012). In South Africa, land conversion and overgrazing relatedo pastoralism impaired biodiversity and ESs, such as long-termorage production and water supply (van Jaarsveld et al., 2005;
almer et al., 2006; Le Maitre et al., 2007). Recently targeted gov-rnmental environmental programmes have been established toupport ecosystem restoration, sustainable land management and∗ Corresponding author. Tel.: +31 611738467.E-mail addresses: [email protected], [email protected] (K. Petz),
[email protected] (J. Glenday), [email protected] (R. Alkemade).
ttp://dx.doi.org/10.1016/j.ecolind.2014.05.023470-160X/© 2014 Elsevier Ltd. All rights reserved.
livelihood improvement (Milton et al., 2003). The Baviaanskloofcatchment was chosen as a watershed-scale example of how policyand management changes could impact ES provision.
Like much of Southern Africa, the Baviaanskloof catchmentis a relatively data-poor environment. A few plot-scale studieshave been performed on the quantitative effects of vegetationdegradation on hydrological and ecological processes in the largerregion (e.g. van Luijk et al. (2013), Mills and Cowling (2006) andLechmere-Oertel et al. (2005a)), but there has been little quantita-tive monitoring of most ecosystem processes and functions. In sucha setting, information on ESs derived from maps and models canimprove land management decision-making. In South Africa someESs have been mapped and modelled using proxies that relate toland cover and land use (e.g. Egoh et al. (2010) and Reyers et al.(2009)). The combination of different land management practices,
their impacts on the resulting land cover and ESs, and the effectof potential future management changes have been less studiedin the region. In general, the consequences of alternative land useand land management options for a broader range of ESs are poorly
Indica
qii
nBbrlwuvaiau
cblOmwi
2
2
2
els(tw2TeKE2vcoli(pstBbsoafodq2ter
It ideally involves a shift from a degraded, abandoned or low graz-ing capacity, state to a nearly pristine state. Restoration is done byre-planting the pioneer P. afra (van Eck et al., 2010). This creates
K. Petz et al. / Ecological
uantified (Carpenter et al., 2009; De Groot et al., 2010) and thentegration of multiple ESs into land use and management decisionss still missing (Ehrlich et al., 2012).
This study aims to evaluate alternative land management sce-arios by mapping and modelling multiple ESs in the South Africanaviaanskloof catchment. Land management in the area is a com-ination of multiple agricultural, nature conservation and thicketestoration practices. Ecosystem restoration and conservation areand use options to increase biodiversity and the provision of a
ide range of ESs (Benayas et al., 2009), whereas agricultural landse targets food production. These land uses can be managed witharying intensity, depending on management practices. Land man-gement refers to human activities that affect land cover directly orndirectly (van Oudenhoven et al., 2012). Land management affectslso vegetation, which can degrade as a consequence of intensivese or unwise land management (Reyers et al., 2009).
Prior to this work, future land management of the Baviaanskloofatchment was explored through stakeholder consultation. Weuild upon this, and apply scenarios to compare three alternative
and management options that reflect stakeholders’ preferences.ur study visualizes the spatial distribution of ESs, evaluates landanagement scenarios against targets set for these ES, and verifieshether the land management scenario preferred by stakeholders
s also the most optimal in terms of ESs provision.
. Methods
.1. Study area: the Baviaanskloof catchment
.1.1. GeographyThe Baviaanskloof catchment (ca. 123,000 ha) is located in East-
rn Cape, in South Africa (Fig. 1). The semi-arid catchment receivesow and erratic precipitation in two annual rainfall peaks. Water iscarce and the recurring droughts are often followed by flood eventsJansen, 2008). The Baviaanskloof River runs west to east betweenwo parallel mountain ranges. It feeds the Kouga Dam and suppliesater to downstream cities, including Port Elizabeth (van Eck et al.,
010). An unpaved road along the river provides access to the area.he catchment is home to a proportions of seven of South Africa’sight biomes (Fynbos, Subtropical Thicket, Nama-karroo, Succulentaroo, Grassland, Savanna and Forest), and is part of one of thearth’s biodiversity hotspots, the Cape Floral Kingdom (Boshoff,005; Crane, 2006). Savanna and grassland vegetation cover thealley-bottom and thicket shrubland and transitional vegetationover the lower slopes (Fig. 1). The catchment has a high diversityf Albany subtropical thicket dominated by the succulent Portu-
acaria afra (‘Spekboom’) (Boshoff, 2005). The montane vegetations composed of fynbos, evergreen small-leafed shrub vegetationFig. 1). This vegetation is (nearly) pristine. Most of the fynbos andarts of the thicket and grassland are protected under the Baviaan-kloof Nature Reserve (van Eck et al., 2010). The catchment is homeo protected (endemic) animal species (e.g. Cape mountain zebra,lack rhino, Cape leopard) (Boshoff, 2005). The area is popular for itseautiful scenery and wildlife, watched from the road. The Baviaan-kloof Nature Reserve receives about 45,600 tourists and the restf the catchment receives a further 10,000–12,000 tourists annu-lly (Powell and Mander, 2009). This highly diverse catchment isacing pressures of land conversion and degradation. In historicallyvergrazed areas vegetation cover has been degraded and speciesiversity reduced, soil eroded and carbon stocks, and soil and wateruality have declined (Lechmere-Oertel et al., 2005b; Mills et al.,
005). Most degraded vegetation is in the valley-bottom and onhe lower slopes which are thicket dominated. Conservation inter-sts emphasize sustainable utilization of biodiversity and thicketestoration, since the area became an UNESCO World Heritagetors 45 (2014) 692–703 693
Site (2004) (van Eck et al., 2010). Governmental land managementprogrammes and some local stakeholders aim to facilitate thicketrestoration and livelihood improvement (van Eck et al., 2010).
2.1.2. StakeholdersStakeholders include local communities, farmers, non-
governmental (e.g. Living Lands1) and governmental organizations(Eastern Cape Parks and Tourism Agency2), and scientists. About62% of the area belongs to the government and 36% of the areabelongs to a few large-scale farmers. Local communities sharethe remaining land (Powell and Mander, 2009). Governmentallands form the Baviaanskloof Nature Reserve, managed by theEastern Cape Parks and Tourism Agency. The reserve is locatedon the higher slopes and mountaintops. Farmed lands are locatedon the valley-bottom and lower slopes. In these areas, vegetationis mostly degraded and is partly converted to cropland. Farmers’main income is derived from animal and crop production and fromtourism (Crane, 2006). Local communities live in three villagesand share small patches of communal lands in the valley-bottom.They are highly dependent on local natural resources (wild food,fuel wood, medicinal plants, construction material, etc.), but boththeir resource access and income sources are limited. About 95% ofthe local households extract or collect natural resources, even if itis mostly restricted or prohibited (Rhodes University Consortium,2007). The unemployment rate is high and many inhabitants obtainsocial security grants (Crane, 2006). The number of permanentresidents is estimated to be 1000 people (Crane, 2006) in 463households (CSIR Satellite Application Centre, 2010).
2.1.3. Land managementThe main land uses in the Baviaanskloof catchment are agri-
culture, nature conservation, and thicket restoration. A part of theland is abandoned and not managed. The intensity of land use isrelated to crop choice, irrigation, animal choice, animal densityand tourism infrastructure. Farmers set up hiking trails and touristaccommodation on their private lands to improve tourism. Agricul-ture, land abandonment and thicket restoration occur on farmers’private land. Management aimed at nature conservation occurs onall governmental lands and on some private lands.
Agriculture includes crop, livestock and game farming. Cropsvary from farming maize as an annual crop in intensively used irri-gated fields to perennial crops in non-irrigated orchards (olives,nuts) (Jansen, 2008). Livestock grazing is conventional with goat,sheep, cattle and ostrich production in fenced areas. Game farmingis the raising of indigenous wildlife species, such as kudu (Tragela-phus strepsiceros), for tourism, sale or hunting.
Unmanaged lands are degraded private lands formerly used foragriculture, but not farmed at present.
Most formal nature conservation takes place in the Baviaan-skloof Nature Reserve. Herbivores (Cape mountain zebra, Blackrhino and Buffalo) were reintroduced in the reserve as part of con-servation management (Powell and Mander, 2009). The (illegal)extraction of wood and other plant materials is a threat to con-servation (Rhodes University Consortium, 2007). Conservation onprivate land means adopting wildlife-friendly management andremoving fences for economic incentives. A voluntary agreementbetween Eastern Cape Parks and Tourism Agency and farmers facil-itates the implementation of these arrangements (Crane, 2006).
Thicket restoration is a transitional land use on farmers’ land.
1 http://www.earthcollective.net/livinglands/.2 http://www.ectourism.co.za/.

694 K. Petz et al. / Ecological Indicators 45 (2014) 692–703
aviaaS (2006
aii(
cTi
2
miE
Fig. 1. Location and original vegetation of the Bource: Map adopted from Crane (2006), vegetation map insert from Euston-Brown
monoculture at first, but stimulates the ecosystem’s recovery,ncreases carbon sequestration, species diversity and soil fertil-ty, reduces erosion and improves water quality in the long term.Lechmere-Oertel et al., 2005a; Mills and Cowling, 2006).
Currently, the area is dominated by livestock, game and annualrop farming, unmanaged land and formal nature conservation.he other land management types are marginal, but may becomemportant in the future (Fig. 2).
.2. Land management mapping and scenario development
Prior to this study, stakeholders explored future land use andanagement possibilities. The Living Lands organization facilitated
nterviews and workshops with the farmers, representatives of theastern Cape Parks and Tourism Agency and scientists (Stokhof de
Fig. 2. Land management under current situation (a), and for future scenarios o
nskloof Catchment, Eastern Cape, South Africa.).
Jong, 2013). These stakeholders developed three land managementscenarios, the Diversity of Farming (DoF), Living with Nature (LwN)and Room for Nature (RfN), with a vision for the year 2040. Thescenarios were restricted to farmers’ lands and no changes wereexpected on governmental lands.
The DoF scenario reflects the farmers’ preferences for agricul-ture and related tourism. It is characterized by livestock, game andannual crop farming and partial thicket restoration. Large partsof the land remain unmanaged. The LwN scenario is a compro-mise between agriculture, restoration and nature conservation.It is dominated by game and perennial crop farming. Thicket is
completely restored. Livestock grazing and unmanaged lands arereduced. The RfN scenario reflects the Eastern Cape Parks andTourism Agency’s preference for extended restoration and natureconservation. Under this scenario, nature conservation dominates,f Diversity of Farming (b), Living with Nature (c) and Room for Nature (d).
K. Petz et al. / Ecological Indicators 45 (2014) 692–703 695
cenarS
tduntd
pWlomdbtaststn((m
2
dmteeWolydw
2
a
vegetation and land use types, topography and legal accessibility.Annual yield is a product of the biomass (kg/ha) of wood stemswith preferred size for collection and the annual increment. As nolocal data were available, measured biomass data were taken from
Table 1Reclassification of vegetation degradation levels to veld condition scores based onpre-established veld condition categories and corresponding veld condition scores(for data source see Appendix).
Pre-established veld conditioncategories and corresponding veldcondition scores (%)
Reclassification of degradationlevels to veld condition scores
Critical 0–25% Severelydegraded
10%
Poor 25–50% Moderatelydegraded
30%
Lightly 50%
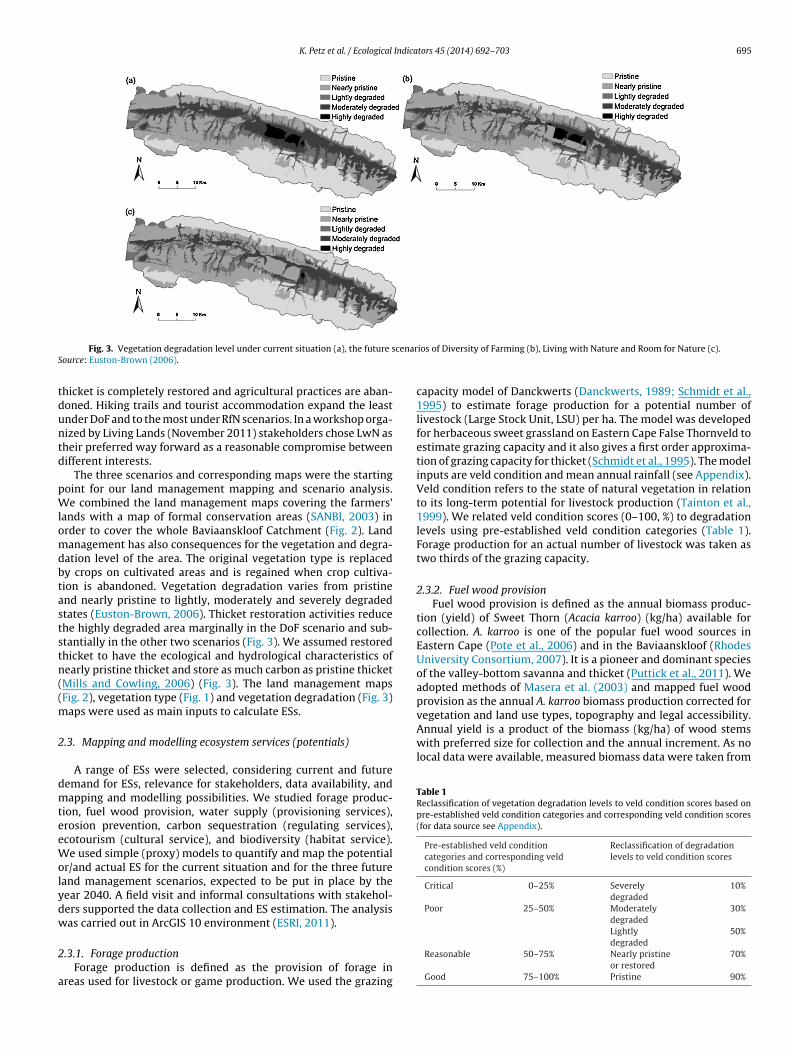
Fig. 3. Vegetation degradation level under current situation (a), the future source: Euston-Brown (2006).
hicket is completely restored and agricultural practices are aban-oned. Hiking trails and tourist accommodation expand the leastnder DoF and to the most under RfN scenarios. In a workshop orga-ized by Living Lands (November 2011) stakeholders chose LwN asheir preferred way forward as a reasonable compromise betweenifferent interests.
The three scenarios and corresponding maps were the startingoint for our land management mapping and scenario analysis.e combined the land management maps covering the farmers’
ands with a map of formal conservation areas (SANBI, 2003) inrder to cover the whole Baviaanskloof Catchment (Fig. 2). Landanagement has also consequences for the vegetation and degra-
ation level of the area. The original vegetation type is replacedy crops on cultivated areas and is regained when crop cultiva-ion is abandoned. Vegetation degradation varies from pristinend nearly pristine to lightly, moderately and severely degradedtates (Euston-Brown, 2006). Thicket restoration activities reducehe highly degraded area marginally in the DoF scenario and sub-tantially in the other two scenarios (Fig. 3). We assumed restoredhicket to have the ecological and hydrological characteristics ofearly pristine thicket and store as much carbon as pristine thicketMills and Cowling, 2006) (Fig. 3). The land management mapsFig. 2), vegetation type (Fig. 1) and vegetation degradation (Fig. 3)
aps were used as main inputs to calculate ESs.
.3. Mapping and modelling ecosystem services (potentials)
A range of ESs were selected, considering current and futureemand for ESs, relevance for stakeholders, data availability, andapping and modelling possibilities. We studied forage produc-
ion, fuel wood provision, water supply (provisioning services),rosion prevention, carbon sequestration (regulating services),cotourism (cultural service), and biodiversity (habitat service).e used simple (proxy) models to quantify and map the potential
r/and actual ES for the current situation and for the three futureand management scenarios, expected to be put in place by theear 2040. A field visit and informal consultations with stakehol-ers supported the data collection and ES estimation. The analysisas carried out in ArcGIS 10 environment (ESRI, 2011).
.3.1. Forage productionForage production is defined as the provision of forage in
reas used for livestock or game production. We used the grazing
ios of Diversity of Farming (b), Living with Nature and Room for Nature (c).
capacity model of Danckwerts (Danckwerts, 1989; Schmidt et al.,1995) to estimate forage production for a potential number oflivestock (Large Stock Unit, LSU) per ha. The model was developedfor herbaceous sweet grassland on Eastern Cape False Thornveld toestimate grazing capacity and it also gives a first order approxima-tion of grazing capacity for thicket (Schmidt et al., 1995). The modelinputs are veld condition and mean annual rainfall (see Appendix).Veld condition refers to the state of natural vegetation in relationto its long-term potential for livestock production (Tainton et al.,1999). We related veld condition scores (0–100, %) to degradationlevels using pre-established veld condition categories (Table 1).Forage production for an actual number of livestock was taken astwo thirds of the grazing capacity.
2.3.2. Fuel wood provisionFuel wood provision is defined as the annual biomass produc-
tion (yield) of Sweet Thorn (Acacia karroo) (kg/ha) available forcollection. A. karroo is one of the popular fuel wood sources inEastern Cape (Pote et al., 2006) and in the Baviaanskloof (RhodesUniversity Consortium, 2007). It is a pioneer and dominant speciesof the valley-bottom savanna and thicket (Puttick et al., 2011). Weadopted methods of Masera et al. (2003) and mapped fuel woodprovision as the annual A. karroo biomass production corrected for
degradedReasonable 50–75% Nearly pristine
or restored70%
Good 75–100% Pristine 90%

6 Indica
aA
oA(mgnWscT
2
a(edadtudlfWblpiafipb(tev
2
t2uremsotteewvdogTu
2
P
lages, and (4) fragmentation. Land cover/use change effects werebased on Alkemade et al. (2009, 2012) and were extended to veg-etation degradation levels (Table 2). Background information on
96 K. Petz et al. / Ecological
nearby thicket-dominated region, based on Pote et al. (2006).nnual increment was taken as 4% after Banks et al. (1996).
A. karroo can dominate the overgrazed and degraded formsf thicket (Puttick et al., 2011). Therefore, we assigned higher. karroo biomass stock to degraded than to non-degraded landspristine = 400 kg/ha, nearly pristine = 700, lightly degraded = 1000,
oderately degraded = 1200, severely degraded = 1600). A. karroorowth decreases on slopes (Pote et al., 2006). Therefore, we relatedegatively the biomass stock range (400–1600 kg/ha) to the slope.e averaged the biomass stock values adjusted to degradation and
lope, for each cell. No wood collection is allowed in formal natureonservation areas, and A. karroo does not occur on cultivated areas.hese areas were therefore excluded.
.3.3. Water supplyWater supply was estimated using the long-term average
nnual water yield (m3) as an indicator. We used the InVEST toolKareiva et al., 2011) to quantify and map water yield using veg-tation and hydrological data. Water yield is calculated as theifference between precipitation and actual evapotranspirations an annual average. The model assumes that all water pro-uced in a watershed in excess of evapotranspiration arrives athe watershed outlet and supplies direct benefits to downstreamsers (Kareiva et al., 2011). Data on vegetation characteristics (rootepth, plant evaporation coefficient) were obtained from a hydro-
ogical modelling database (ACRU) updated for the Baviaanskloofor vegetation types and degradation levels (Mander et al., 2010b).
e assumed moderate grazing, under which 40% of the forageiomass is grazed (Holechek et al., 1999; Palmer et al., 2006). A
inear relationship between grazed biomass and the evapotrans-iration coefficient was assumed. Due to the lack of quantitative
nformation, we assumed no difference between livestock farmingnd game farming. We assigned a higher evapotranspiration coef-cient and a smaller root depth value to irrigated maize than toerennial orchards. Maximum root depth was interpolated fromiome-specific data of Tallis et al. (2011) and Canadell et al. (1996)for fynbos, grassland and savannah 2600 mm, for transitional andhicket 5100 mm, for forest 7000 mm was taken). For detailed mod-lling methodology see Tallis et al. (2011) and for input data onegetation and hydrology see Appendix.
.3.4. Erosion preventionErosion prevention is defined as the annual sediment reten-
ion by vegetation (t/ha). We used the InVEST tool (Kareiva et al.,011) to quantify and map sediment retention. The model is builtpon the Universal Soil Loss Equation and it calculates sedimentetention as the difference between the soil loss under current veg-tation cover and an estimate for bare soil. For detailed modellingethodology see Tallis et al. (2011) and for input data on rainfall,
oil, topography and vegetation see Appendix. Data on the effectf the crop and management practices for different vegetationypes and degradation levels on erosion rates were obtained fromhe ACRU model database adapted for the Baviaanskloof (Mandert al., 2010b). No additional management practices were consid-red to reduce erosion. Parameters for sediment retention factorere derived from Tallis et al. (2011) ((nearly) pristine natural
egetation = 100, lightly and moderately degraded = 50, severelyegraded = 10, cultivated = 60). Furthermore, similarly to the evap-ration coefficient, we assumed a linear relationship between therazed biomass and the sediment retention capacity of vegetation.hus we considered a 40% decrease in sediment retention capacitynder grazing.
.3.5. Carbon sequestrationCarbon sequestration considered here is that sequestered by
. afra-dominated thicket. Although other local vegetation types
tors 45 (2014) 692–703
also store carbon (Reyers et al., 2009; Mills et al., 2012), P. afra-dominated thicket is the main vegetation type which undergoesrestoration, and for which local data are available. Similarly toEgoh et al. (2010) and Reyers et al. (2009) we calculated carbonstorage in the vegetation, including in above- and belowgroundbiomass, soil and litter. The estimated change in carbon stocksbetween the current and the future situation was considered asthe carbon sequestration or depletion. A thicket-specific degrada-tion map was used (Powell et al., 2011) and locally measured carbonstock (Powell, 2009) was extrapolated and mapped for moderately-severely degraded (30.50 ± 2.05 t/ha), and (nearly) pristine-lightlydegraded (87.73 ± 6.51 t/ha) areas. Total carbon storage is the prod-uct of the mean carbon storage corresponding to the degradationlevel and the area, summed for the catchment. Completely restoredthicket stores as much carbon as pristine thicket (Mills and Cowling,2006). Degraded thicket that does not undergo restoration wasassumed not to sequester any net additional carbon (Lechmere-Oertel et al., 2005a).
2.3.6. EcotourismAttractive scenery, high accessibility and high diversity of
wildlife are among the strongest motives for tourists to visit anarea in South Africa (Milton et al., 2003; Lindsey et al., 2007; Reyerset al., 2009). We measured ecotourism, by combining the visibilityof the scenery, accessibility and wildlife diversity in an ‘ecotouristicsuitability’ index (0–100, %). Scenery was mapped as areas visiblefrom roads, hiking trails and tourist accommodation sites by cre-ating a viewshed as described by Reyers et al. (2009) and O’Farrellet al. (2010). The highest value (90) was attributed to areas visibleboth from roads/hiking trails and accommodation sites, a mediumvalue (50) was attributed to areas only visible from roads/hikingtrails and the lowest value (10) was attributed to non-visible areas.Accessibility was calculated by taking a buffer of 1000 m alongthe road and settlements. Within this buffer, a linear increase inaccessibility with decreasing distance to the road or settlementswas calculated after Chan et al. (2006). The number of wild ani-mals and hence the suitability of ecotourism increases with habitatprotection (Milton et al., 2003; Lindsey et al., 2007). Therefore, weincreased the value of ecotouristic suitability slightly more on con-servation areas (value * 1.5) than on game farms (value * 1.2). Thusecotouristic suitability was calculated by combining the scenerymap with the accessibility map and weighing the results with thewildlife value map.
2.3.7. BiodiversityAlthough land conversion, livestock grazing and vegetation
degradation have large negative impact on biodiversity in SouthAfrica (Lechmere-Oertel et al., 2005b; Scholes and Biggs, 2005;Biggs et al., 2008), local data on species occurrence and abundanceare rarely available outside the protected areas (e.g. Subtropi-cal Thicket Ecosystem Project3). Therefore we used the GLOBIO3global biodiversity modelling framework (Alkemade et al., 2009)to quantify the changes biodiversity as a result of changing landmanagement. GLOBIO3 uses the Mean Species Abundance index(MSA, 0–1) in relation to multiple human pressures (Alkemade et al.(2009, 2012) and http://www.globio.info/). We calculated impactsof four land management-related pressures: (1) land cover/usechange, (2) proximity of roads, (3) proximity of croplands and vil-
road, agriculture and urban impacts is described in Benítez-López
3 http://www.bgis.sanbi.org/STEP/project.asp.

K. Petz et al. / Ecological Indicators 45 (2014) 692–703 697
Table 2Mean Species Abundance (MSA, 0–1) estimated for land use types and intensitiesand degradation levels in the Baviaanskloof catchment. Values are based on MSAvalues for land use classes from Alkemade et al. (2009, 2012). For unmanaged landsvegetation types and corresponding degradation levels were used.
MSA valuesBaviaan-skloof
Land useintensitiesaccording toGLOBIO3 (MSAvalue)
Vegetationand landuse type
Vegetation degradationlevel (according toEuston-Brown (2006))
1.0 primary forest (1.0) Forest (nearly) pristine1.0 primary grass-or
scrublands (1.0)Fynbos (nearly) pristine
-lightly degraded1.0 natural rangeland
(1.0)Grassland (nearly) pristine
1.0 primary grass-orscrublands (1.0)
Savanna lightly degraded
0.7 ungrazedabandonedrangelands (0.7)
moderately degraded
1.0 natural rangeland(1.0)
Thicket (nearly) pristine
0.7 ungrazedabandonedrangelands (0.7)
moderately-severelydegraded
1.0 primary grass-orscrublands (1.0)
Transitional (nearly) pristine-lightlydegraded
0.7 moderately degraded0.1 intensive irrigated
agriculture (0.1)Irrigatedagriculture
–
0.6 moderately usedrangeland (0.6)
Game farm (nearly) pristine-lightly degraded
0.5 intensively usedrangeland (0.5)
moderately/severelydegraded
0.6 moderately usedrangeland (0.6)
Livestockgrazing
(nearly) pristine
0.5 intensively usedrangeland (0.5)
moderately/severelydegraded
0.3 low inputagriculture (0.3)
Non-irrigatedorchard
–
1.0 natural rangeland(1.0)
Restoredthicket
(nearly) pristine
1.0 natural rangeland(1.0)
Privateconserva-tionland
restored
0.7 ungrazed non-restored
et1Fowsa
2
calwcum
i
Table 3Management targets based on the catchment management plan (PRESENCE, unpub-lished report 2011) used for ES evaluation under scenarios.
Ecosystem service Management target to evaluate scenarios (year2040)
Forage production Sustainable agriculture translated to min. 500LSU on (nearly) pristine/restored grazing landa
Fuel wood provision Meeting local fuel wood demand: About2200 t/year
Water supply Increased water supply compared to currentsituation
Erosion prevention Erosion reduction compared to currentsituation
Carbon seq. Carbon sequestration through ‘Spekboom’planting
Ecotourism Increased ecotourism (facilities) compared tocurrent situation
Biodiversity Increased biodiversity compared to currentsituation
is degraded, the provision of fuel wood, water supply and eco-
abandonedrangelands (0.7)
t al. (2010) and distance impacts were adjusted to local condi-ions (for the impact zone of roads, annual crop farming and villages000 m was taken and of perennial crop farming 500 m was taken).ragmentation effect is based on the minimum area requirementf animal species (Alkemade et al., 2009). The biodiversity mapas created by overlaying (multiplying values in) the four pres-
ure maps. The multiplication implies a synergistic rather than andditive effect.
.4. Ecosystem services quantification and scenario analysis
First, ESs were quantified for land management practices. Wealculated mean per ha ES value for each land management typend corresponding vegetation degradation level. For this, currentand management, vegetation degradation and derived ES maps
ere overlaid. Since perennial crop farming, thicket restoration andonservation on private land are not present under the current sit-ation, for these land management types the LwN and RfN scenario
aps and corresponding ESs maps were used.Next, we compared future scenarios to current managementn terms of ESs provision in the whole catchment. Each ES was
a Meaning minimal 10,000 ha (nearly) pristine or restored non-fragmented graz-ing land with a grazing capacity of min. 0.05 LSU/ha (GIS Unit Department ofAgriculture, 2004)
aggregated for the catchment, except for ecotourism and biodiver-sity indices. For these mean values were calculated.
Finally, ESs were compared to management targets to evalu-ate the scenarios and stakeholders’ land management choice. Weused the catchment management plan compiled by Living Lands(PRESENCE, unpublished report 2011) to identify target for each ES(Table 3). If an ES target is met, the scenario is considered to providean ES sufficiently. For fuel wood provision no target was foundtherefore we used local demand. It is a product of household num-bers (463, (CSIR Satellite Application Centre, 2010)), percentage ofhouseholds collecting fuel wood (90%) and annual fuel wood con-sumption per household (5362 kg, (Rhodes University Consortium,2007)).
3. Results
3.1. Distribution of ecosystem services under current landmanagement
Results show that, in general, valley-bottom and the lowerslopes (i.e. farmers’ lands) provide ESs at higher rate compared tothe mountaintops (i.e. governmental lands), except for biodiver-sity (Fig. 4). Slopes provide more forage than the valley-bottom,for fuel wood it is the opposite. The potential for ecotourism andcarbon storage was estimated to be the highest in the valley, onthe mountain slopes, and in conservation areas. The whole catch-ment supplies water and retains sediment. Most water is providedat higher altitudes with greatest rainfall and on grazed lands.The pattern of sediment retention follows the topography. Mod-elled biodiversity intactness is lowest on degraded or annual cropfarming lands at lower altitudes; and highest on (nearly) pristineconservation areas at higher altitudes.
3.2. Ecosystem services quantified for land management types
ES values vary across land management types and vegetationdegradation levels. Historically overgrazed (i.e. moderately andseverely degraded) areas may provide approximately two and halftimes more water and 60% more fuel wood; while retaining 40%less sediment and having 38% lower biodiversity, than pristinelands (Table 4). In historically overgrazed areas, where vegetation
tourism is higher, while the provision of other ESs is lower thanin pristine areas. This is the direct result of the vegetation degra-dation or the indirect result of the spatial distribution of degraded

698 K. Petz et al. / Ecological Indicators 45 (2014) 692–703
F roducc
lploat
vtatvt
fdhpsaabp
ig. 4. Ecosystem services (potentials) under current land management: forage parbon sequestration (e), ecotourism (f), and biodiversity (g).
ands. There is a trade-off between forage production and fuel woodrovision, as the A. karroo-dominated thicket supports hardly any
ivestock. Because of their proximity to roads and the presencef tourism infrastructure, the historically overgrazed lands have
higher potential for ecotourism (suitability 0.42 on average) thanhe remote pristine areas (suitability 0.24 on average).
Grazed lands were predicted to supply more water, than culti-ated and non-managed areas. This is a function of lower rainfall athe valley-bottom and lower vegetation density and consequently
higher runoff in grazed areas. Crop cultivation areas provide lit-le water and retain little sediment, since they are located in thealley-bottom. Ecotourism and biodiversity appear to be higher inhe perennial crop farming than under annual crop farming areas.
Private conservation lands, restored thicket and perennial croparming areas were predicted to be the best for tourism. This isue to the increased numbers of wild animals, tourist facilities origh accessibility. Non-grazed, restored, or (nearly) pristine landsrovide highest biodiversity and forage, prevent most erosion andtore most carbon. Formal and private nature conservation areasnd unmanaged lands have the highest MSA (0.89 on average),
nd crop farms have lowest MSA value (0.17 on average), followedy grazed lands (0.53 on average). Unmanaged, degraded landsrovide no forage, but provide fuel wood, water and biodiversity,tion (a), fuel wood provision (b), water supply (c), erosion prevention (d), thicket
reduce erosion, and are potential areas for ecotourism. ESs do notdepend only on land management type and degradation, but alsoon other biophysical, geographical and management aspects (e.g.topography and infrastructure). This is reflected in the results.
3.3. Scenario analysis and evaluation
In all scenarios, model results indicate that additional carbon issequestered and slightly less fuel wood is provided (Table 5), as aresult of the projected thicket restoration. Most forage and wateris provided under LwN scenario due to a decrease of unmanagedland and the increase in game farming. These large grazed areasare likely to retain less water and impair biodiversity. The LwNscenario supports more provisioning ESs, than the other scenarios.Water supply slightly decreases under the DoF and RfN scenar-ios (Table 5). This is because the thicket restoration and reducedgrazing decreases runoff. Ecotourism and biodiversity are providedbest under the RfN scenario. Under RfN scenario, no forage is pro-duced, but slightly more sediment is retained and biodiversity andthe potential for ecotourism increase (Table 5). This is the result
of increased vegetation restoration and conservation, expansion ofhiking trail network and abandonment of agriculture. The vast areasof unmanaged land under DoF and the conservation on private landunder RfN are beneficial for biodiversity.
K. Petz et al. / Ecological Indicators 45 (2014) 692–703 699
Table 4Mean ecosystem service values for each land management type and corresponding vegetation degradation rates.
Land managementtype
Ecosystem ServicesLSU/ha)
Forageproduction(mean kg/ha)
Fuel woodprovision(mean annualyield,
Water supply(mean annualyield, m3/ha)
Erosion prevention(mean sedimentretention, t/ha)thicket, t/ha)
CarbonSequestration(mean carbonstored in
Ecotourism(meansuitability %)
Biodiversity(meanMSA)
Formal natureconservation
Pristine – – 581 320 25 0.96Nearly pristine – – 1023 278 87.7 27 0.95Lightly degr. – – 1169 286 36 0.93Moderately degr. – – 1323 284 30.5 45 0.65
Livestock grazing
Pristine 0.07 35 536 336 24 0.61Nearly pristine 0.03 42 682 297 87.7 31 0.60Lightly degr. 0.01 46 1770 341 33 0.58Moderately degr. 0.00 55 943 149 30.5 39 0.37Severely degr. 0.00 62 1432 97 36 0.42
Game farming
Pristine 0.07 35 758 384 20 0.60Nearly pristine 0.04 42 1035 243 87.7 30 0.61Lightly degr. 0.01 48 1326 177 39 0.61Moderately degr. 0.00 53 1263 210 30.5 35 0.47Severely degr. 0.00 62 1605 119 40 0.46
Unmanaged lands
Pristine – 35 401 323 24 0.96Nearly pristine – 42 846 221 87.7 21 0.93Lightly degr. – 48 1255 220 27 0.91Moderately degr. – 52 1122 242 30.5 33 0.61
Crop farmingAnnual irrigated maize – – 346 48 – 43 0.13Perennial orchard – – 334 34 – 56 0.20
Thicket restorationGrazed 0.04 45 1372 212 77 0.66Non-grazed – 43 886 203 87.7 69 0.74Pristine – 35 371 323 48 0.97
111118101
tdattotcowi
4
4
d
TEn
Private conservationNearly pristine – 42
Lightly degr. – 48
Moderately degr. – 53
Results show that all three scenarios meet most managementargets (DoF and LwN four and RfN five out of seven), but smallifferences can be recognized (Table 5). Results indicate fuel woodnd all non-provisioning services are sufficiently provided underhe RfN scenario, while forage production is sufficient only underhe LwN scenario. The DoF scenario provides fuel wood and threether non-provisioning ESs sufficiently. In general, forage produc-ion appears to be the most sensitive to the land managementhanges, followed by carbon sequestration and ecotourism. The restf the ESs show minimal relative change. The relative change in fuelood provision, water supply and especially in sediment retention
s small under all scenarios regardless of meeting the targets.
. Discussion
.1. Methodological contributions and confirmation of results
This study demonstrates how ESs can be assessed spatially in aata-scarce area, by using relatively simple methods for mapping
able 5cosystem services in the Baviaanskloof catchment, for current situation and three future
ot meet target. For targets, see Table 3.
Ecosystem service Management targets to evaluate sce
Forage production (Total Large Stock Unit,LSU)
Is there sustainable management (i.on (nearly) pristine or restored graz
Fuel wood provision (Total annual yield, t) Is local fuel wood demand met?
Water supply (Total annual yield, Mill m3) Does water supply increase?
Erosion prevention (Annual sedimentretained, Mill t)
Does erosion decrease?
Carbon sequestration (Storage, 1000 t) Does carbon storage increase (i.e. adis sequestered)?
Ecotourism (Mean suitability, %) Does ecotourism increase?
Biodiversity (Mean MSA, 0–1) Does biodiversity increase?
0 234 87.7 52 0.940 233 57 0.954 195 30.5 64 0.64
and modelling. These methods build upon the available studiesfrom other parts of South Africa, and of widely used generic modelssuch as InVEST and GLOBIO3. The resulting maps and models couldbe used to evaluate different scenarios for the area and to verifychoices of stakeholders.
The goal of mapping and modelling was to understand the spa-tial distribution of ESs and compare land management options.We emphasize that ESs should be viewed in combination andin relative terms of change rather than as single and separateservices with absolute values. The estimates ESs at any particu-lar location within the catchment are likely to be inaccurate interms of the actual ES generated because of the semi-quantitativeapproach, which includes assumptions and expert judgements, wefollowed. Nevertheless, this study does demonstrate the outcomesof land management scenarios in terms of relative magnitudes anddirections of change and the spatial variation of ESs across the
catchment, and shows where decisions could have the greatestbenefits. The methodology allowed us to integrate all avail-able information to help making decision about the future landscenarios. Results of scenario evaluation: dark grey = meets target; light grey = does
narios Land management
Current DoF LwN RfN
e. min. 500 LSUing land)?
230 211 1345 0
2400 2300 2200 2300
45.9 45.3 48.8 44.0
362 363 362 363
dition carbon 1246 1616 1784 1784
46 46 49 660.84 0.86 0.83 0.90

7 Indica
mswwsoru
4c
Acec(LpDovs
mAttpv(Apmnbso
bcacccat(Cndn
tIlri
4p
ei2p
This study represents a new regional application of the GLOBIO3model and additionally it also integrates vegetation degradationeffects in the MSA index. Prior to this study, GLOBIO3 was applied
00 K. Petz et al. / Ecological
anagement of the area. The methodology used implies variousources of uncertainty, as the data from the area were scarce. Weere however able to verify some outcomes by comparing themith some overall estimates. We believe that our ESs results are
ound, because they were comparable to available estimates fromther sources and methods; either applied locally or in similaregions. In the following, we describe the methodological contrib-tions and the verifications for each ES.
.1.1. Mapping forage production, fuel wood provision andarbon sequestration
In contrast to other grazing capacity models applied in Southfrica (e.g. Moore and Odendaal (1987)), the model we usedaptures the effect of historical grazing. Therefore, it gives anstimate closer to the long-term forage production (or grazing)apacity than the methods based on actual biomass productionSchmidt et al., 1995). Our mean forage production estimate (0.03SU/ha) is close to, but is slightly lower than what the coarserovincial grazing capacity map shows (0.05 LSU/ha, (GIS Unitepartment of Agriculture, 2004)). Differences may be due tour translation of vegetation degradation levels into prescribedeld condition scores or the spatial resolution of the analy-is.
This study demonstrates a new case study application of theethods of Masera et al. (2003) for mapping fuel wood provision.dditionally, we also integrated the effect of vegetation degrada-
ion in this methodological frame. Using biomass growth makeshe comparison between fuel wood production and consumptionossible (van Jaarsveld et al., 2005). Our estimated fuel wood pro-ision range (0–64 kg/ha), based on the measured data of Pote et al.2006), falls within the range (0–80 kg/ha) reported for Southernfrica (van Jaarsveld et al., 2005). Results showed that fuel woodrovision is below or hardly exceeds local demand under any of theanagement options. In practice people collect wood only at areas
earby the roads and villages, thus not all fuel wood provided cane collected and used due to the distance. These make the Baviaan-kloof vulnerable to fuel wood shortages, similarly to the majorityf South Africa (van Jaarsveld et al., 2005).
Mapping carbon sequestration as the change in vegetation car-on storage is a widely-used method (Kareiva et al., 2011). Thicketarbon sequestration shows a variation through the literature. Thennual sequestration rate for thicket restoration areas is 1.9 t/haalculating with the 30 years scenario timeline and Powel’s (2009)arbon stock data used in present study. Mills and Cowling (2006)alculated 2.4–4.2 t/ha/year carbon sequestration rate for a nearbyrea. These differences are due to the differences in plant geno-ypes and the variation in planting density and restoration timeline30 years used in the present study vs. 27 years used by Mills andowling (2006)), among others. Higher planting density does notecessarily mean higher carbon sequestration if plant genotypesiffer and the independent effects of genotype and planting densityeed further investigation (Mills and Cowling, 2006).
Forage production, fuel wood provision and carbon sequestra-ion can be derived alternatively from net primary productivity.n our case, net primary productivity estimates derived from satel-ite images (MODIS) yielded coarse (1 × 1 km) carbon sequestrationesults without differences along vegetation degradation and graz-ng gradients.
.1.2. The InVEST model used for water supply and erosionrevention
The InVEST model generally does not address land management
ffects beyond land cover/use change. In this study we parameter-zed the InVEST water supply and erosion models (Kareiva et al.,011) for vegetation degradation levels and grazing effects. Thearameterization of these data-intensive models, particularly fortors 45 (2014) 692–703
grazing effects, required much information and also assumptionsbecause of insufficient quantitative information available in theregion. Water yield and erosion prevention were both estimatedpreviously by the hydrological model ACRU4 as part of an initialPayment for Water Services feasibility study (Mander et al., 2010a).In the ACRU model application land management was restrictedto thicket restoration and ESs were not mapped, only quanti-fied. As opposed to traditional hydrological models, the InVESTmodel is suitable for spatial analysis of multiple ESs, although itrepresents hydrologic process in a simplified way (Vigerstol andAukema, 2011). Water yield and erosion prevention results of theInVEST model are more reliable at catchment level than at pixellevel (Tallis et al., 2011). Our annual water yield estimate forthe whole catchment (45.9 million m3) is very close to previoushydrological modelling results (45.7 million m3 (Jansen, 2008) and47.1 million m3 (Mander et al., 2010a)). Because we did not con-sider the water supply infrastructure and the timing of water flows,the estimated water yield may differ from the realized water sup-ply. In the reality, there is a portion of runoff that does not supplydirect benefits, but sustains water retention and river flow impor-tant for ecosystems. In this study, however, these benefits were notquantified.
The decrease in water yield and increase in sediment retentionas a result of increased vegetation cover and thicket restorationis supported by the previous hydrological model results (Manderet al., 2010a) and other studies (Le Maitre et al., 2007; Reyers et al.,2009; van Luijk et al., 2013).
van Luijk et al. (2013) measured a slightly lower increase inwater yield (two times), than the present study (two and halftimes), as a result of thicket degradation in the Baviaanskloof catch-ment. The same authors measured much higher change in sedimentretention, than the present study. The difference can be caused bythe indicator use, our model parameterization of degradation andgrazing effects, and the differences in methods (field sampling vs.modelling).
4.1.3. Mapping ecotourismCombining indicators is a frequently used way to map the
potential for ecotourism, as empirical and quantitative data on thespatial dynamics of tourists are normally absent (c.f. Reyers et al.(2009), O’Farrell et al. (2010) and Petz and van Oudenhoven (2012)).The Baviaanskloof catchment is a heavily visited area (Powell andMander, 2009), but to our best knowledge no maps of the touristsusage exist. Our method enabled the quantification and mappingand ecotoursitic suitability without requiring (much) empiricaldata. According to our results historically overgrazed lands havehigh tourism potential. We emphasize that this is due to the existinginfrastructure (e.g. accommodation sites and hiking trails) providedon degraded lands. In general, however, the tourism potential of apristine or restored landscape is greater than tourism potential ofdegraded landscape (Powell et al., 2009; Reyers et al., 2009). Thisis supported by our scenario results, as ecotourism has the great-est potential under the RfN scenario. In the reality the activitiesincluding camping, walking, overnight hiking and mountain bikingmay be more attractive for most tourists than the view from theroad.
4.1.4. The GLOBIO3 model and biodiversity
in a multiple ESs context at global scale and at regional scale only in
4 http://dbnweb2.ukzn.ac.za/unp/beeh/acru/.

Indica
EmueBdid0irsdad(Bvi
4
elveefrtM
ip(sTttMbilowwsersea
cLasarom
K. Petz et al. / Ecological
urope (Maes et al., 2012). The MSA index provides a realistic esti-ate of the relative land management impacts, but can be refined
sing empirical data on species numbers or local expert knowl-dge where no data are available. Scholes and Biggs (2005) andiggs et al. (2006) used biodiversity intactness index to map bio-iversity in South Africa. Our mean biodiversity value (0.84) falls
n the same range as these prior larger-scale studies indicate (bio-iversity intactness index 0.74–0.88 (Scholes and Biggs, 2005) and.73–0.83 (Biggs et al., 2006) for the vegetation types also present
n the Baviaanskloof). These authors, however, point out that theiresults underestimate the effect of degradation, particularly in aridystems such as thicket. Our result about the decrease in MSA onegraded lands compared to pristine lands (38%) is close to field
measure conducted on a similar site in the Eastern Cape (35%ecrease in species richness and 30% decrease in species diversityLechmere-Oertel et al., 2005b)). Our results also underline thataviaanskloof Nature Reserve, which is a core are for nature conser-ation and biodiversity maintenance, has the highest biodiversityn the whole catchment.
.2. Evaluation of land management choice
Thicket restoration decreases water supply on short term, but itnhances water retention and base-flow which is important for theong-term provisioning of water and other ESs (Reyers et al., 2009;an Luijk et al., 2013). Restoration is, therefore, important consid-ring the growing water shortage in Southern Africa (van Jaarsveldt al., 2005) and in the Baviaanskloof (Mander et al., 2010b). Theull restoration of thicket ecosystem, its ecological processes andestoration of converted areas, however, may take much longerhan the 30 years scenario timeline (Mills and Cowling, 2006; Le
aitre et al., 2007).The amount of ES generated should be viewed in relation to
ts actual use or demand for it (Paetzold et al., 2010). For exam-le, the catchment supplies water for downstream communitiesvan Eck et al., 2010) hence the spatial dynamics of water provi-ion and use can be very roughly quantified (Mander et al., 2010a).he comparison of land management scenarios and their evalua-ion of ESs against targets and local demand are important stepsowards inclusion of ESs into local decision-making and planning.
eeting the targets alone, however, does not necessarily implyenefits for local inhabitants. For example, sustainable agriculture
s a target in the catchment management plan (PRESENCE, unpub-ished report 2011), but will provide benefits to individual farmersnly if it is paired with incentives. Furthermore, the sufficient fuelood provision is important for the local communities, but fuelood collection is not allowed on conservation areas and is not
upported by the catchment management plan. There is a gen-ral tension between the government and the local communitiesegarding the conservation and the management of the Baviaan-kloof catchment (Hough and Prozesky, 2010), also indicated by thexclusion of the local communities from the scenario developmentnd choice.
The nature conservation and restoration-oriented RfN and theompromise (between agriculture, conservation and restoration)wN scenarios meet slightly more management targets than thegriculture-oriented DoF scenario. The chosen LwN scenario fallshort on fuel wood, erosion prevention and biodiversity. The
pplied mapping and modelling methods and the quantitativeesults presented in Table 4 can help to improve the choicef land management options and may help to define another,ore optimal, scenario. For example, the partial transformationtors 45 (2014) 692–703 701
of game farms to private conservation with a voluntary agree-ment between the farmers and the Eastern Cape Parks and TourismAgency could enhance biodiversity. Undertaking light grazingon the remaining game farms could reduce erosion. In addi-tion, the interests of local communities and the ESs they dependcould also be considered in order to prevent potential fuel woodshortages, illegal extractions and achieve successful conserva-tion.
5. Conclusion
This study evaluated alternative land management options forthe Baviaanskloof catchment by quantifying and mapping multi-ple ESs. Although, simplifications and assumptions were requiredto bridge data gaps, reasonable ES provisioning estimates could beobtained, using available data and knowledge of land management-ES provision relationships. Our study shows that combining variousmapping and modelling methods with scenario analysis is an effi-cient way to enhance understanding of ESs and, subsequently,to guide land use and management decisions in data-scarceareas. Lack of high resolution biophysical data is often a prob-lem in ES modelling (Leh et al., 2013), as was the case for thisstudy. We emphasize that the strength of a simple model isthat it yields quantitative estimates when empirical data are lim-ited.
Results show that the provision of ESs depends on land man-agement as pristine ecosystems provide a substantially differentmix of ESs than ecosystems recently restored or managed as graz-ing lands. While livestock and game farming in combination withthicket restoration provide a wide set of ESs, formal nature conser-vation and crop cultivation provide a small number of different ESs.We show that a combination of light grazing, low input agricultureand nature conservation and restoration is the most promising forthe sufficient provision of multiple ESs in the Baviaanskloof catch-ment. The findings can help to strengthen and further optimizethe local stakeholders’ choice regarding the future management ofthe area. Farmers have already started to farm in a more sustain-able way, restore thicket vegetation and develop plans for carbonand water trading (Mander et al., 2010a). Land management fortourism and nature conservation private lands can be combined,especially if partnered with incentives (Reyers et al., 2009). Thisalso fits into the large-scale vision of creating a Baviaanskloof con-servation mega-reserve (van Eck et al., 2010) and conservation andmigration corridors across the whole subtropical thicket biome(Rouget et al., 2006).
Acknowledgements
This research was part of the PRESENCE project and learning net-work (http://www.earthcollective.net/initiatives/presence/). Wewould like thank Living Lands as secretariat of PRESENCE, Gam-toos Irrigation Board, Department of Water Affairs South Africa,and Working for Water for logistic support. Further thank to localresearchers involved in the project, representatives of Eastern CapeParks and Tourism Agency, local farmers and community membersfor their support during the field visit. Special thanks to former-MScstudents of Wageningen University, namely to Jaap van der Mij-den for initial parameterization of InVEST model and Jordy Stokhof
de Jong for providing the initial land management scenario maps.Further thank to members of the Environmental Systems AnalysisGroup, Wageningen University for their constructive comments onthe manuscript.
7
A
a
R
A
A
B
B
B
B
B
B
C
C
C
02 K. Petz et al. / Ecological Indicators 45 (2014) 692–703
ppendix.
Overview of data used for ecosystem services mapping and modelling. SAACA stands for South African Atlas of Climatologynd AgrohydrologyDescription Unit Format Source Ecosystem service used for
Vegetation Classes GIS polygon shape PRESENCE GIS database(Euston-Brown, 2006)
water supply, erosionprevention, carbonsequestration, biodiversity
Land use/management Classes GIS polygon shape PRESENCE GIS database(Stokhof de Jong, 2013)
all
Vegetation degradation Classes GIS polygon shape PRESENCE GIS database(Euston-Brown, 2006)
all, except for ecotourism
Veld condition as apercentage of benchmark
% Table Department of Agriculture,Environmental Affairs & RuralDevelopment, Province ofKwazulu-Natal (Veldmanagement,http://agriculture.kzntl.gov.za/)
forage production
Mean annual precipitation mm GIS raster SAACA (Lynch and Schulze,2007)
forage production, watersupply
Referenceevapotranspiration
mm GIS raster SAACA (Schulze and Maharaj,2007)
water supply
Soil depth mm GIS polygon shape SAACA (Schulze and Horan,2007)
water supply
Soil available waterfraction
mm/mm GIS polygon shape SAACA (Schulze and Horan,2007)
water supply
Watershed andsub-watershed
– GIS polygon shape SAACA (Schulze et al., 2007) water supply, erosionprevention
Plant evapotranspirationcoefficient
% Table University of KwaZulu-Natal(ACRU model parameters)
water supply, erosion
Average root depth mm Table InVEST 2.0 User’s Guide, p. 242.(Tallis et al., 2011)
water supply
Rainfall intensity/erosivity MJ*mm/(ha*h*yr) GIS polygon shape SAACA (Schulze, 2007) erosion preventionSoil erodibility T*ha*h/(ha*MJ*mm) GIS polygon shape SAACA (Schulze and Horan,
2007)erosion prevention
Digital Elevation Model m GIS raster http://www.ngi.gov.za/ erosion preventionBaviaanskloof Nature
Reserve– GIS polygon shape South African National
Biodiversity Institute (SANBI,2003)
fuel wood provision,ecotourism
Road – GIS polyline shape http://www.ngi.gov.za/ ecotourism, biodiversityWalking routes – GIS polyline shape PRESENCE GIS database ecotourismSettlement – GIS polygon shape http://www.ngi.gov.za/ ecotourism, biodiversityAccommodation sites – GIS point PRESENCE GIS database ecotourism
eferences
lkemade, R., Reid, R.S., van den Berg, M., de Leeuw, J., Jeuken, M., 2012. Assessingthe impacts of livestock production on biodiversity in rangeland ecosystems.Proc. Natl. Acad. Sci. U. S. A., http://dx.doi.org/10.1073/pnas.1011013108.
lkemade, R., van Oorschot, M., Miles, L., Nellemann, C., Bakkenes, M., ten Brink, B.,2009. GLOBIO3, A framework to investigate options for reducing global terres-trial biodiversity loss. Ecosystems 12, 374–390.
anks, D.I., Griffin, N.J., Shackleton, C.M., Shackleton, S.E., Mavrandonis, J.M., 1996.Wood supply and demand around two rural settlements in a semi-arid Savanna,South Africa. Biomass and Bioenergy 11, 319–331.
enayas, J.M.R., Newton, A.C., Diaz, A., Bullock, J.M., 2009. Enhancement of biodiver-sity and ecosystem services by ecological restoration: a meta-analysis. Science325, 1121–1124.
enítez-López, A., Alkemade, R., Verweij, P.A., 2010. The impacts of roads and otherinfrastructure on mammal and bird populations: A meta-analysis. Biol. Conserv.143, 1307–1316.
iggs, R., Reyers, B., Scholes, R.J., 2006. A biodiversity intactness score for SouthAfrica. South Afr. J. Sci. 102, 277–283.
iggs, R., Simons, H., Bakkenes, M., Scholes, R.J., Eickhout, B., van Vuuren, D., Alke-made, R., 2008. Scenarios of biodiversity loss in southern Africa in the 21stcentury. Global Environ. Change 18, 296–309.
oshoff, A., 2005. The Baviaanskloof Mega-Reserve: An Environmentally, Sociallyand Economically Sustainable Conservation and Development Initiative. Ter-restrial Ecology Research Unit Report No. 52. University of Port Elizabeth, PortElizabeth, South Africa.
anadell, J., Jackson, R.B., Ehleringer, J.B., Mooney, H.A., Sala, O.E., Schulze, E.D., 1996.Maximum rooting depth of vegetation types at the global scale. Oecologia 108,583–595.
arpenter, S.R., Mooney, H.A., Agard, J., Capistrano, D., DeFries, R.S., Díaz, S., Dietz,
Crane, W., 2006. Biodiversity conservation and land rights in South Africa: whitherthe farm dwellers? Geoforum 37, 1035–1045.
CSIR Satellite Application Centre, 2010. Census Data (2006 dwaf community villagedatabase). FUNDISA Disc Council for Scientific and Industrial Research (CSIR).
Danckwerts, J.E., 1989. Sweet grassveld. In: Danckwerts, J.E., Teague, W.R. (Eds.),Veld Management in Eastern Cape. Department of Agriculture and Water Supply,Government Printer, Pretoria, pp. 140–148.
De Groot, R.S., Alkemade, R., Braat, L., Hein, L., Willemen, L., 2010. Chal-lenges in integrating the concept of ecosystem services and values inlandscape planning, management and decision making. Ecol. Complex. 7,260–272.
Egoh, B.N., Reyers, B., Carwardine, J., Bode, M., O’Farrell, P.J., Wilson, K.A., Possing-ham, H.P., Rouget, M., De Lange, W., Richardson, D.M., Cowling, R.M., 2010.Safeguarding biodiversity and ecosystem services in the Little Karoo, SouthAfrica. Conserv. Biol. 24, 1021–1030.
Ehrlich, P.R., Kareiva, P.M., Daily, G.C., 2012. Securing natural capital and expandingequity to rescale civilization. Nature 486, 68–73.
ESRI, 2011. ArcGIS Desktop: Release 10. Environmental Systems Research Institute,Redlands, CA.
Euston-Brown, D., 2006. Baviaanskloof Mega-reserve Project: Vegetation MappingContract: Report on methodology, Vegetation Classification and Short Descrip-tions of Habitat Units (unpublished).
GIS Unit Department of Agriculture, 2004. Grazing Capacity, Eastern Cape Province.GIS Unit Department of Agriculture, Cradock, South Africa.
Holechek, J.L., Hilton, G., Molinar, F., Galt, D., 1999. Grazing studies: what we’velearned. Rangelands 21, 12–16.
Hough, J.A., Prozesky, H.E., 2010. ‘But we don’t spoil it, we protect it’: Coleske resi-dents’ conceptualisations of the Baviaanskloof Nature Reserve and its protection.South Afr. Geogr. J. 92, 160–172.
Jansen, H.C., 2008. Water for Food and Ecosystems in the Baviaanskloof Mega
T., Duraiappah, A.K., Oteng-Yeboah, A., Pereira, H.M., Perrings, C., Reid, W.V.,Sarukhan, J., Scholes, R.J., Whyte, A., 2009. Science for managing ecosystem ser-vices: beyond the millennium ecosystem assessment. Proc. Natl. Acad. Sci. U. S.A. 106, 1305–1312.han, K.M.A., Shaw, M.R., Cameron, D.R., Underwood, E.C., Daily, G.C., 2006. Conser-vation planning for ecosystem services. PLoS Biol. 4, e379.
Reserve: Land and Water Resources Assessment in the Baviaanskloof, East-
ern Cape Province, South Africa. Alterra-report 1218. Alterra, Wageningen UR,Wageningen.Kareiva, P., Tallis, H., Ricketts, T.H., Daily, G.C., Polasky, S., 2011. Natural Capital:Theory and Practice of Mapping Ecosystem Services. Oxford University Press,New York, USA.

Indica
L
L
L
L
L
L
LM
M
M
M
M
M
M
M
M
N
O
P
P
P
P
P
van Oudenhoven, A.P.E., Petz, K., Alkemade, R., Hein, L., de Groot, R.S., 2012. Frame-work for systematic indicator selection to assess effects of land management on
K. Petz et al. / Ecological
arigauderie, A., Prieur-Richard, A.-H., Mace, G.M., Lonsdale, M., Mooney, H.A., Brus-saard, L., Cooper, D., Cramer, W., Daszak, P., Díaz, S., Duraiappah, A., Elmqvist,T., Faith, D.P., Jackson, L.E., Krug, C., Leadley, P.W., Le Prestre, P., Matsuda, H.,Palmer, M., Perrings, C., Pulleman, M., Reyers, B., Rosa, E.A., Scholes, R.J., Spehn,E., Turner Ii, B.L., Yahara, T., 2012. Biodiversity and ecosystem services sciencefor a sustainable planet: the DIVERSITAS vision for 2012–20. Curr. Opin. Environ.Sustain. 4, 101–105.
e Maitre, D.C., Milton, S.J., Jarmain, C., Colvin, C.A., Saayman, I., Vlok, J.H.J., 2007.Linking ecosystem services and water resources: landscape-scale hydrology ofthe Little Karoo. Front. Ecol. Environ. 5, 261–270.
echmere-Oertel, R.G., Cowling, R.M., Kerley, G.I.H., 2005a. Landscape dysfunctionand reduced spatial heterogeneity in soil resources and fertility in semi-aridsucculent thicket, South Africa. Aust. Ecol. 30, 615–624.
echmere-Oertel, R.G., Kerley, G.I.H., Cowling, R.M., 2005b. Patterns and implicationsof transformation in semi-arid succulent thicket, South Africa. J. Arid Environ.62, 459–474.
eh, M.D.K., Matlock, M.D., Cummings, E.C., Nalley, L.L., 2013. Quantifying and map-ping multiple ecosystem services change in West Africa. Agriculture. Ecosyst.Environ. 165, 6–18.
indsey, P.A., Alexander, R., Mills, M.G.L., Romanach, S., Woodroffe, R., 2007. Wildlifeviewing preferences of visitors to protected areas in South Africa: implicationsfor the role of ecotourism in conservation. J. Ecotourism 6, 19–33.
ynch, S.D., Schulze, R.E., 2007. Annual Precipitation. Pretoria, South Africa.aes, J., Paracchini, M.L., Zulian, G., Dunbar, M.B., Alkemade, R., 2012. Synergies and
trade-offs between ecosystem service supply, biodiversity, and habitat conser-vation status in Europe. Biol. Conserv. 155, 1–12.
ander, M., Blignaut, J., Van Niekerk, M., Cowling, R., Horan, M., Knoesen, D., Mills,A., Powell, M., Schulze, R., 2010a. Baviaans – Tsitsikama Payment for EcosystemServices: Synthesis Report. Future Works, Everton, South Africa.
ander, M., Blignaut, J., Van Niekerk, M., Cowling, R., Horan, M., Knoesen, D., Mills, A.,Powell, M., Schulze, R., 2010b. Baviaanskloof-Tsitsikamma Payment for Ecosys-tem Services: A Feasibility Assessment. FutureWorks for the South AfricanNational Biodiversity Institute’s Cape Action for People and the Environmentprogram, Everton, South Africa.
asera, O.R., Drigo, R., Trossero, M.A., 2003. Woodfuels Integrated Supply/DemandOverview Mapping. WISDOM. A Methodological Approach for Assessing Wood-fuel Sustainability and Supporting Wood Energy Planning. FAO, Rome.
ills, A.J., Birch, S.C., Stephenson, J.D., Bailey, R.V., 2012. Carbon stocks in fynbos,pastures and vineyards on the Agulhas Plain, South Africa: a preliminary assess-ment. South Afr. J. Plant Soil 29, 191–193.
ills, A.J., Cowling, R.M., 2006. Rate of carbon sequestration at two thicket restora-tion sites in the Eastern Cape, South Africa. Restor. Ecol. 14, 38–49.
ills, A.J., Cowling, R.M., Fey, M.V., Kerley, G.I.H., Donaldson, J.S., Lechmere-Oertel,R.G., Sigwela, A.M., Skowno, A.L., Rundel, P., 2005. Effects of goat pastoralism onecosystem carbon storage in semiarid thicket, Eastern Cape, South Africa. Aust.Ecol. 30, 797–804.
ilton, S.J., Dean, W.R.J., Richardson, D.M., 2003. Economic incentives for restoringnatural capital in Southern African rangelands. Front. Ecol. Environ. 1, 247–254.
oore, A., Odendaal, A., 1987. Die ekonomiese implikasies van bosverdigting en bos-beheer soos van toepassing op ‘n speenkalfproduksiestelsel in die doringbosveldvan die Molopo-gebied. J. Grassl. Soc. Southern Africa 4, 139–142.
elson, E.J., Daily, G.C., 2010. Modelling Ecosystem Services in Terrestrial Systems.F1000 Biology Reports., pp. 2.
’Farrell, P.J., Reyers, B., Maitre, D.C., Milton, S.J., Egoh, B., Maherry, A., Colvin, C.,Atkinson, D., Lange, W., Blignaut, J.N., Cowling, R.M., 2010. Multi-functional land-scapes in semi arid environments: implications for biodiversity and ecosystemservices. Landsc. Ecol. 25, 1231–1246.
aetzold, A., Warren, P.H., Maltby, L.L., 2010. A framework for assessing ecologicalquality based on ecosystem services. Ecol. Complex. 7, 273–281.
almer, A.R., Peel, M., Kerley, G., 2006. Arid and semiarid rangeland productionsystems of Southern Africa: wildlife. Sécheresse 17, 362–370.
ereira, H.M., Leadley, P.W., Proenc a, V., Alkemade, R., Scharlemann, J.P.W.,Fernandez-Manjarrés, J.F., Araújo, M.B., Balvanera, P., Biggs, R., Cheung, W.W.L.,Chini, L., Cooper, H.D., Gilman, E.L., Guénette, S., Hurtt, G.C., Huntington, H.P.,Mace, G.M., Oberdorff, T., Revenga, C., Rodrigues, P., Scholes, R.J., Sumaila, U.R.,Walpole, M., 2010. Scenarios for global biodiversity in the 21st Century. Science330, 1496–1501.
etz, K., van Oudenhoven, A.P.E., 2012. Modelling land management effects onecosystem functions and services: a study in The Netherlands. InternationalJournal of Biodiversity Science. Ecosyst. Serv. Manage. 8, 135–155.
ote, J., Shackleton, C., Cocks, M., Lubke, R., 2006. Fuelwood harvesting and selectionin Valley Thicket, South Africa. J. Arid Environ. 67, 270–287.
tors 45 (2014) 692–703 703
Powell, M., Mander, M., 2009. Baviaanskloof-Tsitsikamma Payment for EcosystemServices: Water Services Suppliers Report. Future Works, Everton, South Africa.
Powell, M., Mander, M., Mills, A.J., 2009. Baviaanskloof-Tsitsikamma Payment forEcosystem Services: Vegetation Management for the Optimal Supply of Waterand Carbon Sequestration Report. Future Works, Everton, South Africa.
Powell, M., Vlok, J., Cassidy, K., 2011. Baviaanskloof Subtropical Thicket Restora-tion Western Baviaanskloof Private Lands. Spatial Restoration Plan and InitialCarbon Credit Feasibility Study. Restoration Research Group, Rhodes UniversityGrahamstown, South Africa.
Powell, M.J., 2009. Restoration of Degraded Subtropical Thickets in the Baviaan-skloof Megareserve, South Africa. The Role of Carbon Stocks and Portulacariaafra Survivorship. Department of Environmental Science, Rhodes University,Grahamstown, South Africa.
Puttick, J.R., Hoffman, M.T., Gambiza, J., 2011. Historical and recent land-use impactson the vegetation of Bathurst, a municipal commonage in the Eastern Cape,South Africa. Afr. J. Range Forage Sci. 28, 9–20.
Reyers, B., O’Farrell, P.J., Cowling, R.M., Egoh, B.N., Le Maitre, D.C., Vlok, J.H.J., 2009.Ecosystem services, land-cover change, and stakeholders: finding a sustainablefoothold for a semiarid biodiversity hotspot. Ecol. Soc. 14, 23.
Rhodes University Consortium, 2007. Baviaanskloof Mega-Reserve Project AreaStudy Research Report. Report to the Baviaanskloof Mega-Reserve Project Man-agement Unit, Port Elizabeth Port Elizabeth, South Africa.
Rouget, M., Cowling, R.M., Lombard, A.T., Knight, A.T., Kerley, G.I.H., 2006. Designinglarge-scale conservation corridors for pattern and process. Conserv. Biol. 20,549–561.
SANBI, 2003. STEP Protected Areas. Terrestrial Ecology Unit, South AfricanNational Biodiversity Institute (SANBI), Available at Biodiversity GIS websitehttp://bgis.sanbi.org/STEP/protectedAreas.asp (accessed 12.11.11).
Schmidt, A.G., Theron, G.K., van Hoven, W., 1995. A comparison of some methodsused to estimate the grazing capacity of a game ranch in Northern Province,South Africa. Koedoe 38, 123–128.
Scholes, R.J., Biggs, R., 2005. A biodiversity intactness index. Nature 434, 45–49.Schulze, R.E., 2007. Rainfall: Background. Pretoria, South Africa.Schulze, R.E., Hallowes, L.A., Horan, M.J.C., Lumsden, T.G., Pike, A., Thornton-Dibb, S.,
Warburton, M.L., 2007. South African Quaternary Catchments Database. Preto-ria, South Africa.
Schulze, R.E., Horan, M.J.C., 2007. Soils: Hydrological Attributes. Pretoria, SouthAfrica.
Schulze, R.E., Maharaj, M., 2007. A-Pan Equivalent Reference Potential Evaporation.Pretoria, South Africa.
Stokhof de Jong, J., 2013. Living landscape restoration: the common vision for theHartland in the Baviaanskloof (unpublished work). In: Landscape ArchitectureGroup. Wageningen University, Wageningen.
Tainton, N.M., Aucamp, A.J., Danckwerts, J.E., 1999. Principles of managing veld.Chapter 7. In: Tainton, N.M. (Ed.), Veld Management in South Africa. Universityof KwaZulu-Natal Press, Pietermaritzburg, South Africa, p. 472.
Tallis, H.T., Ricketts, T., Guerry, A.D., Wood, S.A., Sharp, R., Nelson, E., Ennaanay, D.,Wolny, S., Olwero, N., Vigerstol, K., Pennington, D., Mendoza, G., Aukema, J.,Foster, J., Forrest, J., Cameron, D., Arkema, K., Lonsdorf, E., Kennedy, C., Verutes,G., Kim, C.K., Guannel, G., Papenfus, M., Toft, J., Marsik, M., Bernhardt, J., 2011.InVEST 2.0 Beta User‘s Guide: Integrated Valuation of Ecosystem Services andTrade-offs. Stanford, The Natural Capital Project.
van Eck, B., Selomane, O., van den Broeck, D., Zylstra, M., de Groot, D., 2010. Culti-vating the ‘PRESENCE’ learning network to restore living landscapes. Adaptingto climate change in the Baviaanskloof Catchment, South Africa. Chapter. In:Andrade Pérez, A., Herrera Fernandez, B., Cazzolla Gatti, R. (Eds.), BuildingResilience to Climate Change: Ecosystem-based Adaptation and Lessons fromthe Field. IUCN, Gland, Switzerland, pp. 135–149.
van Jaarsveld, A.S., Biggs, R., Scholes, R.J., Bohensky, E., Reyers, B., Lynam, T., Musvoto,C., Fabricius, C., 2005. Measuring conditions and trends in ecosystem servicesat multiple scales: the Southern African Millennium Ecosystem Assessment(SAfMA) experience. Philos. Trans. R. Soc. B: Biol. Sci. 360, 425–441.
van Luijk, G., Cowling, R.M., Riksen, M.J.P.M., Glenday, J., 2013. Hydrological impli-cations of desertification: degradation of South African semi-arid subtropicalthicket. J. Arid Environ. 91, 14–21.
ecosystem services. Ecol. Indic. 21, 110–122.Vigerstol, K.L., Aukema, J.E., 2011. A comparison of tools for modeling freshwater
ecosystem services. J. Environ. Manage. 92, 2403–2409.
Related Documents