1 Percy FitzPatrick Institute, DST/NRF Centre of Excellence, University of Cape Town, Rondebosch, Cape Town 7701, South Africa. 2 Organic Plant Production and Agroecosystems Research in the Tropics and Subtropics, Universität Kassel, Steinstr. 19, D-37213 Witzenhausen, Germany. 3 Animal Husbandry in the Tropics and Subtropics, Universität Kassel and Georg-August-Universität Göttingen, Steinstr. 19, D-37213 Witzenhausen, Germany. 4 Department of Agricultural Economics and Rural Development, Georg-August-Universität, Platz der Göttinger Sieben 5, D-37073 Germany. 5 Agroecology, Georg-August-Universität Göttingen, Grisebachstr. 6, D-37077 Göttingen, Germany. C ontemporary research suggests that humanity is over-exploiting the environment 1 , driving global climate change, eutrophication, degradation of ecosystems and biodiversity loss 2 . At the same time, the world’s human population is projected to grow from 7.2 billion people to 9.6 billion by 2050 (ref. 3). Although most agro-ecosystems have coped with anthropogenic pressures 4 , we cannot assume they will continue to meet our increasing demands 5 . Food-production sys- tems are now global, with attendant benefits and risks 6 ; the diversity of farmed crops is declining 7 ; and environmental degradation from agri- culture is widespread 8–10 . These trends are eroding the resilience of agro- ecosystems to anthropogenic perturbations such as climate change 6,11,12 . Reconciling the demands of the growing human population with ecological sustainability is increasingly difficult 13 . The Millennium Ecosystem Assessment 14 classified ecosystem goods and services (ESS) into four categories: provisioning, regulating, supporting and cultural. It also acknowledged that ecosystems can provide or contribute to disser- vices, such as pathogens and floods. Subsequent analyses have generally focused on single services, or on ESS as outcomes of ecosystem-focused or food-production-focused models 15–17 . The underlying drivers of ecosystem degradation are, however, economic activities that are not themselves ecosystem-focused 18 and may be separated from their own consequences by long socioeconomic supply chains 19 . ESS research has concentrated on ecosystems 20 , rather than the institutional, political and socioeconomic drivers of ecological change 21 . Even the recognition that monitoring ESS requires not only ecological but also socioeconomic data is relatively recent 22 and has not yet influenced the ways in which important policies, such as international trade agreements and develop- ment goals, are designed and implemented 22,23 . Social–ecological systems are complex and adaptive, and attempts to manage them often have unintended consequences 11,24 . To manage ESS sustainably, we need to understand the trajectories of change that have produced our current situation and continue to shape it; the inter- actions, feedbacks and trade-offs between different services and the social–ecological interactions that produce them; and the ways in which fundamental structural changes (those that require new system mod- els, rather than simply adjustments to existing models) occur within the ESS context. Developing this understanding requires us to connect people and ecosystems in an interdisciplinary social–ecological systems framework 25,26 . We address this challenge by proposing a simple concep- tual model that shows how a systems perspective on ESS, in the context of agricultural transitions and increasing urbanization, helps to explain ecological over-exploitation. Service shifts in agricultural transitions In a sense, human history is the story of the great transition from hunt- ing and gathering, through farming, to the present situation in which less than 1% of the population (in many industrialized countries) is directly employed in food production 27–29 . In Germany, for instance, the average farmer in 1950 fed 10 individuals, but in 2010 he or she was feeding 131 people 30 . Despite its importance, there have been few attempts to develop formal social–ecological models of this transition. Generic systems models of ESS are also surprisingly hard to find. Most empirical analyses apply to individual goods or services, such as water flows or climate regulation 21 . A few published studies have quantified trade-offs between different ecosystem services 31–35 , but we are unaware of any formal, causal systems models that provide a broad overview of ESS across multiple categories and scales. Despite the existence of a wide range of land-cover change models 36 , and a growing interest in trans- forming cities for greater environmental sustainability 37 , the changes in service provision that are likely to happen during the transition from an agricultural society to an industrial society are poorly specified. If a human population is stable and most of the people depend directly on ESS, the feedbacks from ESS to human well-being are clear. Many cultures have developed rules and traditions that, under normal conditions, maintain their own resource base (for example, Balinese water temples as irrigation systems 38 ; the protection of sacred forests in southwest Madagascar 39 ; and the release of trained eagles, once they reach 5 years old, back to the wild by the Kazakh Golden Eagle hunters of western Mongolia 40 ). Although rules for natural resource manage- ment are not always effective, if a local equilibrium between resource use and human population size is maintained, a ‘green loop’ that avoids long-term degradation of ecosystems can be sustained. The green loop starts to break down when human populations grow as a result of technological change that increases food supply and life expectancy. Population density and infrastructure increase as urban settlements create alternative livelihood opportunities, provide security Historically, farmers and hunter-gatherers relied directly on ecosystem services, which they both exploited and enjoyed. Urban populations still rely on ecosystems, but prioritize non-ecosystem services (socioeconomic). Population growth and densification increase the scale and change the nature of both ecosystem- and non-ecosystem-service supply and demand, weakening direct feedbacks between ecosystems and societies and potentially pushing social–ecological systems into traps that can lead to collapse. The interacting and mutually reinforcing processes of technological change, population growth and urbanization contribute to over-exploitation of ecosystems through complex feedbacks that have important implications for sustainable resource use. Implications of agricultural transitions and urbanization for ecosystem services Graeme S. Cumming 1 , Andreas Buerkert 2 , Ellen M. Hoffmann 2 , Eva Schlecht 3 , Stephan von Cramon-Taubadel 4 & Teja Tscharntke 5 50 | NATURE | VOL 515 | 6 NOVEMBER 2014 REVIEW doi:10.1038/nature13945 © 2014 Macmillan Publishers Limited. All rights reserved

Welcome message from author
This document is posted to help you gain knowledge. Please leave a comment to let me know what you think about it! Share it to your friends and learn new things together.
Transcript
1Percy FitzPatrick Institute, DST/NRF Centre of Excellence, University of Cape Town, Rondebosch, Cape Town 7701, South Africa. 2Organic Plant Production and Agroecosystems Research in the Tropics and Subtropics, Universität Kassel, Steinstr. 19, D-37213 Witzenhausen, Germany. 3Animal Husbandry in the Tropics and Subtropics, Universität Kassel and Georg-August-Universität Göttingen, Steinstr. 19, D-37213 Witzenhausen, Germany. 4Department of Agricultural Economics and Rural Development, Georg-August-Universität, Platz der Göttinger Sieben 5, D-37073 Germany. 5Agroecology, Georg-August-Universität Göttingen, Grisebachstr. 6, D-37077 Göttingen, Germany.
Contemporary research suggests that humanity is over-exploiting the environment1, driving global climate change, eutrophication, degradation of ecosystems and biodiversity loss2. At the same
time, the world’s human population is projected to grow from 7.2 billion people to 9.6 billion by 2050 (ref. 3). Although most agro-ecosystems have coped with anthropogenic pressures4, we cannot assume they will continue to meet our increasing demands5. Food-production sys-tems are now global, with attendant benefits and risks6; the diversity of farmed crops is declining7; and environmental degradation from agri-culture is widespread8–10. These trends are eroding the resilience of agro-ecosystems to anthropogenic perturbations such as climate change6,11,12.
Reconciling the demands of the growing human population with ecological sustainability is increasingly difficult13. The Millennium Ecosystem Assessment14 classified ecosystem goods and services (ESS) into four categories: provisioning, regulating, supporting and cultural. It also acknowledged that ecosystems can provide or contribute to disser-vices, such as pathogens and floods. Subsequent analyses have generally focused on single services, or on ESS as outcomes of ecosystem-focused or food-production-focused models15–17. The underlying drivers of ecosystem degradation are, however, economic activities that are not themselves ecosystem-focused18 and may be separated from their own consequences by long socioeconomic supply chains19. ESS research has concentrated on ecosystems20, rather than the institutional, political and socioeconomic drivers of ecological change21. Even the recognition that monitoring ESS requires not only ecological but also socioeconomic data is relatively recent22 and has not yet influenced the ways in which important policies, such as international trade agreements and develop-ment goals, are designed and implemented22,23.
Social–ecological systems are complex and adaptive, and attempts to manage them often have unintended consequences11,24. To manage ESS sustainably, we need to understand the trajectories of change that have produced our current situation and continue to shape it; the inter-actions, feedbacks and trade-offs between different services and the social–ecological interactions that produce them; and the ways in which fundamental structural changes (those that require new system mod-els, rather than simply adjustments to existing models) occur within the ESS context. Developing this understanding requires us to connect people and ecosystems in an interdisciplinary social–ecological systems
framework25,26. We address this challenge by proposing a simple concep-tual model that shows how a systems perspective on ESS, in the context of agricultural transitions and increasing urbanization, helps to explain ecological over-exploitation.
Service shifts in agricultural transitionsIn a sense, human history is the story of the great transition from hunt-ing and gathering, through farming, to the present situation in which less than 1% of the population (in many industrialized countries) is directly employed in food production27–29. In Germany, for instance, the average farmer in 1950 fed 10 individuals, but in 2010 he or she was feeding 131 people30. Despite its importance, there have been few attempts to develop formal social–ecological models of this transition. Generic systems models of ESS are also surprisingly hard to find. Most empirical analyses apply to individual goods or services, such as water flows or climate regulation21. A few published studies have quantified trade-offs between different ecosystem services31–35, but we are unaware of any formal, causal systems models that provide a broad overview of ESS across multiple categories and scales. Despite the existence of a wide range of land-cover change models36, and a growing interest in trans-forming cities for greater environmental sustainability37, the changes in service provision that are likely to happen during the transition from an agricultural society to an industrial society are poorly specified.
If a human population is stable and most of the people depend directly on ESS, the feedbacks from ESS to human well-being are clear. Many cultures have developed rules and traditions that, under normal conditions, maintain their own resource base (for example, Balinese water temples as irrigation systems38; the protection of sacred forests in southwest Madagascar39; and the release of trained eagles, once they reach 5 years old, back to the wild by the Kazakh Golden Eagle hunters of western Mongolia40). Although rules for natural resource manage-ment are not always effective, if a local equilibrium between resource use and human population size is maintained, a ‘green loop’ that avoids long-term degradation of ecosystems can be sustained.
The green loop starts to break down when human populations grow as a result of technological change that increases food supply and life expectancy. Population density and infrastructure increase as urban settlements create alternative livelihood opportunities, provide security
Historically, farmers and hunter-gatherers relied directly on ecosystem services, which they both exploited and enjoyed. Urban populations still rely on ecosystems, but prioritize non-ecosystem services (socioeconomic). Population growth and densification increase the scale and change the nature of both ecosystem- and non-ecosystem-service supply and demand, weakening direct feedbacks between ecosystems and societies and potentially pushing social–ecological systems into traps that can lead to collapse. The interacting and mutually reinforcing processes of technological change, population growth and urbanization contribute to over-exploitation of ecosystems through complex feedbacks that have important implications for sustainable resource use.
Implications of agricultural transitions and urbanization for ecosystem servicesGraeme S. Cumming1, Andreas Buerkert2, Ellen M. Hoffmann2, Eva Schlecht3, Stephan von Cramon-Taubadel4 & Teja Tscharntke5
5 0 | N A T U R E | V O L 5 1 5 | 6 N O V E M B E R 2 0 1 4
REVIEWdoi:10.1038/nature13945
© 2014 Macmillan Publishers Limited. All rights reserved
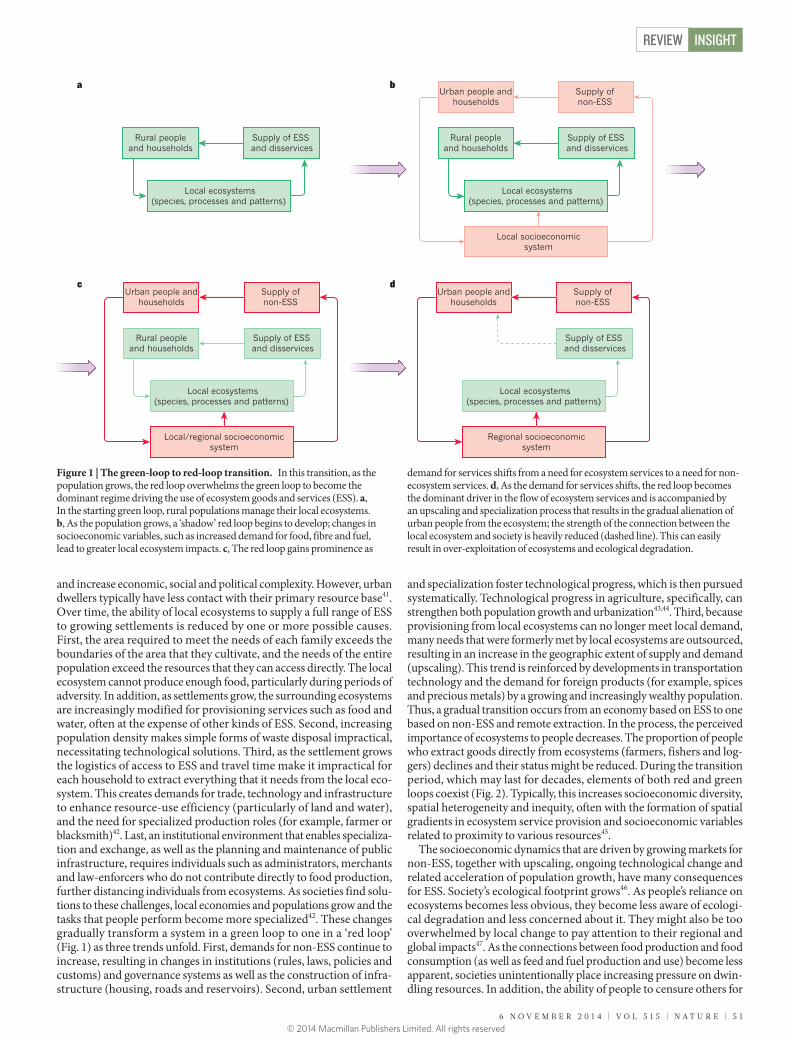
and increase economic, social and political complexity. However, urban dwellers typically have less contact with their primary resource base41. Over time, the ability of local ecosystems to supply a full range of ESS to growing settlements is reduced by one or more possible causes. First, the area required to meet the needs of each family exceeds the boundaries of the area that they cultivate, and the needs of the entire population exceed the resources that they can access directly. The local ecosystem cannot produce enough food, particularly during periods of adversity. In addition, as settlements grow, the surrounding ecosystems are increasingly modified for provisioning services such as food and water, often at the expense of other kinds of ESS. Second, increasing population density makes simple forms of waste disposal impractical, necessitating technological solutions. Third, as the settlement grows the logistics of access to ESS and travel time make it impractical for each household to extract everything that it needs from the local eco-system. This creates demands for trade, technology and infrastructure to enhance resource-use efficiency (particularly of land and water), and the need for specialized production roles (for example, farmer or blacksmith)42. Last, an institutional environment that enables specializa-tion and exchange, as well as the planning and maintenance of public infrastructure, requires individuals such as administrators, merchants and law-enforcers who do not contribute directly to food production, further distancing individuals from ecosystems. As societies find solu-tions to these challenges, local economies and populations grow and the tasks that people perform become more specialized42. These changes gradually transform a system in a green loop to one in a ‘red loop’ (Fig. 1) as three trends unfold. First, demands for non-ESS continue to increase, resulting in changes in institutions (rules, laws, policies and customs) and governance systems as well as the construction of infra-structure (housing, roads and reservoirs). Second, urban settlement
and specialization foster technological progress, which is then pursued systematically. Technological progress in agriculture, specifically, can strengthen both population growth and urbanization43,44. Third, because provisioning from local ecosystems can no longer meet local demand, many needs that were formerly met by local ecosystems are outsourced, resulting in an increase in the geographic extent of supply and demand (upscaling). This trend is reinforced by developments in transportation technology and the demand for foreign products (for example, spices and precious metals) by a growing and increasingly wealthy population. Thus, a gradual transition occurs from an economy based on ESS to one based on non-ESS and remote extraction. In the process, the perceived importance of ecosystems to people decreases. The proportion of people who extract goods directly from ecosystems (farmers, fishers and log-gers) declines and their status might be reduced. During the transition period, which may last for decades, elements of both red and green loops coexist (Fig. 2). Typically, this increases socioeconomic diversity, spatial heterogeneity and inequity, often with the formation of spatial gradients in ecosystem service provision and socioeconomic variables related to proximity to various resources45.
The socioeconomic dynamics that are driven by growing markets for non-ESS, together with upscaling, ongoing technological change and related acceleration of population growth, have many consequences for ESS. Society’s ecological footprint grows46. As people’s reliance on ecosystems becomes less obvious, they become less aware of ecologi-cal degradation and less concerned about it. They might also be too overwhelmed by local change to pay attention to their regional and global impacts47. As the connections between food production and food consumption (as well as feed and fuel production and use) become less apparent, societies unintentionally place increasing pressure on dwin-dling resources. In addition, the ability of people to censure others for
Rural peopleand households
Local ecosystems (species, processes and patterns)
Supply of ESS and disservices
Rural peopleand households
Urban people andhouseholds
Supply of non-ESS
Local ecosystems (species, processes and patterns)
Local socioeconomicsystem
Supply of ESS and disservices
Rural peopleand households
Urban people andhouseholds
Supply of non-ESS
Local ecosystems (species, processes and patterns)
Local/regional socioeconomicsystem
Supply of ESS and disservices
Urban people andhouseholds
Supply of non-ESS
Local ecosystems (species, processes and patterns)
Regional socioeconomicsystem
Supply of ESS and disservices
ba
dc
Figure 1 | The green-loop to red-loop transition. In this transition, as the population grows, the red loop overwhelms the green loop to become the dominant regime driving the use of ecosystem goods and services (ESS). a, In the starting green loop, rural populations manage their local ecosystems. b, As the population grows, a ‘shadow’ red loop begins to develop; changes in socioeconomic variables, such as increased demand for food, fibre and fuel, lead to greater local ecosystem impacts. c, The red loop gains prominence as
demand for services shifts from a need for ecosystem services to a need for non-ecosystem services. d, As the demand for services shifts, the red loop becomes the dominant driver in the flow of ecosystem services and is accompanied by an upscaling and specialization process that results in the gradual alienation of urban people from the ecosystem; the strength of the connection between the local ecosystem and society is heavily reduced (dashed line). This can easily result in over-exploitation of ecosystems and ecological degradation.
6 N O V E M B E R 2 0 1 4 | V O L 5 1 5 | N A T U R E | 5 1
REVIEW INSIGHT
© 2014 Macmillan Publishers Limited. All rights reserved

abusing natural resources declines48 because social interactions between producers and consumers weaken.
Once the transition from green-loop to red-loop dynamics is underway, the red loop becomes the dominant driver of societal change. Institutions and actions that conserve ESS and contribute to their sustainability must then be negotiated in new action forums49 in which many powerful and often competing actors, such as politicians, mining corporations and manufacturing industries, push to enhance the provision of non-ESS, often at the expense of ESS. The shift from green-loop to red-loop dynamics thus underpins a gradual regime shift24,50 in the entire social–ecological system.
Although the transition occurs gradually, the shift from a green to a red loop represents a fundamental change in system functioning that requires two different system models, rather than parameter changes within a single model. The two loops are alternate social–ecological states, each of which has reinforcing feedbacks that buffer it from change. The key slow-changing variables in the system51 are increasing human population and population density, which create amplifying feedbacks that rapidly ratchet up the demand for ESS and non-ESS; technological change, which accelerates population growth and enables a growing proportion of people to obtain their livelihoods in ways unrelated to agriculture; and a loss of biodiversity, which can lead to eventual socioeconomic collapse.
During transition, the proportion of aggregate income obtained directly from ecosystems declines from high (green loop) to low (red loop)52,53. A shift occurs from high to low relative prices for basic ESS (provision of staples such as wheat, potatoes and cassava) and to higher demand for special commodities (luxury food items such as a range of fruits)54. The value of sustaining and regulating services also increases while the value of provisioning services declines. For example, access to electricity and fossil fuels in cities reduces the reli-ance on local wood-fuel production55. Demands for cultural services might change with peoples’ perception of nature, and willingness to pay for cultural services may increase as natural landscapes become
scarcer. For example, temples and shrines in heavily populated cit-ies in Japan and Thailand have found new significance as places in which to experience nature56. Upscaling and increased trade in a red-loop population are not necessarily unsustainable if they lead to an equilibrium between the human population and resources at larger geographic extents.
Lock-in to a red loop need not be an ‘end point’57. Demand for new cultural services, such as walking trails and ecotourism, could lead to a reintegration of local ESS into urban economies and politics (although ecosystems may be species-poor by the time this occurs). Concerns for human health could also lead to measures to prevent environmental degradation. Ageing and declining post-peak human populations will bring new dynamics and possibly, if sufficient bio-diversity remains, the potential to return to more direct interactions with ESS. It remains unclear, however, whether efforts to ‘re-green’ cities (for example, through urban rooftop gardens58) can persist as the human population continues to grow, and whether cities will become unsustainable without efforts to make them greener and more self-sufficient.
The transition from green- to red-loop dynamics occurs through feedbacks between technological change, population growth and eco-system change. The resulting red loop has the potential to sustain-ably reconcile these forces by solving service supply and distribution problems. There may, however, be hurdles that prevent a successful transition and/or reduce the sustainability of the red loop. Over-consumption in the red loop and failure to regulate ecological decline can produce a ‘red trap’. Rural poverty and ecological degradation in the green loop may reinforce each other, leading to a ‘green trap’. In both cases, systems must reorganize or they will collapse (Fig. 3).
Tests of our model require long-term time series data for agricul-tural production, demography, economic developments and ecosys-tem change (Table 1). As a first step towards grounding the model empirically, we review evidence from three case studies: Sweden, as an example of a green-loop to red-loop transition; the Sahel, focusing
People andhouseholds
Local demandfor ESS
Humanhealth
Regional demandfor ESS
Supplyof ESS
Supply of ecosystemdisservices
Supply of non-ESSand disservices
Demand for non-ESSincluding space
Outsourcing (externalproduction to meet exported demand)
Institutions
Implementation,management and
‘use actions’
Local ecosystems (species, processes and patterns)
Local socioeconomicsystems
Regional ecosystemimpacts
Infrastructure andthe built environment
Figure 2 | Detailed interactions and feedbacks during the transitional period between green and red loops. Basic household needs create a local demand for ecosystem goods and services (ESS). This may be expressed as direct and unregulated impacts on ecosystems, or, more typically, as ‘use actions’ (consumptive and non-consumptive) that are governed by rules, laws, policies and customs (institutions). Among use actions, those that have the highest ecological impacts are generally those that involve direct extraction of resources (for example, logging, cultivation or water extraction). Use actions affect the provision of ESS as well as ‘disservices’ (pathogens, crop damage
or floods). The degree to which human needs are met by ecosystem services then affects future demand, completing the loop. The direct interactions of people and ecosystems are gradually overrun by the red loop, in which the focus is non-ESS, despite the continued importance of ecosystems for the community. Ongoing local and regional impacts on ecosystems are hidden from urban dwellers by outsourcing and infrastructure development. The two ‘wild card’ variables (in grey), human health and regional processes, may be present in either red- or green-loop situations and may create ecological or socioeconomic surprises that can alter system dynamics.
5 2 | N A T U R E | V O L 5 1 5 | 6 N O V E M B E R 2 0 1 4
REVIEWINSIGHT
© 2014 Macmillan Publishers Limited. All rights reserved

on Niger, as an example of a green-loop to green-trap transition; and Beijing, as an example of a red-loop to red-trap transition (in the absence of an unequivocal contemporary example of a country in a red trap).
Green loop to red loop in SwedenFor more than 1,000 years, Sweden had low population levels and a dominantly agrarian lifestyle, consistent with a green-loop dynamic. It still has one of Europe’s lowest population densities (around 9.5 million inhabitants; 21 people km−2), but between 1750 and 1850 the population doubled and its subsequent growth was much faster59,60. Around 1870 to 1890, population growth triggered a switch from a green loop (or possibly even a green trap; more than 1% of the population emigrated to America every year during the 1880s61) to a red loop. Rapid economic development, fuelled by engineering, mining, and the steel and pulp industries as well as internal institutional changes and a growing export market, took place between 1870 and 1914 (ref. 62). Two world wars and a global recession reduced economic growth, but gross domestic product (GDP) grew rapidly after 1950 (ref. 60).
Since 1950, industries and business services have expanded, whereas agricultural production has remained relatively constant. Infrastruc-tural assets — buildings and machinery — grew by two orders of mag-nitude from 69 billion year-2000 Swedish kronor in 1965 to 2.5 trillion year-2000 Swedish kronor in 2000. By contrast, employment in agri-culture declined from nearly a million people in 1880 to under 50,000 in 2000, and roughly 20% of agricultural land was removed from pro-duction between 1949 and 1999 (ref. 63). Sweden managed to retain substantial natural resources through its agricultural transition. In 2013, 69% of the country was forested, 8% was used as agricultural land and only 2.8% was ‘built-up’64. Transport infrastructure (roads, railways, harbours and airports) accounted for 40% of built-up land, with total infrastructure occupying a greater area than residential dwellings.
Advances in technologies and farming methods seem to be helping Sweden to remain sustainably within a red loop, with reductions in local environmental degradation and stable or increasing food production. According to Statistics Sweden64, total household water withdrawals between 1995 and 2010 declined from 616,000 m3 to 576,000 m3 per year; and for agriculture, from 137,000 m3 to 99,000 m3. Nitrogen inputs into water bodies declined from 34,527 t in 1995 to 24,416 t in 2005 and for phosphorus, from 970 t to 733 t during the same period. From 1965 to 2012, the area farmed and the numbers of individual people engaged in farming strongly declined, but yields per hectare of wheat (summer and winter) increased from 6,880 kg ha−1 to 11,110 kg ha−1 and annual production more than doubled from 1,039,320 t to 2,289,300 t.
In a red loop we expect a disconnect between people and local eco-systems, with negative consequences for biodiversity and ESS. The available evidence supports this view. The greatest losses of Swedish grasslands, one of the country’s most species-rich habitats, occurred before 1950 and created an extinction debt for habitat-specialized vascular plants, with species still being lost from the remaining grass-lands65. Extensive loss of old-growth forest dates back to a 1948 policy that enabled clear-cutting and over-use of herbicides in Swedish forests. The remaining forests of high conservation value are considered too small and too fragmented to meet current forest and environmental policy goals66. The Swedish Environmental Protection Agency was only created in 1967, and biodiversity conservation has only been a nationally agreed objective of forest management since 1992 (ref. 66). In the Baltic Sea, the Swedish cod harvest peaked at 59,000 t in 1984, but had dropped to 16,000 t by 1993 as the fishery collapsed67. A review of the impacts of agricultural intensification on essential ESS in Swe-den between 1950 and 1999 (ref. 63) found that most of the measures indicated a loss of ESS from the Swedish agricultural landscape. These included a 60% decline in native pollinator abundance and 46%, 33% and 14% increases in the concentrations of the heavy metals mercury, cadmium and lead, respectively.
Sweden has met many of its needs by upscaling, as predicted by our
model. The ecological footprints of large cities in the Baltic Sea region for food and timber production and waste assimilation are more than 565–1,130 times their combined area68. Swedish imports and exports increased sevenfold from 1975 to 2000, with unknown ecological impacts on remote locations. Internal biodiversity loss or an external limit to growth (such as climate change) may yet affect Sweden’s econ-omy69. We could, however, find no obvious evidence that Sweden has entered a red trap. For the moment, it is an example of a shift from a green to a red loop that first increased and then reduced the impacts of the growing human population on local ecosystems.
Green loop to green trap in the Sahel In Niger, millennia-old, environmentally specialized societies of pasto-ralists, agro-pastoralists, fishermen and traders indicate the long-term adaptations of people to ecosystem limitations and opportunities. In some parts of the pre-colonial Sahel, the wealth created as a result of labour division and the inter-regional trade of gold, salt and slaves led to the formation of cultural centres such as Timbuktu and Djenné in Mali between the thirteenth and sixteenth centuries70, proving the economic success of combined trade, regional migration and agro-pastoralism in successfully defying unpredictable rainfall. The existence of a relatively sparse rural society in the Sahel for several thousand years suggests a stable green loop.
The slave trade during the eighteenth and nineteenth centuries resulted in the loss of up to 3 million African inhabitants, affecting the workforce and cultural progress. Population recovery during the twenti-eth century rapidly led to a shortage of fertile land. Together with erratic rainfall, low soil fertility has, for centuries, limited the effectiveness of agricultural intensification efforts71. Shorter fallow periods have led to the expansion of cropping systems into ever more marginal drylands. The resulting large drop in per capita cereal production has required rapidly increasing cereal imports72 (Fig. 4). Although between 1970 and 2012 the area of harvested cereals expanded from 2.3 million to 10 mil-lion ha, cereal imports increased from almost zero to 340,000 t (Fig. 4).
Green loop
Red loop
Red trap
Green trap
Collapseand famine
Ecological degradation
Hou
sehol
d w
ealth
Red-loop sustainability depends on its ecological impacts
Green-loop sustainability depends on quality of life and population regulation
A green trap occurs with inadequate food production
A red trap occurs when people over-consume and cannot, or will not,change in response to ecological declines
Figure 3 | States, traps and transitions along the rural to urban gradient. A typical development trajectory from an agricultural (green loop) to industrial (red loop) society involves individual households gaining wealth while some level of ecosystem degradation occurs. Depending on population growth rates and governance, societies may grow without true socioeconomic restructuring (green trap) or become rich and continue to over-exploit ecosystems (red trap). The dashed lines indicate avoidable transitions. Both traps can lead to socioeconomic collapse. One of the primary challenges of development and policy initiatives is to shift societies from a green trap to a red loop (dotted line) without heavily altering consumption patterns, thus maintaining a relatively high individual quality of life without entering a red trap.
6 N O V E M B E R 2 0 1 4 | V O L 5 1 5 | N A T U R E | 5 3
REVIEW INSIGHT
© 2014 Macmillan Publishers Limited. All rights reserved

These trends correspond with a shift from a green loop to a green trap, in which poor rural populations remain enmeshed in rural poverty. Apart from during the two big Sahel droughts (in the early 1970s and mid-1980s), Niger has coped with the per capita decline of its rain-fed cereal production by upscaling. In our model, this indicates a shift towards a red loop. However, the economic basis for imports was the uranium boom — recently complemented by revenues from oil and gold — which resulted in an availability of funds without the creation of a full set of economic, infrastructural and institutional assets that would characterize a red loop. The decline in demand for nuclear fuel during the 1990s therefore resulted in a food crisis and political instability.
In response to the green trap, the rural population of Niger migrated. In 1951, the urban population was 6% of the country’s 3.3 million inhabitants; by 2012 it was 17% of 16.6 million72. As people in Niger attempt to escape the green trap, the intensive production of vegetables in urban and peri-urban agricultural systems and in irrigated garden-ing systems of southeastern Niger has increased; for example, onion sales in the Maradi region increased from 26,000 t in 1961 to 370,000 t in 2011 (ref. 72). Imports of staple foods, largely financed by foreign aid, have allowed the urban population and its alienation from ESS to continue to grow (upscaling based on external economic resources). Upscaling of demand without expansion of local supply has led to fur-ther neglect of the rural sector, putting additional strain on ecosystems, leading to more ecosystem degradation, and making it increasingly dif-ficult to escape the green trap. For example, reliance on wood fuel from
the marginal shrublands that formerly surrounded the cities73 has led to the widespread loss of vegetation cover and a decline in associated regulating and supporting services.
Agricultural innovations proposed for the Sahel over the past 50 years have largely failed because food production is hampered by a combina-tion of climatic unpredictability and political neglect74. A few exam-ples from Sudano–Sahelian West Africa75,76 indicate that agricultural intensification with positive feedback loops to ESS is possible, in prin-ciple, in this region. It depends, however, on effective local policies, risk-reducing technologies and stable market demand for commodities that support farmers’ investments in agriculture (as well as curbing the present 3.9% per annum population growth rate).
Red loop to red trap in BeijingBeijing is situated on the fertile North China Plain. It has an average annual precipitation of 578 mm and relies, for staple foods, on an inten-sive double cropping system of maize (corn) and wheat. Although the lack of water has limited the development of the Beijing basin area for centuries, and despite China’s one-child policy, the greater metropolitan area has grown from 9 million inhabitants in 1978 to more than 17 mil-lion in 2009 (ref. 77).
Population growth, exacerbated by immigration, rapid industrializa-tion and changes in consumer demands, has led to an ever-increasing demand for water resources. Beijing’s per-capita water-storage capac-ity of 300 m3 is 12.5% of China’s urban average and 3% of the world’s.
Table 1|The main premises (both well proven and those for which the evidence is circumstantial) underpinning our model, and forms of evidence on which proof or disproof of our argument rests
Model stage, prediction or hypothesis Evidence that would support the model Relevant data
Relatively stable populations of low densities are maintained with an agrarian or pastoral lifestyle.
Lower population density before the formation of cities. People per hectare before urbanization, showing evidence of stability in numbers.
Low population density is, or was, ecologically sustainable over timescales of centuries.
Low population density did not lead to degradation of ecosystem services (in addition to evidence of more than 250,000 years of human existence in Africa).
Estimates of how much land was needed for sustainability, for example, the number of hectares per household needed to maintain shifting agricultural system productively for more than 50 years, and proof that this much land was available.
Population increase leads to an increase in the number and size of cities (and/or land degradation and poverty).
Increasing urbanization, declining per capita agricultural production, declining household smallholding sizes as well as intensification as a temporary fix, or failure of agricultural production to sufficiently increase to meet demand.
City sizes, urban population demographics and urban growth rates; per capita production of key food crops; and village, farm or smallholding sizes.
In cities, the proportion of household income from agriculture drops as the society enters a red loop. The agricultural transition divides urban (red loop) and rural (green loop) people.
Differences in household income sources between rural and urban dwellers, declines in proportion of income from agriculture (as an income source) or the increasing role of non-ESS.
At the microscale, household-level data on net income and sources of income; at the macroscale, agricultural production as a proportion of GDP between urbanized and developing countries; and data on service industries and government or city expenditures.
Once in a red loop, upscaling of production systems must occur to meet the food demands of the urban population.
Upscaling, for example, greater ecological impacts on the surrounding countryside, impacts of urban demand on rural production systems and markets, and increased importance of trade.
Data on food prices, diversity and demand from city dwellers (compared with rural dwellers); rates of land conversion around cities; and per hectare production of crops in relation to market growth.
Red-loop dynamics reduce the connections of city dwellers to the countryside, fostering further ecological degradation.
Increasing rates or magnitudes of ecological impacts as urbanization levels increase, with less obvious dependency by city dwellers on provisioning ecosystem services, and increased ignorance about ecosystems (for example, where food comes from or what natural habitats really look like).
Data on land-cover change and biodiversity loss as urbanization occurs, ideally compared with a dysfunctional green-loop situation (increasing population and declining quality of life).
Existence of a green trap. Population increase is possible without urbanization (or the total population may grow more rapidly than the urban population).
Data showing increasing rural population and declining per capita production.
Existence of a red trap. Unsustainable consumption by wealthy societies. Despite arguments for the existence of red traps based on archaeological data, because of global upscaling few, or no, clear-cut contemporary examples exist.
Potential for collapse. The demonstration that collapse is possible from both green-trap and red-trap situations.
Archaeological evidence for social–ecological collapse in past civilizations, both agrarian and urbanized. Contemporary examples are harder to find because of technology and globalization.
Potential for shifting from a green trap to a red loop.
Urbanization and migration can provide a short- or intermediate-term solution to rural poverty.
Data on household incomes for societies (for example, Gini coefficients) as they go through a transition.
GDP, gross domestic product; ESS, ecosystem goods and services
5 4 | N A T U R E | V O L 5 1 5 | 6 N O V E M B E R 2 0 1 4
REVIEWINSIGHT
© 2014 Macmillan Publishers Limited. All rights reserved

Overuse of ESS is evident: 60% of Beijing’s total water use, and 80% of its irrigation water, is fossil groundwater, which is unrenewable. Aver-age water table levels in 2000 were 8.1 m lower than in 1980 and 12.2 m lower than in 1960 (ref. 78). In 2005, agriculture consumed 38% of the total water, for industry the value was 20%, and for municipal and resi-dential purposes it was 39%; the latter is rapidly increasing, leading to fierce competition between these sectors78. Around 70% of the irrigation water in the North China Plain is wasted by evaporation, deep percola-tion or run-off79. China’s central government has now implemented measures, such as the use of plastic mulching and tree-crop interplant-ing on large areas, to enhance water conservation.
High-intensity agricultural production in the Beijing area satisfies only 17% of city dwellers’ demand for grain and 31% of their demand for vegetables77. Heavy environmental contamination has occurred from uncontrolled wastewater discharge into water bodies, nitrate leaching from over-fertilization, and the release of gaseous pollutants and aero-sols into the atmosphere. An estimated 75% of urban residents in China live in areas in which the air quality is below the country’s own stand-ards; fine particle, emissions of sulphur dioxide and nitrogen oxides and subsequent fallout of acid rain80 affect an even higher proportion of Beijing’s population. In 1997 the nationwide death toll from air pol-lution was already estimated to be 300,000 people per year81. Annual total aerial nitrogen deposition rates in China rose from 13 kg N ha−1 in the 1980s to 21 kg N ha−1 in the 2000s, of which agricultural nitrogen sources contributed two-thirds82. Recent data for the Beijing area show annual total dry and wet nitrogen depositions of more than 90 kg ha−1 per year83, resulting in widespread acidification of the generally well-buffered surface soils of China’s croplands84.
In recent decades, per capita income in Beijing has risen faster than the cost of living and the proportion of household income spent on food has declined. Hence, Beijing has witnessed a transition to urban life-styles, a growing dependence of food markets on distant ESS (upscaling)
and the breakage of direct feedbacks from local ecosystems to the local population. So far, upscaling seems to have been a successful strategy for dealing with a potential red-trap situation. However, it is unclear whether further development in Beijing will be sustainable given ongo-ing declines in ESS and human well-being85.
General implicationsAlthough ecosystems are the foundation on which non-ESS rest, demands by urban societies for non-ESS make the connections between humanity and ecosystems less obvious and less immediate. The social–ecological dynamics of ESS are strongly driven by the more general demands of society for non-ESS and by the changes in the scales of supply and demand, for both ESS and non-ESS, that accompany the transition from agricultural to industrial societies. The first point in particular has not been incorporated into the ESS literature.
Agricultural transitions are fundamentally linked to human popula-tion growth86. Growing societies that attempt to remain in a green loop will almost inevitably enter a green trap, which could result in greater biodiversity losses than a red loop87. Few contemporary societies exist in a green loop, and those that come closest to doing so are often socially and economically marginalized and vulnerable to external exploitation of their ecosystems88,89. Contemporary societies that seem to have best navigated a balance between ecological sustainability and human well-being are those, such as Sweden, that have entered a red loop without shifting exploitation to red-trap levels. The red loop has bought such societies additional time, and the best-case scenario is that socioeco-nomic feedbacks within the red loop (for example, declining fertility, or simply longer inter-generational times and smaller families) could reduce population growth and ecological footprints before these sys-tems enter a red trap and collapse90.
Scale is of critical importance here: the cumulative effect of many local or regional red loops may be a global trap, for example if their
Figure 4 | Development of cereal production in Niger between 1960 and 2014. Cereal data illustrate the failed transition from a green to a red loop, and the resulting entry into a green trap. Cereal yield per hectare (a) has declined and the large expansion of the cultivated area (b) is primarily responsible for the increase in total cereal production (c), despite an overall
increase in fertilizer use (d). Cereal production per 1,000 people (e) dropped slightly as the human population grew (f). This would have led to a decline in cereal availability per capita. However, since the 1990s, extensive cereal imports (g) have compensated for the shortfall, with the linked collapse of cereal exports (h).
Cer
eal y
ield
(t
ha–1
)
0.7
Greenloop
Greentrap
Failed transitionto red loop
0.6
0.5
0.4
0.3
0.2
0.1
01960 1970 1980 1990 2000 2010
Are
a har
vest
ed (
mill
ions
ha)
12
10
8
6
4
2
01960 1970 1980 1990 2000 2010
Cer
eal p
roduct
ion (
mill
ions
t yr
–1)
6
5
4
3
2
1
01960 1970 1980 1990 2000 2010
Fert
ilize
r co
nsum
ptio
n (t
hous
ands
t yr
–1) 6
5
4
3
2
1
01960 1970 1980 1990 2000 2010
Cer
eal p
roduc
tion
(t p
er 1
,000 in
habita
nts) 400
300
200
100
0
400
300
200
100
400
300
200
100
01960 1970 1980 1990 2000 2010
Pop
ula
tion (
mill
ions)
20
15
10
5
01960 1970 1980 1990 2000 2010
Cer
eal i
mpor
t (t
hou
sands
t)
Cer
eal e
xpor
t (t
hou
sands
t)
1960 1970 1980 1990 2000 201001960 1970 1980 1990 2000 2010
a b c d
e f g h
6 N O V E M B E R 2 0 1 4 | V O L 5 1 5 | N A T U R E | 5 5
REVIEW INSIGHT
© 2014 Macmillan Publishers Limited. All rights reserved
combined greenhouse-gas emissions trigger climate change. We would expect to find scale dependencies in the relative importance of differ-ent links in the model. At local extents, questions of access and infra-structure development may dominate red-loop ecological impacts. At national extents, the model may capture the basis of an economy as rural or urbanized, and upscaling can be perceived as globalization. For empirical analyses, we suggest an initial unit of analysis as the house-hold, with aggregation of household data across a range of different spatial and temporal scales, and institutional levels.
Our model shares some elements with the environmental Kuznets curve91,92, which suggests that indicators of environmental degradation follow an inverted U-shaped curve over the course of economic devel-opment. We do not wish to reinstate Kuznets’ hypothesis, which has been criticized92,93; but the different pathways that we have identified explain why the environmental Kuznets curve might apply to some societies (such as those undergoing a green- to red-loop transition) and not to others (such as those that are caught in, or heading towards, red or green traps).
It remains unclear whether, how and when ecological debts incurred during industrialization will have to be repaid. Human survival depends on maintaining functional, resilient ecosystems and resulting ESS through the bottleneck of maximum human population. The loss of a crucial proportion of Earth’s fauna during the next 50–100 years would be irreparable over the time frame of human existence, and future socie-ties may struggle to live sustainably if left with unstable, depauperate life-support systems.
Our model has some parallels with existing research on traps and transformations94–97, with many relevant details and implications that will take time to work out. It is not directly diagnostic or prescriptive but it has the potential to both explain and predict, in the context of ESS and agriculture, the creation and resolution of scale mismatches98 and the development of various systemic syndromes (such as the reten-tion of perverse incentives and subsidies99, or the continued presence of destructive feedback loops that are almost impossible to break). The transition from green to red loops may also help to explain collapses in some past societies, providing a translation mode (in moving from theory to empirical, testable hypotheses) for ideas about social complex-ity and adaptive cycles100. A diversity of data-intensive, comparative case studies is needed to test and refine these ideas; developing economies and fast-growing cities should be particularly fertile grounds for fur-ther research. Ultimately, we see in these ideas the basis for a scientific framework that would explain why humanity’s use of ESS is, despite our combined knowledge and expertise, rapidly approaching planetary boundaries. ■
Received 11 March; accepted 28 July 2014.
1. Rockström, J. et al. A safe operating space for humanity. Nature 461, 472–475 (2009).
In this paper, the authors report that Earth’s resources are finite and we are already living unsustainably in some areas.
2. Millennium Assessment. Ecosystems and Human Wellbeing: Biodiversity Synthesis (Island, 2005).
3. United Nations Department of Economic and Social Affairs Population Division. World Population Prospects: The 2012 Revision, Volume I: Comprehensive Tables http://esa.un.org/wpp/documentation/publications.htm (United Nations, 2013).
4. Rudel, T. K. et al. Agricultural intensification and changes in cultivated areas, 1970–2005. Proc. Natl Acad. Sci. USA 106, 20675–20680 (2009).
5. Foley, J. A. et al. Global consequences of land use. Science 309, 570–574 (2005).
6. O’Brien, K. L. & Leichenko, R. M. Double exposure: assessing the impacts of climate change within the context of economic globalization. Glob. Environ. Change 10, 221–232 (2000).
7. Khoury, C. K. et al. Increasing homogeneity in global food supplies and the implications for food security. Proc. Natl Acad. Sci. USA 111, 4001–4006 (2014).
8. Rabotyagov, S. S., Kling, C. L., Gassman, P. W., Rabalais, N. N. & Turner, R. E. The economics of dead zones: causes, impacts, policy challenges, and a model of the gulf of Mexico hypoxic zone. Rev. Environ. Econ. Policy 8, 58–79 (2014).
9. Cramer, W. et al. Tropical forests and the global carbon cycle: impacts of atmospheric carbon dioxide, climate change and rate of deforestation. Phil. Trans. R. Soc. Lond. B 359, 331–343 (2004).
10. Child, M. F., Cumming, G. S. & Amano, T. Assessing the broad-scale impact of agriculturally transformed and protected area landscapes on avian taxonomic and functional richness. Biol. Conserv. 142, 2593–2601 (2009).
11. Norberg, J. & Cumming, G. S. Complexity Theory for a Sustainable Future (Columbia Univ. Press, 2008).
12. Loreau, M. et al. Biodiversity and ecosystem functioning: current knowledge and future challenges. Science 294, 804–808 (2001).
13. Tscharntke, T. et al. Global food security, biodiversity conservation and the future of agricultural intensification. Biol. Conserv. 151, 53–59 (2012).
14. Millennium Assessment. Ecosystems and Human Well-being: a Framework for Assessment. A Report of the Conceptual Framework Working Group of the Millennium Ecosystem Assessment (Island, 2003).
15. Crossman, N. D. et al. A blueprint for mapping and modelling ecosystem services. Ecosyst. Serv. 4, 4–14 (2013).
16. Burkhard, B., Kroll, F., Nedkov, S. & Müller, F. Mapping ecosystem service supply, demand and budgets. Ecol. Indic. 21, 17–29 (2012).
17. Martínez-Harms, M. J. & Balvanera, P. Methods for mapping ecosystem service supply: a review. Inter. J. Biodiv. Sci. Ecosyst. Serv. Mgmt 8, 17–25 (2012).
18. Geist, H. J. & Lambin, E. F. Proximate causes and underlying driving forces of tropical deforestation. Bioscience 52, 143–150 (2002).
19. Revilla, E. & Sáenz, M. J. Supply chain disruption management: global convergence vs national specificity. J. Bus. Res. 67, 1123–1135 (2014).
20. Mooney, H. A., Duraiappah, A. & Larigauderie, A. Evolution of natural and social science interactions in global change research programs. Proc. Natl Acad. Sci. USA 110, 3665–3672 (2013).
21. Carpenter, S. R. et al. Science for managing ecosystem services: beyond the Millennium Ecosystem Assessment. Proc. Natl Acad. Sci. USA 106, 1305–1312 (2009).
22. Reyers, B. et al. Getting the measure of ecosystem services: a social-ecological approach. Front. Ecol. Environ. 11, 268–273 (2013).
This paper reports that policy-related indicators for development goals have focused almost entirely on ecosystems, without effective monitoring of the socioeconomic systems that often drive ecosystem change.
23. Perrings, C. et al. Ecosystem services for 2020. Science 330, 323–324 (2010). 24. Folke, C. et al. Regime shifts, resilience, and biodiversity in ecosystem
management. Annu. Rev. Ecol. Evol. Syst. 35, 557–581 (2004).25. Scheffer, M. & Westley, F. R. The evolutionary basis of rigidity: locks in cells,
minds, and society. Ecol. Soc. 12, 36 (2007). 26. Chapin, F. S. et al. Directional changes in ecological communities and social-
ecological systems: a framework for prediction based on Alaskan examples. Am. Nat. 168, S36–S49 (2006).
27. Boserup, E. Population and Technological Change: a Study of Long-term Trends (Univ. Chicago, 1981).
28. Zeder, M. A. Domestication and early agriculture in the Mediterranean basin: origins, diffusion, and impact. Proc. Natl Acad. Sci. USA 105, 11597–11604 (2008).
29. Livi-Bacci, M. A Concise History of World Population (Wiley, 2012). 30. Deutscher Bauernverband (German Farmers’ Union). Situationsbericht 2013
(Deutscher Bauernverband, 2013). 31. Rodriguez, J. P. et al. in Millennium Ecosystem Assessment Volume 2: Scenarios
Assessment Ch. 11 (Island Press, 2005). 32. Raudsepp-Hearne, C., Peterson, G. D. & Bennett, E. M. Ecosystem service
bundles for analyzing tradeoffs in diverse landscapes. Proc. Natl Acad. Sci. USA 107, 5242–5247 (2010).
33. Nelson, E. et al. Modeling multiple ecosystem services, biodiversity conservation, commodity production, and tradeoffs at landscape scales. Front. Ecol. Environ 7, 4–11 (2009).
34. Bennett, E. M., Peterson, G. D. & Gordon, L. J. Understanding relationships among multiple ecosystem services. Ecol. Lett. 12, 1394–1404 (2009).
35. Clough, Y. et al. Combining high biodiversity with high yields in tropical agroforests. Proc. Natl Acad. Sci. USA 108, 8311–8316 (2011).
36. Popp, A. et al. Land-use transition for bioenergy and climate stabilization: model comparison of drivers, impacts and interactions with other land use based mitigation options. Clim. Change 123, 495–509 (2013).
37. Nevens, F., Frantzeskaki, N., Gorissen, L. & Loorbach, D. Urban transition labs: co-creating transformative action for sustainable cities. J. Cleaner Prod. 50, 111–122 (2013).
38. Berkes, F. Sacred Ecology: Traditional Ecological Knowledge and Resource Management (Taylor and Francis, 1999).
39. Tengö, M. Management Practices for Dealing with Uncertainty and Change: Social-Ecological Systems in Tanzania and Madagascar. PhD thesis, Stockholm Univ. (2004).
40. Soma, T. Contemporary falconry in the Altai-Kazakh in Western Mongolia. Int. J. Intangible Heritage 7, 103–111 (2012).
41. Young, H. & Jacobsen, K. No way back? Adaptation and urbanization of IDP livelihoods in the Darfur Region of Sudan. Dev. Change 44, 125–145 (2013).
42. Smith, A. & Garnier, M. An Inquiry into the Nature and Causes of the Wealth of Nations (Nelson, 1845).
43. Romer, P. M. Endogenous technological change. J. Polit. Econ. 98, S71–S102 (1990).
This paper develops a model that explains how economic growth arises from endogenous technological change.
44. Matsuyama, K. Agricultural productivity, comparative advantage, and economic growth. J. Econ. Theory 58, 317–334 (1992).
The key theoretical contribution of this paper is the finding that the effect of agricultural productivity on economic growth and industrialization depends on the openness of an economy.
5 6 | N A T U R E | V O L 5 1 5 | 6 N O V E M B E R 2 0 1 4
REVIEWINSIGHT
© 2014 Macmillan Publishers Limited. All rights reserved

45. Wu, J. Urban ecology and sustainability: the state-of-the-science and future directions. Landsc. Urban Plan. 125, 209– 221 (2014).
46. Luck, M. A., Jenerette, G. D., Wu, J. & Grimm, N. B. The urban funnel model and the spatially heterogeneous ecological footprint. Ecosystems 4, 782–796 (2001).
47. Grimm, N. B. et al. Global change and the ecology of cities. Science 319, 756–760 (2008).
48. Ostrom, E. How types of goods and property rights jointly affect collective action. J. Theor. Polit. 15, 239–270 (2003).
This paper lays out a set of premises that explain the conditions that determine the effectiveness of institutions in common property systems.
49. McGinnis, M. D. An introduction to IAD and the language of the Ostrom workshop: a simple guide to a complex framework. Policy Stud. J. 39, 169–183 (2011).
50. Scheffer, M. et al. Early-warning signals for critical transitions. Nature 461, 53–59 (2009).
51. Carpenter, S. R. & Turner, M. G. Hares and tortoises: interactions of fast and slow variables in ecosystems. Ecosystems 3, 495–497 (2000).
52. Leamer, E. E., Maul, H., Rodriguez, S. & Schott, P. K. Does natural resource abundance increase Latin American income inequality? J. Dev. Econ. 59, 3–42 (1999).
53. Lebel, L. et al. Industrial transformation and shrimp aquaculture in Thailand and Vietnam: pathways to ecological, social, and economic sustainability? AMBIO 31, 311–323 (2002).
54. Ocampo, J. & Parra-Lancourt, M. The term of trade for commodity since the mid 19th century. J. lberian Latin Am. Econ. Hist. 28, 11–43 (2009).
55. DeFries, R. & Pandey, D. Urbanization, the energy ladder and forest transitions in India’s emerging economy. Land Use Policy 27, 130–138 (2010).
56. Ishii, H. T. et al. Integrating ecological and cultural values toward conservation and utilization of shrine/temple forests as urban green space in Japanese cities. Landscape Ecol. Eng. 6, 307–315 (2010).
57. Genske, D. & Ruff, A. in Proc. 10th IAEG Int. Congress 82 http://www.iaeg.info/iaeg2006/start.htmI (2006).
58. Getter, K. L. & Rowe, D. B. The role of extensive green roofs in sustainable development. HortScience 41, 1276–1285 (2006).
59. Hofsten, E. & Lundstrom, H. Swedish Population History: Main Trends from 1750 to 1970 (National Central Bureau of Statistics, 1976).
60. Lobell, H., Schön, L. & Krantz, O. Swedish historical national accounts, 1800–2000: principles and implications of a new generation. Scand. Econ. Hist. Rev. 56, 142–159 (2008).
61. Einhorn, E. & Logue, J. Modern Welfare States: Politics and Policies in Social Democratic Scandinavia (Praeger Publishers, 1989).
62. Schön, L. Internal and external factors in Swedish industrialization. Scand. Econ. Hist. Rev. 45, 209–223 (1997).
63. Björklund, J., Limburg, K. E. & Rydberg, T. Impact of production intensity on the ability of the agricultural landscape to generate ecosystem services: an example from Sweden. Ecol. Econom. 29, 269–291 (1999).
64. Statistics Sweden. http://www.scb.se/en (Statistics Sweden, 2013). 65. Krauss, J. et al. Habitat fragmentation causes immediate and time-delayed
biodiversity loss at different trophic levels. Ecol. Lett. 13, 597–605 (2010).66. Angelstam, P. et al. Protecting forest areas for biodiversity in Sweden
1991–2010: policy implementation process and outcomes on the ground. Silva Fennica 45, 1111–1133 (2011).
67. Holmlund, C. M. & Hammer, M. Ecosystem services generated by fish populations. Ecol. Econ. 29, 253–268 (1999).
68. Jansson, Å., Folke, C., Rockström, J., Gordon, L. & Falkenmark, M. Linking freshwater flows and ecosystem services appropriated by people: the case of the Baltic Sea drainage basin. Ecosystems 2, 351–366 (1999).
69. Stoate, C. et al. Ecological impacts of early 21st century agricultural change in Europe — a review. J. Environ. Manage. 91, 22–46 (2009).
70. McIntosh, R. J. & McIntosh, S. K. The inland Niger delta before the empire of Mali: evidence from Jenne-jeno. J. Afr. Hist. 22, 1–22 (1981).
71. Bationo, A., Lompo, F. & Koala, S. Research on nutrient flows and balances in West Africa: state-of-the art. Agric. Ecosyst. Environ. 71, 19–35 (1998).
72. FAOSTAT. Crops: Primary Production and Trade Databases http://faostat.fao.org/ Accessed Dec 2013 (FAO, 2013).
73. Brinkmann, K., Schumacher, J., Dittrich, A., Kadaore, I. & Buerkert, A. Analysis of landscape transformation processes in and around four West African cities over the last 50 years. Landsc. Urban Plan. 105, 94–105 (2012).
74. Buerkert, A. & Schlecht, E. Agricultural innovations in small-scale farming systems of Sudano-Sahelian West Africa: some prerequisites for success. Secheresse 24, 322–329 (2013).
This paper reports that factors driving the success of agricultural innovations in sub-Saharan Africa are their capacity to enhance farmers’ access to markets, the possibility to adopt an innovation with only small amounts of capital, and limited risk of failure despite high rainfall variability.
75. Mortimore, M. & Turner, B. Does the Sahelian smallholders’ management of woodland, farm trees, rangeland support the hypothesis of human-induced desertification? J. Arid Environ. 63, 567–595 (2005).
76. Tappan, G. & McGahuey, M. Tracking environmental dynamics and agricultural
intensification in southern Mali. Agric. Syst. 94, 38–51 (2007). 77. The National Bureau of Statistics of Beijing. Beijing Statistical Yearbook (ed.
Xiuqin, Y.) (Chinese Statistics, 2010). 78. Zhang, S., Deng, L., Yue, P. & Cui, H. Study on Water Tariff Reform and Income
Impacts in China’s Metropolitan Areas: the Case of Beijing http://documents.worldbank.org/curated/en/2007/07/10119647/study-water-tariff-reform-income-impacts-chinas-metropolitan-areas-case-beijing (World Bank, 2007).
79. Huang, J., Zhang, H.-L., Tong, W.-J. & Chen, F. The impact of local crops consumption on the water resources in Beijing. J. Cleaner Production 21, 45–50 (2012).
80. State Environmental Protection Administration of China. SEPA Report [in Chinese] http://www.sepa.gov.cn/eic/652466692596695040/20040602/1050958.shtml (SEPA, 2004).
81. Johnson, T. M., Liu, F. & Newfarmer, R. Clear Water, Blue Skies: China’s Environment in the New Century (World Bank, 1997).
82. Liu, X. J. et al. Enhanced nitrogen deposition over China. Nature 494, 459–462 (2013).
83. Shen, J. L. et al. High concentrations and dry deposition of reactive N species at two sites in the North China Plain. Environ. Pollut. 157, 3106–3113 (2009).
84. Guo, J. H. et al. Significant soil acidification in major Chinese croplands. Science 327, 1008–1010 (2010).
85. Zhuang, G. S., Guo, J. H., Yuan, H. & Zhao, C. Y. The compositions, sources, and size distribution of the dust storm from China in spring of 2000 and its impact on the global environment. Chin. Sci. Bull. 46, 895–900 (2001).
86. Gibbs, H. et al. Tropical forests were the primary sources of new agricultural land in the 1980s and 1990s. Proc. Natl Acad. Sci. USA 107, 16732–16737 (2010).
87. Sanderson, F. J., Donald, P. F., Pain, D. J., Burfield, I. J. & Van Bommel, F. P. Long-term population declines in Afro-Palearctic migrant birds. Biol. Conserv. 131, 93–105 (2006).
88. Zimmerman, B., Peres, C. A., Malcolm, J. R. & Turner, T. Conservation and development alliances with the Kayapo of south-eastern Amazonia, a tropical forest indigenous people. Environ. Conserv. 28, 10–22 (2001).
89. Smith, E. A. & Wishnie, M. Conservation and subsistence in small-scale societies. Annu. Rev. Anthropol. 29, 493–524 (2000).
90. Daily, G. C. & Ehrlich, P. R. Socioeconomic equity, sustainability, and Earth’s carrying capacity. Ecol. Appl. 6, 991–1001 (1996).
This paper reports that increasing equity can help to increase food production and reduce fertility rates, but runaway consumption must be curbed for sustainability.
91. Kuznets, S. Economic growth and income inequality. Am. Econ. Rev. 45, 1–28 (1955).
92. Dasgupta, S., Laplante, B., Wang, H. & Wheeler, D. Confronting the environmental Kuznets curve. J. Econ. Perspect. 16, 147–168 (2002).
93. Stern, D. I. The rise and fall of the environmental Kuznets curve. World Dev. 32, 1419–1439 (2004).
94. Costanza, R. L. et al. Sustainability or collapse: what can we learn from integrating the history of humans and the rest of nature? Ambio 36, 522–527 (2007).
95. Haug, G. H. et al. Climate and the collapse of Maya civilization. Science 299, 1731–1735 (2003).
96. Rasmussen, L. V. & Reenberg, A. Collapse and recovery in Sahelian agro-pastoral systems: rethinking trajectories of change. Ecol. Soc. 17, 14 (2012).
97. Tainter, J. A. The Collapse of Complex Societies (Cambridge Univ. Press, 1988). 98. Cumming, G. S., Cumming, D. H. M. & Redman, C. L. Scale mismatches in
social-ecological systems: causes, consequences, and solutions. Ecol. Soc. 11, 14 (2006).
This paper argues that mismatches in the scales at which ecosystems vary and the institutional levels at which responsibility for ecosystem management resides can lead to various management problems.
99. van Beers, C. & van den Bergh, J. C. Perseverance of perverse subsidies and their impact on trade and environment. Ecol. Econ. 36, 475–486 (2001).
100. Holling, C. S. & Meffe, G. K. Command and control and the pathology of natural resource management. Conserv. Biol. 10, 328–337 (1996).
This paper states that attempts to maximize offtake from production systems often create vulnerabilities in those systems, leading to collapse.
Acknowledgements G.S.C. thanks the Universität Kassel (http://www.icdd.uni-kassel.de) and Georg-August-Universität Göttingen for travel funding. This research was partially supported by a James S. McDonnell Foundation grant to G.S.C. and benefitted from discussions between A.B. and E.S. in BU1308/5-3, SCHL587/4-3 and the UrbanFood project, funded by the Volkswagen Foundation (No. I/82 189); between S.v.C-T. and T.T. within the RTG 1644 (Scaling Problems in Statistics); and the discussions of T.T. within the CRC 990 (EFForTS).
Author Information Reprints and permissions information is available at www.nature.com/reprints. The authors declare no competing financial interests. Readers are welcome to comment on the online version of this paper at go.nature.com/t4fvnf. Correspondence should be addressed to G.S.C. ([email protected]).
6 N O V E M B E R 2 0 1 4 | V O L 5 1 5 | N A T U R E | 5 7
REVIEW INSIGHT
© 2014 Macmillan Publishers Limited. All rights reserved
Related Documents


![Urbanization & Human Behavior? Which is which? Urban ecosystem[life] shapes/reshapes human behavior? Human behavior determines/shapes urban ecosystem[life]?](https://static.cupdf.com/doc/110x72/56649e995503460f94b9c794/urbanization-human-behavior-which-is-which-urban-ecosystemlife-shapesreshapes.jpg)