Land Cover Map 2015 (LCM2015) Clare Rowland, Dan Morton, Luis Carrasco, Nye O’Neil, Claire Wood

Welcome message from author
This document is posted to help you gain knowledge. Please leave a comment to let me know what you think about it! Share it to your friends and learn new things together.
Transcript
Land Cover Map 2015
(LCM2015)
Clare Rowland, Dan Morton, Luis Carrasco, Nye O’Neil, Claire Wood
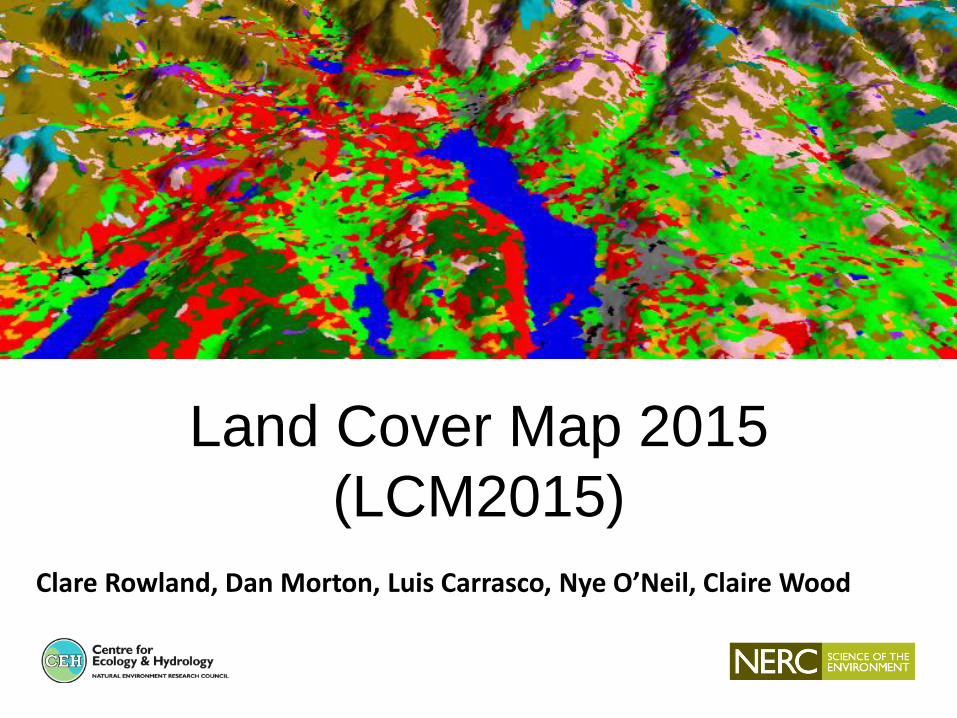
Five questions:
• What is the Land Cover Map (LCM)?
• Why is LCM important?
• How is a LCM produced?
• What LCM products are there?
• How has the LCM been used?

What is the Land Cover Map?

Land Cover Statistics
Land cover class ENGLAND SCOTLAND WALES NORTHERN_IRELAND
Broadleaved woodland 7.5 4.0 7.9 3.3
Coniferous woodland 2.3 13.0 7.7 5.2
Arable 36.5 8.6 4.8 6.8
Improved grassland 32.8 17.3 47.3 57.3
Neutral grassland 0.5 0.0 0.5 3.0
Calcareous grassland 0.6 0.0 0.1 0.0
Acid grassland 3.6 15.3 19.9 2.8
Fen 0.1 0.0 0.2 0.0
Heather 1.3 9.2 2.0 1.9
Heather grassland 0.7 17.1 1.1 4.4
Bog 1.5 8.2 1.3 6.5
Inland rock 0.2 1.9 0.3 0.2
Saltwater 0.1 0.1 0.1 0.1
Freshwater 0.7 2.0 0.6 4.2
Supra-littoral rock 0.0 0.2 0.2 0.0
Supra-littoral sediment 0.1 0.3 0.5 0.3
Littoral rock 0.0 0.2 0.0 0.0
Littoral sediment 0.1 0.2 0.1 0.1
Saltmarsh 0.3 0.1 0.5 0.0
Urban 2.6 0.5 0.9 0.6
Suburban 8.3 1.8 4.2 3.5
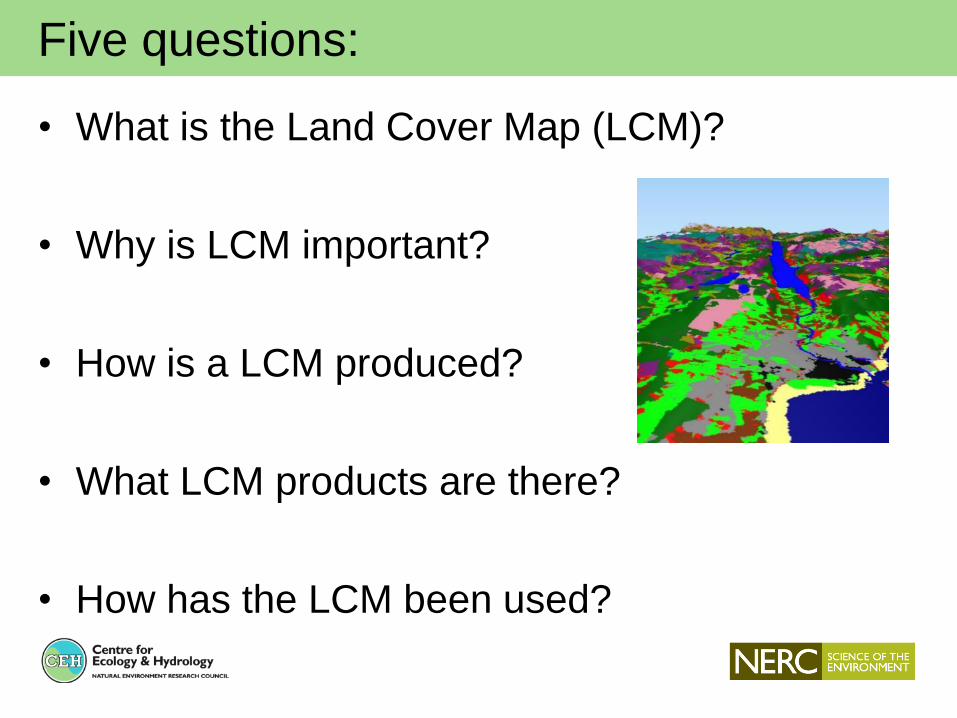
Land Cover Statistics
Land cover class ENGLAND SCOTLAND WALES NORTHERN IRELAND
Broadleaved woodland 7.5 4.0 7.9 3.3
Coniferous woodland 2.3 13.0 7.7 5.2
Arable 36.5 8.6 4.8 6.8
Improved grassland 32.8 17.3 47.3 57.3
Acid grassland 3.6 15.3 19.9 2.8
Heather 1.3 9.2 2.0 1.9
Heather grassland 0.7 17.1 1.1 4.4
Bog 1.5 8.2 1.3 6.5
Urban & Suburban 10.9 2.3 5.0 4.1

What is the Land Cover Map?
Land Cover Map 2015
(LCM2015)
• ~ 7.5 million land parcels
• 21 Land cover classes
• Input data: Landsat-type (~25m
optical)
• Based on image classification
• Classify summer-winter
composite images
• LCM2015 fourth in a series

Land cover map series
• 25 years of Land Cover Mapping

Brief history of UK Land Cover Mapping
LCM1990 (formerly LCMGB) LCM2000 LCM2007
25m Pixels Segments Parcels
LCM2000 ~ 6 million segment-based polygons
LCM2007 ~ 10 million parcel-based polygons

Why is LCM important?
Atmosphere & climate Agriculture
Health & hazards
Impact assessment
Ecology & conservation
Marine & coastal
Water & catchments
Education & publicity
Statistics, information
Urban studies
Telecommunications
Landscape planning
Supports a wide range of applications:

Seasonal nectar productivity in Great Britain
M Baude et al. Nature 530, 85–88 (2016)
doi:10.1038/nature16532
Based on LCM2007 and data on nectar availability through the year

Why is LCM important?
• Widely used by Academia, Commercial users, Government, NGOs
• Recent users include, Norfolk Rivers Trust, Severn Trent Water and a consortium including OFCOM and Microsoft
• Over 18,000 downloads of the various LCM data sets from the CEH Information Gateway over last 2 years, by over 580 unique users
Table 2: Number of unique users downloading LCM data from the CEH Information Gateway (July 2012 – Nov.
2014)Table 1: LCM usage licensed by CEH Knowledge Transfer
Academic Commercial Government,NGOs
LCM20071 157 38 64
LCM2000 316 192 70
LCM1990 620 132 88
1 Vector & 25m raster products only.
1km products only available via CIG.
1km products
25m raster & vector
LCM2007 301 279
LCM2000 197 0
LCM1990 71 0

Why is LCM important?
Educating young minds
LCM2007 now features in a GCSE textbook!

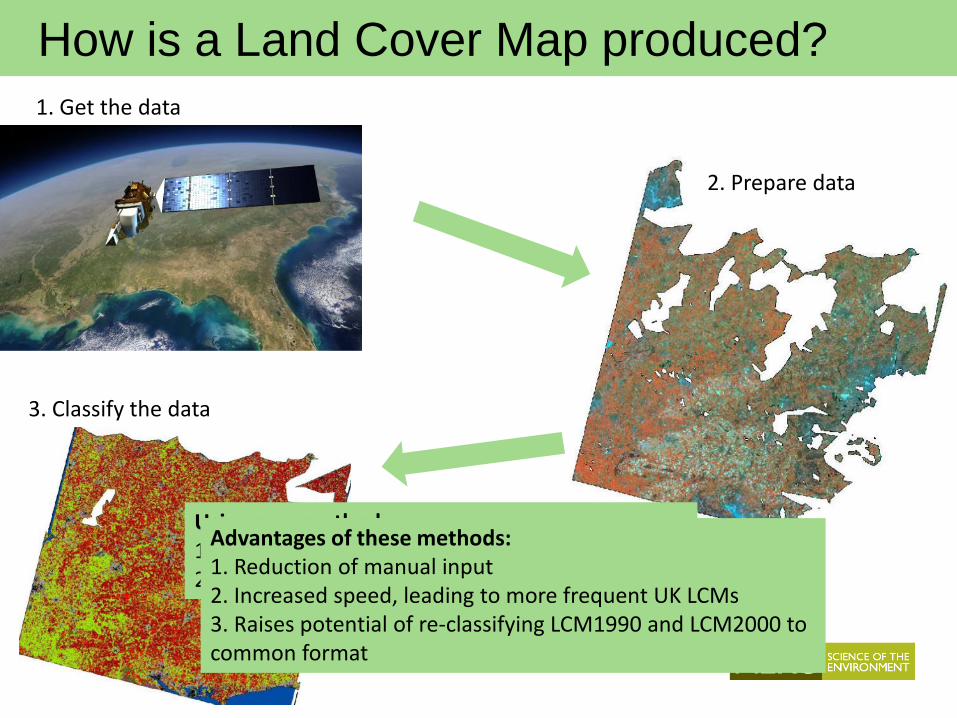
How is a Land Cover map produced?
1. Get the data
2. Prepare data
3. Classify the data

Input data: spectral data
Summer image (June 10th, path 204)
Winter image (March 12th, path 203)
Both images:• Landsat-8• Atmospheric + topographic
correction applied• Cloud maskedDisplayed as: RGB as NIR, SWIR, Red

Input data: composite extent
Common extent
Winterimage
Summer image

Input data: final composite
Summer & Winter data
Plus, additional data
DEMAspect
Slope
Plus, distance from sea, buildings, rivers and coast

How is a Land Cover map produced?
1. Get the data
2. Prepare data
3. Classify the data

How is a Land Cover map produced?
1. Get the data
2. Prepare data
3. Classify the data
Using new methods:1. New classification algorithm2. Harvesting training areas from existing LCMs
How is a Land Cover Map produced?
1. Get the data
2. Prepare data
3. Classify the data
Using new methods:1. New classification algorithm2. Harvesting training areas from existing LCMs
Advantages of these methods:1. Reduction of manual input2. Increased speed, leading to more frequent UK LCMs3. Raises potential of re-classifying LCM1990 and LCM2000 to common format
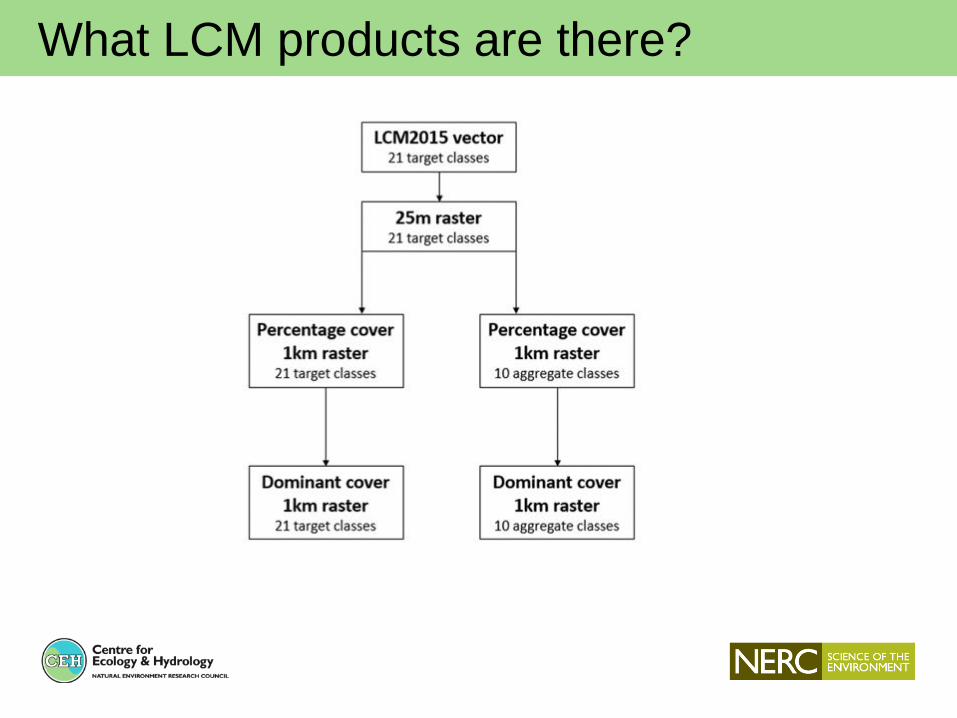
What LCM products are there?

What do they look like?
Comparison of the level of spatial detail in the different productsTop images approx. 35km x 35km Lower images approx. 6km x 6km

Vector attributes
Attribute Description
gid Unique parcel identifier (geometry identifier) for each parcel.
BHAB Dominant land cover at Broad Habitat level e.g. Improved grassland
Pix_dist Number of pixels of each class within the polygon
unc Uncertainty – mean per polygon probability from Random Forest, scaled between 0-255
Unc_stdev Standard deviation of the uncertainty.
npix Number of pixels in polygon
Modal_class
RECOMMENDED FOR DISPLAY. This attribute gives the LCM2015 class as an integer code from
1-21 (see Table 2). Note this is often referred to as the LCM2015 target class (see Appendix 3
for standard LCM colour mapping).
Modal_prop Proportion of polygon classified as dominant class
CompositeThe number of the composite image that the classification is derived from; 99 signifies infill
from LCM2007 (see Appendix 4 for details of composite images).

What do they look like?
1km percentage cover products

LCM2015

LCM2015
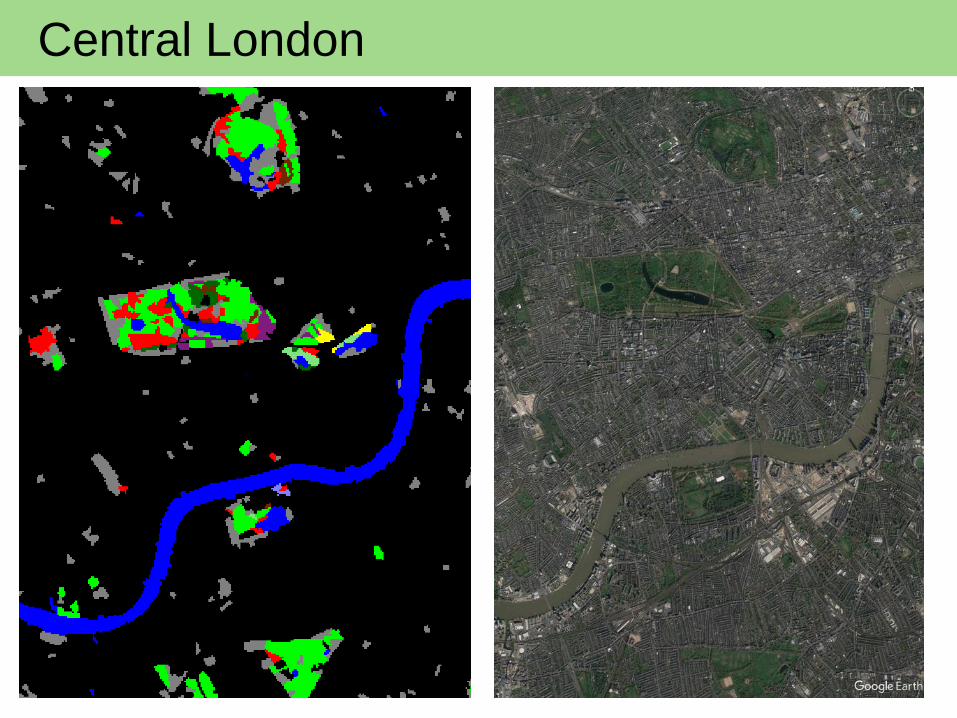
Central London

Further info….
Websites:
https://eip.ceh.ac.uk/lcm/LCM2015
https://www.ceh.ac.uk/services/land-cover-map-2015
[Google CEH LCM2015]
LCM2015 Data set document (available via website)
Note all LCM2015 data sets have doi’s.

LCM uses…

LCM uses…
Related Documents