LABOUR FORCE SURVEY REPORT 2015 Labour Market Information and Research Division Department of Employment Ministry of Labour and Human Resources

Welcome message from author
This document is posted to help you gain knowledge. Please leave a comment to let me know what you think about it! Share it to your friends and learn new things together.
Transcript
LABOUR FORCE SURVEY
REPORT 2015
Labour Market Information and Research Division
Department of Employment
Ministry of Labour and Human Resources

Labour Force Survey Report 2015
1
TABLE OF CONTENTS
FOREWORD ................................................................................................................................................................. 9
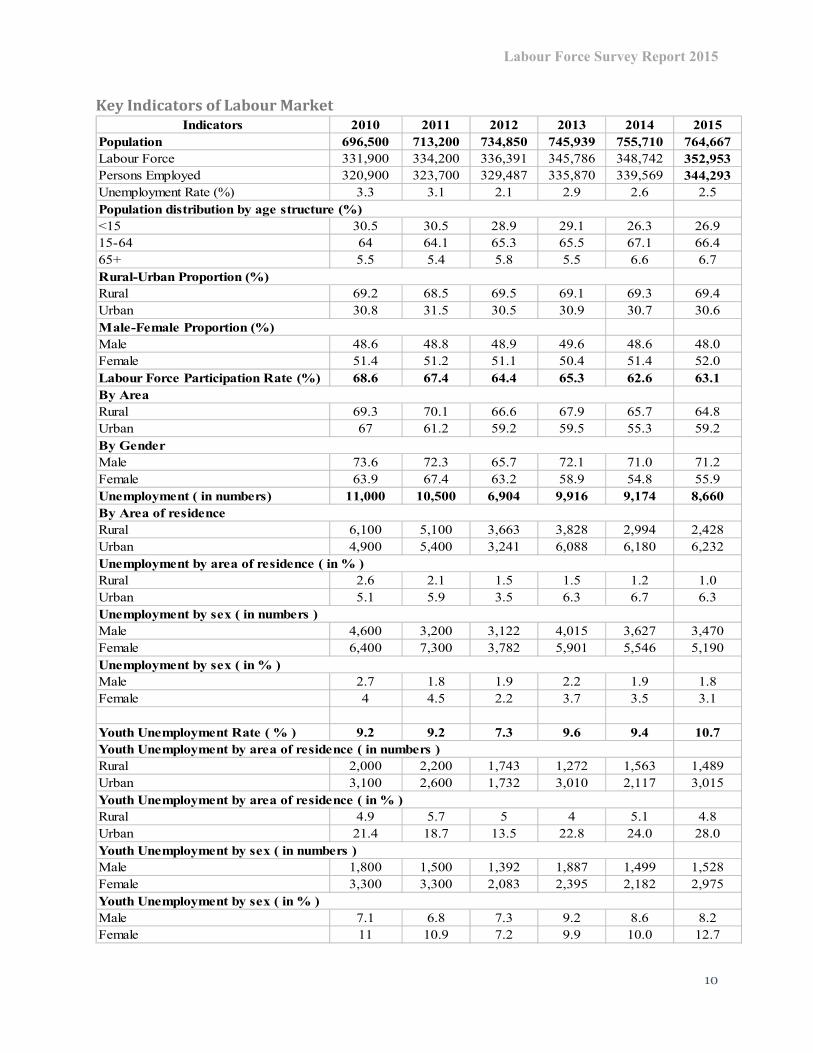
Key Indicators of Labour Market ........................................................................................................................ 10
INTRODUCTION ....................................................................................................................................................... 11
BACKGROUND ................................................................................................................................................ 11
OBJECTIVES ..................................................................................................................................................... 11
SURVEY METHODOLOGY AND SAMPLE DESIGN ................................................................................... 11
Table 1: Allocation of Sample Size across Urban and Rural Areas, 2015 .............................................................. 12
SURVEY INSTRUMENT .................................................................................................................................. 12
TRAINING OF SUPERVISORS AND ENUMERATORS ............................................................................... 13
FIELD OPERATIONS ....................................................................................................................................... 13
NON-RESPONSE RATE ................................................................................................................................... 13
DATA PROCESSING AND ANALYSIS .......................................................................................................... 13
Table 2: Sample Size Allocation and Response Rates by Dzongkhag-2015 ........................................................... 14
SECTION 2 - CONCEPTS & DEFINITIONS ............................................................................................................ 15
SECTION 3 – SUMMARY FINDINGS ..................................................................................................................... 18
1. SURVEY POPULATION .......................................................................................................................... 18
2. DEMOGRAPHIC CHARACTERISTICS ................................................................................................. 18
2.1 Population ......................................................................................................................................................... 18
Table 3: Percentage share of the estimated population by age group and gender, 2015. ........................................ 18
Figure 1: Population pyramid, 2015 ........................................................................................................................ 19
2.2 Marital Status .................................................................................................................................................... 20
Table 4: Percentage share of the estimated population by marital status, 2015 ...................................................... 20
2.3 Level of Education ............................................................................................................................................ 20
Table 5: Percentage share of the estimated population by level of education and gender, 2015 ............................. 20
2.4 Migration ........................................................................................................................................................... 21
Table 6: Percentage share of estimated population migrated by area of residence, 2015 ....................................... 21
Table 7: Percentage share of reasons for migration, 2015 ....................................................................................... 21
3. LABOUR FORCE ..................................................................................................................................... 22
3.1 Labour Force Participation ......................................................................................................................... 22
Figure 2: Labour force participation rates by gender, 2015 .................................................................................... 22
Figure 3: Labour force participation rates by area of residence, 2015 .................................................................... 23
3.2 Employment Status .................................................................................................................................... 24
Figure 4: Percentage share of employed persons by type of enterprise, 2015 ......................................................... 24
Figure 5: Percentage share of male and female employed persons by type of enterprise, 2015 ............................. 24
Table 8: Percentage share of employed persons by major economic activity and gender, 2015 ............................. 25
Labour Force Survey Report 2015
2
Table 9: Percentage share of employed persons by major occupation and gender, 2015 ........................................ 26
Table 10: Percentage share of employed persons by nature of employment and gender, 2015 .............................. 26
Table 11: Percentage share of employed persons by hours of work and gender, 2015 ........................................... 27
Figure 6: Percentage share of employed persons who worked for more than 48 hours by reasons, 2015 .............. 27
Figure 7: Percentage share of employed persons who worked for more than 48 hours by gender and reasons, 2015
................................................................................................................................................................................. 28
Table 12: Percentage share of employed persons who worked for more than 48 hours by area of residence, gender
and reasons, 2015 .................................................................................................................................................... 28
Figure 8: Percentage share of employed persons who tried to look for additional job by gender and area of
residence, 2015 ........................................................................................................................................................ 29
Table 13: Percentage share of regular paid employees by major occupation and average monthly earnings (in
Nu.), 2015 ............................................................................................................................................................... 29
Figure 9: Percentage share of regular paid employees by monthly earnings (in Nu.), 2015 ................................... 30
Table 14: Percentage share of employed persons by age group and level of education, 2015 ................................ 30
Figure 10: Percentage share of employed persons by gender and level of education, 2015 ................................... 31
3.3 Unemployment .................................................................................................................................................. 32
Figure 11: Percentage of unemployed persons by gender and area of residence, 2015 .......................................... 32
Figure 12: Unemployment rates by gender and age group, 2015 ............................................................................ 33
Figure 13: Percentage share of unemployed persons by gender, area of residence and level of education, 2015 ... 34
Figure 14: Percentage share of unemployed persons by Dzongkhag, 2015 ............................................................ 35
Figure 15: Percentage share of unemployed persons by duration of job search, 2015 ............................................ 35
4. ECONOMICALLY INACTIVE POPULATION ...................................................................................... 36
Table 15: Percentage share of economically inactive population by age group and reasons, 2015 ........................ 36
National Labour Force Statistics 2015 ......................................................................................................................... 37
Chapter 1: .................................................................................................................................................................... 38
Table 1.0: Total estimated population by age group, area of residence and gender 2015 - Bhutan .................... 38
Table 1.1: Total estimated population by Dzongkhag, area of residence and gender 2015 - Bhutan ................. 38
Table 1.2: Total number of persons who moved to the current location by previous district of residence 2015 -
Bhutan ................................................................................................................................................................. 39
Table 1.3: Total number of persons who moved to the current location by previous district of residence 2015 -
Rural Bhutan ....................................................................................................................................................... 40
Table 1.4: Total number of persons who moved to the current location by previous district of residence 2015 -
Urban Bhutan ...................................................................................................................................................... 40
Chapter 2: .................................................................................................................................................................... 41
Table 2.0: Total surveyed population distribution by age group, employment status and gender 2015 - Bhutan
............................................................................................................................................................................ 41
Table 2.1: Total surveyed population distribution by age group, employment status and gender 2015 - Rural
Bhutan ................................................................................................................................................................. 41
Table 2.2: Total surveyed population distribution by age group, employment status and gender 2015 - Urban
Bhutan ................................................................................................................................................................. 42

Labour Force Survey Report 2015
3
Chapter 3: .................................................................................................................................................................... 43
Table 3.0: Total employed by age group, type of enterprise and gender 2015 - Bhutan .................................... 43
Table 3.1: Total employed by age group, type of enterprise and gender 2015 - Rural Bhutan ........................... 43
Table 3.2: Total employed by age group, type of enterprise and gender 2015 - Urban Bhutan.......................... 44
Table 3.3: Total employed by dzongkhag, type of enterprise and gender 2015 - Bhutan ................................... 44
Chapter 4: .................................................................................................................................................................... 45
Table 4.0: Total employed persons by age group and level of education 2015 - Bhutan.................................... 45
Table 4.1: Total employed persons by age group and level of education 2015 - Male Bhutan .......................... 45
Table 4.2: Total employed persons by age group and level of education 2015 - Female Bhutan ....................... 46
Table 4.3: Total employed persons by age group and level of education 2015 - Rural Bhutan .......................... 46
Table 4.4: Total employed persons by age group and level of education 2015 - Rural Male ............................. 47
Table 4.5: Total employed persons by age group and level of education 2015 - Rural Female ......................... 47
Table 4.6: Total employed persons by age group and level of education 2015 - Urban Bhutan ......................... 48
Table 4.7: Total employed persons by age group and level of education 2015 - Urban Male ............................ 48
Table 4.8: Total employed persons by age group and level of education 2015 - Urban Female ........................ 49
Table 4.9: Total employed persons by dzongkhag and level of education 2015 - Bhutan .................................. 49
Table 4.10: Total employed persons by dzongkhag and level of education 2015 - Rural Bhutan ...................... 50
Table 4.11: Total employed persons by dzongkhag and level of education 2015 - Urban Bhutan ..................... 50
Chapter 5: .................................................................................................................................................................... 51
Table 5.0: Total employed persons by major economic activity and nature of employment 2015 - Bhutan ...... 51
Table 5.1: Total employed persons by major economic activity and nature of employment 2015 - Male Bhutan
............................................................................................................................................................................ 52
Table 5.2: Total employed persons by major economic activity and nature of employment 2015 - Female
Bhutan ................................................................................................................................................................. 53
Table 5.3: Total employed persons by major economic activity and nature of employment 2015 - Rural Bhutan
............................................................................................................................................................................ 54
Table 5.4: Total employed persons by major economic activity and nature of employment 2015 - Rural Male 55
Table 5.5: Total employed persons by major economic activity and nature of employment 2015 - Rural Female
............................................................................................................................................................................ 56
Table 5.6: Total employed persons by major economic activity and nature of employment 2015 - Urban
Bhutan ................................................................................................................................................................. 57
Table 5.7: Total employed persons by major economic activity and nature of employment 2015 - Urban Male
............................................................................................................................................................................ 58
Table 5.8: Total employed persons by major economic activity and nature of employment 2015 - Urban
Female ................................................................................................................................................................. 59
Chapter 6: .................................................................................................................................................................... 60
Table 6.0: Total employed persons by major economic activity and major occupation 2015 - Bhutan ............. 60
Table 6.1: Total employed persons by major economic activity and major occupation 2015 - Male Bhutan .... 61
Table 6.2: Total employed persons by major economic activity and major occupation 2015 - Female Bhutan . 62

Labour Force Survey Report 2015
4
Table 6.3: Total employed persons by major economic activity and major occupation 2015 - Rural Bhutan .... 63
Table 6.4: Total employed persons by major economic activity and major occupation 2015 - Rural Male ....... 64
Table 6.5: Total employed persons by major economic activity and major occupation 2015 - Rural Female ... 65
Table 6.6: Total employed persons by major economic activity and major occupation 2015 - Urban Bhutan ... 66
Table 6.7: Total employed persons by major economic activity and major occupation 2015 - Urban Male ...... 67
Table 6.8: Total employed persons by major economic activity and major occupation 2015 - Urban Female .. 68
Chapter 7: .................................................................................................................................................................... 69
Table 7.0: Total employed persons by major economic activity and hours worked per week 2015 – Bhutan ... 69
Table 7.1: Total employed persons by major economic activity and hours worked per week 2015 - Male
Bhutan ................................................................................................................................................................. 69
Table 7.2: Total employed persons by major economic activity and hours worked per week 2015 - Female
Bhutan ................................................................................................................................................................. 70
Table 7.3: Total employed persons by major economic activity and hours worked per week 2015 - Rural
Bhutan ................................................................................................................................................................. 70
Table 7.4: Total employed persons by major economic activity and hours worked per week 2015 - Rural Male
............................................................................................................................................................................ 71
Table 7.5: Total employed persons by major economic activity and hours worked per week 2015 - Rural
Female ................................................................................................................................................................. 71
Table 7.6: Total employed persons by major economic activity and hours worked per week 2015 - Urban
Bhutan ................................................................................................................................................................. 72
Table 7.7: Total employed persons by major economic activity and hours worked per week 2015 - Urban Male
............................................................................................................................................................................ 72
Table 7.8: Total employed persons by major economic activity and hours worked per week 2015 - Urban
Female ................................................................................................................................................................. 73
Chapter 8: .................................................................................................................................................................... 74
Table 8.0: Total employed persons by major occupation and hours worked per week 2015 - Bhutan ............... 74
Table 8.1 Total employed persons by major occupation and hours worked per week 2015 - Male Bhutan ....... 74
Table 8.2: Total employed persons by major occupation and hours worked per week 2015 - Female Bhutan .. 75
Table 8.3: Total employed persons by major occupation and hours worked per week 2015 - Rural Bhutan ..... 75
Table 8.4: Total employed persons by major occupation and hours worked per week 2015 - Rural Male ........ 75
Table 8.5: Total employed persons by major occupation and hours worked per week 2015 - Rural Female ..... 76
Table 8.6: Total employed persons by major occupation and hours worked per week 2015 - Urban Bhutan .... 76
Table 8.7: Total employed persons by major occupation and hours worked per week 2015 - Urban Male ....... 76
Table 8.8: Total employed persons by major occupation and hours worked per week 2015 - Urban Female .... 77
Chapter 9: .................................................................................................................................................................... 78
Table 9.0: Total employed persons by nature of employment and hours worked per week 2015 - Bhutan........ 78
Table 9.1: Total employed persons by nature of employment and hours worked per week 2015 - Male Bhutan
............................................................................................................................................................................ 78
Table 9.2: Total employed persons by nature of employment and hours worked per week 2015 - Female
Bhutan ................................................................................................................................................................. 78
Labour Force Survey Report 2015
5
Table 9.3: Total employed persons by nature of employment and hours worked per week 2015 - Rural Bhutan
............................................................................................................................................................................ 79
Table 9.4: Total employed persons by nature of employment and hours worked per week 2015 - Rural Male . 79
Table 9.5: Total employed persons by nature of employment and hours worked per week 2015 - Rural Female
............................................................................................................................................................................ 79
Table 9.6: Total employed persons by nature of employment and hours worked per week 2015 - Urban Bhutan
............................................................................................................................................................................ 80
Table 9.7: Total employed persons by nature of employment and hours worked per week 2015 - Urban Male 80
Table 9.8: Total employed persons by nature of employment and hours worked per week 2015 - Urban Female
............................................................................................................................................................................ 80
Chapter 10: .................................................................................................................................................................. 81
Table 10.0: Total employed persons by major economic activity and level of education 2015 - Bhutan ........... 81
Table 10.1: Total employed persons by major economic activity and level of education 2015 - Male Bhutan.. 82
Table 10.2: Total employed persons by major economic activity and level of education 2015 - Female Bhutan
............................................................................................................................................................................ 83
Table 10.3: Total employed persons by major economic activity and level of education 2015 - Rural Bhutan . 84
Table 10.4: Total employed persons by major economic activity and level of education 2015 - Rural Male .... 85
Table 10.5: Total employed persons by major economic activity and level of education, 2015 - Rural Female 86
Table 10.6: Total employed persons by major economic activity and level of education 2015 - Urban Bhutan 87
Table 10.7: Total employed persons by major economic activity and level of education 2015 - Urban Male ... 88
Table 10.8: Total employed persons by major economic activity and level of education 2015 - Urban Female 89
Chapter 11: .................................................................................................................................................................. 90
Table 11.0: Total employed persons by nature of employment and level of education 2015 - Bhutan .............. 90
Table 11.1: Total employed persons by nature of employment and level of education 2015 - Male Bhutan ..... 90
Table 11.2: Total employed persons by nature of employment and level of education 2015 - Female Bhutan .. 91
Table 11.3: Total employed persons by nature of employment and level of education 2015 - Rural Bhutan .... 91
Table 11.4: Total employed persons by nature of employment and level of education 2015 - Rural Male ........ 92
Table 11.5: Total employed persons by nature of employment and level of education 2015 - Rural Female .... 92
Table 11.6: Total employed persons by nature of employment and level of education 2015 - Urban Bhutan ... 93
Table 11.7: Total employed persons by nature of employment and level of education 2015 - Urban Male ....... 93
Table 11.8: Total employed persons by nature of employment and level of education 2015 - Urban Female ... 94
Chapter 12: .................................................................................................................................................................. 95
Table 12.0: Total employed persons by major occupation and nature of employment 2015 - Bhutan ............... 95
Table 12.1: Total employed persons by major occupation and nature of employment 2015 - Male Bhutan ...... 95
Table 12.2: Total employed persons by major occupation and nature of employment 2015 - Female Bhutan .. 96
Table 12.3: Total employed persons by major occupation and nature of employment 2015 - Rural Bhutan ..... 96
Table 12.4: Total employed persons by major occupation and nature of employment 2015 - Rural Male ........ 97
Table 12.5: Total employed persons by major occupation and nature of employment 2015 - Rural Female ..... 97
Labour Force Survey Report 2015
6
Table 12.6: Total employed persons by major occupation and nature of employment 2015 - Urban Bhutan .... 98
Table 12.7: Total employed persons by major occupation and nature of employment 2015 - Urban Male ....... 98
Table 12.8: Total employed persons by major occupation and nature of employment 2015 - Urban Female .... 99
Chapter 13: ................................................................................................................................................................ 100
Table 13.0: Number of employed persons who looked for additional job by age group and area of residence
and gender 2015 - Bhutan ................................................................................................................................. 100
Table 13.1: Number of employed persons who looked for additional work by Dzongkhag, area of residence
and sex 2015 - Bhutan....................................................................................................................................... 100
Table 13.2: Number of employed persons who looked for additional work by age group, reasons and sex 2015
- Bhutan ............................................................................................................................................................ 101
Table 13.3: Number of employed persons who looked for additional work by age group, area of residence,
reasons and ........................................................................................................................................................ 101
Table 13.4: Number of employed persons who looked for additional work by age group, area of residence,
reasons and sex 2015 - Urban Bhutan ............................................................................................................... 102
Table 13.5: Number of employed persons who looked for additional work by Dzongkhag, reasons and sex
2015 – Bhutan ................................................................................................................................................... 102
Table 13.6: Number of employed persons who looked for additional work by Dzongkhag, area of residence,
reasons and sex 2015 - Rural Bhutan ................................................................................................................ 103
Table 13.7: Number of employed persons who looked for additional work by Dzongkhag, area of residence,
reasons and sex 2015 - Urban Bhutan ............................................................................................................... 103
Chapter 14: ................................................................................................................................................................ 104
Table 14.0: Number of employed persons by major occupation and reasons for working more than 48 hours per
week 2015 - Bhutan .......................................................................................................................................... 104
Table 14.1: Number of employed persons by major occupation and reasons for working more than 48 hours per
week 2015 - Male Bhutan ................................................................................................................................. 104
Table 14.2: Number of employed persons by major occupation and reasons for working more than 48 hours per
week 2015 - Female Bhutan ............................................................................................................................. 105
Table 14.3: Number of employed persons by major occupation and reasons for working more than 48 hours per
week 2015 - Rural Bhutan ................................................................................................................................ 105
Table 14.4: Number of employed persons by major occupation and reasons for working more than 48 hours per
week 2015 - Rural Male .................................................................................................................................... 106
Table 14.5: Number of employed persons by major occupation and reasons for working more than 48 hours per
week 2015 - Rural Female ................................................................................................................................ 106
Table 14.6: Number of employed persons by major occupation and reasons for working more than 48 hours per
week 2015 - Urban Bhutan ............................................................................................................................... 107
Table 14.7: Number of employed persons by major occupation and reasons for working more than 48 hours per
week 2015 - Urban Male ................................................................................................................................... 107
Table 14.8: Number of employed persons by major occupation and reasons for working more than 48 hours per
week 2015-Urban Female ................................................................................................................................. 108
Chapter 15: ................................................................................................................................................................ 109
Table 15.0: Number of regular paid employees by major occupation and range of average monthly earnings (in
Nu.) 2015 – Bhutan ........................................................................................................................................... 109
Labour Force Survey Report 2015
7
Table 15.1: Number of regular paid employees by major occupation and range of average monthly earnings (in
Nu.) 2015 - Male Bhutan .................................................................................................................................. 109
Table 15.2: Number of regular paid employees by major occupation and range of average monthly earnings (in
Nu.) 2015 - Female Bhutan ............................................................................................................................... 110
Table 15.3: Number of regular paid employees by major occupation and range of average monthly earnings (in
Nu.) 2015 - Rural Bhutan .................................................................................................................................. 110
Table 15.4: Number of regular paid employees by major occupation and range of average monthly earnings (in
Nu.) 2015 - Rural Male ..................................................................................................................................... 111
Table 15.5: Number of regular paid employees by major occupation and range of average monthly earnings (in
Nu.) 2015 - Rural Female ................................................................................................................................. 111
Table 15.6: Number of regular paid employees by major occupation and range of average monthly earnings (in
Nu.) 2015 - Urban Bhutan ................................................................................................................................ 112
Table 15.7: Number of regular paid employees by major occupation and range of average monthly earnings (in
Nu.) 2015 - Urban Male .................................................................................................................................... 112
Table 15.8: Number of regular paid employees by major occupation and range of average monthly earnings (in
Nu.) 2015 - Urban Female ................................................................................................................................ 113
Chapter 16: Unemployment ....................................................................................................................................... 114
Table 16.0: Number of unemployed persons by age group, area of residence and sex 2015 -Bhutan .............. 114
Table 16.1: Number of unemployed persons by level of education, area of residence and sex 2015 - Bhutan 114
Table 16.3: Number of unemployed persons by level of education and Dzongkhag 2015 - Male Bhutan ....... 115
Table 16.4: Number of unemployed persons by level of education and Dzongkhag 2015 - Female Bhutan ... 115
Table 16.5: Number of unemployed persons by age group, level of education and sex 2015 - Bhutan ........... 116
Table 16.6: Number of unemployed persons by age group, level of education and sex 2015 - Rural Bhutan .. 117
Table 16.7: Number of unemployed persons by age group, level of education and sex 2015 - Urban Bhutan 118
Table 16.8: Number of unemployed persons by age group, duration taken to look for work and sex 2015 –
Bhutan ............................................................................................................................................................... 119
Table 16.9: Number of unemployed persons by age group, duration taken to look for work and sex 2015 -
Rural ................................................................................................................................................................. 120
Table 16.10: Number of unemployed persons by age group, duration taken to look for work and sex 2015 -
Urban Bhutan .................................................................................................................................................... 121
Chapter 17: ................................................................................................................................................................ 122
Table 17.0: Number of persons by age group, types of training availed and sex 2015 - Bhutan ...................... 122
Table 17.1: Number of persons by age group, types of training availed and sex 2015 - Rural Bhutan ............ 122
Table 17.2: Number persons by age group, types of training availed and sex 2015 - Urban Bhutan ............... 123
Table 17.3: Number persons by field of training, area of residence and sex 2015 - Bhutan ............................. 123
Chapter 18: ................................................................................................................................................................ 124
Table 18.0: Number of economically inactive population by age group and reasons 2015 – Bhutan .............. 124
Table 18.1: Number of economically inactive population by age group and reasons 2015 - Rural Bhutan ..... 125
Table 18.2: Number of economically inactive population by age group and reasons 2015 - Urban Bhutan .... 126
Table 18.3: Number of economically inactive population by age group and education level 2015 - Bhutan ... 127

Labour Force Survey Report 2015
8
Table 18.4: Number of economically inactive population by age group and education level 2015 - Rural
Bhutan ............................................................................................................................................................... 128
Table 18.5: Number of economically inactive population by age group and education level 2015 - Urban .... 129
Annexure I: Questionnaire for Labour Force Survey - 2015 ..................................................................................... 130
Annexure II: Genesis of the Report ........................................................................................................................... 142

Labour Force Survey Report 2015
9
FOREWORD
The Labour Market Information & Research Division (LMIRD) of the Department of
Employment, Ministry of Labour and Human Resources (MoLHR) is pleased to publish the 13th
National Labour Force Survey Report 2015 conducted in December 2015.
The survey was conducted with the aim of providing reliable and timely labour market information
on the labour market scenario of the country. The stability and growth of the country’s economy
depends on the proper execution of plans and programs. For this purpose, it is necessary to have a
clear knowledge and understanding of the size, composition and economic characteristics of the
population. Therefore, it is imperative to know and monitor the growth of human resources
categorized by its respective demographic features and educational level on a timely basis.
The Labour Force Survey (LFS) was incepted in 1998. From 2003, it became a regular activity of
the Ministry of Labour and Human Resources. The Department of Employment conducts the
Labour Force Survey annually to enable the Ministry to assess the current and emerging labour
market scenario in the country.
I would like to thank the National Statistics Bureau (NSB) for guiding us through sample designing
and for providing the tablets, enabling us to go paperless on our survey this year as well. I would
also like to extend special thanks to the Dzongkhag Administrations, the Thuemis, Gups, Gewog
Administrative Officers, Tshogpas, Chupons, Mangmis and our esteemed respondents for their
generous cooperation and support rendered to our survey teams without which the survey would
not have been possible.
I am hopeful that this survey report will be informative and a useful document for people working
at all levels of administration, decision making, planning, research and other group of
beneficiaries. I welcome readers’ feedbacks, suggestions and valuable comments for further
improvement.
MINISTER
MINISTRY OF LABOUR & HUMAN RESOURCES
Labour Force Survey Report 2015
10
Key Indicators of Labour Market
Indicators 2010 2011 2012 2013 2014 2015
Population 696,500 713,200 734,850 745,939 755,710 764,667
Labour Force 331,900 334,200 336,391 345,786 348,742 352,953
Persons Employed 320,900 323,700 329,487 335,870 339,569 344,293
Unemployment Rate (%) 3.3 3.1 2.1 2.9 2.6 2.5
<15 30.5 30.5 28.9 29.1 26.3 26.9
15-64 64 64.1 65.3 65.5 67.1 66.4
65+ 5.5 5.4 5.8 5.5 6.6 6.7
Rural 69.2 68.5 69.5 69.1 69.3 69.4
Urban 30.8 31.5 30.5 30.9 30.7 30.6
Male 48.6 48.8 48.9 49.6 48.6 48.0
Female 51.4 51.2 51.1 50.4 51.4 52.0
Labour Force Participation Rate (%) 68.6 67.4 64.4 65.3 62.6 63.1
Rural 69.3 70.1 66.6 67.9 65.7 64.8
Urban 67 61.2 59.2 59.5 55.3 59.2
Male 73.6 72.3 65.7 72.1 71.0 71.2
Female 63.9 67.4 63.2 58.9 54.8 55.9
Unemployment ( in numbers) 11,000 10,500 6,904 9,916 9,174 8,660
Rural 6,100 5,100 3,663 3,828 2,994 2,428
Urban 4,900 5,400 3,241 6,088 6,180 6,232
Rural 2.6 2.1 1.5 1.5 1.2 1.0
Urban 5.1 5.9 3.5 6.3 6.7 6.3
Male 4,600 3,200 3,122 4,015 3,627 3,470
Female 6,400 7,300 3,782 5,901 5,546 5,190
Male 2.7 1.8 1.9 2.2 1.9 1.8
Female 4 4.5 2.2 3.7 3.5 3.1
Youth Unemployment Rate ( % ) 9.2 9.2 7.3 9.6 9.4 10.7
Rural 2,000 2,200 1,743 1,272 1,563 1,489
Urban 3,100 2,600 1,732 3,010 2,117 3,015
Rural 4.9 5.7 5 4 5.1 4.8
Urban 21.4 18.7 13.5 22.8 24.0 28.0
Male 1,800 1,500 1,392 1,887 1,499 1,528
Female 3,300 3,300 2,083 2,395 2,182 2,975
Male 7.1 6.8 7.3 9.2 8.6 8.2
Female 11 10.9 7.2 9.9 10.0 12.7
Youth Unemployment by sex ( in % )
Unemployment by area of residence ( in % )
Unemployment by sex ( in numbers )
Unemployment by sex ( in % )
Youth Unemployment by area of residence ( in numbers )
Youth Unemployment by area of residence ( in % )
Youth Unemployment by sex ( in numbers )
By Area of residence
Population distribution by age structure (%)
Rural-Urban Proportion (%)
Male-Female Proportion (%)
By Area
By Gender

Labour Force Survey Report 2015
11
INTRODUCTION
BACKGROUND
Labour Force Survey is a regular activity of the
Labour Market Information & Research
Division of the Department of Employment.
The survey is conducted with a moving
reference period, that is, one week prior to date
of interview. This is the 13th nationwide Labour
Force Survey covering a national
representative sample of 6,000 households
(urban=4,500 & rural=1,500). The survey
covered more households in the urban areas
since urban population is more heterogeneous
and the economic activities prevailing in the
same are quite diverse. The data contained in
this report includes demographic and economic
characteristics.
The survey covered all 20 Dzongkhags with
99 sampled Chiwogs in rural areas and 205
sampled Blocks in urban areas.
OBJECTIVES
The survey aims to provide a quantitative
framework for the preparation of plans,
programs and formulation of policies affecting
the Bhutanese labour market.
Broadly the objective of the survey is to
generate the following:
• Percentage of economically active
population;
• Labour force participation rate;
Status of active population in number
(employed + unemployed);
• The labour force available in the
country by age group, gender, level of
education, nationality, marital status,
area of residence, industrial and
occupational classification, and hours
of work; and
• To provide information on main and
subsidiary economic activities and
women’s participation in the total
labour force.
SURVEY METHODOLOGY AND
SAMPLE DESIGN
The statistics and information contained in this
publication are obtained from 6,000 sampled
households in urban and rural areas. Personal
interviews were carried out in each sampled
household. Out of 6,000 sampled households
5,835 households (questionnaires) were fully
completed, accounting for 97.3 percent
completion rate. Of 6,000 households, only 165
households did not respond comprising of 2.7
percent as non-response rate. The sampling
frame for the rural and urban areas had been
used from Bhutan Living Standard Survey
2012 (BLSS 2012) developed by the National
Statistics Bureau.
Universe: The universe for the National
Labour Force Survey 2015 consists of all the
urban and rural areas in the country.
i. Sampling Frame: The sampling frame used
for the survey has been developed by the
National Statistics Bureau for BLSS 2012.
Each town in a Dzongkhag has been divided
into numerous enumeration blocks. The block
for the urban has been demarcated by NSB.
Enumeration blocks for urban and Chiwogs for
rural have been considered as Primary
Sampling Unit (PSUs). The households in both
urban and rural were considered as Secondary
Sampling Unit (SSUs).
ii. Stratification Plan: Each Dzongkhag is
considered as primary stratum and the
stratifying factors used were the geographical
demarcation of the administrative boundaries.

Labour Force Survey Report 2015
12
There were two sub-strata namely urban and
rural.
iii. Sampling Design: A stratified two-stage
sampling method has been adopted for the
survey as follows.
a. Selection of primary sampling units
(PSUs): The Blocks and the Chiwogs have
been taken as the PSUs in urban and rural
respectively. In both the urban and rural
areas the Blocks and Chiwogs were
selected with the assignment of Probability
Proportional to Size (PPS).
b. Selection of secondary sampling units
(SSUs): The households in the sampled
Blocks and Chiwogs were considered as
SSUs. A fixed number of sampled
households have been selected from the
selected PSUs by Circular Systematic
Sampling (CSS) method after listing the
households present in Blocks and Chiwogs
exhaustively.
iv. Sample size and its allocation: With the
resources at our disposal, the nature of
population distribution and the variability of
characteristics for which the estimates are to be
made, a sample of 6,000 households have been
found appropriate to provide reliable estimate
of key indicators of the labour market. The
sample sizes are more for urban areas than the
rural areas to capture the diverse
socioeconomic data in the urban, as given in the
Table 2. The sample allocation and response
rates by dzongkhag are given in Table 3.
Table 1: Allocation of Sample Size across
Urban and Rural Areas, 2015
SURVEY INSTRUMENT
Questionnaire of the survey was divided into
three parts:
a) Demographic characteristics
b) Economic characteristics and
c) Household characteristics
For the field enumeration following manuals
were prepared to ensure efficiency during the
fieldwork:
� Survey Manual which contained
basic concepts and definitions of
different terms in the survey
questionnaire. For the Enumerators it
contained enumerator’s code of
conduct and the ethical guidelines for
enumerators during the field survey.
For the Supervisors, it had detailed
instructions for listing households and
selecting sample households in the
urban and rural areas as well as
supervisor’s terms of reference.
� Enumerator’s Computer Assisted
Personal Interview (CAPI) manual to
guide the enumerators on using the
tablet for conducting the survey, how to
synchronize and export the completed
questionnaires to supervisor.
� Supervisor’s Computer Assisted
Personal Interview (CAPI) manual with detailed instructions for allocating
Area No. of
PSUs
Total No. of
Households
%
Share
Sample
Size
Urban 311 43,390 75.0 4,500
Rural 1,905 87,775 25.0 1,500
Total 2,216 131,165 100 6,000
Labour Force Survey Report 2015
13
survey questionnaires to individual
enumerator, verifying the completed
questionnaires and approving it.
In addition, following reference materials were
provided for the field survey:
(i) An age conversion table from
Bhutanese to English;
(ii) A table of International Standard
Classification of Occupation (ISCO-
88);
(iii) A table of International Standard
Classification of Industry (ISCI)
Revision-3; and
(iv) Household listing forms for urban and
rural areas
TRAINING OF SUPERVISORS AND
ENUMERATORS
For the labour force survey, fifty two university
graduates were recruited to enumerate 6,000
households and ten supervisors and one field
coordinator to supervise the field operation.
Supervisors were trained for five days in
sampling procedure and the questionnaire.
Followed by a week-long training program for
enumerators. During the training, enumerators
were explained on definition of each terms
contained in the questionnaire and they were
also trained in filling the questionnaire in the
tablets and a mock interview were also
conducted among enumerators to better equip
them with interview techniques. Prior to the
survey the field test was conducted for the new
technology and the questionnaire.
FIELD OPERATIONS
A month long survey was conducted in
December 2015. Fifty-two enumerators and ten
supervisors were divided into ten teams and
each team were provided one vehicle to carry
out the field enumeration. Each supervisor in
the team accompanied the enumerators
throughout the survey and conducted field
edits.
NON-RESPONSE RATE
There were non-responses despite the best
effort of the field enumerators and supervisors.
After three revisits, a household was treated as
non-responsive. Out of 6,000 households, 165
did not respond accounting to 2.7 percent non-
response rate. One major source of non-
sampling error is non-response. Non-response
is caused due to absence of occupants in the
sample house, due to total or partial refusal to
answer any of the questions and sometimes
when the respondent is incapable to answer.
DATA PROCESSING AND ANALYSIS
The survey was conducted using Computer
Assisted Personal Interview (CAPI) on tablets.
The data entry, editing and coding were done
during the field survey however, the data
validation, cleaning, tabulation and analyzing
were carried out using the STATA software by
the LMIRD officials in the Ministry.
Out of 6,000 sampled households, survey
covered 23,587 persons. An appropriate
sampling probability weights were assigned to
individual households to obtain realistic
estimates for the whole country.

Labour Force Survey Report 2015
14
Table 2: Sample Size Allocation and Response Rates by Dzongkhag-2015
Sl.
No. Dzongkhag
Total
Households
Total
Sample
Total
respondent
Response
rate
1 Bumthang 2,845 105 105 100
2 Chukha 14,707 840 787 93.7
3 Dagana 4,474 120 119 99.2
4 Gasa 741 30 30 100
5 Haa 2,580 90 90 100
6 Lhuentse 3,040 75 75 100
7 Mongar 7,594 255 255 100
8 Paro 7,056 180 175 97.2
9 Pema Gatshel 4,865 135 135 100
10 Punakha 5,188 180 180 100
11 Samdrup Jongkhar 6,935 300 300 100
12 Samtse 11,586 390 390 100
13 Sarpang 7,687 375 306 81.6
16 Thimphu 20,948 1,905 1,872 98.3
14 Trashigang 10,260 270 270 100
15 Trashiyangtse 3,783 120 120 100
17 Trongsa 2,780 105 105 100
18 Tsirang 3,650 105 105 100
19 Wangdi 6,956 300 298 99.3
20 Zhemgang 3,490 120 118 98.3
Total 131,165 6,000 5,835 97.3
Labour Force Survey Report 2015
15
SECTION 2 - CONCEPTS & DEFINITIONS
In order for the users to interpret the results
from the Survey, it is essential to be familiar
with the concepts used. The definitions and
explanations for each of the key concepts are
given below:
1. Reference period
This refers to the week preceding the date of
the survey interview. The reference period for
this survey is dynamic.
2. Study
It includes, those who are presently school
going children, monks residing in the
Dratshangs and Shedras and those undergoing
higher studies (Post Graduation, Ph.D, etc.)
3. Occupation
Occupation is the type of work, trade or
profession performed by the person during the
reference period.
4. Industry
The term industry is used to refer the activity of
the establishment in which the employed
person worked during the reference period.
5. Work
According to International Labour
Organization (ILO) standards and United
Nations 1993 System of National Accounts,
work includes any kind of works or businesses
including collecting water or firewood, cow
herding, tailoring or making mates, etc. even
for the households’ own consumption.
Examples of activities which are counted as
work
Activities counted as work
• Growing or gathering crops from the
field, producing eggs, milk, food, cow
herding, etc.
• Milling and other food processing
activities, milling grains, making butter
and cheese, brewing local wine, etc.
• Yarning and weaving clothes, making
baskets and mats, peat making,
tailoring, and making furniture, etc
• Construction of own house/buildings,
major renovation of private roads and
other private facilities.
• Fetching water, cutting or collecting
firewood.
• Activities of a religious order such as a
Rimdro, rituals etc.
Activities not counted as work
• Preparing and serving meals
• Family member (baby-sitting, training
& instructing children, transporting
household members/goods, repairing
household durables, vehicles or other
goods, etc.)
6. Nature of Employment
Nature of employment or employment status
comprises the following codes:
1. Regular paid employee;
2. Casual paid employee;
3. Contract/Piece paid worker;
4. Own account worker (Non-
agriculture);
5. Own account worker (Agriculture);
6. Family worker (Non-agriculture); and
7. Family worker (Agriculture).

Labour Force Survey Report 2015
16
6.1. Regular Paid employee: A person who
performed some kind of work, during the
reference period, for wage or salary, in cash
or in kind.
6.2. Casual paid employee: Those employees
who work as and when they find the job for
which they get paid either in cash or in
kind. Example: Gomchen who have
performed rituals during the reference
period, Lhadrip, etc.
6.3. Contract/Piece paid worker: A worker
who has a temporary contract to do a
particular piece of work, but is not an
employee of the company who they are
working for.
6.4. Own account worker (non-agriculture): A person who operates his own enterprise
all alone in the non-agriculture sector and
neither employs anybody to operate his /her
enterprise nor employed by anybody. (e.g.
petty-trader, advocate who practices
independently).
6.5. Own account worker (Agriculture): A
person who operates his own enterprise all
alone in the agriculture sector and neither
employs anybody to operate his /her
enterprise nor employed by anybody. (e.g.
a farmer growing apple in his own land).
6.6. Family worker (Non-agriculture): A
person who helps in an economic enterprise
operated by a member of his/her family
without payment of wages or salary in the
non-agriculture sector. (e.g.: a daughter
who helps in hand-loom weaving).
6.7. Family worker (Agriculture): A person
who helps in an economic enterprise
operated by a member of his/her family
without payment of wages or salary in the
agriculture sector. (e.g.: a wife who helps
her husband in the apple farm).
7. Employed
If a person has performed some work for wage
or salary, in cash or in kind, profit or family
gain in monetary terms during the reference
period or the person who has a job or business
formally attached but temporarily absent from
the work and going to resume the work.
8. Unemployed
Unemployed is based on three categories
which are to be followed simultaneously.
They are:
• Without work;
• Currently available for work; and
• Seeking work.
9. Chronic unemployment
If a person is unemployed for more than a year
is considered to be chronically unemployed.
10. Underemployment
The underemployment is defined based on
two criteria which are to be followed
simultaneously.
(i) They are: Working less than normal
duration; and
(ii) Seeking or being available for additional
work during the reference period.
11. Earnings
It refers to the major or the main source of
income through which the person earns a
livelihood viz. wage, salary, bonuses,
incentives and tips, etc.

Labour Force Survey Report 2015
17
12. Household
Household is defined as a group of people who
live together under one roof and eat their meals
together from the same kitchen irrespective of
relationship. A single person who makes his or
her own food arrangements is counted as a
separate household (one member household).
Who to include in the household member:
1. Those that usually reside in the household
and are present on the day of interview.
2. Those who usually reside in the household
but are temporarily absent/away from the
household from the day of interview for
less than six months (Excluding serial no.
3, since they had been away until the date
of interview).
3. Those persons registered in the households
but lives elsewhere, on labour work,
studying including students & monks and
all military personnel who reside in the
barracks.
13. Disable
A person is considered disable if they are
impaired with the following:
• Physically unfit for work
• Difficulty in seeing
• Difficulty in hearing
• Difficulty in walking
14. Migration
The movement of people across a specific
boundary for the purpose of establishing a new
or semi-permanent residence.
There are two types of migration:
1. International migration (movement
between countries; immigration).
2. Internal migration (movement within the
country; emigration).

Labour Force Survey Report 2015
18
SECTION 3 – SUMMARY FINDINGS
The information contained in this report is
based on the data collected from 6,000 sampled
households interviewed from 28th November –
28th December, 2015. In order to facilitate
computation and comparison, the results of the
survey is presented in tables and charts. By
applying frequency weights for urban and rural
separately, the survey population has been
estimated at 764,667 for the year 2015.
1. SURVEY POPULATION
The Labour Force Survey 2015 estimated the
population for Bhutan at 764,667 with 367,419
males and 397,248 females. Of the total
estimated population, the rural population
increased by 0.1 percentage points in 2015. In
other words, 69.4 percent of the population
resided in the rural areas in 2015 compared to
69.3 percent in 2014. Conversely, the urban
population decreased by 0.1 percentage points
in 2015. In other words, 30.6 percent of the
estimated population resided in urban areas in
2015 compared to 30.7 percent in 2014. The
population growth has been estimated as 1.2
percent.
2. DEMOGRAPHIC
CHARACTERISTICS
2.1 Population
Considering the age group of the population,
26.9 percent are below the age of 14 years, 18.5
percent are between the age group of 15-24
years, 47.9 percent are between the age group
of 25-64 years and 6.7 percent are 65 years and
above. The percentage share of the estimated
population by specific age group is given in
Table 3.
Table 3: Percentage share of the estimated population by age group and gender, 2015.
Age group Gender Total
Male Female
0-4 8.1 6.8 7.4
5-9 9.2 8.2 8.7
10-14 10.8 10.8 10.8
15-19 10.4 10.9 10.6
20-24 7.7 8.1 7.9
25-29 8.0 9.3 8.7
30-34 7.1 7.8 7.5
35-39 7.1 7.4 7.2
40-44 5.7 6.2 6.0
45-49 5.4 5.5 5.4
50-54 4.9 4.6 4.8
55-59 4.5 4.2 4.4
60-64 3.8 4.0 3.9
65-69 2.6 2.2 2.4
70-74 2.2 1.5 1.8
75-79 1.0 1.0 1.0
80-84 1.1 1.2 1.1
85+ 0.5 0.4 0.4
Total 100 100 100
Labour Force Survey Report 2015
19
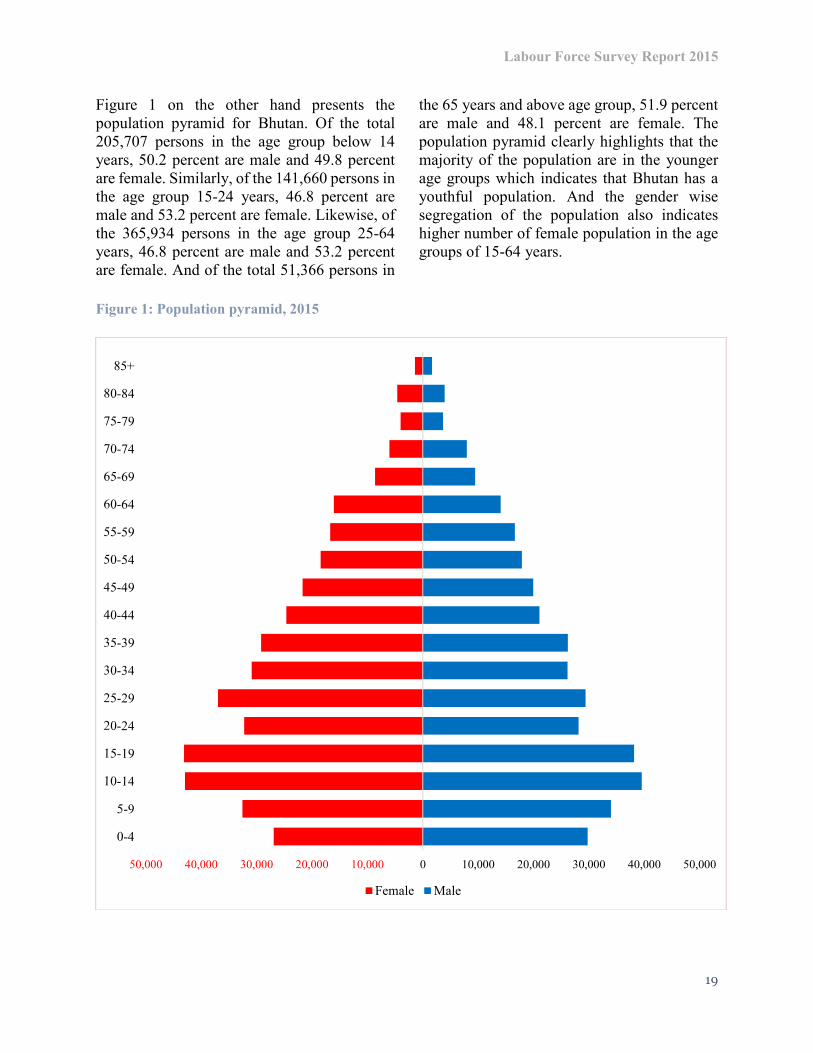
Figure 1 on the other hand presents the
population pyramid for Bhutan. Of the total
205,707 persons in the age group below 14
years, 50.2 percent are male and 49.8 percent
are female. Similarly, of the 141,660 persons in
the age group 15-24 years, 46.8 percent are
male and 53.2 percent are female. Likewise, of
the 365,934 persons in the age group 25-64
years, 46.8 percent are male and 53.2 percent
are female. And of the total 51,366 persons in
the 65 years and above age group, 51.9 percent
are male and 48.1 percent are female. The
population pyramid clearly highlights that the
majority of the population are in the younger
age groups which indicates that Bhutan has a
youthful population. And the gender wise
segregation of the population also indicates
higher number of female population in the age
groups of 15-64 years.
Figure 1: Population pyramid, 2015
50,000 40,000 30,000 20,000 10,000 0 10,000 20,000 30,000 40,000 50,000
Female Male

Labour Force Survey Report 2015
20
2.2 Marital Status
The marital status of the population is given in
Table 3, where 46.8 percent are married and
46.5 percent are single or have never married.
The other status like living together, widowed
and divorced account for smaller proportions of
the total population.
Table 4: Percentage share of the estimated population by marital status, 2015
Marital Status percent share
Single/Never married 46.5
Living together 0.1
Married 46.8
Widowed 4.3
Divorced 2.3
Total 100.0
2.3 Level of Education
As per the level of educational attainment of
the estimated population, 46.0 percent had no
formal education, 21.2 percent had education
level up to primary education, 2.4 percent of
the population had completed non-formal
education, 2.3 percent had monastic education,
23.1 percent of the population had an
educational level of higher secondary and
below, 4.5 percent of the population had an
educational level of bachelor’s degree and
below, 0.4 percent of the population had
master’s degree and above. Of the total
367,419 males, 40.7 percent did not have a
formal education whereas of the total 397,248
females, 50.8 percent did not have a formal
education.
Table 5: Percentage share of the estimated population by level of education and gender, 2015
Level of Education Gender
Total Male Female
No formal education 40.7 50.8 46.0
Nursery 3.1 2.4 2.7
Primary 20.5 16.7 18.5
Lower Secondary 8.0 7.5 7.7
Middle Secondary 9.0 9.3 9.2
Higher Secondary 6.5 5.8 6.2
Undergraduate 1.6 1.4 1.5
Bachelor degree 3.9 2.2 3.0
Master degree & above 0.5 0.3 0.4
NFE 1.4 3.3 2.4
Religious Professionals 4.7 0.2 2.3
Don't know 0.1 0.0 0.1
Total 100.0 100.0 100.0

Labour Force Survey Report 2015
21
2.4 Migration
In 2015, 23.8 percent of the estimated
population moved from rural areas to urban
areas whereas on the other hand 25.1 percent of
the estimated population moved from urban
areas to rural areas. These percentages have
been calculated purely based on the area of
current residence and the area of origin.
Table 6: Percentage share of estimated population migrated by area of residence, 2015
Area of current
residence Area of origin (percent share)
Total
Urban Rural
Urban 44.8 23.8 68.6
Rural 25.1 6.3 31.4
Total 69.9 30.1 100
Table 7 provides the various self-responded
reasons for movement to the current area of
residence. The largest proportion of the
movement occurred mainly due to family move
which accounted for 37.4 percent followed by
education with 19.1 percent and job transfer
accounting for 12.7 percent.
Most females responded family move which
accounted for 45.3 percent and education
which accounted for 18.0 percent as the main
reasons for movement.
Likewise, most males regarded family move
which accounted for 29.0 percent, job transfer
which accounted for 20.5 percent and
education which accounted for 20.3 percent as
the main reasons for movement
Table 7: Percentage share of reasons for migration, 2015
Reasons for movement Male Female Total
Search of work 13.0 4.6 8.7
To start new job 11.4 7.3 9.3
To start new business 2.7 4.2 3.5
Job transfer 20.5 5.2 12.7
Marriage 0.0 8.7 4.4
Education 20.3 18.0 19.1
Training 0.8 0.4 0.6
Resettlement 1.5 2.8 2.2
Health reasons 0.8 3.5 2.2
Family move 29.0 45.3 37.4
Total 100.0 100.0 100.0
Labour Force Survey Report 2015
22
3. LABOUR FORCE
3.1 Labour Force Participation
The labour force participation rate is the
proportion of the population aged 15 years and
older that is economically active. In other
words, the labour force consists of all people
who supply labour for the production of goods
and services during a specified period. People
in those age groups who are not counted as
participating in the labour force are typically
students and the older people and the retired
people.
The labour force participation rate has
increased from 62.6 percent in 2014 to 63.1
percent in 2015. Similarly, the male labour
force participation rate has increased from 71.0
percent in 2014 to 71.2 percent in 2015 and the
female labour force participation rate has
increased from 54.8 percent in 2014 to 55.9
percent in 2015. Likewise, the labour force
participation rates by area of residence also
show positive trends especially in the urban
areas. The urban labour force participation
rates have drastically increased to 59.2 percent
in 2015 compared to only 55.3 percent in 2014.
However, the rural labour force participation
rate has decreased to 64.8 percent in 2015
compared to 65.7 percent in 2014.
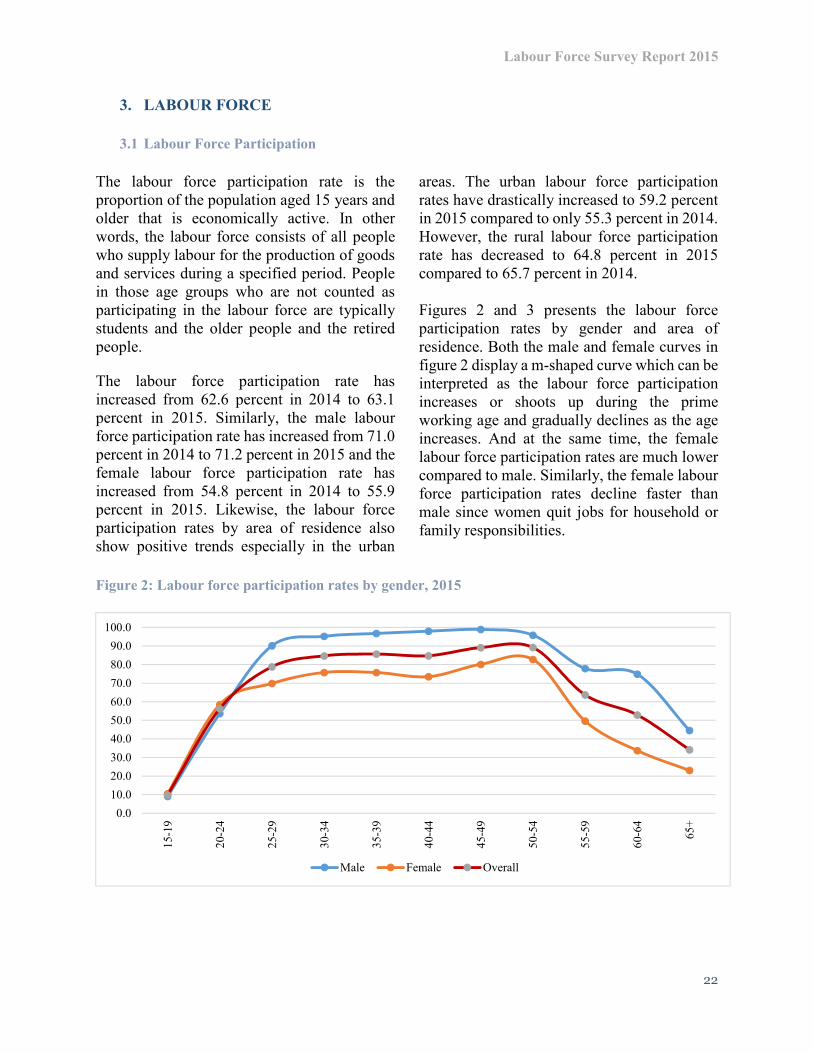
Figures 2 and 3 presents the labour force
participation rates by gender and area of
residence. Both the male and female curves in
figure 2 display a m-shaped curve which can be
interpreted as the labour force participation
increases or shoots up during the prime
working age and gradually declines as the age
increases. And at the same time, the female
labour force participation rates are much lower
compared to male. Similarly, the female labour
force participation rates decline faster than
male since women quit jobs for household or
family responsibilities.
Figure 2: Labour force participation rates by gender, 2015
0.0
10.0
20.0
30.0
40.0
50.0
60.0
70.0
80.0
90.0
100.0
15-1
9
20-2
4
25-2
9
30-3
4
35-3
9
40-4
4
45-4
9
50-5
4
55-5
9
60-6
4
65+
Male Female Overall
Labour Force Survey Report 2015
23
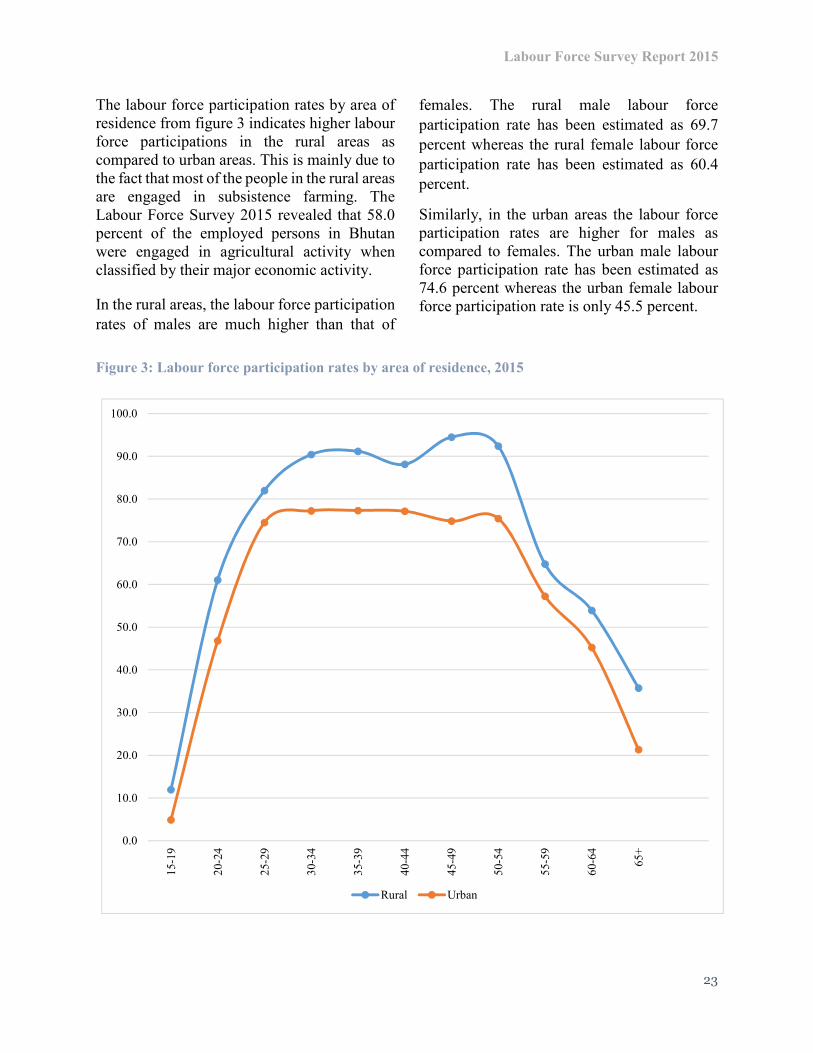
The labour force participation rates by area of
residence from figure 3 indicates higher labour
force participations in the rural areas as
compared to urban areas. This is mainly due to
the fact that most of the people in the rural areas
are engaged in subsistence farming. The
Labour Force Survey 2015 revealed that 58.0
percent of the employed persons in Bhutan
were engaged in agricultural activity when
classified by their major economic activity.
In the rural areas, the labour force participation
rates of males are much higher than that of
females. The rural male labour force
participation rate has been estimated as 69.7
percent whereas the rural female labour force
participation rate has been estimated as 60.4
percent.
Similarly, in the urban areas the labour force
participation rates are higher for males as
compared to females. The urban male labour
force participation rate has been estimated as
74.6 percent whereas the urban female labour
force participation rate is only 45.5 percent.
Figure 3: Labour force participation rates by area of residence, 2015
0.0
10.0
20.0
30.0
40.0
50.0
60.0
70.0
80.0
90.0
100.0
15-1
9
20-2
4
25-2
9
30-3
4
35-3
9
40-4
4
45-4
9
50-5
4
55-5
9
60-6
4
65+
Rural Urban
Labour Force Survey Report 2015
24
Employment Status
The working age population which is 15 years
and above is estimated at 558,959 persons of
which 352, 953 persons are in the labour force
(economically active) and 206,006 persons are
not in the labour force (economically inactive).
Every job has been classified by major
economic activity, major occupation, type of
enterprise, nature of employment and hours of
work which are presented in the tables and
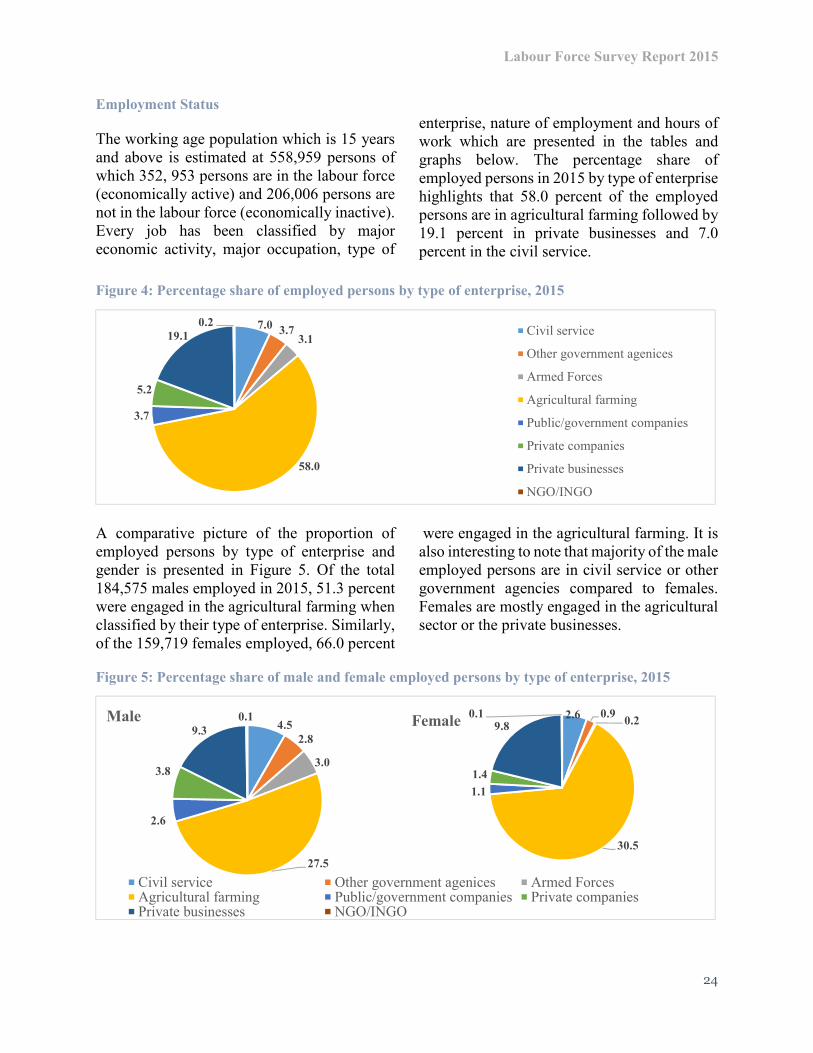
graphs below. The percentage share of
employed persons in 2015 by type of enterprise
highlights that 58.0 percent of the employed
persons are in agricultural farming followed by
19.1 percent in private businesses and 7.0
percent in the civil service.
Figure 4: Percentage share of employed persons by type of enterprise, 2015
A comparative picture of the proportion of
employed persons by type of enterprise and
gender is presented in Figure 5. Of the total
184,575 males employed in 2015, 51.3 percent
were engaged in the agricultural farming when
classified by their type of enterprise. Similarly,
of the 159,719 females employed, 66.0 percent
were engaged in the agricultural farming. It is
also interesting to note that majority of the male
employed persons are in civil service or other
government agencies compared to females.
Females are mostly engaged in the agricultural
sector or the private businesses.
Figure 5: Percentage share of male and female employed persons by type of enterprise, 2015
7.03.7
3.1
58.0
3.7
5.2
19.1
0.2Civil service
Other government agenices
Armed Forces
Agricultural farming
Public/government companies
Private companies
Private businesses
NGO/INGO
4.5
2.8
3.0
27.5
2.6
3.8
9.3
0.1Male
Civil service Other government agenices Armed ForcesAgricultural farming Public/government companies Private companiesPrivate businesses NGO/INGO
2.6 0.90.2
30.5
1.1
1.4
9.80.1
Female

Labour Force Survey Report 2015
25
The categorization of the employed persons by
their major economic activity highlights that
the majority of the employed persons are
engaged in the agriculture and forestry sector
which accounts for 58.0 percent. More female
(30.5 percent) are engaged in this sector
compared to male (27.5 percent). Likewise, 9.2
percent of the total employed persons were
engaged in the public administration and
defense activities where the male employed
constituted 7.4 percent and the female
employed constituted 1.8 percent.
The wholesale and retail trade engaged 7.8
percent of the total employed persons where the
male employed constituted 3.2 percent and the
female employed constituted 4.6 percent.
The employed persons in the agriculture and
forestry sector are much higher in the rural
areas which accounts for 57.0 percent
compared to only 1.0 percent employed in
agriculture and forestry sector in the urban
areas.
Likewise, the persons employed in public
administration and defense activities in the
rural area accounted for only 2.2 percent
whereas the urban area had 6.9 percent
employment share in the public and defense
sector in the urban area.
Similarly, the employed persons in the
wholesale and retail trade accounted for 3.7
percent in the rural areas whereas the employed
persons in the wholesale and retail trade in the
urban areas accounted for only 4.1 percent.
Table 8: Percentage share of employed persons by major economic activity and gender, 2015
Major Economic Activity
Male
Female
Total
Agriculture and Forestry 27.5 30.5 58.0
Mining and Quarrying 0.5 0.1 0.6
Manufacturing 2.8 3.7 6.5
Electricity, Gas and Water Supply 0.6 0.2 0.8
Construction 1.5 0.3 1.8
Wholesale and Retail trade 3.2 4.6 7.8
Hotels and Restaurants 1.1 1.2 2.3
Transport, Finance and Communications 3.3 0.3 3.7
Financial Intermediation 0.5 0.2 0.7
Real Estate, Renting and Business Activities 0.7 0.3 0.9
Public Administration and Defense Activities 7.4 1.8 9.2
Education 1.7 1.6 3.3
Health and Social Work 2.9 1.1 4.0
Private Households with Employed Persons 0.0 0.5 0.6
Total 53.6 46.4 100.0

Labour Force Survey Report 2015
26
As highlighted in the major economic activity,
since majority of the employed persons are
engaged in the agriculture and forestry sector,
the employed persons when classified by their
major occupation show that skilled agricultural
workers accounted for 58.0 percent of the total
employed persons followed by 8.7 percent of
the employed persons in professionals and
service workers, shop and market sales workers
respectively. The lowest share of the employed
persons are in the legislators, senior officials
and managerial positions.
Table 9: Percentage share of employed persons by major occupation and gender, 2015
Major occupation
Male
Female
Total
Legislators, Senior Officials and Managers 1.6 0.4 2.0
Professionals 5.8 2.8 8.7
Technicians and Associate Professionals 2.4 1.2 3.6
Clerks 1.6 1.1 2.6
Service Workers and Shop and Market Sale Workers 3.2 5.4 8.7
Skilled Agricultural Workers 27.5 30.5 58.0
Craft and Related Workers 2.1 3.3 5.5
Plant and Machine Operators 4.3 0.1 4.4
Elementary Occupations 2.0 1.4 3.4
Armed Forces 3.0 0.1 3.2
Total 53.6 46.4 100.0
Table 10 provides further categorization of the
employed persons by nature of employment.
Most employed persons were categorized as
family worker (agriculture) which accounted
for 32.4 percent and mostly dominated by
female. The own account worker (agriculture)
accounted for 25.1 percent and males had
higher share while compared to female.
Likewise, 23.1 percent of the employed
persons were categorized as regular paid
employees where the male counterpart had the
highest share compared to female.
The own account worker (agriculture) in the
rural areas accounted for 24.6 percent whereas
the own-account worker (agriculture) in the
urban areas accounted for only 0.5 percent.
Likewise, the regular paid employees in the
rural areas accounted for only 7.1 percent
whereas the regular paid employees in the
urban areas accounted for 16.0 percent.
Table 10: Percentage share of employed persons by nature of employment and gender, 2015
Nature of employment Male Female Total
Regular Paid Employee 16.6 6.5 23.1
Casual Paid Employee 2.1 0.5 2.7
Contract/Piece Paid Worker 1.0 0.3 1.3
Own-account Worker (Non-agriculture) 6.0 6.2 12.3
Own-account Worker (Agriculture) 14.7 10.4 25.1
Family Worker (Non-agriculture) 0.7 2.5 3.2
Family Worker (Agriculture) 12.5 19.9 32.4
Total 53.6 46.4 100

Labour Force Survey Report 2015
27
Table 11 depicts the statistics and proportions
of employed persons both male and female by
hours worked in a week. The largest proportion
of the employed persons worked in between
40-49 hours which accounted for 35.4 percent
followed by 50-59 hours which accounted for
22.0 percent. The figures also reveal that about
4.9 percent of the total employed persons
worked for less than 30 hours in a week and are
mostly female employed persons. Similarly,
about 5.6 percent of the employed persons
worked for more than 80 hours in week and are
mostly male employed persons.
Table 11: Percentage share of employed persons by hours of work and gender, 2015
Of the total employed persons, 51.9 percent
worked for more than 48 hours in a week. In
absolute figures, 178,170 employed persons
worked for more than 48 hours in a week. The
main reason cited for working more than 48
hours was “wanted more earnings” which
accounted for 60.3 percent followed by
“requirement of the job” which accounted for
39.0 percent. The higher share of employed
persons citing “requirement of the job” could
be mainly due to the fact that most employed
persons are engaged in agricultural farming in
the labour force. The comparative gender wise
information has been provided in figure which
highlights that compared to male, most female
cited “wanted more earnings” for working
more than 48 hours in a week and likewise
compared to female, most male cited
“requirement of the job” for working more than
48 hours in a week.
Figure 6: Percentage share of employed persons who worked for more than 48 hours by reasons,
2015
Gender < 30 hrs 30-39 hrs 40-49 hrs 50-59 hrs 60-69 hrs 70-79 hrs 80 + hrs
Male 1.6 7.5 19.9 11.5 5.0 4.6 3.6
Female 3.3 6.0 15.5 10.5 4.0 5.0 2.0
Total 4.9 13.5 35.4 22.0 8.9 9.6 5.6
60.3%
39.0%
0.5% 0.2%
Wanted more earnings Requirement of the job Exceptional week Other reasons
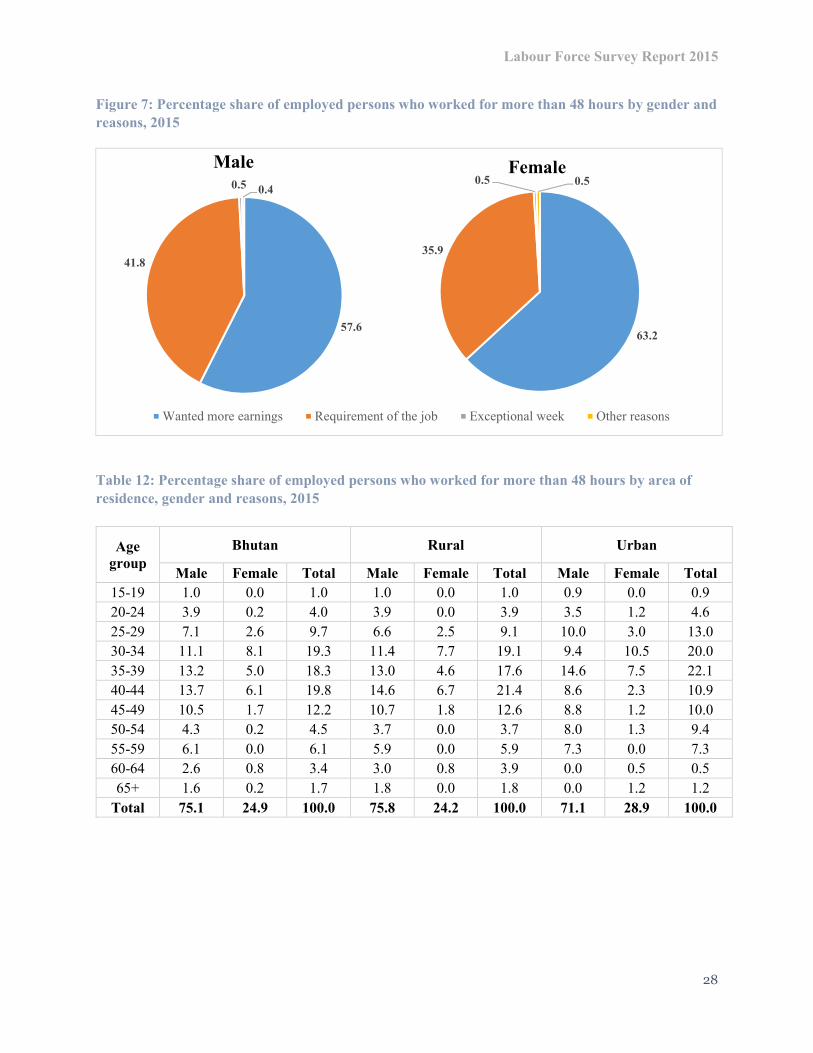
Labour Force Survey Report 2015
28
Figure 7: Percentage share of employed persons who worked for more than 48 hours by gender and
reasons, 2015
Table 12: Percentage share of employed persons who worked for more than 48 hours by area of
residence, gender and reasons, 2015
Age
group
Bhutan Rural Urban
Male Female Total Male Female Total Male Female Total
15-19 1.0 0.0 1.0 1.0 0.0 1.0 0.9 0.0 0.9
20-24 3.9 0.2 4.0 3.9 0.0 3.9 3.5 1.2 4.6
25-29 7.1 2.6 9.7 6.6 2.5 9.1 10.0 3.0 13.0
30-34 11.1 8.1 19.3 11.4 7.7 19.1 9.4 10.5 20.0
35-39 13.2 5.0 18.3 13.0 4.6 17.6 14.6 7.5 22.1
40-44 13.7 6.1 19.8 14.6 6.7 21.4 8.6 2.3 10.9
45-49 10.5 1.7 12.2 10.7 1.8 12.6 8.8 1.2 10.0
50-54 4.3 0.2 4.5 3.7 0.0 3.7 8.0 1.3 9.4
55-59 6.1 0.0 6.1 5.9 0.0 5.9 7.3 0.0 7.3
60-64 2.6 0.8 3.4 3.0 0.8 3.9 0.0 0.5 0.5
65+ 1.6 0.2 1.7 1.8 0.0 1.8 0.0 1.2 1.2
Total 75.1 24.9 100.0 75.8 24.2 100.0 71.1 28.9 100.0
57.6
41.8
0.5 0.4
Male
Wanted more earnings Requirement of the job Exceptional week Other reasons
63.2
35.9
0.5 0.5Female
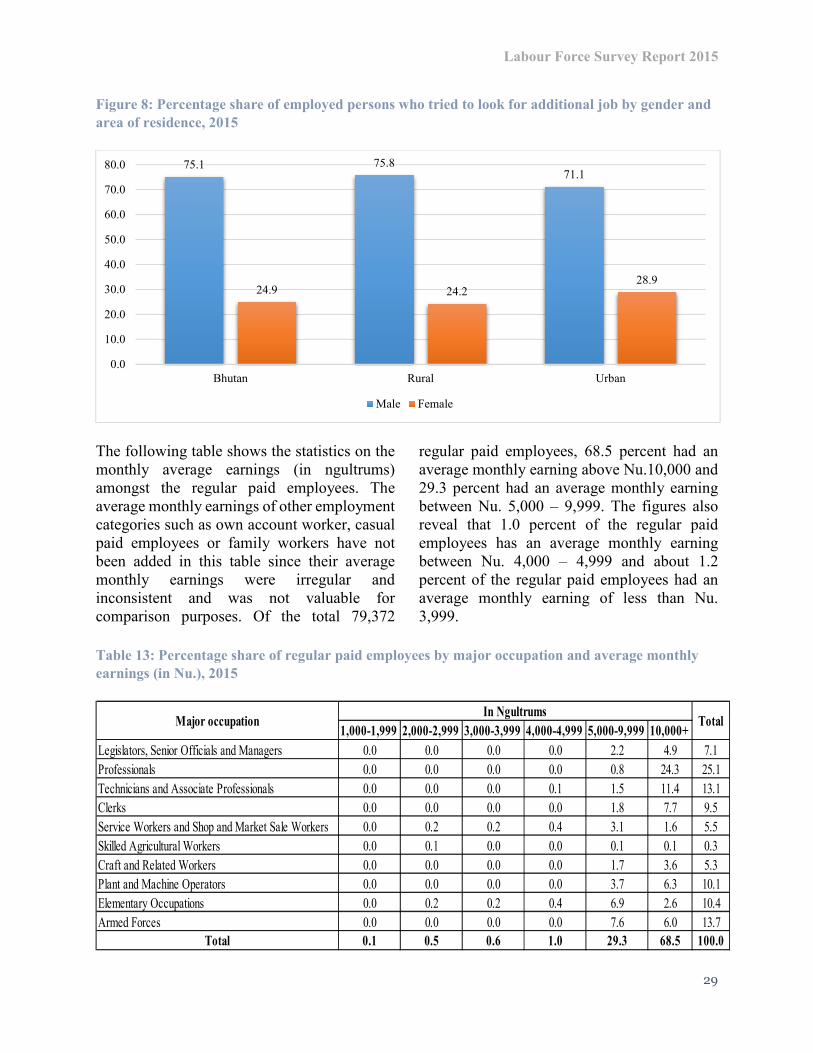
Labour Force Survey Report 2015
29
Figure 8: Percentage share of employed persons who tried to look for additional job by gender and
area of residence, 2015
The following table shows the statistics on the
monthly average earnings (in ngultrums)
amongst the regular paid employees. The
average monthly earnings of other employment
categories such as own account worker, casual
paid employees or family workers have not
been added in this table since their average
monthly earnings were irregular and
inconsistent and was not valuable for
comparison purposes. Of the total 79,372
regular paid employees, 68.5 percent had an
average monthly earning above Nu.10,000 and
29.3 percent had an average monthly earning
between Nu. 5,000 – 9,999. The figures also
reveal that 1.0 percent of the regular paid
employees has an average monthly earning
between Nu. 4,000 – 4,999 and about 1.2
percent of the regular paid employees had an
average monthly earning of less than Nu.
3,999.
Table 13: Percentage share of regular paid employees by major occupation and average monthly
earnings (in Nu.), 2015
75.1 75.871.1
24.9 24.228.9
0.0
10.0
20.0
30.0
40.0
50.0
60.0
70.0
80.0
Bhutan Rural Urban
Male Female
1,000-1,999 2,000-2,999 3,000-3,999 4,000-4,999 5,000-9,999 10,000+
Legislators, Senior Officials and Managers 0.0 0.0 0.0 0.0 2.2 4.9 7.1
Professionals 0.0 0.0 0.0 0.0 0.8 24.3 25.1
Technicians and Associate Professionals 0.0 0.0 0.0 0.1 1.5 11.4 13.1
Clerks 0.0 0.0 0.0 0.0 1.8 7.7 9.5
Service Workers and Shop and Market Sale Workers 0.0 0.2 0.2 0.4 3.1 1.6 5.5
Skilled Agricultural Workers 0.0 0.1 0.0 0.0 0.1 0.1 0.3
Craft and Related Workers 0.0 0.0 0.0 0.0 1.7 3.6 5.3
Plant and Machine Operators 0.0 0.0 0.0 0.0 3.7 6.3 10.1
Elementary Occupations 0.0 0.2 0.2 0.4 6.9 2.6 10.4
Armed Forces 0.0 0.0 0.0 0.0 7.6 6.0 13.7
Total 0.1 0.5 0.6 1.0 29.3 68.5 100.0
Major occupationIn Ngultrums
Total
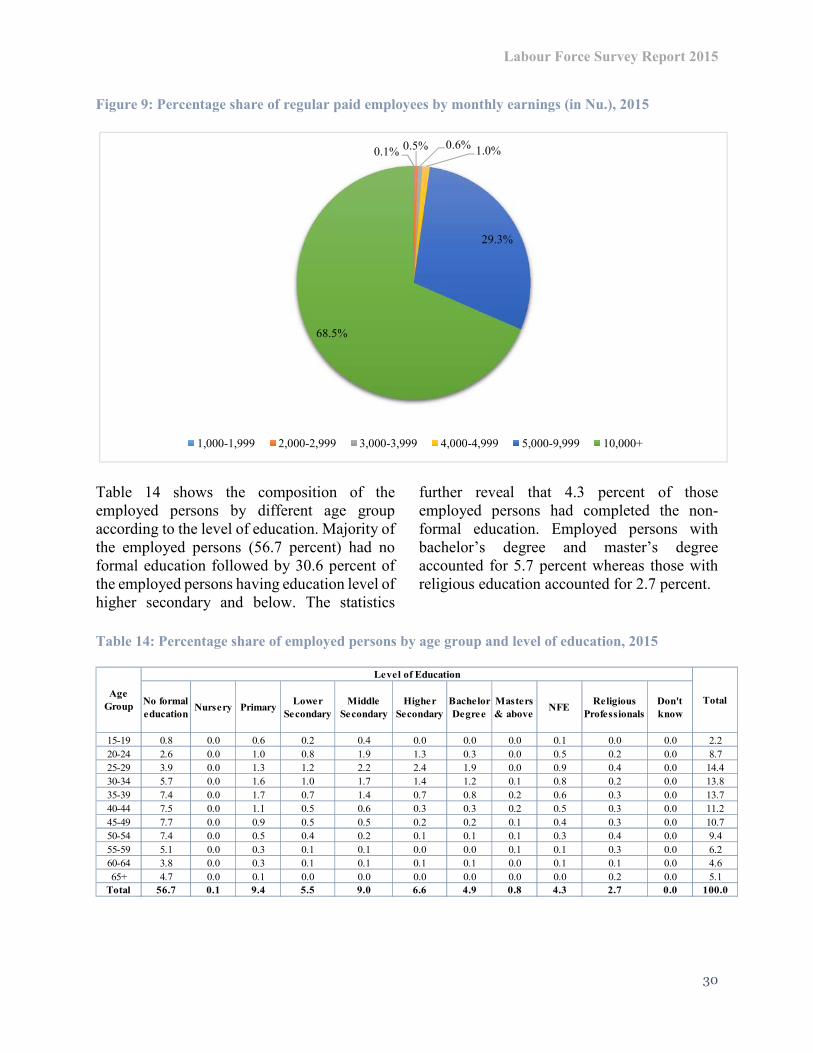
Labour Force Survey Report 2015
30
Figure 9: Percentage share of regular paid employees by monthly earnings (in Nu.), 2015
Table 14 shows the composition of the
employed persons by different age group
according to the level of education. Majority of
the employed persons (56.7 percent) had no
formal education followed by 30.6 percent of
the employed persons having education level of
higher secondary and below. The statistics
further reveal that 4.3 percent of those
employed persons had completed the non-
formal education. Employed persons with
bachelor’s degree and master’s degree
accounted for 5.7 percent whereas those with
religious education accounted for 2.7 percent.
Table 14: Percentage share of employed persons by age group and level of education, 2015
No formal
educationNursery Primary
Lower
Secondary
Middle
Secondary
Higher
Secondary
Bachelor
Degree
Masters
& aboveNFE
Religious
Professionals
Don't
know
15-19 0.8 0.0 0.6 0.2 0.4 0.0 0.0 0.0 0.1 0.0 0.0 2.2
20-24 2.6 0.0 1.0 0.8 1.9 1.3 0.3 0.0 0.5 0.2 0.0 8.7
25-29 3.9 0.0 1.3 1.2 2.2 2.4 1.9 0.0 0.9 0.4 0.0 14.4
30-34 5.7 0.0 1.6 1.0 1.7 1.4 1.2 0.1 0.8 0.2 0.0 13.8
35-39 7.4 0.0 1.7 0.7 1.4 0.7 0.8 0.2 0.6 0.3 0.0 13.7
40-44 7.5 0.0 1.1 0.5 0.6 0.3 0.3 0.2 0.5 0.3 0.0 11.2
45-49 7.7 0.0 0.9 0.5 0.5 0.2 0.2 0.1 0.4 0.3 0.0 10.7
50-54 7.4 0.0 0.5 0.4 0.2 0.1 0.1 0.1 0.3 0.4 0.0 9.4
55-59 5.1 0.0 0.3 0.1 0.1 0.0 0.0 0.1 0.1 0.3 0.0 6.2
60-64 3.8 0.0 0.3 0.1 0.1 0.1 0.1 0.0 0.1 0.1 0.0 4.6
65+ 4.7 0.0 0.1 0.0 0.0 0.0 0.0 0.0 0.0 0.2 0.0 5.1
Total 56.7 0.1 9.4 5.5 9.0 6.6 4.9 0.8 4.3 2.7 0.0 100.0
Level of Education
Age
GroupTotal
0.1%0.5% 0.6%
1.0%
29.3%
68.5%
1,000-1,999 2,000-2,999 3,000-3,999 4,000-4,999 5,000-9,999 10,000+

Labour Force Survey Report 2015
31
Of the 56.7 percent employed persons with no
formal education, female constituted 29.9
percent and male constituted 26.8 percent.
Similarly, of the 30.6 percent of employed
persons with education level of higher
secondary and below, male constituted 19.0
percent whereas female constituted only 11.6
percent. Likewise, of the 5.7 percent of
employed persons with education level of
bachelor’s & master’s degree, male constituted
3.8 percent and female constituted 1.9 percent.
In the case of employed persons who
completed non-formal education, female
constituted 2.9 percent whereas male
constituted only 1.4 percent. Similar scenario
has been observed for those employed persons
with religious education background, where
male constituted 2.6 percent whereas female
constituted only 0.1 percent.
Figure 10: Percentage share of employed persons by gender and level of education, 2015
0%
10%
20%
30%
40%
50%
60%
70%
80%
90%
100%
No
fo
rmal
ed
uca
tion
Nurs
ery
Pri
mar
y
Low
er S
econ
dar
y
Mid
dle
Sec
on
dar
y
Hig
her
Sec
ond
ary
Bac
hel
or
Deg
ree
Mas
ters
& a
bo
ve
NF
E
Rel
igio
us
Pro
fess
ion
als
Do
n't k
no
w
Male Female
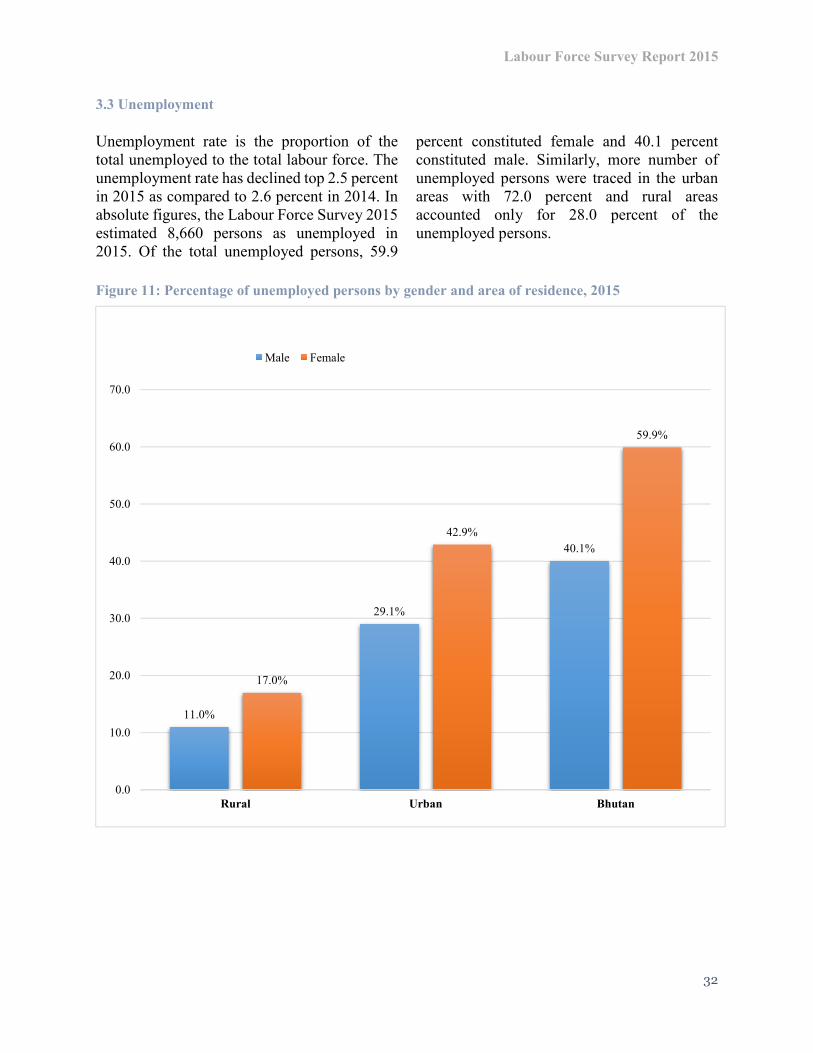
Labour Force Survey Report 2015
32
3.3 Unemployment
Unemployment rate is the proportion of the
total unemployed to the total labour force. The
unemployment rate has declined top 2.5 percent
in 2015 as compared to 2.6 percent in 2014. In
absolute figures, the Labour Force Survey 2015
estimated 8,660 persons as unemployed in
2015. Of the total unemployed persons, 59.9
percent constituted female and 40.1 percent
constituted male. Similarly, more number of
unemployed persons were traced in the urban
areas with 72.0 percent and rural areas
accounted only for 28.0 percent of the
unemployed persons.
Figure 11: Percentage of unemployed persons by gender and area of residence, 2015
11.0%
29.1%
40.1%
17.0%
42.9%
59.9%
0.0
10.0
20.0
30.0
40.0
50.0
60.0
70.0
Rural Urban Bhutan
Male Female

Labour Force Survey Report 2015
33
Figure 12 presents the unemployment rates of
specific age groups and gender which reveals
that female unemployment rates are much
higher compared to male unemployment rates.
The Labour Force Survey 2015 has estimated
the overall female unemployment rate of 3.1
percent whereas the overall male
unemployment rate was estimated as 1.8
percent. The most vulnerable group on the
unemployment category are the age groups
between 15-24 years which are mostly youths.
The pattern of high unemployment in the early
age groups indicates that these are the youths
entering the labour market with certain level of
education who are available for work or looking
for work but lacks the required skills needed for
immediate employment. The youth
unemployment rate has been estimated as 10.7
percent for 2015 as compared to only 9.4
percent. This is an increase of 1.3 percentage
points. Although in 2015, the male youth
unemployment rate declined to 8.2 percent as
compared to 8.6 percent in 2014, the female
youth unemployment rate drastically increased
to 12.7 percent in 2015 as compared to 10.0
percent in 2014. Likewise, the rural youth
unemployment rate in 2015 declined to 4.8
percent as compared to 5.1 percent in 2014.
However, the urban youth unemployment rate
increased top 28.0 percent in 2015 as compared
to only 24.0 percent in 2014.
Figure 12: Unemployment rates by gender and age group, 2015
-2.0
0.0
2.0
4.0
6.0
8.0
10.0
12.0
14.0
16.0
15-1
9
20-2
4
25-2
9
30-3
4
35-3
9
40-4
4
45-4
9
50-5
4
55-5
9
60-6
4
65+
Male Female Overall

Labour Force Survey Report 2015
34
The unemployed persons by level of education
shows that most unemployed persons are in the
education level of middle secondary which
accounted for 15.4 percent, higher secondary
which accounted for 31.9 percent and
bachelor’s degree which accounted for 34.7
percent of the total unemployed persons
respectively. In terms of gender classification of
the unemployed persons by their level of
education, females constituted the highest
share. In the middle secondary level of
education, female constituted 10.8 percent out
of the total 15.4 percent unemployed. Similarly,
in the higher secondary level, female
unemployed constituted 18.5 percent out of the
total 34.7 percent unemployed. Likewise, in the
bachelor’s degree level, female constituted 18.3
percent of the total 34.7 percent unemployed.
This information on the unemployed persons by
gender and level of education further reveals
that more females are unemployed compared to
males as of 2015.
Figure 13: Percentage share of unemployed persons by gender, area of residence and level of
education, 2015
0%
10%
20%
30%
40%
50%
60%
70%
80%
90%
100%
Male Female Total Male Female Total Male Female Total
Bhutan Rural Urban
No formal education Primary education Lower secondary
Middle secondary Higher secondary Bachelor degree
Master degree & above NFE Religious preofessionals

Labour Force Survey Report 2015
35
The regional categorization of the unemployed
persons for 2015 shows that Thimphu
Dzongkhag had the highest number of
unemployed persons. In terms of percentage
share, Thimphu Dzongkhag accounted for 39.1
percent of the total unemployed persons
followed by Chukha Dzongkhag with 21.2
percent of the total unemployed persons, Paro
and Punakha Dzongkhag with 6.1 percent and
6.2 percent of the total unemployed persons
respectively.
Figure 14: Percentage share of unemployed persons by Dzongkhag, 2015
The chronic unemployment in the case of
Bhutan is defined as those persons who have
been unemployed for more than a year. The
chronic unemployment share of the total
unemployed persons in Bhutan has declined to
45.3 percent as compared to 51.1 percent in
2014. The figures also disclose indications on
the female unemployed taking more time in
search of work.
Figure 15: Percentage share of unemployed persons by duration of job search, 2015
0.0
5.0
10.0
15.0
20.0
25.0
30.0
35.0
40.0
45.0
Bum
than
g
Chu
kha
Dag
ana
Gas
a
Haa
Lh
un
tse
Mo
ng
ar
Par
o
Pem
agat
shel
Pu
nak
ha
Sam
dru
p J
on
gk
har
Sam
tse
Sar
pan
g
Th
imph
u
Tas
hig
ang
Tas
hiy
angts
e
Tro
ng
sa
Wan
gd
ue
Zh
emg
ang
8.3%
20.1%
24.5%29.1%
16.2%
1.8%
Less than one month
One to Six months
Six months to one year
One year to two year
More than two years
Don't know
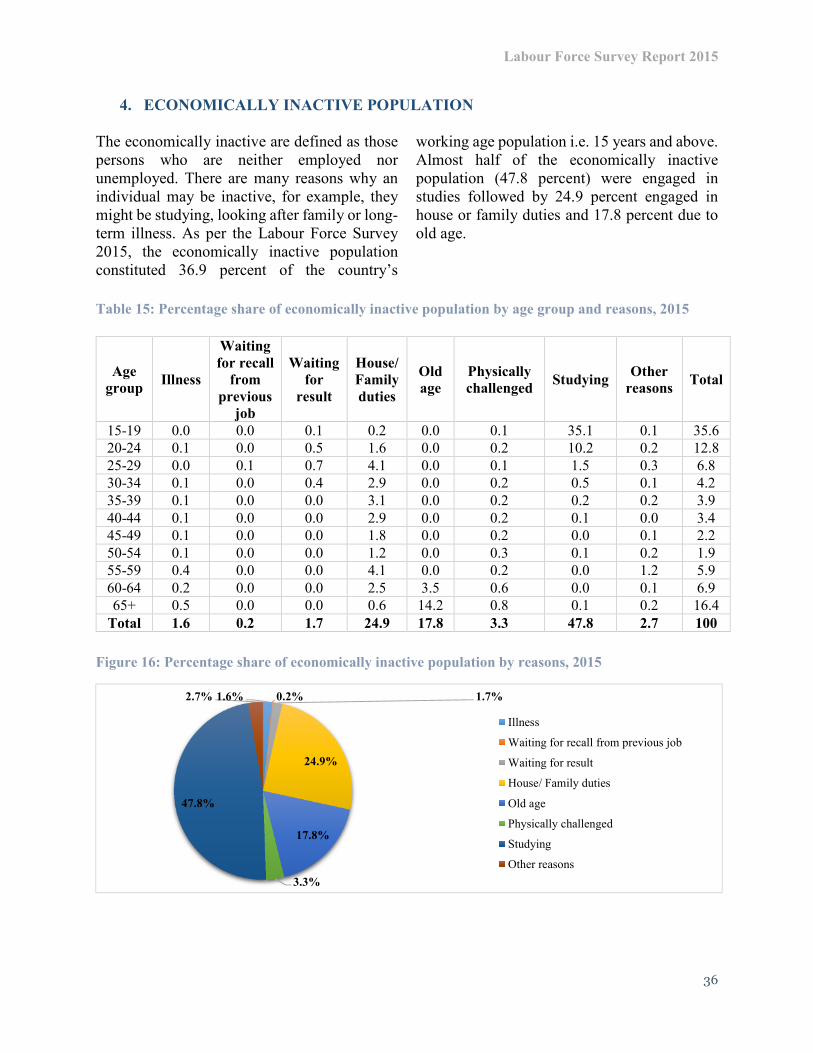
Labour Force Survey Report 2015
36
4. ECONOMICALLY INACTIVE POPULATION
The economically inactive are defined as those
persons who are neither employed nor
unemployed. There are many reasons why an
individual may be inactive, for example, they
might be studying, looking after family or long-
term illness. As per the Labour Force Survey
2015, the economically inactive population
constituted 36.9 percent of the country’s
working age population i.e. 15 years and above.
Almost half of the economically inactive
population (47.8 percent) were engaged in
studies followed by 24.9 percent engaged in
house or family duties and 17.8 percent due to
old age.
Table 15: Percentage share of economically inactive population by age group and reasons, 2015
Age
group Illness
Waiting
for recall
from
previous
job
Waiting
for
result
House/
Family
duties
Old
age
Physically
challenged Studying
Other
reasons Total
15-19 0.0 0.0 0.1 0.2 0.0 0.1 35.1 0.1 35.6
20-24 0.1 0.0 0.5 1.6 0.0 0.2 10.2 0.2 12.8
25-29 0.0 0.1 0.7 4.1 0.0 0.1 1.5 0.3 6.8
30-34 0.1 0.0 0.4 2.9 0.0 0.2 0.5 0.1 4.2
35-39 0.1 0.0 0.0 3.1 0.0 0.2 0.2 0.2 3.9
40-44 0.1 0.0 0.0 2.9 0.0 0.2 0.1 0.0 3.4
45-49 0.1 0.0 0.0 1.8 0.0 0.2 0.0 0.1 2.2
50-54 0.1 0.0 0.0 1.2 0.0 0.3 0.1 0.2 1.9
55-59 0.4 0.0 0.0 4.1 0.0 0.2 0.0 1.2 5.9
60-64 0.2 0.0 0.0 2.5 3.5 0.6 0.0 0.1 6.9
65+ 0.5 0.0 0.0 0.6 14.2 0.8 0.1 0.2 16.4
Total 1.6 0.2 1.7 24.9 17.8 3.3 47.8 2.7 100
Figure 16: Percentage share of economically inactive population by reasons, 2015
1.6% 0.2% 1.7%
24.9%
17.8%
3.3%
47.8%
2.7%
Illness
Waiting for recall from previous job
Waiting for result
House/ Family duties
Old age
Physically challenged
Studying
Other reasons

Labour Force Survey Report 2015
37
National Labour Force Statistics 2015
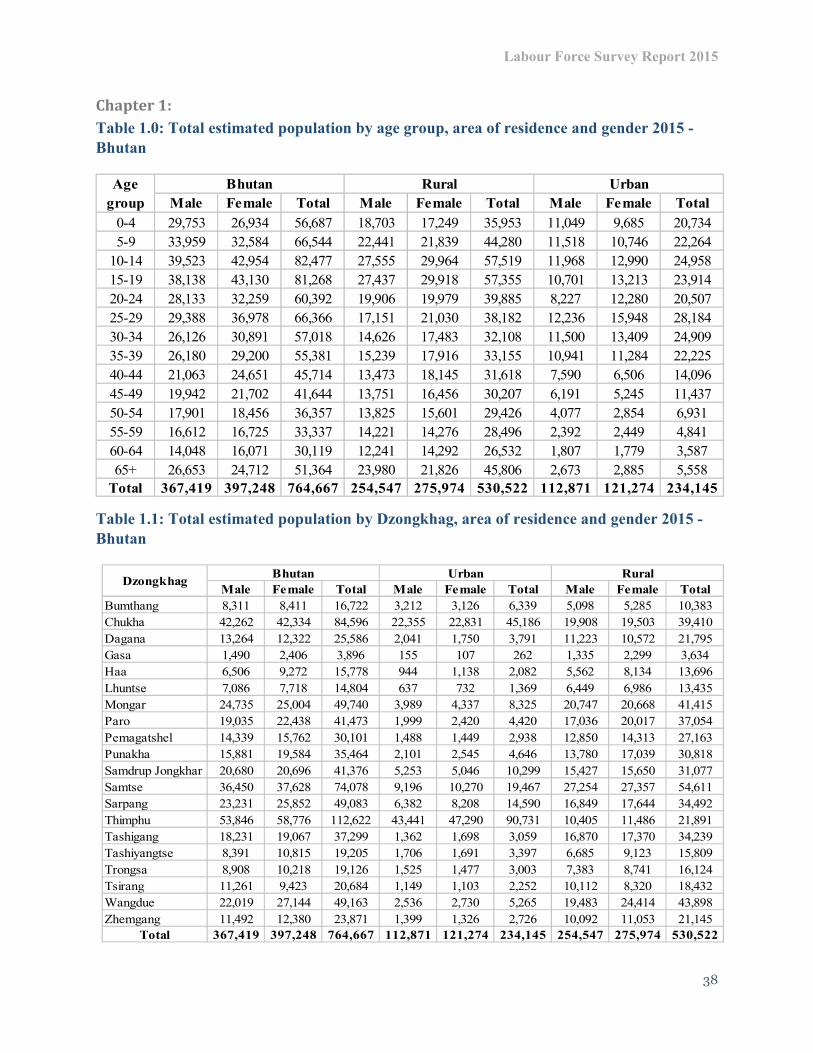
Labour Force Survey Report 2015
38
Chapter 1:
Table 1.0: Total estimated population by age group, area of residence and gender 2015 -
Bhutan
Table 1.1: Total estimated population by Dzongkhag, area of residence and gender 2015 -
Bhutan
Male Female Total Male Female Total Male Female Total
0-4 29,753 26,934 56,687 18,703 17,249 35,953 11,049 9,685 20,734
5-9 33,959 32,584 66,544 22,441 21,839 44,280 11,518 10,746 22,264
10-14 39,523 42,954 82,477 27,555 29,964 57,519 11,968 12,990 24,958
15-19 38,138 43,130 81,268 27,437 29,918 57,355 10,701 13,213 23,914
20-24 28,133 32,259 60,392 19,906 19,979 39,885 8,227 12,280 20,507
25-29 29,388 36,978 66,366 17,151 21,030 38,182 12,236 15,948 28,184
30-34 26,126 30,891 57,018 14,626 17,483 32,108 11,500 13,409 24,909
35-39 26,180 29,200 55,381 15,239 17,916 33,155 10,941 11,284 22,225
40-44 21,063 24,651 45,714 13,473 18,145 31,618 7,590 6,506 14,096
45-49 19,942 21,702 41,644 13,751 16,456 30,207 6,191 5,245 11,437
50-54 17,901 18,456 36,357 13,825 15,601 29,426 4,077 2,854 6,931
55-59 16,612 16,725 33,337 14,221 14,276 28,496 2,392 2,449 4,841
60-64 14,048 16,071 30,119 12,241 14,292 26,532 1,807 1,779 3,587
65+ 26,653 24,712 51,364 23,980 21,826 45,806 2,673 2,885 5,558
Total 367,419 397,248 764,667 254,547 275,974 530,522 112,871 121,274 234,145
Age
group
Bhutan UrbanRural
Male Female Total Male Female Total Male Female Total
Bumthang 8,311 8,411 16,722 3,212 3,126 6,339 5,098 5,285 10,383
Chukha 42,262 42,334 84,596 22,355 22,831 45,186 19,908 19,503 39,410
Dagana 13,264 12,322 25,586 2,041 1,750 3,791 11,223 10,572 21,795
Gasa 1,490 2,406 3,896 155 107 262 1,335 2,299 3,634
Haa 6,506 9,272 15,778 944 1,138 2,082 5,562 8,134 13,696
Lhuntse 7,086 7,718 14,804 637 732 1,369 6,449 6,986 13,435
Mongar 24,735 25,004 49,740 3,989 4,337 8,325 20,747 20,668 41,415
Paro 19,035 22,438 41,473 1,999 2,420 4,420 17,036 20,017 37,054
Pemagatshel 14,339 15,762 30,101 1,488 1,449 2,938 12,850 14,313 27,163
Punakha 15,881 19,584 35,464 2,101 2,545 4,646 13,780 17,039 30,818
Samdrup Jongkhar 20,680 20,696 41,376 5,253 5,046 10,299 15,427 15,650 31,077
Samtse 36,450 37,628 74,078 9,196 10,270 19,467 27,254 27,357 54,611
Sarpang 23,231 25,852 49,083 6,382 8,208 14,590 16,849 17,644 34,492
Thimphu 53,846 58,776 112,622 43,441 47,290 90,731 10,405 11,486 21,891
Tashigang 18,231 19,067 37,299 1,362 1,698 3,059 16,870 17,370 34,239
Tashiyangtse 8,391 10,815 19,205 1,706 1,691 3,397 6,685 9,123 15,809
Trongsa 8,908 10,218 19,126 1,525 1,477 3,003 7,383 8,741 16,124
Tsirang 11,261 9,423 20,684 1,149 1,103 2,252 10,112 8,320 18,432
Wangdue 22,019 27,144 49,163 2,536 2,730 5,265 19,483 24,414 43,898
Zhemgang 11,492 12,380 23,871 1,399 1,326 2,726 10,092 11,053 21,145
Total 367,419 397,248 764,667 112,871 121,274 234,145 254,547 275,974 530,522
DzongkhagBhutan Urban Rural

Labour Force Survey Report 2015
39
Table 1.2: Total number of persons who moved to the current location by previous district of residence 2015 - Bhutan
Bumthang
ChukhaDagana Gasa Haa
Lhuenst
eMongar Paro
Pema
gatshelPunakha
Samdrup
JongkharSamtse Sarpang Thimphu Tsirang Trashigang
Trashi
yangtseTrongsa Wangdue Zhemgang
Outside
Bhutan
Bumthang 17 17 0 0 0 17 0 34 0 0 0 17 0 69 0 34 0 0 0 17 0 223
Chukha 110 18 18 0 92 92 92 128 18 0 18 55 165 586 0 73 0 0 147 18 147 1,777
Dagana 0 73 0 0 0 0 0 0 0 18 0 18 0 199 36 0 0 0 0 0 0 345
Gasa 0 0 0 0 0 0 0 0 0 0 0 0 0 0 0 5 0 0 10 0 0 15
Haa 0 11 0 0 0 0 0 0 0 46 0 0 0 0 0 11 0 0 0 0 0 68
Lhuntse 0 0 0 0 0 0 12 0 24 0 0 12 0 0 0 0 0 134 0 0 0 182
Mongar 73 29 0 0 0 0 29 0 44 0 73 15 0 439 0 44 15 15 15 87 15 889
Paro 18 120 85 0 0 18 18 85 0 18 18 85 393 188 18 18 188 0 0 0 0 1,268
Pemagatshel 13 313 0 0 0 0 0 0 0 104 65 13 0 26 0 39 0 0 0 0 0 575
Punakha 72 36 12 0 0 0 12 0 12 0 0 0 0 12 12 0 0 12 0 0 0 180
Samdrup Jongkhar 0 0 0 0 0 0 0 14 0 0 0 0 0 83 14 41 0 0 0 0 74 226
Samtse 28 131 0 0 0 0 28 55 0 28 55 0 83 0 0 28 0 0 55 0 0 489
Sarpang 31 47 94 16 31 0 16 125 47 31 157 204 0 296 31 94 0 173 16 16 47 1,471
Thimphu 38 218 77 0 26 13 167 141 77 38 115 51 64 13 26 180 51 26 128 13 154 1,617
Trashigang 0 0 0 0 0 0 9 0 0 9 18 0 27 18 0 0 0 0 0 0 0 80
Trongsa 59 0 0 0 0 0 59 83 59 0 0 12 118 214 0 0 0 0 59 0 118 781
Tsirang 0 0 0 0 64 0 0 0 0 0 0 0 0 64 0 0 0 0 0 0 0 128
Wangdue 0 80 0 0 0 0 7 20 0 0 0 0 0 40 0 7 20 0 0 0 0 174
Zhemgang 0 9 0 0 0 0 37 0 0 0 64 0 73 73 0 0 0 37 0 0 0 293
Total 459 1104 286 16 212 139 483 686 280 292 583 483 923 2,320 137 573 274 396 429 151 554 10,780
Previous district of residence
Current district
of residenceTotal
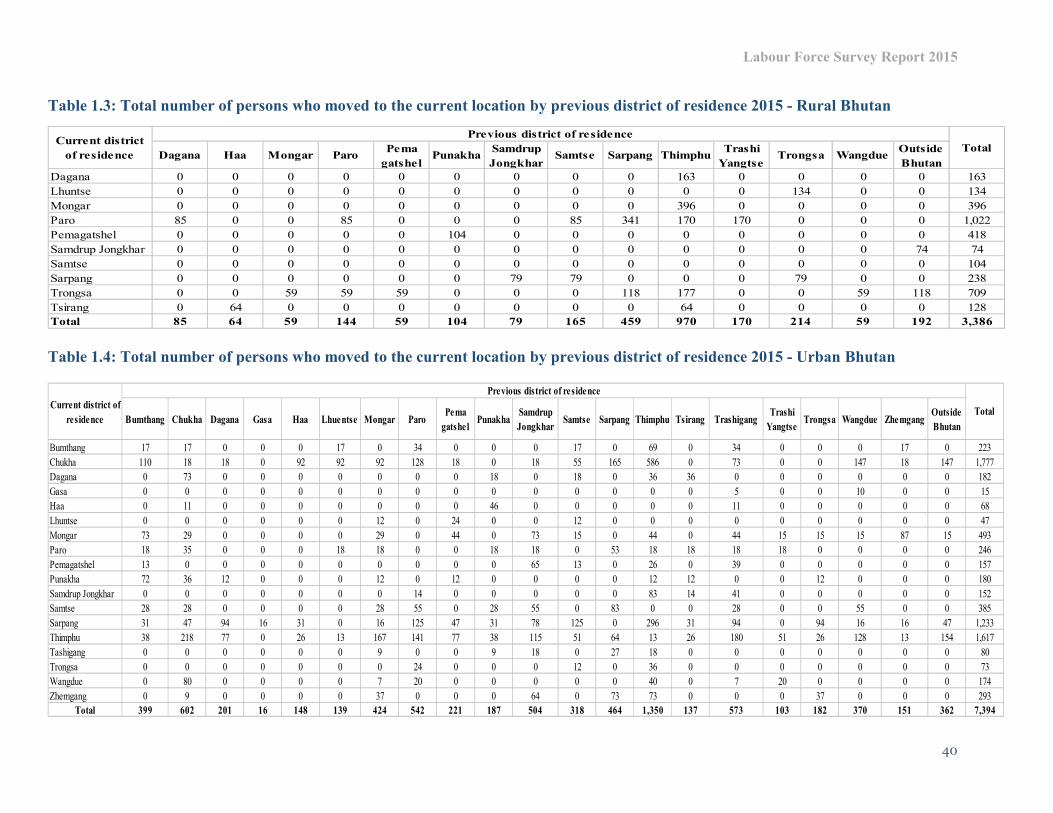
Labour Force Survey Report 2015
40
Table 1.3: Total number of persons who moved to the current location by previous district of residence 2015 - Rural Bhutan
Table 1.4: Total number of persons who moved to the current location by previous district of residence 2015 - Urban Bhutan
Dagana Haa Mongar ParoPema
gatshelPunakha
Samdrup
JongkharSamtse Sarpang Thimphu
Trashi
YangtseTrongsa Wangdue
Outside
Bhutan
Dagana 0 0 0 0 0 0 0 0 0 163 0 0 0 0 163
Lhuntse 0 0 0 0 0 0 0 0 0 0 0 134 0 0 134
Mongar 0 0 0 0 0 0 0 0 0 396 0 0 0 0 396
Paro 85 0 0 85 0 0 0 85 341 170 170 0 0 0 1,022
Pemagatshel 0 0 0 0 0 104 0 0 0 0 0 0 0 0 418
Samdrup Jongkhar 0 0 0 0 0 0 0 0 0 0 0 0 0 74 74
Samtse 0 0 0 0 0 0 0 0 0 0 0 0 0 0 104
Sarpang 0 0 0 0 0 0 79 79 0 0 0 79 0 0 238
Trongsa 0 0 59 59 59 0 0 0 118 177 0 0 59 118 709
Tsirang 0 64 0 0 0 0 0 0 0 64 0 0 0 0 128
Total 85 64 59 144 59 104 79 165 459 970 170 214 59 192 3,386
Current district
of residence
Previous district of residence
Total
Bumthang Chukha Dagana Gasa Haa Lhuentse Mongar ParoPema
gatshelPunakha
Samdrup
JongkharSamtse Sarpang Thimphu Tsirang Trashigang
Trashi
YangtseTrongsa Wangdue Zhemgang
Outside
Bhutan
Bumthang 17 17 0 0 0 17 0 34 0 0 0 17 0 69 0 34 0 0 0 17 0 223
Chukha 110 18 18 0 92 92 92 128 18 0 18 55 165 586 0 73 0 0 147 18 147 1,777
Dagana 0 73 0 0 0 0 0 0 0 18 0 18 0 36 36 0 0 0 0 0 0 182
Gasa 0 0 0 0 0 0 0 0 0 0 0 0 0 0 0 5 0 0 10 0 0 15
Haa 0 11 0 0 0 0 0 0 0 46 0 0 0 0 0 11 0 0 0 0 0 68
Lhuntse 0 0 0 0 0 0 12 0 24 0 0 12 0 0 0 0 0 0 0 0 0 47
Mongar 73 29 0 0 0 0 29 0 44 0 73 15 0 44 0 44 15 15 15 87 15 493
Paro 18 35 0 0 0 18 18 0 0 18 18 0 53 18 18 18 18 0 0 0 0 246
Pemagatshel 13 0 0 0 0 0 0 0 0 0 65 13 0 26 0 39 0 0 0 0 0 157
Punakha 72 36 12 0 0 0 12 0 12 0 0 0 0 12 12 0 0 12 0 0 0 180
Samdrup Jongkhar 0 0 0 0 0 0 0 14 0 0 0 0 0 83 14 41 0 0 0 0 0 152
Samtse 28 28 0 0 0 0 28 55 0 28 55 0 83 0 0 28 0 0 55 0 0 385
Sarpang 31 47 94 16 31 0 16 125 47 31 78 125 0 296 31 94 0 94 16 16 47 1,233
Thimphu 38 218 77 0 26 13 167 141 77 38 115 51 64 13 26 180 51 26 128 13 154 1,617
Tashigang 0 0 0 0 0 0 9 0 0 9 18 0 27 18 0 0 0 0 0 0 0 80
Trongsa 0 0 0 0 0 0 0 24 0 0 0 12 0 36 0 0 0 0 0 0 0 73
Wangdue 0 80 0 0 0 0 7 20 0 0 0 0 0 40 0 7 20 0 0 0 0 174
Zhemgang 0 9 0 0 0 0 37 0 0 0 64 0 73 73 0 0 0 37 0 0 0 293
Total 399 602 201 16 148 139 424 542 221 187 504 318 464 1,350 137 573 103 182 370 151 362 7,394
Current district of
residence
Previous district of residence
Total
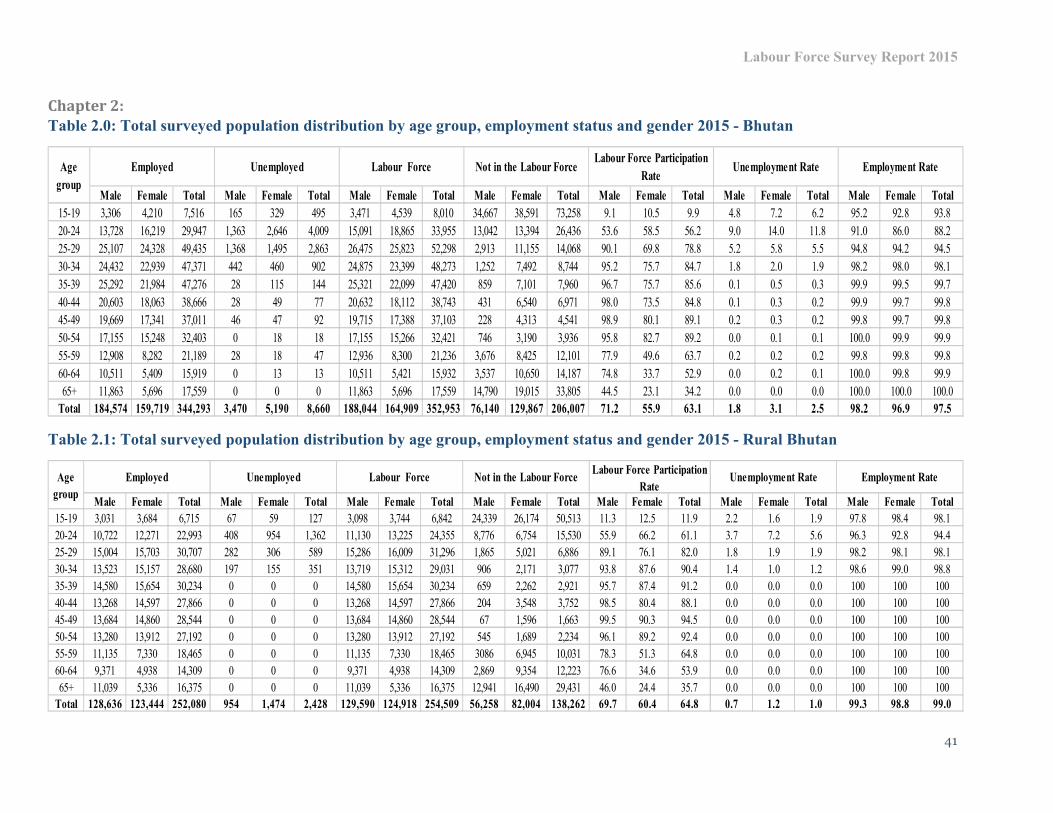
Labour Force Survey Report 2015
41
Chapter 2:
Table 2.0: Total surveyed population distribution by age group, employment status and gender 2015 - Bhutan
Table 2.1: Total surveyed population distribution by age group, employment status and gender 2015 - Rural Bhutan
Male Female Total Male Female Total Male Female Total Male Female Total Male Female Total Male Female Total Male Female Total
15-19 3,306 4,210 7,516 165 329 495 3,471 4,539 8,010 34,667 38,591 73,258 9.1 10.5 9.9 4.8 7.2 6.2 95.2 92.8 93.8
20-24 13,728 16,219 29,947 1,363 2,646 4,009 15,091 18,865 33,955 13,042 13,394 26,436 53.6 58.5 56.2 9.0 14.0 11.8 91.0 86.0 88.2
25-29 25,107 24,328 49,435 1,368 1,495 2,863 26,475 25,823 52,298 2,913 11,155 14,068 90.1 69.8 78.8 5.2 5.8 5.5 94.8 94.2 94.5
30-34 24,432 22,939 47,371 442 460 902 24,875 23,399 48,273 1,252 7,492 8,744 95.2 75.7 84.7 1.8 2.0 1.9 98.2 98.0 98.1
35-39 25,292 21,984 47,276 28 115 144 25,321 22,099 47,420 859 7,101 7,960 96.7 75.7 85.6 0.1 0.5 0.3 99.9 99.5 99.7
40-44 20,603 18,063 38,666 28 49 77 20,632 18,112 38,743 431 6,540 6,971 98.0 73.5 84.8 0.1 0.3 0.2 99.9 99.7 99.8
45-49 19,669 17,341 37,011 46 47 92 19,715 17,388 37,103 228 4,313 4,541 98.9 80.1 89.1 0.2 0.3 0.2 99.8 99.7 99.8
50-54 17,155 15,248 32,403 0 18 18 17,155 15,266 32,421 746 3,190 3,936 95.8 82.7 89.2 0.0 0.1 0.1 100.0 99.9 99.9
55-59 12,908 8,282 21,189 28 18 47 12,936 8,300 21,236 3,676 8,425 12,101 77.9 49.6 63.7 0.2 0.2 0.2 99.8 99.8 99.8
60-64 10,511 5,409 15,919 0 13 13 10,511 5,421 15,932 3,537 10,650 14,187 74.8 33.7 52.9 0.0 0.2 0.1 100.0 99.8 99.9
65+ 11,863 5,696 17,559 0 0 0 11,863 5,696 17,559 14,790 19,015 33,805 44.5 23.1 34.2 0.0 0.0 0.0 100.0 100.0 100.0
Total 184,574 159,719 344,293 3,470 5,190 8,660 188,044 164,909 352,953 76,140 129,867 206,007 71.2 55.9 63.1 1.8 3.1 2.5 98.2 96.9 97.5
Labour Force Participation
RateUnemployment Rate Employment RateAge
group
Labour Force Not in the Labour ForceEmployed Unemployed
Male Female Total Male Female Total Male Female Total Male Female Total Male Female Total Male Female Total Male Female Total
15-19 3,031 3,684 6,715 67 59 127 3,098 3,744 6,842 24,339 26,174 50,513 11.3 12.5 11.9 2.2 1.6 1.9 97.8 98.4 98.1
20-24 10,722 12,271 22,993 408 954 1,362 11,130 13,225 24,355 8,776 6,754 15,530 55.9 66.2 61.1 3.7 7.2 5.6 96.3 92.8 94.4
25-29 15,004 15,703 30,707 282 306 589 15,286 16,009 31,296 1,865 5,021 6,886 89.1 76.1 82.0 1.8 1.9 1.9 98.2 98.1 98.1
30-34 13,523 15,157 28,680 197 155 351 13,719 15,312 29,031 906 2,171 3,077 93.8 87.6 90.4 1.4 1.0 1.2 98.6 99.0 98.8
35-39 14,580 15,654 30,234 0 0 0 14,580 15,654 30,234 659 2,262 2,921 95.7 87.4 91.2 0.0 0.0 0.0 100 100 100
40-44 13,268 14,597 27,866 0 0 0 13,268 14,597 27,866 204 3,548 3,752 98.5 80.4 88.1 0.0 0.0 0.0 100 100 100
45-49 13,684 14,860 28,544 0 0 0 13,684 14,860 28,544 67 1,596 1,663 99.5 90.3 94.5 0.0 0.0 0.0 100 100 100
50-54 13,280 13,912 27,192 0 0 0 13,280 13,912 27,192 545 1,689 2,234 96.1 89.2 92.4 0.0 0.0 0.0 100 100 100
55-59 11,135 7,330 18,465 0 0 0 11,135 7,330 18,465 3086 6,945 10,031 78.3 51.3 64.8 0.0 0.0 0.0 100 100 100
60-64 9,371 4,938 14,309 0 0 0 9,371 4,938 14,309 2,869 9,354 12,223 76.6 34.6 53.9 0.0 0.0 0.0 100 100 100
65+ 11,039 5,336 16,375 0 0 0 11,039 5,336 16,375 12,941 16,490 29,431 46.0 24.4 35.7 0.0 0.0 0.0 100 100 100
Total 128,636 123,444 252,080 954 1,474 2,428 129,590 124,918 254,509 56,258 82,004 138,262 69.7 60.4 64.8 0.7 1.2 1.0 99.3 98.8 99.0
Unemployment Rate Employment RateAge
group
Employed Unemployed Labour Force Not in the Labour ForceLabour Force Participation
Rate

Labour Force Survey Report 2015
42
Table 2.2: Total surveyed population distribution by age group, employment status and gender 2015 - Urban Bhutan
Male Female Total Male Female Total Male Female Total Male Female Total Male Female Total Male Female Total Male Female Total
15-19 275 525 800 98 270 368 373 796 1,169 10,328 12,417 22,745 3.5 6.0 4.9 26.3 33.9 31.5 73.7 66.0 68.4
20-24 3,005 3,948 6,954 955 1,692 2,647 3,961 5,640 9,600 4,266 6,640 10,906 48.1 45.9 46.8 24.1 30.0 27.6 75.9 70.0 72.4
25-29 10,103 8,625 18,728 1,086 1,189 2,275 11,189 9,814 21,003 1,047 6,134 7,181 91.4 61.5 74.5 9.7 12.1 10.8 90.3 87.9 89.2
30-34 10,910 7,782 18,691 245 305 551 11,155 8,087 19,242 345 5,322 5,667 97.0 60.3 77.2 2.2 3.8 2.9 97.8 96.2 97.1
35-39 10,712 6,330 17,043 28 115 144 10,741 6,445 17,186 200 4,839 5,039 98.2 57.1 77.3 0.3 1.8 0.8 99.7 98.2 99.2
40-44 7,335 3,466 10,800 28 49 77 7,363 3,514 10,878 227 2,992 3,219 97.0 54.0 77.2 0.4 1.4 0.7 99.6 98.6 99.3
45-49 5,985 2,481 8,467 46 47 92 6,031 2,528 8,559 160 2,717 2,878 97.4 48.2 74.8 0.8 1.9 1.1 99.2 98.1 98.9
50-54 3,875 1,335 5,211 0 18 18 3,875 1,354 5,229 202 1,500 1,702 95.0 47.4 75.4 0.0 1.3 0.3 100.0 98.6 99.7
55-59 1,773 951 2,724 28 18 47 1,801 970 2,771 590 1,480 2,070 75.3 39.6 57.2 1.6 1.9 1.7 98.4 98.0 98.3
60-64 1,140 470 1,610 0 13 13 1,140 483 1,623 667 1,296 1,964 63.1 27.2 45.2 0.0 2.7 0.8 100 97.3 99.2
65+ 825 360 1,185 0 0 0 825 360 1,185 1,848 2,525 4,373 30.9 12.5 21.3 0.0 0.0 0.0 100 100 100
Total 55,938 36,274 92,213 2,516 3,716 6,232 58,454 39,991 98,444 19,882 47,862 67,745 74.6 45.5 59.2 4.3 9.3 6.3 95.7 90.7 93.7
Unemployment Rate Employment RateAge
group
Employed Unemployed Labour Force Not in the Labour Force Labour Force Participation Rate

Labour Force Survey Report 2015
43
Chapter 3:
Table 3.0: Total employed by age group, type of enterprise and gender 2015 - Bhutan
Table 3.1: Total employed by age group, type of enterprise and gender 2015 - Rural Bhutan
Male Female Total Male Female Total Male Female Total Male Female Total Male Female Total Male Female Total Male Female Total Male Female Total Male Female Total
15-19 0 0 0 0 0 0 0 18 18 2,678 3,282 5,960 13 0 13 213 212 424 402 698 1,101 0 0 0 3,306 4,210 7,516
20-24 295 712 1006 329 212 541 305 172 477 8,483 9,330 17,813 484 528 1,012 1,437 1,063 2,500 2,381 4,191 6,572 13 13 26 13,728 16,219 29,947
25-29 3,101 3,134 6,235 708 593 1,301 1,053 90 1,143 9,191 11,037 20,228 1,859 1,197 3,056 3,555 1,623 5,178 5,355 6,615 11,970 284 38 323 25,107 24,328 49,435
30-34 2,979 2,307 5,286 2,148 980 3,128 2,697 117 2,815 7,958 12,371 20,329 1,247 880 2,126 2,174 1,061 3,235 5,138 5,178 10,316 92 44 136 24,432 22,939 47,371
35-39 3,373 1,438 4,811 1,517 709 2,225 2,347 90 2,437 9,173 12,286 21,458 1,733 660 2,393 1,987 377 2,364 5,112 6,390 11,502 51 35 86 25,292 21,984 47,276
40-44 1,756 563 2,319 1,300 186 1,486 1,917 35 1,953 9,354 12,763 22,117 1,143 325 1,469 1,556 247 1,804 3,564 3,917 7,481 13 26 38 20,603 18,063 38,666
45-49 1,870 352 2,222 962 126 1,088 1,459 16 1,475 10,003 13,533 23,537 1,381 40 1,421 1,023 92 1,114 2,971 3,169 6,141 0 13 13 19,669 17,341 37,011
50-54 1,155 134 1,289 1,500 204 1,703 298 0 298 10,220 13,127 23,347 925 26 950 664 26 689 2,368 1,706 4,074 26 26 51 17,155 15,248 32,403
55-59 573 174 747 628 18 646 136 0 136 9,242 7,097 16,339 236 37 273 143 56 199 1,937 900 2,837 13 0 13 12,908 8,282 21,189
60-64 251 0 251 181 68 249 13 0 13 8,443 4,839 13,282 13 0 13 253 0 253 1,357 502 1,859 0 0 0 10,511 5,409 15,919
65+ 13 0 13 421 0 421 13 0 13 9,945 5,285 15,230 0 0 0 13 0 13 1,459 411 1,870 0 0 0 11,863 5,696 17,559
Total 15,366 8,813 24,178 9,692 3,097 12,789 10,239 538 10,777 94,689 104,951 199,640 9,033 3,692 12,726 13,018 4,756 17,774 32,046 33,678 65,723 492 194 686 184,574 159,719 344,293
TotalAge
Group
Civil serviceOther government
agenicesArmed Forces Agricultural farming
Public/government
companiesPrivate companies NGO/INGOPrivate businesses
Male Female Total Male Female Total Male Female Total Male Female Total Male Female Total Male Female Total Male Female Total Male Female Total Male Female Total
15-19 0 0 0 0 0 0 0 0 0 2,678 3,256 5,934 0 0 0 85 74 159 267 355 622 0 0 0 3,031 3,684 6,715
20-24 0 146 146 147 81 228 0 0 0 8,371 9,182 17,553 147 228 375 691 311 1,002 1,366 2,323 3,689 0 0 0 10,722 12,271 22,993
25-29 816 1,077 1,893 159 104 262 85 0 85 9,048 10,806 19,854 541 291 832 1,442 324 1,765 2,693 3,102 5,795 220 0 220 15,004 15,703 30,707
30-34 427 381 808 1199 347 1546 596 0 596 7,833 12,080 19,913 220 341 561 917 415 1,332 2,330 1,594 3,924 0 0 0 13,523 15,157 28,680
35-39 710 319 1029 883 457 1,340 85 0 85 9,055 11,942 20,997 726 296 1022 703 153 856 2,417 2,487 4,904 0 0 0 14,580 15,654 30,234
40-44 409 135 544 713 0 713 256 0 256 9,208 12,635 21,843 135 85 220 898 67 965 1,651 1,675 3,326 0 0 0 13,268 14,597 27,866
45-49 648 0 648 445 0 445 323 0 323 9,902 13,317 23,218 490 0 490 524 0 524 1,351 1,544 2,895 0 0 0 13,684 14,860 28,544
50-54 330 0 330 1123 135 1258 0 0 0 10,010 12,896 22,906 443 0 443 274 0 274 1,100 881 1,982 0 0 0 13,280 13,912 27,192
55-59 213 135 349 470 0 470 79 0 79 9,089 6,902 15,991 0 0 0 74 0 74 1,209 293 1,502 0 0 0 11,135 7,330 18,465
60-64 198 0 198 141 0 141 0 0 0 8,350 4,650 13,000 0 0 0 133 0 133 549 288 837 0 0 0 9,371 4,938 14,309
65+ 0 0 0 408 0 408 0 0 0 9,748 5,155 14,903 0 0 0 0 0 0 883 181 1,064 0 0 0 11,039 5,336 16,375
Total 3,751 2,193 5,944 5,687 1,124 6,811 1,425 0 1,425 93,294 102,820 196,114 2,702 1,240 3,942 5,742 1,344 7,086 15,815 14,723 30,539 220 0 220 128,636 123,444 252,080
Peivate businessesPrivate companies NGO/INGO TotalAge
Group
Civil serviceOther government
agenicesArmed Forces Agricultural farming
Public/government
companies

Labour Force Survey Report 2015
44
Table 3.2: Total employed by age group, type of enterprise and gender 2015 - Urban Bhutan
Table 3.3: Total employed by dzongkhag, type of enterprise and gender 2015 - Bhutan
Male Female Total Male Female Total Male Female Total Male Female Total Male Female Total Male Female Total Male Female Total Male Female Total Male Female Total
15-19 0 0 0 0 0 0 0 18 18 0 26 26 13 0 13 127 138 265 135 344 479 0 0 0 275 525 800
20-24 295 566 860 183 131 313 305 172 477 111 148 260 337 299 636 746 752 1,498 1,015 1,868 2,883 13 13 26 3,005 3,948 6,954
25-29 2,286 2,057 4,342 549 490 1,039 968 90 1,058 142 231 374 1,318 906 2,225 2,113 1,300 3,413 2,663 3,513 6,175 64 38 103 10,103 8,625 18,728
30-34 2,552 1,926 4,479 949 634 1,582 2,101 117 2,218 125 291 416 1,026 539 1,566 1,257 646 1,903 2,808 3,584 6,391 92 44 136 10,910 7,782 18,691
35-39 2,663 1,119 3,781 634 252 885 2,262 90 2,352 117 343 461 1,006 364 1,371 1,284 224 1,508 2,696 3,903 6,599 51 35 86 10,712 6,330 17,043
40-44 1,347 428 1,775 587 186 773 1,662 35 1,697 146 129 274 1,008 240 1,248 659 180 838 1,913 2,242 4,156 13 26 38 7,335 3,466 10,800
45-49 1,222 352 1,574 516 126 643 1,136 16 1,152 102 217 318 891 40 931 498 92 590 1,620 1,626 3,246 0 13 13 5,985 2,481 8,467
50-54 826 134 959 377 68 446 298 0 298 209 231 441 482 26 508 390 26 415 1,268 825 2,092 26 26 51 3,875 1,335 5,211
55-59 360 38 398 158 18 176 57 0 57 153 195 348 236 37 273 69 56 125 729 607 1,335 13 0 13 1,773 951 2,724
60-64 53 0 53 40 68 108 13 0 13 93 188 282 13 0 13 120 0 120 808 214 1022 0 0 0 1140 470 1,610
65+ 13 0 13 13 0 13 13 0 13 197 130 327 0 0 0 13 0 13 577 230 806 0 0 0 825 360 1,185
Total 11,615 6,619 18,234 4,005 1,973 5,978 8,815 538 9,352 1,395 2,131 3,527 6,331 2,452 8,783 7,276 3,412 10,688 16,230 18,954 35,185 271 194 466 55,938 36,27 92,213
Public/government
companiesPrivate companies NGO/INGO TotalAge
Group
Civil serviceOther government
agenicesArmed Forces Agricultural farming Private businesses
Male Female Total Male Female Total Male Female Total Male Female Total Male Female Total Male Female Total Male Female Total Male Female Total Male Female Total
Bumthang 172 17 189 120 34 155 0 0 0 2,164 3,063 5,227 69 34 103 155 148 303 564 695 1,260 0 0 0 3,244 3,992 7,236
Chukha 1,821 1,473 3,294 1,266 489 1,755 1,882 92 1,973 6,834 5,687 12,521 2,643 624 3,267 3,877 1,100 4,978 3,413 3,787 7,199 0 18 18 21,736 13,270 35,006
Dagana 409 471 880 335 136 471 128 55 182 4,420 4,717 9,136 128 36 164 100 18 118 1,303 752 2,054 0 0 0 6,821 6,185 13,006
Gasa 19 0 19 10 0 10 0 0 0 742 1,335 2,077 15 5 19 0 0 0 19 34 53 0 0 0 805 1,374 2,178
Haa 68 46 114 312 34 346 148 0 148 1,703 3,973 5,676 0 11 11 81 0 81 657 344 1,001 0 0 0 2,969 4,408 7,377
Lhuntse 446 229 674 170 24 193 12 0 12 2,082 1,747 3,829 237 0 237 67 0 67 407 1,481 1,888 0 0 0 3,421 3,480 6,901
Mongar 624 261 885 389 216 606 58 15 73 6,666 9,056 15,722 290 116 406 318 253 571 1,804 1,062 2,866 0 0 0 10,149 10,979 21,128
Paro 904 428 1333 426 170 596 1313 53 1365 1,704 3,237 4,940 343 393 737 1,744 857 2,601 2,555 3,851 6,406 85 0 85 9,074 8,989 18,063
Pemagatshel 783 196 979 235 13 248 39 0 39 5,851 5,864 11,714 78 52 131 39 0 39 810 1,254 2,063 0 0 0 7,835 7,378 15,214
Punakha 567 201 769 291 0 291 12 0 12 4,971 7,475 12,446 540 222 763 177 120 297 955 874 1,829 0 0 0 7,514 8,893 16,407
Samdrup Jongkhar 600 180 779 309 41 351 1244 55 1300 5,947 5,711 11,658 55 0 55 745 278 1,023 1,365 901 2,266 0 0 0 10,266 7,167 17,433
Samtse 785 654 1440 938 504 1,441 1,101 55 1,156 14,237 11,239 25,476 909 275 1,184 2,027 633 2,661 2,262 2,951 5,213 28 0 28 22,288 16,311 38,599
Sarpang 1256 421 1,677 507 94 600 423 31 454 8,105 8,328 16,433 407 47 454 125 62 187 1,917 2,959 4,876 0 0 0 12,739 11,943 24,682
Thimphu 5,435 3,665 9,100 1,797 995 2,792 3,156 115 3,272 1454 1994 3,448 2,568 1,399 3,967 2,914 1,129 4,043 9,243 9,210 18,453 379 167 546 26,946 18,675 45,621
Tashigang 328 124 452 1034 89 1123 80 0 80 6,078 5,462 11,541 71 44 115 80 0 80 962 989 1,950 0 0 0 8,633 6,708 15,341
Tashi Yangtse 158 93 251 622 93 715 14 0 14 2,303 3,168 5,471 14 0 14 29 0 29 1,180 401 1,581 0 0 0 4,320 3,755 8,075
Trongsa 168 48 216 179 95 274 0 0 0 2,317 3,583 5,900 48 24 73 344 12 356 525 527 1052 0 0 0 3,581 4,290 7,871
Tsirang 136 60 196 128 15 143 181 60 242 4,288 3,264 7,552 15 15 30 94 15 109 558 249 807 0 0 0 5,401 3,679 9,080
Wangdue 448 107 555 221 27 247 421 7 428 8,673 11,091 19,764 548 374 923 47 33 80 461 769 1,230 0 0 0 10,819 12,409 23,228
Zhemgang 238 137 375 403 27 430 27 0 27 4,151 4,957 9,108 55 18 73 55 96 151 1085 590 1,675 0 9 9 6,014 5,835 11,849
Total 15,366 8,813 24,178 9,692 3,097 12,789 10,239 538 10,777 94,689 104,951 199,640 9,033 3,692 12,726 13,018 4,756 17,774 32,046 33,678 65,723 492 194 686 184,574 159,719 344,293
TotalAge Group
Civil serviceOther government
agenicesArmed Forces Agricultural farming
Public/government
companiesPrivate companies NGO/INGOPrivate businesses

Labour Force Survey Report 2015
45
Chapter 4:
Table 4.0: Total employed persons by age group and level of education 2015 - Bhutan
Table 4.1: Total employed persons by age group and level of education 2015 - Male Bhutan
No formal
educationNursery Primary
Lower
Secondary
Middle
Secondary
Higher
Secondary
Bachelor
Degree
Masters &
aboveNFE
Religious
Professionals
15-19 2,800 79 2,160 780 1213 160 0 0 226 98 7,516
20-24 9,037 158 3,340 2,723 6,596 4,574 908 13 1,801 797 29,947
25-29 13,516 0 4,520 4,299 7,689 8,193 6,451 114 3,121 1453 49,435
30-34 19,643 79 5,442 3,351 5,774 4,810 4,212 479 2,743 837 47,371
35-39 25,447 0 5,795 2,550 4,840 2,403 2,791 525 2,060 866 47,276
40-44 25,723 67 3,886 1,564 1,948 973 1087 631 1,871 916 38,666
45-49 26,494 85 3,209 1,565 1,596 677 778 236 1,332 1039 37,011
50-54 25,341 0 1,646 1493 591 319 391 280 1,034 1309 32,403
55-59 17,686 0 993 215 267 143 170 219 428 1068 21,189
60-64 13,215 0 980 218 475 196 223 83 197 333 15,919
65+ 16,285 0 421 79 33 141 13 13 0 574 17,559
Total 195,185 469 32,391 18,836 31,023 22,589 17,024 2,592 14,813 9,290 344,293
Age
GroupTotal
Level of Education
No formal
education Nursery Primary
Lower
Secondar
y
Middle
Secondary
Higher
Secondary
Bachelor
Degree
Masters
& aboveNFE
Religious
Professionals
15-19 1,084 79 1,032 305 641 85 0 0 79 0 3,306
20-24 3,249 0 2,124 1,675 2,870 1,968 497 13 598 735 13,728
25-29 5,975 0 2,387 2,377 3,628 4,521 3,614 70 1,004 1453 25,107
30-34 8,300 0 3,834 2,037 3,043 2,706 2,705 143 840 824 24,432
35-39 10,723 0 3,910 1,469 3,137 1,751 2,336 337 776 854 25,292
40-44 11,398 67 3,074 1,011 1,645 831 896 386 380 916 20,603
45-49 11,739 85 2,439 1,266 1,434 613 618 223 317 935 19,669
50-54 11,368 0 1,365 1341 550 281 378 229 335 1309 17,155
55-59 9,701 0 993 215 241 130 152 71 336 1068 12,908
60-64 8,034 0 964 218 475 180 223 83 0 333 10,511
65+ 10,687 0 335 79 33 141 0 13 0 574 11,863
Total 92,259 232 22,458 11,994 17,696 13,208 11,417 1,567 4,664 9,000 184,574
Age
GroupTotal
Level of Education

Labour Force Survey Report 2015
46
Table 4.2: Total employed persons by age group and level of education 2015 - Female Bhutan
Table 4.3: Total employed persons by age group and level of education 2015 - Rural Bhutan
No formal
education Nursery Primary
Lower
Secondary
Middle
Secondary
Higher
Secondary
Bachelor
Degree
Masters &
aboveNFE
Religious
Professionals
15-19 1,716 0 1,128 475 572 74 0 0 147 98 4,210
20-24 5,788 158 1,216 1,048 3,727 2,606 411 0 1,203 62 16,219
25-29 7,541 0 2,133 1,922 4,061 3,672 2,837 44 2,117 0 24,328
30-34 11,343 79 1,608 1,314 2,732 2,104 1,508 336 1,903 13 22,939
35-39 14,724 0 1,885 1,081 1,703 652 455 188 1,284 13 21,984
40-44 14,324 0 813 553 302 142 192 245 1,492 0 18,063
45-49 14,755 0 770 298 162 64 160 13 1,015 104 17,341
50-54 13,973 0 281 151 41 38 13 51 699 0 15,248
55-59 7,985 0 0 0 26 13 18 148 92 0 8,282
60-64 5,180 0 16 0 0 16 0 0 197 0 5,409
65+ 5,598 0 86 0 0 0 13 0 0 0 5,696
Total 102,926 238 9,933 6,843 13,326 9,381 5,607 1,025 10,149 290 159,719
Age
GroupTotal
Level of Education
No formal
education Nursery Primary
Lower
Secondary
Middle
Secondary
Higher
Secondary
Bachelor
Degree
Masters
& aboveNFE
Religious
Professionals
15-19 2,552 79 2,055 640 1017 67 0 0 226 79 6,715
20-24 8,154 158 3,045 1,996 4,699 2,233 252 0 1,712 743 22,993
25-29 11,082 0 3,438 3,150 4,162 2,840 1,701 0 2,942 1312 30,707
30-34 15,406 79 3,753 2,044 2,308 1,071 661 220 2,497 640 28,680
35-39 19,712 0 3,497 1,028 1,910 775 585 220 1,871 635 30,234
40-44 21,000 67 2,408 506 836 199 209 215 1,587 838 27,866
45-49 22,803 67 1,978 605 668 135 135 93 1,164 896 28,544
50-54 22,593 0 1,037 962 189 0 79 70 1,008 1254 27,192
55-59 15,954 0 791 104 67 0 0 135 410 1004 18,465
60-64 12,135 0 821 152 368 135 198 0 179 322 14,309
65+ 15,347 0 313 64 0 104 0 0 0 547 16,375
Total 166,737 451 23,137 11,251 16,224 7,560 3,821 953 13,595 8,270 252,080
Age
Group
Level of Education
Total
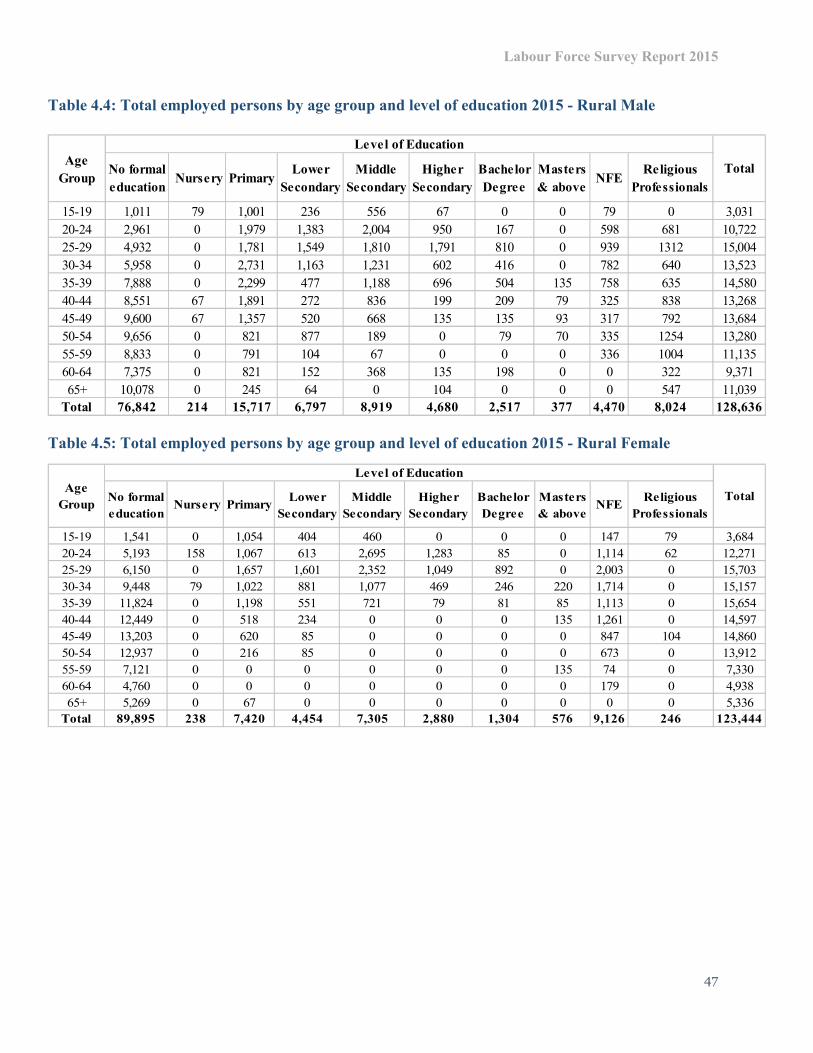
Labour Force Survey Report 2015
47
Table 4.4: Total employed persons by age group and level of education 2015 - Rural Male
Table 4.5: Total employed persons by age group and level of education 2015 - Rural Female
No formal
education Nursery Primary
Lower
Secondary
Middle
Secondary
Higher
Secondary
Bachelor
Degree
Masters
& aboveNFE
Religious
Professionals
15-19 1,011 79 1,001 236 556 67 0 0 79 0 3,031
20-24 2,961 0 1,979 1,383 2,004 950 167 0 598 681 10,722
25-29 4,932 0 1,781 1,549 1,810 1,791 810 0 939 1312 15,004
30-34 5,958 0 2,731 1,163 1,231 602 416 0 782 640 13,523
35-39 7,888 0 2,299 477 1,188 696 504 135 758 635 14,580
40-44 8,551 67 1,891 272 836 199 209 79 325 838 13,268
45-49 9,600 67 1,357 520 668 135 135 93 317 792 13,684
50-54 9,656 0 821 877 189 0 79 70 335 1254 13,280
55-59 8,833 0 791 104 67 0 0 0 336 1004 11,135
60-64 7,375 0 821 152 368 135 198 0 0 322 9,371
65+ 10,078 0 245 64 0 104 0 0 0 547 11,039
Total 76,842 214 15,717 6,797 8,919 4,680 2,517 377 4,470 8,024 128,636
Age
Group
Level of Education
Total
No formal
education Nursery Primary
Lower
Secondary
Middle
Secondary
Higher
Secondary
Bachelor
Degree
Masters
& aboveNFE
Religious
Professionals
15-19 1,541 0 1,054 404 460 0 0 0 147 79 3,684
20-24 5,193 158 1,067 613 2,695 1,283 85 0 1,114 62 12,271
25-29 6,150 0 1,657 1,601 2,352 1,049 892 0 2,003 0 15,703
30-34 9,448 79 1,022 881 1,077 469 246 220 1,714 0 15,157
35-39 11,824 0 1,198 551 721 79 81 85 1,113 0 15,654
40-44 12,449 0 518 234 0 0 0 135 1,261 0 14,597
45-49 13,203 0 620 85 0 0 0 0 847 104 14,860
50-54 12,937 0 216 85 0 0 0 0 673 0 13,912
55-59 7,121 0 0 0 0 0 0 135 74 0 7,330
60-64 4,760 0 0 0 0 0 0 0 179 0 4,938
65+ 5,269 0 67 0 0 0 0 0 0 0 5,336
Total 89,895 238 7,420 4,454 7,305 2,880 1,304 576 9,126 246 123,444
Age
Group
Level of Education
Total

Labour Force Survey Report 2015
48
Table 4.6: Total employed persons by age group and level of education 2015 - Urban Bhutan
Table 4.7: Total employed persons by age group and level of education 2015 - Urban Male
No formal
education Nursery Primary
Lower
Secondary
Middle
Secondary
Higher
Secondary
Bachelor
Degree
Masters
& aboveNFE
Religious
Professionals
15-19 248 0 105 140 196 93 0 0 0 18 800
20-24 883 0 294 727 1,897 2,341 656 13 89 54 6,954
25-29 2,434 0 1,081 1,149 3,528 5,354 4,749 114 179 141 18,728
30-34 4,237 0 1,689 1,307 3,466 3,740 3,551 259 246 197 18,691
35-39 5,735 0 2,297 1,522 2,930 1,628 2,205 305 189 231 17,043
40-44 4,722 0 1,478 1,058 1,112 774 878 416 285 78 10,800
45-49 3,691 18 1,231 960 927 542 643 143 168 143 8,467
50-54 2,747 0 608 531 402 319 312 211 26 55 5,211
55-59 1,732 0 202 112 199 143 170 84 18 64 2,724
60-64 1,080 0 159 66 107 61 26 83 18 11 1,610
65+ 938 0 108 15 33 37 13 13 0 28 1,185
Total 28,447 18 9,253 7,585 14,798 15,030 13,203 1,639 1,218 1,020 92,213
Age
Group
Level of Education
Total
No formal
education Nursery Primary
Lower
Secondary
Middle
Secondary
Higher
Secondary
Bachelor
Degree
Masters
& aboveNFE
Religious
Professionals
15-19 72 0 31 68 85 18 0 0 0 0 275
20-24 288 0 145 292 865 1,018 330 13 0 54 3,005
25-29 1,043 0 606 828 1,818 2,730 2,804 70 64 141 10,103
30-34 2,342 0 1,103 874 1,812 2,104 2,289 143 58 185 10,910
35-39 2,835 0 1,611 992 1,948 1,055 1,832 202 18 219 10,712
40-44 2,847 0 1,183 739 809 632 686 306 54 78 7,335
45-49 2,140 18 1,081 747 766 478 483 130 0 143 5,985
50-54 1,712 0 544 465 361 281 299 160 0 55 3,875
55-59 868 0 202 112 174 130 152 71 0 64 1,773
60-64 659 0 143 66 107 45 26 83 0 11 1,140
65+ 609 0 90 15 33 37 0 13 0 28 825
Total 15,417 18 6,740 5,197 8,777 8,528 8,900 1,190 194 976 55,938
TotalAge
Group
Level of Education

Labour Force Survey Report 2015
49
Table 4.8: Total employed persons by age group and level of education 2015 - Urban Female
Table 4.9: Total employed persons by dzongkhag and level of education 2015 - Bhutan
No formal
education Nursery Primary
Lower
Secondary
Middle
Secondary
Higher
Secondary
Bachelor
Degree
Masters
& aboveNFE
Religious
Professionals
15-19 175 0 74 71 112 74 0 0 0 18 525
20-24 595 0 149 435 1,032 1,323 326 0 89 0 3,948
25-29 1,391 0 476 321 1,710 2,624 1,945 44 115 0 8,625
30-34 1,895 0 585 433 1,654 1,635 1,262 115 188 13 7,782
35-39 2,899 0 686 530 982 573 374 103 171 13 6,330
40-44 1,875 0 295 319 302 142 192 110 231 0 3,466
45-49 1,552 0 150 213 162 64 160 13 168 0 2,481
50-54 1,035 0 64 66 41 38 13 51 26 0 1,335
55-59 863 0 0 0 26 13 18 13 18 0 951
60-64 421 0 16 0 0 16 0 0 18 0 470
65+ 329 0 18 0 0 0 13 0 0 0 360
Total 13,031 0 2,513 2,388 6,021 6,502 4,303 449 1,024 44 36,274
Age
Group
Level of Education
Total
No formal
educationNursery Primary
Lower
Secondary
Middle
Secondary
Higher
Secondary
Bachelor
degree
Masters &
aboveNFE
Religious
Professionals
Bumthang 4,245 0 710 796 637 258 103 17 249 221 7,236
Chukha 14,816 18 4,218 3,017 4,797 3,422 2,499 220 1158 840 35,006
Dagana 6,310 0 2,433 967 1638 454 761 0 280 163 13,006
Gasa 1,690 0 79 148 5 19 15 0 74 148 2,178
Haa 5,184 0 126 126 380 183 68 70 660 579 7,377
Lhuntse 3,588 134 695 561 620 410 185 0 415 292 6,901
Mongar 11,967 317 2,068 1219 1,237 1026 319 15 2,096 864 21,128
Paro 7,594 0 1,846 1,606 2,806 1,731 1062 170 496 752 18,063
Pemagatshel 8,815 0 1,006 614 770 836 823 13 1920 418 15,214
Punakha 10,473 0 991 679 1,126 1,009 474 105 676 874 16,407
Samdrup Jongkhar 10,769 0 999 620 813 1345 337 0 1956 593 17,433
Samtse 24,821 0 4,915 2,602 3,235 1530 991 83 186 235 38,599
Sarpang 15,962 0 2,008 1,087 2,155 1731 675 126 588 270 24,682
Thimphu 13,361 0 5,028 3,138 7,184 6,937 7,457 1,721 321 475 45,621
Tashigang 12,554 0 758 116 614 212 266 0 500 321 15,341
Tashiyangtse 6,723 0 150 43 608 57 86 0 0 408 8,075
Trongsa 5,244 0 463 192 477 121 144 12 969 248 7,871
Tsirang 5,362 0 1857 588 362 230 170 0 512 0 9,080
Wangdue 16,752 0 1,824 635 1,036 655 328 13 875 1,109 23,228
Zhemgang 8,957 0 215 82 522 421 261 27 883 481 11,849
Total 195,185 469 32,391 18,836 31,023 22,589 17,024 2,592 14,813 9,290 344,293
Dzongkhag Total
Level of Education

Labour Force Survey Report 2015
50
Table 4.10: Total employed persons by dzongkhag and level of education 2015 - Rural Bhutan
Table 4.11: Total employed persons by dzongkhag and level of education 2015 - Urban Bhutan
No formal
educationNursery Primary
Lower
Secondary
Middle
Secondary
Higher
Secondary
Bachelor
degree
Masters
& aboveNFE
Religious
Professionals
Bumthang 2,922 0 435 435 311 0 0 0 249 187 4,539
Chukha 10,730 0 2,294 1,350 1,957 472 135 0 810 675 18,423
Dagana 6,018 0 2,196 895 1383 163 488 0 244 163 11,548
Gasa 1,632 0 74 148 0 0 0 0 74 148 2,077
Haa 4,797 0 70 70 278 70 0 70 626 556 6,535
Lhuntse 3,493 134 672 537 537 269 67 0 403 269 6,382
Mongar 11,561 317 1,821 871 396 475 0 0 1,980 792 18,213
Paro 7,155 0 1,618 1,448 2,385 1,363 852 170 426 681 16,099
Pemagatshel 8,567 0 940 522 627 627 418 0 1881 418 14,000
Punakha 9,776 0 931 559 838 745 186 93 652 838 14,618
Samdrup Jongkhar 9,345 0 668 371 371 668 74 0 1928 593 14,018
Samtse 20,829 0 3,731 1,969 1,969 622 0 0 104 207 29,430
Sarpang 13,590 0 1,431 556 954 795 238 79 556 238 18,518
Thimphu 3,649 0 1,757 405 1,757 676 1,081 541 0 0 9,865
Tashigang 12,121 0 687 62 375 0 62 0 500 312 14,121
Tashiyangtse 5,977 0 79 0 551 0 0 0 0 393 7,000
Trongsa 4,784 0 354 59 295 0 59 0 945 236 6,733
Tsirang 5,120 0 1600 512 256 64 64 0 512 0 8,128
Wangdue 16,116 0 1,684 481 601 361 0 0 842 1,082 21,167
Zhemgang 8,554 0 96 0 384 192 96 0 865 481 10,669
Total 166,737 451 23,137 11,251 16,224 7,560 3,821 953 13,595 8,270 252,080
TotalDzongkhag
Level of Education
No formal
educationNursery Primary
Lower
Secondary
Middle
Secondary
Higher
Secondary
Bachelor
degree
Masters
& aboveNFE
Religious
Professionals
Bumthang 1,323 0 275 361 326 258 103 17 0 34 2,697
Chukha 4,086 18 1,924 1,667 2,840 2,950 2,364 220 348 165 16,583
Dagana 292 0 237 73 255 292 273 0 36 0 1,458
Gasa 58 0 5 0 5 19 15 0 0 0 102
Haa 387 0 57 57 102 114 68 0 34 23 842
Lhuntse 94 0 24 24 83 142 118 0 12 24 519
Mongar 406 0 247 348 841 551 319 15 116 73 2,915
Paro 438 0 228 158 421 368 210 0 70 70 1,964
Pemagatshel 248 0 65 91 144 209 405 13 39 0 1,214
Punakha 696 0 60 120 288 264 288 12 24 36 1,789
Samdrup Jongkhar 1,424 0 332 249 442 677 263 0 28 0 3,415
Samtse 3,992 0 1,184 633 1,267 909 991 83 83 28 9,169
Sarpang 2,372 0 577 531 1,202 936 437 47 31 31 6,164
Thimphu 9,712 0 3,272 2,733 5,427 6,261 6,376 1,180 321 475 35,756
Tashigang 433 0 71 53 239 212 203 0 0 9 1,220
Tashiyangtse 745 0 72 43 57 57 86 0 0 14 1,075
Trongsa 460 0 109 133 182 121 85 12 24 12 1,138
Tsirang 242 0 257 76 106 166 106 0 0 0 952
Wangdue 636 0 140 154 435 294 328 13 33 27 2,061
Zhemgang 402 0 119 82 137 229 165 27 18 0 1,180
Total 28,447 18 9,253 7,585 14,798 15,030 13,203 1,639 1,21 1,020 92,213
TotalDzongkhag
Level of Education

Labour Force Survey Report 2015
51
Chapter 5:
Table 5.0: Total employed persons by major economic activity and nature of employment 2015 - Bhutan
Regular
Paid
Employee
Casual
Paid
Employee
Contract
/Piece
Paid
Worker
Own-account
Worker (Non-
agriculture)
Own-account
Worker
(Agriculture)
Family
Worker (Non-
agriculture)
Family
Worker
(Agriculture)
Agricultural and Forestry 246 999 418 0 86,393 0 111,584 199,640
Mining and Quarrying 1,963 28 14 0 0 0 0 2,004
Manufacturing 8,137 1,488 327 10,260 0 2,111 0 22,323
Electricity, Gas and Water supply 1,793 28 862 12 0 0 0 2,695
Construction 3,171 907 1,086 980 0 96 0 6,241
Wholesale and Retail Trade 2,752 242 262 17,952 0 5,583 0 26,791
Hotels and Restaurants 3,016 103 25 3,340 0 1,498 0 7,981
Transport and Communications 4,498 1,715 186 6,046 0 157 0 12,603
Financial Intermediations 2,277 0 224 0 0 0 0 2,501
Real Estate, Renting and Business Activities 1,446 82 49 1,534 0 73 0 3,185
Public Administration and Defence Activities 30,745 506 256 0 0 0 0 31,507
Education 10,667 207 201 176 0 0 0 11,251
Health and Social Work 8,234 2,874 627 1,800 0 120 0 13,655
Private Households with employed persons 427 55 67 79 0 1288 0 1915
Total 79,371 9,234 4,604 42,179 86,393 10,927 111,584 344,293
Nature of Employment
Major Economic Activity Total
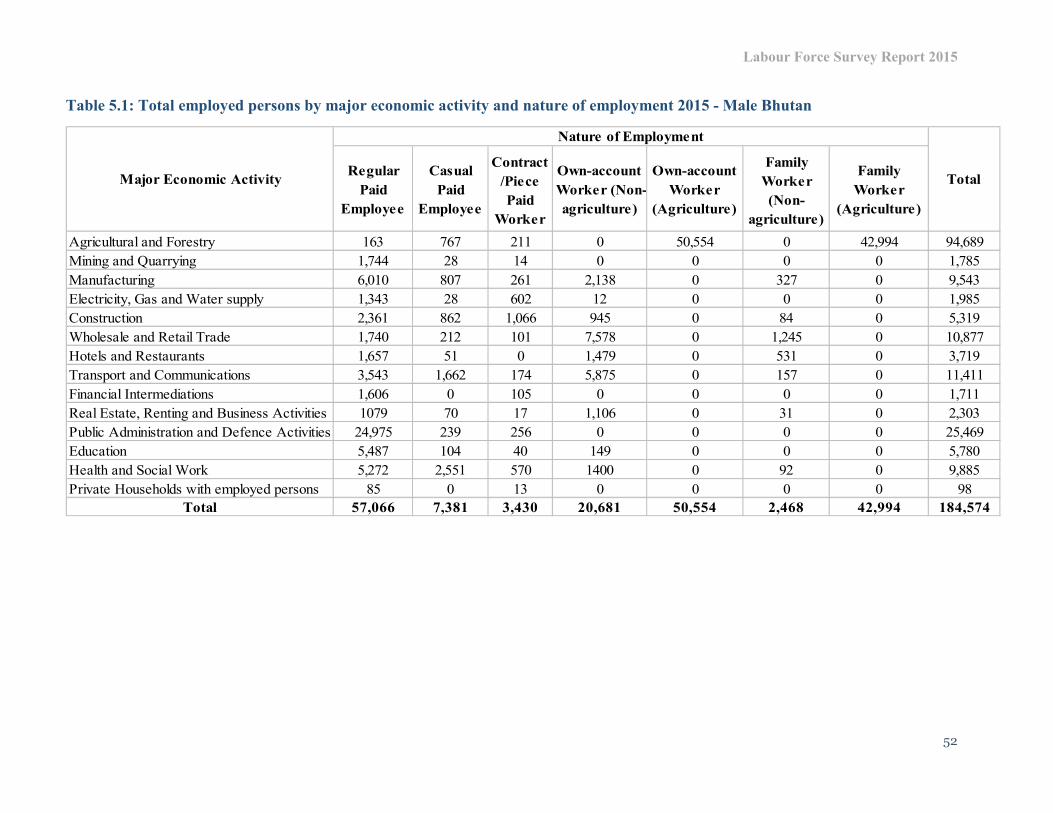
Labour Force Survey Report 2015
52
Table 5.1: Total employed persons by major economic activity and nature of employment 2015 - Male Bhutan
Regular
Paid
Employee
Casual
Paid
Employee
Contract
/Piece
Paid
Worker
Own-account
Worker (Non-
agriculture)
Own-account
Worker
(Agriculture)
Family
Worker
(Non-
agriculture)
Family
Worker
(Agriculture)
Agricultural and Forestry 163 767 211 0 50,554 0 42,994 94,689
Mining and Quarrying 1,744 28 14 0 0 0 0 1,785
Manufacturing 6,010 807 261 2,138 0 327 0 9,543
Electricity, Gas and Water supply 1,343 28 602 12 0 0 0 1,985
Construction 2,361 862 1,066 945 0 84 0 5,319
Wholesale and Retail Trade 1,740 212 101 7,578 0 1,245 0 10,877
Hotels and Restaurants 1,657 51 0 1,479 0 531 0 3,719
Transport and Communications 3,543 1,662 174 5,875 0 157 0 11,411
Financial Intermediations 1,606 0 105 0 0 0 0 1,711
Real Estate, Renting and Business Activities 1079 70 17 1,106 0 31 0 2,303
Public Administration and Defence Activities 24,975 239 256 0 0 0 0 25,469
Education 5,487 104 40 149 0 0 0 5,780
Health and Social Work 5,272 2,551 570 1400 0 92 0 9,885
Private Households with employed persons 85 0 13 0 0 0 0 98
Total 57,066 7,381 3,430 20,681 50,554 2,468 42,994 184,574
Major Economic Activity
Nature of Employment
Total
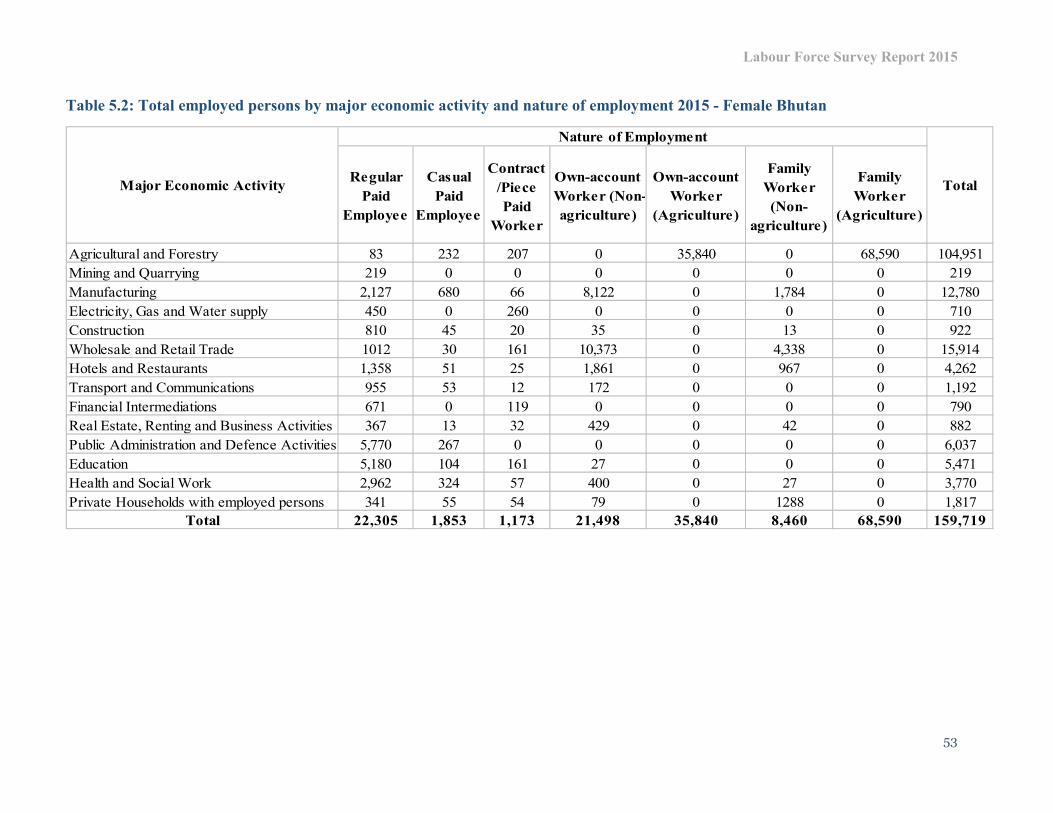
Labour Force Survey Report 2015
53
Table 5.2: Total employed persons by major economic activity and nature of employment 2015 - Female Bhutan
Regular
Paid
Employee
Casual
Paid
Employee
Contract
/Piece
Paid
Worker
Own-account
Worker (Non-
agriculture)
Own-account
Worker
(Agriculture)
Family
Worker
(Non-
agriculture)
Family
Worker
(Agriculture)
Agricultural and Forestry 83 232 207 0 35,840 0 68,590 104,951
Mining and Quarrying 219 0 0 0 0 0 0 219
Manufacturing 2,127 680 66 8,122 0 1,784 0 12,780
Electricity, Gas and Water supply 450 0 260 0 0 0 0 710
Construction 810 45 20 35 0 13 0 922
Wholesale and Retail Trade 1012 30 161 10,373 0 4,338 0 15,914
Hotels and Restaurants 1,358 51 25 1,861 0 967 0 4,262
Transport and Communications 955 53 12 172 0 0 0 1,192
Financial Intermediations 671 0 119 0 0 0 0 790
Real Estate, Renting and Business Activities 367 13 32 429 0 42 0 882
Public Administration and Defence Activities 5,770 267 0 0 0 0 0 6,037
Education 5,180 104 161 27 0 0 0 5,471
Health and Social Work 2,962 324 57 400 0 27 0 3,770
Private Households with employed persons 341 55 54 79 0 1288 0 1,817
Total 22,305 1,853 1,173 21,498 35,840 8,460 68,590 159,719
Major Economic Activity
Nature of Employment
Total
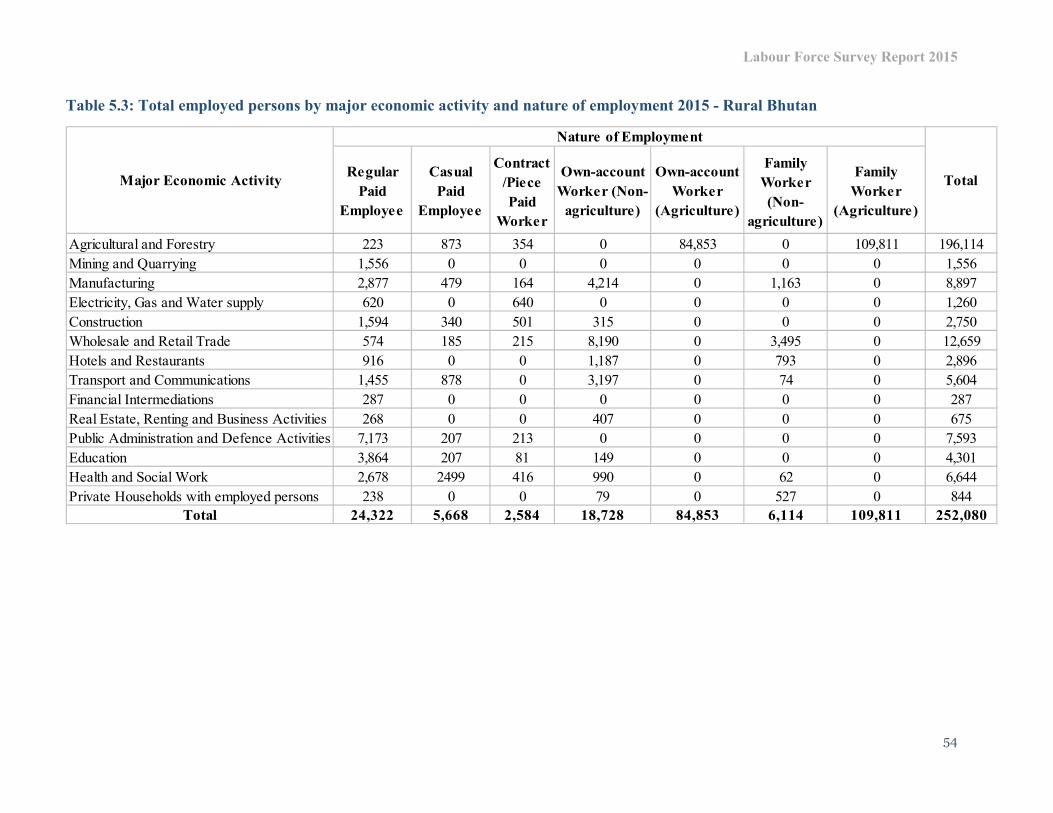
Labour Force Survey Report 2015
54
Table 5.3: Total employed persons by major economic activity and nature of employment 2015 - Rural Bhutan
Regular
Paid
Employee
Casual
Paid
Employee
Contract
/Piece
Paid
Worker
Own-account
Worker (Non-
agriculture)
Own-account
Worker
(Agriculture)
Family
Worker
(Non-
agriculture)
Family
Worker
(Agriculture)
Agricultural and Forestry 223 873 354 0 84,853 0 109,811 196,114
Mining and Quarrying 1,556 0 0 0 0 0 0 1,556
Manufacturing 2,877 479 164 4,214 0 1,163 0 8,897
Electricity, Gas and Water supply 620 0 640 0 0 0 0 1,260
Construction 1,594 340 501 315 0 0 0 2,750
Wholesale and Retail Trade 574 185 215 8,190 0 3,495 0 12,659
Hotels and Restaurants 916 0 0 1,187 0 793 0 2,896
Transport and Communications 1,455 878 0 3,197 0 74 0 5,604
Financial Intermediations 287 0 0 0 0 0 0 287
Real Estate, Renting and Business Activities 268 0 0 407 0 0 0 675
Public Administration and Defence Activities 7,173 207 213 0 0 0 0 7,593
Education 3,864 207 81 149 0 0 0 4,301
Health and Social Work 2,678 2499 416 990 0 62 0 6,644
Private Households with employed persons 238 0 0 79 0 527 0 844
Total 24,322 5,668 2,584 18,728 84,853 6,114 109,811 252,080
Major Economic Activity
Nature of Employment
Total
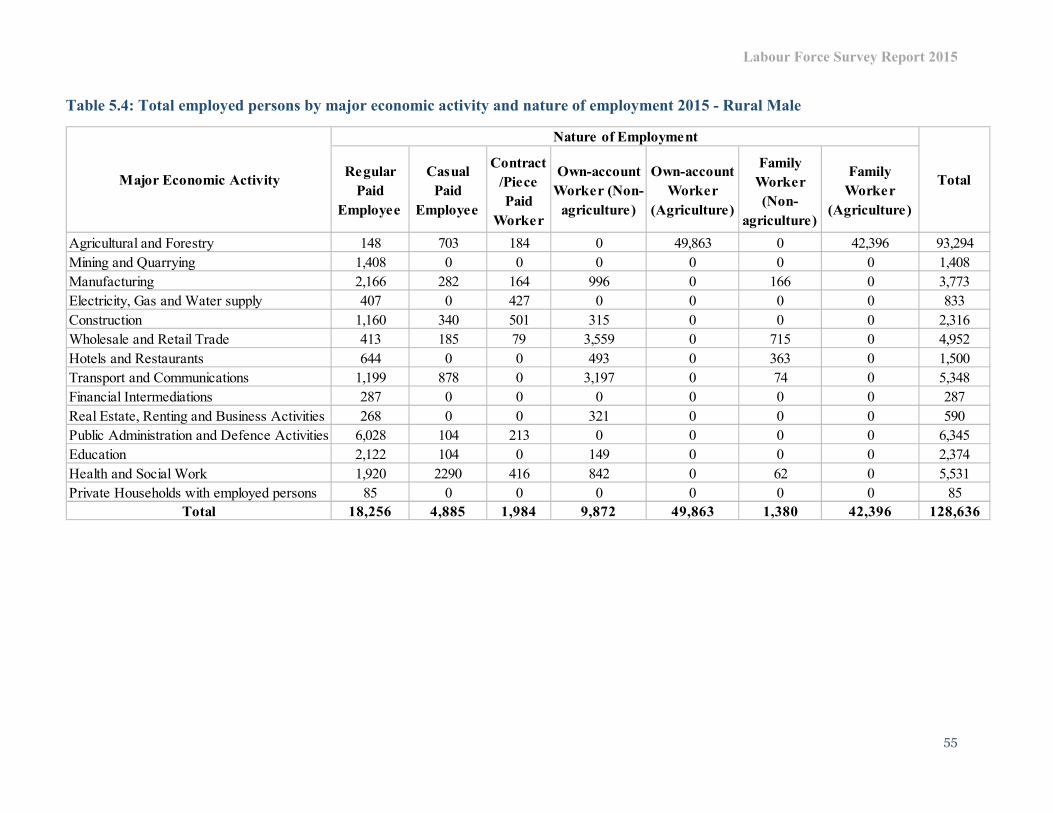
Labour Force Survey Report 2015
55
Table 5.4: Total employed persons by major economic activity and nature of employment 2015 - Rural Male
Regular
Paid
Employee
Casual
Paid
Employee
Contract
/Piece
Paid
Worker
Own-account
Worker (Non-
agriculture)
Own-account
Worker
(Agriculture)
Family
Worker
(Non-
agriculture)
Family
Worker
(Agriculture)
Agricultural and Forestry 148 703 184 0 49,863 0 42,396 93,294
Mining and Quarrying 1,408 0 0 0 0 0 0 1,408
Manufacturing 2,166 282 164 996 0 166 0 3,773
Electricity, Gas and Water supply 407 0 427 0 0 0 0 833
Construction 1,160 340 501 315 0 0 0 2,316
Wholesale and Retail Trade 413 185 79 3,559 0 715 0 4,952
Hotels and Restaurants 644 0 0 493 0 363 0 1,500
Transport and Communications 1,199 878 0 3,197 0 74 0 5,348
Financial Intermediations 287 0 0 0 0 0 0 287
Real Estate, Renting and Business Activities 268 0 0 321 0 0 0 590
Public Administration and Defence Activities 6,028 104 213 0 0 0 0 6,345
Education 2,122 104 0 149 0 0 0 2,374
Health and Social Work 1,920 2290 416 842 0 62 0 5,531
Private Households with employed persons 85 0 0 0 0 0 0 85
Total 18,256 4,885 1,984 9,872 49,863 1,380 42,396 128,636
Major Economic Activity
Nature of Employment
Total

Labour Force Survey Report 2015
56
Table 5.5: Total employed persons by major economic activity and nature of employment 2015 - Rural Female
Regular
Paid
Employee
Casual
Paid
Employee
Contract
/Piece
Paid
Worker
Own-account
Worker (Non-
agriculture)
Own-account
Worker
(Agriculture)
Family
Worker
(Non-
agriculture)
Family
Worker
(Agriculture)
Agricultural and Forestry 74 170 170 0 34,990 0 67,415 102,820
Mining and Quarrying 148 0 0 0 0 0 0 148
Manufacturing 711 197 0 3,218 0 997 0 5,124
Electricity, Gas and Water supply 213 0 213 0 0 0 0 427
Construction 434 0 0 0 0 0 0 434
Wholesale and Retail Trade 161 0 135 4,631 0 2,780 0 7,707
Hotels and Restaurants 271 0 0 695 0 430 0 1,396
Transport and Communications 256 0 0 0 0 0 0 256
Financial Intermediations 0 0 0 0 0 0 0 0
Real Estate, Renting and Business Activities 0 0 0 85 0 0 0 85
Public Administration and Defence Activities 1,145 104 0 0 0 0 0 1,249
Education 1,742 104 81 0 0 0 0 1,927
Health and Social Work 758 208 0 148 0 0 0 1,114
Private Households with employed persons 152 0 0 79 0 527 0 759
Total 6,066 783 600 8,856 34,990 4,734 67,415 123,444
Major Economic Activity
Nature of Employment
Total

Labour Force Survey Report 2015
57
Table 5.6: Total employed persons by major economic activity and nature of employment 2015 - Urban Bhutan
Regular
Paid
Employee
Casual
Paid
Employee
Contract
/Piece
Paid
Worker
Own-
account
Worker
(Non-
agriculture)
Own-account
Worker
(Agriculture)
Family
Worker
(Non-
agriculture)
Family
Worker
(Agriculture)
Agricultural and Forestry 23 126 64 0 1,541 0 1,772 3,527
Mining and Quarrying 406 28 14 0 0 0 0 448
Manufacturing 5,260 1008 163 6,046 0 948 0 13,426
Electricity, Gas and Water supply 1,173 28 222 12 0 0 0 1,435
Construction 1577 567 586 665 0 96 0 3,492
Wholesale and Retail Trade 2,178 58 47 9,761 0 2,088 0 14,132
Hotels and Restaurants 2,100 103 25 2,152 0 705 0 5,085
Transport and Communications 3,043 837 186 2,850 0 83 0 6,999
Financial Intermediations 1,989 0 224 0 0 0 0 2,214
Real Estate, Renting and Business Activities 1,178 82 49 1,128 0 73 0 2,510
Public Administration and Defence Activities 23,573 298 42 0 0 0 0 23,913
Education 6,803 0 120 27 0 0 0 6,950
Health and Social Work 5,556 376 211 810 0 57 0 7,011
Private Households with employed persons 189 55 67 0 0 761 0 1072
Total 55,049 3,566 2,020 23,451 1,541 4,813 1,772 92,213
Major Economic Activity
Nature of Employment
Total

Labour Force Survey Report 2015
58
Table 5.7: Total employed persons by major economic activity and nature of employment 2015 - Urban Male
Regular
Paid
Employee
Casual
Paid
Employee
Contract
/Piece
Paid
Worker
Own-
account
Worker
(Non-
agriculture)
Own-account
Worker
(Agriculture)
Family
Worker
(Non-
agriculture)
Family
Worker
(Agriculture)
Agricultural and Forestry 15 65 27 0 691 0 598 1,395
Mining and Quarrying 336 28 14 0 0 0 0 377
Manufacturing 3,844 526 97 1,142 0 161 0 5,769
Electricity, Gas and Water supply 937 28 175 12 0 0 0 1,152
Construction 1201 523 566 630 0 84 0 3,003
Wholesale and Retail Trade 1,327 28 21 4,019 0 530 0 5,925
Hotels and Restaurants 1,013 51 0 986 0 168 0 2,219
Transport and Communications 2,344 784 174 2,678 0 83 0 6,063
Financial Intermediations 1,318 0 105 0 0 0 0 1,424
Real Estate, Renting and Business Activities 811 70 17 784 0 31 0 1,713
Public Administration and Defence Activities 18,947 135 42 0 0 0 0 19,125
Education 3,366 0 40 0 0 0 0 3,406
Health and Social Work 3,352 260 155 558 0 30 0 4,355
Private Households with employed persons 0 0 13 0 0 0 0 13
Total 38,810 2,496 1,447 10,809 691 1,088 598 55,938
Major Economic Activity
Nature of Employment
Total
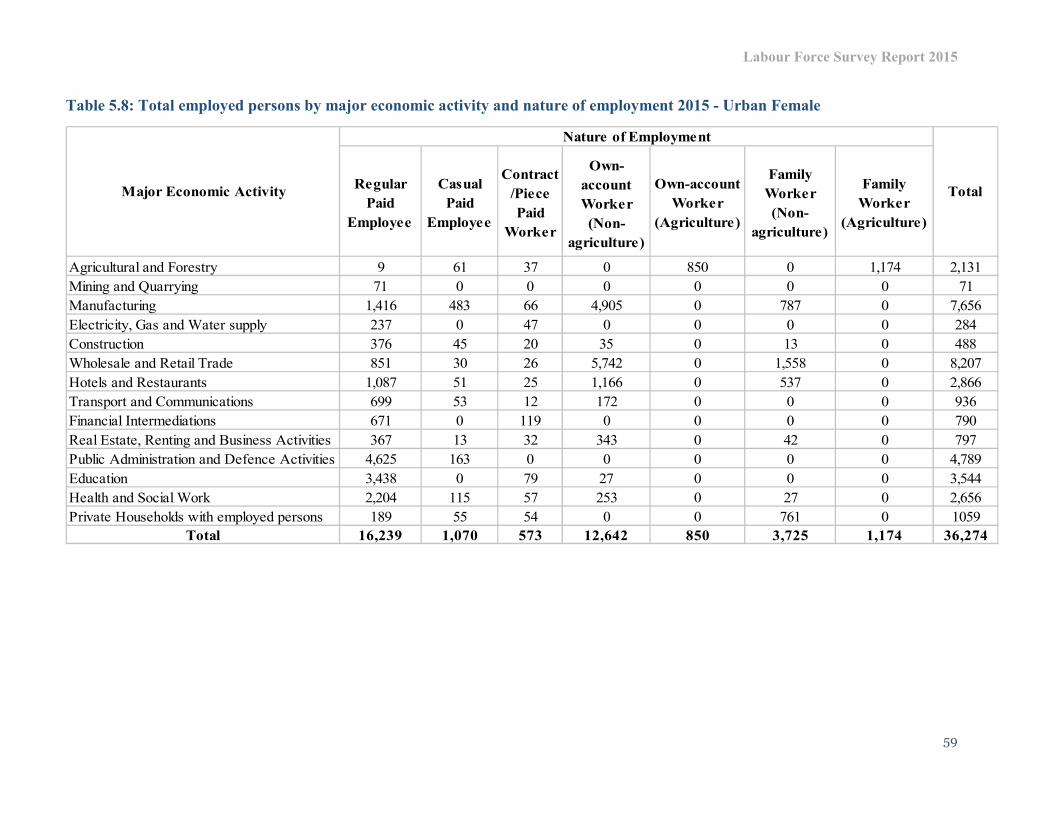
Labour Force Survey Report 2015
59
Table 5.8: Total employed persons by major economic activity and nature of employment 2015 - Urban Female
Regular
Paid
Employee
Casual
Paid
Employee
Contract
/Piece
Paid
Worker
Own-
account
Worker
(Non-
agriculture)
Own-account
Worker
(Agriculture)
Family
Worker
(Non-
agriculture)
Family
Worker
(Agriculture)
Agricultural and Forestry 9 61 37 0 850 0 1,174 2,131
Mining and Quarrying 71 0 0 0 0 0 0 71
Manufacturing 1,416 483 66 4,905 0 787 0 7,656
Electricity, Gas and Water supply 237 0 47 0 0 0 0 284
Construction 376 45 20 35 0 13 0 488
Wholesale and Retail Trade 851 30 26 5,742 0 1,558 0 8,207
Hotels and Restaurants 1,087 51 25 1,166 0 537 0 2,866
Transport and Communications 699 53 12 172 0 0 0 936
Financial Intermediations 671 0 119 0 0 0 0 790
Real Estate, Renting and Business Activities 367 13 32 343 0 42 0 797
Public Administration and Defence Activities 4,625 163 0 0 0 0 0 4,789
Education 3,438 0 79 27 0 0 0 3,544
Health and Social Work 2,204 115 57 253 0 27 0 2,656
Private Households with employed persons 189 55 54 0 0 761 0 1059
Total 16,239 1,070 573 12,642 850 3,725 1,174 36,274
Major Economic Activity
Nature of Employment
Total
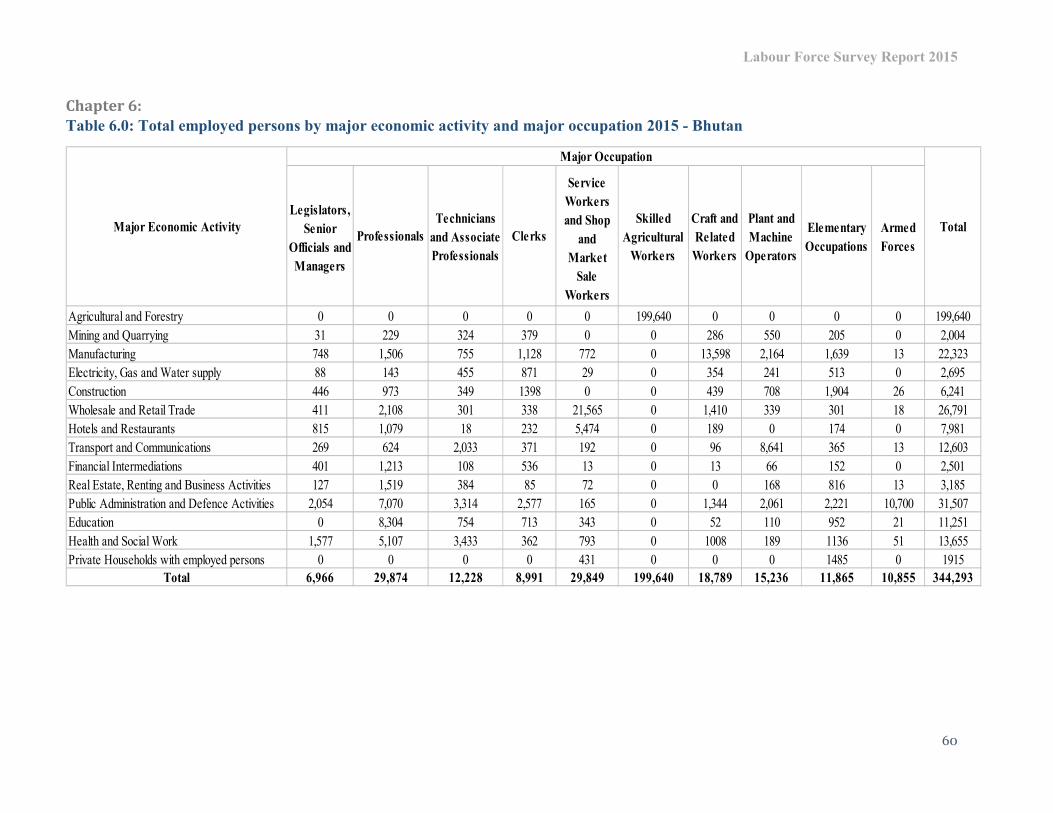
Labour Force Survey Report 2015
60
Chapter 6:
Table 6.0: Total employed persons by major economic activity and major occupation 2015 - Bhutan
Legislators,
Senior
Officials and
Managers
Professionals
Technicians
and Associate
Professionals
Clerks
Service
Workers
and Shop
and
Market
Sale
Workers
Skilled
Agricultural
Workers
Craft and
Related
Workers
Plant and
Machine
Operators
Elementary
Occupations
Armed
Forces
Agricultural and Forestry 0 0 0 0 0 199,640 0 0 0 0 199,640
Mining and Quarrying 31 229 324 379 0 0 286 550 205 0 2,004
Manufacturing 748 1,506 755 1,128 772 0 13,598 2,164 1,639 13 22,323
Electricity, Gas and Water supply 88 143 455 871 29 0 354 241 513 0 2,695
Construction 446 973 349 1398 0 0 439 708 1,904 26 6,241
Wholesale and Retail Trade 411 2,108 301 338 21,565 0 1,410 339 301 18 26,791
Hotels and Restaurants 815 1,079 18 232 5,474 0 189 0 174 0 7,981
Transport and Communications 269 624 2,033 371 192 0 96 8,641 365 13 12,603
Financial Intermediations 401 1,213 108 536 13 0 13 66 152 0 2,501
Real Estate, Renting and Business Activities 127 1,519 384 85 72 0 0 168 816 13 3,185
Public Administration and Defence Activities 2,054 7,070 3,314 2,577 165 0 1,344 2,061 2,221 10,700 31,507
Education 0 8,304 754 713 343 0 52 110 952 21 11,251
Health and Social Work 1,577 5,107 3,433 362 793 0 1008 189 1136 51 13,655
Private Households with employed persons 0 0 0 0 431 0 0 0 1485 0 1915
Total 6,966 29,874 12,228 8,991 29,849 199,640 18,789 15,236 11,865 10,855 344,293
Major Economic Activity
Major Occupation
Total
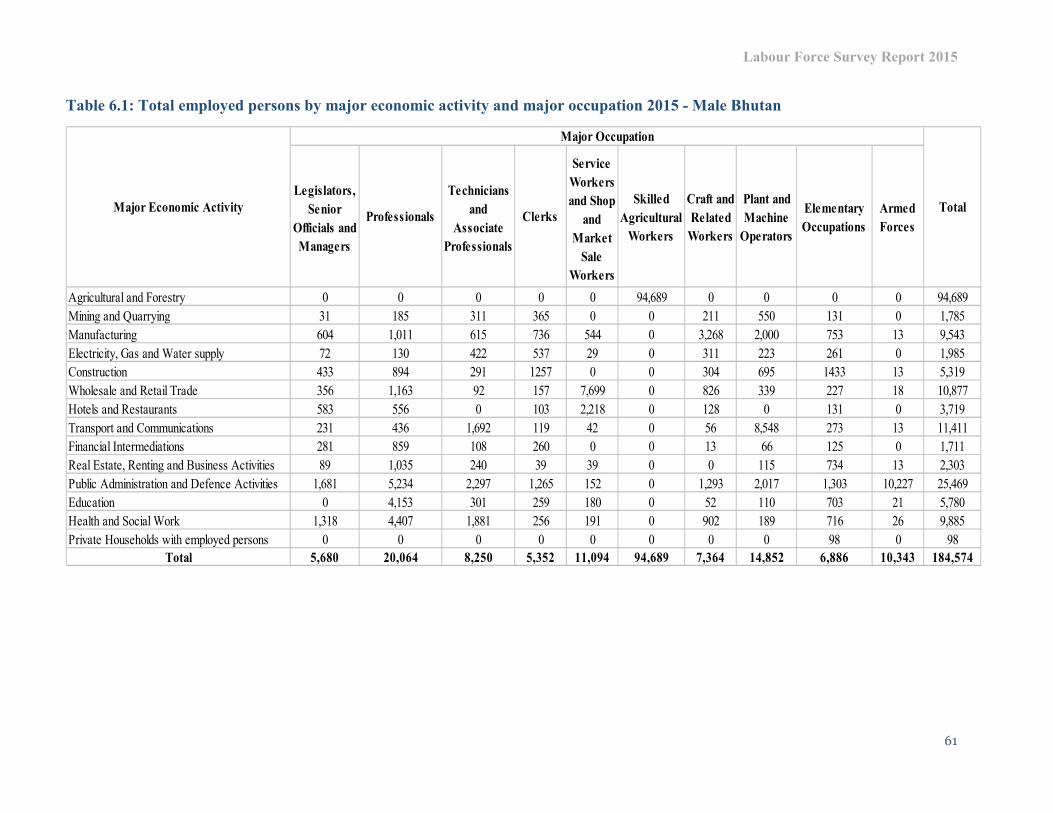
Labour Force Survey Report 2015
61
Table 6.1: Total employed persons by major economic activity and major occupation 2015 - Male Bhutan
Legislators,
Senior
Officials and
Managers
Professionals
Technicians
and
Associate
Professionals
Clerks
Service
Workers
and Shop
and
Market
Sale
Workers
Skilled
Agricultural
Workers
Craft and
Related
Workers
Plant and
Machine
Operators
Elementary
Occupations
Armed
Forces
Agricultural and Forestry 0 0 0 0 0 94,689 0 0 0 0 94,689
Mining and Quarrying 31 185 311 365 0 0 211 550 131 0 1,785
Manufacturing 604 1,011 615 736 544 0 3,268 2,000 753 13 9,543
Electricity, Gas and Water supply 72 130 422 537 29 0 311 223 261 0 1,985
Construction 433 894 291 1257 0 0 304 695 1433 13 5,319
Wholesale and Retail Trade 356 1,163 92 157 7,699 0 826 339 227 18 10,877
Hotels and Restaurants 583 556 0 103 2,218 0 128 0 131 0 3,719
Transport and Communications 231 436 1,692 119 42 0 56 8,548 273 13 11,411
Financial Intermediations 281 859 108 260 0 0 13 66 125 0 1,711
Real Estate, Renting and Business Activities 89 1,035 240 39 39 0 0 115 734 13 2,303
Public Administration and Defence Activities 1,681 5,234 2,297 1,265 152 0 1,293 2,017 1,303 10,227 25,469
Education 0 4,153 301 259 180 0 52 110 703 21 5,780
Health and Social Work 1,318 4,407 1,881 256 191 0 902 189 716 26 9,885
Private Households with employed persons 0 0 0 0 0 0 0 0 98 0 98
Total 5,680 20,064 8,250 5,352 11,094 94,689 7,364 14,852 6,886 10,343 184,574
Major Economic Activity
Major Occupation
Total
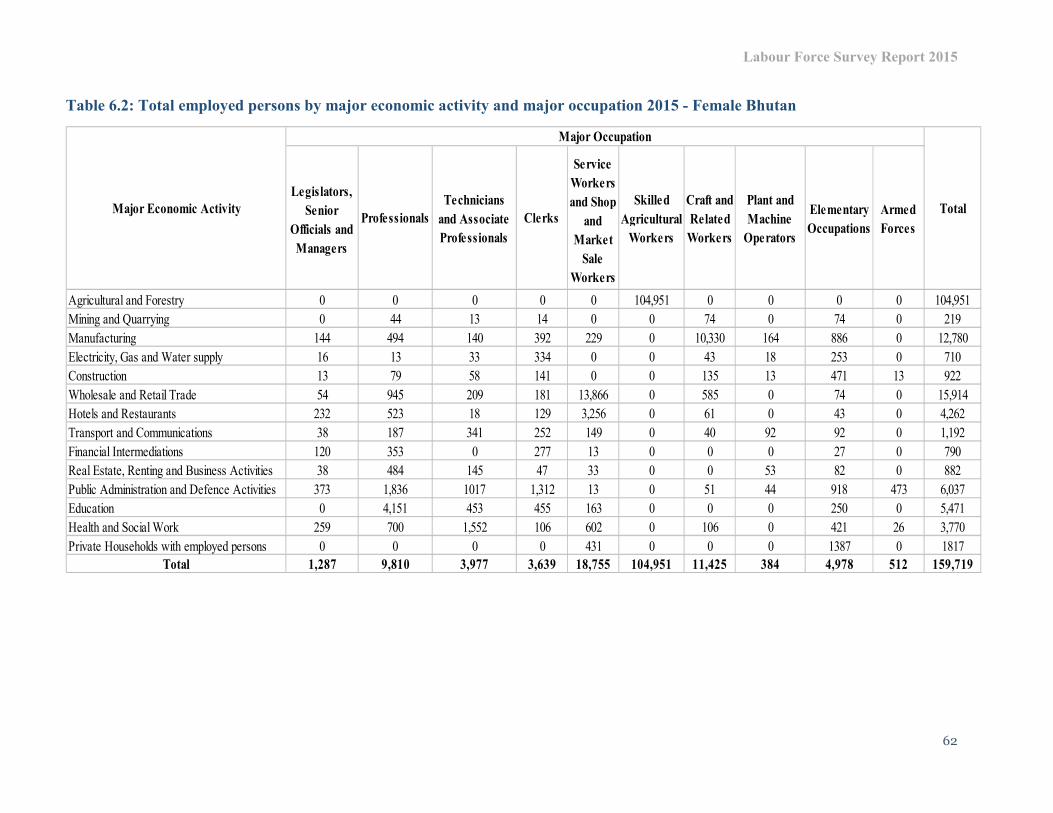
Labour Force Survey Report 2015
62
Table 6.2: Total employed persons by major economic activity and major occupation 2015 - Female Bhutan
Legislators,
Senior
Officials and
Managers
Professionals
Technicians
and Associate
Professionals
Clerks
Service
Workers
and Shop
and
Market
Sale
Workers
Skilled
Agricultural
Workers
Craft and
Related
Workers
Plant and
Machine
Operators
Elementary
Occupations
Armed
Forces
Agricultural and Forestry 0 0 0 0 0 104,951 0 0 0 0 104,951
Mining and Quarrying 0 44 13 14 0 0 74 0 74 0 219
Manufacturing 144 494 140 392 229 0 10,330 164 886 0 12,780
Electricity, Gas and Water supply 16 13 33 334 0 0 43 18 253 0 710
Construction 13 79 58 141 0 0 135 13 471 13 922
Wholesale and Retail Trade 54 945 209 181 13,866 0 585 0 74 0 15,914
Hotels and Restaurants 232 523 18 129 3,256 0 61 0 43 0 4,262
Transport and Communications 38 187 341 252 149 0 40 92 92 0 1,192
Financial Intermediations 120 353 0 277 13 0 0 0 27 0 790
Real Estate, Renting and Business Activities 38 484 145 47 33 0 0 53 82 0 882
Public Administration and Defence Activities 373 1,836 1017 1,312 13 0 51 44 918 473 6,037
Education 0 4,151 453 455 163 0 0 0 250 0 5,471
Health and Social Work 259 700 1,552 106 602 0 106 0 421 26 3,770
Private Households with employed persons 0 0 0 0 431 0 0 0 1387 0 1817
Total 1,287 9,810 3,977 3,639 18,755 104,951 11,425 384 4,978 512 159,719
Major Economic Activity
Major Occupation
Total

Labour Force Survey Report 2015
63
Table 6.3: Total employed persons by major economic activity and major occupation 2015 - Rural Bhutan
Legislators,
Senior
Officials
and
Managers
Professionals
Technicians
and
Associate
Professionals
Clerks
Service
Workers
and Shop
and
Market
Sale
Workers
Skilled
Agricultural
Workers
Craft and
Related
Workers
Plant and
Machine
Operators
Elementary
Occupations
Armed
Forces
Agricultural and Forestry 0 0 0 0 0 196,114 0 0 0 0 196,114
Mining and Quarrying 0 93 311 319 0 0 245 410 178 0 1,556
Manufacturing 220 332 238 488 104 0 6,148 828 539 0 8,897
Electricity, Gas and Water supply 0 0 255 578 0 0 0 93 334 0 1,260
Construction 185 161 85 505 0 0 308 367 1138 0 2,750
Wholesale and Retail Trade 85 649 79 79 10,949 0 573 164 79 0 12,659
Hotels and Restaurants 220 85 0 0 2,420 0 85 0 85 0 2,896
Transport and Communications 0 0 596 0 85 0 0 4,667 256 0 5,604
Financial Intermediations 0 220 0 0 0 0 0 0 67 0 287
Real Estate, Renting and Business Activities 0 313 135 0 0 0 0 0 226 0 675
Public Administration and Defence Activities 1,613 1,644 729 554 0 0 405 482 743 1,425 7,593
Education 0 3,142 264 0 212 0 0 0 682 0 4,301
Health and Social Work 1,377 3,412 783 135 148 0 539 0 251 0 6,644
Private Households with employed persons 0 0 0 0 248 0 0 0 595 0 844
Total 3,700 10,053 3,476 2,659 14,167 196,114 8,304 7,011 5,173 1,425 252,080
Major Economic Activity
Major Occupation
Total

Labour Force Survey Report 2015
64
Table 6.4: Total employed persons by major economic activity and major occupation 2015 - Rural Male
Legislators,
Senior
Officials
and
Managers
Professionals
Technicians
and
Associate
Professionals
Clerks
Service
Workers
and Shop
and
Market
Sale
Workers
Skilled
Agricultural
Workers
Craft and
Related
Workers
Plant and
Machine
Operators
Elementary
Occupations
Armed
Forces
Agricultural and Forestry 0 0 0 0 0 93,294 0 0 0 0 93,294
Mining and Quarrying 0 93 311 319 0 0 171 410 104 0 1,408
Manufacturing 220 197 170 488 104 0 1,698 828 67 0 3,773
Electricity, Gas and Water supply 0 0 255 365 0 0 0 93 120 0 833
Construction 185 161 85 505 0 0 173 367 839 0 2,316
Wholesale and Retail Trade 85 367 0 79 3,728 0 449 164 79 0 4,952
Hotels and Restaurants 220 85 0 0 1,024 0 85 0 85 0 1,500
Transport and Communications 0 0 511 0 0 0 0 4,667 170 0 5,348
Financial Intermediations 0 220 0 0 0 0 0 0 67 0 287
Real Estate, Renting and Business Activities 0 228 135 0 0 0 0 0 226 0 590
Public Administration and Defence Activities 1,374 1,373 441 334 0 0 405 482 511 1,425 6,345
Education 0 1,642 79 0 133 0 0 0 519 0 2,374
Health and Social Work 1,144 3,137 392 135 0 0 471 0 251 0 5,531
Private Households with employed persons 0 0 0 0 0 0 0 0 85 0 85
Total 3,229 7,505 2,380 2,225 4,989 93,294 3,453 7,011 3,126 1,425 128,636
Major Economic Activity
Major Occupation
Total

Labour Force Survey Report 2015
65
Table 6.5: Total employed persons by major economic activity and major occupation 2015 - Rural Female
Legislators,
Senior
Officials
and
Managers
Professionals
Technicians
and
Associate
Professionals
Clerks
Service
Workers
and Shop
and
Market
Sale
Workers
Skilled
Agricultural
Workers
Craft and
Related
Workers
Plant and
Machine
Operators
Elementary
Occupations
Armed
Forces
Agricultural and Forestry 0 0 0 0 0 102,820 0 0 0 0 102,820
Mining and Quarrying 0 0 0 0 0 0 74 0 74 0 148
Manufacturing 0 135 67 0 0 0 4,450 0 471 0 5,124
Electricity, Gas and Water supply 0 0 0 213 0 0 0 0 213 0 427
Construction 0 0 0 0 0 0 135 0 299 0 434
Wholesale and Retail Trade 0 282 79 0 7,221 0 124 0 0 0 7,707
Hotels and Restaurants 0 0 0 0 1,396 0 0 0 0 0 1,396
Transport and Communications 0 0 85 0 85 0 0 0 85 0 256
Financial Intermediations 0 0 0 0 0 0 0 0 0 0 0
Real Estate, Renting and Business Activities 0 85 0 0 0 0 0 0 0 0 85
Public Administration and Defence Activities 239 270 288 220 0 0 0 0 232 0 1,249
Education 0 1,500 185 0 79 0 0 0 163 0 1,927
Health and Social Work 233 275 391 0 148 0 67 0 0 0 1,114
Private Households with employed persons 0 0 0 0 248 0 0 0 510 0 759
Total 472 2,547 1,096 434 9,178 102,820 4,851 0 2,047 0 123,444
Major Economic Activity
Major Occupation
Total

Labour Force Survey Report 2015
66
Table 6.6: Total employed persons by major economic activity and major occupation 2015 - Urban Bhutan
Legislators,
Senior
Officials and
Managers
Professionals
Technicians
and Associate
Professionals
Clerks
Service
Workers
and Shop
and
Market
Sale
Workers
Skilled
Agricultural
Workers
Craft
and
Related
Workers
Plant and
Machine
Operators
Elementary
Occupations
Armed
Forces
Agricultural and Forestry 0 0 0 0 0 3,527 0 0 0 0 3,527
Mining and Quarrying 31 136 13 60 0 0 40 141 28 0 448
Manufacturing 528 1,173 517 640 669 0 7,449 1,336 1,100 13 13,426
Electricity, Gas and Water supply 88 143 200 293 29 0 354 148 180 0 1,435
Construction 261 812 264 893 0 0 131 340 765 26 3,492
Wholesale and Retail Trade 325 1,459 222 258 10,616 0 837 175 222 18 14,132
Hotels and Restaurants 595 994 18 232 3,053 0 104 0 89 0 5,085
Transport and Communications 269 624 1,436 371 106 0 96 3,974 110 13 6,999
Financial Intermediations 401 992 108 536 13 0 13 66 85 0 2,214
Real Estate, Renting and Business Activities 127 1,206 249 85 72 0 0 168 590 13 2,510
Public Administration and Defence Activities 441 5,426 2,586 2,023 165 0 939 1,580 1,478 9,276 23,913
Education 0 5,162 489 713 131 0 52 110 270 21 6,950
Health and Social Work 200 1,695 2,650 227 645 0 469 189 885 51 7,011
Private Households with employed persons 0 0 0 0 182 0 0 0 889 0 1072
Total 3,266 19,821 8,752 6,332 15,682 3,527 10,485 8,225 6,691 9,430 92,213
Major Economic Activity
Major Occupation
Total

Labour Force Survey Report 2015
67
Table 6.7: Total employed persons by major economic activity and major occupation 2015 - Urban Male
Legislators,
Senior
Officials and
Managers
Professionals
Technicians
and Associate
Professionals
Clerks
Service
Workers
and Shop
and
Market
Sale
Workers
Skilled
Agricultural
Workers
Craft
and
Related
Workers
Plant and
Machine
Operators
Elementary
Occupations
Armed
Forces
Agricultural and Forestry 0 0 0 0 0 1,395 0 0 0 0 1,395
Mining and Quarrying 31 92 0 46 0 0 40 141 28 0 377
Manufacturing 384 814 445 248 440 0 1,570 1,172 685 13 5,769
Electricity, Gas and Water supply 72 130 167 173 29 0 311 129 140 0 1,152
Construction 248 733 206 752 0 0 131 328 594 13 3,003
Wholesale and Retail Trade 271 796 92 78 3,971 0 376 175 148 18 5,925
Hotels and Restaurants 363 471 0 103 1,194 0 43 0 46 0 2,219
Transport and Communications 231 436 1,181 119 42 0 56 3,882 103 13 6,063
Financial Intermediations 281 639 108 260 0 0 13 66 58 0 1,424
Real Estate, Renting and Business Activities 89 807 105 39 39 0 0 115 507 13 1,713
Public Administration and Defence Activities 307 3,860 1,856 931 152 0 888 1,536 791 8,802 19,125
Education 0 2,511 222 259 47 0 52 110 184 21 3,406
Health and Social Work 174 1,270 1,489 121 191 0 431 189 465 26 4,355
Private Households with employed persons 0 0 0 0 0 0 0 0 13 0 13
Total 2,451 12,559 5,870 3,127 6,105 1,395 3,911 7,841 3,761 8,919 55,938
Major Economic Activity
Major Occupation
Total
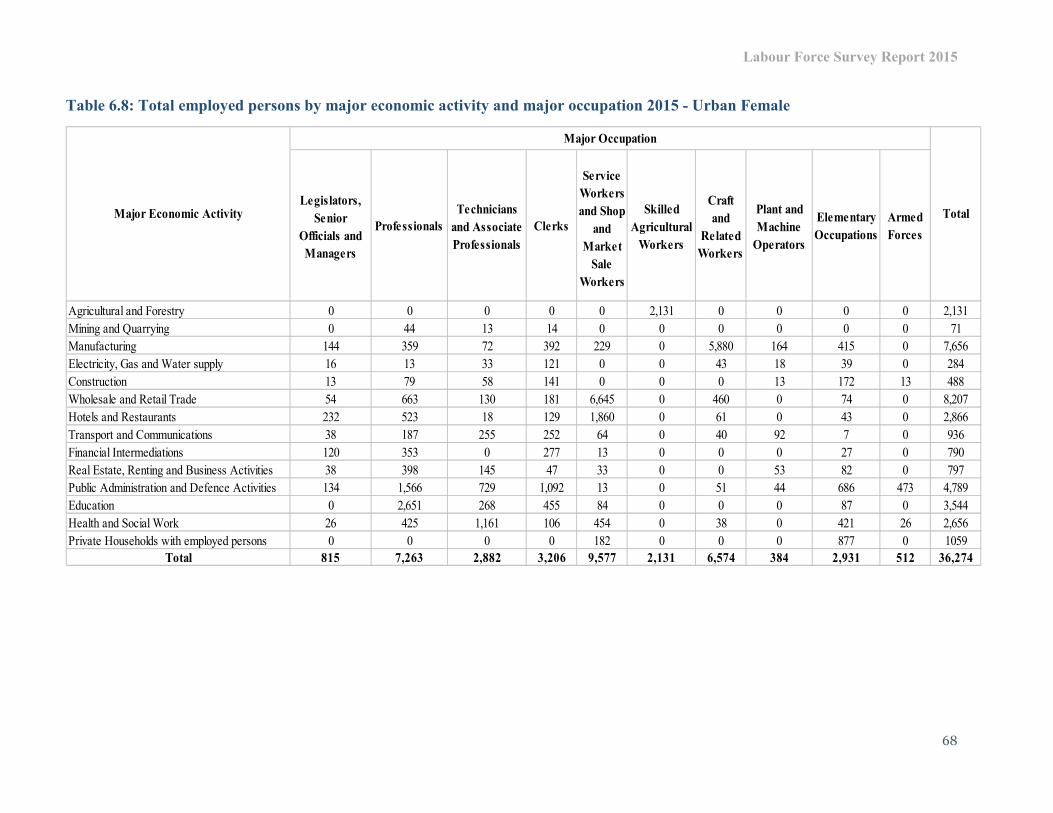
Labour Force Survey Report 2015
68
Table 6.8: Total employed persons by major economic activity and major occupation 2015 - Urban Female
Legislators,
Senior
Officials and
Managers
Professionals
Technicians
and Associate
Professionals
Clerks
Service
Workers
and Shop
and
Market
Sale
Workers
Skilled
Agricultural
Workers
Craft
and
Related
Workers
Plant and
Machine
Operators
Elementary
Occupations
Armed
Forces
Agricultural and Forestry 0 0 0 0 0 2,131 0 0 0 0 2,131
Mining and Quarrying 0 44 13 14 0 0 0 0 0 0 71
Manufacturing 144 359 72 392 229 0 5,880 164 415 0 7,656
Electricity, Gas and Water supply 16 13 33 121 0 0 43 18 39 0 284
Construction 13 79 58 141 0 0 0 13 172 13 488
Wholesale and Retail Trade 54 663 130 181 6,645 0 460 0 74 0 8,207
Hotels and Restaurants 232 523 18 129 1,860 0 61 0 43 0 2,866
Transport and Communications 38 187 255 252 64 0 40 92 7 0 936
Financial Intermediations 120 353 0 277 13 0 0 0 27 0 790
Real Estate, Renting and Business Activities 38 398 145 47 33 0 0 53 82 0 797
Public Administration and Defence Activities 134 1,566 729 1,092 13 0 51 44 686 473 4,789
Education 0 2,651 268 455 84 0 0 0 87 0 3,544
Health and Social Work 26 425 1,161 106 454 0 38 0 421 26 2,656
Private Households with employed persons 0 0 0 0 182 0 0 0 877 0 1059
Total 815 7,263 2,882 3,206 9,577 2,131 6,574 384 2,931 512 36,274
Major Economic Activity
Major Occupation
Total

Labour Force Survey Report 2015
69
Chapter 7:
Table 7.0: Total employed persons by major economic activity and hours worked per week 2015 –
Bhutan
Table 7.1: Total employed persons by major economic activity and hours worked per week 2015 -
Male Bhutan
< 30 30-39 40-49 50-59 60-69 70-79 80 +
Agriculture and Forestry 9,448 18,278 63,641 52,346 23,408 23,641 8,878 199,640
Mining and Quarrying 28 232 1,324 315 92 13 0 2,004
Manufacturing 3,627 4,544 8,072 3,088 898 1,018 1076 22,323
Electricity, Gas and Water Supply 28 321 1,870 318 68 57 33 2,695
Construction 153 756 2,492 1,333 449 752 306 6,241
Wholesale and Retail trade 711 1800 6,960 6,073 2,478 4,049 4,720 26,791
Hotels and Restaurants 63 667 2,160 2,048 693 1,131 1,219 7,981
Transport, Finance and Communications 388 1795 4,811 2,961 950 1,035 663 12,603
Financial Intermediation 55 1002 1,238 164 9 0 33 2,501
Real Estate, Renting and Business Activities 629 687 1,029 429 56 175 180 3,185
Public Administration and Defense Activities 585 9,398 14,735 4,007 916 533 1,334 31,507
Education 398 2,637 6,516 1,051 364 98 187 11,251
Health and Social Work 590 4,118 6,431 1,116 310 659 430 13,655
Private Households with Employed Persons 127 244 771 478 55 7 233 1,915
Total 16,829 46,479 122,051 75,728 30,746 33,168 19,293 344,293
Total hours worked per weekTotalMajor Economic Activity
< 30 30-39 40-49 50-59 60-69 70-79 80 +
Agriculture and Forestry 3,168 8,077 29,574 23,804 12,324 11,124 6,617 94,689
Mining and Quarrying 28 219 1,210 223 92 13 0 1,785
Manufacturing 244 1599 4,289 1,806 801 315 488 9,543
Electricity, Gas and Water Supply 28 188 1,364 254 68 50 33 1,985
Construction 140 634 2,001 1,198 449 604 293 5,319
Wholesale & Retail trade 102 788 3,113 2,967 882 1,092 1,933 10,877
Hotels & Restaurants 22 377 1,209 1056 250 381 423 3,719
Transport and Communications 375 1450 4,257 2,851 931 912 635 11,411
Financial Intermediation 40 727 816 109 0 0 18 1,711
Real Estate, Renting and Business Activities 402 540 715 279 56 156 155 2,303
Public Administration 411 6,706 12,122 3,643 773 521 1,293 25,469
Education 34 1452 3,223 550 321 13 187 5,780
Health and Social Work 433 2,957 4,600 756 178 634 328 9,885
Private Households with Employed Persons 0 13 85 0 0 0 0 98
Total 5,427 25,726 68,579 39,498 17,125 15,815 12,404 184,574
Major Economic ActivityTotal hours worked per week
Total

Labour Force Survey Report 2015
70
Table 7.2: Total employed persons by major economic activity and hours worked per week 2015 -
Female Bhutan
Table 7.3: Total employed persons by major economic activity and hours worked per week 2015 -
Rural Bhutan
< 30 30-39 40-49 50-59 60-69 70-79 80 +
Agriculture and Forestry 6,280 10,201 34,067 28,542 11,084 12,517 2,261 104,951
Mining and Quarrying 0 13 114 92 0 0 0 219
Manufacturing 3,383 2,945 3,783 1,282 97 703 588 12,780
Electricity, Gas and Water Supply 0 133 506 64 0 7 0 710
Construction 13 122 491 135 0 148 13 922
Wholesale & Retail trade 608 1012 3,847 3,106 1,597 2,957 2,787 15,914
Hotels & Restaurants 41 290 950 992 443 750 796 4,262
Transport and Communications 13 345 554 110 18 123 28 1,192
Financial Intermediation 15 275 422 55 9 0 15 790
Real Estate, Renting and Business Activities 226 148 314 149 0 20 26 882
Public Administration 174 2,692 2,612 363 143 12 40 6,037
Education 364 1185 3,293 501 42 85 0 5,471
Health and Social Work 157 1161 1,831 360 133 26 103 3,770
Private Households with Employed Persons 127 231 686 478 55 7 233 1817
Total 11,401 20,753 53,472 36,230 13,620 17,353 6,889 159,719
Major Economic ActivityTotal hours worked per week
Total
< 30 30-39 40-49 50-59 60-69 70-79 80 +
Agriculture and Forestry 9,084 17,697 62,492 51,305 23,131 23,602 8,802 196,114
Mining and Quarrying 0 161 1038 283 74 0 0 1,556
Manufacturing 917 2,506 3,125 749 397 587 617 8,897
Electricity, Gas and Water Supply 0 120 1,047 93 0 0 0 1,260
Construction 81 298 1,149 460 185 435 141 2,750
Wholesale & Retail trade 329 1155 2,987 2,781 1,087 1,994 2,325 12,659
Hotels & Restaurants 0 305 816 1,038 250 420 67 2,896
Transport and Communications 253 821 1,989 1460 283 650 147 5,604
Financial Intermediation 0 135 152 0 0 0 0 287
Real Estate, Renting and Business Activities 149 135 59 178 0 79 74 675
Public Administration 404 2,074 3,068 1,603 67 214 163 7,593
Education 234 1037 2,215 480 104 85 147 4,301
Health and Social Work 430 1933 3,016 368 170 489 238 6,644
Private Households with Employed Persons 96 181 165 238 0 0 163 844
Total 11,977 28,558 83,318 61,036 25,749 28,556 12,885 252,080
Major Economic ActivityTotal hours worked per week
Total
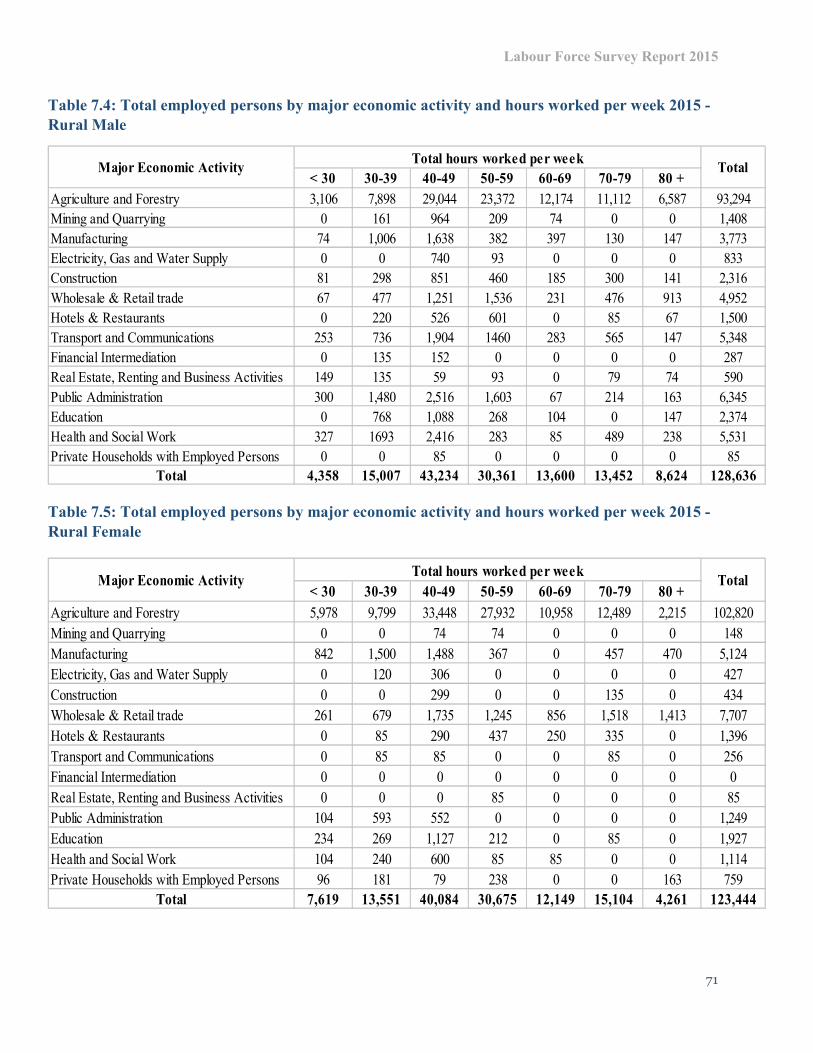
Labour Force Survey Report 2015
71
Table 7.4: Total employed persons by major economic activity and hours worked per week 2015 -
Rural Male
Table 7.5: Total employed persons by major economic activity and hours worked per week 2015 -
Rural Female
< 30 30-39 40-49 50-59 60-69 70-79 80 +
Agriculture and Forestry 3,106 7,898 29,044 23,372 12,174 11,112 6,587 93,294
Mining and Quarrying 0 161 964 209 74 0 0 1,408
Manufacturing 74 1,006 1,638 382 397 130 147 3,773
Electricity, Gas and Water Supply 0 0 740 93 0 0 0 833
Construction 81 298 851 460 185 300 141 2,316
Wholesale & Retail trade 67 477 1,251 1,536 231 476 913 4,952
Hotels & Restaurants 0 220 526 601 0 85 67 1,500
Transport and Communications 253 736 1,904 1460 283 565 147 5,348
Financial Intermediation 0 135 152 0 0 0 0 287
Real Estate, Renting and Business Activities 149 135 59 93 0 79 74 590
Public Administration 300 1,480 2,516 1,603 67 214 163 6,345
Education 0 768 1,088 268 104 0 147 2,374
Health and Social Work 327 1693 2,416 283 85 489 238 5,531
Private Households with Employed Persons 0 0 85 0 0 0 0 85
Total 4,358 15,007 43,234 30,361 13,600 13,452 8,624 128,636
Major Economic ActivityTotal hours worked per week
Total
< 30 30-39 40-49 50-59 60-69 70-79 80 +
Agriculture and Forestry 5,978 9,799 33,448 27,932 10,958 12,489 2,215 102,820
Mining and Quarrying 0 0 74 74 0 0 0 148
Manufacturing 842 1,500 1,488 367 0 457 470 5,124
Electricity, Gas and Water Supply 0 120 306 0 0 0 0 427
Construction 0 0 299 0 0 135 0 434
Wholesale & Retail trade 261 679 1,735 1,245 856 1,518 1,413 7,707
Hotels & Restaurants 0 85 290 437 250 335 0 1,396
Transport and Communications 0 85 85 0 0 85 0 256
Financial Intermediation 0 0 0 0 0 0 0 0
Real Estate, Renting and Business Activities 0 0 0 85 0 0 0 85
Public Administration 104 593 552 0 0 0 0 1,249
Education 234 269 1,127 212 0 85 0 1,927
Health and Social Work 104 240 600 85 85 0 0 1,114
Private Households with Employed Persons 96 181 79 238 0 0 163 759
Total 7,619 13,551 40,084 30,675 12,149 15,104 4,261 123,444
Major Economic ActivityTotal hours worked per week
Total
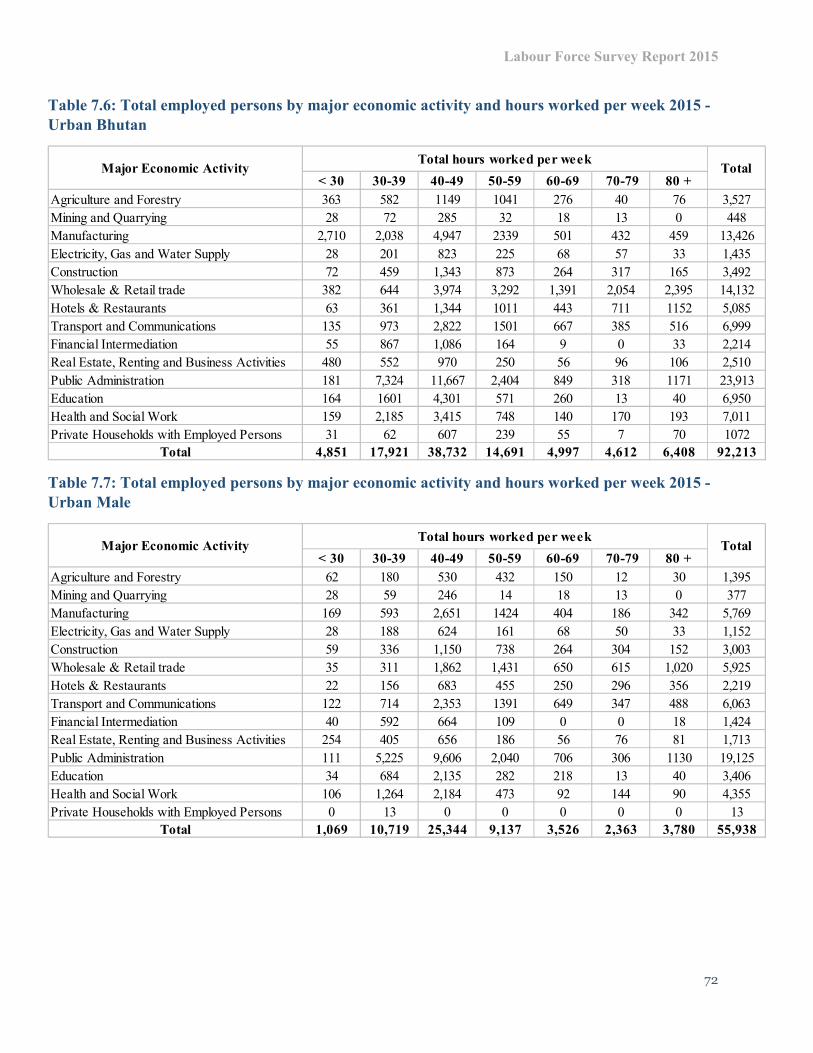
Labour Force Survey Report 2015
72
Table 7.6: Total employed persons by major economic activity and hours worked per week 2015 -
Urban Bhutan
Table 7.7: Total employed persons by major economic activity and hours worked per week 2015 -
Urban Male
< 30 30-39 40-49 50-59 60-69 70-79 80 +
Agriculture and Forestry 363 582 1149 1041 276 40 76 3,527
Mining and Quarrying 28 72 285 32 18 13 0 448
Manufacturing 2,710 2,038 4,947 2339 501 432 459 13,426
Electricity, Gas and Water Supply 28 201 823 225 68 57 33 1,435
Construction 72 459 1,343 873 264 317 165 3,492
Wholesale & Retail trade 382 644 3,974 3,292 1,391 2,054 2,395 14,132
Hotels & Restaurants 63 361 1,344 1011 443 711 1152 5,085
Transport and Communications 135 973 2,822 1501 667 385 516 6,999
Financial Intermediation 55 867 1,086 164 9 0 33 2,214
Real Estate, Renting and Business Activities 480 552 970 250 56 96 106 2,510
Public Administration 181 7,324 11,667 2,404 849 318 1171 23,913
Education 164 1601 4,301 571 260 13 40 6,950
Health and Social Work 159 2,185 3,415 748 140 170 193 7,011
Private Households with Employed Persons 31 62 607 239 55 7 70 1072
Total 4,851 17,921 38,732 14,691 4,997 4,612 6,408 92,213
Major Economic ActivityTotal hours worked per week
Total
< 30 30-39 40-49 50-59 60-69 70-79 80 +
Agriculture and Forestry 62 180 530 432 150 12 30 1,395
Mining and Quarrying 28 59 246 14 18 13 0 377
Manufacturing 169 593 2,651 1424 404 186 342 5,769
Electricity, Gas and Water Supply 28 188 624 161 68 50 33 1,152
Construction 59 336 1,150 738 264 304 152 3,003
Wholesale & Retail trade 35 311 1,862 1,431 650 615 1,020 5,925
Hotels & Restaurants 22 156 683 455 250 296 356 2,219
Transport and Communications 122 714 2,353 1391 649 347 488 6,063
Financial Intermediation 40 592 664 109 0 0 18 1,424
Real Estate, Renting and Business Activities 254 405 656 186 56 76 81 1,713
Public Administration 111 5,225 9,606 2,040 706 306 1130 19,125
Education 34 684 2,135 282 218 13 40 3,406
Health and Social Work 106 1,264 2,184 473 92 144 90 4,355
Private Households with Employed Persons 0 13 0 0 0 0 0 13
Total 1,069 10,719 25,344 9,137 3,526 2,363 3,780 55,938
Major Economic ActivityTotal hours worked per week
Total

Labour Force Survey Report 2015
73
Table 7.8: Total employed persons by major economic activity and hours worked per week 2015 -
Urban Female
< 30 30-39 40-49 50-59 60-69 70-79 80 +
Agriculture and Forestry 301 402 619 610 126 28 46 2,131
Mining and Quarrying 0 13 39 18 0 0 0 71
Manufacturing 2,541 1,445 2,296 915 97 246 118 7,656
Electricity, Gas and Water Supply 0 13 200 64 0 7 0 284
Construction 13 122 192 135 0 13 13 488
Wholesale & Retail trade 347 333 2,112 1,861 741 1,439 1,375 8,207
Hotels & Restaurants 41 205 661 555 193 415 796 2,866
Transport and Communications 13 260 469 110 18 38 28 936
Financial Intermediation 15 275 422 55 9 0 15 790
Real Estate, Renting and Business Activities 226 148 314 64 0 20 26 797
Public Administration 70 2,099 2,061 363 143 12 40 4,789
Education 130 916 2,166 289 42 0 0 3,544
Health and Social Work 53 922 1,231 275 47 26 103 2,656
Private Households with Employed Persons 31 50 607 239 55 7 70 1059
Total 3,782 7,202 13,388 5,554 1,471 2,249 2,628 36,274
Major Economic ActivityTotal hours worked per week
Total

Labour Force Survey Report 2015
74
Chapter 8:
Table 8.0: Total employed persons by major occupation and hours worked per week 2015 -
Bhutan
Table 8.1 Total employed persons by major occupation and hours worked per week 2015 - Male
Bhutan
< 30 30-39 40-49 50-59 60-69 70-79 80 +
Legislators, Senior Officials and Managers 417 1997 3,172 801 87 164 329 6,966
Professionals 1,361 8,668 13,849 2,028 932 1766 1,270 29,874
Technicians and Associate Professionals 355 2,944 6,278 1,444 616 405 186 12,228
Clerks 74 2,637 4,638 1,155 237 113 138 8,991
Service Workers and Shop and Market Sale Workers 596 2182 7,782 7,318 2,579 4,459 4,932 29,849
Skilled Agricultural Workers 9,448 18,278 63,641 52,346 23,408 23,641 8,878 199,640
Craft and Related Workers 3,614 4,078 6,489 2,022 829 808 950 18,789
Plant and Machine Operators 464 2277 6,108 3,712 1,024 794 858 15,236
Elementary Occupations 439 1,610 5,721 2,186 397 727 784 11,865
Armed Forces 60 1,809 4,373 2,716 638 290 969 10,855
Total 16,829 46,479 122,051 75,728 30,746 33,168 19,293 344,293
Major OccupationTotal hours worked per week
Total
< 30 30-39 40-49 50-59 60-69 70-79 80 +
Legislators, Senior Officials and Managers 313 1658 2,695 571 61 133 249 5,680
Professionals 850 6,019 9,334 1,318 680 1074 789 20,064
Technicians and Associate Professionals 85 1,860 4,324 1,080 477 362 62 8,250
Clerks 60 1543 2,664 672 186 106 122 5,352
Service Workers and Shop and Market Sale Workers 136 768 3,153 3,287 766 1,197 1,786 11,094
Skilled Agricultural Workers 3,168 8,077 29,574 23,804 12,324 11,124 6,617 94,689
Craft and Related Workers 136 1081 3,346 1,346 754 322 379 7,364
Plant and Machine Operators 451 2252 6,019 3,555 1,024 750 801 14,852
Elementary Occupations 168 740 3,284 1,246 347 456 645 6,886
Armed Forces 60 1729 4,184 2,619 508 290 953 10,343
Total 5,427 25,726 68,579 39,498 17,125 15,815 12,404 184,574
Major OccupationTotal hours worked per week
Total

Labour Force Survey Report 2015
75
Table 8.2: Total employed persons by major occupation and hours worked per week 2015 -
Female Bhutan
Table 8.3: Total employed persons by major occupation and hours worked per week 2015 - Rural
Bhutan
Table 8.4: Total employed persons by major occupation and hours worked per week 2015 - Rural
Male
< 30 30-39 40-49 50-59 60-69 70-79 80 +
Legislators, Senior Officials and Managers 104 339 477 230 26 31 80 1,287
Professionals 510 2,649 4,515 710 252 692 481 9,810
Technicians and Associate Professionals 271 1083 1,954 364 139 43 123 3,977
Clerks 15 1094 1,974 483 51 7 16 3,639
Service Workers and Shop and Market Sale Workers 460 1413 4,629 4,031 1,813 3,263 3,146 18,755
Skilled Agricultural Workers 6,280 10,201 34,067 28,542 11,084 12,517 2,261 104,951
Craft and Related Workers 3,478 2,997 3,143 676 75 485 571 11,425
Plant and Machine Operators 13 26 89 157 0 43 57 384
Elementary Occupations 271 870 2,437 940 49 271 139 4,978
Armed Forces 0 80 189 98 130 0 16 512
Total 11,401 20,753 53,472 36,230 13,620 17,353 6,889 159,719
Major OccupationTotal hours worked per week
Total
< 30 30-39 40-49 50-59 60-69 70-79 80 +
Legislators, Senior Officials and Managers 404 1138 1,594 322 0 67 175 3,700
Professionals 628 2,827 4,360 560 284 1034 361 10,053
Technicians and Associate Professionals 185 728 1,582 391 256 256 79 3,476
Clerks 0 863 1,272 387 74 0 62 2,659
Service Workers and Shop and Market Sale Workers 266 1323 3,694 3,401 1,038 2,170 2,274 14,167
Skilled Agricultural Workers 9,084 17,697 62,492 51,305 23,131 23,602 8,802 196,114
Craft and Related Workers 801 2,025 2,802 1,079 517 463 617 8,304
Plant and Machine Operators 328 1218 2,929 1,606 344 372 214 7,011
Elementary Occupations 281 740 2,595 628 104 526 299 5,173
Armed Forces 0 0 0 1,357 0 67 0 1,425
Total 11,977 28,558 83,318 61,036 25,749 28,556 12,885 252,080
Major OccupationTotal hours worked per week
Total
< 30 30-39 40-49 50-59 60-69 70-79 80 +
Legislators, Senior Officials and Managers 300 1003 1,446 237 0 67 175 3,229
Professionals 475 2,397 3,134 322 216 734 226 7,505
Technicians and Associate Professionals 0 508 1,123 323 170 256 0 2,380
Clerks 0 778 924 387 74 0 62 2,225
Service Workers and Shop and Market Sale Workers 67 371 1,521 1,720 0 397 913 4,989
Skilled Agricultural Workers 3,106 7,898 29,044 23,372 12,174 11,112 6,587 93,294
Craft and Related Workers 0 463 1,412 773 517 141 146 3,453
Plant and Machine Operators 328 1218 2,929 1,606 344 372 214 7,011
Elementary Occupations 81 371 1,701 263 104 305 299 3,126
Armed Forces 0 0 0 1,357 0 67 0 1,425
Total 4,358 15,007 43,234 30,361 13,600 13,452 8,624 128,636
Major OccupationTotal hours worked per week
Total

Labour Force Survey Report 2015
76
Table 8.5: Total employed persons by major occupation and hours worked per week 2015 - Rural
Female
Table 8.6: Total employed persons by major occupation and hours worked per week 2015 - Urban
Bhutan
Table 8.7: Total employed persons by major occupation and hours worked per week 2015 - Urban
Male
< 30 30-39 40-49 50-59 60-69 70-79 80 +
Legislators, Senior Officials and Managers 104 135 148 85 0 0 0 472
Professionals 153 429 1,225 238 67 300 135 2,547
Technicians and Associate Professionals 185 220 459 67 85 0 79 1,096
Clerks 0 85 348 0 0 0 0 434
Service Workers and Shop and Market Sale Workers 199 951 2,173 1,682 1,038 1,773 1,362 9,178
Skilled Agricultural Workers 5,978 9,799 33,448 27,932 10,958 12,489 2,215 102,820
Craft and Related Workers 801 1,562 1,390 306 0 322 470 4,851
Plant and Machine Operators 0 0 0 0 0 0 0 0
Elementary Occupations 200 369 893 365 0 220 0 2,047
Armed Forces 0 0 0 0 0 0 0 0
Total 7,619 13,551 40,084 30,675 12,149 15,104 4,261 123,444
Major OccupationTotal hours worked per week
Total
< 30 30-39 40-49 50-59 60-69 70-79 80 +
Legislators, Senior Officials and Managers 13 859 1,579 479 87 97 154 3,266
Professionals 733 5,841 9,490 1,468 648 733 909 19,821
Technicians and Associate Professionals 170 2,215 4,696 1053 361 149 106 8,752
Clerks 74 1774 3,366 767 163 113 75 6,332
Service Workers and Shop and Market Sale Workers 330 859 4,088 3,917 1,540 2,289 2,658 15,682
Skilled Agricultural Workers 363 582 1149 1041 276 40 76 3,527
Craft and Related Workers 2,813 2,053 3,686 943 312 345 333 10,485
Plant and Machine Operators 136 1059 3,179 2106 679 422 644 8,225
Elementary Occupations 158 870 3,126 1558 293 202 484 6,691
Armed Forces 60 1809 4,373 1,359 638 223 969 9,430
Total 4,851 17,921 38,732 14,691 4,997 4,612 6,408 92,213
Major OccupationTotal hours worked per week
Total
< 30 30-39 40-49 50-59 60-69 70-79 80 +
Legislators, Senior Officials and Managers 13 655 1,249 334 61 65 74 2,451
Professionals 375 3,621 6,200 996 463 340 563 12,559
Technicians and Associate Professionals 85 1,352 3,201 757 307 106 62 5,870
Clerks 60 765 1,740 284 112 106 60 3,127
Service Workers and Shop and Market Sale Workers 69 397 1,632 1,568 766 800 874 6,105
Skilled Agricultural Workers 62 180 530 432 150 12 30 1,395
Craft and Related Workers 136 618 1,934 573 236 181 233 3,911
Plant and Machine Operators 124 1034 3,090 1949 679 379 587 7,841
Elementary Occupations 86 369 1,583 983 244 151 345 3,761
Armed Forces 60 1729 4,184 1,261 508 223 953 8,919
Total 1,069 10,719 25,344 9,137 3,526 2,363 3,780 55,938
Major OccupationTotal hours worked per week
Total
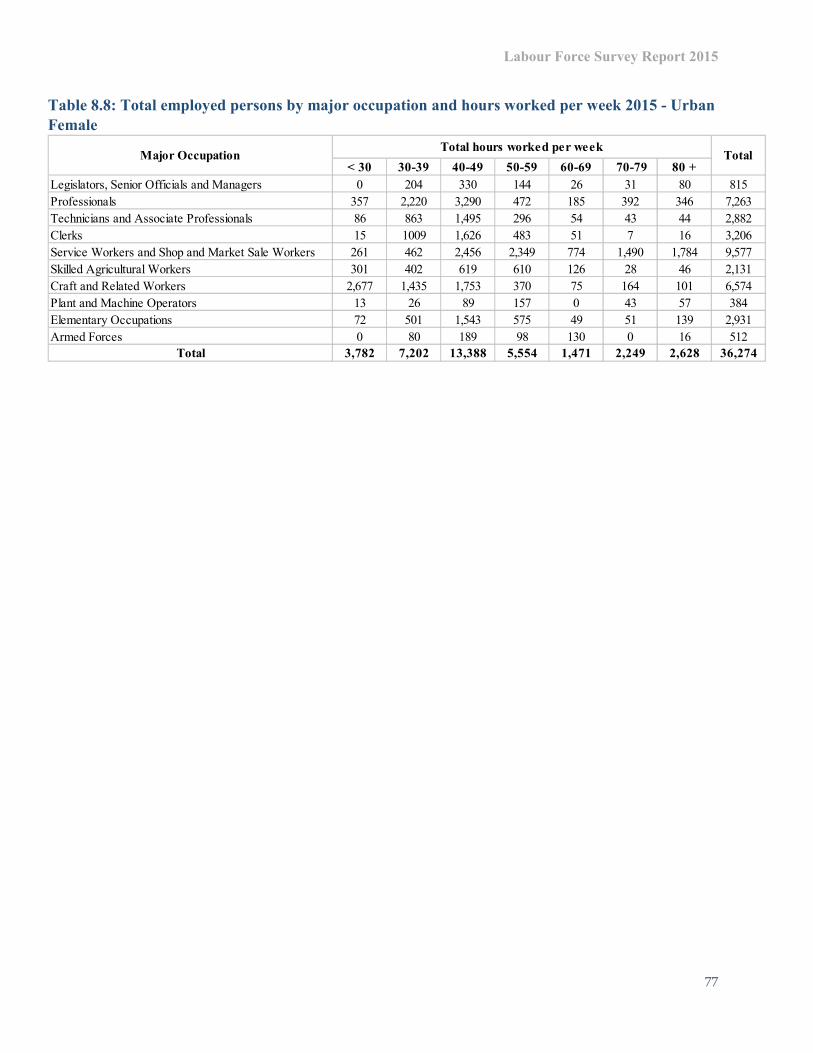
Labour Force Survey Report 2015
77
Table 8.8: Total employed persons by major occupation and hours worked per week 2015 - Urban
Female
< 30 30-39 40-49 50-59 60-69 70-79 80 +
Legislators, Senior Officials and Managers 0 204 330 144 26 31 80 815
Professionals 357 2,220 3,290 472 185 392 346 7,263
Technicians and Associate Professionals 86 863 1,495 296 54 43 44 2,882
Clerks 15 1009 1,626 483 51 7 16 3,206
Service Workers and Shop and Market Sale Workers 261 462 2,456 2,349 774 1,490 1,784 9,577
Skilled Agricultural Workers 301 402 619 610 126 28 46 2,131
Craft and Related Workers 2,677 1,435 1,753 370 75 164 101 6,574
Plant and Machine Operators 13 26 89 157 0 43 57 384
Elementary Occupations 72 501 1,543 575 49 51 139 2,931
Armed Forces 0 80 189 98 130 0 16 512
Total 3,782 7,202 13,388 5,554 1,471 2,249 2,628 36,274
Major OccupationTotal hours worked per week
Total

Labour Force Survey Report 2015
78
Chapter 9:
Table 9.0: Total employed persons by nature of employment and hours worked per week 2015 -
Bhutan
Table 9.1: Total employed persons by nature of employment and hours worked per week 2015 -
Male Bhutan
Table 9.2: Total employed persons by nature of employment and hours worked per week 2015 -
Female Bhutan
< 30 30-39 40-49 50-59 60-69 70-79 80 +
Regular Paid Employee 1,103 19,650 40,100 10,462 2,854 2,238 2,964 79,371
Casual Paid Employee 1010 2157 2538 2214 347 762 206 9234
Contract/Piece Paid Worker 162 619 1898 730 343 640 211 4604
Own-account Worker (Non-agriculture) 4,091 4,582 11,578 7,813 3,232 5,353 5,530 42,179
Own-account Worker (Agriculture) 3,194 5,671 26,018 23,100 12,193 11,553 4,664 86,393
Family Worker (Non-agriculture) 1,014 1,258 2,654 2,464 810 1,118 1,609 10,927
Family Worker (Agriculture) 6,253 12,543 37,264 28,944 10,965 11,505 4,110 111,584
Total 16,829 46,479 122,051 75,728 30,746 33,168 19,293 344,293
Nature of employmentTotal hours worked per week
Total
< 30 30-39 40-49 50-59 60-69 70-79 80 +
Regular Paid Employee 688 13,674 28,330 8,082 2,289 1,523 2,480 57,066
Casual Paid Employee 658 1587 2186 1721 334 733 160 7381
Contract/Piece Paid Worker 53 366 1462 610 244 512 183 3430
Own-account Worker (Non-agriculture) 718 1,673 6,819 4,705 1,898 2,098 2,769 20,681
Own-account Worker (Agriculture) 1,682 3,461 16,387 12,467 7,768 5,167 3,623 50,554
Family Worker (Non-agriculture) 141 366 464 773 129 297 298 2,468
Family Worker (Agriculture) 1,486 4,599 12,931 11,140 4,464 5,485 2,890 42,994
Total 5,427 25,726 68,579 39,498 17,125 15,815 12,404 184,574
Nature of employmentTotal hours worked per week
Total
< 30 30-39 40-49 50-59 60-69 70-79 80 +
Regular Paid Employee 415 5,976 11,770 2,380 565 715 484 22,305
Casual Paid Employee 352 570 351 493 13 28 46 1853
Contract/Piece Paid Worker 109 252 437 120 100 128 27 1173
Own-account Worker (Non-agriculture) 3,373 2,909 4,759 3,108 1,334 3,255 2,760 21,498
Own-account Worker (Agriculture) 1,513 2,211 9,632 10,632 4,426 6,385 1,041 35,840
Family Worker (Non-agriculture) 872 892 2,191 1,691 681 822 1,311 8,460
Family Worker (Agriculture) 4,767 7,944 24,333 17,804 6,501 6,020 1,220 68,590
Total 11,401 20,753 53,472 36,230 13,620 17,353 6,889 159,719
Nature of employment TotalTotal hours worked per week

Labour Force Survey Report 2015
79
Table 9.3: Total employed persons by nature of employment and hours worked per week 2015 -
Rural Bhutan
Table 9.4: Total employed persons by nature of employment and hours worked per week 2015 -
Rural Male
Table 9.5: Total employed persons by nature of employment and hours worked per week 2015 -
Rural Female
< 30 30-39 40-49 50-59 60-69 70-79 80 +
Regular Paid Employee 606 13,839 28,369 6,938 2117 1039 2,141 55,049
Casual Paid Employee 291 635 939 1,291 158 150 102 3,566
Contract/Piece Paid Worker 81 311 821 385 166 188 69 2,020
Own-account Worker (Non-agriculture) 3,055 2,241 6,183 4,258 1,889 2,692 3,132 23,451
Own-account Worker (Agriculture) 126 110 542 548 130 24 60 1,541
Family Worker (Non-agriculture) 455 377 1,334 823 418 518 889 4,813
Family Worker (Agriculture) 237 408 545 447 119 0 16 1,772
Total 4,851 17,921 38,732 14,691 4,997 4,612 6,408 92,213
Nature of employment TotalTotal hours worked per week
< 30 30-39 40-49 50-59 60-69 70-79 80 +
Regular Paid Employee 345 4,558 8,324 3,017 578 758 677 18,256
Casual Paid Employee 512 1220 1,421 827 189 611 104 4,885
Contract/Piece Paid Worker 0 188 849 345 104 356 142 1,984
Own-account Worker (Non-agriculture) 328 824 3,586 2,342 630 945 1,218 9,872
Own-account Worker (Agriculture) 1,682 3,416 16,066 12,246 7,705 5,155 3,593 49,863
Family Worker (Non-agriculture) 67 320 233 618 0 142 0 1,380
Family Worker (Agriculture) 1,424 4,482 12,755 10,965 4,395 5,485 2,890 42,396
Total 4,358 15,007 43,234 30,361 13,600 13,452 8,624 128,636
Nature of employmentTotal hours worked per week
Total
< 30 30-39 40-49 50-59 60-69 70-79 80 +
Regular Paid Employee 153 1,253 3,408 506 159 441 146 6,066
Casual Paid Employee 207 302 178 96 0 0 0 783
Contract/Piece Paid Worker 81 120 228 0 74 96 0 600
Own-account Worker (Non-agriculture) 708 1,516 1,809 1,214 714 1,716 1,180 8,856
Own-account Worker (Agriculture) 1,387 2,146 9,410 10,305 4,358 6,373 1,011 34,990
Family Worker (Non-agriculture) 492 561 1,087 1,023 392 459 720 4,734
Family Worker (Agriculture) 4,592 7,653 23,964 17,531 6,451 6,020 1,204 67,415
Total 7,619 13,551 40,084 30,675 12,149 15,104 4,261 123,444
Nature of employmentTotal hours worked per week
Total
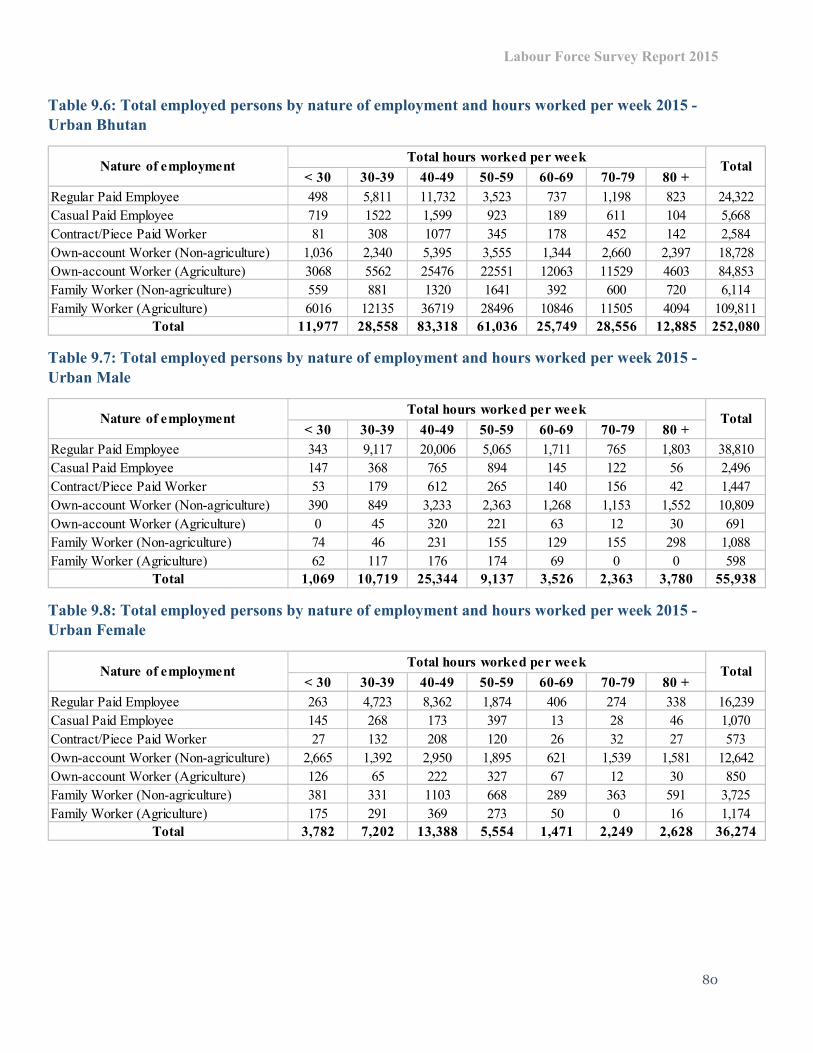
Labour Force Survey Report 2015
80
Table 9.6: Total employed persons by nature of employment and hours worked per week 2015 -
Urban Bhutan
Table 9.7: Total employed persons by nature of employment and hours worked per week 2015 -
Urban Male
Table 9.8: Total employed persons by nature of employment and hours worked per week 2015 -
Urban Female
< 30 30-39 40-49 50-59 60-69 70-79 80 +
Regular Paid Employee 498 5,811 11,732 3,523 737 1,198 823 24,322
Casual Paid Employee 719 1522 1,599 923 189 611 104 5,668
Contract/Piece Paid Worker 81 308 1077 345 178 452 142 2,584
Own-account Worker (Non-agriculture) 1,036 2,340 5,395 3,555 1,344 2,660 2,397 18,728
Own-account Worker (Agriculture) 3068 5562 25476 22551 12063 11529 4603 84,853
Family Worker (Non-agriculture) 559 881 1320 1641 392 600 720 6,114
Family Worker (Agriculture) 6016 12135 36719 28496 10846 11505 4094 109,811
Total 11,977 28,558 83,318 61,036 25,749 28,556 12,885 252,080
Nature of employment TotalTotal hours worked per week
< 30 30-39 40-49 50-59 60-69 70-79 80 +
Regular Paid Employee 343 9,117 20,006 5,065 1,711 765 1,803 38,810
Casual Paid Employee 147 368 765 894 145 122 56 2,496
Contract/Piece Paid Worker 53 179 612 265 140 156 42 1,447
Own-account Worker (Non-agriculture) 390 849 3,233 2,363 1,268 1,153 1,552 10,809
Own-account Worker (Agriculture) 0 45 320 221 63 12 30 691
Family Worker (Non-agriculture) 74 46 231 155 129 155 298 1,088
Family Worker (Agriculture) 62 117 176 174 69 0 0 598
Total 1,069 10,719 25,344 9,137 3,526 2,363 3,780 55,938
Nature of employmentTotal hours worked per week
Total
< 30 30-39 40-49 50-59 60-69 70-79 80 +
Regular Paid Employee 263 4,723 8,362 1,874 406 274 338 16,239
Casual Paid Employee 145 268 173 397 13 28 46 1,070
Contract/Piece Paid Worker 27 132 208 120 26 32 27 573
Own-account Worker (Non-agriculture) 2,665 1,392 2,950 1,895 621 1,539 1,581 12,642
Own-account Worker (Agriculture) 126 65 222 327 67 12 30 850
Family Worker (Non-agriculture) 381 331 1103 668 289 363 591 3,725
Family Worker (Agriculture) 175 291 369 273 50 0 16 1,174
Total 3,782 7,202 13,388 5,554 1,471 2,249 2,628 36,274
Nature of employmentTotal hours worked per week
Total

Labour Force Survey Report 2015
81
Chapter 10:
Table 10.0: Total employed persons by major economic activity and level of education 2015 - Bhutan
No formal
educationNursery Primary
Lower
Secondary
Middle
Secondary
Higher
Secondary
Bachelor
Degree
Masters &
aboveNFE
Religious
Professionals
Agricultural and Forestry 147,965 384 16,189 7,991 7,569 2,900 195 13 11,901 4,454 199,640
Mining and Quarrying 508 0 325 212 328 347 117 93 74 0 2,004
Manufacturing 11,201 0 2,396 1,675 3,240 1,403 938 44 1,222 205 22,323
Electricity, Gas and Water supply 472 0 179 302 845 642 133 0 0 123 2,695
Construction 2,348 0 711 476 1074 726 591 72 81 162 6,241
Wholesale and Retail Trade 11,108 0 3,930 1,921 4,389 3,101 1,225 68 773 276 26,791
Hotels and Restaurants 2,798 0 778 497 1,781 1,401 590 13 114 9 7,981
Transport and Communications 5,172 0 1,771 1235 1,490 1,278 1,192 70 111 284 12,603
Financial Intermediations 128 0 106 75 223 575 1,179 199 15 0 2,501
Real Estate, Renting and Business Activities 1,067 0 305 361 558 404 376 70 31 13 3,185
Public Administration and Defence Activities 8,072 18 4,210 3,042 5,489 4,199 4,647 1,154 164 511 31,507
Education 732 0 349 296 1,244 2,943 4,913 561 43 169 11,251
Health and Social Work 2,452 67 966 599 2,430 2,607 929 236 284 3,085 13,655
Private Households with employed persons 1162 0 175 155 362 62 0 0 0 0 1915
Total 195,185 469 32,391 18,836 31,023 22,589 17,024 2,592 14,813 9,290 344,293
Major Economic Activity Total
Level of education

Labour Force Survey Report 2015
82
Table 10.1: Total employed persons by major economic activity and level of education 2015 - Male Bhutan
No formal
educationNursery Primary
Lower
Secondary
Middle
Secondary
Higher
Secondary
Bachelor
Degree
Masters
& aboveNFE
Religious
Professionals
Agricultural and Forestry 65,171 146 10,474 4,855 3,902 1787 195 13 3755 4,312 94,689
Mining and Quarrying 508 0 325 63 314 334 73 93 74 0 1,785
Manufacturing 3,881 0 1,326 774 1,457 980 688 44 208 186 9,543
Electricity, Gas and Water supply 454 0 160 284 521 340 104 0 0 123 1,985
Construction 1,958 0 695 378 867 620 499 59 81 162 5,319
Wholesale and Retail Trade 3,517 0 1,702 722 2,252 1360 898 55 97 276 10,877
Hotels and Restaurants 1048 0 500 260 720 669 404 13 96 9 3,719
Transport and Communications 5,046 0 1,733 1112 1,289 1,005 768 70 104 284 11,411
Financial Intermediations 115 0 81 62 152 366 773 161 0 0 1,711
Real Estate, Renting and Business Activities 642 0 279 314 401 285 286 70 13 13 2,303
Public Administration and Defence Activities 7,386 18 4,060 2,602 4,062 2,625 3622 525 58 511 25,469
Education 510 0 336 265 405 1,301 2500 281 13 169 5,780
Health and Social Work 1,926 67 787 302 1353 1,537 608 185 165 2955 9,885
Private Households with employed persons 98 0 0 0 0 0 0 0 0 0 98
Total 92,259 232 22,458 11,994 17,696 13,208 11417 1,567 4,664 9,000 184,574
Major Economic Activity
Level of education
Total

Labour Force Survey Report 2015
83
Table 10.2: Total employed persons by major economic activity and level of education 2015 - Female Bhutan
No formal
educationNursery Primary
Lower
Secondary
Middle
Secondary
Higher
Secondary
Bachelor
Degree
Masters
& aboveNFE
Religious
Professionals
Agricultural and Forestry 82,794 238 5,715 3,136 3,667 1113 0 0 8146 142 104,951
Mining and Quarrying 0 0 0 148 14 13 44 0 0 0 219
Manufacturing 7,321 0 1,071 901 1783 423 250 0 1014 18 12,780
Electricity, Gas and Water supply 18 0 18 19 324 302 29 0 0 0 710
Construction 390 0 16 98 207 106 92 13 0 0 922
Wholesale and Retail Trade 7,591 0 2,229 1,199 2,138 1,741 328 13 676 0 15,914
Hotels and Restaurants 1,749 0 279 237 1,061 732 186 0 18 0 4,262
Transport and Communications 125 0 38 124 201 273 424 0 7 0 1,192
Financial Intermediations 13 0 26 13 71 209 406 38 15 0 790
Real Estate, Renting and Business Activities 425 0 26 47 158 119 90 0 18 0 882
Public Administration and Defence Activities 686 0 150 439 1,427 1,574 1026 629 107 0 6,037
Education 222 0 13 31 839 1,642 2413 280 30 0 5,471
Health and Social Work 527 0 180 297 1076 1070 320 51 118 130 3,770
Private Households with employed persons 1064 0 175 155 362 62 0 0 0 0 1817
Total 102,926 238 9,933 6,843 13,326 9,381 5607 1,025 10149 290 159,719
Major Economic Activity
Level of education
Total

Labour Force Survey Report 2015
84
Table 10.3: Total employed persons by major economic activity and level of education 2015 - Rural Bhutan
No formal
educationNursery Primary
Lower
Secondary
Middle
Secondary
Higher
Secondary
Bachelor
Degree
Masters
& aboveNFE
Religious
Professionals
Agricultural and Forestry 145,453 384 15,870 7,734 7,384 2,766 165 0 11863 4,415 196,114
Mining and Quarrying 453 0 239 148 275 275 0 93 74 0 1,556
Manufacturing 4,733 0 974 721 1329 324 135 0 595 85 8,897
Electricity, Gas and Water supply 241 0 0 85 442 400 0 0 0 93 1,260
Construction 1,290 0 388 167 426 152 96 0 81 149 2,750
Wholesale and Retail Trade 5,745 0 2,257 841 1,777 1098 231 0 488 222 12,659
Hotels and Restaurants 1,127 0 274 93 801 420 85 0 96 0 2,896
Transport and Communications 3,161 0 964 233 555 245 256 0 104 85 5,604
Financial Intermediations 67 0 0 0 0 0 85 135 0 0 287
Real Estate, Renting and Business Activities 306 0 81 152 0 135 0 0 0 0 675
Public Administration and Defence Activities 1,749 0 1,352 761 1,500 420 977 405 79 350 7,593
Education 479 0 238 251 392 836 1707 319 0 79 4,301
Health and Social Work 1411 67 434 64 1088 491 85 0 213 2791 6,644
Private Households with employed persons 522 0 67 0 255 0 0 0 0 0 844
Total 166,737 451 23,137 11,251 16,224 7,560 3821 953 13595 8,270 252,080
Major Economic Activity
Level of education
Total
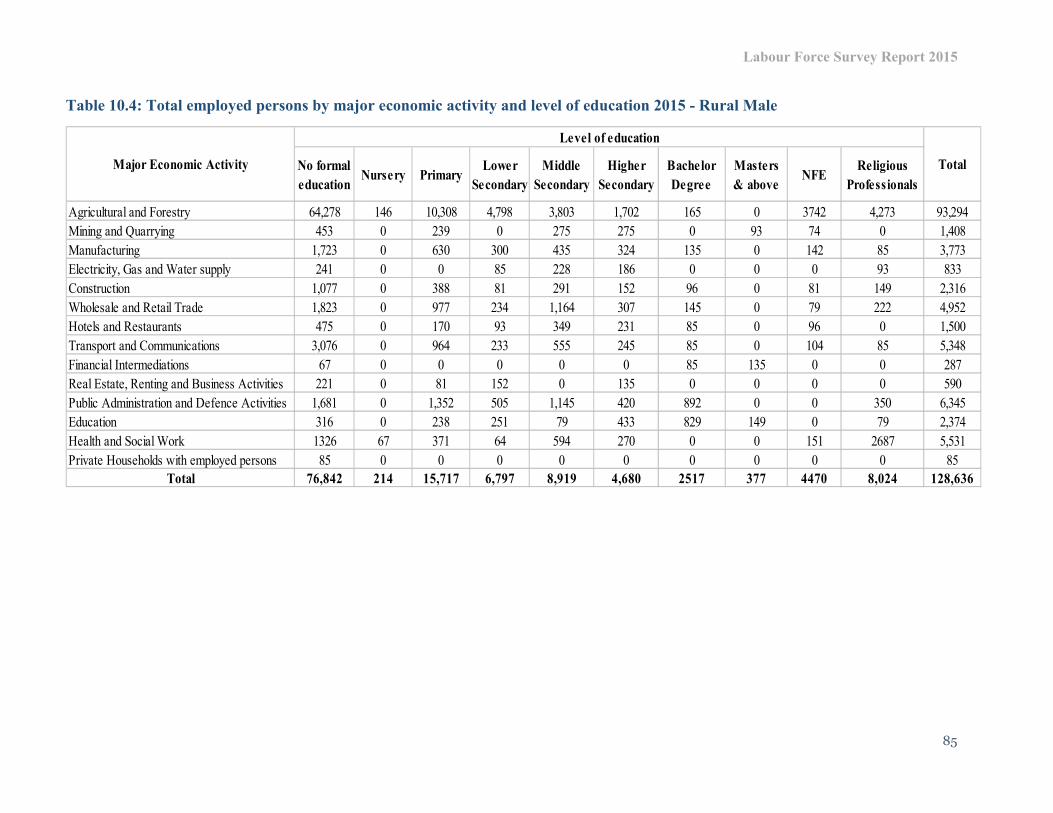
Labour Force Survey Report 2015
85
Table 10.4: Total employed persons by major economic activity and level of education 2015 - Rural Male
No formal
educationNursery Primary
Lower
Secondary
Middle
Secondary
Higher
Secondary
Bachelor
Degree
Masters
& aboveNFE
Religious
Professionals
Agricultural and Forestry 64,278 146 10,308 4,798 3,803 1,702 165 0 3742 4,273 93,294
Mining and Quarrying 453 0 239 0 275 275 0 93 74 0 1,408
Manufacturing 1,723 0 630 300 435 324 135 0 142 85 3,773
Electricity, Gas and Water supply 241 0 0 85 228 186 0 0 0 93 833
Construction 1,077 0 388 81 291 152 96 0 81 149 2,316
Wholesale and Retail Trade 1,823 0 977 234 1,164 307 145 0 79 222 4,952
Hotels and Restaurants 475 0 170 93 349 231 85 0 96 0 1,500
Transport and Communications 3,076 0 964 233 555 245 85 0 104 85 5,348
Financial Intermediations 67 0 0 0 0 0 85 135 0 0 287
Real Estate, Renting and Business Activities 221 0 81 152 0 135 0 0 0 0 590
Public Administration and Defence Activities 1,681 0 1,352 505 1,145 420 892 0 0 350 6,345
Education 316 0 238 251 79 433 829 149 0 79 2,374
Health and Social Work 1326 67 371 64 594 270 0 0 151 2687 5,531
Private Households with employed persons 85 0 0 0 0 0 0 0 0 0 85
Total 76,842 214 15,717 6,797 8,919 4,680 2517 377 4470 8,024 128,636
Major Economic Activity
Level of education
Total
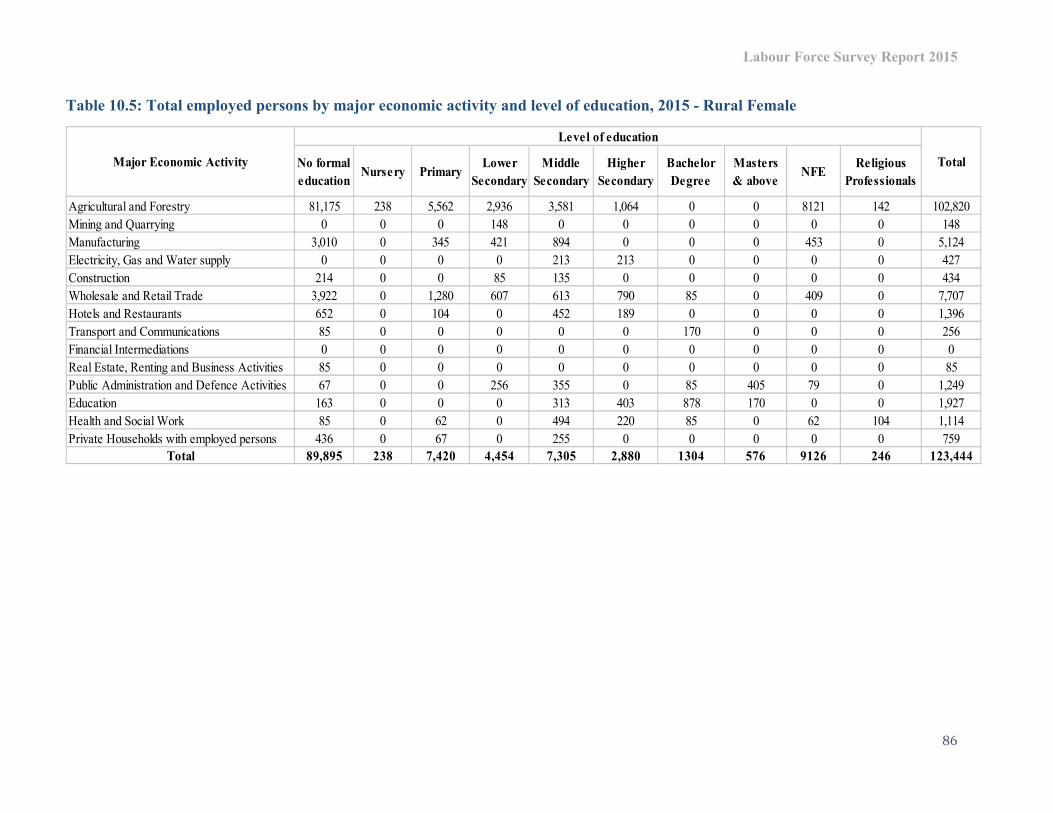
Labour Force Survey Report 2015
86
Table 10.5: Total employed persons by major economic activity and level of education, 2015 - Rural Female
No formal
educationNursery Primary
Lower
Secondary
Middle
Secondary
Higher
Secondary
Bachelor
Degree
Masters
& aboveNFE
Religious
Professionals
Agricultural and Forestry 81,175 238 5,562 2,936 3,581 1,064 0 0 8121 142 102,820
Mining and Quarrying 0 0 0 148 0 0 0 0 0 0 148
Manufacturing 3,010 0 345 421 894 0 0 0 453 0 5,124
Electricity, Gas and Water supply 0 0 0 0 213 213 0 0 0 0 427
Construction 214 0 0 85 135 0 0 0 0 0 434
Wholesale and Retail Trade 3,922 0 1,280 607 613 790 85 0 409 0 7,707
Hotels and Restaurants 652 0 104 0 452 189 0 0 0 0 1,396
Transport and Communications 85 0 0 0 0 0 170 0 0 0 256
Financial Intermediations 0 0 0 0 0 0 0 0 0 0 0
Real Estate, Renting and Business Activities 85 0 0 0 0 0 0 0 0 0 85
Public Administration and Defence Activities 67 0 0 256 355 0 85 405 79 0 1,249
Education 163 0 0 0 313 403 878 170 0 0 1,927
Health and Social Work 85 0 62 0 494 220 85 0 62 104 1,114
Private Households with employed persons 436 0 67 0 255 0 0 0 0 0 759
Total 89,895 238 7,420 4,454 7,305 2,880 1304 576 9126 246 123,444
Major Economic Activity
Level of education
Total
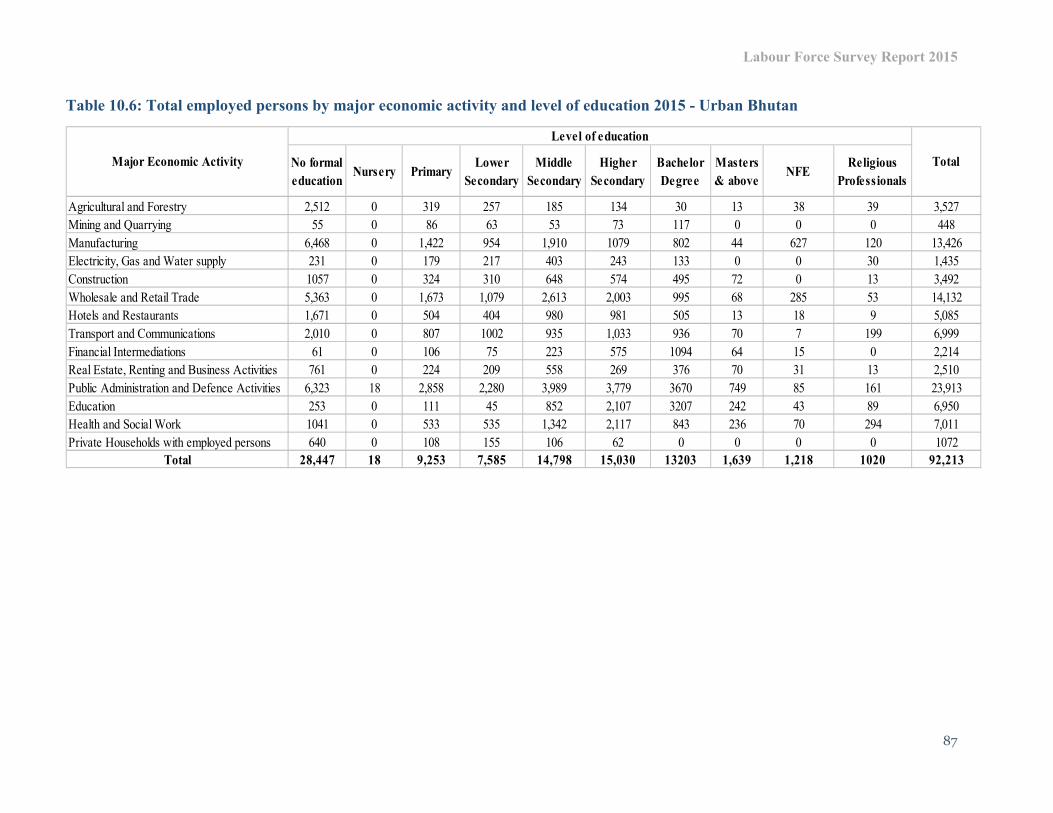
Labour Force Survey Report 2015
87
Table 10.6: Total employed persons by major economic activity and level of education 2015 - Urban Bhutan
No formal
educationNursery Primary
Lower
Secondary
Middle
Secondary
Higher
Secondary
Bachelor
Degree
Masters
& aboveNFE
Religious
Professionals
Agricultural and Forestry 2,512 0 319 257 185 134 30 13 38 39 3,527
Mining and Quarrying 55 0 86 63 53 73 117 0 0 0 448
Manufacturing 6,468 0 1,422 954 1,910 1079 802 44 627 120 13,426
Electricity, Gas and Water supply 231 0 179 217 403 243 133 0 0 30 1,435
Construction 1057 0 324 310 648 574 495 72 0 13 3,492
Wholesale and Retail Trade 5,363 0 1,673 1,079 2,613 2,003 995 68 285 53 14,132
Hotels and Restaurants 1,671 0 504 404 980 981 505 13 18 9 5,085
Transport and Communications 2,010 0 807 1002 935 1,033 936 70 7 199 6,999
Financial Intermediations 61 0 106 75 223 575 1094 64 15 0 2,214
Real Estate, Renting and Business Activities 761 0 224 209 558 269 376 70 31 13 2,510
Public Administration and Defence Activities 6,323 18 2,858 2,280 3,989 3,779 3670 749 85 161 23,913
Education 253 0 111 45 852 2,107 3207 242 43 89 6,950
Health and Social Work 1041 0 533 535 1,342 2,117 843 236 70 294 7,011
Private Households with employed persons 640 0 108 155 106 62 0 0 0 0 1072
Total 28,447 18 9,253 7,585 14,798 15,030 13203 1,639 1,218 1020 92,213
Major Economic Activity
Level of education
Total

Labour Force Survey Report 2015
88
Table 10.7: Total employed persons by major economic activity and level of education 2015 - Urban Male
No formal
educationNursery Primary
Lower
Secondary
Middle
Secondary
Higher
Secondary
Bachelor
Degree
Masters
& aboveNFE
Religious
Professionals
Agricultural and Forestry 893 166 57 99 85 30 13 0 13 39 1,395
Mining and Quarrying 55 86 63 39 60 73 0 0 0 0 377
Manufacturing 2,157 696 475 1022 656 553 44 0 66 101 5,769
Electricity, Gas and Water supply 213 160 198 293 154 104 0 0 0 30 1,152
Construction 881 308 297 576 467 403 59 0 0 13 3,003
Wholesale and Retail Trade 1,694 725 488 1,088 1,052 752 55 0 18 53 5,925
Hotels and Restaurants 573 329 167 371 437 319 13 0 0 9 2,219
Transport and Communications 1,970 769 878 734 760 683 70 0 0 199 6,063
Financial Intermediations 48 81 62 152 366 688 26 0 0 0 1,424
Real Estate, Renting and Business Activities 421 198 162 401 150 286 70 0 13 13 1,713
Public Administration and Defence Activities 5,704 2708 2,097 2,917 2,205 2,730 525 18 58 161 19,125
Education 194 98 14 326 868 1,672 132 0 13 89 3,406
Health and Social Work 600 416 238 759 1,267 608 185 0 15 268 4,355
Private Households with employed persons 13 0 0 0 0 0 0 0 0 0 13
Total 15,417 6740 5,197 8,777 8,528 8,900 1190 18 194 976 55,938
Major Economic Activity
Level of education
Total

Labour Force Survey Report 2015
89
Table 10.8: Total employed persons by major economic activity and level of education 2015 - Urban Female
No formal
educationNursery Primary
Lower
Secondary
Middle
Secondary
Higher
Secondary
Bachelor
Degree
Masters
& aboveNFE
Religious
Professionals
Agricultural and Forestry 1,619 0 153 200 86 49 0 0 25 0 2,131
Mining and Quarrying 0 0 0 0 14 13 44 0 0 0 71
Manufacturing 4,311 0 726 479 888 423 250 0 561 18 7,656
Electricity, Gas and Water supply 18 0 18 19 110 89 29 0 0 0 284
Construction 177 0 16 13 72 106 92 13 0 0 488
Wholesale and Retail Trade 3,669 0 949 592 1,525 951 242 13 267 0 8,207
Hotels and Restaurants 1,098 0 175 237 609 544 186 0 18 0 2,866
Transport and Communications 40 0 38 124 201 273 253 0 7 0 936
Financial Intermediations 13 0 26 13 71 209 406 38 15 0 790
Real Estate, Renting and Business Activities 340 0 26 47 158 119 90 0 18 0 797
Public Administration and Defence Activities 618 0 150 183 1,072 1,574 941 224 27 0 4,789
Education 60 0 13 31 526 1,239 1535 110 30 0 3,544
Health and Social Work 441 0 117 297 583 850 235 51 56 26 2,656
Private Households with employed persons 627 0 108 155 106 62 0 0 0 0 1059
Total 13,031 0 2,513 2,388 6,021 6,502 4303 449 1,024 44 36,274
Major Economic Activity
Level of education
Total

Labour Force Survey Report 2015
90
Chapter 11:
Table 11.0: Total employed persons by nature of employment and level of education 2015 - Bhutan
Table 11.1: Total employed persons by nature of employment and level of education 2015 - Male Bhutan
No formal
educationNursery Primary
Lower
Secondary
Middle
Secondary
Higher
Secondary
Bachelor
Degree
Masters
& aboveNFE
Religious
Professionals
Regular Paid Employee 16,492 85 8,463 6,156 14,853 14,786 14,000 2,249 935 1,352 79,371
Casual Paid Employee 3,598 0 1,193 568 954 595 538 0 80 1,707 9,234
Contract/Piece Paid Worker 1,628 0 379 478 922 352 363 26 15 442 4,604
Own-account Worker (Non-agriculture) 22,239 0 4,963 2,864 4,753 2,703 1,537 305 1,573 1,241 42,179
Own-account Worker (Agriculture) 69,606 146 6,755 2,838 1,253 355 17 13 3,224 2,186 86,393
Family Worker (Non-agriculture) 4,303 0 1,526 885 2,039 1,275 390 0 415 94 10,927
Family Worker (Agriculture) 77,319 238 9,112 5,049 6,248 2,522 177 0 8,572 2,268 111,584
Total 195,185 469 32,391 18,836 31,023 22,589 17,024 2,592 14,813 9,290 344,293
Nature of employment Total
Level of Education
No formal
educationNursery Primary
Lower
Secondary
Middle
Secondary
Higher
Secondary
Bachelor
Degree
Masters
& aboveNFE
Religious
Professionals
Regular Paid Employee 13,768 85 7,812 4,986 9,518 8,700 9,091 1,250 523 1,333 57,066
Casual Paid Employee 2,772 0 1,164 343 528 476 495 0 13 1,590 7,381
Contract/Piece Paid Worker 1,187 0 348 419 504 289 216 26 0 442 3,430
Own-account Worker (Non-agriculture) 9,356 0 2,710 1,425 2,803 1,464 1,150 279 265 1,228 20,681
Own-account Worker (Agriculture) 38,460 67 4,943 2,223 807 276 17 13 1,562 2,186 50,554
Family Worker (Non-agriculture) 616 0 272 70 508 515 270 0 122 94 2,468
Family Worker (Agriculture) 26,100 79 5,209 2,527 3,027 1,488 177 0 2,180 2,126 42,994
Total 92,259 232 22,458 11,994 17,696 13,208 11,417 1,567 4,664 9,000 184,574
Nature of employment
Level of Education
Total

Labour Force Survey Report 2015
91
Table 11.2: Total employed persons by nature of employment and level of education 2015 - Female Bhutan
Table 11.3: Total employed persons by nature of employment and level of education 2015 - Rural Bhutan
No formal
educationNursery Primary
Lower
Secondary
Middle
Secondary
Higher
Secondary
Bachelor
Degree
Masters
& aboveNFE
Religious
Professionals
Regular Paid Employee 2,724 0 651 1,170 5,335 6,086 4,909 999 413 18 22,305
Casual Paid Employee 826 0 29 225 426 119 43 0 67 117 1,853
Contract/Piece Paid Worker 441 0 31 58 417 63 147 0 15 0 1,173
Own-account Worker (Non-agriculture) 12,883 0 2,253 1,439 1,950 1,239 387 26 1,308 13 21,498
Own-account Worker (Agriculture) 31,146 79 1,812 615 446 79 0 0 1,663 0 35,840
Family Worker (Non-agriculture) 3,686 0 1,254 815 1,531 760 121 0 293 0 8,460
Family Worker (Agriculture) 51,219 158 3,903 2,522 3,221 1,034 0 0 6,391 142 68,590
Total 102,926 238 9,933 6,843 13,326 9,381 5,607 1,025 10,149 290 159,719
Nature of employment
Level of Education
Total
No formal
educationNursery Primary
Lower
Secondary
Middle
Secondary
Higher
Secondary
Bachelor
Degree
Masters
& aboveNFE
Religious
Professionals
Regular Paid Employee 5,769 67 3,239 1,726 4,857 3,018 3,160 883 662 942 24,322
Casual Paid Employee 2,055 0 983 289 516 170 85 0 0 1,568 5,668
Contract/Piece Paid Worker 1,047 0 198 188 546 93 96 0 0 416 2,584
Own-account Worker (Non-agriculture) 11,067 0 2,170 893 1,752 835 234 70 840 867 18,728
Own-account Worker (Agriculture) 68,310 146 6,628 2,791 1,247 355 0 0 3,218 2,159 84,853
Family Worker (Non-agriculture) 2,282 0 944 526 1,236 677 81 0 305 62 6,114
Family Worker (Agriculture) 76,207 238 8,975 4,839 6,070 2,411 165 0 8,572 2,257 109,811
Total 166,737 451 23,137 11,251 16,224 7,560 3,821 953 13,595 8,270 252,080
Level of Education
Nature of employment Total

Labour Force Survey Report 2015
92
Table 11.4: Total employed persons by nature of employment and level of education 2015 - Rural Male
Table 11.5: Total employed persons by nature of employment and level of education 2015 - Rural Female
No formal
educationNursery Primary
Lower
Secondary
Middle
Secondary
Higher
Secondary
Bachelor
Degree
Masters
& aboveNFE
Religious
Professionals
Regular Paid Employee 4,866 67 3,104 1,339 3,221 2,102 1,941 308 367 942 18,256
Casual Paid Employee 1,781 0 983 186 215 170 85 0 0 1,463 4,885
Contract/Piece Paid Worker 741 0 198 188 252 93 96 0 0 416 1,984
Own-account Worker (Non-agriculture) 5,412 0 1,239 390 1,185 296 149 70 265 867 9,872
Own-account Worker (Agriculture) 37,938 67 4,844 2,210 807 276 0 0 1,562 2,159 49,863
Family Worker (Non-agriculture) 359 0 153 0 311 317 81 0 96 62 1,380
Family Worker (Agriculture) 25,745 79 5,196 2,483 2,928 1,426 165 0 2,180 2,115 42,396
Total 76,842 214 15,717 6,797 8,919 4,680 2,517 377 4,470 8,024 128,636
Nature of employment
Level of Education
Total
No formal
educationNursery Primary
Lower
Secondary
Middle
Secondary
Higher
Secondary
Bachelor
Degree
Masters
& aboveNFE
Religious
Professionals
Regular Paid Employee 903 0 135 386 1,636 916 1,219 576 295 0 6,066
Casual Paid Employee 274 0 0 104 301 0 0 0 0 104 783
Contract/Piece Paid Worker 305 0 0 0 295 0 0 0 0 0 600
Own-account Worker (Non-agriculture) 5,655 0 932 502 567 540 85 0 575 0 8,856
Own-account Worker (Agriculture) 30,372 79 1,784 580 439 79 0 0 1,656 0 34,990
Family Worker (Non-agriculture) 1,923 0 792 526 925 360 0 0 209 0 4,734
Family Worker (Agriculture) 50,463 158 3,779 2,356 3,142 985 0 0 6,391 142 67,415
Total 89,895 238 7,420 4,454 7,305 2,880 1,304 576 9,126 246 123,444
Nature of employment
Level of Education
Total

Labour Force Survey Report 2015
93
Table 11.6: Total employed persons by nature of employment and level of education 2015 - Urban Bhutan
Table 11.7: Total employed persons by nature of employment and level of education 2015 - Urban Male
No formal
educationNursery Primary
Lower
Secondary
Middle
Secondary
Higher
Secondary
Bachelor
Degree
Masters
& aboveNFE
Religious
Professionals
Regular Paid Employee 10,723 5,224 4,430 9,996 11,769 10,840 1,365 18 273 410 55,049
Casual Paid Employee 1,543 210 278 438 425 453 0 0 80 139 3,566
Contract/Piece Paid Worker 582 181 290 375 259 267 26 0 15 26 2,020
Own-account Worker (Non-agriculture) 11,172 2,793 1,971 3,001 1,868 1,303 236 0 733 375 23,451
Own-account Worker (Agriculture) 1,295 127 47 7 0 17 13 0 7 28 1,541
Family Worker (Non-agriculture) 2,021 582 359 803 598 309 0 0 110 32 4,813
Family Worker (Agriculture) 1,112 137 210 179 111 13 0 0 0 11 1,772
Total 28,447 9,253 7,585 14,798 15,030 13,203 1,639 18 1,218 1,020 92,213
Nature of employment
Level of Education
Total
No formal
educationNursery Primary
Lower
Secondary
Middle
Secondary
Higher
Secondary
Bachelor
Degree
Masters
& aboveNFE
Religious
Professionals
Regular Paid Employee 8,902 18 4,708 3,647 6,297 6,598 7,150 942 156 391 38,810
Casual Paid Employee 990 0 181 157 313 306 410 0 13 126 2,496
Contract/Piece Paid Worker 446 0 150 231 253 196 120 26 0 26 1,447
Own-account Worker (Non-agriculture) 3,944 0 1,471 1,035 1,618 1,168 1,001 210 0 362 10,809
Own-account Worker (Agriculture) 522 0 99 13 0 0 17 13 0 28 691
Family Worker (Non-agriculture) 257 0 120 70 197 198 189 0 26 32 1,088
Family Worker (Agriculture) 355 0 13 44 99 62 13 0 0 11 598
Total 15,417 18 6,740 5,197 8,777 8,528 8,900 1,190 194 976 55,938
Nature of employment
Level of Education
Total

Labour Force Survey Report 2015
94
Table 11.8: Total employed persons by nature of employment and level of education 2015 - Urban Female
No formal
educationNursery Primary
Lower
Secondary
Middle
Secondary
Higher
Secondary
Bachelor
Degree
Masters
& aboveNFE
Religious
Professionals
Regular Paid Employee 1,821 0 516 783 3,698 5,170 3,690 423 118 18 16,239
Casual Paid Employee 552 0 29 121 125 119 43 0 67 13 1,070
Contract/Piece Paid Worker 136 0 31 58 122 63 147 0 15 0 573
Own-account Worker (Non-agriculture) 7,228 0 1,322 937 1,383 700 302 26 733 13 12,642
Own-account Worker (Agriculture) 773 0 29 34 7 0 0 0 7 0 850
Family Worker (Non-agriculture) 1,763 0 462 288 606 400 121 0 85 0 3,725
Family Worker (Agriculture) 757 0 124 166 79 49 0 0 0 0 1,174
Total 13,031 0 2,513 2,388 6,021 6,502 4,303 449 1,024 44 36,274
Nature of employment
Level of Education
Total
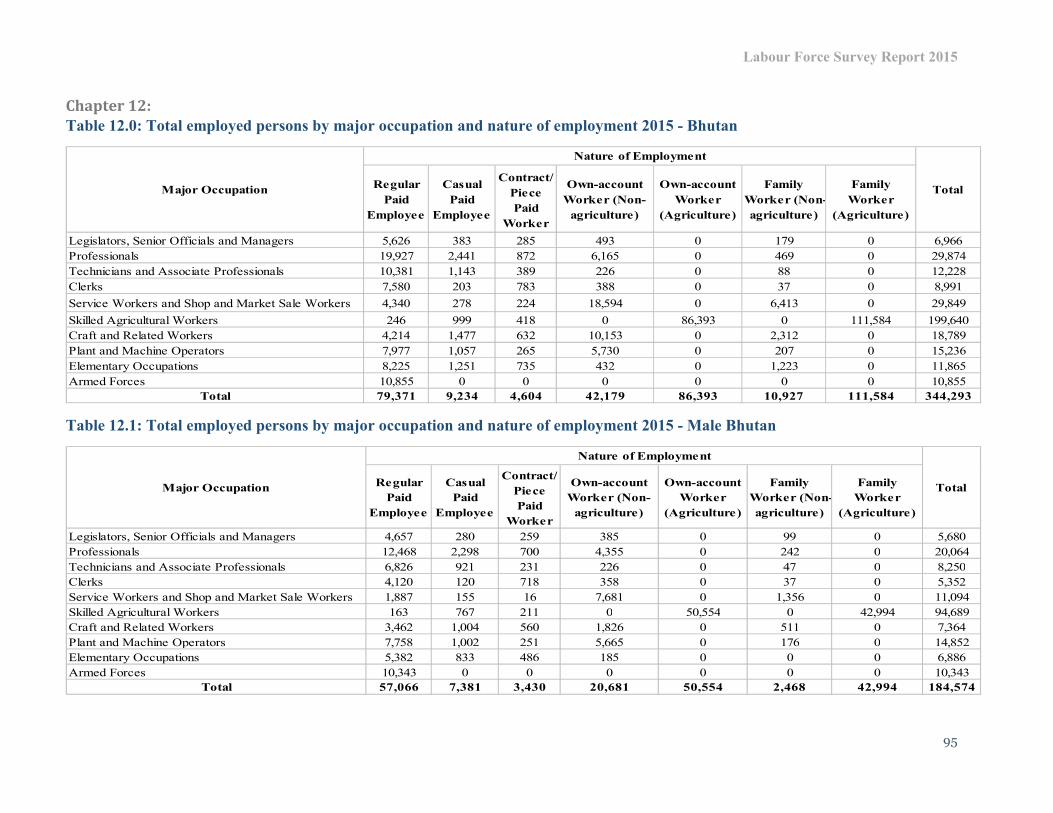
Labour Force Survey Report 2015
95
Chapter 12:
Table 12.0: Total employed persons by major occupation and nature of employment 2015 - Bhutan
Table 12.1: Total employed persons by major occupation and nature of employment 2015 - Male Bhutan
Regular
Paid
Employee
Casual
Paid
Employee
Contract/
Piece
Paid
Worker
Own-account
Worker (Non-
agriculture)
Own-account
Worker
(Agriculture)
Family
Worker (Non-
agriculture)
Family
Worker
(Agriculture)
Legislators, Senior Officials and Managers 5,626 383 285 493 0 179 0 6,966
Professionals 19,927 2,441 872 6,165 0 469 0 29,874
Technicians and Associate Professionals 10,381 1,143 389 226 0 88 0 12,228
Clerks 7,580 203 783 388 0 37 0 8,991
Service Workers and Shop and Market Sale Workers 4,340 278 224 18,594 0 6,413 0 29,849
Skilled Agricultural Workers 246 999 418 0 86,393 0 111,584 199,640
Craft and Related Workers 4,214 1,477 632 10,153 0 2,312 0 18,789
Plant and Machine Operators 7,977 1,057 265 5,730 0 207 0 15,236
Elementary Occupations 8,225 1,251 735 432 0 1,223 0 11,865
Armed Forces 10,855 0 0 0 0 0 0 10,855
Total 79,371 9,234 4,604 42,179 86,393 10,927 111,584 344,293
Nature of Employment
TotalMajor Occupation
Regular
Paid
Employee
Casual
Paid
Employee
Contract/
Piece
Paid
Worker
Own-account
Worker (Non-
agriculture)
Own-account
Worker
(Agriculture)
Family
Worker (Non-
agriculture)
Family
Worker
(Agriculture)
Legislators, Senior Officials and Managers 4,657 280 259 385 0 99 0 5,680
Professionals 12,468 2,298 700 4,355 0 242 0 20,064
Technicians and Associate Professionals 6,826 921 231 226 0 47 0 8,250
Clerks 4,120 120 718 358 0 37 0 5,352
Service Workers and Shop and Market Sale Workers 1,887 155 16 7,681 0 1,356 0 11,094
Skilled Agricultural Workers 163 767 211 0 50,554 0 42,994 94,689
Craft and Related Workers 3,462 1,004 560 1,826 0 511 0 7,364
Plant and Machine Operators 7,758 1,002 251 5,665 0 176 0 14,852
Elementary Occupations 5,382 833 486 185 0 0 0 6,886
Armed Forces 10,343 0 0 0 0 0 0 10,343
Total 57,066 7,381 3,430 20,681 50,554 2,468 42,994 184,574
Nature of Employment
TotalMajor Occupation
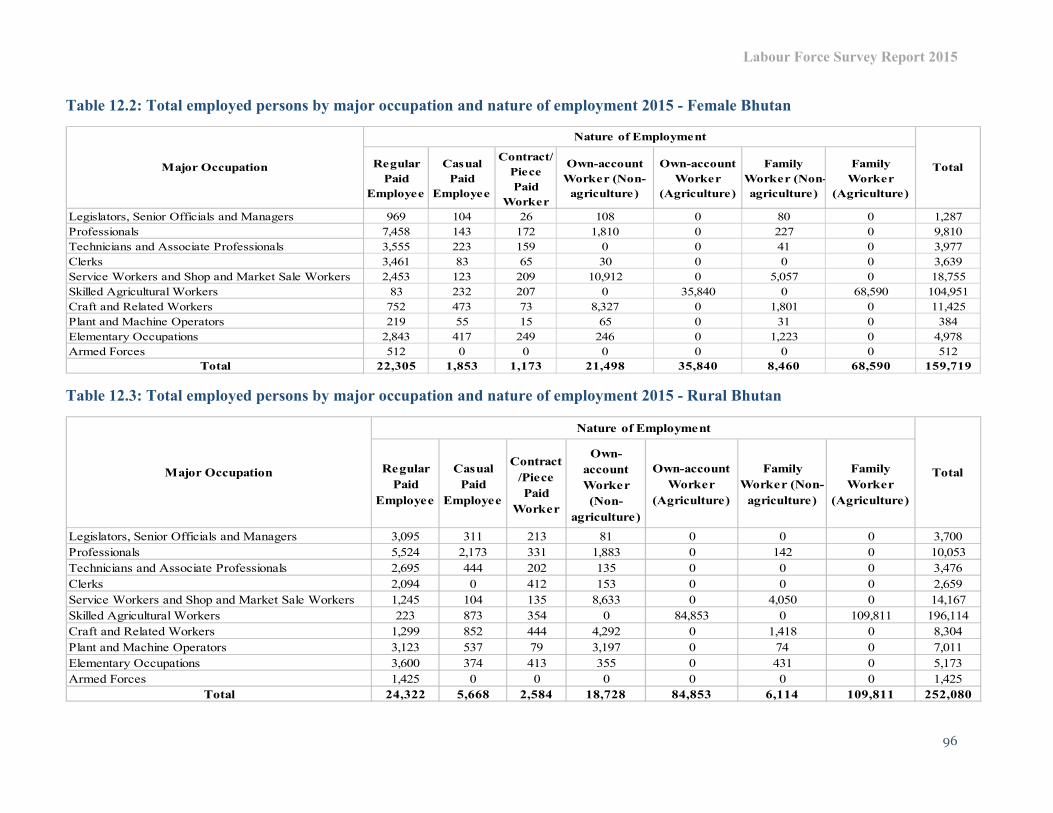
Labour Force Survey Report 2015
96
Table 12.2: Total employed persons by major occupation and nature of employment 2015 - Female Bhutan
Table 12.3: Total employed persons by major occupation and nature of employment 2015 - Rural Bhutan
Regular
Paid
Employee
Casual
Paid
Employee
Contract/
Piece
Paid
Worker
Own-account
Worker (Non-
agriculture)
Own-account
Worker
(Agriculture)
Family
Worker (Non-
agriculture)
Family
Worker
(Agriculture)
Legislators, Senior Officials and Managers 969 104 26 108 0 80 0 1,287
Professionals 7,458 143 172 1,810 0 227 0 9,810
Technicians and Associate Professionals 3,555 223 159 0 0 41 0 3,977
Clerks 3,461 83 65 30 0 0 0 3,639
Service Workers and Shop and Market Sale Workers 2,453 123 209 10,912 0 5,057 0 18,755
Skilled Agricultural Workers 83 232 207 0 35,840 0 68,590 104,951
Craft and Related Workers 752 473 73 8,327 0 1,801 0 11,425
Plant and Machine Operators 219 55 15 65 0 31 0 384
Elementary Occupations 2,843 417 249 246 0 1,223 0 4,978
Armed Forces 512 0 0 0 0 0 0 512
Total 22,305 1,853 1,173 21,498 35,840 8,460 68,590 159,719
Major Occupation
Nature of Employment
Total
Regular
Paid
Employee
Casual
Paid
Employee
Contract
/Piece
Paid
Worker
Own-
account
Worker
(Non-
agriculture)
Own-account
Worker
(Agriculture)
Family
Worker (Non-
agriculture)
Family
Worker
(Agriculture)
Legislators, Senior Officials and Managers 3,095 311 213 81 0 0 0 3,700
Professionals 5,524 2,173 331 1,883 0 142 0 10,053
Technicians and Associate Professionals 2,695 444 202 135 0 0 0 3,476
Clerks 2,094 0 412 153 0 0 0 2,659
Service Workers and Shop and Market Sale Workers 1,245 104 135 8,633 0 4,050 0 14,167
Skilled Agricultural Workers 223 873 354 0 84,853 0 109,811 196,114
Craft and Related Workers 1,299 852 444 4,292 0 1,418 0 8,304
Plant and Machine Operators 3,123 537 79 3,197 0 74 0 7,011
Elementary Occupations 3,600 374 413 355 0 431 0 5,173
Armed Forces 1,425 0 0 0 0 0 0 1,425
Total 24,322 5,668 2,584 18,728 84,853 6,114 109,811 252,080
Major Occupation
Nature of Employment
Total

Labour Force Survey Report 2015
97
Table 12.4: Total employed persons by major occupation and nature of employment 2015 - Rural Male
Table 12.5: Total employed persons by major occupation and nature of employment 2015 - Rural Female
Regular
Paid
Employee
Casual
Paid
Employee
Contract
/Piece
Paid
Worker
Own-
account
Worker
(Non-
agriculture)
Own-account
Worker
(Agriculture)
Family
Worker (Non-
agriculture)
Family
Worker
(Agriculture)
Legislators, Senior Officials and Managers 2,727 207 213 81 0 0 0 3,229
Professionals 3,448 2,069 331 1,515 0 142 0 7,505
Technicians and Associate Professionals 1,784 341 120 135 0 0 0 2,380
Clerks 1,660 0 412 153 0 0 0 2,225
Service Workers and Shop and Market Sale Workers 576 104 0 3,504 0 806 0 4,989
Skilled Agricultural Workers 148 703 184 0 49,863 0 42,396 93,294
Craft and Related Workers 881 655 444 1,115 0 358 0 3,453
Plant and Machine Operators 3,123 537 79 3,197 0 74 0 7,011
Elementary Occupations 2,484 270 200 172 0 0 0 3,126
Armed Forces 1,425 0 0 0 0 0 0 1,425
Total 18,256 4,885 1,984 9,872 49,863 1,380 42,396 128,636
Major Occupation
Nature of Employment
Total
Regular
Paid
Employee
Casual
Paid
Employee
Contract
/Piece
Paid
Worker
Own-
account
Worker
(Non-
agriculture)
Own-account
Worker
(Agriculture)
Family
Worker (Non-
agriculture)
Family
Worker
(Agriculture)
Legislators, Senior Officials and Managers 368 104 0 0 0 0 0 472
Professionals 2,076 104 0 367 0 0 0 2,547
Technicians and Associate Professionals 911 104 81 0 0 0 0 1,096
Clerks 434 0 0 0 0 0 0 434
Service Workers and Shop and Market Sale Workers 669 0 135 5,129 0 3,244 0 9,178
Skilled Agricultural Workers 74 170 170 0 34,990 0 67,415 102,820
Craft and Related Workers 418 197 0 3,176 0 1,060 0 4,851
Plant and Machine Operators 0 0 0 0 0 0 0 0
Elementary Occupations 1,117 104 213 183 0 431 0 2,047
Armed Forces 0 0 0 0 0 0 0 0
Total 6,066 783 600 8,856 34,990 4,734 67,415 123,444
Major Occupation
Nature of Employment
Total
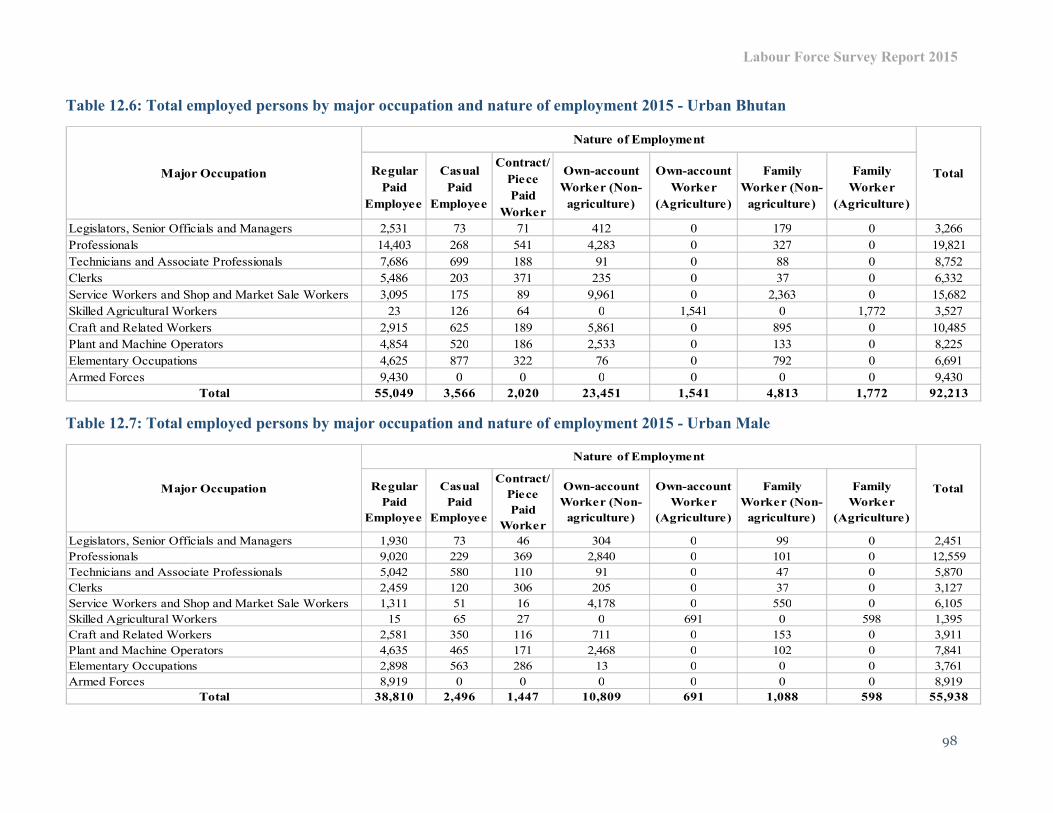
Labour Force Survey Report 2015
98
Table 12.6: Total employed persons by major occupation and nature of employment 2015 - Urban Bhutan
Table 12.7: Total employed persons by major occupation and nature of employment 2015 - Urban Male
Regular
Paid
Employee
Casual
Paid
Employee
Contract/
Piece
Paid
Worker
Own-account
Worker (Non-
agriculture)
Own-account
Worker
(Agriculture)
Family
Worker (Non-
agriculture)
Family
Worker
(Agriculture)
Legislators, Senior Officials and Managers 2,531 73 71 412 0 179 0 3,266
Professionals 14,403 268 541 4,283 0 327 0 19,821
Technicians and Associate Professionals 7,686 699 188 91 0 88 0 8,752
Clerks 5,486 203 371 235 0 37 0 6,332
Service Workers and Shop and Market Sale Workers 3,095 175 89 9,961 0 2,363 0 15,682
Skilled Agricultural Workers 23 126 64 0 1,541 0 1,772 3,527
Craft and Related Workers 2,915 625 189 5,861 0 895 0 10,485
Plant and Machine Operators 4,854 520 186 2,533 0 133 0 8,225
Elementary Occupations 4,625 877 322 76 0 792 0 6,691
Armed Forces 9,430 0 0 0 0 0 0 9,430
Total 55,049 3,566 2,020 23,451 1,541 4,813 1,772 92,213
Major Occupation
Nature of Employment
Total
Regular
Paid
Employee
Casual
Paid
Employee
Contract/
Piece
Paid
Worker
Own-account
Worker (Non-
agriculture)
Own-account
Worker
(Agriculture)
Family
Worker (Non-
agriculture)
Family
Worker
(Agriculture)
Legislators, Senior Officials and Managers 1,930 73 46 304 0 99 0 2,451
Professionals 9,020 229 369 2,840 0 101 0 12,559
Technicians and Associate Professionals 5,042 580 110 91 0 47 0 5,870
Clerks 2,459 120 306 205 0 37 0 3,127
Service Workers and Shop and Market Sale Workers 1,311 51 16 4,178 0 550 0 6,105
Skilled Agricultural Workers 15 65 27 0 691 0 598 1,395
Craft and Related Workers 2,581 350 116 711 0 153 0 3,911
Plant and Machine Operators 4,635 465 171 2,468 0 102 0 7,841
Elementary Occupations 2,898 563 286 13 0 0 0 3,761
Armed Forces 8,919 0 0 0 0 0 0 8,919
Total 38,810 2,496 1,447 10,809 691 1,088 598 55,938
Major Occupation
Nature of Employment
Total

Labour Force Survey Report 2015
99
Table 12.8: Total employed persons by major occupation and nature of employment 2015 - Urban Female
Regular
Paid
Employee
Casual
Paid
Employee
Contract/
Piece
Paid
Worker
Own-account
Worker (Non-
agriculture)
Own-account
Worker
(Agriculture)
Family
Worker (Non-
agriculture)
Family
Worker
(Agriculture)
Legislators, Senior Officials and Managers 601 0 26 108 0 80 0 815
Professionals 5,383 38 172 1,443 0 227 0 7,263
Technicians and Associate Professionals 2,644 119 77 0 0 41 0 2,882
Clerks 3,027 83 65 30 0 0 0 3,206
Service Workers and Shop and Market Sale Workers 1,784 123 74 5,783 0 1,813 0 9,577
Skilled Agricultural Workers 9 61 37 0 850 0 1,174 2,131
Craft and Related Workers 334 276 73 5,150 0 741 0 6,574
Plant and Machine Operators 219 55 15 65 0 31 0 384
Elementary Occupations 1,726 314 36 63 0 792 0 2,931
Armed Forces 512 0 0 0 0 0 0 512
Total 16,239 1,070 573 12,642 850 3,725 1,174 36,274
Major Occupation
Nature of Employment
Total

Labour Force Survey Report 2015
100
Chapter 13:
Table 13.0: Number of employed persons who looked for additional job by age group and area of
residence and gender 2015 - Bhutan
Table 13.1: Number of employed persons who looked for additional work by Dzongkhag, area of
residence and sex 2015 - Bhutan
Male Female Total Male Female Total Male Female Total
15-19 92 0 92 79 0 79 13 0 13
20-24 364 16 380 317 0 317 48 16 63
25-29 668 243 911 530 202 732 138 41 179
30-34 1,047 766 1,813 917 621 1,537 130 145 275
35-39 1,245 473 1,718 1,044 370 1,414 201 103 304
40-44 1,293 571 1,864 1,175 539 1,714 118 32 150
45-49 984 164 1,148 863 146 1,010 121 17 138
50-54 406 18 424 295 0 295 110 18 129
55-59 574 0 574 473 0 473 101 0 101
60-64 242 74 316 242 67 310 0 7 7
65+ 147 17 164 147 0 147 0 17 17
Total 7,062 2,342 9,405 6,083 1,945 8,028 979 397 1,376
Bhutan Rural UrbanAge
group
Male Female Total Male Female Total Male Female Total
Bumthang 324 210 534 187 124 311 137 86 223
Chukha 564 104 668 472 67 540 92 37 128
Dagana 100 0 100 81 0 81 18 0 18
Haa 150 0 150 139 0 139 11 0 11
Lhuntse 537 873 1,411 537 873 1,411 0 0 0
Mongar 2,880 504 3,384 2,851 475 3,326 29 29 58
Paro 208 205 413 85 170 256 123 35 158
Pemagats 104 0 104 104 0 104 0 0 0
Punakha 372 0 372 372 0 372 0 0 0
Samtse 186 0 186 104 0 104 83 0 83
Sarpang 270 142 412 238 79 318 31 62 94
Thimphu 385 141 526 0 0 0 385 141 526
Tashiyan 93 0 93 79 0 79 14 0 14
Trongsa 0 59 59 0 59 59 0 0 0
Tsirang 79 0 79 64 0 64 15 0 15
Wangdue 13 7 20 0 0 0 13 7 20
Zhemgang 796 96 892 769 96 865 27 0 27
Total 7,062 2,342 9,405 6,083 1,945 8,028 979 397 1,376
Bhutan Rural UrbanDzongkhag
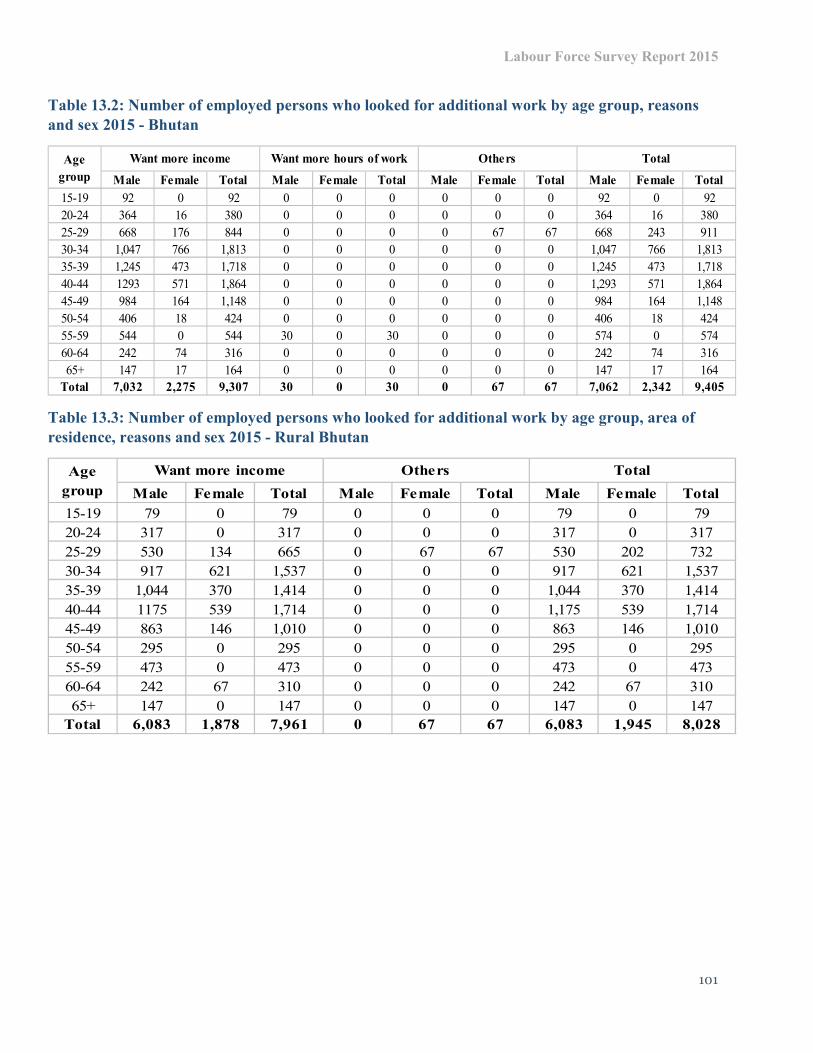
Labour Force Survey Report 2015
101
Table 13.2: Number of employed persons who looked for additional work by age group, reasons
and sex 2015 - Bhutan
Table 13.3: Number of employed persons who looked for additional work by age group, area of
residence, reasons and sex 2015 - Rural Bhutan
Male Female Total Male Female Total Male Female Total Male Female Total
15-19 92 0 92 0 0 0 0 0 0 92 0 92
20-24 364 16 380 0 0 0 0 0 0 364 16 380
25-29 668 176 844 0 0 0 0 67 67 668 243 911
30-34 1,047 766 1,813 0 0 0 0 0 0 1,047 766 1,813
35-39 1,245 473 1,718 0 0 0 0 0 0 1,245 473 1,718
40-44 1293 571 1,864 0 0 0 0 0 0 1,293 571 1,864
45-49 984 164 1,148 0 0 0 0 0 0 984 164 1,148
50-54 406 18 424 0 0 0 0 0 0 406 18 424
55-59 544 0 544 30 0 30 0 0 0 574 0 574
60-64 242 74 316 0 0 0 0 0 0 242 74 316
65+ 147 17 164 0 0 0 0 0 0 147 17 164
Total 7,032 2,275 9,307 30 0 30 0 67 67 7,062 2,342 9,405
Age
group
Want more income Others TotalWant more hours of work
Male Female Total Male Female Total Male Female Total
15-19 79 0 79 0 0 0 79 0 79
20-24 317 0 317 0 0 0 317 0 317
25-29 530 134 665 0 67 67 530 202 732
30-34 917 621 1,537 0 0 0 917 621 1,537
35-39 1,044 370 1,414 0 0 0 1,044 370 1,414
40-44 1175 539 1,714 0 0 0 1,175 539 1,714
45-49 863 146 1,010 0 0 0 863 146 1,010
50-54 295 0 295 0 0 0 295 0 295
55-59 473 0 473 0 0 0 473 0 473
60-64 242 67 310 0 0 0 242 67 310
65+ 147 0 147 0 0 0 147 0 147
Total 6,083 1,878 7,961 0 67 67 6,083 1,945 8,028
Age
group
Want more income Others Total

Labour Force Survey Report 2015
102
Table 13.4: Number of employed persons who looked for additional work by age group, area of
residence, reasons and sex 2015 - Urban Bhutan
Table 13.5: Number of employed persons who looked for additional work by Dzongkhag, reasons
and sex 2015 – Bhutan
Male Female Total Male Female Total Male Female Total
15-19 13 0 13 0 0 0 13 0 13
20-24 48 16 63 0 0 0 48 16 63
25-29 138 41 179 0 0 0 138 41 179
30-34 130 145 275 0 0 0 130 145 275
35-39 201 103 304 0 0 0 201 103 304
40-44 118 32 150 0 0 0 118 32 150
45-49 121 17 138 0 0 0 121 17 138
50-54 110 18 129 0 0 0 110 18 129
55-59 71 0 71 30 0 30 101 0 101
60-64 0 7 7 0 0 0 0 7 7
65+ 0 17 17 0 0 0 0 17 17
Total 949 397 1,346 30 0 30 979 397 1,376
Age
group
Want more income TotalWant more hours of work
Male Female Total Male Female Total Male Female Total Male Female Total
Bumthang 307 210 517 17 0 17 0 0 0 324 210 534
Chukha 564 37 601 0 0 0 0 67 67 564 104 668
Dagana 100 0 100 0 0 0 0 0 0 100 0 100
Haa 150 0 150 0 0 0 0 0 0 150 0 150
Lhuntse 537 873 1,411 0 0 0 0 0 0 537 873 1,411
Mongar 2880 504 3,384 0 0 0 0 0 0 2,880 504 3,384
Paro 208 205 413 0 0 0 0 0 0 208 205 413
Pemagatshel 104 0 104 0 0 0 0 0 0 104 0 104
Punakha 372 0 372 0 0 0 0 0 0 372 0 372
Samtse 186 0 186 0 0 0 0 0 0 186 0 186
Sarpang 270 142 412 0 0 0 0 0 0 270 142 412
Thimphu 372 141 513 13 0 13 0 0 0 385 141 526
Tashiyan 93 0 93 0 0 0 0 0 0 93 0 93
Trongsa 0 59 59 0 0 0 0 0 0 0 59 59
Tsirang 79 0 79 0 0 0 0 0 0 79 0 79
Wangdue 13 7 20 0 0 0 0 0 0 13 7 20
Zhemgang 796 96 892 0 0 0 0 0 0 796 96 892
Total 7,032 2,275 9,307 30 0 30 0 67 67 7,062 2,342 9,405
TotalDzongkhag
Want more income OthersWant more hours of work

Labour Force Survey Report 2015
103
Table 13.6: Number of employed persons who looked for additional work by Dzongkhag, area of
residence, reasons and sex 2015 - Rural Bhutan
Table 13.7: Number of employed persons who looked for additional work by Dzongkhag, area of
residence, reasons and sex 2015 - Urban Bhutan
Male Female Total Male Female Total Male Female Total
Bumthang 187 124 311 0 0 0 187 124 311
Chukha 472 0 472 0 67 67 472 67 540
Dagana 81 0 81 0 0 0 81 0 81
Haa 139 0 139 0 0 0 139 0 139
Lhuntse 537 873 1,411 0 0 0 537 873 1,411
Mongar 2851 475 3,326 0 0 0 2,851 475 3,326
Paro 85 170 256 0 0 0 85 170 256
Pemagatshel 104 0 104 0 0 0 104 0 104
Punakha 372 0 372 0 0 0 372 0 372
Samtse 104 0 104 0 0 0 104 0 104
Sarpang 238 79 318 0 0 0 238 79 318
Tashiyan 79 0 79 0 0 0 79 0 79
Trongsa 0 59 59 0 0 0 0 59 59
Tsirang 64 0 64 0 0 0 64 0 64
Zhemgang 769 96 865 0 0 0 769 96 865
Total 6,083 1,878 7,961 0 67 67 6,083 1,945 8,028
DzongkhagWant more income Others Total
Male Female Total Male Female Total Male Female Total
Bumthang 120 86 206 17 0 17 137 86 223
Chukha 92 37 128 0 0 0 92 37 128
Dagana 18 0 18 0 0 0 18 0 18
Haa 11 0 11 0 0 0 11 0 11
Mongar 29 29 58 0 0 0 29 29 58
Paro 123 35 158 0 0 0 123 35 158
Samtse 83 0 83 0 0 0 83 0 83
Sarpang 31 62 94 0 0 0 31 62 94
Thimphu 372 141 513 13 0 13 385 141 526
Tashiyangtse 14 0 14 0 0 0 14 0 14
Tsirang 15 0 15 0 0 0 15 0 15
Wangdue 13 7 20 0 0 0 13 7 20
Zhemgang 27 0 27 0 0 0 27 0 27
Total 949 397 1,346 30 0 30 979 397 1,376
DzongkhagWant more income TotalWant more hours of work
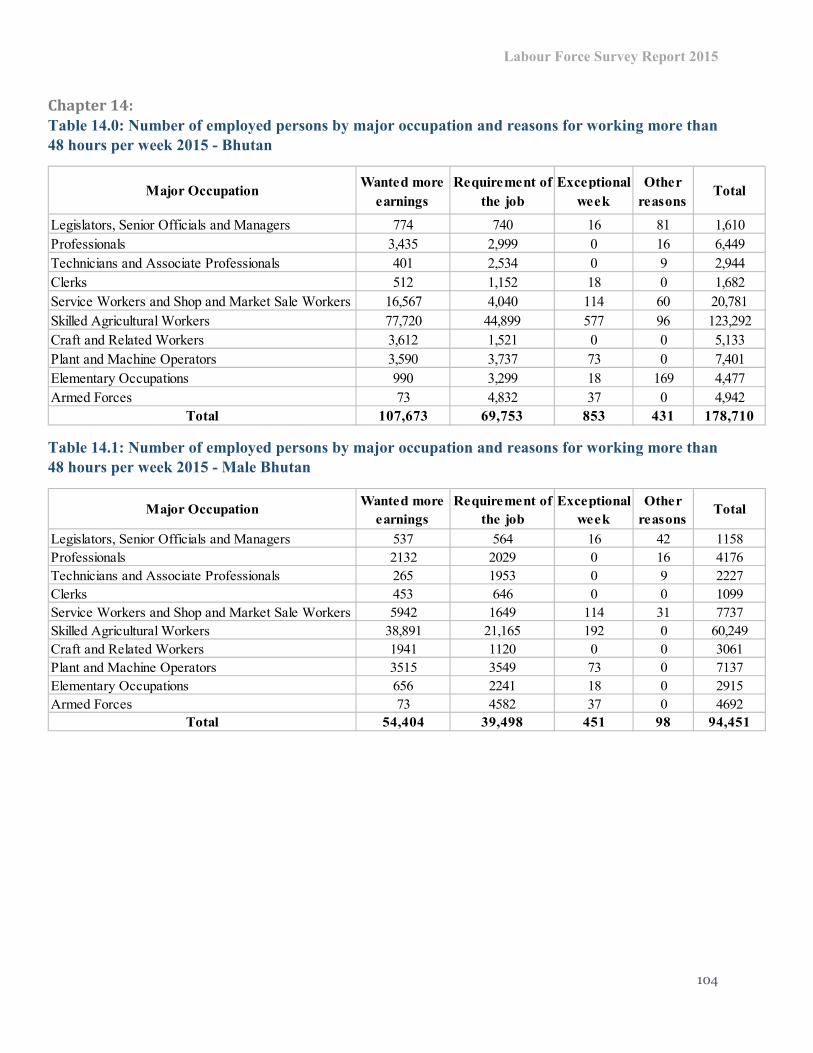
Labour Force Survey Report 2015
104
Chapter 14:
Table 14.0: Number of employed persons by major occupation and reasons for working more than
48 hours per week 2015 - Bhutan
Table 14.1: Number of employed persons by major occupation and reasons for working more than
48 hours per week 2015 - Male Bhutan
Major OccupationWanted more
earnings
Requirement of
the job
Exceptional
week
Other
reasonsTotal
Legislators, Senior Officials and Managers 774 740 16 81 1,610
Professionals 3,435 2,999 0 16 6,449
Technicians and Associate Professionals 401 2,534 0 9 2,944
Clerks 512 1,152 18 0 1,682
Service Workers and Shop and Market Sale Workers 16,567 4,040 114 60 20,781
Skilled Agricultural Workers 77,720 44,899 577 96 123,292
Craft and Related Workers 3,612 1,521 0 0 5,133
Plant and Machine Operators 3,590 3,737 73 0 7,401
Elementary Occupations 990 3,299 18 169 4,477
Armed Forces 73 4,832 37 0 4,942
Total 107,673 69,753 853 431 178,710
Major OccupationWanted more
earnings
Requirement of
the job
Exceptional
week
Other
reasonsTotal
Legislators, Senior Officials and Managers 537 564 16 42 1158
Professionals 2132 2029 0 16 4176
Technicians and Associate Professionals 265 1953 0 9 2227
Clerks 453 646 0 0 1099
Service Workers and Shop and Market Sale Workers 5942 1649 114 31 7737
Skilled Agricultural Workers 38,891 21,165 192 0 60,249
Craft and Related Workers 1941 1120 0 0 3061
Plant and Machine Operators 3515 3549 73 0 7137
Elementary Occupations 656 2241 18 0 2915
Armed Forces 73 4582 37 0 4692
Total 54,404 39,498 451 98 94,451

Labour Force Survey Report 2015
105
Table 14.2: Number of employed persons by major occupation and reasons for working more than
48 hours per week 2015 - Female Bhutan
Table 14.3: Number of employed persons by major occupation and reasons for working more than
48 hours per week 2015 - Rural Bhutan
Major OccupationWanted more
earnings
Requirement of
the job
Exceptional
week
Other
reasonsTotal
Legislators, Senior Officials and Managers 237 176 0 39 452
Professionals 1,303 971 0 0 2,273
Technicians and Associate Professionals 136 580 0 0 716
Clerks 59 506 18 0 583
Service Workers and Shop and Market Sale Workers 10,625 2,390 0 29 13,044
Skilled Agricultural Workers 38,829 23,734 384 96 63,043
Craft and Related Workers 1,672 400 0 0 2,072
Plant and Machine Operators 76 188 0 0 264
Elementary Occupations 334 1,059 0 169 1,562
Armed Forces 0 250 0 0 250
Total 53,269 30,255 403 333 84,259
Major OccupationWanted more
earnings
Requirement of
the job
Exceptional
week
Other
reasonsTotal
Legislators, Senior Officials and Managers 588 167 0 0 755
Professionals 1,283 1,017 0 0 2,301
Technicians and Associate Professionals 164 937 0 0 1,101
Clerks 283 241 0 0 524
Service Workers and Shop and Market Sale Workers 8,384 1,161 96 0 9,641
Skilled Agricultural Workers 76,627 44,182 577 96 121,481
Craft and Related Workers 2,285 630 0 0 2,915
Plant and Machine Operators 1,692 1,574 0 0 3,266
Elementary Occupations 519 1,191 0 79 1,790
Armed Forces 0 1,425 0 0 1,425
Total 91,825 52,526 673 176 145,199

Labour Force Survey Report 2015
106
Table 14.4: Number of employed persons by major occupation and reasons for working more than
48 hours per week 2015 - Rural Male
Table 14.5: Number of employed persons by major occupation and reasons for working more than
48 hours per week 2015 - Rural Female
Major OccupationWanted more
earnings
Requirement of
the job
Exceptional
week
Other
reasonsTotal
Legislators, Senior Officials and Managers 417 167 0 0 584
Professionals 916 644 0 0 1,560
Technicians and Associate Professionals 85 784 0 0 869
Clerks 283 241 0 0 524
Service Workers and Shop and Market Sale Workers 2,870 416 96 0 3,383
Skilled Agricultural Workers 38,404 20,898 192 0 59,494
Craft and Related Workers 1,363 369 0 0 1,732
Plant and Machine Operators 1,692 1,574 0 0 3,266
Elementary Occupations 301 800 0 0 1,101
Armed Forces 0 1,425 0 0 1,425
Total 46,331 27,319 288 0 73,938
Major OccupationWanted more
earnings
Requirement of
the job
Exceptional
week
Other
reasonsTotal
Legislators, Senior Officials and Managers 170 0 0 0 170
Professionals 367 373 0 0 740
Technicians and Associate Professionals 79 153 0 0 232
Clerks 5514 745 0 0 6,258
Service Workers and Shop and Market Sale Workers 38,223 23,284 384 96 61,988
Skilled Agricultural Workers 922 262 0 0 1,183
Craft and Related Workers 0 0 0 0 0
Plant and Machine Operators 218 391 0 79 689
Elementary Occupations 0 0 0 0 0
Armed Forces 45493 25,207 384 176 71,261

Labour Force Survey Report 2015
107
Table 14.6: Number of employed persons by major occupation and reasons for working more than
48 hours per week 2015 - Urban Bhutan
Table 14.7: Number of employed persons by major occupation and reasons for working more than
48 hours per week 2015 - Urban Male
Major OccupationWanted more
earnings
Requirement of
the job
Exceptional
week
Other
reasonsTotal
Legislators, Senior Officials and Managers 186 573 16 81 856
Professionals 2,151 1,982 0 16 4,149
Technicians and Associate Professionals 236 1,597 0 9 1,842
Clerks 229 911 18 0 1,158
Service Workers and Shop and Market Sale Workers 8,183 2,879 18 60 11,140
Skilled Agricultural Workers 1,093 717 0 0 1,810
Craft and Related Workers 1,327 890 0 0 2,218
Plant and Machine Operators 1,898 2,163 73 0 4,135
Elementary Occupations 471 2,108 18 90 2,687
Armed Forces 73 3,408 37 0 3,517
Total 15,848 17,227 181 255 33,511
Major OccupationWanted more
earnings
Requirement of
the job
Exceptional
week
Other
reasonsTotal
Legislators, Senior Officials and Managers 120 397 16 42 574
Professionals 1,216 1,384 0 16 2,616
Technicians and Associate Professionals 179 1,169 0 9 1,358
Clerks 170 404 0 0 575
Service Workers and Shop and Market Sale Workers 3,072 1,233 18 31 4,354
Skilled Agricultural Workers 487 267 0 0 755
Craft and Related Workers 577 752 0 0 1,329
Plant and Machine Operators 1,823 1,975 73 0 3,871
Elementary Occupations 355 1,441 18 0 1,814
Armed Forces 73 3,158 37 0 3,267
Total 8,073 12,180 162 98 20,512
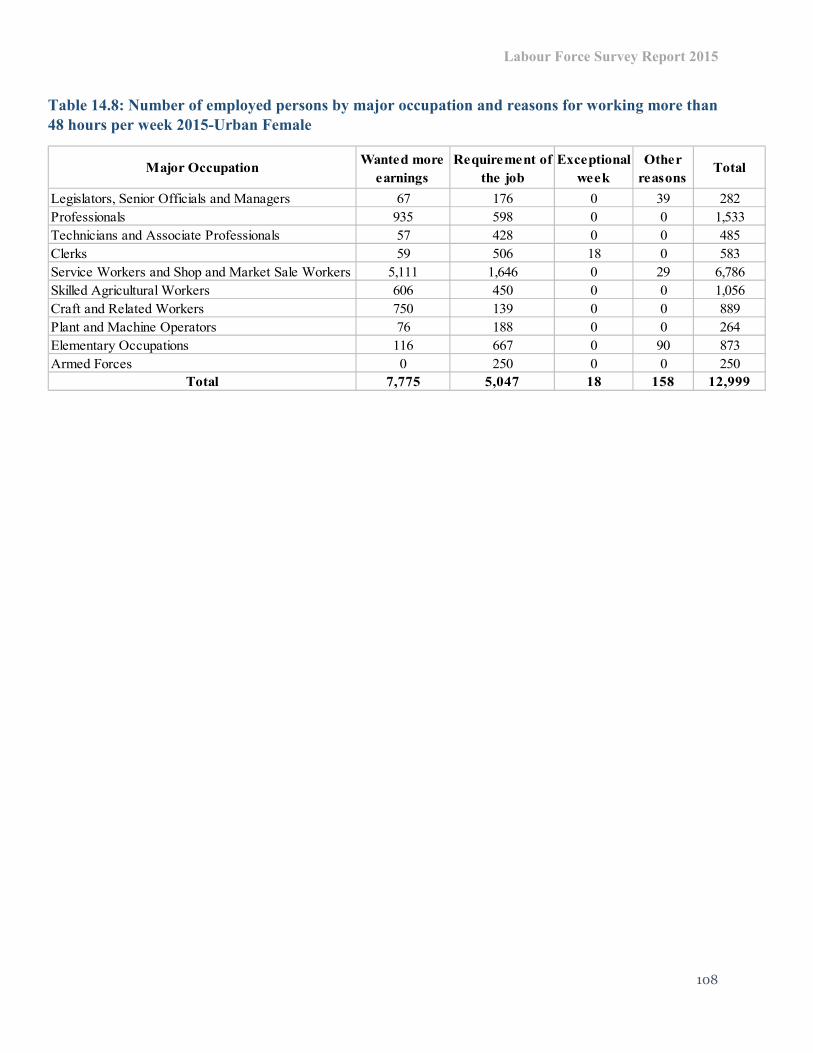
Labour Force Survey Report 2015
108
Table 14.8: Number of employed persons by major occupation and reasons for working more than
48 hours per week 2015-Urban Female
Major OccupationWanted more
earnings
Requirement of
the job
Exceptional
week
Other
reasonsTotal
Legislators, Senior Officials and Managers 67 176 0 39 282
Professionals 935 598 0 0 1,533
Technicians and Associate Professionals 57 428 0 0 485
Clerks 59 506 18 0 583
Service Workers and Shop and Market Sale Workers 5,111 1,646 0 29 6,786
Skilled Agricultural Workers 606 450 0 0 1,056
Craft and Related Workers 750 139 0 0 889
Plant and Machine Operators 76 188 0 0 264
Elementary Occupations 116 667 0 90 873
Armed Forces 0 250 0 0 250
Total 7,775 5,047 18 158 12,999

Labour Force Survey Report 2015
109
Chapter 15:
Table 15.0: Number of regular paid employees by major occupation and range of average monthly earnings (in Nu.) 2015 – Bhutan
Table 15.1: Number of regular paid employees by major occupation and range of average monthly earnings (in Nu.) 2015 - Male
Bhutan
<1000 1,000-1,999 2,000-2,999 3,000-3,999 4,000-4,999 5,000-9,999 10,000+
Legislators, Senior Officials and Managers 13 0 0 0 0 2,244 4,530 6,787
Professionals 0 533 169 178 195 2,687 25,257 29,019
Technicians and Associate Professionals 0 16 0 31 101 1,579 10,413 12,140
Clerks 0 13 0 41 13 1,655 7,233 8,955
Service Workers and Shop and Market Sale Workers 36 241 280 775 419 5,212 16,385 23,346
Skilled Agricultural Workers 3,864 6,975 13,327 11,461 6,798 22,346 22,322 87,093
Craft and Related Workers 72 596 1,450 1,135 950 5,272 6,986 16,461
Plant and Machine Operators 0 148 0 16 317 4,006 10,529 15,015
Elementary Occupations 192 0 113 322 448 6,591 2,976 10,642
Armed Forces 0 13 0 37 18 6,031 4,756 10,855
Total 4,178 8,534 15,338 13,995 9,260 57,622 111,386 220,313
TotalAverage Monthly Earnings (in Nu.)
Major occupation
<1000 1,000-1,999 2,000-2,999 3,000-3,999 4,000-4,999 5,000-9,999 10,000+
Legislators, Senior Officials and Managers 13 0 0 0 0 2,003 3,564 5,581
Professionals 0 520 16 142 157 1,709 16,942 19,486
Technicians and Associate Professionals 0 0 0 16 16 885 7,287 8,203
Clerks 0 13 0 13 13 897 4,380 5,316
Service Workers and Shop and Market Sale Workers 0 241 13 272 60 1,692 7,371 9,649
Skilled Agricultural Workers 1,623 3,176 7,628 5,682 4,311 13,992 14,899 51,310
Craft and Related Workers 13 18 13 109 89 2,078 4,533 6,853
Plant and Machine Operators 0 148 0 16 287 3,847 10,364 14,662
Elementary Occupations 85 0 70 222 109 4,090 2,310 6,886
Armed Forces 0 13 0 37 18 5,690 4,585 10,343
Total 1,734 4,129 7,738 6,507 5,059 36,886 76,235 138,289
TotalMajor occupationAverage Monthly Earnings (in Nu.)
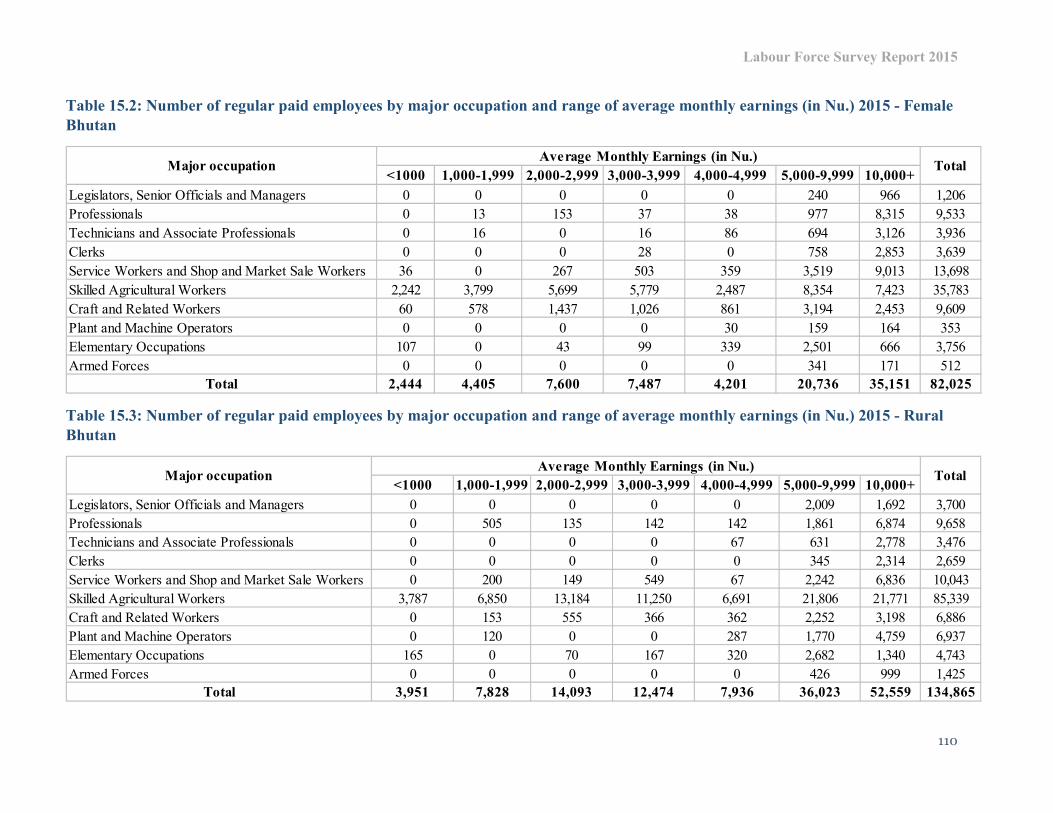
Labour Force Survey Report 2015
110
Table 15.2: Number of regular paid employees by major occupation and range of average monthly earnings (in Nu.) 2015 - Female
Bhutan
Table 15.3: Number of regular paid employees by major occupation and range of average monthly earnings (in Nu.) 2015 - Rural
Bhutan
<1000 1,000-1,999 2,000-2,999 3,000-3,999 4,000-4,999 5,000-9,999 10,000+
Legislators, Senior Officials and Managers 0 0 0 0 0 240 966 1,206
Professionals 0 13 153 37 38 977 8,315 9,533
Technicians and Associate Professionals 0 16 0 16 86 694 3,126 3,936
Clerks 0 0 0 28 0 758 2,853 3,639
Service Workers and Shop and Market Sale Workers 36 0 267 503 359 3,519 9,013 13,698
Skilled Agricultural Workers 2,242 3,799 5,699 5,779 2,487 8,354 7,423 35,783
Craft and Related Workers 60 578 1,437 1,026 861 3,194 2,453 9,609
Plant and Machine Operators 0 0 0 0 30 159 164 353
Elementary Occupations 107 0 43 99 339 2,501 666 3,756
Armed Forces 0 0 0 0 0 341 171 512
Total 2,444 4,405 7,600 7,487 4,201 20,736 35,151 82,025
TotalMajor occupationAverage Monthly Earnings (in Nu.)
<1000 1,000-1,999 2,000-2,999 3,000-3,999 4,000-4,999 5,000-9,999 10,000+
Legislators, Senior Officials and Managers 0 0 0 0 0 2,009 1,692 3,700
Professionals 0 505 135 142 142 1,861 6,874 9,658
Technicians and Associate Professionals 0 0 0 0 67 631 2,778 3,476
Clerks 0 0 0 0 0 345 2,314 2,659
Service Workers and Shop and Market Sale Workers 0 200 149 549 67 2,242 6,836 10,043
Skilled Agricultural Workers 3,787 6,850 13,184 11,250 6,691 21,806 21,771 85,339
Craft and Related Workers 0 153 555 366 362 2,252 3,198 6,886
Plant and Machine Operators 0 120 0 0 287 1,770 4,759 6,937
Elementary Occupations 165 0 70 167 320 2,682 1,340 4,743
Armed Forces 0 0 0 0 0 426 999 1,425
Total 3,951 7,828 14,093 12,474 7,936 36,023 52,559 134,865
TotalMajor occupationAverage Monthly Earnings (in Nu.)

Labour Force Survey Report 2015
111
Table 15.4: Number of regular paid employees by major occupation and range of average monthly earnings (in Nu.) 2015 - Rural
Male
Table 15.5: Number of regular paid employees by major occupation and range of average monthly earnings (in Nu.) 2015 - Rural
Female
<1000 1,000-1,999 2,000-2,999 3,000-3,999 4,000-4,999 5,000-9,999 10,000+
Legislators, Senior Officials and Managers 0 0 0 0 0 1,842 1,386 3,229
Professionals 0 505 0 142 142 1,378 4,944 7,110
Technicians and Associate Professionals 0 0 0 0 0 385 1,995 2,380
Clerks 0 0 0 0 0 345 1,880 2,225
Service Workers and Shop and Market Sale Workers 0 200 0 208 0 676 3,025 4,109
Skilled Agricultural Workers 1,595 3,158 7,581 5,622 4,261 13,749 14,547 50,513
Craft and Related Workers 0 0 0 96 62 976 1,960 3,095
Plant and Machine Operators 0 120 0 0 287 1,770 4,759 6,937
Elementary Occupations 85 0 70 167 81 1,756 967 3,126
Armed Forces 0 0 0 0 0 426 999 1,425
Total 1,680 3,982 7,651 6,234 4,833 23,304 36,463 84,148
Major occupationAverage Monthly Earnings (in Nu.)
Total
<1000 1,000-1,999 2,000-2,999 3,000-3,999 4,000-4,999 5,000-9,999 10,000+
Legislators, Senior Officials and Managers 0 0 0 0 0 166 305 472
Professionals 0 0 135 0 0 483 1,930 2,547
Technicians and Associate Professionals 0 0 0 0 67 246 783 1,096
Clerks 0 0 0 0 0 0 434 434
Service Workers and Shop and Market Sale Workers 0 0 149 341 67 1,566 3,810 5,934
Skilled Agricultural Workers 2,192 3,693 5,603 5,629 2,429 8,056 7,224 34,826
Craft and Related Workers 0 153 555 270 300 1,275 1,238 3,791
Plant and Machine Operators 0 0 0 0 0 0 0 0
Elementary Occupations 79 0 0 0 239 926 373 1,617
Armed Forces 0 0 0 0 0 0 0 0
Total 2,271 3,845 6,443 6,240 3,103 12,718 16,096 50,716
Major occupationAverage Monthly Earnings (in Nu.)
Total

Labour Force Survey Report 2015
112
Table 15.6: Number of regular paid employees by major occupation and range of average monthly earnings (in Nu.) 2015 - Urban
Bhutan
Table 15.7: Number of regular paid employees by major occupation and range of average monthly earnings (in Nu.) 2015 - Urban
Male
<1000 1,000-1,999 2,000-2,999 3,000-3,999 4,000-4,9995,000-9,99910,000+
Legislators, Senior Officials and Managers 13 0 0 0 0 235 2,838 3,087
Professionals 0 28 34 37 53 826 18,383 19,361
Technicians and Associate Professionals 0 16 0 31 34 948 7,635 8,664
Clerks 0 13 0 41 13 1,310 4,919 6,296
Service Workers and Shop and Market Sale Workers 36 41 131 225 352 2,970 9,549 13,304
Skilled Agricultural Workers 78 124 142 211 107 541 551 1,754
Craft and Related Workers 72 443 895 768 588 3,020 3,788 9,575
Plant and Machine Operators 0 28 0 16 30 2,236 5,769 8,079
Elementary Occupations 28 0 43 155 128 3,908 1,637 5,899
Armed Forces 0 13 0 37 18 5,605 3,758 9,430
Total 226 706 1,245 1,521 1,324 21,600 58,827 85,449
Major occupationMonthly Average Earnings (in Nu.)
Total
<1000 1,000-1,999 2,000-2,999 3,000-3,999 4,000-4,9995,000-9,99910,000+
Legislators, Senior Officials and Managers 13 0 0 0 0 161 2,178 2,352
Professionals 0 16 16 0 16 331 11,997 12,376
Technicians and Associate Professionals 0 0 0 16 16 500 5,292 5,823
Clerks 0 13 0 13 13 552 2,499 3,090
Service Workers and Shop and Market Sale Workers 0 41 13 64 60 1,017 4,346 5,540
Skilled Agricultural Workers 28 18 47 60 50 243 352 797
Craft and Related Workers 13 18 13 13 26 1,102 2,573 3,758
Plant and Machine Operators 0 28 0 16 0 2,077 5,605 7,725
Elementary Occupations 0 0 0 56 28 2,334 1,343 3,761
Armed Forces 0 13 0 37 18 5,264 3,586 8,919
Total 53 147 88 273 225 13,582 39,772 54,140
Major occupationMonthly Average Earnings (in Nu.)
Total
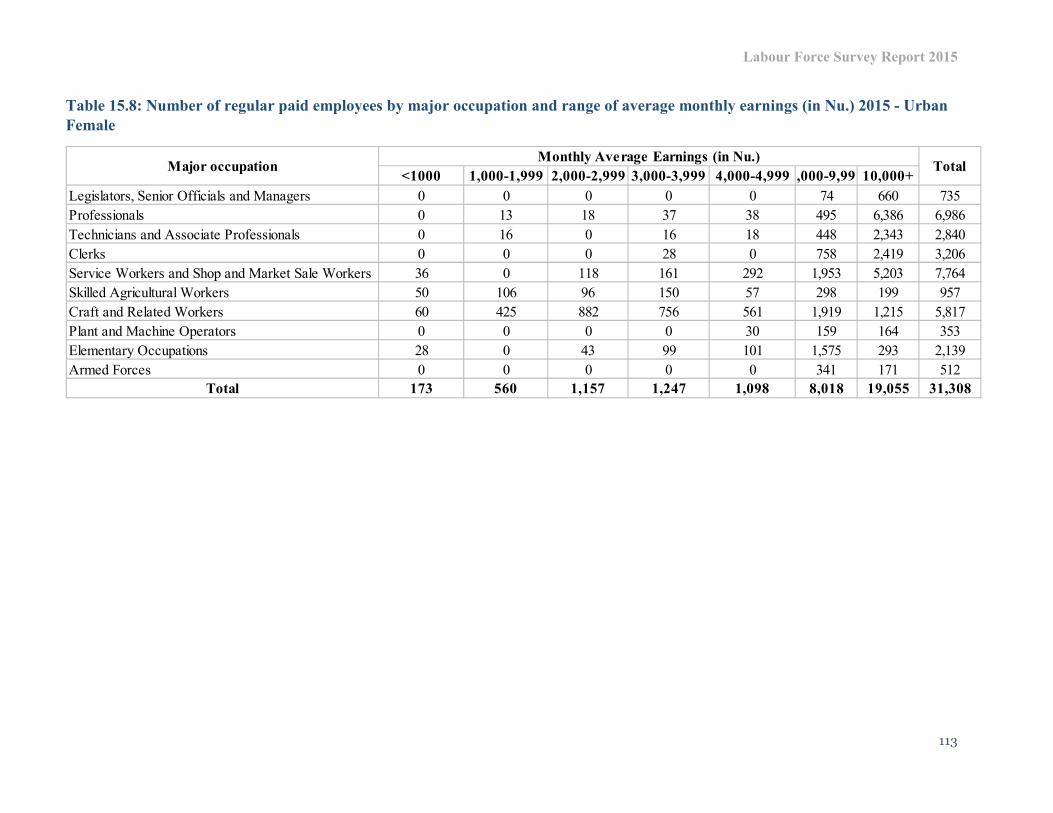
Labour Force Survey Report 2015
113
Table 15.8: Number of regular paid employees by major occupation and range of average monthly earnings (in Nu.) 2015 - Urban
Female
<1000 1,000-1,999 2,000-2,999 3,000-3,999 4,000-4,9995,000-9,99910,000+
Legislators, Senior Officials and Managers 0 0 0 0 0 74 660 735
Professionals 0 13 18 37 38 495 6,386 6,986
Technicians and Associate Professionals 0 16 0 16 18 448 2,343 2,840
Clerks 0 0 0 28 0 758 2,419 3,206
Service Workers and Shop and Market Sale Workers 36 0 118 161 292 1,953 5,203 7,764
Skilled Agricultural Workers 50 106 96 150 57 298 199 957
Craft and Related Workers 60 425 882 756 561 1,919 1,215 5,817
Plant and Machine Operators 0 0 0 0 30 159 164 353
Elementary Occupations 28 0 43 99 101 1,575 293 2,139
Armed Forces 0 0 0 0 0 341 171 512
Total 173 560 1,157 1,247 1,098 8,018 19,055 31,308
Major occupationMonthly Average Earnings (in Nu.)
Total

Labour Force Survey Report 2015
114
Chapter 16: Unemployment
Table 16.0: Number of unemployed persons by age group, area of residence and sex 2015 -
Bhutan
Table 16.1: Number of unemployed persons by level of education, area of residence and sex 2015
- Bhutan
Male Female Total Male Female Total Male Female Total
15-19 165 329 495 67 59 127 98 270 368
20-24 1363 2646 4009 408 954 1362 955 1692 2647
25-29 1368 1495 2863 282 306 589 1086 1189 2275
30-34 442 460 902 197 155 351 245 305 551
35-39 28 115 144 0 0 0 28 115 144
40-44 28 49 77 0 0 0 28 49 77
45-49 46 47 92 0 0 0 46 47 92
50-54 0 18 18 0 0 0 0 18 18
55-59 28 18 47 0 0 0 28 18 47
60-64 0 13 13 0 0 0 0 13 13
Total 3,470 5,190 8,660 954 1,474 2,428 2,516 3,716 6,232
Bhutan Rural UrbanAge group
Male Female Total Male Female Total Male Female Total
No formal education 147 473 620 104 104 207 43 370 413
Primary education 64 349 413 0 153 153 64 196 260
Lower secondary 102 205 308 0 0 0 102 205 308
Middle secondary 402 935 1,337 67 326 393 335 609 944
Higher secondary 1,156 1,604 2,760 493 621 1,113 663 984 1,647
Bachelor degree 1,422 1586 3,008 155 271 427 1,266 1315 2,581
Master degree & above 148 25 173 135 0 135 13 25 38
NFE 0 13 13 0 0 0 0 13 13
Religious preofessionals 29 0 29 0 0 0 29 0 29
Total 3,470 5,190 8,660 954 1,474 2,428 2,516 3,716 6,232
UrbanRuralLevel of Education
Bhutan
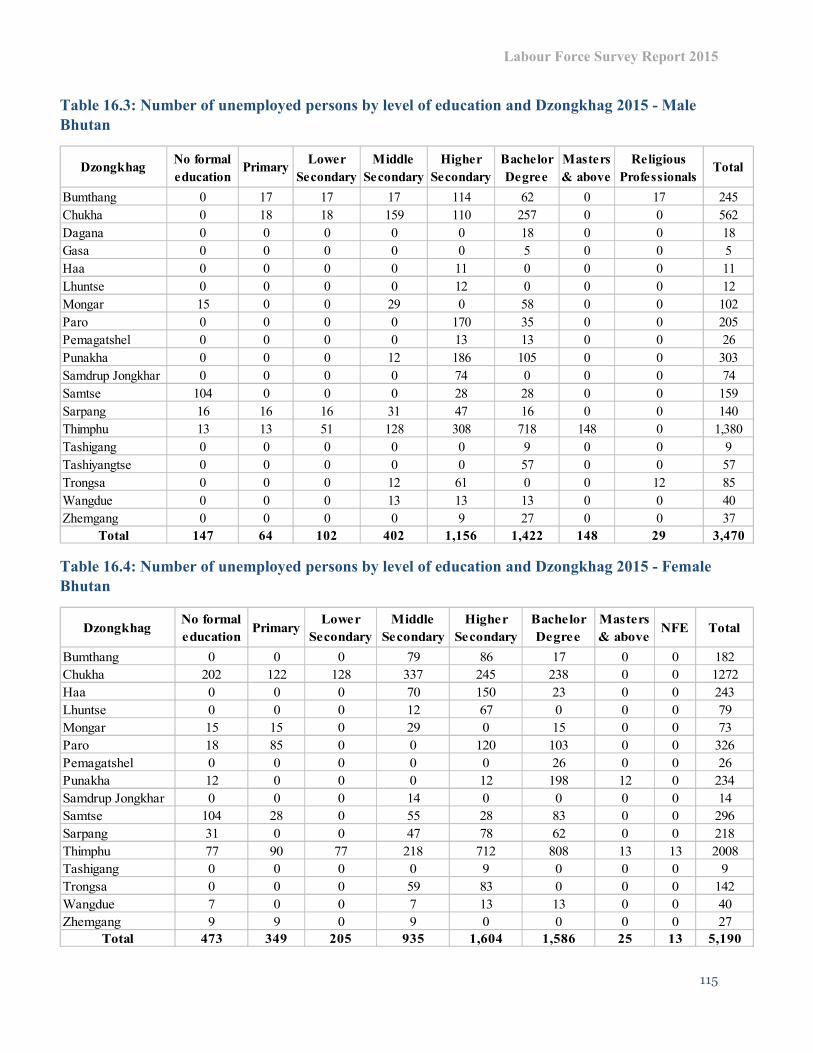
Labour Force Survey Report 2015
115
Table 16.3: Number of unemployed persons by level of education and Dzongkhag 2015 - Male
Bhutan
Table 16.4: Number of unemployed persons by level of education and Dzongkhag 2015 - Female
Bhutan
DzongkhagNo formal
educationPrimary
Lower
Secondary
Middle
Secondary
Higher
Secondary
Bachelor
Degree
Masters
& above
Religious
ProfessionalsTotal
Bumthang 0 17 17 17 114 62 0 17 245
Chukha 0 18 18 159 110 257 0 0 562
Dagana 0 0 0 0 0 18 0 0 18
Gasa 0 0 0 0 0 5 0 0 5
Haa 0 0 0 0 11 0 0 0 11
Lhuntse 0 0 0 0 12 0 0 0 12
Mongar 15 0 0 29 0 58 0 0 102
Paro 0 0 0 0 170 35 0 0 205
Pemagatshel 0 0 0 0 13 13 0 0 26
Punakha 0 0 0 12 186 105 0 0 303
Samdrup Jongkhar 0 0 0 0 74 0 0 0 74
Samtse 104 0 0 0 28 28 0 0 159
Sarpang 16 16 16 31 47 16 0 0 140
Thimphu 13 13 51 128 308 718 148 0 1,380
Tashigang 0 0 0 0 0 9 0 0 9
Tashiyangtse 0 0 0 0 0 57 0 0 57
Trongsa 0 0 0 12 61 0 0 12 85
Wangdue 0 0 0 13 13 13 0 0 40
Zhemgang 0 0 0 0 9 27 0 0 37
Total 147 64 102 402 1,156 1,422 148 29 3,470
DzongkhagNo formal
educationPrimary
Lower
Secondary
Middle
Secondary
Higher
Secondary
Bachelor
Degree
Masters
& aboveNFE Total
Bumthang 0 0 0 79 86 17 0 0 182
Chukha 202 122 128 337 245 238 0 0 1272
Haa 0 0 0 70 150 23 0 0 243
Lhuntse 0 0 0 12 67 0 0 0 79
Mongar 15 15 0 29 0 15 0 0 73
Paro 18 85 0 0 120 103 0 0 326
Pemagatshel 0 0 0 0 0 26 0 0 26
Punakha 12 0 0 0 12 198 12 0 234
Samdrup Jongkhar 0 0 0 14 0 0 0 0 14
Samtse 104 28 0 55 28 83 0 0 296
Sarpang 31 0 0 47 78 62 0 0 218
Thimphu 77 90 77 218 712 808 13 13 2008
Tashigang 0 0 0 0 9 0 0 0 9
Trongsa 0 0 0 59 83 0 0 0 142
Wangdue 7 0 0 7 13 13 0 0 40
Zhemgang 9 9 0 9 0 0 0 0 27
Total 473 349 205 935 1,604 1,586 25 13 5,190

Labour Force Survey Report 2015
116
Table 16.5: Number of unemployed persons by age group, level of education and sex 2015 -
Bhutan
Age
Group
No formal
educationPrimary
Lower
Secondary
Middle
Secondary
Higher
Secondary
Bachelors
Degree
Masters
DegreeNFE
Religious
ProfessionalsTotal
15-19 0 17 44 80 25 0 0 0 0 165
20-24 0 0 30 128 745 460 0 0 0 1,363
25-29 13 18 0 106 267 787 148 0 29 1,368
30-34 118 13 28 27 106 149 0 0 0 442
35-39 0 0 0 28 0 0 0 0 0 28
40-44 0 16 0 0 13 0 0 0 0 28
45-49 0 0 0 33 0 13 0 0 0 46
50-54 0 0 0 0 0 0 0 0 0 0
55-59 16 0 0 0 0 13 0 0 0 28
60-64 0 0 0 0 0 0 0 0 0 0
65+ 0 0 0 0 0 0 0 0 0 0
Total 147 64 102 402 1,156 1,422 148 0 29 3,470
Age
Group
No formal
educationPrimary
Lower
Secondary
Middle
Secondary
Higher
Secondary
Bachelors
Degree
Masters
DegreeNFE
Religious
ProfessionalsTotal
15-19 30 38 0 64 197 0 0 0 0 329
20-24 37 77 117 445 1,009 936 12 13 0 2,646
25-29 141 64 49 254 373 600 13 0 0 1,495
30-34 108 113 26 137 26 50 0 0 0 460
35-39 77 26 13 0 0 0 0 0 0 115
40-44 49 0 0 0 0 0 0 0 0 49
45-49 0 31 0 16 0 0 0 0 0 47
50-54 0 0 0 18 0 0 0 0 0 18
55-59 18 0 0 0 0 0 0 0 0 18
60-64 13 0 0 0 0 0 0 0 0 13
65+ 0 0 0 0 0 0 0 0 0 0
Total 473 349 205 935 1,604 1,586 25 13 0 5,190
Age
Group
No formal
educationPrimary
Lower
Secondary
Middle
Secondary
Higher
Secondary
Bachelors
Degree
Masters
DegreeNFE
Religious
ProfessionalsTotal
15-19 30 56 44 144 221 0 0 0 0 495
20-24 37 77 147 573 1,754 1,396 12 13 0 4,009
25-29 154 82 49 360 640 1,387 161 0 29 2,863
30-34 226 126 54 165 132 200 0 0 0 902
35-39 77 26 13 28 0 0 0 0 0 144
40-44 49 16 0 0 13 0 0 0 0 77
45-49 0 31 0 48 0 13 0 0 0 92
50-54 0 0 0 18 0 0 0 0 0 18
55-59 34 0 0 0 0 13 0 0 0 47
60-64 13 0 0 0 0 0 0 0 0 13
65+ 0 0 0 0 0 0 0 0 0 0
Total 620 413 308 1,337 2,760 3,008 173 13 29 8,660
16.5 (b): Level of Education - Female
16.5 (c): Level of Education - Both Male & Female
16.5 (a): Level of Education - Male

Labour Force Survey Report 2015
117
Table 16.6: Number of unemployed persons by age group, level of education and sex 2015 -
Rural Bhutan
Age
Group
No formal
educationPrimary
Lower
Secondary
Middle
Secondary
Higher
Secondary
Bachelors
Degree
Masters
DegreeTotal
15-19 0 0 0 67 0 0 0 67
20-24 0 0 0 0 315 93 0 408
25-29 0 0 0 0 85 62 135 282
30-34 104 0 0 0 93 0 0 197
35-39 0 0 0 0 0 0 0 0
40-44 0 0 0 0 0 0 0 0
45-49 0 0 0 0 0 0 0 0
50-54 0 0 0 0 0 0 0 0
55-59 0 0 0 0 0 0 0 0
60-64 0 0 0 0 0 0 0 0
65+ 0 0 0 0 0 0 0 0
Total 104 0 0 67 493 155 135 954
Age
Group
No formal
educationPrimary
Lower
Secondary
Middle
Secondary
Higher
Secondary
Bachelors
Degree
Masters
DegreeTotal
15-19 0 0 0 0 59 0 0 59
20-24 0 67 0 189 426 271 0 954
25-29 104 0 0 67 135 0 0 306
30-34 0 85 0 70 0 0 0 155
35-39 0 0 0 0 0 0 0 0
40-44 0 0 0 0 0 0 0 0
45-49 0 0 0 0 0 0 0 0
50-54 0 0 0 0 0 0 0 0
55-59 0 0 0 0 0 0 0 0
60-64 0 0 0 0 0 0 0 0
65+ 0 0 0 0 0 0 0 0
Total 104 153 0 326 621 271 0 1,474
Age
Group
No formal
educationPrimary
Lower
Secondary
Middle
Secondary
Higher
Secondary
Bachelors
Degree
Masters
DegreeTotal
15-19 0 0 0 67 59 0 0 127
20-24 0 67 0 189 741 365 0 1,362
25-29 104 0 0 67 220 62 135 589
30-34 104 85 0 70 93 0 0 351
35-39 0 0 0 0 0 0 0 0
40-44 0 0 0 0 0 0 0 0
45-49 0 0 0 0 0 0 0 0
50-54 0 0 0 0 0 0 0 0
55-59 0 0 0 0 0 0 0 0
60-64 0 0 0 0 0 0 0 0
65+ 0 0 0 0 0 0 0 0
Total 207 153 0 393 1,113 427 135 2,428
16.6 (a): Level of Education - Male
16.6 (b): Level of Education - Female
16.6 (c): Level of Education - Both Male & Female

Labour Force Survey Report 2015
118
Table 16.7: Number of unemployed persons by age group, level of education and sex 2015 -
Urban Bhutan
Age
Group
No formal
educationPrimary
Lower
Secondary
Middle
Secondary
Higher
Secondary
Bachelors
Degree
Masters
DegreeNFE
Religious
ProfessionalsTotal
15-19 0 17 44 12 25 0 0 0 0 98
20-24 0 0 30 128 431 367 0 0 0 955
25-29 13 18 0 106 182 725 13 0 29 1,086
30-34 15 13 28 27 13 149 0 0 0 245
35-39 0 0 0 28 0 0 0 0 0 28
40-44 0 16 0 0 13 0 0 0 0 28
45-49 0 0 0 33 0 13 0 0 0 46
50-54 0 0 0 0 0 0 0 0 0 0
55-59 16 0 0 0 0 13 0 0 0 28
60-64 0 0 0 0 0 0 0 0 0 0
65+ 0 0 0 0 0 0 0 0 0 0
Total 43 64 102 335 663 1,266 13 0 29 2,516
Age
Group
No formal
educationPrimary
Lower
Secondary
Middle
Secondary
Higher
Secondary
Bachelors
Degree
Masters
DegreeNFE
Religious
ProfessionalsTotal
15-19 30 38 0 64 137 0 0 0 270
20-24 37 9 117 256 583 665 12 13 0 1,692
25-29 38 64 49 187 238 600 13 0 0 1,189
30-34 108 28 26 68 26 50 0 0 0 305
35-39 77 26 13 0 0 0 0 0 0 115
40-44 49 0 0 0 0 0 0 0 0 49
45-49 0 31 0 16 0 0 0 0 0 47
50-54 0 0 0 18 0 0 0 0 0 18
55-59 18 0 0 0 0 0 0 0 0 18
60-64 13 0 0 0 0 0 0 0 0 13
65+ 0 0 0 0 0 0 0 0 0 0
Total 370 196 205 609 984 1,315 25 13 0 3,716
Age
Group
No formal
educationPrimary
Lower
Secondary
Middle
Secondary
Higher
Secondary
Bachelors
Degree
Masters
DegreeNFE
Religious
ProfessionalsTotal
15-19 30 56 44 76 162 0 0 0 0 368
20-24 37 9 147 384 1,013 1,031 12 13 0 2,647
25-29 51 82 49 293 420 1,324 26 0 29 2,275
30-34 123 40 54 95 38 200 0 0 0 551
35-39 77 26 13 28 0 0 0 0 0 144
40-44 49 16 0 0 13 0 0 0 0 77
45-49 0 31 0 48 0 13 0 0 0 92
50-54 0 0 0 18 0 0 0 0 0 18
55-59 34 0 0 0 0 13 0 0 0 47
60-64 13 0 0 0 0 0 0 0 0 13
65+ 0 0 0 0 0 0 0 0 0 0
Total 413 260 308 944 1,647 2,581 38 13 29 6,232
16.7 (a): Level of Education - Male
16.7 (b): Level of Education - Female
16.7 (c): Level of Education - Both Male & Female

Labour Force Survey Report 2015
119
Table 16.8: Number of unemployed persons by age group, duration taken to look for work and
sex 2015 – Bhutan
Age
Group
Less than
one month
One to Six
months
Six months to
one year
One year to
two year
More than
two yearsTotal
15-19 80 26 48 12 0 165
20-24 127 490 289 311 146 1,363
25-29 87 193 456 407 225 1,368
30-34 15 120 72 192 43 442
35-39 0 0 0 16 13 28
40-44 0 13 0 0 16 28
45-49 33 0 0 0 13 46
50-54 0 0 0 0 0 0
55-59 0 16 0 13 0 28
60-64 0 0 0 0 0 0
65+ 0 0 0 0 0 0
Total 341 857 866 950 456 3,470
Age
Group
Less than
one month
One to Six
months
Six months to
one year
One year to
two year
More than
two yearsTotal
15-19 59 38 75 144 0 329
20-24 140 548 698 832 366 2,646
25-29 81 140 371 494 377 1,495
30-34 0 160 70 53 176 460
35-39 49 0 0 26 0 115
40-44 0 0 18 18 0 49
45-49 18 0 0 0 28 47
50-54 0 0 18 0 0 18
55-59 18 0 0 0 0 18
60-64 13 0 0 0 0 13
65+ 0 0 0 0 0 0
Total 378 887 1,252 1,566 947 5,190
Age
Group
Less than
one month
One to Six
months
Six months to
one year
One year to
two year
More than
two yearsTotal
15-19 138 64 124 156 0 495
20-24 267 1037 987 1143 512 4,009
25-29 168 333 827 902 602 2,863
30-34 15 281 143 245 219 902
35-39 49 0 0 41 13 144
40-44 0 13 18 18 16 77
45-49 51 0 0 0 41 92
50-54 0 0 18 0 0 18
55-59 18 16 0 13 0 47
60-64 13 0 0 0 0 13
65+ 0 0 0 0 0 0
Total 719 1,744 2,118 2,517 1,403 8,660
16.8 (c): Duration for search of job - Both Male & Female
16.8 (b): Duration for search of job - Female
16.8 (a): Duration for search of job - Male
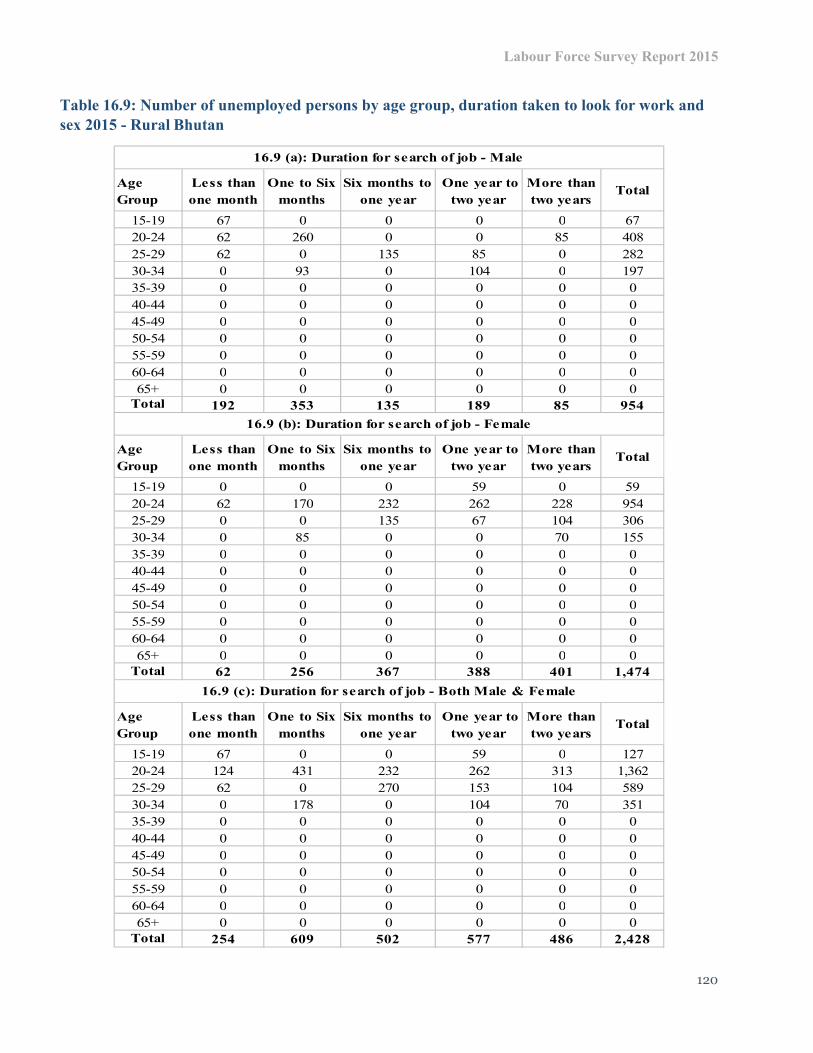
Labour Force Survey Report 2015
120
Table 16.9: Number of unemployed persons by age group, duration taken to look for work and
sex 2015 - Rural Bhutan
Age
Group
Less than
one month
One to Six
months
Six months to
one year
One year to
two year
More than
two yearsTotal
15-19 67 0 0 0 0 67
20-24 62 260 0 0 85 408
25-29 62 0 135 85 0 282
30-34 0 93 0 104 0 197
35-39 0 0 0 0 0 0
40-44 0 0 0 0 0 0
45-49 0 0 0 0 0 0
50-54 0 0 0 0 0 0
55-59 0 0 0 0 0 0
60-64 0 0 0 0 0 0
65+ 0 0 0 0 0 0
Total 192 353 135 189 85 954
Age
Group
Less than
one month
One to Six
months
Six months to
one year
One year to
two year
More than
two yearsTotal
15-19 0 0 0 59 0 59
20-24 62 170 232 262 228 954
25-29 0 0 135 67 104 306
30-34 0 85 0 0 70 155
35-39 0 0 0 0 0 0
40-44 0 0 0 0 0 0
45-49 0 0 0 0 0 0
50-54 0 0 0 0 0 0
55-59 0 0 0 0 0 0
60-64 0 0 0 0 0 0
65+ 0 0 0 0 0 0
Total 62 256 367 388 401 1,474
Age
Group
Less than
one month
One to Six
months
Six months to
one year
One year to
two year
More than
two yearsTotal
15-19 67 0 0 59 0 127
20-24 124 431 232 262 313 1,362
25-29 62 0 270 153 104 589
30-34 0 178 0 104 70 351
35-39 0 0 0 0 0 0
40-44 0 0 0 0 0 0
45-49 0 0 0 0 0 0
50-54 0 0 0 0 0 0
55-59 0 0 0 0 0 0
60-64 0 0 0 0 0 0
65+ 0 0 0 0 0 0
Total 254 609 502 577 486 2,428
16.9 (a): Duration for search of job - Male
16.9 (b): Duration for search of job - Female
16.9 (c): Duration for search of job - Both Male & Female

Labour Force Survey Report 2015
121
Table 16.10: Number of unemployed persons by age group, duration taken to look for work and
sex 2015 - Urban Bhutan
Age
Group
Less than
one month
One to Six
months
Six months to
one year
One year to
two year
More than
two yearsTotal
15-19 12 26 48 12 0 98
20-24 65 229 289 311 61 955
25-29 25 193 321 322 225 1,086
30-34 15 27 72 88 43 245
35-39 0 0 0 16 13 28
40-44 0 13 0 0 16 28
45-49 33 0 0 0 13 46
50-54 0 0 0 0 0 0
55-59 0 16 0 13 0 28
60-64 0 0 0 0 0 0
65+ 0 0 0 0 0 0
Total 149 503 731 762 371 2,516
Age
Group
Less than
one month
One to Six
months
Six months to
one year
One year to
two year
More than
two yearsTotal
15-19 59 38 75 85 0 270
20-24 78 377 466 570 138 1,692
25-29 81 140 236 427 274 1,189
30-34 0 75 70 53 106 305
35-39 49 0 0 26 0 115
40-44 0 0 18 18 0 49
45-49 18 0 0 0 28 47
50-54 0 0 18 0 0 18
55-59 18 0 0 0 0 18
60-64 13 0 0 0 0 13
65+ 0 0 0 0 0 0
Total 316 631 885 1,178 546 3,716
Age
Group
Less than
one month
One to Six
months
Six months to
one year
One year to
two year
More than
two yearsTotal
15-19 71 64 124 97 0 368
20-24 143 606 755 882 199 2,647
25-29 106 333 557 749 499 2,275
30-34 15 103 143 141 149 551
35-39 49 0 0 41 13 144
40-44 0 13 18 18 16 77
45-49 51 0 0 0 41 92
50-54 0 0 18 0 0 18
55-59 18 16 0 13 0 47
60-64 13 0 0 0 0 13
65+ 0 0 0 0 0 0
Total 465 1135 1,615 1,940 917 6,232
16.10 (a): Duration for search of job - Male
16.10 (b): Duration for search of job - Female
16.10 (c): Duration for search of job - Both Male & Female

Labour Force Survey Report 2015
122
Chapter 17:
Table 17.0: Number of persons by age group, types of training availed and sex 2015 - Bhutan
Table 17.1: Number of persons by age group, types of training availed and sex 2015 - Rural
Bhutan
Male Female Total Male Female Total Male Female Total
15-19 28 40 68 0 26 26 28 65 94
20-24 885 1,587 2,472 15 129 144 899 1,716 2,616
25-29 3,724 2,066 5,789 205 47 252 3,928 2,112 6,041
30-34 3,453 1,463 4,917 119 59 178 3,573 1,522 5,094
35-39 3,448 993 4,441 44 96 140 3,492 1,089 4,581
40-44 2,443 181 2,624 87 62 149 2,530 243 2,773
45-49 2,575 110 2,685 18 0 18 2,593 110 2,703
50-54 916 134 1,050 278 13 291 1,195 147 1,341
55-59 800 38 839 64 0 64 864 38 903
60-64 254 0 254 103 0 103 357 0 357
65+ 900 107 1,007 0 0 0 900 107 1,007
Total 19,427 6,718 26,145 933 431 1,364 20,360 7,149 27,509
Age
group
Formal Informal Total
Male Female Total Male Female Total Male Female Total
15-19 0 0 0 0 0 0 0 0 0
20-24 142 700 842 0 85 85 142 785 927
25-29 1,558 636 2,194 81 0 81 1,639 636 2,275
30-34 982 422 1,404 0 0 0 982 422 1,404
35-39 954 403 1,357 0 0 0 954 403 1,357
40-44 937 0 937 0 62 62 937 62 999
45-49 1,151 0 1,151 0 0 0 1,151 0 1,151
50-54 302 0 302 192 0 192 494 0 494
55-59 495 0 495 64 0 64 559 0 559
60-64 147 0 147 67 0 67 214 0 214
65+ 724 81 805 0 0 0 724 81 805
Total 7,392 2,243 9,635 405 147 552 7,797 2,390 10,188
Age
group
Formal Informal Total

Labour Force Survey Report 2015
123
Table 17.2: Number persons by age group, types of training availed and sex 2015 - Urban
Bhutan
Table 17.3: Number persons by field of training, area of residence and sex 2015 - Bhutan
Male Female Total Male Female Total Male Female Total
15-19 28 40 68 0 26 26 28 65 94
20-24 743 887 1,630 15 44 58 758 931 1,688
25-29 2,166 1,430 3,595 123 47 170 2,289 1,476 3,766
30-34 2,471 1,041 3,512 119 59 178 2,590 1,100 3,690
35-39 2,494 590 3,083 44 96 140 2,538 685 3,223
40-44 1,507 181 1,687 87 0 87 1,594 181 1,774
45-49 1,423 110 1,533 18 0 18 1,442 110 1,551
50-54 614 134 748 86 13 99 700 147 847
55-59 305 38 344 0 0 0 305 38 344
60-64 107 107 36 0 36 142 0 142
65+ 176 26 202 0 0 0 176 26 202
Total 12,035 4,475 16,510 528 284 812 12,563 4,759 17,322
Age
group
Formal Informal Total
Male Female Total Male Female Total Male Female Total
Agriculture, livestock, fishing etc 1,264 268 1,533 723 147 870 542 121 663
Auto mechanic or home appliance repair 1,480 240 1,720 833 148 981 648 91 739
Construction and other engineering 1,787 558 2,345 730 135 865 1,058 423 1,481
Manufacturing and mining 219 11 230 81 0 81 138 11 149
Information and technology 746 835 1,581 165 184 348 581 651 1,233
Business management, book-keeping, accounting etc 757 873 1,629 85 238 323 671 635 1,306
Health/Education services 2,502 1,993 4,496 1,006 742 1,748 1,497 1,251 2,748
Media and entertainment 38 60 98 0 0 0 38 60 98
Legal services 114 45 159 67 0 67 47 45 92
Secretarial, Clerical, General office 272 196 468 224 170 395 48 26 74
Hair dressing, Cosmetology 0 437 437 0 233 233 0 204 204
Restaurant, Culinary Arts, Hotel, Tourism 735 267 1,002 256 85 341 479 182 661
Public order and safety 7,344 308 7,652 2,495 0 2,495 4,849 308 5,157
Arts and crafts 475 540 1,015 158 203 361 317 337 654
Others 2,503 505 3,007 976 104 1,080 1,527 400 1,927
Don't know 123 13 136 0 0 0 123 13 136
Total 20,360 7,149 27,509 7,797 2,390 10,188 12,563 4,759 17,322
Bhutan UrbanRuralField of Training

Labour Force Survey Report 2015
124
Chapter 18:
Table 18.0: Number of economically inactive population by age group and reasons 2015
Age
groupIllness
Waiting for
recall from
previous job
Waiting
for
result
House/
Family
duties
Old agePhysically
challengedStudying
Other
reasonsTotal
15-19 20 0 62 13 0 98 34,423 51 34,667
20-24 62 71 112 215 0 255 12,086 241 13,042
25-29 52 90 185 160 0 116 2,162 147 2,913
30-34 13 13 0 122 0 213 849 42 1,252
35-39 17 31 0 132 0 175 274 230 859
40-44 18 15 0 73 0 102 142 82 431
45-49 18 0 0 73 0 67 13 56 228
50-54 111 0 0 59 0 245 96 235 746
55-59 362 0 0 1,622 0 247 0 1,446 3,676
60-64 172 0 0 717 2,117 424 0 107 3,537
65+ 423 0 0 0 12,675 1,232 116 344 14,790
Total 1,268 220 359 3,185 14,792 3,175 50,161 2,981 76,140
Age
groupIllness
Waiting for
recall from
previous job
Waiting
for
result
House/
Family
duties
Old agePhysically
challengedStudying
Other
reasonsTotal
15-19 36 0 111 313 0 203 37,874 54 38,591
20-24 46 13 880 3,088 0 198 9,016 153 13,394
25-29 12 44 1307 8,303 0 97 1,010 381 11,155
30-34 142 41 885 5,791 0 294 99 241 7,492
35-39 135 0 0 6,245 0 282 181 258 7,101
40-44 137 0 0 5,997 0 379 18 9 6,540
45-49 115 0 0 3,622 0 420 0 156 4,313
50-54 165 0 0 2,396 0 405 83 141 3,190
55-59 456 0 0 6,790 0 98 12 1,070 8,425
60-64 251 0 0 4,392 5,173 745 0 90 10,650
65+ 560 0 0 1,188 16,633 503 93 39 19,015
Total 2,054 98 3,183 48,125 21,806 3,624 48,386 2,590 129,867
Age
groupIllness
Waiting for
recall from
previous job
Waiting
for
result
House/
Family
duties
Old agePhysically
challengedStudying
Other
reasonsTotal
15-19 55 0 173 326 0 301 72,296 105 73,258
20-24 108 84 992 3,304 0 453 21,102 394 26,436
25-29 64 134 1492 8,463 0 214 3,172 528 14,068
30-34 155 54 885 5,913 0 507 947 283 8,744
35-39 152 31 0 6,377 0 458 455 487 7,960
40-44 155 15 0 6,069 0 481 160 91 6,971
45-49 133 0 0 3,695 0 487 13 212 4,541
50-54 276 0 0 2,454 0 650 179 376 3,936
55-59 818 0 0 8,411 0 345 12 2,515 12,101
60-64 422 0 0 5,108 7,290 1169 0 197 14,187
65+ 983 0 0 1,188 29,308 1,734 210 382 33,805
Total 3,322 318 3,542 51,310 36,598 6,799 98,547 5,571 206,007
18.0 (c): Reasons for economically inactive population - Both Male & Female
18.0 (a): Reasons for economically inactive population - Male
18.0 (b): Reasons for economically inactive population - Female

Labour Force Survey Report 2015
125
Table 18.1: Number of economically inactive population by age group, gender and reasons 2015
- Rural Bhutan
Age
groupIllness
Waiting
for
result
House/
Family
duties
Old agePhysically
challengedStudying
Other
reasonsTotal
15-19 0 62 0 0 85 24,191 0 24,339
20-24 0 0 135 0 211 8,295 135 8,776
25-29 0 67 0 0 104 1,694 0 1,865
30-34 0 0 0 0 153 754 0 906
35-39 0 0 74 0 175 226 184 659
40-44 0 0 0 0 62 142 0 204
45-49 0 0 0 0 67 0 0 67
50-54 85 0 0 0 245 79 135 545
55-59 347 0 1,282 0 238 0 1,219 3,086
60-64 163 0 560 1,721 352 0 74 2,869
65+ 342 0 0 11,066 1,147 104 283 12,941
Total 936 130 2,051 12,787 2,839 35,484 2,031 56,258
Age
groupIllness
Waiting
for
result
House/
Family
duties
Old agePhysically
challengedStudying
Other
reasonsTotal
15-19 0 0 93 0 172 25,909 0 26,174
20-24 0 422 866 0 153 5,314 0 6,754
25-29 0 530 3,656 0 67 632 135 5,021
30-34 96 153 1,655 0 266 0 0 2,171
35-39 79 0 1,779 0 221 79 104 2,262
40-44 59 0 3,167 0 322 0 0 3,548
45-49 0 0 1,176 0 420 0 0 1,596
50-54 104 0 1,113 0 405 67 0 1,689
55-59 404 0 5,639 0 79 0 823 6,945
60-64 232 0 4,121 4,210 716 0 74 9,354
65+ 494 0 1,170 14,285 448 93 0 16,490
Total 1,469 1,105 24,435 18,495 3,271 32,094 1,136 82,004
Age
groupIllness
Waiting
for
result
House/
Family
duties
Old agePhysically
challengedStudying
Other
reasonsTotal
15-19 0 62 93 0 257 50100 0 50,513
20-24 0 422 1,001 0 364 13,609 135 15,530
25-29 0 598 3,656 0 171 2,326 135 6,886
30-34 96 153 1,655 0 419 754 0 3,077
35-39 79 0 1,853 0 396 305 288 2,921
40-44 59 0 3,167 0 384 142 0 3,752
45-49 0 0 1,176 0 487 0 0 1,663
50-54 189 0 1,113 0 650 147 135 2,234
55-59 750 0 6,921 0 317 0 2042 10,031
60-64 395 0 4,680 5,931 1068 0 148 12,223
65+ 836 0 1,170 25,351 1,594 197 283 29,431
Total 2,405 1,235 26,486 31,281 6,110 67,578 3,166 138,262
18.1 (c): Reasons for economically inactive population - Both Male & Female
18.1 (a): Reasons for economically inactive population - Male
18.1 (b): Reasons for economically inactive population - Female
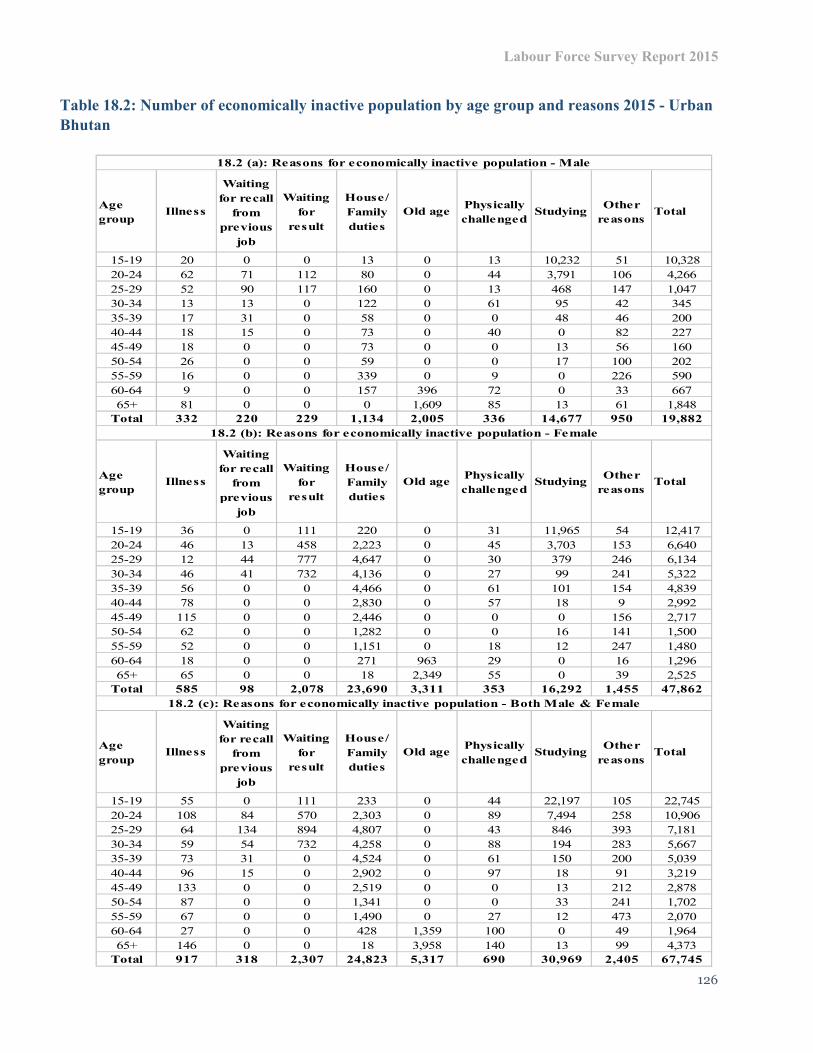
Labour Force Survey Report 2015
126
Table 18.2: Number of economically inactive population by age group and reasons 2015 - Urban
Bhutan
Age
groupIllness
Waiting
for recall
from
previous
job
Waiting
for
result
House/
Family
duties
Old agePhysically
challengedStudying
Other
reasonsTotal
15-19 20 0 0 13 0 13 10,232 51 10,328
20-24 62 71 112 80 0 44 3,791 106 4,266
25-29 52 90 117 160 0 13 468 147 1,047
30-34 13 13 0 122 0 61 95 42 345
35-39 17 31 0 58 0 0 48 46 200
40-44 18 15 0 73 0 40 0 82 227
45-49 18 0 0 73 0 0 13 56 160
50-54 26 0 0 59 0 0 17 100 202
55-59 16 0 0 339 0 9 0 226 590
60-64 9 0 0 157 396 72 0 33 667
65+ 81 0 0 0 1,609 85 13 61 1,848
Total 332 220 229 1,134 2,005 336 14,677 950 19,882
Age
groupIllness
Waiting
for recall
from
previous
job
Waiting
for
result
House/
Family
duties
Old agePhysically
challengedStudying
Other
reasonsTotal
15-19 36 0 111 220 0 31 11,965 54 12,417
20-24 46 13 458 2,223 0 45 3,703 153 6,640
25-29 12 44 777 4,647 0 30 379 246 6,134
30-34 46 41 732 4,136 0 27 99 241 5,322
35-39 56 0 0 4,466 0 61 101 154 4,839
40-44 78 0 0 2,830 0 57 18 9 2,992
45-49 115 0 0 2,446 0 0 0 156 2,717
50-54 62 0 0 1,282 0 0 16 141 1,500
55-59 52 0 0 1,151 0 18 12 247 1,480
60-64 18 0 0 271 963 29 0 16 1,296
65+ 65 0 0 18 2,349 55 0 39 2,525
Total 585 98 2,078 23,690 3,311 353 16,292 1,455 47,862
Age
groupIllness
Waiting
for recall
from
previous
job
Waiting
for
result
House/
Family
duties
Old agePhysically
challengedStudying
Other
reasonsTotal
15-19 55 0 111 233 0 44 22,197 105 22,745
20-24 108 84 570 2,303 0 89 7,494 258 10,906
25-29 64 134 894 4,807 0 43 846 393 7,181
30-34 59 54 732 4,258 0 88 194 283 5,667
35-39 73 31 0 4,524 0 61 150 200 5,039
40-44 96 15 0 2,902 0 97 18 91 3,219
45-49 133 0 0 2,519 0 0 13 212 2,878
50-54 87 0 0 1,341 0 0 33 241 1,702
55-59 67 0 0 1,490 0 27 12 473 2,070
60-64 27 0 0 428 1,359 100 0 49 1,964
65+ 146 0 0 18 3,958 140 13 99 4,373
Total 917 318 2,307 24,823 5,317 690 30,969 2,405 67,745
18.2 (c): Reasons for economically inactive population - Both Male & Female
18.2 (a): Reasons for economically inactive population - Male
18.2 (b): Reasons for economically inactive population - Female

Labour Force Survey Report 2015
127
Table 18.3: Number of economically inactive population by age group and education level 2015
- Bhutan
Age
group
No formal
educationPrimary
Lower
Secondary
Middle
Secondary
Higher
Secondary
Bachelor
Degree
Master
degree
& above
NFEReligious
ProfessionalsTotal
15-19 111 3,793 10,788 11,987 6,044 0 0 130 1,813 34,667
20-24 275 108 412 2,035 8,727 173 0 0 1,300 13,042
25-29 197 67 43 88 1,251 203 51 0 1,013 2,913
30-34 233 18 0 109 52 13 98 18 711 1,252
35-39 157 79 43 16 30 0 18 67 354 859
40-44 148 0 0 39 56 18 0 62 92 431
45-49 117 31 18 0 31 0 18 0 0 228
50-54 522 43 0 16 0 0 0 0 135 746
55-59 2,568 233 122 80 13 104 0 148 394 3,676
60-64 2,941 114 65 38 46 38 18 0 276 3,537
65+ 13,113 187 51 115 0 47 28 0 1,189 14,790
Total 20,381 4,672 11,543 14,521 16,250 596 232 427 7,277 76,140
Age
group
No formal
educationPrimary
Lower
Secondary
Middle
Secondary
Higher
Secondary
Bachelor
Degree
Master
degree
& above
NFEReligious
ProfessionalsTotal
15-19 326 4,367 10,921 14,657 8,198 0 0 31 91 38,591
20-24 1,387 428 680 2,465 7,808 280 0 207 59 13,394
25-29 4,472 771 1,073 2,014 1,820 415 147 444 0 11,155
30-34 3,586 814 712 1,181 453 163 31 522 0 7,492
35-39 4,702 548 414 721 139 13 0 564 0 7,101
40-44 5,352 455 215 154 26 0 0 310 0 6,540
45-49 3,315 157 250 154 26 31 0 381 0 4,313
50-54 2,665 74 66 295 26 0 0 46 18 3,190
55-59 8,137 45 0 58 0 13 0 141 0 8,425
60-64 10,309 110 0 16 0 28 0 114 74 10,650
65+ 18,816 61 0 81 31 0 13 0 0 19,015
Total 63,067 7,831 14,330 21,795 18,527 942 191 2,759 242 129,867
Age
group
No formal
educationPrimary
Lower
Secondary
Middle
Secondary
Higher
Secondary
Bachelor
Degree
Master
degree
& above
NFEReligious
ProfessionalsTotal
15-19 437 8,160 21,709 26,643 14,242 0 0 161 1,904 73,258
20-24 1,662 535 1,092 4,501 16,535 453 0 207 1,359 26,436
25-29 4,668 838 1,116 2,102 3,072 618 198 444 1,013 14,068
30-34 3,819 832 712 1,289 505 176 129 540 711 8,744
35-39 4,858 627 457 737 169 13 18 631 354 7,960
40-44 5,500 455 215 193 81 18 0 373 92 6,971
45-49 3,432 188 268 154 57 31 18 381 0 4,541
50-54 3,187 117 66 311 26 0 0 46 152 3,936
55-59 10,705 278 122 138 13 116 0 289 394 12,101
60-64 13,250 224 65 53 46 66 18 114 351 14,187
65+ 31,929 249 51 196 31 47 41 0 1,189 33,805
Total 83,448 12,503 25,873 36,316 34,776 1,538 423 3,186 7,519 206,007
18.3 (c): Level of education - Both Male & Female
18.3 (b): Level of education - Female
18.3 (a): Level of education - Male

Labour Force Survey Report 2015
128
Table 18.4: Number of economically inactive population by age group and education level 2015 -
Rural Bhutan
Age
group
No formal
educationPrimary
Lower
Secondary
Middle
Secondary
Higher
Secondary
Bachelor
Degree
Master
degree
& above
NFEReligious
ProfessionalsTotal
15-19 85 3,175 8,173 7,993 3,060 0 0 130 1,722 24,339
20-24 211 79 333 1,390 5,461 135 0 0 1,167 8,776
25-29 171 0 0 0 751 0 0 0 943 1,865
30-34 85 0 0 67 0 0 85 0 669 906
35-39 96 79 0 0 0 0 0 67 337 659
40-44 62 0 0 0 0 0 0 62 79 204
45-49 67 0 0 0 0 0 0 0 0 67
50-54 466 0 0 0 0 0 0 0 79 545
55-59 2,220 135 104 0 0 85 0 148 394 3,086
60-64 2,624 0 0 0 0 0 0 0 245 2,869
65+ 11,829 81 0 0 0 0 0 0 1,031 12,941
Total 17,917 3,550 8,610 9,451 9,272 220 85 408 6,665 56,258
Age
group
No formal
educationPrimary
Lower
Secondary
Middle
Secondary
Higher
Secondary
Bachelor
Degree
Master
degree
& above
NFEReligious
ProfessionalsTotal
15-19 172 3,804 8,108 9,822 4,193 0 0 0 74 26,174
20-24 477 201 451 1,373 3,899 135 0 79 59 6,754
25-29 2,083 299 641 773 857 135 85 147 0 5,021
30-34 1,163 240 302 252 135 0 0 79 0 2,171
35-39 1,827 104 0 159 0 0 0 172 0 2,262
40-44 3,285 128 67 0 0 0 0 67 0 3,548
45-49 1,278 0 85 85 0 0 0 148 0 1,596
50-54 1,469 0 0 220 0 0 0 0 0 1,689
55-59 6,871 0 0 0 0 0 0 74 0 6,945
60-64 9,108 67 0 0 0 0 0 104 74 9,354
65+ 16,409 0 0 81 0 0 0 0 0 16,490
Total 44,143 4,842 9,654 12,766 9,085 270 85 872 207 82,004
Age
group
No formal
educationPrimary
Lower
Secondary
Middle
Secondary
Higher
Secondary
Bachelor
Degree
Master
degree
& above
NFEReligious
ProfessionalsTotal
15-19 257 6,979 16,281 17,815 7,253 0 0 130 1,796 50,513
20-24 688 280 785 2,764 9,360 270 0 79 1,226 15,530
25-29 2,255 299 641 773 1,608 135 85 147 943 6,886
30-34 1,248 240 302 319 135 0 85 79 669 3,077
35-39 1,923 183 0 159 0 0 0 240 337 2,921
40-44 3,348 128 67 0 0 0 0 130 79 3,752
45-49 1,345 0 85 85 0 0 0 148 0 1,663
50-54 1,934 0 0 220 0 0 0 0 79 2,234
55-59 9,091 135 104 0 0 85 0 223 394 10,031
60-64 11,732 67 0 0 0 0 0 104 319 12,223
65+ 28,238 81 0 81 0 0 0 0 1,031 29,431
Total 62,059 8,392 18,264 22,217 18,356 491 170 1,280 6,873 138,262
18.4 (a): Level of education - Male
18.4 (b): Level of education - Female
18.4 (c): Level of education - Both Male & Female

Labour Force Survey Report 2015
129
Table 18.5: Number of economically inactive population by age group and education level 2015 -
Urban Bhutan
Age
group
No formal
educationPrimary
Lower
Secondary
Middle
Secondary
Higher
Secondary
Bachelor
Degree
Master
degree
& above
NFEReligious
ProfessionalsTotal
15-19 26 618 2,616 3,993 2,985 0 0 0 91 10,328
20-24 65 28 79 645 3,266 38 0 0 133 4,266
25-29 26 67 43 88 500 203 51 0 70 1,047
30-34 148 18 0 41 52 13 13 18 43 345
35-39 61 0 43 16 30 0 18 0 17 200
40-44 86 0 0 39 56 18 0 0 13 227
45-49 49 31 18 0 31 0 18 0 0 160
50-54 56 43 0 16 0 0 0 0 56 202
55-59 348 98 18 80 13 18 0 0 0 590
60-64 317 114 65 38 46 38 18 0 31 667
65+ 1,284 106 51 115 0 47 28 0 158 1,848
Total 2,464 1,122 2,933 5,070 6,978 376 147 18 612 19,882
Age
group
No formal
educationPrimary
Lower
Secondary
Middle
Secondary
Higher
Secondary
Bachelor
Degree
Master
degree
& above
NFEReligious
ProfessionalsTotal
15-19 154 563 2,812 4,835 4,005 0 0 31 17 12,417
20-24 910 227 229 1,092 3,909 145 0 128 0 6,640
25-29 2,388 472 432 1,240 963 280 62 296 0 6,134
30-34 2,423 575 411 929 318 163 31 442 0 5,322
35-39 2,874 444 414 562 139 13 0 391 0 4,839
40-44 2,067 327 148 154 26 0 0 243 0 2,992
45-49 2,037 157 165 68 26 31 0 233 0 2,717
50-54 1,196 74 66 75 26 0 0 46 18 1,500
55-59 1,266 45 0 58 0 13 0 67 0 1,480
60-64 1,201 43 0 16 0 28 0 9 0 1,296
65+ 2,407 61 0 0 31 0 13 0 0 2,525
Total 18,924 2,989 4,676 9,029 9,442 672 106 1,887 35 47,862
Age
group
No formal
educationPrimary
Lower
Secondary
Middle
Secondary
Higher
Secondary
Bachelor
Degree
Master
degree
& above
NFEReligious
ProfessionalsTotal
15-19 180 1,181 5,428 8,828 6,989 0 0 31 108 22,745
20-24 975 256 307 1,737 7,175 183 0 128 133 10,906
25-29 2,414 539 475 1,328 1,463 483 113 296 70 7,181
30-34 2,571 592 411 970 370 176 44 460 43 5,667
35-39 2,935 444 457 578 169 13 18 391 17 5,039
40-44 2,153 327 148 193 81 18 0 243 13 3,219
45-49 2,087 188 183 68 57 31 18 233 0 2,878
50-54 1,252 117 66 91 26 0 0 46 73 1,702
55-59 1,614 143 18 138 13 31 0 67 0 2,070
60-64 1,518 157 65 53 46 66 18 9 31 1,964
65+ 3,690 167 51 115 31 47 41 0 158 4,373
Total 21,388 4,111 7,609 14,099 16,420 1,048 253 1,905 647 67,745
18.5 (a): Level of education - Male
18.5 (b): Level of education - Female
18.5 (c): Level of education - Both Male & Female
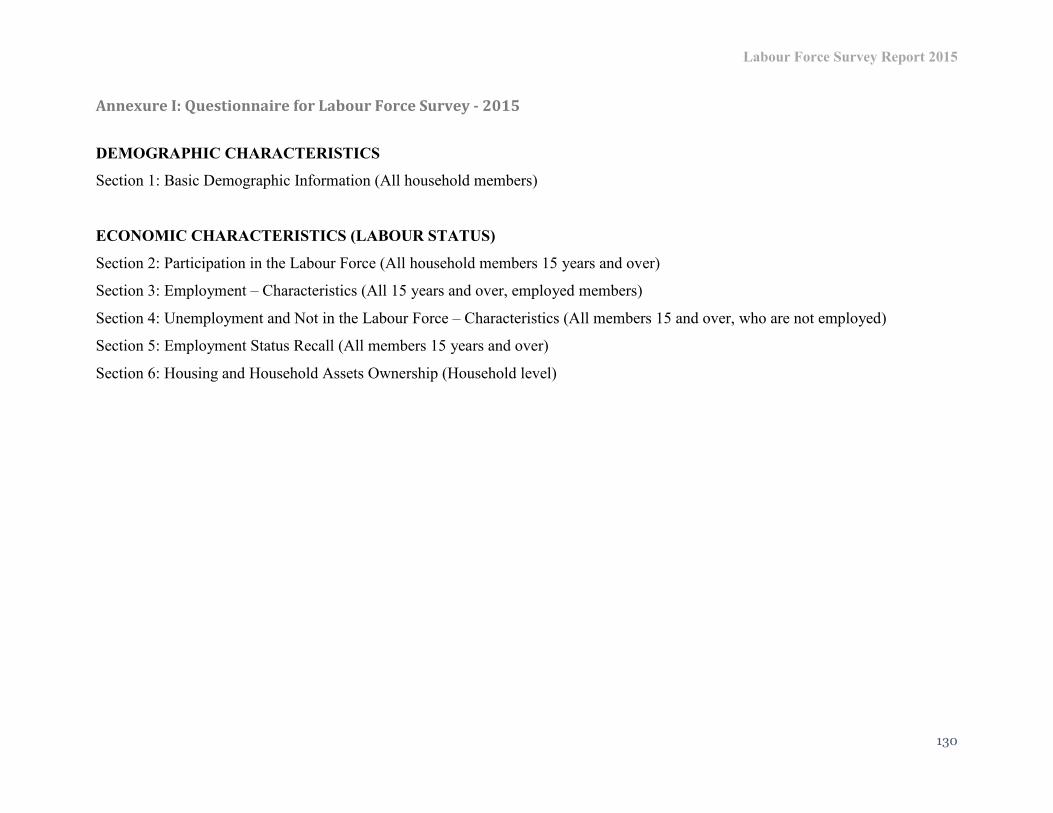
Labour Force Survey Report 2015
130
Annexure I: Questionnaire for Labour Force Survey - 2015
DEMOGRAPHIC CHARACTERISTICS
Section 1: Basic Demographic Information (All household members)
ECONOMIC CHARACTERISTICS (LABOUR STATUS)
Section 2: Participation in the Labour Force (All household members 15 years and over)
Section 3: Employment – Characteristics (All 15 years and over, employed members)
Section 4: Unemployment and Not in the Labour Force – Characteristics (All members 15 and over, who are not employed)
Section 5: Employment Status Recall (All members 15 years and over)
Section 6: Housing and Household Assets Ownership (Household level)

Labour Force Survey Report 2015
131
DEMOGRAPHIC CHARACTERISTICS
SECTION 1: BASIC DEMOGRAPHIC INFORMATION
Filter: All Household Members
1. Total household size ____ (Enter the number of household members)
2. Name of the household member
3. Resident Status: 1- Present, 2- Non present --Migrated for work, 3- Non present -- Other
4. Sex: 1-Male, 2-Female
5. Age in completed years
6. Relationship of household members to the household head: (Enter code)
Code: 1-Head, 2-Spouse, 3- Father/Mother, 4- Brother/Sister, 5- Son/Daughter 6- Other relative, 7-Non-relative
7. Marital Status: (Enter code)
Code: 1- Married, 2-Widowed, 3- Divorced/Separated, 4- Living together, 5- Never married
8. Nationality: 1- Bhutanese, 2- Non-Bhutanese
9. Does [NAME] have any chronic illness/disease or disability? 1- Yes, 2-No (if no, go to Q11)
10. If yes in Q9, what type of disability does [NAME] has? (Enter code, multiple answers allowed)
Code: 1- Difficulty seeing even when using glasses/contact lenses, 2- Difficulty in hearing even with a hearing aid,
3- Physical disability (as walking, climbing stairs, reaching, lifting or carrying), 4- Emotional or mental disability
11. Where was [NAME] born? (Enter Dzongkhag code, if abroad- give name of the country)
12. Prior to the current residence has [NAME] ever lived in different dzongkhag or country outside of Bhutan? 1-Yes, 2-No (If No,
go to Q 18)
13. For how many years has [NAME] been residing in the current location?

Labour Force Survey Report 2015
132
Codes: 1-Less than one year, 2- One to less than three years, 3- Three to less than five years, 4- Five years or more
14. What was [NAME]’s previous district of residence before moving here? (Enter Dzongkhag code. If abroad give name of the
country)
15. Where was [NAME]’s previous residence located? 1-Rural, 2- Urban
16. What was the main reason for movement? (Enter code)
Code: 1-Search of work, 2- To start new job, 3- To start new business, 4- Job transfer, 5- Marriage, 6- Education, 7- Training, 8-
Resettlement, 9-Natural disaster, 10- Health reason, 11- Family move
17. What was [NAME]’s labour status before the move? (Enter code)
Code: 1- Regular paid employee, 2- Casual paid employee, 3- Contract/piece paid worker, 4- Own-account worker(Non-Agriculture),
5 – Own-account worker (Agriculture), 6 – Family worker -(Non-Agriculture), 7- Family worker –(Agriculture), 8- Unemployed, 9-
Not in labour force (For codes 8-9 go to Q.19), 99- Don’t know
18. What was [NAME]’s occupation before the move? (Enter occupation code)
19. What is [NAME]’s highest education grade completed? (Enter code)
Code: 00-Illiterate, 01-12 – Class I to Class XII, 13- Undergraduate, 15- Bachelor Degree, 16- Masters degree and above, 20-
PP/Nursery, 21- Non-formal attended, 22- Lama/Gaylong/Gomchen/Anims,
99- Don’t know [if age less than 6 years, go to next member]
If grade is 00 then go to Q21; if grade is equal to or less than 10 and equal to 16, 21 and 22 then go to Q24; if grade is 11 and 12 go
to Q22; if grade is 15 & 16, go to Q23, if ‘Don’t know’ go to Q24.
20. Which year did [NAME] complete the grade? (Enter ‘99’ for Don’t know)
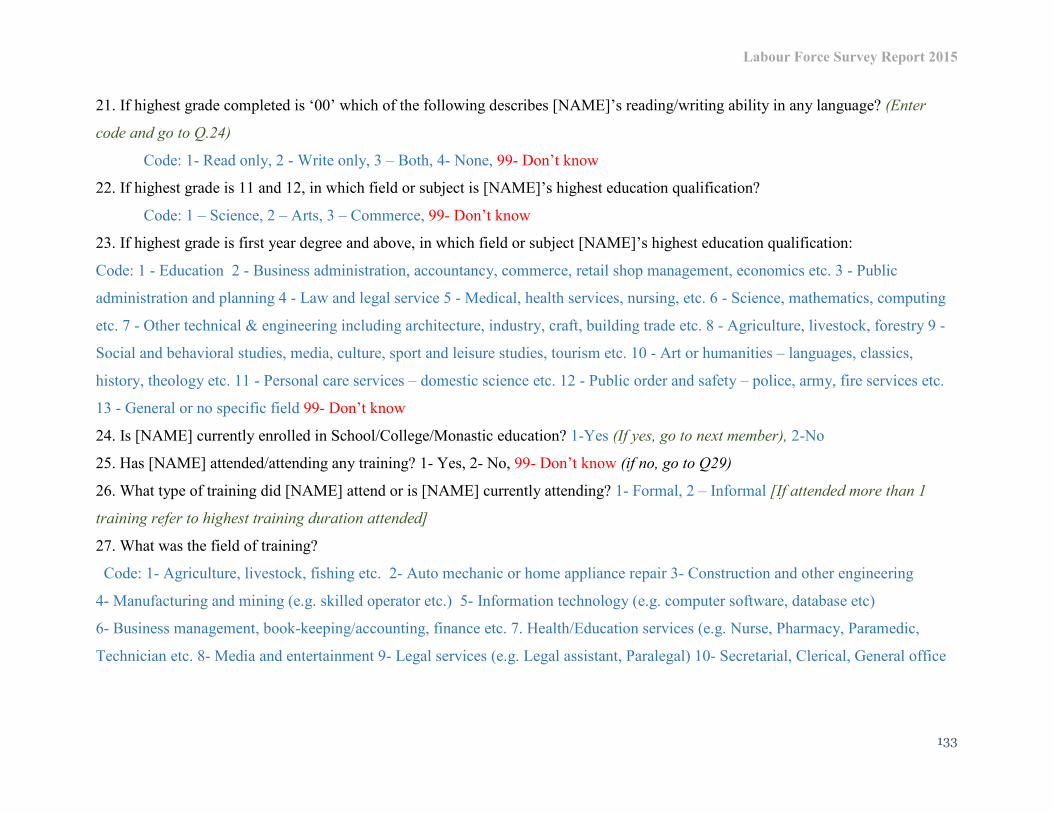
Labour Force Survey Report 2015
133
21. If highest grade completed is ‘00’ which of the following describes [NAME]’s reading/writing ability in any language? (Enter
code and go to Q.24)
Code: 1- Read only, 2 - Write only, 3 – Both, 4- None, 99- Don’t know
22. If highest grade is 11 and 12, in which field or subject is [NAME]’s highest education qualification?
Code: 1 – Science, 2 – Arts, 3 – Commerce, 99- Don’t know
23. If highest grade is first year degree and above, in which field or subject [NAME]’s highest education qualification:
Code: 1 - Education 2 - Business administration, accountancy, commerce, retail shop management, economics etc. 3 - Public
administration and planning 4 - Law and legal service 5 - Medical, health services, nursing, etc. 6 - Science, mathematics, computing
etc. 7 - Other technical & engineering including architecture, industry, craft, building trade etc. 8 - Agriculture, livestock, forestry 9 -
Social and behavioral studies, media, culture, sport and leisure studies, tourism etc. 10 - Art or humanities – languages, classics,
history, theology etc. 11 - Personal care services – domestic science etc. 12 - Public order and safety – police, army, fire services etc.
13 - General or no specific field 99- Don’t know
24. Is [NAME] currently enrolled in School/College/Monastic education? 1-Yes (If yes, go to next member), 2-No
25. Has [NAME] attended/attending any training? 1- Yes, 2- No, 99- Don’t know (if no, go to Q29)
26. What type of training did [NAME] attend or is [NAME] currently attending? 1- Formal, 2 – Informal [If attended more than 1
training refer to highest training duration attended]
27. What was the field of training?
Code: 1- Agriculture, livestock, fishing etc. 2- Auto mechanic or home appliance repair 3- Construction and other engineering
4- Manufacturing and mining (e.g. skilled operator etc.) 5- Information technology (e.g. computer software, database etc)
6- Business management, book-keeping/accounting, finance etc. 7. Health/Education services (e.g. Nurse, Pharmacy, Paramedic,
Technician etc. 8- Media and entertainment 9- Legal services (e.g. Legal assistant, Paralegal) 10- Secretarial, Clerical, General office

Labour Force Survey Report 2015
134
11- Hair dressing, Cosmetology 12- Tourism and Hospitality 13- Public order and safety (e.g. Police, Army, Fire Services etc.) 14-
Arts and crafts (e.g. tailoring, weaving, painting, etc) 15- Others, please specify 99- Don’t know
28. What was the duration of training? (Enter code)
Code: 1- Less than one month, 2- One month to less than six months, 3- Six months to less than one year, 4- One year to less than two
years, 5- Two years and above
29. What was the highest level of training completed? (Enter code)
Code: 1- PG Diploma/Certificate, 2- Diploma, 3- Certificate, 4-Without certificate
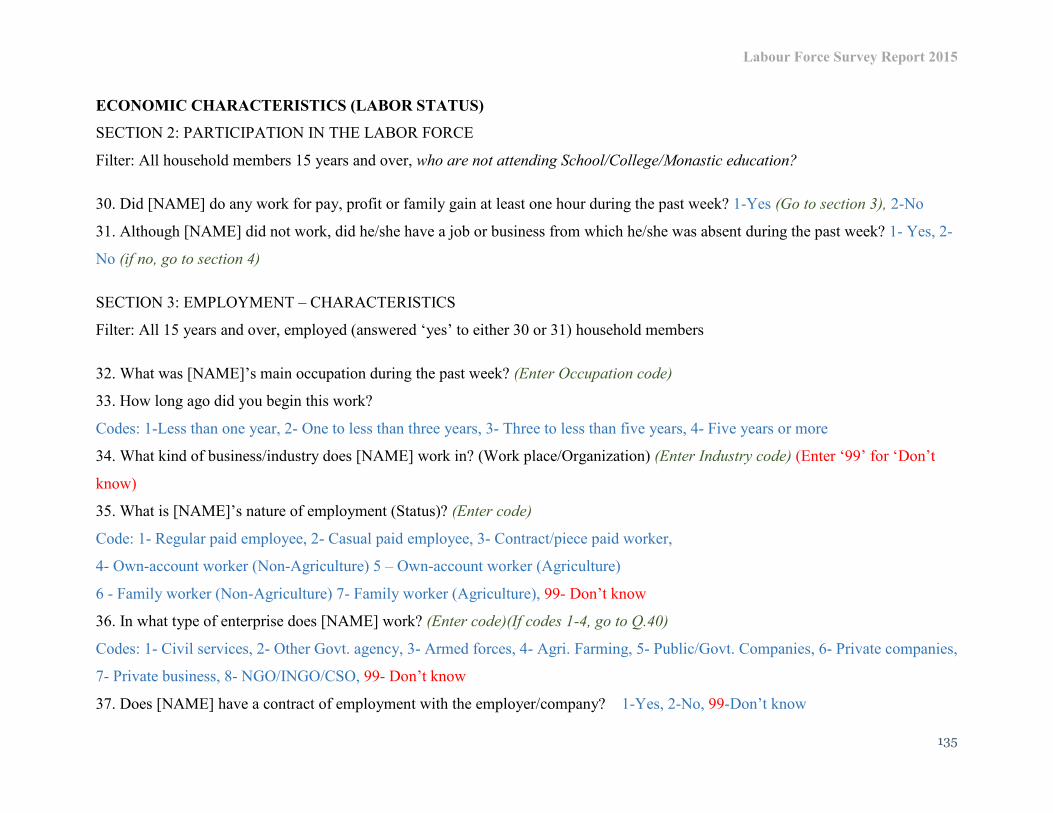
Labour Force Survey Report 2015
135
ECONOMIC CHARACTERISTICS (LABOR STATUS)
SECTION 2: PARTICIPATION IN THE LABOR FORCE
Filter: All household members 15 years and over, who are not attending School/College/Monastic education?
30. Did [NAME] do any work for pay, profit or family gain at least one hour during the past week? 1-Yes (Go to section 3), 2-No
31. Although [NAME] did not work, did he/she have a job or business from which he/she was absent during the past week? 1- Yes, 2-
No (if no, go to section 4)
SECTION 3: EMPLOYMENT – CHARACTERISTICS
Filter: All 15 years and over, employed (answered ‘yes’ to either 30 or 31) household members
32. What was [NAME]’s main occupation during the past week? (Enter Occupation code)
33. How long ago did you begin this work?
Codes: 1-Less than one year, 2- One to less than three years, 3- Three to less than five years, 4- Five years or more
34. What kind of business/industry does [NAME] work in? (Work place/Organization) (Enter Industry code) (Enter ‘99’ for ‘Don’t
know)
35. What is [NAME]’s nature of employment (Status)? (Enter code)
Code: 1- Regular paid employee, 2- Casual paid employee, 3- Contract/piece paid worker,
4- Own-account worker (Non-Agriculture) 5 – Own-account worker (Agriculture)
6 - Family worker (Non-Agriculture) 7- Family worker (Agriculture), 99- Don’t know
36. In what type of enterprise does [NAME] work? (Enter code)(If codes 1-4, go to Q.40)
Codes: 1- Civil services, 2- Other Govt. agency, 3- Armed forces, 4- Agri. Farming, 5- Public/Govt. Companies, 6- Private companies,
7- Private business, 8- NGO/INGO/CSO, 99- Don’t know
37. Does [NAME] have a contract of employment with the employer/company? 1-Yes, 2-No, 99-Don’t know

Labour Force Survey Report 2015
136
38. Does the enterprise keep the following records? Codes: 1-Yes, 2-No, 99-Don’t know
1. Wage records 2. Attendance records 3. Accident records
39. Does [NAME]’s job entitle him/her to any of the following benefits? Codes: 1-Yes, 2-No, 99-Don’t know
1. Gratuity 2. Provident fund 3. Overtime payments 4. Leave system 5. Weekly rest period 8.
Compensation for injury, disability or death due to work accidents or occupational disease
40. How many hours in total did [NAME] work during the past one week for his/her primary job? ___ hours
41. What is [NAME]’s average monthly earnings (Nu.) for primary job? Nu______ (Enter Amount, Ask only to paid employees and
own-account workers)
42. Besides main job, did [NAME] look for/have additional work during the past week? 1-Yes, 2-No
(If ‘no’ and hours worked in primary job is more than 48 hours, go to Q47. If ‘no’ and hours worked in primary job is less than 35
hours, go to Q48.)
43. What are the reasons for seeking/having an additional work? (Enter code)
Codes: 1- Want more income, 2- Want more hours of work, 3- Main job does not match with qualification/training, 4- Others, specify
44. How many other jobs did [NAME] have during the past week? (Enter no. of other jobs besides ‘main job’)
45. What is [NAME]’s average monthly earnings (Nu.) for all additional jobs? Nu______ (Enter Amount) Note: This should NOT
include earnings from Primary Job
46. What is the total number of hours worked in additional jobs during the past week?
(If hours worked in the past week (for both Main + Additional jobs) is more than 48 hours, go to Q47) (If hours worked in the past
week (for both Main + Additional works) is less than 35 hours, go to Q48)
47. Reasons for working more than 48 hours during the past week (Enter code)
Code: 1- Wanted more earnings, 2- Requirement of the job, 3- Exceptional week, 4- Others, specify [Go to Section 5]
48. Would [NAME] prefer to work more hours? 1- Yes, 2-No, 99- Don’t know [If “no” or “Don’t know”, go to Section 5]
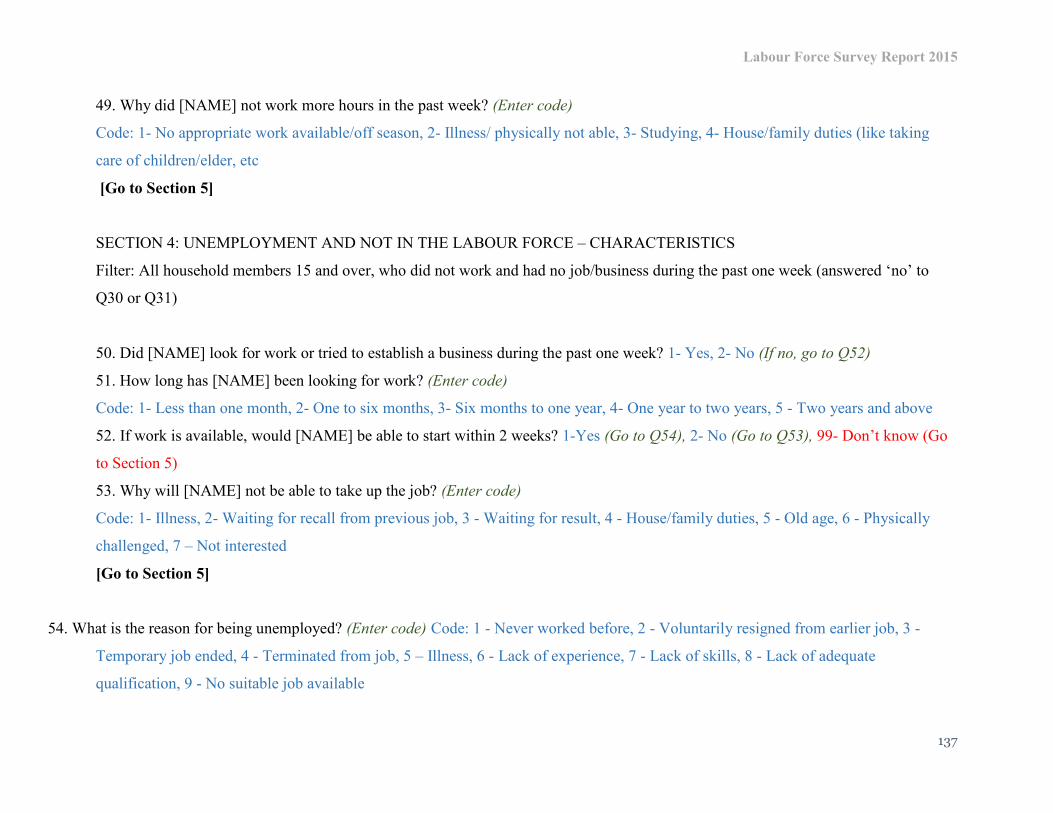
Labour Force Survey Report 2015
137
49. Why did [NAME] not work more hours in the past week? (Enter code)
Code: 1- No appropriate work available/off season, 2- Illness/ physically not able, 3- Studying, 4- House/family duties (like taking
care of children/elder, etc
[Go to Section 5]
SECTION 4: UNEMPLOYMENT AND NOT IN THE LABOUR FORCE – CHARACTERISTICS
Filter: All household members 15 and over, who did not work and had no job/business during the past one week (answered ‘no’ to
Q30 or Q31)
50. Did [NAME] look for work or tried to establish a business during the past one week? 1- Yes, 2- No (If no, go to Q52)
51. How long has [NAME] been looking for work? (Enter code)
Code: 1- Less than one month, 2- One to six months, 3- Six months to one year, 4- One year to two years, 5 - Two years and above
52. If work is available, would [NAME] be able to start within 2 weeks? 1-Yes (Go to Q54), 2- No (Go to Q53), 99- Don’t know (Go
to Section 5)
53. Why will [NAME] not be able to take up the job? (Enter code)
Code: 1- Illness, 2- Waiting for recall from previous job, 3 - Waiting for result, 4 - House/family duties, 5 - Old age, 6 - Physically
challenged, 7 – Not interested
[Go to Section 5]
54. What is the reason for being unemployed? (Enter code) Code: 1 - Never worked before, 2 - Voluntarily resigned from earlier job, 3 -
Temporary job ended, 4 - Terminated from job, 5 – Illness, 6 - Lack of experience, 7 - Lack of skills, 8 - Lack of adequate
qualification, 9 - No suitable job available

Labour Force Survey Report 2015
138
55. What steps have [NAME] taken in search of job? (Enter max. 3 codes)
Code: 1- Registered with MoLHR, 2- Approached employer directly, 3- Sought assistance from relatives/friend, 4-Applied for
training, 5- Internships, 6- Want to start own business
56. What type of occupation does [NAME] prefer? (Enter Occupation code)
57. Why does [NAME] prefer that occupation? (Enter max. 3 codes )
Code: 1- High salary and benefits, 2- Education, training and skills are aligned with that occupation, 3- Good reputation in the society,
4- Personal interests are aligned with that occupation, 5- Flexibility in terms of time management
58. In what type of enterprise would [NAME] like to work? (Enter code)
Codes: 1- Civil services, 2- Other Govt. agency, 3- Armed forces, 4- Agri. Farming, 5- Public/Govt. Companies, 6- Private companies,
7- Private business, 8- NGO/INGO/CSO, 99- Don’t know
59. Why does [NAME] prefer that type of enterprise? (Enter max. 3 codes )
Code: 1- High salary, 2- Better working conditions, 3- Better working environment, 4- Good reputation in the society, 5- Personal
interests are aligned with that enterprise
60. Is there any private sector opportunity available that [NAME] is not taking up to wait for a government job? 1-Yes, 2-No, 99-
Don’t know (If no or don’t know, go to Q62)
61. Why does not [NAME] prefer to take up private sector jobs? (Enter max 3 codes)
Code: 1- Lack of job security, 2- Lack of better working conditions, 3- Inadequate salary, 4-Lack or non-existence of private sector
jobs for my qualification, 5- Unpleasant work environment
62. What is the minimum monthly remuneration expected (Nu.) for available work? (Enter ‘99’ for ‘Don’t know’)
63. Did [NAME] work any time before? 1-Yes, 2- No (If no, go to Section 5)
64. What was [NAME]’s last occupation? (Enter occupation code) (Enter ‘99’ for ‘Don’t know’)
65. In what type of enterprise did [NAME] work for the last job/work? (Enter code)
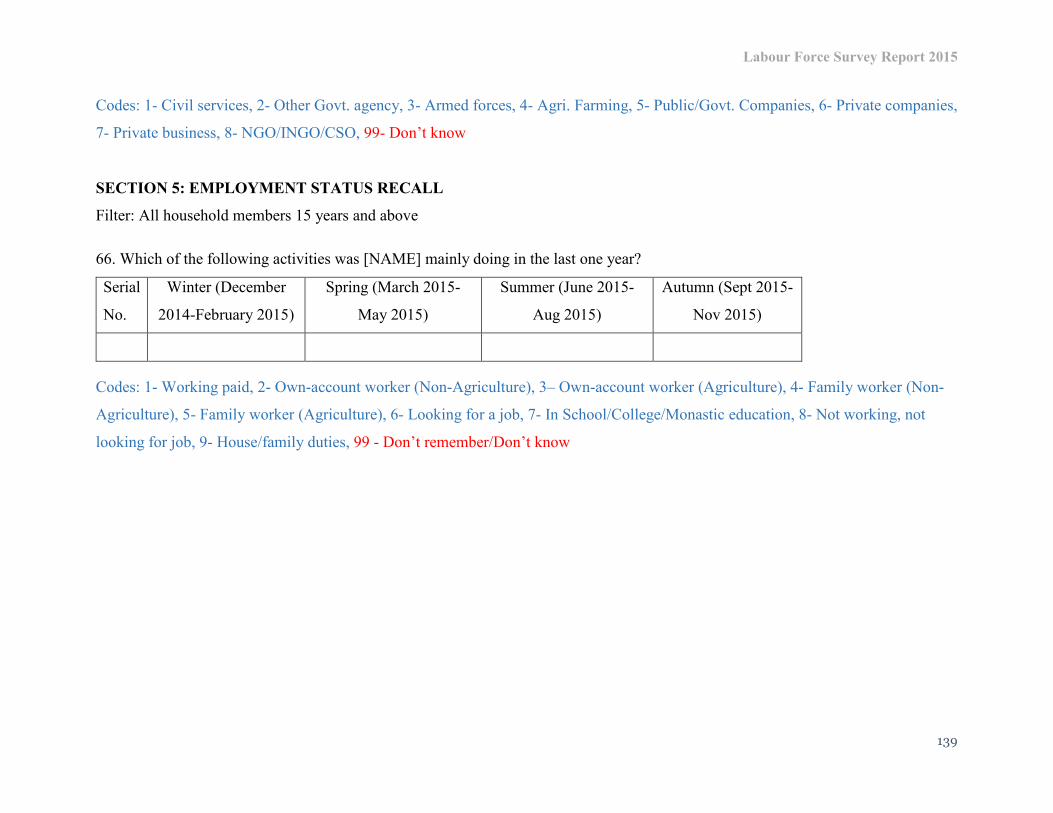
Labour Force Survey Report 2015
139
Codes: 1- Civil services, 2- Other Govt. agency, 3- Armed forces, 4- Agri. Farming, 5- Public/Govt. Companies, 6- Private companies,
7- Private business, 8- NGO/INGO/CSO, 99- Don’t know
SECTION 5: EMPLOYMENT STATUS RECALL
Filter: All household members 15 years and above
66. Which of the following activities was [NAME] mainly doing in the last one year?
Serial
No.
Winter (December
2014-February 2015)
Spring (March 2015-
May 2015)
Summer (June 2015-
Aug 2015)
Autumn (Sept 2015-
Nov 2015)
Codes: 1- Working paid, 2- Own-account worker (Non-Agriculture), 3– Own-account worker (Agriculture), 4- Family worker (Non-
Agriculture), 5- Family worker (Agriculture), 6- Looking for a job, 7- In School/College/Monastic education, 8- Not working, not
looking for job, 9- House/family duties, 99 - Don’t remember/Don’t know

Labour Force Survey Report 2015
140
SECTION 6: HOUSING AND HOUSEHOLD ASSETS OWNERSHIP
Filter: Household level questions answered by the respondent (preferably household head)
67. Type of dwelling (Enter code)
Code: 1-House, 2-Part of a house, 3-Separate apartment, 4- Shared apartment
68. Does the household own the dwelling? 1- Yes, 2-No
69. Does the household have electricity? 1-Yes from the grid, 2- Yes from solar, 3- No
70. What fuel does the household use most often for cooking?
Code: 1-Gas, 2- Bio gas, 3-Electricity, 4-Wood, 5- Kerosene
71. How does the household usually heat/cool the dwelling?
Code: 1- Bukhari, 2- Electric heater, 3- Kerosene heater, 4- Traditional stove (Thab), 5- Does not heat/cool the dwelling,
72. Livestock and Poultry (Indicate the number of animals. Write ‘0’ if none)
I. Pigs___ (ii) Cattle___ (iii)Yaks___ (iv)Buffaloes___ (v)Horses____ (vi) Sheep___ (vii) Goats___ (viii) Chickens___
73. Does the household own the following items? (Consider only the items that are in working condition) 1- Yes (acquired less than a
year ago), 2- Acquired a year or more ago, 3- No
(i) Sofa set? (ii) Furniture? (iii) Heater? (iv) Bukhari? (v) Fan? (vi) Choesham? (vii) Mobile phone? (viii) Bicycle? (ix) Rice cooker?
(x) Curry cooker? (xi) Water boiler? (xii) Refrigerator? (xiii) Modern stove? (xiv) Microwave oven? (xv) Camera/video camera? (xvi)
Radio/cassette/CD player? (xvii) Television? (xviii)VCR/VCD/DVD player? (xix) Computer/Laptop? (xx) Rice grinding machine?
(xxi) Jewelry? (xxii) Dish antenna/decoder? (xxiii) Lamps/petromax? (xxiv) Foreign bow? (xxv) Electric Iron? (xxvi) Sewing
machine? (xxvii) Washing machine? (xxviii) Tractor? (xxix) Bike/Scooter? (xxx) Family car?
74. Land (Indicate number of acres, Write ‘0’ if none)
(i) Orchard _____.__ acres (ii) Wet land (Total) ____.__
(iii) Wet operated (Total) ____.__ acres (iv) Dry land (Total) ____.__ acres

Labour Force Survey Report 2015
141
(v) Dry land (Operated) ____.__ acres (vi) Other land (grass land etc.) ____.__ acres
75. How much cash in Nu. (worth of cash, if it is in kind) did the household receive as remittance or gift during last 1 year? (Enter
‘99’ for ‘Don’t know’)
76. How much cash in Nu. (worth of cash if it is in kind) did the household send as remittance or gift during last 1 year? (Enter ‘99’
for ‘Don’t know’)

Labour Force Survey Report 2015
142
Annexure II: Genesis of the Report
1. Overall Management:
- Sherab Tenzin, Director General
Department of Employment
Ministry of Labour and Human Resources
2. Overall Survey Coordinator - Ugyen Tenzin, Chief Statistical Officer
Labour Market Information and Research Division
Department of Employment
Ministry of Labour and Human Resources
3. Questionnaire Design:
- Dechen Dema, Asst. Research Officer
4. Survey Training Coordinator:
- Gayduen Wangdi, Research Officer
5. Sample Design:
- Tandin Dorji, Sr. Statistical Officer
- Dechen Dema, Asst. Research Officer
6. Field Operation:
- Tandin Dorji, Sr. Statistical Officer
- Gayduen Wangdi, Research Officer
- Dechen Dema, Asst. Research Officer
- Singye Dorji, ICT Division, Thimphu Head Office
- Nanda Kr. Mongar, ICT Division, Thimphu Head Office
- Tshering Pem, ICT Division, Thimphu Head Office
- Karma, Labour Officer, RELO, Trashigang
- Karma Yonten, Labour Officer, RELO, Trashigang
- Bhim Bdr. Chhetri, Labour Officer, RELO, Gelephu
- Penjor, Labour Officer, RELO, Gelephu
- Chumo Wangmo, Employment Officer, RELO, Phuentsholing
- Sangay Dorji, Dy. Chief Employment Officer, RELO, Samdrup Jongkhar
7. Data Processing:
- Dechen Dema, Asst. Research Officer
8. Compilation: - Ugyen Tenzin, Chief Statistical Officer
- Dechen Dema, Asst. Research Officer
9. Administration and Finance:
- Gaydeun Wangdi, Research Officer
Related Documents