Medical labour force 2006

Welcome message from author
This document is posted to help you gain knowledge. Please leave a comment to let me know what you think about it! Share it to your friends and learn new things together.
Transcript
Medical labour force
2006

The Australian Institute of Health and Welfare is Australia’s national health and welfare statistics and information agency. The Institute’s mission is better information and statistics for better health and wellbeing.
Please note that as with all statistical reports there is the potential for minor revisions of data in this report over its life. Please refer to the online version at <www.aihw.gov.au>.
NATIONAL HEALTH LABOUR FORCE SERIES Number 41
Medical labour force
2006
October 2008
Australian Institute of Health and Welfare Canberra
Cat. no. HWL 42
© Australian Institute of Health and Welfare 2008 This work is copyright. Apart from any use as permitted under the Copyright Act 1968, no part may be reproduced without prior written permission from the Australian Institute of Health and Welfare. Requests and enquiries concerning reproduction and rights should be directed to the Head, Media and Communications Unit, Australian Institute of Health and Welfare, GPO Box 570, Canberra ACT 2601. This publication is part of the Australian Institute of Health and Welfare’s National health labour force series. A complete list of the Institute’s publications is available from the Institute’s website <www.aihw.gov.au>. ISSN 1327-4309 ISBN 978 1 74024 836 5
Suggested citation
Australian Institute of Health and Welfare 2008. Medical labour force 2006. National health labour force series no. 41. Cat. no. HWL 42. Canberra: AIHW.
Australian Institute of Health and Welfare
Board Chair Hon. Peter Collins, AM, QC Director Penny Allbon Any enquiries about or comments on this publication should be directed to: David Braddock Australian Institute of Health and Welfare GPO Box 570 Canberra ACT 2601 Phone: (02) 6244 1136 Email: [email protected] Published by the Australian Institute of Health and Welfare Printed by Pirion
v
Contents
Acknowledgments.............................................................................................................................. vi Abbreviations.....................................................................................................................................vii Symbols and other usages ...............................................................................................................vii Summary ........................................................................................................................................... viii 1 Introduction....................................................................................................................................1
1.1 Medical practitioners in Australia ........................................................................................1 1.2 AIHW Medical Labour Force Survey...................................................................................2 1.3 Other sources of data on medical practitioners ..................................................................4 1.4 Additional information ..........................................................................................................4
2 Registered medical practitioners................................................................................................5 3 Medical practitioners employed in medicine ..........................................................................8
3.1 Age and sex..............................................................................................................................8 3.2 Aboriginal and Torres Strait Islander medical practitioners ............................................8 3.3 Field of medicine...................................................................................................................10 3.4 Country of first medical qualification ................................................................................16 3.5 Working hours.......................................................................................................................17 3.6 Work setting and sector .......................................................................................................20
4 Supply of practitioners...............................................................................................................22 4.1 Overall supply .......................................................................................................................22 4.2 Supply of clinicians...............................................................................................................23
5 Regional comparisons ................................................................................................................24 5.1 Remoteness Areas .................................................................................................................24 5.2 States and territories .............................................................................................................30
Appendix A: Explanatory notes on the AIHW Medical Labour Force Survey ...................34 Appendix B: Medical practitioner registration numbers........................................................45 Appendix C: Medicare data ..........................................................................................................48 Appendix D: 2006 Census of Population and Housing data ..................................................52 Appendix E: National public hospital establishments data ..................................................55 Appendix F: Additional information available from the AIHW website...........................57 Appendix G: Population estimates..............................................................................................59 Glossary................................................................................................................................................61 References............................................................................................................................................66 List of tables ........................................................................................................................................68 List of figures ......................................................................................................................................69
vi
Acknowledgments
This report was prepared by Brendan Brady, Janice Miller and Felicity Summers, with assistance from Andrew Powierski and guidance from David Braddock, all of the Labour Force Unit of the Australian Institute of Health and Welfare (AIHW).
We thank each state and territory medical board and health authority that provided data used in this report. Most importantly, we also thank the medical practitioners who took the time to complete the survey. Without their cooperation, it would not be possible to maintain this collection, which is used to underpin planning and policy decisions.
Comments and suggestions from the Health Workforce Principal Committee’s Jurisdictional Workforce Planners Working Group were also gratefully received. The AIHW would also like to acknowledge the funding and assistance provided by the National Health Workforce Taskforce for this report.
vii
Abbreviations
ABS Australian Bureau of Statistics AHMAC Australian Health Ministers Advisory Council AIHW Australian Institute of Health and Welfare AMWAC Australian Medical Workforce Advisory Committee ANZSCO Australian and New Zealand Standard Classification of Occupations ASGC Australian Standard Geographical Classification CMO career medical officer DoHA Department of Health and Ageing FTE full-time equivalent FWE full-time workload equivalent GP general practitioner HMO hospital medical officer ICR Intelligent Character Recognition MLFS Medical Labour Force Survey NPHED National Public Hospital Establishments Database PGY post-graduation year RA Remoteness Area RACGP Royal Australian College of General Practitioners RMO resident medical officer TRD temporary resident doctor VMO visiting medical officer VRGP vocationally registered general practitioner
Symbols and other usages
Throughout this publication, data from the AIHW Medical Labour Force Surveys may not add to the totals shown due to the estimation process used for non-responses (see Appendix A). As a result, numbers of practitioners may be in fractions, but are rounded to whole numbers for publication. Percentages are calculated on the unrounded figures. Where tables contain a ‘not stated’ category, percentage calculations exclude this category. Percentage distributions may not sum to 100 due to rounding.
Italics within a table denote a subtotal. — Nil or rounded to zero . . Not applicable n.a. Not available n.p. Not publishable. Cells may be suppressed for confidentiality reasons or where estimates are based on small cells, resulting in low reliability.
viii
Summary In 2006, there were an estimated 71,740 medical practitioners registered in Australia and most of these (62,425 or 87.0%) were working in medicine in Australia. The other 13.0% were on extended leave, not working, working in an area other than medicine or working in medicine overseas. The number of employed medical practitioners in 2006 was 15.6% higher than in 2002 (62,425 compared with 53,991 respectively). In 2006, 93.2% were working as clinicians, of whom 39.5% were primary care practitioners, followed by specialists (34.8%), specialists-in-training (13.1%), hospital non-specialists (11.3%) and other clinicians (1.3%). The average age of practitioners in the medical workforce in 2006 was 46.1 years, compared with 46.6 years in 2002. Females continue to increase their share of the medical practitioner workforce. In 2006, 33.7% of medical practitioners were female, compared with 31.6% in 2002. Among clinicians, the female share varies between types of clinical practice. In 2006, of those working as clinicians, females represented 49.0% of hospital non-specialists compared with 40.9% of specialists-in-training and 21.6% of specialists. Medical practitioners who identified themselves as Aboriginal or Torres Strait Islander represented about 0.3% of medical practitioners employed in medicine in 2006. Medical practitioners worked an average of 43.3 hours per week in 2006, a decrease from 44.4 hours per week in 2002. In 2006, on average, 39.9 hours were in clinical work, about the same as in 2002 (39.6 hours). Female medical practitioners worked fewer hours, on average, than their male counterparts (37.6 compared with 46.2 hours per week). Over one-fifth (22.8%) of employed medical practitioners obtained their first medical qualification overseas. Despite a decrease in average hours worked from 2002 to 2006, the supply of employed medical practitioners increased from 271 to 290 FTE medical practitioners per 100,000 population over that period due to an overall increase in numbers. Among clinicians working in primary care there was a decrease in supply between 2002 and 2006, from 101 to 97 FTE per 100,000 population. The supply of specialists-in-training increased from 31 to 41 FTE per 100,000 population over the same period. In 2006, the largest supply of employed medical practitioners was in Major Cities at 332 FTE per 100,000 population, followed by Inner Regional Australia at 184 FTE per 100,000 and Outer Regional Australia at 154 FTE per 100,000. In contrast, the variation in the supply of primary care practitioners was smaller across Major Cities, Inner and Outer Regional Australia (98, 87 and 86 FTE per 100,000 respectively). This information on the medical practitioner labour force is based primarily on estimates derived from the 2006 Australian Institute of Health and Welfare (AIHW) Medical Labour Force Survey. This survey collects information on the demographic and employment characteristics of medical practitioners registered in Australia. It is conducted annually by state and territory health departments, with the questionnaire administered by the medical boards in each jurisdiction, in conjunction with the registration renewal process.
The national survey response rate was 70.2%. Survey data for 2006 were not available for the Northern Territory. Estimates for the Northern Territory were derived from responses to the 2007 Medical Labour Force Survey, weighted to the 2006 number of registered medical practitioners (known as ‘benchmarks’ in this report), resulting in a response rate equivalent to 28.6%. As such, the Northern Territory estimates should be treated with caution.
ix
The estimates in this report may vary from workforce estimates produced by individual jurisdictions as the AIHW takes account of those medical practitioners apparently employed in more than one jurisdiction, and because of differences in imputation and estimation processes.

1
1 Introduction
This report provides data on the Australian medical labour force in 2006. The primary source of estimates presented in this report is the 2006 AIHW Medical Labour Force Survey, in which medical practitioners renewing their registration were asked a range of demographic and labour force questions. Where the data allow, the report also provides some comparisons of 2006 estimates with estimates derived from surveys in previous years. Registration data, data on salaried medical practitioners in public hospitals, Medicare data on general practitioners and data on medical practitioners obtained from the 2006 Census of Population and Housing are also presented to provide additional and comparative information on the medical workforce.
The report is arranged according to the following structure. Chapter 1 describes the role of medical practitioners, briefly describes the AIHW Medical Labour Force Survey and directs readers to further information on other medical labour force data sources. Chapter 2 describes the medical practitioner labour force, including their clinical or non-clinical role and labour force status. Chapter 3 examines various characteristics of the medical labour force including age and sex, field of medicine, country of first qualification, working hours and work setting. Chapter 4 describes overall supply and the supply of clinicians. Chapter 5 includes regional comparisons for the Australian Standard Geographical Classification (ASGC) areas and states and territories. The appendices contain explanatory notes and further information and comparison with other medical labour force data sources.
1.1 Medical practitioners in Australia Medical practitioners diagnose physical and mental illnesses, disorders and injuries, provide medical care to patients, and prescribe and perform medical and surgical treatments to promote and restore good health (ABS 2006a). They may be clinicians, who include primary care practitioners (mostly general practitioners (GPs)), hospital non-specialists, specialists-in-training, specialists and other clinicians. Medical practitioners may also be non-clinicians, and work as administrators, teachers/educators, researchers, public health physicians or occupational health physicians (See Glossary).
Medical practitioners undertake several years of on-the-job training once they have completed their medical studies at university. Initial training is undertaken as an intern and then as a resident medical officer, usually in the public hospital system. After this initial training most medical practitioners go on to undertake further more specialised training as a GP or a specialist in one of the large range of recognised medical specialities. Apart from GPs, most of this vocational training is undertaken in the public hospital system. GP trainees undertake their training in private GP practices.
Upon completion of specialist or GP training, the options open to medical practitioners broaden to include private medical practice; a combination of private medical practice with a visiting medical officer (VMO) engagement at one or more public hospitals; and employment as a staff specialist in a public hospital or health facility, with options to undertake limited private practice (AMA 2008).
2
All medical practitioners must be registered with a state or territory medical board (or council) to practise in Australia. This applies to both those who trained in Australia and to overseas-trained medical practitioners (DoHA 2007).
The type of medical registration held by a medical practitioner determines or limits the work that he or she is licensed to undertake in that state or territory. While there is considerable variation across jurisdictions in the specific types of medical registration and the terms used to describe them, they can be generally classified into two broad types: ‘general’ or ‘full’ registration and ‘conditional’ or ‘limited’ (non-general) registration.
General registration is granted to medical practitioners who have fulfilled the full requirements of the board to practice. It permits a medical practitioner to work unsupervised in their field. If a medical practitioner does not meet the requirements to become a generally registered medical practitioner they may obtain limited or conditional registration. Interns, ‘Area of need’ medical practitioners (see Appendix B), overseas-trained medical practitioners undertaking postgraduate or supervised training, overseas-trained specialists whose specialist qualifications and experience have been recognised by the relevant Australian specialist college or institution, non-practising medical practitioners and medical practitioners facing disciplinary action are generally classed as conditional registrants. Overseas-trained medical practitioners usually gain conditional registration when they first practise in Australia. Conditionally registered medical practitioners can gain general registration when they meet the requirements of that state or territory medical board (or council).
1.2 AIHW Medical Labour Force Survey Access to reliable, comprehensive, timely and nationally consistent trend data is one of the key elements in gaining an understanding of the current health labour force and in workforce planning. The size, distribution and expertise of the health labour force are the subject of considerable scrutiny by governments, educators, health care providers and the community. There is interest in changes to the size and composition of the various health professions, and the potential impacts on health care as a result of those changes.
In recognition of this, the Australian Health Ministers Advisory Council (AHMAC) commissioned the AIHW, initially in 1990, to develop national health labour force statistics on the major registrable health professions. Medical practitioners were identified as one of the key health professions for which ongoing information should be collected for monitoring and planning purposes. These practitioners have been the focus of an annual survey and AIHW report since 1993.
The AIHW Medical Labour Force Survey, the main source of data for this report, is an annual survey of medical practitioners that began in 1993. The survey is managed by each state and territory health department, with the questionnaire administered by the medical board in each jurisdiction as part of the registration renewal process. Under agreement with AHMAC’s Health Workforce Principal Committee, the AIHW cleans, collates and weights the state and territory survey results to obtain national estimates of the total medical labour force and reports the findings.
3
The AIHW Medical Labour Force Survey provides detailed time series estimates of the medical labour force. It provides data not readily available from most other sources, such as the type of work undertaken by medical practitioners, their specialities and their hours worked, and covers working in both the private and public sector. The survey also provides some information on those registered medical practitioners who are not undertaking clinical work, or who are not employed.
The 2006 questionnaire was sent to all registrants in New South Wales, Victoria, Western Australia, South Australia, the Australian Capital Territory and the Northern Territory. It was sent only to general registrants and conditionally registered specialists in Queensland. In Tasmania, only general registrants, conditional specialists and non-practising practitioners were surveyed. No survey data were received from the Northern Territory, so estimates are based on responses to the 2007 survey weighted to the 2006 number of registered medical practitioners (known as ‘benchmarks’ in this report).
The overall response rate in 2006 was 70.2%. Queensland, New South Wales and Victoria had higher response rates at 79.7%, 75.4% and 72.0% respectively. The Northern Territory had the lowest response rate at 28.6% and its estimates should be treated with caution.
Responses to the survey are weighted to benchmark figures to account for non-response. These benchmarks are the number of registered practitioners in each state and territory, provided by the respective medical boards (or councils), and referred to as ‘benchmarks’ to distinguish them from figures reported in the annual reports of the medical boards. Due to scope differences between the survey and benchmark populations for Queensland and Tasmania, the estimates for these jurisdictions are undercounts. National estimates are an undercount as a result. Estimates in most jurisdictions are made taking the age and sex of the population of registered medical practitioners and survey respondents into account.
While the core data items (such as labour force status) have been collected since the survey’s inception, there have been changes to the questionnaire and estimation methods over time. While every effort is made to maintain comparable time series, this is not always possible. As a result care should be taken in comparing data from earlier publications with the current one. The most up-to-date estimates for the years prior to 2006 are available from the internet tables on the AIHW website.
The estimates published in this report may differ from other estimates derived from the survey data, such as those derived by some states and territories. This is due to a number of factors. First, the AIHW adjusts state and territory registration figures to account for those medical practitioners who state that they are working ‘mainly or only in another jurisdiction’, to minimise the possibility of double counting. Second, data cleaning, collation and imputation methods may differ. Third, differences in estimates can occur depending on the date of extraction and detail of the benchmark figures.
A detailed description of the AIHW Medical Labour Force Survey is provided in Appendix A, including a summary of changes to the 2006 survey questionnaire and data collected.
4
1.3 Other sources of data on medical practitioners There is a range of other data sources that provide information on the medical labour force, and can provide a different perspective on medical practitioners than can be obtained from the AIHW Medical Labour Force Survey. Data from the following sources are included in appendices to this publication: • medical practitioner registration numbers (state and territory boards and councils)
(Appendix B) • Medicare data (Australian Government Department of Health and Ageing (DoHA))
(Appendix C) • Australian Bureau of Statistics (ABS) Census of Population and Housing (Appendix D) • National Public Hospital Establishments Database (AIHW) (Appendix E).
1.4 Additional information An electronic version of this report is available from the AIHW’s website at <www.aihw.gov.au/labourforce/publications.cfm> (select link to Medical labour force 2006). Additional tables, containing more detailed data from the AIHW Medical Labour Force Survey, are also available on the website.
5
253 (0.4%)
Researchers1,149 (1.8%)
Teachers/educators650 (1.0%)
Other
Public health physicians366 (0.6%)
Administrators1,249 (2.0%)
Clinicians58,167 (93.2%)
Primary care practitioners
22,954 (39.5%)
Hospital non-specialists6,591 (11.3%)
Specialists20,254 (34.8%)
Specialists-in-training7,635 (13.1%)
Australian-registered medicalpractitioners working overseas
3,063 (38.0%)
Currently employed in medicine62,425 (98.0%)
On extended leave980 (1.5%)
Looking for work in medicine283 (0.4%)
Employed elsewhere 63 (22.3%)
Not employed 220 (77.7%)
Employed elsewhere and not looking for work in medicine
735 (9.1%)
Not employed, not looking for work
2,529 (31.4%)
Retired from work
1,725 (21.4%)
states and territories in 200677,902
Registered medical practitioners 71,740 (92.1%)
Multi-state registrations6,162 (7.9%)
In medical labour force in Australia 63,688 (88.8%)
Not in medical labour force in Australia8,052 (11.2%)
Other clinicians734 (1.3%)
591 (0.9%)
Occupational health physicians
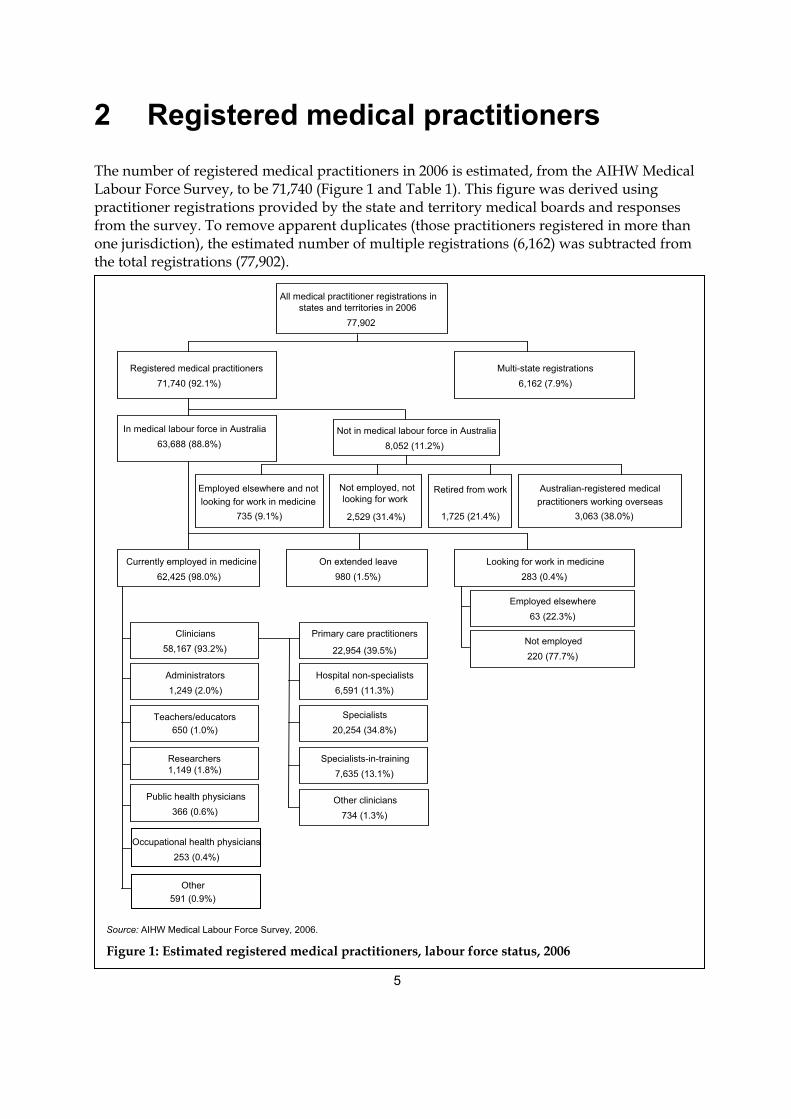
2 Registered medical practitioners
The number of registered medical practitioners in 2006 is estimated, from the AIHW Medical Labour Force Survey, to be 71,740 (Figure 1 and Table 1). This figure was derived using practitioner registrations provided by the state and territory medical boards and responses from the survey. To remove apparent duplicates (those practitioners registered in more than one jurisdiction), the estimated number of multiple registrations (6,162) was subtracted from the total registrations (77,902).
Source: AIHW Medical Labour Force Survey, 2006.
Figure 1: Estimated registered medical practitioners, labour force status, 2006
All medical practitioner registrations in
6
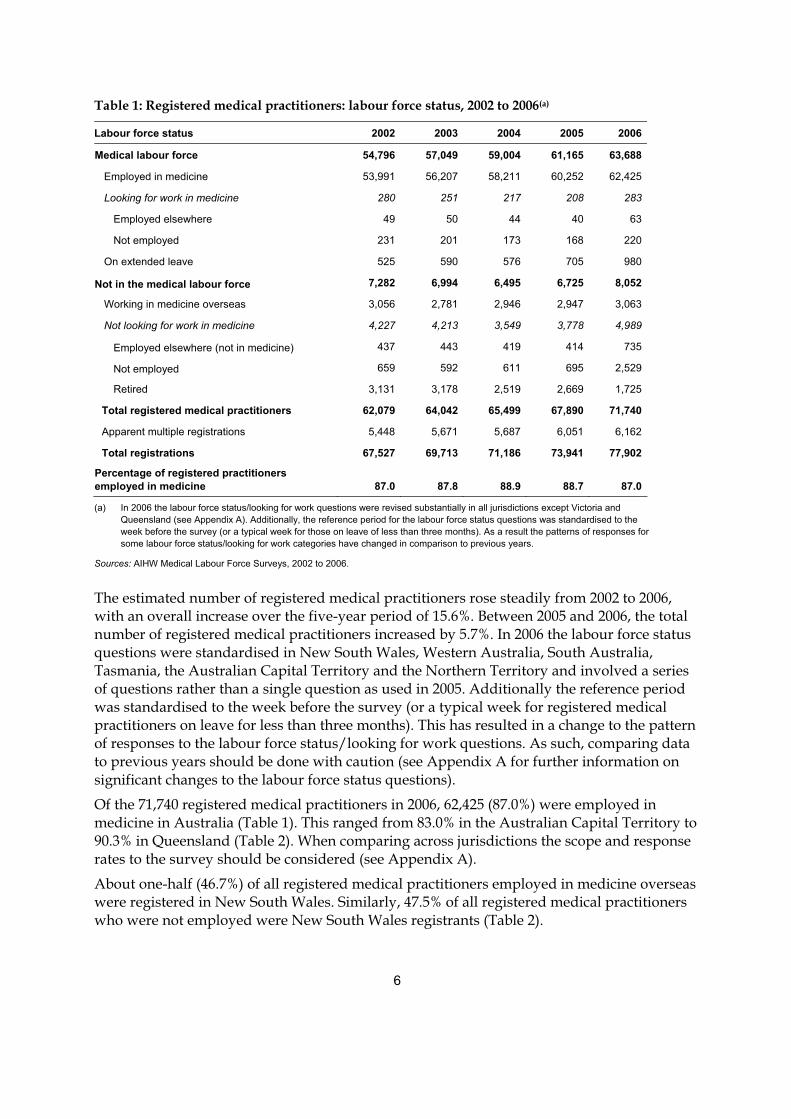
Table 1: Registered medical practitioners: labour force status, 2002 to 2006(a)
Labour force status 2002 2003 2004 2005 2006
Medical labour force 54,796 57,049 59,004 61,165 63,688
Employed in medicine 53,991 56,207 58,211 60,252 62,425
Looking for work in medicine 280 251 217 208 283
Employed elsewhere 49 50 44 40 63
Not employed 231 201 173 168 220
On extended leave 525 590 576 705 980
Not in the medical labour force 7,282 6,994 6,495 6,725 8,052
Working in medicine overseas 3,056 2,781 2,946 2,947 3,063
Not looking for work in medicine 4,227 4,213 3,549 3,778 4,989
Employed elsewhere (not in medicine) 437 443 419 414 735
Not employed 659 592 611 695 2,529
Retired 3,131 3,178 2,519 2,669 1,725
Total registered medical practitioners 62,079 64,042 65,499 67,890 71,740
Apparent multiple registrations 5,448 5,671 5,687 6,051 6,162
Total registrations 67,527 69,713 71,186 73,941 77,902
Percentage of registered practitioners employed in medicine 87.0 87.8 88.9 88.7 87.0
(a) In 2006 the labour force status/looking for work questions were revised substantially in all jurisdictions except Victoria and Queensland (see Appendix A). Additionally, the reference period for the labour force status questions was standardised to the week before the survey (or a typical week for those on leave of less than three months). As a result the patterns of responses for some labour force status/looking for work categories have changed in comparison to previous years.
Sources: AIHW Medical Labour Force Surveys, 2002 to 2006.
The estimated number of registered medical practitioners rose steadily from 2002 to 2006, with an overall increase over the five-year period of 15.6%. Between 2005 and 2006, the total number of registered medical practitioners increased by 5.7%. In 2006 the labour force status questions were standardised in New South Wales, Western Australia, South Australia, Tasmania, the Australian Capital Territory and the Northern Territory and involved a series of questions rather than a single question as used in 2005. Additionally the reference period was standardised to the week before the survey (or a typical week for registered medical practitioners on leave for less than three months). This has resulted in a change to the pattern of responses to the labour force status/looking for work questions. As such, comparing data to previous years should be done with caution (see Appendix A for further information on significant changes to the labour force status questions).
Of the 71,740 registered medical practitioners in 2006, 62,425 (87.0%) were employed in medicine in Australia (Table 1). This ranged from 83.0% in the Australian Capital Territory to 90.3% in Queensland (Table 2). When comparing across jurisdictions the scope and response rates to the survey should be considered (see Appendix A).
About one-half (46.7%) of all registered medical practitioners employed in medicine overseas were registered in New South Wales. Similarly, 47.5% of all registered medical practitioners who were not employed were New South Wales registrants (Table 2).
7
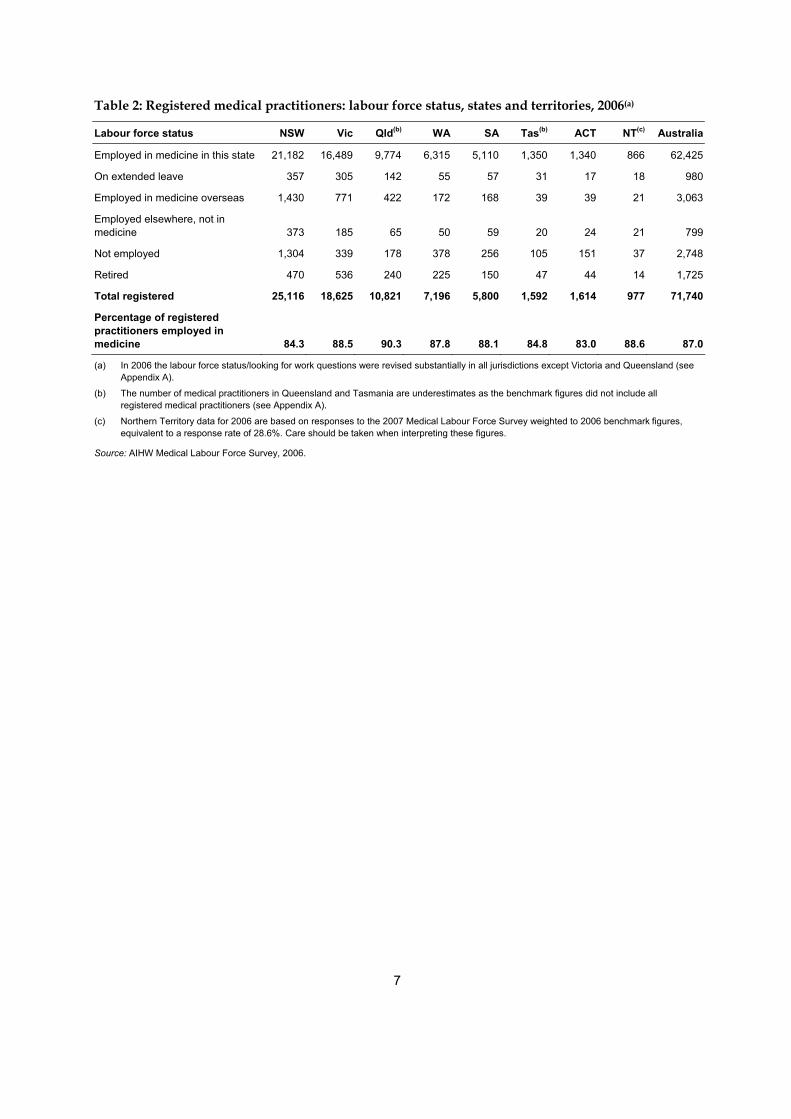
Table 2: Registered medical practitioners: labour force status, states and territories, 2006(a)
Labour force status NSW Vic Qld(b) WA SA Tas(b) ACT NT(c) Australia
Employed in medicine in this state 21,182 16,489 9,774 6,315 5,110 1,350 1,340 866 62,425
On extended leave 357 305 142 55 57 31 17 18 980
Employed in medicine overseas 1,430 771 422 172 168 39 39 21 3,063
Employed elsewhere, not in medicine 373 185 65 50 59 20 24 21 799
Not employed 1,304 339 178 378 256 105 151 37 2,748
Retired 470 536 240 225 150 47 44 14 1,725
Total registered 25,116 18,625 10,821 7,196 5,800 1,592 1,614 977 71,740
Percentage of registered practitioners employed in medicine 84.3 88.5 90.3 87.8 88.1 84.8 83.0 88.6 87.0
(a) In 2006 the labour force status/looking for work questions were revised substantially in all jurisdictions except Victoria and Queensland (see Appendix A).
(b) The number of medical practitioners in Queensland and Tasmania are underestimates as the benchmark figures did not include all registered medical practitioners (see Appendix A).
(c) Northern Territory data for 2006 are based on responses to the 2007 Medical Labour Force Survey weighted to 2006 benchmark figures, equivalent to a response rate of 28.6%. Care should be taken when interpreting these figures.
Source: AIHW Medical Labour Force Survey, 2006.
8
3 Medical practitioners employed in medicine A medical practitioner who reported working mainly, or only, in their state of registration, in medicine, in the four weeks prior to the survey is considered to have been ‘employed in medicine’, or an ‘employed medical practitioner’, at the time of the survey (see Glossary). In 2006, there were 62,425 medical practitioners employed in medicine in Australia (Figure 1, Tables 1 and 2). The characteristics and supply of these employed medical practitioners are the focus of the remainder of this report.
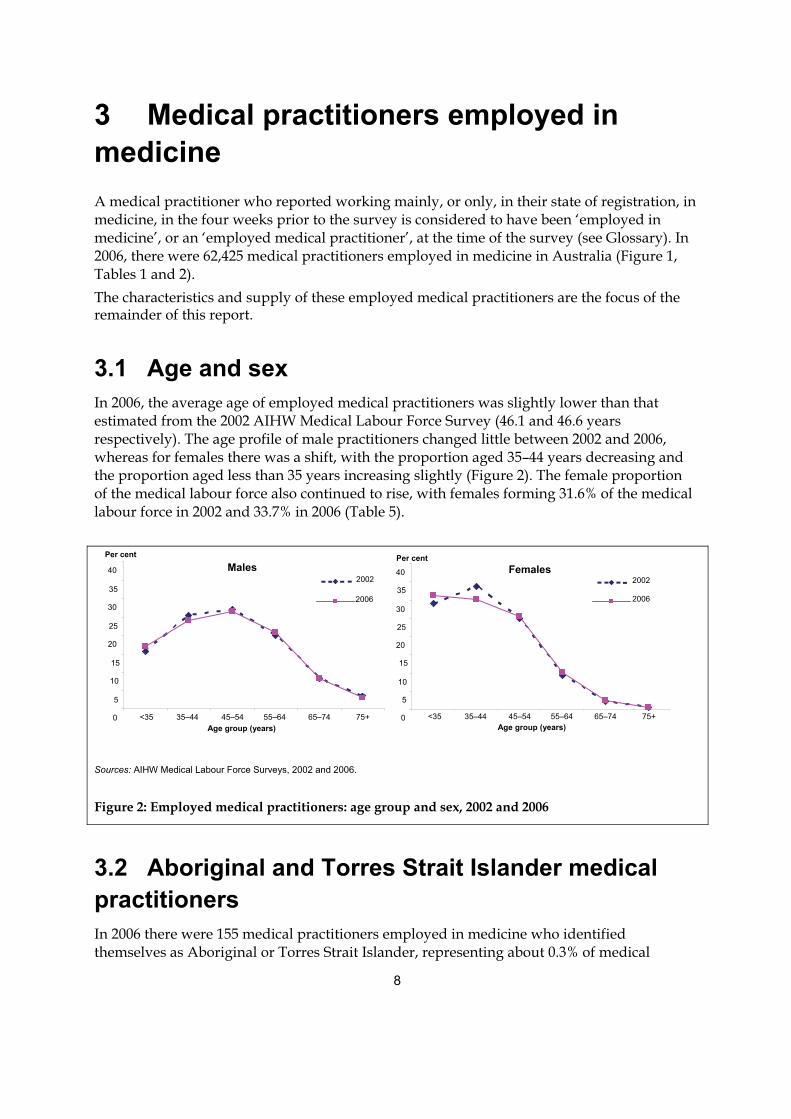
3.1 Age and sex In 2006, the average age of employed medical practitioners was slightly lower than that estimated from the 2002 AIHW Medical Labour Force Survey (46.1 and 46.6 years respectively). The age profile of male practitioners changed little between 2002 and 2006, whereas for females there was a shift, with the proportion aged 35–44 years decreasing and the proportion aged less than 35 years increasing slightly (Figure 2). The female proportion of the medical labour force also continued to rise, with females forming 31.6% of the medical labour force in 2002 and 33.7% in 2006 (Table 5).
Sources: AIHW Medical Labour Force Surveys, 2002 and 2006.
Figure 2: Employed medical practitioners: age group and sex, 2002 and 2006
3.2 Aboriginal and Torres Strait Islander medical practitioners In 2006 there were 155 medical practitioners employed in medicine who identified themselves as Aboriginal or Torres Strait Islander, representing about 0.3% of medical
Males
0
5 10
15
20
25
30
35
40
<35 35–44 45–54 55–64 65–74 75+Age group (years)
2002
2006
Females
0
5
10
15
20
25
30
35
40
<35 35–44 45–54 55–64 65–74 75+Age group (years)
2002
2006
Per cent Per cent
9
practitioners employed in medicine who reported they were either Indigenous or non-Indigenous.
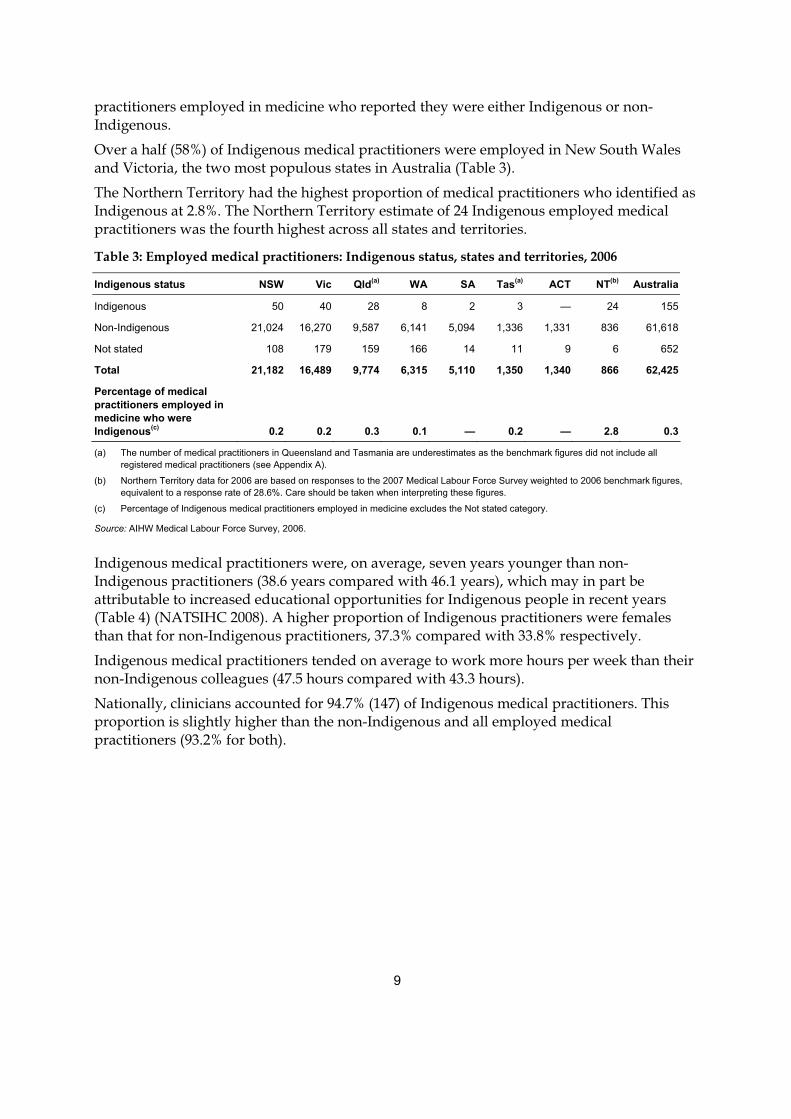
Over a half (58%) of Indigenous medical practitioners were employed in New South Wales and Victoria, the two most populous states in Australia (Table 3).
The Northern Territory had the highest proportion of medical practitioners who identified as Indigenous at 2.8%. The Northern Territory estimate of 24 Indigenous employed medical practitioners was the fourth highest across all states and territories.
Table 3: Employed medical practitioners: Indigenous status, states and territories, 2006
Indigenous status NSW Vic Qld(a) WA SA Tas(a) ACT NT(b) Australia
Indigenous 50 40 28 8 2 3 — 24 155
Non-Indigenous 21,024 16,270 9,587 6,141 5,094 1,336 1,331 836 61,618
Not stated 108 179 159 166 14 11 9 6 652
Total 21,182 16,489 9,774 6,315 5,110 1,350 1,340 866 62,425
Percentage of medical practitioners employed in medicine who were Indigenous(c) 0.2 0.2 0.3 0.1 — 0.2 — 2.8 0.3
(a) The number of medical practitioners in Queensland and Tasmania are underestimates as the benchmark figures did not include all registered medical practitioners (see Appendix A).
(b) Northern Territory data for 2006 are based on responses to the 2007 Medical Labour Force Survey weighted to 2006 benchmark figures, equivalent to a response rate of 28.6%. Care should be taken when interpreting these figures.
(c) Percentage of Indigenous medical practitioners employed in medicine excludes the Not stated category.
Source: AIHW Medical Labour Force Survey, 2006.
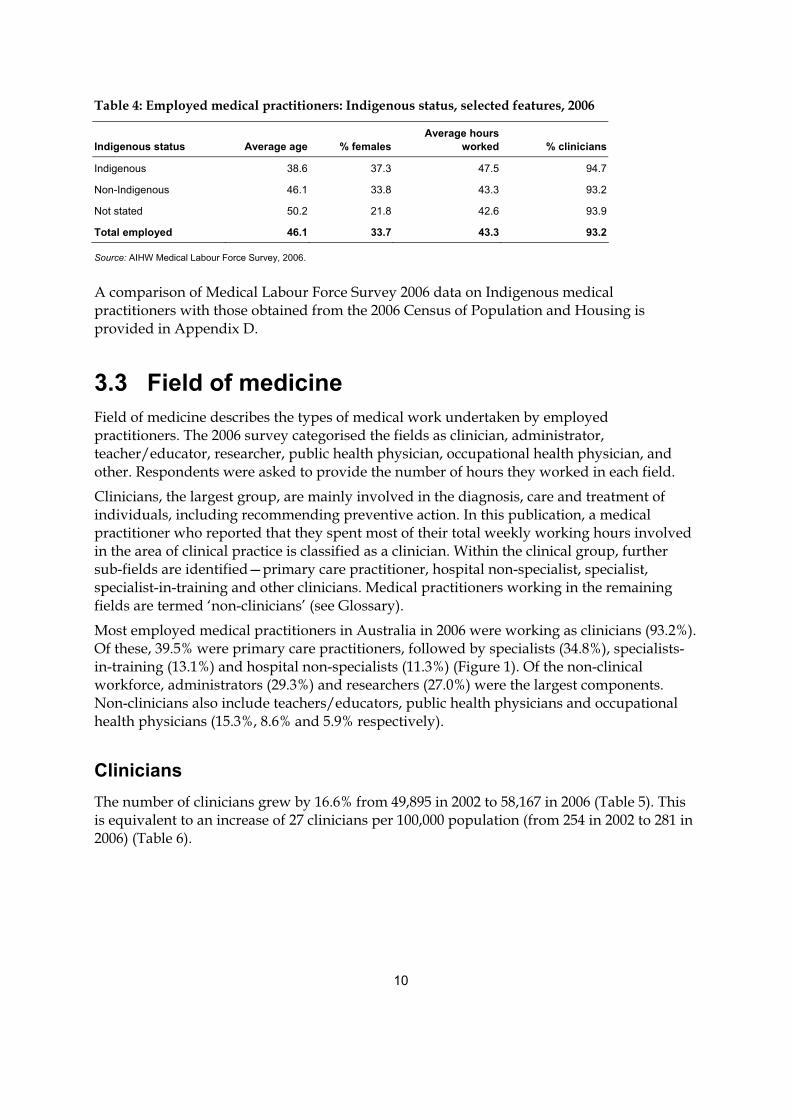
Indigenous medical practitioners were, on average, seven years younger than non-Indigenous practitioners (38.6 years compared with 46.1 years), which may in part be attributable to increased educational opportunities for Indigenous people in recent years (Table 4) (NATSIHC 2008). A higher proportion of Indigenous practitioners were females than that for non-Indigenous practitioners, 37.3% compared with 33.8% respectively.
Indigenous medical practitioners tended on average to work more hours per week than their non-Indigenous colleagues (47.5 hours compared with 43.3 hours).
Nationally, clinicians accounted for 94.7% (147) of Indigenous medical practitioners. This proportion is slightly higher than the non-Indigenous and all employed medical practitioners (93.2% for both).
10
Table 4: Employed medical practitioners: Indigenous status, selected features, 2006
Indigenous status Average age % femalesAverage hours
worked % clinicians
Indigenous 38.6 37.3 47.5 94.7
Non-Indigenous 46.1 33.8 43.3 93.2
Not stated 50.2 21.8 42.6 93.9
Total employed 46.1 33.7 43.3 93.2
Source: AIHW Medical Labour Force Survey, 2006.
A comparison of Medical Labour Force Survey 2006 data on Indigenous medical practitioners with those obtained from the 2006 Census of Population and Housing is provided in Appendix D.
3.3 Field of medicine Field of medicine describes the types of medical work undertaken by employed practitioners. The 2006 survey categorised the fields as clinician, administrator, teacher/educator, researcher, public health physician, occupational health physician, and other. Respondents were asked to provide the number of hours they worked in each field.
Clinicians, the largest group, are mainly involved in the diagnosis, care and treatment of individuals, including recommending preventive action. In this publication, a medical practitioner who reported that they spent most of their total weekly working hours involved in the area of clinical practice is classified as a clinician. Within the clinical group, further sub-fields are identified—primary care practitioner, hospital non-specialist, specialist, specialist-in-training and other clinicians. Medical practitioners working in the remaining fields are termed ‘non-clinicians’ (see Glossary).
Most employed medical practitioners in Australia in 2006 were working as clinicians (93.2%). Of these, 39.5% were primary care practitioners, followed by specialists (34.8%), specialists-in-training (13.1%) and hospital non-specialists (11.3%) (Figure 1). Of the non-clinical workforce, administrators (29.3%) and researchers (27.0%) were the largest components. Non-clinicians also include teachers/educators, public health physicians and occupational health physicians (15.3%, 8.6% and 5.9% respectively).
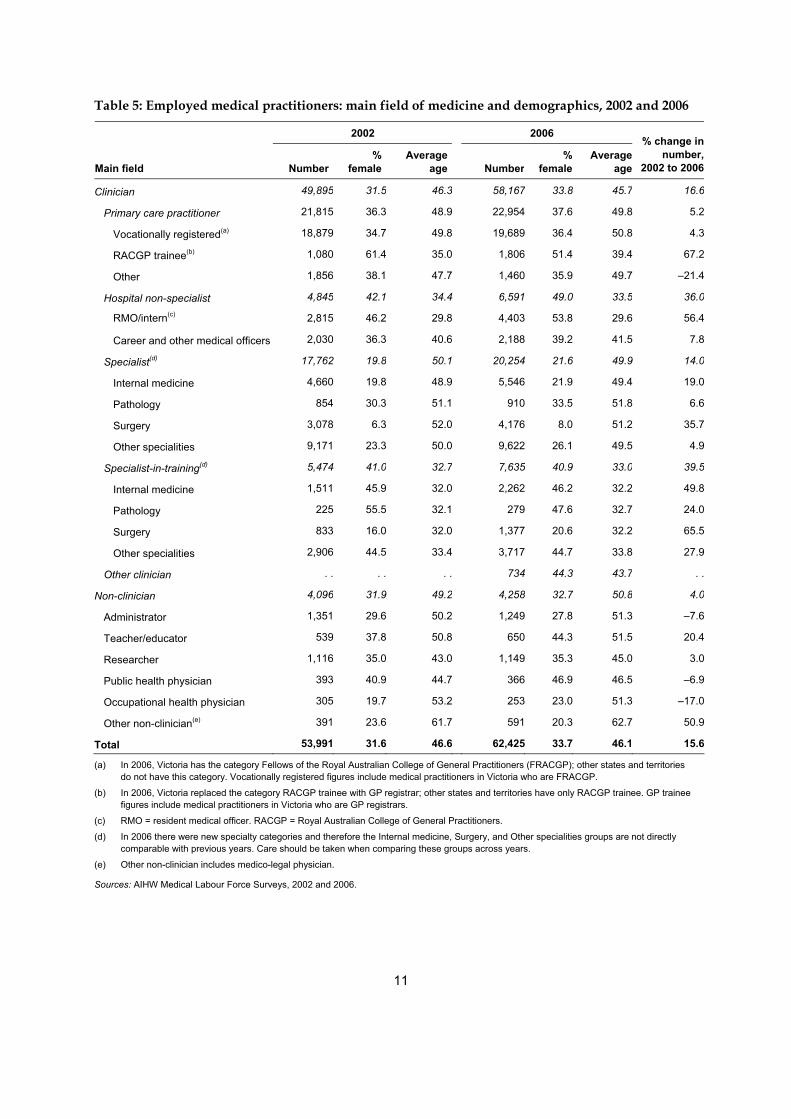
Clinicians The number of clinicians grew by 16.6% from 49,895 in 2002 to 58,167 in 2006 (Table 5). This is equivalent to an increase of 27 clinicians per 100,000 population (from 254 in 2002 to 281 in 2006) (Table 6).
11
Table 5: Employed medical practitioners: main field of medicine and demographics, 2002 and 2006
2002 2006
Main field Number%
femaleAverage
age Number%
femaleAverage
age
% change in number,
2002 to 2006
Clinician 49,895 31.5 46.3 58,167 33.8 45.7 16.6
Primary care practitioner 21,815 36.3 48.9 22,954 37.6 49.8 5.2
Vocationally registered(a) 18,879 34.7 49.8 19,689 36.4 50.8 4.3
RACGP trainee(b) 1,080 61.4 35.0 1,806 51.4 39.4 67.2
Other 1,856 38.1 47.7 1,460 35.9 49.7 –21.4
Hospital non-specialist 4,845 42.1 34.4 6,591 49.0 33.5 36.0
RMO/intern(c) 2,815 46.2 29.8 4,403 53.8 29.6 56.4
Career and other medical officers 2,030 36.3 40.6 2,188 39.2 41.5 7.8
Specialist(d) 17,762 19.8 50.1 20,254 21.6 49.9 14.0
Internal medicine 4,660 19.8 48.9 5,546 21.9 49.4 19.0
Pathology 854 30.3 51.1 910 33.5 51.8 6.6
Surgery 3,078 6.3 52.0 4,176 8.0 51.2 35.7
Other specialities 9,171 23.3 50.0 9,622 26.1 49.5 4.9
Specialist-in-training(d) 5,474 41.0 32.7 7,635 40.9 33.0 39.5
Internal medicine 1,511 45.9 32.0 2,262 46.2 32.2 49.8
Pathology 225 55.5 32.1 279 47.6 32.7 24.0
Surgery 833 16.0 32.0 1,377 20.6 32.2 65.5
Other specialities 2,906 44.5 33.4 3,717 44.7 33.8 27.9
Other clinician . . . . . . 734 44.3 43.7 . .
Non-clinician 4,096 31.9 49.2 4,258 32.7 50.8 4.0
Administrator 1,351 29.6 50.2 1,249 27.8 51.3 –7.6
Teacher/educator 539 37.8 50.8 650 44.3 51.5 20.4
Researcher 1,116 35.0 43.0 1,149 35.3 45.0 3.0
Public health physician 393 40.9 44.7 366 46.9 46.5 –6.9
Occupational health physician 305 19.7 53.2 253 23.0 51.3 –17.0
Other non-clinician(e) 391 23.6 61.7 591 20.3 62.7 50.9
Total 53,991 31.6 46.6 62,425 33.7 46.1 15.6
(a) In 2006, Victoria has the category Fellows of the Royal Australian College of General Practitioners (FRACGP); other states and territories do not have this category. Vocationally registered figures include medical practitioners in Victoria who are FRACGP.
(b) In 2006, Victoria replaced the category RACGP trainee with GP registrar; other states and territories have only RACGP trainee. GP trainee figures include medical practitioners in Victoria who are GP registrars.
(c) RMO = resident medical officer. RACGP = Royal Australian College of General Practitioners.
(d) In 2006 there were new specialty categories and therefore the Internal medicine, Surgery, and Other specialities groups are not directly comparable with previous years. Care should be taken when comparing these groups across years.
(e) Other non-clinician includes medico-legal physician.
Sources: AIHW Medical Labour Force Surveys, 2002 and 2006.
12
The average age of clinicians decreased slightly over the five-year period, from 46.3 years in 2002 to 45.7 years in 2006. The proportion of clinicians who were females rose over the same period, by 2.3 percentage points, to 33.8% in 2006 (Table 5).
Growth in the number of primary care practitioners from 2002 to 2006 was relatively small (5.2%) compared with that for other clinicians. The number of Royal Australian College of General Practitioners (RACGP) trainees increased by 67.6% over the same period. Hospital non-specialists and specialists-in-training, in particular, experienced relatively high rates of growth (36.0% and 39.5% respectively). The number of specialists rose by 14.0% from 2002 to 2006 (Table 5).
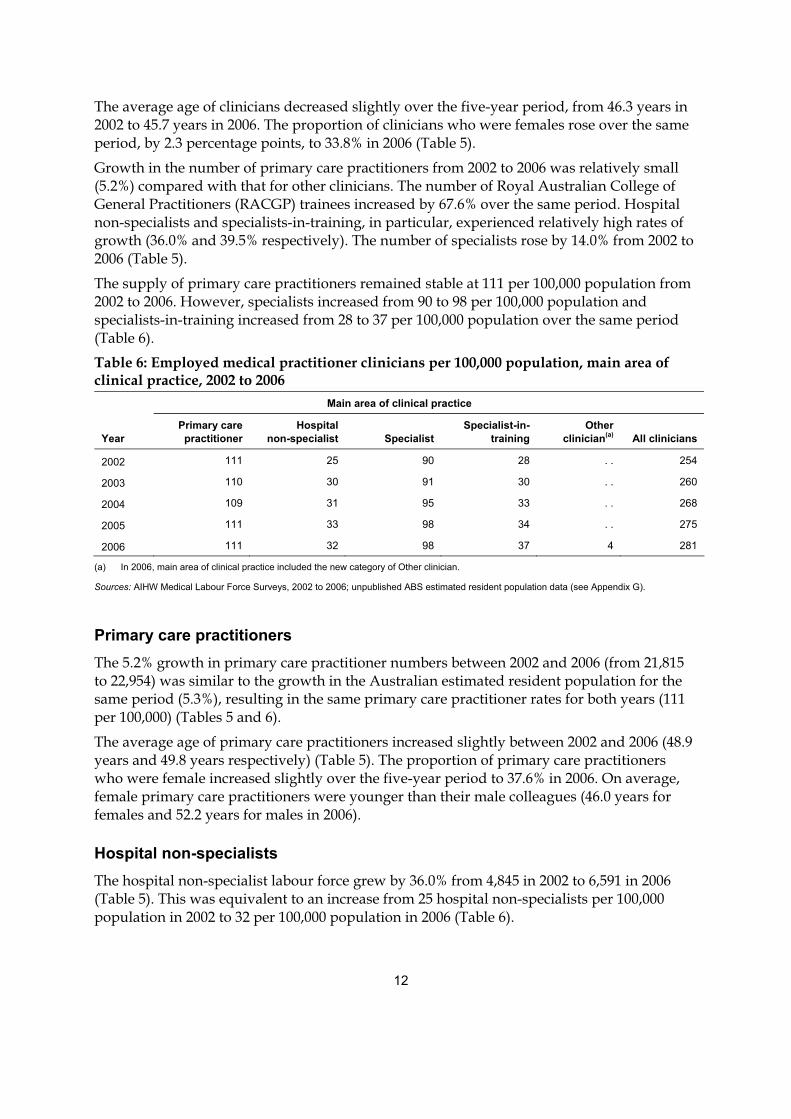
The supply of primary care practitioners remained stable at 111 per 100,000 population from 2002 to 2006. However, specialists increased from 90 to 98 per 100,000 population and specialists-in-training increased from 28 to 37 per 100,000 population over the same period (Table 6). Table 6: Employed medical practitioner clinicians per 100,000 population, main area of clinical practice, 2002 to 2006
Main area of clinical practice
Year Primary care practitioner
Hospitalnon-specialist Specialist
Specialist-in-training
Other clinician(a) All clinicians
2002 111 25 90 28 . . 254
2003 110 30 91 30 . . 260
2004 109 31 95 33 . . 268
2005 111 33 98 34 . . 275
2006 111 32 98 37 4 281
(a) In 2006, main area of clinical practice included the new category of Other clinician.
Sources: AIHW Medical Labour Force Surveys, 2002 to 2006; unpublished ABS estimated resident population data (see Appendix G).
Primary care practitioners The 5.2% growth in primary care practitioner numbers between 2002 and 2006 (from 21,815 to 22,954) was similar to the growth in the Australian estimated resident population for the same period (5.3%), resulting in the same primary care practitioner rates for both years (111 per 100,000) (Tables 5 and 6).
The average age of primary care practitioners increased slightly between 2002 and 2006 (48.9 years and 49.8 years respectively) (Table 5). The proportion of primary care practitioners who were female increased slightly over the five-year period to 37.6% in 2006. On average, female primary care practitioners were younger than their male colleagues (46.0 years for females and 52.2 years for males in 2006).
Hospital non-specialists The hospital non-specialist labour force grew by 36.0% from 4,845 in 2002 to 6,591 in 2006 (Table 5). This was equivalent to an increase from 25 hospital non-specialists per 100,000 population in 2002 to 32 per 100,000 population in 2006 (Table 6).
13
The average age for this group of clinicians in 2006 was 33.5 years, slightly younger than in 2002 (34.4 years) (Table 5). The proportion of females increased from 42.1% in 2002 to 49.0% in 2006. Hospital non-specialists were one of the youngest sub-fields, on average, among clinicians.
Specialists The number of employed specialist clinicians increased between 2002 and 2006 (from 17,762 to 20,254) (Table 5). The number per 100,000 population rose from 90 to 98 (Table 6). The average age for specialist clinicians was 49.9 years in 2006, making them the oldest of the clinician sub-fields. In 2006, 21.6% of specialist clinicians were female, the lowest proportion among the clinician sub-fields (Table 5).
Table 7: Employed specialist clinicians per 100,000 population, broad specialty group, 2002 to 2006
Broad specialty group
Year Internal medicine Pathology Surgery Other specialties Total
2002 24 4 16 47 90
2003 24 5 16 47 91
2004 26 4 16 48 95
2005 27 5 17 50 98
2006(a) 27 4 20 46 98
(a) In 2006 there were new specialty categories and therefore the Internal medicine, Surgery, and Other specialities groups are not directly comparable with previous years. Changes to these three broad groups are minor and do not affect comparisons significantly.
Sources: AIHW Medical Labour Force Surveys, 2002 to 2006; unpublished ABS estimated resident population data (see Appendix G).
Growth in the broad specialty groups from 2002 to 2006 was not uniform. Growth in numbers was highest for surgery (up by 35.7%) and lowest for pathology specialist numbers (up by 6.6%) (Table 5). For surgery, this equated to a rate increase of 4 per 100,000 population, whereas the rate of pathology specialists remained steady at 4 per 100,000 population (Table 7). Moderate growth in numbers occurred for internal medicine specialists (up by 19.0%).
While the average age did not differ greatly among the broad specialist groups, there were major differences in the representation of females. In 2006, 8.0% of surgery specialists were females, compared with 33.5% of pathologists (Table 5).
Specialists-in-training The number of specialists-in-training increased by 39.5% between 2002 and 2006, from 5,474 to 7,635 (Table 5). This equates to a rise of 9 per 100,000 to 37 per 100,000 population in 2006 (Table 6). Trainee numbers in surgery rose by 65.5% while trainees in internal medicine increased by 49.8%.
In 2006, 40.9% of specialists-in-training were females, almost double the proportion of specialists. The average age of specialists-in-training (33.0 years in 2006) was relatively young compared with specialists and primary care practitioners.
14
Overall, the proportion of specialists-in-training who were females remained relatively steady (41.0% in 2002 and 40.9% in 2006). However, between 2002 and 2006, the proportion of specialists-in-training who were female and training in surgery increased from 16.0% to 20.6%.
Non-clinicians As outlined above, a medical practitioner who reported spending most of their total working hours mainly engaged in clinical practice is classified as a clinician.
A non-clinician is a medical practitioner who reported in the AIHW Medical Labour Force Survey that they worked the majority of their total weekly hours as one of the following: • an administrator: employed in medical administration • a teacher/educator: teaching or training persons in medicine • a researcher: engaged in medical research • a public health physician: engaged in identifying disease and illness, along with their
treatments and any preventive measures that affect the health of the general public • an occupational health physician: engaged in identifying disease and illness, along with
their treatments and any preventive measures arising from particular fields or industries • in another medical field: a medico-legal physician or other job function in medicine
which is not one of the above.
It should be noted that using this definition, a clinician may undertake some non-clinician functions and vice versa.
In 2006, there were 4,258 employed non-clinician medical practitioners, compared with 58,167 employed clinicians (Table 5).
The number of employed non-clinician medical practitioners increased by 4.0% from 2002 to 2006. Among the non-clinical fields, other non-clinicians and teachers/educators had the highest increase in numbers (50.9% and 20.4% respectively).
Non-clinicians were, on average and as a group, slightly older than clinicians (50.8 years and 45.7 years respectively in 2006). Around one-third were female, similar to the proportion for clinicians.
15
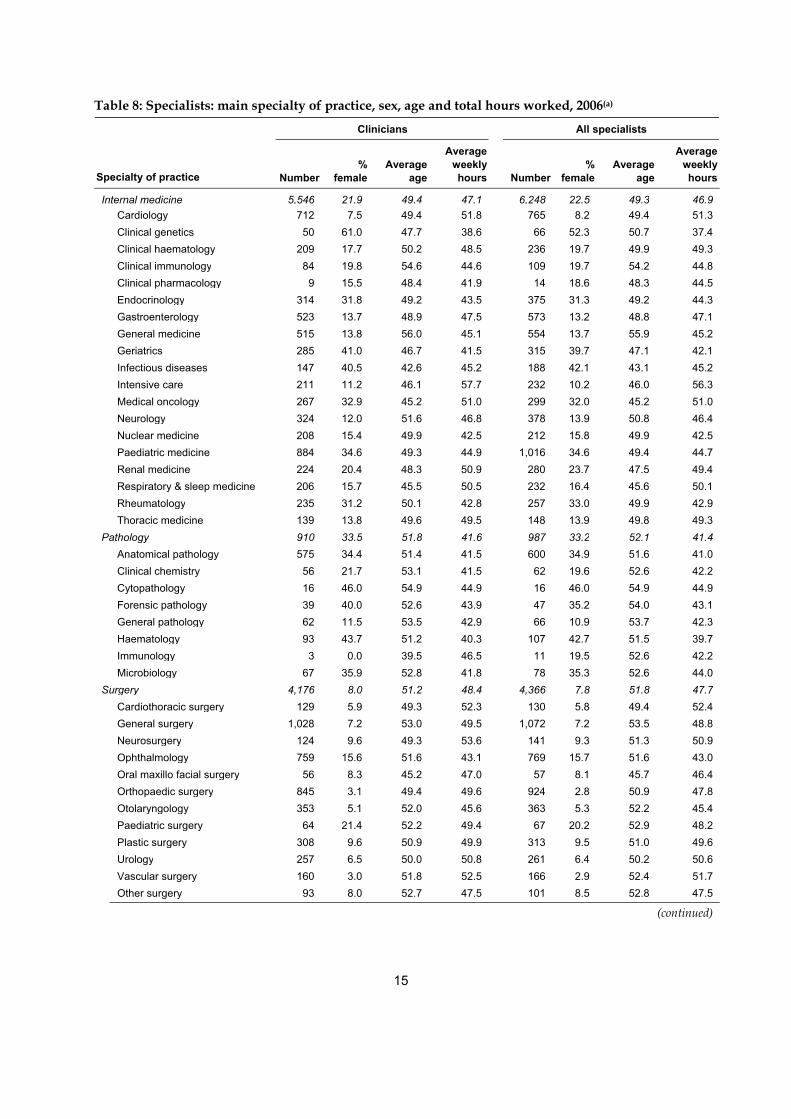
Table 8: Specialists: main specialty of practice, sex, age and total hours worked, 2006(a)
Clinicians All specialists
Specialty of practice Number %
femaleAverage
age
Average weekly hours Number
% female
Average age
Average weekly hours
Internal medicine 5,546 21.9 49.4 47.1 6,248 22.5 49.3 46.9 Cardiology 712 7.5 49.4 51.8 765 8.2 49.4 51.3 Clinical genetics 50 61.0 47.7 38.6 66 52.3 50.7 37.4 Clinical haematology 209 17.7 50.2 48.5 236 19.7 49.9 49.3 Clinical immunology 84 19.8 54.6 44.6 109 19.7 54.2 44.8 Clinical pharmacology 9 15.5 48.4 41.9 14 18.6 48.3 44.5 Endocrinology 314 31.8 49.2 43.5 375 31.3 49.2 44.3 Gastroenterology 523 13.7 48.9 47.5 573 13.2 48.8 47.1 General medicine 515 13.8 56.0 45.1 554 13.7 55.9 45.2 Geriatrics 285 41.0 46.7 41.5 315 39.7 47.1 42.1 Infectious diseases 147 40.5 42.6 45.2 188 42.1 43.1 45.2 Intensive care 211 11.2 46.1 57.7 232 10.2 46.0 56.3 Medical oncology 267 32.9 45.2 51.0 299 32.0 45.2 51.0 Neurology 324 12.0 51.6 46.8 378 13.9 50.8 46.4 Nuclear medicine 208 15.4 49.9 42.5 212 15.8 49.9 42.5 Paediatric medicine 884 34.6 49.3 44.9 1,016 34.6 49.4 44.7 Renal medicine 224 20.4 48.3 50.9 280 23.7 47.5 49.4 Respiratory & sleep medicine 206 15.7 45.5 50.5 232 16.4 45.6 50.1 Rheumatology 235 31.2 50.1 42.8 257 33.0 49.9 42.9 Thoracic medicine 139 13.8 49.6 49.5 148 13.9 49.8 49.3Pathology 910 33.5 51.8 41.6 987 33.2 52.1 41.4 Anatomical pathology 575 34.4 51.4 41.5 600 34.9 51.6 41.0 Clinical chemistry 56 21.7 53.1 41.5 62 19.6 52.6 42.2 Cytopathology 16 46.0 54.9 44.9 16 46.0 54.9 44.9 Forensic pathology 39 40.0 52.6 43.9 47 35.2 54.0 43.1 General pathology 62 11.5 53.5 42.9 66 10.9 53.7 42.3 Haematology 93 43.7 51.2 40.3 107 42.7 51.5 39.7 Immunology 3 0.0 39.5 46.5 11 19.5 52.6 42.2 Microbiology 67 35.9 52.8 41.8 78 35.3 52.6 44.0Surgery 4,176 8.0 51.2 48.4 4,366 7.8 51.8 47.7 Cardiothoracic surgery 129 5.9 49.3 52.3 130 5.8 49.4 52.4 General surgery 1,028 7.2 53.0 49.5 1,072 7.2 53.5 48.8 Neurosurgery 124 9.6 49.3 53.6 141 9.3 51.3 50.9 Ophthalmology 759 15.6 51.6 43.1 769 15.7 51.6 43.0 Oral maxillo facial surgery 56 8.3 45.2 47.0 57 8.1 45.7 46.4 Orthopaedic surgery 845 3.1 49.4 49.6 924 2.8 50.9 47.8 Otolaryngology 353 5.1 52.0 45.6 363 5.3 52.2 45.4 Paediatric surgery 64 21.4 52.2 49.4 67 20.2 52.9 48.2 Plastic surgery 308 9.6 50.9 49.9 313 9.5 51.0 49.6 Urology 257 6.5 50.0 50.8 261 6.4 50.2 50.6 Vascular surgery 160 3.0 51.8 52.5 166 2.9 52.4 51.7 Other surgery 93 8.0 52.7 47.5 101 8.5 52.8 47.5
(continued)
16
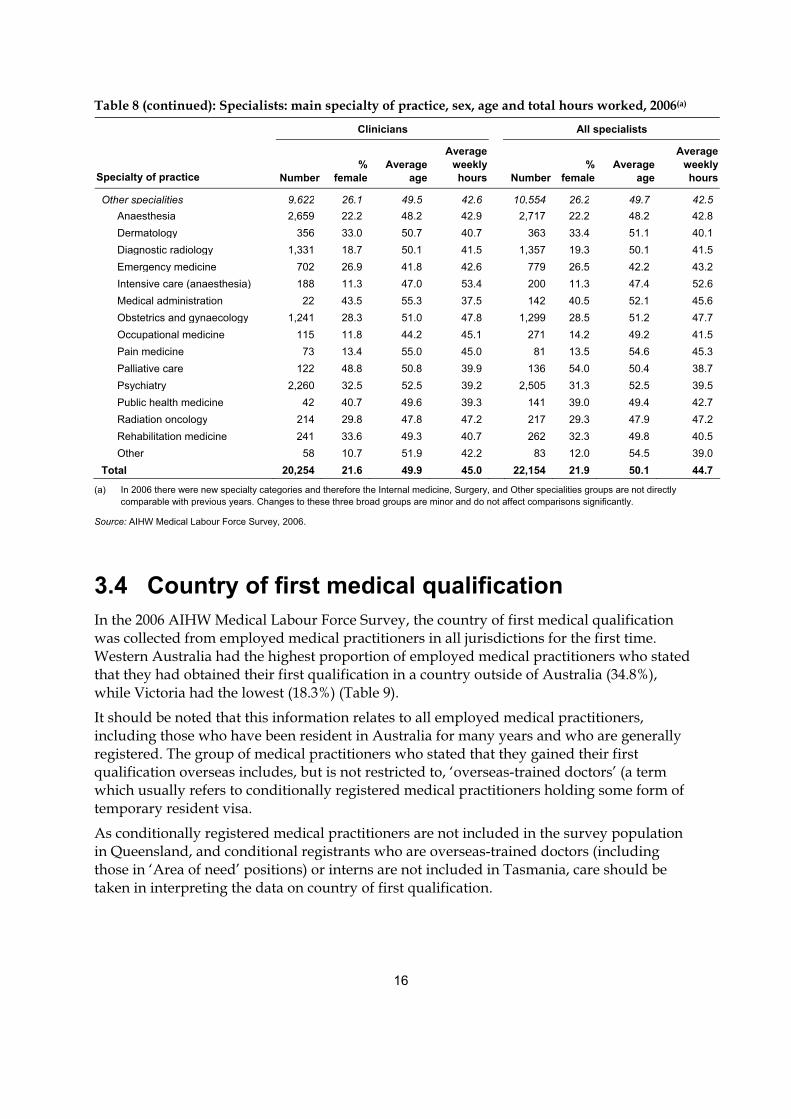
Table 8 (continued): Specialists: main specialty of practice, sex, age and total hours worked, 2006(a)
Clinicians All specialists
Specialty of practice Number %
femaleAverage
age
Average weekly hours Number
% female
Average age
Average weekly hours
Other specialities 9,622 26.1 49.5 42.6 10,554 26.2 49.7 42.5 Anaesthesia 2,659 22.2 48.2 42.9 2,717 22.2 48.2 42.8 Dermatology 356 33.0 50.7 40.7 363 33.4 51.1 40.1 Diagnostic radiology 1,331 18.7 50.1 41.5 1,357 19.3 50.1 41.5 Emergency medicine 702 26.9 41.8 42.6 779 26.5 42.2 43.2 Intensive care (anaesthesia) 188 11.3 47.0 53.4 200 11.3 47.4 52.6 Medical administration 22 43.5 55.3 37.5 142 40.5 52.1 45.6 Obstetrics and gynaecology 1,241 28.3 51.0 47.8 1,299 28.5 51.2 47.7 Occupational medicine 115 11.8 44.2 45.1 271 14.2 49.2 41.5 Pain medicine 73 13.4 55.0 45.0 81 13.5 54.6 45.3 Palliative care 122 48.8 50.8 39.9 136 54.0 50.4 38.7 Psychiatry 2,260 32.5 52.5 39.2 2,505 31.3 52.5 39.5 Public health medicine 42 40.7 49.6 39.3 141 39.0 49.4 42.7 Radiation oncology 214 29.8 47.8 47.2 217 29.3 47.9 47.2 Rehabilitation medicine 241 33.6 49.3 40.7 262 32.3 49.8 40.5 Other 58 10.7 51.9 42.2 83 12.0 54.5 39.0Total 20,254 21.6 49.9 45.0 22,154 21.9 50.1 44.7
(a) In 2006 there were new specialty categories and therefore the Internal medicine, Surgery, and Other specialities groups are not directly comparable with previous years. Changes to these three broad groups are minor and do not affect comparisons significantly.
Source: AIHW Medical Labour Force Survey, 2006.
3.4 Country of first medical qualification In the 2006 AIHW Medical Labour Force Survey, the country of first medical qualification was collected from employed medical practitioners in all jurisdictions for the first time. Western Australia had the highest proportion of employed medical practitioners who stated that they had obtained their first qualification in a country outside of Australia (34.8%), while Victoria had the lowest (18.3%) (Table 9).
It should be noted that this information relates to all employed medical practitioners, including those who have been resident in Australia for many years and who are generally registered. The group of medical practitioners who stated that they gained their first qualification overseas includes, but is not restricted to, ‘overseas-trained doctors’ (a term which usually refers to conditionally registered medical practitioners holding some form of temporary resident visa.
As conditionally registered medical practitioners are not included in the survey population in Queensland, and conditional registrants who are overseas-trained doctors (including those in ‘Area of need’ positions) or interns are not included in Tasmania, care should be taken in interpreting the data on country of first qualification.
17
Table 9: Employed medical practitioners: country of first qualification, states and territories, 2006
Country of first qualification NSW Vic Qld(a) WA SA Tas(a) ACT NT(b) Total
Australia 16,206 13,441 7,749 4,080 3,829 1,029 971 625 47,930
New Zealand 600 350 314 191 79 34 53 18 1,639
UK/Ireland 895 637 766 870 249 116 75 95 3,702
Other countries 3,390 2,022 911 1,118 888 170 216 96 8,812
Not stated 91 38 34 57 65 2 25 32 342
Total 21,182 16,489 9,774 6,315 5,110 1,350 1,340 866 62,425
% Australian trained(c) 76.8 81.7 79.6 65.2 75.9 76.3 73.9 74.9 77.2
(a) The number of medical practitioners in Queensland and Tasmania are underestimates as the benchmark figures did not include all registered medical practitioners (see Appendix A).
(b) Northern Territory data for 2006 are based on responses to the 2007 Medical Labour Force Survey weighted to 2006 benchmark figures, equivalent to a response rate of 28.6%. Care should be taken when interpreting these figures.
(c) Percentage of Australian trained excludes the Not stated response category.
Source: AIHW Medical Labour Force Survey, 2006.
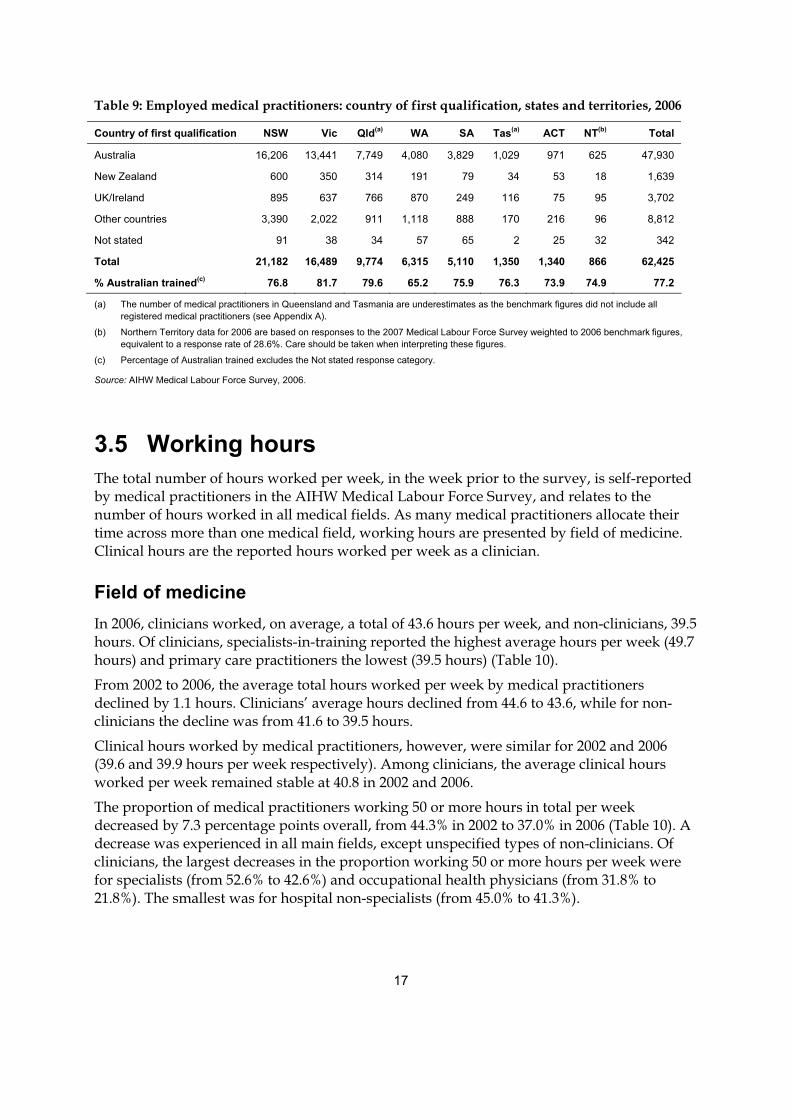
3.5 Working hours The total number of hours worked per week, in the week prior to the survey, is self-reported by medical practitioners in the AIHW Medical Labour Force Survey, and relates to the number of hours worked in all medical fields. As many medical practitioners allocate their time across more than one medical field, working hours are presented by field of medicine. Clinical hours are the reported hours worked per week as a clinician.
Field of medicine In 2006, clinicians worked, on average, a total of 43.6 hours per week, and non-clinicians, 39.5 hours. Of clinicians, specialists-in-training reported the highest average hours per week (49.7 hours) and primary care practitioners the lowest (39.5 hours) (Table 10).
From 2002 to 2006, the average total hours worked per week by medical practitioners declined by 1.1 hours. Clinicians’ average hours declined from 44.6 to 43.6, while for non-clinicians the decline was from 41.6 to 39.5 hours.
Clinical hours worked by medical practitioners, however, were similar for 2002 and 2006 (39.6 and 39.9 hours per week respectively). Among clinicians, the average clinical hours worked per week remained stable at 40.8 in 2002 and 2006.
The proportion of medical practitioners working 50 or more hours in total per week decreased by 7.3 percentage points overall, from 44.3% in 2002 to 37.0% in 2006 (Table 10). A decrease was experienced in all main fields, except unspecified types of non-clinicians. Of clinicians, the largest decreases in the proportion working 50 or more hours per week were for specialists (from 52.6% to 42.6%) and occupational health physicians (from 31.8% to 21.8%). The smallest was for hospital non-specialists (from 45.0% to 41.3%).
18
Table 10: Employed medical practitioners by field of medicine: average weekly hours worked and proportion working 50 hours or more, 2002 and 2006
2002 2006
Main field
Average weekly total
hours
Average weekly
clinical hours
% working 50 hours or
more in total
Average weekly total
hours
Average weekly
clinical hours
% working 50 hours or
more in total
Clinician 44.6 40.8 44.5 43.6 40.8 37.2
Primary care 41.1 38.5 35.2 39.5 37.9 27.9
Hospital non-specialist 46.0 44.3 45.0 47.3 46.2 41.3
Specialist 47.1 40.6 52.6 45.0 40.0 42.6
Specialist-in-training 49.8 47.4 54.4 49.7 47.9 48.2
Other clinician(a) . . . . . . 35.6 34.9 24.9
Non-clinician 41.6 10.6 41.7 39.5 11.6 34.4
Administrator 46.2 11.3 54.3 44.4 12.3 46.2
Teacher/educator 37.4 10.3 35.5 35.0 11.6 27.3
Researcher 43.9 10.3 44.8 43.0 11.4 40.6
Public health physician 41.9 9.9 33.2 41.7 12.4 28.6
Occupational health physician 38.3 10.2 31.8 35.8 9.6 21.8
Other non-clinician(b) 26.2 9.0 13.5 27.1 9.9 13.8
Total 44.4 39.6 44.3 43.3 39.9 37.0
(a) In 2006, main area of clinical practice included the new category of Other clinician.
(b) Other non-clinician includes medico-legal physician.
Sources: AIHW Medical Labour Force Surveys, 2002 and 2006.
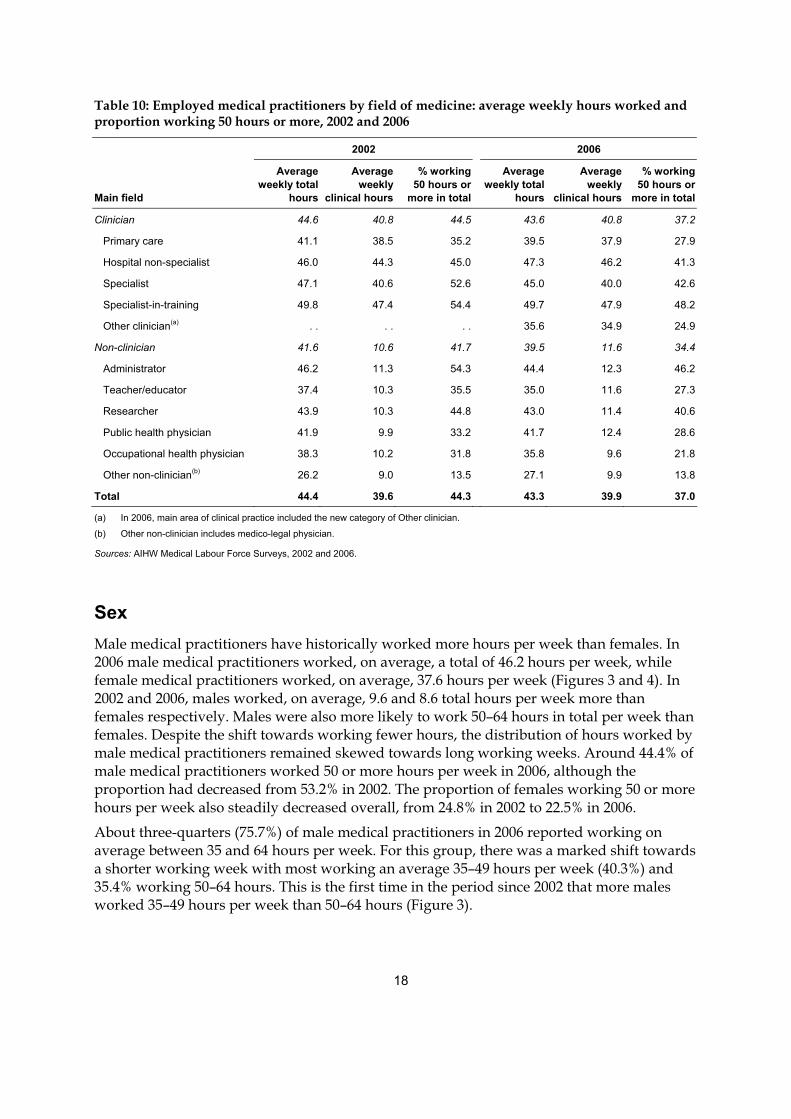
Sex Male medical practitioners have historically worked more hours per week than females. In 2006 male medical practitioners worked, on average, a total of 46.2 hours per week, while female medical practitioners worked, on average, 37.6 hours per week (Figures 3 and 4). In 2002 and 2006, males worked, on average, 9.6 and 8.6 total hours per week more than females respectively. Males were also more likely to work 50–64 hours in total per week than females. Despite the shift towards working fewer hours, the distribution of hours worked by male medical practitioners remained skewed towards long working weeks. Around 44.4% of male medical practitioners worked 50 or more hours per week in 2006, although the proportion had decreased from 53.2% in 2002. The proportion of females working 50 or more hours per week also steadily decreased overall, from 24.8% in 2002 to 22.5% in 2006.
About three-quarters (75.7%) of male medical practitioners in 2006 reported working on average between 35 and 64 hours per week. For this group, there was a marked shift towards a shorter working week with most working an average 35–49 hours per week (40.3%) and 35.4% working 50–64 hours. This is the first time in the period since 2002 that more males worked 35–49 hours per week than 50–64 hours (Figure 3).
19
Sources: AIHW Medical Labour Force Surveys, 2002 to 2006.
Figure 3: Employed male medical practitioners by total hours worked per week, 2002 to 2006
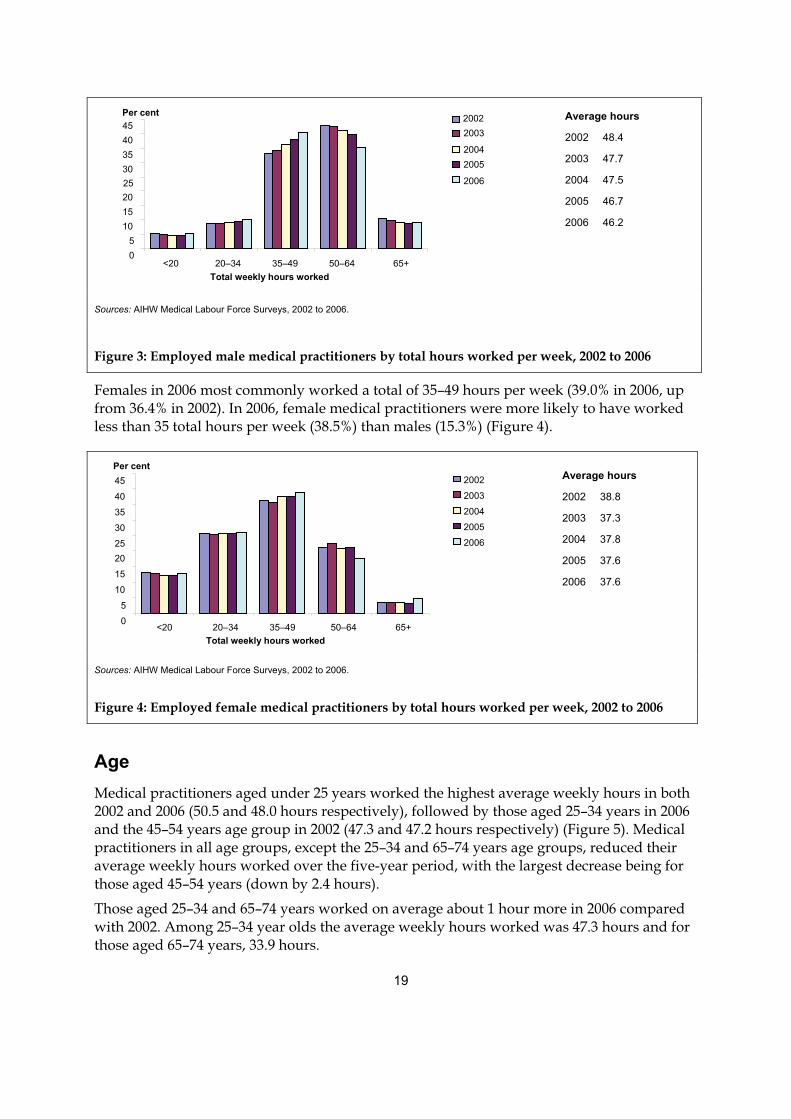
Females in 2006 most commonly worked a total of 35–49 hours per week (39.0% in 2006, up from 36.4% in 2002). In 2006, female medical practitioners were more likely to have worked less than 35 total hours per week (38.5%) than males (15.3%) (Figure 4).
Sources: AIHW Medical Labour Force Surveys, 2002 to 2006.
Figure 4: Employed female medical practitioners by total hours worked per week, 2002 to 2006
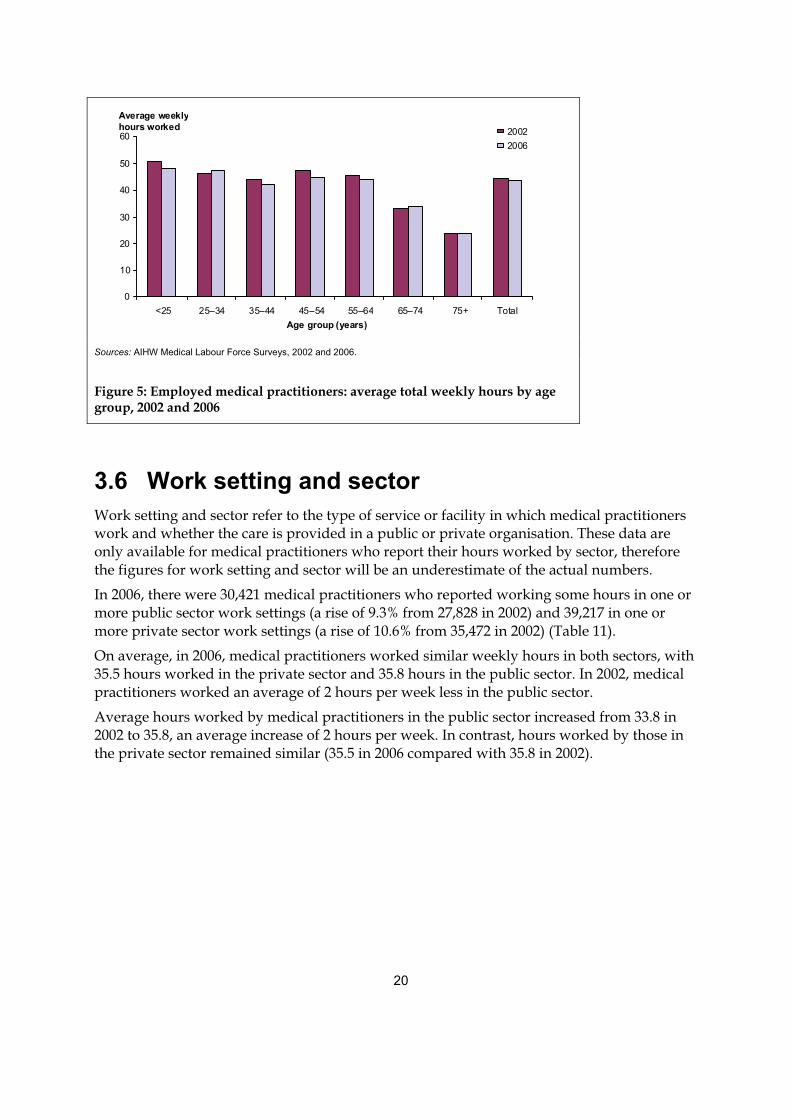
Age Medical practitioners aged under 25 years worked the highest average weekly hours in both 2002 and 2006 (50.5 and 48.0 hours respectively), followed by those aged 25–34 years in 2006 and the 45–54 years age group in 2002 (47.3 and 47.2 hours respectively) (Figure 5). Medical practitioners in all age groups, except the 25–34 and 65–74 years age groups, reduced their average weekly hours worked over the five-year period, with the largest decrease being for those aged 45–54 years (down by 2.4 hours).
Those aged 25–34 and 65–74 years worked on average about 1 hour more in 2006 compared with 2002. Among 25–34 year olds the average weekly hours worked was 47.3 hours and for those aged 65–74 years, 33.9 hours.
05
10 15 20 25 30 35 40 45
<20 20–34 35–49 50–64 65+Total weekly hours worked
Per cent2002
2003
2004
2005
2006
Average hours
2002 38.8
2003 37.3
2004 37.8
2005 37.6
2006 37.6
Average hours
2002 48.4
2003 47.7
2004 47.5
2005 46.7
2006 46.2
0 5
10 15 20 25 30 35 40 45
<20 20–34 35–49 50–64 65+Total weekly hours worked
2003
20042005
2006
Per cent 2002
20
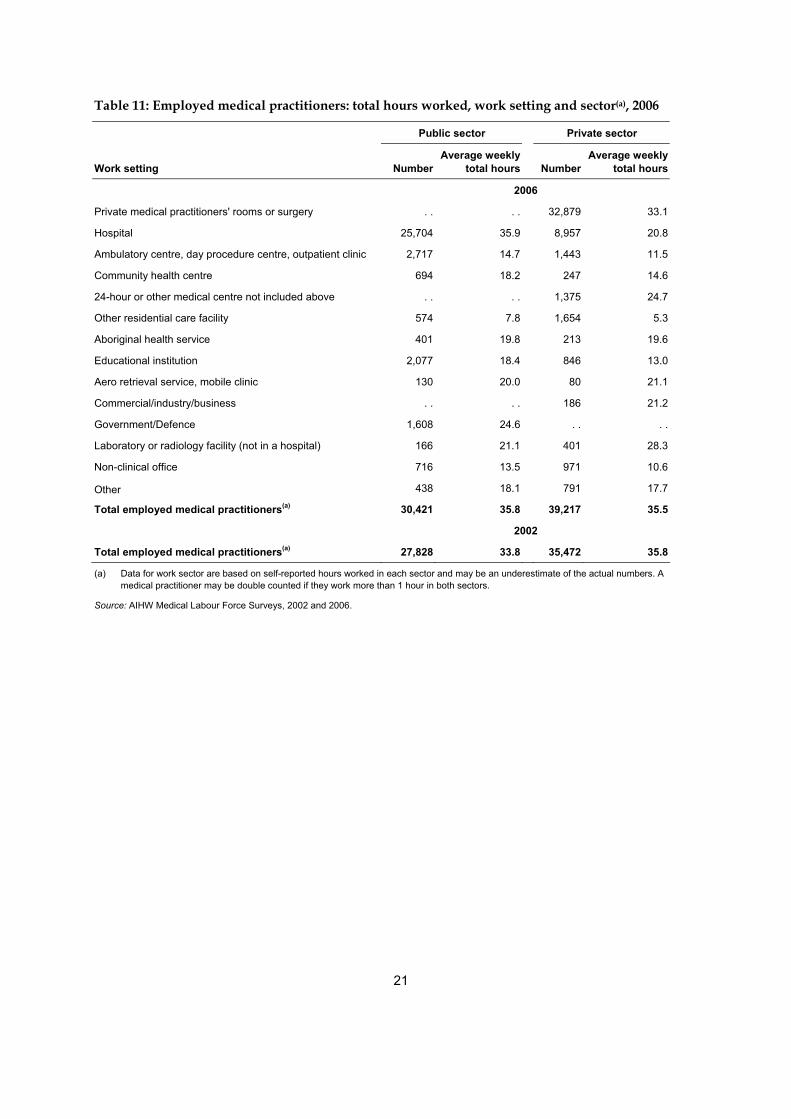
3.6 Work setting and sector Work setting and sector refer to the type of service or facility in which medical practitioners work and whether the care is provided in a public or private organisation. These data are only available for medical practitioners who report their hours worked by sector, therefore the figures for work setting and sector will be an underestimate of the actual numbers.
In 2006, there were 30,421 medical practitioners who reported working some hours in one or more public sector work settings (a rise of 9.3% from 27,828 in 2002) and 39,217 in one or more private sector work settings (a rise of 10.6% from 35,472 in 2002) (Table 11).
On average, in 2006, medical practitioners worked similar weekly hours in both sectors, with 35.5 hours worked in the private sector and 35.8 hours in the public sector. In 2002, medical practitioners worked an average of 2 hours per week less in the public sector.
Average hours worked by medical practitioners in the public sector increased from 33.8 in 2002 to 35.8, an average increase of 2 hours per week. In contrast, hours worked by those in the private sector remained similar (35.5 in 2006 compared with 35.8 in 2002).
0
10
20
30
40
50
60
<25 25–34 35–44 45–54 55–64 65–74 75+ TotalAge group (years)
Average weekly hours worked 2002
2006
Sources: AIHW Medical Labour Force Surveys, 2002 and 2006.
Figure 5: Employed medical practitioners: average total weekly hours by age group, 2002 and 2006
21
Table 11: Employed medical practitioners: total hours worked, work setting and sector(a), 2006
Public sector Private sector
Work setting NumberAverage weekly
total hours Number Average weekly
total hours
2006
Private medical practitioners' rooms or surgery . . . . 32,879 33.1
Hospital 25,704 35.9 8,957 20.8
Ambulatory centre, day procedure centre, outpatient clinic 2,717 14.7 1,443 11.5
Community health centre 694 18.2 247 14.6
24-hour or other medical centre not included above . . . . 1,375 24.7
Other residential care facility 574 7.8 1,654 5.3
Aboriginal health service 401 19.8 213 19.6
Educational institution 2,077 18.4 846 13.0
Aero retrieval service, mobile clinic 130 20.0 80 21.1
Commercial/industry/business . . . . 186 21.2
Government/Defence 1,608 24.6 . . . .
Laboratory or radiology facility (not in a hospital) 166 21.1 401 28.3
Non-clinical office 716 13.5 971 10.6
Other 438 18.1 791 17.7
Total employed medical practitioners(a) 30,421 35.8 39,217 35.5
2002
Total employed medical practitioners(a) 27,828 33.8 35,472 35.8
(a) Data for work sector are based on self-reported hours worked in each sector and may be an underestimate of the actual numbers. A medical practitioner may be double counted if they work more than 1 hour in both sectors.
Source: AIHW Medical Labour Force Surveys, 2002 and 2006.
22
4 Supply of practitioners
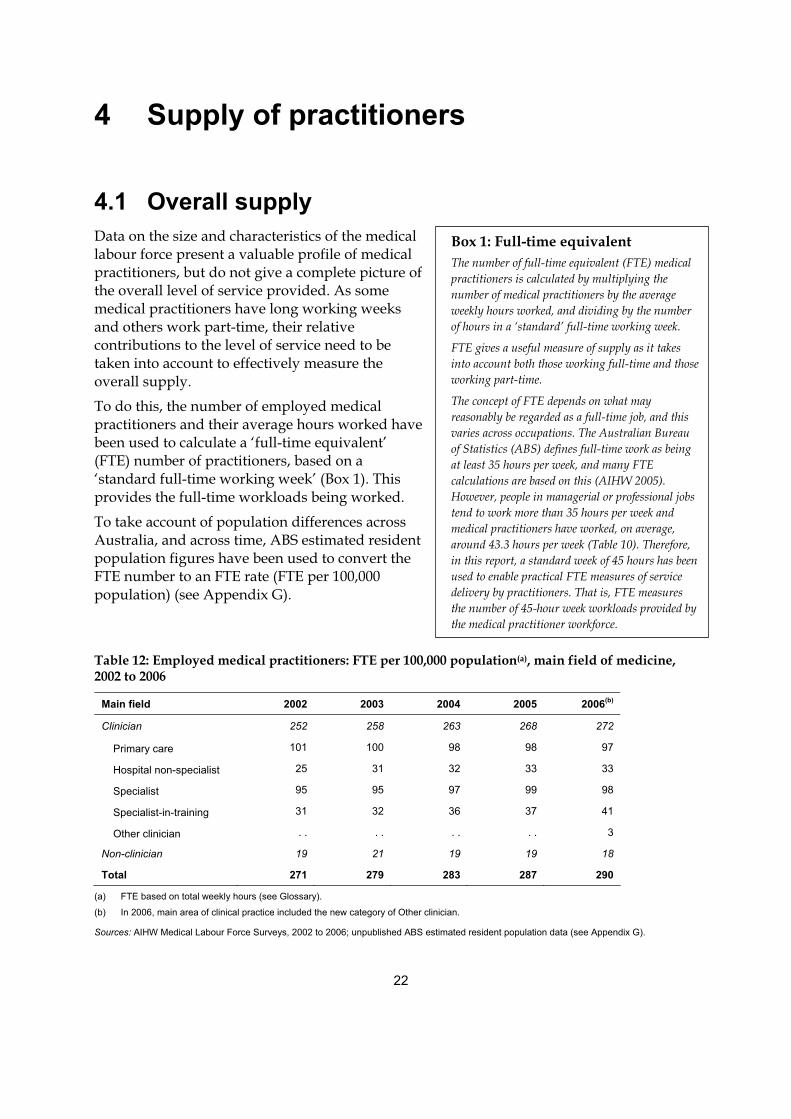
4.1 Overall supply Data on the size and characteristics of the medical labour force present a valuable profile of medical practitioners, but do not give a complete picture of the overall level of service provided. As some medical practitioners have long working weeks and others work part-time, their relative contributions to the level of service need to be taken into account to effectively measure the overall supply.
To do this, the number of employed medical practitioners and their average hours worked have been used to calculate a ‘full-time equivalent’ (FTE) number of practitioners, based on a ‘standard full-time working week’ (Box 1). This provides the full-time workloads being worked.
To take account of population differences across Australia, and across time, ABS estimated resident population figures have been used to convert the FTE number to an FTE rate (FTE per 100,000 population) (see Appendix G).
Table 12: Employed medical practitioners: FTE per 100,000 population(a), main field of medicine, 2002 to 2006
Main field 2002 2003 2004 2005 2006(b)
Clinician 252 258 263 268 272
Primary care 101 100 98 98 97
Hospital non-specialist 25 31 32 33 33
Specialist 95 95 97 99 98
Specialist-in-training 31 32 36 37 41
Other clinician . . . . . . . . 3
Non-clinician 19 21 19 19 18
Total 271 279 283 287 290
(a) FTE based on total weekly hours (see Glossary).
(b) In 2006, main area of clinical practice included the new category of Other clinician.
Sources: AIHW Medical Labour Force Surveys, 2002 to 2006; unpublished ABS estimated resident population data (see Appendix G).
Box 1: Full-time equivalent The number of full-time equivalent (FTE) medical practitioners is calculated by multiplying the number of medical practitioners by the average weekly hours worked, and dividing by the number of hours in a ‘standard’ full-time working week.
FTE gives a useful measure of supply as it takes into account both those working full-time and those working part-time.
The concept of FTE depends on what may reasonably be regarded as a full-time job, and this varies across occupations. The Australian Bureau of Statistics (ABS) defines full-time work as being at least 35 hours per week, and many FTE calculations are based on this (AIHW 2005). However, people in managerial or professional jobs tend to work more than 35 hours per week and medical practitioners have worked, on average, around 43.3 hours per week (Table 10). Therefore, in this report, a standard week of 45 hours has been used to enable practical FTE measures of service delivery by practitioners. That is, FTE measures the number of 45-hour week workloads provided by the medical practitioner workforce.
23
The FTE rate indicates that the overall supply of medical practitioners was higher in 2006 than in 2002 (290 and 271 FTE per 100,000 population respectively) (Table 12).
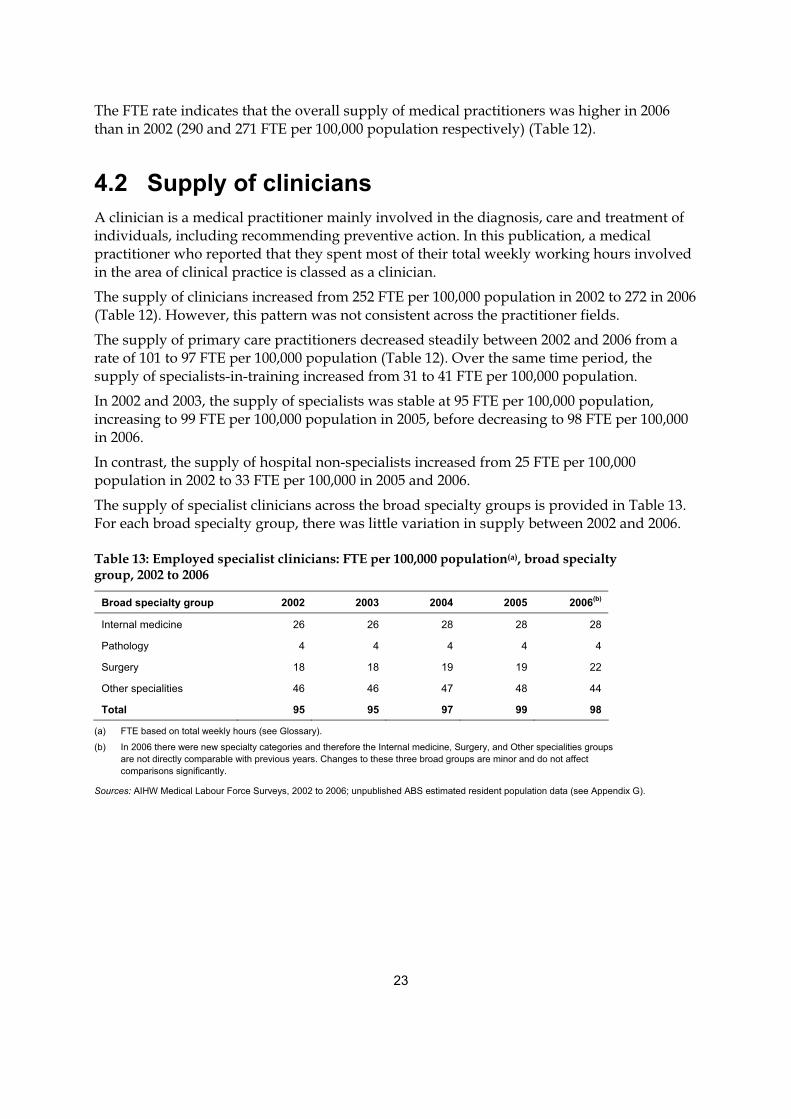
4.2 Supply of clinicians A clinician is a medical practitioner mainly involved in the diagnosis, care and treatment of individuals, including recommending preventive action. In this publication, a medical practitioner who reported that they spent most of their total weekly working hours involved in the area of clinical practice is classed as a clinician.
The supply of clinicians increased from 252 FTE per 100,000 population in 2002 to 272 in 2006 (Table 12). However, this pattern was not consistent across the practitioner fields.
The supply of primary care practitioners decreased steadily between 2002 and 2006 from a rate of 101 to 97 FTE per 100,000 population (Table 12). Over the same time period, the supply of specialists-in-training increased from 31 to 41 FTE per 100,000 population.
In 2002 and 2003, the supply of specialists was stable at 95 FTE per 100,000 population, increasing to 99 FTE per 100,000 population in 2005, before decreasing to 98 FTE per 100,000 in 2006.
In contrast, the supply of hospital non-specialists increased from 25 FTE per 100,000 population in 2002 to 33 FTE per 100,000 in 2005 and 2006.
The supply of specialist clinicians across the broad specialty groups is provided in Table 13. For each broad specialty group, there was little variation in supply between 2002 and 2006.
Table 13: Employed specialist clinicians: FTE per 100,000 population(a), broad specialty group, 2002 to 2006
Broad specialty group 2002 2003 2004 2005 2006(b)
Internal medicine 26 26 28 28 28
Pathology 4 4 4 4 4
Surgery 18 18 19 19 22
Other specialities 46 46 47 48 44
Total 95 95 97 99 98
(a) FTE based on total weekly hours (see Glossary).
(b) In 2006 there were new specialty categories and therefore the Internal medicine, Surgery, and Other specialities groups are not directly comparable with previous years. Changes to these three broad groups are minor and do not affect comparisons significantly.
Sources: AIHW Medical Labour Force Surveys, 2002 to 2006; unpublished ABS estimated resident population data (see Appendix G).
24
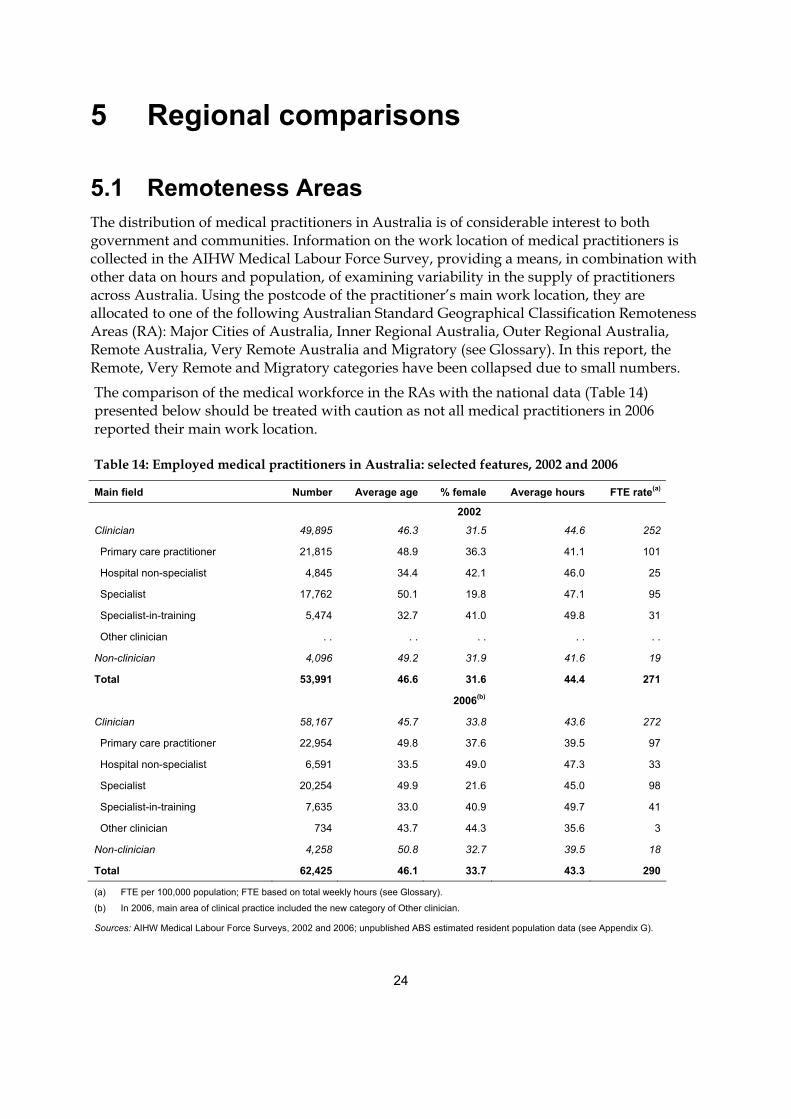
5 Regional comparisons
5.1 Remoteness Areas The distribution of medical practitioners in Australia is of considerable interest to both government and communities. Information on the work location of medical practitioners is collected in the AIHW Medical Labour Force Survey, providing a means, in combination with other data on hours and population, of examining variability in the supply of practitioners across Australia. Using the postcode of the practitioner’s main work location, they are allocated to one of the following Australian Standard Geographical Classification Remoteness Areas (RA): Major Cities of Australia, Inner Regional Australia, Outer Regional Australia, Remote Australia, Very Remote Australia and Migratory (see Glossary). In this report, the Remote, Very Remote and Migratory categories have been collapsed due to small numbers.
The comparison of the medical workforce in the RAs with the national data (Table 14) presented below should be treated with caution as not all medical practitioners in 2006 reported their main work location.
Table 14: Employed medical practitioners in Australia: selected features, 2002 and 2006
Main field Number Average age % female Average hours FTE rate(a)
2002
Clinician 49,895 46.3 31.5 44.6 252
Primary care practitioner 21,815 48.9 36.3 41.1 101
Hospital non-specialist 4,845 34.4 42.1 46.0 25
Specialist 17,762 50.1 19.8 47.1 95
Specialist-in-training 5,474 32.7 41.0 49.8 31
Other clinician . . . . . . . . . .
Non-clinician 4,096 49.2 31.9 41.6 19
Total 53,991 46.6 31.6 44.4 271
2006(b)
Clinician 58,167 45.7 33.8 43.6 272
Primary care practitioner 22,954 49.8 37.6 39.5 97
Hospital non-specialist 6,591 33.5 49.0 47.3 33
Specialist 20,254 49.9 21.6 45.0 98
Specialist-in-training 7,635 33.0 40.9 49.7 41
Other clinician 734 43.7 44.3 35.6 3
Non-clinician 4,258 50.8 32.7 39.5 18
Total 62,425 46.1 33.7 43.3 290
(a) FTE per 100,000 population; FTE based on total weekly hours (see Glossary).
(b) In 2006, main area of clinical practice included the new category of Other clinician.
Sources: AIHW Medical Labour Force Surveys, 2002 and 2006; unpublished ABS estimated resident population data (see Appendix G).
25
In 2006, some 60,802 (97.4%) of the 62,425 estimated employed medical practitioners in Australia reported the area of their main work location in the four weeks prior to the survey i.e. 1,623 employed medical practitioners could not be allocated to a RA. Among this group, 80.9% (49,177) work in Major Cities, 12.7% (7,728) in Inner Regional areas, 5.0% (3,026) in Outer Regional areas and 1.4% (871) in Remote/Very Remote areas (Tables 14–18).
Of the 22,426 primary care practitioner clinicians who reported their main work location in 2006, 72.8% (16,318) were working mainly in Major Cities, 17.4% (3,908) in Inner Regional areas, 7.6% (1,709) in Outer Regional areas and 2.2% (491) in Remote/Very Remote areas.
This number, while small relative to the total number of employed medical practitioners, is larger than the number who reported that their main work location was in a Remote/Very Remote area (871). It should also be noted that, because of the missing values, the national figures for numbers and rates, in Table 14, are greater than the sum of the individual RAs (Tables 15–18).
In 2006, the overall supply of medical practitioners in Australia was estimated to be 290 FTE per 100,000 population (Table 14). This varied considerably across RAs, estimated to be 332 FTE per 100,000 population in Major Cities, 184 FTE in Inner Regional, 154 in Outer Regional and 191 in Remote/Very Remote areas (Tables 15–18). For clinicians in primary care practice, however, supply was less varied. In 2006, it is estimated that there were 98 FTE primary care practitioners employed per 100,000 population in Major Cities, 87 in Inner Regional, 86 in Outer Regional and 108 in Remote/Very Remote areas.
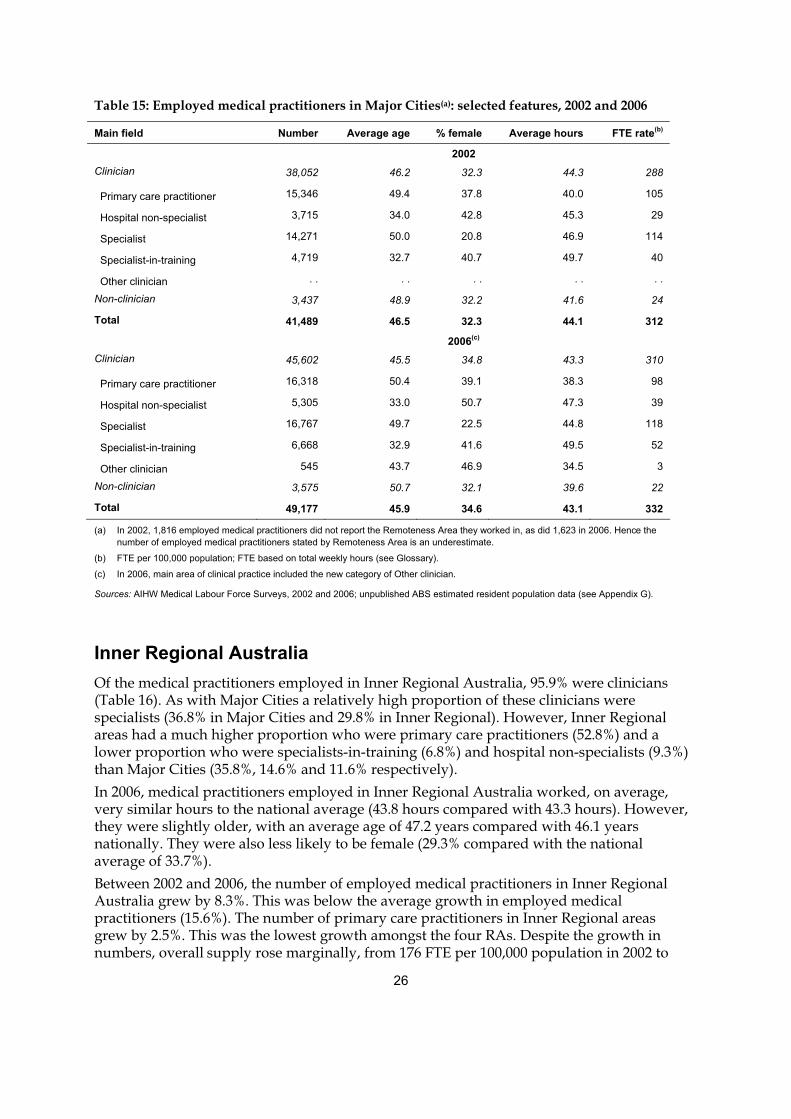
Major Cities of Australia Of the medical practitioners employed in Major Cities in 2006, 92.7% were clinicians. Of employed clinicians, 36.8% were specialists, 35.8% were primary care practitioners, 14.6% specialists-in-training and 11.6% hospital non-specialists (Table 15). The proportion of specialists and specialists-in-training was higher in this area than any other RA. The proportion of primary care practitioners was the lowest of the four RAs. This indicates that the medical practitioner population is more diverse in Major Cities than in the other RAs.
In 2006 around one-third (34.6%) of medical practitioners in Major Cities were female, the highest proportion of the four RAs. The average age of medical practitioners in Major Cities was 45.9 years, which was slightly lower than the national average in 2006 of 46.1 years (Table 14). These differences reflect, in part, the different fields of practice in Major Cities compared with other RAs, with a relatively high proportion of specialists-in-training and hospital non-specialists (who are younger, on average, and more often female than other medical practitioners).
Between 2002 and 2006, the number of employed medical practitioners in Major Cities increased by 18.5%. For clinicians, overall, the increase was 19.8%. Amongst clinicians, the largest increase over the period occurred for hospital non-specialists (42.8%) followed by specialists-in-training (41.3%).
There was also a rise in the supply of medical practitioners of 20 FTE per 100,000 population, and 22 FTE per 100,000 population for clinicians, from 2002 to 2006. However, over the same period, the supply of primary care clinicians decreased by 7 FTE per 100,000 to 98 FTE per 100,000 population in 2006. This drop is largely a result of a decline in the average hours worked by primary care practitioners in this RA.
26
Table 15: Employed medical practitioners in Major Cities(a): selected features, 2002 and 2006
Main field Number Average age % female Average hours FTE rate(b)
2002 Clinician 38,052 46.2 32.3 44.3 288
Primary care practitioner 15,346 49.4 37.8 40.0 105
Hospital non-specialist 3,715 34.0 42.8 45.3 29
Specialist 14,271 50.0 20.8 46.9 114
Specialist-in-training 4,719 32.7 40.7 49.7 40
Other clinician . . . . . . . . . .
Non-clinician 3,437 48.9 32.2 41.6 24
Total 41,489 46.5 32.3 44.1 312
2006(c) Clinician 45,602 45.5 34.8 43.3 310
Primary care practitioner 16,318 50.4 39.1 38.3 98
Hospital non-specialist 5,305 33.0 50.7 47.3 39
Specialist 16,767 49.7 22.5 44.8 118
Specialist-in-training 6,668 32.9 41.6 49.5 52
Other clinician 545 43.7 46.9 34.5 3
Non-clinician 3,575 50.7 32.1 39.6 22
Total 49,177 45.9 34.6 43.1 332
(a) In 2002, 1,816 employed medical practitioners did not report the Remoteness Area they worked in, as did 1,623 in 2006. Hence the number of employed medical practitioners stated by Remoteness Area is an underestimate.
(b) FTE per 100,000 population; FTE based on total weekly hours (see Glossary).
(c) In 2006, main area of clinical practice included the new category of Other clinician.
Sources: AIHW Medical Labour Force Surveys, 2002 and 2006; unpublished ABS estimated resident population data (see Appendix G).
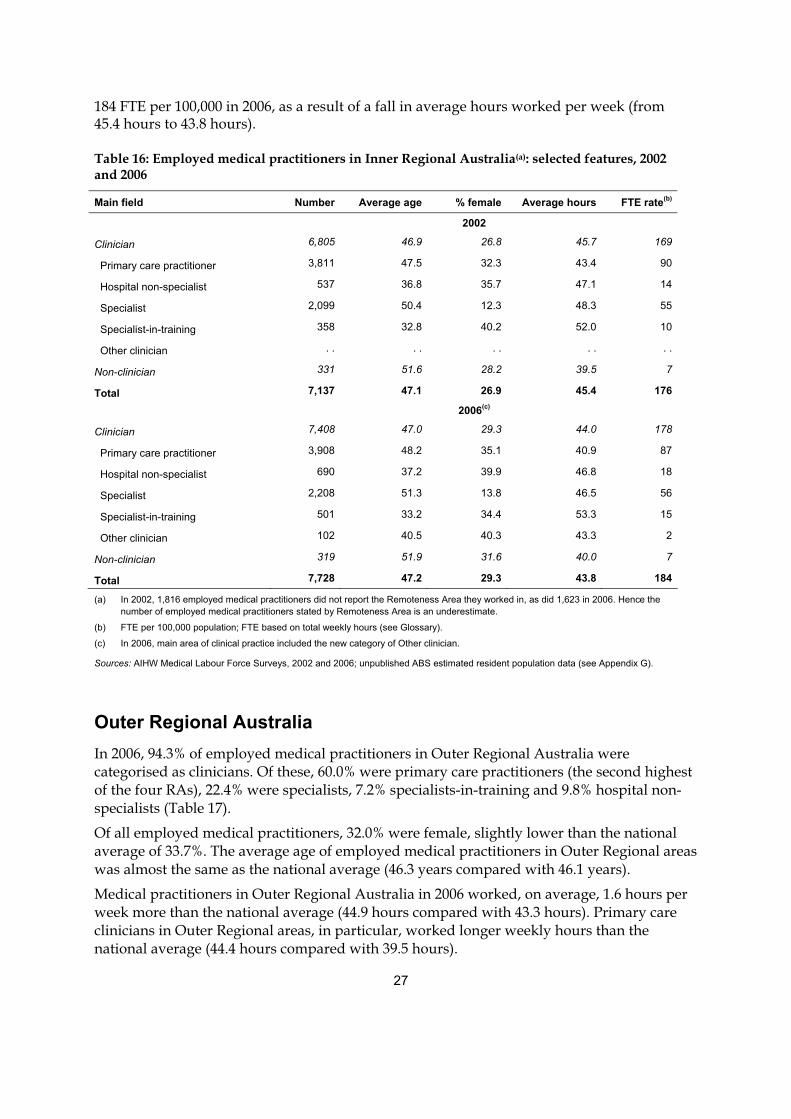
Inner Regional Australia Of the medical practitioners employed in Inner Regional Australia, 95.9% were clinicians (Table 16). As with Major Cities a relatively high proportion of these clinicians were specialists (36.8% in Major Cities and 29.8% in Inner Regional). However, Inner Regional areas had a much higher proportion who were primary care practitioners (52.8%) and a lower proportion who were specialists-in-training (6.8%) and hospital non-specialists (9.3%) than Major Cities (35.8%, 14.6% and 11.6% respectively). In 2006, medical practitioners employed in Inner Regional Australia worked, on average, very similar hours to the national average (43.8 hours compared with 43.3 hours). However, they were slightly older, with an average age of 47.2 years compared with 46.1 years nationally. They were also less likely to be female (29.3% compared with the national average of 33.7%). Between 2002 and 2006, the number of employed medical practitioners in Inner Regional Australia grew by 8.3%. This was below the average growth in employed medical practitioners (15.6%). The number of primary care practitioners in Inner Regional areas grew by 2.5%. This was the lowest growth amongst the four RAs. Despite the growth in numbers, overall supply rose marginally, from 176 FTE per 100,000 population in 2002 to
27
184 FTE per 100,000 in 2006, as a result of a fall in average hours worked per week (from 45.4 hours to 43.8 hours).
Table 16: Employed medical practitioners in Inner Regional Australia(a): selected features, 2002 and 2006
Main field Number Average age % female Average hours FTE rate(b)
2002
Clinician 6,805 46.9 26.8 45.7 169
Primary care practitioner 3,811 47.5 32.3 43.4 90
Hospital non-specialist 537 36.8 35.7 47.1 14
Specialist 2,099 50.4 12.3 48.3 55
Specialist-in-training 358 32.8 40.2 52.0 10
Other clinician . . . . . . . . . .
Non-clinician 331 51.6 28.2 39.5 7
Total 7,137 47.1 26.9 45.4 176
2006(c)
Clinician 7,408 47.0 29.3 44.0 178
Primary care practitioner 3,908 48.2 35.1 40.9 87
Hospital non-specialist 690 37.2 39.9 46.8 18
Specialist 2,208 51.3 13.8 46.5 56
Specialist-in-training 501 33.2 34.4 53.3 15
Other clinician 102 40.5 40.3 43.3 2
Non-clinician 319 51.9 31.6 40.0 7
Total 7,728 47.2 29.3 43.8 184
(a) In 2002, 1,816 employed medical practitioners did not report the Remoteness Area they worked in, as did 1,623 in 2006. Hence the number of employed medical practitioners stated by Remoteness Area is an underestimate.
(b) FTE per 100,000 population; FTE based on total weekly hours (see Glossary).
(c) In 2006, main area of clinical practice included the new category of Other clinician.
Sources: AIHW Medical Labour Force Surveys, 2002 and 2006; unpublished ABS estimated resident population data (see Appendix G).
Outer Regional Australia In 2006, 94.3% of employed medical practitioners in Outer Regional Australia were categorised as clinicians. Of these, 60.0% were primary care practitioners (the second highest of the four RAs), 22.4% were specialists, 7.2% specialists-in-training and 9.8% hospital non-specialists (Table 17).
Of all employed medical practitioners, 32.0% were female, slightly lower than the national average of 33.7%. The average age of employed medical practitioners in Outer Regional areas was almost the same as the national average (46.3 years compared with 46.1 years).
Medical practitioners in Outer Regional Australia in 2006 worked, on average, 1.6 hours per week more than the national average (44.9 hours compared with 43.3 hours). Primary care clinicians in Outer Regional areas, in particular, worked longer weekly hours than the national average (44.4 hours compared with 39.5 hours).
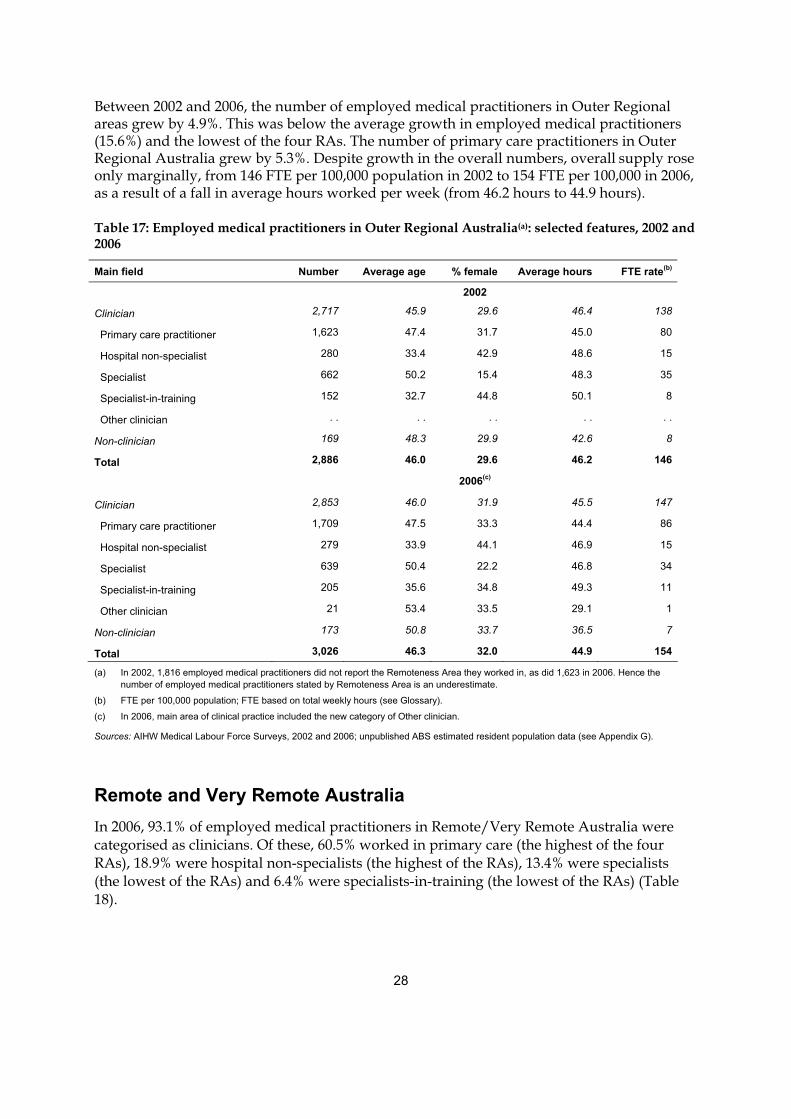
28
Between 2002 and 2006, the number of employed medical practitioners in Outer Regional areas grew by 4.9%. This was below the average growth in employed medical practitioners (15.6%) and the lowest of the four RAs. The number of primary care practitioners in Outer Regional Australia grew by 5.3%. Despite growth in the overall numbers, overall supply rose only marginally, from 146 FTE per 100,000 population in 2002 to 154 FTE per 100,000 in 2006, as a result of a fall in average hours worked per week (from 46.2 hours to 44.9 hours).
Table 17: Employed medical practitioners in Outer Regional Australia(a): selected features, 2002 and 2006
Main field Number Average age % female Average hours FTE rate(b)
2002
Clinician 2,717 45.9 29.6 46.4 138
Primary care practitioner 1,623 47.4 31.7 45.0 80
Hospital non-specialist 280 33.4 42.9 48.6 15
Specialist 662 50.2 15.4 48.3 35
Specialist-in-training 152 32.7 44.8 50.1 8
Other clinician . . . . . . . . . .
Non-clinician 169 48.3 29.9 42.6 8
Total 2,886 46.0 29.6 46.2 146
2006(c)
Clinician 2,853 46.0 31.9 45.5 147
Primary care practitioner 1,709 47.5 33.3 44.4 86
Hospital non-specialist 279 33.9 44.1 46.9 15
Specialist 639 50.4 22.2 46.8 34
Specialist-in-training 205 35.6 34.8 49.3 11
Other clinician 21 53.4 33.5 29.1 1
Non-clinician 173 50.8 33.7 36.5 7
Total 3,026 46.3 32.0 44.9 154
(a) In 2002, 1,816 employed medical practitioners did not report the Remoteness Area they worked in, as did 1,623 in 2006. Hence the number of employed medical practitioners stated by Remoteness Area is an underestimate.
(b) FTE per 100,000 population; FTE based on total weekly hours (see Glossary).
(c) In 2006, main area of clinical practice included the new category of Other clinician.
Sources: AIHW Medical Labour Force Surveys, 2002 and 2006; unpublished ABS estimated resident population data (see Appendix G).
Remote and Very Remote Australia In 2006, 93.1% of employed medical practitioners in Remote/Very Remote Australia were categorised as clinicians. Of these, 60.5% worked in primary care (the highest of the four RAs), 18.9% were hospital non-specialists (the highest of the RAs), 13.4% were specialists (the lowest of the RAs) and 6.4% were specialists-in-training (the lowest of the RAs) (Table 18).
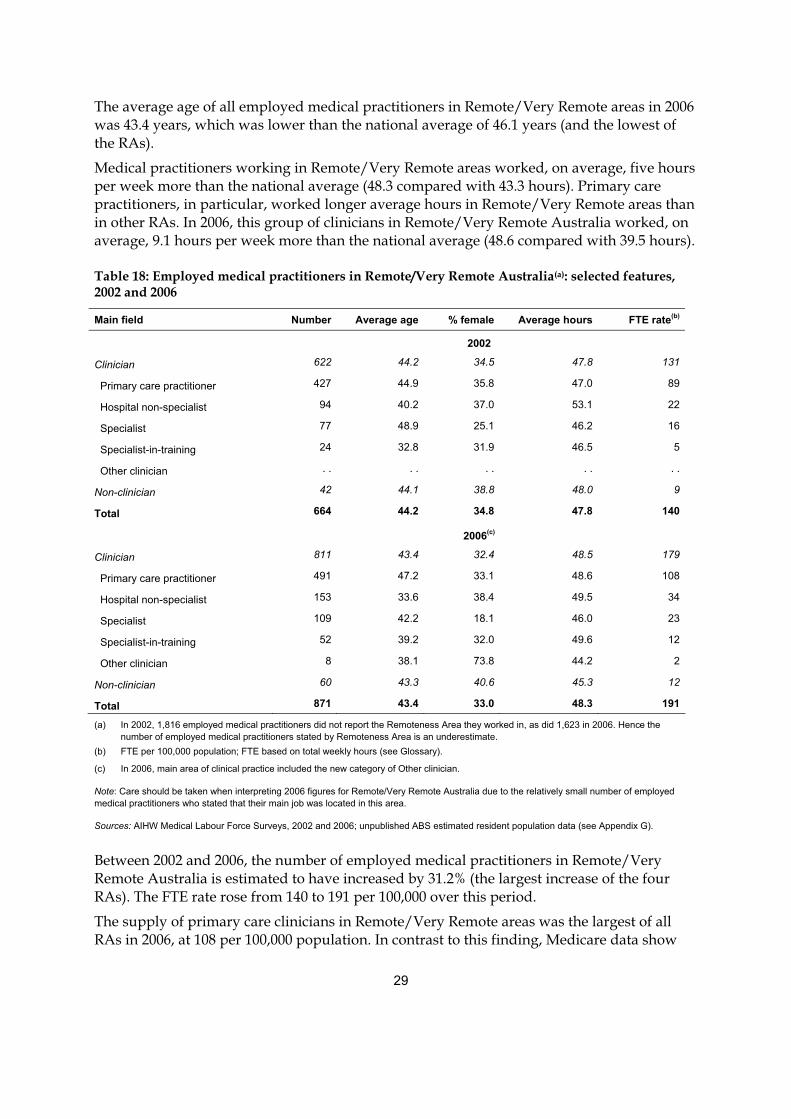
29
The average age of all employed medical practitioners in Remote/Very Remote areas in 2006 was 43.4 years, which was lower than the national average of 46.1 years (and the lowest of the RAs).
Medical practitioners working in Remote/Very Remote areas worked, on average, five hours per week more than the national average (48.3 compared with 43.3 hours). Primary care practitioners, in particular, worked longer average hours in Remote/Very Remote areas than in other RAs. In 2006, this group of clinicians in Remote/Very Remote Australia worked, on average, 9.1 hours per week more than the national average (48.6 compared with 39.5 hours).
Table 18: Employed medical practitioners in Remote/Very Remote Australia(a): selected features, 2002 and 2006
Main field Number Average age % female Average hours FTE rate(b)
2002
Clinician 622 44.2 34.5 47.8 131
Primary care practitioner 427 44.9 35.8 47.0 89
Hospital non-specialist 94 40.2 37.0 53.1 22
Specialist 77 48.9 25.1 46.2 16
Specialist-in-training 24 32.8 31.9 46.5 5
Other clinician . . . . . . . . . .
Non-clinician 42 44.1 38.8 48.0 9
Total 664 44.2 34.8 47.8 140
2006(c)
Clinician 811 43.4 32.4 48.5 179
Primary care practitioner 491 47.2 33.1 48.6 108
Hospital non-specialist 153 33.6 38.4 49.5 34
Specialist 109 42.2 18.1 46.0 23
Specialist-in-training 52 39.2 32.0 49.6 12
Other clinician 8 38.1 73.8 44.2 2
Non-clinician 60 43.3 40.6 45.3 12
Total 871 43.4 33.0 48.3 191
(a) In 2002, 1,816 employed medical practitioners did not report the Remoteness Area they worked in, as did 1,623 in 2006. Hence the number of employed medical practitioners stated by Remoteness Area is an underestimate.
(b) FTE per 100,000 population; FTE based on total weekly hours (see Glossary).
(c) In 2006, main area of clinical practice included the new category of Other clinician.
Note: Care should be taken when interpreting 2006 figures for Remote/Very Remote Australia due to the relatively small number of employed medical practitioners who stated that their main job was located in this area.
Sources: AIHW Medical Labour Force Surveys, 2002 and 2006; unpublished ABS estimated resident population data (see Appendix G).
Between 2002 and 2006, the number of employed medical practitioners in Remote/Very Remote Australia is estimated to have increased by 31.2% (the largest increase of the four RAs). The FTE rate rose from 140 to 191 per 100,000 over this period.
The supply of primary care clinicians in Remote/Very Remote areas was the largest of all RAs in 2006, at 108 per 100,000 population. In contrast to this finding, Medicare data show
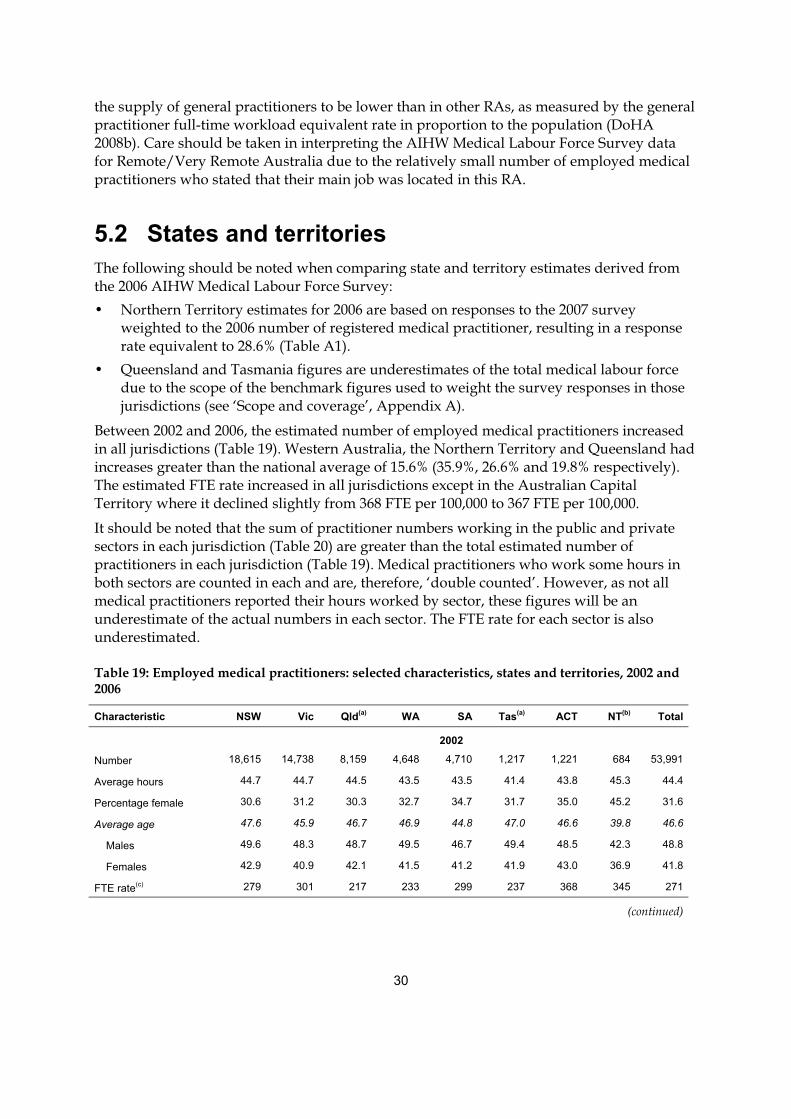
30
the supply of general practitioners to be lower than in other RAs, as measured by the general practitioner full-time workload equivalent rate in proportion to the population (DoHA 2008b). Care should be taken in interpreting the AIHW Medical Labour Force Survey data for Remote/Very Remote Australia due to the relatively small number of employed medical practitioners who stated that their main job was located in this RA.
5.2 States and territories The following should be noted when comparing state and territory estimates derived from the 2006 AIHW Medical Labour Force Survey: • Northern Territory estimates for 2006 are based on responses to the 2007 survey
weighted to the 2006 number of registered medical practitioner, resulting in a response rate equivalent to 28.6% (Table A1).
• Queensland and Tasmania figures are underestimates of the total medical labour force due to the scope of the benchmark figures used to weight the survey responses in those jurisdictions (see ‘Scope and coverage’, Appendix A).
Between 2002 and 2006, the estimated number of employed medical practitioners increased in all jurisdictions (Table 19). Western Australia, the Northern Territory and Queensland had increases greater than the national average of 15.6% (35.9%, 26.6% and 19.8% respectively). The estimated FTE rate increased in all jurisdictions except in the Australian Capital Territory where it declined slightly from 368 FTE per 100,000 to 367 FTE per 100,000.
It should be noted that the sum of practitioner numbers working in the public and private sectors in each jurisdiction (Table 20) are greater than the total estimated number of practitioners in each jurisdiction (Table 19). Medical practitioners who work some hours in both sectors are counted in each and are, therefore, ‘double counted’. However, as not all medical practitioners reported their hours worked by sector, these figures will be an underestimate of the actual numbers in each sector. The FTE rate for each sector is also underestimated.
Table 19: Employed medical practitioners: selected characteristics, states and territories, 2002 and 2006
Characteristic NSW Vic Qld(a) WA SA Tas(a) ACT NT(b) Total
2002
Number 18,615 14,738 8,159 4,648 4,710 1,217 1,221 684 53,991
Average hours 44.7 44.7 44.5 43.5 43.5 41.4 43.8 45.3 44.4
Percentage female 30.6 31.2 30.3 32.7 34.7 31.7 35.0 45.2 31.6
Average age 47.6 45.9 46.7 46.9 44.8 47.0 46.6 39.8 46.6
Males 49.6 48.3 48.7 49.5 46.7 49.4 48.5 42.3 48.8
Females 42.9 40.9 42.1 41.5 41.2 41.9 43.0 36.9 41.8
FTE rate(c) 279 301 217 233 299 237 368 345 271
(continued)
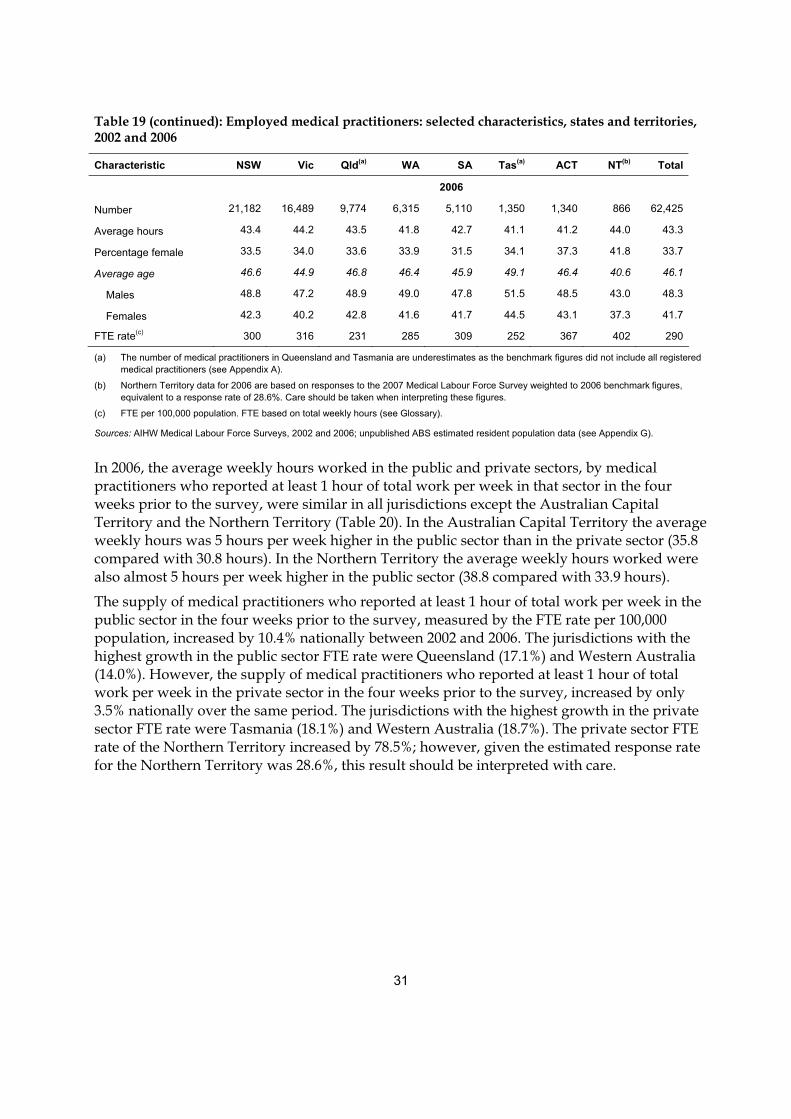
31
Table 19 (continued): Employed medical practitioners: selected characteristics, states and territories, 2002 and 2006
Characteristic NSW Vic Qld(a) WA SA Tas(a) ACT NT(b) Total
2006
Number 21,182 16,489 9,774 6,315 5,110 1,350 1,340 866 62,425
Average hours 43.4 44.2 43.5 41.8 42.7 41.1 41.2 44.0 43.3
Percentage female 33.5 34.0 33.6 33.9 31.5 34.1 37.3 41.8 33.7
Average age 46.6 44.9 46.8 46.4 45.9 49.1 46.4 40.6 46.1
Males 48.8 47.2 48.9 49.0 47.8 51.5 48.5 43.0 48.3
Females 42.3 40.2 42.8 41.6 41.7 44.5 43.1 37.3 41.7
FTE rate(c) 300 316 231 285 309 252 367 402 290
(a) The number of medical practitioners in Queensland and Tasmania are underestimates as the benchmark figures did not include all registered medical practitioners (see Appendix A).
(b) Northern Territory data for 2006 are based on responses to the 2007 Medical Labour Force Survey weighted to 2006 benchmark figures, equivalent to a response rate of 28.6%. Care should be taken when interpreting these figures.
(c) FTE per 100,000 population. FTE based on total weekly hours (see Glossary).
Sources: AIHW Medical Labour Force Surveys, 2002 and 2006; unpublished ABS estimated resident population data (see Appendix G).
In 2006, the average weekly hours worked in the public and private sectors, by medical practitioners who reported at least 1 hour of total work per week in that sector in the four weeks prior to the survey, were similar in all jurisdictions except the Australian Capital Territory and the Northern Territory (Table 20). In the Australian Capital Territory the average weekly hours was 5 hours per week higher in the public sector than in the private sector (35.8 compared with 30.8 hours). In the Northern Territory the average weekly hours worked were also almost 5 hours per week higher in the public sector (38.8 compared with 33.9 hours).
The supply of medical practitioners who reported at least 1 hour of total work per week in the public sector in the four weeks prior to the survey, measured by the FTE rate per 100,000 population, increased by 10.4% nationally between 2002 and 2006. The jurisdictions with the highest growth in the public sector FTE rate were Queensland (17.1%) and Western Australia (14.0%). However, the supply of medical practitioners who reported at least 1 hour of total work per week in the private sector in the four weeks prior to the survey, increased by only 3.5% nationally over the same period. The jurisdictions with the highest growth in the private sector FTE rate were Tasmania (18.1%) and Western Australia (18.7%). The private sector FTE rate of the Northern Territory increased by 78.5%; however, given the estimated response rate for the Northern Territory was 28.6%, this result should be interpreted with care.
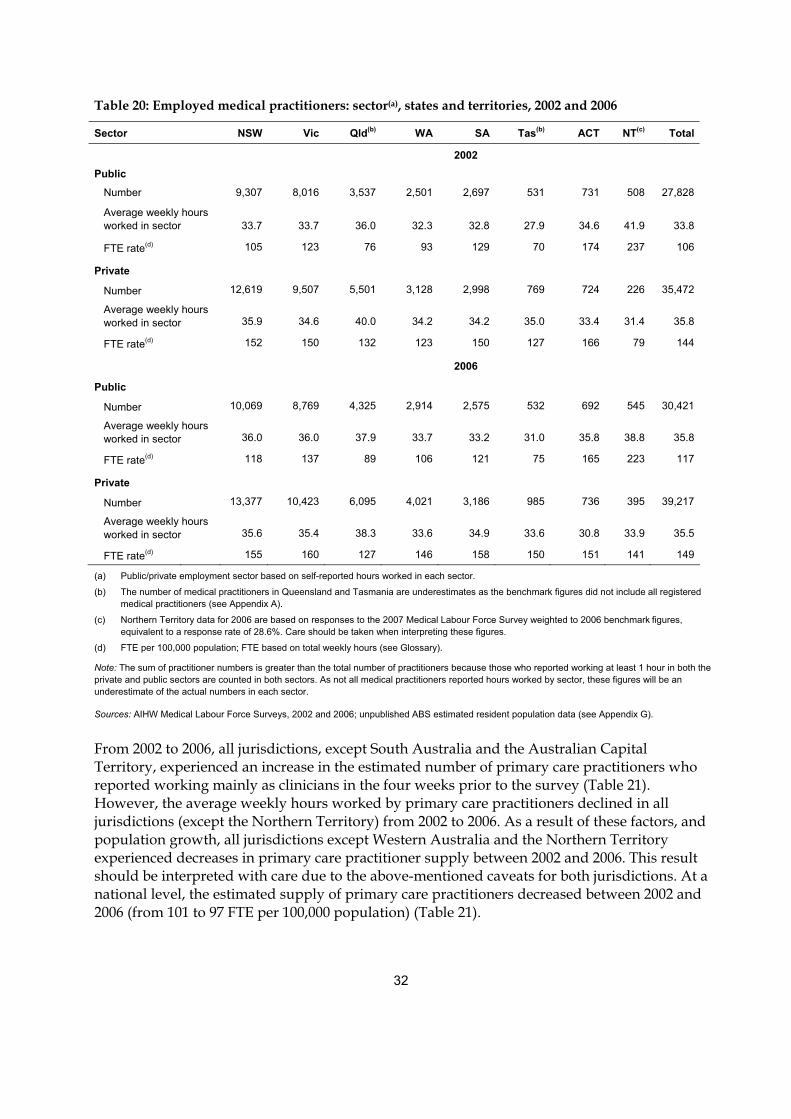
32
Table 20: Employed medical practitioners: sector(a), states and territories, 2002 and 2006
Sector NSW Vic Qld(b) WA SA Tas(b) ACT NT(c) Total
2002
Public
Number 9,307 8,016 3,537 2,501 2,697 531 731 508 27,828
Average weekly hours worked in sector 33.7 33.7 36.0 32.3 32.8 27.9 34.6 41.9 33.8
FTE rate(d) 105 123 76 93 129 70 174 237 106
Private
Number 12,619 9,507 5,501 3,128 2,998 769 724 226 35,472
Average weekly hours worked in sector 35.9 34.6 40.0 34.2 34.2 35.0 33.4 31.4 35.8
FTE rate(d) 152 150 132 123 150 127 166 79 144
2006
Public
Number 10,069 8,769 4,325 2,914 2,575 532 692 545 30,421
Average weekly hours worked in sector 36.0 36.0 37.9 33.7 33.2 31.0 35.8 38.8 35.8
FTE rate(d) 118 137 89 106 121 75 165 223 117
Private
Number 13,377 10,423 6,095 4,021 3,186 985 736 395 39,217
Average weekly hours worked in sector 35.6 35.4 38.3 33.6 34.9 33.6 30.8 33.9 35.5
FTE rate(d) 155 160 127 146 158 150 151 141 149
(a) Public/private employment sector based on self-reported hours worked in each sector.
(b) The number of medical practitioners in Queensland and Tasmania are underestimates as the benchmark figures did not include all registered medical practitioners (see Appendix A).
(c) Northern Territory data for 2006 are based on responses to the 2007 Medical Labour Force Survey weighted to 2006 benchmark figures, equivalent to a response rate of 28.6%. Care should be taken when interpreting these figures.
(d) FTE per 100,000 population; FTE based on total weekly hours (see Glossary).
Note: The sum of practitioner numbers is greater than the total number of practitioners because those who reported working at least 1 hour in both the private and public sectors are counted in both sectors. As not all medical practitioners reported hours worked by sector, these figures will be an underestimate of the actual numbers in each sector.
Sources: AIHW Medical Labour Force Surveys, 2002 and 2006; unpublished ABS estimated resident population data (see Appendix G).
From 2002 to 2006, all jurisdictions, except South Australia and the Australian Capital Territory, experienced an increase in the estimated number of primary care practitioners who reported working mainly as clinicians in the four weeks prior to the survey (Table 21). However, the average weekly hours worked by primary care practitioners declined in all jurisdictions (except the Northern Territory) from 2002 to 2006. As a result of these factors, and population growth, all jurisdictions except Western Australia and the Northern Territory experienced decreases in primary care practitioner supply between 2002 and 2006. This result should be interpreted with care due to the above-mentioned caveats for both jurisdictions. At a national level, the estimated supply of primary care practitioners decreased between 2002 and 2006 (from 101 to 97 FTE per 100,000 population) (Table 21).
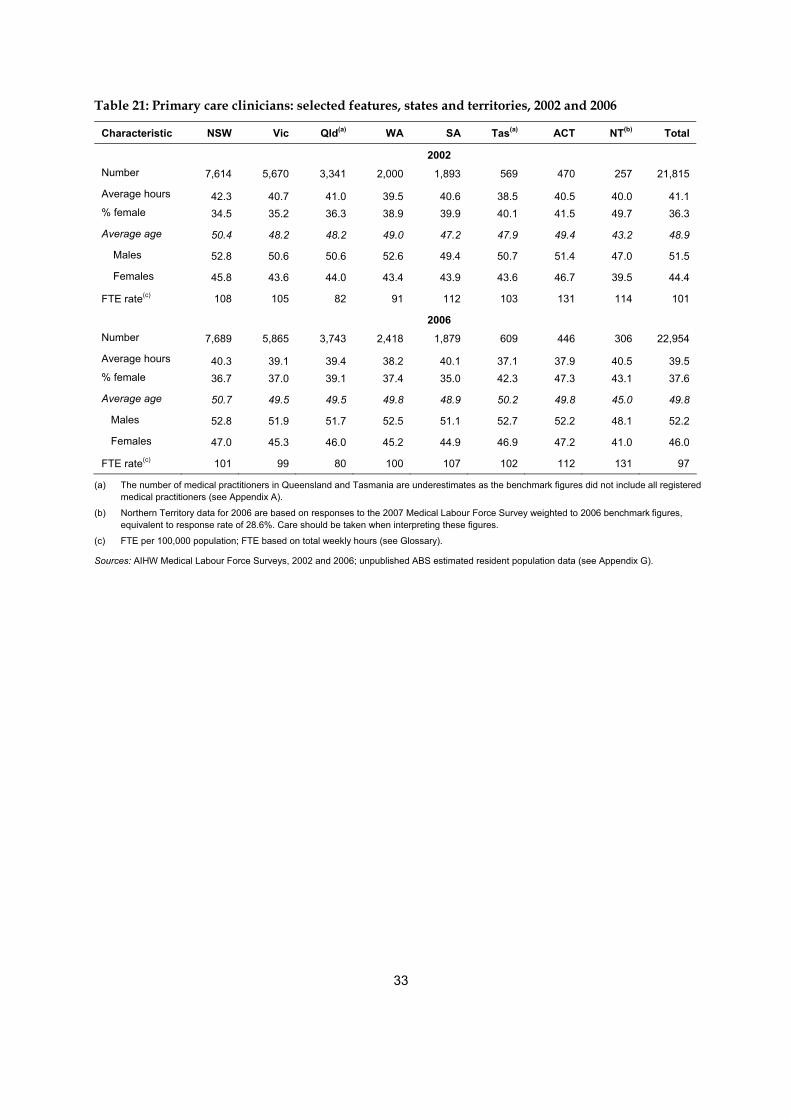
33
Table 21: Primary care clinicians: selected features, states and territories, 2002 and 2006
Characteristic NSW Vic Qld(a) WA SA Tas(a) ACT NT(b) Total
2002 Number 7,614 5,670 3,341 2,000 1,893 569 470 257 21,815
Average hours 42.3 40.7 41.0 39.5 40.6 38.5 40.5 40.0 41.1 % female 34.5 35.2 36.3 38.9 39.9 40.1 41.5 49.7 36.3
Average age 50.4 48.2 48.2 49.0 47.2 47.9 49.4 43.2 48.9
Males 52.8 50.6 50.6 52.6 49.4 50.7 51.4 47.0 51.5
Females 45.8 43.6 44.0 43.4 43.9 43.6 46.7 39.5 44.4
FTE rate(c) 108 105 82 91 112 103 131 114 101
2006 Number 7,689 5,865 3,743 2,418 1,879 609 446 306 22,954
Average hours 40.3 39.1 39.4 38.2 40.1 37.1 37.9 40.5 39.5 % female 36.7 37.0 39.1 37.4 35.0 42.3 47.3 43.1 37.6
Average age 50.7 49.5 49.5 49.8 48.9 50.2 49.8 45.0 49.8
Males 52.8 51.9 51.7 52.5 51.1 52.7 52.2 48.1 52.2
Females 47.0 45.3 46.0 45.2 44.9 46.9 47.2 41.0 46.0
FTE rate(c) 101 99 80 100 107 102 112 131 97
(a) The number of medical practitioners in Queensland and Tasmania are underestimates as the benchmark figures did not include all registered medical practitioners (see Appendix A).
(b) Northern Territory data for 2006 are based on responses to the 2007 Medical Labour Force Survey weighted to 2006 benchmark figures, equivalent to response rate of 28.6%. Care should be taken when interpreting these figures.
(c) FTE per 100,000 population; FTE based on total weekly hours (see Glossary).
Sources: AIHW Medical Labour Force Surveys, 2002 and 2006; unpublished ABS estimated resident population data (see Appendix G).
34
Appendix A: Explanatory notes on the AIHW Medical Labour Force Survey
Background The AIHW Medical Labour Force Survey collects information on the demographics, employment characteristics, work locations and work activity of medical practitioners who are renewing their medical registration with medical boards in each state and territory. The same basic survey questionnaire is used across jurisdictions, although there are some variations in design. Some questions may also be added, removed or amended by individual jurisdictions from year to year.
While the core data items (such as labour force status) have been collected in the survey since its inception, there have been changes to the questionnaire and estimation methods over time. While every effort is made to maintain a comparable time series, this is not always possible. In addition, previous years’ estimates are revised when necessary. As a result, some care should be taken in comparing data from earlier publications with the current one. The most up-to-date estimates for the years prior to 2006 are available from the internet tables on the AIHW website.
As the survey questionnaire is sent out with registration renewal papers by the medical boards, the timing of the survey varies, depending on the registration practices in each jurisdiction. The 2006 estimates provided in this report are based on data collected as part of the 2006 registration renewal process in each state and territory.
The estimates published in this report may differ from other estimates derived from the labour force survey data, such as those derived by some states and territories. This is due to a number of factors. First, the AIHW adjusts state and territory registration figures to account for those medical practitioners who state that they are working ‘mainly or only in another jurisdiction’, to minimise the possibility of double counting medical practitioners at a national level. Second, data cleaning, collation and imputation methods may differ. Third, differences in estimates can occur depending on the date of extraction and detail of the benchmark figures.
Method
The survey population is drawn from the medical registers maintained by each state and territory medical board (or council). The registers contain information on all medical practitioners licensed to practise in that state or territory, such as demographics, employment characteristics, work locations and work activity.
Each medical board conducts an annual renewal of registration of medical practitioners who are qualified and eligible to practise and, in association with this process, questionnaires are sent to these practitioners on the register at that time. The results of the 2006 survey relate to the period when renewal notices and the survey were sent out, with timing dependent on the
35
licence renewal procedure operating in each state or territory. Returned questionnaires were processed by, or on behalf of, the respective health authority. Each state and territory then forwarded a data file of de-identified responses to the AIHW for further cleaning, final coding, collation into a national data set, application of national range and edit checks, estimation for item and population non-response, and finally, analysis (see ‘Estimation procedures’, below).
The questionnaire is a paper-based form. States and territories have agreed on the core content of the questionnaires, but there is some variation in actual questions asked and in the format of the questionnaire. Information on the availability and comparability of the survey forms used by each state and territory is provided in Appendix F.
Scope and coverage The survey questionnaire is distributed in association with the registration renewal process; as such, only practitioners who are on the register at the time of the survey and who are required to renew their registration receive a questionnaire for completion, regardless of their type of registration (conditional or general). Medical practitioners registering for the first time or who are not required to renew their registration in the survey year are not surveyed. In addition, not all medical practitioners who receive a questionnaire respond.
The survey questionnaire is sent to all registrants in New South Wales, Victoria, Western Australia, South Australia, the Australian Capital Territory and the Northern Territory. However, there are some variations in the scope of the population surveyed across jurisdictions. Questionnaires were sent to only general registrants and conditionally registered specialists in Queensland. In Tasmania, only general registrants, conditional specialists and non-practising practitioners are surveyed.
In deriving estimates of the total population of registered practitioners, registrants who do not receive a questionnaire are treated in the same way as survey non-respondents in the weighting process (see ‘Estimation procedures’, below).
As the Northern Territory did not conduct the survey in 2006 the AIHW could not use 2006 survey data. In order to provide some estimates in 2006, the 2007 Northern Territory Medical Labour Force Survey data were weighted to 2006 benchmark figures. This method was deemed appropriate after the AIHW implemented a basic analysis of the 2007 Northern Territory data and concluded the distribution of respondents was consistent with previous years. Therefore, care should be taken when using averages or making comparisons over time for the Northern Territory and in making comparisons between the Northern Territory and other jurisdictions.
Estimation procedures
The AIHW uses the data collected in the Medical Labour Force Survey to derive estimates of the total medical labour force. In deriving the estimates, two sources of non-response to the survey are accounted for:
• item non-response, which occurs as some respondents return partially completed questionnaires
36
• population non-response, which occurs because not all registered medical practitioners who receive a questionnaire respond, and not all practitioners receive a questionnaire (e.g. first-time registrants).
A separate estimation procedure is used for each. Imputation is used to account for item non-response and weighting for population non-response.
Both of these procedures are described below.
Imputation: estimation for item non-response The imputation process involves an initial examination of all information which has been provided by a respondent. If possible, an assumption is made about any missing information for that respondent based on their responses to other survey questions. For example, if a respondent provides information on hours worked and the area in which they work, but leaves the labour force question blank, it is reasonable to assume that they were, in fact, employed. In 2006, Western Australia had over 400 records (10% of all records) for which information was provided on hours worked and where the respondent had worked although they left the labour force status question blank. After consultation with the Western Australian Department of Health it was decided to impute labour force status as employed in these cases. This was also implemented nationally.
Missing values remaining after this process are considered for their suitability for further imputation. Suitability is based on the level of non-response to that item. Imputation is usually only applied in cases where the proportion of missing values is less than 5% of the total.
In imputation, the known probabilities of particular responses occurring are used to assign a response category value to each record, using a random number generator. Imputed values are based on the distribution of responses occurring in the responding sample. Therefore, fundamental to estimating missing values for survey respondents who returned partially completed questionnaires is the assumption that respondents who answer various questions are similar to those who do not.
Age group and sex values within each state and territory are first imputed to account for missing age and sex values. In 2006, 0.5% of records (275) received an imputed age group and 0.2% (88) received an imputed sex value. Other variables deemed suitable for this process are then imputed. In 2006, these variables were field of medicine (clinician, administrator, etc.), clinician type (GP, specialist, etc.), specialty of practice (cardiology, general pathology, etc.), specialty training (cardiology, general pathology, etc.), general practitioner type (vocational registered GP, RACGP Fellow, etc.), and hospital non-specialist type (intern, RMO, etc.).
Weighting: estimation for population non-response Each survey record (a record equates to a respondent) is assigned a weight which is calibrated to align with independent data on the population of interest, referred to as ‘benchmarks’. In principle, this weight is based on the population number divided by the number in the responding sample. The resulting fraction becomes the expansion factor applied to the record, referred to as the ‘weight’, providing an estimate of the population when aggregate output is generated.
37
Benchmark data are the number of registered practitioners in each state and territory, provided to the AIHW by the states and territories medical boards (or councils). Where possible, benchmarks are broken down by age group and sex. Where data are not available from the boards, benchmark figures are obtained from other sources, such as medical board annual reports.
The total number of registered medical practitioners is used to benchmark the survey in New South Wales, Victoria, South Australia, Western Australia, the Australian Capital Territory and the Northern Territory. In Queensland, however, only the number of general registered medical practitioners and conditionally registered specialists is used as a benchmark figure. In Tasmania, only the total number of general registrants, conditional specialists and non-practising practitioners is used as the benchmark for the survey.
The calculation of weights is usually part of the data processing for a sample survey in which the sample is selected before the survey is conducted. In the Medical Labour Force Survey, all registered practitioners within the scope of the survey are sent a questionnaire when registration renewal is due. Therefore, technically, it is a census of medical practitioners. However, because not all renewing practitioners in scope respond, the result is a data set based on a very large ‘self-selecting sample’ of the population. As the group of respondents in the data set is not random, standard errors are not a suitable means of gauging variability.
The weight for each record is based on particular characteristics that are known for the whole population. The benchmark data provided to the AIHW for most jurisdictions are state of registration, age (or age group) and sex. In 2006, benchmark figures by age and sex were provided for New South Wales, Victoria, South Australia, the Northern Territory and the Australian Capital Territory. For Queensland, Western Australia and Tasmania, age and sex breakdowns of benchmark data were not provided by the medical boards, and the calculation of weights was based on the total benchmark figure.
Producing estimates for the population by weighting the data from respondents does adjust for bias in the responding group of practitioners, but only for known population characteristics (age and sex, where provided, in the case of the Medical Labour Force Survey). If information for a variable is not known for the whole population, the variable cannot be used in the calculation of weights and cannot be used in the adjustment process.
For variables not used in the calculation of weights (for the Medical Labour Force Survey that is all variables other than state/territory, age and sex), it is assumed, for estimation purposes, that respondents and non-respondents have the same characteristics. If the assumption is incorrect, and non-respondents are different from respondents, then the estimates will have some bias. The extent of this cannot be measured without more detailed information about non-respondents. However, as registrants who do not renew are probably less likely to respond to the survey, and as conditionally registered medical practitioners are not surveyed in some jurisdictions, it is likely that there will be some bias in estimates.
Response rate The estimated overall response rate to the AIHW Medical Labour Force Survey in 2006 was 70.2%. That is, the number of responses to the survey represented 70.2% of the medical registration figures used for benchmarking purposes (Table A1). At a national level, there was
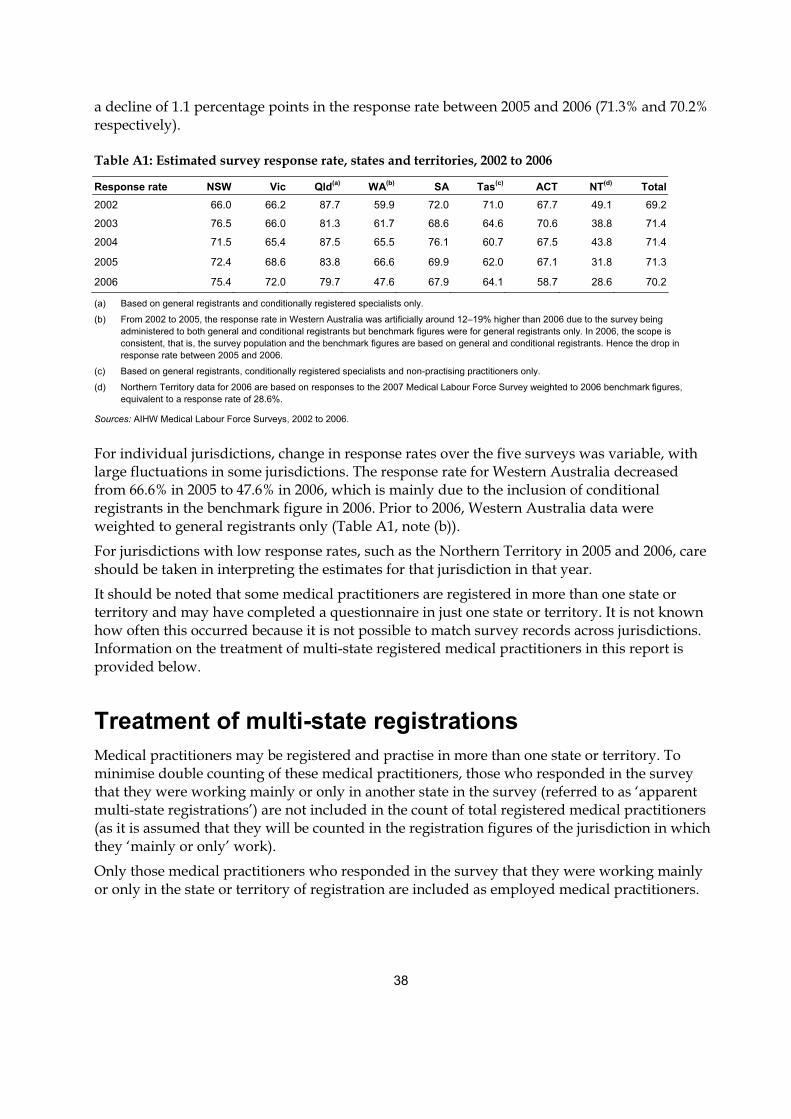
38
a decline of 1.1 percentage points in the response rate between 2005 and 2006 (71.3% and 70.2% respectively).
Table A1: Estimated survey response rate, states and territories, 2002 to 2006
Response rate NSW Vic Qld(a) WA(b) SA Tas(c) ACT NT(d) Total2002 66.0 66.2 87.7 59.9 72.0 71.0 67.7 49.1 69.2
2003 76.5 66.0 81.3 61.7 68.6 64.6 70.6 38.8 71.4
2004 71.5 65.4 87.5 65.5 76.1 60.7 67.5 43.8 71.4
2005 72.4 68.6 83.8 66.6 69.9 62.0 67.1 31.8 71.3
2006 75.4 72.0 79.7 47.6 67.9 64.1 58.7 28.6 70.2
(a) Based on general registrants and conditionally registered specialists only.
(b) From 2002 to 2005, the response rate in Western Australia was artificially around 12–19% higher than 2006 due to the survey being administered to both general and conditional registrants but benchmark figures were for general registrants only. In 2006, the scope is consistent, that is, the survey population and the benchmark figures are based on general and conditional registrants. Hence the drop in response rate between 2005 and 2006.
(c) Based on general registrants, conditionally registered specialists and non-practising practitioners only.
(d) Northern Territory data for 2006 are based on responses to the 2007 Medical Labour Force Survey weighted to 2006 benchmark figures, equivalent to a response rate of 28.6%.
Sources: AIHW Medical Labour Force Surveys, 2002 to 2006.
For individual jurisdictions, change in response rates over the five surveys was variable, with large fluctuations in some jurisdictions. The response rate for Western Australia decreased from 66.6% in 2005 to 47.6% in 2006, which is mainly due to the inclusion of conditional registrants in the benchmark figure in 2006. Prior to 2006, Western Australia data were weighted to general registrants only (Table A1, note (b)).
For jurisdictions with low response rates, such as the Northern Territory in 2005 and 2006, care should be taken in interpreting the estimates for that jurisdiction in that year.
It should be noted that some medical practitioners are registered in more than one state or territory and may have completed a questionnaire in just one state or territory. It is not known how often this occurred because it is not possible to match survey records across jurisdictions. Information on the treatment of multi-state registered medical practitioners in this report is provided below.
Treatment of multi-state registrations Medical practitioners may be registered and practise in more than one state or territory. To minimise double counting of these medical practitioners, those who responded in the survey that they were working mainly or only in another state in the survey (referred to as ‘apparent multi-state registrations’) are not included in the count of total registered medical practitioners (as it is assumed that they will be counted in the registration figures of the jurisdiction in which they ‘mainly or only’ work).
Only those medical practitioners who responded in the survey that they were working mainly or only in the state or territory of registration are included as employed medical practitioners.
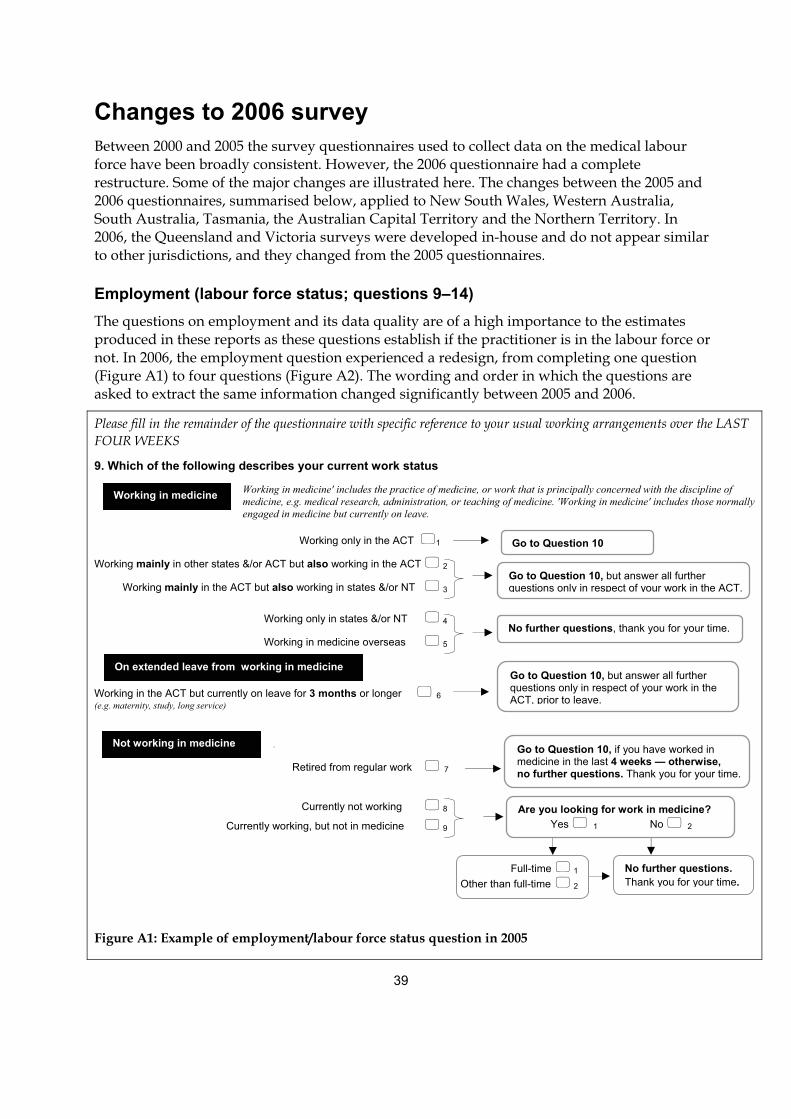
39
Changes to 2006 survey
Between 2000 and 2005 the survey questionnaires used to collect data on the medical labour force have been broadly consistent. However, the 2006 questionnaire had a complete restructure. Some of the major changes are illustrated here. The changes between the 2005 and 2006 questionnaires, summarised below, applied to New South Wales, Western Australia, South Australia, Tasmania, the Australian Capital Territory and the Northern Territory. In 2006, the Queensland and Victoria surveys were developed in-house and do not appear similar to other jurisdictions, and they changed from the 2005 questionnaires.
Employment (labour force status; questions 9–14) The questions on employment and its data quality are of a high importance to the estimates produced in these reports as these questions establish if the practitioner is in the labour force or not. In 2006, the employment question experienced a redesign, from completing one question (Figure A1) to four questions (Figure A2). The wording and order in which the questions are asked to extract the same information changed significantly between 2005 and 2006.
Please fill in the remainder of the questionnaire with specific reference to your usual working arrangements over the LAST FOUR WEEKS
9. Which of the following describes your current work status
Working in medicine' includes the practice of medicine, or work that is principally concerned with the discipline of medicine, e.g. medical research, administration, or teaching of medicine. 'Working in medicine' includes those normally engaged in medicine but currently on leave.
Working only in the ACT �1
Working mainly in other states &/or ACT but also working in the ACT � 2
Working mainly in the ACT but also working in states &/or NT � 3
Working only in states &/or NT � 4
Working in medicine overseas � 5
Working in the ACT but currently on leave for 3 months or longer � 6 (e.g. maternity, study, long service)
.
Retired from regular work � 7
Currently not working � 8
Currently working, but not in medicine � 9
Figure A1: Example of employment/labour force status question in 2005
Working in medicine
Not working in medicine
Go to Question 10
Go to Question 10, but answer all further questions only in respect of your work in the ACT.
No further questions, thank you for your time.
Go to Question 10, but answer all further questions only in respect of your work in the ACT, prior to leave.
Go to Question 10, if you have worked in medicine in the last 4 weeks — otherwise, no further questions. Thank you for your time.
Are you looking for work in medicine? Yes � 1 No � 2
Full-time � 1
Other than full-time � 2 No further questions.
Thank you for your time.
On extended leave from working in medicine
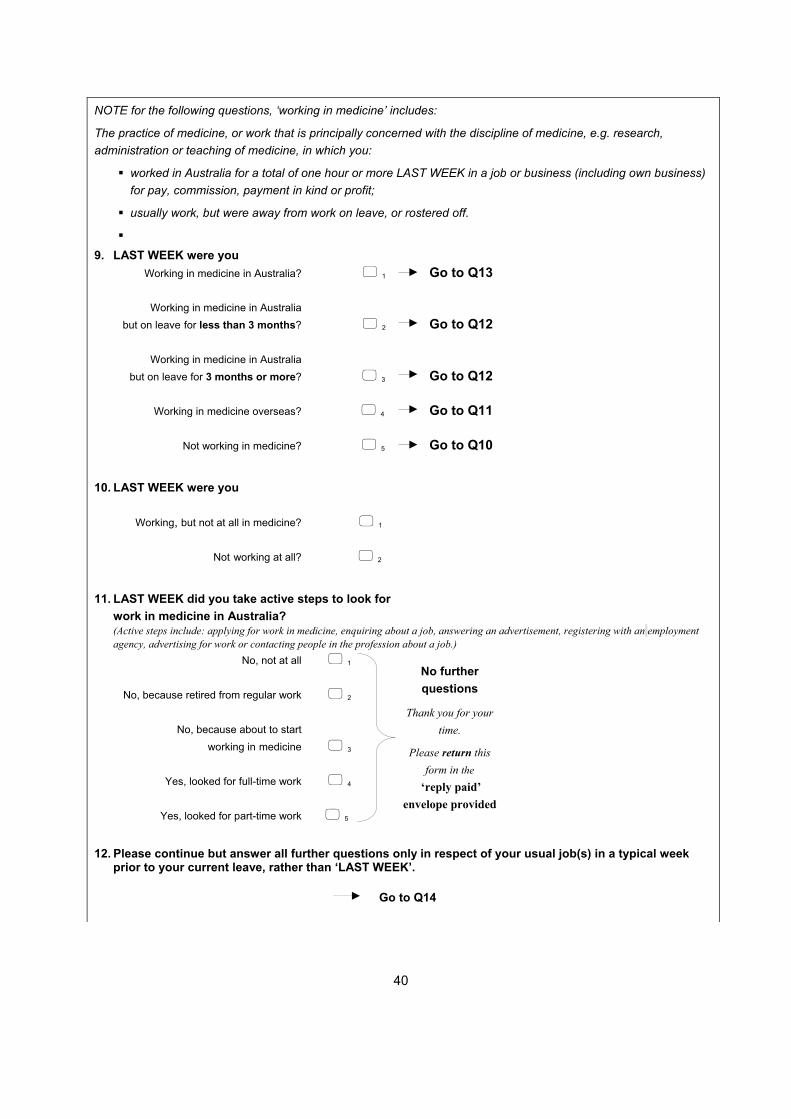
40
NOTE for the following questions, ‘working in medicine’ includes:
The practice of medicine, or work that is principally concerned with the discipline of medicine, e.g. research, administration or teaching of medicine, in which you:
� worked in Australia for a total of one hour or more LAST WEEK in a job or business (including own business) for pay, commission, payment in kind or profit;
� usually work, but were away from work on leave, or rostered off.
� 9. LAST WEEK were you Working in medicine in Australia? � 1 Go to Q13
Working in medicine in Australia but on leave for less than 3 months? � 2 Go to Q12
Working in medicine in Australia but on leave for 3 months or more? � 3 Go to Q12
Working in medicine overseas? � 4 Go to Q11
Not working in medicine? � 5 Go to Q10 10. LAST WEEK were you
Working, but not at all in medicine? � 1
Not working at all? � 2
11. LAST WEEK did you take active steps to look for
work in medicine in Australia? (Active steps include: applying for work in medicine, enquiring about a job, answering an advertisement, registering with an employment
agency, advertising for work or contacting people in the profession about a job.) No, not at all � 1
No, because retired from regular work � 2
No, because about to start working in medicine � 3
Yes, looked for full-time work � 4
Yes, looked for part-time work � 5 12. Please continue but answer all further questions only in respect of your usual job(s) in a typical week
prior to your current leave, rather than ‘LAST WEEK’.
No further questions
Thank you for your time.
Please return this form in the
‘reply paid’ envelope provided
Go to Q14
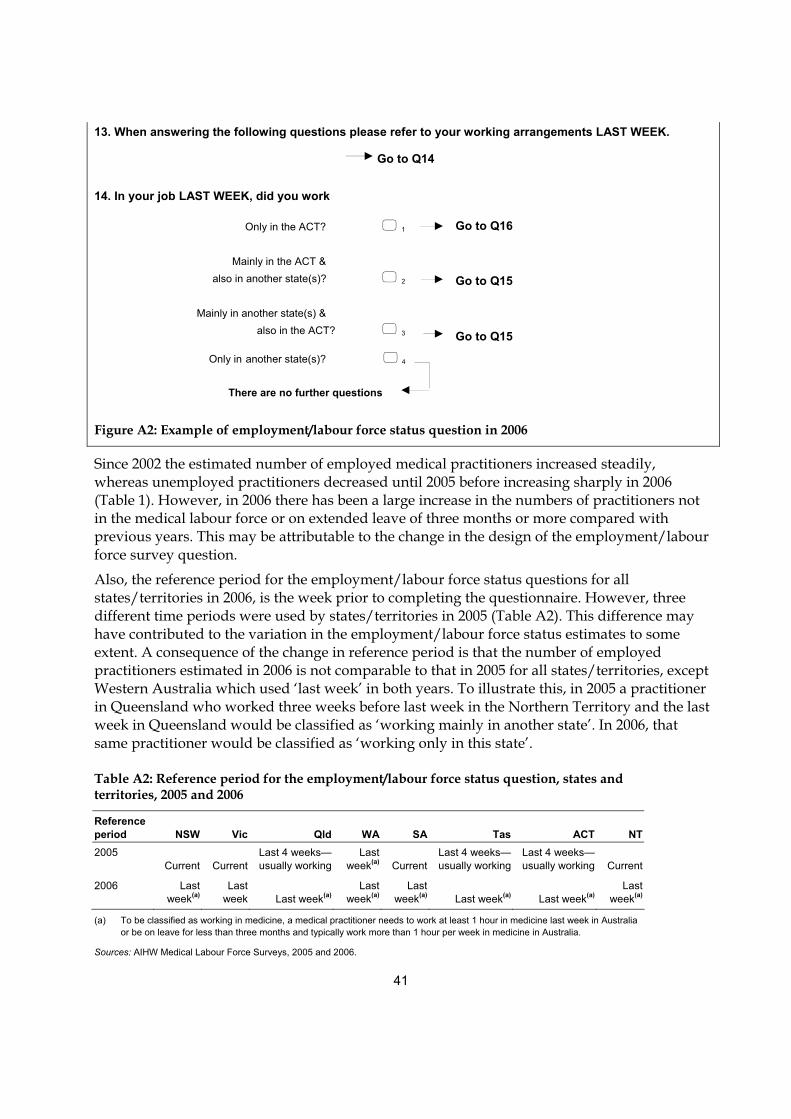
41
13. When answering the following questions please refer to your working arrangements LAST WEEK.
14. In your job LAST WEEK, did you work
Only in the ACT? � 1 Mainly in the ACT &
also in another state(s)? � 2
Mainly in another state(s) & also in the ACT? � 3
Only in another state(s)? � 4
Figure A2: Example of employment/labour force status question in 2006
Since 2002 the estimated number of employed medical practitioners increased steadily, whereas unemployed practitioners decreased until 2005 before increasing sharply in 2006 (Table 1). However, in 2006 there has been a large increase in the numbers of practitioners not in the medical labour force or on extended leave of three months or more compared with previous years. This may be attributable to the change in the design of the employment/labour force survey question.
Also, the reference period for the employment/labour force status questions for all states/territories in 2006, is the week prior to completing the questionnaire. However, three different time periods were used by states/territories in 2005 (Table A2). This difference may have contributed to the variation in the employment/labour force status estimates to some extent. A consequence of the change in reference period is that the number of employed practitioners estimated in 2006 is not comparable to that in 2005 for all states/territories, except Western Australia which used ‘last week’ in both years. To illustrate this, in 2005 a practitioner in Queensland who worked three weeks before last week in the Northern Territory and the last week in Queensland would be classified as ‘working mainly in another state’. In 2006, that same practitioner would be classified as ‘working only in this state’.
Table A2: Reference period for the employment/labour force status question, states and territories, 2005 and 2006
Reference period NSW Vic Qld WA SA Tas ACT NT 2005
Current Current Last 4 weeks—usually working
Last week(a) Current
Last 4 weeks—usually working
Last 4 weeks—usually working Current
2006 Last week(a)
Last week Last week(a)
Last week(a)
Last week(a) Last week(a) Last week(a)
Last week(a)
(a) To be classified as working in medicine, a medical practitioner needs to work at least 1 hour in medicine last week in Australia or be on leave for less than three months and typically work more than 1 hour per week in medicine in Australia.
Sources: AIHW Medical Labour Force Surveys, 2005 and 2006.
Go to Q16 Go to Q15 Go to Q15
There are no further questions
Go to Q14
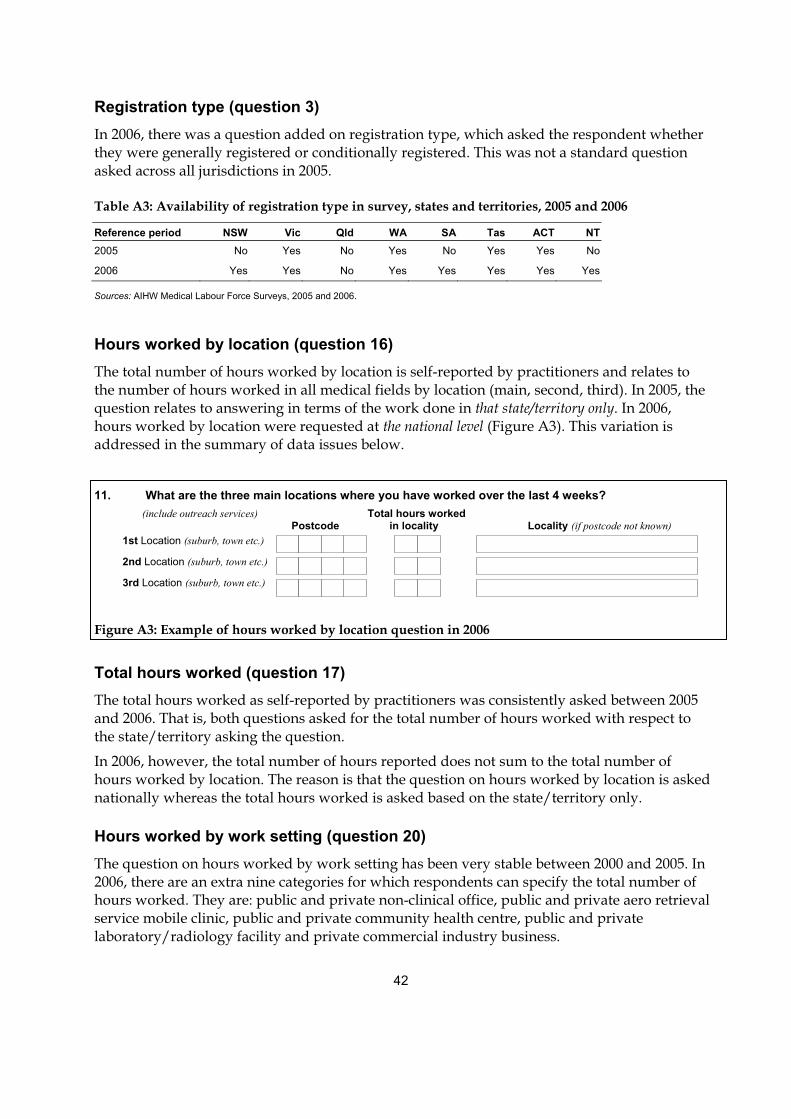
42
Registration type (question 3) In 2006, there was a question added on registration type, which asked the respondent whether they were generally registered or conditionally registered. This was not a standard question asked across all jurisdictions in 2005.
Table A3: Availability of registration type in survey, states and territories, 2005 and 2006
Reference period NSW Vic Qld WA SA Tas ACT NT 2005 No Yes No Yes No Yes Yes No
2006 Yes Yes No Yes Yes Yes Yes Yes
Sources: AIHW Medical Labour Force Surveys, 2005 and 2006.
Hours worked by location (question 16) The total number of hours worked by location is self-reported by practitioners and relates to the number of hours worked in all medical fields by location (main, second, third). In 2005, the question relates to answering in terms of the work done in that state/territory only. In 2006, hours worked by location were requested at the national level (Figure A3). This variation is addressed in the summary of data issues below.
11. What are the three main locations where you have worked over the last 4 weeks? (include outreach services) Total hours worked Postcode in locality Locality (if postcode not known)
1st Location (suburb, town etc.)
2nd Location (suburb, town etc.)
3rd Location (suburb, town etc.)
Figure A3: Example of hours worked by location question in 2006
Total hours worked (question 17) The total hours worked as self-reported by practitioners was consistently asked between 2005 and 2006. That is, both questions asked for the total number of hours worked with respect to the state/territory asking the question.
In 2006, however, the total number of hours reported does not sum to the total number of hours worked by location. The reason is that the question on hours worked by location is asked nationally whereas the total hours worked is asked based on the state/territory only.
Hours worked by work setting (question 20) The question on hours worked by work setting has been very stable between 2000 and 2005. In 2006, there are an extra nine categories for which respondents can specify the total number of hours worked. They are: public and private non-clinical office, public and private aero retrieval service mobile clinic, public and private community health centre, public and private laboratory/radiology facility and private commercial industry business.
43
Clinician type (question 22) Clinicians, the largest group of medical practitioners, are mainly involved in the diagnosis, care and treatment of individuals, including recommending preventive action. Prior to 2006 there were four major clinician types reported: primary care practitioner, specialist, specialist-in-training and hospital non-specialist. In 2006, there is an extra category that respondents can tick: ‘none of the above’. If they mark this they are reporting that they have worked in a clinical capacity in 2006 although they did not work as a primary care practitioner, specialist, specialist-in-training or hospital non-specialist.
Specialty and sub-specialty (question 34) For those clinical practitioners who marked they are specialists or specialists-in-training, the survey requests further information on the specialty area in which they practise, the specialty in which they are qualified or the specialty in which they are training. Between 2005 and 2006 there has been a change to the way this question is asked. In 2005, respondents looked up the code from a list provided, and wrote the code on the questionnaire. Whereas in 2006, the question appeared in a much more visually complex tick-a-box layout (see Appendix F).
Data issues The following data issues need to be considered in interpreting this report: • As the Northern Territory did not conduct the survey in 2006 the AIHW could not use 2006
survey data. In order to provide some estimates in 2006, the 2007 Northern Territory Medical Labour Force Survey data were weighted to 2006 benchmark figures. This method was deemed appropriate after the AIHW implemented a basic analysis on the 2007 Northern Territory data and concluded the distribution of respondents was consistent with previous years.
• The Northern Territory estimates are based on the 2007 survey data weighted to the 2006 benchmark figures, resulting in a response rate equivalent to 28.6%. Care should be taken when interpreting the data for 2006, or making comparisons over time for the Northern Territory and in making comparisons between the Northern Territory and other jurisdictions.
• Western Australia had over 400 records (10% of all records) from respondents who gave information on hours worked and where they worked but did not report their labour force status. After consultation with the Western Australian Department of Health it was decided to impute labour force status as employed in these cases. This was also implemented nationally.
• In 2006, the New South Wales Medical Board sent out 2005 and 2006 questionnaires. The AIHW decided after consultation with the New South Wales Department of Health to remove the 823 records that were completed on the old (2005) questionnaire. The removed records account for only 3.5% of all survey responses and the impact of their exclusion on the New South Wales and national estimates will be negligible.
• Between 2002 and 2006 there was a 35.9% increase in the number of employed medical practitioners in Western Australia (from 4,648 to 6,315 respectively). This rise can be attributed to the AIHW weighting to general registrants only in 2002 when the survey was
44
administered to both general and conditional registrants (as provided by Western Australia). In 2006, this problem was rectified and the scope of the survey is now consistent with the benchmarks used.
• The total hours worked (and FTE rates) by Remoteness Area (Major City, Inner Regional, Outer Regional and Remote/Very Remote) figures are an overestimate. The process of deriving total hours worked by Remoteness Area involves using the total hours reported, rather than using the total hours worked in each Remoteness Area. Subsequently, in theory a practitioner may report they worked 40 hours in an Outer Regional area (main location) and 5 hours in a Remote area (second location). The current practice involves using the total hours worked, 45, and distributing those all to the main working location, in this case being the Outer Regional area. The reason for using total hours worked is that in 2006, the questions on hours worked by location and total hours worked were based on different scope, as discussed above.
• The work sector estimates of employed and hours worked are an underestimate. The process of deriving work sector is based on responses to the hours worked in that work sector. If a respondent is determined to be employed (via the employment/labour force status questions) but has not responded to the hours worked in different work settings question, then the respondent will be counted as employed but not included in the number working in either the private or public sector. Consequently, the number of employed will not be the sum of those working in the private and public sectors.
45
Appendix B: Medical practitioner registration numbers
Medical boards (or councils in some jurisdictions) are statutory authorities established in each jurisdiction to register medical practitioners, investigate complaints about medical practitioners and develop guidelines for the profession. They maintain a register of medical practitioners who are licensed to practise in their jurisdiction. All medical practitioners must be registered to practise in Australia.
As outlined in Appendix A, responses to the AIHW Medical Labour Force Survey are weighted to medical practitioner figures provided by state and territory medical boards from their medical registers. Medical boards also publish data on the number of registered medical practitioners in their annual reports.
Medical practitioner boards registration numbers The numbers of medical practitioner registrations reported by state and territory medical boards and councils in their 2005–06 annual reports are provided in Table B1. In total there were 82,289 registrations reported for 2005–06. This is higher than the benchmark number for the AIHW 2006 Medical Labour Force Survey (77,902) (Tables 1 and B2). The main reasons for this difference are:
• The benchmark figures provided by Queensland are for general registrations and conditionally registered specialists only and do not include all conditionally registered medical practitioners (see Glossary). In Tasmania, benchmarks are based on general registrations, conditionally registered specialists and non-practising practitioners only and do not include conditional registrants who are overseas-trained doctors (including those in ‘Area of need’ positions) or interns.
• The registration numbers published by the jurisdictions are a snapshot of the number of registered medical practitioners at a particular point in time. Typically, the point-in-time used is the end of the financial year (30 June). For benchmarking purposes, the AIHW attempts to obtain more detailed registration numbers (by age group and sex) from the medical boards to match the timing of the survey.
Of the medical registrations reported by the boards and councils in their 2005–06 annual reports, 83.3% were reported as general registrations and 16.7% as conditional/limited/non-general registrations (Table B1). The proportion of general registrations varied across jurisdictions, from 79.0% in Tasmania to 86.6% in Queensland.
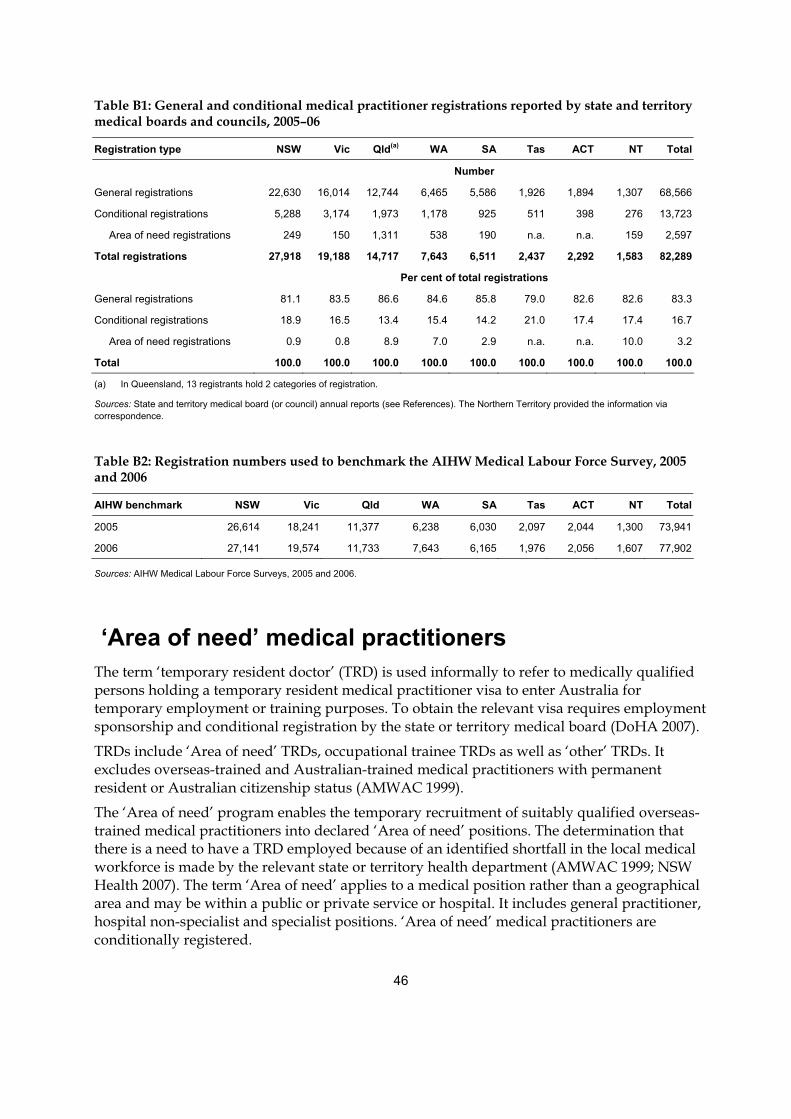
46
Table B1: General and conditional medical practitioner registrations reported by state and territory medical boards and councils, 2005–06
Registration type NSW Vic Qld(a) WA SA Tas ACT NT Total
Number
General registrations 22,630 16,014 12,744 6,465 5,586 1,926 1,894 1,307 68,566
Conditional registrations 5,288 3,174 1,973 1,178 925 511 398 276 13,723
Area of need registrations 249 150 1,311 538 190 n.a. n.a. 159 2,597
Total registrations 27,918 19,188 14,717 7,643 6,511 2,437 2,292 1,583 82,289
Per cent of total registrations
General registrations 81.1 83.5 86.6 84.6 85.8 79.0 82.6 82.6 83.3
Conditional registrations 18.9 16.5 13.4 15.4 14.2 21.0 17.4 17.4 16.7
Area of need registrations 0.9 0.8 8.9 7.0 2.9 n.a. n.a. 10.0 3.2
Total 100.0 100.0 100.0 100.0 100.0 100.0 100.0 100.0 100.0
(a) In Queensland, 13 registrants hold 2 categories of registration.
Sources: State and territory medical board (or council) annual reports (see References). The Northern Territory provided the information via correspondence.
Table B2: Registration numbers used to benchmark the AIHW Medical Labour Force Survey, 2005 and 2006
AIHW benchmark NSW Vic Qld WA SA Tas ACT NT Total
2005 26,614 18,241 11,377 6,238 6,030 2,097 2,044 1,300 73,941
2006 27,141 19,574 11,733 7,643 6,165 1,976 2,056 1,607 77,902
Sources: AIHW Medical Labour Force Surveys, 2005 and 2006.
‘Area of need’ medical practitioners The term ‘temporary resident doctor’ (TRD) is used informally to refer to medically qualified persons holding a temporary resident medical practitioner visa to enter Australia for temporary employment or training purposes. To obtain the relevant visa requires employment sponsorship and conditional registration by the state or territory medical board (DoHA 2007).
TRDs include ‘Area of need’ TRDs, occupational trainee TRDs as well as ‘other’ TRDs. It excludes overseas-trained and Australian-trained medical practitioners with permanent resident or Australian citizenship status (AMWAC 1999).
The ‘Area of need’ program enables the temporary recruitment of suitably qualified overseas-trained medical practitioners into declared ‘Area of need’ positions. The determination that there is a need to have a TRD employed because of an identified shortfall in the local medical workforce is made by the relevant state or territory health department (AMWAC 1999; NSW Health 2007). The term ‘Area of need’ applies to a medical position rather than a geographical area and may be within a public or private service or hospital. It includes general practitioner, hospital non-specialist and specialist positions. ‘Area of need’ medical practitioners are conditionally registered.

47
Data on the number of ‘Area of need’ medical practitioners are of interest to workforce planners as they are an indication of the level and type of shortages in the Australian medical workforce. To have a position identified as ‘Area of need’ an employer must first demonstrate that it cannot readily fill the position from the Australian labour market (NSW Health 2007).
Data on the number of ‘Area of need’ registrants are available from the medical board’s annual reports for 2005–06 in all jurisdictions, except Tasmania and the Australian Capital Territory (Table B1). In 2005–06, the proportion of registered medical practitioners in Australia who were reported as ‘Area of need’ medical practitioners varied significantly amongst reporting jurisdictions, from 0.8% in Victoria to 10.0% in the Northern Territory.
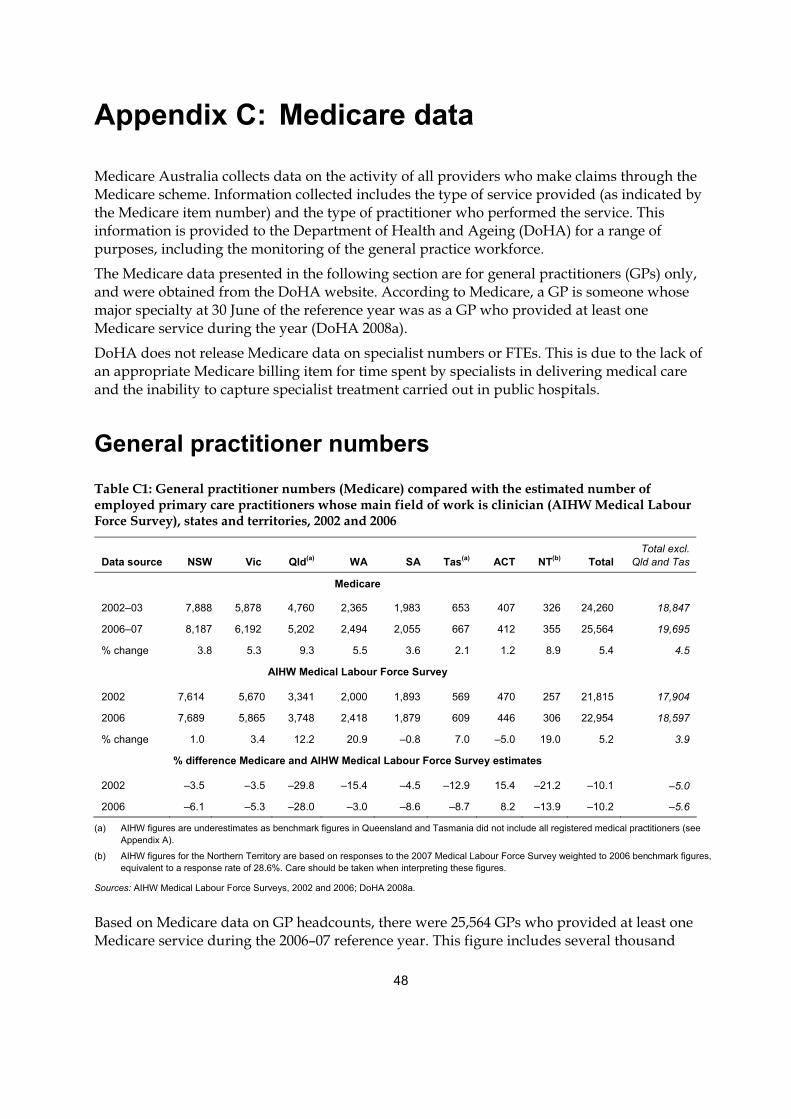
48
Appendix C: Medicare data
Medicare Australia collects data on the activity of all providers who make claims through the Medicare scheme. Information collected includes the type of service provided (as indicated by the Medicare item number) and the type of practitioner who performed the service. This information is provided to the Department of Health and Ageing (DoHA) for a range of purposes, including the monitoring of the general practice workforce.
The Medicare data presented in the following section are for general practitioners (GPs) only, and were obtained from the DoHA website. According to Medicare, a GP is someone whose major specialty at 30 June of the reference year was as a GP who provided at least one Medicare service during the year (DoHA 2008a).
DoHA does not release Medicare data on specialist numbers or FTEs. This is due to the lack of an appropriate Medicare billing item for time spent by specialists in delivering medical care and the inability to capture specialist treatment carried out in public hospitals.
General practitioner numbers
Table C1: General practitioner numbers (Medicare) compared with the estimated number of employed primary care practitioners whose main field of work is clinician (AIHW Medical Labour Force Survey), states and territories, 2002 and 2006
Data source NSW Vic Qld(a) WA SA Tas(a) ACT NT(b) Total Total excl.
Qld and Tas
Medicare
2002–03 7,888 5,878 4,760 2,365 1,983 653 407 326 24,260 18,847
2006–07 8,187 6,192 5,202 2,494 2,055 667 412 355 25,564 19,695
% change 3.8 5.3 9.3 5.5 3.6 2.1 1.2 8.9 5.4 4.5
AIHW Medical Labour Force Survey
2002 7,614 5,670 3,341 2,000 1,893 569 470 257 21,815 17,904
2006 7,689 5,865 3,748 2,418 1,879 609 446 306 22,954 18,597
% change 1.0 3.4 12.2 20.9 –0.8 7.0 –5.0 19.0 5.2 3.9
% difference Medicare and AIHW Medical Labour Force Survey estimates
2002 –3.5 –3.5 –29.8 –15.4 –4.5 –12.9 15.4 –21.2 –10.1 –5.0
2006 –6.1 –5.3 –28.0 –3.0 –8.6 –8.7 8.2 –13.9 –10.2 –5.6
(a) AIHW figures are underestimates as benchmark figures in Queensland and Tasmania did not include all registered medical practitioners (see Appendix A).
(b) AIHW figures for the Northern Territory are based on responses to the 2007 Medical Labour Force Survey weighted to 2006 benchmark figures, equivalent to a response rate of 28.6%. Care should be taken when interpreting these figures.
Sources: AIHW Medical Labour Force Surveys, 2002 and 2006; DoHA 2008a.
Based on Medicare data on GP headcounts, there were 25,564 GPs who provided at least one Medicare service during the 2006–07 reference year. This figure includes several thousand
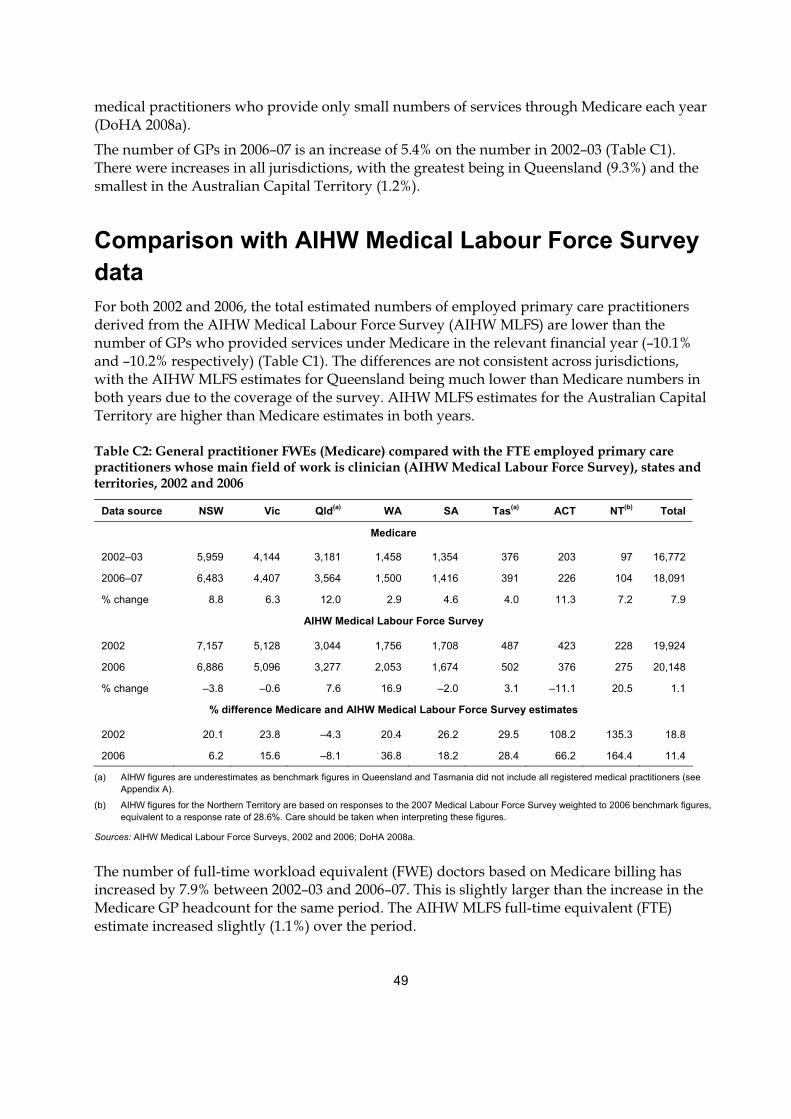
49
medical practitioners who provide only small numbers of services through Medicare each year (DoHA 2008a).
The number of GPs in 2006–07 is an increase of 5.4% on the number in 2002–03 (Table C1). There were increases in all jurisdictions, with the greatest being in Queensland (9.3%) and the smallest in the Australian Capital Territory (1.2%).
Comparison with AIHW Medical Labour Force Survey data For both 2002 and 2006, the total estimated numbers of employed primary care practitioners derived from the AIHW Medical Labour Force Survey (AIHW MLFS) are lower than the number of GPs who provided services under Medicare in the relevant financial year (–10.1% and –10.2% respectively) (Table C1). The differences are not consistent across jurisdictions, with the AIHW MLFS estimates for Queensland being much lower than Medicare numbers in both years due to the coverage of the survey. AIHW MLFS estimates for the Australian Capital Territory are higher than Medicare estimates in both years.
Table C2: General practitioner FWEs (Medicare) compared with the FTE employed primary care practitioners whose main field of work is clinician (AIHW Medical Labour Force Survey), states and territories, 2002 and 2006
Data source NSW Vic Qld(a) WA SA Tas(a) ACT NT(b) Total
Medicare
2002–03 5,959 4,144 3,181 1,458 1,354 376 203 97 16,772
2006–07 6,483 4,407 3,564 1,500 1,416 391 226 104 18,091
% change 8.8 6.3 12.0 2.9 4.6 4.0 11.3 7.2 7.9
AIHW Medical Labour Force Survey
2002 7,157 5,128 3,044 1,756 1,708 487 423 228 19,924
2006 6,886 5,096 3,277 2,053 1,674 502 376 275 20,148
% change –3.8 –0.6 7.6 16.9 –2.0 3.1 –11.1 20.5 1.1
% difference Medicare and AIHW Medical Labour Force Survey estimates
2002 20.1 23.8 –4.3 20.4 26.2 29.5 108.2 135.3 18.8
2006 6.2 15.6 –8.1 36.8 18.2 28.4 66.2 164.4 11.4
(a) AIHW figures are underestimates as benchmark figures in Queensland and Tasmania did not include all registered medical practitioners (see Appendix A).
(b) AIHW figures for the Northern Territory are based on responses to the 2007 Medical Labour Force Survey weighted to 2006 benchmark figures, equivalent to a response rate of 28.6%. Care should be taken when interpreting these figures.
Sources: AIHW Medical Labour Force Surveys, 2002 and 2006; DoHA 2008a.
The number of full-time workload equivalent (FWE) doctors based on Medicare billing has increased by 7.9% between 2002–03 and 2006–07. This is slightly larger than the increase in the Medicare GP headcount for the same period. The AIHW MLFS full-time equivalent (FTE) estimate increased slightly (1.1%) over the period.
50
The overall differences between the two data sources were similar for the two time periods, with the AIHW MLFS estimates being consistently higher than Medicare numbers, except for Queensland which were slightly lower (Table C2).
These differences may be explained by the following:
Method of data collection and estimation Estimates of primary care practitioners from the AIHW MLFS are derived from data collected in an annual survey of medical practitioners who are renewing their registration with the state and territory medical boards. The survey is conducted at a particular point in time each year in each jurisdiction, with timing determined by the registration renewal process. In contrast, the Medicare data are an administrative data collection relating to Medicare services provided over an entire financial year.
AIHW MLFS estimates are derived from survey responses, using state and territory medical practitioner registration figures as benchmarks. As estimates are based on survey responses, they are subject to some variability where small populations are concerned (such as with GPs in the Northern Territory and the Australian Capital Territory). As this variability in the survey is not due to sampling error, it cannot be readily measured.
The estimated number of medical practitioners in Queensland and Tasmania, derived from the AIHW MLFS, are known to be underestimates, due to the benchmarking data used. While in other jurisdictions survey responses are benchmarked to all registrations, in Queensland the benchmark figures do not include conditionally registered medical practitioners, and in Tasmania they do not include conditional registrants who are overseas-trained doctors or interns (see Appendix A).
Caution should be taken when comparing Medicare FWE and AIHW FTE figures due to differences in calculation methods (Table C2). Medicare FWE is calculated by dividing each doctor’s Medicare billing by the average billing of full-time doctors for the year. There is no cap on a doctor’s FWE. That is, a doctor with 50% of the average billing for full-time doctors is counted as 0.5, a doctor billing at the average is counted as one, and a doctor billing at 150% of the average is counted as 1.5 (DoHA 2008a). AIHW MLFS estimate of FTE is calculated by multiplying the number of doctors by the average total weekly hours and dividing by 45 (45 hours representing a full-time work week).
Definitions For the purposes of this report on the AIHW MLFS, a primary care practitioner is defined as a medical practitioner who reported that they were employed at the time of the survey (based on hours worked per week), and their main area of clinical practice was primary care. Those employed medical practitioners who did not provide data on hours worked by field of practice (that is, as a clinician or non-clinician) are assumed to be clinicians, and are included in the count of primary care practitioners if they indicated that their main area of clinical practice was primary care. Medical practitioners who stated that most of their time was spent working as an educator, administrator, researcher, public health physician, occupational health physician or other are not included. Some of these may, however, have undertaken some clinical work (and therefore, probably billed Medicare). As a result, the number of primary care practitioners
51
reported by the AIHW MLFS will underestimate those primary care practitioners who spent less time on clinical work than in other medical fields.
Medicare defines a GP as someone whose major specialty at 30 June of the reference year was as a GP, and who provided at least one Medicare service during the financial year. DoHA notes that the headcount figures include several thousand medical practitioners who provide only small numbers of services through Medicare each year (DoHA 2008a).
Anomalies at the state and territory level may be due to different methods of allocating GPs to a state, although both methods attempt to allocate the GP to the state or territory where they undertake most of their work. In the AIHW MLFS, to be allocated to a state or territory a primary care practitioner must be registered in that state or territory, and indicate in the survey that they are mainly or only working in that state or territory at the time of the survey. With Medicare data on GP headcounts, a GP is allocated to the state or territory where most of their services were provided over the whole financial year.
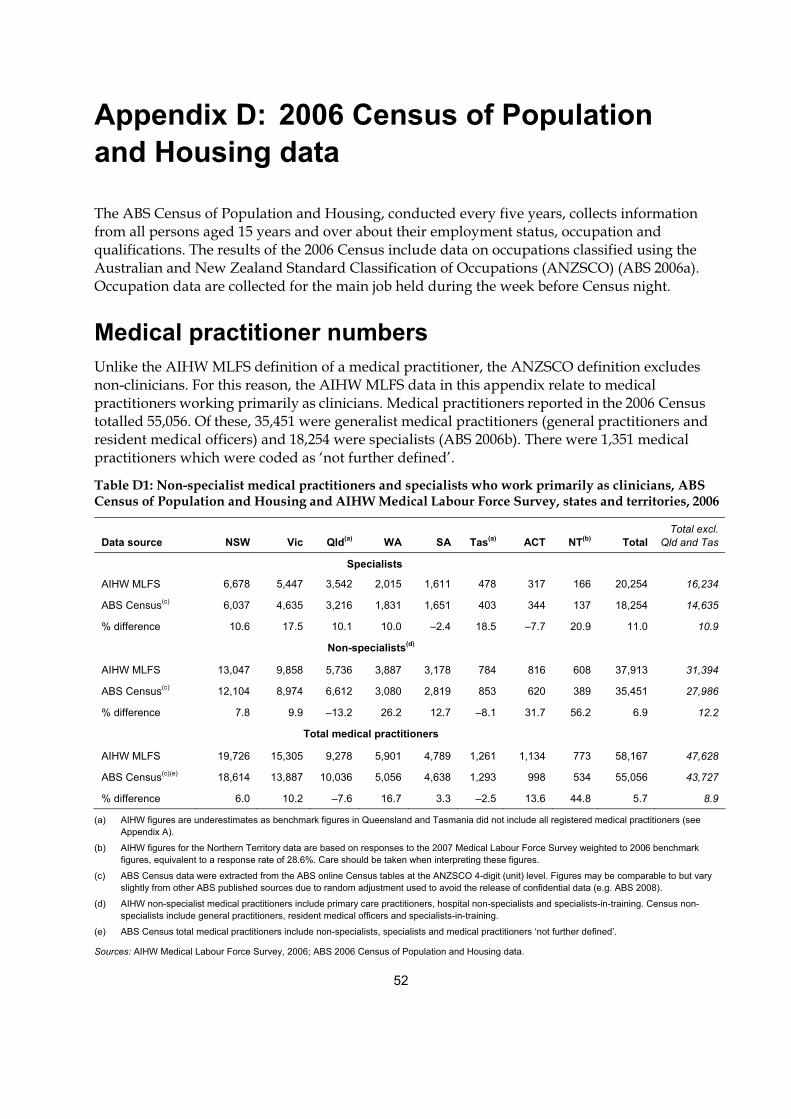
52
Appendix D: 2006 Census of Population and Housing data
The ABS Census of Population and Housing, conducted every five years, collects information from all persons aged 15 years and over about their employment status, occupation and qualifications. The results of the 2006 Census include data on occupations classified using the Australian and New Zealand Standard Classification of Occupations (ANZSCO) (ABS 2006a). Occupation data are collected for the main job held during the week before Census night.
Medical practitioner numbers Unlike the AIHW MLFS definition of a medical practitioner, the ANZSCO definition excludes non-clinicians. For this reason, the AIHW MLFS data in this appendix relate to medical practitioners working primarily as clinicians. Medical practitioners reported in the 2006 Census totalled 55,056. Of these, 35,451 were generalist medical practitioners (general practitioners and resident medical officers) and 18,254 were specialists (ABS 2006b). There were 1,351 medical practitioners which were coded as ‘not further defined’.
Table D1: Non-specialist medical practitioners and specialists who work primarily as clinicians, ABS Census of Population and Housing and AIHW Medical Labour Force Survey, states and territories, 2006
Data source NSW Vic Qld(a) WA SA Tas(a) ACT NT(b) Total Total excl.
Qld and Tas
Specialists
AIHW MLFS 6,678 5,447 3,542 2,015 1,611 478 317 166 20,254 16,234
ABS Census(c) 6,037 4,635 3,216 1,831 1,651 403 344 137 18,254 14,635
% difference 10.6 17.5 10.1 10.0 –2.4 18.5 –7.7 20.9 11.0 10.9
Non-specialists(d)
AIHW MLFS 13,047 9,858 5,736 3,887 3,178 784 816 608 37,913 31,394
ABS Census(c) 12,104 8,974 6,612 3,080 2,819 853 620 389 35,451 27,986
% difference 7.8 9.9 –13.2 26.2 12.7 –8.1 31.7 56.2 6.9 12.2
Total medical practitioners
AIHW MLFS 19,726 15,305 9,278 5,901 4,789 1,261 1,134 773 58,167 47,628
ABS Census(c)(e) 18,614 13,887 10,036 5,056 4,638 1,293 998 534 55,056 43,727
% difference 6.0 10.2 –7.6 16.7 3.3 –2.5 13.6 44.8 5.7 8.9
(a) AIHW figures are underestimates as benchmark figures in Queensland and Tasmania did not include all registered medical practitioners (see Appendix A).
(b) AIHW figures for the Northern Territory data are based on responses to the 2007 Medical Labour Force Survey weighted to 2006 benchmark figures, equivalent to a response rate of 28.6%. Care should be taken when interpreting these figures.
(c) ABS Census data were extracted from the ABS online Census tables at the ANZSCO 4-digit (unit) level. Figures may be comparable to but vary slightly from other ABS published sources due to random adjustment used to avoid the release of confidential data (e.g. ABS 2008).
(d) AIHW non-specialist medical practitioners include primary care practitioners, hospital non-specialists and specialists-in-training. Census non-specialists include general practitioners, resident medical officers and specialists-in-training.
(e) ABS Census total medical practitioners include non-specialists, specialists and medical practitioners ‘not further defined’.
Sources: AIHW Medical Labour Force Survey, 2006; ABS 2006 Census of Population and Housing data.
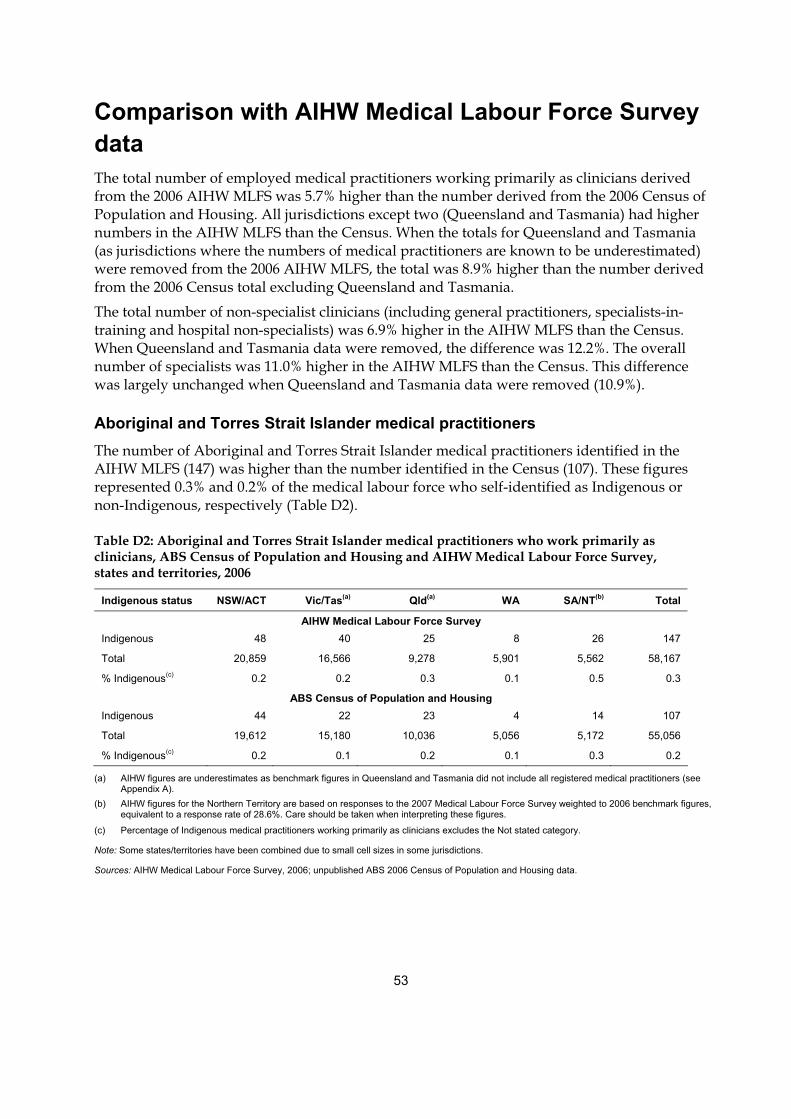
53
Comparison with AIHW Medical Labour Force Survey data The total number of employed medical practitioners working primarily as clinicians derived from the 2006 AIHW MLFS was 5.7% higher than the number derived from the 2006 Census of Population and Housing. All jurisdictions except two (Queensland and Tasmania) had higher numbers in the AIHW MLFS than the Census. When the totals for Queensland and Tasmania (as jurisdictions where the numbers of medical practitioners are known to be underestimated) were removed from the 2006 AIHW MLFS, the total was 8.9% higher than the number derived from the 2006 Census total excluding Queensland and Tasmania.
The total number of non-specialist clinicians (including general practitioners, specialists-in-training and hospital non-specialists) was 6.9% higher in the AIHW MLFS than the Census. When Queensland and Tasmania data were removed, the difference was 12.2%. The overall number of specialists was 11.0% higher in the AIHW MLFS than the Census. This difference was largely unchanged when Queensland and Tasmania data were removed (10.9%).
Aboriginal and Torres Strait Islander medical practitioners The number of Aboriginal and Torres Strait Islander medical practitioners identified in the AIHW MLFS (147) was higher than the number identified in the Census (107). These figures represented 0.3% and 0.2% of the medical labour force who self-identified as Indigenous or non-Indigenous, respectively (Table D2).
Table D2: Aboriginal and Torres Strait Islander medical practitioners who work primarily as clinicians, ABS Census of Population and Housing and AIHW Medical Labour Force Survey, states and territories, 2006
Indigenous status NSW/ACT Vic/Tas(a) Qld(a) WA SA/NT(b) Total
AIHW Medical Labour Force Survey Indigenous 48 40 25 8 26 147
Total 20,859 16,566 9,278 5,901 5,562 58,167
% Indigenous(c) 0.2 0.2 0.3 0.1 0.5 0.3
ABS Census of Population and Housing Indigenous 44 22 23 4 14 107
Total 19,612 15,180 10,036 5,056 5,172 55,056
% Indigenous(c) 0.2 0.1 0.2 0.1 0.3 0.2
(a) AIHW figures are underestimates as benchmark figures in Queensland and Tasmania did not include all registered medical practitioners (see Appendix A).
(b) AIHW figures for the Northern Territory are based on responses to the 2007 Medical Labour Force Survey weighted to 2006 benchmark figures, equivalent to a response rate of 28.6%. Care should be taken when interpreting these figures.
(c) Percentage of Indigenous medical practitioners working primarily as clinicians excludes the Not stated category.
Note: Some states/territories have been combined due to small cell sizes in some jurisdictions.
Sources: AIHW Medical Labour Force Survey, 2006; unpublished ABS 2006 Census of Population and Housing data.
54
Differences between the data sources The reasons for the generally higher estimates in the AIHW MLFS than in the Census data are not well understood. There are a range of differences in the scope and collection methodologies of the two collections, and these may contribute to the differences in the figures between the two sources. Several key differences are highlighted below.
In the Census, responses are handwritten which are interpreted using intelligent character recognition technology and then coded using ANZSCO. The Census method may result in under identification of medical practitioners with accurate coding dependent on the level of detail provided and the legibility of responses. Coding of the Census responses results in some medical practitioners being coded as ‘not further defined’ (1,351 in the 2006 Census). These medical practitioners will be either non-specialists or specialists, but inadequate information has been provided to determine the appropriate category (ABS 2006b).
In the AIHW MLFS, estimates of the number of medical practitioners are derived from survey responses weighted to registration numbers provided by state and territory medical boards (known as benchmarks) and adjusted for multi-state registrations. These weighted figures are not likely to underestimate numbers of medical practitioners, except for Queensland and Tasmania as the benchmark figures exclude conditional registrants in Queensland, and conditional registrants who are overseas-trained doctors (including those in ‘Area of need’ positions) and interns in Tasmania.
A proportion of part-time clinicians are excluded from both data sources, but via different methods. The Census gathers information about a person’s main job only, so if they work part-time as a clinical medical practitioner and it is not their main job then they will not be classed as a medical practitioner. This also excludes some medical practitioners who undertake clinical work in addition to non-clinical main job (e.g. research, teaching, administration etc).
For the AIHW MLFS, a clinician is a medical practitioner who reported they spent most of their medical practitioner time working in clinical practice during the week prior to the survey (see Glossary). Medical practitioners who stated that most of their time was spent working outside clinical practice, as an educator, administrator, researcher, public health physician, occupational health physician or other are classed as non-clinicians. As a result, the number of clinicians reported by the AIHW MLFS will not include those clinicians who spend less time on clinical work than in other medical fields. However, unlike the Census, the AIHW MLFS data on clinical medical practitioners includes those medical practitioners who undertake clinical work in addition to a non-medical main job.
To be allocated to a state or territory in the AIHW MLFS, a medical practitioner must be registered in that state or territory, and indicate that they are mainly or only working in that state or territory at the time of the survey. Registration periods and processes differ across jurisdictions, resulting in the survey administration taking place throughout the year. This may have resulted in some variation in jurisdictional allocation compared with the Census, which provides a point in time snapshot. The Census data in this appendix allocates individuals to a given state or territory based on their usual residence, whereas the AIHW MLFS uses work postcode.
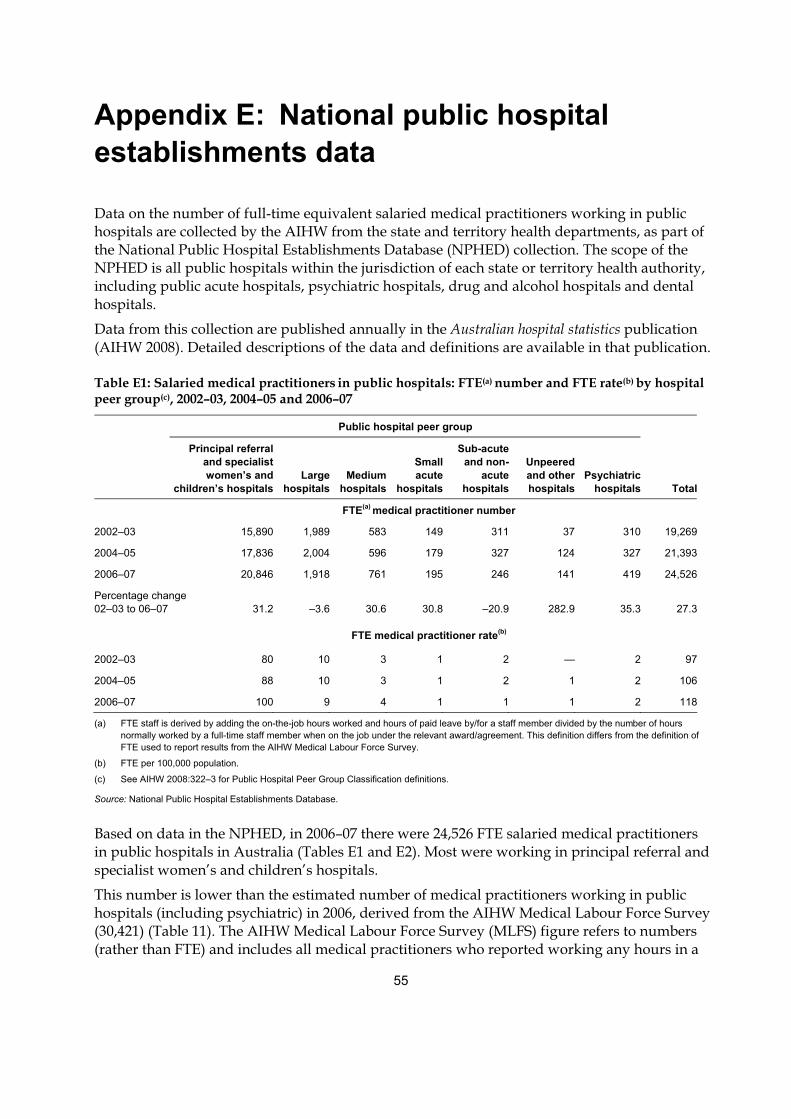
55
Appendix E: National public hospital establishments data
Data on the number of full-time equivalent salaried medical practitioners working in public hospitals are collected by the AIHW from the state and territory health departments, as part of the National Public Hospital Establishments Database (NPHED) collection. The scope of the NPHED is all public hospitals within the jurisdiction of each state or territory health authority, including public acute hospitals, psychiatric hospitals, drug and alcohol hospitals and dental hospitals.
Data from this collection are published annually in the Australian hospital statistics publication (AIHW 2008). Detailed descriptions of the data and definitions are available in that publication.
Table E1: Salaried medical practitioners in public hospitals: FTE(a) number and FTE rate(b) by hospital peer group(c), 2002–03, 2004–05 and 2006–07
Public hospital peer group
Principal referraland specialist women’s and
children’s hospitalsLarge
hospitalsMedium
hospitals
Small acute
hospitals
Sub-acuteand non-
acutehospitals
Unpeered and other hospitals
Psychiatric hospitals Total
FTE(a) medical practitioner number
2002–03 15,890 1,989 583 149 311 37 310 19,269
2004–05 17,836 2,004 596 179 327 124 327 21,393
2006–07 20,846 1,918 761 195 246 141 419 24,526
Percentage change 02–03 to 06–07 31.2 –3.6 30.6 30.8 –20.9 282.9 35.3 27.3
FTE medical practitioner rate(b)
2002–03 80 10 3 1 2 — 2 97
2004–05 88 10 3 1 2 1 2 106
2006–07 100 9 4 1 1 1 2 118
(a) FTE staff is derived by adding the on-the-job hours worked and hours of paid leave by/for a staff member divided by the number of hours normally worked by a full-time staff member when on the job under the relevant award/agreement. This definition differs from the definition of FTE used to report results from the AIHW Medical Labour Force Survey.
(b) FTE per 100,000 population.
(c) See AIHW 2008:322–3 for Public Hospital Peer Group Classification definitions.
Source: National Public Hospital Establishments Database.
Based on data in the NPHED, in 2006–07 there were 24,526 FTE salaried medical practitioners in public hospitals in Australia (Tables E1 and E2). Most were working in principal referral and specialist women’s and children’s hospitals.
This number is lower than the estimated number of medical practitioners working in public hospitals (including psychiatric) in 2006, derived from the AIHW Medical Labour Force Survey (30,421) (Table 11). The AIHW Medical Labour Force Survey (MLFS) figure refers to numbers (rather than FTE) and includes all medical practitioners who reported working any hours in a
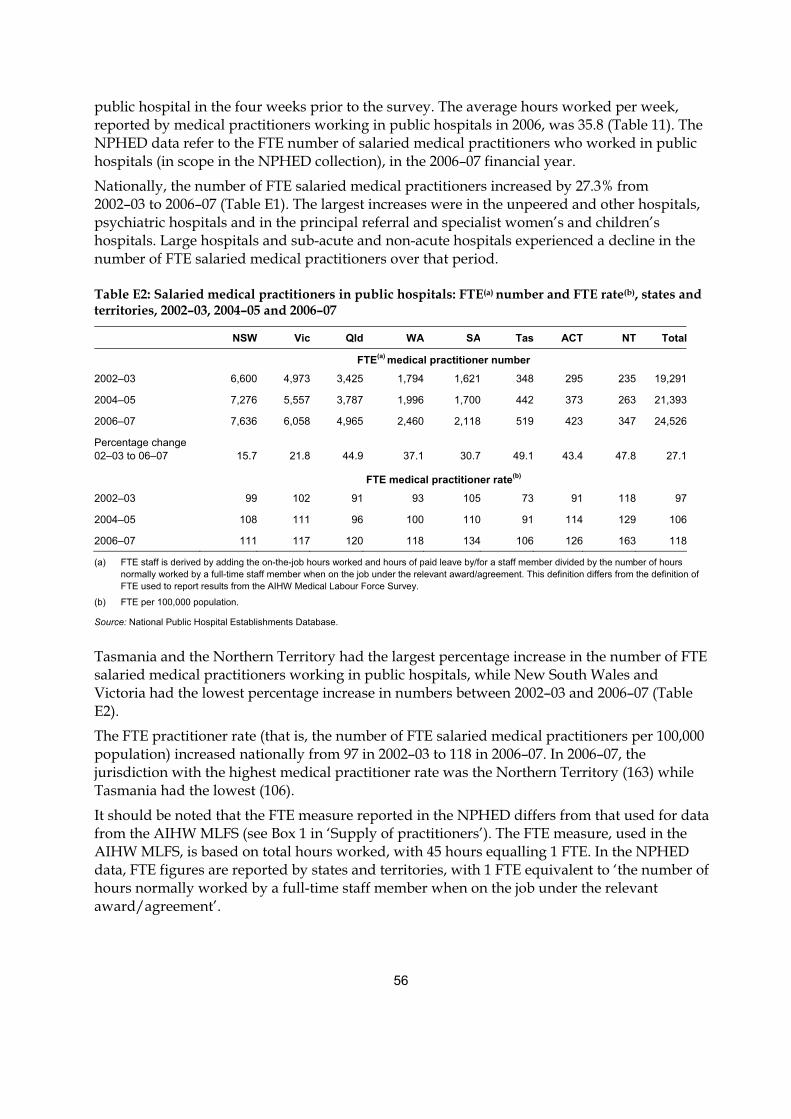
56
public hospital in the four weeks prior to the survey. The average hours worked per week, reported by medical practitioners working in public hospitals in 2006, was 35.8 (Table 11). The NPHED data refer to the FTE number of salaried medical practitioners who worked in public hospitals (in scope in the NPHED collection), in the 2006–07 financial year.
Nationally, the number of FTE salaried medical practitioners increased by 27.3% from 2002–03 to 2006–07 (Table E1). The largest increases were in the unpeered and other hospitals, psychiatric hospitals and in the principal referral and specialist women’s and children’s hospitals. Large hospitals and sub-acute and non-acute hospitals experienced a decline in the number of FTE salaried medical practitioners over that period.
Table E2: Salaried medical practitioners in public hospitals: FTE(a) number and FTE rate(b), states and territories, 2002–03, 2004–05 and 2006–07
NSW Vic Qld WA SA Tas ACT NT Total
FTE(a) medical practitioner number
2002–03 6,600 4,973 3,425 1,794 1,621 348 295 235 19,291
2004–05 7,276 5,557 3,787 1,996 1,700 442 373 263 21,393
2006–07 7,636 6,058 4,965 2,460 2,118 519 423 347 24,526
Percentage change 02–03 to 06–07 15.7 21.8 44.9 37.1 30.7 49.1 43.4 47.8 27.1
FTE medical practitioner rate(b)
2002–03 99 102 91 93 105 73 91 118 97
2004–05 108 111 96 100 110 91 114 129 106
2006–07 111 117 120 118 134 106 126 163 118
(a) FTE staff is derived by adding the on-the-job hours worked and hours of paid leave by/for a staff member divided by the number of hours normally worked by a full-time staff member when on the job under the relevant award/agreement. This definition differs from the definition of FTE used to report results from the AIHW Medical Labour Force Survey.
(b) FTE per 100,000 population.
Source: National Public Hospital Establishments Database.
Tasmania and the Northern Territory had the largest percentage increase in the number of FTE salaried medical practitioners working in public hospitals, while New South Wales and Victoria had the lowest percentage increase in numbers between 2002–03 and 2006–07 (Table E2).
The FTE practitioner rate (that is, the number of FTE salaried medical practitioners per 100,000 population) increased nationally from 97 in 2002–03 to 118 in 2006–07. In 2006–07, the jurisdiction with the highest medical practitioner rate was the Northern Territory (163) while Tasmania had the lowest (106).
It should be noted that the FTE measure reported in the NPHED differs from that used for data from the AIHW MLFS (see Box 1 in ‘Supply of practitioners’). The FTE measure, used in the AIHW MLFS, is based on total hours worked, with 45 hours equalling 1 FTE. In the NPHED data, FTE figures are reported by states and territories, with 1 FTE equivalent to ‘the number of hours normally worked by a full-time staff member when on the job under the relevant award/agreement’.
57
Appendix F: Additional information available from the AIHW website
Tables In addition to the tables in this publication, more detailed tabulations from the 2006 Medical Labour Force Survey are published on the AIHW website <http://www.aihw.gov.au/ labourforce/publications.cfm>.
Employed practitioners: 13 tables of demographic characteristics (age, sex, citizenship, state/territory), main field of medicine, hours worked per week and full-time equivalent (FTE) supply (employed practitioners per 100,000 population and FTE practitioners per 100,000 population).
Employed practitioners by geographic region of main job: 8 tables by demographic characteristics, main field of medicine, hours worked per week, practitioner rates and full-time equivalent supply (employed practitioners per 100,000 population and FTE practitioners per 100,000 population).
Primary care practitioners: 13 tables of demographic characteristics, hours worked per week, practice size, type of primary care practitioner by state/territory or geographic location of main practice. One table by state and territory and one table by geographic region for selected characteristics (age, sex, hours worked) by type of primary care practitioner (VRGP, RACGP trainees, other).
Hospital non-specialists: 10 tables of type of hospital non-specialist, demographic characteristics, hours worked per week, work setting and sector by state/territory, or by geographic region of main job.
Specialists and specialists-in-training: 11 tables of specialists by selected characteristics (including demographic), main specialty of practice, clinical hours worked per week, total hours worked per week, other specialities of practice by state/territory.
There are two tables for specialists-in-training: selected characteristics and specialty of training, both by state/territory.

58
Survey questionnaires The questionnaires used by jurisdictions in the 2006 AIHW Medical Labour Force Survey questionnaire are provided on the AIHW web site <http://www.aihw.gov.au/labourforce/ publications.cfm> (select link to Medical labour force 2006).
In some jurisdictions, the questionnaire has been modified from the national template to suit local preferences. As a result the actual survey questionnaire used in each jurisdiction differs in format and in the wording for some questions. Where necessary and possible, the AIHW maps responses to provide nationally comparable estimates.
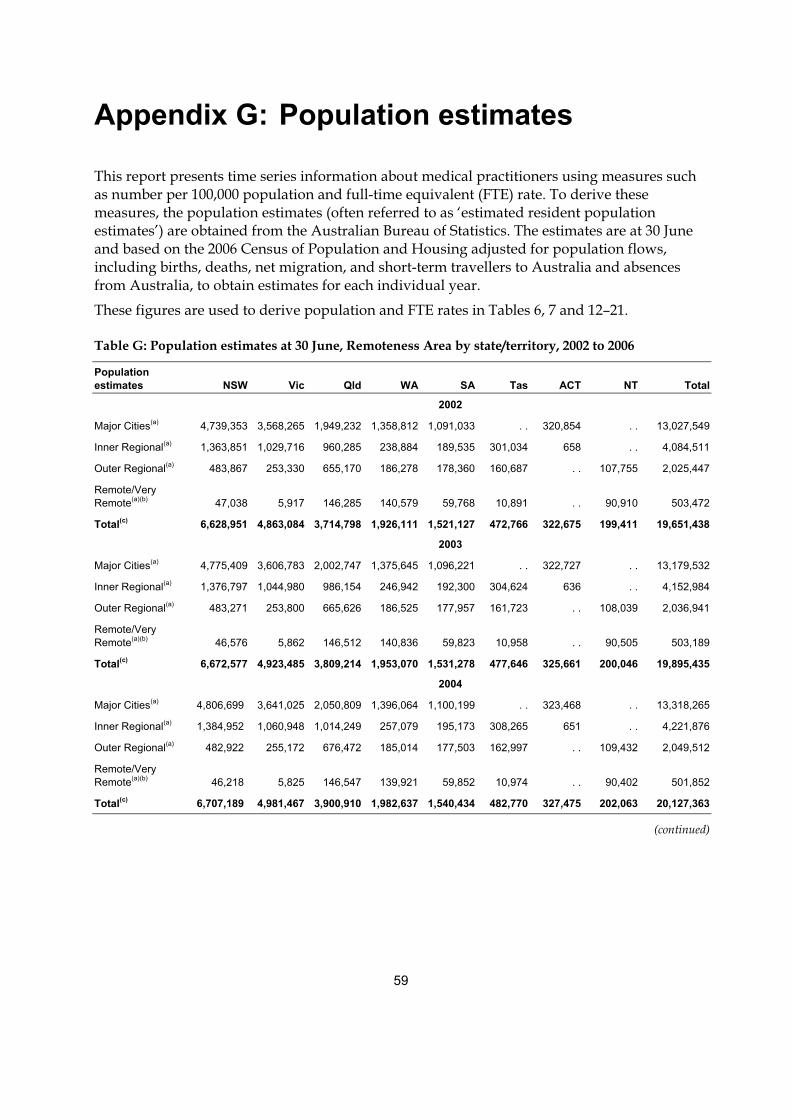
59
Appendix G: Population estimates
This report presents time series information about medical practitioners using measures such as number per 100,000 population and full-time equivalent (FTE) rate. To derive these measures, the population estimates (often referred to as ‘estimated resident population estimates’) are obtained from the Australian Bureau of Statistics. The estimates are at 30 June and based on the 2006 Census of Population and Housing adjusted for population flows, including births, deaths, net migration, and short-term travellers to Australia and absences from Australia, to obtain estimates for each individual year.
These figures are used to derive population and FTE rates in Tables 6, 7 and 12–21.
Table G: Population estimates at 30 June, Remoteness Area by state/territory, 2002 to 2006
Population estimates NSW Vic Qld WA SA Tas ACT NT Total
2002
Major Cities(a) 4,739,353 3,568,265 1,949,232 1,358,812 1,091,033 . . 320,854 . . 13,027,549
Inner Regional(a) 1,363,851 1,029,716 960,285 238,884 189,535 301,034 658 . . 4,084,511
Outer Regional(a) 483,867 253,330 655,170 186,278 178,360 160,687 . . 107,755 2,025,447
Remote/Very Remote(a)(b) 47,038 5,917 146,285 140,579 59,768 10,891 . . 90,910 503,472
Total(c) 6,628,951 4,863,084 3,714,798 1,926,111 1,521,127 472,766 322,675 199,411 19,651,438
2003
Major Cities(a) 4,775,409 3,606,783 2,002,747 1,375,645 1,096,221 . . 322,727 . . 13,179,532
Inner Regional(a) 1,376,797 1,044,980 986,154 246,942 192,300 304,624 636 . . 4,152,984
Outer Regional(a) 483,271 253,800 665,626 186,525 177,957 161,723 . . 108,039 2,036,941
Remote/Very Remote(a)(b) 46,576 5,862 146,512 140,836 59,823 10,958 . . 90,505 503,189
Total(c) 6,672,577 4,923,485 3,809,214 1,953,070 1,531,278 477,646 325,661 200,046 19,895,435
2004
Major Cities(a) 4,806,699 3,641,025 2,050,809 1,396,064 1,100,199 . . 323,468 . . 13,318,265
Inner Regional(a) 1,384,952 1,060,948 1,014,249 257,079 195,173 308,265 651 . . 4,221,876
Outer Regional(a) 482,922 255,172 676,472 185,014 177,503 162,997 . . 109,432 2,049,512
Remote/Very Remote(a)(b) 46,218 5,825 146,547 139,921 59,852 10,974 . . 90,402 501,852
Total(c) 6,707,189 4,981,467 3,900,910 1,982,637 1,540,434 482,770 327,475 202,063 20,127,363
(continued)
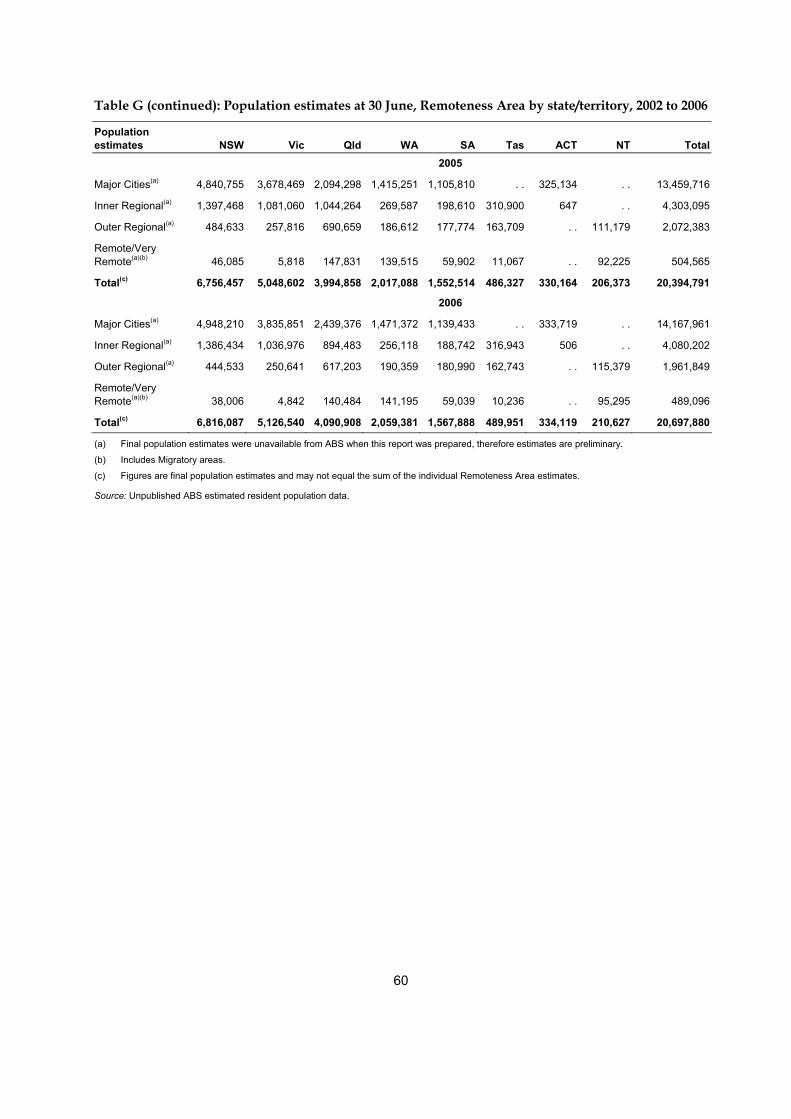
60
Table G (continued): Population estimates at 30 June, Remoteness Area by state/territory, 2002 to 2006
Population estimates NSW Vic Qld WA SA Tas ACT NT Total 2005
Major Cities(a) 4,840,755 3,678,469 2,094,298 1,415,251 1,105,810 . . 325,134 . . 13,459,716
Inner Regional(a) 1,397,468 1,081,060 1,044,264 269,587 198,610 310,900 647 . . 4,303,095
Outer Regional(a) 484,633 257,816 690,659 186,612 177,774 163,709 . . 111,179 2,072,383
Remote/Very Remote(a)(b) 46,085 5,818 147,831 139,515 59,902 11,067 . . 92,225 504,565
Total(c) 6,756,457 5,048,602 3,994,858 2,017,088 1,552,514 486,327 330,164 206,373 20,394,791
2006
Major Cities(a) 4,948,210 3,835,851 2,439,376 1,471,372 1,139,433 . . 333,719 . . 14,167,961
Inner Regional(a) 1,386,434 1,036,976 894,483 256,118 188,742 316,943 506 . . 4,080,202
Outer Regional(a) 444,533 250,641 617,203 190,359 180,990 162,743 . . 115,379 1,961,849
Remote/Very Remote(a)(b) 38,006 4,842 140,484 141,195 59,039 10,236 . . 95,295 489,096
Total(c) 6,816,087 5,126,540 4,090,908 2,059,381 1,567,888 489,951 334,119 210,627 20,697,880
(a) Final population estimates were unavailable from ABS when this report was prepared, therefore estimates are preliminary.
(b) Includes Migratory areas.
(c) Figures are final population estimates and may not equal the sum of the individual Remoteness Area estimates.
Source: Unpublished ABS estimated resident population data.
61
Glossary
Benchmark data
For the 2006 AIHW Medical Labour Force Survey, responses are weighted to the number of registered medical practitioners in each state and territory to take account for non-response. These numbers are referred to as ‘benchmarks’ throughout this report, and may not be equivalent to that reported in the medical board (or council) annual report due to scope and reporting time differences.
Career medical officer (CMO) and other salaried hospital career practitioner
Generally, a medical practitioner who mainly works in a hospital after completing all professional training is referred to as a career medical officer (CMO). CMO also includes some other salaried practitioners who have completed an internship and are registered to practise under supervision. They are also known as a hospital medical officer (HMO) in some states.
Conditional registration
If a medical practitioner does not meet the requirements to become a generally registered medical practitioner they may obtain limited or conditional registration. Interns, ‘Area of need’ medical practitioners (see Appendix B), overseas-trained medical practitioners undertaking postgraduate or supervised training, overseas-trained specialists, non-practising medical practitioners and medical practitioners facing disciplinary action are generally conditionally registered.
Employed medical practitioner
A medical practitioner who reported in the survey working mainly, or only, in their state of registration, in medicine, in the four weeks prior to the survey. In this report, data on employed medical practitioners include those who are: • practising medicine • involved with work that is principally concerned with the discipline of medicine (including
medical research, administration, or teaching of medicine) • on leave for three months or longer.
Field of medicine A description of the job function in the type of medical work undertaken by a medical practitioner:
Clinician: In this publication, a medical practitioner who spends most of the total weekly working hours mainly engaged in clinical practice (that is, diagnosis and/or treatment including recommending preventive action to patients) is classified as a clinician.
Non-clinician: A medical practitioner who is not a clinician. It includes: • administrator: employed in medical administration • teacher/educator: teaching or training persons in medicine • researcher: engaged in medical research
62
• public health physician: engaged in identifying disease and illness, along with their treatments and any preventive measures that affect the health of the general public
• occupational health physician: engaged in identifying disease and illness, along with their treatments and any preventive measures arising from particular fields or industries
• other: a job function in medicine which is not one of the above.
FRACGP Fellow of the Royal Australian College of General Practitioners.
Full-time equivalent (FTE)
A measure of the workforce that takes into account both the absolute number of workers and the average hours per week that they work. In this report, 45 total hours per week is assumed to be equivalent to 1 FTE.
The number of full-time equivalent practitioners equals the number of practitioners multiplied by the average weekly hours worked, divided by the number of hours in a ‘standard‘ full-time week, i.e. 45 hours for this report. The FTE number is converted to a rate per 100,000 population for comparison with the practitioner rate (number of practitioners per 100,000 population).
Full-time workload equivalent (FWE)
A measure of medical workforce supply that takes into account the differing working patterns of medical practitioners. FWE is calculated by dividing each medical practitioner’s Medicare billing by the average billing of full-time doctors for the year. There is no cap on a medical practitioner’s FWE.
General practitioner
In this report, data on general practitioners are included in the primary care practitioner data (see ‘Primary care practitioner’).
General registration
General registration is granted to medical practitioners who have fulfilled the full requirements of the medical board (or council) in that jurisdiction to practise. It permits a medical practitioner to work unsupervised in their field.
GP registrar
A registered medical practitioner who is enrolled in a general practice training program approved by the Royal Australian College of General Practitioners (RACGP) to achieve Fellowship of the RACGP. (See ‘RACGP trainee’.)
Hospital medical officers (HMOs)
A type of hospital non-specialist. An HMO is a medical practitioner undergoing further training in a hospital after completing an internship, but who has not commenced a recognised general practice or specialist practice training program. These are often referred to as PGY2 (post-graduation year 2) and PGY3.
63
Hospital non-specialist
A medical practitioner mainly employed in a salaried position in a hospital who does not have a recognised specialist qualification and who is not in training to gain a recognised specialist qualification. They include interns, resident medical officers (RMOs), hospital medical officers (HMOs) and interns, as well as career medical officers (CMOs) and other salaried hospital practitioners.
Hours worked The total number of weekly hours worked is self-reported by practitioners and relates to the number of hours worked in all medical fields. In editing survey responses, maximum hours worked accepted were 125 hours per week. Reported hours greater than 125 are considered unreliable and not included in the analysis.
Intern
A type of hospital non-specialist. Medical practitioners in their first year of medical work after completing their undergraduate or postgraduate medical degree. These are often referred to as PGY1 (post-graduation year 1).
Medical boards
Medical boards (or councils in some jurisdictions) are statutory authorities established under specific legislation, in each state and territory. The principal purpose of the board is to protect the health and safety of the public of the jurisdiction by providing mechanisms designed to ensure that medical practitioners are fit to practise medicine. They achieve this by ensuring that only properly trained medical practitioners are registered, and that registered medical practitioners maintain proper standards of conduct and competence.
Occupation
A description of the job function within the field of medicine: • clinician: a medical practitioner mainly involved in the diagnosis, care and treatment of
individuals including recommending preventive action (in this publication, a medical practitioner who spends most hours engaged in clinical practice is classified as a clinician)
• administrator: a person mainly employed in medical administration • teacher/educator: a person teaching or training persons in medicine • researcher: a person primarily engaged in medical research • public health physician: a medical practitioner primarily engaged in identifying disease
and illness, along with their treatments and any preventive measures that affect the health of the general public
• occupational health physician: a medical practitioner primarily engaged in identifying disease and illness, along with their treatments and any preventive measures, arising from particular occupations or industries and
• other: a job function in medicine which is not one of the above (including medico-legal physician).
64
Primary care practitioner In the AIHW Medical Labour Force Survey, a primary care practitioner is defined as a medical practitioner who reported that they were employed at the time of the survey, spent most of their time working as a clinician in the week prior to the survey and their main area of clinical practice was primary or general care.
Primary care practitioners who identify as such are asked to further identify themselves as a vocationally registered GP, an RACGP trainee, or other.
RACGP Royal Australian College of General Practitioners.
RACGP trainee A medical practitioner under the supervision of a Royal Australian College of General Practitioners (RACGP) Fellow in a job recognised as leading to the RACGP Fellowship.
Remoteness Area The Remoteness Area (RA) Structure within the Australian Standard Geographical Classification (ASGC), produced by the ABS, has been used in this publication to present regional data.
The RA Structure of the ASGC is based on the Accessibility/Remoteness Index of Australia (ARIA), where the remoteness index value of a point is based on the physical road distance to the nearest town or service in each of six population size classes based on the 2006 Census of Population and Housing. These classes are: • Major Cities of Australia • Inner Regional Australia • Outer Regional Australia • Remote Australia • Very Remote Australia • Migratory.
Due to the small numbers in the Remote Australia, Very Remote Australia and Migratory classes, they have been collapsed and reported as Remote/Very Remote in this report.
Resident medical officer (RMO) A medical practitioner undergoing further training in a hospital after completing an internship, but who has not commenced a recognised general practice or specialist practice training program. These are often referred to as PGY2 and PGY3.
Specialist A medical practitioner with a qualification awarded by, or which equates to that awarded by, the relevant specialist professional college in Australia to treat certain conditions (defined in the questionnaire).

65
Specialist-in-training A medical practitioner who has been accepted by a specialist medical college into a training position supervised by a member of the college. They are self-identified on the questionnaire.
Specialty The specialty area of medicine in which a specialist practices. A specialty is an area of work for which the specialist is qualified for recognition under the Health Insurance Act 1973.
Vocationally registered general practitioner (VRGP) A primary care practitioner who has been registered by Medicare Australia as a recognised general practitioner. They are self-identified on the questionnaire.
66
References
Australian Bureau of Statistics (ABS) 2006a. ANZSCO—Australian and New Zealand Standard Classification of Occupations, first edition, 2006. Cat. no. 1220.0. Canberra: ABS.
ABS 2006b. 2901.0 Census dictionary, 2006 (Reissue). Viewed 1 June 2008, <http://www.abs.gov.au/AUSSTATS/[email protected]/mf/2901.0>.
ABS 2007. 4705.0 Population distribution, Aboriginal and Torres Strait Islander Australians, 2006. Viewed 1 June 2008, <http://www.abs.gov.au/AUSSTATS/[email protected]/mf/4705.0>.
ABS 2008. 4819.0 Selected health occupations: Australia, 2006. Viewed 17 June 2008, <http://www.abs.gov.au/AUSSTATS/[email protected]/ProductsbyReleaseDate/3901E0682F031085CA25746A00108FD5?OpenDocument>.
AIHW (Australian Institute of Health and Welfare) 2005. Medical labour force 2003. National Health Labour Force Series no. 32. Cat. no. HWL 32. Canberra: AIHW.
AIHW 2008. Australian hospital statistics 2006–07. Health Services Series no. 31. Cat. no. HSE 55. Canberra: AIHW.
AMA (Australian Medical Association) 2008. Becoming a doctor and bonded medical school places — a guide for prospective medical students. Viewed 08 September 2008, <http://www.ama.com.au/web.nsf/doc/WEEN-7A454H>.
AMWAC (Australian Medical Workforce Advisory Committee) 1999. Temporary resident doctors in Australia: distribution, characteristics and role. Viewed 10 October 2007, <http://www.nhwt.gov.au/documents/Publications/1999/Temporary%20resident%20doctors%20in%20Australia.pdf>.
Australian Capital Territory Medical Board 2006. ACT Medical Board, annual report 2005–2006. Viewed 1 June 2008, <http://www.medicalboard.act.gov.au/information/docs/anrep06.doc>.
DoHA (Department of Health and Ageing) 2007. Work as a doctor in Australia. Viewed 1 June 2008, <http://www.doctorconnect.gov.au/internet/otd/publishing.nsf/Content/ work-Registering-and-qualifying>.
DoHA 2008a. General practice statistics. Viewed 1 June 2008, <http://www.health.gov.au/ internet/main/publishing.nsf/Content/General+Practice+Statistics-1>.
DoHA 2008b. Report on the Audit of Health Workforce in Rural and Regional Australia, April 2008. Canberra: Commonwealth of Australia.
Medical Council of Tasmania 2006. Medical Council of Tasmania, annual report 2006. Viewed 1 June 2008, <http://www.medicalcounciltas.com.au/pdfs/Annual%20Report%202006.pdf>.
National Aboriginal and Torres Strait Islander Health Council (NATSIHC) 2008. Pathways into the health workforce for Aboriginal and Torres Strait Islander people. Viewed 8 September 2008, <http://www.aida.org.au/pdf/Pathways.pdf>.
New South Wales Health (NSW Health) 2007. Area of need program. Viewed 16 October 2007, <http://www.health.nsw.gov.au/othp/>.
67
New South Wales Medical Board 2006. New South Wales Medical Board, annual report 2006. Viewed 1 June 2008, <http://www.nswmb.org.au/system/files/f53/o522// 5145%20AnnualReport%202006.pdf>.
Queensland Medical Board 2006. Medical Board of Queensland, annual report 2005–2006. Viewed 1 June 2008, <http://www.medicalboard.qld.gov.au/pdfs/ medical-annual-report-2005–06.pdf>.
South Australia Medical Board 2006. Medical Board of South Australia, 23rd annual report 2005–06. Viewed 1 June 2008, <http://www.medicalboardsa.asn.au/media/files/26820.pdf>.
Victoria Medical Board 2006. Medical Practitioners Board of Victoria, annual report 2006. Viewed 1 June 2008, <http://medicalboardvic.org.au/pdf/AR_2006.pdf>.
Western Australia Medical Board 2006. Medical Board of Western Australia, 2006 annual report. Viewed 1 June 2008, <http://www.medicalboard.com.au/pdfs/ 2006%20Annual%20Report%20Final.pdf>.
68
List of tables
Table 1: Registered medical practitioners: labour force status, 2002 to 2006 ...........................................6 Table 2: Registered medical practitioners: labour force status, states and territories, 2006...................7 Table 3: Employed medical practitioners: Indigenous status, states and territories, 2006.....................9 Table 4: Employed medical practitioners: Indigenous status, selected features, 2006 .........................10 Table 5: Employed medical practitioners: main field of medicine and demographics, 2002 and
2006....................................................................................................................................................11 Table 6: Employed medical practitioner clinicians per 100,000 population, main area of clinical
practice, 2002 to 2006.......................................................................................................................12 Table 7: Employed specialist clinicians per 100,000 population, broad specialty group, 2002 to
2006....................................................................................................................................................13 Table 8: Specialists: main specialty of practice, sex, age and total hours worked, 2006.......................15 Table 9: Employed medical practitioners: country of first qualification, states and territories,
2006....................................................................................................................................................17 Table 10: Employed medical practitioners by field of medicine: average weekly hours worked
and proportion working 50 hours or more, 2002 and 2006 .......................................................18 Table 11: Employed medical practitioners: total hours worked, work setting and sector, 2006...........21 Table 12: Employed medical practitioners: FTE per 100,000 population, main field of medicine,
2002 to 2006 ......................................................................................................................................22 Table 13: Employed specialist clinicians: FTE per 100,000 population, broad specialty group,
2002 to 2006 ......................................................................................................................................23 Table 14: Employed medical practitioners: selected features, 2002 and 2006..........................................24 Table 15: Employed medical practitioners in Major Cities: selected features, 2002 and 2006...............26 Table 16: Employed medical practitioners in Inner Regional Australia: selected features,
2002 and 2006 ...................................................................................................................................27 Table 17: Employed medical practitioners in Outer Regional Australia: selected features,
2002 and 2006 ...................................................................................................................................28 Table 18: Employed medical practitioners in Remote/Very Remote Australia: selected features,
2002 and 2006 ...................................................................................................................................29 Table 19: Employed medical practitioners: selected characteristics, states and territories, 2002 and
2006....................................................................................................................................................30 Table 20: Employed medical practitioners: sector, states and territories, 2002 and 2006.......................32 Table 21: Primary care clinicians: selected features, states and territories, 2002 and 2006 ....................33 Table A1: Estimated survey response rate, states and territories, 2002 to 2006........................................38 Table A2: Reference period for the employment/labour force status question, states and
territories, 2005 and 2006................................................................................................................41 Table A3: Availability of registration type in survey, states and territories, 2005 and 2006...................42 Table B1: General and conditional medical practitioner registrations reported by state and
territory medical boards and councils, 2005–06 ..........................................................................46
69
Table B2: Registration numbers used to benchmark the AIHW Medical Labour Force Survey, 2005 and 2006 ...................................................................................................................................46
Table C1: General practitioner numbers (Medicare) compared with the estimated number of employed primary care practitioners whose main field of work is clinician (AIHW Medical Labour Force Survey), states and territories, 2002 and 2006 ......................................48
Table C2: General practitioner FWEs (Medicare) compared with the FTE employed primary care practitioners whose main field of work is clinician (AIHW Medical Labour Force Survey), states and territories, 2002 and 2006..............................................................................49
Table D1: Non-specialist medical practitioners and specialists who work primarily as clinicians, ABS Census of Population and Housing and AIHW Medical Labour Force Survey, states and territories, 2006..............................................................................................................52
Table D2: Aboriginal or Torres Strait Islander medical practitioners who work primarily as clinicians, ABS Census of Population and Housing and AIHW Medical Labour Force Survey, states and territories, 2006 .....................................................................................53
Table E1: Salaried medical practitioners in public hospitals: FTE number and FTE rate by hospital peer group(c), 2002–03, 2004–05 and 2006–07................................................................55
Table E2: Salaried medical practitioners in public hospitals: FTE number and FTE rate, states and territories, 2002–03, 2004–05 and 2006–07..................................................................56
Table G: Population estimates at 30 June, Remoteness Area by state/territory, 2002 to 2006 .............59
List of figures
Figure 1: Estimated registered medical practitioners, labour force status, 2006.......................................5 Figure 2: Employed medical practitioners: age group and sex, 2002 and 2006.........................................8 Figure 3: Employed male medical practitioners by total hours worked per week, 2002 to 2006 .........19 Figure 4: Employed female medical practitioners by total hours worked per week, 2002 to 2006 ......19 Figure 5: Employed medical practitioners: average total weekly hours by age group,
2002 and 2006 ...................................................................................................................................20 Figure A1: Example of employment/labour force status question in 2005 ................................................39 Figure A2: Example of employment/labour force status question in 2006 ................................................41 Figure A3: Example of hours worked by location question in 2006 ............................................................42
Related Documents