Review Label-free quantification in clinical proteomics Dominik A. Megger ⁎, Thilo Bracht, Helmut E. Meyer, Barbara Sitek ⁎⁎ Medizinisches Proteom-Center, Ruhr-Universität Bochum, Bochum, Germany abstract article info Article history: Received 16 November 2012 Received in revised form 26 March 2013 Accepted 1 April 2013 Available online 6 April 2013 Keywords: Quantitative proteomics Label-free proteomics Clinical proteomics Disease biomarker Nowadays, proteomic studies no longer focus only on identifying as many proteins as possible in a given sample, but aiming for an accurate quantification of them. Especially in clinical proteomics, the investigation of variable protein expression profiles can yield useful information on pathological pathways or biomarkers and drug targets related to a particular disease. Over the time, many quantitative proteomic approaches have been established allowing researchers in the field of proteomics to refer to a comprehensive toolbox of different methodologies. In this review we will give an overview of different methods of quantitative proteomics with focus on label-free proteomics and its use in clinical proteomics. © 2013 Elsevier B.V. All rights reserved. 1. Introduction Accompanied by rapid technical developments in the field of mass spectrometry, proteomics has evolved into a very powerful bioanalytical platform for answering multidisciplinary scientific questions from medicine, biology, and biochemistry. This widespread applicability of proteomics necessarily implies the need of customized techniques and workflows depending on the scientific question itself, the kind of proteome under investigation (e.g. soluble or membrane proteins, post-translationally modified proteins, protein isoforms) as well as the sample types to be analyzed (e.g. tissue, cultured cells, body fluids, plants, bacteria). To meet all of these demands, a comprehensive repertoire of experimental techniques for isolation, separation, digestion, enrichment, depletion, identification as well as absolute and relative quantification of proteins has been developed over the years and further enhancements are still part of ongoing research. In particular, label-free proteomics has emerged as a high-throughput method for quantitative clinical proteomics studies. In this review we will give an overview about label-free proteomics and its use in the investigation of scientific questions with clinical relevance and a translational intent, widely referred to as clinical proteomics. We will discuss different approaches of label-free proteomics (except MALDI-MS-based strate- gies like MALDI imaging or quantitative LC-MALDI-MS/MS) in compar- ison to each other and labeling-based methods in order to shed light on the advantages, disadvantages and limitations of the different tech- niques. Furthermore, several experimental aspects ranging from sample preparation to data acquisition will be reviewed. Apart from these, soft- ware solutions for data analyses of label-free proteomics experiments and further data interpretation will be presented and selected examples from recent clinical proteomics studies will be discussed. 2. Quantitative proteomics 2.1. 2D gel electrophoresis Since its development almost 40 years ago, the two-dimensional gel electrophoresis is still one of the methods of choice for protein separation and quantification. Using an isoelectric focussing in the first dimension and a separation via SDS-PAGE in the second dimension, thousands of protein spots can be separated, visualized and quantified in a single 2D gel [1,2]. The isolated protein spots of interest are then digested, extracted from the gel and identified via mass spectrometry. Even if the quantification is very accurate and sensitive in this gel-based approach, the relative high amount of protein sample neces- sary for protein identification as well as multiple experimental steps are the major disadvantages of this technique. Due to these drawbacks and as a consequence of the technical improvements in the fields of chromatography and mass spectrometry, novel mass-spectrometry- based quantification strategies have been developed that allow high- throughput proteome analyses and are complementary to gel-based approaches leading to a higher proteome coverage. 2.2. Labeling-based quantification Over the years, several mass-spectrometry-based quantitative proteomic strategies utilizing different labeling strategies have been published. Most of these techniques rely on the labeling of samples from different conditions with stable isotopes ( 2 H, 13 C, 15 N, 18 O) and a Biochimica et Biophysica Acta 1834 (2013) 1581–1590 ⁎ Corresponding author at: Medizinisches Proteom-Center, Ruhr-Universität Bochum, 44801 Bochum, Germany. Tel.: +49 234/32 26119. ⁎⁎ Corresponding author at: Medizinisches Proteom-Center, Ruhr-Universität Bochum, 44801 Bochum, Germany. Tel.: +49 234/32 24362. E-mail addresses: [email protected] (D.A. Megger), [email protected] (B. Sitek). 1570-9639/$ – see front matter © 2013 Elsevier B.V. All rights reserved. http://dx.doi.org/10.1016/j.bbapap.2013.04.001 Contents lists available at SciVerse ScienceDirect Biochimica et Biophysica Acta journal homepage: www.elsevier.com/locate/bbapap

Welcome message from author
This document is posted to help you gain knowledge. Please leave a comment to let me know what you think about it! Share it to your friends and learn new things together.
Transcript
Biochimica et Biophysica Acta 1834 (2013) 1581–1590
Contents lists available at SciVerse ScienceDirect
Biochimica et Biophysica Acta
j ourna l homepage: www.e lsev ie r .com/ locate /bbapap
Review
Label-free quantification in clinical proteomics
Dominik A. Megger ⁎, Thilo Bracht, Helmut E. Meyer, Barbara Sitek ⁎⁎Medizinisches Proteom-Center, Ruhr-Universität Bochum, Bochum, Germany
⁎ Corresponding author at: Medizinisches Proteom-Ce44801 Bochum, Germany. Tel.: +49 234/32 26119.⁎⁎ Corresponding author at: Medizinisches Proteom-Ce44801 Bochum, Germany. Tel.: +49 234/32 24362.
E-mail addresses: [email protected] (D.A. Me(B. Sitek).
1570-9639/$ – see front matter © 2013 Elsevier B.V. Allhttp://dx.doi.org/10.1016/j.bbapap.2013.04.001
a b s t r a c t
a r t i c l e i n f oArticle history:Received 16 November 2012Received in revised form 26 March 2013Accepted 1 April 2013Available online 6 April 2013
Keywords:Quantitative proteomicsLabel-free proteomicsClinical proteomicsDisease biomarker
Nowadays, proteomic studies no longer focus only on identifying asmany proteins as possible in a given sample,but aiming for an accurate quantification of them. Especially in clinical proteomics, the investigation of variableprotein expression profiles can yield useful information on pathological pathways or biomarkers and drugtargets related to a particular disease. Over the time, many quantitative proteomic approaches have beenestablished allowing researchers in the field of proteomics to refer to a comprehensive toolbox of differentmethodologies. In this review we will give an overview of different methods of quantitative proteomicswith focus on label-free proteomics and its use in clinical proteomics.
© 2013 Elsevier B.V. All rights reserved.
1. Introduction
Accompanied by rapid technical developments in the field of massspectrometry, proteomics has evolved into a very powerful bioanalyticalplatform for answering multidisciplinary scientific questions frommedicine, biology, and biochemistry. This widespread applicabilityof proteomics necessarily implies the need of customized techniquesandworkflows depending on the scientific question itself, the kind ofproteome under investigation (e.g. soluble or membrane proteins,post-translationally modified proteins, protein isoforms) as well asthe sample types to be analyzed (e.g. tissue, cultured cells, bodyfluids, plants, bacteria). To meet all of these demands, a comprehensiverepertoire of experimental techniques for isolation, separation,digestion, enrichment, depletion, identification as well as absolute andrelative quantification of proteins has been developed over the yearsand further enhancements are still part of ongoing research. In particular,label-free proteomics has emerged as a high-throughput method forquantitative clinical proteomics studies. In this review we will give anoverview about label-free proteomics and its use in the investigation ofscientific questions with clinical relevance and a translational intent,widely referred to as clinical proteomics. We will discuss differentapproaches of label-free proteomics (except MALDI-MS-based strate-gies like MALDI imaging or quantitative LC-MALDI-MS/MS) in compar-ison to each other and labeling-basedmethods in order to shed light onthe advantages, disadvantages and limitations of the different tech-niques. Furthermore, several experimental aspects ranging from sample
nter, Ruhr-Universität Bochum,
nter, Ruhr-Universität Bochum,
gger), [email protected]
rights reserved.
preparation to data acquisitionwill be reviewed. Apart from these, soft-ware solutions for data analyses of label-free proteomics experimentsand further data interpretationwill be presented and selected examplesfrom recent clinical proteomics studies will be discussed.
2. Quantitative proteomics
2.1. 2D gel electrophoresis
Since its development almost 40 years ago, the two-dimensionalgel electrophoresis is still one of the methods of choice for proteinseparation and quantification. Using an isoelectric focussing in thefirst dimension and a separation via SDS-PAGE in the seconddimension,thousands of protein spots can be separated, visualized and quantifiedin a single 2D gel [1,2]. The isolated protein spots of interest are thendigested, extracted from the gel and identified via mass spectrometry.Even if the quantification is very accurate and sensitive in thisgel-based approach, the relative high amount of protein sample neces-sary for protein identification as well as multiple experimental stepsare the major disadvantages of this technique. Due to these drawbacksand as a consequence of the technical improvements in the fields ofchromatography and mass spectrometry, novel mass-spectrometry-based quantification strategies have been developed that allow high-throughput proteome analyses and are complementary to gel-basedapproaches leading to a higher proteome coverage.
2.2. Labeling-based quantification
Over the years, several mass-spectrometry-based quantitativeproteomic strategies utilizing different labeling strategies have beenpublished. Most of these techniques rely on the labeling of samplesfrom different conditions with stable isotopes (2H, 13C, 15N, 18O) and a
1582 D.A. Megger et al. / Biochimica et Biophysica Acta 1834 (2013) 1581–1590
following quantitative analysis in a mass spectrometer. The introduc-tion of the isotopic label can be performed by metabolic, chemicalor enzymatic labeling. Approaches utilizing stable-isotope labelingare: stable isotope labeling by amino acids in cell culture (SILAC)[3], stable isotope labeling of mammals (SILAM) [4], isotope-codedaffinity tags (ICAT) [5], isotope-coded protein labeling (ICPL) [6], isobarictags for relative and absolute quantification (iTRAQ) [7], tandemmasstags (TMT) [8,9], isobaric peptide termini labeling (IPTL) [10,11], di-methyl labeling [12] as well as several variants of these techniques.Apart from SILAC and SILAM which are introduced by metaboliclabeling, the above-mentioned quantification strategies are directly ap-plicable for proteomic studies of clinical samples. However, to over-come the limitation of SILAC to cell culture models a Super-SILACapproach has been developed. Here, quantitative changes of theproteome in different clinical samples (e.g. tumor tissue samples)can be determined by the comparison to an internal standardconsisting of an isotopically-labeled pool of cancer cell lines [13].Aside from the labeling with stable isotopes, a labeling strategy basedon the attachment of a metal complex to peptides or proteins hasbeen reported on. This approach is known as metal-coded affinity taglabeling (MeCAT) and enables absolute quantification with high sensi-tivity and a wide linear dynamic range via inductively coupled plasmamass spectrometry (ICP-MS) [14,15]. However, its potential applicabilityfor clinical samples has not been tested yet.
2.3. Label-free quantification
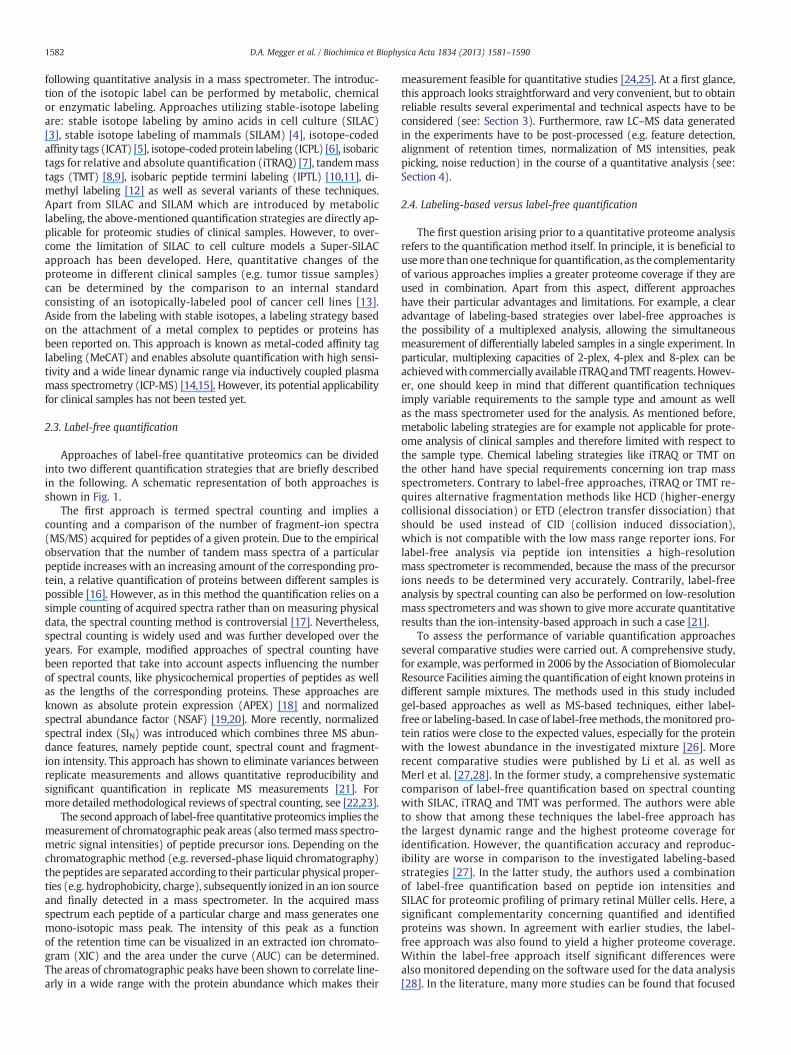
Approaches of label-free quantitative proteomics can be dividedinto two different quantification strategies that are briefly describedin the following. A schematic representation of both approaches isshown in Fig. 1.
The first approach is termed spectral counting and implies acounting and a comparison of the number of fragment-ion spectra(MS/MS) acquired for peptides of a given protein. Due to the empiricalobservation that the number of tandem mass spectra of a particularpeptide increases with an increasing amount of the corresponding pro-tein, a relative quantification of proteins between different samples ispossible [16]. However, as in this method the quantification relies on asimple counting of acquired spectra rather than on measuring physicaldata, the spectral counting method is controversial [17]. Nevertheless,spectral counting is widely used and was further developed over theyears. For example, modified approaches of spectral counting havebeen reported that take into account aspects influencing the numberof spectral counts, like physicochemical properties of peptides as wellas the lengths of the corresponding proteins. These approaches areknown as absolute protein expression (APEX) [18] and normalizedspectral abundance factor (NSAF) [19,20]. More recently, normalizedspectral index (SIN) was introduced which combines three MS abun-dance features, namely peptide count, spectral count and fragment-ion intensity. This approach has shown to eliminate variances betweenreplicate measurements and allows quantitative reproducibility andsignificant quantification in replicate MS measurements [21]. Formore detailed methodological reviews of spectral counting, see [22,23].
The second approach of label-free quantitative proteomics implies themeasurement of chromatographic peak areas (also termedmass spectro-metric signal intensities) of peptide precursor ions. Depending on thechromatographic method (e.g. reversed-phase liquid chromatography)the peptides are separated according to their particular physical proper-ties (e.g. hydrophobicity, charge), subsequently ionized in an ion sourceand finally detected in a mass spectrometer. In the acquired massspectrum each peptide of a particular charge and mass generates onemono-isotopic mass peak. The intensity of this peak as a functionof the retention time can be visualized in an extracted ion chromato-gram (XIC) and the area under the curve (AUC) can be determined.The areas of chromatographic peaks have been shown to correlate line-arly in a wide range with the protein abundance which makes their
measurement feasible for quantitative studies [24,25]. At a first glance,this approach looks straightforward and very convenient, but to obtainreliable results several experimental and technical aspects have to beconsidered (see: Section 3). Furthermore, raw LC–MS data generatedin the experiments have to be post-processed (e.g. feature detection,alignment of retention times, normalization of MS intensities, peakpicking, noise reduction) in the course of a quantitative analysis (see:Section 4).
2.4. Labeling-based versus label-free quantification
The first question arising prior to a quantitative proteome analysisrefers to the quantification method itself. In principle, it is beneficial tousemore thanone technique for quantification, as the complementarityof various approaches implies a greater proteome coverage if they areused in combination. Apart from this aspect, different approacheshave their particular advantages and limitations. For example, a clearadvantage of labeling-based strategies over label-free approaches isthe possibility of a multiplexed analysis, allowing the simultaneousmeasurement of differentially labeled samples in a single experiment. Inparticular, multiplexing capacities of 2-plex, 4-plex and 8-plex can beachievedwith commercially available iTRAQand TMT reagents. Howev-er, one should keep in mind that different quantification techniquesimply variable requirements to the sample type and amount as wellas the mass spectrometer used for the analysis. As mentioned before,metabolic labeling strategies are for example not applicable for prote-ome analysis of clinical samples and therefore limited with respect tothe sample type. Chemical labeling strategies like iTRAQ or TMT onthe other hand have special requirements concerning ion trap massspectrometers. Contrary to label-free approaches, iTRAQ or TMT re-quires alternative fragmentation methods like HCD (higher-energycollisional dissociation) or ETD (electron transfer dissociation) thatshould be used instead of CID (collision induced dissociation),which is not compatible with the low mass range reporter ions. Forlabel-free analysis via peptide ion intensities a high-resolutionmass spectrometer is recommended, because the mass of the precursorions needs to be determined very accurately. Contrarily, label-freeanalysis by spectral counting can also be performed on low-resolutionmass spectrometers and was shown to give more accurate quantitativeresults than the ion-intensity-based approach in such a case [21].
To assess the performance of variable quantification approachesseveral comparative studies were carried out. A comprehensive study,for example, was performed in 2006 by the Association of BiomolecularResource Facilities aiming the quantification of eight known proteins indifferent sample mixtures. The methods used in this study includedgel-based approaches as well as MS-based techniques, either label-free or labeling-based. In case of label-freemethods, themonitored pro-tein ratios were close to the expected values, especially for the proteinwith the lowest abundance in the investigated mixture [26]. Morerecent comparative studies were published by Li et al. as well asMerl et al. [27,28]. In the former study, a comprehensive systematiccomparison of label-free quantification based on spectral countingwith SILAC, iTRAQ and TMT was performed. The authors were ableto show that among these techniques the label-free approach hasthe largest dynamic range and the highest proteome coverage foridentification. However, the quantification accuracy and reproduc-ibility are worse in comparison to the investigated labeling-basedstrategies [27]. In the latter study, the authors used a combinationof label-free quantification based on peptide ion intensities andSILAC for proteomic profiling of primary retinal Müller cells. Here, asignificant complementarity concerning quantified and identifiedproteins was shown. In agreement with earlier studies, the label-free approach was also found to yield a higher proteome coverage.Within the label-free approach itself significant differences werealso monitored depending on the software used for the data analysis[28]. In the literature, many more studies can be found that focused

Fig. 1. Schematic representation of the two different label-free approaches. In the spectral-counting approach (left) peptide and protein abundances can be estimated based on thenumber of acquired peptide spectrum matches. In the ion-intensity-based approach (right) the changes of peptide abundances are determined by measuring and comparing thechromatographic peak areas of the corresponding peptides. In this example, both results would indicate a higher peptide abundance in State A.
1583D.A. Megger et al. / Biochimica et Biophysica Acta 1834 (2013) 1581–1590
on the comparison of different mass-spectrometry-based quantifica-tion strategies [29–34].
3. Experimental aspects
3.1. Sample preparation, purification and separation
The robustness and reproducibility of sample preparation are twoof the most important aspects for a successful quantitative proteomeanalysis, especially for label-free quantification where each sample ishandled separately starting from sample acquisition to the final mea-surement. Hence, every step within the experimental pipeline is a po-tential source of errors and can introduce several biases that mightproduce misleading results. An overview of a typical proteomics pipelineincluding the different experimental steps that generally can influencethe outcome of a proteome analysis is shown in Fig. 2.
The first step of a quantitative proteome analysis of clinical samplesthat determines the ongoing workflow is the choice of a sample typeand its acquisition. Principally, clinical proteomics studies can beperformed with numerous materials ranging from different body fluids(e.g. serum, plasma, urine, bile) to cell lines or isolated cell types andtissue samples, but specific workflows for different sample typesneed to be followed. In the case of tissue-based quantitative proteomics,microdissection of cells or tissue regions of interest might be necessary,depending on the heterogeneity of the investigated tissue. It has beenshown thatmicrodissection can resolve the problems of sample hetero-geneity and contaminations in tissue samples [35,36]. Over the years,several proteomic workflows including microdissection have beenestablished and published. Optimized workflows for quantitative2D-DIGE analyses of microdissected cells derived from a broad varietyof different tissue specimen have been developed and successfullyapplied in several biomarker discovery studies [37–45]. Concerningmass-spectrometry-based quantitative proteomics, Umar et al.reported on a proteomics pipeline for biomarker discovery of lasercapture microdissected breast cancer tissue, very recently [46]. At thesame time, this research group systematically evaluated the impact ofseveral sample preparation steps on the results of a proteomic studyof the same tissue type [47]. Apart from these two studies, many othersare reported in literature that focused on the improvement of sample
preparation steps for quantitative proteomics analyses of diverse clinicalsamples.
The subsequent steps, namely cell lysis, protein isolation and diges-tion, can also significantly influence the results of a proteomic study.Different cell lysis buffers and conditions need to be chosen dependingon the part of proteome under investigation (e.g. membrane proteins,organelle proteins, cytosolic proteins) or the sample type itself. Manyexamples of fine-tuned workflows for protein isolation from differentsample types and cellular compartments can be found in the literature.For example, Bergquist et al. evaluated the applicability and perfor-mance of different lysis buffers for the extraction of plasma membraneproteins frommouse brain tissue, very recently [48]. Earlier, Mann et al.reported a method known as filter-aided sample preparation (FASP)that allows protein extraction from formalin-fixed tissue samples [49].In addition to lysis protocols, digestion protocols have to be carefullychosen as well. Even if the proteolytic digestion with trypsin or otherproteases is the most-widely used method in proteomics, digestionmethods relying on chemical or physical methods might be useful andnecessary in special cases. Concerning proteolysis, one has furthermoreto decidewhether to perform an in-gel or in-solution digestion. If deter-gents that might influence the performance of the liquid chromatogra-phy were used during cell lysis, the former one should be used, as itimplies an intrinsic purification step of the proteins and peptides in agel. However, this method also implies a significant sample loss due toan incomplete extraction of the peptides from a gel piece. Alternatively,spin columns are increasingly used for sample purification [50] and cor-responding on-filter digestion protocols are available as well [49]. Forminute sample amounts in-solution digestion should be used. In this re-gard, improved in-solution digestion protocols for low sample amountswere established by Vékey and co-workers [51]. Comparative studies ofdifferent digestion methods can be found in literature as well. Fenselauet al., for example, presented a comparative study of different digestionmethods for plasma membrane proteins and found in-gel digestionto be themost advantageous one for this particular type of proteins [52].
Apart from the abovementioned steps, the determination of proteinconcentration in a given sample is a very important experimental as-pect, especially in the case of label-free quantification. A determinationdirectly after protein extraction from a sample is required to confirmthe successful isolation of proteins and to adjust the amount of protease
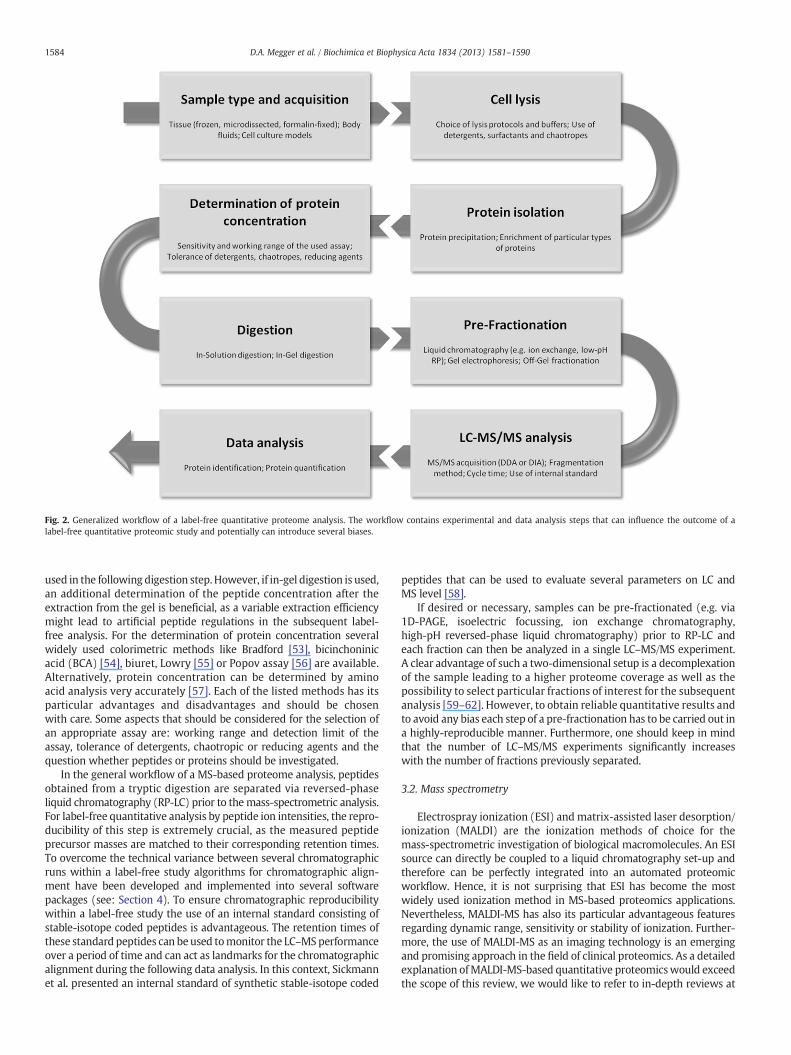
Fig. 2. Generalized workflow of a label-free quantitative proteome analysis. The workflow contains experimental and data analysis steps that can influence the outcome of alabel-free quantitative proteomic study and potentially can introduce several biases.
1584 D.A. Megger et al. / Biochimica et Biophysica Acta 1834 (2013) 1581–1590
used in the following digestion step.However, if in-gel digestion is used,an additional determination of the peptide concentration after theextraction from the gel is beneficial, as a variable extraction efficiencymight lead to artificial peptide regulations in the subsequent label-free analysis. For the determination of protein concentration severalwidely used colorimetric methods like Bradford [53], bicinchoninicacid (BCA) [54], biuret, Lowry [55] or Popov assay [56] are available.Alternatively, protein concentration can be determined by aminoacid analysis very accurately [57]. Each of the listed methods has itsparticular advantages and disadvantages and should be chosenwith care. Some aspects that should be considered for the selection ofan appropriate assay are: working range and detection limit of theassay, tolerance of detergents, chaotropic or reducing agents and thequestion whether peptides or proteins should be investigated.
In the general workflow of a MS-based proteome analysis, peptidesobtained from a tryptic digestion are separated via reversed-phaseliquid chromatography (RP-LC) prior to themass-spectrometric analysis.For label-free quantitative analysis by peptide ion intensities, the repro-ducibility of this step is extremely crucial, as the measured peptideprecursor masses are matched to their corresponding retention times.To overcome the technical variance between several chromatographicruns within a label-free study algorithms for chromatographic align-ment have been developed and implemented into several softwarepackages (see: Section 4). To ensure chromatographic reproducibilitywithin a label-free study the use of an internal standard consisting ofstable-isotope coded peptides is advantageous. The retention times ofthese standard peptides can beused tomonitor the LC–MSperformanceover a period of time and can act as landmarks for the chromatographicalignment during the following data analysis. In this context, Sickmannet al. presented an internal standard of synthetic stable-isotope coded
peptides that can be used to evaluate several parameters on LC andMS level [58].
If desired or necessary, samples can be pre-fractionated (e.g. via1D-PAGE, isoelectric focussing, ion exchange chromatography,high-pH reversed-phase liquid chromatography) prior to RP-LC andeach fraction can then be analyzed in a single LC–MS/MS experiment.A clear advantage of such a two-dimensional setup is a decomplexationof the sample leading to a higher proteome coverage as well as thepossibility to select particular fractions of interest for the subsequentanalysis [59–62]. However, to obtain reliable quantitative results andto avoid any bias each step of a pre-fractionation has to be carried out ina highly-reproducible manner. Furthermore, one should keep in mindthat the number of LC–MS/MS experiments significantly increaseswith the number of fractions previously separated.
3.2. Mass spectrometry
Electrospray ionization (ESI) and matrix-assisted laser desorption/ionization (MALDI) are the ionization methods of choice for themass-spectrometric investigation of biological macromolecules. An ESIsource can directly be coupled to a liquid chromatography set-up andtherefore can be perfectly integrated into an automated proteomicworkflow. Hence, it is not surprising that ESI has become the mostwidely used ionization method in MS-based proteomics applications.Nevertheless, MALDI-MS has also its particular advantageous featuresregarding dynamic range, sensitivity or stability of ionization. Further-more, the use of MALDI-MS as an imaging technology is an emergingand promising approach in the field of clinical proteomics. As a detailedexplanation ofMALDI-MS-based quantitative proteomicswould exceedthe scope of this review, we would like to refer to in-depth reviews at
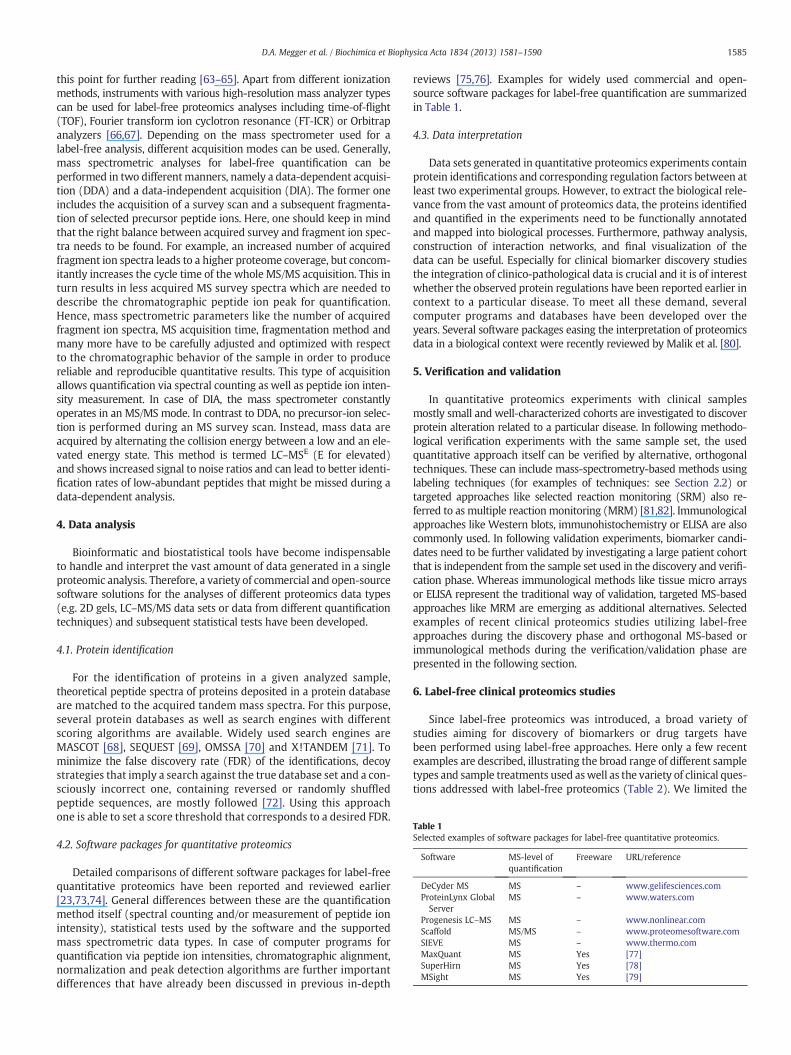
Table 1Selected examples of software packages for label-free quantitative proteomics.
Software MS-level ofquantification
Freeware URL/reference
DeCyder MS MS – www.gelifesciences.comProteinLynx GlobalServer
MS – www.waters.com
Progenesis LC–MS MS – www.nonlinear.comScaffold MS/MS – www.proteomesoftware.comSIEVE MS – www.thermo.comMaxQuant MS Yes [77]SuperHirn MS Yes [78]MSight MS Yes [79]
1585D.A. Megger et al. / Biochimica et Biophysica Acta 1834 (2013) 1581–1590
this point for further reading [63–65]. Apart from different ionizationmethods, instruments with various high-resolution mass analyzer typescan be used for label-free proteomics analyses including time-of-flight(TOF), Fourier transform ion cyclotron resonance (FT-ICR) or Orbitrapanalyzers [66,67]. Depending on the mass spectrometer used for alabel-free analysis, different acquisition modes can be used. Generally,mass spectrometric analyses for label-free quantification can beperformed in two differentmanners, namely a data-dependent acquisi-tion (DDA) and a data-independent acquisition (DIA). The former oneincludes the acquisition of a survey scan and a subsequent fragmenta-tion of selected precursor peptide ions. Here, one should keep in mindthat the right balance between acquired survey and fragment ion spec-tra needs to be found. For example, an increased number of acquiredfragment ion spectra leads to a higher proteome coverage, but concom-itantly increases the cycle time of the whole MS/MS acquisition. This inturn results in less acquired MS survey spectra which are needed todescribe the chromatographic peptide ion peak for quantification.Hence, mass spectrometric parameters like the number of acquiredfragment ion spectra, MS acquisition time, fragmentation method andmany more have to be carefully adjusted and optimized with respectto the chromatographic behavior of the sample in order to producereliable and reproducible quantitative results. This type of acquisitionallows quantification via spectral counting as well as peptide ion inten-sity measurement. In case of DIA, the mass spectrometer constantlyoperates in an MS/MS mode. In contrast to DDA, no precursor-ion selec-tion is performed during an MS survey scan. Instead, mass data areacquired by alternating the collision energy between a low and an ele-vated energy state. This method is termed LC–MSE (E for elevated)and shows increased signal to noise ratios and can lead to better identi-fication rates of low-abundant peptides that might be missed during adata-dependent analysis.
4. Data analysis
Bioinformatic and biostatistical tools have become indispensableto handle and interpret the vast amount of data generated in a singleproteomic analysis. Therefore, a variety of commercial and open-sourcesoftware solutions for the analyses of different proteomics data types(e.g. 2D gels, LC–MS/MS data sets or data from different quantificationtechniques) and subsequent statistical tests have been developed.
4.1. Protein identification
For the identification of proteins in a given analyzed sample,theoretical peptide spectra of proteins deposited in a protein databaseare matched to the acquired tandem mass spectra. For this purpose,several protein databases as well as search engines with differentscoring algorithms are available. Widely used search engines areMASCOT [68], SEQUEST [69], OMSSA [70] and X!TANDEM [71]. Tominimize the false discovery rate (FDR) of the identifications, decoystrategies that imply a search against the true database set and a con-sciously incorrect one, containing reversed or randomly shuffledpeptide sequences, are mostly followed [72]. Using this approachone is able to set a score threshold that corresponds to a desired FDR.
4.2. Software packages for quantitative proteomics
Detailed comparisons of different software packages for label-freequantitative proteomics have been reported and reviewed earlier[23,73,74]. General differences between these are the quantificationmethod itself (spectral counting and/or measurement of peptide ionintensity), statistical tests used by the software and the supportedmass spectrometric data types. In case of computer programs forquantification via peptide ion intensities, chromatographic alignment,normalization and peak detection algorithms are further importantdifferences that have already been discussed in previous in-depth
reviews [75,76]. Examples for widely used commercial and open-source software packages for label-free quantification are summarizedin Table 1.
4.3. Data interpretation
Data sets generated in quantitative proteomics experiments containprotein identifications and corresponding regulation factors between atleast two experimental groups. However, to extract the biological rele-vance from the vast amount of proteomics data, the proteins identifiedand quantified in the experiments need to be functionally annotatedand mapped into biological processes. Furthermore, pathway analysis,construction of interaction networks, and final visualization of thedata can be useful. Especially for clinical biomarker discovery studiesthe integration of clinico-pathological data is crucial and it is of interestwhether the observed protein regulations have been reported earlier incontext to a particular disease. To meet all these demand, severalcomputer programs and databases have been developed over theyears. Several software packages easing the interpretation of proteomicsdata in a biological context were recently reviewed by Malik et al. [80].
5. Verification and validation
In quantitative proteomics experiments with clinical samplesmostly small and well-characterized cohorts are investigated to discoverprotein alteration related to a particular disease. In following methodo-logical verification experiments with the same sample set, the usedquantitative approach itself can be verified by alternative, orthogonaltechniques. These can include mass-spectrometry-based methods usinglabeling techniques (for examples of techniques: see Section 2.2) ortargeted approaches like selected reaction monitoring (SRM) also re-ferred to as multiple reactionmonitoring (MRM) [81,82]. Immunologicalapproaches like Western blots, immunohistochemistry or ELISA are alsocommonly used. In following validation experiments, biomarker candi-dates need to be further validated by investigating a large patient cohortthat is independent from the sample set used in the discovery and verifi-cation phase. Whereas immunological methods like tissue micro arraysor ELISA represent the traditional way of validation, targeted MS-basedapproaches like MRM are emerging as additional alternatives. Selectedexamples of recent clinical proteomics studies utilizing label-freeapproaches during the discovery phase and orthogonal MS-based orimmunological methods during the verification/validation phase arepresented in the following section.
6. Label-free clinical proteomics studies
Since label-free proteomics was introduced, a broad variety ofstudies aiming for discovery of biomarkers or drug targets havebeen performed using label-free approaches. Here only a few recentexamples are described, illustrating the broad range of different sampletypes and sample treatments used aswell as the variety of clinical ques-tions addressed with label-free proteomics (Table 2). We limited the
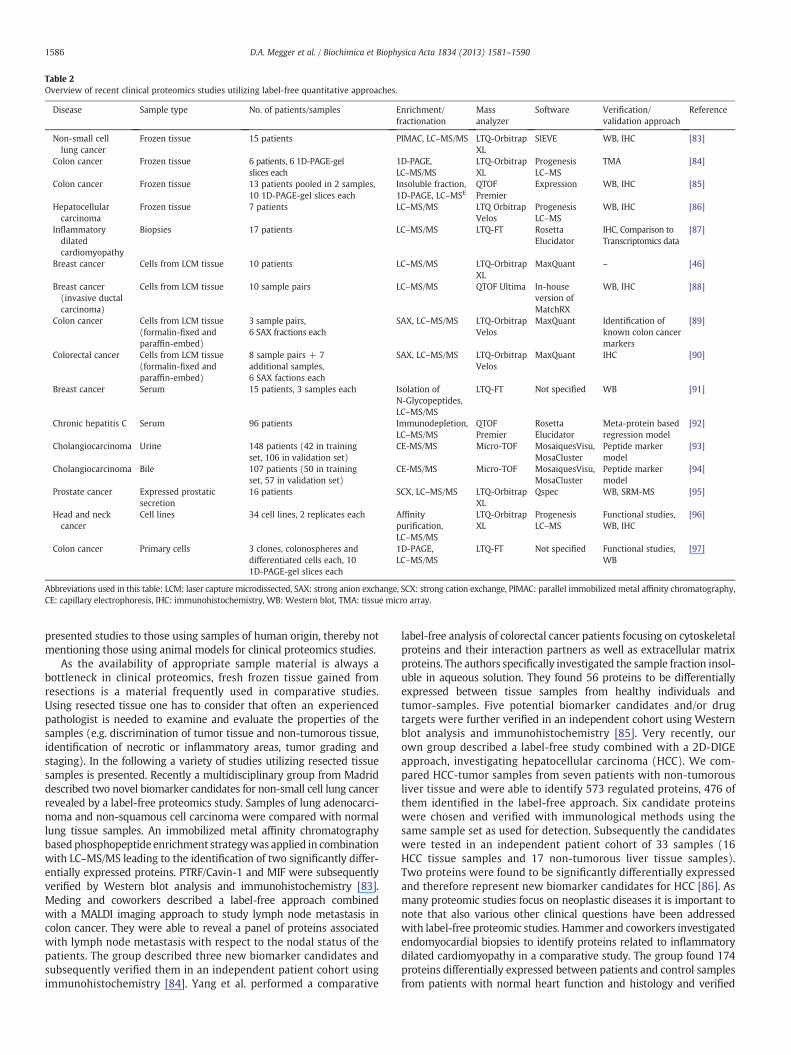
Table 2Overview of recent clinical proteomics studies utilizing label-free quantitative approaches.
Disease Sample type No. of patients/samples Enrichment/fractionation
Massanalyzer
Software Verification/validation approach
Reference
Non-small celllung cancer
Frozen tissue 15 patients PIMAC, LC–MS/MS LTQ-OrbitrapXL
SIEVE WB, IHC [83]
Colon cancer Frozen tissue 6 patients, 6 1D-PAGE-gelslices each
1D-PAGE,LC–MS/MS
LTQ-OrbitrapXL
ProgenesisLC–MS
TMA [84]
Colon cancer Frozen tissue 13 patients pooled in 2 samples,10 1D-PAGE-gel slices each
Insoluble fraction,1D-PAGE, LC–MSE
QTOFPremier
Expression WB, IHC [85]
Hepatocellularcarcinoma
Frozen tissue 7 patients LC–MS/MS LTQ OrbitrapVelos
ProgenesisLC–MS
WB, IHC [86]
Inflammatorydilatedcardiomyopathy
Biopsies 17 patients LC–MS/MS LTQ-FT RosettaElucidator
IHC, Comparison toTranscriptomics data
[87]
Breast cancer Cells from LCM tissue 10 patients LC–MS/MS LTQ-OrbitrapXL
MaxQuant – [46]
Breast cancer(invasive ductalcarcinoma)
Cells from LCM tissue 10 sample pairs LC–MS/MS QTOF Ultima In-houseversion ofMatchRX
WB, IHC [88]
Colon cancer Cells from LCM tissue(formalin-fixed andparaffin-embed)
3 sample pairs,6 SAX fractions each
SAX, LC–MS/MS LTQ-OrbitrapVelos
MaxQuant Identification ofknown colon cancermarkers
[89]
Colorectal cancer Cells from LCM tissue(formalin-fixed andparaffin-embed)
8 sample pairs + 7additional samples,6 SAX factions each
SAX, LC–MS/MS LTQ-OrbitrapVelos
MaxQuant IHC [90]
Breast cancer Serum 15 patients, 3 samples each Isolation ofN-Glycopeptides,LC–MS/MS
LTQ-FT Not specified WB [91]
Chronic hepatitis C Serum 96 patients Immunodepletion,LC–MS/MS
QTOFPremier
RosettaElucidator
Meta-protein basedregression model
[92]
Cholangiocarcinoma Urine 148 patients (42 in trainingset, 106 in validation set)
CE-MS/MS Micro-TOF MosaiquesVisu,MosaCluster
Peptide markermodel
[93]
Cholangiocarcinoma Bile 107 patients (50 in trainingset, 57 in validation set)
CE-MS/MS Micro-TOF MosaiquesVisu,MosaCluster
Peptide markermodel
[94]
Prostate cancer Expressed prostaticsecretion
16 patients SCX, LC–MS/MS LTQ-OrbitrapXL
Qspec WB, SRM-MS [95]
Head and neckcancer
Cell lines 34 cell lines, 2 replicates each Affinitypurification,LC–MS/MS
LTQ-OrbitrapXL
ProgenesisLC–MS
Functional studies,WB, IHC
[96]
Colon cancer Primary cells 3 clones, colonospheres anddifferentiated cells each, 101D-PAGE-gel slices each
1D-PAGE,LC–MS/MS
LTQ-FT Not specified Functional studies,WB
[97]
Abbreviations used in this table: LCM: laser capture microdissected, SAX: strong anion exchange, SCX: strong cation exchange, PIMAC: parallel immobilized metal affinity chromatography,CE: capillary electrophoresis, IHC: immunohistochemistry, WB: Western blot, TMA: tissue micro array.
1586 D.A. Megger et al. / Biochimica et Biophysica Acta 1834 (2013) 1581–1590
presented studies to those using samples of human origin, thereby notmentioning those using animal models for clinical proteomics studies.
As the availability of appropriate sample material is always abottleneck in clinical proteomics, fresh frozen tissue gained fromresections is a material frequently used in comparative studies.Using resected tissue one has to consider that often an experiencedpathologist is needed to examine and evaluate the properties of thesamples (e.g. discrimination of tumor tissue and non-tumorous tissue,identification of necrotic or inflammatory areas, tumor grading andstaging). In the following a variety of studies utilizing resected tissuesamples is presented. Recently a multidisciplinary group from Madriddescribed two novel biomarker candidates for non-small cell lung cancerrevealed by a label-free proteomics study. Samples of lung adenocarci-noma and non-squamous cell carcinoma were compared with normallung tissue samples. An immobilized metal affinity chromatographybased phosphopeptide enrichment strategywas applied in combinationwith LC–MS/MS leading to the identification of two significantly differ-entially expressed proteins. PTRF/Cavin-1 and MIF were subsequentlyverified by Western blot analysis and immunohistochemistry [83].Meding and coworkers described a label-free approach combinedwith a MALDI imaging approach to study lymph node metastasis incolon cancer. They were able to reveal a panel of proteins associatedwith lymph node metastasis with respect to the nodal status of thepatients. The group described three new biomarker candidates andsubsequently verified them in an independent patient cohort usingimmunohistochemistry [84]. Yang et al. performed a comparative
label-free analysis of colorectal cancer patients focusing on cytoskeletalproteins and their interaction partners as well as extracellular matrixproteins. The authors specifically investigated the sample fraction insol-uble in aqueous solution. They found 56 proteins to be differentiallyexpressed between tissue samples from healthy individuals andtumor-samples. Five potential biomarker candidates and/or drugtargets were further verified in an independent cohort using Westernblot analysis and immunohistochemistry [85]. Very recently, ourown group described a label-free study combined with a 2D-DIGEapproach, investigating hepatocellular carcinoma (HCC). We com-pared HCC-tumor samples from seven patients with non-tumorousliver tissue and were able to identify 573 regulated proteins, 476 ofthem identified in the label-free approach. Six candidate proteinswere chosen and verified with immunological methods using thesame sample set as used for detection. Subsequently the candidateswere tested in an independent patient cohort of 33 samples (16HCC tissue samples and 17 non-tumorous liver tissue samples).Two proteins were found to be significantly differentially expressedand therefore represent new biomarker candidates for HCC [86]. Asmany proteomic studies focus on neoplastic diseases it is important tonote that also various other clinical questions have been addressedwith label-free proteomic studies. Hammer and coworkers investigatedendomyocardial biopsies to identify proteins related to inflammatorydilated cardiomyopathy in a comparative study. The group found 174proteins differentially expressed between patients and control samplesfrom patients with normal heart function and histology and verified
1587D.A. Megger et al. / Biochimica et Biophysica Acta 1834 (2013) 1581–1590
them by immunohistochemistry and comparison with transcriptomicsdata [87].
Since tissues and also tumors consist of various cell types andcompounds of the extracellular matrix, laser capture microdissectionis often used to isolate the appropriate cell types of interest. By doingso, bias from irrelevant sample components can be ruled out andanalysis of specific sample parts is enabled. Again one has to beaware that often pathological experience may be needed for selectionand microdissection of the specific sample compound under investiga-tion. Liu and coworkers established a biomarker discovery pipeline forbreast cancer based on the analysis of laser capture microdissectedepithelial cells. The group described a workflow enabling the identi-fication of about 1800 proteins in samples containing an average of4000 cells on routine basis. The robustness and reproducibility ofthe workflowwere extensively tested and demonstrated by the anal-ysis of downstream regulated proteins of estrogen receptorα (ER) inER+ compared to ER− breast tumors [46]. Hill et al. designed a studyto investigate tumor vascularization in breast cancer. The group isolatedendothelial cells from tumor blood vessels to compare themwith bloodvessels from non-tumorous tissue in a differential label-free study. Theauthors described 86 proteins to be over-expressed in tumor vessels,among them several known tumor markers. 40 proteins were foundto be under-expressed, including basement-membrane proteinswhich are also known to show aberrant abundance in tumor vessels.To verify the results eight proteins were further studied by immunohis-tochemistry and Western blot analysis [88].
Although most described tissue-based studies utilize fresh frozentissue samples for label-free analysis and frozen tissue remains thegold standard for proteomic studies, the usage of formalin-fixed samplesfor label-free analysis has also been reported. Since Ostasiewicz andcoworkers described a method allowing the proteomic analysis offormalin-fixed and paraffin-embedded (FFPE) tissue the group alsoreported label-free studies based on FFPE samples. After optimizingthe analysis of small numbers of laser capturemicrodissected colorectalcancer cells and thereby showing the feasibility of such studies [89] aproteomic study of archival FFPE tissue samples was reported veryrecently. The authors compared laser capture microdissected cellsfrom normal mucosa, primary carcinoma and nodal metastases anddemonstrated the relative quantification of 7576 proteins. Expressionlevels of 1808 proteins were found to be significantly differentialbetween normal and cancer tissue and three potential biomarkerswere verified by immunohistochemistry [90]. Albeit the usage offormalin-fixed and paraffin-embedded samples in clinical studiesis possible, the benefit for discovery of biomarkers or drug targetsremains to be demonstrated. One advantage could be the availability ofextensive patient follow up data in samples from historical collections.If no such benefit derives from usage of FFPE samples, utilizingfresh frozen tissue appears to bemore obvious, as any bias from fixationcan be ruled out.
Human serum or plasma samples are generally difficult to analyzebecause the protein abundances of the plasma proteome span morethan ten orders of magnitude and are dominated by a small numberof typical plasma proteins. However, serum and plasma samples areeasily available and therefore very attractive clinical samples that alsohave been used in label-free studies. Hyung et al. reported a differentiallabel-free proteomics study using human serum samples. They fraction-ated the serum samples by isolation of N-glycosylated proteins usinghydrazide chemistry thereby avoiding depletion of high abundantproteins prior to analysis. The group studied serum samples of breastcancer patients comparing responders and non-responders toneoadjuvant chemotherapy and was able to identify thirteen novelbiomarker candidates. Six selected biomarker candidates were testedin an independent set of patients and allowed prediction of respondersand non-responders [91]. Patel et al. described a study in which serumsamples of patients with chronic Hepatitis C infection were used in alabel-free study to identify potential prognostic markers that allow
discrimination of responders and non-responders to standard-of-caretherapy. Samples were immunodepleted for 14 of the most abundantserum proteins prior to analysis by LC–MS/MS. Sera of 55 patientswere used in a training set and 41 in an independent validation cohort.Based on 105 identified proteins of interest the authors were able todevelop a regression model which allowed them to predict treatmentresponse in the validation set [92]. Although immunodepletion is widelyused, one should bring tomind the disadvantages of the procedurewhenworking with serum or plasma samples. Immunodepletion is hardlyreproducible and very likely to cause bias during sample preparation.The same holds true for blood coagulation, but moreover several pro-teases are involved in blood coagulation as well. For this reasonimmunodepletion should be avoided if ever possible and plasma is thesample of choicewhen blood samples are investigated using quantitativeproteomics studies.
Like serum or plasma, urine is also a source of samples which areeasily available and can be obtained non-invasively. Metzger andcoworkers investigated urine samples of 42 patients possessingcholangiocarcinoma (CC), primary sclerosing cholangitis (PSC) or benignbiliary disorder (BBD). The group established a peptide marker modelbased on ion intensity and the capillary electrophoresis migration time.The model was applied to an independent test cohort of 106 patientswhere it could discriminate patients with CC from patients with PSC orBBD with 83% sensitivity and 79% specificity [93]. Earlier, the samegroup already reported a similar approach utilizing bile for proteomicanalysis, a sample that can be obtained less invasive than tissue samplesduring endoscopic examination of patients. A training set of 50 patientswith CC, PSC or choledocholithiasis was used to identify disease-specificpeptide-patterns. The model was subsequently tested with an indepen-dent cohort of 57 patients where it distinguished CC from PSC andcholedocholithiasis with 84% sensitivity and 78% specificity [94].
Very recently, a label-free approach utilizing expressed prostaticsecretions (EPS) as source of samples was published by Kim et al.Samples from individuals with extracapsular or organ-confinedprostate cancer were compared in order to identify prognosticmarkerswhich allowdiscrimination of indolent tumors fromaggressiveones. Direct-EPS samples were used for the label-free study in which133 differentially expressed proteins could be identified. Verificationof biomarker candidates was carried out with EPS-urine from an inde-pendent patient cohort. 7 selected biomarker candidates were verifiedby Western blotting and relative quantification via SRM-MS [95].
Cell culturemodels present an idealway to study biological questionsin a well defined system with reduced biological variation. On the otherhand this alsomeans a deficient representation of the complex biologicalvariety one has to consider when addressing questions of clinical rele-vance. However, several label-free studies utilizing cell culture modelsto address such questions have been reported. Wu et al. were able to re-veal new potential drug targets for squamous head and neck cancer bystudying 34 cell lines in a kinase centric label-free approach. Theyperformed affinity purification via kinobeads to enrich kinases whichwere subsequently quantified in a label-free ion-intensity-based fashion.146 kinases were quantified among which 42 kinases were shown to besignificantly differentially expressed between different cell lines. Loss offunction experiments were used for validation of several kinases as po-tential drug targets for the treatment of squamous head and neck cancer[96]. Van Houdt and coworkers reported a study in which colon cancercells derived from resections of liver metastasis were cultivated incolonosphere cultures. Cancer stem cell enriched colonospheres werecomparedwith differentiated cells from the same clone in order to iden-tify cancer stem cell specific features. A total of 3048 proteins were iden-tified among which 32 were found to be significantly up-regulated incancer stem cells. One of the over-expressed proteins was BIRC6, an in-hibitor of apoptosis protein, which was further investigated in a func-tional manner. Knock down of BIRC6 restored sensitivity of cancerstem cells to two tested chemotherapeutic drugs which marks BIRC6as a potential drug target in treatment of colon carcinoma [97].
1588 D.A. Megger et al. / Biochimica et Biophysica Acta 1834 (2013) 1581–1590
7. Conclusion
In this review we gave an overview of label-free quantitative prote-omics ranging from the definition of different approaches over experi-mental aspects to the final data analysis. The applicability of label-freeproteomic approaches in clinical proteomicswas depicted by highlightingvery recent examples of quantitative proteomic studies with clinicalsamples or disease-related questions. In general, we conclude thatlabel-free proteomics is a versatile tool to estimate changes of proteinabundances between different samples. Like any other quantificationmethod, label-free approaches have also disadvantages. For example,an excellent reproducibility of every experimental step starting fromthe sample acquisition to LC–MS/MS analysis is required for reliablequantification. This demand of reproducibility during the whole pro-teomic workflow still poses one of the greatest challenges in label-freeproteomics. With regard to clinical proteomics, label-free proteomicsturned out to be a promising strategy to detect disease-related proteinregulations. However, especially in these types of biomarker studies,the use of microdissected samples is highly recommended and theregulation patterns detected in a label-free quantitative proteomicsapproach necessarily need to be validated in large and independentpatient cohorts with orthogonal techniques.
Acknowledgements
D. A. Megger and T. Bracht acknowledge the financial supportfrom the PROFILE-consortium Ruhr. The project has been selectedunder the operational program co-financed by the European RegionalDevelopment Fund (ERDF) Objective 2 “Regional Competitivenessand Employment” 2007–2013, North Rhine-Westphalia (Germany). Apart of this study was funded from P.U.R.E. (Protein Unit for Researchin Europe), a project of North Rhine-Westphalia as well.
References
[1] J. Klose, Protein mapping by combined isoelectric focusing and electrophoresis ofmouse tissues. A novel approach to testing for induced pointmutations inmammals,Humangenetik 26 (1975) 231–243.
[2] P.H. O'Farrell, High resolution two-dimensional electrophoresis of proteins, J. Biol.Chem. 250 (1975) 4007–4021.
[3] S.E. Ong, B. Blagoev, I. Kratchmarova, D.B. Kristensen, H. Steen, A. Pandey, M.Mann, Stable isotope labeling by amino acids in cell culture, SILAC, as a simpleand accurate approach to expression proteomics, Mol. Cell. Proteomics 1 (2002)376–386.
[4] C.C. Wu, M.J. MacCoss, K.E. Howell, D.E. Matthews, J.R. Yates 3rd, Metabolic labelingof mammalian organisms with stable isotopes for quantitative proteomic analysis,Anal. Chem. 76 (2004) 4951–4959.
[5] S.P. Gygi, B. Rist, S.A. Gerber, F. Turecek, M.H. Gelb, R. Aebersold, Quantitativeanalysis of complex protein mixtures using isotope-coded affinity tags, Nat.Biotechnol. 17 (1999) 994–999.
[6] A. Schmidt, J. Kellermann, F. Lottspeich, A novel strategy for quantitative proteomicsusing isotope-coded protein labels, Proteomics 5 (2005) 4–15.
[7] P.L. Ross, Y.N. Huang, J.N. Marchese, B. Williamson, K. Parker, S. Hattan, N.Khainovski, S. Pillai, S. Dey, S. Daniels, S. Purkayastha, P. Juhasz, S. Martin, M.Bartlet-Jones, F. He, A. Jacobson, D.J. Pappin, Multiplexed protein quantitation inSaccharomyces cerevisiae using amine-reactive isobaric tagging reagents, Mol.Cell. Proteomics 3 (2004) 1154–1169.
[8] A. Thompson, J. Schafer, K. Kuhn, S. Kienle, J. Schwarz, G. Schmidt, T. Neumann, R.Johnstone, A.K. Mohammed, C. Hamon, Tandem mass tags: a novel quantificationstrategy for comparative analysis of complex protein mixtures by MS/MS, Anal.Chem. 75 (2003) 1895–1904.
[9] L. Dayon, A. Hainard, V. Licker, N. Turck, K. Kuhn, D.F. Hochstrasser, P.R. Burkhard,J.C. Sanchez, Relative quantification of proteins in human cerebrospinal fluids byMS/MS using 6-plex isobaric tags, Anal. Chem. 80 (2008) 2921–2931.
[10] C.J. Koehler, M. Strozynski, F. Kozielski, A. Treumann, B. Thiede, Isobaric peptidetermini labeling for MS/MS-based quantitative proteomics, J. Proteome Res. 8(2009) 4333–4341.
[11] C.J. Koehler, M.O. Arntzen, M. Strozynski, A. Treumann, B. Thiede, Isobaric peptidetermini labeling utilizing site-specific N-terminal succinylation, Anal. Chem. 83(2011) 4775–4781.
[12] P.J. Boersema, R. Raijmakers, S. Lemeer, S. Mohammed, A.J. Heck, Multiplex peptidestable isotope dimethyl labeling for quantitative proteomics, Nat. Protoc. 4 (2009)484–494.
[13] T. Geiger, J. Cox, P. Ostasiewicz, J.R. Wisniewski, M. Mann, Super-SILAC mix forquantitative proteomics of human tumor tissue, Nat. Methods 7 (2010) 383–385.
[14] R. Ahrends, S. Pieper, A. Kuhn, H. Weisshoff, M. Hamester, T. Lindemann, C.Scheler, K. Lehmann, K. Taubner, M.W. Linscheid, A metal-coded affinity tag approachto quantitative proteomics, Mol. Cell. Proteomics 6 (2007) 1907–1916.
[15] D. Esteban-Fernandez, C. Scheler, M.W. Linscheid, Absolute protein quantificationby LC-ICP-MS using MeCAT peptide labeling, Anal. Bioanal. Chem. 401 (2011)657–666.
[16] H. Liu, R.G. Sadygov, J.R. Yates 3rd, A model for random sampling and estimationof relative protein abundance in shotgun proteomics, Anal. Chem. 76 (2004)4193–4201.
[17] M. Bantscheff, M. Schirle, G. Sweetman, J. Rick, B. Kuster, Quantitative mass spec-trometry in proteomics: a critical review, Anal. Bioanal. Chem. 389 (2007)1017–1031.
[18] P. Lu, C. Vogel, R. Wang, X. Yao, E.M. Marcotte, Absolute protein expression profilingestimates the relative contributions of transcriptional and translational regulation,Nat. Biotechnol. 25 (2007) 117–124.
[19] L. Florens, M.J. Carozza, S.K. Swanson, M. Fournier, M.K. Coleman, J.L. Workman,M.P. Washburn, Analyzing chromatin remodeling complexes using shotgun proteo-mics and normalized spectral abundance factors, Methods 40 (2006) 303–311.
[20] B. Zybailov, A.L. Mosley, M.E. Sardiu, M.K. Coleman, L. Florens, M.P. Washburn,Statistical analysis of membrane proteome expression changes in Saccharomycescerevisiae, J. Proteome Res. 5 (2006) 2339–2347.
[21] N.M. Griffin, J. Yu, F. Long, P. Oh, S. Shore, Y. Li, J.A. Koziol, J.E. Schnitzer, Label-free,normalized quantification of complex mass spectrometry data for proteomicanalysis, Nat. Biotechnol. 28 (2010) 83–89.
[22] D.H. Lundgren, S.I. Hwang, L. Wu, D.K. Han, Role of spectral counting in quantitativeproteomics, Expert Rev. Proteomics 7 (2010) 39–53.
[23] K.A. Neilson, N.A. Ali, S. Muralidharan, M. Mirzaei, M. Mariani, G. Assadourian, A.Lee, S.C. van Sluyter, P.A. Haynes, Less label, more free: approaches in label-freequantitative mass spectrometry, Proteomics 11 (2011) 535–553.
[24] P.V. Bondarenko, D. Chelius, T.A. Shaler, Identification and relative quantitation ofprotein mixtures by enzymatic digestion followed by capillary reversed-phaseliquid chromatography–tandem mass spectrometry, Anal. Chem. 74 (2002)4741–4749.
[25] D. Chelius, P.V. Bondarenko, Quantitative profiling of proteins in complex mixturesusing liquid chromatography and mass spectrometry, J. Proteome Res. 1 (2002)317–323.
[26] C.W. Turck, A.M. Falick, J.A. Kowalak, W.S. Lane, K.S. Lilley, B.S. Phinney, S.T.Weintraub, H.E. Witkowska, N.A. Yates, The Association of Biomolecular ResourceFacilities Proteomics Research Group 2006 study: relative protein quantitation,Mol. Cell. Proteomics 6 (2007) 1291–1298.
[27] Z. Li, R.M. Adams, K. Chourey, G.B. Hurst, R.L. Hettich, C. Pan, Systematic comparisonof label-free, metabolic labeling, and isobaric chemical labeling for quantitativeproteomics on LTQ Orbitrap Velos, J. Proteome Res. 11 (2012) 1582–1590.
[28] J. Merl, M. Ueffing, S.M. Hauck, C. von Toerne, Direct comparison of MS-basedlabel-free and SILAC quantitative proteome profiling strategies in primary retinalMuller cells, Proteomics 12 (2012) 1902–1911.
[29] T.S. Collier, S.M. Randall, P. Sarkar, B.M. Rao, R.A. Dean, D.C. Muddiman, Comparisonof stable-isotope labeling with amino acids in cell culture and spectral counting forrelative quantification of protein expression, Rapid Commun. Mass Spectrom. 25(2011) 2524–2532.
[30] T.S. Collier, P. Sarkar, W.L. Franck, B.M. Rao, R.A. Dean, D.C. Muddiman, Di-rect comparison of stable isotope labeling by amino acids in cell cultureand spectral counting for quantitative proteomics, Anal. Chem. 82 (2010)8696–8702.
[31] V.J. Patel, K. Thalassinos, S.E. Slade, J.B. Connolly, A. Crombie, J.C. Murrell, J.H.Scrivens, A comparison of labeling and label-freemass spectrometry-based proteomicsapproaches, J. Proteome Res. 8 (2009) 3752–3759.
[32] H. Wang, S. Alvarez, L.M. Hicks, Comprehensive comparison of iTRAQ and label-freeLC-based quantitative proteomics approaches using two Chlamydomonas reinhardtiistrains of interest for biofuels engineering, J. Proteome Res. 11 (2012) 487–501.
[33] Y. Tian, A.C. Tan, X. Sun, M.T. Olson, Z. Xie, N. Jinawath, D.W. Chan, M. Shih Ie, Z.Zhang, H. Zhang, Quantitative proteomic analysis of ovarian cancer cells identifiedmitochondrial proteins associated with Paclitaxel resistance, Proteomics Clin. Appl.3 (2009) 1288–1295.
[34] L. Ijsselstijn, M.P. Stoop, C. Stingl, P.A. Sillevis Smitt, T.M. Luider, L.J. Dekker, Com-parative study of targeted and label-free mass spectrometry methods for proteinquantification, J. Proteome Res. 12 (2013) 2005–2011.
[35] R.E. Banks, M.J. Dunn, M.A. Forbes, A. Stanley, D. Pappin, T. Naven, M. Gough, P.Harnden, P.J. Selby, The potential use of laser capture microdissection to selectivelyobtain distinct populations of cells for proteomic analysis—preliminary findings,Electrophoresis 20 (1999) 689–700.
[36] J. Ai, Y. Tan, W. Ying, Y. Hong, S. Liu, M. Wu, X. Qian, H. Wang, Proteome analysisof hepatocellular carcinoma by laser capture microdissection, Proteomics 6(2006) 538–546.
[37] C. Molleken, B. Sitek, C. Henkel, G. Poschmann, B. Sipos, S. Wiese, B. Warscheid, C.Broelsch, M. Reiser, S.L. Friedman, I. Tornoe, A. Schlosser, G. Kloppel, W.Schmiegel, H.E. Meyer, U. Holmskov, K. Stuhler, Detection of novel biomarkersof liver cirrhosis by proteomic analysis, Hepatology 49 (2009) 1257–1266.
[38] G. Poschmann, B. Sitek, B. Sipos, K. Stuhler, Application of saturation labeling inlung cancer proteomics, Methods Mol. Biol. 854 (2012) 253–267.
[39] G. Poschmann, B. Sitek, B. Sipos, A. Ulrich, S. Wiese, C. Stephan, B. Warscheid, G.Kloppel, A. Vander Borght, F.C. Ramaekers, H.E. Meyer, K. Stuhler, Identification ofproteomic differences between squamous cell carcinoma of the lung and bronchialepithelium, Mol. Cell. Proteomics 8 (2009) 1105–1116.
[40] B. Sitek, J. Luttges, K. Marcus, G. Kloppel, W. Schmiegel, H.E. Meyer, S.A. Hahn, K.Stuhler, Application of fluorescence difference gel electrophoresis saturation labelling
1589D.A. Megger et al. / Biochimica et Biophysica Acta 1834 (2013) 1581–1590
for the analysis of microdissected precursor lesions of pancreatic ductal adenocarci-noma, Proteomics 5 (2005) 2665–2679.
[41] B. Sitek, S. Potthoff, T. Schulenborg, J. Stegbauer, T. Vinke, L.C. Rump, H.E. Meyer,O. Vonend, K. Stuhler, Novel approaches to analyse glomerular proteins fromsmallest scalemurine andhuman samples usingDIGE saturation labelling, Proteomics6 (2006) 4337–4345.
[42] B. Sitek, B. Sipos, I. Alkatout, G. Poschmann, C. Stephan, T. Schulenborg, K. Marcus, J.Luttges, D.D. Dittert, G. Baretton, W. Schmiegel, S.A. Hahn, G. Kloppel, H.E. Meyer, K.Stuhler, Analysis of the pancreatic tumor progression by a quantitative proteomic ap-proach and immunohistochemical validation, J. Proteome Res. 8 (2009) 1647–1656.
[43] M. Hosako, T. Muto, Y. Nakamura, K. Tsuta, N. Tochigi, H. Tsuda, H. Asamura, T.Tomonaga, A. Kawai, T. Kondo, Proteomic study of malignant pleural mesotheliomaby lasermicrodissection and two-dimensional difference gel electrophoresis identifiedcathepsinD as a novel candidate for a differential diagnosis biomarker, J. Proteomics 75(2012) 833–844.
[44] T. Kondo, S. Hirohashi, Application of highly sensitive fluorescent dyes (CyDye DIGEFluor saturation dyes) to laser microdissection and two-dimensional difference gelelectrophoresis (2D-DIGE) for cancer proteomics, Nat. Protoc. 1 (2006) 2940–2956.
[45] T. Orimo, H. Ojima, N. Hiraoka, S. Saito, T. Kosuge, T. Kakisaka, H. Yokoo, K.Nakanishi, T. Kamiyama, S. Todo, S. Hirohashi, T. Kondo, Proteomic profiling revealsthe prognostic value of adenomatous polyposis coli-end-binding protein 1 inhepatocellular carcinoma, Hepatology 48 (2008) 1851–1863.
[46] N.Q. Liu, R.B. Braakman, C. Stingl, T.M. Luider, J.W. Martens, J.A. Foekens, A. Umar,Proteomics pipeline for biomarker discovery of laser capture microdissectedbreast cancer tissue, J. Mammary Gland Biol. Neoplasia 17 (2012) 155–164.
[47] R.B. Braakman, M.M. Tilanus-Linthorst, N.Q. Liu, C. Stingl, L.J. Dekker, T.M. Luider,J.W. Martens, J.A. Foekens, A. Umar, Optimized nLC–MS workflow for laser capturemicrodissected breast cancer tissue, J. Proteomics 75 (2012) 2844–2854.
[48] G. Shevchenko, S. Musunuri, M. Wetterhall, J. Bergquist, Comparison of extractionmethods for the comprehensive analysis of mouse brain proteome usingshotgun-based mass spectrometry, J. Proteome Res. 11 (2012) 2441–2451.
[49] J.R. Wisniewski, A. Zougman, N. Nagaraj, M. Mann, Universal sample preparationmethod for proteome analysis, Nat. Methods 6 (2009) 359–362.
[50] B.S. Antharavally, K.A. Mallia, M.M. Rosenblatt, A.M. Salunkhe, J.C. Rogers, P.Haney, N. Haghdoost, Efficient removal of detergents from proteins and peptidesin a spin column format, Anal. Biochem. 416 (2011) 39–44.
[51] L. Turiak, O. Ozohanics, F. Marino, L. Drahos, K. Vekey, Digestion protocol for smallprotein amounts for nano-HPLC-MS(MS) analysis, J. Proteomics 74 (2011) 942–947.
[52] W. Choksawangkarn, N. Edwards, Y. Wang, P. Gutierrez, C. Fenselau, Comparativestudy of workflows optimized for in-gel, in-solution, and on-filter proteolysis inthe analysis of plasma membrane proteins, J. Proteome Res. 11 (2012) 3030–3034.
[53] M.M. Bradford, A rapid and sensitive method for the quantitation of microgramquantities of protein utilizing the principle of protein–dye binding, Anal.Biochem. 72 (1976) 248–254.
[54] P.K. Smith, R.I. Krohn, G.T. Hermanson, A.K. Mallia, F.H. Gartner, M.D. Provenzano,E.K. Fujimoto, N.M. Goeke, B.J. Olson, D.C. Klenk, Measurement of protein usingbicinchoninic acid, Anal. Biochem. 150 (1985) 76–85.
[55] O.H. Lowry, N.J. Rosebrough, A.L. Farr, R.J. Randall, Protein measurement with theFolin phenol reagent, J. Biol. Chem. 193 (1951) 265–275.
[56] N. Popov, M. Schmitt, S. Schulzeck, H. Matthies, Reliable micromethod for deter-mination of the protein content in tissue homogenates, Acta Biol. Med. Ger. 34(1975) 1441–1446.
[57] M.I. Tyler, Amino acid analysis. An overview, Methods Mol. Biol. 159 (2000) 1–7.[58] J.M. Burkhart, T. Premsler, A. Sickmann, Quality control of nano-LC–MS systems
using stable isotope-coded peptides, Proteomics 11 (2011) 1049–1057.[59] N.A. Patel, A. Crombie, S.E. Slade, K. Thalassinos, C. Hughes, J.B. Connolly, J.
Langridge, J.C. Murrell, J.H. Scrivens, Comparison of one- and two-dimensionalliquid chromatography approaches in the label-free quantitative analysis ofMethylocella silvestris, J. Proteome Res. 11 (2012) 4755–4763.
[60] V. Gautier, E. Mouton-Barbosa, D. Bouyssie, N. Delcourt, M. Beau, J.P. Girard, C.Cayrol, O. Burlet-Schiltz, B. Monsarrat, A. Gonzalez de Peredo, Label-free quantificationand shotgun analysis of complex proteomes by one-dimensional SDS-PAGE/NanoLC–MS: evaluation for the large scale analysis of inflammatory human endothelial cells,Mol. Cell. Proteomics 11 (2012) 527–539.
[61] B.B. Gao, L. Stuart, E.P. Feener, Label-free quantitative analysis of one-dimensionalPAGE LC/MS/MS proteome: application on angiotensin II-stimulated smoothmuscle cells secretome, Mol. Cell. Proteomics 7 (2008) 2399–2409.
[62] S. Fraterman, U. Zeiger, T.S. Khurana, N.A. Rubinstein, M. Wilm, Combination ofpeptide OFFGEL fractionation and label-free quantitation facilitated proteomicsprofiling of extraocular muscle, Proteomics 7 (2007) 3404–3416.
[63] J. Franck, K. Arafah, M. Elayed, D. Bonnel, D. Vergara, A. Jacquet, D. Vinatier, M.Wisztorski, R. Day, I. Fournier, M. Salzet, MALDI imaging mass spectrometry: state ofthe art technology in clinical proteomics, Mol. Cell. Proteomics 8 (2009) 2023–2033.
[64] A.S. Benk, C. Roesli, Label-free quantification using MALDI mass spectrometry:considerations and perspectives, Anal. Bioanal. Chem. 404 (2012) 1039–1056.
[65] B. Balluff, C. Schone, H. Hofler, A. Walch, MALDI imaging mass spectrometry fordirect tissue analysis: technological advancements and recent applications,Histochem. Cell Biol. 136 (2011) 227–244.
[66] A. Panchaud, M. Affolter, P. Moreillon, M. Kussmann, Experimental and computationalapproaches to quantitative proteomics: status quo and outlook, J. Proteomics 71 (2008)19–33.
[67] R. Aebersold, M. Mann, Mass spectrometry-based proteomics, Nature 422 (2003)198–207.
[68] D.N. Perkins, D.J. Pappin, D.M. Creasy, J.S. Cottrell, Probability-based protein identifica-tion by searching sequence databases using mass spectrometry data, Electrophoresis20 (1999) 3551–3567.
[69] J.K. Eng, A.L. Mccormack, J.R. Yates, An approach to correlate tandem mass-spectral data of peptides with amino-acid-sequences in a protein database, J.Am. Soc. Mass Spectr. 5 (1994) 976–989.
[70] L.Y. Geer, S.P. Markey, J.A. Kowalak, L. Wagner, M. Xu, D.M. Maynard, X. Yang, W.Shi, S.H. Bryant, Open mass spectrometry search algorithm, J. Proteome Res. 3(2004) 958–964.
[71] R. Craig, R.C. Beavis, TANDEM: matching proteins with tandem mass spectra, Bio-informatics 20 (2004) 1466–1467.
[72] J.E. Elias, S.P. Gygi, Target-decoy search strategy for increased confidence inlarge-scale protein identifications by mass spectrometry, Nat. Methods 4 (2007)207–214.
[73] L.N. Mueller, M.Y. Brusniak, D.R. Mani, R. Aebersold, An assessment of softwaresolutions for the analysis of mass spectrometry based quantitative proteomicsdata, J. Proteome Res. 7 (2008) 51–61.
[74] R. Matthiesen, A.S. Carvalho, Methods and algorithms for relative quantitativeproteomics by mass spectrometry, Methods Mol. Biol. 593 (2010) 187–204.
[75] K. Podwojski, M. Eisenacher, M. Kohl, M. Turewicz, H.E. Meyer, J. Rahnenfuhrer, C.Stephan, Peek a peak: a glance at statistics for quantitative label-free proteomics,Expert Rev. Proteomics 7 (2010) 249–261.
[76] S. Nahnsen, C. Bielow, K. Reinert, O. Kohlbacher, Tools for label-free peptide quan-tification, Mol. Cell. Proteomics 12 (2013) 549–556.
[77] J. Cox, M. Mann, MaxQuant enables high peptide identification rates, individualizedp.p.b.-range mass accuracies and proteome-wide protein quantification, Nat.Biotechnol. 26 (2008) 1367–1372.
[78] L.N. Mueller, O. Rinner, A. Schmidt, S. Letarte, B. Bodenmiller, M.Y. Brusniak, O. Vitek,R. Aebersold, M. Muller, SuperHirn — a novel tool for high resolution LC–MS-basedpeptide/protein profiling, Proteomics 7 (2007) 3470–3480.
[79] P.M. Palagi, D. Walther, M. Quadroni, S. Catherinet, J. Burgess, C.G. Zimmermann-Ivol,J.C. Sanchez, P.A. Binz, D.F. Hochstrasser, R.D. Appel, MSight: an image analysissoftware for liquid chromatography–mass spectrometry, Proteomics 5 (2005)2381–2384.
[80] R. Malik, K. Dulla, E.A. Nigg, R. Korner, From proteome lists to biological impact—tools and strategies for the analysis of large MS data sets, Proteomics 10 (2010)1270–1283.
[81] P. Picotti, O. Rinner, R. Stallmach, F. Dautel, T. Farrah, B. Domon, H. Wenschuh, R.Aebersold, High-throughput generation of selected reaction-monitoring assaysfor proteins and proteomes, Nat. Methods 7 (2010) 43–46.
[82] L. Anderson, C.L. Hunter, Quantitative mass spectrometric multiple reactionmonitoring assays for major plasma proteins, Mol. Cell. Proteomics 5 (2006)573–588.
[83] A. Gamez-Pozo, I. Sanchez-Navarro, E. Calvo, M.T. Agullo-Ortuno, R. Lopez-Vacas,E. Diaz, E. Camafeita, M. Nistal, R. Madero, E. Espinosa, J.A. Lopez, J.A. Fresno Vara,PTRF/cavin-1 and MIF proteins are identified as non-small cell lung cancer bio-markers by label-free proteomics, PLoS One 7 (2012) e33752.
[84] S. Meding, B. Balluff, M. Elsner, C. Schone, S. Rauser, U. Nitsche, M. Maak, A. Schafer,S.M. Hauck, M. Ueffing, R. Langer, H. Hofler, H. Friess, R. Rosenberg, A. Walch,Tissue-based proteomics reveals FXYD3, S100A11 andGSTM3as novelmarkers for re-gional lymph node metastasis in colon cancer, J. Pathol. 228 (2012) 459–470.
[85] H.Y. Yang, J. Kwon, H.R. Park, S.O. Kwon, Y.K. Park, H.S. Kim, Y.J. Chung, Y.J. Chang,H.I. Choi, K.J. Chung, D.S. Lee, B.J. Park, S.H. Jeong, T.H. Lee, Comparative proteomicanalysis for the insoluble fractions of colorectal cancer patients, J. Proteomics 75(2012) 3639–3653.
[86] D. A.Megger, T. Bracht, M. Kohl, M. Ahrens,W. Naboulsi, F.Weber, A. C. Hoffmann, C.Stephan, K. Kuhlmann, M. Eisenacher, J. F. Schlaak, H. A. Baba, H. E. Meyer, and B.Sitek, Proteomic differences between hepatocellular carcinoma and non-tumorousliver tissue investigated by a combined 2D-DIGE and label-free quantitative proteo-mics study, Mol. Cell. Proteomics (in press) (http://dx.doi.org/10.1074/mcp.M113.028027).
[87] E. Hammer, M. Goritzka, S. Ameling, K. Darm, L. Steil, K. Klingel, C. Trimpert, L.R.Herda, M. Dorr, H.K. Kroemer, R. Kandolf, A. Staudt, S.B. Felix, U. Volker, Characteri-zation of the humanmyocardial proteome in inflammatory dilated cardiomyopathyby label-free quantitative shotgun proteomics of heart biopsies, J. Proteome Res. 10(2011) 2161–2171.
[88] J.J. Hill, T.L. Tremblay, A. Pen, J. Li, A.C. Robotham, A.E. Lenferink, E. Wang, M.O'Connor-McCourt, J.F. Kelly, Identification of vascular breast tumor markers by lasercapturemicrodissection and label-free LC–MS, J. Proteome Res. 10 (2011) 2479–2493.
[89] J.R.Wisniewski, P. Ostasiewicz,M.Mann,High recovery FASP applied to the proteomicanalysis of microdissected formalin fixed paraffin embedded cancer tissues retrievesknown colon cancer markers, J. Proteome Res. 10 (2011) 3040–3049.
[90] J.R. Wisniewski, P. Ostasiewicz, K. Dus, D.F. Zielinska, F. Gnad, M. Mann, Extensivequantitative remodeling of the proteome between normal colon tissue andadenocarcinoma, Mol. Syst. Biol. 8 (2012) 611.
[91] S.W. Hyung, M.Y. Lee, J.H. Yu, B. Shin, H.J. Jung, J.M. Park, W. Han, K.M. Lee, H.G.Moon, H. Zhang, R. Aebersold, D. Hwang, S.W. Lee, M.H. Yu, D.Y. Noh, A serumprotein profile predictive of the resistance to neoadjuvant chemotherapy in ad-vanced breast cancers, Mol. Cell. Proteomics 10 (2011), M111 011023.
[92] K. Patel, J.E. Lucas, J.W. Thompson, L.G. Dubois, H.L. Tillmann, A.J. Thompson, D.Uzarski, R.M. Califf, M.A. Moseley, G.S. Ginsburg, J.G. McHutchison, J.J. McCarthy,High predictive accuracy of an unbiased proteomic profile for sustained virologicresponse in chronic hepatitis C patients, Hepatology 53 (2011) 1809–1818.
[93] J. Metzger, A.A. Negm, R.R. Plentz, T.J. Weismuller, J. Wedemeyer, T.H. Karlsen, M.Dakna, W. Mullen, H. Mischak, M.P. Manns, T.O. Lankisch, Urine proteomic analysisdifferentiates cholangiocarcinoma from primary sclerosing cholangitis andother benign biliary disorders, Gut 62 (2012) 122–130.
[94] T.O. Lankisch, J. Metzger, A.A. Negm, K. Vosskuhl, E. Schiffer, J. Siwy, T.J.Weismuller, A.S. Schneider, K. Thedieck, R. Baumeister, P. Zurbig, E.M.

1590 D.A. Megger et al. / Biochimica et Biophysica Acta 1834 (2013) 1581–1590
Weissinger, M.P. Manns, H. Mischak, J. Wedemeyer, Bile proteomic profiles differenti-ate cholangiocarcinoma from primary sclerosing cholangitis and choledocholithiasis,Hepatology 53 (2011) 875–884.
[95] Y. Kim, V. Ignatchenko, C.Q. Yao, I. Kalatskaya, J.O. Nyalwidhe, R.S. Lance, A.O.Gramolini, D.A. Troyer, L.D. Stein, P.C. Boutros, J.A. Medin, O.J. Semmes, R.R.Drake, T. Kislinger, Identification of differentially expressed proteins in directexpressed prostatic secretions of men with organ-confined versus extracapsularprostate cancer, Mol. Cell. Proteomics 11 (2012) 1870–1884.
[96] Z. Wu, J.B. Doondeea, A.M. Gholami, M.C. Janning, S. Lemeer, K. Kramer, S.A.Eccles, S.M. Gollin, R. Grenman, A. Walch, S.M. Feller, B. Kuster, Quantitativechemical proteomics reveals new potential drug targets in head and neck cancer,Mol. Cell. Proteomics 10 (2011), M111 011635.
[97] W.J. Van Houdt, B.L. Emmink, T.V. Pham, S.R. Piersma, A. Verheem, R.G. Vries, S.A.Fratantoni, A. Pronk, H. Clevers, I.H. Borel Rinkes, C.R. Jimenez, O. Kranenburg, Compar-ative proteomics of colon cancer stem cells and differentiated tumor cells identifiesBIRC6 as a potential therapeutic target, Mol. Cell. Proteomics 10 (2011), M111 011353.
Related Documents


![A Review on Quantitative Multiplexed Proteomics...A Review on Quantitative Multiplexed Proteomics Nishant Pappireddi, [a, b] ... Protein Identification and Quantification in Mass Spectrometry-Based](https://static.cupdf.com/doc/110x72/5e7f3f3acedae249de4f489a/a-review-on-quantitative-multiplexed-proteomics-a-review-on-quantitative-multiplexed.jpg)