Dharmapuri – 636 703. Regulation : 2013 Branch : B.E. – ECE Year & Semester : III Year / V Semester LAB MANUAL EC65 EC65 EC65 EC6512 12 12 12- COMMUNICATION SYSTEMS COMMUNICATION SYSTEMS COMMUNICATION SYSTEMS COMMUNICATION SYSTEMS LABORATORY LABORATORY LABORATORY LABORATORY

Welcome message from author
This document is posted to help you gain knowledge. Please leave a comment to let me know what you think about it! Share it to your friends and learn new things together.
Transcript

Dharmapuri – 636 703.
Regulation : 2013
Branch : B.E. – ECE
Year & Semester : III Year / V Semester
LAB MANUAL
EC65EC65EC65EC6512121212---- COMMUNICATION SYSTEMSCOMMUNICATION SYSTEMSCOMMUNICATION SYSTEMSCOMMUNICATION SYSTEMS LABORATORYLABORATORYLABORATORYLABORATORY

INTRODUCTION
Exchanging information between two systems or human beings is called as
communication. The information’s in terms of binary digits called as digital data and electrical
signals called as analog data.
The Communication System Lab is designed to help students understand the
basic principles of communication techniques as well as giving them the insight
on design, simulation and hardware implementation of circuits.
The main aim is to provide hands‐on experience to the students so that they
are able to put theoretical concepts to practice. The content of this course consists of two
parts, ‘simulation’ and ‘hardwired’. Computer simulation is stressed upon as it is
a key analysis tool of engineering design.
MATLAB software is used for simulation of communication experiments Students
will carry out design experiments as a part of the experiments list provided in this lab
manual.
Students will be given a specific design problem, which after completion they
will verify using the simulation software or hardwired implementation.
ANNA UNIVERSITY: CHENNAI
REGULATION 2013
EC6512 – COMMUNICATION SYSTEMS LABORATORY
LIST OF EXPERIMENTS:
1. Signal Sampling and reconstruction
2. Time Division Multiplexing
3. AM Modulator and Demodulator
4. FM Modulator and Demodulator
5. Pulse Code Modulation and Demodulation
6. Delta Modulation and Demodulation
7. Observation (simulation) of signal constellations of BPSK, QPSK and QAM
8. Line coding schemes
9. FSK, PSK and DPSK schemes (Simulation)
10. Error control coding schemes – Linear Block Codes (Simulation)
11. Communication link simulation
12. Equalization – Zero Forcing & LMS algorithms (simulation)
TOTAL: 45 PERIODS

LIST OF EXPERIMENTS
S.no Date Name of the Experiment Page
no Marks Signature
1 Signal Sampling and reconstruction
2 Time Division Multiplexing
3 AM Modulator and Demodulator
4 FM Modulator and Demodulator
5 Pulse Code Modulation and
Demodulation
6 Delta Modulation and Demodulation
7
Observation (simulation) of signal constellations of BPSK, QPSK and QAM
8 Line coding schemes
9 FSK, PSK and DPSK schemes (Simulation)
10 Error control coding schemes – Linear Block Codes (Simulation)
11 Communication link simulation
12 Equalization – Zero Forcing & LMS algorithms (simulation)

EC6512 – Communication Systems Laboratory
1 Department of Electronics and Communication Engineering Varuvan Vadivelan Institute of Technology, Dharmapuri – 636 703.
Exp.No.: 1
Date:
SAMPLING AND RECONSTRUCTION OF ANALOG SIGNALS AIM:
To study the signal sampling and reconstruction of analog signals.
APPARATUS REQUIRED:
1. Sampling and Reconstruction Kit 2. Patch Cords 3. Probes 4. DSO
THEORY:
A band limited signal of finite energy has no frequency components higher than ‘W’
hertz is completely described by specified the values of the signal of instants of time separated
by 1/2W seconds, where ‘W’ is the higher frequency content. The zero order hold circuit is used
for practical reconstruction. It simply holds the value x(n) for ‘T’ seconds. Here ‘T’ is the
sampling period; The output of zero order hold is stair case signal. The reconstructed signal is
the succession of sine pulses weighted by x(nTs) these pulses are interpolated with the help of a
LPF. It is also called reconstruction filter or interpolation filter Natural sampling is chopper
sampling because the waveform of the sampled signal appears to be chopped off from the
original signal waveform. The top of the samples remains constant and equal to instantaneous
value of x(t) at start of sampling fs = 1/Ts
PROCEDURE:
1. Connect the main plug in to the main board. Keep the power switch in OFF position.
2. Put the duty cycle selector switch in position 50%
3. Link 25 Hz sine wave output to analog input.
4. Turn on the trainer.
5. Turning on the trainer select 250 Hz sampling rate by default.
6. Display 25Hz sine wave and sampled output on t oscilloscope. This display shows
25Hz sine wave being sampled at 200 Hz there are 10 samples for every cycle of the
sine wave.

EC6512 – Communication Systems Laboratory
2 Department of Electronics and Communication Engineering Varuvan Vadivelan Institute of Technology, Dharmapuri – 636 703.
7. Link the sample output to the fourth order low pass filter display sample output and
output of the filter in the oscilloscope. The display shows the reconstructed original
21 Hz sine wave.
8. We had used sampling frequency greater than twice the maximum input frequency.
9. Remove the line from 25KHz sine wave output to the modulating input.
10. By successive process of frequency selector switch change the sampling frequency 32
KHz, 16KHz, 8 KHz,4 KHz,2 KHz,1 KHz,50 Hz and back to 250 Hz
11. Observe how sample output changes in each cases and how the lower sampling
frequencies introduce distortion in to the filter output waveform. This is due to the
fact that the filter does not attenuate the unwanted next frequency component
significantly use of higher order filter would improve the output waveform.
12. So far we have used sampling frequencies greater than twice the maximum input
frequency. To set the nyquist criteria set sampling rate 4 Hz 50% duty cycle.
13. Remove the link 25 Hz sine wave output to the modulating input.
14. Connect the link from 250 Hz or 500 Hz sine wave output to the modulating input
and link the sampled output to fourth order LPF. Display sample output and output of
the filter on the oscilloscope. The display shows the reconstruction signal 250 Hz or
500Hz sine wave.
15. Now decrease the sampling rate to 32 KHz and then to 500 Hz. Observe the distorted
fact that we under sampled the input waveform overlooking the nyquist criteria and
thus the output was distorted even though the signal below the cutoff frequency of the
filter. This is also describes the phenomenon of aliasing.

EC6512 – Communication Systems Laboratory
3 Department of Electronics and Communication Engineering Varuvan Vadivelan Institute of Technology, Dharmapuri – 636 703.
FUNCTIONAL BLOCK DIAGRAM:

EC6512 – Communication Systems Laboratory
4 Department of Electronics and Communication Engineering Varuvan Vadivelan Institute of Technology, Dharmapuri – 636 703.
TABULATION:
Parameters Amplitude
(V)
Time period
(ms) Frequency
(Hz)
Modulation signal
Sampled output
Sampled & hold output
Flat top output
Demodulated signal
RESULT:
Thus the signal sampling and reconstruction techniques were performed and graph plotted.
EC6512 – Communication Systems Laboratory
5 Department of Electronics and Communication Engineering Varuvan Vadivelan Institute of Technology, Dharmapuri – 636 703.
Exp.No.: 2
Date:
TIME DIVISION MULTIPLEXING (TDM)
AIM:
To write a Matlab program for time division multiplexing (TDM) and plot the
characteristics curve.
APPARATUS REQUIRED:
1. Computer
2. Matlab software R2014a
THEORY:
Time division multiplexing (TDM) is the process of sending more than one source
information over a same channel in different time slot which helps in efficient channel utilization
and saves bandwidth.
PROCEDURE:
1. Open Matlab version R2014a.
2. Open new file and enter the program and save it.
3. Add the path to the location of the file in the system.
4. Compile the program and check for any error and debug it.
5. Note down the output.
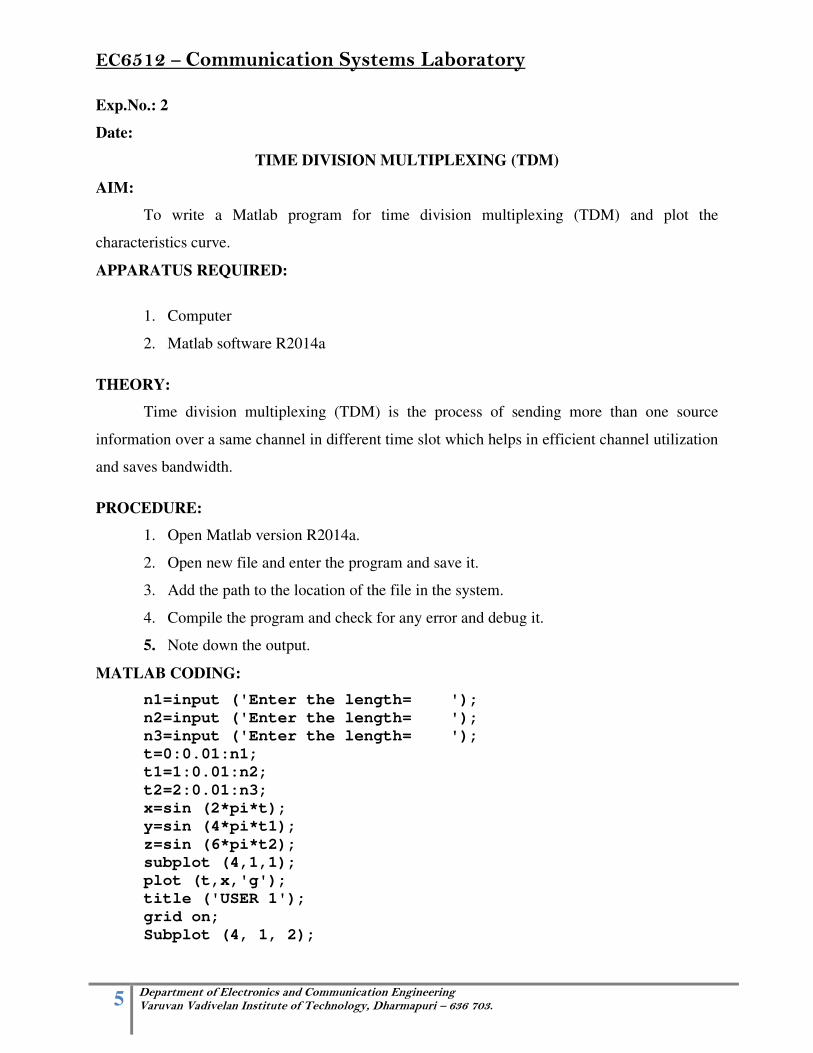
MATLAB CODING:
n1=input ('Enter the length= ');
n2=input ('Enter the length= ');
n3=input ('Enter the length= ');
t=0:0.01:n1;
t1=1:0.01:n2;
t2=2:0.01:n3;
x=sin (2*pi*t);
y=sin (4*pi*t1);
z=sin (6*pi*t2);
subplot (4,1,1);
plot (t,x,'g');
title ('USER 1');
grid on;
Subplot (4, 1, 2);
EC6512 – Communication Systems Laboratory
6 Department of Electronics and Communication Engineering Varuvan Vadivelan Institute of Technology, Dharmapuri – 636 703.
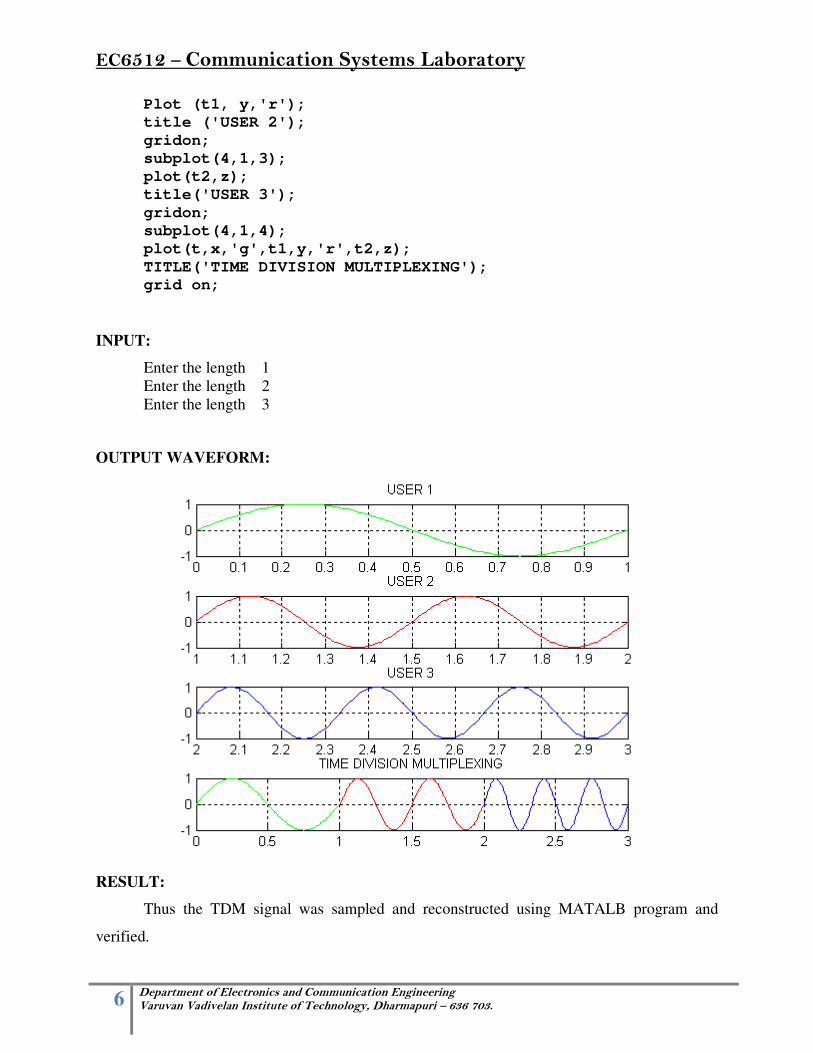
Plot (t1, y,'r');
title ('USER 2');
gridon;
subplot(4,1,3);
plot(t2,z);
title('USER 3');
gridon;
subplot(4,1,4);
plot(t,x,'g',t1,y,'r',t2,z);
TITLE('TIME DIVISION MULTIPLEXING'); grid on;
INPUT:
Enter the length 1 Enter the length 2 Enter the length 3
OUTPUT WAVEFORM:
RESULT:
Thus the TDM signal was sampled and reconstructed using MATALB program and
verified.

EC6512 – Communication Systems Laboratory
7 Department of Electronics and Communication Engineering Varuvan Vadivelan Institute of Technology, Dharmapuri – 636 703.
Exp. No.: 3
Date:
AMPLITUDE MODULATION AND DEMODULATON
AIM:
To perform the amplitude modulation and demodulation using AM Kit.
APPARATUS REQUIRED:
1. Amplitude modulation kit
2. DSO
3. Probes
4. Patch cords
MODULATION THEORY:
Modulation is defined as the process by which some characteristics of a carrier signal is
varied in accordance with a modulating signal. The base band signal is referred to as the
modulating signal and the output of the modulation process is called as the modulation signal.
The carrier frequency fc must be much greater than the highest frequency components fm
of the message signal m(t) i.e. fc >>fm
The modulation index must be less than unity. if the modulation index is greater than
unity, the carrier wave becomes over modulated.
DEMODULATION THEORY:
The process of detection provides a means of recovering the modulating Signal from
modulating signal. Demodulation is the reverse process of modulation. The detector circuit is
employed to separate the carrier wave and eliminate the side bands. Since the envelope of an AM
wave has the same shape as the message, independent of the carrier frequency and phase,
demodulation can be accomplished by extracting envelope.
The depth of modulation at the detector output greater than unity and circuit impedance is
less than circuit load (Rl>Zm) results in clipping of negative peaks of modulating signal. It is
called “negative clipping “.

EC6512 – Communication Systems Laboratory
8 Department of Electronics and Communication Engineering Varuvan Vadivelan Institute of Technology, Dharmapuri – 636 703.
PROCEDURE:
A. Amplitude Modulation
1. Connect the mains cord of the trainer unit to AC 220V, 50 Hz supply.
2.Switch ON the trainer kit. The neon lamp will glow indicating that the unit is ready
for operation.
3.Observe the waveforms of modulating signal and carrier signal in an Oscilloscope.
4.Using patch cords, connect the modulating signal and the carrier signal to
‘AM MODULATION’.
5.Observe the amplitude modulated output waveform across sockets marked
‘AM OUTPUT’.
B. AM Demodulation
1.Set the amplitude of modulating and carrier signal in Amplitude Modulation.
2. Using patch cords, connect the ‘AM OUTPUT’ from the AM Modulation
to the sockets marked ‘AM INPUT‘ in the AM Demodulation.
3.Connect the detector output to filter input using patch cords.
4.Connect the filter output to amplifier input.
5.Connect the amplifier output to inverting amplifier input.
6.Observe the demodulated output waveform across sockets marked
‘DEMOD OUTPUT’.
EC6512 – Communication Systems Laboratory
9 Department of Electronics and Communication Engineering Varuvan Vadivelan Institute of Technology, Dharmapuri – 636 703.
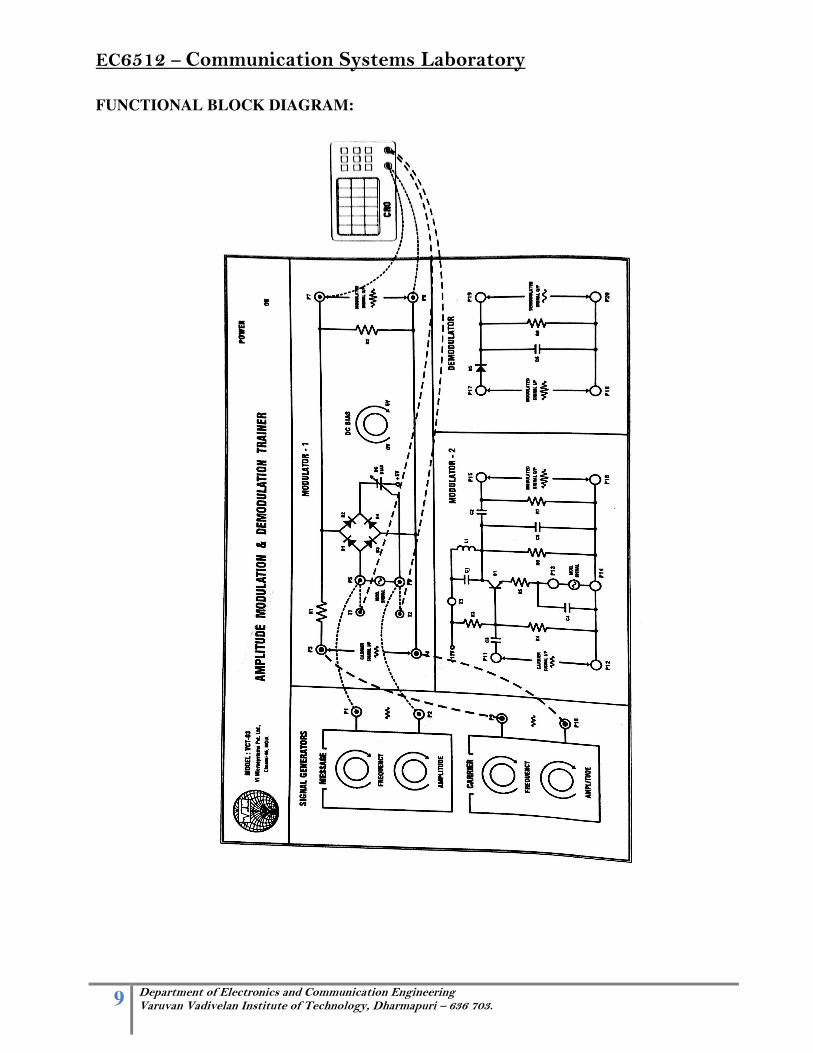
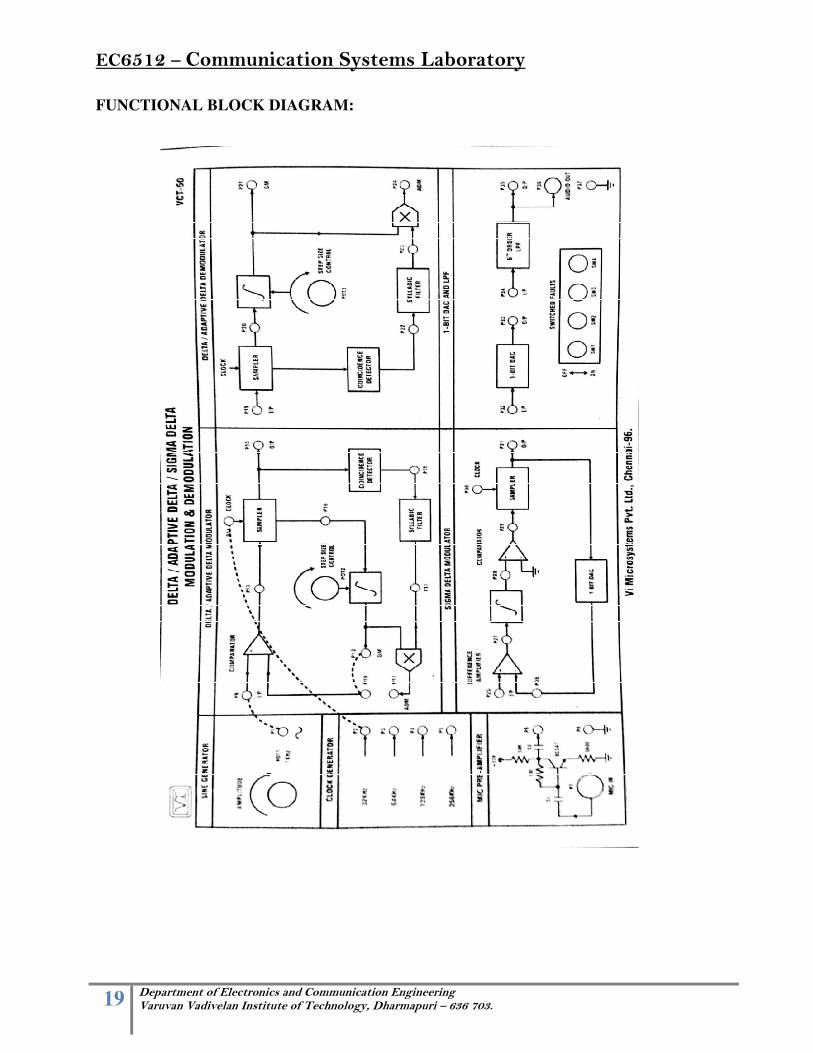
FUNCTIONAL BLOCK DIAGRAM:
EC6512 – Communication Systems Laboratory
10 Department of Electronics and Communication Engineering Varuvan Vadivelan Institute of Technology, Dharmapuri – 636 703.
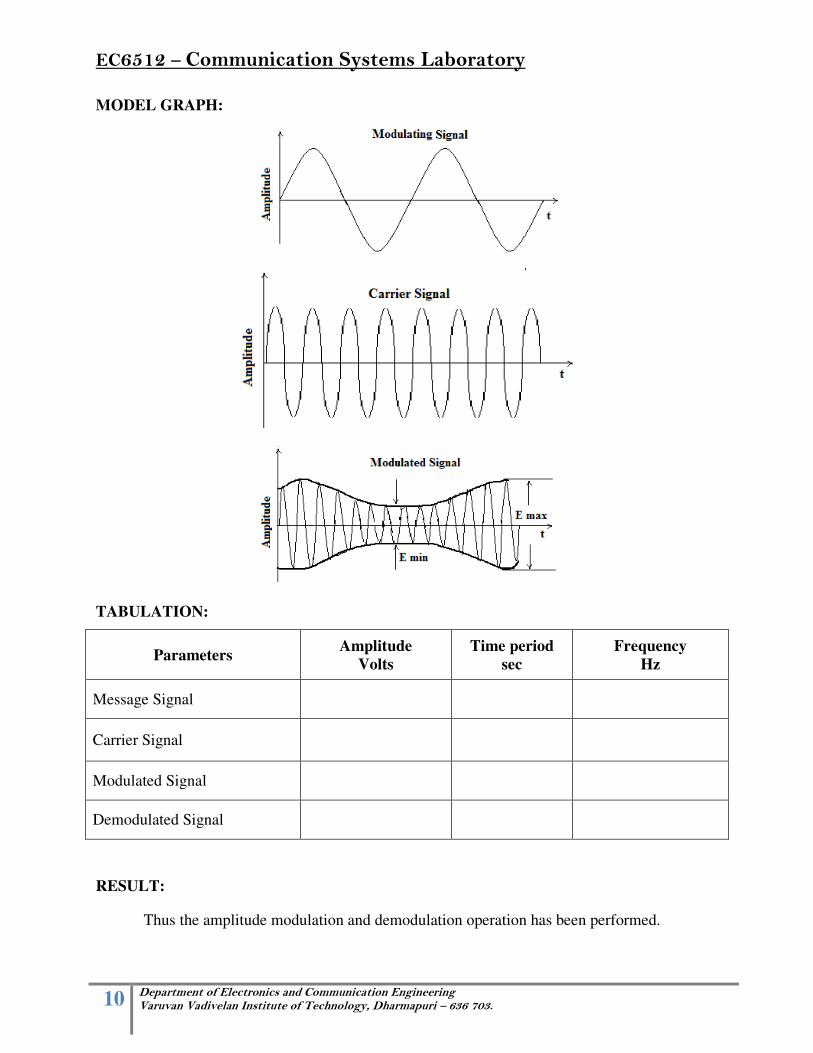
MODEL GRAPH:
TABULATION:
Parameters Amplitude
Volts
Time period
sec
Frequency
Hz
Message Signal
Carrier Signal
Modulated Signal
Demodulated Signal
RESULT:
Thus the amplitude modulation and demodulation operation has been performed.

EC6512 – Communication Systems Laboratory
11 Department of Electronics and Communication Engineering Varuvan Vadivelan Institute of Technology, Dharmapuri – 636 703.
Exp. No.: 4
Date:
FREQUENCY MODULATION AND DEMODULATION
AIM:
To perform the frequency modulation and demodulation using FM kit.
APPARATUS REQUIRED:
1. Frequency modulation kit
2. DSO
3. Probes
4. Patch cords
THEORY:
Frequency modulation is a process of changing the frequency of a carrier wave in
accordance with the slowly varying base band signal. The main advantage of this modulation is
that it can provide better discrimination against noise.
PROCEDURE:
1. Connect the mains cord of the trainer unit to AC 220V, 50 Hz supply.
2. Switch ON the trainer kit. The neon lamp will glow indicating that the unit is ready
for operation.
3. Observe the Modulating Signal in an Oscilloscope.
4. Observe the FM Source in the Oscilloscope.
5. Using patch cords, connect the FM Source to sockets marked ‘FM INPUT’ in
FM Detector Circuit.
6.Observe the Frequency Demodulated Output Signal across sockets marked
‘DEMOD OUTPUT’.

EC6512 – Communication Systems Laboratory
12 Department of Electronics and Communication Engineering Varuvan Vadivelan Institute of Technology, Dharmapuri – 636 703.
FUNCTIONAL BLOCK DIAGRAM:

EC6512 – Communication Systems Laboratory
13 Department of Electronics and Communication Engineering Varuvan Vadivelan Institute of Technology, Dharmapuri – 636 703.
MODEL GRAPH:
TABULATION:
Parameters Amplitude
Volts
Time period
Sec
Frequency
Hz
Message signal
Carrier signal
Modulated signal
Demodulated signal
RESULT:
Thus the frequency modulation and demodulation has been performed and also the modulation index was found.

EC6512 – Communication Systems Laboratory
14 Department of Electronics and Communication Engineering Varuvan Vadivelan Institute of Technology, Dharmapuri – 636 703.
Exp. No.: 5
Date:
PULSE CODE MODULATION AND DEMODULATION
AIM:
To perform Pulse code Modulation and demodulation and to plot the waveform for
binary data at different frequencies
APPARATUS REQUIRED:
1. PCM kit
2. DSO
3. Probe
4. Patch cord
THEORY:
PCM is a method of converting an analog in to digita signals . Information in a analog
form cannot be processes by digital computers so its necessary to convert them in to digital PCM
is term which was formed during the development of digital audio transmission standards.
Digital data can be transported robustly over long distances unlike the analog data and can be
interleaved with other digital data sos various combinations of transmission channels can be
used.
PROCEDURE:
1.Connect the mains cord of the trainer unit to AC 220V, 50 Hz supply.
2.Switch ON the trainer kit. The neon lamp will glow indicating that the unit is ready
for operation.
3.Observe the Modulating Signal in an Oscilloscope.
4.Observe the FM Source in the Oscilloscope.
5.Using patch cords, connect sinewave signal source to the sample & hold circuits.
6.Connect the clock signal to the respective stages.
7. Observe the PCM output signal across the sockets marked “PCM OUTPUT”
8. Pulse mode modulated can also be observed by variable DC supply.

EC6512 – Communication Systems Laboratory
15 Department of Electronics and Communication Engineering Varuvan Vadivelan Institute of Technology, Dharmapuri – 636 703.
FUNCTIONAL BLOCK DIAGRAM:

EC6512 – Communication Systems Laboratory
16 Department of Electronics and Communication Engineering Varuvan Vadivelan Institute of Technology, Dharmapuri – 636 703.
DEMODULATION:
1. Using patch cord connect the output from pulse code modulation to the sockets .
2. Observe the PCK demodulated output signal across the sockets marked “DEMOD OUTPUT”
BLOCK DIAGRAM:
PCM signal applied to channel input
(a) Transmitter
Disorted PCM Regenarated PCM signal produced signal produced at channel output ------------ at channel output
(b) Transmission path
Final Channel output
(b) Receiver
TABULATION:
Parameters Amplitude
Volts
Time period
Sec
Frquency
Hz
Message signal
Modulated signal
Demodulated signal
RESULT:
Thus the Pulse Code Modulation and Demodulation was performed and output the
verified.
Sources of Continuous-
Time message
signal
Low – pass filter
Sampler Quantizer Encoder
Regenarative repeater
Regenarative repeater
Regenarative repeater
Regenarative repeater
Regenaration circuit Decoder
Reconstruction filter
Destination

EC6512 – Communication Systems Laboratory
17 Department of Electronics and Communication Engineering Varuvan Vadivelan Institute of Technology, Dharmapuri – 636 703.
Exp. No.: 6
Date:
DELTA MODULATION AND DEMODULATION
AIM:
To perform the Delta Modulation and Demodulation using hardware kit.
APPARATUS REQUIRED:
1. DM kit
2. DSO
3. Probe
4. Patch cord
THEORY:
Delta Modulation is a form of pulse modulation where a sample value is represented as a
single bit. This is almost similar to differential PCM, as the transmitted bit is only one per
sample just to indicate whether the present sample is larger or smaller than the previous one. The
encoding, decoding and quantizing process become extremely simple but this system cannot
handle rapidly varying samples. This increases the quantizing noise.
PROCEDURE:
A. Delta Modulation:
1.Connect the mains cord of the trainer unit to AC 220V, 50 Hz supply.
2.Switch ON the trainer kit. The neon lamp will glow indicating that the unit is ready
for operation.
3.Observe the waveforms of Modulating Signal Generator and Clock Signal Generator
in an Oscilloscope.
4.Using patch cords, connect the modulating signal to the sockets marked ‘MOD SIGNAL’
in the Delta Modulation.
5.Using patch cords, connect the clock signal to the sockets marked ‘CLK’ in the
Signal Reconstructed.
6.Connect the ‘DELTA MOD OUTPUT’ in Delta Modulator to the sockets marked

EC6512 – Communication Systems Laboratory
18 Department of Electronics and Communication Engineering Varuvan Vadivelan Institute of Technology, Dharmapuri – 636 703.
‘DELTA MOD INPUT’ in the Signal Reconstructed.
7.Using patch cords, connect the Delta Reconstructed Output marked (#) from Signal
reconstructed to the Delta Modulator marked (#).
B. Delta Demodulation:
1.Using patch cords, connect the ‘DELTA RECONSTRUCTED OUTPUT’ from the Signal.
2.Reconstructor to the sockets marked ‘DELTA RECONSTRUCTED INPUT‘ in the Delta Demodulation.
3.Observe the demodulated output waveform across sockets marked ‘DEMOD OUTPUT’.
BLOCK DIAGRAM OF DM MODULATOR AND DEMODULATOR:
e(n) + e(n) e(n)= ±1 To channel
_
∆g(n)
Encoder
∆r
e(n) Output
Decoder
∆r
Accumulator Low Pass
Filter
Quantizer
Accumulator
∑
EC6512 – Communication Systems Laboratory
19 Department of Electronics and Communication Engineering Varuvan Vadivelan Institute of Technology, Dharmapuri – 636 703.
FUNCTIONAL BLOCK DIAGRAM:

EC6512 – Communication Systems Laboratory
20 Department of Electronics and Communication Engineering Varuvan Vadivelan Institute of Technology, Dharmapuri – 636 703.
TABULATION:
MODEL GRAPH:
RESULT:
Thus the Delta modulation and demodulation were performed and graph plotted.
Parameters Amplitude
Volts Time period
Sec
Frequency
Hz
Message signal
Demodulated signal

EC6512 – Communication Systems Laboratory
21 Department of Electronics and Communication Engineering Varuvan Vadivelan Institute of Technology, Dharmapuri – 636 703.
Exp. No.: 7
Date:
OBSERVATION (SIMULATION) OF SIGNAL CONSTELLATIONS OF
BPSK, QPSK AND QAM
AIM:
To simulate BPSK QPSK and QAM using MAT Lab .
APPARATUS REQUIRED:
1. Personal Computer
2. Matlab software R2014a
PROCEDURE:
1. Open Matlab version R2014a
2. Open new file and enter the program and save it.
3. Add the path to the location of the file in the system.
4. Compile the program and check for any error and debug it.
5. Note down the output.
MATLAB CODING:
BPSK:
clc;
clear all;
bits=1000000;
data=randint (1,bits)>0.5;
ebno=0:10;
BER=zeros(1,length(ebno));
for i=1:length(ebno)
%---Transmitter---------
%mapping of bits into symbols
symb=2.*data-1;
%----Filter
psf=ones(1,1);
M=length(psf);
% inserting zeros between the bits
% w.r.t number of coefficients of

EC6512 – Communication Systems Laboratory
22 Department of Electronics and Communication Engineering Varuvan Vadivelan Institute of Technology, Dharmapuri – 636 703.
% PSF to pass the bit stream from the PSF
z=zeros(M-1,bits);
upsamp=[symb;z];
upsamp2=reshape(upsamp,1,(M)*bits);
%Passing the symbols from PSF
tx_symb=conv(upsamp2,psf);
%--------CHANNEL-----------
%Random noise generation and addition to the signal
ebnos=10.^(ebno(i)/10);
n_var=1/sqrt(2.*ebnos);
rx_symb=tx_symb+n_var*randn(1,length(tx_symb));
%xxxxxxxxxxxxxxxxxxxxxxxxxx
%-------RECEIVER-----------
rx_match=conv(rx_symb,psf);
rx=rx_match(M:M:length(rx_match));
rx=rx(1:1:bits);
recv_bits=(sign(rx)+1)./2;
%xxxxxxxxxxxxxxxxxxxxxxxxxxx
%---SIMULATED BIT ERROR RATE----
errors=find(xor(recv_bits,data));
errors=size(errors,2);
BER(i)=errors/bits;
%xxxxxxxxxxxxxxxxxxxxxxxxxxx
end
fs=1;
n_pt=2^9;
tx_spec=fft(tx_symb,n_pt);
f= -fs/2:fs/n_pt:fs/2-fs/n_pt;
figure
plot(f,abs(fftshift(tx_spec)));
title('Signal Spectrum for Signal with Rectangular Pulse
Shaping for BPSK');
xlabel('Frequency [Hz]');
ylabel('x(F)');
figure
semilogy(ebno,BER,'b.-');
hold on
thr=0.5*erfc(sqrt(10.^(ebno/10)));
semilogy(ebno,thr,'rx-');
xlabel('Eb/No (dB)')
ylabel('Bit Error rate')
title('Simulated Vs Theoritical Bit Error Rate for BPSK')
legend('simulation','theory')
grid on;
EC6512 – Communication Systems Laboratory
23 Department of Electronics and Communication Engineering Varuvan Vadivelan Institute of Technology, Dharmapuri – 636 703.
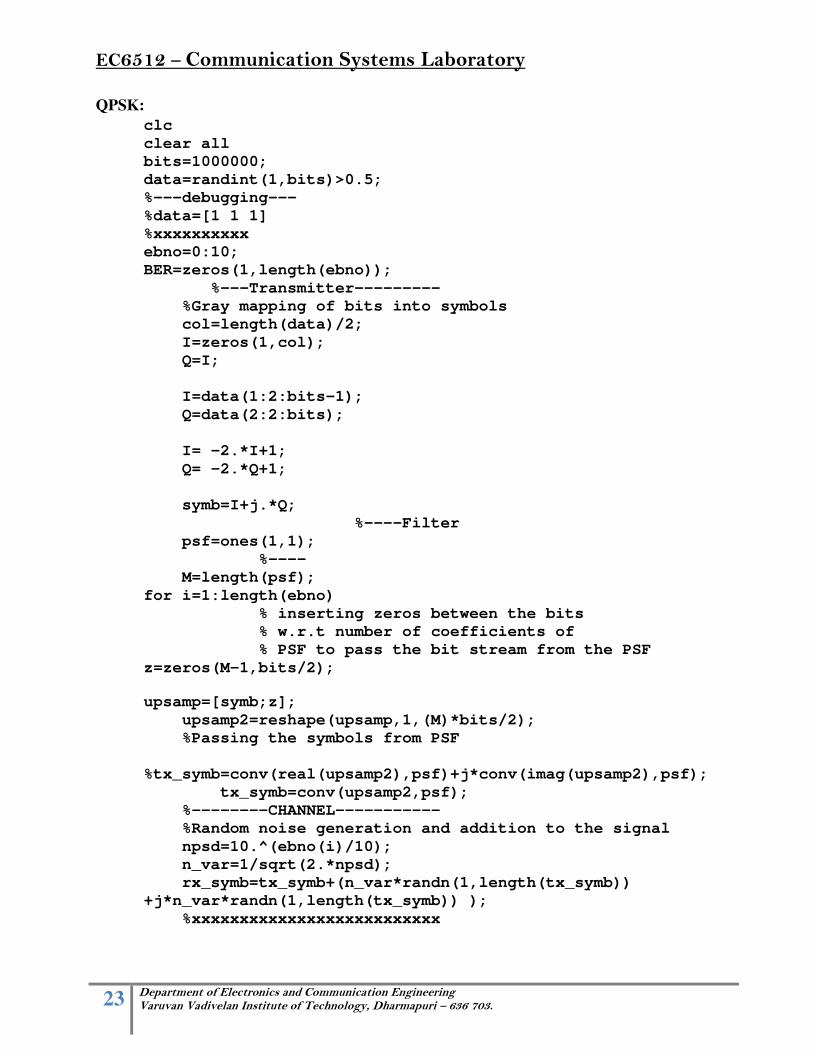
QPSK:
clc
clear all
bits=1000000;
data=randint(1,bits)>0.5;
%---debugging---
%data=[1 1 1]
%xxxxxxxxxx
ebno=0:10;
BER=zeros(1,length(ebno));
%---Transmitter---------
%Gray mapping of bits into symbols
col=length(data)/2;
I=zeros(1,col);
Q=I;
I=data(1:2:bits-1);
Q=data(2:2:bits);
I= -2.*I+1;
Q= -2.*Q+1;
symb=I+j.*Q;
%----Filter
psf=ones(1,1);
%----
M=length(psf);
for i=1:length(ebno)
% inserting zeros between the bits
% w.r.t number of coefficients of
% PSF to pass the bit stream from the PSF
z=zeros(M-1,bits/2);
upsamp=[symb;z];
upsamp2=reshape(upsamp,1,(M)*bits/2);
%Passing the symbols from PSF
%tx_symb=conv(real(upsamp2),psf)+j*conv(imag(upsamp2),psf);
tx_symb=conv(upsamp2,psf);
%--------CHANNEL-----------
%Random noise generation and addition to the signal
npsd=10.^(ebno(i)/10);
n_var=1/sqrt(2.*npsd);
rx_symb=tx_symb+(n_var*randn(1,length(tx_symb))
+j*n_var*randn(1,length(tx_symb)) );
%xxxxxxxxxxxxxxxxxxxxxxxxxx

EC6512 – Communication Systems Laboratory
24 Department of Electronics and Communication Engineering Varuvan Vadivelan Institute of Technology, Dharmapuri – 636 703.
%-------RECEIVER-----------
rx_match=conv(rx_symb,psf);
rx=rx_match(M:M:length(rx_match));
rx=rx(1:1:bits/2);
recv_bits=zeros(1,bits);
%demapping
k=1;
for ii=1:bits/2
recv_bits(k)= -( sign( real( rx(ii))) -1)/2;
recv_bits(k+1)=-( sign( imag( rx(ii)))-1)/2;
k=k+2;
end
%sign( real( rx ) )
%sign( imag( rx ) )
%data
%tx_symb
%rx_symb
%recv_bits
%xxxxxxxxxxxxxxxxxxxxxxxxxxx
%---SIMULATED BIT ERROR RATE----
errors=find(xor(recv_bits,data));
errors=size(errors,2);
BER(i)=errors/bits;
%xxxxxxxxxxxxxxxxxxxxxxxxxxx
end
fs=1;
n_pt=2^9;
tx_spec=fft(tx_symb,n_pt);
f= -fs/2:fs/n_pt:fs/2-fs/n_pt;
figure
plot(f,abs(fftshift(tx_spec)));
title('Signal Spectrum for Signal with Rectangular
Pulse Shaping for QPSK');
xlabel('Frequency [Hz]');
ylabel('x(F)');
figure
semilogy(ebno,BER,'b.-');
hold on
thr=0.5*erfc(sqrt(10.^(ebno/10)));
semilogy(ebno,thr,'rx-');
xlabel('Eb/No (dB)')
ylabel('Bit Error rate')
title('Simulated Vs Theoritical Bit Error Rate for
QPSK')
legend('Simulation','Theory'; grid on;

EC6512 – Communication Systems Laboratory
25 Department of Electronics and Communication Engineering Varuvan Vadivelan Institute of Technology, Dharmapuri – 636 703.
QAM:
clc
clear all
bits=3000000;
data=randint(1,bits)>0.5;
%---debugging---
%data=[1 1 1]
%xxxxxxxxxx
ebno=0:10;
BER=zeros(1,length(ebno));
thr=BER;
%---Transmitter---------
%Gray mapping of bits into symbols
col=length(data)/3;
I=zeros(1,col);
Q=I;
k=1;
for i=1:3:length(data)
if(data(i:i+2)==[0 0 0])
I(k)=1;
Q(k)=1;
k=k+1;
elseif(data(i:i+2)==[0 0 1])
I(k)=3;
Q(k)=1;
k=k+1;
elseif(data(i:i+2)==[0 1 0])
I(k)=-1;
Q(k)=1;
k=k+1;
elseif(data(i:i+2)==[0 1 1])
I(k)=-3;
Q(k)=1;
k=k+1;
elseif(data(i:i+2)==[1 0 0])
I(k)=1;
Q(k)=-1;
k=k+1;
elseif(data(i:i+2)==[1 0 1])
I(k)=3;
Q(k)=-1;
k=k+1;
elseif(data(i:i+2)==[1 1 0])
I(k)=-1;
Q(k)=-1;

EC6512 – Communication Systems Laboratory
26 Department of Electronics and Communication Engineering Varuvan Vadivelan Institute of Technology, Dharmapuri – 636 703.
k=k+1;
elseif(data(i:i+2)==[1 1 1])
I(k)=-3;
Q(k)=-1;
k=k+1;
end
end symb=I+j*Q;
%real(symb)
%imag(symb)
%----Filter
psf=ones(1,1);
Es=sum(psf.^2);
eb=Es/3;
eb=2;
%----
M=length(psf);
for i=1:length(ebno)
% inserting zeros between the bits
% w.r.t number of coefficients of
% PSF to pass the bit stream from the PSF
z=zeros(M-1,bits/3);
upsamp=[symb;z];
upsamp2=reshape(upsamp,1,(M)*bits/3);
%Passing the symbols from PSF
%tx_symb=conv(real(upsamp2),psf)+j*conv(imag(upsamp2),psf);
tx_symb=conv(upsamp2,psf);
%--------CHANNEL-----------
%Random noise generation and addition to the signal
ebno2=10.^(ebno(i)/10);
%no=eb/ebno2;
%n_var=sqrt(no/2);
n_var=sqrt(eb/(2*ebno2));
rx_symb=tx_symb+(n_var*randn(1,length(tx_symb))
+j*n_var*randn(1,length(tx_symb)) );
%xxxxxxxxxxxxxxxxxxxxxxxxxx
%-------RECEIVER-----------
rx_match=conv(rx_symb,psf);
rx=rx_match(M:M:length(rx_match));
rx=rx(1:1:bits/3);
recv_bits=zeros(1,bits);
%demapping
k=1;
for n=1:bits/3
I=real(rx(n));

EC6512 – Communication Systems Laboratory
27 Department of Electronics and Communication Engineering Varuvan Vadivelan Institute of Technology, Dharmapuri – 636 703.
Q=imag(rx(n));
if (I > 0) && (I < 2) && (Q > 0)
recv_bits(k:k+2)=[0 0 0];
elseif (I > 0) && (I < 2) && (Q < 0)
recv_bits(k:k+2)=[1 0 0];
elseif (I > 2) && (Q >0)
recv_bits(k:k+2)=[0 0 1];
elseif (I > 2) && (Q < 0)
recv_bits(k:k+2)=[1 0 1];
elseif (I < 0) && (I > -2) && (Q > 0)
recv_bits(k:k+2)=[0 1 0];
elseif (I < 0) && (I > -2) && (Q < 0)
recv_bits(k:k+2)=[1 1 0];
elseif (I < -2) && (Q > 0)
recv_bits(k:k+2)=[0 1 1];
elseif (I < -2) && (Q < 0)
recv_bits(k:k+2)=[1 1 1];
end
k=k+3;
end
tx_symb;
rx_symb;
data;
recv_bits;
%xxxxxxxxxxxxxxxxxxxxxxxxxxx
%---SIMULATED BIT ERROR RATE----
errors=find(xor(recv_bits,data));
errors=size(errors,2);
BER(i)=errors/bits;
ebno_lin=(10^(ebno(i)/10))
thr(i)=(5/12)*erfc(sqrt(ebno_lin/2));
%xxxxxxxxxxxxxxxxxxxxxxxxxxx
end
fs=1;
n_pt=2^9;
tx_spec=fft(tx_symb,n_pt); f= -fs/2:fs/n_pt:fs/2-fs/n_pt;
figure
plot(f,abs(fftshift(tx_spec)));
title('Signal Spectrum for Signal with Rectangular
Pulse Shaping for 8QAM');
xlabel('Frequency [Hz]');
ylabel('x(F)');
figure;
semilogy(ebno,BER,'b.-');
hold on
%ebno2=(10.^(ebno/10));
EC6512 – Communication Systems Laboratory
28 Department of Electronics and Communication Engineering Varuvan Vadivelan Institute of Technology, Dharmapuri – 636 703.
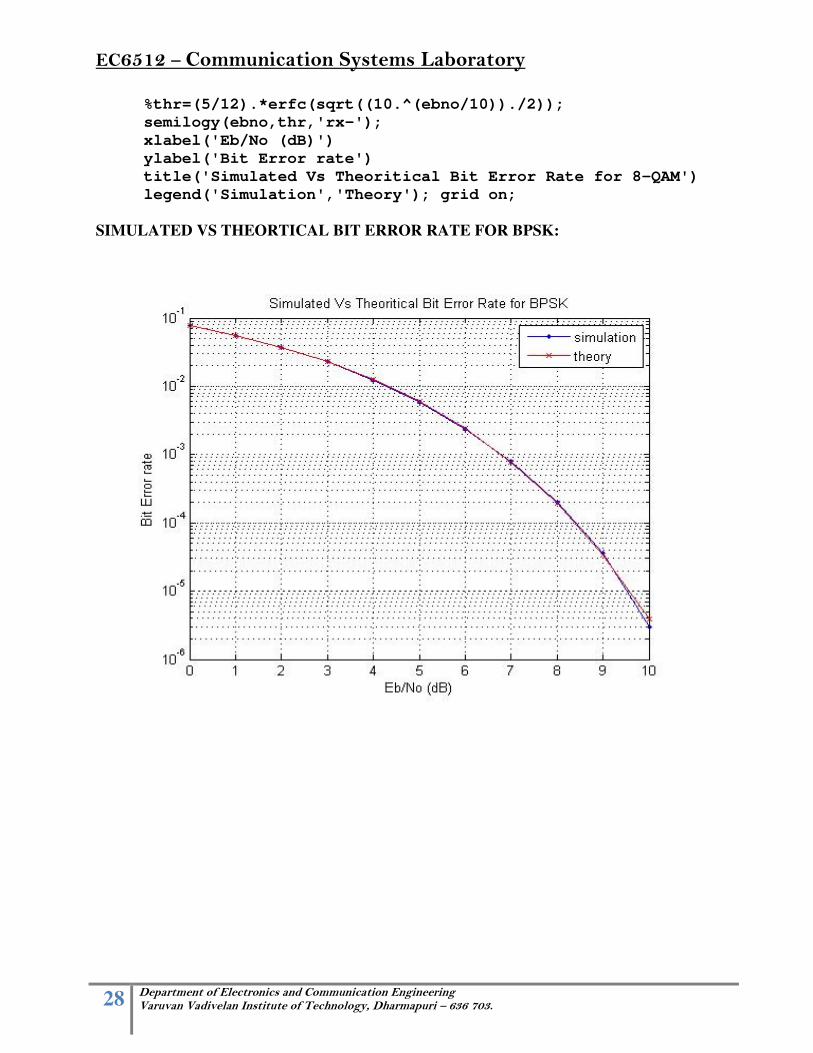
%thr=(5/12).*erfc(sqrt((10.^(ebno/10))./2));
semilogy(ebno,thr,'rx-');
xlabel('Eb/No (dB)')
ylabel('Bit Error rate')
title('Simulated Vs Theoritical Bit Error Rate for 8-QAM')
legend('Simulation','Theory'); grid on;
SIMULATED VS THEORTICAL BIT ERROR RATE FOR BPSK:

EC6512 – Communication Systems Laboratory
29 Department of Electronics and Communication Engineering Varuvan Vadivelan Institute of Technology, Dharmapuri – 636 703.
RECTANGULAR PULSE SHAPING FOR BPSK:
SIMULATED VS THEORITICAL BIT ERROR RATE FOR QPSK:

EC6512 – Communication Systems Laboratory
30 Department of Electronics and Communication Engineering Varuvan Vadivelan Institute of Technology, Dharmapuri – 636 703.
SIGNAL SPECTRUM FOR SIGNAL WITH RECTANGULAR PULSE SHAPING FOR
QPSK:
SIGNAL SPECTRUM FOR SIGNAL WITH RECTANGULAR PULSE SHAPING FOR
8 QAM:

EC6512 – Communication Systems Laboratory
31 Department of Electronics and Communication Engineering Varuvan Vadivelan Institute of Technology, Dharmapuri – 636 703.
SIMULATED VS THEORITICAL BIT ERROR RATE FOR 8- QAM:
RESULT:
Thus the Signal Constellation of BPSK, QPSK and QAM were plotted.
EC6512 – Communication Systems Laboratory
32 Department of Electronics and Communication Engineering Varuvan Vadivelan Institute of Technology, Dharmapuri – 636 703.
Exp. No.: 8
Date:
LINE CODING AND DECODING TECHNIQUES
AIM:
1. To study the different line coding techniques with the communication trainer kit .
APPARATUS REQUIRED:
2. Communication trainer kit. 3. Patch cords. 4. DSO/CRO
THEORY:
Line coding refers to the process of representing the bit stream (1’s and 0’s) in the form of
voltage or current variations optimally tuned for the specific properties of the physical channel
being used. The selection of a proper line code can help in so many ways: One possibility is to
aid in clock recovery at the receiver.
Some common types of line encoding in common-use nowadays are unipolar, polar,
bipolar, Manchester and Duobinary encoding. These codes are explained here:
Unipolar (Unipolar NRZ and Unipolar RZ):
Unipolar is the simplest line coding scheme possible. It has the advantage of being
compatible with TTL logic. Unipolar coding uses a positive rectangular pulse p(t) to represent
binary 1, and the absence of a pulse (i.e., zero voltage) to represent a binary 0. Two possibilities
for the pulse p(t) exist3: Non-Return-to-Zero (NRZ) rectangular pulse and Return-to-Zero (RZ)
rectangular pulse. The difference between Unipolar NRZ and Unipolar RZ codes is that the
rectangular pulse in NRZ stays at a positive value (e.g., +5V) for the full duration of the logic 1
bit, while the plus in RZ drops from +5V to 0V in the middle of the bit time.
A drawback of unipolar (RZ and NRZ) is that its average value is not zero, which means
it creates a significant DC-component at the receiver (see the impulse at zero frequency in the
corresponding power spectral density (PSD) of this line code.

EC6512 – Communication Systems Laboratory
33 Department of Electronics and Communication Engineering Varuvan Vadivelan Institute of Technology, Dharmapuri – 636 703.
MANCHESTER ENCODING:
In Manchester code each bit of data is signified by at least one transition. Manchester
encoding is therefore considered to be self-clocking, which means that accurate clock recovery
from a data stream is possible. In addition, the DC component of the encoded signal is zero.
Although transitions allow the signal to be self-clocking, it carries significant overhead as there
is a need for essentially twice the bandwidth of a simple NRZ or NRZI encoding
Ø Unipolar most of signal power is centered around origin and there is waste of power
due to DC component that is present.
Ø Polar format most of signal power is centered around origin and they are
simple to implement.
Ø Bipolar format does not have DC component and does not demand more bandwidth,
but power requirement is double than other formats.
Ø Manchester format does not have DC component but provides proper clocking.
PROCEDURE:
1. Connect the PRBS (test point P5) to various line coding formats. Obtain the coded
output as per the requirement.
2. Connect coded signal test point to corresponding decoding test point as inputs.
3. Set the SW1 as per the requirement.
4. Set the potentiometer P1 in minimum position.
5. Switch ON the power supply. Press the switch SW2 once.
6. Display the encoded signal and decoded signal on the cro

EC6512 – Communication Systems Laboratory
34 Department of Electronics and Communication Engineering Varuvan Vadivelan Institute of Technology, Dharmapuri – 636 703.
FUNCTIONAL BLOCK DIAGRAM:

EC6512 – Communication Systems Laboratory
35 Department of Electronics and Communication Engineering Varuvan Vadivelan Institute of Technology, Dharmapuri – 636 703.
TABULAR COLUMN:
MODEL GRAPH:
RESULT:
Thus the line coding and decoding techniques was studied
S.no Name of the
Signal
Amplitude
Volt
Time period
Sec
Frequency
Hz

EC6512 – Communication Systems Laboratory
36 Department of Electronics and Communication Engineering Varuvan Vadivelan Institute of Technology, Dharmapuri – 636 703.
Exp. No.: 9
Date:
ASK, FSK AND PSK SIMULATION USING MATLAB
AIM:
To simulate ASK, FSK and PSK using matlab.
APPARATUS REQUIRED:
1. Personal Computer
2. Matlab software R2014a
PROCEDURE:
1. Open Matlab version R2014a.
2. Open new file and enter the program and save it.
3. Add the path to the location of the file in the system.
4. Compile the program and check for any error and debug it.
5. Note down the output.
MATLAB CODING:
ASK, FSK & PSK:
%matlab code for digital modulation (ask, fsk and psk)
pi=3.14;
f=5;
f2=10;
phi=pi;
x=[1 0 1 1 0];
nx=size(x,2);
i=1;
while i<nx+1
t = i:0.001:i+1;
if x(i)==1
ask=sin(2*pi*f*t);
fsk=sin(2*pi*f*t);
psk=sin(2*pi*f*t);
else
ask=0;
fsk=sin(2*pi*f2*t);

EC6512 – Communication Systems Laboratory
37 Department of Electronics and Communication Engineering Varuvan Vadivelan Institute of Technology, Dharmapuri – 636 703.
psk=sin(2*pi*f*t+phi);
end
subplot(3,1,1);
plot(t,ask);
xlabel('time')
ylabel('amplitude')
title('amplitude shift keying')
holdon;
gridon;
axis([1 10 -2 2]);
subplot(3,1,2);
plot(t,fsk);
xlabel('time')
ylabel('amplitude')
title('frequency shift keying')
holdon;
gridon;
axis([1 10 -2 2]);
subplot(3,1,3);
plot(t,psk);
xlabel('time')
ylabel('amplitude')
title('Phase shift keying')
holdon;
gridon;
axis([1 10 -2 2]);
i=i+1;
end

EC6512 – Communication Systems Laboratory
38 Department of Electronics and Communication Engineering Varuvan Vadivelan Institute of Technology, Dharmapuri – 636 703.
MODEL GRAPH:
RESULT:
The simulation of ASK FSK and PSK has been done using MATLAB and the outputs
were recorded.

EC6512 – Communication Systems Laboratory
39 Department of Electronics and Communication Engineering Varuvan Vadivelan Institute of Technology, Dharmapuri – 636 703.
Exp. No.: 10
Date:
ERROR CONTROL CODING
AIM:
To study error linear block code error control coding technique using MATLAB.
APPARATUS REQUIRED:
1. Personal Computer
2. Matlab software R2014a
THEORY:
In coding theory, a linear code is an error-correcting code for which any linear
combination of codewords is also a codeword. Linear codes are traditionally partitioned
into block codes and convolutional codes, although turbo codes can be seen as a hybrid of these
two types. Linear codes allow for more efficient encoding and decoding algorithms than other
codes. Linear codes are used in forward error correction and are applied in methods for
transmitting symbols (e.g., bits) on a communications channel so that, if errors occur in the
communication, some errors can be corrected or detected by the recipient of a message block.
PROCEDURE:
1. Open Matlab version R2014a
2. Open new file and enter the program and save it.
3. Add the path to the location of the file in the system.
4. Compile the program and check for any error and debug it.
5. Note down the output.
MATLAB CODING:
clc;clearall;
%g=input('Enter The Generator Matrix: ');%row value
separate by semicolon
disp('The Generator Matrix is : ');
g= [1 1 0 1 0 0 0 ;0 1 1 0 1 0 0;1 1 1 0 0 1 0;1 0 1 0 0 0
1];
disp(g);
disp ('The Order of Linear Block Code for given Generator
Matrix is:');
[n,k] = size(transpose(g));
disp('The Code Word Length is : ');disp(n);

EC6512 – Communication Systems Laboratory
40 Department of Electronics and Communication Engineering Varuvan Vadivelan Institute of Technology, Dharmapuri – 636 703.
disp('The Parity Bit Length is : ');disp(k);
for i = 1:2^k
for j = k:-1:1
if rem(i-1,2^(-j+k+1))>=2^(-j+k)
m(i,j)=1;
else
m(i,j)=0;
end
end
end
disp('The Possible Message Bits are : ');
disp(' c0 c1 c2 c3');
disp(m);
disp('The Possible Codewords are :')
disp(' b0 b1 b2 c0 c1 c2 c3 Hamming
weight')
c = rem(m*g,2);
d_min = sum((c(1:2^k,:))');
d_min2=d_min';
s= [ c d_min2];
disp(s);
disp('The Minimum Hamming Weight for the given Block Code
is= ');
d_min1 = min(sum((c(2:2^k,:))'));
disp(d_min1);
% DECode
p = [g(:,1:n-k)];
h = [eye(n-k),transpose(p)];
disp('The H Matrix is ');
disp(h);
ht = transpose(h);
disp('The H Transpose Matrix is ');
disp(ht);
r=[0 0 1 1 1 0 1];
e=rem(r*ht,2);
disp('Syndrome of a Given Codeword is :');
disp(e);
for i = 1:1:size(ht)
if(ht(i,1:3)==e)
r(i) = 1-r(i);
break;
end
end
disp('The Error is in bit:');
disp(i);
disp('The Corrected Codeword is :');disp(r);
EC6512 – Communication Systems Laboratory
41 Department of Electronics and Communication Engineering Varuvan Vadivelan Institute of Technology, Dharmapuri – 636 703.
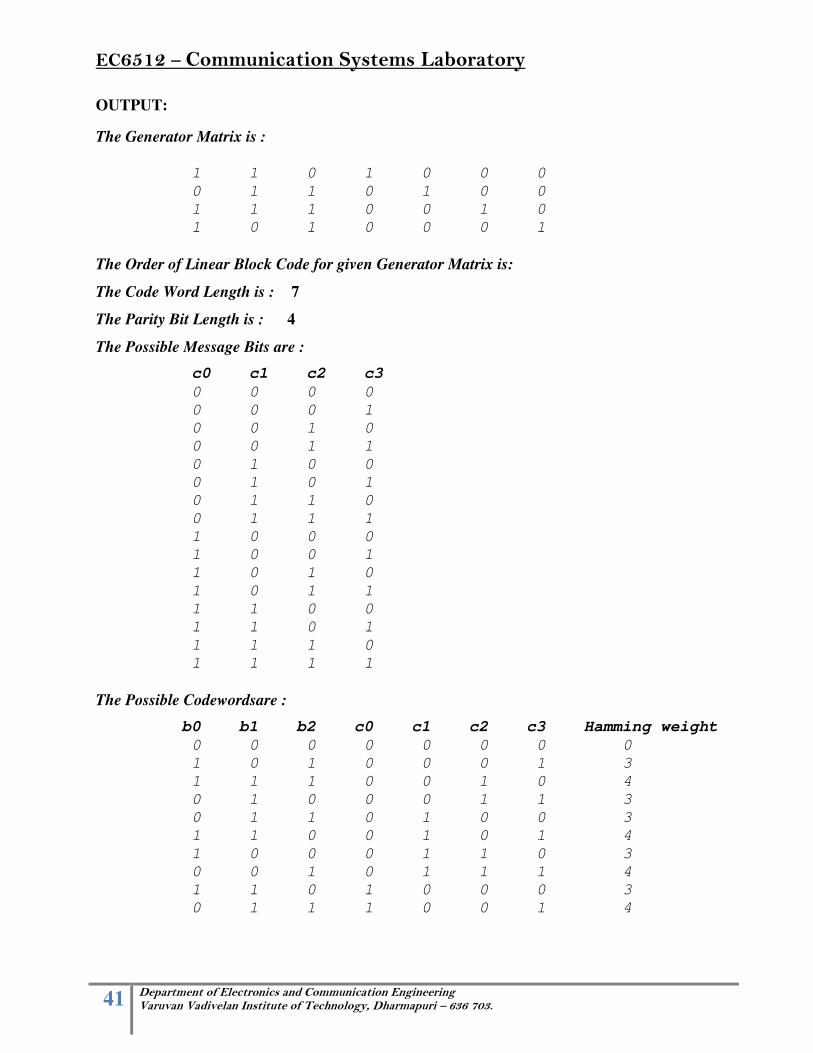
OUTPUT:
The Generator Matrix is :
1 1 0 1 0 0 0
0 1 1 0 1 0 0
1 1 1 0 0 1 0
1 0 1 0 0 0 1
The Order of Linear Block Code for given Generator Matrix is:
The Code Word Length is : 7
The Parity Bit Length is : 4
The Possible Message Bits are :
c0 c1 c2 c3
0 0 0 0
0 0 0 1
0 0 1 0
0 0 1 1
0 1 0 0
0 1 0 1
0 1 1 0
0 1 1 1
1 0 0 0
1 0 0 1
1 0 1 0
1 0 1 1
1 1 0 0
1 1 0 1
1 1 1 0
1 1 1 1
The Possible Codewordsare :
b0 b1 b2 c0 c1 c2 c3 Hamming weight
0 0 0 0 0 0 0 0
1 0 1 0 0 0 1 3
1 1 1 0 0 1 0 4
0 1 0 0 0 1 1 3
0 1 1 0 1 0 0 3
1 1 0 0 1 0 1 4
1 0 0 0 1 1 0 3
0 0 1 0 1 1 1 4
1 1 0 1 0 0 0 3
0 1 1 1 0 0 1 4

EC6512 – Communication Systems Laboratory
42 Department of Electronics and Communication Engineering Varuvan Vadivelan Institute of Technology, Dharmapuri – 636 703.
0 0 1 1 0 1 0 3
1 0 0 1 0 1 1 4
1 0 1 1 1 0 0 4
0 0 0 1 1 0 1 3
0 1 0 1 1 1 0 4
1 1 1 1 1 1 1 7
The Minimum Hamming Weight for the given Block Code is= 3
The H Matrix is
1 0 0 1 0 1 1
0 1 0 1 1 1 0
0 0 1 0 1 1 1
The H Transpose Matrix is
1 0 0
0 1 0
0 0 1
1 1 0
0 1 1
1 1 1
1 0 1
Syndrome of a Given Codewordis :
0 0 1
The Error is in bit: 3
The Corrected Codewordis :
0 0 0 1 1 0 1
RESULT:
Thus the program for error control coding was done using MATLAB and the output verified.

EC6512 – Communication Systems Laboratory
43 Department of Electronics and Communication Engineering Varuvan Vadivelan Institute of Technology, Dharmapuri – 636 703.
Exp. No.: 11
Date:
COMMUNICATION LINK
AIM:
To simulate the communication link using MATLAB simulation tool.
APPARATUS REQUIRED:
1. Personal Computer
2. Matlab software R2014a
PROCEDURE:
1. Open Matlab version R2014a.
2. And click the start button.
3. Now select the simulink library browser.
4. Open new file for a new project and fix the tools from the simulink library browser,
the connect the all tools and save it.
5. Now press run button for to simulate communication link.
6. Note down the output.
SIMULINK DIAGRAM OF COMMUNICATION LINK:

EC6512 – Communication Systems Laboratory
44 Department of Electronics and Communication Engineering Varuvan Vadivelan Institute of Technology, Dharmapuri – 636 703.
OUTPUT:
RESULT:
Thus the simulation of the communication link was done using MATLAB and the output
verified.

EC6512 – Communication Systems Laboratory
45 Department of Electronics and Communication Engineering Varuvan Vadivelan Institute of Technology, Dharmapuri – 636 703.
Exp. No.: 12
Date:
Equalization – Zero Forcing & LMS algorithms (simulation)
AIM:
To simulate the zero forcing and LMS algorithms equalizer using MATLAB simulation
tool.
APPARATUS REQUIRED:
1. Personal Computer
2. Matlab software R2014a
PROCEDURE:
1. Open Matlab version R2014a.
2. And click the start button.
3. Now select the simulink library browser.
4. Open new file for a new project and fix the tools from the simulink library browser,
the connect the all tools and save it.
5. Now press run button for to simulate communication link.
6. Note down the output.
MATLAB CODE FOR ZERO FORCING EQUALIZER:
%Project: Zero Forcing Equalizer
%Discription: Zero Forcing Equalizer is a type of linear
%equalizers used to
%combat ISI(inter symbol interference). This codes is a
%demostration of a
%simple implemenation of Zero Forcing Equalizer using
MatLab tools.
function Xh = ZF(h,r)
%r --- signal at the receiver
% h--- impulse response of the channel
%Computing inverse impulse response
gD=tf(h,1); %taking impulse response and transforming
%it to S domain
f=1/gD; % taking inverse of a transfer %function
[num,den]=tfdata(f,'v'); % extracting numerator and
%denominator %coefficients

EC6512 – Communication Systems Laboratory
46 Department of Electronics and Communication Engineering Varuvan Vadivelan Institute of Technology, Dharmapuri – 636 703.
%Zero forcing
Xh=filter(num,den,r); % filtering
Xh=Xh(2:end); %this done for techniqal reasons End
SIMULINK DIAGRAM OF LMS LINEAR EQUALIZER:
OUTPUT:
RESULT:
Thus the simulations of zero forcing and LMS algorithms equalizer has been done using
MATLAB and the output verified.
Related Documents