209 University of Virginia Physics Department PHYS 241W, Fall 2004 Name Date Partners Lab 12 - MICROWAVE AND LIGHT INTERFERENCE OBJECTIVES • To better understand the wave nature of light • To study interference effects with electromagnetic waves in microwave and visible wavelengths OVERVIEW Electromagnetic waves are time varying electric and magnetic fields that are coupled to each other and that travel through empty space or through insulating materials. The spectrum of electromagnetic waves spans an immense range of frequencies, from near zero to more than 10 30 Hz. For periodic electromagnetic waves the frequency and the wavelength are related through c = λ f , (1) where λ is the wavelength of the wave, f is its frequency, and c is the velocity of light. A section of the electromagnetic spectrum is shown in Fig. 1. In Investigation 1, we will use waves having a frequency of 1.05 × 10 10 Hz (10.5 GHz), corresponding to a wavelength of 2.85 cm. 10 2 10 4 10 3 10 10 6 10 8 10 7 10 5 10 10 10 12 10 11 10 9 10 14 10 16 10 15 10 13 10 18 10 20 10 19 10 17 10 22 10 23 10 21 10 -2 10 -4 10 -3 1 10 -6 10 -8 10 -7 10 -5 10 -10 10 -12 10 -11 10 -9 10 -14 10 -15 10 -13 10 -1 10 2 10 4 10 3 10 6 10 7 10 5 1 MHz 1 kHz VISIBLE LIGHT Frequency, Hz Wavelength, m Gamma rays X rays Ultraviolet light Infrared light Short radio waves Television and FM radio AM radio Long radio waves 1 nm 1 mm 1 cm 1 m 1 km 1 Å Microwaves 1 GHz 1 THz 1 µm 10 Fig. 1. Section of the electromagnetic spectrum.

Welcome message from author
This document is posted to help you gain knowledge. Please leave a comment to let me know what you think about it! Share it to your friends and learn new things together.
Transcript

209
University of Virginia Physics Department PHYS 241W, Fall 2004
Name Date Partners
Lab 12 - MICROWAVE AND LIGHT INTERFERENCE
OBJECTIVES
• To better understand the wave nature of light
• To study interference effects with electromagnetic waves in microwave and visible wavelengths
OVERVIEW
Electromagnetic waves are time varying electric and magnetic fields that are coupled to each other and that travel through empty space or through insulating materials. The spectrum of electromagnetic waves spans an immense range of frequencies, from near zero to more than 1030 Hz. For periodic electromagnetic waves the frequency and the wavelength are related through
c = λ f , (1)
where λ is the wavelength of the wave, f is its frequency, and c is the velocity of light. A section of the electromagnetic spectrum is shown in Fig. 1.
In Investigation 1, we will use waves having a frequency of 1.05 × 10¹⁰ Hz (10.5 GHz), corresponding to a wavelength of 2.85 cm.
102
104
103
10
106
108
107
105
1010
1012
1011
109
1014
1016
1015
1013
1018
1020
1019
1017
1022
1023
1021
10-2
10-4
10-3
1
10-6
10-8
10-7
10-5
10-10
10-12
10-11
10-9
10-14
10-15
10-13
10-1
102
104
103
106
107
105
1 MHz
1 kHz
VISIBLE LIGHT
Frequency, Hz Wavelength, m
Gamma rays
X rays
Ultraviolet light
Infrared light
Short radio waves Television and FM radio
AM radio
Long radio waves
1 nm
1 mm
1 cm
1 m
1 km
1 Å
Microwaves 1 GHz
1 THz
1 µm
10
Fig. 1. Section of the electromagnetic spectrum.
210 Lab 12 - Microwave and Light Interference
University of Virginia Physics Department PHYS 241W, Fall 2004
This relegates them to the so-called microwave part of the spectrum. In Investigation 2, we will be using visible light, which has wavelengths of 400 – 700 nm (1 nm = 10-9 m), corresponding to frequencies on the order of 4.3 × 10¹⁴-7.5 × 10¹⁴ Hz. These wavelengths (and hence, frequencies) differ by nearly five orders of magnitude, and yet we shall find that both waves exhibit the effects of interference.
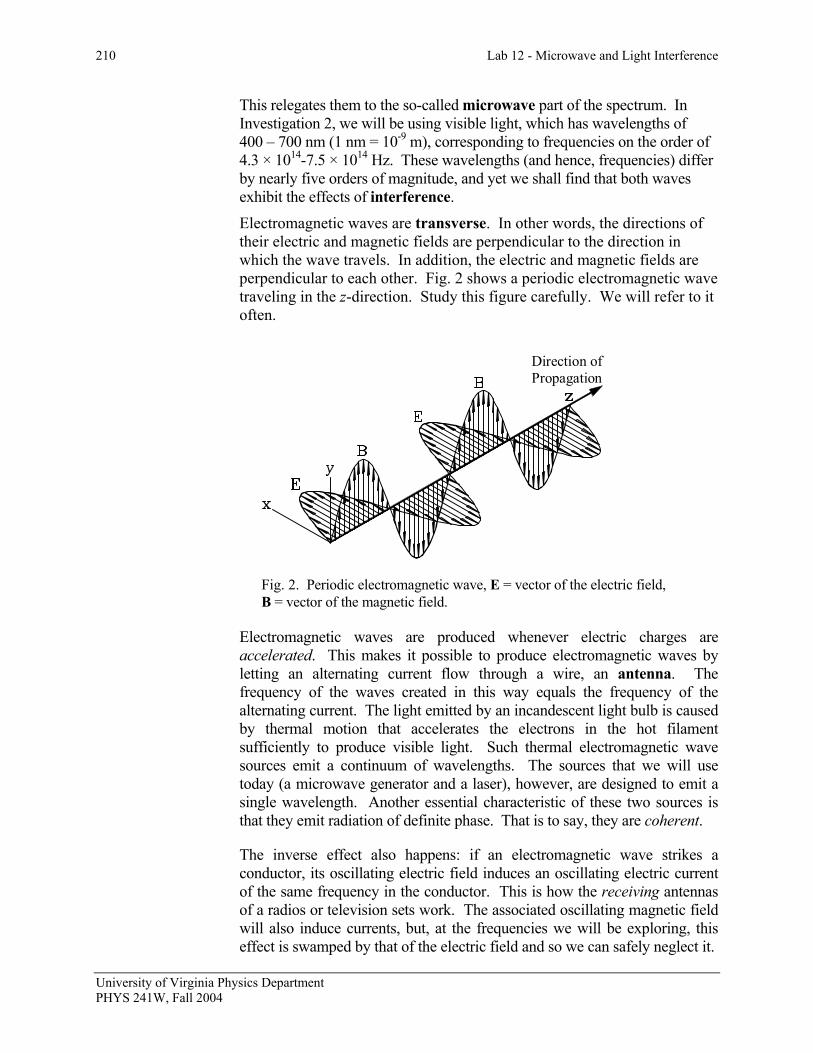
Electromagnetic waves are transverse. In other words, the directions of their electric and magnetic fields are perpendicular to the direction in which the wave travels. In addition, the electric and magnetic fields are perpendicular to each other. Fig. 2 shows a periodic electromagnetic wave traveling in the z-direction. Study this figure carefully. We will refer to it often.
Electromagnetic waves are produced whenever electric charges are accelerated. This makes it possible to produce electromagnetic waves by letting an alternating current flow through a wire, an antenna. The frequency of the waves created in this way equals the frequency of the alternating current. The light emitted by an incandescent light bulb is caused by thermal motion that accelerates the electrons in the hot filament sufficiently to produce visible light. Such thermal electromagnetic wave sources emit a continuum of wavelengths. The sources that we will use today (a microwave generator and a laser), however, are designed to emit a single wavelength. Another essential characteristic of these two sources is that they emit radiation of definite phase. That is to say, they are coherent.
The inverse effect also happens: if an electromagnetic wave strikes a conductor, its oscillating electric field induces an oscillating electric current of the same frequency in the conductor. This is how the receiving antennas of a radios or television sets work. The associated oscillating magnetic field will also induce currents, but, at the frequencies we will be exploring, this effect is swamped by that of the electric field and so we can safely neglect it.
Direction of Propagation
Fig. 2. Periodic electromagnetic wave, E = vector of the electric field, B = vector of the magnetic field.

Lab 12 - Microwave and Light Interference 211
University of Virginia Physics Department PHYS 241W, Fall 2004
Electromagnetic waves carry energy. The energy density at any point is proportional to the square of the net electric field. The intensity (what we can observe) is the time average of the energy density. Important Note: To find the intensity of the electromagnetic waves at any point, we must first add up (as vectors, of course), all of the electric fields to find the net electric field. We cannot simply add intensities. It is this property of electromagnetic waves1 that lead to interference effects.
In this workshop you will be studying how electromagnetic waves interfere. We will, once again, be using two small regions of the electromagnetic spectrum: microwaves and visible light. Look at Fig. 1 to understand the relative position of microwaves and visible light. The microwaves that you will be using in this experiment have a frequency of 1.05 × 10¹⁰ Hz, corresponding to a wavelength of 2.85 cm. The name microwave is to be understood historically: In the early days of radio the wavelengths in use were of the order of hundreds, even thousands, of meters. Compared with these waves, those in the centimeter region, which were first used in radar equipment during W.W. II, were indeed ‘micro’ waves.
You will recall that conductors cannot sustain a net electric field. Any externally applied electric field will give rise to a force on the free electrons that will cause them to move until they create a field that precisely cancels the external field (thereby eliminating the force on the electrons). If an electromagnetic wave strikes a conductor, the component of its oscillating electric field that is parallel to the wire will induce an oscillating electric current of the same frequency in the conductor. This oscillating current is simply the free electrons in the wire redistributing themselves. Now you will also recall that an oscillating electric current will produce electromagnetic waves. An important thing to note about these induced waves is that their electric fields must be equal in magnitude and opposite in direction to the incident wave at the surface of the conductor.
Consider now a plane electromagnetic wave incident upon a wire. Fig. 3 schematically shows a top view of such a case. Only one incident wave front and the resultant induced wave front are shown. The incident wave front is shown as having passed the wire and is traveling from the top of the figure to the bottom. The induced wave will be of the form of an expanding cylinder centered on the wire and, since the induced wave travels at the same speed as does the incident wave, the cylinder’s radius is equal to the distance that the incident wave front has traveled since it struck the wire. At the point where the induced wave and the incident wave touch, they add destructively as the induced wave must be 180° out of phase with respect to the incident wave.
1 This is a general property of waves, not just for electromagnetic waves.

212 Lab 12 - Microwave and Light Interference
University of Virginia Physics Department PHYS 241W, Fall 2004
Fig. 3. An electromagnetic wave incident upon a wire
Fig. 4 shows the same situation, but with a number of wires all oriented in the same direction. We can see that the induced wave fronts all line up in phase at the incident wave front. However, since the induced waves are 180° out of phase with the incident wave, the resulting wave front is reduced in amplitude. We indicate this by showing the incident wave front as a dashed line. With enough such wires, the amplitude for the forward direction can be reduced to a negligible level. The energy of the incident wave is not lost; it is simply re-radiated in other directions.
Fig. 4. An electromagnetic wave incident upon an assembly of wires
Fig. 5 is similar to Fig. 4, with a few notable differences. Most significantly, the wires are now arranged in a linear array. We also now have the incident wave come in at an angle (from the top left).
Incident Wave Front
Induced Wave Front
Wire
Direction of Propagation of Incident Wave Front
Direction of Propagation of Incident Wave Front

Lab 12 - Microwave and Light Interference 213
University of Virginia Physics Department PHYS 241W, Fall 2004
Fig. 5. An electromagnetic wave incident upon a linear array of wires
We recognize this arrangement as the “wire grid polarizer” from an earlier lab. In the earlier lab, we investigated the polarization properties of transmitted electromagnetic waves. We now consider the properties of the scattered or reflected waves. In Fig. 5, we see that not only do the induced waves line up with each other in the plane of the incident wave, now they also line up with each other in another plane. This alignment of wave fronts gives rise to constructive interference, meaning that the resulting wave front’s amplitude is enhanced in this direction. With enough wires, essentially all of the incident wave’s energy will be radiated in this direction.
Furthermore, we can see from Fig. 5 that the angle that this reflected wave front makes with the plane of the wires is the same as that of the incident wave front. In other words, “angle of incidence equals angle of reflection”. We will find that, for microwaves, the “wire grid polarizer” makes a fine mirror (but only for waves with their electric fields aligned with the wires!).
What about Polaroid glasses and filters? Why do they not act like mirrors? The answer is that Polaroid filters and glasses are thick relative to the wavelength of visible light. The conductive molecules are randomly distributed throughout the filter and, hence, are arranged more like the wires shown in Fig. 4 than in Fig. 5.
INVESTIGATION 1: INTERFERENCE EFFECTS WITH MICROWAVES
Activity 1-1: Polarization Of Microwaves Reflected From A Wire Grid
For this activity, you will need the following:
Reflected Wave Front
Incident Wave Front
Direction of Propagation of Reflected Wave Front
Direction of Propagation of Incident Wave Front

214 Lab 12 - Microwave and Light Interference
University of Virginia Physics Department PHYS 241W, Fall 2004
• PASCO Gunn diode microwave transmitter
• PASCO microwave receiver
• Goniometer
• Wire Grid
It is imperative that you NOT peg the meter as doing so can damage it! If you find the meter pegged, immediately turn down the sensitivity and/or move the receiver away from the microwave generator!
1. Refer to Fig. 6. Place the generator on the main arm of the goniometer such that entrance to the "horn" is between 30-40 from the goniometer’s hinge (at the center of the circle). Place the receiver on the goniometer’s shorter arm so that its horn is about the same distance from the hinge.
2. Set the angle between the two arms the goniometer at 180° (so that the receiver is "looking" directly at the transmitter). Set both the receiver and the transmitter at 0° (so that the electric field of the emitted and detected waves is oriented vertically). Turn on the generator by plugging the AC adapter wire into the generator and then plug the adapter into an AC outlet. Adjust the sensitivity on the receiver to obtain a signal that is 75% of full scale on the meter. Again, do not let the meter peg! Leave the sensitivity at this setting for the remainder of this Investigation.
3. Place the wire grid so that the center pin of the goniometer hinge fits into the recess in the bottom of the grid frame (see Fig. 7). Align the grid so that it is at 40° on the goniometer scale.
Receiver
Generator
Fig. 6. Microwave generator and receiver arrangement.

Lab 12 - Microwave and Light Interference 215
University of Virginia Physics Department PHYS 241W, Fall 2004
Question 1-1: What is the angle (labeled "Angle of Incidence" in Fig. 7) between the incident microwave beam and the normal to the plane formed by the wire grid array?
Angle of Incidence
Prediction 1-1: At what angle between the goniometer arms do we expect to find a maximum detected signal? Explain.
Goniometer Angle
4. Record the detected signal strength with grid in place and the receiver still at 180°.
Meter Reading
5. Slide the receiver (still attached to the short goniometer arm) until you find the angle where the detected signal is at a maximum. [Note: You may find it easier to slide the receiver if you put a bit of paper under the receiver to reduce sliding friction.]. Record the angle between the two goniometer arms and the detected signal strength.
Goniometer Angle
Meter Reading
Question 1-2: Does the wire grid array behave like a mirror? Explain.
Fig. 7. Microwave receiver, transmitter and wire grid arrangement
Angle of Incidence Angle of
Reflectance
Wire Grid
Transmitter
Receiver

216 Lab 12 - Microwave and Light Interference
University of Virginia Physics Department PHYS 241W, Fall 2004
Activity 1-2: Two Slit Interference Pattern
To further observe interference with microwaves, you will need the following:
• PASCO Gunn diode microwave transmitter
• PASCO microwave receiver
• Goniometer
• Double slit hood
• Meter stick or tape measure, plastic ruler
CAUTION: DO NOT ALLOW THE RECEIVER’S METER TO PEG AT ANY TIME!
1. Replace the detector probe and reflector with the receiver, as shown in Fig. 8. Set the knob on the back of the receiver to 0º. Starting with the
meter multiplier on 30, adjust the sensitivity to obtain a signal near 0.5 on the meter. If you cannot achieve this with a sensitivity of 10 or 3, move the receiver closer to the generator.
2. Rotate the receiver and verify that it is sensitive to the polarization of the wave. The maximum signal should be obtained when both are at 0º.
3. Slide the double slit hood over the generator’s horn, creating two coherent microwave sources as shown schematically in Fig. 9.
Receiver
Generator
Fig. 8. Microwave generator and receiver arrangement.

Lab 12 - Microwave and Light Interference 217
University of Virginia Physics Department PHYS 241W, Fall 2004
4. Place the generator on the main arm of the goniometer such that the hood lies directly over the goniometer’s hinge. Place the receiver on the goniometer’s shorter arm so that the horns are about 25 cm apart. The signal amplitude that the receiver will detect depends on the phase of the microwaves when they reach the receiver probe. To a good approximation, if x = d sin θ is equal to an integral number of wavelengths nλ, then the microwaves from the two slits will interfere constructively and you will see a maximum register on the meter. Likewise, if d sin θ is equal to a half-integral number of wavelengths (n - ½) λ, the meter will register a minimum.
constructive interference: sinn dλ θ=
destructive interference: 1( ) sin2
n dλ θ− =
d = distance between centers of slits (double slit hood):__________
5. Set the receiver to 0º. Adjust the horn around 0º to obtain a maxima signal. Then move the horn receiver to greater angles and note further maxima and minima. You will need to increase the sensitivity to find the minima accurately. However, reduce the sensitivity as you move away from the minima so that you do not peg the meter! You should be able to locate two minima and one other maximum on each side of the central maximum, but just look on one side of the central maximum (0º). (Hint: It is easier to slide the receiver if you place a sheet of paper under its feet.)
Angles of maxima: _____________ ______________
Angles of minima: _____________ ______________
d
Microwavegenerator
θ
θ
x = d sin θ
Horn
Double slit hood
Receiver
Fig. 9 Interference from the two slit hood.
218 Lab 12 - Microwave and Light Interference
University of Virginia Physics Department PHYS 241W, Fall 2004
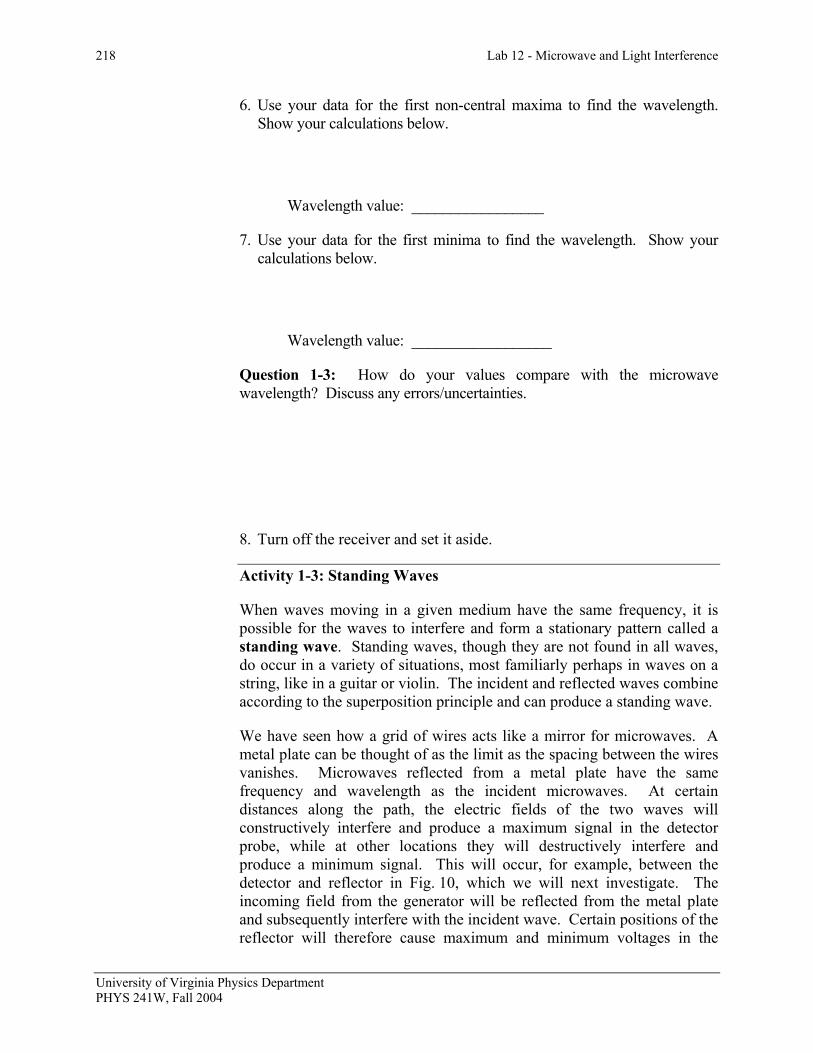
6. Use your data for the first non-central maxima to find the wavelength. Show your calculations below.
Wavelength value: _________________
7. Use your data for the first minima to find the wavelength. Show your calculations below.
Wavelength value: __________________
Question 1-3: How do your values compare with the microwave wavelength? Discuss any errors/uncertainties.
8. Turn off the receiver and set it aside.
Activity 1-3: Standing Waves
When waves moving in a given medium have the same frequency, it is possible for the waves to interfere and form a stationary pattern called a standing wave. Standing waves, though they are not found in all waves, do occur in a variety of situations, most familiarly perhaps in waves on a string, like in a guitar or violin. The incident and reflected waves combine according to the superposition principle and can produce a standing wave.
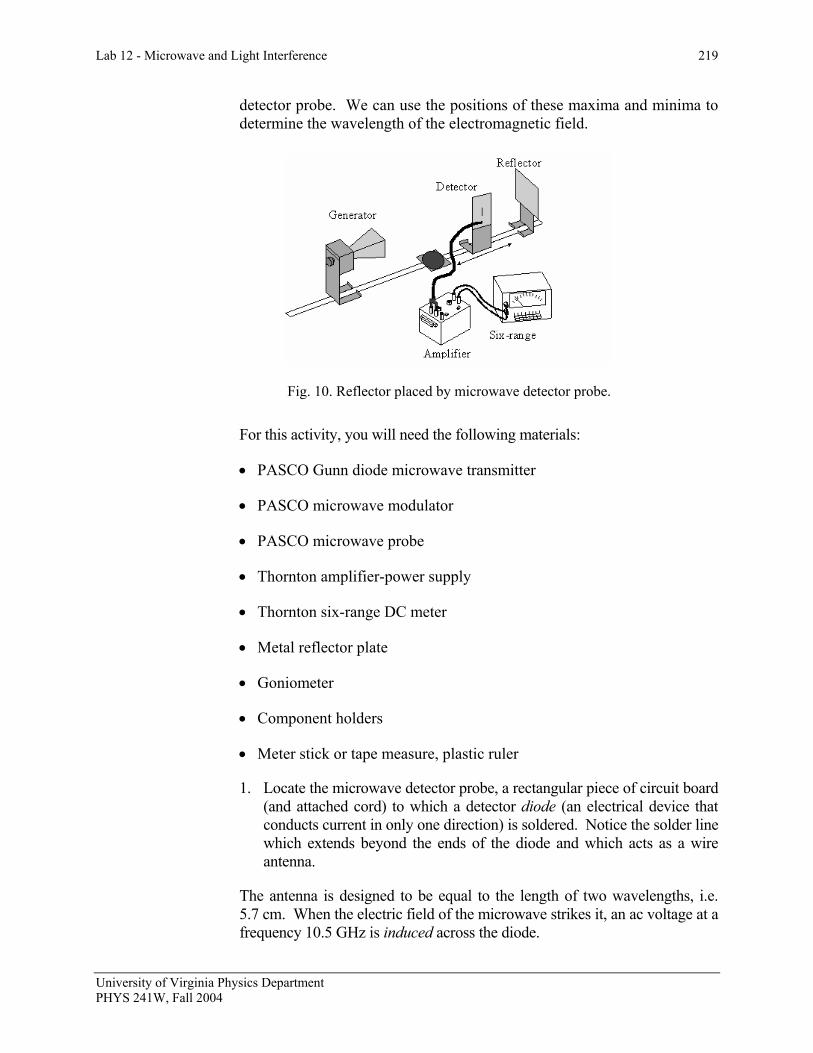
We have seen how a grid of wires acts like a mirror for microwaves. A metal plate can be thought of as the limit as the spacing between the wires vanishes. Microwaves reflected from a metal plate have the same frequency and wavelength as the incident microwaves. At certain distances along the path, the electric fields of the two waves will constructively interfere and produce a maximum signal in the detector probe, while at other locations they will destructively interfere and produce a minimum signal. This will occur, for example, between the detector and reflector in Fig. 10, which we will next investigate. The incoming field from the generator will be reflected from the metal plate and subsequently interfere with the incident wave. Certain positions of the reflector will therefore cause maximum and minimum voltages in the
Lab 12 - Microwave and Light Interference 219
University of Virginia Physics Department PHYS 241W, Fall 2004
Fig. 10. Reflector placed by microwave detector probe.
detector probe. We can use the positions of these maxima and minima to determine the wavelength of the electromagnetic field.
For this activity, you will need the following materials:
• PASCO Gunn diode microwave transmitter
• PASCO microwave modulator
• PASCO microwave probe
• Thornton amplifier-power supply
• Thornton six-range DC meter
• Metal reflector plate
• Goniometer
• Component holders
• Meter stick or tape measure, plastic ruler
1. Locate the microwave detector probe, a rectangular piece of circuit board (and attached cord) to which a detector diode (an electrical device that conducts current in only one direction) is soldered. Notice the solder line which extends beyond the ends of the diode and which acts as a wire antenna.
The antenna is designed to be equal to the length of two wavelengths, i.e. 5.7 cm. When the electric field of the microwave strikes it, an ac voltage at a frequency 10.5 GHz is induced across the diode.
220 Lab 12 - Microwave and Light Interference
University of Virginia Physics Department PHYS 241W, Fall 2004
The amplitude of the DC signal from the detector diode is generally quite weak, so it must be amplified. Locate the Thornton amplifier and the Thornton six-range DC meter (voltmeter). DO NOT plug the probe into the amplifier yet! Set the amplifier to DC, its gain to a high value (near 100), and its DC OFFSET to zero (12 o’clock position). Turn on the amplifier. Select the 10 V range on the Thornton DC meter. Plug the OUT of the amplifier into the six-range meter (red to red, black to black). Adjust the DC OFFSET so that the meter reads slightly above zero. At lower scales, the meter becomes increasingly sensitive to the DC OFFSET of the amplifier. It is imperative that you NOT peg the meter as doing so can damage it! The meter is extremely sensitive to the DC OFFSET of the amplifier, so be extremely careful!
CAUTION: DO NOT ALLOW THE SIX-RANGE METER TO PEG AT ANY TIME!
IF YOU FIND THE METER PEGGED, IMMEDIATELY SELECT A LARGER (LOWER SENSITIVITY SCALE!
Start measurements with the six-range meter set to the 10 V scale. Decrease as necessary.
2. Using a BNC-to-banana adapter, plug the probe into the IN of the amplifier. One of the arms of the BNC-to-banana adapter has a tab, which indicates it should be plugged into the ground (black) terminal. Position the diode at about 50 cm from the front of the microwave generator’s horn and oriented vertically, as shown in Fig. 10. Make sure the orientation of the generator is 0º.
3. Adjust the distance of the probe from the generator until the meter registers a voltage about 3/4 of full scale (10 V scale). Keep the probe at least 15 cm away from the generator to keep the diode from burning out. (The stand holding the detector probe is easier to slide if you put a piece of paper under its feet. Also, remember to keep your hand out of the way since any conductor in the vicinity, e.g. a piece of metal, even your hand, will reflect waves and may give you spurious results.)
Note: The meter may register a voltage when there are no microwaves incident upon the detector, due to the DC OFFSET of the amplifier. We could subtract this offset from our measurements, but, for purposes here, we need only be able to identify maxima and minima.
4. Return the generator angle to 0º and move the generator and detector back to the 50 cm position.
Prediction 1-2: If we place a reflector behind the detector probe, the microwave should be reflected back towards the generator. What do you
Lab 12 - Microwave and Light Interference 221
University of Virginia Physics Department PHYS 241W, Fall 2004
think will happen to the original wave and the reflected wave? What are the conditions to produce a maximum constructive standing wave? What are the conditions to produce a minimum?
5. Place a reflector (solid flat piece of metal) behind the detector probe, as shown in Fig. 10. This will produce a standing wave between the generator and the reflector. Making sure to keep the probe at least 50 cm from the generator, slide the probe along the leg of the goniometer, and notice there are positions of maxima and minima signal strength. Slide the detector probe along the goniometer, no more than a cm or two, until you determine a maximum signal. Then slide the reflector, again no more than a centimeter or two, until you obtain another signal strength maximum. Continue making slight adjustments to the detector probe and reflector until the meter reading is as high as possible, but not pegging on the 10 V scale. If this occurs, move the generator back further away.
6. Now find a node (minimum) of the standing wave pattern by slightly moving the probe until the meter reading is a minimum. We want to determine the wavelength of the standing wave, so only relative distances between maxima and/or minima are relevant. In this case, it is easiest to use the goniometer scale and measure the distance using the probe base and goniometer scale. Record the position of the probe below:
Initial probe position at minimum: ____________________
7. While watching the meter, slide the probe along the goniometer until the probe has passed through at least ten antinodes (maxima) and returned to a node. Be sure to count the number of antinodes that were traversed. Record the number of antinodes traversed and the new probe position.
Antinodes traversed: ______
Final probe position at minimum: ________
Question 1-4: What are the analogies with the nodes and antinodes found here and for the standing waves found from an oscillating string fixed at both ends (guitar)? Sketch a picture.

222 Lab 12 - Microwave and Light Interference
University of Virginia Physics Department PHYS 241W, Fall 2004
Question 1-5: What is the distance in terms of the wavelength between adjacent antinodes (maxima)?
Question 1-6: What is the wavelength you deduce from your data?
Wavelength of standing wave: ________________________
Question 1-7: Using this experimental wavelength value, determine the frequency of the wave. Is this consistent with your apparatus? If not, please explain.
Wave frequency: ____________
8. Unplug the generator’s power supply from the receptacle and turn off the amplifier before proceeding.
INVESTIGATION 2: INTERFERENCE EFFECTS WITH VISIBLE LASER LIGHT
Please read Appendix J: Lasers before you come to lab.
OVERVIEW
In an earlier experiment you studied various interference phenomena with electromagnetic waves whose wavelength λ was approximately 3 cm (microwaves). In this experiment you will study similar phenomena with electromagnetic waves in the visible part of the spectrum. For brevity, we will simply use the common term "light". Light waves have a much shorter wavelength (λ ≈ 4 - 7 × 10⁻⁵ cm) than do microwaves.
All the phenomena that you will observe can be described quite accurately with a simple theoretical model dating back to Christian Huygens (1629 - 1695). This model applies to wave phenomena in general and does not make any reference to the electromagnetic nature of light.
Huygens’ Principle states that every point of a wave front can be thought of as the origin of spherical waves. This seems to be contradicted by

Lab 12 - Microwave and Light Interference 223
University of Virginia Physics Department PHYS 241W, Fall 2004
experience: How can a laser emit a pencil beam? Would the light not spread out immediately?
We investigate this question with a gedanken (thought) experiment: Let a plane wave be incident on a screen that has a hole cut into it. Imagine that at the time t = 0 the wave front, coming from below, has just reached the hole as shown in Fig. 11a. An instant later, at t = t1,the spherical wavelets that were, according to Huygens' Principal, created at every point of this wave front have begun to spread, as in Fig. 11b. Later yet at t = t2, shown in Fig. 11c, we find that the wavelets have spread considerably; but, in a central region as wide as the slit, they have formed a new wave front propagating in the same direction as the old one. This reasoning can be repeated point by point in space and time as needed.
As a result, one will see by and large what one would have expected: a ray of light of the width of the slit, propagating in the original direction. Only on very close observation will one see that a small amount of light has leaked around the corner to regions where according to a ray model it should not be. The larger the hole, the smaller will be the fraction of the light that leaks around the corner, a process called diffraction. Largeness is a relative term - large with respect to what? The only measure of length that is appropriate for this problem is the wavelength of the incident light: When the size of the hole is large compared to the wavelength only a small part of all the light will find its way around the edge, most of it will be in the central beam. Only if the size of the hole is small compared to the wavelength will one find that the light spreads out spherically, as shown in Fig. 12. Clearly this is only a hand waving argument. A mathematically rigorous explanation of diffraction, based on Huygens’
Fig. 11. The propagation of a wave front through a hole.

224 Lab 12 - Microwave and Light Interference
University of Virginia Physics Department PHYS 241W, Fall 2004
Principle, is credited to J. A. Fresnel, (1788-1827).
For this investigation, you will need the following:
• Spectra-Physics Helium-Neon Laser
• Lab jack
• Small Support stand
• Clamp for stand
• Slide with single slits of varying widths
• Slide with multiple slits
• Diffraction grating slide
• Board placed on table to observe patterns
• 3-m tape
THE SINGLE SLIT
Diffraction patterns can be observed with a single slit. Fig. 13 shows three representative wavelets emerging from a single slit. The angle has been chosen so that the path difference between the wavelets a) and c) is equal to the wavelength λ. For a single slit such a condition will result in darkness: For each wavelet emerging from the lower half of the slit there will be one from the upper half that is out of phase by half a wavelength
Fig. 12 A wave front hitting a small pinhole.

Lab 12 - Microwave and Light Interference 225
University of Virginia Physics Department PHYS 241W, Fall 2004
that will extinguish it. In the case of the single slit the condition for darkness is thus
dDny dark
nλ
= (2)
where n is any whole integer greater than 0 (n = 1,2,3…).
A more detailed derivation gives the intensity, I, as a function of angle, θ:
2
0 2
sin sin( )
sin
d
I = Id
π θλθ
π θλ
⎛ ⎞⎜ ⎟⎝ ⎠
⎛ ⎞⎜ ⎟⎝ ⎠
. (3)
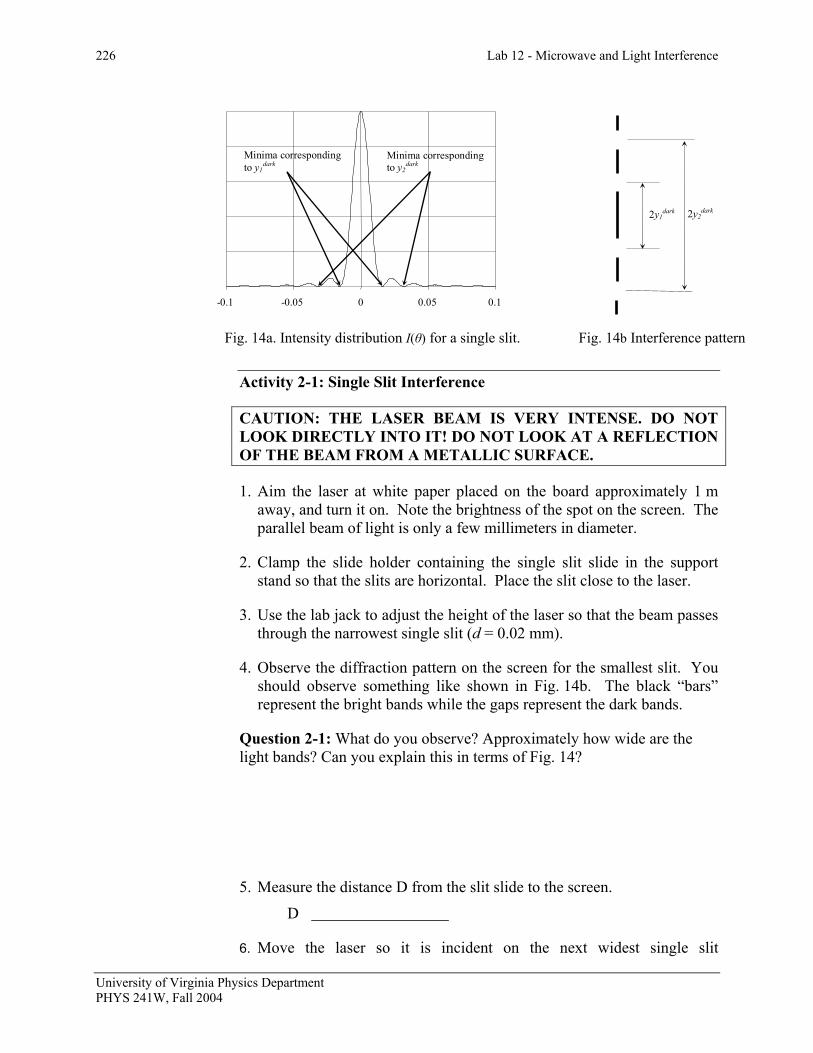
I(θ) is shown in Fig. 14a. Dark bands appear when the intensity drops to zero. It is easy to see that yn
dark correspond to such minima (since sin(θ) = y/D). Bright bands appear at the maxima of the intensity distribution. By inspection, we can see that the intensity goes to I0 as θ goes to zero (use sin(x) ≈ x for very small x). The rest of these maxima are best found through numerical methods.
Fig. 13 Diffraction by a single slit.
226 Lab 12 - Microwave and Light Interference
University of Virginia Physics Department PHYS 241W, Fall 2004
Activity 2-1: Single Slit Interference
CAUTION: THE LASER BEAM IS VERY INTENSE. DO NOT LOOK DIRECTLY INTO IT! DO NOT LOOK AT A REFLECTION OF THE BEAM FROM A METALLIC SURFACE.
1. Aim the laser at white paper placed on the board approximately 1 m away, and turn it on. Note the brightness of the spot on the screen. The parallel beam of light is only a few millimeters in diameter.
2. Clamp the slide holder containing the single slit slide in the support stand so that the slits are horizontal. Place the slit close to the laser.
3. Use the lab jack to adjust the height of the laser so that the beam passes through the narrowest single slit (d = 0.02 mm).
4. Observe the diffraction pattern on the screen for the smallest slit. You should observe something like shown in Fig. 14b. The black “bars” represent the bright bands while the gaps represent the dark bands.
Question 2-1: What do you observe? Approximately how wide are the light bands? Can you explain this in terms of Fig. 14?
5. Measure the distance D from the slit slide to the screen.
D
6. Move the laser so it is incident on the next widest single slit
-0.1 -0.05 0 0.05 0.1
Minima corresponding to y2
dark Minima corresponding to y1
dark
Fig. 14a. Intensity distribution I(θ) for a single slit. Fig. 14b Interference pattern
2y1dark 2y2
dark

Lab 12 - Microwave and Light Interference 227
University of Virginia Physics Department PHYS 241W, Fall 2004
(d = 0.04 mm). Measure the diffraction pattern for this slit. To do this, measure from the dark band on one side of the center to the dark band on the other side of the center light band (see Fig. 14). This will give you 2yn
dark. Measure for three different bands and record in Table 2-1.
Table 2-1
7. Use the values found for 2yndark to determine yn
dark and record them in Table 2-1.
Question 2-2: Use the bands and the measurements you found to find the wavelength of the laser using Eq. (2). Record the values in Table 2-1. Find the average and record below.
λ
8. Move the laser so that it is incident on the wider slits of 0.08 mm, and then on 0.16 mm. Look at the intensity pattern for each.
Question 2-3: What can you qualitatively say about how the diffraction pattern changes as the slit width goes from smaller to larger?
Question 2-4: Why do you think that the bands would get larger or smaller (depending on your answer to Question 2-3)? Why would the bands get closer together or further apart (also depending on your previous answer)?
d n 2yndark yn
dark λ
1
2 0.04 mm
3
228 Lab 12 - Microwave and Light Interference
University of Virginia Physics Department PHYS 241W, Fall 2004
THE DOUBLE SLIT
We consider now the case of two very narrow parallel slits making the following assumptions:
1. The distance d between the slits is large compared to their widths.
2. Both slits are illuminated by a plane wave e.g. light from a distant source or from a laser.
3. The incident light has a well-defined wavelength. Such light is called monochromatic, i.e. light of one color.
4. The individual slits are narrow, no more than a few hundred wavelengths wide.
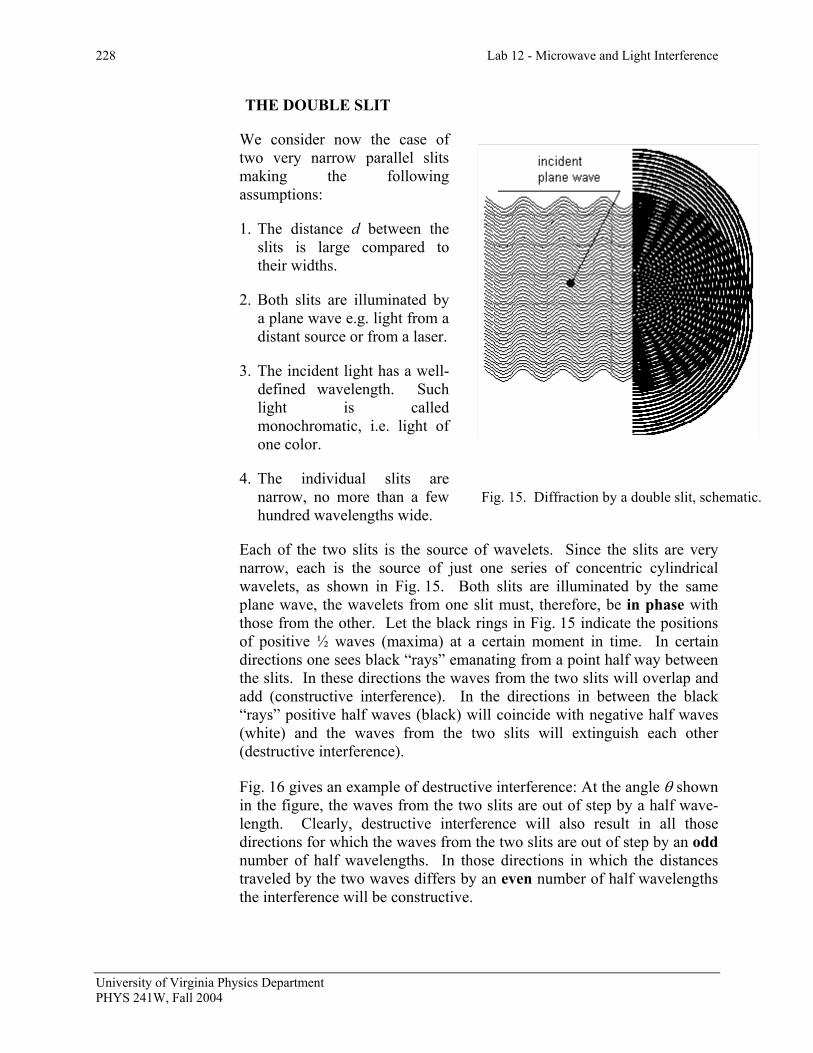
Each of the two slits is the source of wavelets. Since the slits are very narrow, each is the source of just one series of concentric cylindrical wavelets, as shown in Fig. 15. Both slits are illuminated by the same plane wave, the wavelets from one slit must, therefore, be in phase with those from the other. Let the black rings in Fig. 15 indicate the positions of positive ½ waves (maxima) at a certain moment in time. In certain directions one sees black “rays” emanating from a point half way between the slits. In these directions the waves from the two slits will overlap and add (constructive interference). In the directions in between the black “rays” positive half waves (black) will coincide with negative half waves (white) and the waves from the two slits will extinguish each other (destructive interference).
Fig. 16 gives an example of destructive interference: At the angle θ shown in the figure, the waves from the two slits are out of step by a half wave-length. Clearly, destructive interference will also result in all those directions for which the waves from the two slits are out of step by an odd number of half wavelengths. In those directions in which the distances traveled by the two waves differs by an even number of half wavelengths the interference will be constructive.
Fig. 15. Diffraction by a double slit, schematic.

Lab 12 - Microwave and Light Interference 229
University of Virginia Physics Department PHYS 241W, Fall 2004
On a screen intercepting the light, one will therefore see alternating light and dark bands. From the positions of these bands it is easy to determine the wavelength of the light. From Fig. 16 we find
sin = 2dλθ (4)
where d is the distance between the slits and λ is the wavelength. We can also note that
1tandarky = D
θ (5)
where y1dark is the distance of the first dark band from the center line and
D is the distance from the slit to the screen. From this we can obtain (for small angles tan(θ) ≈ sin(θ)) the wavelength:
1dark2y dD
λ ≈ (6)
Convince yourself that this can be generalized to
, 1,2,3,...darkn2y d n
(2n -1)Dλ ≈ = (7)
Fig. 16. Diffraction by a double slit, with details.
230 Lab 12 - Microwave and Light Interference
University of Virginia Physics Department PHYS 241W, Fall 2004
where y1dark, y2
dark, y3dark, etc. are the distances to the first, second, third,
etc. dark band from the centerline.
Activity 2-2: Multiple Slit Interference
Prediction 2-1: How do you think the slit pattern will change if you switch the single-slit slide with a slide that has two slits, if at all? How will this be related to the single slit pattern? (Hint: think of the double slit as two single slits next to each other. How will they interact?)
1. Replace the single slit slide with the multiple slit slide.
2. Make the laser light incident upon the double slit with the slide close to the laser.
Question 2-5: How is this pattern different from the single slit pattern?
3. With a pencil or pen, mark a line slightly off to the side the position of the central ray. Then mark a point right on the first four dark spots above and below the central ray position. It may be easiest to take the white paper off the board to measure the positions between the dark spots above and below the critical rays. Mark on your diagram where the distances 2y1
dark, 2y2dark, and 2y3
dark actually are. Measure them and write them down below.
2y1dark ___________________________
2y2dark ___________________________
2y3dark ___________________________
4. Use the measurements in step 4 to calculate the wavelength. Perhaps calculate λ using all three experimental values and compare them.
λ
Lab 12 - Microwave and Light Interference 231
University of Virginia Physics Department PHYS 241W, Fall 2004
Question 2-7: How well does your calculated value agree with the wavelength of the laser (632.8 nm)? Which orders should give the best results? Did you try several orders?
THE DIFFRACTION GRATING
Adding more slits of the same widths and with the same slit to slit distances will not change the positions of the light and dark bands but will make the light bands narrower and brighter. In diffraction gratings this is carried to extremes: many thousands of lines are scratched into a piece of glass or a mirror surface, giving the same effect as many thousands of slits. The “slit” to “slit” distance d is usually made very small so that for a given wavelength λ the distances yn
bright from the bright bands to the center become very large. At the same time, the thickness of the bands of monochromatic light become narrow lines. This enables one to measure the yn
bright ‘s (and hence the wavelengths) very accurately with such gratings. The order m specifies the order of the principal maxima, and m = 0 for the central beam at a scattering angle θ = 0. The first bright spot on either side of the central maxima would be m = 1 scattered at angle θ1; the next spot would be m = 2 scattered at angle θ2 and so forth.
It is therefore quite easy to calculate the wavelength of light using a diffraction grating. The wavelength is given by the equation
sin mm dλ θ= (8)
D is the distance from the diffraction grating to the screen, and the first maximum (m = 1) is observed at an angle θ1 from the central ray. Then ym
bright is the distance on the screen from the central ray to the maxima corresponding to order m. Then
tan brightm
my
Dθ = (9)
By using the two previous equations we can calculate the wavelength. Eq. (9) can be used to find θm, and then that value plugged into Eq. (8).
Activity 2-3: The Diffraction Grating
In this activity, you will use the diffraction grating to calculate the wavelength of the light.
1. Find the slide that contains the diffraction grating. Printed on the slide
232 Lab 12 - Microwave and Light Interference
University of Virginia Physics Department PHYS 241W, Fall 2004
should be the number of lines per millimeter (N). Record this value and then determine the distance d between adjacent slits 1/N.
N d
2. Measure the distance D between the diffraction grating and the screen very precisely. It should be about 15-20 cm, to allow for the band separations to be as large as possible while still being on the screen.
D 3. Shine the light from the laser through the diffraction grating and ensure
that you can measure the maxima. You probably will have to look at the first order, because the others will be off the screen. It may help to turn the grating and screen horizontal to make these measurements. Measure and record the distance from the center of one maxima to the same maxima on the other side of the central ray. Write down the order you used and the distance measured.
Order m
Distance between bright spots on either side of central spot
4. Note that the measurement you just recorded is 2ymbright.
5. Use the data that you have to calculate the wavelength of the light.
λ
Question 2-8: How well does your measured value for the He-Ne laser wavelength agree with the accepted value? Does this appear to be the best of your measurements? Explain why or why not? What do you think may have been the cause of any of your errors?
Related Documents