NOVEMBER 2011

KW Market Within A Market Report-November 2011
Mar 14, 2016
For current information on the climate of the market in Los Angeles and surrounding areas, "The KW Market Within A Market Report" brings you up-to-date on the statistics for all MLS areas. Its informative style makes it easy to keep abreast of the latest statistics in the market for you to share with your clients and other agents.
Welcome message from author
This document is posted to help you gain knowledge. Please leave a comment to let me know what you think about it! Share it to your friends and learn new things together.
Transcript
NOVEMBER 2011

BEL AIR-HOLMBY HILLS SFR
NOV. 2010 NOV. 2011 % CHANGE
Median Price $2,645,000 Median Price $2,500,000 -5.5%
Average Price per Square Foot $1,034 Average Price per Square Foot $674 -34.8%
Properties Sold 12 Properties Sold 8 -33.3%
Properties Pending Sale 13 Properties Pending Sale 19 46.2%
Properties for Sale 176 Properties for Sale 152 -13.6%
Days on Market (Pending Sale) 76 Days on Market (Pending Sale) 77 1.7%
Month’s Supply of Inventory 11.4 Month’s Supply of Inventory 5.7 -50.0%
Percent Under Contract 7.35% Percent Under Contract 12.50% 70.1%
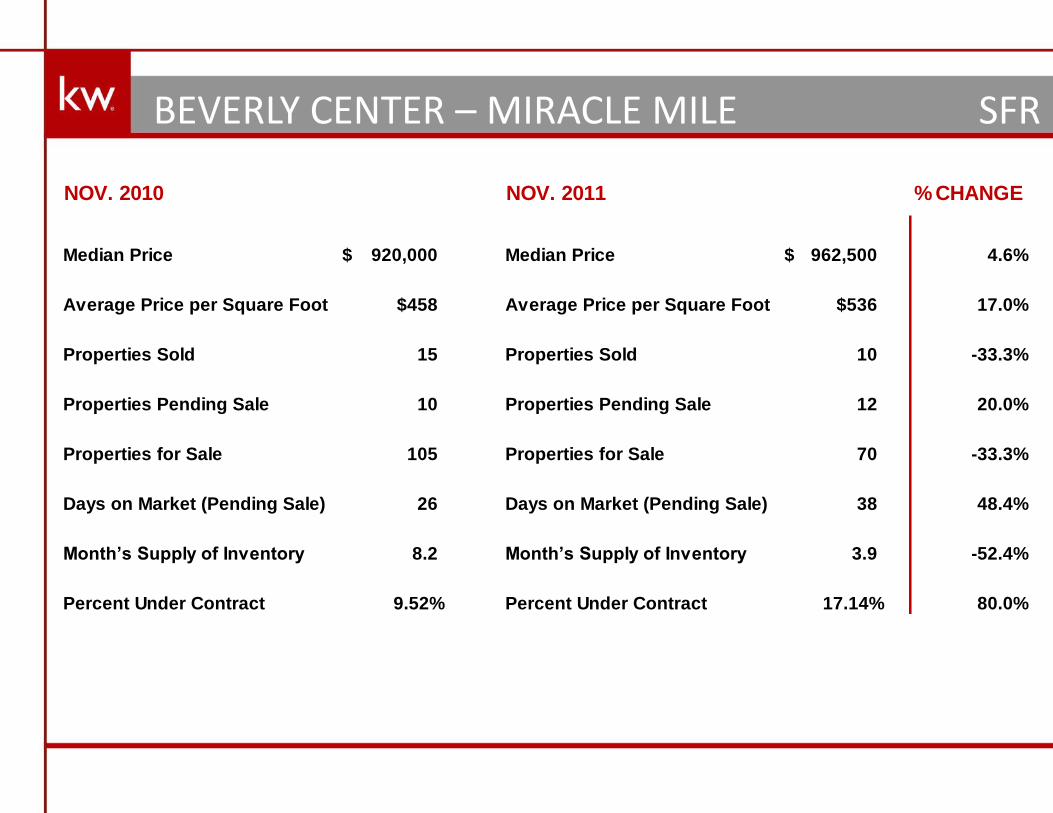
BEVERLY CENTER – MIRACLE MILE SFR
NOV. 2010 NOV. 2011 % CHANGE
Median Price 920,000$ Median Price 962,500$ 4.6%
Average Price per Square Foot $458 Average Price per Square Foot $536 17.0%
Properties Sold 15 Properties Sold 10 -33.3%
Properties Pending Sale 10 Properties Pending Sale 12 20.0%
Properties for Sale 105 Properties for Sale 70 -33.3%
Days on Market (Pending Sale) 26 Days on Market (Pending Sale) 38 48.4%
Month’s Supply of Inventory 8.2 Month’s Supply of Inventory 3.9 -52.4%
Percent Under Contract 9.52% Percent Under Contract 17.14% 80.0%

BEVERLY CENTER – MIRACLE MILE CONDO
NOV. 2010 NOV. 2011 % CHANGE
Median Price 568,000$ Median Price $420,000 -26.1%
Average Price per Square Foot $386 Average Price per Square Foot $262 -32.1%
Properties Sold 5 Properties Sold 1 -80.0%
Properties Pending Sale 7 Properties Pending Sale 5 -28.6%
Properties for Sale 63 Properties for Sale 24 -61.9%
Days on Market (Pending Sale) 62 Days on Market (Pending Sale) 14 -77.8%
Month’s Supply of Inventory 7.6 Month’s Supply of Inventory 3.2 -57.9%
Percent Under Contract 11.11% Percent Under Contract 20.83% 87.5%
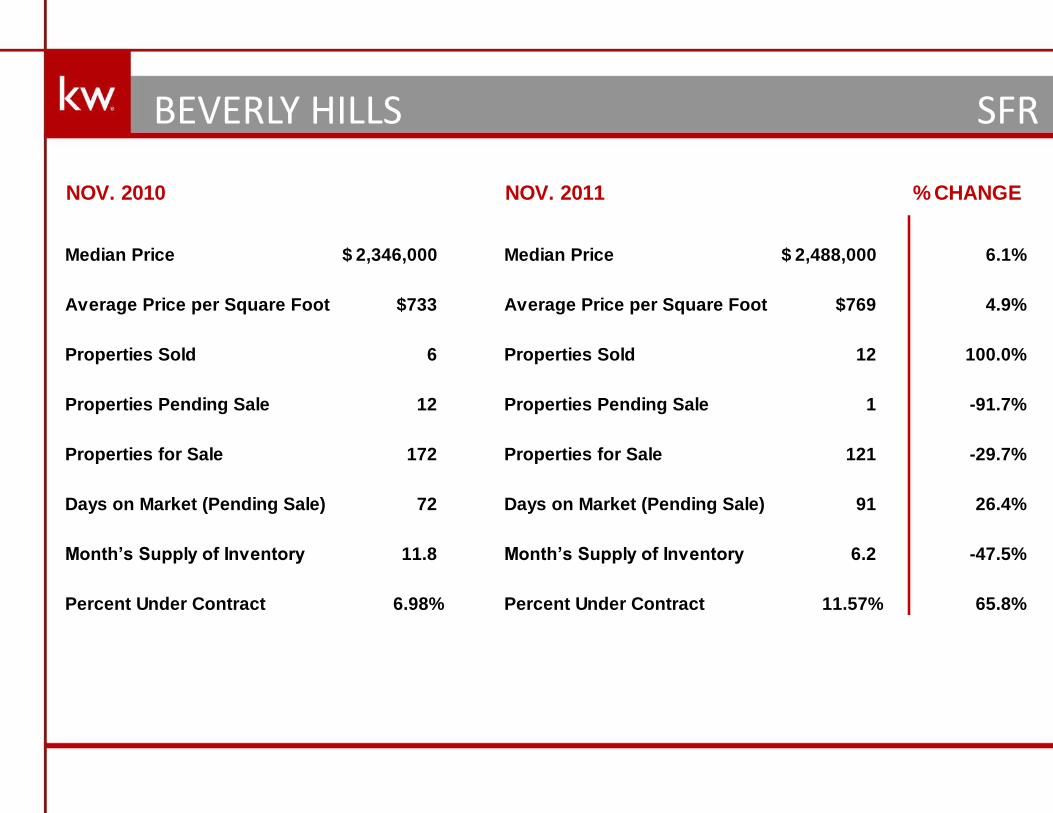
BEVERLY HILLS SFR
NOV. 2010 NOV. 2011 % CHANGE
Median Price 2,346,000$ Median Price 2,488,000$ 6.1%
Average Price per Square Foot $733 Average Price per Square Foot $769 4.9%
Properties Sold 6 Properties Sold 12 100.0%
Properties Pending Sale 12 Properties Pending Sale 1 -91.7%
Properties for Sale 172 Properties for Sale 121 -29.7%
Days on Market (Pending Sale) 72 Days on Market (Pending Sale) 91 26.4%
Month’s Supply of Inventory 11.8 Month’s Supply of Inventory 6.2 -47.5%
Percent Under Contract 6.98% Percent Under Contract 11.57% 65.8%

BEVERLY HILLS CONDO
NOV. 2010 NOV. 2011 % CHANGE
Median Price 850,000$ Median Price 675,000$ -20.6%
Average Price per Square Foot $510 Average Price per Square Foot $439 -13.9%
Properties Sold 7 Properties Sold 3 -57.1%
Properties Pending Sale 6 Properties Pending Sale 7 16.7%
Properties for Sale 105 Properties for Sale 77 -26.7%
Days on Market (Pending Sale) 156 Days on Market (Pending Sale) 161 3.3%
Month’s Supply of Inventory 15.0 Month’s Supply of Inventory 8.0 -46.7%
Percent Under Contract 5.71% Percent Under Contract 9.09% 59.2%

BEVERLY HILLS P.O. SFR
NOV. 2010 NOV. 2011 % CHANGE
Median Price 1,635,000$ Median Price 1,120,000$ -31.5%
Average Price per Square Foot $639 Average Price per Square Foot $519 -18.8%
Properties Sold 9 Properties Sold 9 0.0%
Properties Pending Sale 6 Properties Pending Sale 16 166.7%
Properties for Sale 163 Properties for Sale 161 -1.2%
Days on Market (Pending Sale) 151 Days on Market (Pending Sale) 97 -35.8%
Month’s Supply of Inventory 24.0 Month’s Supply of Inventory 7.8 -67.5%
Percent Under Contract 3.68% Percent Under Contract 9.94% 170.1%

BEVERLYWOOD SFR
NOV. 2010 NOV. 2011 % CHANGE
Median Price 817,500$ Median Price 612,000$ -25.1%
Average Price per Square Foot $484 Average Price per Square Foot $405 -16.3%
Properties Sold 12 Properties Sold 10 -16.7%
Properties Pending Sale 11 Properties Pending Sale 9 -18.2%
Properties for Sale 80 Properties for Sale 70 -12.5%
Days on Market (Pending Sale) 66 Days on Market (Pending Sale) 61 -8.1%
Month’s Supply of Inventory 5.6 Month’s Supply of Inventory 5.2 -7.1%
Percent Under Contract 13.75% Percent Under Contract 12.86% -6.5%

BRENTWOOD SFR
NOV. 2010 NOV. 2011 % CHANGE
Median Price 1,497,500$ Median Price 1,500,000$ 0.2%
Average Price per Square Foot $654 Average Price per Square Foot $588 -10.1%
Properties Sold 16 Properties Sold 13 -18.8%
Properties Pending Sale 13 Properties Pending Sale 16 23.1%
Properties for Sale 180 Properties for Sale 140 -22.2%
Days on Market (Pending Sale) 69 Days on Market (Pending Sale) 97 40.6%
Month’s Supply of Inventory 11.4 Month’s Supply of Inventory 8.8 -22.8%
Percent Under Contract 7.22% Percent Under Contract 11.43% 58.3%

BRENTWOOD CONDO
NOV. 2010 NOV. 2011 % CHANGE
Median Price 531,250$ Median Price 575,000$ 8.2%
Average Price per Square Foot $416 Average Price per Square Foot $397 -4.6%
Properties Sold 8 Properties Sold 9 12.5%
Properties Pending Sale 11 Properties Pending Sale 8 -27.3%
Properties for Sale 148 Properties for Sale 76 -48.6%
Days on Market (Pending Sale) 107 Days on Market (Pending Sale) 94 -12.5%
Month’s Supply of Inventory 11.0 Month’s Supply of Inventory 7.5 -31.8%
Percent Under Contract 7.43% Percent Under Contract 10.53% 41.7%

CHEVIOT HILLS – RANCH PARK SFR
NOV. 2010 NOV. 2011 % CHANGE
Median Price 1,200,000$ Median Price 1,300,000$ 8.3%
Average Price per Square Foot $541 Average Price per Square Foot $577 6.7%
Properties Sold 7 Properties Sold 7 0.0%
Properties Pending Sale 4 Properties Pending Sale 4 0.0%
Properties for Sale 39 Properties for Sale 39 0.0%
Days on Market (Pending Sale) 57 Days on Market (Pending Sale) 123 115.8%
Month’s Supply of Inventory 8.0 Month’s Supply of Inventory 5.7 -28.8%
Percent Under Contract 10.26% Percent Under Contract 11.11% 8.3%

CULVER CITY SFR
NOV. 2010 NOV. 2011 % CHANGE
Median Price 670,000$ Median Price 785,000$ 17.2%
Average Price per Square Foot $460 Average Price per Square Foot $411 -10.7%
Properties Sold 10 Properties Sold 10 0.0%
Properties Pending Sale 6 Properties Pending Sale 8 33.3%
Properties for Sale 60 Properties for Sale 60 0.0%
Days on Market (Pending Sale) 71 Days on Market (Pending Sale) 47 -32.8%
Month’s Supply of Inventory 8.2 Month’s Supply of Inventory 4.5 -45.1%
Percent Under Contract 10.00% Percent Under Contract 13.33% 33.3%

HANCOCK PARK – WILSHIRE SFR
NOV. 2010 NOV. 2011 % CHANGE
Median Price 848,000$ Median Price 728,000$ -14.2%
Average Price per Square Foot $446 Average Price per Square Foot $381 -14.6%
Properties Sold 16 Properties Sold 11 -31.3%
Properties Pending Sale 14 Properties Pending Sale 22 57.1%
Properties for Sale 147 Properties for Sale 123 -16.3%
Days on Market (Pending Sale) 57 Days on Market (Pending Sale) 64 11.7%
Month’s Supply of Inventory 8.3 Month’s Supply of Inventory 4.1 -50.6%
Percent Under Contract 9.52% Percent Under Contract 17.89% 87.9%

HOLLYWOOD SFR
NOV. 2010 NOV. 2011 % CHANGE
Median Price 530,000$ Median Price 292,500$ -44.8%
Average Price per Square Foot $490 Average Price per Square Foot $204 -58.4%
Properties Sold 1 Properties Sold 2 100.0%
Properties Pending Sale 2 Properties Pending Sale 7 250.0%
Properties for Sale 22 Properties for Sale 26 18.2%
Days on Market (Pending Sale) 138 Days on Market (Pending Sale) 38 -72.8%
Month’s Supply of Inventory 9.0 Month’s Supply of Inventory 1.9 -78.9%
Percent Under Contract 9.09% Percent Under Contract 26.92% 196.1%

HOLLYWOOD CONDO
NOV. 2010 NOV. 2011 % CHANGE
Median Price 532,500$ Median Price 413,500$ -22.3%
Average Price per Square Foot $358 Average Price per Square Foot $362 1.1%
Properties Sold 5 Properties Sold 12 140.0%
Properties Pending Sale 5 Properties Pending Sale 12 140.0%
Properties for Sale 104 Properties for Sale 69 -33.7%
Days on Market (Pending Sale) 21 Days on Market (Pending Sale) 15 -31.1%
Month’s Supply of Inventory 18.4 Month’s Supply of Inventory 4.3 -76.6%
Percent Under Contract 4.81% Percent Under Contract 17.39% 261.5%

HOLLYWOOD HILLS EAST SFR
NOV. 2010 NOV. 2011 % CHANGE
Median Price 815,000$ Median Price 850,000$ 4.3%
Average Price per Square Foot $467 Average Price per Square Foot $334 -28.5%
Properties Sold 6 Properties Sold 6 0.0%
Properties Pending Sale 10 Properties Pending Sale 14 40.0%
Properties for Sale 104 Properties for Sale 77 -26.0%
Days on Market (Pending Sale) 63 Days on Market (Pending Sale) 67 6.3%
Month’s Supply of Inventory 8.4 Month’s Supply of Inventory 3.5 -58.3%
Percent Under Contract 9.62% Percent Under Contract 18.18% 89.0%

LOS FELIZ SFR
NOV. 2010 NOV. 2011 % CHANGE
Median Price 932,500$ Median Price 675,000$ -27.6%
Average Price per Square Foot $501 Average Price per Square Foot $404 -19.4%
Properties Sold 13 Properties Sold 15 15.4%
Properties Pending Sale 10 Properties Pending Sale 18 80.0%
Properties for Sale 102 Properties for Sale 97 -4.9%
Days on Market (Pending Sale) 43 Days on Market (Pending Sale) 57 33.5%
Month’s Supply of Inventory 8.0 Month’s Supply of Inventory 3.7 -53.8%
Percent Under Contract 9.80% Percent Under Contract 18.56% 89.4%

MALIBU SFR
NOV. 2010 NOV. 2011 % CHANGE
Median Price 1,375,000$ Median Price 950,000$ -30.9%
Average Price per Square Foot $471 Average Price per Square Foot $589 25.1%
Properties Sold 9 Properties Sold 7 -22.2%
Properties Pending Sale 6 Properties Pending Sale 16 166.7%
Properties for Sale 277 Properties for Sale 233 -15.9%
Days on Market (Pending Sale) 62 Days on Market (Pending Sale) 151 143.9%
Month’s Supply of Inventory 41.3 Month’s Supply of Inventory 11.5 -72.2%
Percent Under Contract 2.17% Percent Under Contract 6.87% 216.6%

MALIBU BEACH SFR
NOV. 2010 NOV. 2011 % CHANGE
Median Price 3,688,000$ Median Price 8,500,000 n/a
Average Price per Square Foot $1,229 Average Price per Square Foot 1,445 n/a
Properties Sold 2 Properties Sold 2 n/a
Properties Pending Sale 1 Properties Pending Sale 2 100.0%
Properties for Sale 95 Properties for Sale 104 9.5%
Days on Market (Pending Sale) 319 Days on Market (Pending Sale) 115 -63.9%
Month’s Supply of Inventory 91.0 Month’s Supply of Inventory 44.0 -51.6%
Percent Under Contract 1.02% Percent Under Contract 1.92% 88.2%
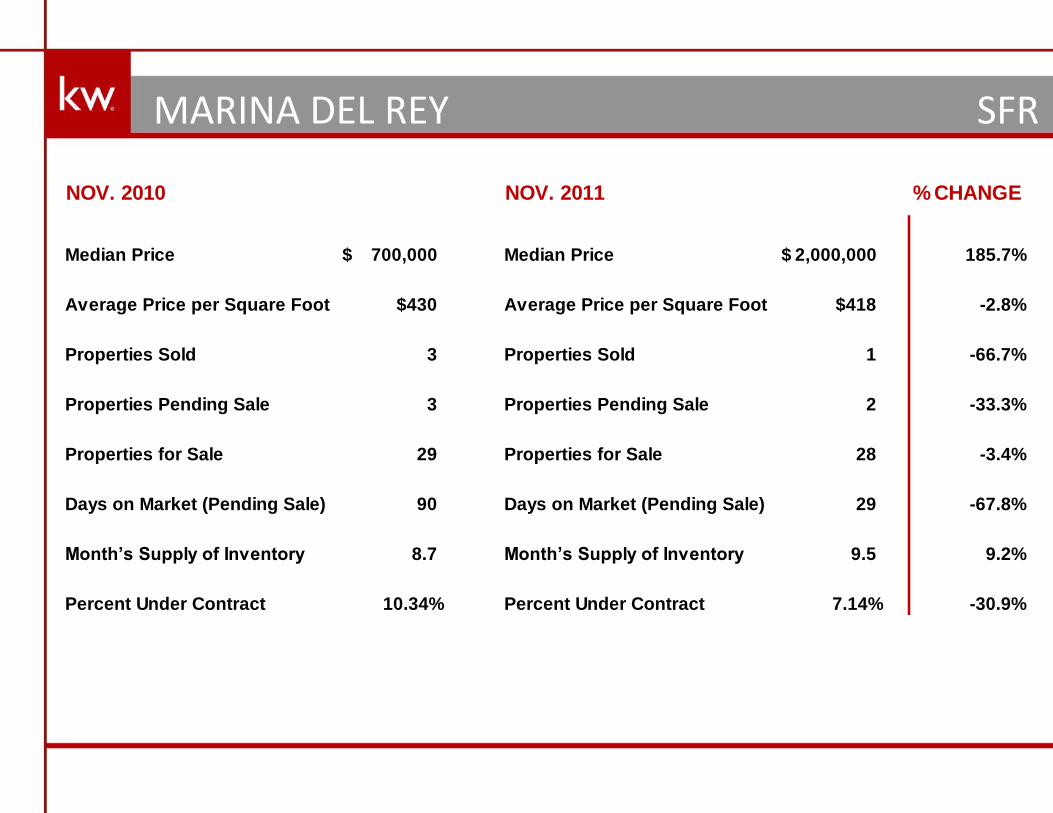
MARINA DEL REY SFR
NOV. 2010 NOV. 2011 % CHANGE
Median Price 700,000$ Median Price 2,000,000$ 185.7%
Average Price per Square Foot $430 Average Price per Square Foot $418 -2.8%
Properties Sold 3 Properties Sold 1 -66.7%
Properties Pending Sale 3 Properties Pending Sale 2 -33.3%
Properties for Sale 29 Properties for Sale 28 -3.4%
Days on Market (Pending Sale) 90 Days on Market (Pending Sale) 29 -67.8%
Month’s Supply of Inventory 8.7 Month’s Supply of Inventory 9.5 9.2%
Percent Under Contract 10.34% Percent Under Contract 7.14% -30.9%

MARINA DEL REY CONDO
NOV. 2010 NOV. 2011 % CHANGE
Median Price 647,500$ Median Price 571,500$ -11.7%
Average Price per Square Foot $484 Average Price per Square Foot $355 -26.7%
Properties Sold 18 Properties Sold 11 -38.9%
Properties Pending Sale 14 Properties Pending Sale 14 0.0%
Properties for Sale 216 Properties for Sale 153 -29.2%
Days on Market (Pending Sale) 129 Days on Market (Pending Sale) 62 -51.8%
Month’s Supply of Inventory 13.9 Month’s Supply of Inventory 8.7 -37.4%
Percent Under Contract 6.48% Percent Under Contract 9.15% 41.2%

MID LOS ANGELES SFR
NOV. 2010 NOV. 2011 % CHANGE
Median Price 326,500$ Median Price 309,000$ -5.4%
Average Price per Square Foot $217 Average Price per Square Foot $212 -2.3%
Properties Sold 14 Properties Sold 21 50.0%
Properties Pending Sale 21 Properties Pending Sale 19 -9.5%
Properties for Sale 160 Properties for Sale 87 -45.6%
Days on Market (Pending Sale) 69 Days on Market (Pending Sale) 63 -8.7%
Month’s Supply of Inventory 5.9 Month’s Supply of Inventory 3.3 -44.1%
Percent Under Contract 13.12% Percent Under Contract 21.84% 66.5%

MID WILSHIRE SFR
NOV. 2010 NOV. 2011 % CHANGE
Median Price 180,000$ Median Price 234,900$ 30.5%
Average Price per Square Foot $238 Average Price per Square Foot $165 -30.7%
Properties Sold 1 Properties Sold 1 0.0%
Properties Pending Sale 2 Properties Pending Sale 5 150.0%
Properties for Sale 46 Properties for Sale 19 -58.7%
Days on Market (Pending Sale) 37 Days on Market (Pending Sale) 29 -20.5%
Month’s Supply of Inventory 19.0 Month’s Supply of Inventory 2.4 -87.4%
Percent Under Contract 4.35% Percent Under Contract 26.32% 505.1%
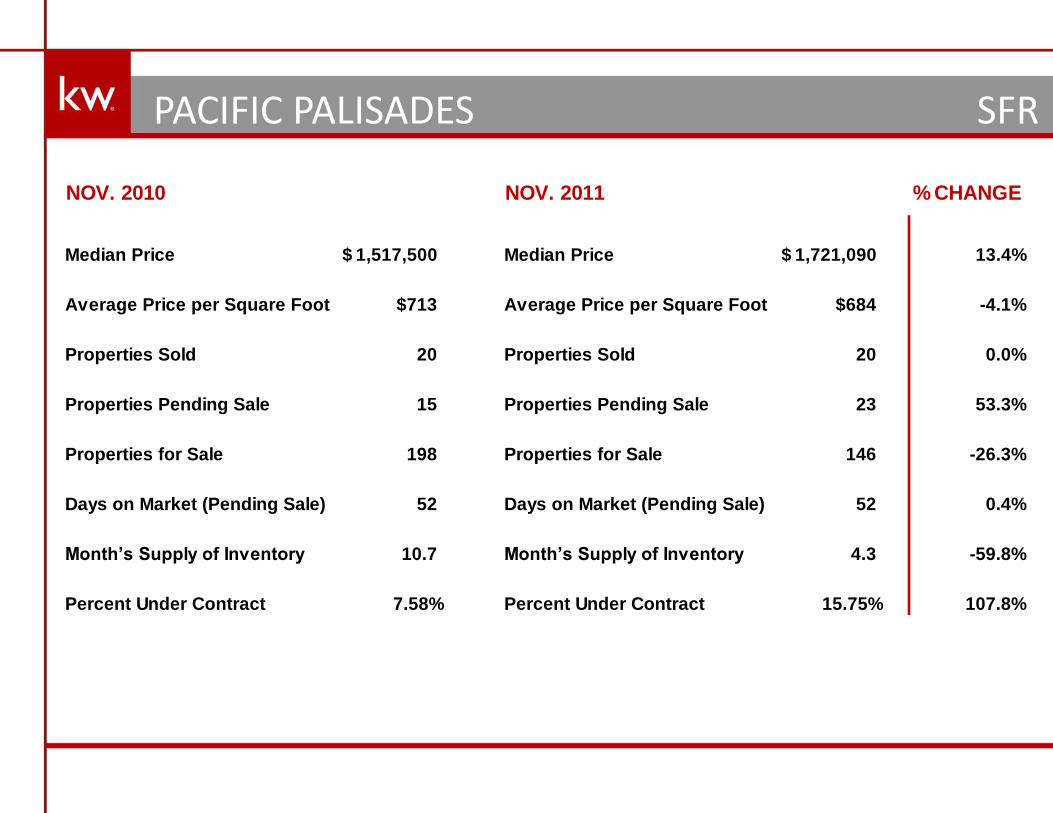
PACIFIC PALISADES SFR
NOV. 2010 NOV. 2011 % CHANGE
Median Price 1,517,500$ Median Price 1,721,090$ 13.4%
Average Price per Square Foot $713 Average Price per Square Foot $684 -4.1%
Properties Sold 20 Properties Sold 20 0.0%
Properties Pending Sale 15 Properties Pending Sale 23 53.3%
Properties for Sale 198 Properties for Sale 146 -26.3%
Days on Market (Pending Sale) 52 Days on Market (Pending Sale) 52 0.4%
Month’s Supply of Inventory 10.7 Month’s Supply of Inventory 4.3 -59.8%
Percent Under Contract 7.58% Percent Under Contract 15.75% 107.8%
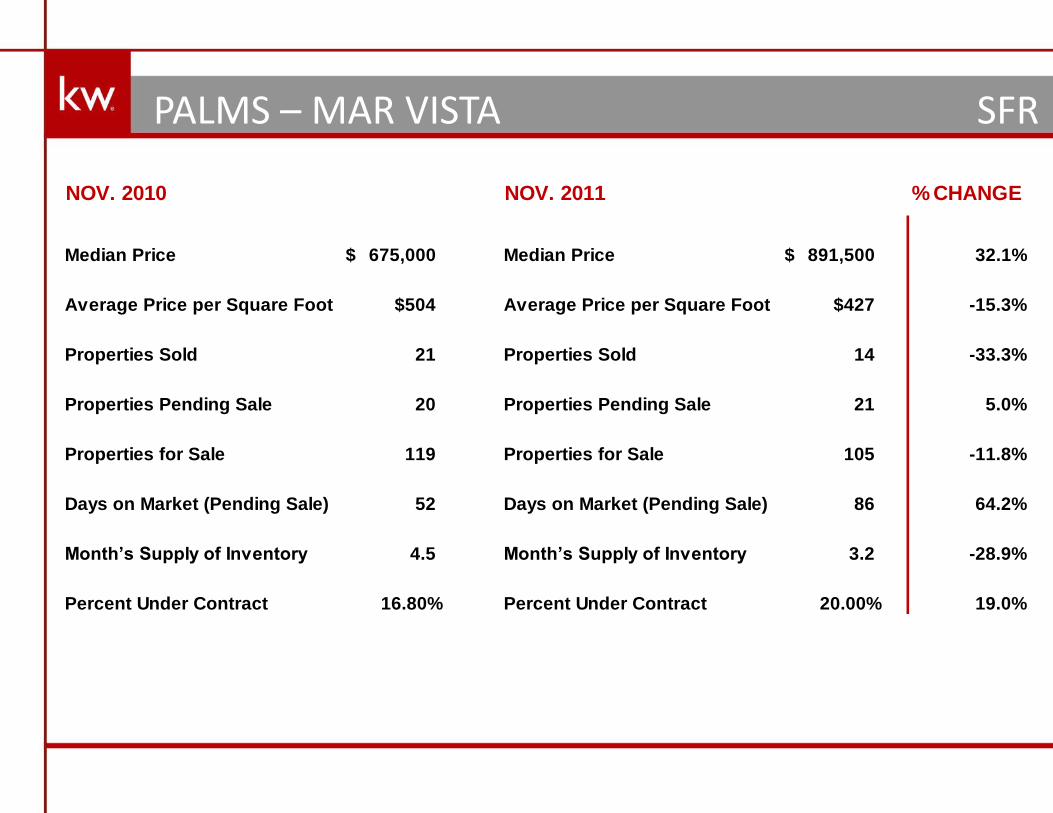
PALMS – MAR VISTA SFR
NOV. 2010 NOV. 2011 % CHANGE
Median Price 675,000$ Median Price 891,500$ 32.1%
Average Price per Square Foot $504 Average Price per Square Foot $427 -15.3%
Properties Sold 21 Properties Sold 14 -33.3%
Properties Pending Sale 20 Properties Pending Sale 21 5.0%
Properties for Sale 119 Properties for Sale 105 -11.8%
Days on Market (Pending Sale) 52 Days on Market (Pending Sale) 86 64.2%
Month’s Supply of Inventory 4.5 Month’s Supply of Inventory 3.2 -28.9%
Percent Under Contract 16.80% Percent Under Contract 20.00% 19.0%

SANTA MONICA SFR
NOV. 2010 NOV. 2011 % CHANGE
Median Price 1,075,000$ Median Price 1,640,000$ 52.6%
Average Price per Square Foot $615 Average Price per Square Foot $734 19.3%
Properties Sold 21 Properties Sold 13 -38.1%
Properties Pending Sale 15 Properties Pending Sale 18 20.0%
Properties for Sale 132 Properties for Sale 113 -14.4%
Days on Market (Pending Sale) 70 Days on Market (Pending Sale) 76 8.0%
Month’s Supply of Inventory 7.2 Month’s Supply of Inventory 4.5 -37.5%
Percent Under Contract 11.36% Percent Under Contract 15.93% 40.2%
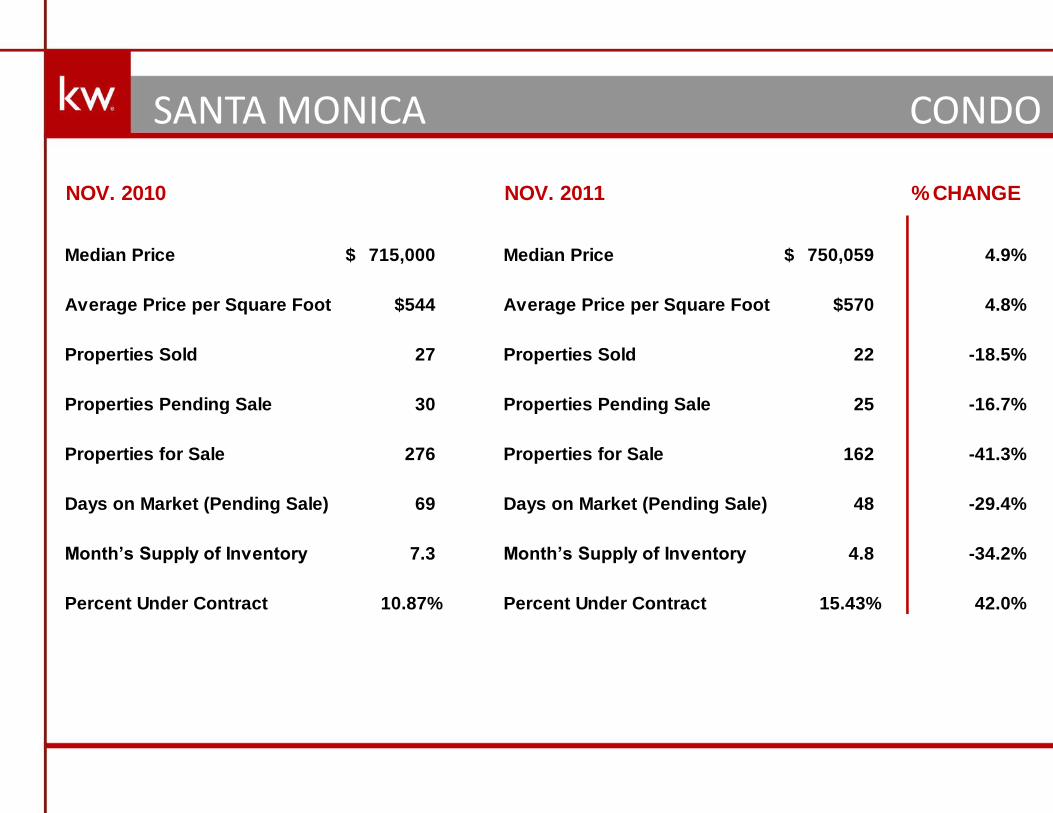
SANTA MONICA CONDO
NOV. 2010 NOV. 2011 % CHANGE
Median Price 715,000$ Median Price 750,059$ 4.9%
Average Price per Square Foot $544 Average Price per Square Foot $570 4.8%
Properties Sold 27 Properties Sold 22 -18.5%
Properties Pending Sale 30 Properties Pending Sale 25 -16.7%
Properties for Sale 276 Properties for Sale 162 -41.3%
Days on Market (Pending Sale) 69 Days on Market (Pending Sale) 48 -29.4%
Month’s Supply of Inventory 7.3 Month’s Supply of Inventory 4.8 -34.2%
Percent Under Contract 10.87% Percent Under Contract 15.43% 42.0%

SILVERLAKE – ECHO PARK SFR
NOV. 2010 NOV. 2011 % CHANGE
Median Price 765,000$ Median Price 637,000$ -16.7%
Average Price per Square Foot $443 Average Price per Square Foot $382 -13.8%
Properties Sold 11 Properties Sold 18 63.6%
Properties Pending Sale 15 Properties Pending Sale 18 20.0%
Properties for Sale 105 Properties for Sale 86 -18.1%
Days on Market (Pending Sale) 55 Days on Market (Pending Sale) 70 26.8%
Month’s Supply of Inventory 5.7 Month’s Supply of Inventory 3.1 -45.6%
Percent Under Contract 14.29% Percent Under Contract 20.93% 46.5%

STUDIO CITY SFR
NOV. 2010 NOV. 2011 % CHANGE
Median Price 659,500$ Median Price 1,125,568$ 70.7%
Average Price per Square Foot $1,034 Average Price per Square Foot $674 -34.8%
Properties Sold 12 Properties Sold 8 -33.3%
Properties Pending Sale 13 Properties Pending Sale 19 46.2%
Properties for Sale 176 Properties for Sale 152 -13.6%
Days on Market (Pending Sale) 76 Days on Market (Pending Sale) 77 1.7%
Month’s Supply of Inventory 11.4 Month’s Supply of Inventory 5.7 -50.0%
Percent Under Contract 7.35% Percent Under Contract 12.50% 70.1%
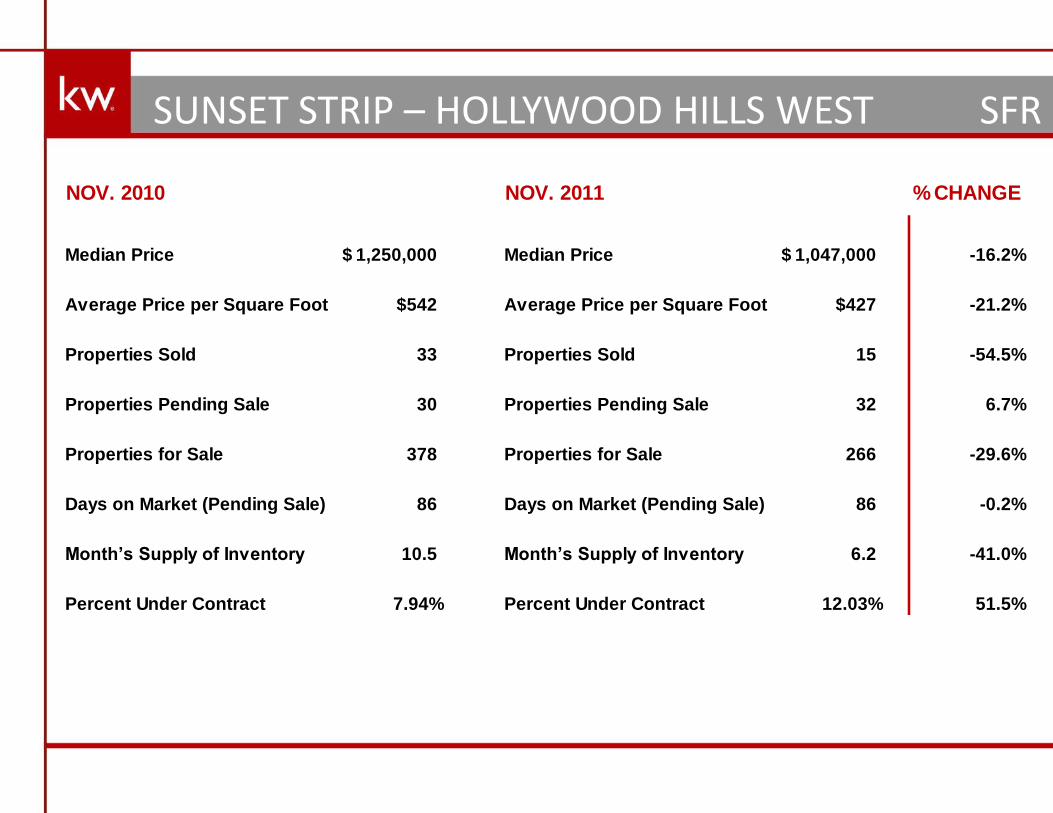
SUNSET STRIP – HOLLYWOOD HILLS WEST SFR
NOV. 2010 NOV. 2011 % CHANGE
Median Price 1,250,000$ Median Price 1,047,000$ -16.2%
Average Price per Square Foot $542 Average Price per Square Foot $427 -21.2%
Properties Sold 33 Properties Sold 15 -54.5%
Properties Pending Sale 30 Properties Pending Sale 32 6.7%
Properties for Sale 378 Properties for Sale 266 -29.6%
Days on Market (Pending Sale) 86 Days on Market (Pending Sale) 86 -0.2%
Month’s Supply of Inventory 10.5 Month’s Supply of Inventory 6.2 -41.0%
Percent Under Contract 7.94% Percent Under Contract 12.03% 51.5%

SUNSET STRIP – HOLLYWOOD HILLS WEST CONDO
NOV. 2010 NOV. 2011 % CHANGE
Median Price 288,000$ Median Price 510,500$ 77.3%
Average Price per Square Foot $362 Average Price per Square Foot $378 4.4%
Properties Sold 3 Properties Sold 6 100.0%
Properties Pending Sale 1 Properties Pending Sale 7 600.0%
Properties for Sale 62 Properties for Sale 35 -43.5%
Days on Market (Pending Sale) 125 Days on Market (Pending Sale) 112 -10.7%
Month’s Supply of Inventory 56.0 Month’s Supply of Inventory 3.6 -93.6%
Percent Under Contract 1.61% Percent Under Contract 20.00% 1142.2%

VENICE SFR
NOV. 2010 NOV. 2011 % CHANGE
Median Price 1,335,000$ Median Price 992,500$ -25.7%
Average Price per Square Foot $695 Average Price per Square Foot $653 -6.0%
Properties Sold 14 Properties Sold 10 -28.6%
Properties Pending Sale 12 Properties Pending Sale 14 16.7%
Properties for Sale 146 Properties for Sale 92 -37.0%
Days on Market (Pending Sale) 51 Days on Market (Pending Sale) 66 29.4%
Month’s Supply of Inventory 9.8 Month’s Supply of Inventory 4.6 -53.1%
Percent Under Contract 8.22% Percent Under Contract 15.22% 85.2%

WEST HOLLYWOOD SFR
NOV. 2010 NOV. 2011 % CHANGE
Median Price 745,000$ Median Price 761,250$ 2.2%
Average Price per Square Foot $545 Average Price per Square Foot $658 20.7%
Properties Sold 5 Properties Sold 8 60.0%
Properties Pending Sale 6 Properties Pending Sale 14 133.3%
Properties for Sale 69 Properties for Sale 59 -14.5%
Days on Market (Pending Sale) 58 Days on Market (Pending Sale) 50 -13.8%
Month’s Supply of Inventory 9.8 Month’s Supply of Inventory 2.7 -72.4%
Percent Under Contract 8.70% Percent Under Contract 23.73% 172.8%

WEST HOLLYWOOD CONDO
NOV. 2010 NOV. 2011 % CHANGE
Median Price 482,000$ Median Price 420,000$ -12.9%
Average Price per Square Foot $421 Average Price per Square Foot $372 -11.6%
Properties Sold 20 Properties Sold 23 15.0%
Properties Pending Sale 22 Properties Pending Sale 34 54.5%
Properties for Sale 278 Properties for Sale 195 -29.9%
Days on Market (Pending Sale) 106 Days on Market (Pending Sale) 76 -28.3%
Month’s Supply of Inventory 10.8 Month’s Supply of Inventory 3.9 -63.9%
Percent Under Contract 7.91% Percent Under Contract 17.44% 120.5%
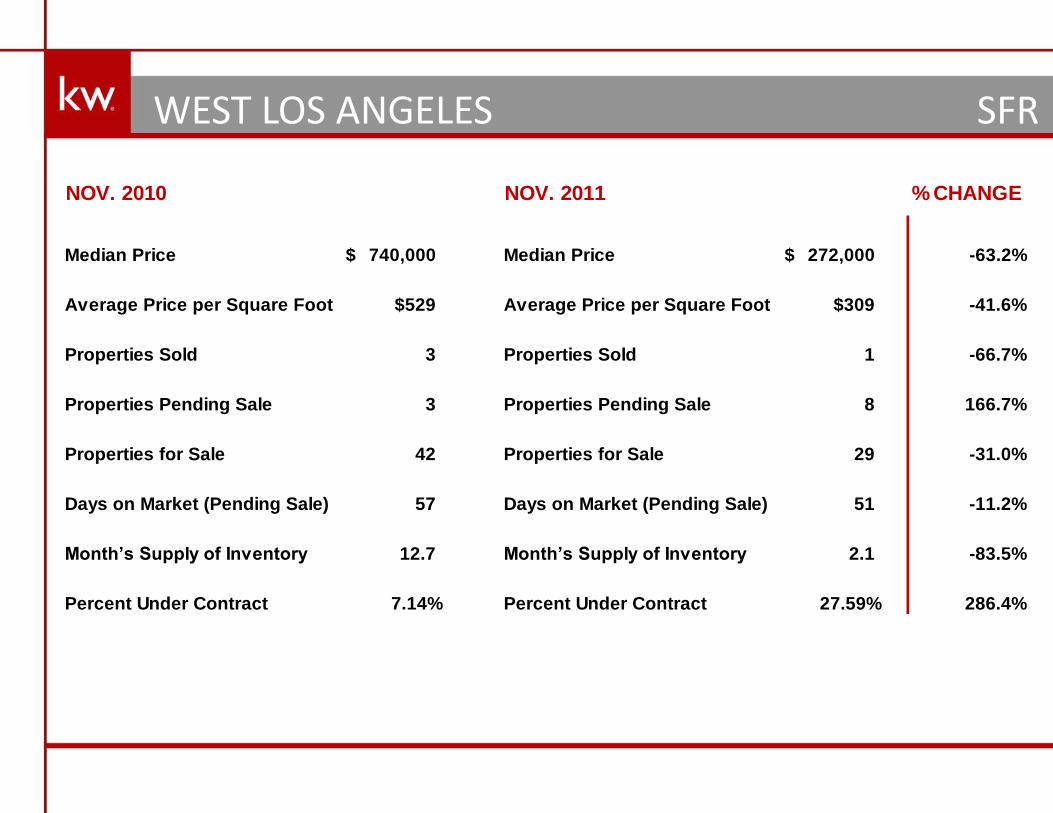
WEST LOS ANGELES SFR
NOV. 2010 NOV. 2011 % CHANGE
Median Price 740,000$ Median Price 272,000$ -63.2%
Average Price per Square Foot $529 Average Price per Square Foot $309 -41.6%
Properties Sold 3 Properties Sold 1 -66.7%
Properties Pending Sale 3 Properties Pending Sale 8 166.7%
Properties for Sale 42 Properties for Sale 29 -31.0%
Days on Market (Pending Sale) 57 Days on Market (Pending Sale) 51 -11.2%
Month’s Supply of Inventory 12.7 Month’s Supply of Inventory 2.1 -83.5%
Percent Under Contract 7.14% Percent Under Contract 27.59% 286.4%

WESTWOOD – CENTURY CITY SFR
NOV. 2010 NOV. 2011 % CHANGE
Median Price 1,459,000$ Median Price 1,452,500$ -0.4%
Average Price per Square Foot $602 Average Price per Square Foot $535 -11.1%
Properties Sold 11 Properties Sold 6 -45.5%
Properties Pending Sale 20 Properties Pending Sale 17 -15.0%
Properties for Sale 93 Properties for Sale 75 -19.4%
Days on Market (Pending Sale) 53 Days on Market (Pending Sale) 57 6.8%
Month’s Supply of Inventory 3.2 Month’s Supply of Inventory 2.7 -15.6%
Percent Under Contract 21.51% Percent Under Contract 22.67% 5.4%
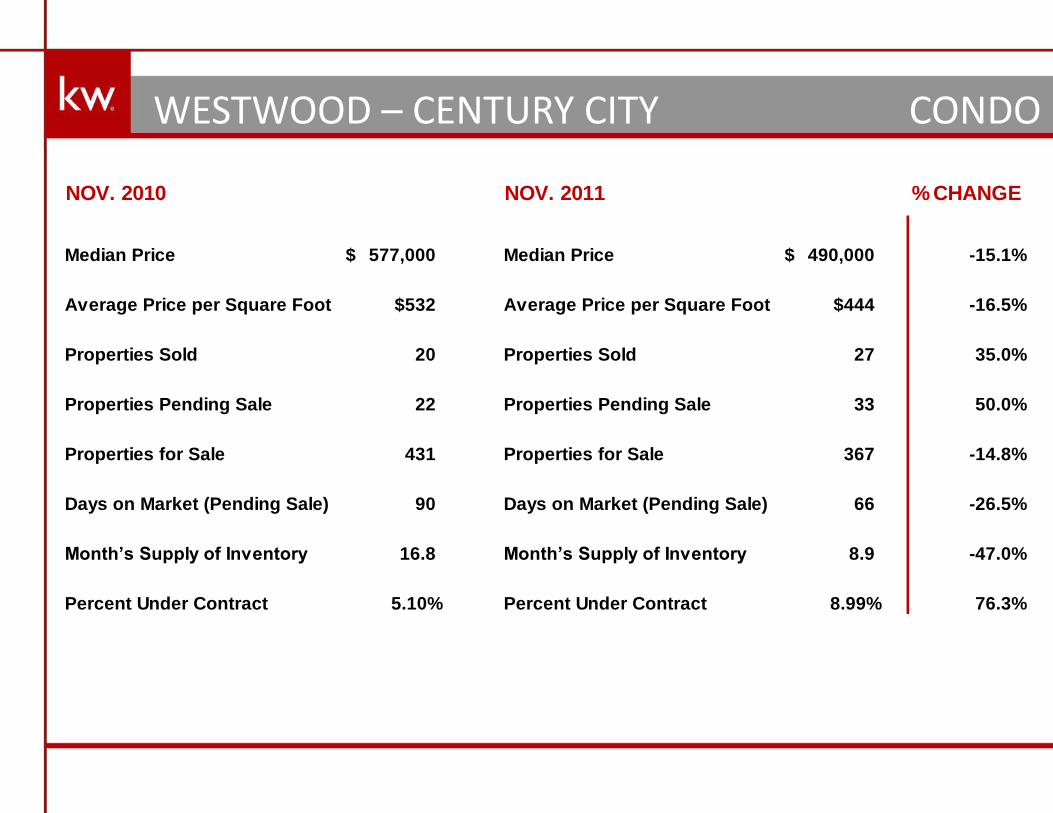
WESTWOOD – CENTURY CITY CONDO
NOV. 2010 NOV. 2011 % CHANGE
Median Price 577,000$ Median Price 490,000$ -15.1%
Average Price per Square Foot $532 Average Price per Square Foot $444 -16.5%
Properties Sold 20 Properties Sold 27 35.0%
Properties Pending Sale 22 Properties Pending Sale 33 50.0%
Properties for Sale 431 Properties for Sale 367 -14.8%
Days on Market (Pending Sale) 90 Days on Market (Pending Sale) 66 -26.5%
Month’s Supply of Inventory 16.8 Month’s Supply of Inventory 8.9 -47.0%
Percent Under Contract 5.10% Percent Under Contract 8.99% 76.3%
Related Documents