81 Lampiran I Kuesioner Penelitian Pengaruh Relationship Marketing Terhadap Kepuasan dan Loyalitas PT. Telkomsel Branch Malang KUESIONER PENELITIAN Responden yang terhormat, Dalam rangka penyusunan jurnal yang menjadi salah satu syarat untuk menyelesaikan Progam Sarjana S1 pada STIE Malangkuçeçwara saya memperkenalkan diri Nama : Siska Bertua Simorangkir NPK : K.2017.1.34298 Jurusan : Manajemen Pemasaran Jika Bpk/Ibu adalah mahasiswa Malang Raya (Kota Malang, Kab. Malang, Kota Batu) yang memakai layanan Telkomsel Sy memohon bantuannya utk bersedia mengisi kuesioner penelitian saya terkait "PENGARUH RELATIONSHIP MARKETING TERHADAP KEPUASAN DAN LOYALITAS CUSTOMER DALAM PENGGUNAAN PROGRAM/LAYANAN TELKOMSEL PADA MAHASISWA YANG ADA DI MALANG RAYA” Durasi pengisian kuesioner sekitat 5-10 menit. Bagi 2 (dua) responden yg terpilih, saya akan memberikan hadiah sbg tanda terima kasih saya berupa saldo GOpay atau OVO senilai Rp20.000 Atas kesediannya, sy ucapkan terima kasih PETUNJUK PENGISIAN KUESIONER 1. Saudara/saudari diminta untuk memberikan tanggapan/respon terhadap pernyataan yang kami buat dengan mengisi kuisoner pada kolom yang tersedia dan pilih yang sesuai dengan keadaan sebenarnya. Ada lima alternatif jawaban, yaitu: • 1 = Sangat Tidak Setuju (STS) • 2 = Tidak Setuju (TS) • 3 = Cukup Setuju (CS) • 4 = Setuju (S) • 5 = Sangat Setuju (SS)

Welcome message from author
This document is posted to help you gain knowledge. Please leave a comment to let me know what you think about it! Share it to your friends and learn new things together.
Transcript
81
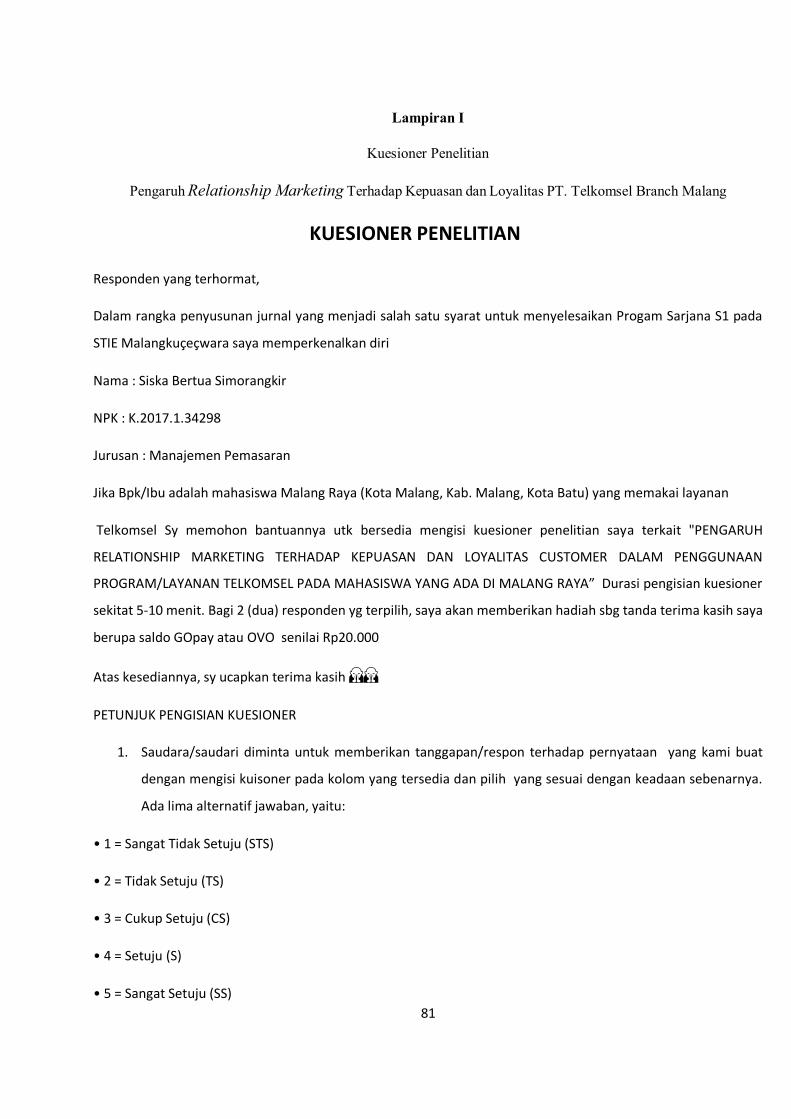
Lampiran I
Kuesioner Penelitian
Pengaruh Relationship Marketing Terhadap Kepuasan dan Loyalitas PT. Telkomsel Branch Malang
KUESIONER PENELITIAN
Responden yang terhormat,
Dalam rangka penyusunan jurnal yang menjadi salah satu syarat untuk menyelesaikan Progam Sarjana S1 pada
STIE Malangkuçeçwara saya memperkenalkan diri
Nama : Siska Bertua Simorangkir
NPK : K.2017.1.34298
Jurusan : Manajemen Pemasaran
Jika Bpk/Ibu adalah mahasiswa Malang Raya (Kota Malang, Kab. Malang, Kota Batu) yang memakai layanan
Telkomsel Sy memohon bantuannya utk bersedia mengisi kuesioner penelitian saya terkait "PENGARUH
RELATIONSHIP MARKETING TERHADAP KEPUASAN DAN LOYALITAS CUSTOMER DALAM PENGGUNAAN
PROGRAM/LAYANAN TELKOMSEL PADA MAHASISWA YANG ADA DI MALANG RAYA” Durasi pengisian kuesioner
sekitat 5-10 menit. Bagi 2 (dua) responden yg terpilih, saya akan memberikan hadiah sbg tanda terima kasih saya
berupa saldo GOpay atau OVO senilai Rp20.000
Atas kesediannya, sy ucapkan terima kasih 🙏🙏
PETUNJUK PENGISIAN KUESIONER
1. Saudara/saudari diminta untuk memberikan tanggapan/respon terhadap pernyataan yang kami buat
dengan mengisi kuisoner pada kolom yang tersedia dan pilih yang sesuai dengan keadaan sebenarnya.
Ada lima alternatif jawaban, yaitu:
• 1 = Sangat Tidak Setuju (STS)
• 2 = Tidak Setuju (TS)
• 3 = Cukup Setuju (CS)
• 4 = Setuju (S)
• 5 = Sangat Setuju (SS)

82
.IDENTITAS UMUM
Nama :
Jenis Kelamin :
Laki-laki
Perempuan
Umur :
17 tahun
18 tahun
19 tahun
20 tahun
21 tahun
Tingkat pendidikan :
SMA/SMK
Diploma/Akademi
S1
Lainya....
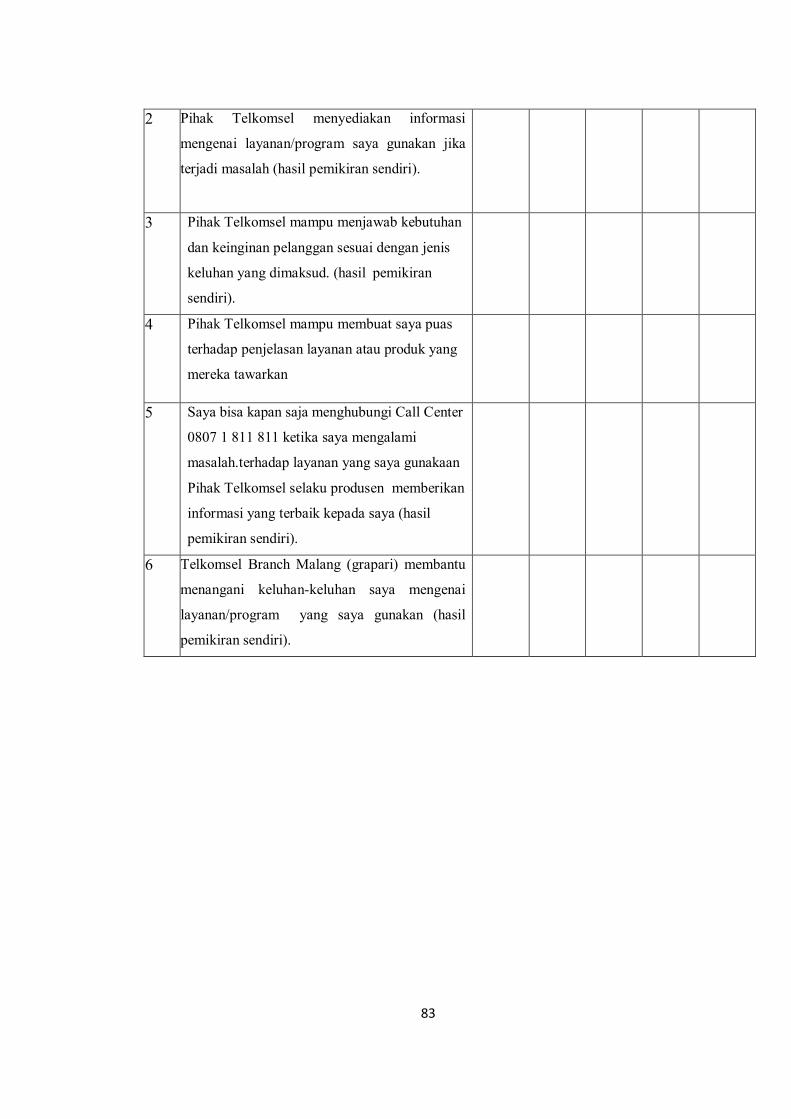
Relationship Marketing
No
Pernyataan
Alternatif Jawaban
STS T
S
N S S
S
1 Pihak Telkomsel selalu memberikan
penjelasan kepada saya secara jelas dapat
diterima dan dimengerti. (hasil pemikiran
sendiri)
83
2 Pihak Telkomsel menyediakan informasi
mengenai layanan/program saya gunakan jika
terjadi masalah (hasil pemikiran sendiri).
3 Pihak Telkomsel mampu menjawab kebutuhan
dan keinginan pelanggan sesuai dengan jenis
keluhan yang dimaksud. (hasil pemikiran
sendiri).
4 Pihak Telkomsel mampu membuat saya puas
terhadap penjelasan layanan atau produk yang
mereka tawarkan
5 Saya bisa kapan saja menghubungi Call Center
0807 1 811 811 ketika saya mengalami
masalah.terhadap layanan yang saya gunakaan
Pihak Telkomsel selaku produsen memberikan
informasi yang terbaik kepada saya (hasil
pemikiran sendiri).
6 Telkomsel Branch Malang (grapari) membantu
menangani keluhan-keluhan saya mengenai
layanan/program yang saya gunakan (hasil
pemikiran sendiri).

84
Kepuasan konsumen
No
Pernyataan
Alternatif Jawaban
STS T
S
N S S
S
1 Pihak Telkomsel selaku produsen
memberikan ganti rugi atas pelayanan
yang tidak sesuai dengan kepuasan
pelanggan
2 Pihak Telkomsel memberikan bonus sms gratis
dan juga bonus bicara (Talk Mania) bagi
pengguna kartu prabayar simpati atau bonus
internet untuk programlainnya
3 Pihak Telkomsel selaku produsen senantiasa
memberikan pemberitahuan atas perubahan tarif
layanan/program yang sedang di gunakan
4 Telkomsel bisa memenuhi harapan atas layanan
dan program yang disediakan Telkomsel (hasil
pemikiran sendiri)
5 Telkomsel selaku produsen memiliki
karyawan yang jujur, benar dan mempunyai
integritas yang tinggi (Andis, 2007)
6 Sebagai pengguna layanan dan program
telkomssel saya percaya pihak Telkomsel akan
memenuhi janjinya (hasil pemikiran sendiri).
7 Program dan layanan telah sesuai dengan apa
yang ditawarkan dan dijanjikan perusahaan
terhadap pengguna layanan mereka
85
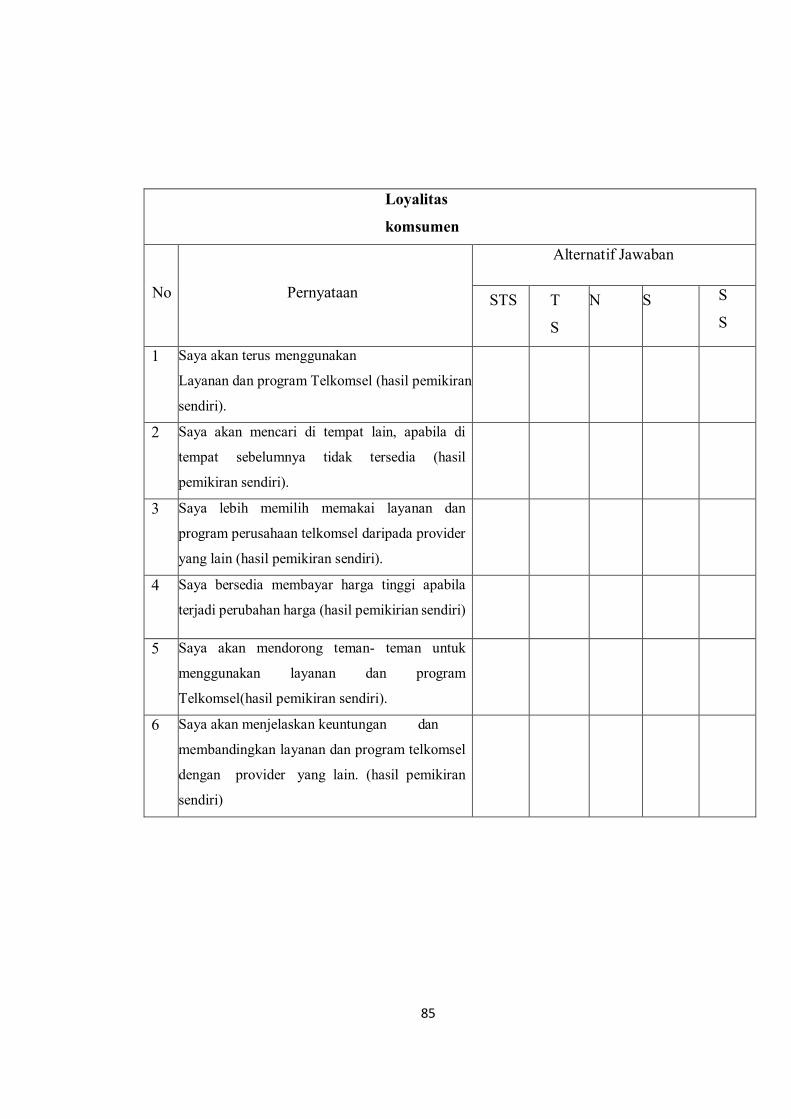
Loyalitas
komsumen
No
Pernyataan
Alternatif Jawaban
STS T
S
N S S
S
1 Saya akan terus menggunakan
Layanan dan program Telkomsel (hasil pemikiran
sendiri).
2 Saya akan mencari di tempat lain, apabila di
tempat sebelumnya tidak tersedia (hasil
pemikiran sendiri).
3 Saya lebih memilih memakai layanan dan
program perusahaan telkomsel daripada provider
yang lain (hasil pemikiran sendiri).
4 Saya bersedia membayar harga tinggi apabila
terjadi perubahan harga (hasil pemikirian sendiri)
5 Saya akan mendorong teman- teman untuk
menggunakan layanan dan program
Telkomsel(hasil pemikiran sendiri).
6 Saya akan menjelaskan keuntungan dan
membandingkan layanan dan program telkomsel
dengan provider yang lain. (hasil pemikiran
sendiri)

86

87
88
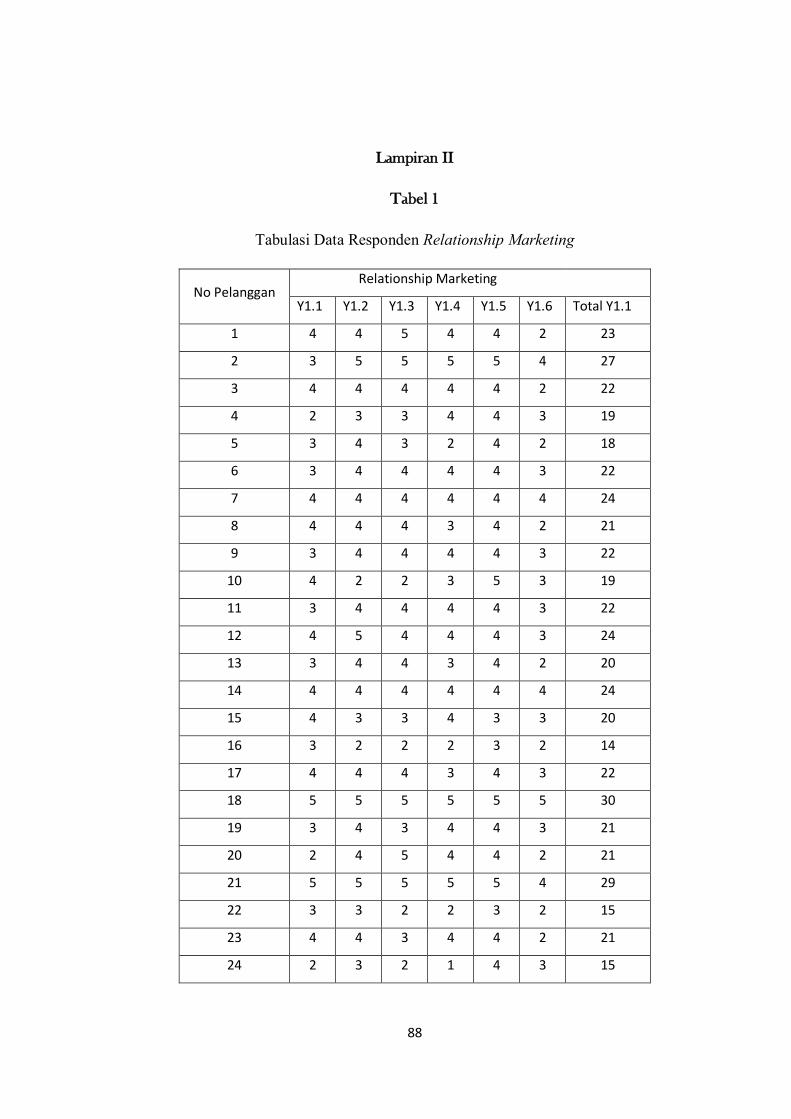
Lampiran II
Tabel 1
Tabulasi Data Responden Relationship Marketing
No Pelanggan Relationship Marketing
Y1.1 Y1.2 Y1.3 Y1.4 Y1.5 Y1.6 Total Y1.1
1 4 4 5 4 4 2 23
2 3 5 5 5 5 4 27
3 4 4 4 4 4 2 22
4 2 3 3 4 4 3 19
5 3 4 3 2 4 2 18
6 3 4 4 4 4 3 22
7 4 4 4 4 4 4 24
8 4 4 4 3 4 2 21
9 3 4 4 4 4 3 22
10 4 2 2 3 5 3 19
11 3 4 4 4 4 3 22
12 4 5 4 4 4 3 24
13 3 4 4 3 4 2 20
14 4 4 4 4 4 4 24
15 4 3 3 4 3 3 20
16 3 2 2 2 3 2 14
17 4 4 4 3 4 3 22
18 5 5 5 5 5 5 30
19 3 4 3 4 4 3 21
20 2 4 5 4 4 2 21
21 5 5 5 5 5 4 29
22 3 3 2 2 3 2 15
23 4 4 3 4 4 2 21
24 2 3 2 1 4 3 15

89
25 3 3 4 3 4 3 20
26 3 3 4 4 3 3 20
27 5 4 4 5 5 5 28
28 3 3 3 4 2 3 18
29 5 5 5 5 5 2 27
30 4 2 4 4 2 3 19
31 4 5 5 5 5 5 29
32 3 3 4 3 3 3 19
33 4 3 3 4 4 3 21
34 5 5 5 5 5 3 28
35 2 3 1 3 2 2 13
36 3 4 4 4 3 3 21
37 3 5 5 5 5 5 28
38 4 4 4 4 4 4 24
39 3 3 3 4 3 2 18
40 3 5 5 5 4 3 25
41 3 3 3 2 2 2 15
42 2 3 3 3 3 2 16
43 5 5 5 5 5 4 29
44 3 5 5 5 5 4 27
45 2 5 5 5 5 4 26
46 3 3 2 3 2 3 16
47 3 4 5 5 4 3 24
48 5 5 5 5 5 5 30
49 5 5 5 5 5 3 28
50 2 3 2 3 3 3 16
51 3 2 3 3 3 3 17
52 4 4 4 4 5 3 24
53 4 5 4 4 4 4 25
54 3 5 5 5 5 4 27
55 3 3 2 3 2 2 15
90
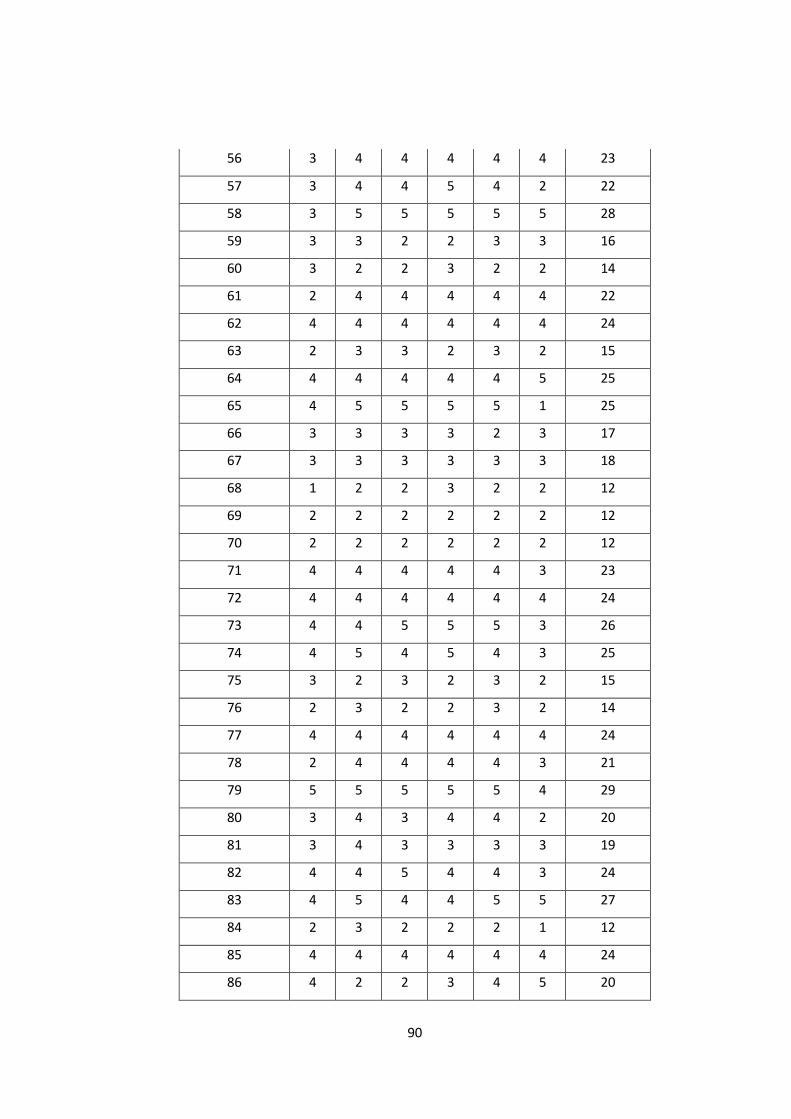
56 3 4 4 4 4 4 23
57 3 4 4 5 4 2 22
58 3 5 5 5 5 5 28
59 3 3 2 2 3 3 16
60 3 2 2 3 2 2 14
61 2 4 4 4 4 4 22
62 4 4 4 4 4 4 24
63 2 3 3 2 3 2 15
64 4 4 4 4 4 5 25
65 4 5 5 5 5 1 25
66 3 3 3 3 2 3 17
67 3 3 3 3 3 3 18
68 1 2 2 3 2 2 12
69 2 2 2 2 2 2 12
70 2 2 2 2 2 2 12
71 4 4 4 4 4 3 23
72 4 4 4 4 4 4 24
73 4 4 5 5 5 3 26
74 4 5 4 5 4 3 25
75 3 2 3 2 3 2 15
76 2 3 2 2 3 2 14
77 4 4 4 4 4 4 24
78 2 4 4 4 4 3 21
79 5 5 5 5 5 4 29
80 3 4 3 4 4 2 20
81 3 4 3 3 3 3 19
82 4 4 5 4 4 3 24
83 4 5 4 4 5 5 27
84 2 3 2 2 2 1 12
85 4 4 4 4 4 4 24
86 4 2 2 3 4 5 20

91
87 4 3 2 4 4 4 21
88 3 4 1 5 1 3 17
89 4 1 1 3 4 3 16
90 5 3 2 2 3 3 18
91 4 2 3 3 2 2 16
92 3 3 2 1 3 1 13
93 4 5 1 3 2 4 19
94 2 4 3 2 1 5 17
95 3 2 4 3 2 4 18
96 4 1 4 2 4 3 18
97 1 4 3 1 2 4 15
98 3 3 2 2 3 3 16
99 4 2 1 3 1 1 12
100 4 1 2 4 3 3 17
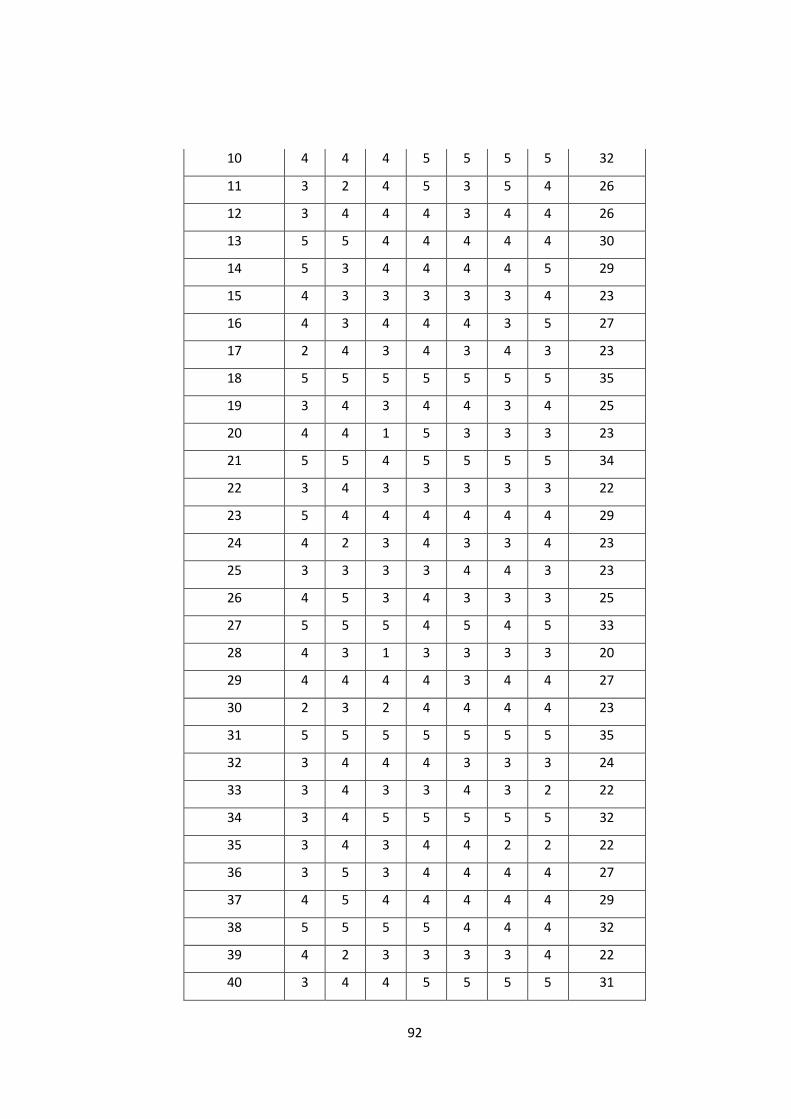
Tabel 2
Tabulasi Data Responden Kepuasan
No Pelanggan Kepuasan Konsumen
X1.1 X1.2 X1.3 X1.4 X1.5 X1.6 X1.7 TOTAL X1
1 4 4 4 4 4 4 4 28
2 5 5 5 5 5 5 5 35
3 3 3 3 3 3 3 3 21
4 3 4 4 4 3 3 3 24
5 4 4 5 4 4 4 3 28
6 3 4 3 4 3 3 3 23
7 4 4 4 4 4 4 4 28
8 3 4 4 4 4 4 4 27
9 4 4 4 4 3 4 4 27
92
10 4 4 4 5 5 5 5 32
11 3 2 4 5 3 5 4 26
12 3 4 4 4 3 4 4 26
13 5 5 4 4 4 4 4 30
14 5 3 4 4 4 4 5 29
15 4 3 3 3 3 3 4 23
16 4 3 4 4 4 3 5 27
17 2 4 3 4 3 4 3 23
18 5 5 5 5 5 5 5 35
19 3 4 3 4 4 3 4 25
20 4 4 1 5 3 3 3 23
21 5 5 4 5 5 5 5 34
22 3 4 3 3 3 3 3 22
23 5 4 4 4 4 4 4 29
24 4 2 3 4 3 3 4 23
25 3 3 3 3 4 4 3 23
26 4 5 3 4 3 3 3 25
27 5 5 5 4 5 4 5 33
28 4 3 1 3 3 3 3 20
29 4 4 4 4 3 4 4 27
30 2 3 2 4 4 4 4 23
31 5 5 5 5 5 5 5 35
32 3 4 4 4 3 3 3 24
33 3 4 3 3 4 3 2 22
34 3 4 5 5 5 5 5 32
35 3 4 3 4 4 2 2 22
36 3 5 3 4 4 4 4 27
37 4 5 4 4 4 4 4 29
38 5 5 5 5 4 4 4 32
39 4 2 3 3 3 3 4 22
40 3 4 4 5 5 5 5 31

93
41 4 4 4 4 4 4 4 28
42 2 4 2 4 4 4 3 23
43 5 4 5 5 5 5 5 34
44 4 5 5 5 3 4 5 31
45 5 5 4 4 3 5 5 31
46 4 3 3 3 4 4 4 25
47 4 5 2 4 4 4 3 26
48 5 5 5 5 5 5 5 35
49 3 4 4 5 5 5 5 31
50 4 4 4 4 4 4 4 28
51 4 4 4 4 4 4 4 28
52 3 4 3 4 5 4 4 27
53 4 4 4 5 4 4 4 29
54 5 5 5 5 5 5 5 35
55 3 2 2 4 3 3 3 20
56 4 4 4 4 4 4 4 28
57 4 4 3 4 4 4 4 27
58 5 3 5 5 5 5 5 33
59 3 4 4 4 3 4 3 25
60 4 3 5 3 3 4 4 26
61 4 4 4 4 4 4 4 28
62 4 4 3 4 4 4 4 27
63 5 3 3 3 3 4 4 25
64 5 4 3 4 4 4 4 28
65 3 4 3 4 4 4 4 26
66 5 4 2 4 5 5 3 28
67 3 3 3 3 3 4 4 23
68 4 4 2 4 4 4 4 26
69 3 3 3 3 3 3 3 21
70 3 3 3 3 2 2 3 19
71 4 4 4 4 4 4 4 28

94
72 4 4 4 4 4 4 4 28
73 5 3 4 5 3 4 4 28
74 5 5 3 5 4 5 5 32
75 4 3 3 5 4 3 3 25
76 2 4 2 3 4 4 2 21
77 4 4 4 4 4 4 4 28
78 3 3 3 3 3 3 3 21
79 5 4 5 5 5 5 5 34
80 5 5 1 4 3 3 3 24
81 3 3 3 3 3 3 3 21
82 4 4 3 5 4 4 4 28
83 4 5 5 5 5 4 5 33
84 3 3 2 4 3 4 4 23
85 4 4 4 4 4 4 4 28
86 1 3 4 4 4 4 4 24
87 2 4 2 4 5 5 5 27
88 3 2 5 5 5 5 5 30
89 4 1 2 5 5 4 4 25
90 2 4 4 5 5 5 5 30
91 3 1 2 5 5 4 4 24
92 3 2 4 5 5 4 3 26
93 4 3 2 5 5 5 4 28
94 4 3 5 3 3 3 2 23
95 2 4 4 3 4 4 5 26
96 3 5 3 5 5 5 2 28
97 5 5 4 5 4 4 3 30
98 2 5 3 4 4 3 3 24
99 3 4 4 4 5 4 3 27
100 4 3 3 5 4 3 2 24

95
Tabel 3
Tabulasi Data Responden Loyalitas
No Pelanggan Loyalitas Cusmer
X2.1 X2.2 X2.3 X2.4 X2.5 X2.6 TOTAL X2
1 4 4 4 4 4 4 24
2 5 4 5 4 4 4 26
3 3 3 3 3 3 3 18
4 3 3 3 3 3 3 18
5 4 5 3 2 3 5 22
6 4 3 4 3 4 3 21
7 4 4 4 4 4 4 24
8 4 4 4 3 4 4 23
9 3 4 4 3 3 3 20
10 3 4 4 4 4 5 24
11 5 4 5 3 5 5 27
12 5 4 5 3 3 3 23
13 3 4 4 4 4 4 23
14 4 3 4 2 3 4 20
15 4 3 4 3 3 3 20
16 5 3 2 2 3 3 18
17 5 4 5 1 3 4 22
18 5 5 5 5 5 5 30
19 4 3 3 3 3 3 19
20 5 3 5 4 3 5 25
21 5 3 5 3 4 4 24
22 3 3 3 2 3 3 17
23 4 4 4 4 4 4 24

96
24 4 3 3 2 3 3 18
25 4 3 4 3 4 3 21
26 5 4 5 2 3 3 22
27 4 4 4 4 4 4 24
28 3 3 4 2 3 2 17
29 4 3 4 2 3 4 20
30 3 4 4 4 2 2 19
31 5 5 5 5 5 5 30
32 4 4 2 2 3 3 18
33 2 3 2 2 3 4 16
34 5 4 4 5 5 4 27
35 4 3 4 1 2 3 17
36 5 4 3 2 3 4 21
37 4 4 4 4 4 4 24
38 4 4 2 2 4 2 18
39 3 3 4 2 3 3 18
40 5 5 5 5 5 5 30
41 2 4 4 2 3 4 19
42 3 3 3 2 2 3 16
43 5 4 5 4 4 5 27
44 4 4 4 2 3 5 22
45 4 4 5 3 3 5 24
46 4 2 2 2 2 5 17
47 5 3 4 2 3 3 20
48 5 5 5 5 5 5 30
49 5 4 4 5 5 4 27
50 2 4 4 2 2 4 18
51 3 4 3 3 3 3 19

97
52 4 4 4 4 4 4 24
53 5 4 4 3 5 4 25
54 5 4 5 4 4 4 26
55 3 3 2 3 2 2 15
56 4 4 4 4 4 4 24
57 4 3 4 3 3 3 20
58 5 3 4 4 4 4 24
59 4 4 2 2 3 3 18
60 3 3 2 2 3 3 16
61 4 4 4 4 4 4 24
62 4 4 4 4 4 4 24
63 5 4 2 2 2 4 19
64 4 3 4 3 3 3 20
65 4 4 4 4 4 4 24
66 3 4 3 2 3 4 19
67 4 3 4 4 4 3 22
68 2 4 2 2 2 2 14
69 3 3 2 2 2 2 14
70 3 3 3 3 2 2 16
71 4 4 4 4 4 4 24
72 4 4 4 3 3 4 22
73 5 3 5 5 3 5 26
74 5 2 5 4 3 4 23
75 3 4 3 2 3 3 18
76 1 4 5 2 2 4 18
77 4 4 4 1 4 4 21
78 3 3 1 1 1 3 12
79 5 4 5 4 4 5 27

98
80 3 4 3 2 3 3 18
81 3 3 3 3 3 3 18
82 5 3 5 4 4 4 25
83 5 5 5 2 4 3 24
84 3 3 2 1 1 1 11
85 2 4 4 2 2 4 18
86 4 4 4 4 4 3 23
87 4 2 2 3 4 4 19
88 5 5 5 5 5 4 29
89 3 4 4 4 5 4 24
90 4 3 4 5 5 2 23
91 4 4 2 2 3 4 19
92 3 5 5 4 4 4 25
93 4 5 4 5 4 5 27
94 3 3 5 4 3 5 23
95 3 5 5 4 3 3 23
96 3 3 4 5 4 3 22
97 5 5 4 4 4 4 26
98 3 5 5 4 4 4 25
99 3 4 5 3 4 4 23
100 4 5 5 4 3 4 25
Tabel 4

99
Correlations
x1.1 x1.2 x1.3 x1.4 x1.5 x1.6 tx1
x1.1 Pearson
Correlation
1 .288** .350** .470** .477** .292** .608**
Sig. (2-tailed) .004 .000 .000 .000 .003 .000
N 100 100 100 100 100 100 100
x1.2 Pearson
Correlation
.288** 1 .685** .643** .601** .414** .800**
Sig. (2-tailed) .004 .000 .000 .000 .000 .000
N 100 100 100 100 100 100 100
x1.3 Pearson
Correlation
.350** .685** 1 .691** .715** .390** .851**
Sig. (2-tailed) .000 .000 .000 .000 .000 .000
N 100 100 100 100 100 100 100
x1.4 Pearson
Correlation
.470** .643** .691** 1 .619** .413** .842**
Sig. (2-tailed) .000 .000 .000 .000 .000 .000
N 100 100 100 100 100 100 100
x1.5 Pearson
Correlation
.477** .601** .715** .619** 1 .408** .839**
100
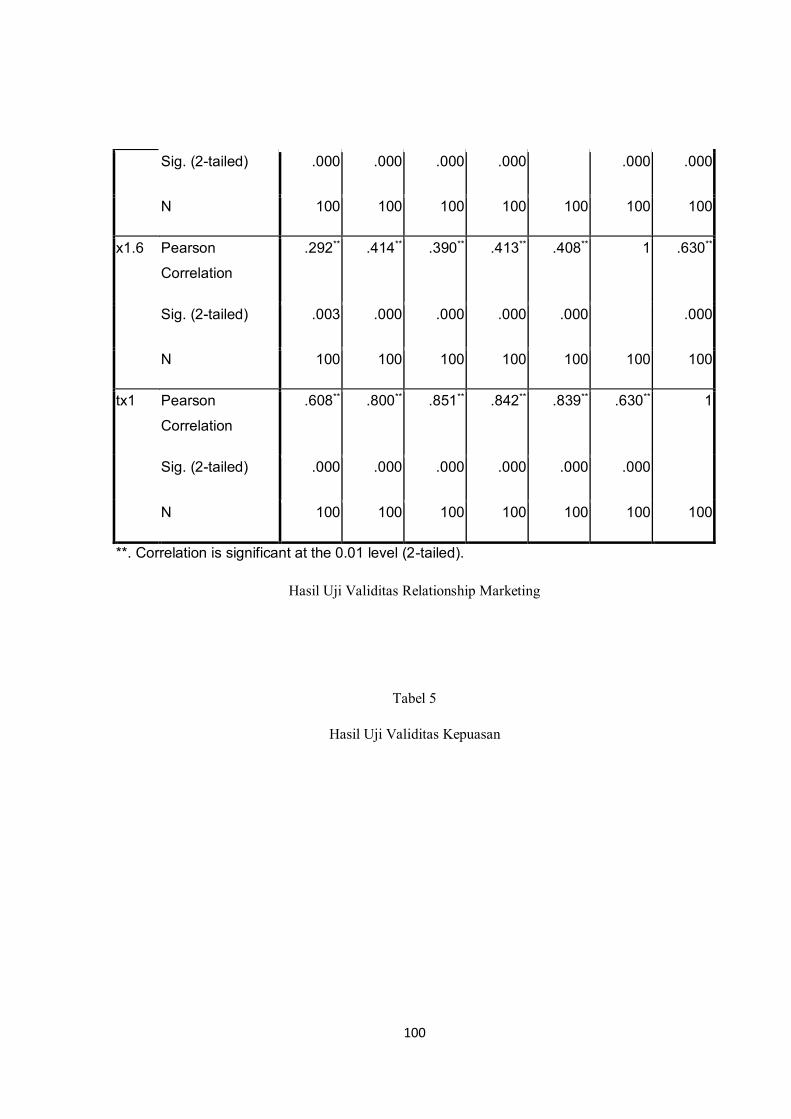
Hasil Uji Validitas Relationship Marketing
Tabel 5
Hasil Uji Validitas Kepuasan
Sig. (2-tailed) .000 .000 .000 .000 .000 .000
N 100 100 100 100 100 100 100
x1.6 Pearson
Correlation
.292** .414** .390** .413** .408** 1 .630**
Sig. (2-tailed) .003 .000 .000 .000 .000 .000
N 100 100 100 100 100 100 100
tx1 Pearson
Correlation
.608** .800** .851** .842** .839** .630** 1
Sig. (2-tailed) .000 .000 .000 .000 .000 .000
N 100 100 100 100 100 100 100
**. Correlation is significant at the 0.01 level (2-tailed).
101
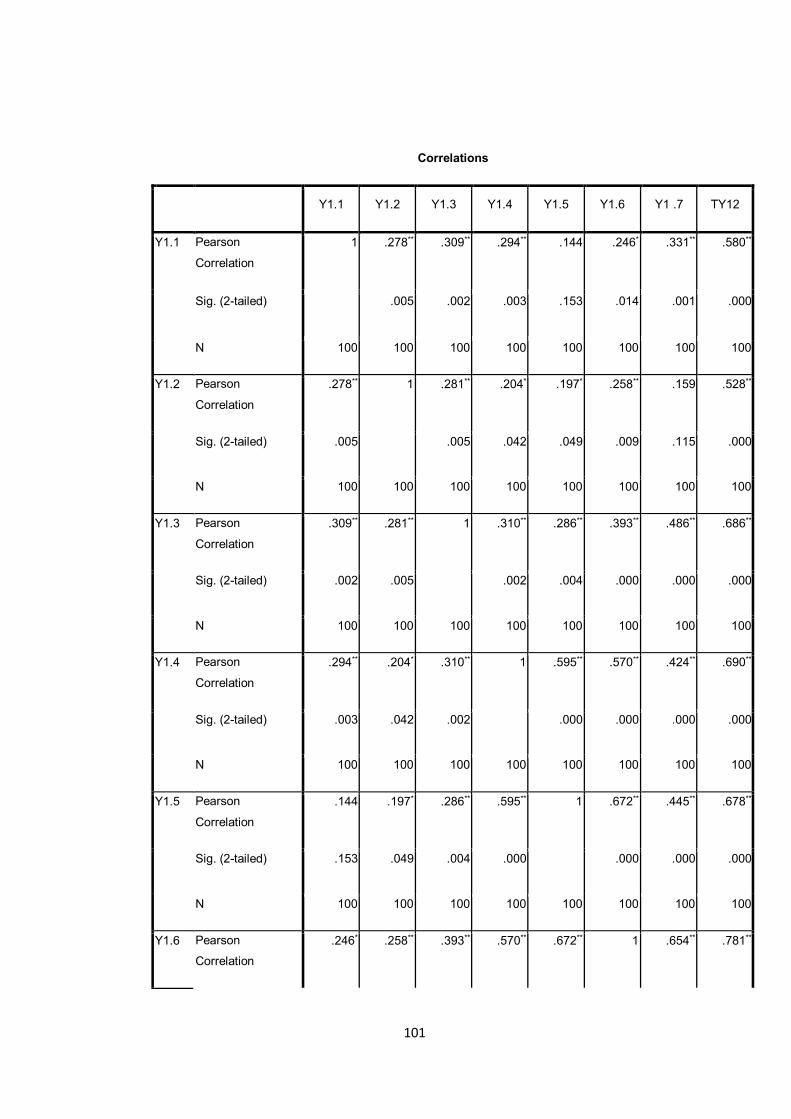
Correlations
Y1.1 Y1.2 Y1.3 Y1.4 Y1.5 Y1.6 Y1 .7 TY12
Y1.1 Pearson
Correlation
1 .278** .309** .294** .144 .246* .331** .580**
Sig. (2-tailed) .005 .002 .003 .153 .014 .001 .000
N 100 100 100 100 100 100 100 100
Y1.2 Pearson
Correlation
.278** 1 .281** .204* .197* .258** .159 .528**
Sig. (2-tailed) .005 .005 .042 .049 .009 .115 .000
N 100 100 100 100 100 100 100 100
Y1.3 Pearson
Correlation
.309** .281** 1 .310** .286** .393** .486** .686**
Sig. (2-tailed) .002 .005 .002 .004 .000 .000 .000
N 100 100 100 100 100 100 100 100
Y1.4 Pearson
Correlation
.294** .204* .310** 1 .595** .570** .424** .690**
Sig. (2-tailed) .003 .042 .002 .000 .000 .000 .000
N 100 100 100 100 100 100 100 100
Y1.5 Pearson
Correlation
.144 .197* .286** .595** 1 .672** .445** .678**
Sig. (2-tailed) .153 .049 .004 .000 .000 .000 .000
N 100 100 100 100 100 100 100 100
Y1.6 Pearson
Correlation .246* .258** .393** .570** .672** 1 .654** .781**
102
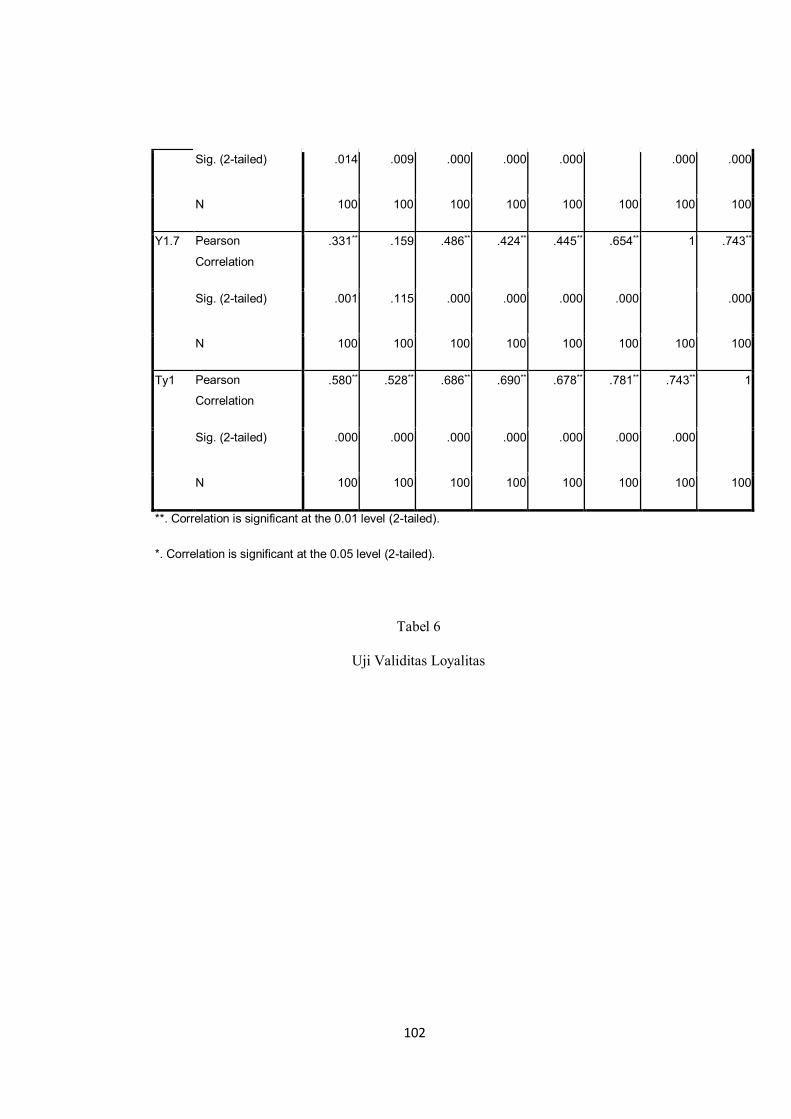
Sig. (2-tailed) .014 .009 .000 .000 .000 .000 .000
N 100 100 100 100 100 100 100 100
Y1.7 Pearson
Correlation
.331** .159 .486** .424** .445** .654** 1 .743**
Sig. (2-tailed) .001 .115 .000 .000 .000 .000 .000
N 100 100 100 100 100 100 100 100
Ty1 Pearson
Correlation .580** .528** .686** .690** .678** .781** .743** 1
Sig. (2-tailed) .000 .000 .000 .000 .000 .000 .000
N 100 100 100 100 100 100 100 100
**. Correlation is significant at the 0.01 level (2-tailed).
*. Correlation is significant at the 0.05 level (2-tailed).
Tabel 6
Uji Validitas Loyalitas

103
Correlations
Y2.1 Y2.2 Y2.3 Y2.4 Y2.5 Y2.6 Ty2
Y2.1 Pearson
Correlation
1 .127 .353** .339** .499** .358** .626**
Sig. (2-tailed) .209 .000 .001 .000 .000 .000
N 100 100 100 100 100 100 100
Y2.2 Pearson
Correlation
.127 1 .382** .315** .404** .356** .563**
Sig. (2-tailed) .209 .000 .001 .000 .000 .000
N 100 100 100 100 100 100 100
Y2.3 Pearson
Correlation
.353** .382** 1 .541** .505** .484** .773**
Sig. (2-tailed) .000 .000 .000 .000 .000 .000
N 100 100 100 100 100 100 100
Y2.4 Pearson
Correlation
.339** .315** .541** 1 .693** .390** .792**
Sig. (2-tailed) .001 .001 .000 .000 .000 .000
N 100 100 100 100 100 100 100
Y2.5 Pearson
Correlation
.499** .404** .505** .693** 1 .441** .830**
Sig. (2-tailed) .000 .000 .000 .000 .000 .000
N 100 100 100 100 100 100 100
104
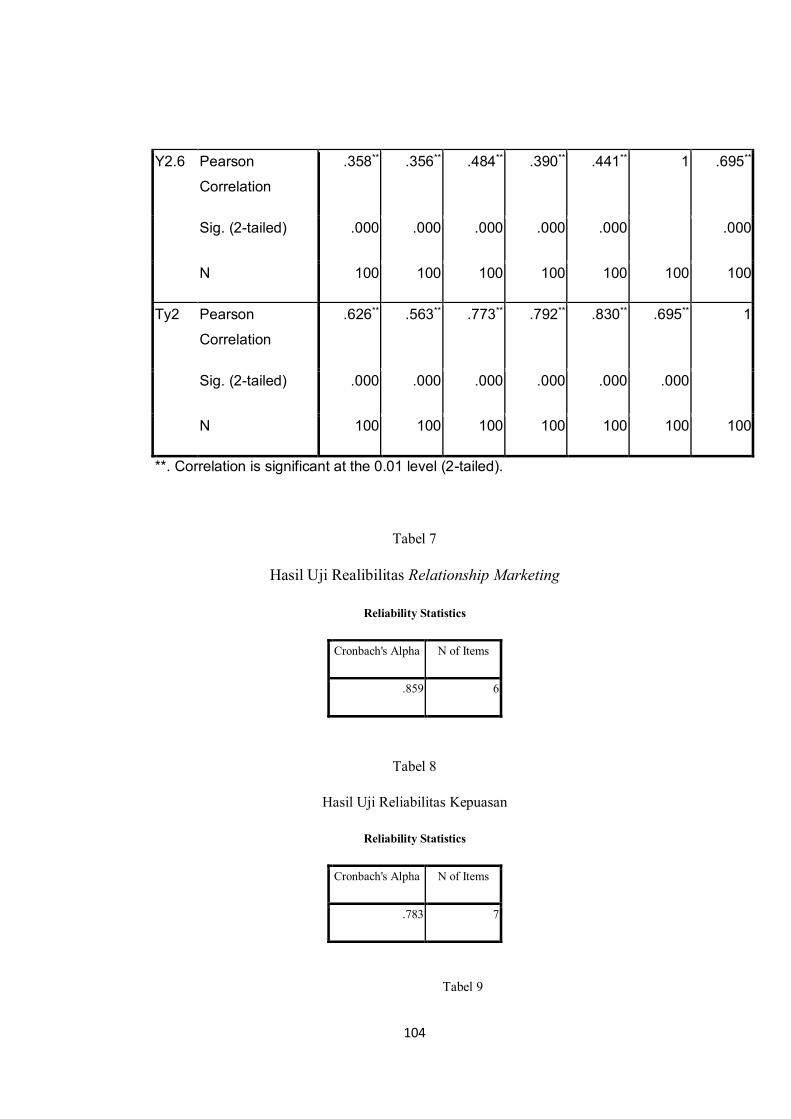
Y2.6 Pearson
Correlation
.358** .356** .484** .390** .441** 1 .695**
Sig. (2-tailed) .000 .000 .000 .000 .000 .000
N 100 100 100 100 100 100 100
Ty2 Pearson
Correlation
.626** .563** .773** .792** .830** .695** 1
Sig. (2-tailed) .000 .000 .000 .000 .000 .000
N 100 100 100 100 100 100 100
**. Correlation is significant at the 0.01 level (2-tailed).
Tabel 7
Hasil Uji Realibilitas Relationship Marketing
Reliability Statistics
Cronbach's Alpha N of Items
.859 6
Tabel 8
Hasil Uji Reliabilitas Kepuasan
Reliability Statistics
Cronbach's Alpha N of Items
.783 7
Tabel 9
105
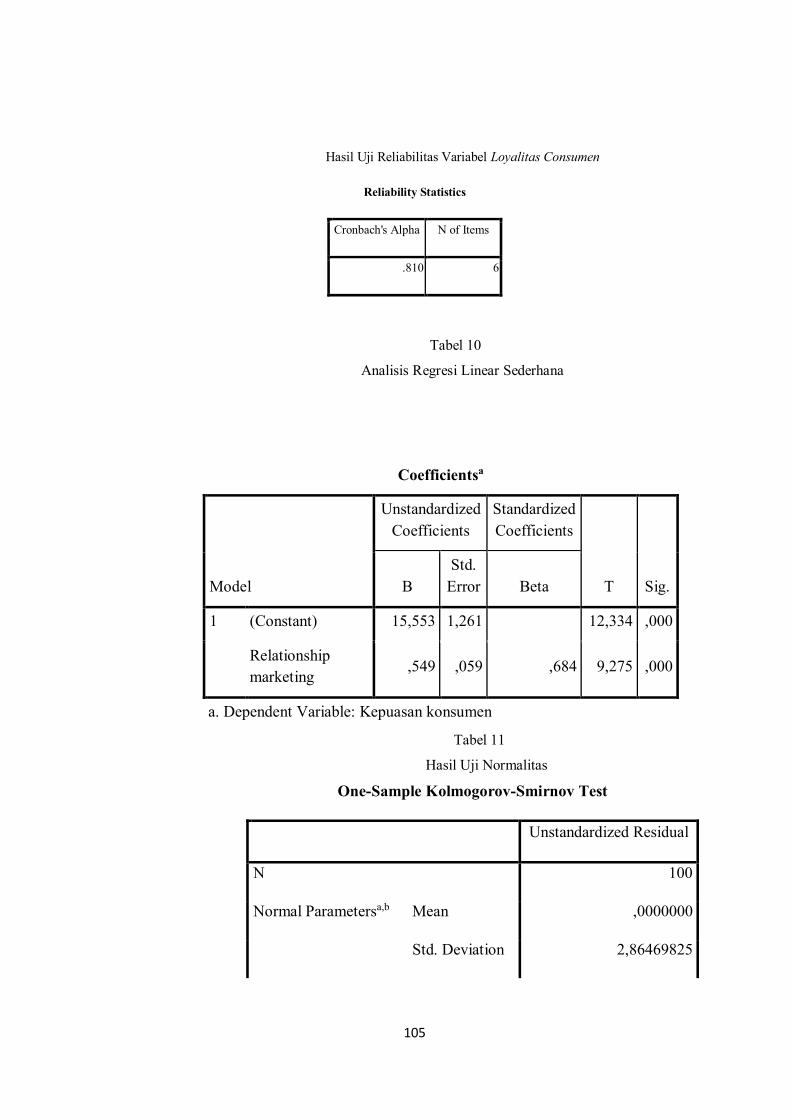
Hasil Uji Reliabilitas Variabel Loyalitas Consumen
Reliability Statistics
Cronbach's Alpha N of Items
.810 6
Tabel 10
Analisis Regresi Linear Sederhana
Tabel 11
Hasil Uji Normalitas
One-Sample Kolmogorov-Smirnov Test
Unstandardized Residual
N 100
Normal Parametersa,b Mean ,0000000
Std. Deviation 2,86469825
Coefficientsa
Model
Unstandardized Coefficients
Standardized Coefficients
T Sig. B Std.
Error Beta
1 (Constant) 15,553 1,261 12,334 ,000
Relationship marketing ,549 ,059 ,684 9,275 ,000
a. Dependent Variable: Kepuasan konsumen
106
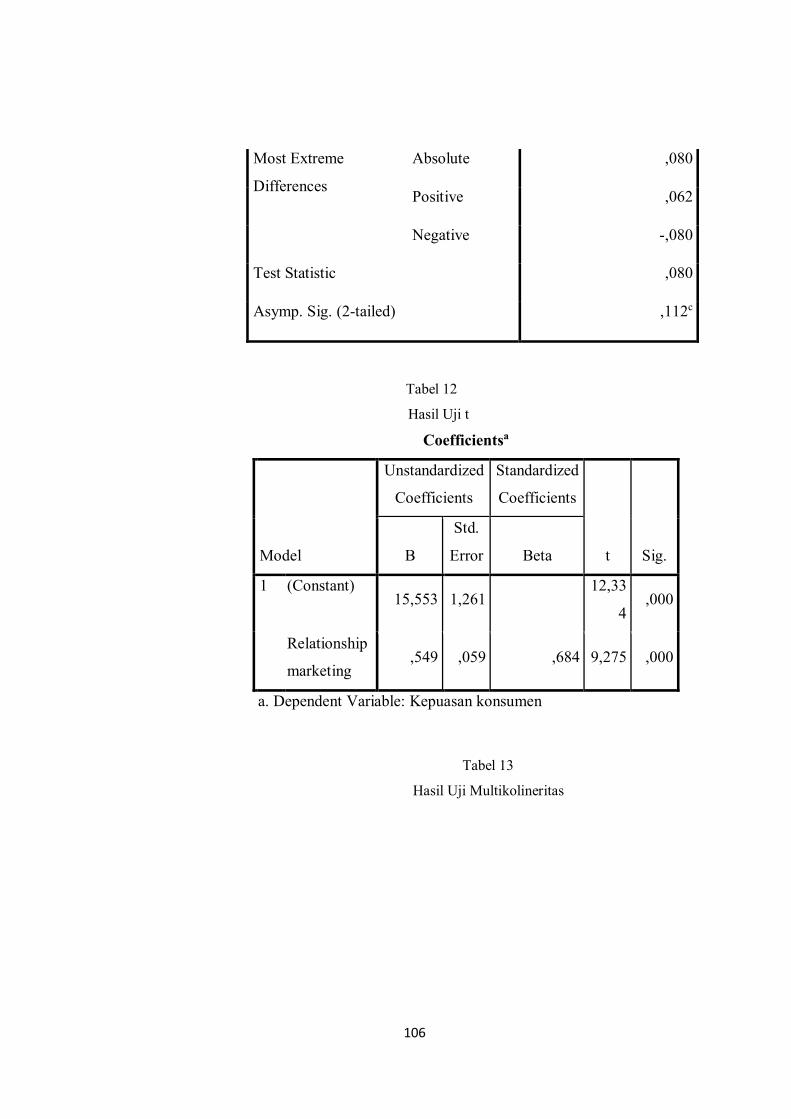
Most Extreme
Differences
Absolute ,080
Positive ,062
Negative -,080
Test Statistic ,080
Asymp. Sig. (2-tailed) ,112c
Tabel 12
Hasil Uji t
Coefficientsa
Model
Unstandardized
Coefficients
Standardized
Coefficients
t Sig. B
Std.
Error Beta
1 (Constant) 15,553 1,261
12,33
4 ,000
Relationship
marketing ,549 ,059 ,684 9,275 ,000
a. Dependent Variable: Kepuasan konsumen
Tabel 13
Hasil Uji Multikolineritas

107
Coefficientsa
Model
Collinearity Statistics
Tolerance VIF
1 Relationship Marketing .997 1.003
Kepuasan Konsumen .997 1.003
a. Dependent Variable: Loyalitas Customer
Tabel 14
Uji F
ANOVAb
Model Sum of Squares Df Mean Square F Sig.
1 Regression 810.063 2 405.032 49.485 .000a
Residual 793.937 97 8.185
Total 1604.000 99
a. Predictors: (Constant), Kepuasan Konsumen, Relationship Marketing
b. Dependent Variable: Loyalitas Customer
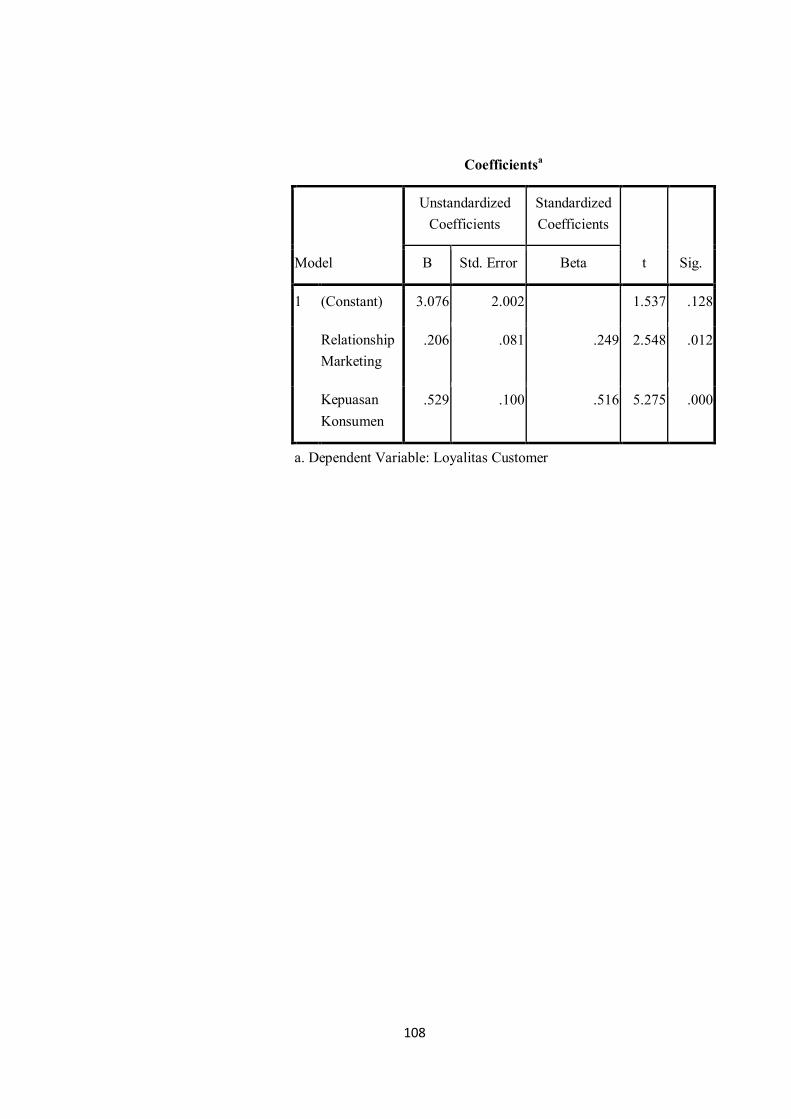
Tabel 15
Analisis Regresi Berganda
108
Coefficientsa
Model
Unstandardized Coefficients
Standardized Coefficients
t Sig. B Std. Error Beta
1 (Constant) 3.076 2.002 1.537 .128
Relationship Marketing
.206 .081 .249 2.548 .012
Kepuasan Konsumen
.529 .100 .516 5.275 .000
a. Dependent Variable: Loyalitas Customer
Related Documents