1 REPUBLIC OF GHANA ------------- MINISTRY OF LOCAL GOVRNMENT, RURAL DEVELOPMENT AND ENVIRONMENT ------------- KRACHI EAST DISTRICT ASSEMBLY KRACHI EAST DISTRICT WATER AND SANITATION PLAN August 2008 GROUPE D’ETUDE DE RECHERCHE ET D’APPUI AU DÉVELOPPEMENT

Welcome message from author
This document is posted to help you gain knowledge. Please leave a comment to let me know what you think about it! Share it to your friends and learn new things together.
Transcript
1
REPUBLIC OF GHANA
------------- MINISTRY OF LOCAL GOVRNMENT,
RURAL DEVELOPMENT AND ENVIRONMENT
-------------
KRACHI EAST DISTRICT ASSEMBLY
KRACHI EAST DISTRICT WATER
AND SANITATION PLAN
August 2008
GROUPE D’ETUDE DE RECHERCHE ET D’APPUI AU DÉVELOPPEMENT

2
Sicap Sacré Cœur III Villa N° 9231 - BP : 16473 Dakar/Fann, Sénégal
Tel: 221-33 869-37-93 / Fax: 221-33 827-94-99 / Email: [email protected] /[email protected] /
Web: www.geradsn.org

3
Content I- INTRODUCTION ......................................................................................................................................................... 7
1-1 Preamble ............................................................................................................................................................. 7
1-2 Implementing strategy ......................................................................................................................................... 9
1-3 Approach ............................................................................................................................................................. 9
1-4 Methodology ...................................................................................................................................................... 10
A-DIAGNOSIS OF THE ENVIRONMENT .................................................................................................................... 12
A-1 PHYSICAL PRESENTATION OF THE DISTRICT ................................................................................................ 12
A-1-1 Geographical situation and size of the District ............................................................................................... 12
A-1-2 Climate and vegetation .................................................................................................................................. 12
A-1-3 Geology and soils .......................................................................................................................................... 13
A-2 DEMOGRAPHY AND HUMAN RESOURCES ...................................................................................................... 15
A-2-1 Population size and distribution ..................................................................................................................... 15
A-2-2 Schooling level of the population ................................................................................................................... 16
A-2-3 Ethnic composition ......................................................................................................................................... 17
A-2-4 Population distribution by Area Council ......................................................................................................... 17
A-2-5 Urban/rural duality .......................................................................................................................................... 20
A-2-6 Households activities and expenditures ....................................................................................................... 20
A-3 POVERTY APPRAISAL ........................................................................................................................................ 21
A-3-1 Level of access to basic social services ......................................................................................................... 21
A-3-2 Analysis of the poverty situation..................................................................................................................... 24
A-4 ROLE OF ACTORS ............................................................................................................................................... 25
A-4-1 The District Assembly .................................................................................................................................... 25
A-5 WATER, SANITATION AND HYGIENE ISSUES .................................................................................................. 26
A-5-1 Study of the drinking water sector .................................................................................................................. 26
A-5-1-1 Access and usage of water .................................................................................................................... 27
A-5-1-2 Coverage of the water needs ................................................................................................................. 31
A-5-2 Access to the sanitation facilities ................................................................................................................... 33
A-5-2-1 Identification and typology of the sanitation facilities.............................................................................. 33
A-5-2-2 Analysis of the relation water/hygiene/health ......................................................................................... 35
A-6 SYNTHESIS OF THE DIAGNOSIS ELEMENTS ................................................................................................... 37
B- STRATEGIC ORIENTATIONS FOR WATER AND SANITATION ACCESS IMPROVEMENT .............................. 39
B-1 STRATEGIC ORIENTATIONS .............................................................................................................................. 39
B-2 IDENTIFICATION OF ACTIONS ........................................................................................................................... 40
B-2-1 Improved access to water .............................................................................................................................. 40
B-2-2 Improved access to sanitation infrastructures ................................................................................................ 40

4
CONCLUSION ............................................................................................................................................................. 42
Maps
Map 1 : Location of Krachi East District ................................................................................................... 14
Map 2 : Distribution of the District population........................................................................................... 19
Map 3 : Location of the basic social equipments in the District ................................................................ 23
Map 4 : Location of hydraulic facilities ..................................................................................................... 28
Map 5 : Drinking water coverage rate ...................................................................................................... 32
Map 6: Location of sanitation facilities ..................................................................................................... 34
Map 7: Sanitation coverage rate .............................................................................................................. 36
Tables
Table 1 : Population distribution by age and by gender ........................................................................... 15
Table 2: Sample population schooling Level ............................................................................................ 16
Table 3: Categorization of the District population .................................................................................... 18
Table 4: Typology of the basic social equipments ................................................................................... 22
Table 5: Access to equipment per Area Council ...................................................................................... 24
Table 6: Access Level of vulnerable persons ........................................................................................... 25
Table 7: The main sources of water supply ............................................................................................. 27
Table 8: Level of functionality of hydraulic facilities ................................................................................. 29
Table 9: Access conditions to drinking water ........................................................................................... 30
Table 10: Coverage rate by Area Council ................................................................................................ 31
Table 11: Summary of issues and solutions ............................................................................................ 41
Figures
Graph 1: Ethnic distribution of the sample population .............................................................................. 17
Graph 2: Main occupations of the household heads of the sample ......................................................... 21

5
ACRONYMS AND ABBREVIATIONS
AEPHA Access to Safe Water, Hygiene and Sanitation
CBO Community Based Organisation
CWSA Community Water and Sanitation Agency
DWSO District Water and Sanitation Office
DWSP District Water and Sanitation Plan
DWST District Water and Sanitation Team
EPA Environmental Protection Agency
GWCL Ghana Water Company Limited
HDW Hand Dug Wells
LG Local Government
LGA Local Government Act
LI Legislative Instrument
MoWRWH Ministry of Water Resources Works and Housing
MDGs Millenium Development Goals
PNDC Provisionnal National Defense Council
PS Piped Systems
PURC Public Utilities Regulatory Commission
RH Rain Harvesting
VIP Ventilated Pit Latrines
WAG WaterAid Ghana
WATSAN Water and Sanitation Committees

6
WRC Water Resources Commission

7
I- INTRODUCTION
1-1 Preamble
After Independence in 1957, the Republic of Ghana is one of the sub-Saharan countries of Africa
that based its development policy on participatory development strategy using the
decentralisation process as governance rule. Inheritance from British colonization influenced the
political choices of its successive rulers and the involvement of all society stakeholders in the
management of the country has always prevailed as a major trend. This is concretely materialized
through the consensual definition of administrative, legal, political and economic frameworks
enabling all stakeholders to express their ideas and fixing the limits of the central government’s
scope of authority, as compared with local governments.
Consistently with the Anglo-Saxon assumption, the State is not the primary holder of all
competences, some of which need to be transferred to its organic and territorial components. The
overall smaller units are combined to build and confer the State with some federative
competences. That is the meaning of the notion of «devolution of power», dear to the Anglo-
Saxons. This approach is completely different from that adopted by most of the other countries in
the region, where the constitution leaves it to ordinary legislators to define the competences of
the local governments. In Ghana, the cardinal values of decentralization are based on principles
such as autonomy, subsidiarity, accountability (to voters) and concomitant transfer of a certain
number of competences (human and material) from the State to local governments.
Theoretically launched in the country since 1985, the decentralization process was effectively
enforced with the adoption of the new 1992 constitution that conferred to local governments
under one of the bills of the 1993 Local Government Act with below prerogatives:
Elaboration and execution of plans, programmes and strategies for effective mobilisation
of necessary resources for District development;
Fixing and levying of fiscal taxes, taxes and other charges.
The development plans that are Districts strategic planning documents pose development issues
and define mainlines for interventions in priority sectors (education, health, road infrastructures,
water-hygiene-sanitation, etc.). Development plans are implemented with the own resources of
local governments and additional resources from the central government but also with the
technical and financial support of some development partners.
As for the water and sanitation sector, some District could prepare their own Water-Hygiene-
Sanitation Sector Plans. Thus, the sector plan is a strategic document to define a political vision
8
in the concerned sector. It is a decision support instrument for the water, sanitation and hygiene
sector. DWSP is a coordination tool resulting from Participative Diagnosis undertaken with all
concerned parties and/or stakeholders within the District territory. It expresses the consensual
vision of all stakeholders that validated the results of the Participative Diagnosis and the strategic
orientations defined on the basis of the solutions the District has proposed and is intending to
operationalize. DWSP accelerates the achievement of the related objectives of the poverty
reduction strategic framework, which is the national reference frame for strategic development
orientation and those of the MDGs.
Along with a certain number of partners, WaterAid Ghana supports the implementation of
projects in favour of vulnerable communities in some Districts. WaterAid’s intervention fits into
the policy of the national action undertaken within the global framework of achievement of the
MDGs for local DWSHS, in four West African countries.
For WAG, its option to base its action on this approach is justified by the national engagement in
the DWSHS sector, is one of the major levers ensuring effective and transparent provision of
water and sanitation services, because:
The services will be more sustainable since requiring, in that process the involvement of
local populations;
Intolerable practices such as, late provision of services and other poor service
performance levels will be reduced and controlled;
Local populations closely and regularly collaborate with the communes or local
governments and other service providers, with regard to constant accountability of their
actions;
Responsibilities will be clearly shared among the populations and the District;
The nationals/populations will contribute to smooth implementation of DWSHS plans and
strategies.
Throughout the country, Development plans of most Districts include Water-Hygiene-Sanitation
sector plans. However, for a certain number of objective reasons they do not pose the water and
sanitation issue within the community, in terms of specific concerns (poverty profile,
geographical and financial accessibility to facilities, etc.).
For WAG the current DWSP format should be broadly integrated within the framework of its
interventions so much so that to foster advocacy for the mobilization of resources. Thus, for its
action to be more effective, while keeping up with the logic of national action and making its
intervention consistent with national policies WAG tries to support local governments in better
9
planning water and sanitation sector related actions by adapting the implementing strategic
reference frame (DWSP) to its intervention strategy.
1-2 Implementing strategy
The space unit of WaterAid Ghana’s intervention is the District. That is the decentralised
grassroots organisation under the District Assembly that as a matter of fact is supposed to
guarantee for the population the requested conditions for sustainable development since being
closer to them. Under that prospect, the major objective of WaterAid Ghana is to improve access
to potable water, to sanitation facilities and promote general hygienic conditions. The
participative approach through the application of the MARP tool has been requested in order to
reach such major objective. Actually, the DWSP was elaborated under the prospect of
Consistence with both national and sector development policies: actually, the proposed
activities may contribute to further development of decentralization process and implementation
of DWSP, and obviously to poverty reduction by covering the deemed priority needs of the local
populations.
Synergy in the proposed actions: synergy could be easily promoted through other poverty
reduction actions. The conducted Participative Diagnosis clearly showed that the underlying
cause of poverty is relevant to lack of access to basic social services. Generally, vulnerable
groups and the poorest are the mostly affected since having poor or even no access to the
requested financial resources to enable them having adequate access to basic social facilities and
equipments.
Convergence for more tangible and sustainable performances in poverty reduction: such
convergence and integration effort within the poverty reduction strategy is considered as a
precondition to enhance the achievement of DWSP objectives.
1-3 Approach
Elaborating District DSWP not only requires a strategy but also an approach to be mainly based
on three major principles: local governance and national action where coordination of data
collection is undertaken by decentralized grassroots organizations such as DWSTs, IPs, etc. That
means, giving local population more sense of responsibility, under the prospects of an
enhancement of the emergence of an issued capital among the group of users.
10
Promote accountability principle through learning, to provide local populations with means for
action. Actually, to enhance the capacities for control and participation in decision making,
namely in the management of local affairs, capacity building is necessary for all concerned
parties (field staffs). The principle of equity through implementation of a participative process
provides the communities with the opportunity to systematically analyze and discuss the local
situation and raises awareness of existing problems and possible solutions, as well.
1-4 Methodology
The major outlines of DWSP making process, as shown in our technical bid clearly state that our
proposed option is participative approach with strong involvement of local communities in
situational analysis and problem enunciation.
1. The coordination meeting
The aim of the meeting was to share views on the methodology and agree upon organizational
and logistic aspects. During that meeting the following issues were discussed:
The planning for the conduct of subsequent DWSP making stages in the ten Districts ;
The process to implement those stages: the number of missions and the content of each
mission as well;
The various expected results and its reporting formats;
At the end of the meeting, we elaborated a flowchart displaying the main phase of the subsequent
study stages, namely, statistic data, and cartographic data base and data collection methodologies
in the concerned areas.
2. Data collection
a. Literature search and data processing
As regard the data collection process, we started with the search and processing of available data
on our target area. Several types of documents were processed, namely:
Specific information on water, hygiene and sanitations sectors collected from DSWOs
and some WaterAid’s IPs;
Report and statistic data compendium at WAG;
Complementary information in the Internet.
b. Sampling and proposed collection tool
The unavailability of statistic data on Krachi East District explains the shortcoming sampling in
the process of household surveys. In relation thereto, the WAG team suggested a sample of 325
households.
11
In addition, and with respect to complying with the objectives of the study, the mission team
prepared some survey tools, namely:
Interview guide on national participation: it aims at assessing the level participation of
nationals in order to analyze governance and democracy at the local level.
Interview guide for identifying grassroots organizations: it should allow assessing the
level of social organization.
Interview guide for focus-groups with main resources persons in the communities: It
provides basic information on the social structure and main development activities.
Household questionnaires: it gives quantitative information on living standards and level
access to basic social equipment and facilities.
On top of these tools the team of WAG proposed a guide for Districts institutional
diagnosis: it was supposed to help understanding the profile of resources persons in Local
Governments.
c. Instructors’ Training
January 30 to 31, 2008 instructors’ training session was rather an exchange and discussion
workshop among the mission team and the participants. Considering their good knowledge of the
target survey area, the participants suggested a reformulation of some questions and use of data
collection methodologies more consistent with their socio-cultural environment.
3. Data processing
a. Data entry
Practical training on the use of Sphinx software (data processing) enable the data entry operators,
entering household, community and grassroots organizations’ data. The aggregated data was
entered using Excel template to construct a digital data base to be used as material for mapping
design.
b. The cartographic analysis
The maps were prepared using ArcView that includes a compatibility link. The various
conducted analysis allowed making thematic maps (population map, equipment map, equipment
coverage map, etc.); this made it possible to provide the users with decision support tool to be
used in planning.
c. Analyzing the raw data
The whole of the quantitative and qualitative information collected at the level of the
communities was used to aliment a data base, enabling Area/Town Councils and Districts level
regroupings. The primal assumptions considered in making this report were formulated on the
basis of the whole of the information generated in that framework
12
A-DIAGNOSIS OF THE ENVIRONMENT
A-1 PHYSICAL PRESENTATION OF THE DISTRICT
The natural, human and economic situation of a place constitutes the basic reference data that
occupy an essential place in the analysis process of the preliminary situation to the formulation of
development issues.
For the water and draining sector, one always takes into account the demographic data relating to
the conventional standards to assess the coverage rate of the populations needs. One also
acknowledges that the expression of needs is not identical depending on the fact that one is in an
urban or rural area. Within the framework of the DWSP elaboration, the study starts from the
analysis of the natural and demographic information (the quantitative as well as the qualitative
ones contained in the data base) in order to define some axes which will serve as reference points
to lead our global analysis.
A-1-1 Geographical situation and size of the District
The District of Krachi East, with a total area of 2528 km², 15 % of which are occupied by water,
is located in the Northwest part of the Volta Region of Ghana. It is bordered:
In the Southwest by the District of Krachi West;
In the Southeast by the District of Jasikan;
In the East by the District of Kadjebi;
And in the North by the District of Nkwanta.
This geographic situation places the District in a strategic position, mainly regarding the support
of the development partners involved in the Regions of the North and the South of Ghana.
Likewise, this strategic position confers to the District climatic assets especially for its
development.
A-1-2 Climate and vegetation
As most of the Districts of the North part of the Volta Region, the District of Krachi East has a
maximal average temperature of 30°c recorded in March while the minimal average temperature
was of 25.5 ° c recorded in August. The District has two rainy and dry seasons taking turns every
year. The rainy season extends over seven months going from April to October with a maximal
rainfall of 1300mm and the dry season starts from November to March. Besides, the maximum
rainfalls are reached in August especially in the Southeast part.
13
The relative humidity is very high during the rainy season, about 85 % and very low in the dry
season (25 %). From November to December, the harmatan is over the entire District, making it a
favourable harvest period. It is also necessary to emphasize that during the rainy season, roads are
almost impracticable due to the flood.
The District of East Krachi is within the transition zone between the North Savannah and the
semi-muggy forest with deciduous leaves. About 75 % of the District is covered by the savannah
characterized by a little aridity. Thus, resistant trees such as Dawadawa, among others, are found
there. This type of vegetation is found in the Northern part of the District. In the Southern part of
the District is found the forest vegetation characterized by varieties of trees such as Odum, Wawa,
mahogany etc. On the other hand, the vegetation goes through a progressive degradation, because
of the overexploitation by human beings for daily needs.
A-1-3 Geology and soils
The District of East Krachi is in the Northern part of the central highlands with hills varying from
850 m to 1000 m over the sea level around Asukawkaw and Katanga areas to the south of the
District. The Northern part of the District is part of the North Western Savannah of the Volta
region which is characterized by an almost flat relief with hillsides varying from 85 m to 300 m
over the sea level. The other water lots found in the District include many streams. They also
offer the opportunity to develop agricultural activities, mainly rice growing. These water lots
constitute important resources for the populations, because they are used for domestic activities,
fishing and transportation. There are also important hills that present great potentials for the
development of tourism in the District.
However, this environment presents constraints during the rainy season, mainly in terms of
accessibility to some communities especially the Island and Peninsular communities.

14
Map 1 : Location of Krachi East District

15
A-2 DEMOGRAPHY AND HUMAN RESOURCES
A-2-1 Population size and distribution
According to the 2000 census results, the District of East Krachi has a population estimated at
75,058 persons with an annual growth rate of 2.8 %. The demographic projections show that the
population will increase from 88,796 to 96,569 inhabitants respectively from 2006 to 2009.
It is also necessary to mention that the demographic growth rate hides enormous disparities,
because it is higher in the rural areas than in the urban ones. This might be due to the low
academic level in the rural areas and to the lack of sensitization on maternity. The demographic
density for the planned period increases from 35 to 38 inhabitants by square kilometre from 2006
to 2009. Compared to the national average which is of 89 inhabitants, the District density is very
low.
As for the distribution by gender, it shows a slight numeric superiority of women who constitute
52.7 % of the total population against 47.3 % for men.
Table 1 : Population distribution by age and by gender
Age groups
Male
Female
TOTAL
0-14 years 17.8% 19.7% 37.5%
15-64 years 28 4% 31.4% 59.6%
Over 65 years 1.3% 1.6% 2.9%
TOTAL 47.3% 52.7% 100%
Source: 2008 Households surveys
The distribution by gender shows that the age grouping 15 to 64 years represents 59.6 %. It is
also the economically active age proportion while the dependent population which is aged 0 to 14
and over 65 constitutes 40.4 %.
As for the marital situation of the interviewed households, the married persons represent 93.2 %
of the sample with 74.9 % of monogamous, followed by widowers and bachelors who represent
respectively 4.4% and 2.4 %. The surveys also revealed that 86.5 % of the household heads are
male and that 72.2 % of them are over 40 years old.
16
The Christian religion is dominant with 64.1 % of the population, 41.2 % of which are
Protestants and 22.9 % Catholics. Follow the other confessions that are the Animists (20.6 %)
and the Muslims who represent 4.1 % of the sample.
A-2-2 Schooling level of the population
The governments which succeeded one another in Ghana implemented various policies aiming at
reducing the illiteracy rate of the population. This was illustrated by the adoption of a program
aiming at ensuring free education for all the “schoolable children. “
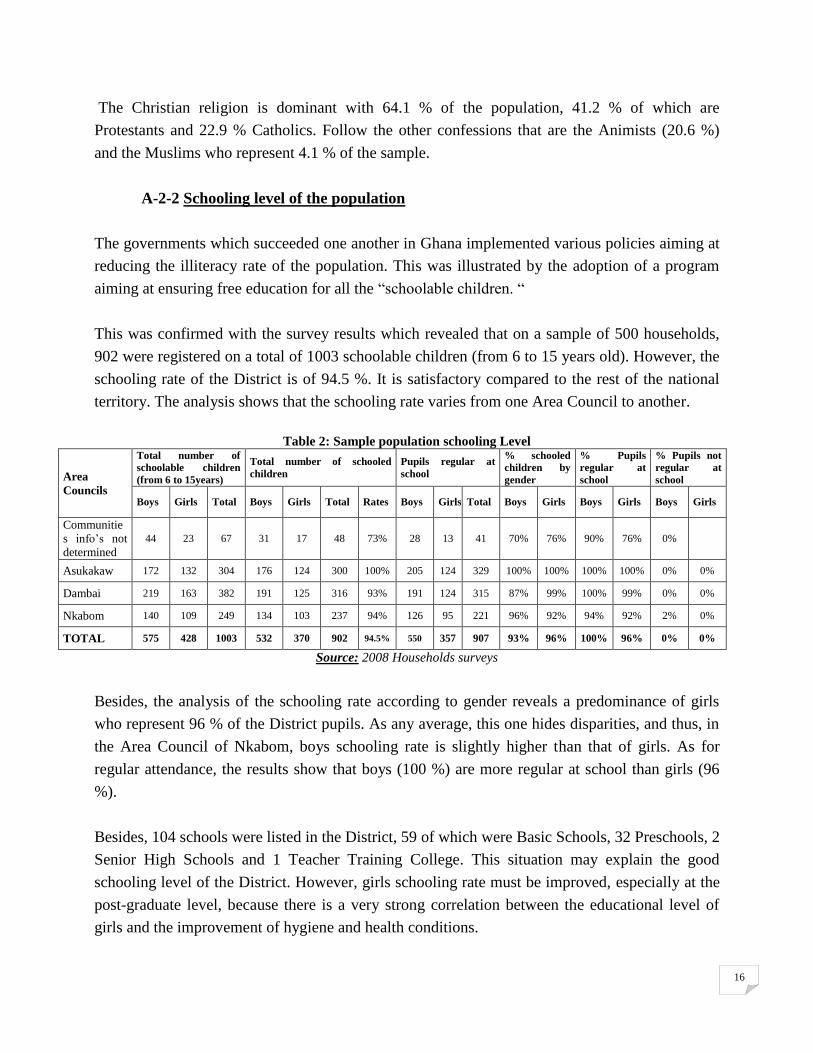
This was confirmed with the survey results which revealed that on a sample of 500 households,
902 were registered on a total of 1003 schoolable children (from 6 to 15 years old). However, the
schooling rate of the District is of 94.5 %. It is satisfactory compared to the rest of the national
territory. The analysis shows that the schooling rate varies from one Area Council to another.
Table 2: Sample population schooling Level
Area
Councils
Total number of
schoolable children
(from 6 to 15years)
Total number of schooled
children
Pupils regular at
school
% schooled
children by
gender
% Pupils
regular at
school
% Pupils not
regular at
school
Boys Girls Total Boys Girls Total Rates Boys Girls Total Boys Girls Boys Girls Boys Girls
Communitie
s info’s not
determined
44 23 67 31 17 48 73% 28 13 41 70% 76% 90% 76% 0%
Asukakaw 172 132 304 176 124 300 100% 205 124 329 100% 100% 100% 100% 0% 0%
Dambai 219 163 382 191 125 316 93% 191 124 315 87% 99% 100% 99% 0% 0%
Nkabom 140 109 249 134 103 237 94% 126 95 221 96% 92% 94% 92% 2% 0%
TOTAL 575 428 1003 532 370 902 94.5% 550 357 907 93% 96% 100% 96% 0% 0%
Source: 2008 Households surveys
Besides, the analysis of the schooling rate according to gender reveals a predominance of girls
who represent 96 % of the District pupils. As any average, this one hides disparities, and thus, in
the Area Council of Nkabom, boys schooling rate is slightly higher than that of girls. As for
regular attendance, the results show that boys (100 %) are more regular at school than girls (96
%).
Besides, 104 schools were listed in the District, 59 of which were Basic Schools, 32 Preschools, 2
Senior High Schools and 1 Teacher Training College. This situation may explain the good
schooling level of the District. However, girls schooling rate must be improved, especially at the
post-graduate level, because there is a very strong correlation between the educational level of
girls and the improvement of hygiene and health conditions.
17
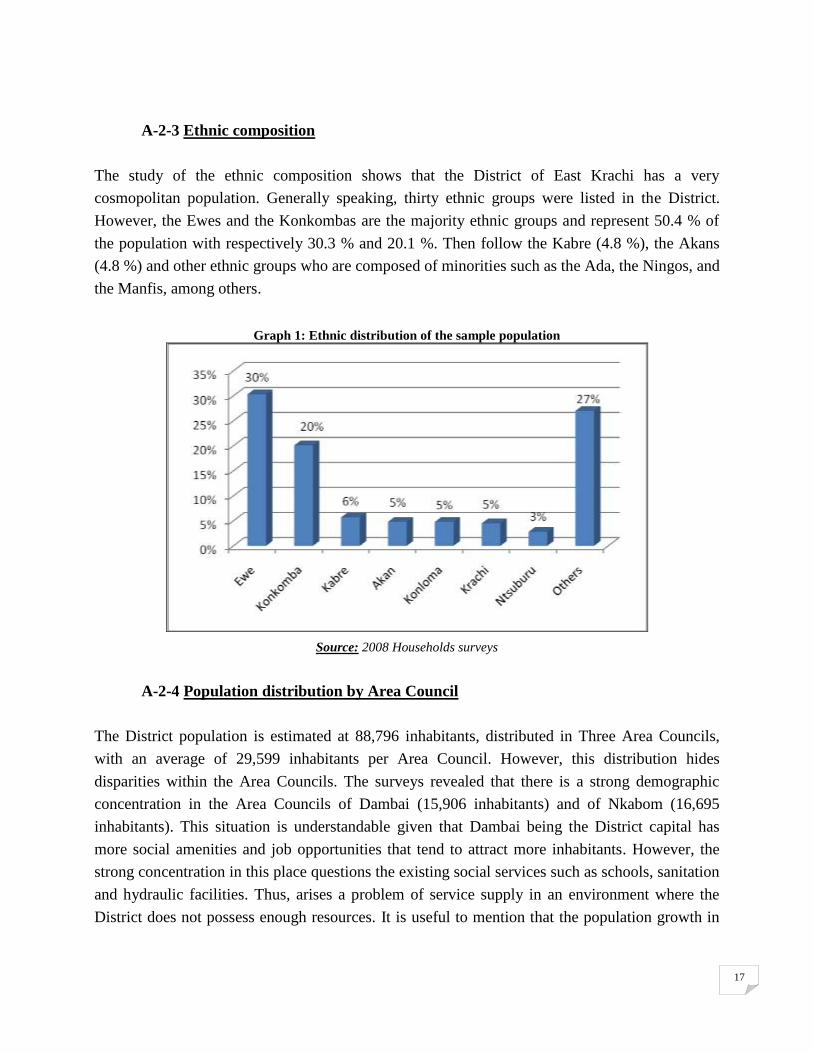
A-2-3 Ethnic composition
The study of the ethnic composition shows that the District of East Krachi has a very
cosmopolitan population. Generally speaking, thirty ethnic groups were listed in the District.
However, the Ewes and the Konkombas are the majority ethnic groups and represent 50.4 % of
the population with respectively 30.3 % and 20.1 %. Then follow the Kabre (4.8 %), the Akans
(4.8 %) and other ethnic groups who are composed of minorities such as the Ada, the Ningos, and
the Manfis, among others.
Graph 1: Ethnic distribution of the sample population
Source: 2008 Households surveys
A-2-4 Population distribution by Area Council
The District population is estimated at 88,796 inhabitants, distributed in Three Area Councils,
with an average of 29,599 inhabitants per Area Council. However, this distribution hides
disparities within the Area Councils. The surveys revealed that there is a strong demographic
concentration in the Area Councils of Dambai (15,906 inhabitants) and of Nkabom (16,695
inhabitants). This situation is understandable given that Dambai being the District capital has
more social amenities and job opportunities that tend to attract more inhabitants. However, the
strong concentration in this place questions the existing social services such as schools, sanitation
and hydraulic facilities. Thus, arises a problem of service supply in an environment where the
District does not possess enough resources. It is useful to mention that the population growth in

18
the rural areas is much more important than in the urban areas. Furthermore, access to the basic
social services is much more difficult in these places.
Table 3: Categorization of the District population
Area Councils Number of
communities Number of
households Population
Categorization of the
population
Asukawkaw 15 143 9,416 Less than 10,000 inhabitants
Dambai 27 121 15,906 From 10,000 to 20,000
inhabitants Nkabom 26 89 16,695
Total 68 354 42,017
Source: 2008 Households surveys
The population is distributed in 500 households with an average of 9 persons per household.
However, the categorization of communities according to the size of the population gives four
classes:
Thirty three communities have less than 500 inhabitants;
Sixteen communities have between 500 and 1000 inhabitants;
Two communities have between 1000 and 1,500 inhabitants; and
Four communities have more than 1,500 inhabitants with Dambai that counts
7,000 inhabitants.
However, it is necessary to mention that this land division hides enormous disparities within
the Area Councils and puts a real problem of human resources and equipments distribution
that are the basics of the District development.
19
Map 2 : Distribution of the District population
20
A-2-5 Urban/rural duality
The major part of the population of Krachi East lives in rural areas. However, the District
population, as for most of the Districts, is very ill-distributed. The 2005 surveys revealed that
there is a strong demographic concentration in the District capital, and thus, the largest
communities are found along the road of Dambai down to Asukawkaw. However, the strong
concentration in these Towns has harmful consequences on the use of the existing basic social
services (schools, health, sanitation facilities), on the farmlands and on the populations activities.
This situation is more difficult in the rural areas, given that the sanitation system coverage in the
rural communities is of about 2 % compared to the coverage rate in the urban areas that is of 6 %,
and which concentrates less people.
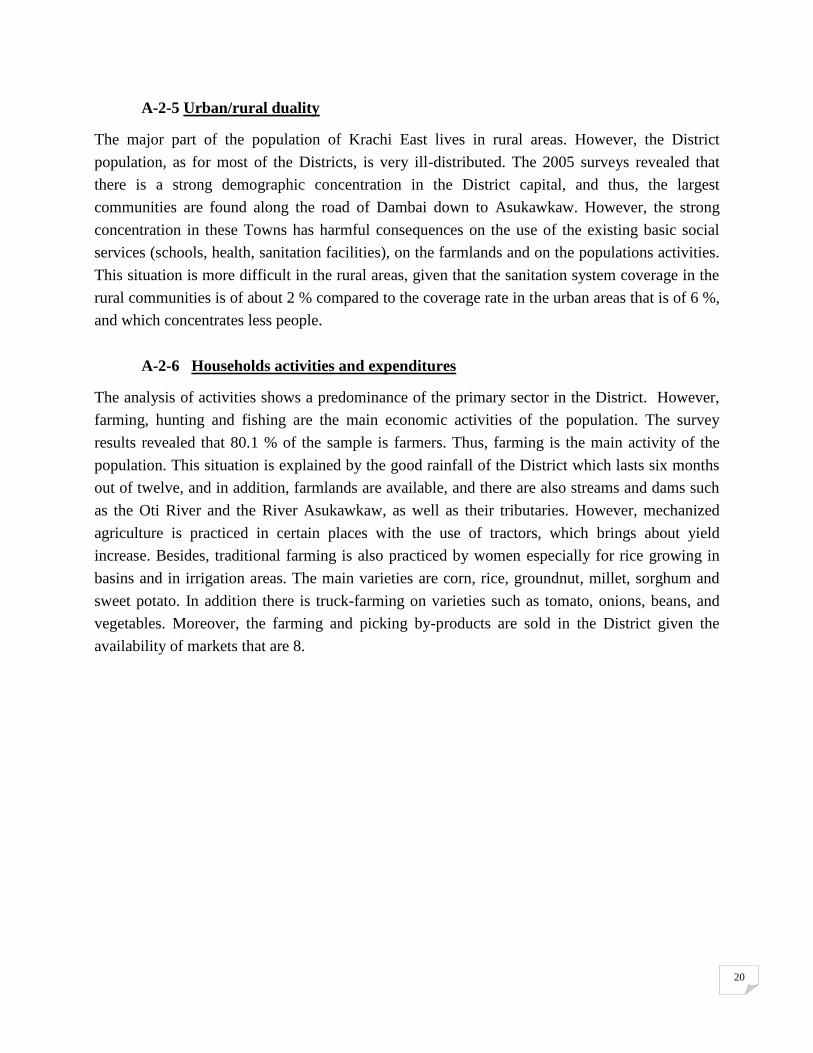
A-2-6 Households activities and expenditures
The analysis of activities shows a predominance of the primary sector in the District. However,
farming, hunting and fishing are the main economic activities of the population. The survey
results revealed that 80.1 % of the sample is farmers. Thus, farming is the main activity of the
population. This situation is explained by the good rainfall of the District which lasts six months
out of twelve, and in addition, farmlands are available, and there are also streams and dams such
as the Oti River and the River Asukawkaw, as well as their tributaries. However, mechanized
agriculture is practiced in certain places with the use of tractors, which brings about yield
increase. Besides, traditional farming is also practiced by women especially for rice growing in
basins and in irrigation areas. The main varieties are corn, rice, groundnut, millet, sorghum and
sweet potato. In addition there is truck-farming on varieties such as tomato, onions, beans, and
vegetables. Moreover, the farming and picking by-products are sold in the District given the
availability of markets that are 8.
21
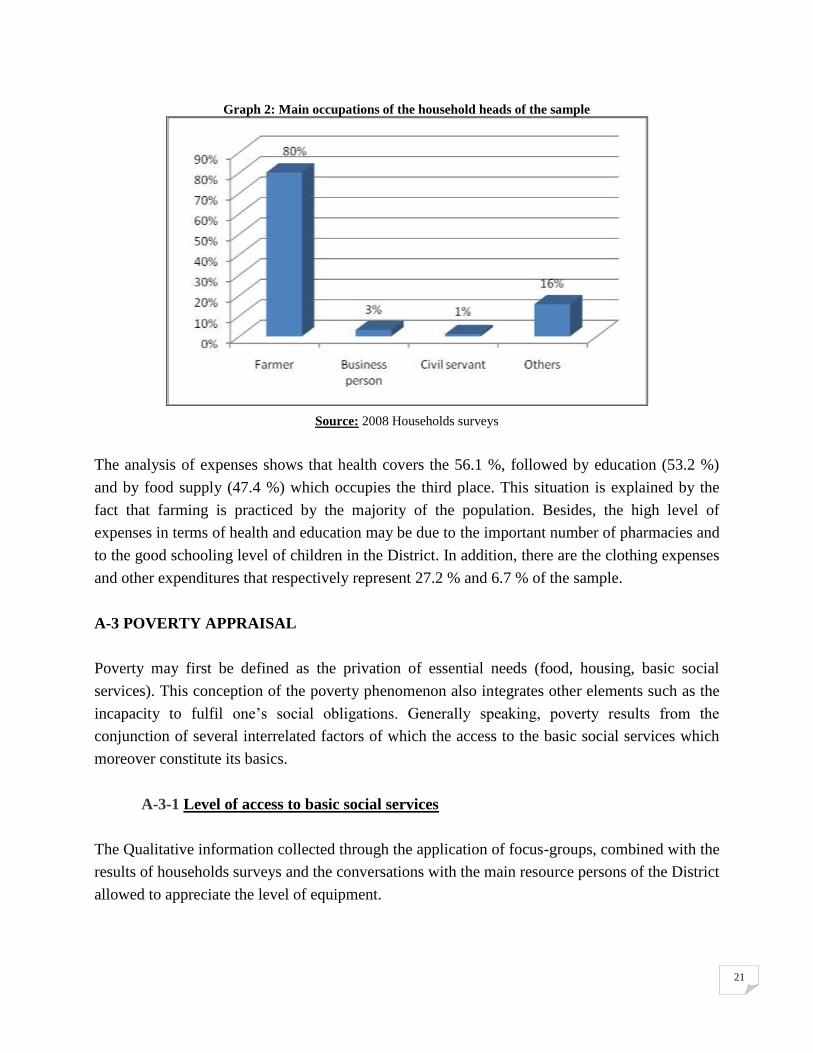
Graph 2: Main occupations of the household heads of the sample
Source: 2008 Households surveys
The analysis of expenses shows that health covers the 56.1 %, followed by education (53.2 %)
and by food supply (47.4 %) which occupies the third place. This situation is explained by the
fact that farming is practiced by the majority of the population. Besides, the high level of
expenses in terms of health and education may be due to the important number of pharmacies and
to the good schooling level of children in the District. In addition, there are the clothing expenses
and other expenditures that respectively represent 27.2 % and 6.7 % of the sample.
A-3 POVERTY APPRAISAL
Poverty may first be defined as the privation of essential needs (food, housing, basic social
services). This conception of the poverty phenomenon also integrates other elements such as the
incapacity to fulfil one’s social obligations. Generally speaking, poverty results from the
conjunction of several interrelated factors of which the access to the basic social services which
moreover constitute its basics.
A-3-1 Level of access to basic social services
The Qualitative information collected through the application of focus-groups, combined with the
results of households surveys and the conversations with the main resource persons of the District
allowed to appreciate the level of equipment.
22
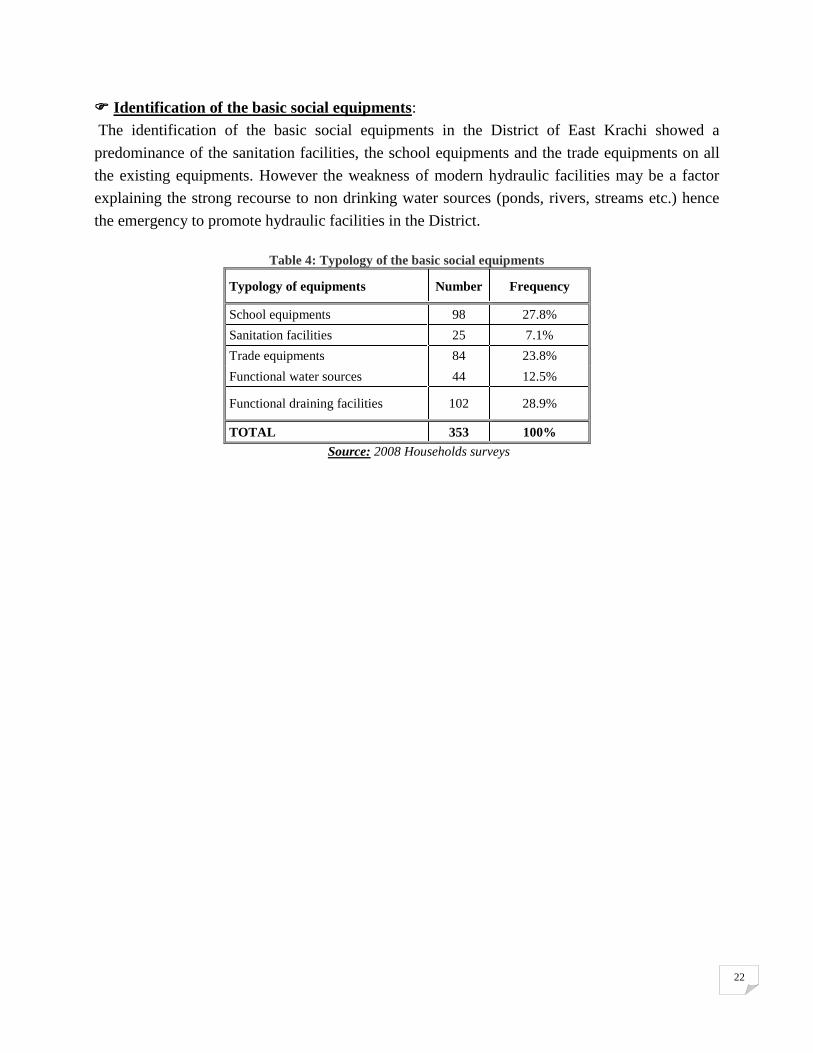
Identification of the basic social equipments:
The identification of the basic social equipments in the District of East Krachi showed a
predominance of the sanitation facilities, the school equipments and the trade equipments on all
the existing equipments. However the weakness of modern hydraulic facilities may be a factor
explaining the strong recourse to non drinking water sources (ponds, rivers, streams etc.) hence
the emergency to promote hydraulic facilities in the District.
Table 4: Typology of the basic social equipments
Typology of equipments Number Frequency
School equipments 98 27.8%
Sanitation facilities 25 7.1%
Trade equipments 84 23.8%
Functional water sources 44 12.5%
Functional draining facilities 102 28.9%
TOTAL 353 100%
Source: 2008 Households surveys
23
Map 3 : Location of the basic social equipments in the District

24
These equipments are more or less well distributed in the District, with a strong concentration in
the Area Council of Nkabom (53.4 %) which is also characterized by its demographic size;
whereas the Dambai Town Council area is weakly equipped with only 4.5 % of the District total.
Table 5: Access to equipment per Area Council
Access to equipment per
Area Council Number Frequency
NKABOM 179 53.4%
Asukawkaw 63 18.8%
Dambai 78 23.3%
Dambai town council 15 4.5%
TOTAL 335 100
Source: 2008 Households surveys
A-3-2 Analysis of the poverty situation
The poverty assessment in the District can be made through several factors. The majority of the
population is composed of farmers confronted with climatic changes marked by the drought
which brought about the decrease of agricultural yields. In addition, there is the overexploitation
of the forest (for charcoal), which contributes to worsen poverty.
The vulnerability analysis is also centred on women, children, the disabled persons and those
affected by HIV/AIDS. Besides, regarding the threat of HIV/AIDS, the District is as vulnerable
as all the rest of the country. The main factor which causes the spread of the virus is the strong
poverty prevalence which compels people, in particular girls, to have behaviour that leads them
to prostitution. In addition, there is the inaccessibility of women to land and to financial
resources. Another factor which predisposes the populations is the strong presence of
onchocerciasis in certain parts of the District such as Asukawkaw and Dormabin called the
"oncho zone ". Moreover, statistics revealed that 15 % of the population were infected by the
parasite and 167 persons became blind. Another factor threatening the populations is the
frequency of village fires that destroy a whole place. All these combined effects contribute to the
worsening of poverty in the District.
However, the drinking water and health facilities coverage rate is a fundamental indicator for the
District vulnerability analysis. Indeed this coverage rate is as low in rural areas as in urban areas
and represents respectively 7.1 % and 17 %. Moreover, this disparity must be subjected to
question in order to reduce poverty all over the national territory.
25
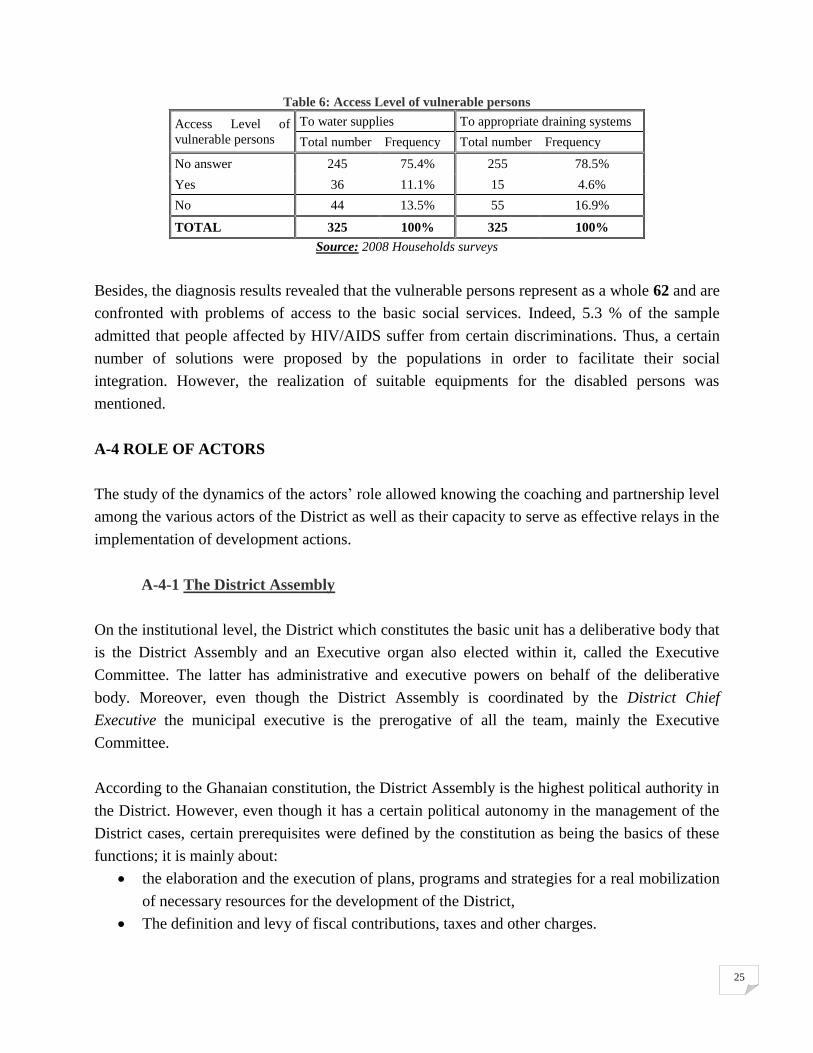
Table 6: Access Level of vulnerable persons
Access Level of
vulnerable persons
To water supplies To appropriate draining systems
Total number Frequency Total number Frequency
No answer 245 75.4% 255 78.5%
Yes 36 11.1% 15 4.6%
No 44 13.5% 55 16.9%
TOTAL 325 100% 325 100%
Source: 2008 Households surveys
Besides, the diagnosis results revealed that the vulnerable persons represent as a whole 62 and are
confronted with problems of access to the basic social services. Indeed, 5.3 % of the sample
admitted that people affected by HIV/AIDS suffer from certain discriminations. Thus, a certain
number of solutions were proposed by the populations in order to facilitate their social
integration. However, the realization of suitable equipments for the disabled persons was
mentioned.
A-4 ROLE OF ACTORS
The study of the dynamics of the actors’ role allowed knowing the coaching and partnership level
among the various actors of the District as well as their capacity to serve as effective relays in the
implementation of development actions.
A-4-1 The District Assembly
On the institutional level, the District which constitutes the basic unit has a deliberative body that
is the District Assembly and an Executive organ also elected within it, called the Executive
Committee. The latter has administrative and executive powers on behalf of the deliberative
body. Moreover, even though the District Assembly is coordinated by the District Chief
Executive the municipal executive is the prerogative of all the team, mainly the Executive
Committee.
According to the Ghanaian constitution, the District Assembly is the highest political authority in
the District. However, even though it has a certain political autonomy in the management of the
District cases, certain prerequisites were defined by the constitution as being the basics of these
functions; it is mainly about:
the elaboration and the execution of plans, programs and strategies for a real mobilization
of necessary resources for the development of the District,
The definition and levy of fiscal contributions, taxes and other charges.

26
Nevertheless, there is a traditional system of governance steered by the traditional leaders. This
traditional governance is led by the Senior Nana Krachi Wura who lives in Krachi and who is
represented in all the communities of the District.
A-5 WATER, SANITATION AND HYGIENE ISSUES
The study of the institutional management of water and draining in Ghana reveals that the
Ministry of Water Resources, Works and Housing (MoWRWH) carries out the various
formulations of sectoral policies, coordinates and steers the activities relating to water, hygiene
and draining. It is supported in this task by the Water Resources Commission (WRC), the
Environmental Protection Agency (EPA), the Public Utilities Regulatory Commission (PURC),
Community Water and Sanitation Agency and the District Assembly. Thus, the Ministry and the
various aforementioned agencies coordinate the implementation of the water sector, from the
production to the supply in rural areas as well as in urban areas.
In a more specific way, urban water supply management is ensured by the Ghana Water
Company Limited (GWCL). This confers to water management in urban areas a quasi-public
aspect given that the GWCL is supported by a private agency (Aqua Vitens Rand).
As for rural areas, water management is ensured by the Community Water and Sanitation Agency
(CWSA) which is in charge of the management of the water/draining sector in the rural and urban
areas of small demographic size. For that purpose, it supports the District Assembly which
identifies the District Water and Sanitation Teams (DWST). Apart from this role, the District
Assembly proceeds to the selection of the final beneficiaries, to the setting up of water sources
and approves the pricing of water. This organization gives to water management a quite
decentralized aspect given that the technical and financial aspects are executed with the actual
involvement of the beneficiary communities. For reminder, the latter generally give a 5 %
contribution in the realization of capital cost of construction.
The support of development partners in this sector generally concerns the technical aspect and
capacity building for people in charge of the management of the water and draining sectors at the
local level.
A-5-1 Study of the drinking water sector
In the District of East Krachi, water management is ensured by the water and sanitation
development board and the WATSAN committees. These are composed of the key community
elected members for a period of up to four years. The Water Board and the WATSAN

27
Committees are usually under the supervision of the DWST and are accountable to the
community. Their main actions are to ensure the operation and maintenance of the facilities
relating to water and sanitation. However, the coordination of aspects relating to the planning of
actions related to water and sanitation is ensured by the local planning services.
A-5-1-1 Access and usage of water
The analysis of the situation regarding the District water supply requires a site inventory on the
various water supply sources, as well as on their functionality, accessibility.
a- Sources of water supply
Water supply in the District of East Krachi is made from various water sources. The main sources
of drinking water supply are boreholes (36 %), followed by the standpipes (3 %) and the private
water-service pipes (1 %). It is necessary to clarify that these sources are almost the same both in
the rainy season and in the dry season.
Table 7: The main sources of water supply
Main sources of water supply In the dry season In the rainy season
Total number % Total number %
Boreholes 81 36% 93 35%
Standpipes 38 3% 38 3%
Traditional wells equipped with pumps 0 0% 0 0%
Private water service pipes 2 0.3% 5 1%
Other 214 60% 196 58%
Total 338 100% 315 100%
Source: 2008 Households surveys
However, the inhabitants of the District of East Krachi mainly get water from non drinking
sources as declared about 60 % of the households. These water sources are generally constituted
of surface waters, mainly rivers, streams and lakes. Besides, the recourse to these various sources
varies according to the seasons. In the dry season, the non drinking water sources are more used,
because most of the drinking water sources go through a phreatic decline.
The recourse to non drinking water sources is also explained by the presence of very dense
hydrographic network with the Oti and Asukawkaw as well as their tributaries; but also by the
geographic estrangement of certain functional water sources mentioned by 7 % of the
households, and finally by the lack of financial means revealed by 3 % of the sample.
It is also necessary to say that there are communities that do not have drinking water sources: it is
the case of Kolikope Kpandokope, Nanso, Napoa, and Akokrowa in the Area Council of
Asukawkaw. Besides, in the Area Council of Nkabom are concentrated more than half of the
water sources (127 out of 246). This fact is explained by the fact that 45 % of communities are
located in this place.

28
Map 4 : Location of hydraulic facilities

29
b- Functionality of water sources
The functionality of water sources in the District of East Krachi is far from being satisfactory
given that the hydraulic facilities that are in good working conditions are of a very limited
number compared to the existing total. Indeed, the drinking water sources are 246 in total, of
which only 12 are functional, meaning a functionality rate of 6 %. This rate varies from one area
to another; the highest functionality rate is found in Asukawkaw (8%) and the lowest in Nkabom
(3 %).
Table 8: Level of functionality of hydraulic facilities
Area Councils Functional Non functional Functionality rate
Asukawkaw 3 35 8%
Dambai 5 71 7%
Nkabom 4 123 4%
Total 12 229 6%
Source: 2008 Households surveys
Generally speaking, one can say that the District is very ill-provided with hydraulic facilities (93)
of which 76 are functional). So, it is necessary to repair the non functional equipments that are
already implemented and even to create others for a better coverage of the drinking water
requirements of the all the communities in the District.
c- Accessibility of water sources
Accessibility to the drinking water sources will be analyzed through the distance separating water
sources from the living places, the time spent to fetch water, the financial accessibility, as well as
the quantity of available water per day and per person.
Physical accessibility :
It concerns the distance that the populations have to cover in order to fetch drinking water. The
surveys revealed that 56 % of the sample are not satisfied with the location of water sources
whatever the season. On the basis of 500 meters standard distance which is the reference in the
country, one can say that 34 % of the households are today penalized regarding to the sites of
hydraulic facilities. Moreover 15 % of the households cover more of 1km to fetch water. But
most of the households are not too far from water sources. Thus, 40 % live at less than 200m
away from the water sources, and 22 % between 200 and 500m.
However, this accessibility hides disparities between the Area Councils. Thus, 69.2 % of the
population of Dambai cover less than 200m unlike the population of Nkabom, 30.9 % of which
cover 1 to 2km to fetch water. However, it is necessary to mention that the constraints related to
distance are more accentuated during the dry season.
30
Time spent to fetch water: the time spent to fetch water can be explained by several
factors of which essentially, the distance to be covered to reach the water sources, the
crowds around water sources, but also type of dewatering. Indeed, the survey results
revealed that 428 % spend more of 30mn in the dry season, while in the rainy season 341
% spend the same time. This emphasizes the importance of the non drinking water
sources for the satisfaction of the populations water needs, given that these sources are
much more abundant in the rainy season, which explains the short time spent to fetch
water.
The time spent to fetch water varies according to Area Councils. Thus, in the Area Council of
Asukawkaw, more than half of the sample (63.4 %) spends more than 30mn to fetch water,
unlike in Dambai where only 23.3 % spend the same time.
Accessibility by quantity: the situation for the accessibility by quantity can be analyzed
with a great nuance because of the strong presence of perennial surface waters. However,
the water consummation quantity is much more important in the rainy season than in the
dry season. This is explained by the availability of rainy waters. The water collected is
kept in basins and buckets, among others. Besides, the weakness of the hydraulic
facilities and the estrangement of the water sources are the main factors influencing
negatively the quantity of used water.
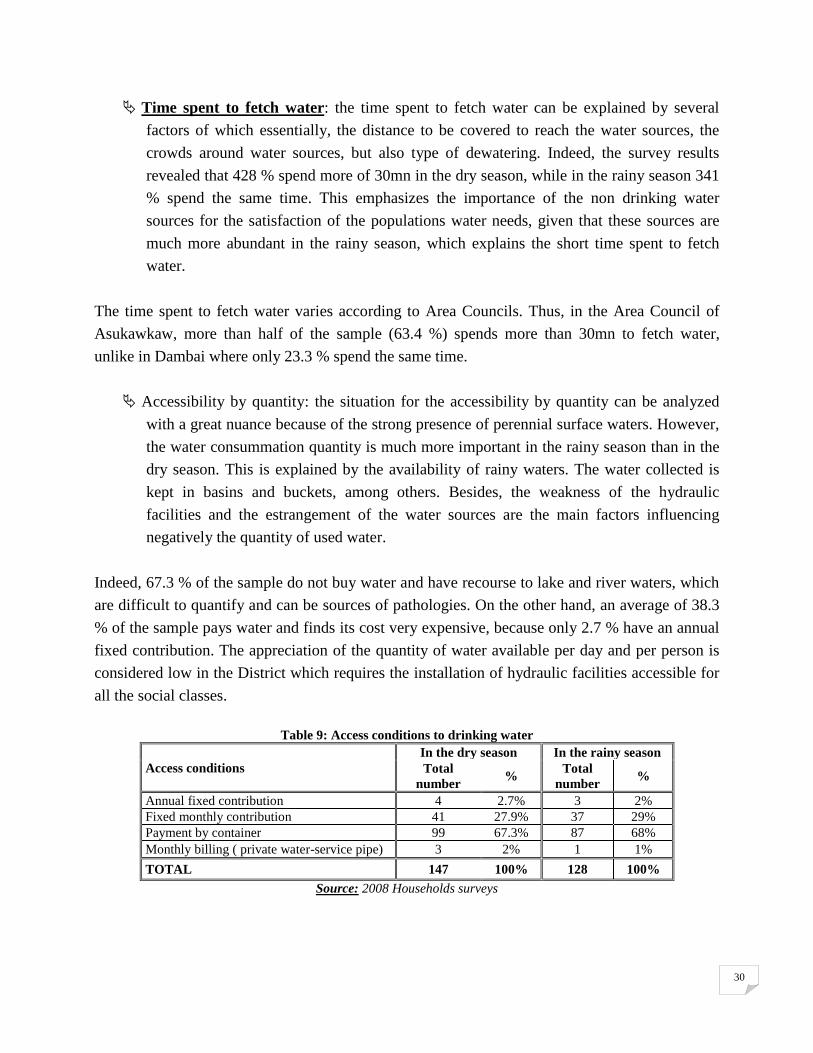
Indeed, 67.3 % of the sample do not buy water and have recourse to lake and river waters, which
are difficult to quantify and can be sources of pathologies. On the other hand, an average of 38.3
% of the sample pays water and finds its cost very expensive, because only 2.7 % have an annual
fixed contribution. The appreciation of the quantity of water available per day and per person is
considered low in the District which requires the installation of hydraulic facilities accessible for
all the social classes.
Table 9: Access conditions to drinking water
Access conditions
In the dry season In the rainy season
Total
number %
Total
number %
Annual fixed contribution 4 2.7% 3 2%
Fixed monthly contribution 41 27.9% 37 29%
Payment by container 99 67.3% 87 68%
Monthly billing ( private water-service pipe) 3 2% 1 1%
TOTAL 147 100% 128 100%
Source: 2008 Households surveys
31
The payment methods used are numerous, but the payment per container is the most frequent one,
as expressed about 67.5 % of the households. The other payment methods are the monthly and
annual fixed contribution adopted respectively by about 28 % and 2.5 % of the households. In
tiny portion of the population receives a monthly invoice because having a private water-service
pipe.
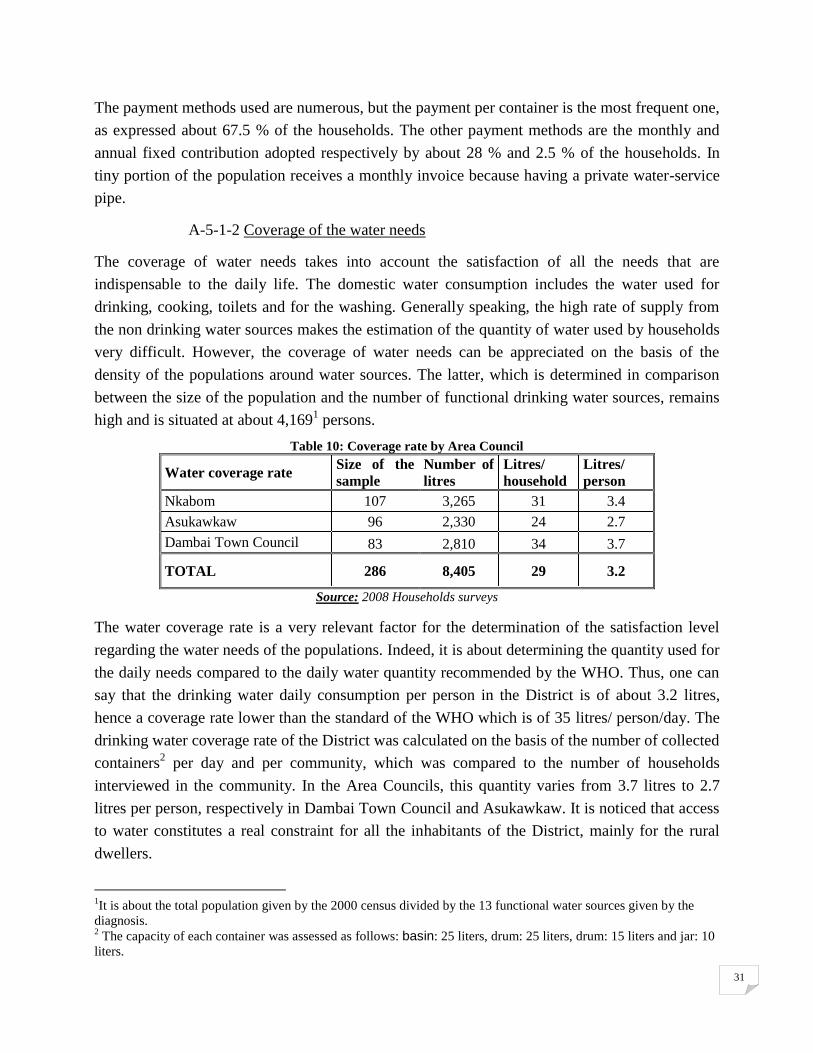
A-5-1-2 Coverage of the water needs
The coverage of water needs takes into account the satisfaction of all the needs that are
indispensable to the daily life. The domestic water consumption includes the water used for
drinking, cooking, toilets and for the washing. Generally speaking, the high rate of supply from
the non drinking water sources makes the estimation of the quantity of water used by households
very difficult. However, the coverage of water needs can be appreciated on the basis of the
density of the populations around water sources. The latter, which is determined in comparison
between the size of the population and the number of functional drinking water sources, remains
high and is situated at about 4,1691 persons.
Table 10: Coverage rate by Area Council
Water coverage rate Size of the
sample
Number of
litres
Litres/
household
Litres/
person
Nkabom 107 3,265 31 3.4
Asukawkaw 96 2,330 24 2.7
Dambai Town Council 83 2,810 34 3.7
TOTAL 286 8,405 29 3.2
Source: 2008 Households surveys
The water coverage rate is a very relevant factor for the determination of the satisfaction level
regarding the water needs of the populations. Indeed, it is about determining the quantity used for
the daily needs compared to the daily water quantity recommended by the WHO. Thus, one can
say that the drinking water daily consumption per person in the District is of about 3.2 litres,
hence a coverage rate lower than the standard of the WHO which is of 35 litres/ person/day. The
drinking water coverage rate of the District was calculated on the basis of the number of collected
containers2 per day and per community, which was compared to the number of households
interviewed in the community. In the Area Councils, this quantity varies from 3.7 litres to 2.7
litres per person, respectively in Dambai Town Council and Asukawkaw. It is noticed that access
to water constitutes a real constraint for all the inhabitants of the District, mainly for the rural
dwellers.
1It is about the total population given by the 2000 census divided by the 13 functional water sources given by the
diagnosis. 2 The capacity of each container was assessed as follows: basin: 25 liters, drum: 25 liters, drum: 15 liters and jar: 10
liters.

32
Map 5 : Drinking water coverage rate

33
A-5-2 Access to the sanitation facilities
A-5-2-1 Identification and typology of the sanitation facilities
In the District of East Krachi, private sanitation facilities (households) and public ones
(organizations, districts etc.) were listed.
The private sanitation facilities: They are located in houses and are essentially
constituted of traditional latrines (84.6 %), of KVIP (4.2 %) and others (12 %). The
survey results revealed that the District populations are weakly equipped with modern
sanitation facilities. The few facilities listed that are in conformity with the hygiene
standards are realized with the support of the development partners. Indeed, 57.6 % of
the sample benefited from material support, 24.2 % from technical support and 18.2 %
from financial support.
Nevertheless, by referring to the data supplied at the level of the Area Councils in terms of
sanitation facilities, the latrine installation rate of the District which is of about 27 % was
determined. However, the latter has a very high variation level according to the Area Councils of
the study. Thus, it is of 23 % in Asukawkaw and 12 % in Dambai. Furthermore, the bulk of
functional latrines are located in communities that are not part of the study, representing 55 out of
the 97 facilities listed.
Besides, 78.1 % of the population do not have family latrines; several reasons were evoked to
justify this low rate of latrine installation; 82.9 % mentioned to the lack of financial means, for
6.2 % it is the lack of space and 3.1 % mentioned socio-cultural reasons. Generally, the latrines
listed are essentially located in the urban areas.
The public sanitation facilities: They are mainly located in the public spaces: schools
and markets, among others. However, in the District of East Krachi 35 public toilets were
listed, of which 23 are functional. The surveys data show that the public sanitation
facilities are very ill-distributed in the District. Of all the latrines (7 of which 1 is non
functional), only 5 are respectively in Asukawkaw and in Dambai. However, this low
equipment in latrines is more stressed in the rural areas, which urges the populations to
have recourse to other types of privies that are not in conformity with the hygiene
standards such as the bush and along the streams. This therefore causes a real public
health problem. That is why it is urgent to build appropriate sanitation facilities in
schools and public places in order to ensure the well being of populations.

34
Map 6: Location of sanitation facilities
35
Water and sanitation management: The Water and Sanitation Committees (WATSAN)
and the Water and Sanitation Development Boards are in charge of the water and
sanitation management in the District. These WATSAN are constituted in committees
having received a training allowing them a good management of this sector. The
WATSAN concentrates its activities in the operation and management of hydraulic
facilities in the District and also sees to the promotion of hygiene.
A-5-2-2 Analysis of the relation water/hygiene/health
Water is an important element in the determination of the hygiene and health conditions. The
quality of water is appreciated through the conservation methods and through its use in the
households. The analysis of the quality of the water consumed allows determining the relation
between water, hygiene and health.
General hygiene conditions: The hygiene conditions depend on several factors such as
the quality of the water consumed, its conservation and the maintenance of the sanitation
facilities. Thus, the results revealed that 54.2 % of the sample does not appreciate the
quality of the water they consume. Thus, 65.8 % consider it is foul, 21.9 % of the sample
declares the presence of smells and 9.7 % evoked bad taste. This phenomenon is
explained by the quasi-absence of drinking water supply sources and that the streams are
proliferation sites for certain diseases such as the guinea worm, onchocerciasis, and
typhoid among others. Besides, the surveys showed that the drinking water storage
containers are well taken care of, because they are covered by 83.1 % of the households
and cleaned several times a week by 91.2 %. This is a good method to reduce the
proliferation of waterborne diseases.
The maintenance of the sanitation facilities is a very frequent practice in the households as
expressed by 58.9 % of the sample. This task is generally carried out by women and girls of the
sample households. However, these very hygienic practices are weakened by the low level of
latrine installation in the households, which stresses the recourse to unhealthy practices.
Moreover, surveys showed that 51.3 % of the sample has recourse to nature more exactly along
the rivers and in the ravines created by the erosion. This situation questions the problems of
hygiene and public health thus favouring the development of certain faecal diseases such as the
guinea worm and bilharziasis. Therefore, the emergency in the District is to promote private
sanitation facilities in order to improve the populations living conditions.

36
Map 7: Sanitation coverage rate

37
Waste Management
The elimination of the solid waste: Garbage management is a major preoccupation for the
District. Only one single dump was listed, that of Yariga which is at 14km from Dambai.
The latter has a limited number of containers to face the solid waste of the Area Council.
Indeed, a large share of the population has recourse to the illegal garbage dumps and to
the ravines created by the erosion.
The evacuation of the liquid wastes: There are almost no sewer systems in the District.
The households pour waste waters directly in the nature, around the houses and in the
ravines. This situation leads to the proliferation of mosquitoes that are the vectors of
diseases (malaria) present in the District all year long. Studies revealed that the coverage
of the District sanitation system was estimated at 2 % in August, 2006. Generally
speaking, the District always remains confronted with a problem of public health which
requires a set of measures such as the intensification of the sanitation facilities and the
sensitization of the populations for the adoption of good hygienic practices.
A-6 SYNTHESIS OF THE DIAGNOSIS ELEMENTS
The analysis of the demographic and socio economic data reveals that the District of East Krachi,
which is one of 18 Districts of the Volta region, concentrates a population estimated at 88,799
(2008) inhabitants distributed in Three Area Councils and 210communities. Its population that is
in majority young is dominated by the active fringe that is the age grouping from 15-64 years,
and males. The study of the academic level shows a very high schooling rate (94.5 %). However,
it is higher for girls (96 %) than for boys.
The District of East Krachi is rural in majority with a good practice of mechanized farming.
Indeed, the analysis of activities led by the persons and their living standard allow saying that the
farming sector detains the largest proportion of the population and that women are well
represented in this sector.
On the institutional level, the Ghanaian legislation confers to territorial communities the
necessary power for the development of their respective area. As such, the District Assembly
which is the basic political authority of the District executes all the development activities of
Krachi East, with the support of certain decentralized technical services.

38
In the sector of water/sanitation, the main hydraulic facilities remain pump-equipped wells,
boreholes and standpipes. It is necessary to mention that the sanitation network is rather weak.
The diagnosis results show major constraints that arise within the framework of the access to
water, with a low coverage of the drinking water needs. However, the populations do not
succeed in satisfying standards required by the WHO that is 35 litres. This situation forces more
than 50 % of the population to fetch water from non drinking water sources. The insufficiency of
the sanitation facilities, with an average rate of 27 %, favours the common practice which is open
defecation to any available glade. Then the problem of hygiene and public health that has harmful
consequences with the proliferation of certain waterborne diseases such as onchocerciasis,
diarrhoea, guinea worm, bilharziasis and scabies arises.

39
B- STRATEGIC ORIENTATIONS FOR WATER AND SANITATION ACCESS
IMPROVEMENT
The DWSP constitutes an orientation document of Krachi East District activities in terms of
water and sanitation access improvement. It constitutes also a reference framework for any
intervention in the water and sanitation sector at the District level. Considering difficulties
identified by local populations, formulations have been made to overcome those deficits.
These development actions selected by populations to overcome difficulties and promote
sustainable access to water and sanitation are rendered in three main strategic orientations:
the improvement of access to potable water sources;
the improvement of the access to public and private sanitation facilities ;
capacity building,
These various orientations are not at all independent one another. Its implementation will enable
achieving the objectives set by the District Assembly, as far as sustainable development is
concerned
B-1 STRATEGIC ORIENTATIONS
The diagnosis on the water, hygiene and sanitation sector revealed several constraints impeding
the development of Krachi East District. Thus, to improve the situation, as far as access to
potable water and sanitation facilities are concerned, and promote a sustainable development,
local players identified the main actions to be implemented.
Priorities for Krachi East District development
The participative diagnosis enabled the populations of Krachi East District bringing out the most
arduous constraints and prioritizing the actions to be conducted in order to improve access to
water and sanitation facilities and promote hygiene as well. Regarding access to water and
sanitation facilities, the formulation of the priorities defines the following local development
axis:
improvement of access to water
improvement of access to sanitation facilities,
promotion of local governance.
The various action are not independent one another but are in the contrary closely linked, hence a
necessity for it to be include in a global and integrated strategy.
40
Constraints to pursuing development priorities
Krachi East District faces several constraints, namely:
WATER
Shortage of modern watering points.
Distant location of modern watering points.
High prevalence of resort to non potable water sources
HYGIENE/SANITATION
Low rate of latrine availability.
Insufficient number of family latrines
Insufficient number of institutional latrines
Absence of appropriate solid and liquid waste disposal
Prevalence of bad hygiene habits and practices
B-2 IDENTIFICATION OF ACTIONS
B-2-1 Improved access to water
Basis for action
Assessment of the water access shows that communities are experiencing serious difficulties as a
result of the insufficient water points in the District. This constraint of access is also due to the
financial capacities of households, considering the large majority of household heads who state
that the water cost is unaffordable. Similarly, the limited financial capacities hinder the
development of an adequate system for reclaiming/managing rain water.
Actions required:
Construction of boreholes throughout the District,
Construction of small town Water System and large Town Water System in big cities such
as Dambai and Asukawkaw,
Systems for collecting rain water,
Mechanisation of some water points.
B-2-2 Improved access to sanitation infrastructures
Basis for action
Overall, latrine construction is very low with few household latrines observed. It is noted a use of
latrines which do not comply with hygiene standards but also an inadequate management of
liquid and solid waste. To address this, there is a need to first increase the sanitation

41
infrastructures and then sensitise community members on the compliance with good hygiene
principles.
Actions required
The main actions identified include the promotion of household latrines in the District through
the construction of latrines in institutions and other heavily attended places.
Table 11: Summary of issues and solutions
Areas Issues Solutions Objectives
Water
Limited number of
modern water points
Construction of boreholes
To improve community access to
quality and quantity water
Construction of Small Town Water
System and Large Town Water
System
Remoteness of the modern
water points System to collect rain water
String reliance/resort to
unsafe water sources Mechanisation of some water points
Hygiene/
sanitation
Limited number of
household latrines
Promotion and support for household
latrines To improve access to sanitation
infrastructures and promote
individual & collective hygiene Lack of latrines in
institutions Provision of institutional latrines
Source : Planning workshop, July 2008

42
CONCLUSION
Krachi East owns its DWSP with an implementation Plan which includes all actions required and
assesses the local finances to be invested for the local development with the involvement of all
stakeholders.
The methodology used in developing the SDP was a comprehensive institutional diagnosis of all
stakeholders with a focus on their roles, responsibilities, interests, etc in each programme.
Finally, a practical approach has been immediately used to market the plan; this approach has
based on the local communities’ needs as well as the capacities of the strategic partners in the
District.
Each strategic partner will work in line with its role in the project and following an
implementation plan. To this effect, the District needs to own a monitoring and evaluation system
to be used as both a guide and management tool for the following purposes:
- Ensure community participation in all stages of the implementation;
- Jointly identify strengths and weaknesses of actions;
- Keep the relevant stakeholders (supported people, technicians, project/programme staff,
donors) updated on the implementation level;
- Follow the progress of the project implementation using criteria and data base initially
agreed upon by stakeholders (project owners, contractors, monitoring officer, etc)
- If necessary, make adjustments using the lessons learnt.
Related Documents


