Macromolecular Nanotechnolgy Kinetics of nucleation and crystallization of poly(e-caprolactone) – Multiwalled carbon nanotube composites Evgeny Zhuravlev a,⇑ , Andreas Wurm a , Petra Pötschke b , René Androsch c , Jürn W.P. Schmelzer a , Christoph Schick a a University of Rostock, Institute of Physics, Wismarsche Str. 43-45, 18051 Rostock, Germany b Leibniz Institute of Polymer Research Dresden, Hohe Str. 6, 01069 Dresden, Germany c Martin-Luther-University Halle-Wittenberg, Center for Engineering Sciences, 06099 Halle/S., Germany article info Article history: Received 4 October 2013 Received in revised form 10 December 2013 Accepted 18 December 2013 Available online 28 December 2013 Keywords: Crystal nucleation Nucleating agent efficiency Polymers Fast scanning calorimetry MWCNT abstract The nucleation efficiency of multiwall carbon nanotubes (MWCNT) in poly(e-caprolactone) (PCL), as an example, was tested for a wide range of temperatures and cooling rates and compared to the efficiency of homogeneously formed nuclei. The temperature range below the maximum of crystallization rate is generally not accessible for non-isothermal cooling experiments because the sample becomes amorphous at the needed cooling rates. Isother- mal experiments after fast quenches extend the temperature range down to and below the glass transition. The employed differential fast scanning calorimeter (DFSC) allows cooling at rates up to 100,000 K/s and precise adjustment and control of isothermal conditions in the time range from 10 4 to 10 4 s and longer. As shown in previous work, heterogeneous crystal nucleation dominates at low supercooling, revealing a significant dependence of crystallization rate on MWCNT concentration. Nevertheless, no saturation of the nucleation activity at a MWCNT loading of 0.2–0.5 wt% as seen in slow DSC experiments was observed at the much higher cooling rates employed here. At high supercooling, where homoge- neous nucleation is prevalent, the addition of MWCNT neither enhances nor reduces the crystallization rate. At the temperature of maximum homogeneous nucleation rate, forma- tion of homogeneous nuclei always dominates crystallization. Ó 2014 Elsevier Ltd. All rights reserved. 1. Introduction Nucleating additives are widely used to initiate crystal- lization during processing of polymers since a number of properties of the final product can be modified by tailoring crystallization. The direct influence of the degree of crys- tallinity on optical, mechanical and dielectric properties was investigated by several authors, e.g. [1–4]. In particu- lar, it is known that the increase of the amount of nucle- ation sites may lead to the formation of a large number of crystals which do not organize in a higher-order super- structure. Absence of spherulites in semicrystalline polymers has been shown to be beneficial to obtain highly transparent films, of high stiffness and simultaneously high ductility. In any such attempt to initiate crystallization by heter- ogeneous nucleation sites, one has to appropriately account for the effect of homogeneous nucleation too. By homogeneous nucleation, under certain conditions, a very large number of nuclei can be formed [5–7] and therefore it is expected to compete with nuclei formation caused by nucleating additives. As one prerequisite, a large und- ercooling (temperature sufficiently below the melting tem- perature) has to be achieved, and therefore a certain high 0014-3057/$ - see front matter Ó 2014 Elsevier Ltd. All rights reserved. http://dx.doi.org/10.1016/j.eurpolymj.2013.12.015 ⇑ Corresponding author. Tel.: +49 381 498 6888; fax: +49 381 498 6882. E-mail address: [email protected] (E. Zhuravlev). European Polymer Journal 52 (2014) 1–11 Contents lists available at ScienceDirect European Polymer Journal journal homepage: www.elsevier.com/locate/europolj MACROMOLECULAR NANOTECHNOLOGY

Welcome message from author
This document is posted to help you gain knowledge. Please leave a comment to let me know what you think about it! Share it to your friends and learn new things together.
Transcript
European Polymer Journal 52 (2014) 1–11
Contents lists available at ScienceDirect
European Polymer Journal
journal homepage: www.elsevier .com/locate /europol j
Macromolecular Nanotechnolgy
Kinetics of nucleation and crystallizationof poly(e-caprolactone) – Multiwalled carbonnanotube composites
0014-3057/$ - see front matter � 2014 Elsevier Ltd. All rights reserved.http://dx.doi.org/10.1016/j.eurpolymj.2013.12.015
⇑ Corresponding author. Tel.: +49 381 498 6888; fax: +49 381 4986882.
E-mail address: [email protected] (E. Zhuravlev).
LOG
Y
Evgeny Zhuravlev a,⇑, Andreas Wurm a, Petra Pötschke b, René Androsch c,Jürn W.P. Schmelzer a, Christoph Schick a
a University of Rostock, Institute of Physics, Wismarsche Str. 43-45, 18051 Rostock, Germanyb Leibniz Institute of Polymer Research Dresden, Hohe Str. 6, 01069 Dresden, Germanyc Martin-Luther-University Halle-Wittenberg, Center for Engineering Sciences, 06099 Halle/S., Germany
a r t i c l e i n f o a b s t r a c t
ECU
LAR
NA
NO
TECH
NO
Article history:Received 4 October 2013Received in revised form 10 December 2013Accepted 18 December 2013Available online 28 December 2013
Keywords:Crystal nucleationNucleating agent efficiencyPolymersFast scanning calorimetryMWCNT
CRO
MO
L
The nucleation efficiency of multiwall carbon nanotubes (MWCNT) in poly(e-caprolactone)(PCL), as an example, was tested for a wide range of temperatures and cooling rates andcompared to the efficiency of homogeneously formed nuclei. The temperature range belowthe maximum of crystallization rate is generally not accessible for non-isothermal coolingexperiments because the sample becomes amorphous at the needed cooling rates. Isother-mal experiments after fast quenches extend the temperature range down to and below theglass transition. The employed differential fast scanning calorimeter (DFSC) allows coolingat rates up to 100,000 K/s and precise adjustment and control of isothermal conditions inthe time range from 10�4 to 104 s and longer. As shown in previous work, heterogeneouscrystal nucleation dominates at low supercooling, revealing a significant dependence ofcrystallization rate on MWCNT concentration. Nevertheless, no saturation of the nucleationactivity at a MWCNT loading of 0.2–0.5 wt% as seen in slow DSC experiments was observedat the much higher cooling rates employed here. At high supercooling, where homoge-neous nucleation is prevalent, the addition of MWCNT neither enhances nor reduces thecrystallization rate. At the temperature of maximum homogeneous nucleation rate, forma-tion of homogeneous nuclei always dominates crystallization.
� 2014 Elsevier Ltd. All rights reserved.
MA
1. Introduction
Nucleating additives are widely used to initiate crystal-lization during processing of polymers since a number ofproperties of the final product can be modified by tailoringcrystallization. The direct influence of the degree of crys-tallinity on optical, mechanical and dielectric propertieswas investigated by several authors, e.g. [1–4]. In particu-lar, it is known that the increase of the amount of nucle-ation sites may lead to the formation of a large number
of crystals which do not organize in a higher-order super-structure. Absence of spherulites in semicrystallinepolymers has been shown to be beneficial to obtain highlytransparent films, of high stiffness and simultaneouslyhigh ductility.
In any such attempt to initiate crystallization by heter-ogeneous nucleation sites, one has to appropriatelyaccount for the effect of homogeneous nucleation too. Byhomogeneous nucleation, under certain conditions, a verylarge number of nuclei can be formed [5–7] and thereforeit is expected to compete with nuclei formation causedby nucleating additives. As one prerequisite, a large und-ercooling (temperature sufficiently below the melting tem-perature) has to be achieved, and therefore a certain high
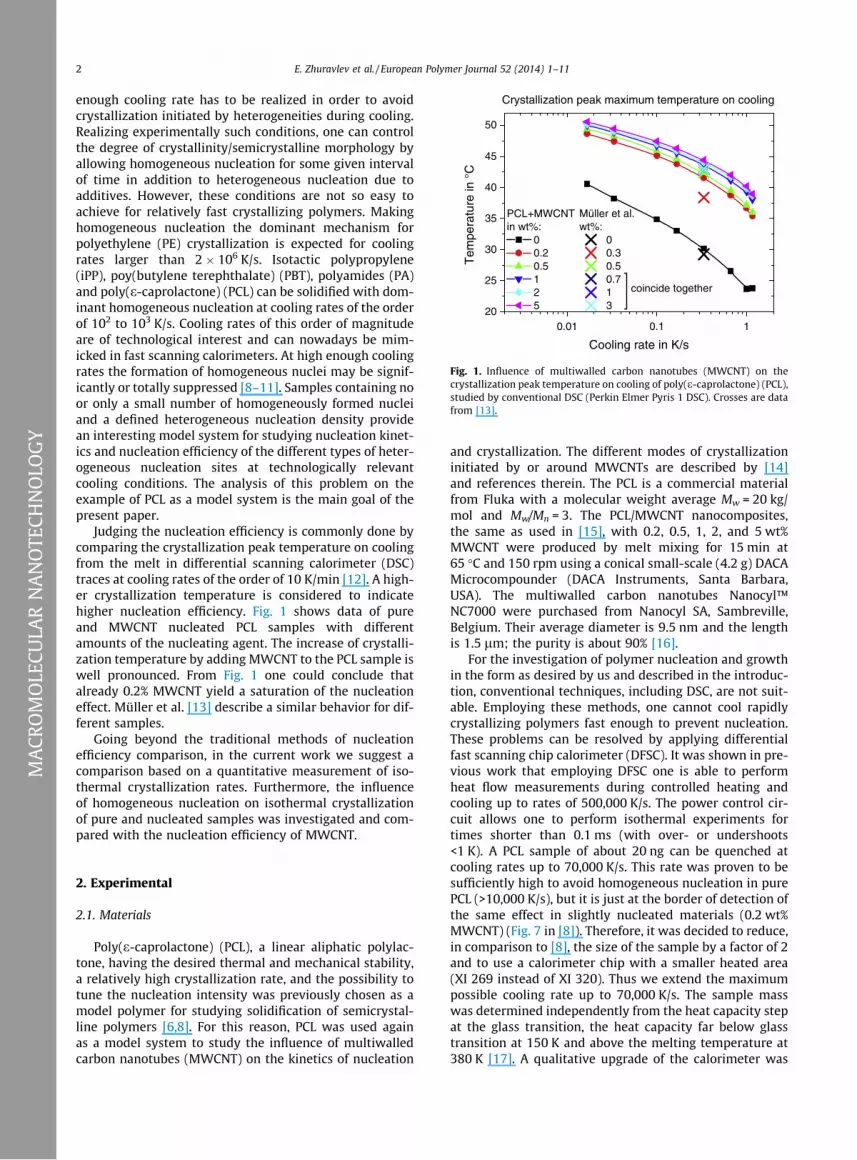
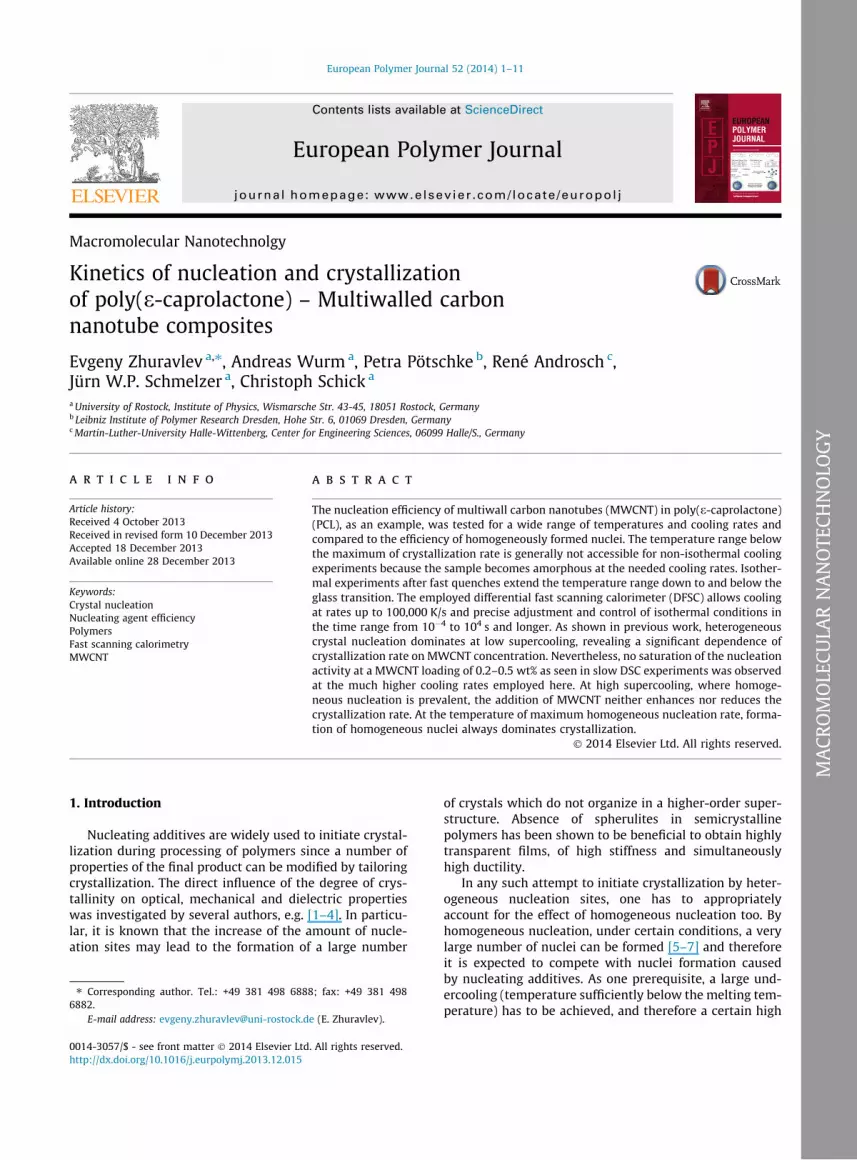
Fig. 1. Influence of multiwalled carbon nanotubes (MWCNT) on thecrystallization peak temperature on cooling of poly(e-caprolactone) (PCL),studied by conventional DSC (Perkin Elmer Pyris 1 DSC). Crosses are datafrom [13].
2 E. Zhuravlev et al. / European Polymer Journal 52 (2014) 1–11
MA
CRO
MO
LECU
LAR
NA
NO
TECH
NO
LOG
Y
enough cooling rate has to be realized in order to avoidcrystallization initiated by heterogeneities during cooling.Realizing experimentally such conditions, one can controlthe degree of crystallinity/semicrystalline morphology byallowing homogeneous nucleation for some given intervalof time in addition to heterogeneous nucleation due toadditives. However, these conditions are not so easy toachieve for relatively fast crystallizing polymers. Makinghomogeneous nucleation the dominant mechanism forpolyethylene (PE) crystallization is expected for coolingrates larger than 2 � 106 K/s. Isotactic polypropylene(iPP), poy(butylene terephthalate) (PBT), polyamides (PA)and poly(e-caprolactone) (PCL) can be solidified with dom-inant homogeneous nucleation at cooling rates of the orderof 102 to 103 K/s. Cooling rates of this order of magnitudeare of technological interest and can nowadays be mim-icked in fast scanning calorimeters. At high enough coolingrates the formation of homogeneous nuclei may be signif-icantly or totally suppressed [8–11]. Samples containing noor only a small number of homogeneously formed nucleiand a defined heterogeneous nucleation density providean interesting model system for studying nucleation kinet-ics and nucleation efficiency of the different types of heter-ogeneous nucleation sites at technologically relevantcooling conditions. The analysis of this problem on theexample of PCL as a model system is the main goal of thepresent paper.
Judging the nucleation efficiency is commonly done bycomparing the crystallization peak temperature on coolingfrom the melt in differential scanning calorimeter (DSC)traces at cooling rates of the order of 10 K/min [12]. A high-er crystallization temperature is considered to indicatehigher nucleation efficiency. Fig. 1 shows data of pureand MWCNT nucleated PCL samples with differentamounts of the nucleating agent. The increase of crystalli-zation temperature by adding MWCNT to the PCL sample iswell pronounced. From Fig. 1 one could conclude thatalready 0.2% MWCNT yield a saturation of the nucleationeffect. Müller et al. [13] describe a similar behavior for dif-ferent samples.
Going beyond the traditional methods of nucleationefficiency comparison, in the current work we suggest acomparison based on a quantitative measurement of iso-thermal crystallization rates. Furthermore, the influenceof homogeneous nucleation on isothermal crystallizationof pure and nucleated samples was investigated and com-pared with the nucleation efficiency of MWCNT.
2. Experimental
2.1. Materials
Poly(e-caprolactone) (PCL), a linear aliphatic polylac-tone, having the desired thermal and mechanical stability,a relatively high crystallization rate, and the possibility totune the nucleation intensity was previously chosen as amodel polymer for studying solidification of semicrystal-line polymers [6,8]. For this reason, PCL was used againas a model system to study the influence of multiwalledcarbon nanotubes (MWCNT) on the kinetics of nucleation
and crystallization. The different modes of crystallizationinitiated by or around MWCNTs are described by [14]and references therein. The PCL is a commercial materialfrom Fluka with a molecular weight average Mw = 20 kg/mol and Mw/Mn = 3. The PCL/MWCNT nanocomposites,the same as used in [15], with 0.2, 0.5, 1, 2, and 5 wt%MWCNT were produced by melt mixing for 15 min at65 �C and 150 rpm using a conical small-scale (4.2 g) DACAMicrocompounder (DACA Instruments, Santa Barbara,USA). The multiwalled carbon nanotubes Nanocyl™NC7000 were purchased from Nanocyl SA, Sambreville,Belgium. Their average diameter is 9.5 nm and the lengthis 1.5 lm; the purity is about 90% [16].
For the investigation of polymer nucleation and growthin the form as desired by us and described in the introduc-tion, conventional techniques, including DSC, are not suit-able. Employing these methods, one cannot cool rapidlycrystallizing polymers fast enough to prevent nucleation.These problems can be resolved by applying differentialfast scanning chip calorimeter (DFSC). It was shown in pre-vious work that employing DFSC one is able to performheat flow measurements during controlled heating andcooling up to rates of 500,000 K/s. The power control cir-cuit allows one to perform isothermal experiments fortimes shorter than 0.1 ms (with over- or undershoots<1 K). A PCL sample of about 20 ng can be quenched atcooling rates up to 70,000 K/s. This rate was proven to besufficiently high to avoid homogeneous nucleation in purePCL (>10,000 K/s), but it is just at the border of detection ofthe same effect in slightly nucleated materials (0.2 wt%MWCNT) (Fig. 7 in [8]). Therefore, it was decided to reduce,in comparison to [8], the size of the sample by a factor of 2and to use a calorimeter chip with a smaller heated area(XI 269 instead of XI 320). Thus we extend the maximumpossible cooling rate up to 70,000 K/s. The sample masswas determined independently from the heat capacity stepat the glass transition, the heat capacity far below glasstransition at 150 K and above the melting temperature at380 K [17]. A qualitative upgrade of the calorimeter was
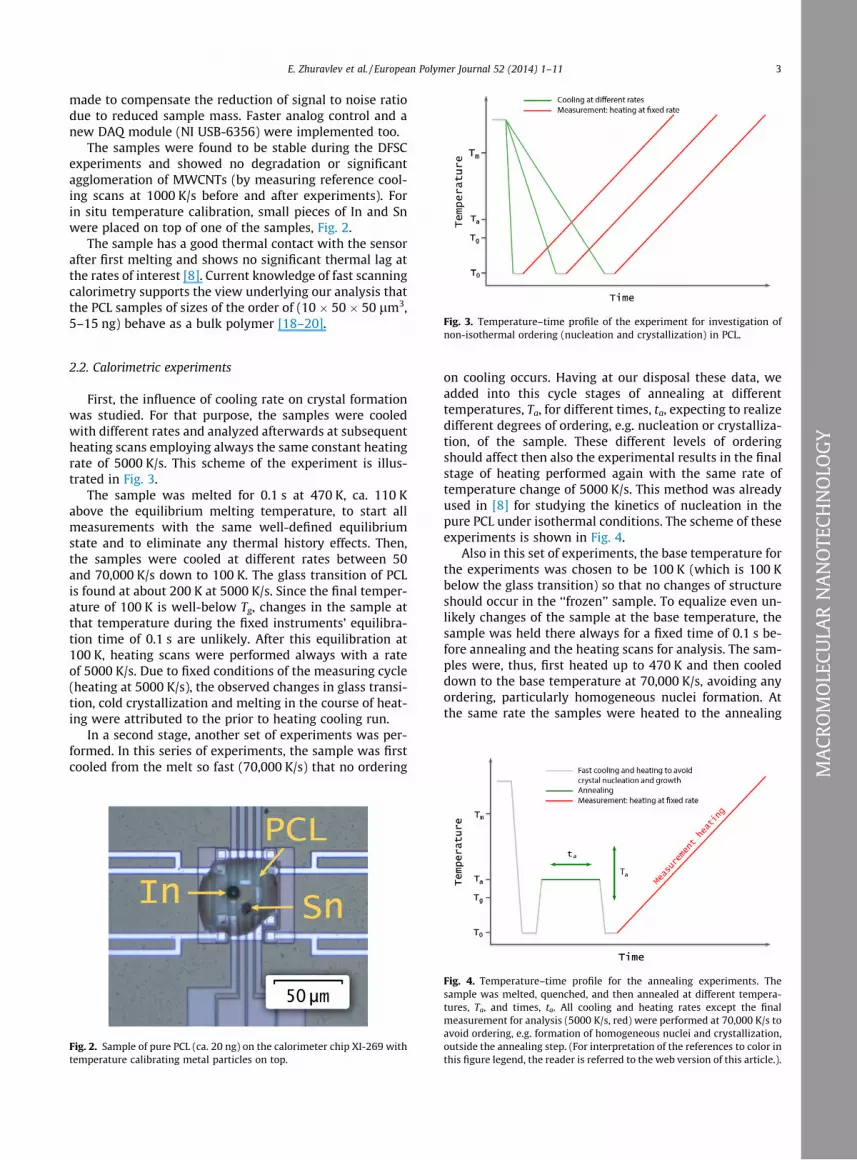
Fig. 3. Temperature–time profile of the experiment for investigation of
E. Zhuravlev et al. / European Polymer Journal 52 (2014) 1–11 3
made to compensate the reduction of signal to noise ratiodue to reduced sample mass. Faster analog control and anew DAQ module (NI USB-6356) were implemented too.
The samples were found to be stable during the DFSCexperiments and showed no degradation or significantagglomeration of MWCNTs (by measuring reference cool-ing scans at 1000 K/s before and after experiments). Forin situ temperature calibration, small pieces of In and Snwere placed on top of one of the samples, Fig. 2.
The sample has a good thermal contact with the sensorafter first melting and shows no significant thermal lag atthe rates of interest [8]. Current knowledge of fast scanningcalorimetry supports the view underlying our analysis thatthe PCL samples of sizes of the order of (10 � 50 � 50 lm3,5–15 ng) behave as a bulk polymer [18–20].
non-isothermal ordering (nucleation and crystallization) in PCL.
MA
CRO
MO
LECU
LAR
NA
NO
TECH
NO
LOG
Y
2.2. Calorimetric experiments
First, the influence of cooling rate on crystal formationwas studied. For that purpose, the samples were cooledwith different rates and analyzed afterwards at subsequentheating scans employing always the same constant heatingrate of 5000 K/s. This scheme of the experiment is illus-trated in Fig. 3.
The sample was melted for 0.1 s at 470 K, ca. 110 Kabove the equilibrium melting temperature, to start allmeasurements with the same well-defined equilibriumstate and to eliminate any thermal history effects. Then,the samples were cooled at different rates between 50and 70,000 K/s down to 100 K. The glass transition of PCLis found at about 200 K at 5000 K/s. Since the final temper-ature of 100 K is well-below Tg, changes in the sample atthat temperature during the fixed instruments’ equilibra-tion time of 0.1 s are unlikely. After this equilibration at100 K, heating scans were performed always with a rateof 5000 K/s. Due to fixed conditions of the measuring cycle(heating at 5000 K/s), the observed changes in glass transi-tion, cold crystallization and melting in the course of heat-ing were attributed to the prior to heating cooling run.
In a second stage, another set of experiments was per-formed. In this series of experiments, the sample was firstcooled from the melt so fast (70,000 K/s) that no ordering
Fig. 2. Sample of pure PCL (ca. 20 ng) on the calorimeter chip XI-269 withtemperature calibrating metal particles on top.
on cooling occurs. Having at our disposal these data, weadded into this cycle stages of annealing at differenttemperatures, Ta, for different times, ta, expecting to realizedifferent degrees of ordering, e.g. nucleation or crystalliza-tion, of the sample. These different levels of orderingshould affect then also the experimental results in the finalstage of heating performed again with the same rate oftemperature change of 5000 K/s. This method was alreadyused in [8] for studying the kinetics of nucleation in thepure PCL under isothermal conditions. The scheme of theseexperiments is shown in Fig. 4.
Also in this set of experiments, the base temperature forthe experiments was chosen to be 100 K (which is 100 Kbelow the glass transition) so that no changes of structureshould occur in the ‘‘frozen’’ sample. To equalize even un-likely changes of the sample at the base temperature, thesample was held there always for a fixed time of 0.1 s be-fore annealing and the heating scans for analysis. The sam-ples were, thus, first heated up to 470 K and then cooleddown to the base temperature at 70,000 K/s, avoiding anyordering, particularly homogeneous nuclei formation. Atthe same rate the samples were heated to the annealing
Fig. 4. Temperature–time profile for the annealing experiments. Thesample was melted, quenched, and then annealed at different tempera-tures, Ta, and times, ta. All cooling and heating rates except the finalmeasurement for analysis (5000 K/s, red) were performed at 70,000 K/s toavoid ordering, e.g. formation of homogeneous nuclei and crystallization,outside the annealing step. (For interpretation of the references to color inthis figure legend, the reader is referred to the web version of this article.).
100 1000 10000 100000
-30
-20
-10
0
50
100
Δ h in
J/g
Cooling rate in K/s
BΔhcc
A
MWCNT content: 0 wt% 0.2 wt%
0.5 wt% 1 wt%2 wt%5 wt% heating at 5,000 K/s
DSC0.01K/s
Δ Δ
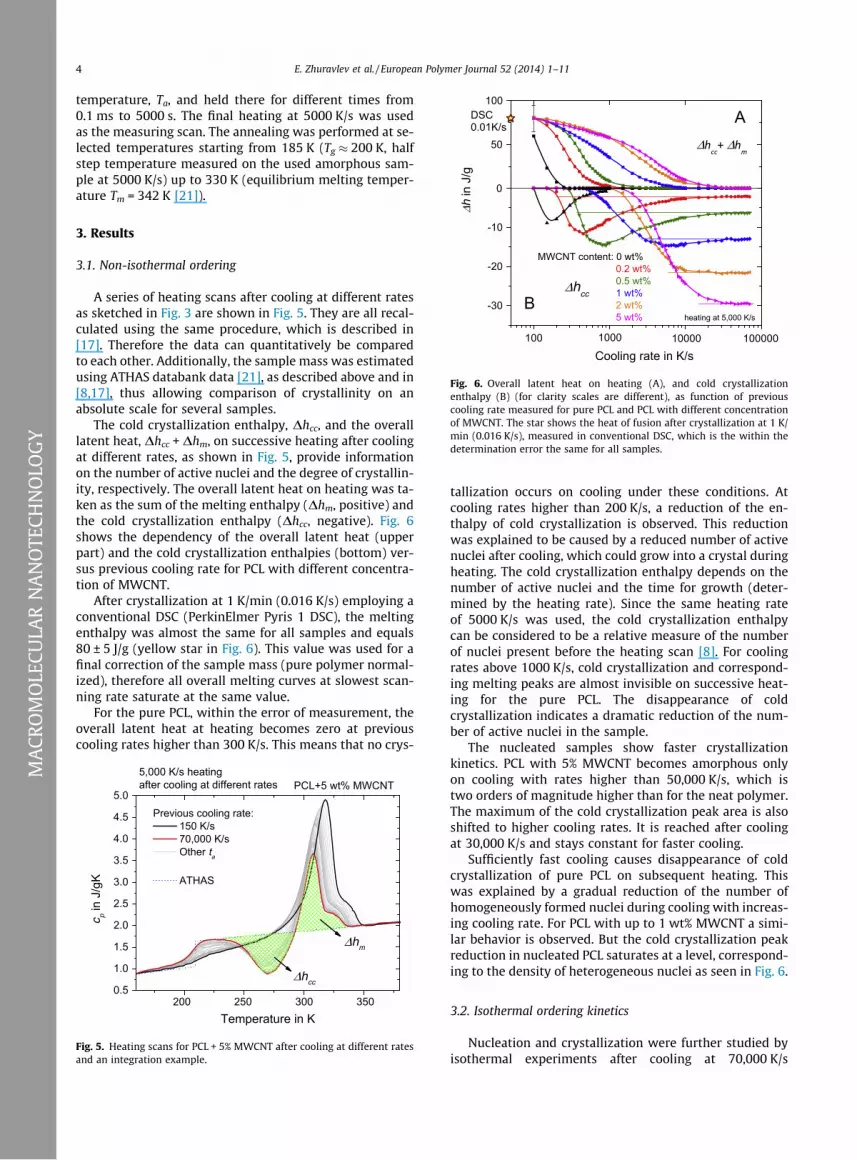
Fig. 6. Overall latent heat on heating (A), and cold crystallizationenthalpy (B) (for clarity scales are different), as function of previouscooling rate measured for pure PCL and PCL with different concentrationof MWCNT. The star shows the heat of fusion after crystallization at 1 K/min (0.016 K/s), measured in conventional DSC, which is the within thedetermination error the same for all samples.
4 E. Zhuravlev et al. / European Polymer Journal 52 (2014) 1–11
MA
CRO
MO
LECU
LAR
NA
NO
TECH
NO
LOG
Y
temperature, Ta, and held there for different times from0.1 ms to 5000 s. The final heating at 5000 K/s was usedas the measuring scan. The annealing was performed at se-lected temperatures starting from 185 K (Tg � 200 K, halfstep temperature measured on the used amorphous sam-ple at 5000 K/s) up to 330 K (equilibrium melting temper-ature Tm = 342 K [21]).
3. Results
3.1. Non-isothermal ordering
A series of heating scans after cooling at different ratesas sketched in Fig. 3 are shown in Fig. 5. They are all recal-culated using the same procedure, which is described in[17]. Therefore the data can quantitatively be comparedto each other. Additionally, the sample mass was estimatedusing ATHAS databank data [21], as described above and in[8,17], thus allowing comparison of crystallinity on anabsolute scale for several samples.
The cold crystallization enthalpy, Dhcc, and the overalllatent heat, Dhcc + Dhm, on successive heating after coolingat different rates, as shown in Fig. 5, provide informationon the number of active nuclei and the degree of crystallin-ity, respectively. The overall latent heat on heating was ta-ken as the sum of the melting enthalpy (Dhm, positive) andthe cold crystallization enthalpy (Dhcc, negative). Fig. 6shows the dependency of the overall latent heat (upperpart) and the cold crystallization enthalpies (bottom) ver-sus previous cooling rate for PCL with different concentra-tion of MWCNT.
After crystallization at 1 K/min (0.016 K/s) employing aconventional DSC (PerkinElmer Pyris 1 DSC), the meltingenthalpy was almost the same for all samples and equals80 ± 5 J/g (yellow star in Fig. 6). This value was used for afinal correction of the sample mass (pure polymer normal-ized), therefore all overall melting curves at slowest scan-ning rate saturate at the same value.
For the pure PCL, within the error of measurement, theoverall latent heat at heating becomes zero at previouscooling rates higher than 300 K/s. This means that no crys-
200 250 300 3500.5
1.0
1.5
2.0
2.5
3.0
3.5
4.0
4.5
5.0
Δhm
Previous cooling rate: 150 K/s 70,000 K/s Other ta
ATHAS
c p in
J/gK
Temperature in K
5,000 K/s heatingafter cooling at different rates PCL+5 wt% MWCNT
Δhcc
Fig. 5. Heating scans for PCL + 5% MWCNT after cooling at different ratesand an integration example.
tallization occurs on cooling under these conditions. Atcooling rates higher than 200 K/s, a reduction of the en-thalpy of cold crystallization is observed. This reductionwas explained to be caused by a reduced number of activenuclei after cooling, which could grow into a crystal duringheating. The cold crystallization enthalpy depends on thenumber of active nuclei and the time for growth (deter-mined by the heating rate). Since the same heating rateof 5000 K/s was used, the cold crystallization enthalpycan be considered to be a relative measure of the numberof nuclei present before the heating scan [8]. For coolingrates above 1000 K/s, cold crystallization and correspond-ing melting peaks are almost invisible on successive heat-ing for the pure PCL. The disappearance of coldcrystallization indicates a dramatic reduction of the num-ber of active nuclei in the sample.
The nucleated samples show faster crystallizationkinetics. PCL with 5% MWCNT becomes amorphous onlyon cooling with rates higher than 50,000 K/s, which istwo orders of magnitude higher than for the neat polymer.The maximum of the cold crystallization peak area is alsoshifted to higher cooling rates. It is reached after coolingat 30,000 K/s and stays constant for faster cooling.
Sufficiently fast cooling causes disappearance of coldcrystallization of pure PCL on subsequent heating. Thiswas explained by a gradual reduction of the number ofhomogeneously formed nuclei during cooling with increas-ing cooling rate. For PCL with up to 1 wt% MWCNT a simi-lar behavior is observed. But the cold crystallization peakreduction in nucleated PCL saturates at a level, correspond-ing to the density of heterogeneous nuclei as seen in Fig. 6.
3.2. Isothermal ordering kinetics
Nucleation and crystallization were further studied byisothermal experiments after cooling at 70,000 K/s

Fig. 7. Heating curves after annealing at 195 K for different times (from 0to 4000 s) for MWCNT concentrations from 0 to 5 wt%. During annealing,homogeneous nuclei are formed, which is seen by the growing coldcrystallization peak on the subsequent heating. Even for the highlynucleated sample (5% MWCNT) a shift of the cold crystallization peakmaximum is clearly seen (>20 K), although the area of the peak does notsignificantly change with increasing annealing time.
E. Zhuravlev et al. / European Polymer Journal 52 (2014) 1–11 5
MA
CRO
MO
LECU
LAR
NA
NO
TECH
NO
LOG
Y
applying the temperature–time profile of Fig. 4. Measuredcurves for different samples after annealing at 195 K, thatis, at a temperature close-to the beginning of the glasstransition, are shown in Fig. 7 as an example.
After annealing for 2 s at 195 K which is 5 K below Tg
(red curves) the glass transition (1) on heating is superim-posed by an enthalpy recovery peak (1�), related to thenon-equilibrium glassy state after quenching. The develop-ment of the enthalpy recovery peak and its transformationinto melting of tiny isothermally formed crystals (peak 2 inthe green curves) at temperatures around the glass transi-tion is discussed in more detail in the next chapter. Theleftover of the tiny crystals after melting initiates coldcrystallization immediately after or already during melt-ing. With this observation, a link to the well-known self-nucleation has been established. Self-nucleation is knownto occur when heating a semi-crystalline sample some 5–30 K above the melting or dissolution temperature beforeattempting crystallization at lower temperature [22]. Thisself-nuclei induced cold crystallization has a different peakmaximum temperature (3a in the orange curves) com-pared to cold crystallization of untreated heterogeneouslynucleated samples (3b in black, red and green curves). Asexpected, the difference in crystallization temperatures re-sults in different melting peak temperatures too (4a and4b) for the nucleated samples. However, several meltingevents are overlapping since heating at 5000 K/s is not fastenough to prevent reorganization on heating totally.
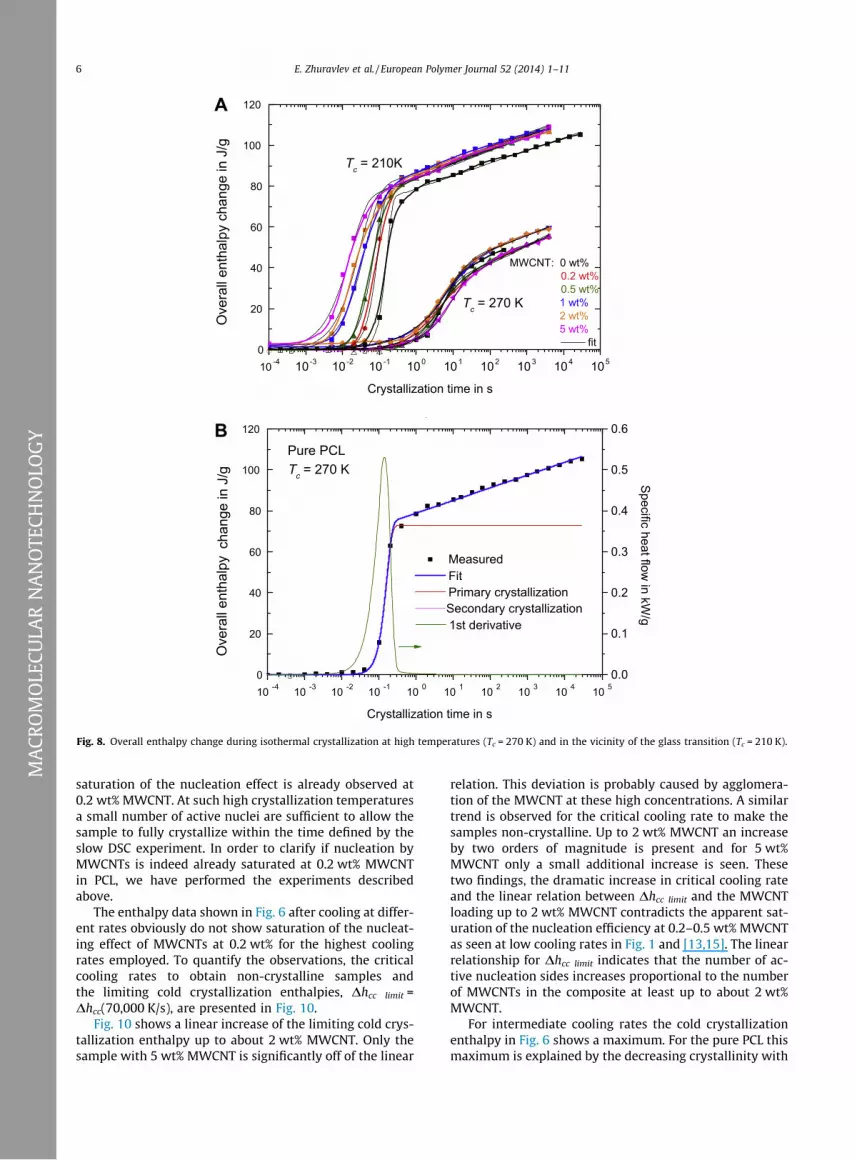
To quantify the influence of the nucleating agent on PCLcrystallization, the integration of the heat capacity curveson heating as discussed above (Fig. 5), was performed forall measurements and the latent heats were obtained.Two sets of results are shown in Fig. 8, where crystalliza-tion at two temperatures is compared for all samples.
The crystallization behavior at Tc = 210 K is, within theuncertainty of mass determination, the same for all sam-ples, while at Tc = 270 K the MWCNT nanocomposites crys-tallize significantly faster than neat PCL.
For parameterization of the crystallization results, theKolmogorov–Johnson–Mehl–Avrami formalism [23] wasused to fit the data. The resulting fit curve and its temper-ature derivative are shown in Fig. 8B. Taking into account alinear increase of enthalpy with the logarithm of time dueto secondary crystallization [24] (pink1 line in Fig. 8B), thefinal fit curve for the overall latent heat on heating was ex-pressed as:
DH ¼ DHC1 1� exp � tt1=2
ln 2� �2
! !
þ A2ðln t � ln t1=2Þ12jt � t1=2jt � t1=2
þ 1� �� �
ð1Þ
where DHC1 is the enthalpy at the end of primary crystal-lization, t is the annealing time, t1/2 is the crystallizationhalf-time, n is the Avrami coefficient of overall crystalliza-tion and A2 is a secondary crystallization parameter. Thelatter part of the secondary crystallization term is used toadjust it to zero before primary crystallization half-time.
1 For interpretation of color in Fig. 8, the reader is referred to the webversion of this article.
The results of fitting can be seen as black thin lines inFig. 8. The obtained half-times of crystallization were plot-ted in Fig. 9.
The results covers the full temperature range of crystal-lization from 180 K (Tg(10 K/min) = 209 K [26]) to 340 K(Tm = 342 K [26]). The estimated time constants cover therange from 10�2 s (crystallization of PCL with 5 wt%MWCNT at 280 K) to 3 � 109 s (crystallization at 185 K).
4. Discussion
4.1. Nucleation efficiency
When studying the efficiency of nucleating agents, oneneeds to specify the temperature range of interest.Depending on crystallization temperature, homogeneousnucleation may compete with the added nuclei and over-turn their influence [27]. A study of the influence ofMWCNT on nucleation of PCL was carried out by Mülleret al. in [13]. They have found saturation of the nucleatingeffect at about 0.5 wt% MWCNT concentration as shown inFig. 1. Müller et al. determined the efficiency using thecrystallization peak maximum temperature on slow cool-ing as proposed by Fillon et al. [12] and reached a valueof 200%. The isothermal crystallization of these sampleswas followed too in [13]. However, at that time the tem-perature range was very limited due to limited coolingabilities of conventional DSCs. The samples were crystalliz-ing on cooling before reaching lower temperatures. For theneat PCL isothermal crystallization was measured in thetemperature range from 318 K to 320 K, and for faster crys-tallizing PCL + MWCNT nanocomposites the temperaturerange was limited to 322–328 K. Our data on differentPCL MWCNT composites, Fig. 1, show the same trend and
10 -4 10-3 10-2 10-1 100 101 102 103 104 1050
20
40
60
80
100
120
MWCNT: 0 wt%0.2 wt%0.5 wt%1 wt%2 wt%5 wt%
fit
Ove
rall
enth
alpy
cha
nge
in J
/g
Crystallization time in s
Tc = 270 K
Tc = 210K
10 -4 10 -3 10 -2 10 -1 10 0 10 1 10 2 10 3 10 4 10 50
20
40
60
80
100
120
Measured Fit Primary crystallization
Secondary crystallization
Ove
rall
enth
alpy
cha
nge
in J
/g
Crystallization time in s
Tc = 270 KPure PCL
0.0
0.1
0.2
0.3
0.4
0.5
0.6
Specific heat flow in kW
/g
1st derivative
A
B
Fig. 8. Overall enthalpy change during isothermal crystallization at high temperatures (Tc = 270 K) and in the vicinity of the glass transition (Tc = 210 K).
6 E. Zhuravlev et al. / European Polymer Journal 52 (2014) 1–11
MA
CRO
MO
LECU
LAR
NA
NO
TECH
NO
LOG
Y
saturation of the nucleation effect is already observed at0.2 wt% MWCNT. At such high crystallization temperaturesa small number of active nuclei are sufficient to allow thesample to fully crystallize within the time defined by theslow DSC experiment. In order to clarify if nucleation byMWCNTs is indeed already saturated at 0.2 wt% MWCNTin PCL, we have performed the experiments describedabove.
The enthalpy data shown in Fig. 6 after cooling at differ-ent rates obviously do not show saturation of the nucleat-ing effect of MWCNTs at 0.2 wt% for the highest coolingrates employed. To quantify the observations, the criticalcooling rates to obtain non-crystalline samples andthe limiting cold crystallization enthalpies, Dhcc limit =Dhcc(70,000 K/s), are presented in Fig. 10.
Fig. 10 shows a linear increase of the limiting cold crys-tallization enthalpy up to about 2 wt% MWCNT. Only thesample with 5 wt% MWCNT is significantly off of the linear
relation. This deviation is probably caused by agglomera-tion of the MWCNT at these high concentrations. A similartrend is observed for the critical cooling rate to make thesamples non-crystalline. Up to 2 wt% MWCNT an increaseby two orders of magnitude is present and for 5 wt%MWCNT only a small additional increase is seen. Thesetwo findings, the dramatic increase in critical cooling rateand the linear relation between Dhcc limit and the MWCNTloading up to 2 wt% MWCNT contradicts the apparent sat-uration of the nucleation efficiency at 0.2–0.5 wt% MWCNTas seen at low cooling rates in Fig. 1 and [13,15]. The linearrelationship for Dhcc limit indicates that the number of ac-tive nucleation sides increases proportional to the numberof MWCNTs in the composite at least up to about 2 wt%MWCNT.
For intermediate cooling rates the cold crystallizationenthalpy in Fig. 6 shows a maximum. For the pure PCL thismaximum is explained by the decreasing crystallinity with
180 200 220 240 260 280 300 320 340-3
-2
-1
0
1
2
3
4
5
6
7
5
1
T/Tm
log(
τ/s)
Temperature in K
dielectric α-relaxation(dynamic glass transition)
PCL pure: nucleation half-time crystallization half-time
ConventionalDSC
Müller et al. [13]
0.2
MWCNT wt%
0.5 0.6 0.7 0.8 0.9 1.0
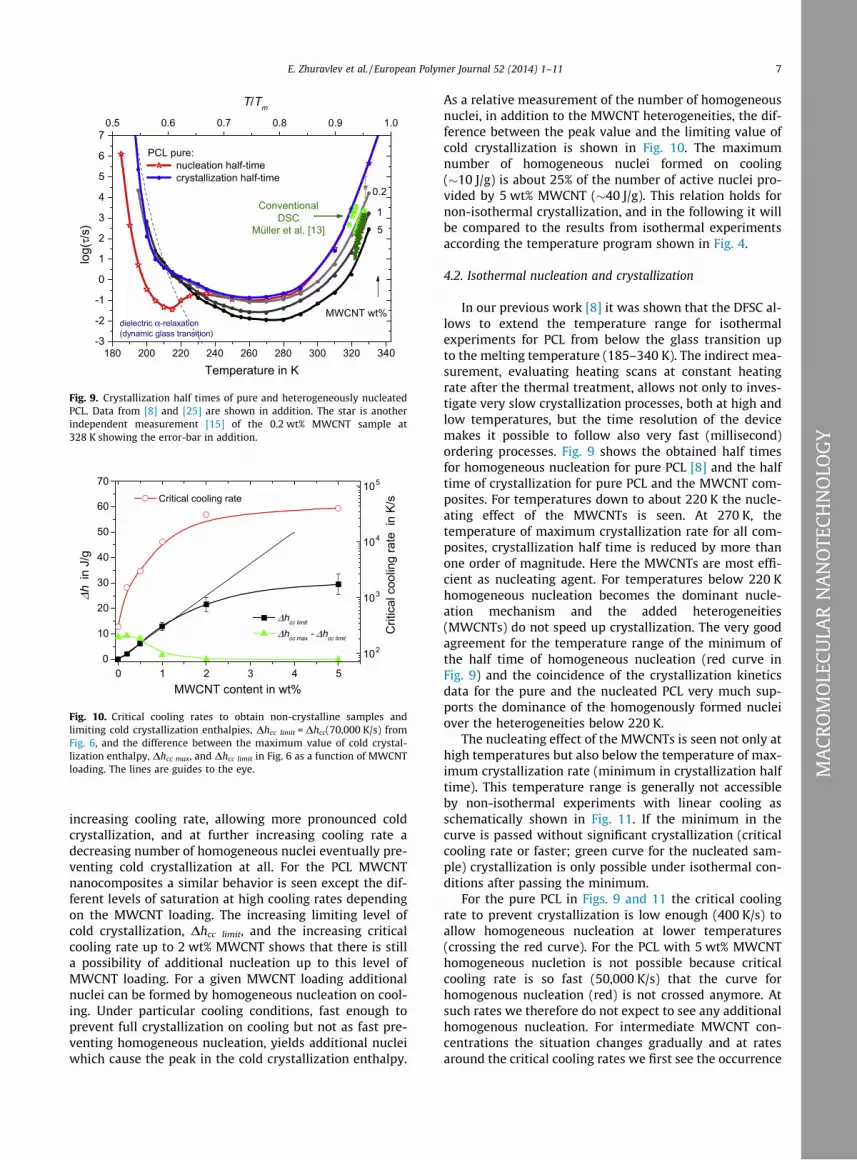
Fig. 9. Crystallization half times of pure and heterogeneously nucleatedPCL. Data from [8] and [25] are shown in addition. The star is anotherindependent measurement [15] of the 0.2 wt% MWCNT sample at328 K showing the error-bar in addition.
0 1 2 3 4 50
10
20
30
40
50
60
70
Δhcc limit
Δhcc max - Δhcc limit
Δh i
n J/
g
MWCNT content in wt%
102
103
104
105
Critical cooling rate
Crit
ical
coo
ling
rate
in
K/s
Fig. 10. Critical cooling rates to obtain non-crystalline samples andlimiting cold crystallization enthalpies, Dhcc limit = Dhcc(70,000 K/s) fromFig. 6, and the difference between the maximum value of cold crystal-lization enthalpy, Dhcc max, and Dhcc limit in Fig. 6 as a function of MWCNTloading. The lines are guides to the eye.
E. Zhuravlev et al. / European Polymer Journal 52 (2014) 1–11 7
MA
CRO
MO
LECU
LAR
NA
NO
TECH
NO
LOG
Y
increasing cooling rate, allowing more pronounced coldcrystallization, and at further increasing cooling rate adecreasing number of homogeneous nuclei eventually pre-venting cold crystallization at all. For the PCL MWCNTnanocomposites a similar behavior is seen except the dif-ferent levels of saturation at high cooling rates dependingon the MWCNT loading. The increasing limiting level ofcold crystallization, Dhcc limit, and the increasing criticalcooling rate up to 2 wt% MWCNT shows that there is stilla possibility of additional nucleation up to this level ofMWCNT loading. For a given MWCNT loading additionalnuclei can be formed by homogeneous nucleation on cool-ing. Under particular cooling conditions, fast enough toprevent full crystallization on cooling but not as fast pre-venting homogeneous nucleation, yields additional nucleiwhich cause the peak in the cold crystallization enthalpy.As a relative measurement of the number of homogeneousnuclei, in addition to the MWCNT heterogeneities, the dif-ference between the peak value and the limiting value ofcold crystallization is shown in Fig. 10. The maximumnumber of homogeneous nuclei formed on cooling(�10 J/g) is about 25% of the number of active nuclei pro-vided by 5 wt% MWCNT (�40 J/g). This relation holds fornon-isothermal crystallization, and in the following it willbe compared to the results from isothermal experimentsaccording the temperature program shown in Fig. 4.
4.2. Isothermal nucleation and crystallization
In our previous work [8] it was shown that the DFSC al-lows to extend the temperature range for isothermalexperiments for PCL from below the glass transition upto the melting temperature (185–340 K). The indirect mea-surement, evaluating heating scans at constant heatingrate after the thermal treatment, allows not only to inves-tigate very slow crystallization processes, both at high andlow temperatures, but the time resolution of the devicemakes it possible to follow also very fast (millisecond)ordering processes. Fig. 9 shows the obtained half timesfor homogeneous nucleation for pure PCL [8] and the halftime of crystallization for pure PCL and the MWCNT com-posites. For temperatures down to about 220 K the nucle-ating effect of the MWCNTs is seen. At 270 K, thetemperature of maximum crystallization rate for all com-posites, crystallization half time is reduced by more thanone order of magnitude. Here the MWCNTs are most effi-cient as nucleating agent. For temperatures below 220 Khomogeneous nucleation becomes the dominant nucle-ation mechanism and the added heterogeneities(MWCNTs) do not speed up crystallization. The very goodagreement for the temperature range of the minimum ofthe half time of homogeneous nucleation (red curve inFig. 9) and the coincidence of the crystallization kineticsdata for the pure and the nucleated PCL very much sup-ports the dominance of the homogenously formed nucleiover the heterogeneities below 220 K.
The nucleating effect of the MWCNTs is seen not only athigh temperatures but also below the temperature of max-imum crystallization rate (minimum in crystallization halftime). This temperature range is generally not accessibleby non-isothermal experiments with linear cooling asschematically shown in Fig. 11. If the minimum in thecurve is passed without significant crystallization (criticalcooling rate or faster; green curve for the nucleated sam-ple) crystallization is only possible under isothermal con-ditions after passing the minimum.
For the pure PCL in Figs. 9 and 11 the critical coolingrate to prevent crystallization is low enough (400 K/s) toallow homogeneous nucleation at lower temperatures(crossing the red curve). For the PCL with 5 wt% MWCNThomogeneous nucletion is not possible because criticalcooling rate is so fast (50,000 K/s) that the curve forhomogenous nucleation (red) is not crossed anymore. Atsuch rates we therefore do not expect to see any additionalhomogenous nucleation. For intermediate MWCNT con-centrations the situation changes gradually and at ratesaround the critical cooling rates we first see the occurrence
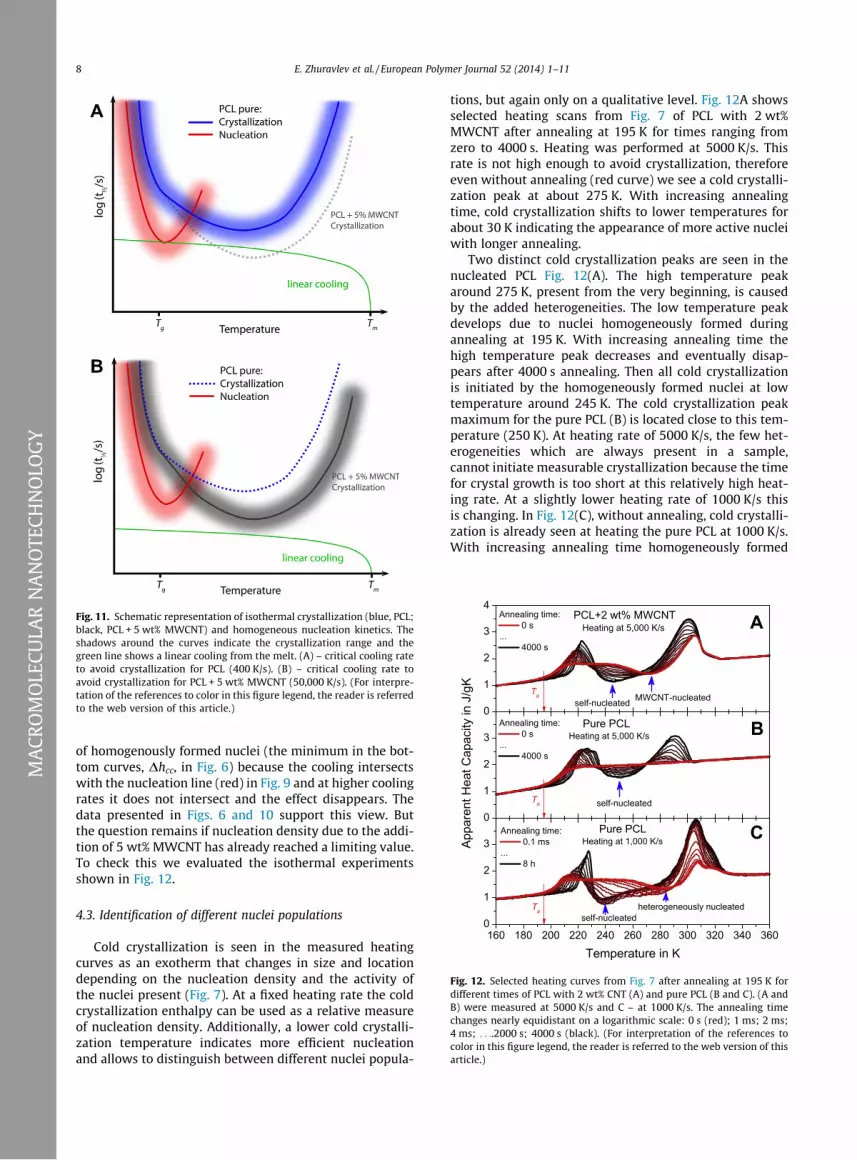
Fig. 11. Schematic representation of isothermal crystallization (blue, PCL;black, PCL + 5 wt% MWCNT) and homogeneous nucleation kinetics. Theshadows around the curves indicate the crystallization range and thegreen line shows a linear cooling from the melt. (A) – critical cooling rateto avoid crystallization for PCL (400 K/s). (B) – critical cooling rate toavoid crystallization for PCL + 5 wt% MWCNT (50,000 K/s). (For interpre-tation of the references to color in this figure legend, the reader is referredto the web version of this article.) 0
1
2
3
4Annealing time:
0 s...
4000 s
Taself-nucleated MWCNT-nucleated
APCL+2 wt% MWCNTHeating at 5,000 K/s
0
1
2
3
Ta
Appa
rent
Hea
t Cap
acity
in J
/gK
Annealing time: 0 s
... 4000 s
Heating at 5,000 K/s BPure PCL
self-nucleated
160 180 200 220 240 260 280 300 320 340 3600
1
2
3
heterogeneously nucleatedTa
Annealing time: 0.1 ms
... 8 h
Heating at 1,000 K/s
Temperature in K
CPure PCL
self-nucleated
Fig. 12. Selected heating curves from Fig. 7 after annealing at 195 K fordifferent times of PCL with 2 wt% CNT (A) and pure PCL (B and C). (A andB) were measured at 5000 K/s and C – at 1000 K/s. The annealing timechanges nearly equidistant on a logarithmic scale: 0 s (red); 1 ms; 2 ms;4 ms; . . ..2000 s; 4000 s (black). (For interpretation of the references tocolor in this figure legend, the reader is referred to the web version of thisarticle.)
8 E. Zhuravlev et al. / European Polymer Journal 52 (2014) 1–11
MA
CRO
MO
LECU
LAR
NA
NO
TECH
NO
LOG
Y
of homogenously formed nuclei (the minimum in the bot-tom curves, Dhcc, in Fig. 6) because the cooling intersectswith the nucleation line (red) in Fig. 9 and at higher coolingrates it does not intersect and the effect disappears. Thedata presented in Figs. 6 and 10 support this view. Butthe question remains if nucleation density due to the addi-tion of 5 wt% MWCNT has already reached a limiting value.To check this we evaluated the isothermal experimentsshown in Fig. 12.
4.3. Identification of different nuclei populations
Cold crystallization is seen in the measured heatingcurves as an exotherm that changes in size and locationdepending on the nucleation density and the activity ofthe nuclei present (Fig. 7). At a fixed heating rate the coldcrystallization enthalpy can be used as a relative measureof nucleation density. Additionally, a lower cold crystalli-zation temperature indicates more efficient nucleationand allows to distinguish between different nuclei popula-
tions, but again only on a qualitative level. Fig. 12A showsselected heating scans from Fig. 7 of PCL with 2 wt%MWCNT after annealing at 195 K for times ranging fromzero to 4000 s. Heating was performed at 5000 K/s. Thisrate is not high enough to avoid crystallization, thereforeeven without annealing (red curve) we see a cold crystalli-zation peak at about 275 K. With increasing annealingtime, cold crystallization shifts to lower temperatures forabout 30 K indicating the appearance of more active nucleiwith longer annealing.
Two distinct cold crystallization peaks are seen in thenucleated PCL Fig. 12(A). The high temperature peakaround 275 K, present from the very beginning, is causedby the added heterogeneities. The low temperature peakdevelops due to nuclei homogeneously formed duringannealing at 195 K. With increasing annealing time thehigh temperature peak decreases and eventually disap-pears after 4000 s annealing. Then all cold crystallizationis initiated by the homogeneously formed nuclei at lowtemperature around 245 K. The cold crystallization peakmaximum for the pure PCL (B) is located close to this tem-perature (250 K). At heating rate of 5000 K/s, the few het-erogeneities which are always present in a sample,cannot initiate measurable crystallization because the timefor crystal growth is too short at this relatively high heat-ing rate. At a slightly lower heating rate of 1000 K/s thisis changing. In Fig. 12(C), without annealing, cold crystalli-zation is already seen at heating the pure PCL at 1000 K/s.With increasing annealing time homogeneously formed
150 200 250 300 3500.5
1.0
1.5
2.0
2.5
3.0
3.5
Annealing time: 0 s 10 s 40 s 4000 s Other ta
Appa
rent
Hea
t Cap
acity
in J
/gK
Temperature in K
PCL+5 wt% MWCNT
Heating at 5,000K/safter annealing at 205K
Ta
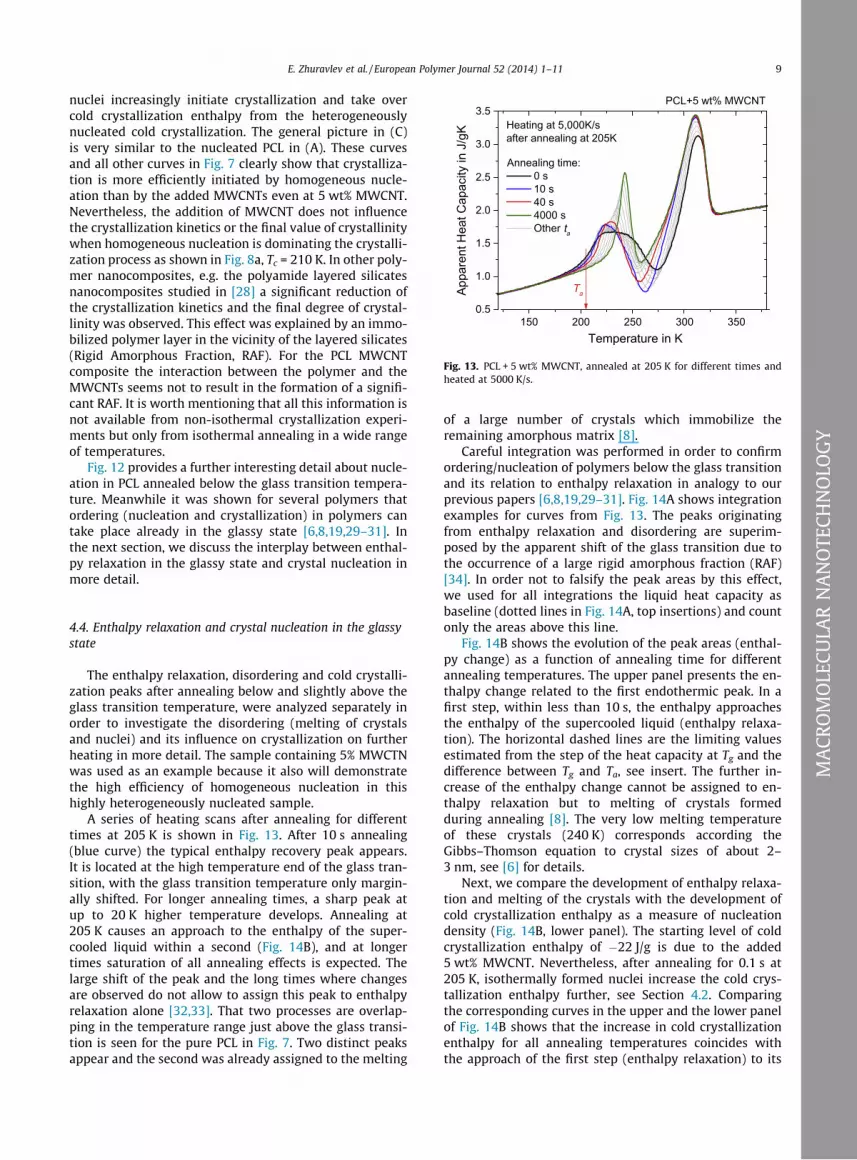
Fig. 13. PCL + 5 wt% MWCNT, annealed at 205 K for different times andheated at 5000 K/s.
E. Zhuravlev et al. / European Polymer Journal 52 (2014) 1–11 9
AN
OTE
CHN
OLO
GY
nuclei increasingly initiate crystallization and take overcold crystallization enthalpy from the heterogeneouslynucleated cold crystallization. The general picture in (C)is very similar to the nucleated PCL in (A). These curvesand all other curves in Fig. 7 clearly show that crystalliza-tion is more efficiently initiated by homogeneous nucle-ation than by the added MWCNTs even at 5 wt% MWCNT.Nevertheless, the addition of MWCNT does not influencethe crystallization kinetics or the final value of crystallinitywhen homogeneous nucleation is dominating the crystalli-zation process as shown in Fig. 8a, Tc = 210 K. In other poly-mer nanocomposites, e.g. the polyamide layered silicatesnanocomposites studied in [28] a significant reduction ofthe crystallization kinetics and the final degree of crystal-linity was observed. This effect was explained by an immo-bilized polymer layer in the vicinity of the layered silicates(Rigid Amorphous Fraction, RAF). For the PCL MWCNTcomposite the interaction between the polymer and theMWCNTs seems not to result in the formation of a signifi-cant RAF. It is worth mentioning that all this information isnot available from non-isothermal crystallization experi-ments but only from isothermal annealing in a wide rangeof temperatures.
Fig. 12 provides a further interesting detail about nucle-ation in PCL annealed below the glass transition tempera-ture. Meanwhile it was shown for several polymers thatordering (nucleation and crystallization) in polymers cantake place already in the glassy state [6,8,19,29–31]. Inthe next section, we discuss the interplay between enthal-py relaxation in the glassy state and crystal nucleation inmore detail.
MA
CRO
MO
LECU
LAR
N
4.4. Enthalpy relaxation and crystal nucleation in the glassystate
The enthalpy relaxation, disordering and cold crystalli-zation peaks after annealing below and slightly above theglass transition temperature, were analyzed separately inorder to investigate the disordering (melting of crystalsand nuclei) and its influence on crystallization on furtherheating in more detail. The sample containing 5% MWCTNwas used as an example because it also will demonstratethe high efficiency of homogeneous nucleation in thishighly heterogeneously nucleated sample.
A series of heating scans after annealing for differenttimes at 205 K is shown in Fig. 13. After 10 s annealing(blue curve) the typical enthalpy recovery peak appears.It is located at the high temperature end of the glass tran-sition, with the glass transition temperature only margin-ally shifted. For longer annealing times, a sharp peak atup to 20 K higher temperature develops. Annealing at205 K causes an approach to the enthalpy of the super-cooled liquid within a second (Fig. 14B), and at longertimes saturation of all annealing effects is expected. Thelarge shift of the peak and the long times where changesare observed do not allow to assign this peak to enthalpyrelaxation alone [32,33]. That two processes are overlap-ping in the temperature range just above the glass transi-tion is seen for the pure PCL in Fig. 7. Two distinct peaksappear and the second was already assigned to the melting
of a large number of crystals which immobilize theremaining amorphous matrix [8].
Careful integration was performed in order to confirmordering/nucleation of polymers below the glass transitionand its relation to enthalpy relaxation in analogy to ourprevious papers [6,8,19,29–31]. Fig. 14A shows integrationexamples for curves from Fig. 13. The peaks originatingfrom enthalpy relaxation and disordering are superim-posed by the apparent shift of the glass transition due tothe occurrence of a large rigid amorphous fraction (RAF)[34]. In order not to falsify the peak areas by this effect,we used for all integrations the liquid heat capacity asbaseline (dotted lines in Fig. 14A, top insertions) and countonly the areas above this line.
Fig. 14B shows the evolution of the peak areas (enthal-py change) as a function of annealing time for differentannealing temperatures. The upper panel presents the en-thalpy change related to the first endothermic peak. In afirst step, within less than 10 s, the enthalpy approachesthe enthalpy of the supercooled liquid (enthalpy relaxa-tion). The horizontal dashed lines are the limiting valuesestimated from the step of the heat capacity at Tg and thedifference between Tg and Ta, see insert. The further in-crease of the enthalpy change cannot be assigned to en-thalpy relaxation but to melting of crystals formedduring annealing [8]. The very low melting temperatureof these crystals (240 K) corresponds according theGibbs–Thomson equation to crystal sizes of about 2–3 nm, see [6] for details.
Next, we compare the development of enthalpy relaxa-tion and melting of the crystals with the development ofcold crystallization enthalpy as a measure of nucleationdensity (Fig. 14B, lower panel). The starting level of coldcrystallization enthalpy of �22 J/g is due to the added5 wt% MWCNT. Nevertheless, after annealing for 0.1 s at205 K, isothermally formed nuclei increase the cold crys-tallization enthalpy further, see Section 4.2. Comparingthe corresponding curves in the upper and the lower panelof Fig. 14B shows that the increase in cold crystallizationenthalpy for all annealing temperatures coincides withthe approach of the first step (enthalpy relaxation) to its
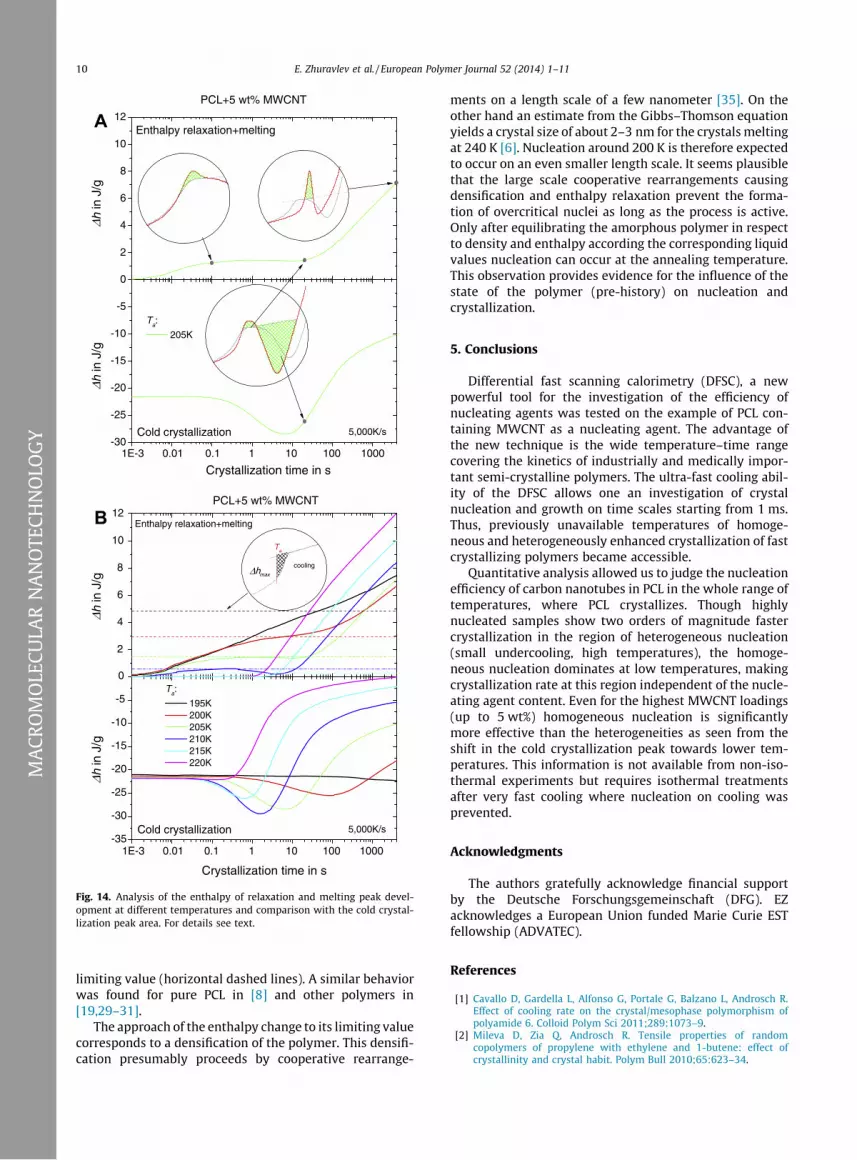
Fig. 14. Analysis of the enthalpy of relaxation and melting peak devel-opment at different temperatures and comparison with the cold crystal-lization peak area. For details see text.
10 E. Zhuravlev et al. / European Polymer Journal 52 (2014) 1–11
MA
CRO
MO
LECU
LAR
NA
NO
TECH
NO
LOG
Y
limiting value (horizontal dashed lines). A similar behaviorwas found for pure PCL in [8] and other polymers in[19,29–31].
The approach of the enthalpy change to its limiting valuecorresponds to a densification of the polymer. This densifi-cation presumably proceeds by cooperative rearrange-
ments on a length scale of a few nanometer [35]. On theother hand an estimate from the Gibbs–Thomson equationyields a crystal size of about 2–3 nm for the crystals meltingat 240 K [6]. Nucleation around 200 K is therefore expectedto occur on an even smaller length scale. It seems plausiblethat the large scale cooperative rearrangements causingdensification and enthalpy relaxation prevent the forma-tion of overcritical nuclei as long as the process is active.Only after equilibrating the amorphous polymer in respectto density and enthalpy according the corresponding liquidvalues nucleation can occur at the annealing temperature.This observation provides evidence for the influence of thestate of the polymer (pre-history) on nucleation andcrystallization.
5. Conclusions
Differential fast scanning calorimetry (DFSC), a newpowerful tool for the investigation of the efficiency ofnucleating agents was tested on the example of PCL con-taining MWCNT as a nucleating agent. The advantage ofthe new technique is the wide temperature–time rangecovering the kinetics of industrially and medically impor-tant semi-crystalline polymers. The ultra-fast cooling abil-ity of the DFSC allows one an investigation of crystalnucleation and growth on time scales starting from 1 ms.Thus, previously unavailable temperatures of homoge-neous and heterogeneously enhanced crystallization of fastcrystallizing polymers became accessible.
Quantitative analysis allowed us to judge the nucleationefficiency of carbon nanotubes in PCL in the whole range oftemperatures, where PCL crystallizes. Though highlynucleated samples show two orders of magnitude fastercrystallization in the region of heterogeneous nucleation(small undercooling, high temperatures), the homoge-neous nucleation dominates at low temperatures, makingcrystallization rate at this region independent of the nucle-ating agent content. Even for the highest MWCNT loadings(up to 5 wt%) homogeneous nucleation is significantlymore effective than the heterogeneities as seen from theshift in the cold crystallization peak towards lower tem-peratures. This information is not available from non-iso-thermal experiments but requires isothermal treatmentsafter very fast cooling where nucleation on cooling wasprevented.
Acknowledgments
The authors gratefully acknowledge financial supportby the Deutsche Forschungsgemeinschaft (DFG). EZacknowledges a European Union funded Marie Curie ESTfellowship (ADVATEC).
References
[1] Cavallo D, Gardella L, Alfonso G, Portale G, Balzano L, Androsch R.Effect of cooling rate on the crystal/mesophase polymorphism ofpolyamide 6. Colloid Polym Sci 2011;289:1073–9.
[2] Mileva D, Zia Q, Androsch R. Tensile properties of randomcopolymers of propylene with ethylene and 1-butene: effect ofcrystallinity and crystal habit. Polym Bull 2010;65:623–34.
E. Zhuravlev et al. / European Polymer Journal 52 (2014) 1–11 11
ECU
LAR
NA
NO
TECH
NO
LOG
Y
[3] Menyhárd A, Gahleitner M, Varga J, Bernreitner K, Jääskeläinen P,Øysæd H, et al. The influence of nucleus density on optical propertiesin nucleated isotactic polypropylene. Eur Polym J 2009;45:3138–48.
[4] Jeon K, Warnock S, Ruiz-Orta C, Kismarahardja A, Brooks J, Alamo RG.Role of matrix crystallinity in carbon nanotube dispersion andelectrical conductivity of iPP-based nanocomposites. J Polym Sci PartB: Polym Phys 2010;48:2084–96.
[5] Mileva D, Androsch R, Zhuravlev E, Schick C. Morphology ofmesophase and crystals of polyamide 6 prepared in a fast scanningchip calorimeter. Polymer 2012;53:3994–4001.
[6] Wurm A, Zhuravlev E, Eckstein K, Jehnichen D, Pospiech D, AndroschR, et al. Crystallization and homogeneous nucleation kineticsof poly(e-caprolactone) (PCL) with different molar masses.Macromolecules 2012;45:3816–28.
[7] Gutzow IS, Schmelzer JWP. The vitreous state thermodynamics,structure, rheology, and crystallization. Heidelberg: Springer; 2013.
[8] Zhuravlev E, Schmelzer JWP, Wunderlich B, Schick C. Kinetics ofnucleation and crystallization in poly(epsilon caprolactone) PCL.Polymer 2011;52:1983–97.
[9] SalmeronSanchez M, Mathot VBF, VandenPoel G, GomezRibelles JL.Effect of the cooling rate on the nucleation kinetics of poly(L-lacticacid) and its influence on morphology. Macromolecules2007;40:7989–97.
[10] Okamoto N, Oguni M. Discovery of crystal nucleation proceedingmuch below the glass transition temperature in a supercooledliquid. Solid State Commun 1996;99:53–6.
[11] Fokin VM, Yuritsyn NS, Zanotto ED, Schmelzer JWP, Cabral AA.Nucleation time-lag from nucleation and growth experiments indeeply undercooled glass-forming liquids. J Non-Crystal Solids2008;354:3785–92.
[12] Fillon B, Thierry A, Lotz B, Wittmann JC. Efficiency scale for polymernucleating agents. J Therm Anal 1994;42:721–31.
[13] Trujillo M, Arnal ML, Müller AJ, Mujica MA, Urbina de Navarro C,Ruelle B, et al. Supernucleation and crystallization regime changeprovoked by MWNT addition to poly(e-caprolactone). Polymer2012;53:832–41.
[14] Laird ED, Li CY. Structure and Morphology Control in CrystallinePolymer–Carbon Nanotube Nanocomposites. Macromolecules 2013.
[15] Wurm A, Lellinger D, Minakov AA, Skipa T, Pötschke P, Alig I, SchickC. Crystallization of poly(e-caprolactone)/MWCNT composites: Acombined SAXS/WAXS, electrical and thermal conductivity study,Polymer submitted; 2013.
[16] N.S.A., Data sheet Nanocyl 7000. Edition 2007-02-05; 2007.[17] Zhuravlev E, Schick C. Fast scanning power compensated differential
scanning nano-calorimeter: 2. Heat capacity analysis. ThermochimActa 2010;505:14–21.
[18] Cheruthazhekatt S, Pijpers TFJ, Harding GW, Mathot VBF, Pasch H.Compositional analysis of an impact polypropylene copolymer by
Lfast scanning DSC and FTIR of TREF-SEC cross-fractions.Macromolecules 2012;45:5866–80.
[19] Mollova A, Androsch R, Mileva D, Schick C, Benhamida A. Effect ofsupercooling on crystallization of polyamide 11. Macromolecules2013;46:828–35.
[20] Cebe P, Hu X, Kaplan DL, Zhuravlev E, Wurm A, Arbeiter D, et al.Beating the heat – fast scanning melts silk beta sheet crystals. SciRep 2013;3:1–7.
[21] Wunderlich B. The athas database on heat capacities of polymers.Pure Appl Chem 1995;67:1019–26. WWW URL: http://www.springermaterials.com/docs/athas.html.
[22] Fillon B, Wittmann JC, Lotz B, Thierry A. Self-nucleation andrecrystallization of lsotactic polypropylene (a Phase) investigatedby differential scanning calorimetry. J Polym Sci B: Polym Phys1993;31:1383–93.
[23] Avrami M. Transformation-time relaxtions for random distributionof nuclei. J Chem Phys 1940;8:212–24.
[24] Rybnikar F. Mechanism of secondary crystallization in polymers. JPolym Sci Part A: Gen Papers 1963;1:2031–8.
[25] Müller A, Hernández Z, Arnal M, Sánchez J. Successive self-nucleation/annealing (SSA): a novel technique to study molecularsegregation during crystallization. Polym Bull 1997;39:465–72.
[26] Wunderlich B, et al., WWW URL: <http://web.utk.edu/athas/databank/intro.html>.
[27] Schmelzer JWP, Hellmuth O. Nucleation Theory and Applications,Joint Institute for Nuclear Research, Dubna; 2013.
[28] Wurm A, Ismail M, Kretzschmar B, Pospiech D, Schick C. Retardedcrystallization in polyamide/layered silicates nanocompositescaused by an immobilized interphase. Macromolecules2010;43:1480–7.
[29] Androsch R, Di Lorenzo ML. Crystal nucleation in glassy poly(l-lacticacid). Macromolecules 2013;46:6048–56.
[30] Mileva M, Androsch R, Zhuravlev E, Schick C, Wunderlich B.Homogeneous nucleation and mesophase formation in glassyisotactic polypropylene. Polymer 2012;53:277–82.
[31] Kolesov I, Mileva D, Androsch R, Schick C. Structure formation ofpolyamide 6 from the glassy state by fast scanning chip calorimetry.Polymer 2011;52:5156–65.
[32] Hutchinson JM, Smith S, Horne B, Gourlay GM. Physical aging ofpolycarbonate: enthalpy relaxation, creep response, and yieldingbehavior. Macromolecules 1999;32:5046–61.
[33] Hodge IM. Enthalpy relaxation and recovery in amorphous materials[Review]. J Non-Cryst Solids 1994;169:211–66.
[34] Wunderlich B. Reversible crystallization and the rigid-amorphousphase in semicrystalline macromolecules. Progr Polym Sci2003;28:383–450.
[35] Donth E. Glass transition. Berlin: Springer; 2001.
MA
CRO
MO
Related Documents


![Protein Crystallography - instruct.uwo.ca · Protein Crystallization • Principles of protein solubility [PPt] [protein] Undersaturated solubility Supersaturated Precipitation Nucleation](https://static.cupdf.com/doc/110x72/5e18b58cfac19c6065246f42/protein-crystallography-protein-crystallization-a-principles-of-protein-solubility.jpg)