Kinetic Analysis of Tyrosinase Enzyme Experiment #5

Kinetic Analysis of Tyrosinase Enzyme Experiment #5.
Dec 28, 2015
Welcome message from author
This document is posted to help you gain knowledge. Please leave a comment to let me know what you think about it! Share it to your friends and learn new things together.
Transcript
Kinetic Analysis of Tyrosinase Enzyme
Experiment #5

Enzymes as catalysts
• It is necessary for biological reactions to occur much quicker than the ambient temperature and prevailing conditions would allow
– “catalyst” a substance that when added to a chemical reaction, speeds it up without altering the final products or without itself being consumed.
– Enzymes are biological catalysts

Enzyme Benefits
• Enzymes provide many medical benefits– key to understanding inborn errors of metabolism
– important in detoxification reactions
– targets of chemotherapy
– aid in diagnosis and monitoring therapy
– primary role of vitamins is as enzyme cofactors
– key to metabolic control and balance
Enzyme properties
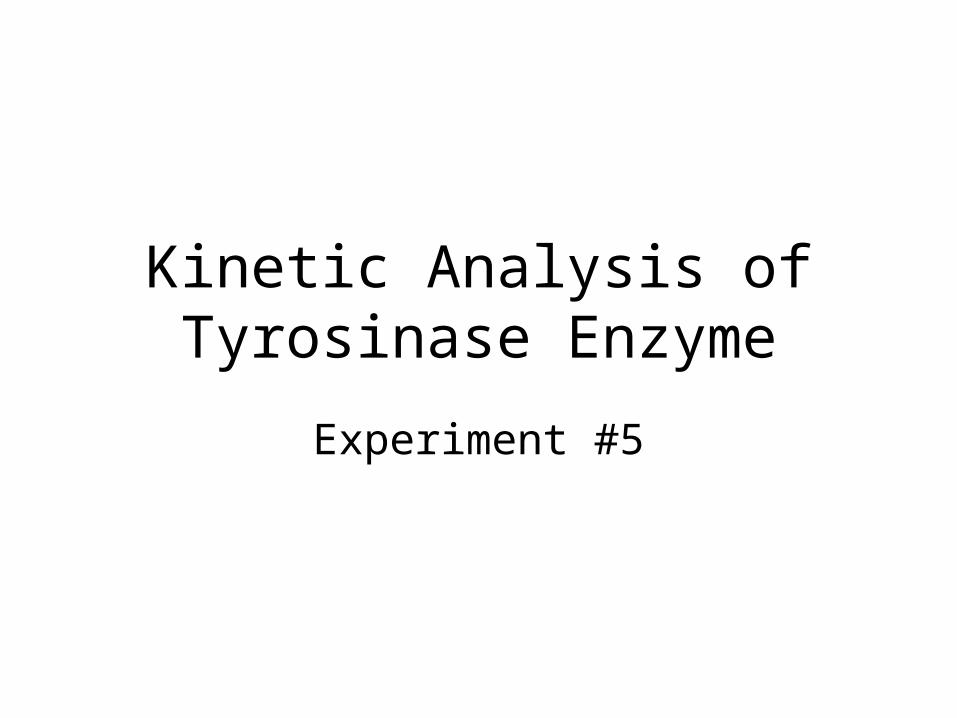
• All enzymes are proteins– Molecular Weight range: 15 kd-1000 kd
– enzymes show the same physical and chemical properties as all proteins
• denaturation• precipitation• sensitivity to proteases
• Enzymes are efficient biological catalysts which must operate at 37o C or below and at pH values found in living cells
Enzyme Properties
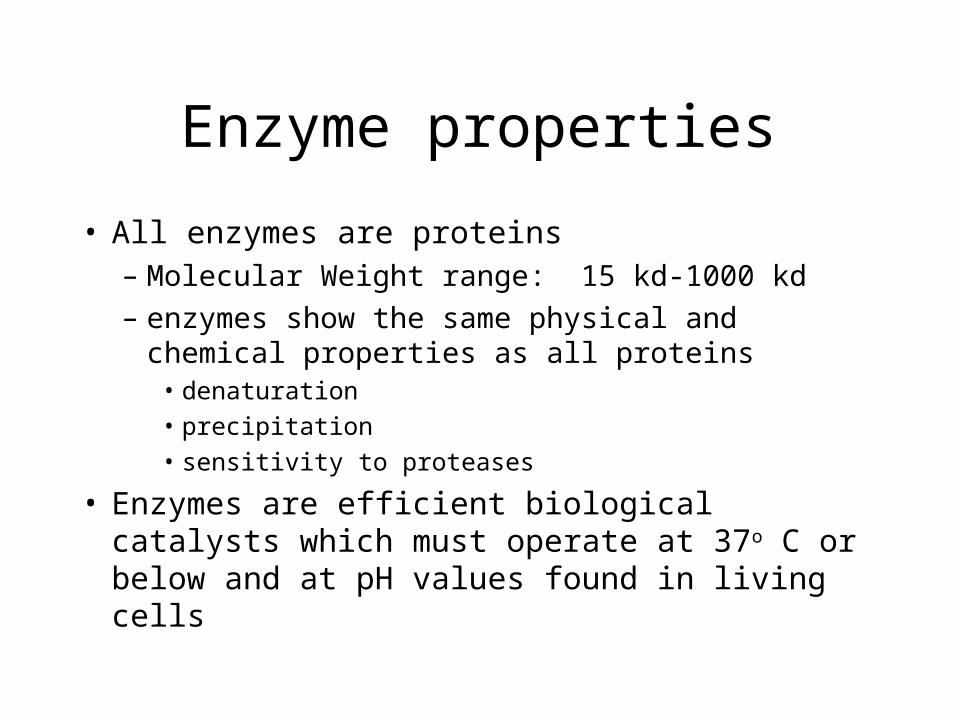
• Enzymes are highly specific in their catalysis– they must bind (form a complex) with substrate into a
region of the enzyme known as the “active site”
• How?

Enzyme Properties
• Enzymes also allow the regulation of reactions through activation or inhibition of the enzyme by effectors– ** Virtually all biological reactions are found
to be enzyme catalyzed**
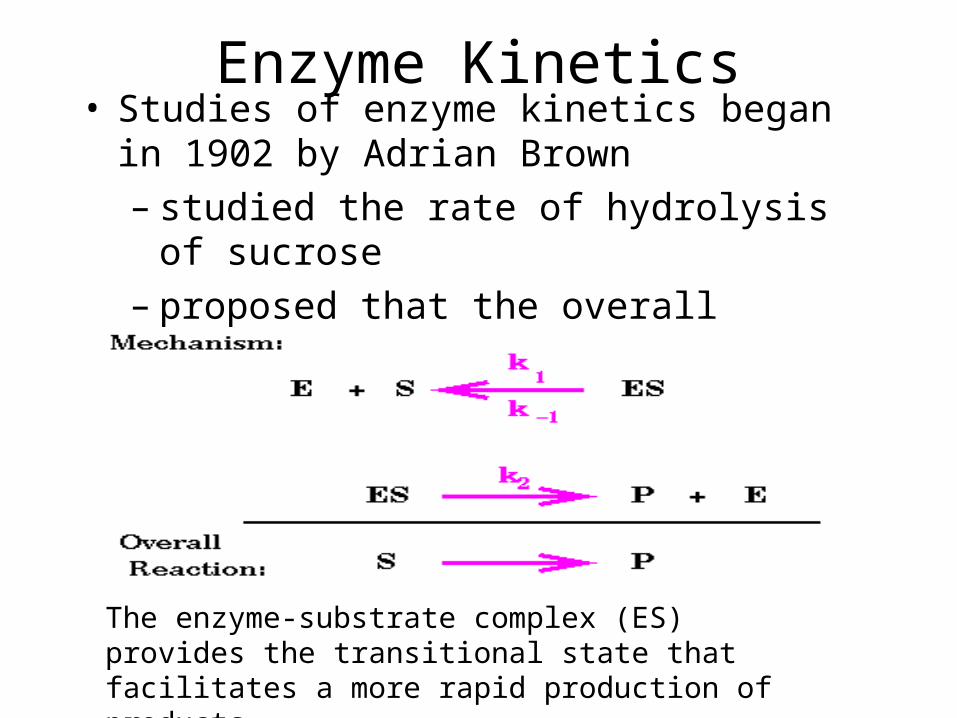
Enzyme Kinetics• Studies of enzyme kinetics began in 1902 by
Adrian Brown– studied the rate of hydrolysis of sucrose– proposed that the overall reaction was
composed of two elementary reactions
The enzyme-substrate complex (ES) provides the transitional state that facilitates a more rapid production of products

Enzyme Kinetics
• In 1913, Lenor Michaelis and Maude Menten made the assumption that the reversible step in the mechanism does achieve equilibrium
• Therefore, rewriting the law of chemical equilibrium for the reversible step and equating the ratio of the forward to reverse rate constants and making substitutions….
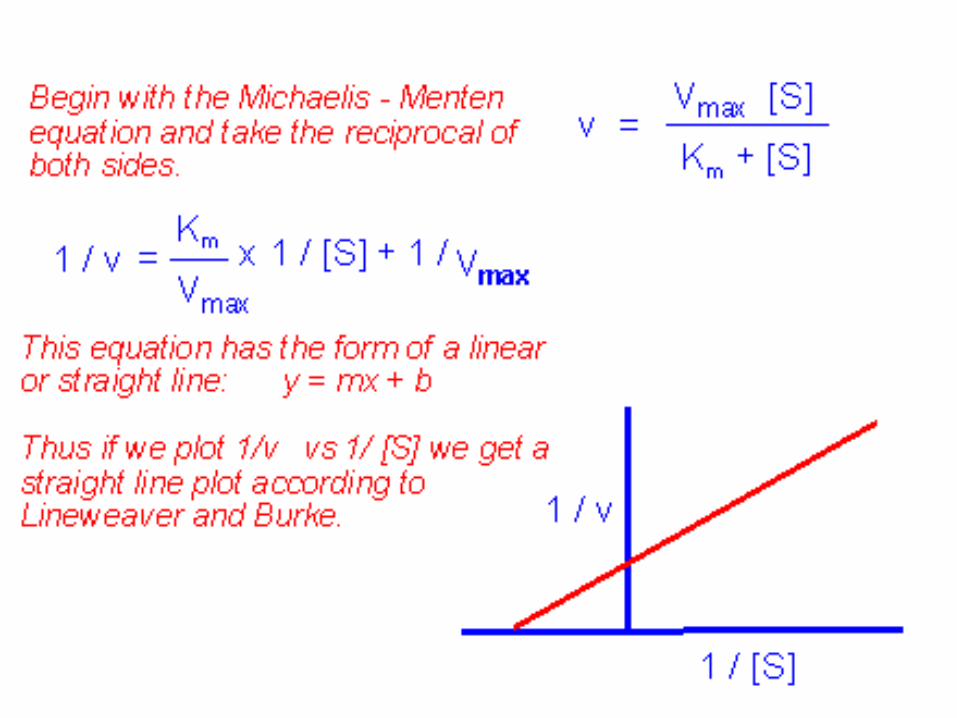
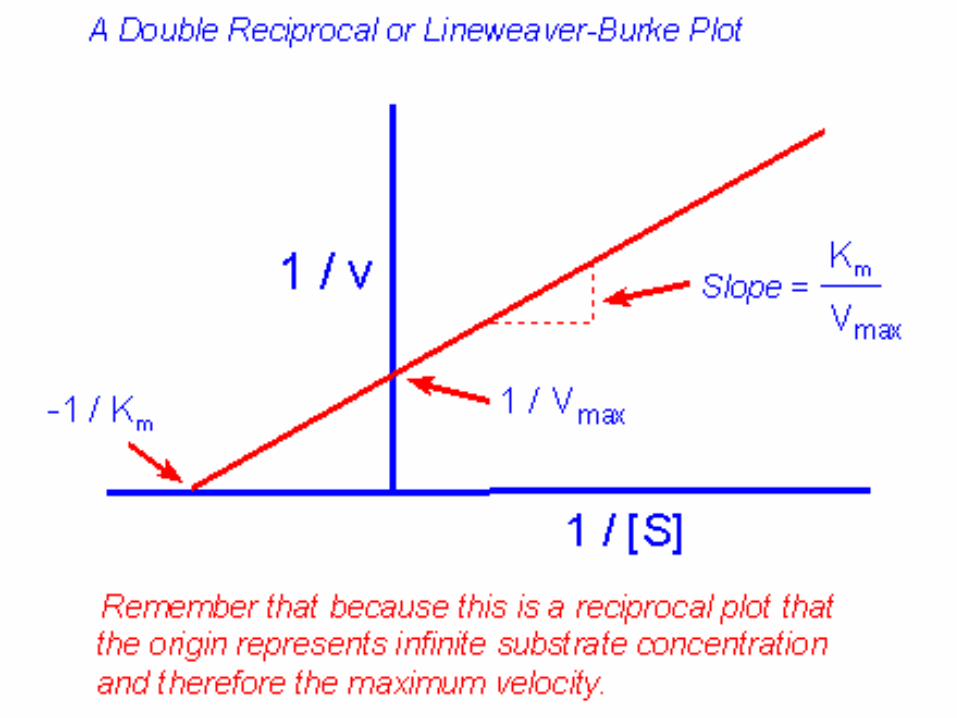
Enzyme Kinetics
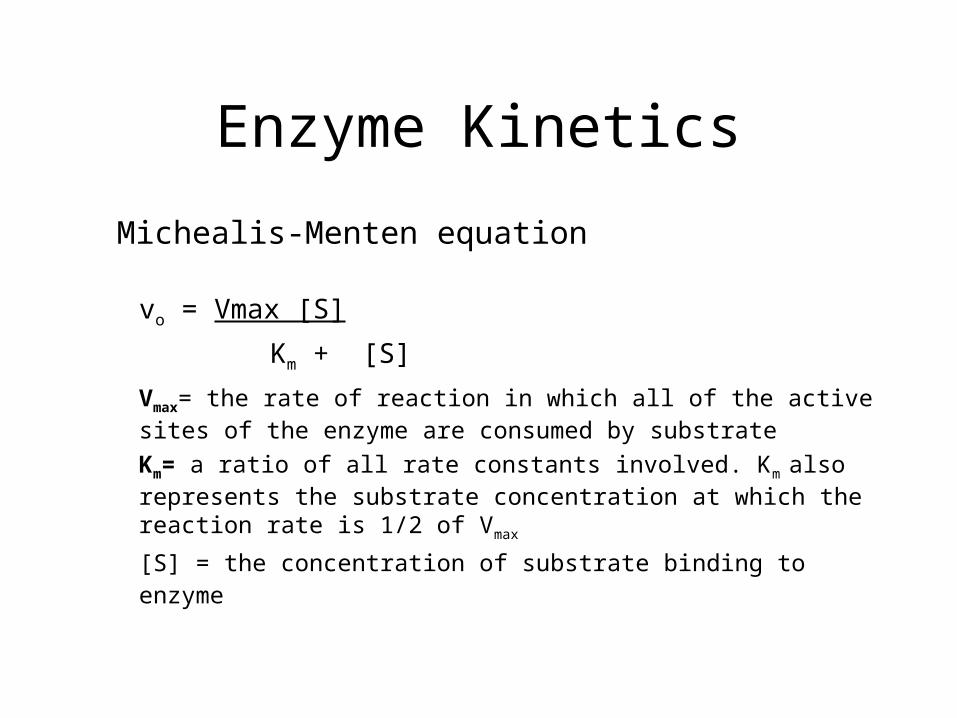
Michealis-Menten equation
vo = Vmax [S]
Km + [S]
Vmax= the rate of reaction in which all of the active sites of the enzyme are consumed by substrate
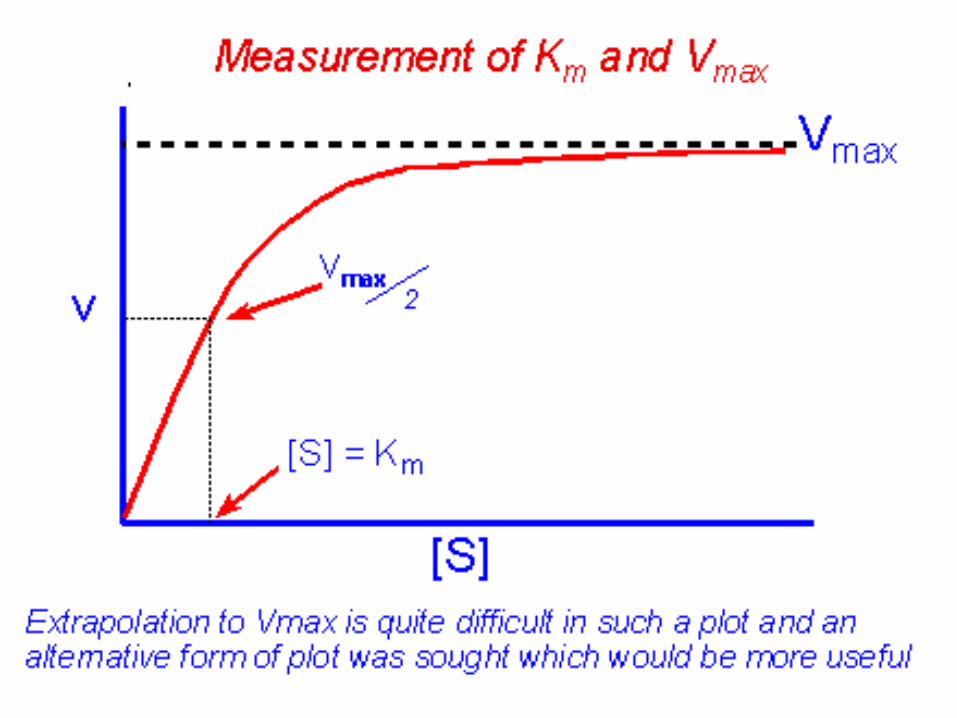
Km= a ratio of all rate constants involved. Km also represents the substrate concentration at which the reaction rate is 1/2 of Vmax
[S] = the concentration of substrate binding to enzyme

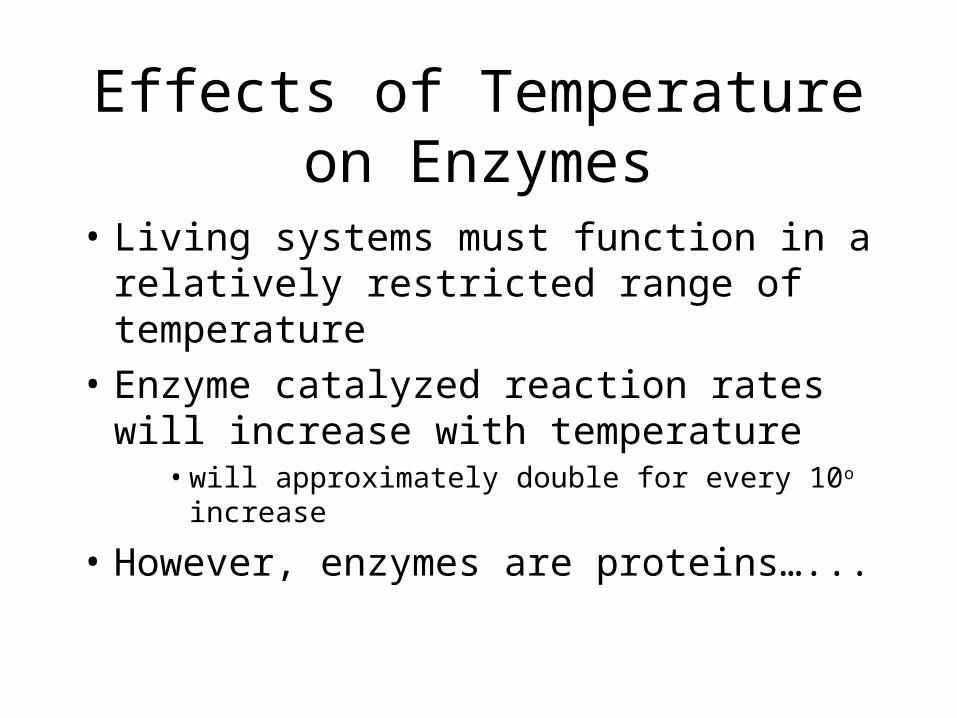
Effects of Temperature on Enzymes
• Living systems must function in a relatively restricted range of temperature
• Enzyme catalyzed reaction rates will increase with temperature
• will approximately double for every 10o increase
• However, enzymes are proteins…...


Tyrosinase Enzyme
• Copper containing oxidase• Widely distributed in plants, animals, and humans
– In plant cells, is responsible for browning in potatoes, apples and bananas
– In human cells, is responsible for catalyzing the biosynthesis of melanin pigments, causing suntans
• Method of assay:Tyrosinase + (d,l)-Dopa Dopachrome λ= 475 nm
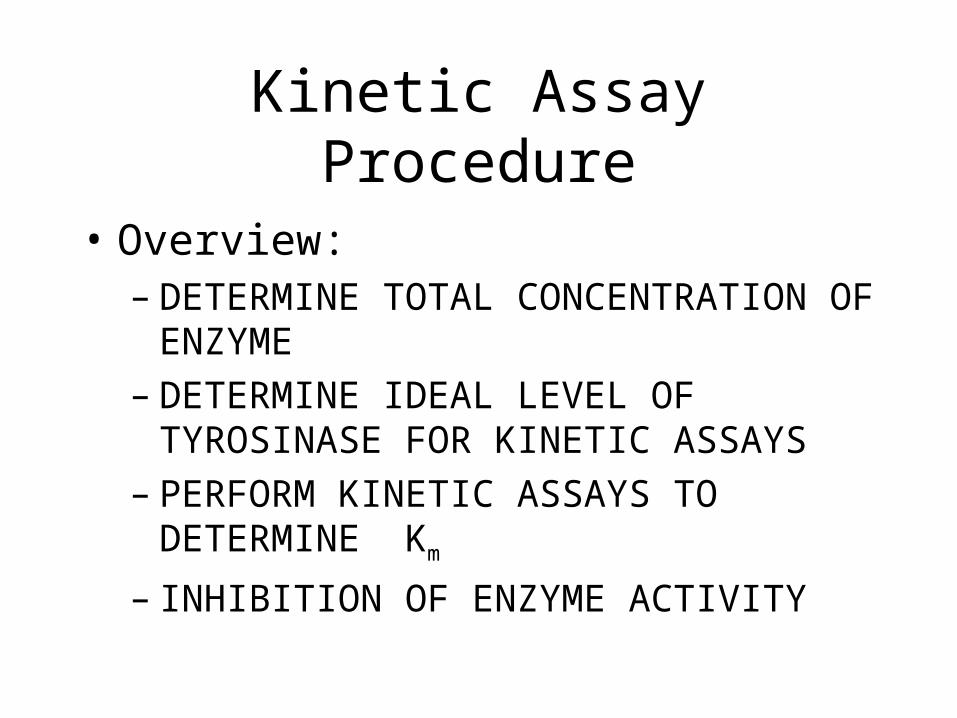
Kinetic Assay Procedure
• Overview:– DETERMINE TOTAL CONCENTRATION
OF ENZYME– DETERMINE IDEAL LEVEL OF
TYROSINASE FOR KINETIC ASSAYS– PERFORM KINETIC ASSAYS TO
DETERMINE Km
– INHIBITION OF ENZYME ACTIVITY
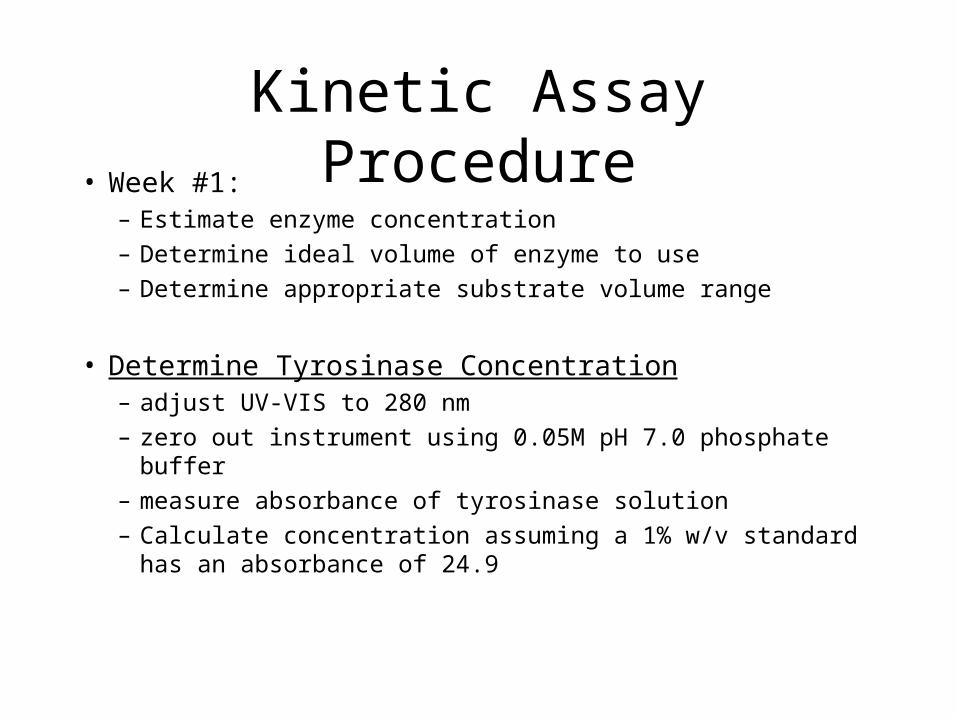
Kinetic Assay Procedure• Week #1:
– Estimate enzyme concentration– Determine ideal volume of enzyme to use– Determine appropriate substrate volume range
• Determine Tyrosinase Concentration– adjust UV-VIS to 280 nm– zero out instrument using 0.05M pH 7.0 phosphate buffer– measure absorbance of tyrosinase solution– Calculate concentration assuming a 1% w/v standard has an
absorbance of 24.9

Kinetic Assay Procedure• ** All reagents except enzyme will be stored at room temperature**
• Determination of Ideal Enzyme Volume:• Initially set up all 5 assays as given in the table EXCEPT for adding
enzyme (gently invert to mix)
Reagent (mL) 1 2 3 4 5phosphate buffer 1.45 1.40 1.30 1.20 1.10
l,d-Dopa 1.5 1.5 1.5 1.5 1.5
Tyrosinase 0.05 0.10 0.20 0.30 0.40
• Place into spectrophotometer at 475 nm and immediately set 0 and 100%T
Kinetic Assay (continued)
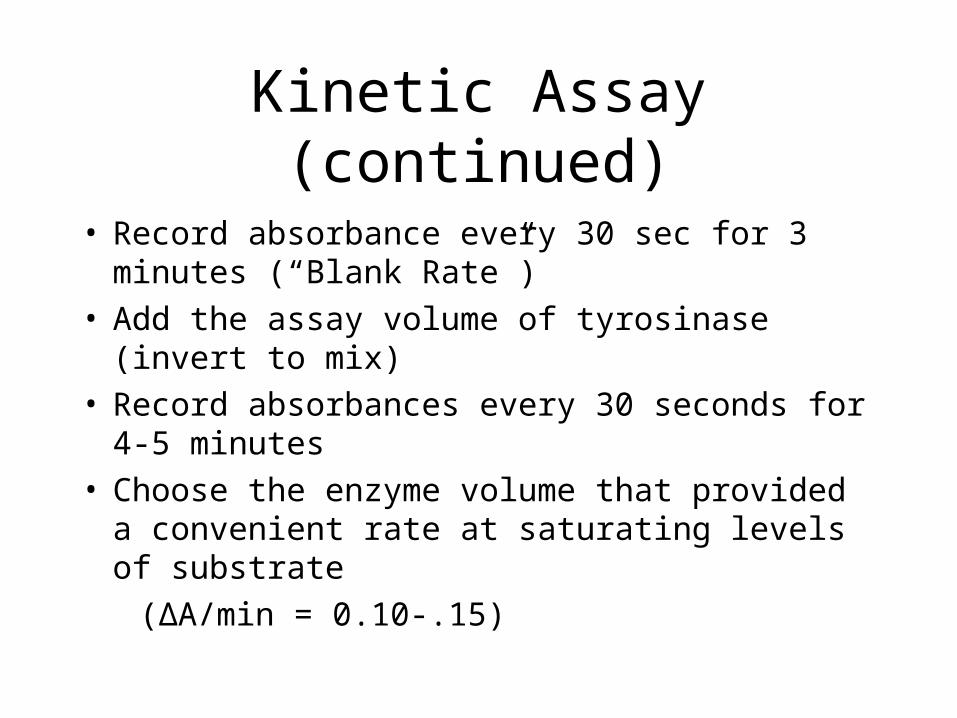
• Record absorbance every 30 sec for 3 minutes (“Blank Rate”)
• Add the assay volume of tyrosinase (invert to mix)• Record absorbances every 30 seconds for 4-5
minutes• Choose the enzyme volume that provided a
convenient rate at saturating levels of substrate
(ΔA/min = 0.10-.15)

• Determination of Substrate Volume:– Designed as a trial run to make sure the recommended volumes of substrate concentration will work
(sufficient changes in absorbance that aren’t too rapid or too slow)– If they don’t work, formulate a volume range that will
**Set up assays containing fixed volume of enzyme. Total volume always 3.0 mL**
Reagent 1 2 3 4 5
phosphate buffer (3.00 - (substrate + enzyme)
d,l-Dopa 0.10 0.40 0.80 1.0 1.50
tyrosinase *optimal enzyme volume
*Run assays just like previous step..running a blank, adding enzyme last, recording measurements every 30 sec
Kinetic Analysis of Tyrosinase Enzyme
Experiment #5
Week#2: Determination of Km
Inhibition

Enzyme Inhibition
• Inhibitors can halt the activity of an enzyme– results in a decreasing concentration of product
formation– Drug therapy is based on the inhibition of specific
enzymes
• There are three major classes of inhibitors– Competitive– Noncompetitive– Uncompetitive
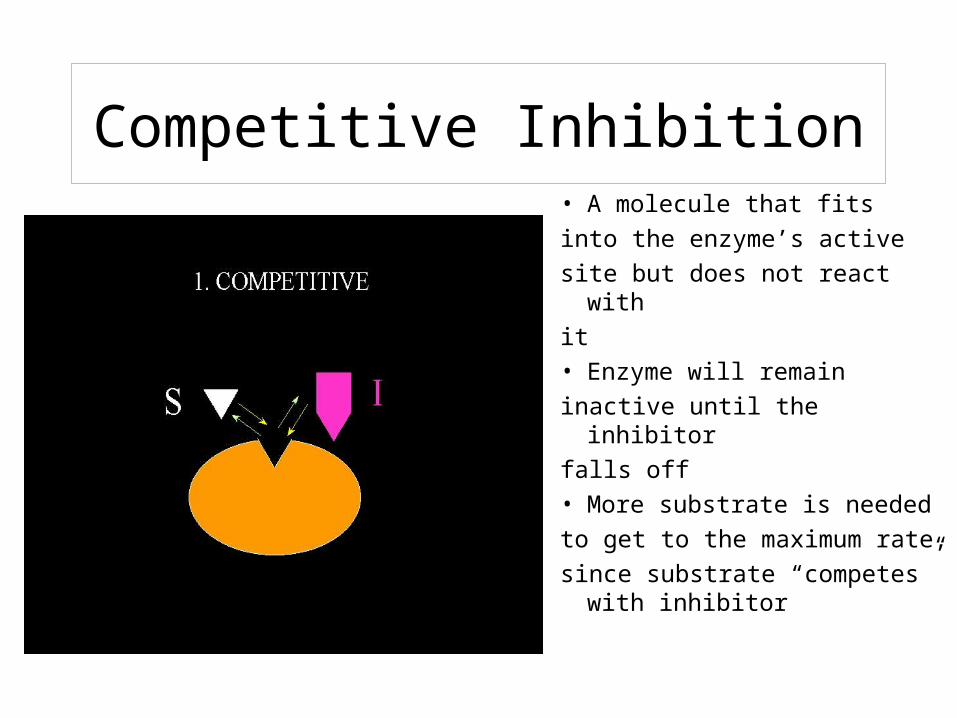
Competitive Inhibition• A molecule that fits
into the enzyme’s active
site but does not react with
it
• Enzyme will remain
inactive until the inhibitor
falls off
• More substrate is needed
to get to the maximum rate,
since substrate “competes” with inhibitor
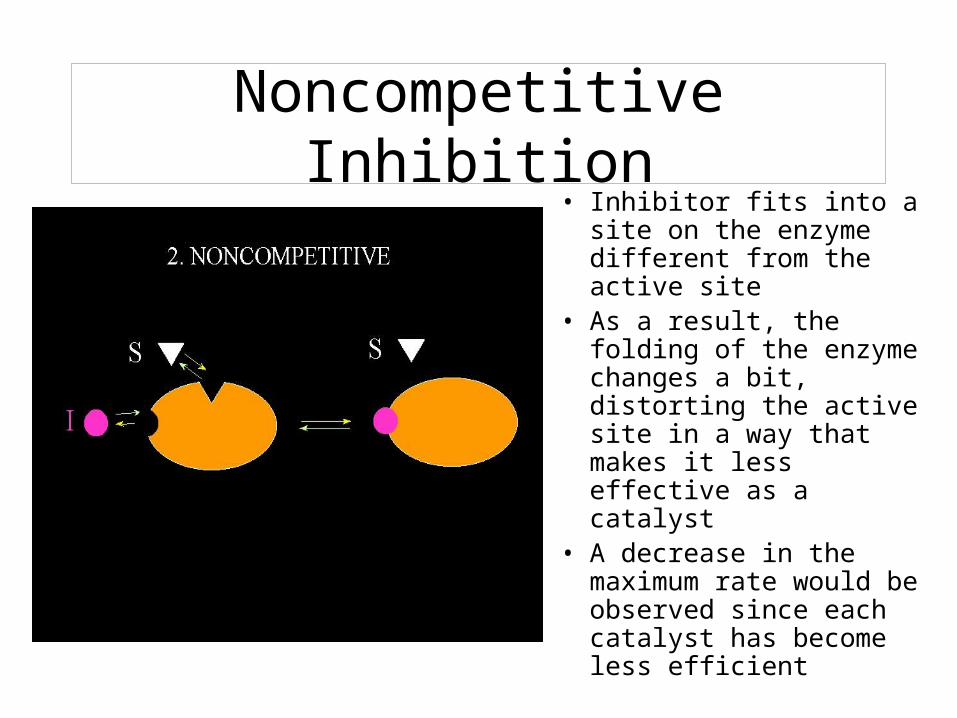
Noncompetitive Inhibition• Inhibitor fits into a site on
the enzyme different from the active site
• As a result, the folding of the enzyme changes a bit, distorting the active site in a way that makes it less effective as a catalyst
• A decrease in the maximum rate would be observed since each catalyst has become less efficient
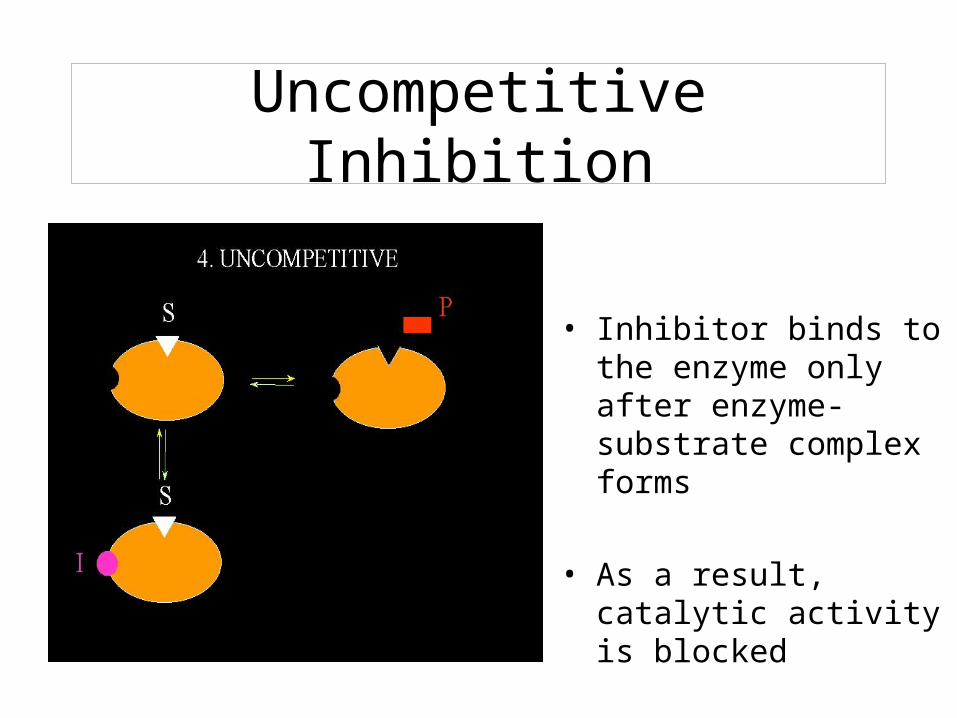
Uncompetitive Inhibition
• Inhibitor binds to the enzyme only after enzyme-substrate complex forms
• As a result, catalytic activity is blocked

Irreversible Inhibition
• Inhibitor may bind to the active site or alternative site
• Next, inhibitor forms a covalent bond to the enzyme
• Since inhibitor, will not fall off, the enzyme molecule is dead

Different slopes, same y-intercept (Km for substrate increases)
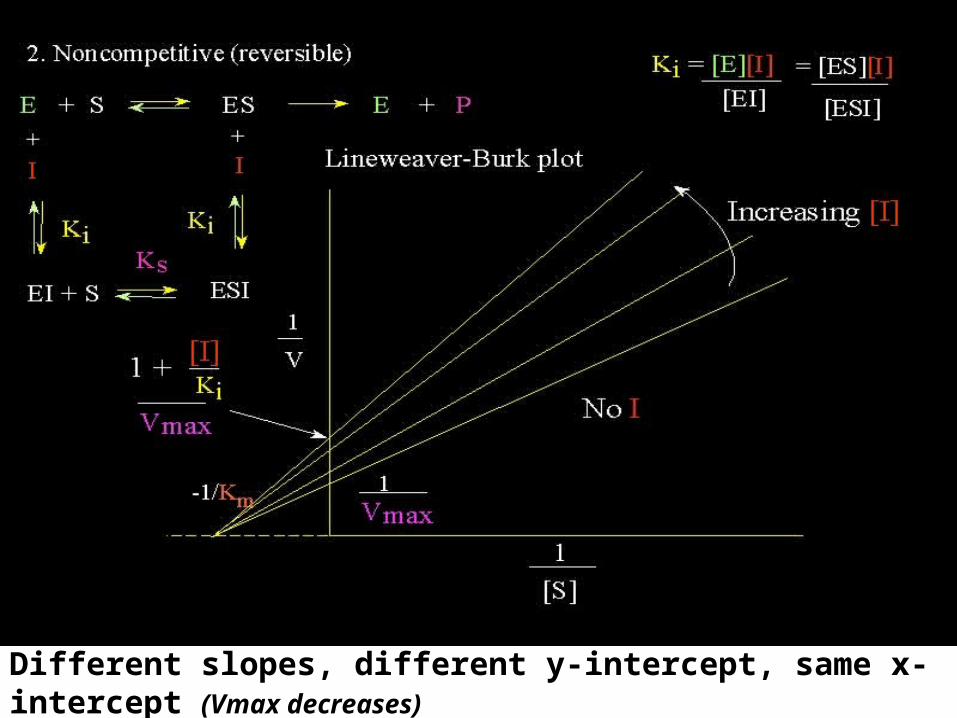
Different slopes, different y-intercept, same x-intercept (Vmax decreases)
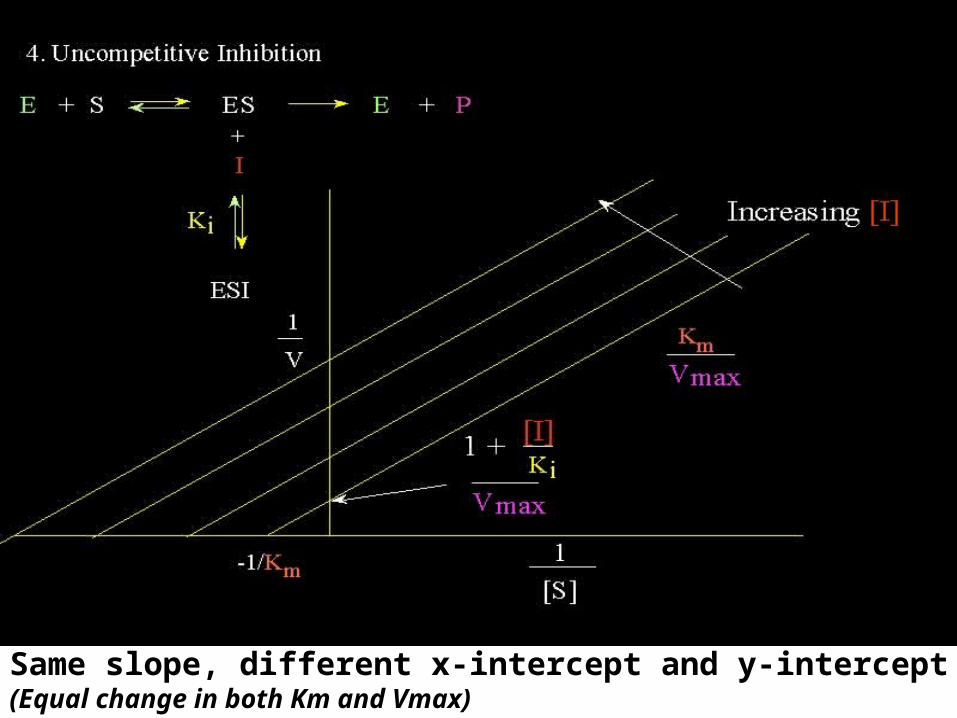
Same slope, different x-intercept and y-intercept (Equal change in both Km and Vmax)
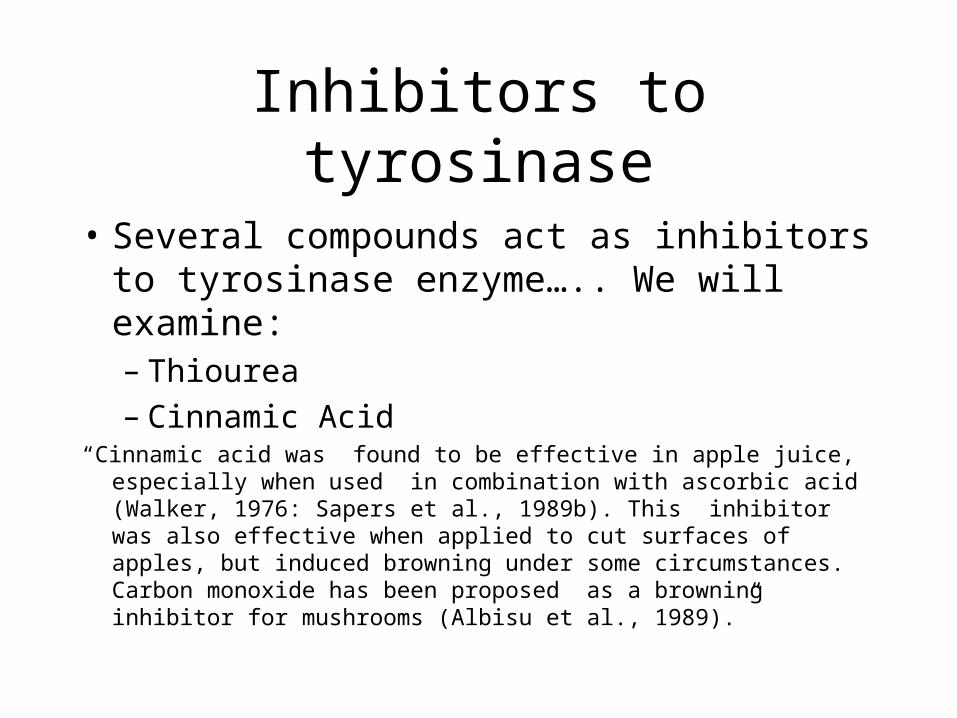
Inhibitors to tyrosinase
• Several compounds act as inhibitors to tyrosinase enzyme….. We will examine:– Thiourea– Cinnamic Acid
“Cinnamic acid was found to be effective in apple juice, especially when used in combination with ascorbic acid (Walker, 1976: Sapers et al., 1989b). This inhibitor was also effective when applied to cut surfaces of apples, but induced browning under some circumstances. Carbon monoxide has been proposed as a browning inhibitor for mushrooms (Albisu et al., 1989).”
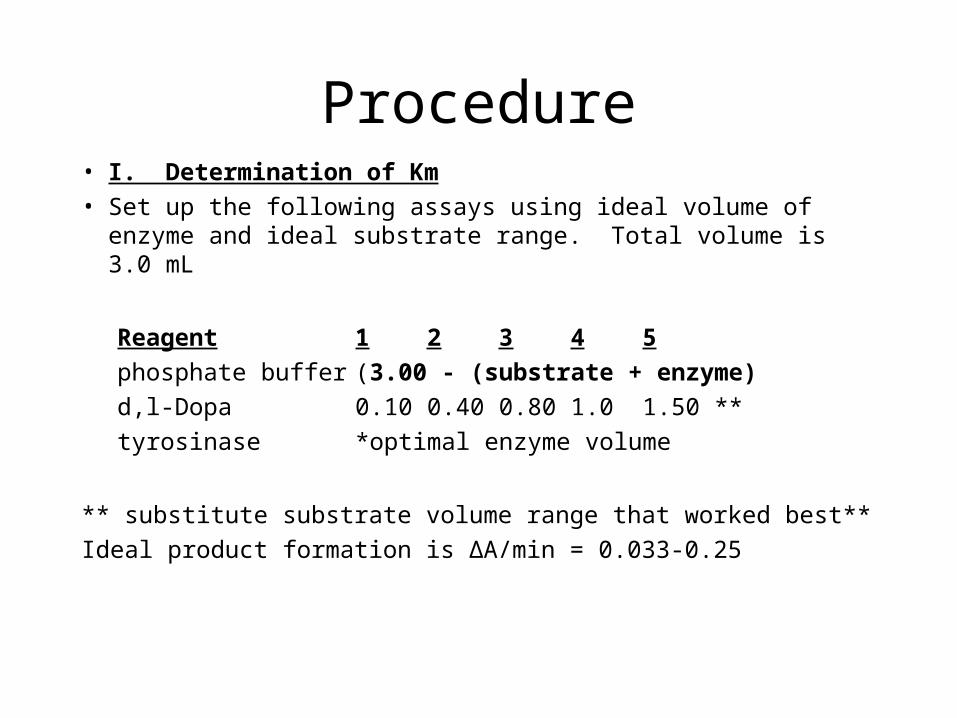
Procedure• I. Determination of Km
• Set up the following assays using ideal volume of enzyme and ideal substrate range. Total volume is 3.0 mL
Reagent 1 2 3 4 5
phosphate buffer (3.00 - (substrate + enzyme)
d,l-Dopa 0.10 0.40 0.80 1.0 1.50 **
tyrosinase *optimal enzyme volume
** substitute substrate volume range that worked best**
Ideal product formation is ΔA/min = 0.033-0.25

Procedure• Set up all 5 assays as given in the table except for
adding the enzyme• Place into spectrophotometer at 475 nm and
immediately set 0 and 100%T• Record absorbance every 30 seconds for 3 minutes
(“blank rate”)• Add the assay volume of tyrosinase, invert,
immediately set 100%T• Record absorbances every 30 seconds for 4 minutes
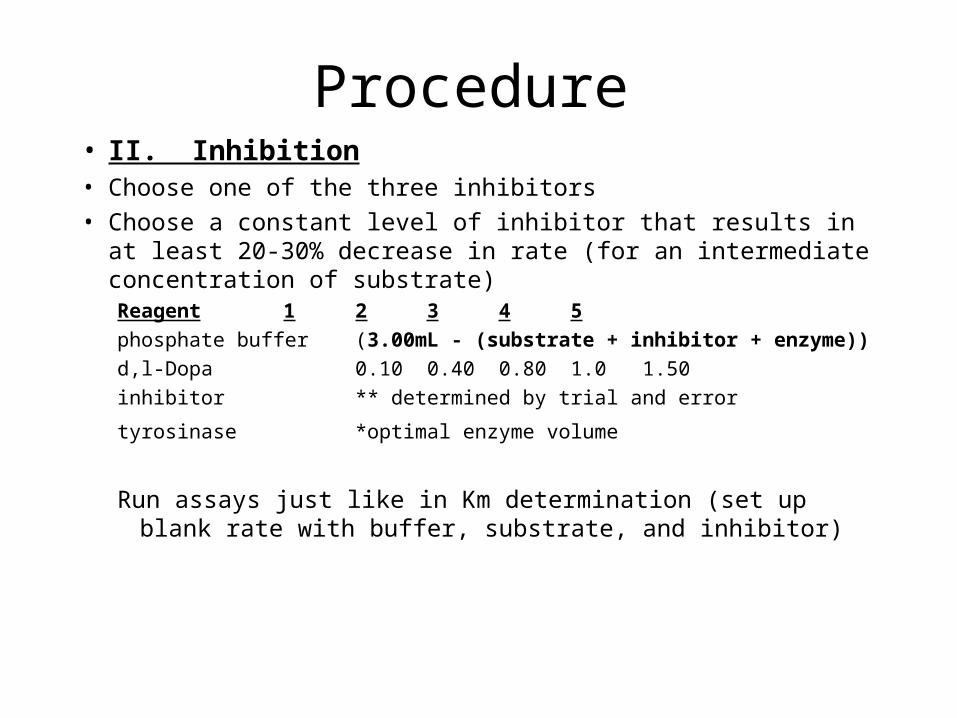
Procedure• II. Inhibition• Choose one of the three inhibitors• Choose a constant level of inhibitor that results in at least 20-30%
decrease in rate (for an intermediate concentration of substrate)Reagent 1 2 3 4 5
phosphate buffer (3.00mL - (substrate + inhibitor + enzyme))
d,l-Dopa 0.10 0.40 0.80 1.0 1.50
inhibitor ** determined by trial and error
tyrosinase *optimal enzyme volume
Run assays just like in Km determination (set up blank rate with buffer, substrate, and inhibitor)

Data AnalysisAssay #1Elapsed Time %T AbsorbanceBlank0 min..3 min
with enzyme0 min ….4 min
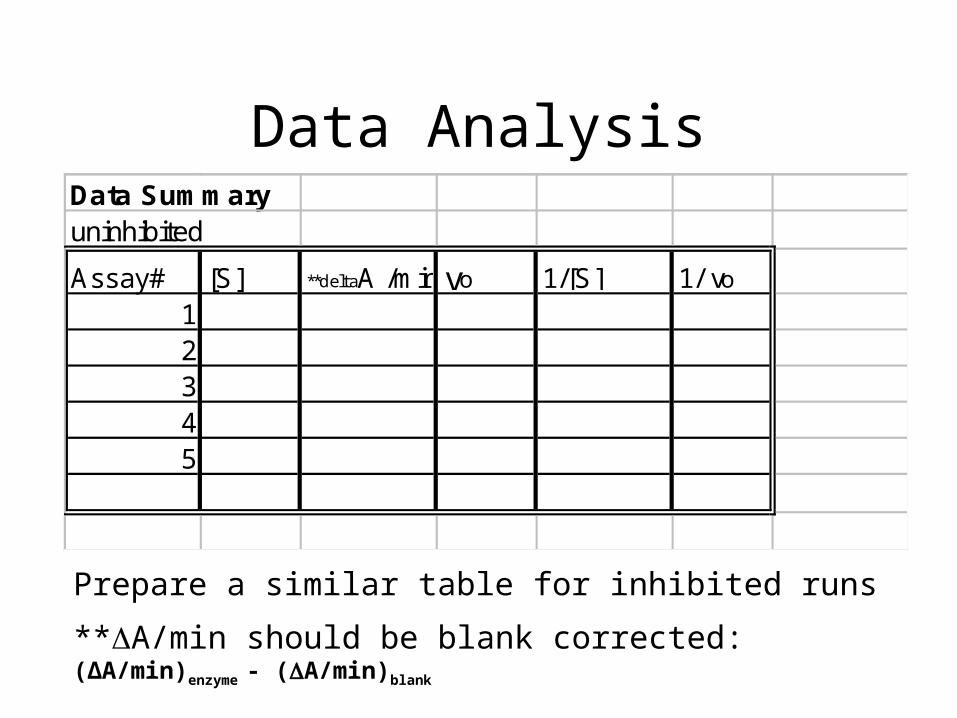
Data Analysis
Prepare a similar table for inhibited runs
**A/min should be blank corrected: (ΔA/min)enzyme - (A/min)blank
Data Summaryuninhibited
Assay# [S] **deltaA /min vo 1/[S] 1/ vo
12345

Data Analysis
Use the following formulas to calculate [S] and vo
[S]mg/mL = (volume used in assay)(“Stock conc.” mg/mL)
3.0 mL
[S] mol/L = Smg/mL x 1
197.2The rate of reaction is dependent on production of Dopachrome
molar absorptivity constant of dopachrome = 3600 mol/Lcm
Δc = ΔA/min (Δc )(.003L)(106 ) = vo (umol/min)
3600 x 1cm
(Δmol/Lmin )

Data Analysis• Use linear regression to calculate slope and intercept for
inhibited and uninhibited plot• Uninhibited Inhibitedy-intercept= 1/Vmax compare slope and 1/y-intercept = Vmax y-int to inhibited
competitive & noncompetitive
slope = Km/Vmax slopeinh = slopeuninh (1 + [I]/KI)
Km = (slope)(Vmax) [I] = (ml inhibitor used)(inhibitor, M) (3.0 mL)
uncompetitive
y-interceptinh = y-interceptuninh (1 + [I]/KI)
Related Documents