EPM Second Quarter Report: Key Performance Indicators Summary Dashboard In addition to the strategic side of the house, we also have the operational side which is represented by our Key Performance Indicators (KPIs). The KPIs are the third component of our Enterprise Performance Reporting structure and serve as a collection of performance indicators that measure and monitor the effectiveness of our efforts at the operational level. The Key Performance Indicators Summary Dashboard provides a brief synopsis of how all 62 KPIs are performing for the second quarter (October 1, 2021 – December 31, 2021). Additional performance details can be found on the summary sheets for each KPI. Informational KPIs are non-performance driven. Second Quarter Measure Performance: • 19 On-Target • 1 At-Risk • 5 Off-Target • 27 Pending Refresh • 6 Informational • 4 Closed Session item The Key Performance Indicators Summary Dashboard also provides trend analysis data that captures performance from year four (FY 2020-21). A visual depiction of all KPIs can be found on the Enterprise Operations Map. Second Quarter Report - Key Performance Indicators Page 1 of 123

Welcome message from author
This document is posted to help you gain knowledge. Please leave a comment to let me know what you think about it! Share it to your friends and learn new things together.
Transcript
EPM Second Quarter Report: Key Performance Indicators Summary Dashboard
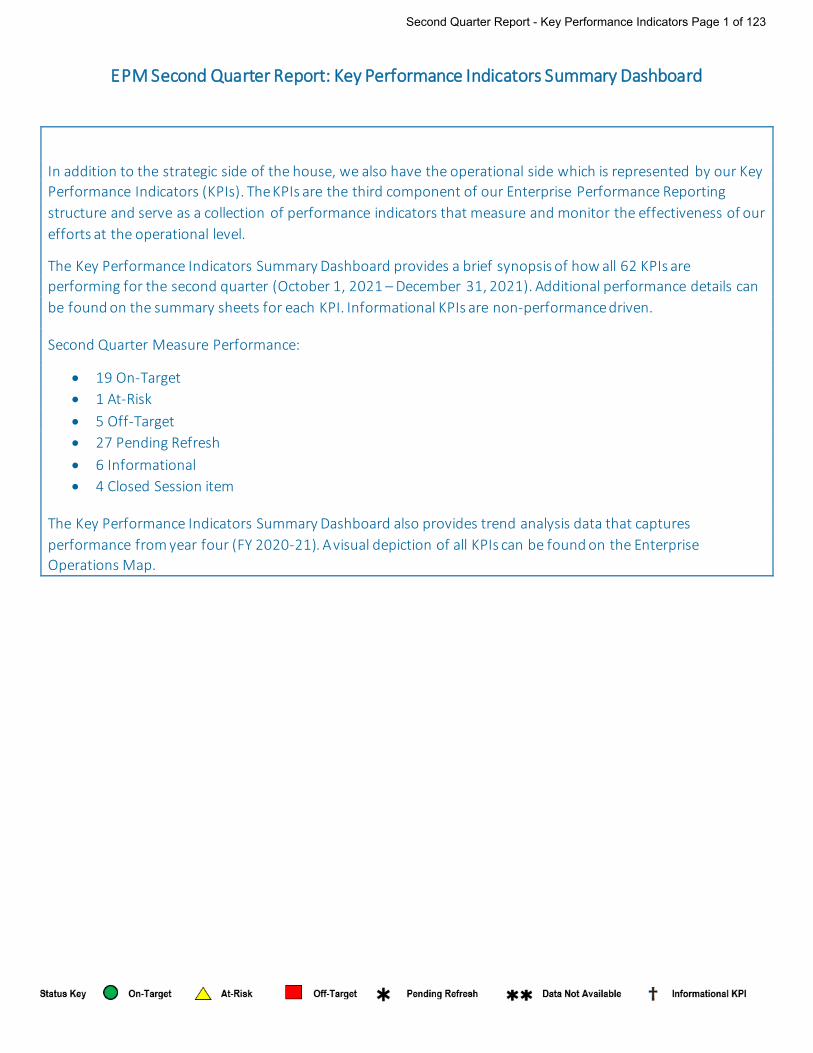
In addition to the strategic side of the house, we also have the operational side which is represented by our Key Performance Indicators (KPIs). The KPIs are the third component of our Enterprise Performance Reporting structure and serve as a collection of performance indicators that measure and monitor the effectiveness of our efforts at the operational level.
The Key Performance Indicators Summary Dashboard provides a brief synopsis of how all 62 KPIs are performing for the second quarter (October 1, 2021 – December 31, 2021). Additional performance details can be found on the summary sheets for each KPI. Informational KPIs are non-performance driven.
Second Quarter Measure Performance:
• 19 On-Target• 1 At-Risk• 5 Off-Target• 27 Pending Refresh• 6 Informational• 4 Closed Session item
The Key Performance Indicators Summary Dashboard also provides trend analysis data that captures performance from year four (FY 2020-21). A visual depiction of all KPIs can be found on the Enterprise Operations Map.
Second Quarter Report - Key Performance Indicators Page 1 of 123
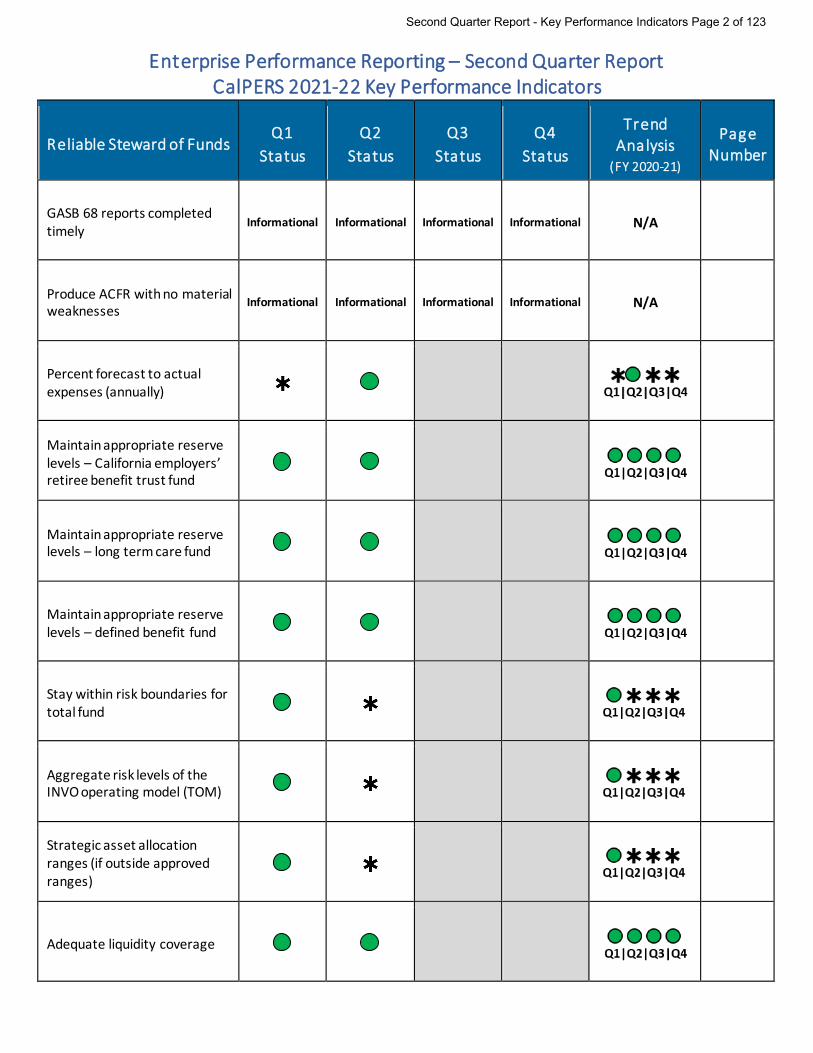
Enterprise Performance Reporting – Second Quarter Report CalPERS 2021-22 Key Performance Indicators
Reliable Steward of Funds Q1
Status Q2
Status Q3
Status Q4
Status
Trend Analysis
(FY 2020-21)
Page Number
GASB 68 reports completed timely
Informational Informational Informational Informational N/A
Produce ACFR with no material weaknesses
Informational Informational Informational Informational N/A
Percent forecast to actual expenses (annually)
Will be reported next quarter
Will be reported next quarter
Maintain appropriate reserve levels – California employers’ retiree benefit trust fund
Will be reported next
quarter Will be reported next
quarter
Maintain appropriate reserve levels – long term care fund
Will be reported next quarter
Will be reported next quarter
Maintain appropriate reserve levels – defined benefit fund
Will be reported next quarter
Will be reported next quarter
Stay within risk boundaries for total fund
Will be reported next quarter
Will be reported next quarter
Aggregate risk levels of the INVO operating model (TOM)
Will be reported next quarter
Will be reported next quarter
Strategic asset allocation ranges (if outside approved ranges)
Will be reported next
quarter Will be reported next
quarter
Adequate liquidity coverage Will be reported next
quarter Will be reported next
quarter
Second Quarter Report - Key Performance Indicators Page 2 of 123
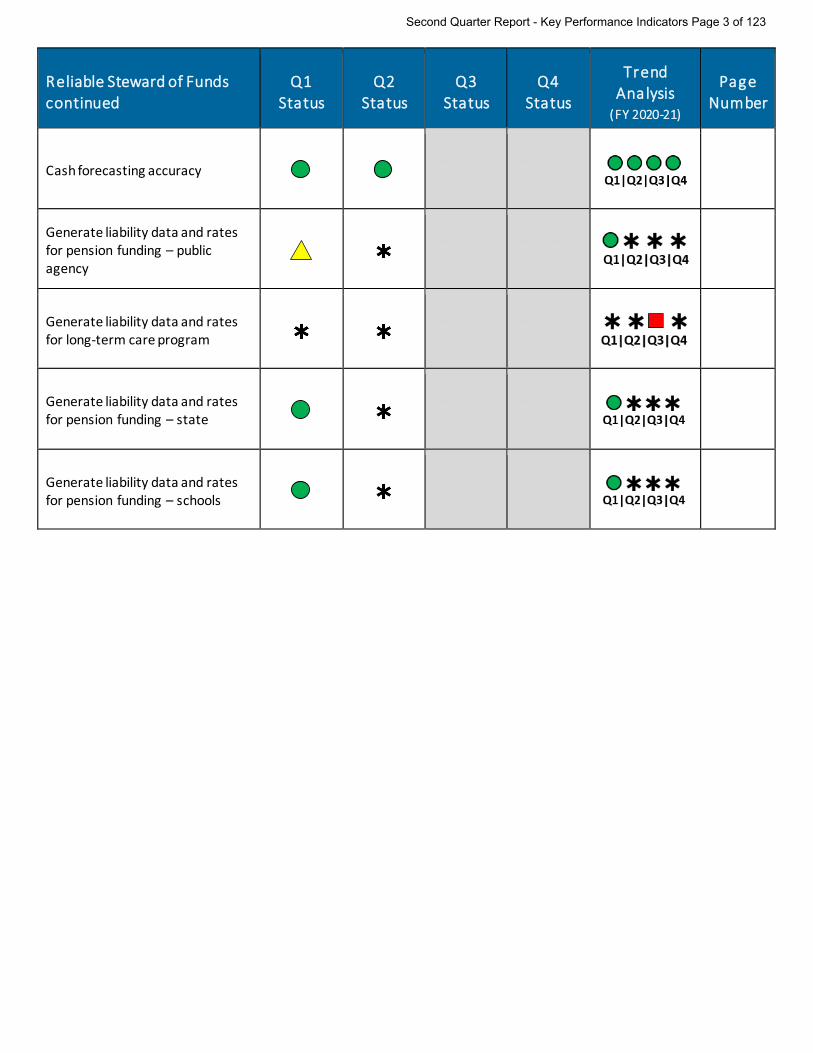
Reliable Steward of Funds continued
Q1 Status
Q2 Status
Q3 Status
Q4 Status
Trend Analysis
(FY 2020-21)
Page Number
Cash forecasting accuracy Will be reported next
quarter Will be reported next
quarter
Generate liability data and rates for pension funding – public agency
Will be reported next
quarter Will be reported next
quarter
Generate liability data and rates for long-term care program
Will be reported next quarter
Will be reported next quarter
Generate liability data and rates for pension funding – state
Will be reported next quarter
Will be reported next quarter
Generate liability data and rates for pension funding – schools
Will be reported next quarter
Will be reported next quarter
Second Quarter Report - Key Performance Indicators Page 3 of 123
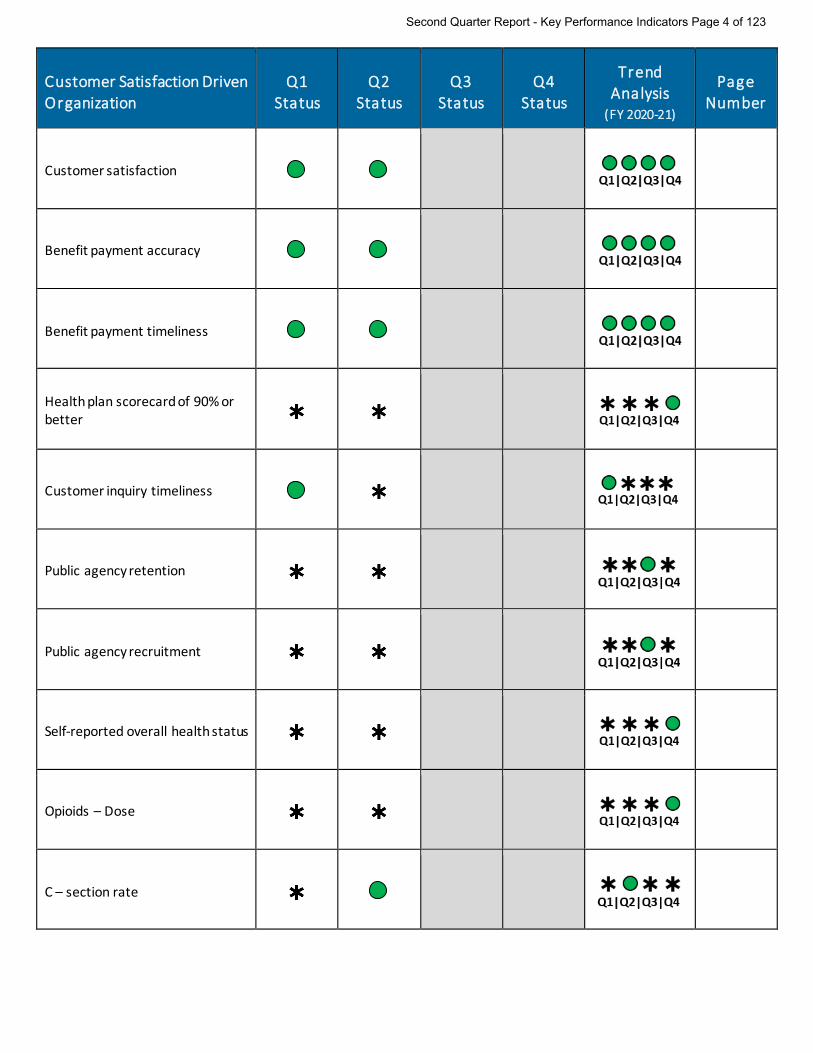
Customer Satisfaction Driven Organization
Q1 Status
Q2 Status
Q3 Status
Q4 Status
Trend Analysis
(FY 2020-21)
Page Number
Customer satisfaction Will be reported next
quarter Will be reported next
quarter
Benefit payment accuracy Will be reported next
quarter Will be reported next
quarter
Benefit payment timeliness Will be reported next
quarter Will be reported next
quarter
Health plan scorecard of 90% or better
Will be reported next quarter
Will be reported next quarter
Customer inquiry timeliness Will be reported next
quarter Will be reported next
quarter
Public agency retention Will be reported next
quarter Will be reported next
quarter
Public agency recruitment Will be reported next
quarter Will be reported next
quarter
Self-reported overall health status Will be reported next
quarter Will be reported next
quarter
Opioids – Dose Will be reported next
quarter Will be reported next
quarter
C – section rate Will be reported next
quarter Will be reported next
quarter
Second Quarter Report - Key Performance Indicators Page 4 of 123
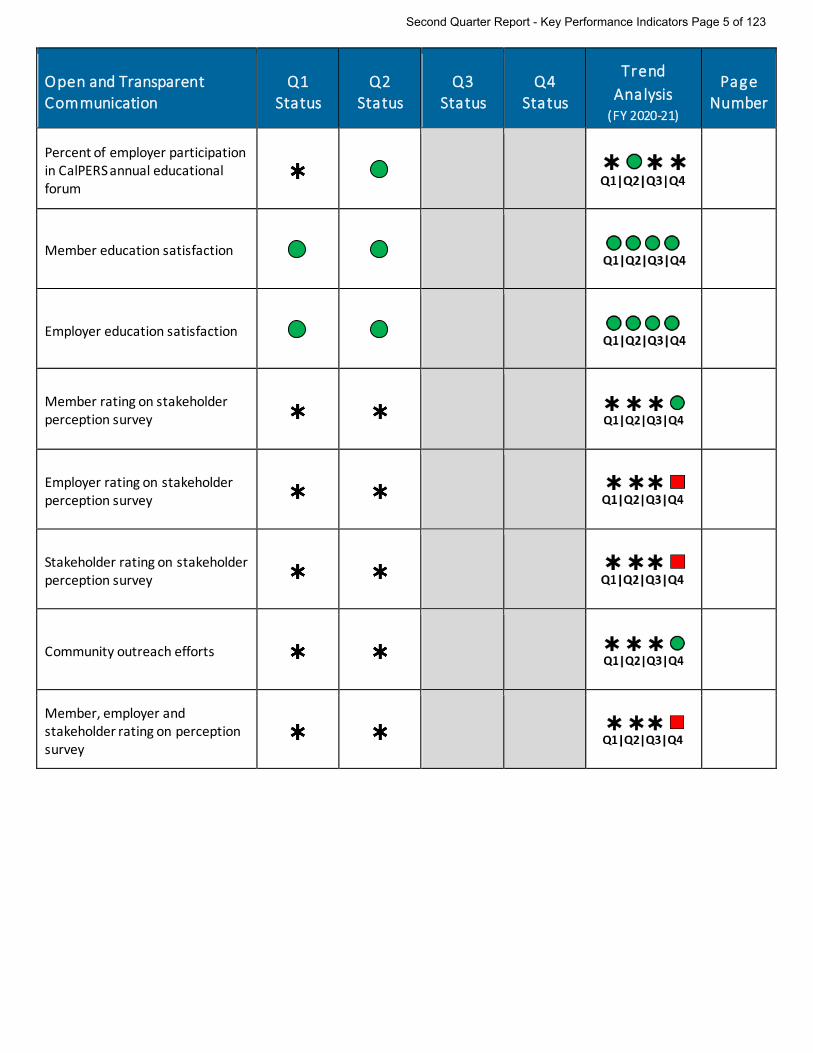
Open and Transparent Communication
Q1 Status
Q2 Status
Q3 Status
Q4 Status
Trend Analysis
(FY 2020-21)
Page Number
Percent of employer participation in CalPERS annual educational forum
Will be reported next
quarter Will be reported next
quarter
Member education satisfaction Will be reported next
quarter Will be reported next
quarter
Employer education satisfaction Will be reported next
quarter Will be reported next
quarter
Member rating on stakeholder perception survey
Will be reported next quarter
Will be reported next quarter
Employer rating on stakeholder perception survey
Will be reported next quarter
Will be reported next quarter
Stakeholder rating on stakeholder perception survey
Will be reported next quarter
Will be reported next quarter
Community outreach efforts Will be reported next
quarter Will be reported next
quarter
Member, employer and stakeholder rating on perception survey
Will be reported next
quarter Will be reported next
quarter
Second Quarter Report - Key Performance Indicators Page 5 of 123
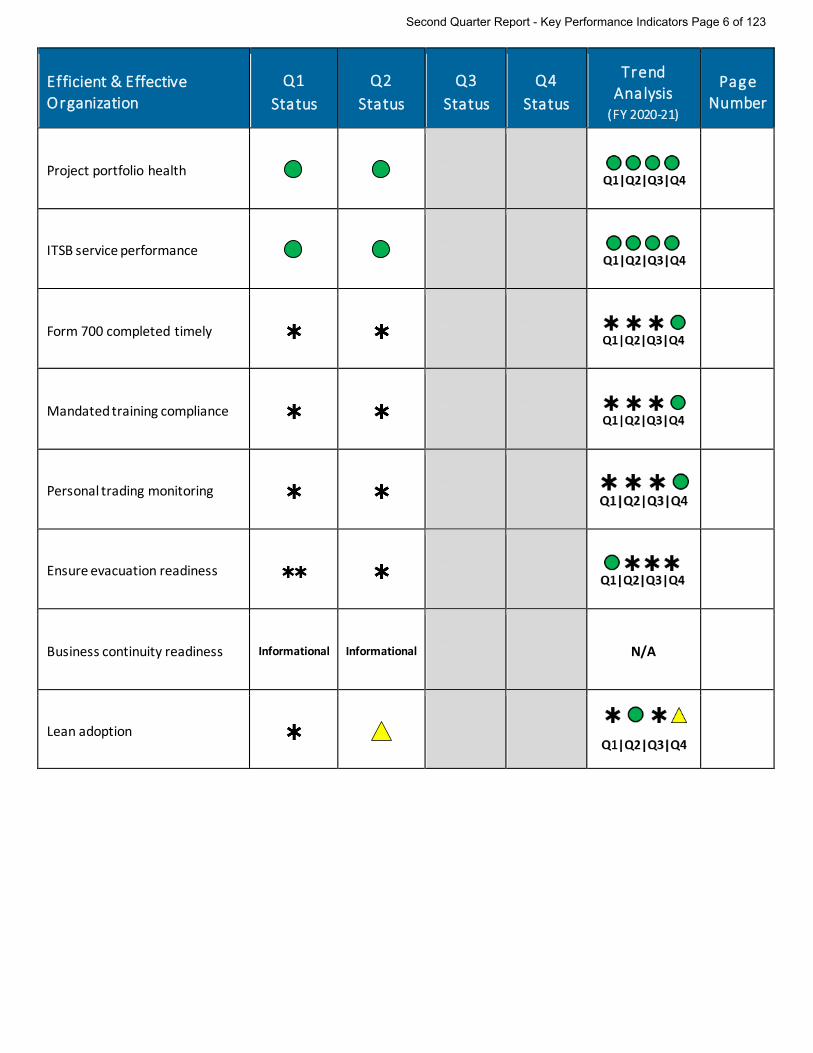
Efficient & Effective Organization
Q1 Status
Q2 Status
Q3 Status
Q4 Status
Trend Analysis
(FY 2020-21)
Page Number
Project portfolio health Will be reported next
quarter Will be reported next
quarter
ITSB service performance Will be reported next
quarter Will be reported next
quarter
Form 700 completed timely Will be reported next
quarter Will be reported next
quarter
Mandated training compliance Will be reported next
quarter Will be reported next
quarter
Personal trading monitoring Will be reported next
quarter Will be reported next
quarter
Ensure evacuation readiness Will be reported next
quarter Will be reported next
quarter
Business continuity readiness Informational Informational Will be reported next quarter
Will be reported next quarter N/A
Lean adoption Will be reported next
quarter Will be reported next
quarter
Second Quarter Report - Key Performance Indicators Page 6 of 123
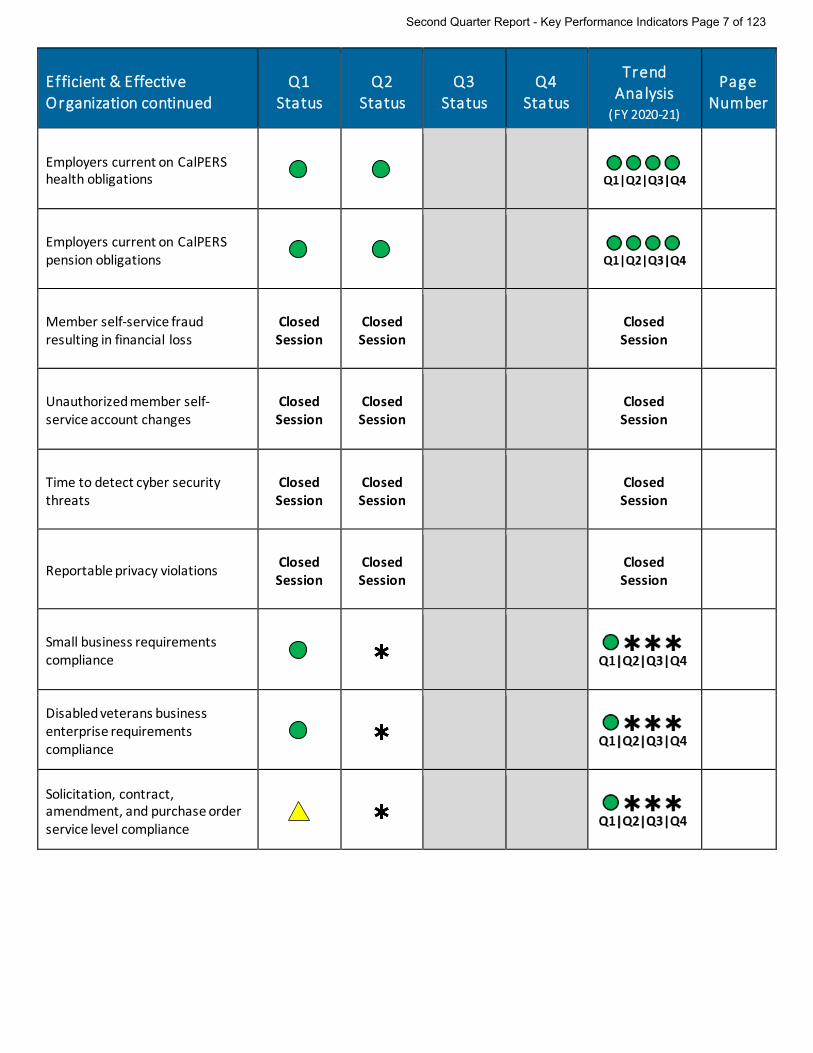
Efficient & Effective Organization continued
Q1 Status
Q2 Status
Q3 Status
Q4 Status
Trend Analysis
(FY 2020-21)
Page Number
Employers current on CalPERS health obligations
Will be reported next quarter
Will be reported next quarter
Employers current on CalPERS pension obligations
Will be reported next quarter
Will be reported next quarter
Member self-service fraud resulting in financial loss
Closed Session
Closed Session
Will be reported next quarter
Will be reported next quarter
Closed Session
Unauthorized member self-service account changes
Closed Session
Closed Session
Will be reported next quarter
Will be reported next quarter
Closed Session
Time to detect cyber security threats
Closed Session
Closed Session
Will be reported next quarter
Will be reported next quarter
Closed Session
Reportable privacy violations Closed Session
Closed Session
Will be reported next quarter
Will be reported next quarter
Closed Session
Small business requirements compliance
Will be reported next quarter
Will be reported next quarter
Disabled veterans business enterprise requirements compliance
Will be reported next
quarter Will be reported next
quarter
Solicitation, contract, amendment, and purchase order service level compliance
Will be reported next
quarter Will be reported next
quarter
Second Quarter Report - Key Performance Indicators Page 7 of 123

Supportive & Engaged Leadership
Q1 Status
Q2 Status
Q3 Status
Q4 Status
Trend Analysis
(FY 2020-21)
Page Number
Team member perception of leadership – manager relationships
Will be reported next
quarter Will be reported next
quarter
Health of enterprise performance reporting framework
Will be reported next
quarter Will be reported next
quarter
Second Quarter Report - Key Performance Indicators Page 8 of 123
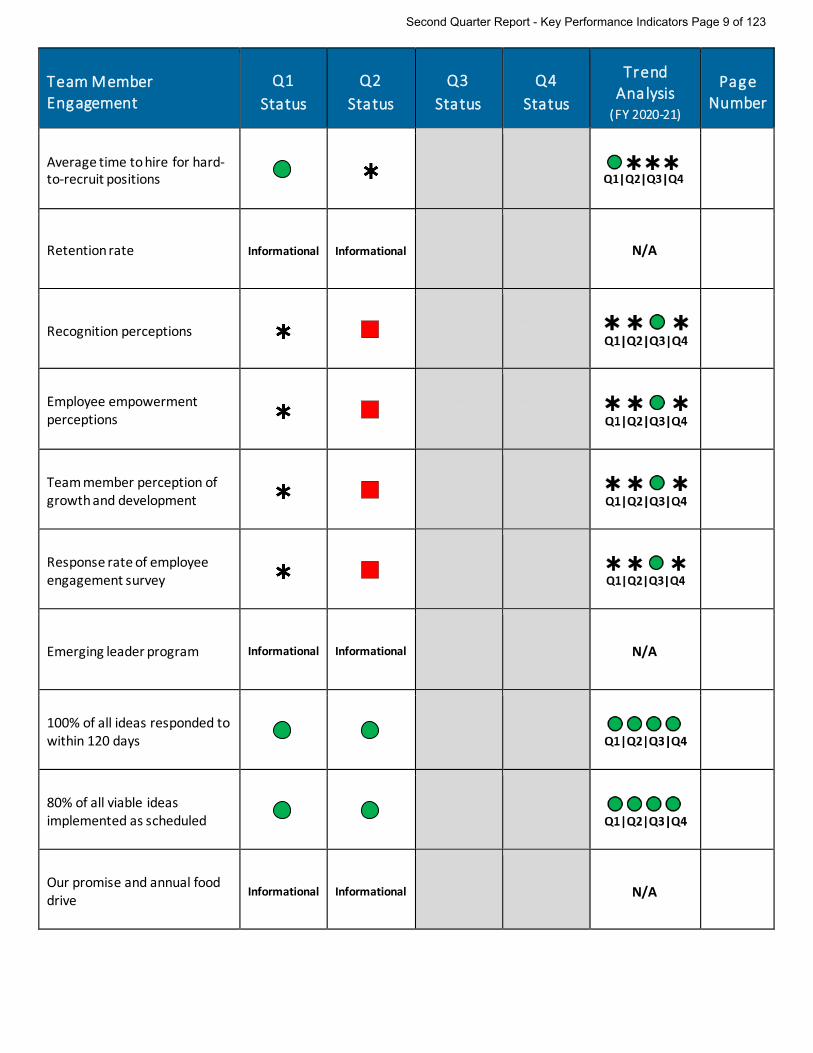
Team Member Engagement
Q1 Status
Q2 Status
Q3 Status
Q4 Status
Trend Analysis
(FY 2020-21)
Page Number
Average time to hire for hard-to-recruit positions
Will be reported next quarter
Will be reported next quarter
Retention rate Informational Informational Will be reported next quarter
Will be reported next quarter N/A
Recognition perceptions Will be reported next
quarter Will be reported next
quarter
Employee empowerment perceptions
Will be reported next quarter
Will be reported next quarter
Team member perception of growth and development
Will be reported next quarter
Will be reported next quarter
Response rate of employee engagement survey
Will be reported next quarter
Will be reported next quarter
Emerging leader program Informational Informational Will be reported next quarter
Will be reported next quarter N/A
100% of all ideas responded to within 120 days
Will be reported next quarter
Will be reported next quarter
80% of all viable ideas implemented as scheduled
Will be reported next quarter
Will be reported next quarter
Our promise and annual food drive
Informational Informational Will be reported next quarter
Will be reported next quarter N/A
Second Quarter Report - Key Performance Indicators Page 9 of 123
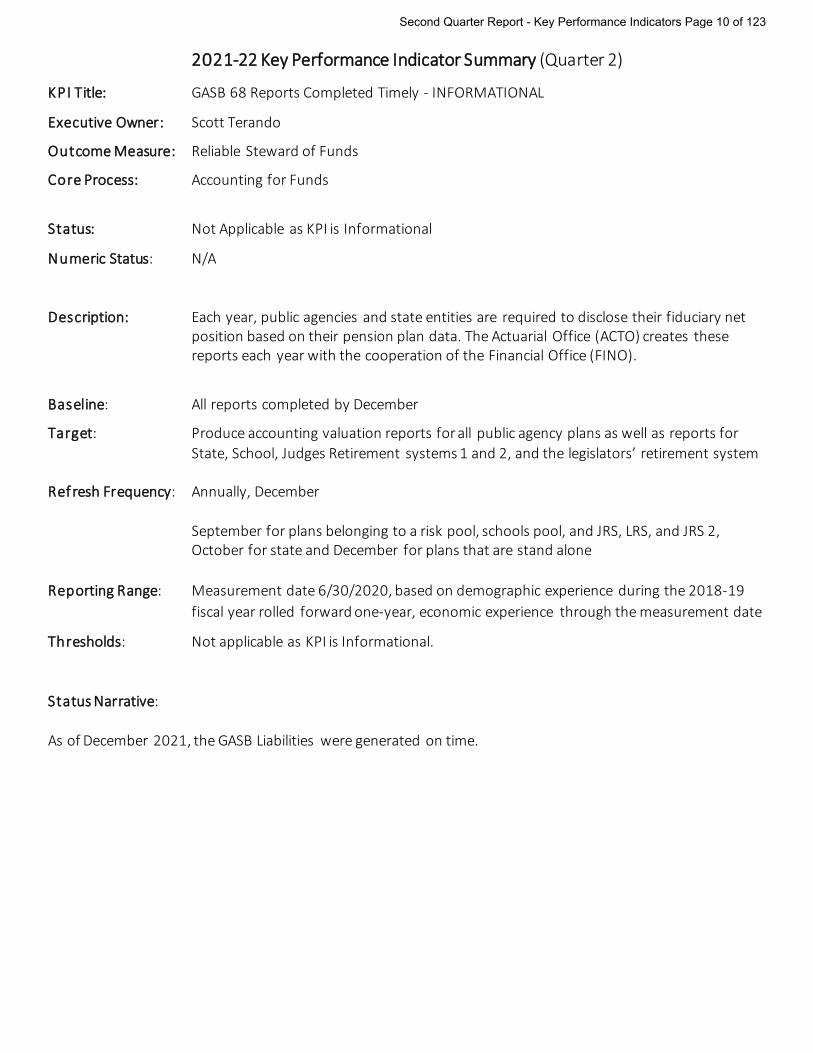
2021-22 Key Performance Indicator Summary (Quarter 2)
KPI Title: GASB 68 Reports Completed Timely - INFORMATIONAL
Executive Owner: Scott Terando
Outcome Measure: Reliable Steward of Funds
Core Process: Accounting for Funds
Status: Not Applicable as KPI is Informational
Numeric Status: N/A
Description: Each year, public agencies and state entities are required to disclose their fiduciary net position based on their pension plan data. The Actuarial Office (ACTO) creates these reports each year with the cooperation of the Financial Office (FINO).
Baseline: All reports completed by December
Target: Produce accounting valuation reports for all public agency plans as well as reports for State, School, Judges Retirement systems 1 and 2, and the legislators’ retirement system
Refresh Frequency: Annually, December
September for plans belonging to a risk pool, schools pool, and JRS, LRS, and JRS 2, October for state and December for plans that are stand alone
Reporting Range: Measurement date 6/30/2020, based on demographic experience during the 2018-19
fiscal year rolled forward one-year, economic experience through the measurement date
Thresholds: Not applicable as KPI is Informational.
Status Narrative:
As of December 2021, the GASB Liabilities were generated on time.
Second Quarter Report - Key Performance Indicators Page 10 of 123
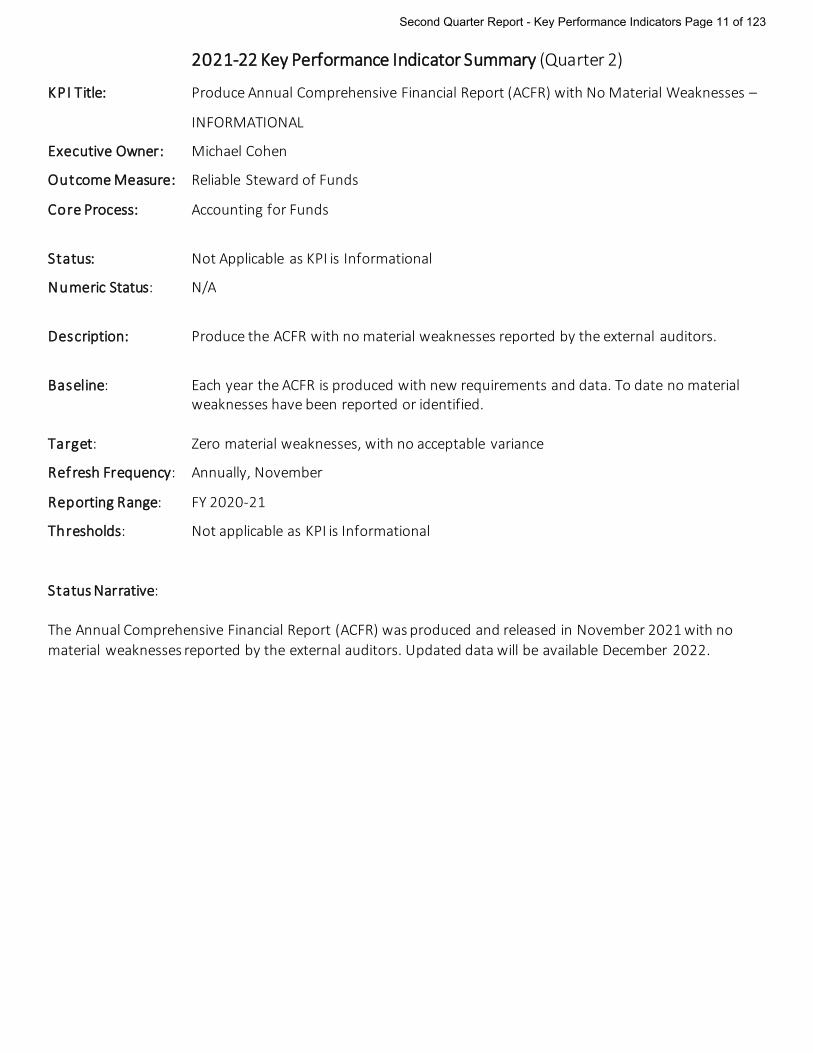
2021-22 Key Performance Indicator Summary (Quarter 2)
KPI Title: Produce Annual Comprehensive Financial Report (ACFR) with No Material Weaknesses –
INFORMATIONAL
Executive Owner: Michael Cohen
Outcome Measure: Reliable Steward of Funds
Core Process: Accounting for Funds
Status: Not Applicable as KPI is Informational
Numeric Status: N/A
Description: Produce the ACFR with no material weaknesses reported by the external auditors.
Baseline: Each year the ACFR is produced with new requirements and data. To date no material weaknesses have been reported or identified.
Target: Zero material weaknesses, with no acceptable variance
Refresh Frequency: Annually, November
Reporting Range: FY 2020-21
Thresholds: Not applicable as KPI is Informational
Status Narrative:
The Annual Comprehensive Financial Report (ACFR) was produced and released in November 2021 with no material weaknesses reported by the external auditors. Updated data will be available December 2022.
Second Quarter Report - Key Performance Indicators Page 11 of 123

2021-22 Key Performance Indicator Summary (Quarter 2)
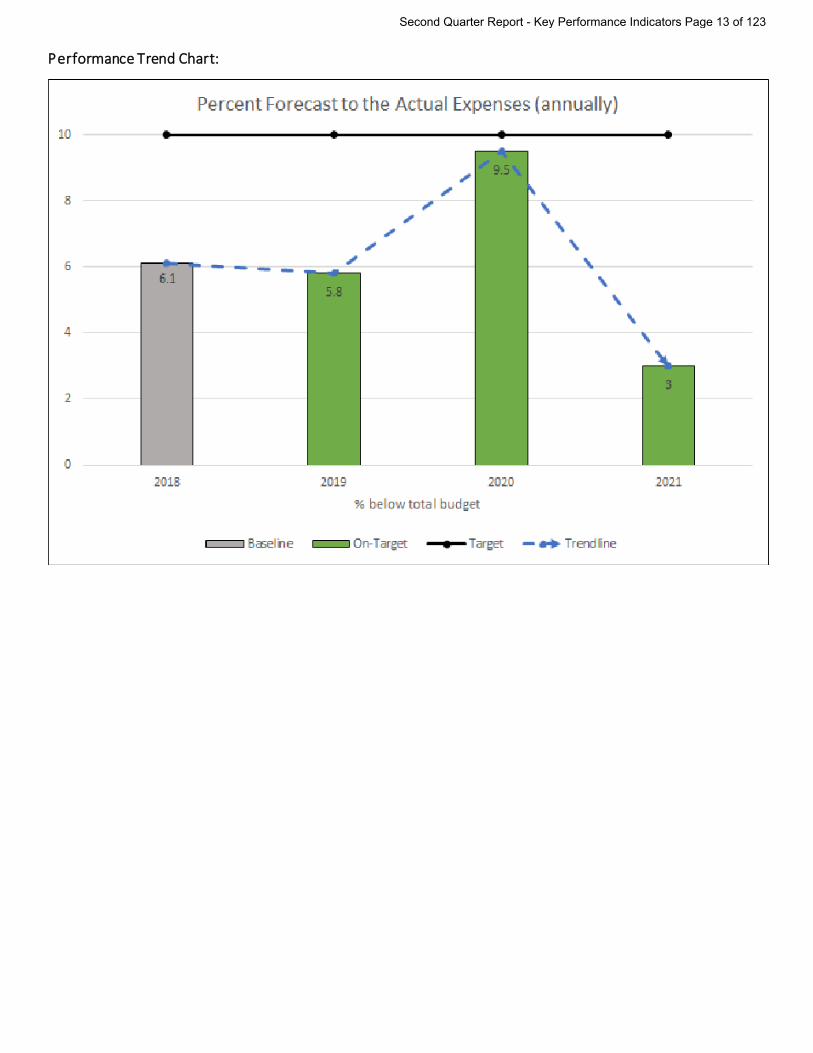
KPI Title: Percent Forecast to the Actual Expenses (Annually)
Executive Owner: Michael Cohen
Outcome Measure: Reliable Steward of Funds
Core Process: Accounting for Funds
Status: On-Target
Numeric Status: 3.0% below total budget for 2020-21
Description: The percentage of forecast to actual expenses will measure how closely the
organization’s ability to adequately project future expenses. Actual expenses exclude investment external management fees.
Baseline: 6.1% below total budget for FY 2017-18
Target: Accuracy at or below 10% of total budget
Refresh Frequency: Annually, December
Reporting Range: FY 2020-21
Thresholds: On-Target: Accuracy at or below 10% of total budget At-Risk: Accuracy at or below 10.1% – 15% of total budget Off-Target: Accuracy at or below 15.1% of total budget
Status Narrative:
As of November 2021, data reflects this KPI was On-Target at 3.0% below the total budget. Updated performance data will be available December 2022.
Second Quarter Report - Key Performance Indicators Page 12 of 123
Performance Trend Chart:
Second Quarter Report - Key Performance Indicators Page 13 of 123
2021-22 Key Performance Indicator Summary (Quarter 2)
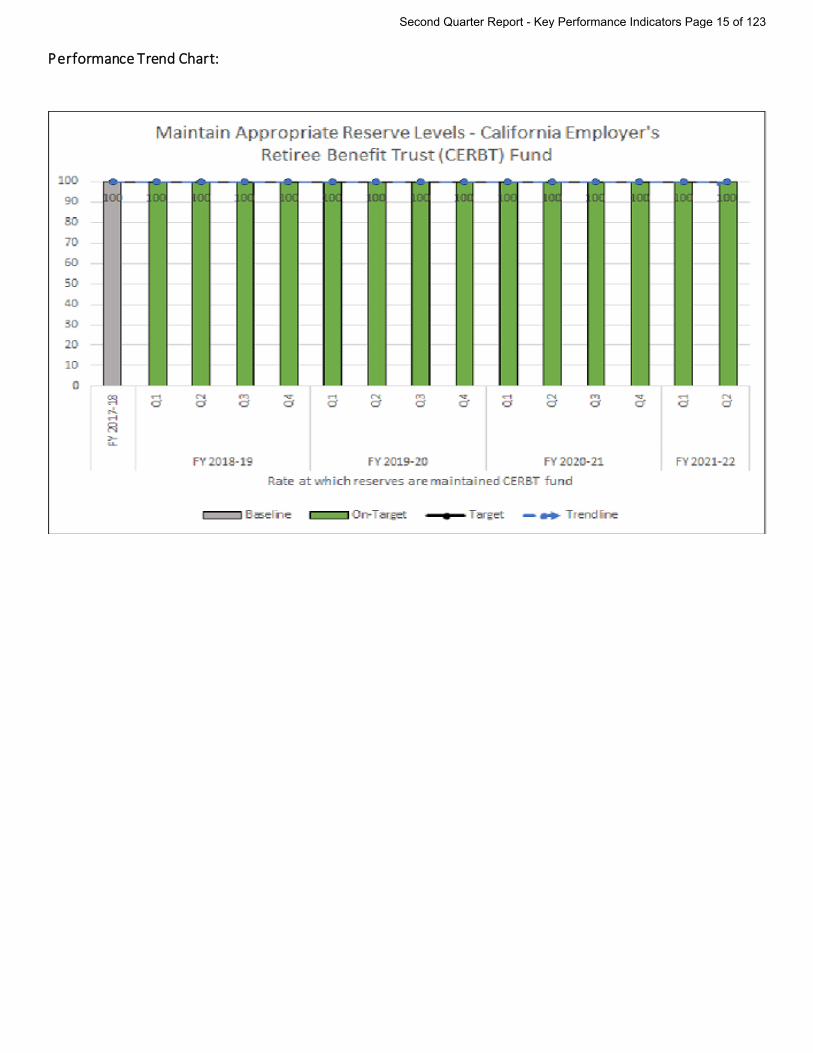
KPI Title: Maintain Appropriate Reserve Levels – California Employer’s Retiree Benefit Trust Fund
Executive Owner: Michael Cohen
Outcome Measure: Reliable Steward of Funds
Core Process: Accounting for Funds
Status: On-Target
Numeric Status: 100%
Description: Treasury Management (TM) reserves are established to ensure the payment of member
benefits and other obligations without interruption while optimizing the use of fund assets. A TM Reserve is defined as liquid assets dedicated to the payment of member benefits and other obligations during a stressed or crisis event. The TM reserves are documented in the TM Reserve Policy and reviewed annually. The California Employers’ Retiree Benefit Trust Fund (CERBT) has a reserve requirement to prefund monthly benefit payments by 5 business days.
Baseline: The baseline is 100% since reserve targets were met in FY2017-18
Target: The target is to comply with the Treasury Management Reserve Policy and meet 100% of reserve targets
Refresh Frequency: Quarterly
Reporting Range: 10/01/2021 – 12/31/2021
Thresholds: On-Target: 100% of reserve targets were met At-Risk: 98% to 99% of reserve targets were met Off-Target: Less than 97% of reserve targets were met
Status Narrative:
100% of reserve targets were met during the 2nd quarter of FY 2021-22.
Second Quarter Report - Key Performance Indicators Page 14 of 123
Performance Trend Chart:
Second Quarter Report - Key Performance Indicators Page 15 of 123
2021-22 Key Performance Indicator Summary (Quarter 2)
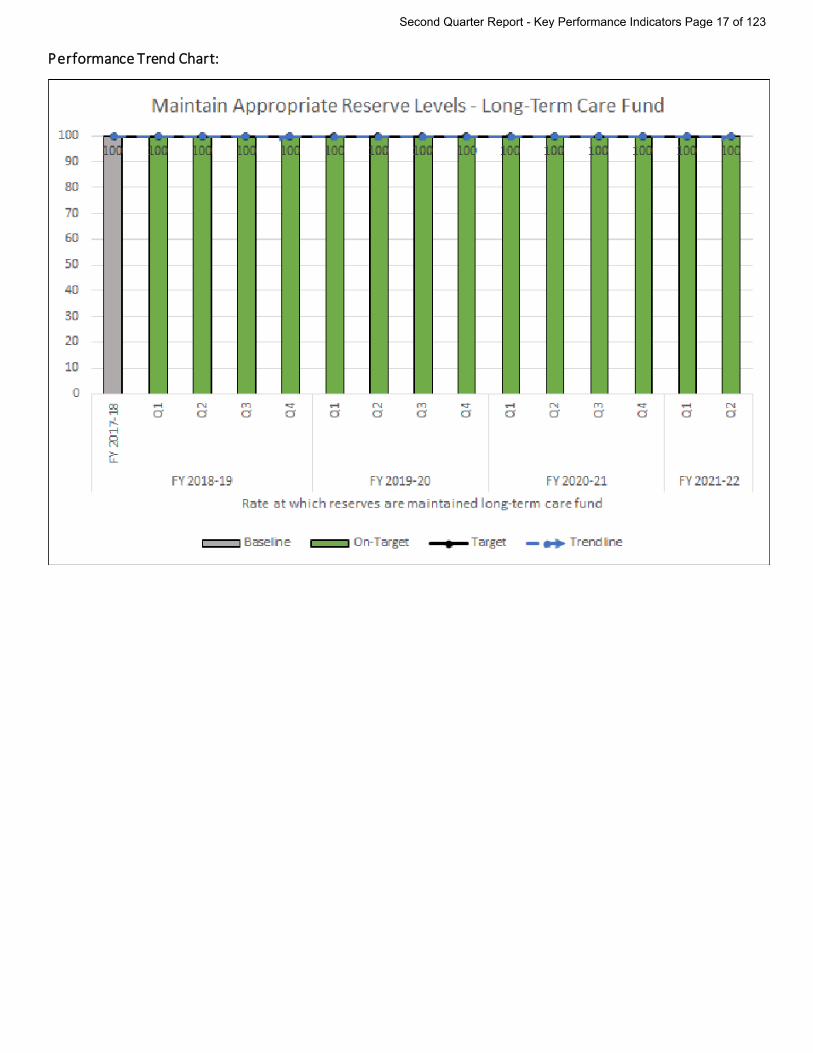
KPI Title: Maintain Appropriate Reserve Levels – Long-Term Care Fund
Executive Owner: Michael Cohen
Outcome Measure: Reliable Steward of Funds
Core Process: Accounting for Funds
Status: On-Target
Numeric Status: 100%
Description: Treasury Management (TM) reserves are established to ensure the payment of member
benefits and other obligations without interruption while optimizing the use of fund assets. A TM Reserve is defined as liquid assets dedicated to the payment of member benefits and other obligations during a stressed or crisis event. The TM reserves are documented in the TM Reserve Policy and reviewed annually. The Long-Term Care Fund has a TM reserve equal to one month’s coverage of expected program obligations.
Baseline: The baseline is 100% since reserve targets were met in FY2017-18
Target: The target is to comply with the Treasury Management Reserve Policy and meet 100% of reserve target
Refresh Frequency: Quarterly
Reporting Range: 10/01/2021 – 12/31/2021
Thresholds: On-Target: 100% of reserve targets were met At-Risk: 98% to 99% of reserve targets were met Off-Target: Less than 97% of reserve targets were met
Status Narrative:
100% of reserve targets were met during the 2nd quarter of FY 2021-22.
Second Quarter Report - Key Performance Indicators Page 16 of 123
Performance Trend Chart:
Second Quarter Report - Key Performance Indicators Page 17 of 123
2021-22 Key Performance Indicator Summary (Quarter 2)
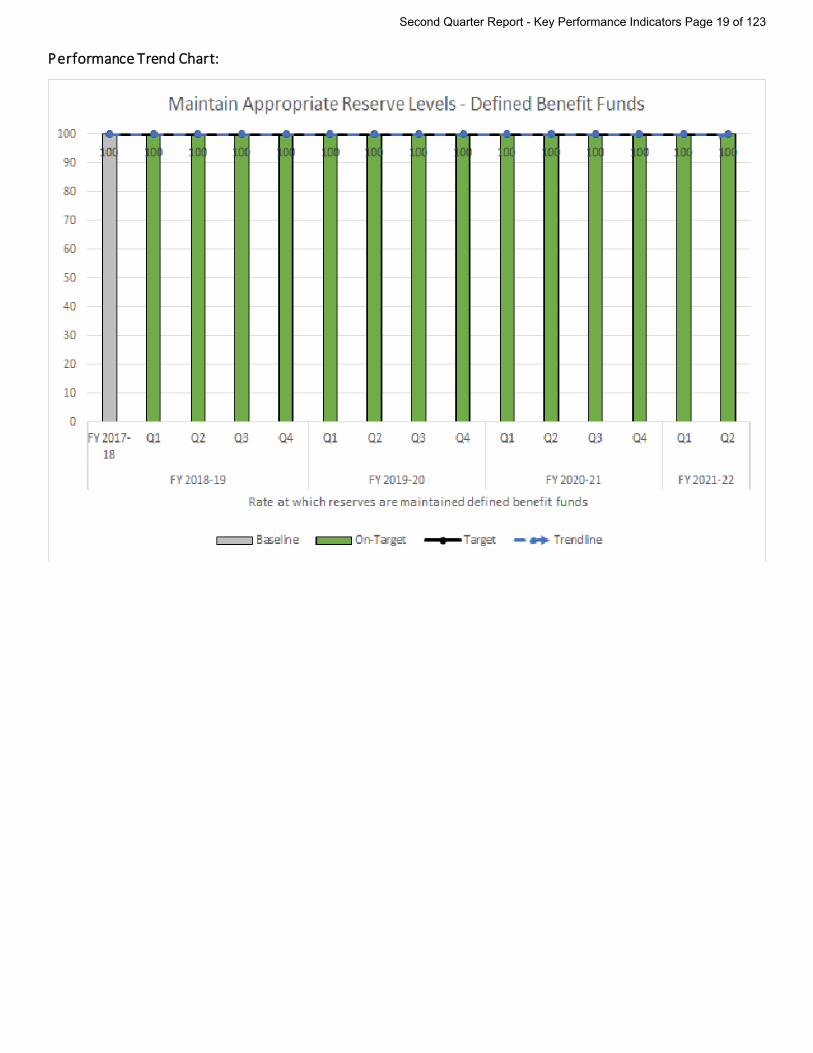
KPI Title: Maintain Appropriate Reserve Levels – Defined Benefit Funds
Executive Owner: Michael Cohen
Outcome Measure: Reliable Steward of Funds
Core Process: Accounting for Funds
Status: On-Target
Numeric Status: 100%
Description: Treasury Management (TM) reserves are established to ensure the payment of member
benefits and other obligations without interruption while optimizing the use of fund assets. A TM Reserve is defined as liquid assets dedicated to the payment of member benefits and other obligations during a stressed or crisis event. The TM reserves are documented in the TM Reserve Policy. This policy is reviewed annually. The following defined benefit funds have reserves established:
• Public Employees’ Retirement Fund- Prefund monthly benefit payments by 5
business days • Legislators’ Retirement Fund- TM reserve equal to two months coverage of
benefit payments and program obligations • Judges’ Retirement Fund- TM Reserve equal to two-month coverage of member
benefit payments and program obligation Baseline: The baseline is 100% since reserve targets were met in FY 2017-18
Target: The target is to comply with the Treasury Management Reserve Policy and meet 100% of reserve target
Refresh Frequency: Quarterly
Reporting Range: 10/01/2021 – 12/31/2021
Thresholds: On-Target: 100% of reserve targets were met At-Risk: 98% to 99% of reserve targets were met Off-Target: Less than 97% of reserve targets were met
Status Narrative:
100% of reserve targets were met during the 2nd quarter of FY 2021-22.
Second Quarter Report - Key Performance Indicators Page 18 of 123
Performance Trend Chart:
Second Quarter Report - Key Performance Indicators Page 19 of 123
2021-22 Key Performance Indicator Summary (Quarter 2)
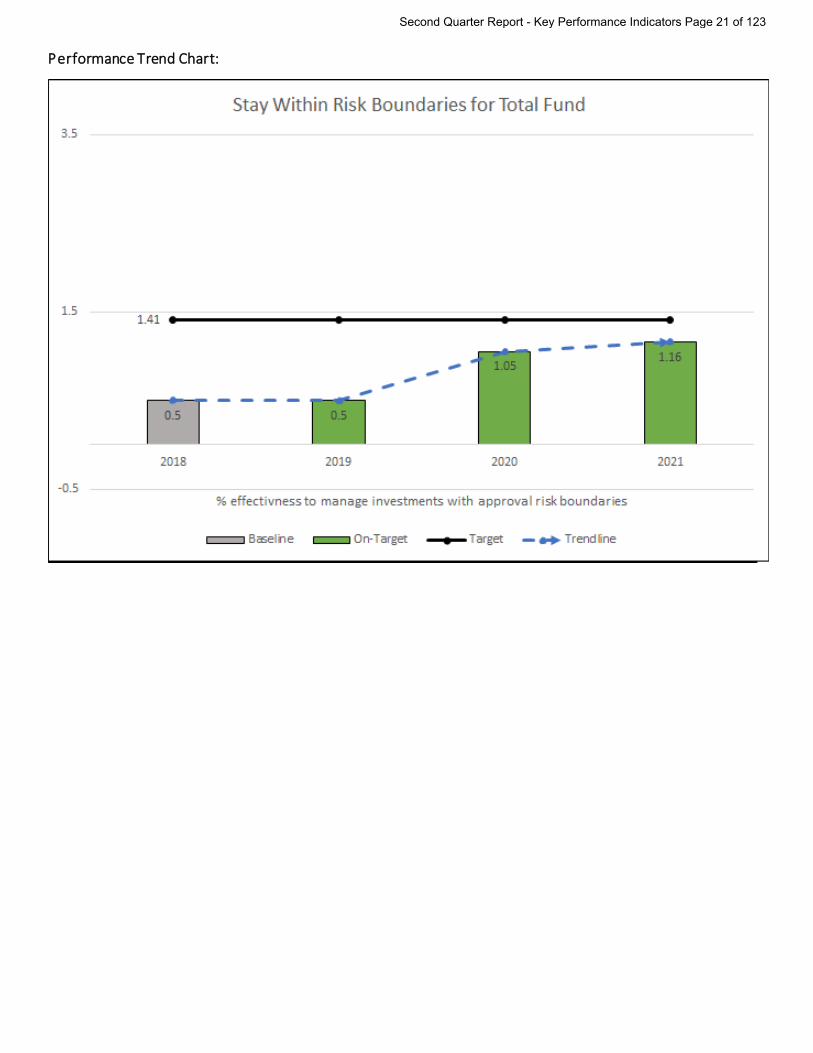
KPI Title: Stay Within Risk Boundaries for Total Fund
Executive Owner: Dan Bienvenue
Outcome Measure: Reliable Steward of Funds
Core Process: Managing Investments
Status: Pending Refresh (in September 2022)
Numeric Status: 1.16% (for FY 2020-21)
Description: Forecast tracking error is the difference in risk between a managed portfolio and
benchmark, measured as the annualized standard deviation (1-yr) of the differential return between the portfolio and an equal investment in the benchmark. This KPI provides a method to evaluate staffs’ effectiveness to manage investments within the approved risk boundaries.
Baseline: As of June 30, 2017, the active tracking error is 0.5%. Target: Target is to remain within approved risk boundaries (policy limit) for Total Fund. The
CalPERS Total Fund is managed with policy maximum limit of 1.5% tracking error, inclusive of active asset allocation and other active management decisions.
Refresh Frequency: Annually, September Reporting Range: FY 2020-21 Thresholds: On-Target: 0% - 1.41% At-Risk: 1.42% - 1.49% Off-Target: Greater than 1.50%
Status Narrative:
As of July 1, 2021, this KPI was reported as On-Target.
Tracking error was 1.16%, per Quarterly Update on Performance and Risk as of July 1, 2021 presented at the September Investment Committee. This information is reported to the Board on a quarterly cycle.
Second Quarter Report - Key Performance Indicators Page 20 of 123
Performance Trend Chart:
Second Quarter Report - Key Performance Indicators Page 21 of 123
2021-22 Key Performance Indicator Summary (Quarter 2)
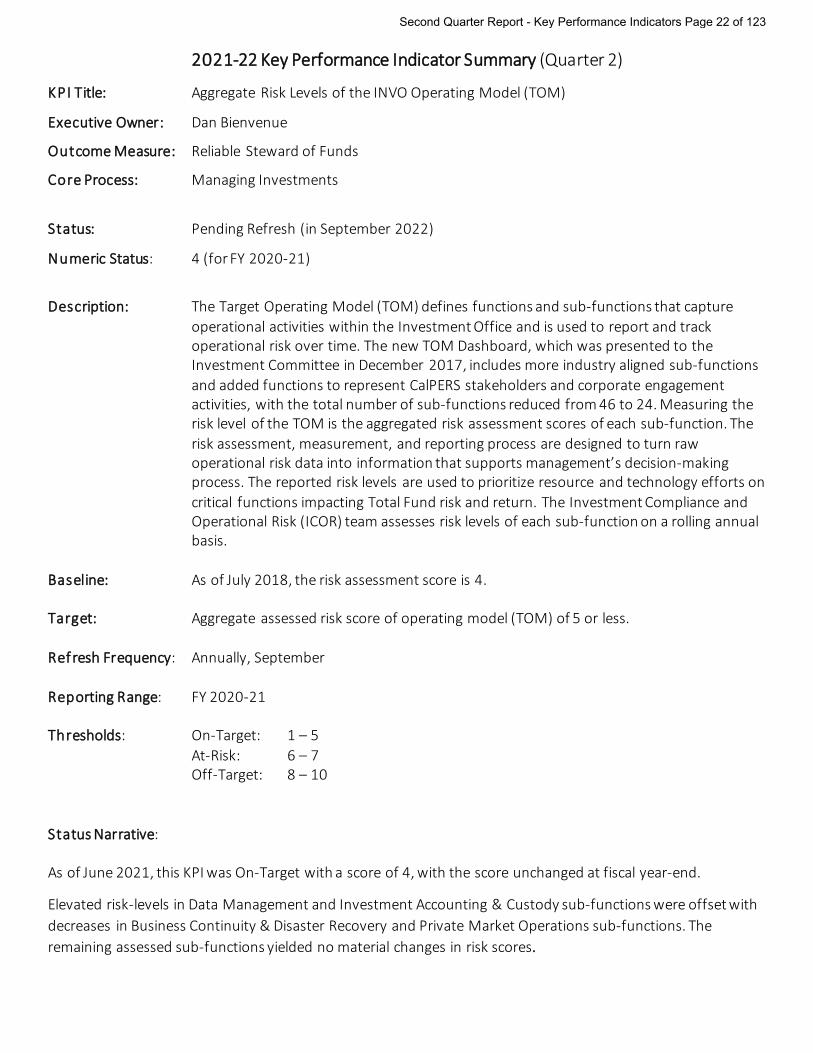
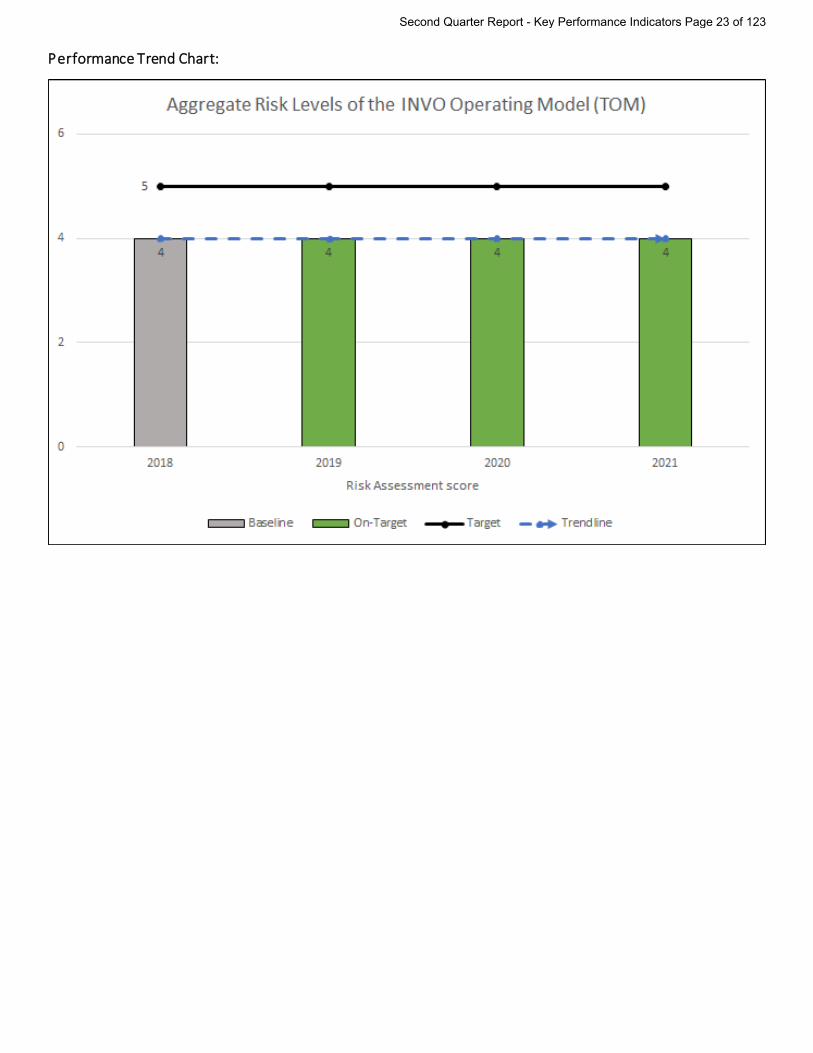
KPI Title: Aggregate Risk Levels of the INVO Operating Model (TOM)
Executive Owner: Dan Bienvenue
Outcome Measure: Reliable Steward of Funds
Core Process: Managing Investments
Status: Pending Refresh (in September 2022)
Numeric Status: 4 (for FY 2020-21)
Description: The Target Operating Model (TOM) defines functions and sub-functions that capture
operational activities within the Investment Office and is used to report and track operational risk over time. The new TOM Dashboard, which was presented to the Investment Committee in December 2017, includes more industry aligned sub-functions and added functions to represent CalPERS stakeholders and corporate engagement activities, with the total number of sub-functions reduced from 46 to 24. Measuring the risk level of the TOM is the aggregated risk assessment scores of each sub-function. The risk assessment, measurement, and reporting process are designed to turn raw operational risk data into information that supports management’s decision-making process. The reported risk levels are used to prioritize resource and technology efforts on critical functions impacting Total Fund risk and return. The Investment Compliance and Operational Risk (ICOR) team assesses risk levels of each sub-function on a rolling annual basis.
Baseline: As of July 2018, the risk assessment score is 4. Target: Aggregate assessed risk score of operating model (TOM) of 5 or less. Refresh Frequency: Annually, September Reporting Range: FY 2020-21 Thresholds: On-Target: 1 – 5 At-Risk: 6 – 7 Off-Target: 8 – 10
Status Narrative:
As of June 2021, this KPI was On-Target with a score of 4, with the score unchanged at fiscal year-end.
Elevated risk-levels in Data Management and Investment Accounting & Custody sub-functions were offset with decreases in Business Continuity & Disaster Recovery and Private Market Operations sub-functions. The remaining assessed sub-functions yielded no material changes in risk scores.
Second Quarter Report - Key Performance Indicators Page 22 of 123
Performance Trend Chart:
Second Quarter Report - Key Performance Indicators Page 23 of 123
2021-22 Key Performance Indicator Summary (Quarter 2)
KPI Title: Strategic Asset Allocation Ranges (if outside approved ranges)
Executive Owner: Dan Bienvenue
Outcome Measure: Reliable Steward of Funds
Core Process: Managing Investments
Status: Pending Refresh (in September 2022)
Numeric Status: Current asset allocation ranges remain within approved targets (for FY 2020-21)
Description: The Strategic Asset Allocation ranges are set on a 4-year Asset Liability Management
(ALM) cycle with interim asset allocation changes occurring as required to realign levels of risk and liquidity. Allocations may temporarily deviate from policy ranges due to extreme market volatility or to accommodate contributions, distributions, or other short-term cash needs. If an asset class allocation exceeds the policy range, staff shall return the asset allocation to within its policy range in a timely manner, with the exact time primarily dependent on transaction costs and liquidity. This KPI provides a method to evaluate staffs’ effectiveness to manage investments within the approved ranges.
Baseline: Asset Class: Policy Weight: Policy Range Relative to Target: Growth Public Equity 50% +/-7% Private Equity 8% +/-4% Income 28% +/-6% Real Assets 13% +/-5% Inflation Assets 0% +3% /-0% Liquidity 1% +3% /-6% Total Fund 100% N/A Target: Target is for ranges to remain the approved interim targets and ranges, as listed above,
as of June 2018. Refresh Frequency: Annually, September Reporting Range: FY 2020-21 Thresholds: On-Target: Up to 1% of the maximum of any range, up or down At-Risk: Between 0.99% and maximum of any range, up or down Off-Target: Exceeding maximum of any range, up or downStatus Narrative:
As of June 2021, the PERF asset allocation remained within approved targets per the Quarterly Update on Performance and Risk as of June 30, 2021 presented at the September Investment Committee. The next update will be available in September 2022.
Second Quarter Report - Key Performance Indicators Page 24 of 123

No performance trend chart is available for this KPI.
Second Quarter Report - Key Performance Indicators Page 25 of 123
2021-22 Key Performance Indicator Summary (Quarter 2)
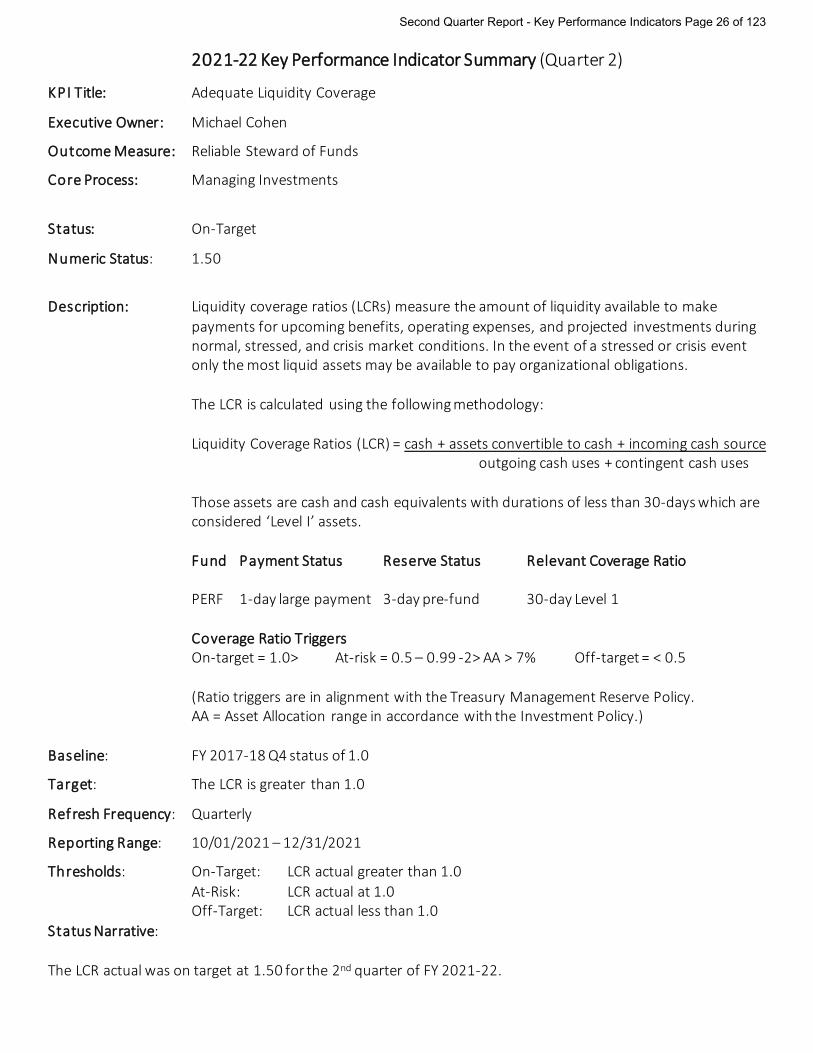
KPI Title: Adequate Liquidity Coverage
Executive Owner: Michael Cohen
Outcome Measure: Reliable Steward of Funds
Core Process: Managing Investments
Status: On-Target
Numeric Status: 1.50
Description: Liquidity coverage ratios (LCRs) measure the amount of liquidity available to make
payments for upcoming benefits, operating expenses, and projected investments during normal, stressed, and crisis market conditions. In the event of a stressed or crisis event only the most liquid assets may be available to pay organizational obligations.
The LCR is calculated using the following methodology: Liquidity Coverage Ratios (LCR) = cash + assets convertible to cash + incoming cash source outgoing cash uses + contingent cash uses Those assets are cash and cash equivalents with durations of less than 30-days which are
considered ‘Level I’ assets. Fund Payment Status Reserve Status Relevant Coverage Ratio PERF 1-day large payment 3-day pre-fund 30-day Level 1 Coverage Ratio Triggers On-target = 1.0> At-risk = 0.5 – 0.99 -2> AA > 7% Off-target = < 0.5 (Ratio triggers are in alignment with the Treasury Management Reserve Policy. AA = Asset Allocation range in accordance with the Investment Policy.) Baseline: FY 2017-18 Q4 status of 1.0
Target: The LCR is greater than 1.0
Refresh Frequency: Quarterly
Reporting Range: 10/01/2021 – 12/31/2021
Thresholds: On-Target: LCR actual greater than 1.0 At-Risk: LCR actual at 1.0 Off-Target: LCR actual less than 1.0Status Narrative:
The LCR actual was on target at 1.50 for the 2nd quarter of FY 2021-22.
Second Quarter Report - Key Performance Indicators Page 26 of 123
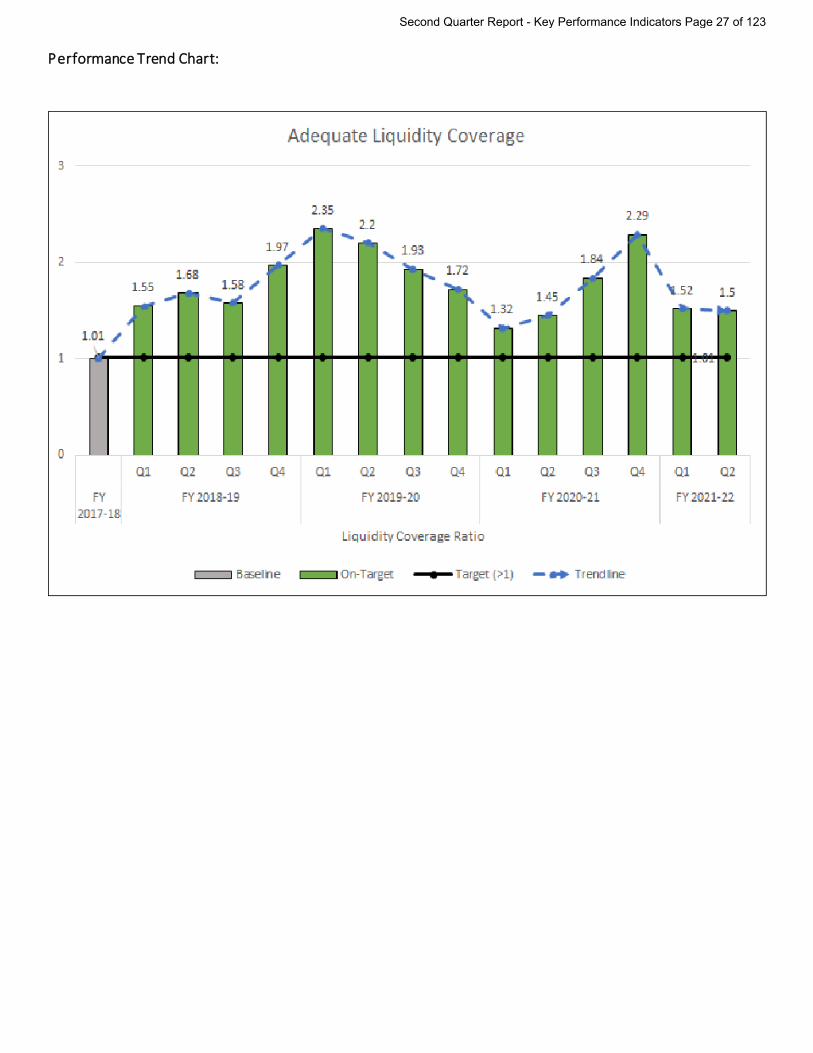
Performance Trend Chart:
Second Quarter Report - Key Performance Indicators Page 27 of 123
2021-22 Key Performance Indicator Summary (Quarter 2)
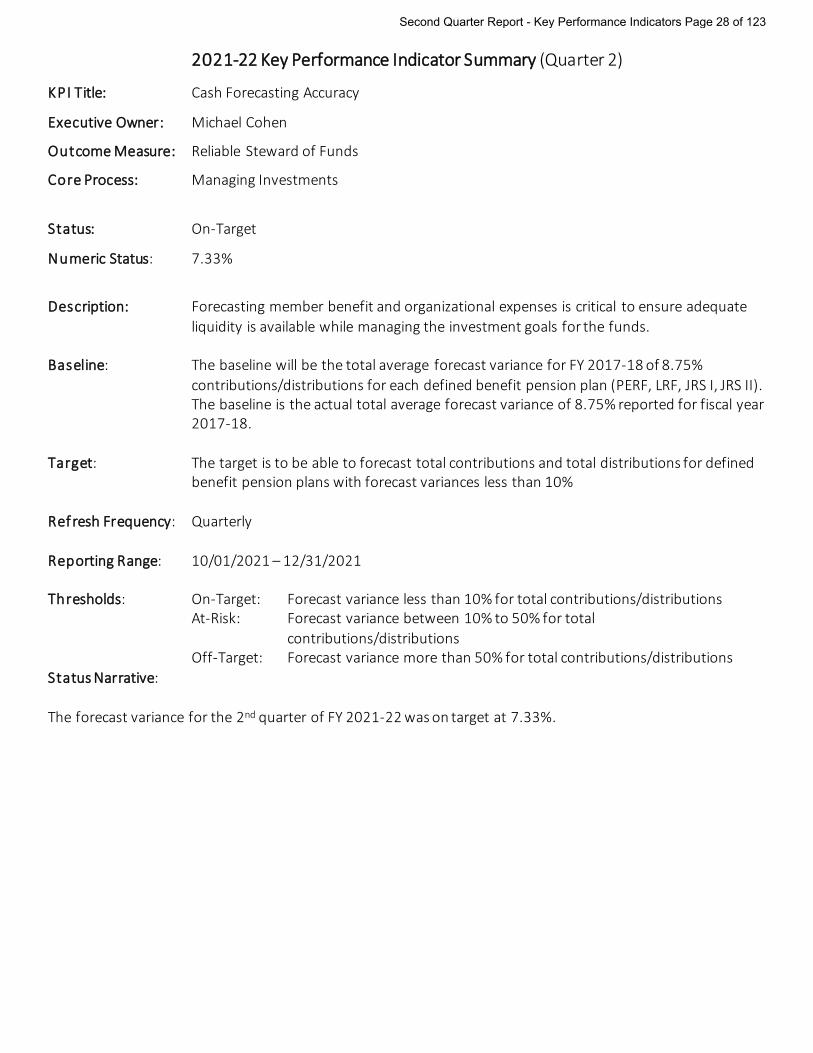
KPI Title: Cash Forecasting Accuracy
Executive Owner: Michael Cohen
Outcome Measure: Reliable Steward of Funds
Core Process: Managing Investments
Status: On-Target
Numeric Status: 7.33%
Description: Forecasting member benefit and organizational expenses is critical to ensure adequate
liquidity is available while managing the investment goals for the funds. Baseline: The baseline will be the total average forecast variance for FY 2017-18 of 8.75%
contributions/distributions for each defined benefit pension plan (PERF, LRF, JRS I, JRS II). The baseline is the actual total average forecast variance of 8.75% reported for fiscal year 2017-18.
Target: The target is to be able to forecast total contributions and total distributions for defined
benefit pension plans with forecast variances less than 10% Refresh Frequency: Quarterly Reporting Range: 10/01/2021 – 12/31/2021 Thresholds: On-Target: Forecast variance less than 10% for total contributions/distributions At-Risk: Forecast variance between 10% to 50% for total
contributions/distributions Off-Target: Forecast variance more than 50% for total contributions/distributionsStatus Narrative:
The forecast variance for the 2nd quarter of FY 2021-22 was on target at 7.33%.
Second Quarter Report - Key Performance Indicators Page 28 of 123
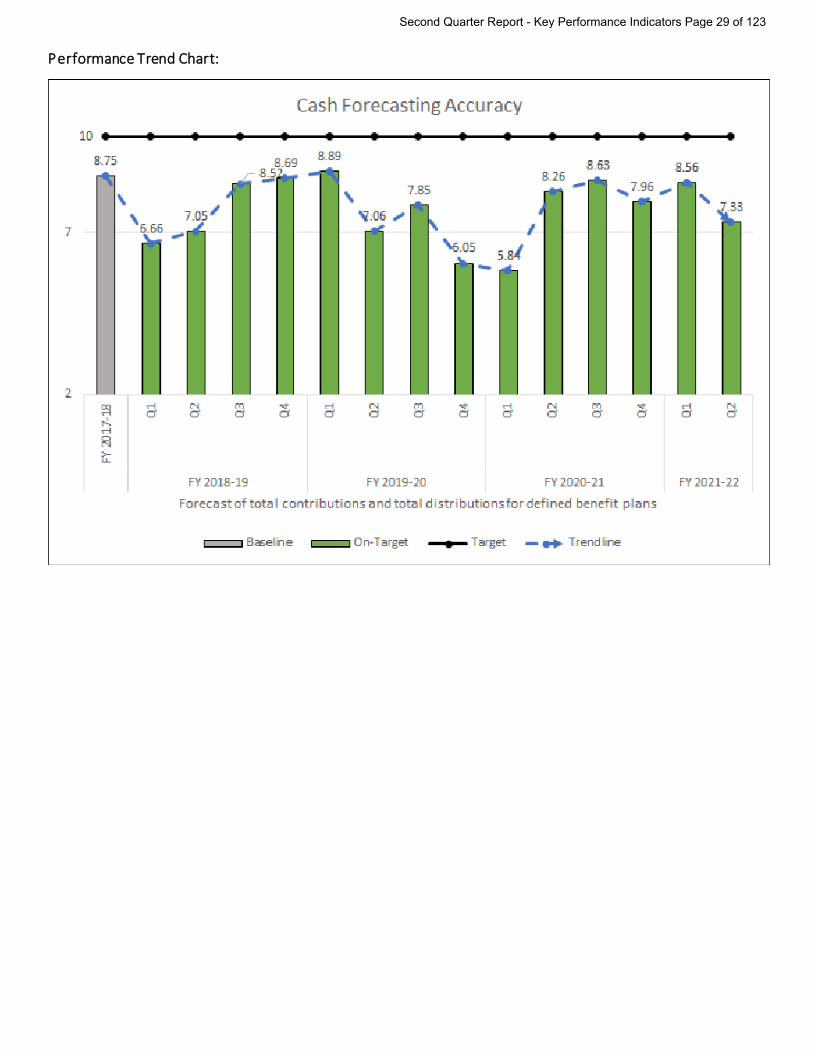
Performance Trend Chart:
Second Quarter Report - Key Performance Indicators Page 29 of 123
2021-22 Key Performance Indicator Summary (Quarter 2)
KPI Title: Generate Liability Data and Rates for Pension Funding – Public Agency
Executive Owner: Scott Terando
Outcome Measure: Reliable Steward of Funds
Core Process: Projecting Liabilities
Status: Pending Refresh (in September 2022)
Numeric Status: Results uploaded in August (for FY 2019-20)
Description: Each year, the public agency pension plan is reviewed and the contribution rates are
adjusted to account for any gains and losses the pension plan must pay for.
Baseline: Reports and contribution rates are uploaded to myCalPERS in July
Target: Calculate liabilities and produce annual valuation reports each year for all public agency pension plans so that the fiscal year rates may be determined and uploaded in July each year
Refresh Frequency: Annually, September
Reporting Range: FY 2019-20
Thresholds: On-Target: Deliverables uploaded in July At-Risk: Deliverables uploaded in August Off-Target: Deliverables uploaded after August
Status Narrative:
All reports for public agencies were uploaded to myCalPERS in August 2021. The target timing of July was not met due to a combination of factors including the team not being at full capacity and a large volume of additional work in connection with the Experience Study and Asset Liability Management process.
No performance trend chart is available for this KPI.
Second Quarter Report - Key Performance Indicators Page 30 of 123
2021-22 Key Performance Indicator Summary (Quarter 2)
KPI Title: Generate Liability Data for Long-Term Care Program
Executive Owner: Scott Terando
Outcome Measure: Reliable Steward of Funds
Core Process: Projecting Liabilities
Status: Pending Refresh (in March 2022)
Numeric Status: Reported at the September Board Meeting (for FY 2019-20)
Description: Each year, the Long-Term Care plan is reviewed and adjusted to ensure the viability of
the plan. The long-term care valuation will be using a revamped data set, and will also be solidifying the first principles model this year. The actuarial office produces a report and an agenda item to inform the plan sponsor and the CalPERS Board of the health of the plan.
Baseline: Report and deliverables must be completed by February Board meeting
Target: The annual Long-Term Care report, complete with agenda item deliverables, for the February Board meeting each year
Refresh Frequency: Annually, March
Reporting Range: Fiscal Year 2019-20
Thresholds: On-Target: Deliverables for February Board At-Risk: Deliverables for April Board Off-Target: Deliverables after April Board
Status Narrative:
The June 2020 liabilities are complete. The report was presented to the board at the September board meeting. This item was delayed due to complications surrounding the ongoing lawsuit and pending rate increases occurring this year.
No performance trend chart is available for this KPI.
Second Quarter Report - Key Performance Indicators Page 31 of 123

2021-22 Key Performance Indicator Summary (Quarter 2)
KPI Title: Generate Liability Data and Rates for Pension Funding – State
Executive Owner: Scott Terando
Outcome Measure: Reliable Steward of Funds
Core Process: Projecting Liabilities
Status: Pending Refresh (in July 2022)
Numeric Status: Completed in June 2021 (for FY 2019-20)
Description: Each year, the State Pension Plan is reviewed and the contribution rates are adjusted to
account for any gains and losses the pension plan must pay for. The actuarial office produces an agenda item in April.
Baseline: Contribution Rates are uploaded to myCalPERS in June.
Target: Calculate liabilities and produce annual valuation results each year for the state pension plans so that the fiscal year rates may be determined by June of each year.
Refresh Frequency: Annually, July
Reporting Range: Fiscal Year 2019-20
Thresholds: On-Target: Deliverables uploaded by June At-Risk: Deliverables uploaded by July Off-Target: Deliverables uploaded by August (or later)
Status Narrative:
Results for the state were presented to the board in April and uploaded to myCalPERS before the end of June 2021.
No performance trend chart is available for this KPI.
Second Quarter Report - Key Performance Indicators Page 32 of 123
2021-22 Key Performance Indicator Summary (Quarter 2)
KPI Title: Generate Liability Data and Rates for Pension Funding – Schools
Executive Owner: Scott Terando
Outcome Measure: Reliable Steward of Funds
Core Process: Projecting Liabilities
Status: Pending Refresh (in July 2022)
Numeric Status: Completed June 2021 (for FY 2019-20)
Description: Each year, the schools pool pension plan is reviewed and the contribution rates are
adjusted to account for any gains and losses the pension plan must pay for. The actuarial office produces an agenda item in April.
Baseline: Contribution rates are uploaded to myCalPERS in June.
Target: Calculate liabilities and produce annual valuation results each year for the schools pool pension plan so that the fiscal year rates may be determined and uploaded in June of each year
Refresh Frequency: Annually, July
Reporting Range: Fiscal Year 2019-20
Thresholds: On-Target: Deliverables uploaded in June At-Risk: Deliverables uploaded in July Off-Target: Deliverables uploaded in August (or later)
Status Narrative:
Results for the school’s pool were presented to the board in April 2021 and uploaded to myCalPERS before the end of June 2021.
No performance trend chart is available for this KPI.
Second Quarter Report - Key Performance Indicators Page 33 of 123
2021-22 Key Performance Indicator Summary (Quarter 2)
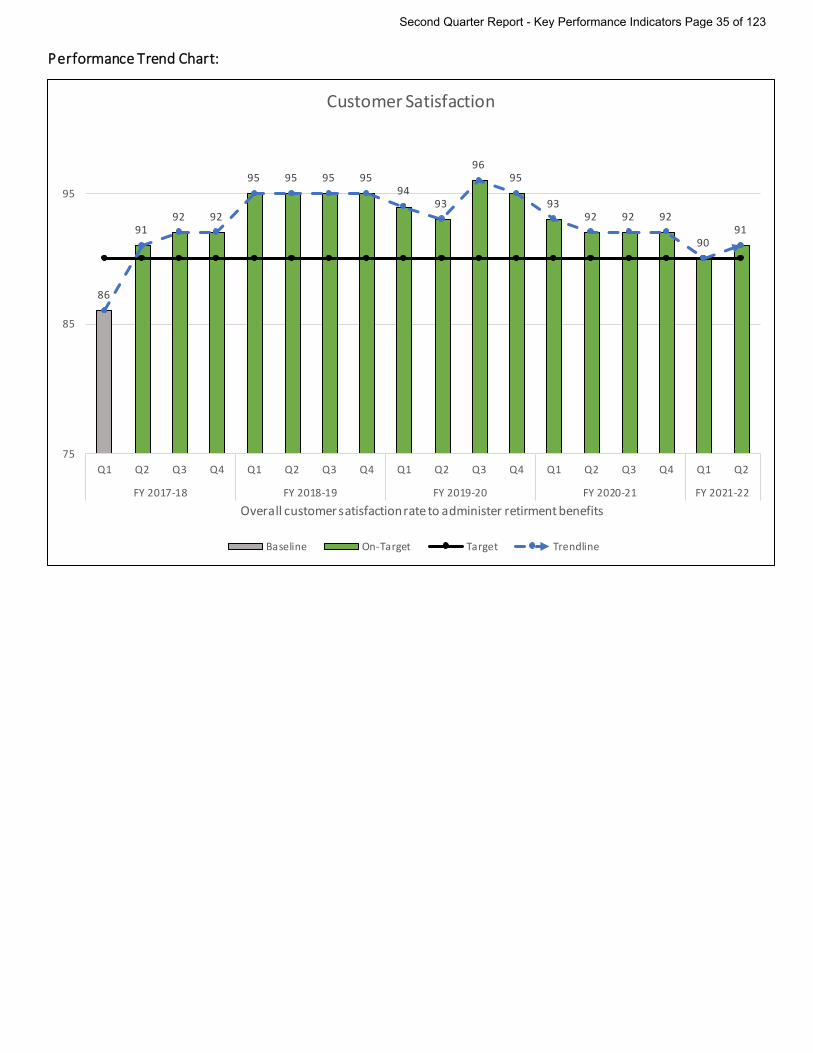
KPI Title: Customer Satisfaction
Executive Owner: Anthony Suine
Outcome Measure: Customer Satisfaction Driven Organization
Core Process: Provide and Administer Retirement Benefits
Status: On-Target
Numeric Status: 91%
Description: To ensure we are listening to our customers and taking action on their feedback, we
collect customer satisfaction surveys for many of our business processes. This key performance indicator measures the overall customer satisfaction rate with CalPERS ability to perform its most core function to provide and administer retirement benefits.
Baseline: FY 2017-18, Quarter 1: 86%
Target: Achieve an overall satisfaction rate of 90%, reflecting a positive customer experience across core processes
Refresh Frequency: Quarterly
Reporting Range: 10/01/2021 – 12/31/2021
Thresholds: On-Target: 80% or above At-Risk: 70% - 79% Off-Target: 69% or below
Status Narrative:
This KPI is on target for this reporting period.
Second Quarter Report - Key Performance Indicators Page 34 of 123
Performance Trend Chart:
86
9192 92
95 95 95 9594
93
9695
9392 92 92
9091
75
85
95
Q1 Q2 Q3 Q4 Q1 Q2 Q3 Q4 Q1 Q2 Q3 Q4 Q1 Q2 Q3 Q4 Q1 Q2
FY 2017-18 FY 2018-19 FY 2019-20 FY 2020-21 FY 2021-22
Overall customer satisfaction rate to administer retirment benefits
Customer Satisfaction
Baseline On-Target Target Trendline
Second Quarter Report - Key Performance Indicators Page 35 of 123

2021-22 Key Performance Indicator Summary (Quarter 2)
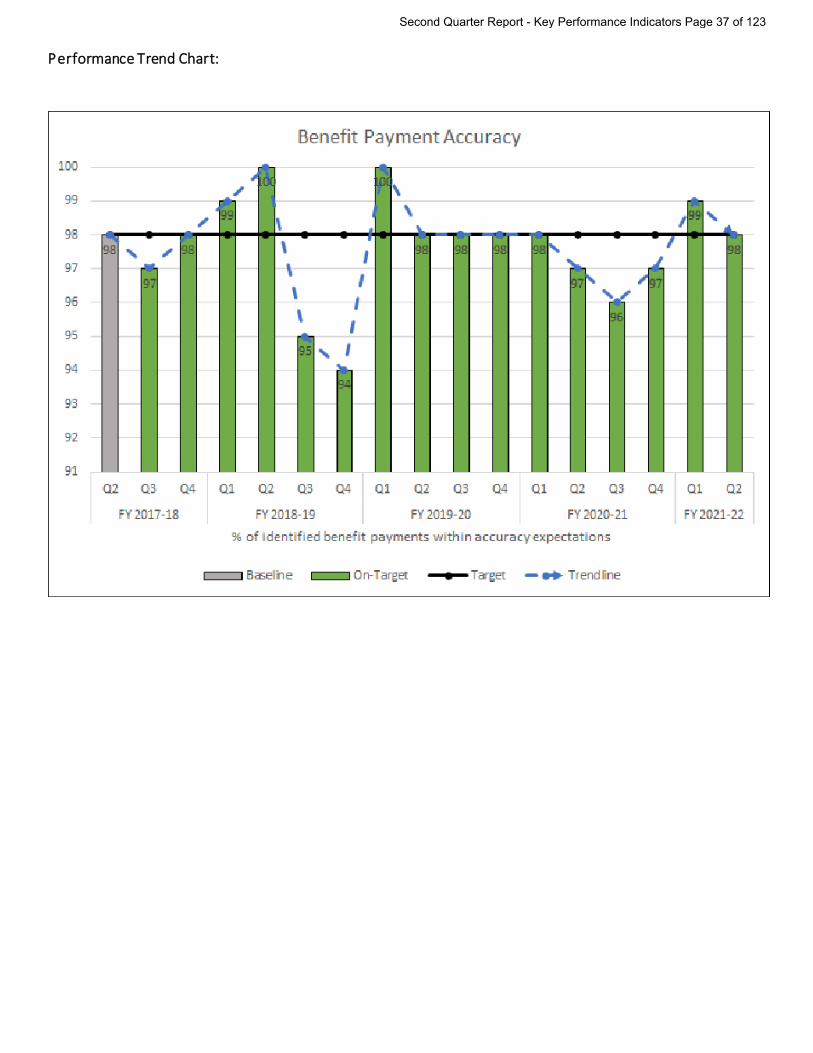
KPI Title: Benefit Payment Accuracy
Executive Owner: Anthony Suine
Outcome Measure: Customer Satisfaction Driven Organization
Core Process: Provide and Administer Retirement Benefits
Status: On-Target
Numeric Status: 98%
Description: Collecting data and measuring performance on the accuracy of the benefit payments we
issue ensures our customers receive the benefits they have earned and aids in long term stability for the fund.
Baseline: FY 2017-18, Quarter 2: 98%
Target: Issue 98% of identified benefit payments within accuracy expectations Refresh Frequency: Quarterly
Reporting Range: 10/01/2021 – 12/31/2021
Thresholds: On-Target: 90% or above At-Risk: 83% - 89% Off-Target: Below 83%
Status Narrative:
This KPI is on target for this reporting period.
Second Quarter Report - Key Performance Indicators Page 36 of 123
Performance Trend Chart:
Second Quarter Report - Key Performance Indicators Page 37 of 123

2021-22 Key Performance Indicator Summary (Quarter 2)
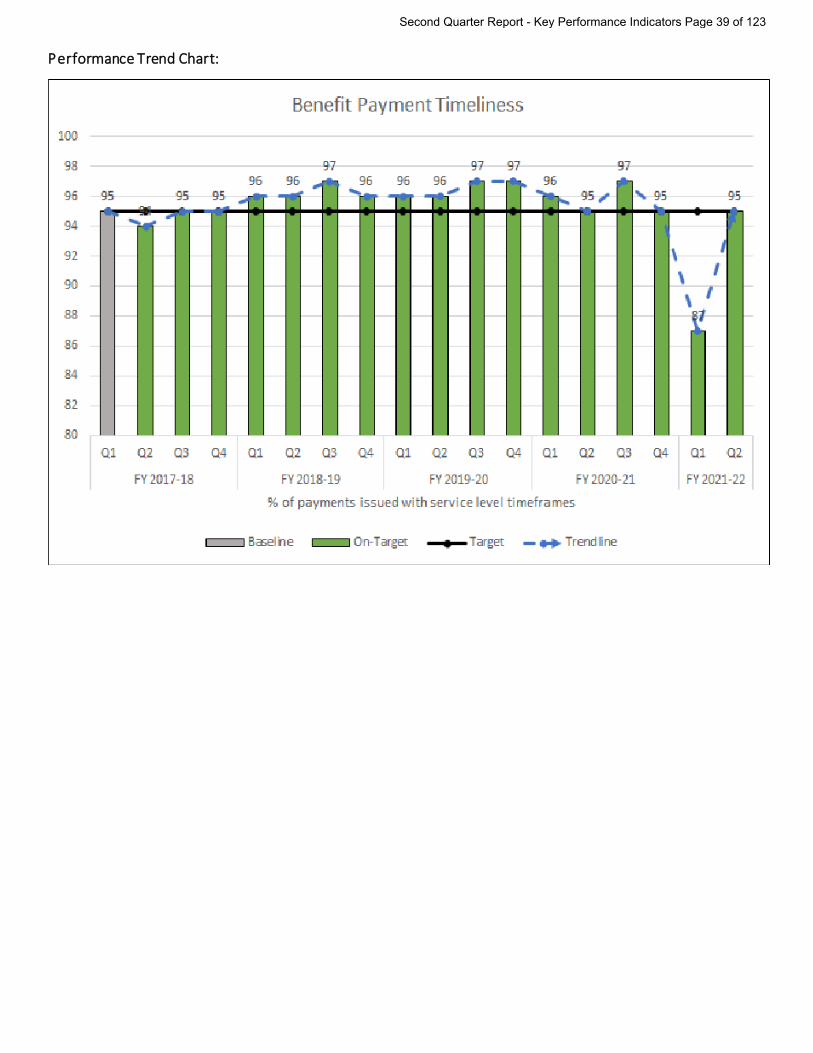
KPI Title: Benefit Payment Timeliness
Executive Owner: Anthony Suine
Outcome Measure: Customer Satisfaction Driven Organization
Core Process: Provide and Administer Retirement Benefits
Status: On-Target
Numeric Status: 95%
Description: The key performance indicator for benefit payment timeliness measures one of our most
critical priorities: ensuring that customers receive benefit payments on time. In FY 2017-18, 95% of identified benefit payments were made within our established service levels, reflecting our absolute commitment to issuing timely payments to our customers.
Baseline: FY 2017-18, Quarter 1: 95%
Target: Issue 95% of benefit payments within service level timeframes Refresh Frequency: Quarterly
Reporting Range: 10/01/2021 – 12/31/2021
Thresholds: On-Target: 87% or above At-Risk: 79% - 86% Off-Target: Below 79%
Status Narrative:
This KPI is on target for this reporting period.
Second Quarter Report - Key Performance Indicators Page 38 of 123
Performance Trend Chart:
Second Quarter Report - Key Performance Indicators Page 39 of 123
2021-22 Key Performance Indicator Summary (Quarter 2)
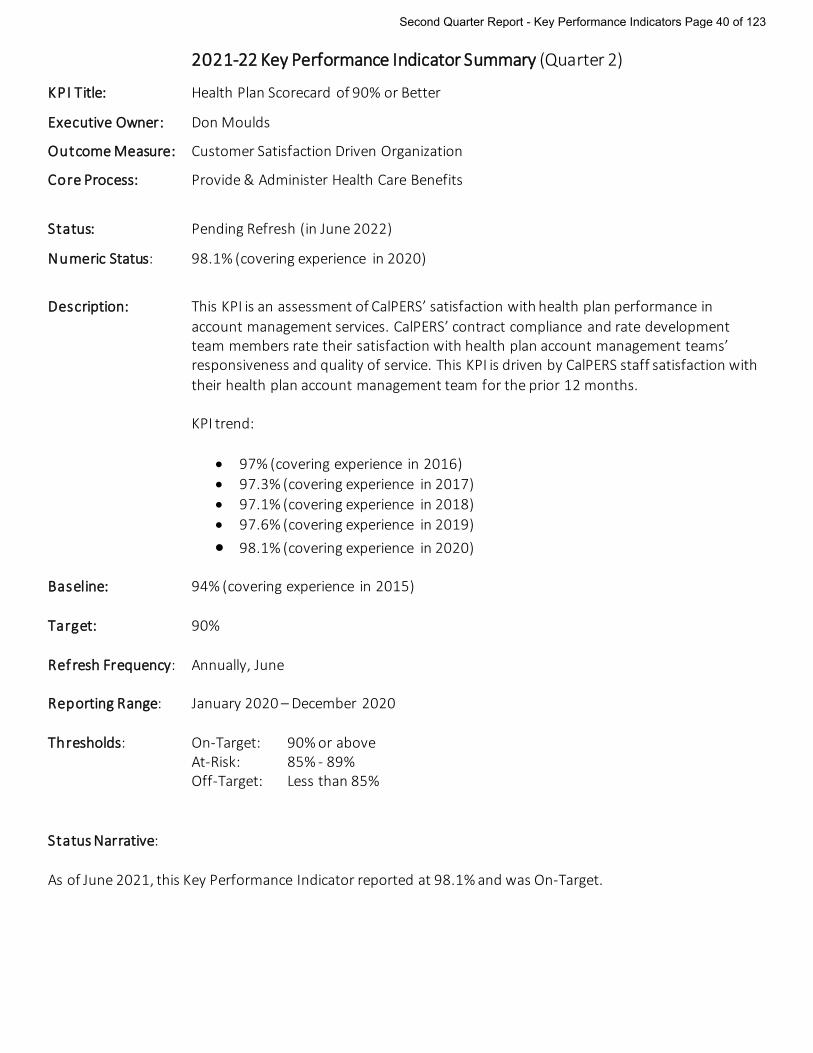
KPI Title: Health Plan Scorecard of 90% or Better
Executive Owner: Don Moulds
Outcome Measure: Customer Satisfaction Driven Organization
Core Process: Provide & Administer Health Care Benefits
Status: Pending Refresh (in June 2022)
Numeric Status: 98.1% (covering experience in 2020)
Description: This KPI is an assessment of CalPERS’ satisfaction with health plan performance in
account management services. CalPERS’ contract compliance and rate development team members rate their satisfaction with health plan account management teams’ responsiveness and quality of service. This KPI is driven by CalPERS staff satisfaction with their health plan account management team for the prior 12 months.
KPI trend:
• 97% (covering experience in 2016) • 97.3% (covering experience in 2017) • 97.1% (covering experience in 2018) • 97.6% (covering experience in 2019) • 98.1% (covering experience in 2020)
Baseline: 94% (covering experience in 2015) Target: 90% Refresh Frequency: Annually, June Reporting Range: January 2020 – December 2020 Thresholds: On-Target: 90% or above At-Risk: 85% - 89% Off-Target: Less than 85%
Status Narrative:
As of June 2021, this Key Performance Indicator reported at 98.1% and was On-Target.
Second Quarter Report - Key Performance Indicators Page 40 of 123

Performance Trend Chart:
Second Quarter Report - Key Performance Indicators Page 41 of 123

2021-22 Key Performance Indicator Summary (Quarter 2)
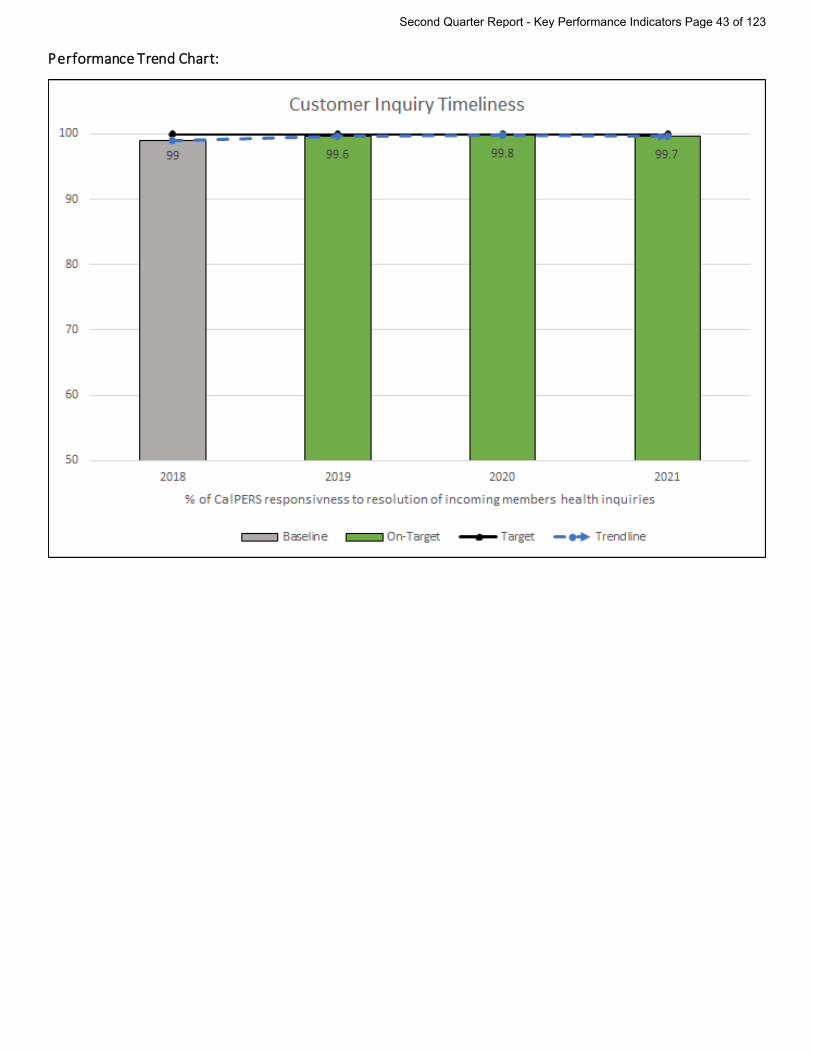
KPI Title: Customer Inquiry Timeliness
Executive Owner: Don Moulds
Outcome Measure: Customer Satisfaction Driven Organization
Core Process: Provide & Administer Health Care Benefits
Status: Pending Refresh (in August 2022)
Numeric Status: 99.7% (for FY 2020-21)
Description: This measure is an assessment of CalPERS’ responsiveness and resolution to incoming
member health inquiries. CalPERS measures customer service response rates with designated service level targets. The established target to respond and resolve phone inquiries is 5-business days, and 30-calendar days for document inquiries (letter, form, fax, etc.). Rate will be calculated by dividing the total number of workflows completed within service level by the total number of inquiries (phone/documents).
KPI trend:
• 99.6% (covering experience in Fiscal Year 2018-19) • 99.8% (covering experience in Fiscal Year 2019-20) • 99.7% (covering experience in Fiscal Year 2020-21)
Baseline: FY 2017-18 baseline of 99% completed within service level targets. Target: 100% completed within service level targets Refresh Frequency: Annually, August Reporting Range: Fiscal Year 2020-21 Thresholds: On-Target: 98% or above At-Risk: 93% - 97% Off-Target: Less than 93%
Status Narrative:
As of August 2021, this Key Performance Indicator (KPI) reported at 99.7% and was On-Target. Updated performance data will be available in August 2022.
Second Quarter Report - Key Performance Indicators Page 42 of 123
Performance Trend Chart:
Second Quarter Report - Key Performance Indicators Page 43 of 123

2021-22 Key Performance Indicator Summary (Quarter 2)
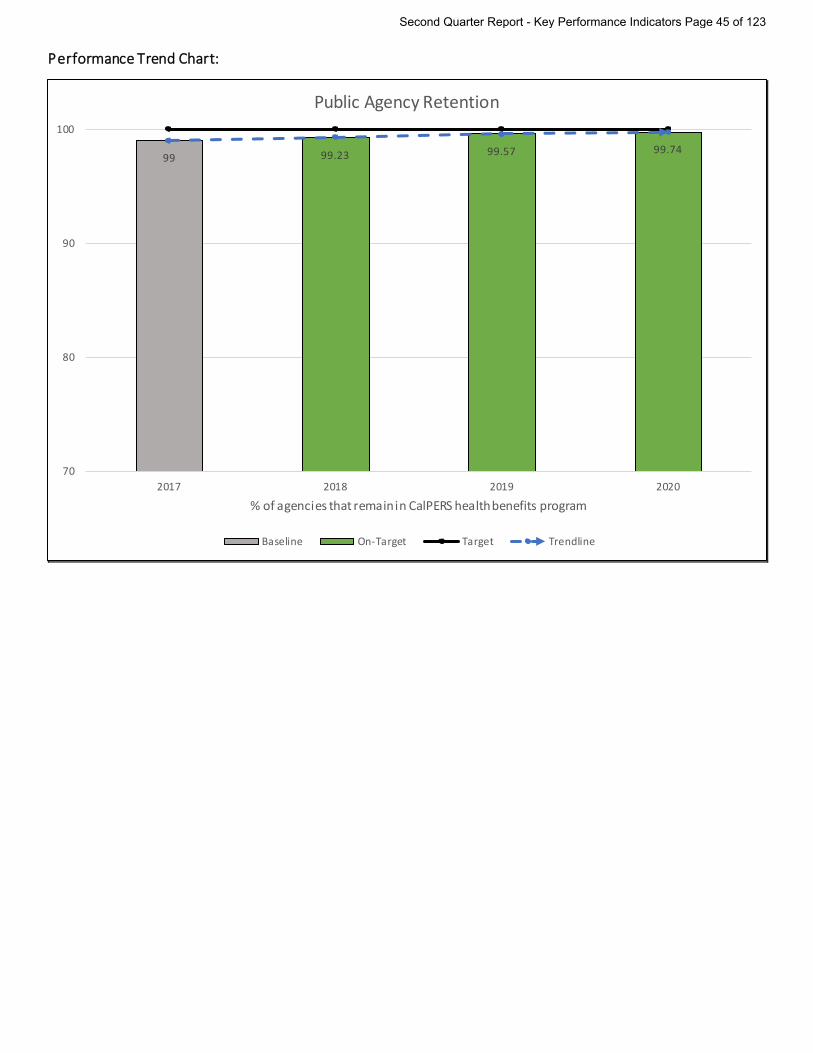
KPI Title: Public Agency Retention
Executive Owner: Don Moulds
Outcome Measure: Customer Satisfaction Driven Organization
Core Process: Provide & Administer Health Care Benefits
Status: Pending Refresh (in February 2022)
Numeric Status: 99.74% (for 2020)
Description: This measure is an indicator of the strength of the CalPERS Health Benefits Program as
agencies leaving our program may pose a risk in achieving the strategic goal of health care affordability by driving up health care costs. The calculation is based on the number of agencies in the CalPERS Health Benefits Program at the end of the previous calendar year against the number of agencies in the program at the beginning of the current calendar year. Any new agencies that joined during the previous calendar year are excluded.
KPI trend:
• 99.23% for 2018 • 99.57% for 2019 • 99.74% for 2020
Baseline: 99% rate of retention of public agency and school employers for calendar year 2017. Target: 100% Refresh Frequency: Annually, February Reporting Range: January 2020 – December 2020 Thresholds: On-Target: 99.0% and above At-Risk: 98.0% - 98.9% Off-Target: 97.9% and below
Status Narrative:
As of February 2021, this Key Performance Indicator reported at 99.74% and was On-Target.
Second Quarter Report - Key Performance Indicators Page 44 of 123
Performance Trend Chart:
99 99.23 99.57 99.74
70
80
90
100
2017 2018 2019 2020
% of agencies that remain in CalPERS health benefits program
Public Agency Retention
Baseline On-Target Target Trendline
Second Quarter Report - Key Performance Indicators Page 45 of 123
2021-22 Key Performance Indicator Summary (Quarter 2)
KPI Title: Public Agency Recruitment
Executive Owner: Don Moulds
Outcome Measure: Customer Satisfaction Driven Organization
Core Process: Provide & Administer Health Care Benefits
Status: Pending Refresh (in February 2022)
Numeric Status: 16,597 Total Covered Lives (for 2020)
Description: This measure is an indicator of the strength of the CalPERS Health Benefits Program
because not increasing the number of contracting agencies and Total Covered Lives (TCLs) may pose a risk in achieving the strategic goal of health care affordability by driving up health care costs
KPI trend:
• 9,992 for 2018 • 5,407 for 2019 • 16,597 for 2020
Baseline: 5,823 TCLs gained through the resolution process for calendar year 2017. Target: 12,000 new TCLs Refresh Frequency: Annually, February Reporting Range: January 2020 – December 2020 Thresholds: On-Target: 9,000 TCLs or above At-Risk: 6,000 – 8,999 TCLs Off-Target: 5,999 TCLs or below
Status Narrative:
As of February 2021, this Key Performance Indicator reported with 16,597 TCLs and was On-Target.
Second Quarter Report - Key Performance Indicators Page 46 of 123

Performance Trend Chart:
5823
9,992
16,597
5407
5000
7000
9000
11000
13000
15000
17000
2017 2018 2019 2020
# of new covered individuals per year
Public Agency Recruitment
Baseline On-Target Off-Target Target Trendline
Second Quarter Report - Key Performance Indicators Page 47 of 123
2021-22 Key Performance Indicator Summary (Quarter 2)
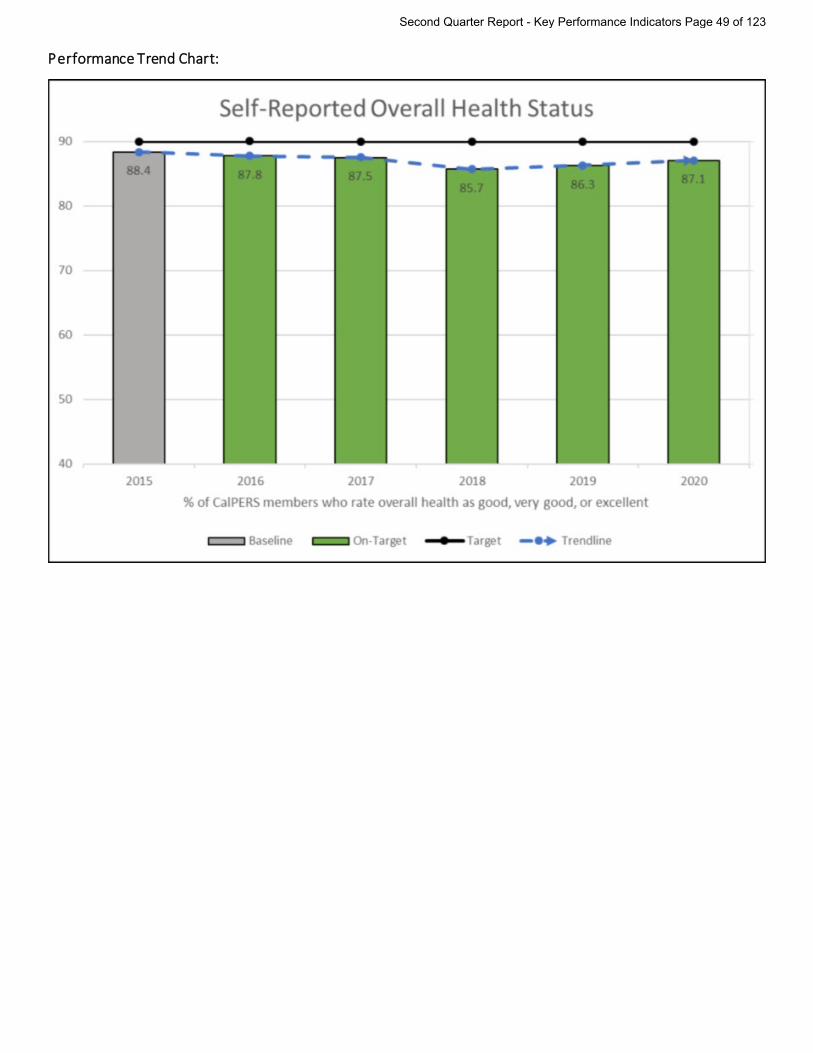
KPI Title: Self-Reported Overall Health Status
Executive Owner: Don Moulds
Outcome Measure: Customer Satisfaction Driven Organization
Core Process: Provide & Administer Health Care Benefits
Status: Pending Refresh (in June 2022)
Numeric Status: 87.1% (covering experience in 2020)
Description: This KPI assesses the proportion of CalPERS members who rate their overall health as
good, very good, or excellent. This metric represents the percentage of CalPERS members who rated their overall
health as good, very good, or excellent on the annual Health Plan Member survey. A higher percentage is considered good.
Factors that can influence this KPI include enforcement of contractual requirements and
collaborative efforts with CalPERS health plan partners. KPI trend:
• 87.8% (covering experience in 2016) • 87.5% (covering experience in 2017) • 85.7% (covering experience in 2018) • 86.3% (covering experience in 2019) • 87.1% (covering experience in 2020)
Baseline: 88.4% (covering experience in 2015) Target: 90% Refresh Frequency: Annually, June Reporting Range: January 2020 – December 2020 Thresholds: On-Target: 85% and above At-Risk: 80 – 84.8% Off-Target: Below 80%
Status Narrative:
As of June 2021, this Key Performance Indicator reported at 87.1% and was On-Target.
Second Quarter Report - Key Performance Indicators Page 48 of 123
Performance Trend Chart:
Second Quarter Report - Key Performance Indicators Page 49 of 123
2021-22 Key Performance Indicator Summary (Quarter 2)
KPI Title: Opioids - Dose
Executive Owner: Don Moulds
Outcome Measure: Customer Satisfaction Driven Organization
Core Process: Provide & Administer Health Care Benefits
Status: Pending Refresh (in April 2022)
Numeric Status: 183.60 MME (covering experience in 2020)
Description: Morphine milligram equivalents (MME) per capita on an incurred year basis for Basic
plans. This KPI has undergone development. Prior to 2018, the original target was tentatively
the national average (640) because CalPERS was unable to perform MME analyses in the data warehouse. As CalPERS team members discovered that CalPERS is already much better than national and California averages, we are shifting to a target of 45% of the national average as a “stretch” goal, and 50% of the national average as “red zone.” (The calculations exclude Methadone and Suboxone drugs which are typically used to treat opioid addiction).
The federal Centers for Disease Control and Prevention (CDC) reported that the average
daily morphine milligram equivalents (MME) of opioids prescribed per capita in the United States increased from 180 in 1999 to 782 in 2010, then decreased to 640 in 2015. The California MME per capita, as reported by amfAR (The Foundation for AIDS Research) is 467.0.
Medicare data are currently unavailable for this KPI. However, the Centers for Medicare
and Medicaid Services (CMS) requires Medicare plans to take actions regarding opioid management, and our Medicare plans are following CMS guidelines in this area.
KPI trend:
• 258.53 (covering experience in 2018) • 249.70 (covering experience in 2019) • 183.60 (covering experience in 2020)
Baseline: 317.46 for 2017 Target: Below 288 Refresh Frequency: Annually, April Reporting Range: January 2020 – December 2020
Second Quarter Report - Key Performance Indicators Page 50 of 123

Thresholds: On-Target: Below 288 At-Risk: 289 – 319 Off-Target: 320 and above
Status Narrative:
As of April 2021, this Key Performance Indicator reported with 183.60 MME and was On-Target.
Performance Trend Chart:
Second Quarter Report - Key Performance Indicators Page 51 of 123
2021-22 Key Performance Indicator Summary (Quarter 2)
KPI Title: C-Section Rate
Executive Owner: Don Moulds
Outcome Measure: Customer Satisfaction Driven Organization
Core Process: Provide & Administer Health Care Benefits
Status: On-Target
Numeric Status: 58.3% (covering experience in 2020)
Description: Percentage of in-network hospitals providing obstetric services to CalPERS members that
have a NTSV (“nulliparous” [i.e., first time], “term” [i.e., not preterm or post-term], “single” [i.e., not twins, triplets, etc.], and “vertex” [i.e., not breech]) cesarean section rate of 23.9% or less.
Although cesarean births can be lifesaving and medically optimal, far too many are
performed for non-medical reasons. This KPI originally involved total C-section rates; however, both nationally and in California (e.g., under Let's Get Healthy California), the preferred metric for C-sections is the NTSV rate, and the NTSV C-section target rate is 23.9% or less.
Calculating the overall NTSV C-section rates among CalPERS membership would require
linkage to external data sources, which would be administratively difficult. In contrast, it is simple to determine from each health plan which contracted hospitals provide obstetric services to CalPERS members.
KPI trend:
• 49.4% (covering experience in 2018) • 65.9% (covering experience in 2019) • 58.3% (covering experience in 2020)
Baseline: 36.96%. That is, out of the 257 in-network hospitals that provided obstetric services to
CalPERS members in 2017, 95 (36.96%) had an NTSV C-section rate of 23.9% or less. Target: 45% of in-network hospitals meet the NTSV C-section rate of 23.9% Refresh Frequency: Annually, December Reporting Range: January 2020 – December 2020 Thresholds: On-Target: >45% At-Risk: 37 – 45% Off-Target: <37%
Second Quarter Report - Key Performance Indicators Page 52 of 123

Status Narrative:
As of December 2021, this Key Performance Indicator (KPI) reported at 53.8% and was On-Target. Updated performance data will be available in December 2022.
Performance Trend Chart:
Second Quarter Report - Key Performance Indicators Page 53 of 123
2021-22 Key Performance Indicator Summary (Quarter 2)
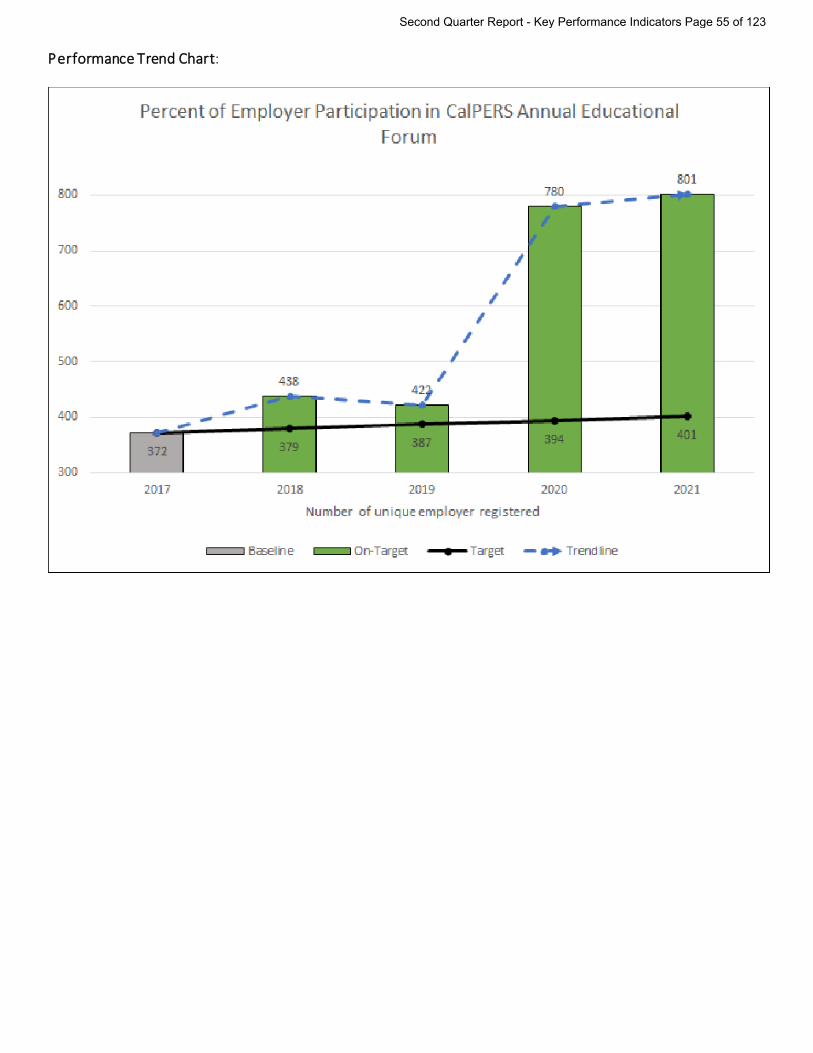
KPI Title: Percent of Employer Participation in CalPERS Annual Educational Forum
Executive Owner: Brad Pacheco
Outcome Measure: Open & Transparent Communication
Core Process: Educate Members, Employers & Stakeholders
Status: On-Target
Numeric Status: 801, or 116% over baseline
Description: CalPERS hosts the Educational Forum on an annual basis, in the month of October. The
KPI is based on the total number of unique employers registered. The totals will be measured by the past year’s total number of unique employers registered.
Baseline: The baseline is total number of unique employers registered, resulting from October 31, 2016 to October 31, 2017
• 372 unique employers Target: Increase registration totals of unique employers by 2% or greater per year from the
baseline figure for the next 5 years. Refresh Frequency: Annually, November
Reporting Range: 11/01/2020 – 10/31/2021
Thresholds: On-Target: Percentage meets or exceeds increase of 2% per year from the baseline At-Risk: Percentage remains the same or increases by less than 2% per year from
the baseline Off-Target: Percentage decreases from the baseline
Status Narrative:
This KPI was on-target for the current reporting period with an increase of 116% over the baseline. The reason for this significant increase was because the Ed Forum was a virtual event in 2021, as in 2020.
Second Quarter Report - Key Performance Indicators Page 54 of 123
Performance Trend Chart:
Second Quarter Report - Key Performance Indicators Page 55 of 123
2021-22 Key Performance Indicator Summary (Quarter 2)
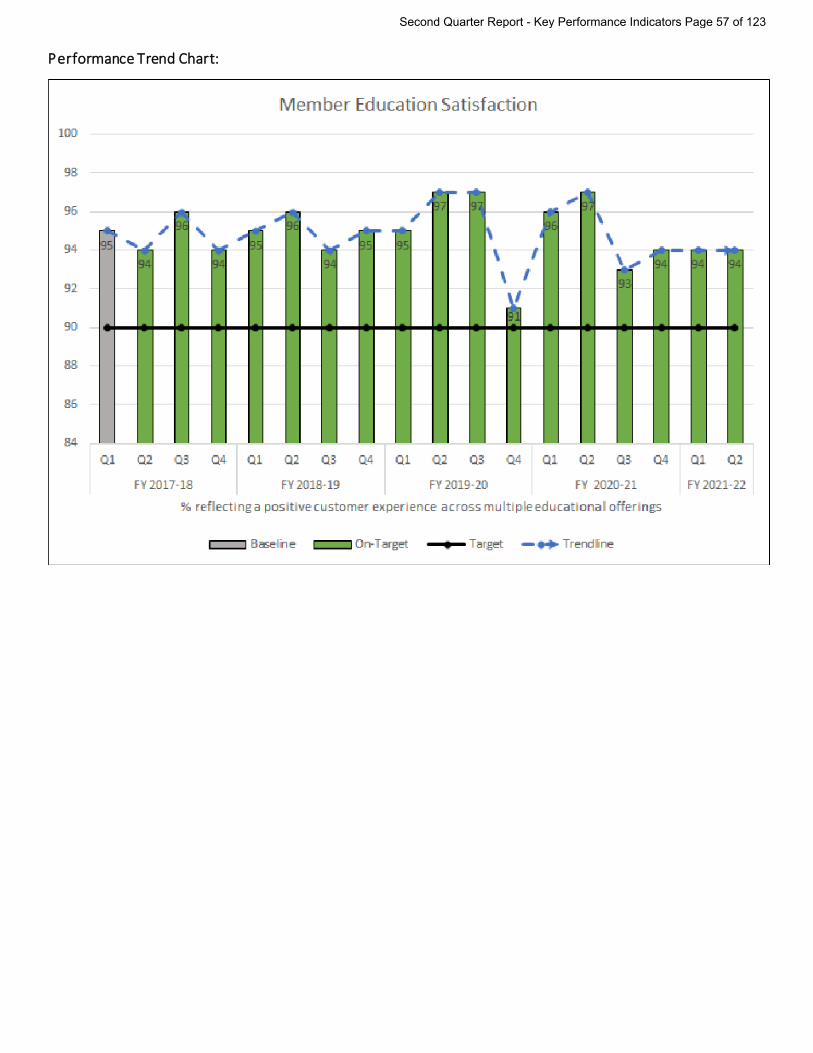
KPI Title: Member Education Satisfaction
Executive Owner: Anthony Suine
Outcome Measure: Open & Transparent Communication
Core Process: Educate Members, Employers & Stakeholders
Status: On-Target
Numeric Status: 94%
Description: The key performance indicator for member education measures satisfaction of our
customers who attend educational offerings for members, including webinars, instructor-led training, computer-based training, and CalPERS Benefit Education Events. Closely monitoring satisfaction data ensures our educational offerings meet customer expectations. For the 2017-18 Fiscal Year, 95% of attendees reported satisfaction with member education offerings, exceeding performance targets and demonstrating an overall positive customer experience.
Baseline: FY 2017-18, Quarter 1: 95%
Target: Achieve an overall satisfaction rate of 90%, reflecting a positive customer experience across multiple educational offerings
Refresh Frequency: Quarterly
Reporting Range: 10/01/2021 – 12/31/2021
Thresholds: On-Target: 80% or above At-Risk: 70% - 79% Off-Target: Below 70%
Status Narrative:
This KPI is on target for this reporting period.
Second Quarter Report - Key Performance Indicators Page 56 of 123
Performance Trend Chart:
Second Quarter Report - Key Performance Indicators Page 57 of 123
2021-22 Key Performance Indicator Summary (Quarter 2)
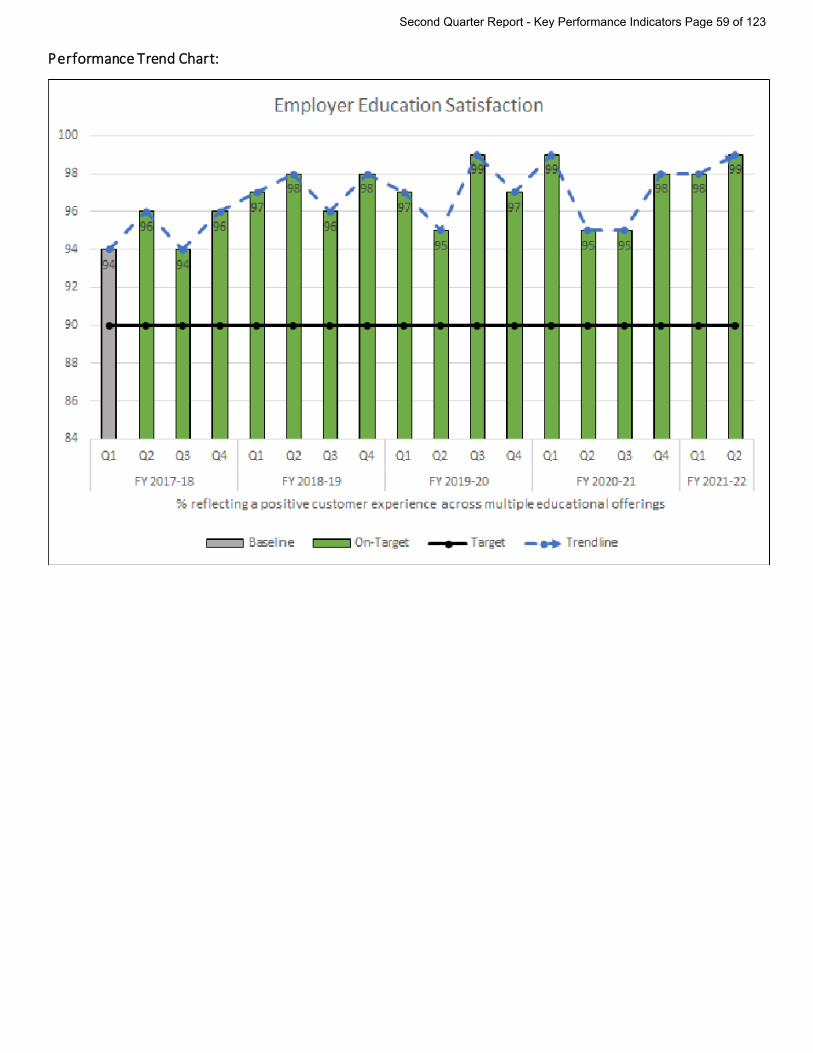
KPI Title: Employer Education Satisfaction
Executive Owner: Anthony Suine
Outcome Measure: Open & Transparent Communication
Core Process: Educate Members, Employers & Stakeholders
Status: On-Target
Numeric Status: 99%
Description: The key performance indicator for employer education focuses on measuring satisfaction
of business partners who attend webinars, computer-based, and instructor-led training for business partners. The collection of this data ensures we effectively educate employers on our benefit programs and enable them to report accurate information to CalPERS on behalf of their employees.
Satisfaction with our Employer Education offerings performed at 94% for the 2017-18 Fiscal Year, demonstrating the effectiveness of employer training courses
Baseline: FY 2017-18, Quarter 1: 94%
Target: Achieve an overall satisfaction rate of 90%, reflecting a positive customer experience across multiple educational offerings
Refresh Frequency: Quarterly
Reporting Range: 10/01/2021 – 12/31/2021
Thresholds: On-Target: 80% or above At-Risk: 70% - 79% Off-Target: Below 70%
Status Narrative:
This KPI is on target for this reporting period.
Second Quarter Report - Key Performance Indicators Page 58 of 123
Performance Trend Chart:
Second Quarter Report - Key Performance Indicators Page 59 of 123
2022-23 Key Performance Indicator Summary (Quarter 1)
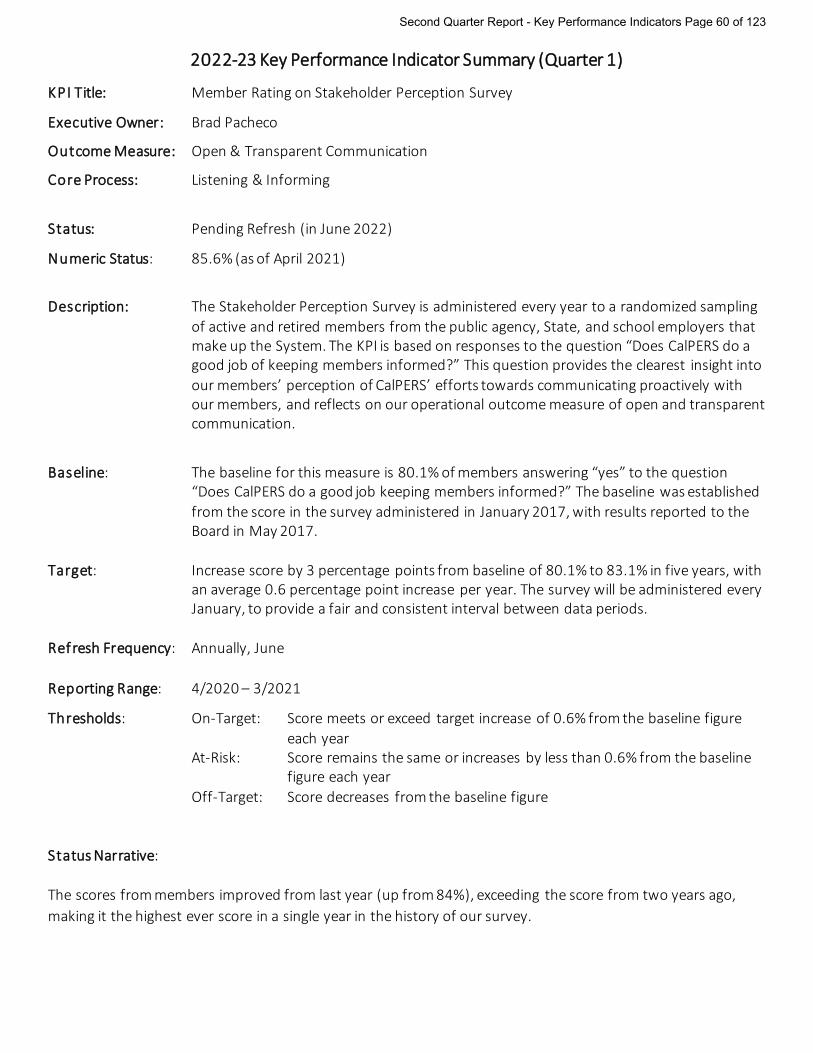
KPI Title: Member Rating on Stakeholder Perception Survey
Executive Owner: Brad Pacheco
Outcome Measure: Open & Transparent Communication
Core Process: Listening & Informing
Status: Pending Refresh (in June 2022)
Numeric Status: 85.6% (as of April 2021)
Description: The Stakeholder Perception Survey is administered every year to a randomized sampling
of active and retired members from the public agency, State, and school employers that make up the System. The KPI is based on responses to the question “Does CalPERS do a good job of keeping members informed?” This question provides the clearest insight into our members’ perception of CalPERS’ efforts towards communicating proactively with our members, and reflects on our operational outcome measure of open and transparent communication.
Baseline: The baseline for this measure is 80.1% of members answering “yes” to the question “Does CalPERS do a good job keeping members informed?” The baseline was established from the score in the survey administered in January 2017, with results reported to the Board in May 2017.
Target: Increase score by 3 percentage points from baseline of 80.1% to 83.1% in five years, with
an average 0.6 percentage point increase per year. The survey will be administered every January, to provide a fair and consistent interval between data periods.
Refresh Frequency: Annually, June
Reporting Range: 4/2020 – 3/2021
Thresholds: On-Target: Score meets or exceed target increase of 0.6% from the baseline figure each year
At-Risk: Score remains the same or increases by less than 0.6% from the baseline figure each year
Off-Target: Score decreases from the baseline figure
Status Narrative:
The scores from members improved from last year (up from 84%), exceeding the score from two years ago, making it the highest ever score in a single year in the history of our survey.
Second Quarter Report - Key Performance Indicators Page 60 of 123
Performance Trend Chart:
Second Quarter Report - Key Performance Indicators Page 61 of 123
2021-22 Key Performance Indicator Summary (Quarter 2)
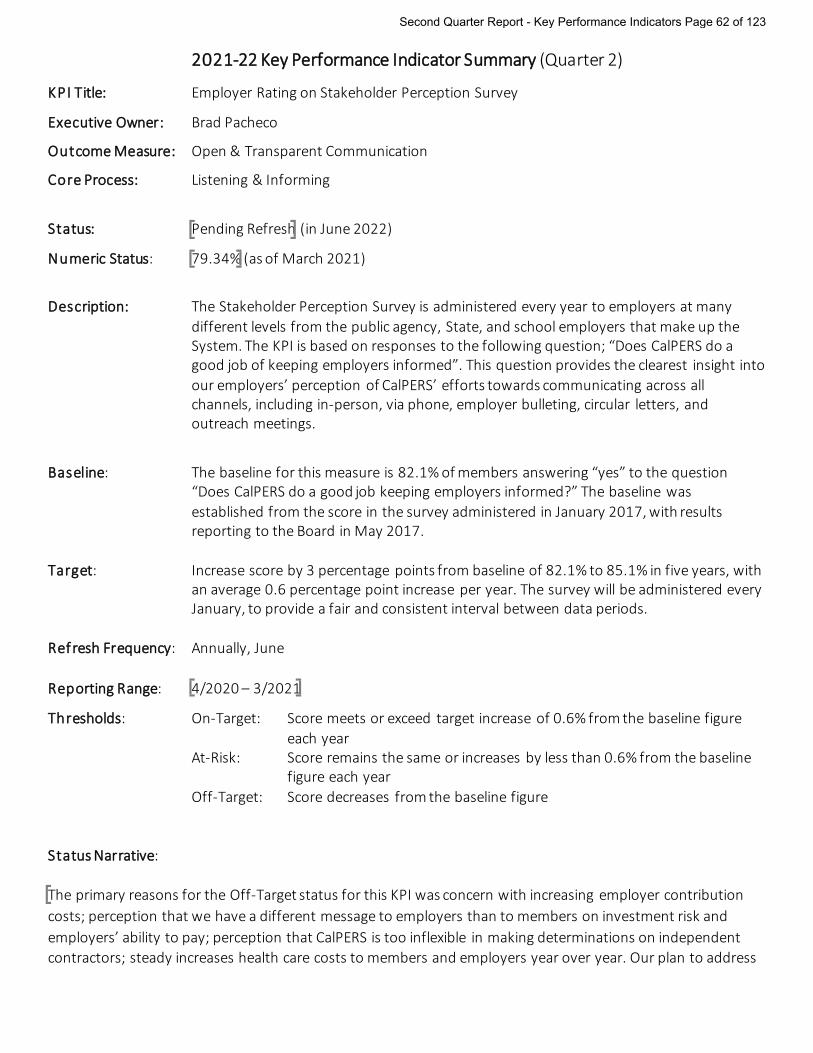
KPI Title: Employer Rating on Stakeholder Perception Survey
Executive Owner: Brad Pacheco
Outcome Measure: Open & Transparent Communication
Core Process: Listening & Informing
Status: Pending Refresh (in June 2022)
Numeric Status: 79.34% (as of March 2021)
Description: The Stakeholder Perception Survey is administered every year to employers at many
different levels from the public agency, State, and school employers that make up the System. The KPI is based on responses to the following question; “Does CalPERS do a good job of keeping employers informed”. This question provides the clearest insight into our employers’ perception of CalPERS’ efforts towards communicating across all channels, including in-person, via phone, employer bulleting, circular letters, and outreach meetings.
Baseline: The baseline for this measure is 82.1% of members answering “yes” to the question “Does CalPERS do a good job keeping employers informed?” The baseline was established from the score in the survey administered in January 2017, with results reporting to the Board in May 2017.
Target: Increase score by 3 percentage points from baseline of 82.1% to 85.1% in five years, with
an average 0.6 percentage point increase per year. The survey will be administered every January, to provide a fair and consistent interval between data periods.
Refresh Frequency: Annually, June
Reporting Range: 4/2020 – 3/2021
Thresholds: On-Target: Score meets or exceed target increase of 0.6% from the baseline figure each year
At-Risk: Score remains the same or increases by less than 0.6% from the baseline figure each year
Off-Target: Score decreases from the baseline figure
Status Narrative:
The primary reasons for the Off-Target status for this KPI was concern with increasing employer contribution costs; perception that we have a different message to employers than to members on investment risk and employers’ ability to pay; perception that CalPERS is too inflexible in making determinations on independent contractors; steady increases health care costs to members and employers year over year. Our plan to address
Second Quarter Report - Key Performance Indicators Page 62 of 123
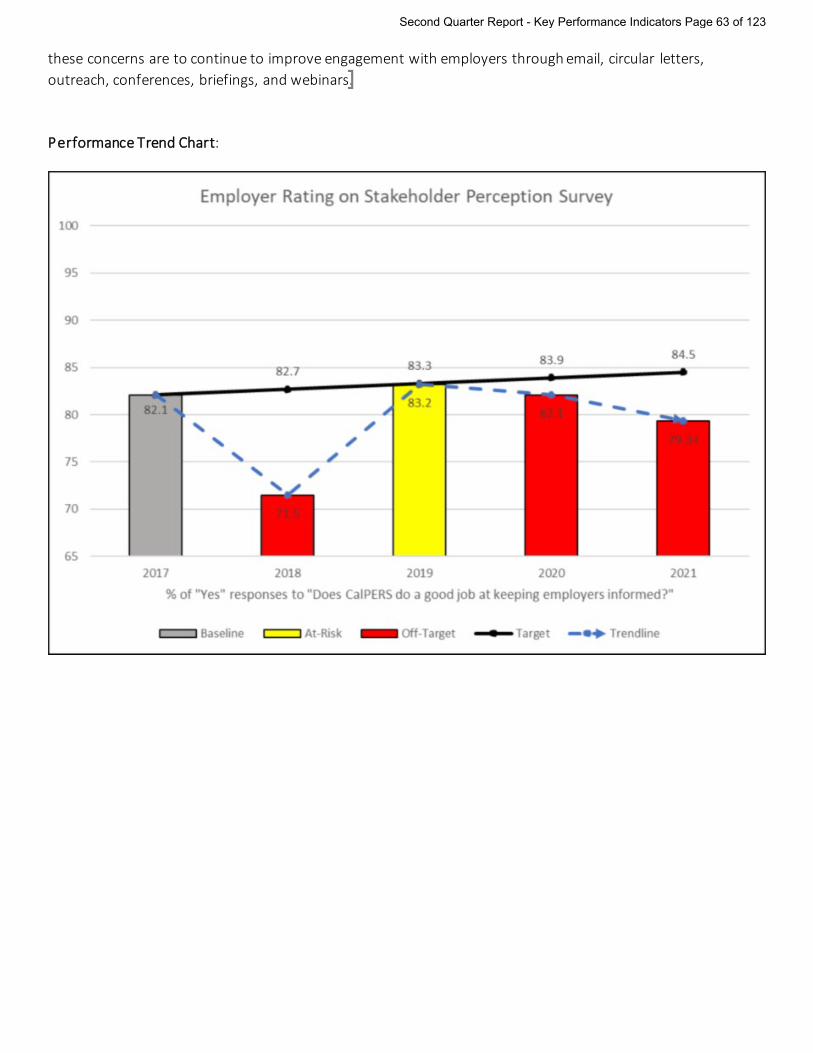
these concerns are to continue to improve engagement with employers through email, circular letters, outreach, conferences, briefings, and webinars.
Performance Trend Chart:
Second Quarter Report - Key Performance Indicators Page 63 of 123
2021-22 Key Performance Indicator Summary (Quarter 2)
KPI Title: Stakeholder Rating on Stakeholder Perception Survey
Executive Owner: Brad Pacheco
Outcome Measure: Open & Transparent Communication
Core Process: Listening & Informing
Status: Pending Refresh (in June 2022)
Numeric Status: 66.67% (as of March 2021)
Description: The Stakeholder Perception Survey is administered every year to a list of the 75
stakeholder leaders with whom CalPERS is most closely engaged. These stakeholders represent members, employers, retirees, private sector business, the Legislature, peer pension funds, and business partners. The KPI is based on responses to the following question: "Does CalPERS do a good job of keeping stakeholders informed". This question provides the clearest insight into our stakeholders' perception of CalPERS' efforts to communicate and be responsive.
Baseline: The baseline for this measure is 69% of surveyed stakeholders answering "yes" to the to the question "Does CalPERS do a good job keeping stakeholders informed?" The baseline was established from the score in the survey administered in January 2017, with results reported to the Board in May 2017.
Target: Increase score by 3 percentage points from baseline of 69% to 72% in five years, with an
average 0.6 percentage point increase per year. The survey will be administered every January, to provide a fair and consistent interval between data periods.
Refresh Frequency: Annually, June
Reporting Range: 4/2019 – 3/2020
Thresholds: On-Target: Score meets or exceed target increase of 0.6% from the baseline figure each year
At-Risk: Score remains the same or increases by less than 0.6% from the baseline figure each year
Off-Target: Score decreases from the baseline figure
Status Narrative:
This KPI was Off-Target for the year and reflected the lowest score in the past 4 years. One factor that may have impacted this score is that the entire cohort consists of just 75 people – and only 35 replied to the survey. With such a small population, even a small dip in the rating of one question can create a large downturn in final rating and cause quite a bit of volatility year to year. The steps to help improve scores are to continue to
Second Quarter Report - Key Performance Indicators Page 64 of 123
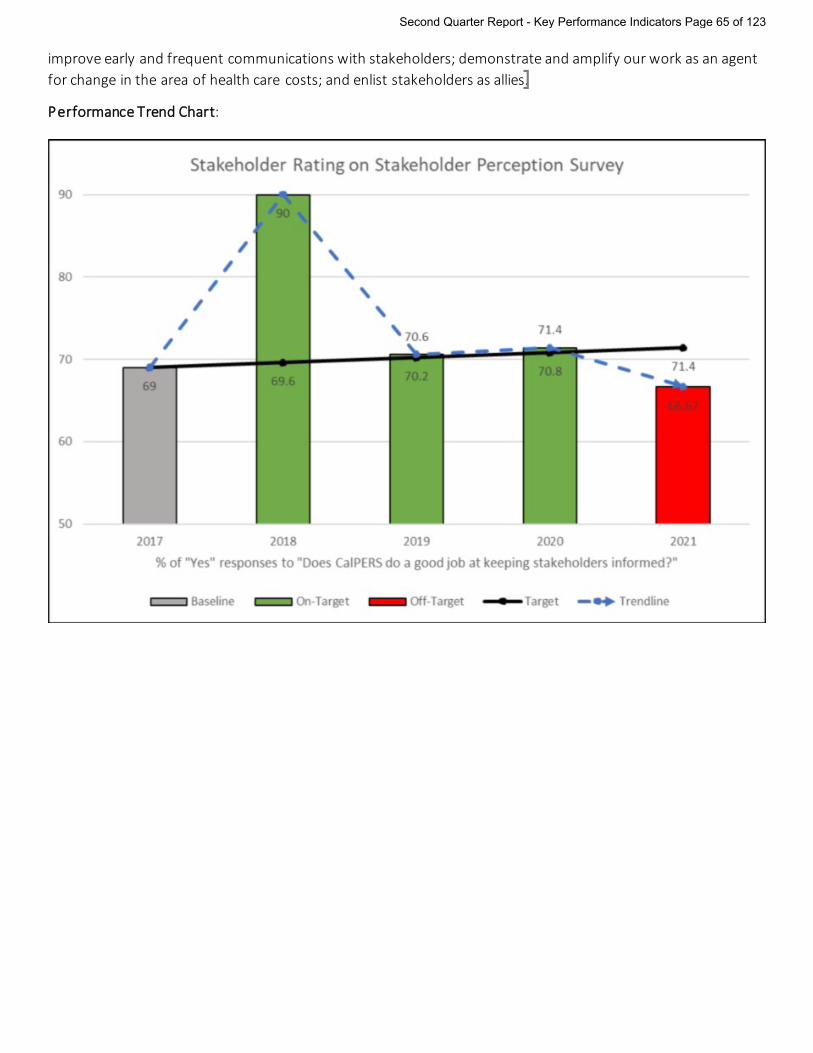
improve early and frequent communications with stakeholders; demonstrate and amplify our work as an agent for change in the area of health care costs; and enlist stakeholders as allies.
Performance Trend Chart:
Second Quarter Report - Key Performance Indicators Page 65 of 123
2021-22 Key Performance Indicator Summary (Quarter 2)
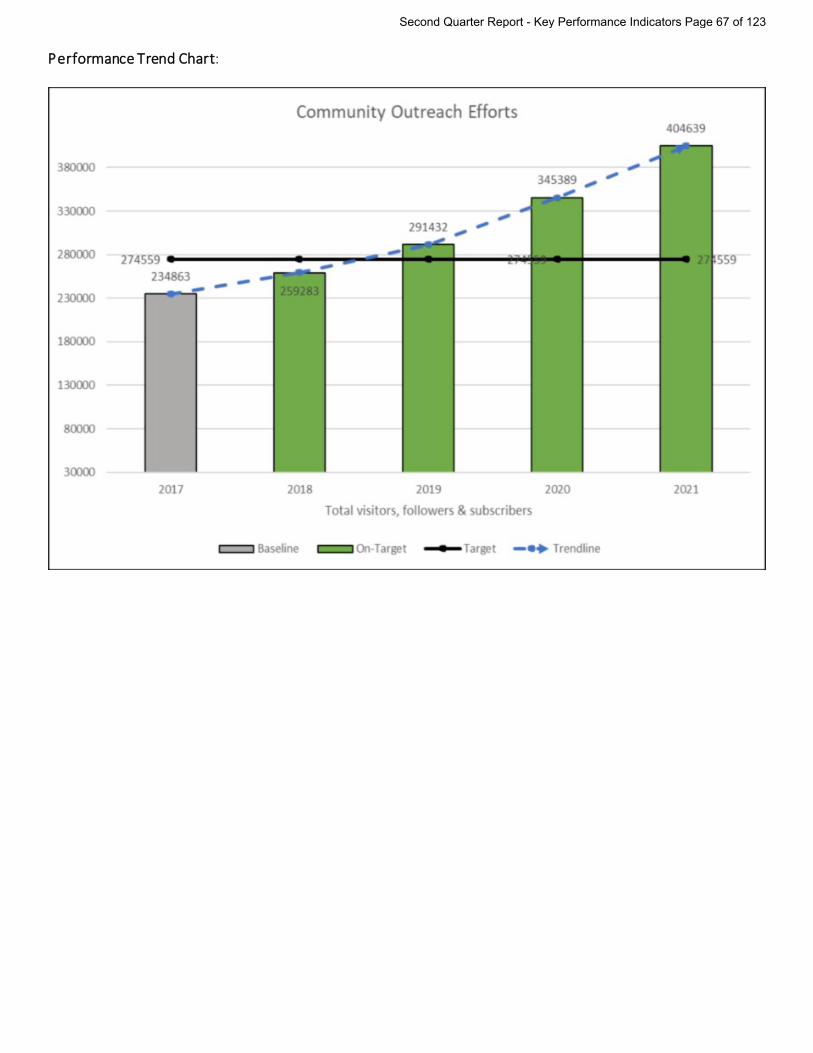
KPI Title: Community Outreach Efforts
Executive Owner: Brad Pacheco
Outcome Measure: Open & Transparent Communication
Core Process: Listening & Informing
Status: Pending Refresh (in June 2022)
Numeric Status: 404,639 (for FY 2020-21)
Description: This KPI measures our efforts to modernize CalPERS’ communications and outreach to
improve agility and maximize reach, response, and reputation while increasing programmatic and operational efficiencies.
Factors:
• Visits to Public Website • Total Social Media Followers • CalPERS News and Ambassador Newsletter Email Subscriptions
Baseline: 234,863 Total Visitors, Followers & Subscribers (as of 07/01/17) Target: 274,559 Total Visitors, Followers & Subscribers (by 06/30/22)
• Total Increase (over 5 years): 39,696 • Annual Increase: 7,939
Refresh Frequency: Annually, June
Reporting Range: FY 2020-21
Thresholds: On-Target: 7,939 and above At-Risk: 7,000 – 7,938 Off-Target: Below 7,000
Status Narrative:
As of June 30, 2021, there were 404,639 Total Visitors, Followers & Subscribers.
The annual increase was 59,250 users (July 1, 2020 – June 30, 2021).
The total increase was 155,356 users (July 1, 2017 - June 30, 2021).
This KPI is On-Target. Updated performance data will be available in June 2022.
Second Quarter Report - Key Performance Indicators Page 66 of 123
Performance Trend Chart:
Second Quarter Report - Key Performance Indicators Page 67 of 123
2021-22 Key Performance Indicator Summary (Quarter 2)
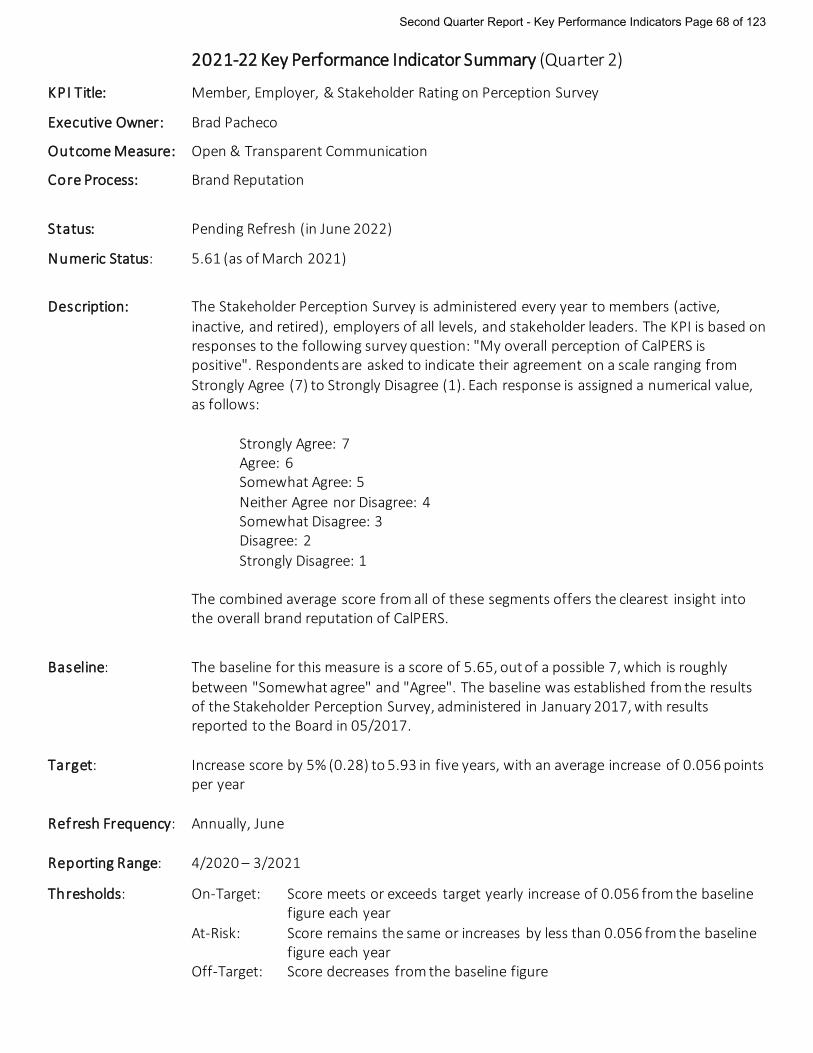
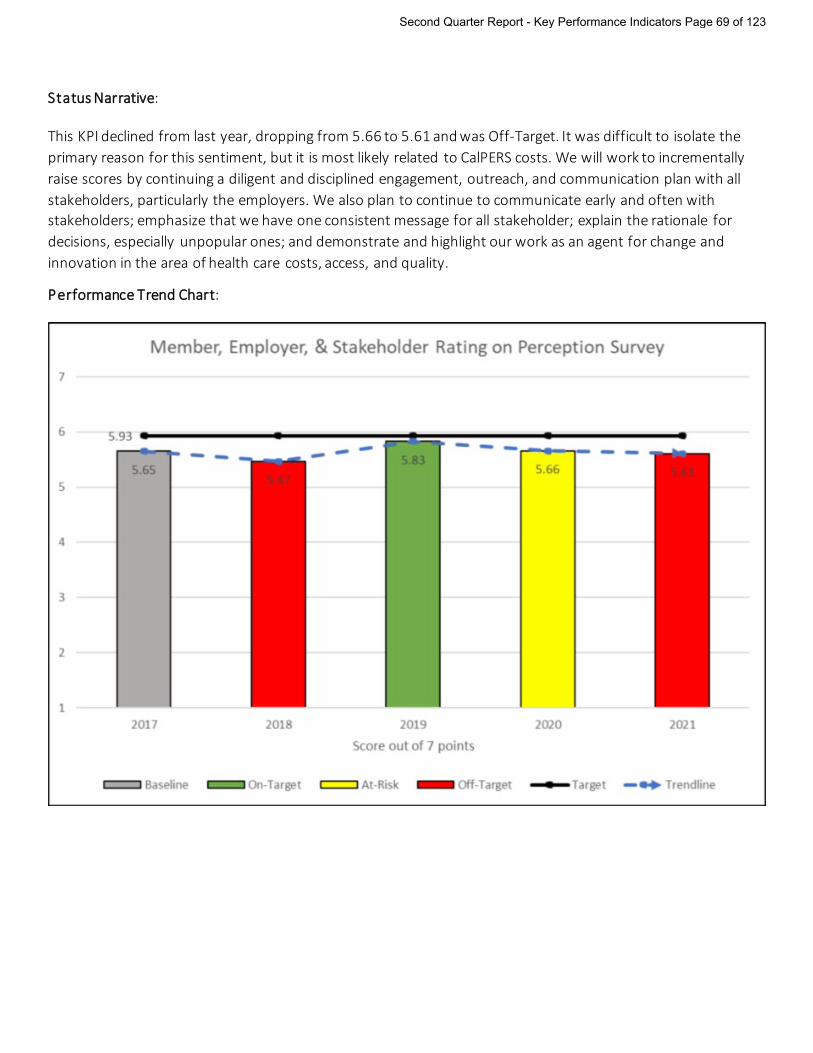
KPI Title: Member, Employer, & Stakeholder Rating on Perception Survey
Executive Owner: Brad Pacheco
Outcome Measure: Open & Transparent Communication
Core Process: Brand Reputation
Status: Pending Refresh (in June 2022)
Numeric Status: 5.61 (as of March 2021)
Description: The Stakeholder Perception Survey is administered every year to members (active,
inactive, and retired), employers of all levels, and stakeholder leaders. The KPI is based on responses to the following survey question: "My overall perception of CalPERS is positive". Respondents are asked to indicate their agreement on a scale ranging from Strongly Agree (7) to Strongly Disagree (1). Each response is assigned a numerical value, as follows:
Strongly Agree: 7 Agree: 6 Somewhat Agree: 5 Neither Agree nor Disagree: 4 Somewhat Disagree: 3 Disagree: 2 Strongly Disagree: 1
The combined average score from all of these segments offers the clearest insight into
the overall brand reputation of CalPERS.
Baseline: The baseline for this measure is a score of 5.65, out of a possible 7, which is roughly between "Somewhat agree" and "Agree". The baseline was established from the results of the Stakeholder Perception Survey, administered in January 2017, with results reported to the Board in 05/2017.
Target: Increase score by 5% (0.28) to 5.93 in five years, with an average increase of 0.056 points
per year Refresh Frequency: Annually, June
Reporting Range: 4/2020 – 3/2021
Thresholds: On-Target: Score meets or exceeds target yearly increase of 0.056 from the baseline figure each year
At-Risk: Score remains the same or increases by less than 0.056 from the baseline figure each year
Off-Target: Score decreases from the baseline figure
Second Quarter Report - Key Performance Indicators Page 68 of 123
Status Narrative:
This KPI declined from last year, dropping from 5.66 to 5.61 and was Off-Target. It was difficult to isolate the primary reason for this sentiment, but it is most likely related to CalPERS costs. We will work to incrementally raise scores by continuing a diligent and disciplined engagement, outreach, and communication plan with all stakeholders, particularly the employers. We also plan to continue to communicate early and often with stakeholders; emphasize that we have one consistent message for all stakeholder; explain the rationale for decisions, especially unpopular ones; and demonstrate and highlight our work as an agent for change and innovation in the area of health care costs, access, and quality.
Performance Trend Chart:
Second Quarter Report - Key Performance Indicators Page 69 of 123
2021-22 Key Performance Indicator Summary (Quarter 2)
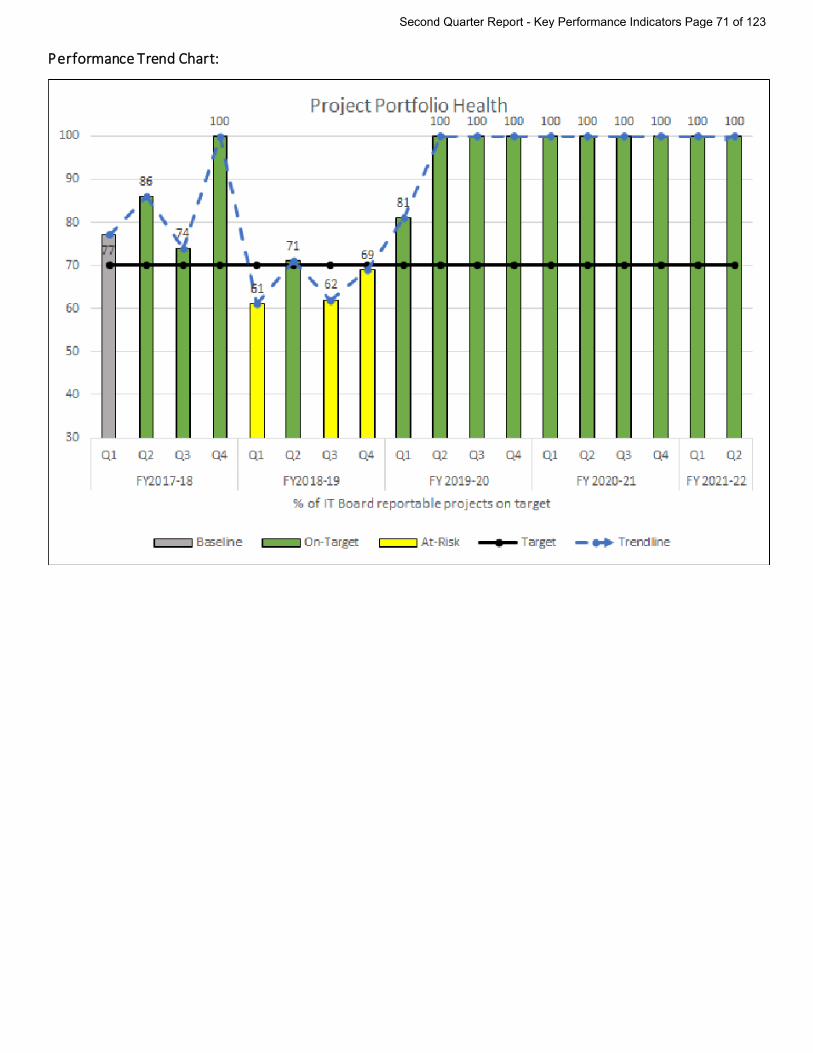
KPI Title: Project Portfolio Health
Executive Owner: Doug Hoffner
Outcome Measure: Efficient & Effective Organization
Core Process: Leveraging Technology
Status: On-Target
Numeric Status: 100%
Description: This KPI measures the overall health component of Board Reportable Projects in the
portfolio. The score is calculated using the project size and overall health score. Projects are weighted based on the project size which is determined based on complexity, duration, and budget. Projects with a larger size have a greater weight and impact the overall KPI status.
Baseline: The baseline measurement, taken from Board Reportable Projects as of 9/29/17, is 77%. Target: The target is 70% of the projects in the portfolio are On-Target for the next fiscal year. Refresh Frequency: Quarterly Reporting Range: 10/01/2021 – 12/31/2021 Thresholds: On-Target: 70% or above At-Risk: 54% to 69% Off-Target: Less than 54%
Status Narrative:
The board reportable projects all have an overall health status of green (On-Target).
Second Quarter Report - Key Performance Indicators Page 70 of 123
Performance Trend Chart:
Second Quarter Report - Key Performance Indicators Page 71 of 123
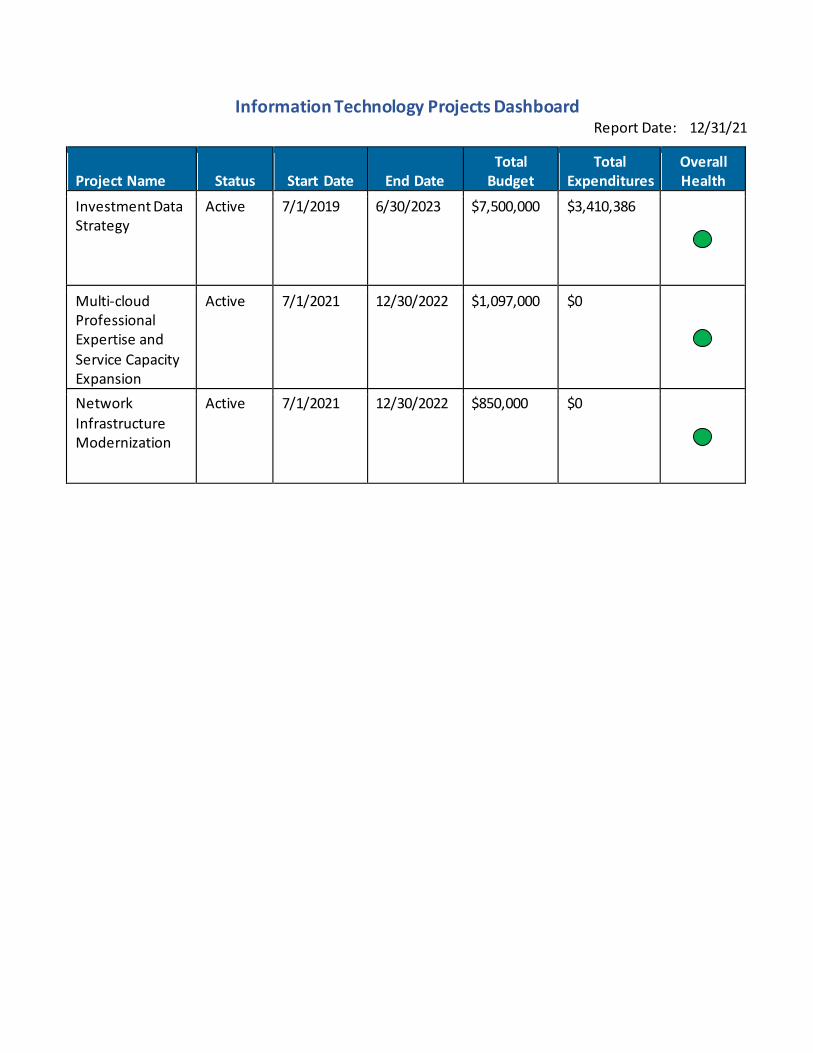
Information Technology Projects Dashboard Report Date: 12/31/21
Project Name Status Start Date End Date Total
Budget Total
Expenditures Overall Health
Investment Data Strategy
Active 7/1/2019 6/30/2023 $7,500,000 $3,410,386
Multi-cloud Professional Expertise and Service Capacity Expansion
Active 7/1/2021 12/30/2022 $1,097,000 $0
Network Infrastructure Modernization
Active 7/1/2021 12/30/2022 $850,000 $0
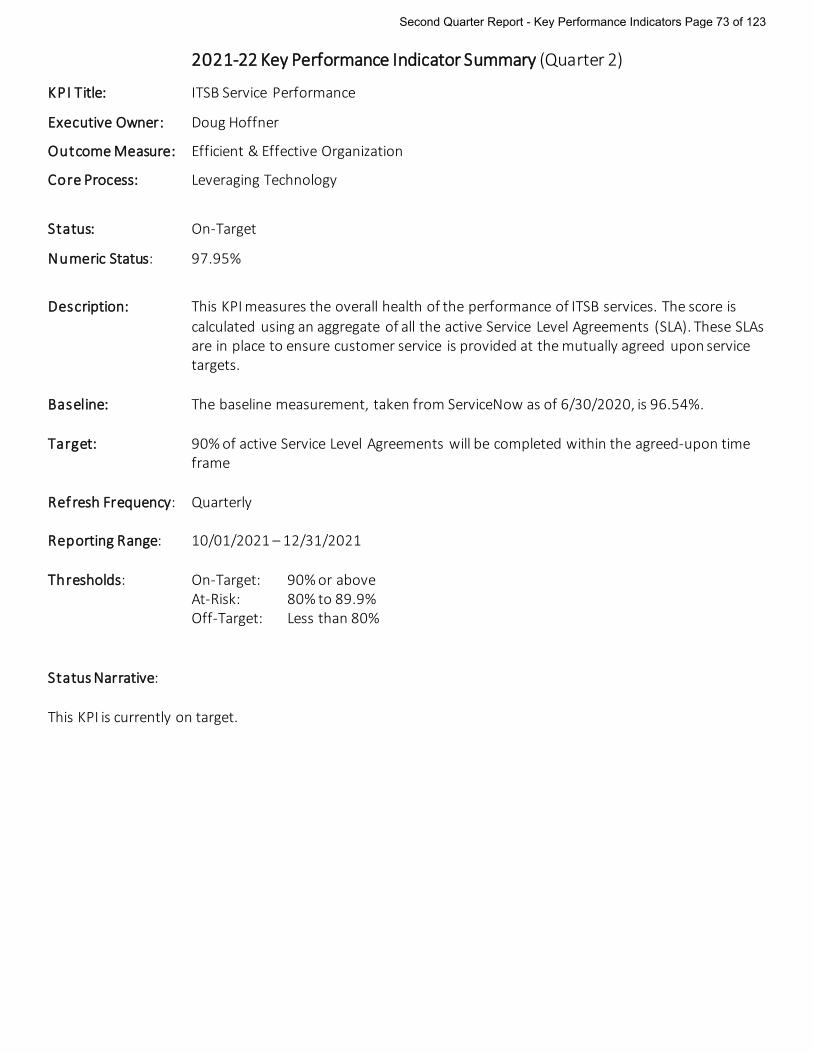
2021-22 Key Performance Indicator Summary (Quarter 2)
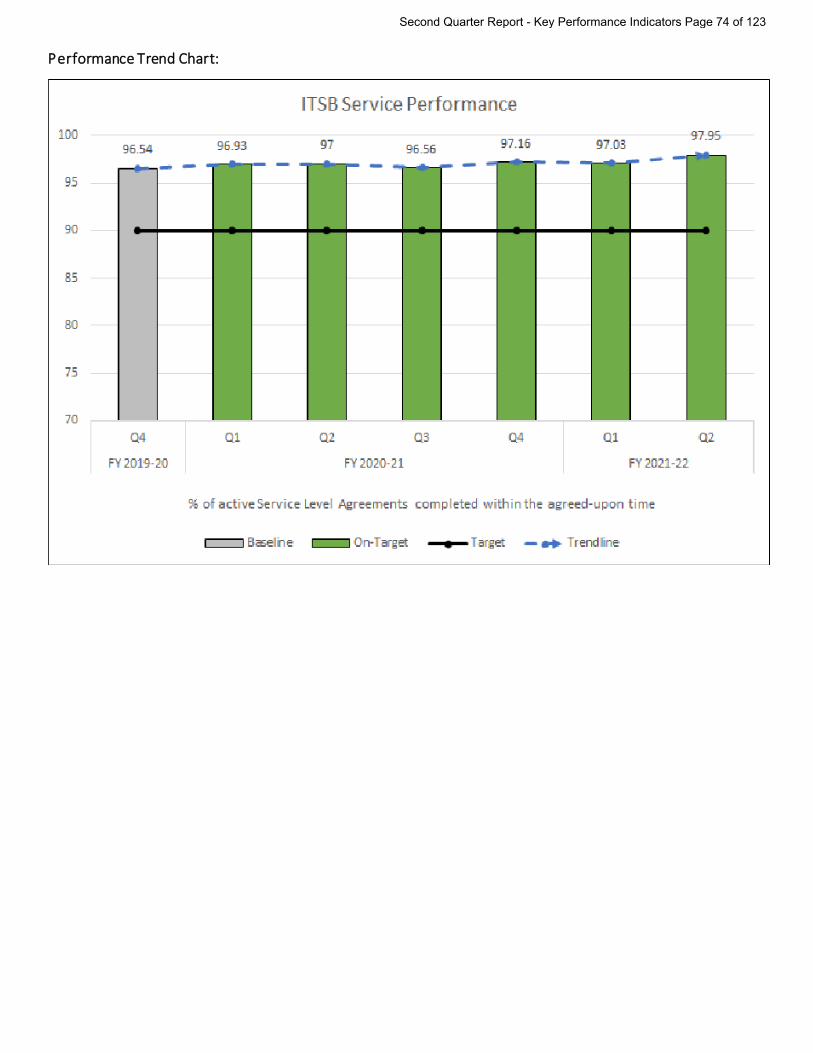
KPI Title: ITSB Service Performance
Executive Owner: Doug Hoffner
Outcome Measure: Efficient & Effective Organization
Core Process: Leveraging Technology
Status: On-Target
Numeric Status: 97.95%
Description: This KPI measures the overall health of the performance of ITSB services. The score is
calculated using an aggregate of all the active Service Level Agreements (SLA). These SLAs are in place to ensure customer service is provided at the mutually agreed upon service targets.
Baseline: The baseline measurement, taken from ServiceNow as of 6/30/2020, is 96.54%. Target: 90% of active Service Level Agreements will be completed within the agreed-upon time
frame Refresh Frequency: Quarterly Reporting Range: 10/01/2021 – 12/31/2021 Thresholds: On-Target: 90% or above At-Risk: 80% to 89.9% Off-Target: Less than 80%
Status Narrative:
This KPI is currently on target.
Second Quarter Report - Key Performance Indicators Page 73 of 123
Performance Trend Chart:
Second Quarter Report - Key Performance Indicators Page 74 of 123
2021-22 Key Performance Indicator Summary (Quarter 2)
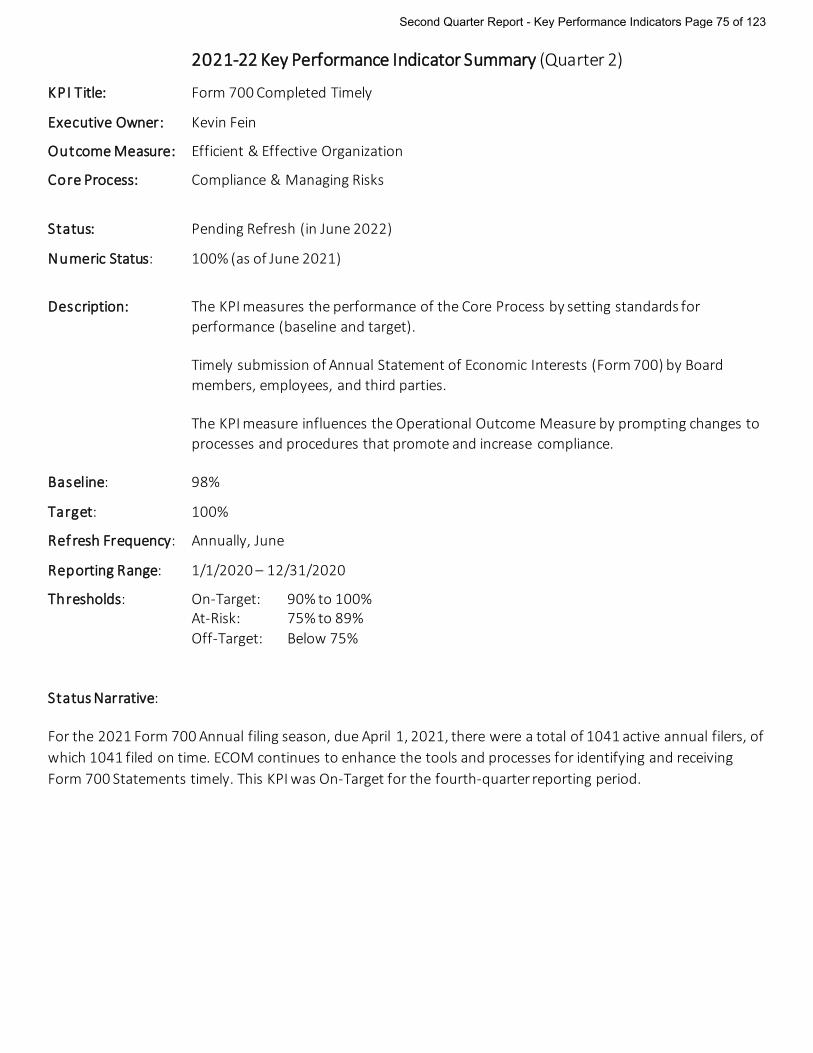
KPI Title: Form 700 Completed Timely
Executive Owner: Kevin Fein
Outcome Measure: Efficient & Effective Organization
Core Process: Compliance & Managing Risks
Status: Pending Refresh (in June 2022)
Numeric Status: 100% (as of June 2021)
Description: The KPI measures the performance of the Core Process by setting standards for
performance (baseline and target). Timely submission of Annual Statement of Economic Interests (Form 700) by Board
members, employees, and third parties. The KPI measure influences the Operational Outcome Measure by prompting changes to
processes and procedures that promote and increase compliance. Baseline: 98%
Target: 100%
Refresh Frequency: Annually, June
Reporting Range: 1/1/2020 – 12/31/2020
Thresholds: On-Target: 90% to 100% At-Risk: 75% to 89% Off-Target: Below 75%
Status Narrative:
For the 2021 Form 700 Annual filing season, due April 1, 2021, there were a total of 1041 active annual filers, of which 1041 filed on time. ECOM continues to enhance the tools and processes for identifying and receiving Form 700 Statements timely. This KPI was On-Target for the fourth-quarter reporting period.
Second Quarter Report - Key Performance Indicators Page 75 of 123
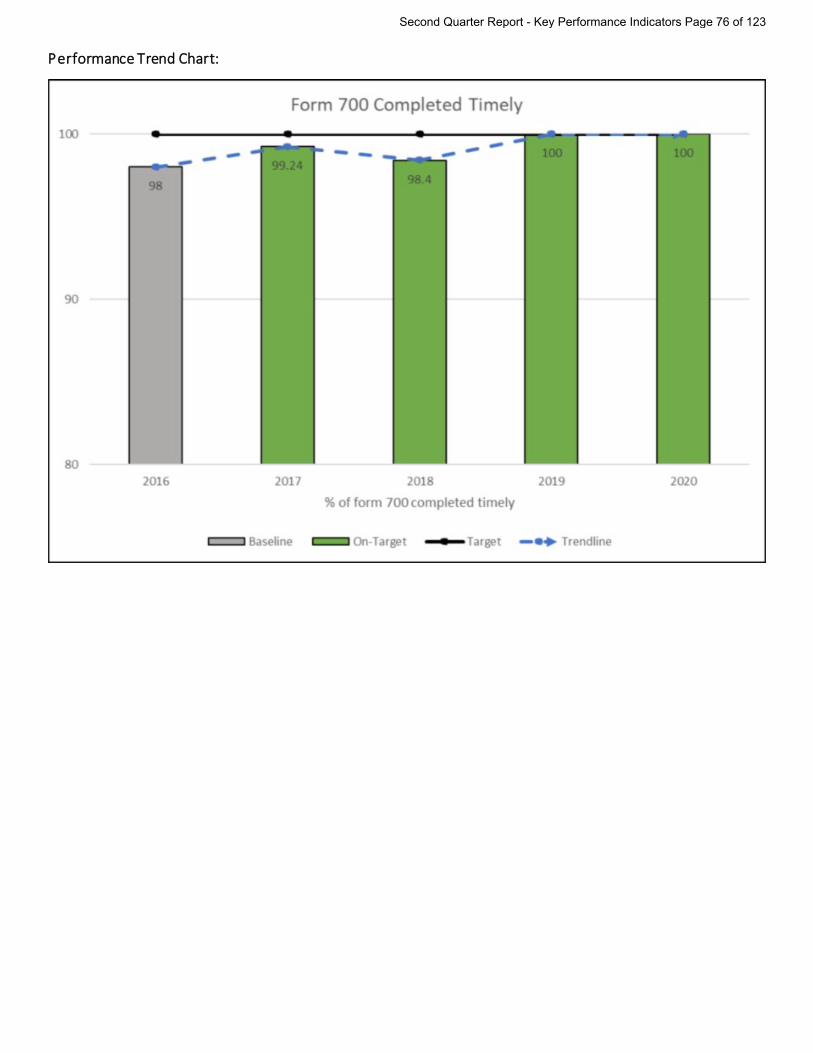
Performance Trend Chart:
Second Quarter Report - Key Performance Indicators Page 76 of 123
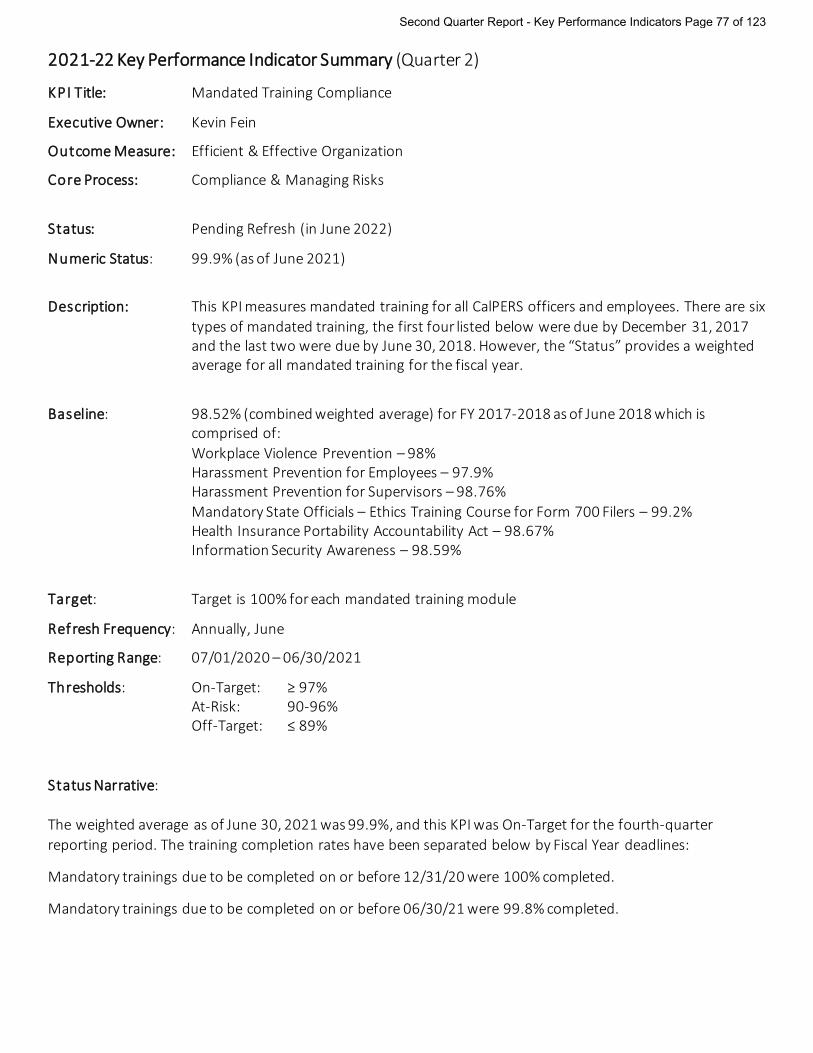
2021-22 Key Performance Indicator Summary (Quarter 2)
KPI Title: Mandated Training Compliance
Executive Owner: Kevin Fein
Outcome Measure: Efficient & Effective Organization
Core Process: Compliance & Managing Risks
Status: Pending Refresh (in June 2022)
Numeric Status: 99.9% (as of June 2021)
Description: This KPI measures mandated training for all CalPERS officers and employees. There are six
types of mandated training, the first four listed below were due by December 31, 2017 and the last two were due by June 30, 2018. However, the “Status” provides a weighted average for all mandated training for the fiscal year.
Baseline: 98.52% (combined weighted average) for FY 2017-2018 as of June 2018 which is comprised of:
Workplace Violence Prevention – 98% Harassment Prevention for Employees – 97.9% Harassment Prevention for Supervisors – 98.76% Mandatory State Officials – Ethics Training Course for Form 700 Filers – 99.2% Health Insurance Portability Accountability Act – 98.67% Information Security Awareness – 98.59%
Target: Target is 100% for each mandated training module
Refresh Frequency: Annually, June
Reporting Range: 07/01/2020 – 06/30/2021
Thresholds: On-Target: ≥ 97% At-Risk: 90-96% Off-Target: ≤ 89%
Status Narrative:
The weighted average as of June 30, 2021 was 99.9%, and this KPI was On-Target for the fourth-quarter reporting period. The training completion rates have been separated below by Fiscal Year deadlines:
Mandatory trainings due to be completed on or before 12/31/20 were 100% completed.
Mandatory trainings due to be completed on or before 06/30/21 were 99.8% completed.
Second Quarter Report - Key Performance Indicators Page 77 of 123
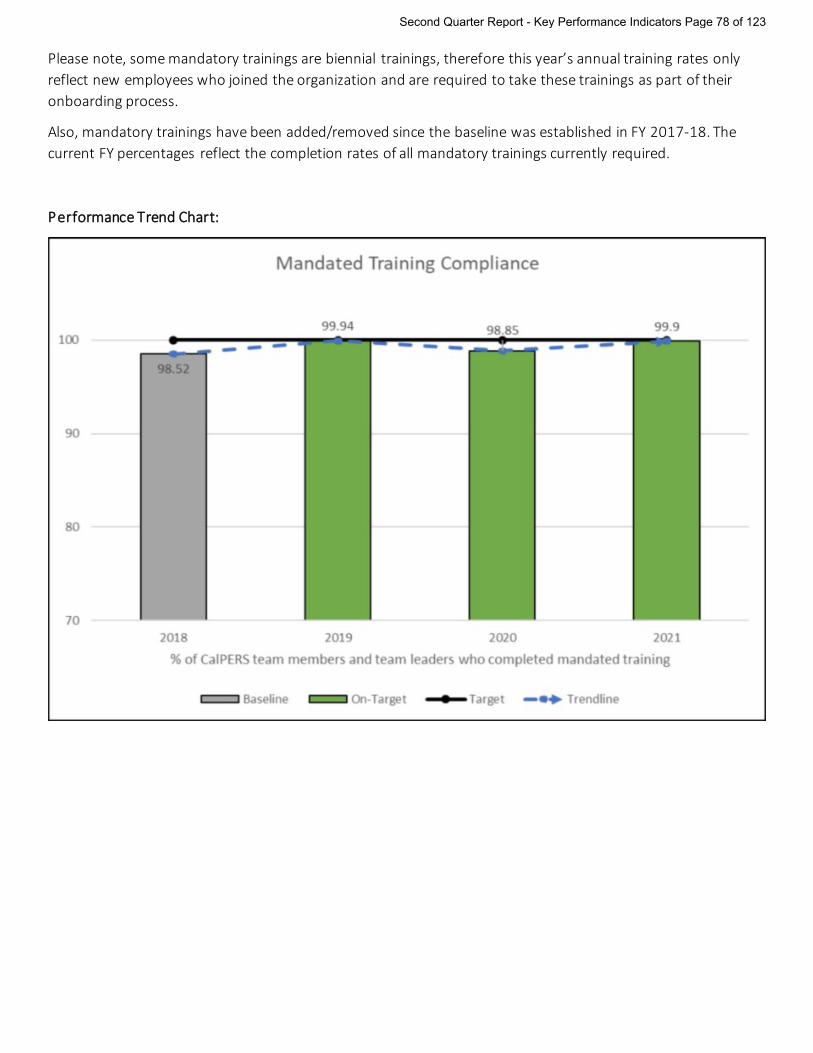
Please note, some mandatory trainings are biennial trainings, therefore this year’s annual training rates only reflect new employees who joined the organization and are required to take these trainings as part of their onboarding process.
Also, mandatory trainings have been added/removed since the baseline was established in FY 2017-18. The current FY percentages reflect the completion rates of all mandatory trainings currently required.
Performance Trend Chart:
Second Quarter Report - Key Performance Indicators Page 78 of 123

2021-22 Key Performance Indicator Summary (Quarter 2)
KPI Title: Personal Trading Monitoring
Executive Owner: Kevin Fein
Outcome Measure: Efficient & Effective Organization
Core Process: Compliance & Managing Risks
Status: Pending Refresh (in June 2022)
Numeric Status: 31 (as of June 2021)
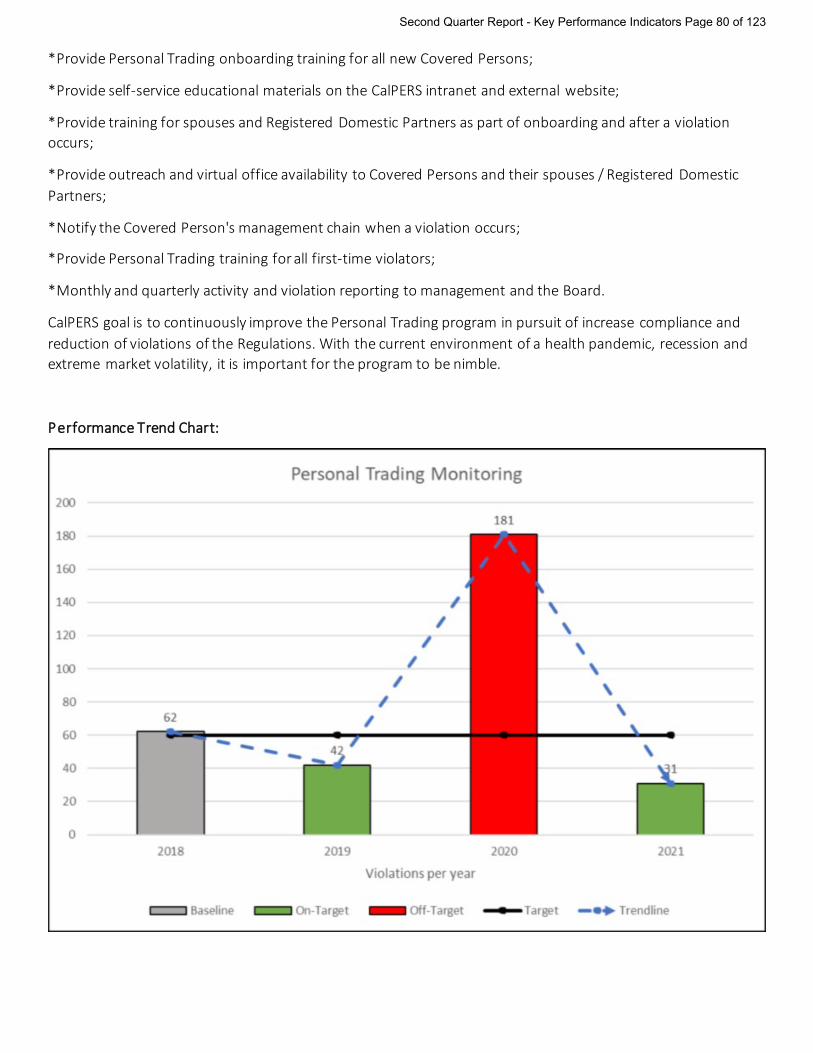
Description: Measure all violations to CalPERS Personal Trading Regulations. CalPERS maintains
regulations around the personal trading activities of Covered Persons to help ensure that CalPERS complies with federal and state laws around the misuse of material, non-public information.
Baseline: 62 violations per year
Target: Zero
Refresh Frequency: Annually, June
Reporting Range: Previous fiscal year snapshot, 07/01/20 to 06/30/21
Thresholds: On-Target: ≤ 60 violations At-Risk: 61-70 violations Off-Target: ≥ 80 violations
Status Narrative:
For FY 2020-21 there were approximately 3,249 transactions resulting in 31 violations. This KPI was On-Target for the fourth-quarter reporting period. Please note, a single transaction can result in multiple violations. Enterprise Compliance continues to implement the following enhancements in order to increase both awareness and comprehension of the requirements and to emphasize the importance of adhering to the Regulations:
*Quarterly communications on key topics and reminders;
*Monthly Covered Persons training provided to educate on key topics and FAQs;
*Annual mandatory training requirement for all Covered Persons;
*Mandatory refresher training for Covered Persons when a violation occurs;
*Update and create additional self-service educational materials on the CalPERS intranet and external website;
The enterprise Compliance Office continues to support Covered Persons in their awareness and comprehension of the requirements in the following ways:
Second Quarter Report - Key Performance Indicators Page 79 of 123
*Provide Personal Trading onboarding training for all new Covered Persons;
*Provide self-service educational materials on the CalPERS intranet and external website;
*Provide training for spouses and Registered Domestic Partners as part of onboarding and after a violation occurs;
*Provide outreach and virtual office availability to Covered Persons and their spouses / Registered Domestic Partners;
*Notify the Covered Person's management chain when a violation occurs;
*Provide Personal Trading training for all first-time violators;
*Monthly and quarterly activity and violation reporting to management and the Board.
CalPERS goal is to continuously improve the Personal Trading program in pursuit of increase compliance and reduction of violations of the Regulations. With the current environment of a health pandemic, recession and extreme market volatility, it is important for the program to be nimble.
Performance Trend Chart:
Second Quarter Report - Key Performance Indicators Page 80 of 123
2021-22 Key Performance Indicator Summary (Quarter 2)
KPI Title: Ensure Evacuation Readiness
Executive Owner: Doug Hoffner
Outcome Measure: Efficient & Effective Organization
Core Process: Compliance & Managing Risks
Status: Pending Refresh (in September 2022)
Numeric Status: N/A (as of September 2021)
Description: This KPI is focused on increasing the overall health and safety of all team members in the
organization by ensuring they are equipped with the tools to efficiently and effectively evacuate during an emergency. To achieve this, the following tasks are performed: hold an annual evacuation drill; work to obtain appropriate team member to Floor Warden Team (FWT) and Emergency Response Team (ERT) ratios; hold ERT and FWT trainings and mock drills; and work to increase the visibility of, and education around, the emergency assistance program for those with special assistance needs.
Baseline: The baseline for Fiscal Year 16/17 is 77%. It is a combined average of 77% Floor Warden
Team (FWT) and 78% Emergency Response Team (ERT) participation. Target: The target is to achieve a combined average of 80% or greater on the FWT and ERT
participation rate. Refresh Frequency: Annually, September Reporting Range: FY 2020-21 Thresholds: On-Target: > 80% ERT and FWT participation At-Risk: 75 – 80% ERT and FWT participation Off-Target: < 75% ERT and FWT participation
Status Narrative:
Due to the nature of the vast majority of team members working remotely, this KPI is on hold indefinitely. OSSD will redevelop this KPI when return to office plan is implemented and evaluated, and we have a mature emergency management processes to account for the new hybrid work schedule. Some topics that will be evaluated and considered in the new Evacuation Readiness KPI include: the need for a new floor warden and emergency response teams; additional learning in GoLearn; research other state agencies and private sector companies to see what they’re doing; changes to the Where’s My Peeps app; possibility of using xMatters for communications. OSSD teams will discuss how to best incorporate changes in the working environment into an emergency response plan to provide safety to all CalPERS team members.
Second Quarter Report - Key Performance Indicators Page 81 of 123
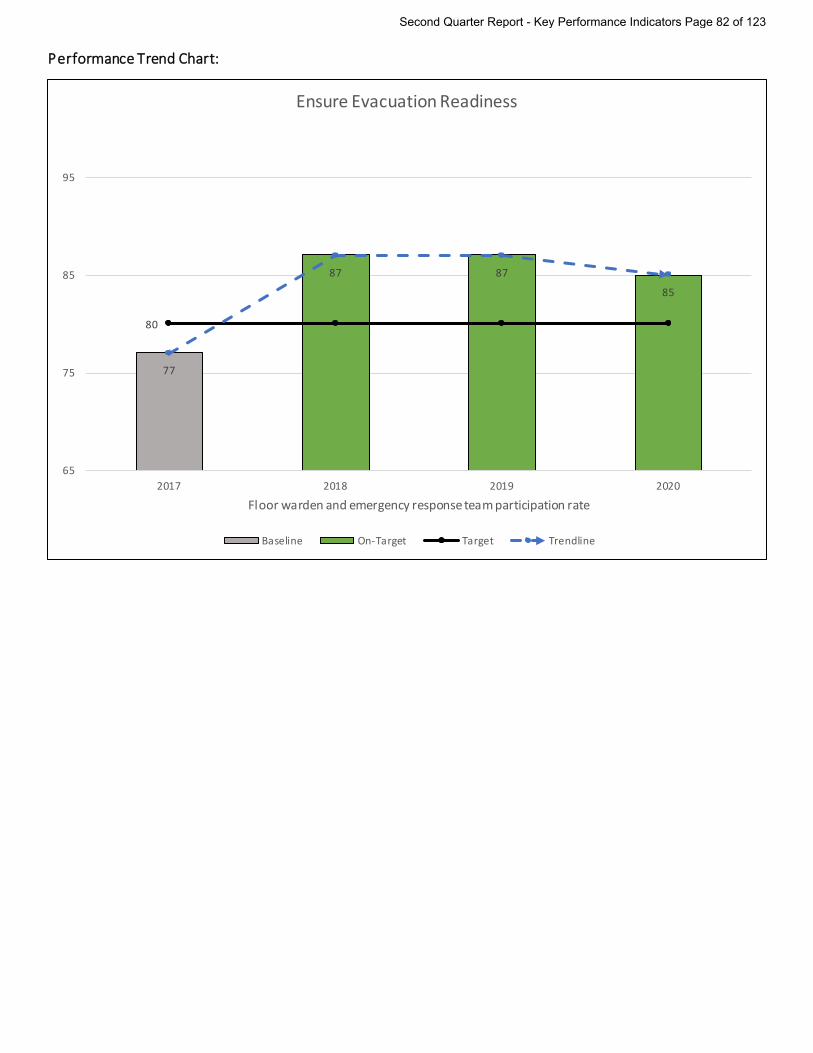
Performance Trend Chart:
80
77
87 87
85
65
75
85
95
2017 2018 2019 2020
Floor warden and emergency response team participation rate
Ensure Evacuation Readiness
Baseline On-Target Target Trendline
Second Quarter Report - Key Performance Indicators Page 82 of 123
2021-22 Key Performance Indicator Summary (Quarter 2)
KPI Title: Business Continuity Readiness – INFORMATIONAL
Executive Owner: Doug Hoffner
Outcome Measure: Efficient & Effective Organization
Core Process: Compliance & Managing Risks
Status: Not Applicable as KPI is Informational
Numeric Status: N/A
Description: This KPI supports CalPERS’ mission of delivering retirement and health care benefits to
members and their beneficiaries during disaster recovery and maintaining CalPERS’ ability to remain effective after an interruption to business operations.
Baseline: Not applicable as KPI is Informational Target: Not applicable as KPI is Informational Refresh Frequency: Annually, July Reporting Range: FY 2021-22 Thresholds: Not applicable as KPI is Informational Status Narrative:
One of the most important components of Business Continuity for CalPERS is the Enterprise Plan, which contains the Pandemic Preparedness, Response, and Recovery Plan (Pandemic Plan) appendix. This plan was activated in February of 2020 in response to COVID-19. By following the recommendations in the Pandemic Plan, appropriate measures were taken to protect team members and ensure continuity of business. Some of the key steps taken in conjunction with Human Resources, Public Affairs, and Health were: establishing a COVID-19 daily workgroup; educating team members on proper handwashing protocol and hygiene; distributing hand sanitizer and disinfectant wipes to divisions; increasing sanitizing of high-touch areas; and implementing social distancing. In partnership with the Information Technology Services Branch, team members whose processes can be performed offsite were provided remote access.
The Business Continuity Plan (BCP) update for 31 division BCPs is in progress; and the CalOES Checklist for the Enterprise Plan will be submitted in January 2022.
Previous reports mentioned that a Return to Office Plan (RTOP) was distributed to the enterprise, including, state and county guidance and best practice to create a safe environment for our team members when they return to campus, as well as keep team members currently working on campus safe. The plan included how to maintain a healthy building, protective supplies available to team members, and guidance for team members when onsite.
Second Quarter Report - Key Performance Indicators Page 83 of 123

The Human Resources Division (HRSD) recently updated the Covid-19 Prevention Plan (CPP). The CPP includes procedures to ensure the health and safety of all team members and visitors. With recommendation from the Legal Office and HRSD with approval from the OSSD leadership team, the RTOP will no longer be updated in favor of the more comprehensive CPP.
Second Quarter Report - Key Performance Indicators Page 84 of 123
2021-22 Key Performance Indicator Summary (Quarter 2)
KPI Title: Lean Adoption
Executive Owner: Doug Hoffner
Outcome Measure: Efficient & Effective Organization
Core Process: Compliance & Managing Risks
Status: At-Risk
Numeric Status: 3.0
Description: Lean is a continuous business process improvement approach to reduce waste and
increase value to customers. This KPI measures factors that impact the adoption of Lean, including training participation, leadership support, team engagement, Lean practice and application, strategic alignment, and process improvement results.
As Lean continues to expand throughout the organization, we may identify additional factors to further measure adoption.
Baseline: As of June 2020, the overall adoption score was 2.9 out of 5.0. Target: Overall adoption score of 3.3 by June 30, 2022 Refresh Frequency: Semi-Annually, Quarter 2 and Quarter 4 Reporting Range: 7/31/21- 12/31/21 Thresholds: On-Target: At or above 0.1 increase in overall adoption score per 6 months At-Risk: No increase in overall adoption score per 6 months Off-Target: Decrease in adoption score per 6 months
Status Narrative:
The Lean Adoption score was unchanged from December 2020 to December 2021. CalPERS continues to train the enterprise in Lean fundamentals and 61% of CalPERS team is trained. Various areas across the enterprise continue to implement process improvements and awareness of the Lean Community of Practice has increased since June 2021. CalPERS will continue to engage team members to improve processes and further expand the adoption of Lean.
Second Quarter Report - Key Performance Indicators Page 85 of 123
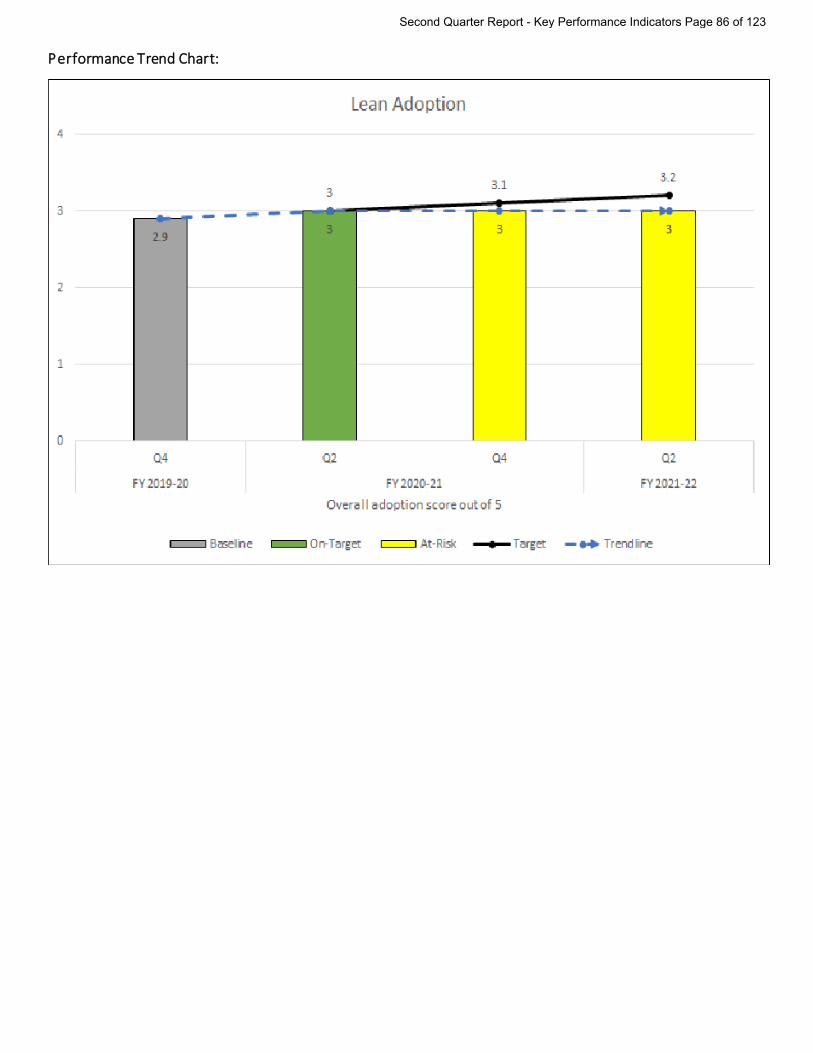
Performance Trend Chart:
Second Quarter Report - Key Performance Indicators Page 86 of 123

2021-22 Key Performance Indicator Summary (Quarter 2)
KPI Title: Employers Current on CalPERS Health Obligations
Executive Owner: Michael Cohen
Outcome Measure: Efficient & Effective Organization
Core Process: Compliance & Managing Risks
Status: On-Target
Numeric Status: 98.96%
Description: Public Agency employers are required to pay health contributions by the 10th business
day of the month. If employers do not pay timely they are subject to penalties and will be contacted by the Member and Health Collections Unit. Continued failure to pay will result in cancelled benefits. This KPI reflects the percentage of Public Agency employers that are current.
Baseline: 97.6% of Public Agency employers are current on their health obligations (July –
September 2018 timeframe) Target: The target is for 100% of Public Agency employers to be current on all CalPERS health
contributions Refresh Frequency: Quarterly Reporting Range: 10/01/2021 – 12/31/2021 Thresholds: On-Target: 95 – 100% of Public Agency employers are current At-Risk: 90 – 94% of Public Agency employers are current Off-Target: Less than 89% of Public Agency employers are currentStatus Narrative:
As of December 2021, 98.96% of Public Agency employers are current on their CalPERS health obligations.
Second Quarter Report - Key Performance Indicators Page 87 of 123
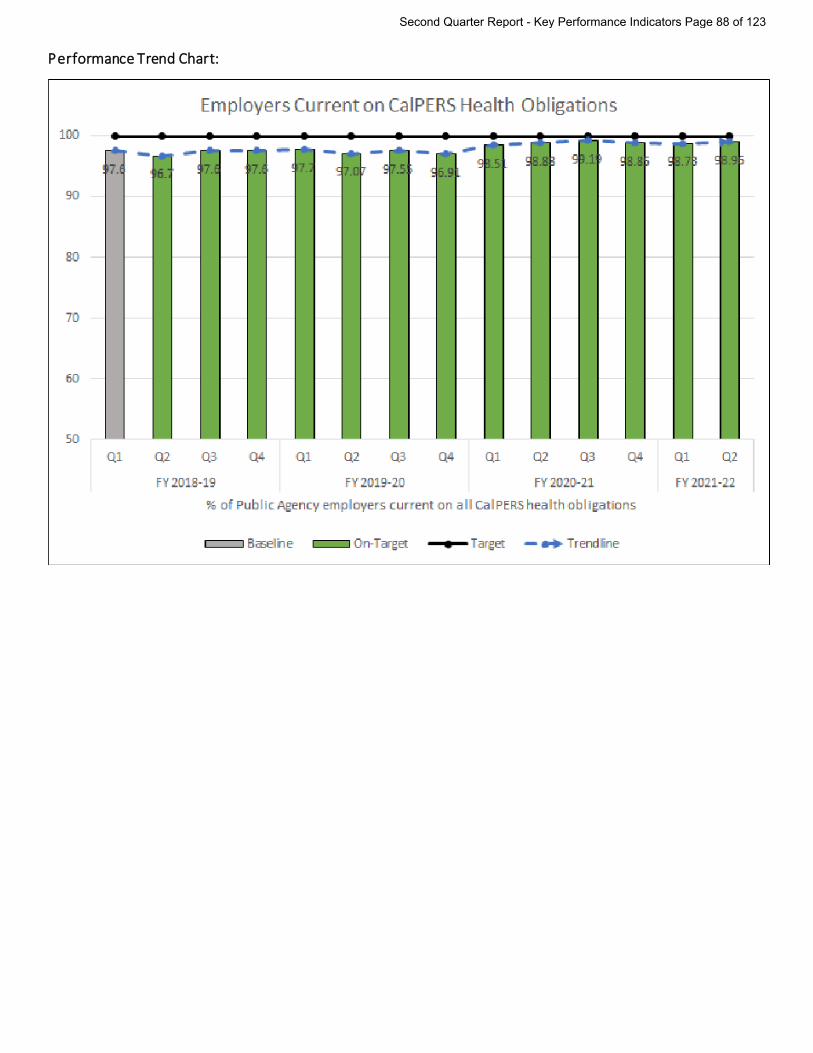
Performance Trend Chart:
Second Quarter Report - Key Performance Indicators Page 88 of 123

2021-22 Key Performance Indicator Summary (Quarter 2)
KPI Title: Employers Current on CalPERS Pension Obligations
Executive Owner: Michael Cohen
Outcome Measure: Efficient & Effective Organization
Core Process: Compliance & Managing Risks
Status: On-Target
Numeric Status: 98.8%
Description: The positive proportion of employers that are current on their CalPERS obligations
ensures fulfillment of the employer’s contractual and statutory responsibilities when participating in CalPERS’ pension programs.
Baseline: 98% of employers are current on their CalPERS pension obligations based on the
September FAC Reporting on Participating Employers Target: 100% of employers are current on all CalPERS pension obligations Refresh Frequency: Quarterly Reporting Range: 10/01/2021 – 12/31/2021 Thresholds: On-Target: 85 – 100% of employers current At-Risk: 60 – 84% of employers current Off-Target: 59% or less of employers currentStatus Narrative:
As of December 2021, 98.8% of employers are current on their CalPERS pension obligations.
Second Quarter Report - Key Performance Indicators Page 89 of 123
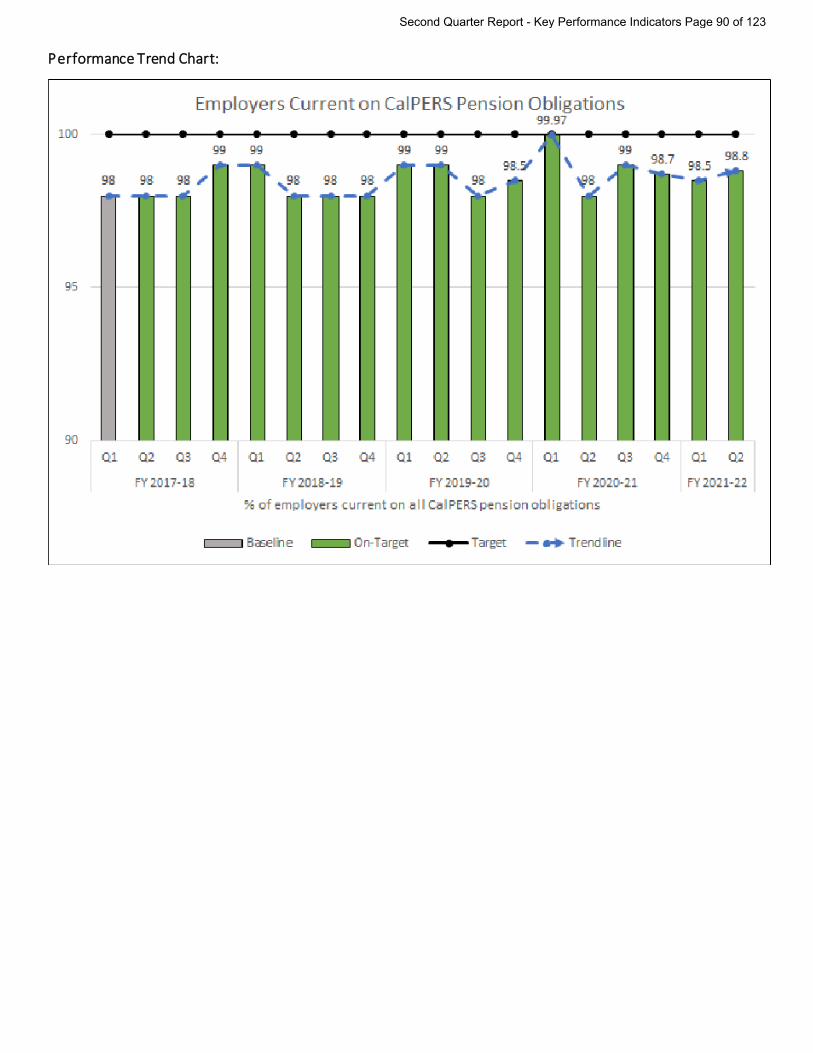
Performance Trend Chart:
Second Quarter Report - Key Performance Indicators Page 90 of 123

2021-22 Key Performance Indicator Summary (Quarter 2)
KPI Title: Member Self-Service Fraud Resulting in Financial Loss – Closed Session
Executive Owner: Matt Jacobs
Outcome Measure: Efficient & Effective Organization
Core Process: Compliance & Managing Risks
Status: Information to be provided in Closed Session
Second Quarter Report - Key Performance Indicators Page 91 of 123
2021-22 Key Performance Indicator Summary (Quarter 2)
KPI Title: Unauthorized Member Self-Service Account Changes – Closed Session
Executive Owner: Matt Jacobs
Outcome Measure: Efficient & Effective Organization
Core Process: Compliance & Managing Risks
Status: Information to be provided in Closed Session
Second Quarter Report - Key Performance Indicators Page 92 of 123
2021-22 Key Performance Indicator Summary (Quarter 2)
KPI Title: Time to Detect Cyber Security Threats – Closed Session
Executive Owner: Matt Jacobs
Outcome Measure: Efficient & Effective Organization
Core Process: Compliance & Managing Risks
Status: Information to be provided in Closed Session
Second Quarter Report - Key Performance Indicators Page 93 of 123
2021-22 Key Performance Indicator Summary (Quarter 2)
KPI Title: Reportable Privacy Violations – Closed Session
Executive Owner: Matt Jacobs
Outcome Measure: Efficient & Effective Organization
Core Process: Compliance & Managing Risks
Status: Information to be provided in Closed Session
Second Quarter Report - Key Performance Indicators Page 94 of 123
2021-22 Key Performance Indicator Summary (Quarter 2)
KPI Title: Small Business Requirements Compliance
Executive Owner: Doug Hoffner
Outcome Measure: Efficient & Effective Organization
Core Process: Purchasing & Acquisition
Status: Pending Refresh (in September 2022)
Numeric Status: 25.51% (as of September 2021)
Description: This KPI is focused on ensuring compliance pertaining to Small Business (SB) laws, rules &
regulations. All State Agencies must comply with the California State Law by meeting the target of 25% SB participation for total contracting dollars. If CalPERS is not successful in meeting these numbers for three straight fiscal years, this could impact its ability to continue to run its own SB program.
Baseline: The baseline, which reflects Fiscal Year 17/18 participation, is 25.04% SB of total
contracting dollars. Target: The target is to have 25% SB or greater participation for total contracting dollars. Refresh Frequency: Annually, September Reporting Range: FY 2020-21 Thresholds: On-Target: 25% and above At-Risk: 22.5% - 24.99% Off-Target: Below 22.5%
Status Narrative:
This KPI was On-Target as of September 2021. CalPERS achieved 25.51% Small Business participation level for FY 2020-21, eclipsing the target of a 25% participation by .51%
Second Quarter Report - Key Performance Indicators Page 95 of 123

Performance Trend Chart:
Second Quarter Report - Key Performance Indicators Page 96 of 123
2021-22 Key Performance Indicator Summary (Quarter 2)
KPI Title: Disabled Veterans Business Enterprise Requirements Compliance
Executive Owner: Doug Hoffner
Outcome Measure: Efficient & Effective Organization
Core Process: Purchasing & Acquisition
Status: Pending Refresh (in September 2022)
Numeric Status: 5.20% (as of September 2021)
Description: This KPI is focused on ensuring compliance pertaining to Disabled Veterans Business
Enterprise (DVBE) laws, rules & regulations. All State Agencies must comply with the California State Law by meeting the target of 3% DVBE participation for total contracting dollars. If CalPERS is not successful in meeting these numbers for three straight fiscal years, this could impact its ability to continue to run its own DVBE program.
Baseline: The baseline, which reflects Fiscal Year 17/18 participation, 3.09% DVBE of total
contracting dollars. Target: The target is to have 3% DVBE or greater participation for total contracting dollars Refresh Frequency: Annually, September Reporting Range: FY 2020-21 Thresholds: On-Target: 3% and above At-Risk: 2.7% - 2.99% Off-Target: Below 2.7%
Status Narrative:
This KPI was On-Target as of September 2021. CalPERS achieved a 5.20% participation level with DVBEs for FY 2020-21, eclipsing the target of 3% participation by 2.20%.
Second Quarter Report - Key Performance Indicators Page 97 of 123

Performance Trend Chart:
Second Quarter Report - Key Performance Indicators Page 98 of 123

2021-22 Key Performance Indicator Summary (Quarter 2)
KPI Title: Solicitation, Contract, Amendment & Purchase Order Service Level Compliance
Executive Owner: Doug Hoffner
Outcome Measure: Efficient & Effective Organization
Core Process: Purchasing & Acquisition
Status: Pending Refresh (in September 2022)
Numeric Status: 82% (as of September 2021)
Description: This KPI ensures Operations Support Services Division (OSSD) and Program areas meet
service level agreements (SLA) for CalPERS issued solicitations, contracts, amendments and Purchase Orders (PO). Meeting Solicitation SLAs are vital to ensuring CalPERS programs continue to do their job for the members. If SLAs are not met for contracts or amendments this can significantly impact CalPERS program areas completing work for their members. Goods cannot be delivered nor, can services begin until a contract, amendment, or PO is executed.
Baseline: The baseline reflects FY 2017-18 information as a combined average of 86% for
solicitations, contracts, amendments and purchase orders Target: The target is to achieve 100% solicitation, contract, amendment and purchase order
service level compliance Refresh Frequency: Annually, September Reporting Range: FY 2020-21 Thresholds: On-Target: 91% or greater At-Risk: 81% - 90% Off-Target: 80% or lower
Status Narrative:
OSSD met the SLA for solicitations, contracts, amendments, and purchase orders 82% of the time as a combined average for FY 2020-21; the combined average was down 9% from FY 2019-20. Contributing factors to the decreased percentage were the OSSD contracts and procurement section experienced an 88% turnover in team leadership over the FY due to promotional opportunities within the division, and lateral transfers to promote cross functional development opportunities within OSSD and a retirement election. In addition, the team experienced a 14% increase in expedited contract and purchase order requests (67 requests in FY 19-20 to 80 requests in FY 20-21) and a 44% increase in solicitations (5 solicitations in FY 19-20 to 9 solicitations in FY 20-21). Improvement efforts have already been implemented to improve SLA performance, the procurement team completed a LEAN process improvement business initiative with PRDA in June 2021 and the contracts team is
Second Quarter Report - Key Performance Indicators Page 99 of 123

on target to complete its 18-month LEAN process improvement business initiative with PRDA in December of 2021. As a result of these LEAN efforts, contract and procurement processes, procedures, and SLAs will be reviewed and modified as needed using LEAN methodology. For example, PRDA is currently reviewing the contract SLA, which has not been updated in over a decade, to ensure performance reporting accuracy. The contract and procurement sections are now fully staffed, trained, and poised to increase the percentage in which it meets its SLA in FY 2021-22.
Second Quarter Report - Key Performance Indicators Page 100 of 123

Performance Trend Chart:
Second Quarter Report - Key Performance Indicators Page 101 of 123
2021-22 Key Performance Indicator Summary (Quarter 2)
KPI Title: Team Member Perception of Leadership: Manager Relationships
Executive Owner: Doug Hoffner
Outcome Measure: Supportive and Engaged Leadership
Core Process: Attracting & Supporting Team Members
Status: Off-Target
Numeric Status: N/A
Description: The annual Employee Engagement Survey will help us ensure we continue to measure
how team members perceive their relationship with their direct managers. The annual Employee Engagement Survey captured team members’ perceptions of leadership for Manager Relationships. CalPERS is committed to ensuring accessibility to all of our team members. The Employee Engagement vendor used from 2017-2019, McLean & Company, did not meet the CalPERS Web Content Accessibility Guidelines (WCAG) and they had no immediate plans to make the content accessible. Our new survey vendor, Perceptyx, meets these guidelines, offers advanced technology and innovative tools such as a dashboard with survey results and action planning framework. With this transition, the baseline results reported to the Board will change. Perceptyx uses a 5-point rating scale whereas the previous vendor used a 6-point rating scale which means the results for the survey will not be directly compared with previous years’ results. The 5-point scale has the benefits of making it easier for survey participants to respond more quickly, enhances the comparability of scores with peers, and utilizes industry best practices to differentiate employee sentiment. To help mitigate the impact of not having a direct comparison of years, we have included the trend chart results from the previous survey and created a new trend chart tracking the new survey results in the summary sheet. We have also updated the title of the KPI to match the category within the survey for ease of reference.
Baseline: 85.7% positive survey score for team member perception of Manager Relationships as of
10/2020 Target: 59% or higher positive survey score represents high performance Refresh Frequency: Annually, December Reporting Range: November 2019 – October 2020
Second Quarter Report - Key Performance Indicators Page 102 of 123

Thresholds: On-Target: Above 59% represents high performance At-Risk: 40 – 59% represents average performance Off-Target: Under 40% represents low performance
Status Narrative:
This KPI is Off-Target because the annual Employee Engagement survey was paused in 2021 to allow the CalPERS team time to transition back to an office-centric work schedule before gathering engagement data.
Performance Trend Chart:
85.7
59
50
60
70
80
90
100
2020 2021
% of team members who responded positively to manager relationships
Team Member Perception of Leadership - Manager Relationships
Baseline Target
Second Quarter Report - Key Performance Indicators Page 103 of 123
2021-22 Key Performance Indicator Summary (Quarter 2)
KPI Title: Health of Enterprise Performance Reporting (EPR) Framework
Executive Owner: Doug Hoffner
Outcome Measure: Supportive & Engaged Leadership
Core Process: Managing Resources & Performance
Status: Pending Refresh (in June 2022)
Numeric Status: 91.2% (for FY 2020-21)
Description: The Enterprise Performance Reporting KPI provides a comprehensive view of the health
of CalPERS as it pertains to our strategic efforts and operational processes. This KPI will include the health of Strategic Measures, Business Plan Initiatives, and KPIs, but will exclude all indicators that are under development or informational.
Baseline: For FY 2018-19, 89.7% of our Strategic Measures, Business Plan Initiatives, and KPIs are in
a healthy status (On-Target) Target: 85% or greater of all EPR components that are in a healthy status (On-Target). Refresh Frequency: Annually, June Reporting Range: FY 2020-21 Thresholds: On-Target: 85% + At-Risk: 80 – 84.9% Off-Target: Below 80%Status Narrative:
This KPI was On-Target for the current reporting period with 91.2% of the Strategic Measures, Business Plan Initiatives and Key Performance Indicators reporting in a healthy status (On-Target) for FY 2020-21.
Second Quarter Report - Key Performance Indicators Page 104 of 123
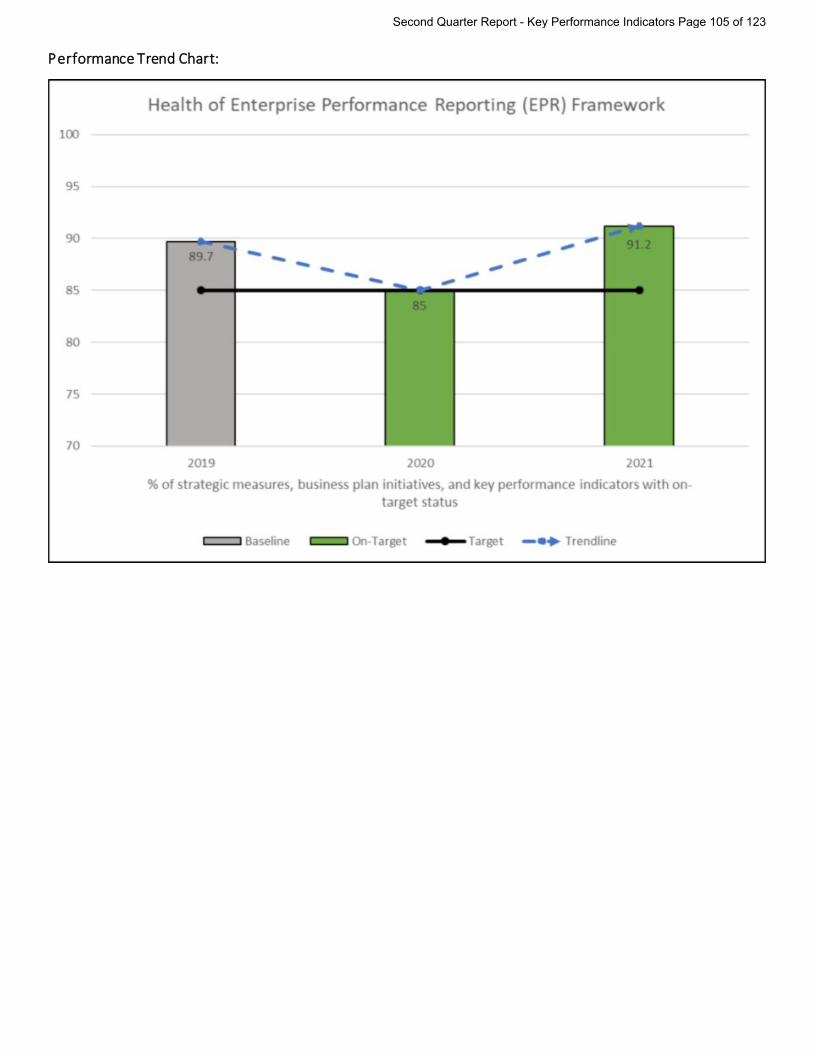
Performance Trend Chart:
Second Quarter Report - Key Performance Indicators Page 105 of 123
2021-22 Key Performance Indicator Summary (Quarter 2)
KPI Title: Average Time to Hire for Hard to Recruit Positions
Executive Owner: Doug Hoffner
Outcome Measure: Team Member Engagement
Core Process: Attracting & Supporting Team Members
Status: Pending Refresh (in September 2022)
Numeric Status: 90% (for FY 2020-21)
Description: This KPI measures the average time to hire for those defined as hard-to-recruit positions.
Time measured starts when the recruitment request is submitted to the Human Resources Division (HRSD) until the time an official job offer is accepted by the candidate.
Baseline: 75% with the average time to hire being 70 days as of 6/30/18. Target: 70% of hard-to-recruit positions filled within 120 days of recruitment initiation. The
target and thresholds may be adjusted after we begin measuring all hard-to-recruit positions enterprise-wide, beginning FY 2019-20.
Refresh Frequency: Annually, September Reporting Range: FY 2020-21 Thresholds: On-Target: 70% at 120 days At-Risk: 55% to 69% at 120 days Off-Target: 54% and below at 120 days
Status Narrative:
As of September 2021, this KPI reported at 90% and was On-Target. The data consists of all hard-to-recruit positions for FY 2020-21. This includes those from previous data collections to encompass those outside leadership positions and includes all hard-to-recruit for positions enterprise wide.
Second Quarter Report - Key Performance Indicators Page 106 of 123
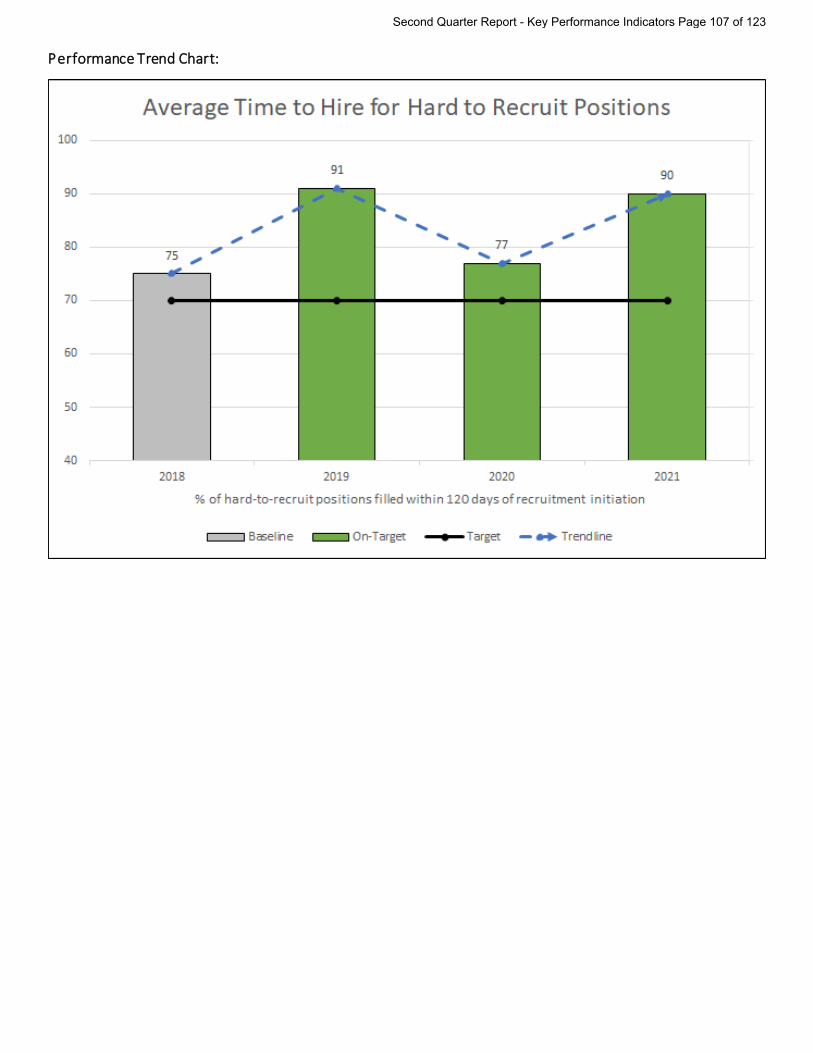
Performance Trend Chart:
Second Quarter Report - Key Performance Indicators Page 107 of 123
2021-22 Key Performance Indicator Summary (Quarter 2)
KPI Title: Retention Rate – INFORMATIONAL
Executive Owner: Doug Hoffner
Outcome Measure: Team Member Engagement
Core Process: Attracting & Supporting Team Members
Status: Not Applicable as KPI is Informational
Numeric Status: N/A
Description: This is an overview of CalPERS retention rate. We have researched best practices and
evaluated existing data towards establishing a baseline for measurement and breakdowns for reporting retention. A review of employee retention on an annual basis involves identifying trends for areas where we have success, as well as areas where we may be experiencing challenges.
We do not set a target for a minimum or maximum amount of hires, transfers, promotions, discharges, etc.
Baseline: Not applicable as KPI is Informational Target: Not applicable as KPI is Informational Refresh Frequency: Annually, December Reporting Range: FY 2020-21 Thresholds: Not applicable as KPI is Informational
Status Narrative:
The Retention Rate for Fiscal Year (FY) 20-21 was 92.3%. The historical CalPERS Retention Rates over the prior 3 FYs ranged from 91.2% - 91.6%. This increase in overall retention of CalPERS team members may be attributed to a pandemic-related work climate, decreased job opportunities, and the ability to better accommodate work-life demands in a hybrid work environment.
Second Quarter Report - Key Performance Indicators Page 108 of 123
2021-22 Key Performance Indicator Summary (Quarter 2)
KPI Title: Recognition Perceptions
Executive Owner: Doug Hoffner
Outcome Measure: Team Member Engagement
Core Process: Attracting & Supporting Team Members
Status: Off-Target
Numeric Status: N/A
Description: Respecting and appreciating our employees for their contributions to the organization is
integral to living our Core Values. Continuous recognition of employee accomplishments and behaviors is also one of the most effective ways to reinforce organizational values, support business objectives, and retain motivated, high-performing employees. To this end, we will seek opportunities to provide our people with meaningful recognition on a consistent and ongoing basis that encourages them to be their very best, to grow and learn, and enjoy themselves in the process. Also seek recognition that is fun, memorable, appreciates the everyday, honors the exceptional, and celebrates successes. Such recognition will be sincere, specific, timely and fit the individual or team, as well as the accomplishment.
The annual Employee Engagement survey captures team members’ perceptions of recognition.
CalPERS is committed to ensuring accessibility to all of our team members. The Employee Engagement vendor used from 2017-2019, McLean & Company, did not meet the CalPERS Web Content Accessibility Guidelines (WCAG) and they had no immediate plans to make the content accessible.
Our new survey vendor, Perceptyx, meets these guidelines, offers advanced technology and innovative tools such as a dashboard with survey results and action planning framework. With this transition, the baseline results reported to the Board will change. Perceptyx uses a 5-point rating scale whereas the previous vendor used a 6-point rating scale which means the results for the survey will not be directly compared with previous years’ results. The 5-point scale has the benefits of making it easier for survey participants to respond more quickly, enhances the comparability of scores with peers, and utilizes industry best practices to differentiate employee sentiment. To help mitigate the impact of not having a direct comparison of years, we have included the trend chart results from the previous survey and created a new trend chart tracking the new survey results in the summary sheet.
Baseline: 79.2% positive survey score for recognition perception as of 10/2020. Target: 59% or higher positive survey score represents high performance
Second Quarter Report - Key Performance Indicators Page 109 of 123
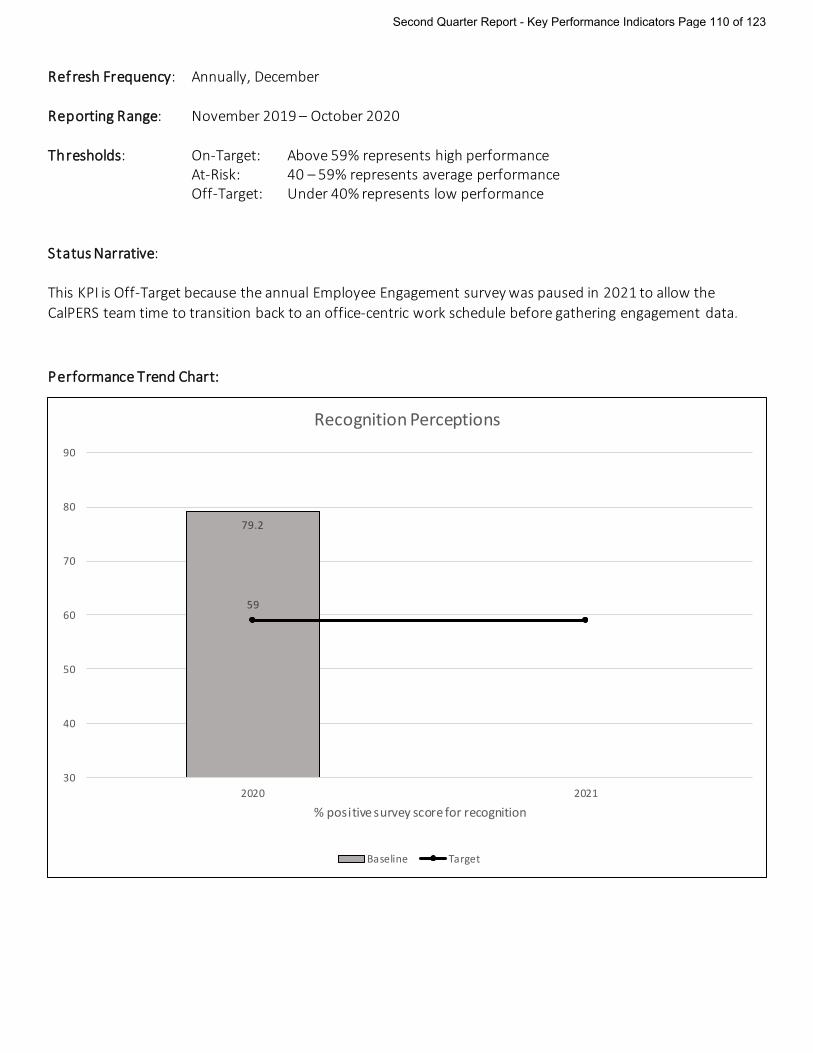
Refresh Frequency: Annually, December Reporting Range: November 2019 – October 2020 Thresholds: On-Target: Above 59% represents high performance At-Risk: 40 – 59% represents average performance Off-Target: Under 40% represents low performance
Status Narrative:
This KPI is Off-Target because the annual Employee Engagement survey was paused in 2021 to allow the CalPERS team time to transition back to an office-centric work schedule before gathering engagement data.
Performance Trend Chart:
79.2
59
30
40
50
60
70
80
90
2020 2021
% positive survey score for recognition
Recognition Perceptions
Baseline Target
Second Quarter Report - Key Performance Indicators Page 110 of 123
2021-22 Key Performance Indicator Summary (Quarter 2)
KPI Title: Employee Empowerment Perceptions
Executive Owner: Doug Hoffner
Outcome Measure: Team Member Engagement
Core Process: Attracting & Supporting Team Members
Status: Off-Target
Numeric Status: N/A
Description: There is a return on investment for work life balance programs-such return is typically
realized through employee attendance, lower health care costs, lower workers’ compensation cost, increased productivity, and reduced employee turnover. It is important CalPERS promotes work life balance, demonstrating commitment to team members. The prior Work Life Balance perceptions is now captured under Employee Empowerment which aligns with the new engagement survey vendor category.
The annual Employee Engagement survey captures team members’ perceptions of
employee empowerment. CalPERS is committed to ensuring accessibility to all of our team members. The Employee
Engagement vendor used from 2017-2019, McLean & Company, did not meet the CalPERS Web Content Accessibility Guidelines (WCAG) and they had no immediate plans to make the content accessible.
Our new survey vendor, Perceptyx, meets these guidelines, offers advanced technology and innovative tools such as a dashboard with survey results and action planning framework. With this transition, the baseline results reported to the Board will change. Perceptyx uses a 5-point rating scale whereas the previous vendor used a 6-point rating scale which means the results for the survey will not be directly compared with previous years’ results. The 5-point scale has the benefits of making it easier for survey participants to respond more quickly, enhances the comparability of scores with peers, and utilizes industry best practices to differentiate employee sentiment. To help mitigate the impact of not having a direct comparison of years, we have included the trend chart results from the previous survey and created a new trend chart tracking the new survey results in the summary sheet. We have also updated the title of the KPI to match the category within the survey for ease of reference.
Baseline: 75.2% positive survey score for work life balance perception as of 10/2020. Target: 59% or higher positive survey score represents high performance Refresh Frequency: Annually, December Reporting Range: November 2019 – October 2020
Second Quarter Report - Key Performance Indicators Page 111 of 123

Thresholds: On-Target: Above 59% represents high performance At-Risk: 40 – 59% represents average performance Off-Target: Under 40% represents low performance
Status Narrative:
This KPI is Off-Target because the annual Employee Engagement survey was paused in 2021 to allow the CalPERS team time to transition back to an office-centric work schedule before gathering engagement data.
Performance Trend Chart:
75.2
59
40
50
60
70
80
2020 2021
% positive survey score for employee empowerment perceptions
Employee Empowerment Perceptions
Baseline Target
Second Quarter Report - Key Performance Indicators Page 112 of 123

2021-22 Key Performance Indicator Summary (Quarter 2)
KPI Title: Team Member Perception of Growth and Development
Executive Owner: Doug Hoffner
Outcome Measure: Team Member Engagement
Core Process: Attracting & Supporting Team Members
Status: Off-Target
Numeric Status: N/A
Description: The annual Employee Engagement survey will help us ensure we continue to measure
and capture how team members perceive CalPERS growth and development. CalPERS is committed to ensuring accessibility to all of our team members. The Employee
Engagement vendor used from 2017-2019, McLean & Company, did not meet the CalPERS Web Content Accessibility Guidelines (WCAG) and they had no immediate plans to make the content accessible.
Our new survey vendor, Perceptyx, meets these guidelines, offers advanced technology
and innovative tools such as a dashboard with survey results and action planning framework. With this transition, the baseline results reported to the Board will change. Perceptyx uses a 5-point rating scale whereas the previous vendor used a 6-point rating scale which means the results for the survey will not be directly compared with previous years’ results. The 5-point scale has the benefits of making it easier for survey participants to respond more quickly, enhances the comparability of scores with peers, and utilizes industry best practices to differentiate employee sentiment. To help mitigate the impact of not having a direct comparison of years, we have included the trend chart results from the previous survey and created a new trend chart tracking the new survey results in the summary sheet. We have also updated the title of the KPI to match the category within the survey for ease of reference.
Baseline: 76.5% positive survey score for team member perception of growth and development as of 10/2020.
Target: 59% or higher positive survey score represents high performance Refresh Frequency: Annually, December Reporting Range: November 2019 – October 2020 Thresholds: On-Target: Above 59% represents high performance At-Risk: 40 – 59% represents average performance Off-Target: Under 40% represents low performance
Second Quarter Report - Key Performance Indicators Page 113 of 123
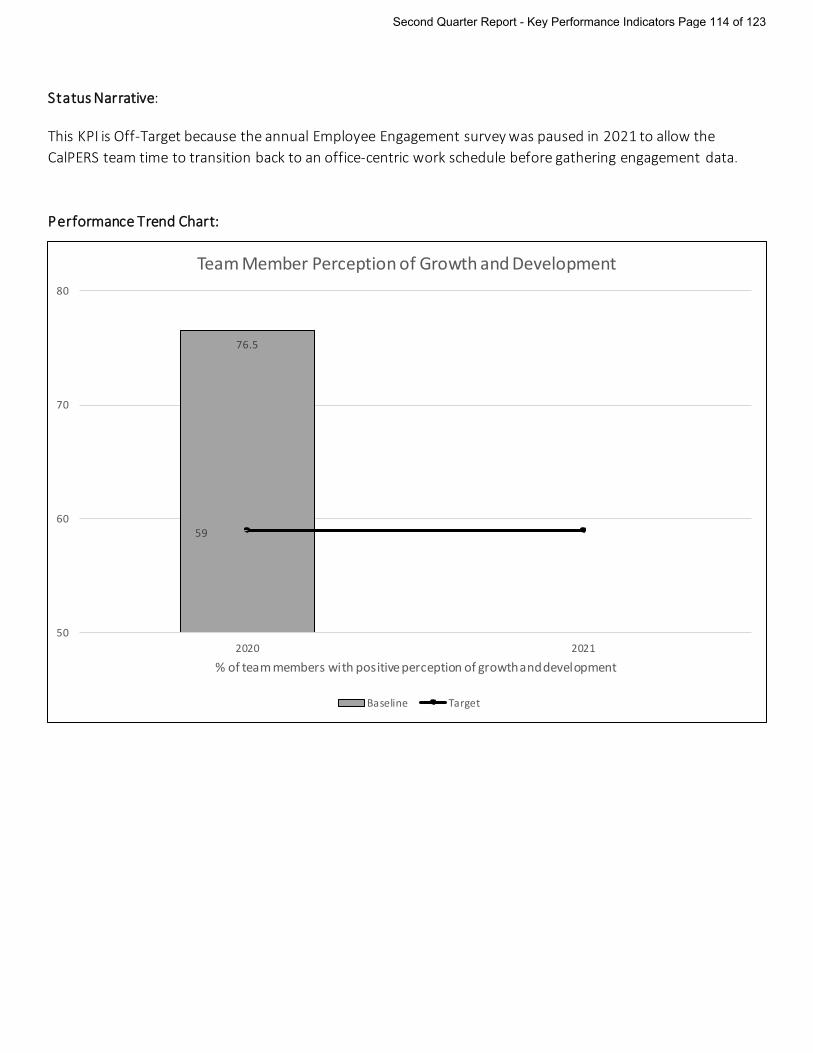
Status Narrative:
This KPI is Off-Target because the annual Employee Engagement survey was paused in 2021 to allow the CalPERS team time to transition back to an office-centric work schedule before gathering engagement data.
Performance Trend Chart:
76.5
59
50
60
70
80
2020 2021
% of team members with positive perception of growth and development
Team Member Perception of Growth and Development
Baseline Target
Second Quarter Report - Key Performance Indicators Page 114 of 123

2021-22 Key Performance Indicator Summary (Quarter 2)
KPI Title: Response Rate of Employee Engagement Survey
Executive Owner: Doug Hoffner
Outcome Measure: Team Member Engagement
Core Process: Attracting & Supporting Team Members
Status: Off-Target
Numeric Status: N/A
Description: This KPI will capture survey response rate of team members. The annual Employee
Engagement survey will help us ensure that we continue to foster a culture where engaging behaviors are part of our daily interactions and practices.
CalPERS is committed to ensuring accessibility to all of our team members. The Employee
Engagement vendor used from 2017-2019, McLean & Company, did not meet the CalPERS Web Content Accessibility Guidelines (WCAG) and they had no immediate plans to make the content accessible.
Our new survey vendor, Perceptyx, meets these guidelines, offers advanced technology
and innovative tools such as a dashboard with survey results and action planning framework. With this transition, the baseline results reported to the Board will change. Perceptyx uses a 5-point rating scale whereas the previous vendor used a 6-point rating scale which means the results for the survey will not be directly compared with previous years’ results. The 5-point scale has the benefits of making it easier for survey participants to respond more quickly, enhances the comparability of scores with peers, and utilizes industry best practices to differentiate employee sentiment. To help mitigate the impact of not having a direct comparison of years, we have included the trend chart results from the previous survey and created a new trend chart tracking the new survey results in the summary sheet.
Baseline: 70% response rate of employees responded to the survey as of 10/2017. Target: 70% or higher positive survey score represents high performance Refresh Frequency: Annually, December Reporting Range: November 2019 – October 2020 Thresholds: On-Target: Above 59% represents high performance At-Risk: 40 – 59% represents average performance Off-Target: Under 40% represents low performance
Second Quarter Report - Key Performance Indicators Page 115 of 123
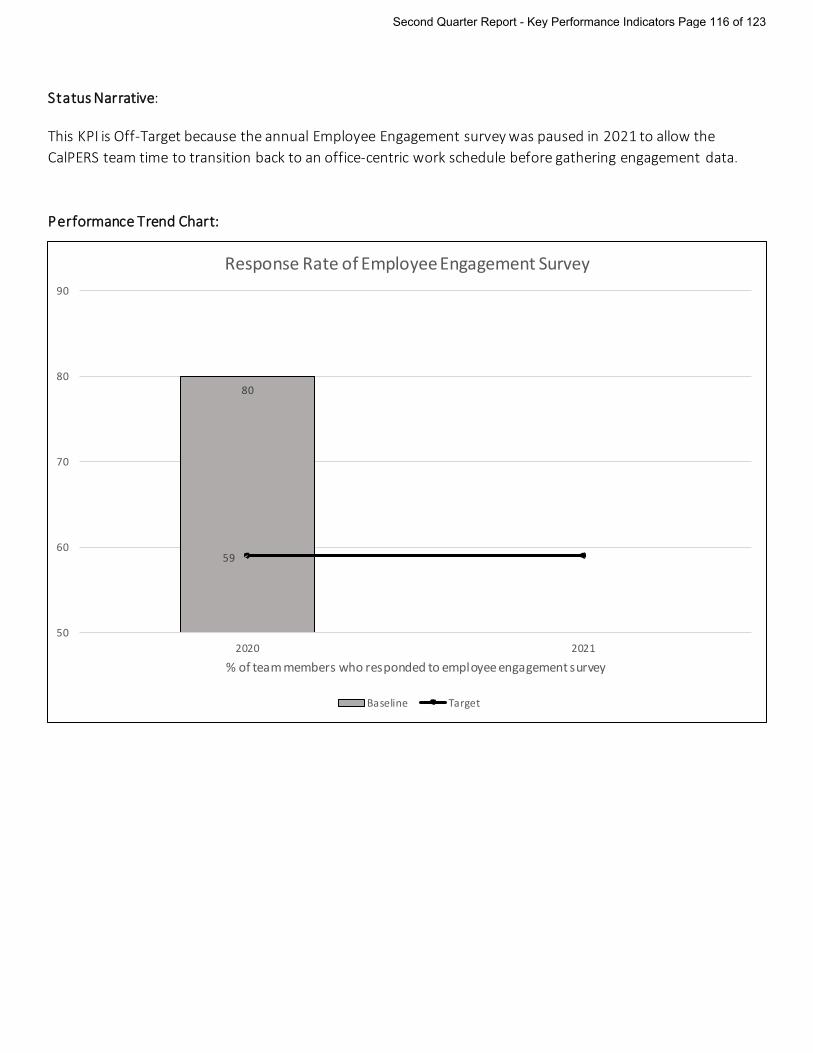
Status Narrative:
This KPI is Off-Target because the annual Employee Engagement survey was paused in 2021 to allow the CalPERS team time to transition back to an office-centric work schedule before gathering engagement data.
Performance Trend Chart:
80
59
50
60
70
80
90
2020 2021
% of team members who responded to employee engagement survey
Response Rate of Employee Engagement Survey
Baseline Target
Second Quarter Report - Key Performance Indicators Page 116 of 123
2021-22 Key Performance Indicator Summary (Quarter 2)
KPI Title: Emerging Leader Program – INFORMATIONAL
Executive Owner: Doug Hoffner
Outcome Measure: Team Member Engagement
Core Process: Attracting & Supporting Team Members
Status: Not Applicable as KPI is Informational
Numeric Status: N/A
Description: The Emerging Leader Program is a program that prepares high-potential team members
for a leadership role. The program targets journey-level analysts, technical, and professional staff to participate in a six-month learning program while they work in their current capacity.
Baseline: Not applicable as KPI is Informational Target: Not applicable as KPI is Informational Refresh Frequency: Annually, July Reporting Range: FY 2020-21 Thresholds: Not applicable as KPI is Informational
Status Narrative:
The Emerging Leader Program (ELP) was designed to offer CalPERS employees a way to bridge the learning and experience gap between journey-level classifications and first-line supervisor/manager classifications. After successful completion of the ELP pilot in 2018, the Human Resources Division (HRSD) implemented a second ELP cohort with 25 team members graduating in June 2019, a third cohort with 23 completing the program in June 2020, and 24 completing the fourth cohort in June 2021. Survey feedback consistently supports the value of the program and participant satisfaction. HRSD implemented a third ELP cohort of 25 participants in January 2020. Five (20%) received promotions while in the program. To date, 10 participants (40%) from the pilot, nine participants (40%) from the second cohort, and five participants (20%) from the third and fourth cohorts have received promotions for a cumulative program total of 34 participants (38%) receiving promotions. A fifth cohort is scheduled to begin in January of 2022
Second Quarter Report - Key Performance Indicators Page 117 of 123

2021-22 Key Performance Indicator Summary (Quarter 2)
KPI Title: 100% of all Ideas Responded to within 120 Days
Executive Owner: Doug Hoffner
Outcome Measure: Team Member Engagement
Core Process: Attracting & Supporting Team Members
Status: On-Target
Numeric Status: 100%
Description: Idea Factory is a CalPERS employee-driven innovation program, designed to inspire team
members to share ideas and solutions that will improve CalPERS. All ideas will be evaluated and scored based upon perceived business value and effort to implement by the Senior Leadership Council (SLC) and the outcome of the ideas will be shared with the organization via Inside CalPERS and Idea Factory Library. By considering and responding to each idea submitted through the program, it shows that leadership supports team members by being open to innovative thinking and continuous improvement.
Baseline: 100% as of 11/2017 Target: 100% of ideas submitted through Idea Factory will be responded to within 120 days of
ideas submission • Responded to: communicating the ideas’ evaluation outcome to the idea submitter
Refresh Frequency: Quarterly Reporting Range: 10/01/2021 – 12/31/2021 Thresholds: On-Target: 100% of ideas responded to within 120 days of idea submission At-Risk: 99% - 95% of ideas responded to within 120 days of idea submission Off-Target: 95% or less of ideas responded to within 120 days of idea submissionStatus Narrative:
This KPI is at 100% and is On-Target for the quarter.
Second Quarter Report - Key Performance Indicators Page 118 of 123
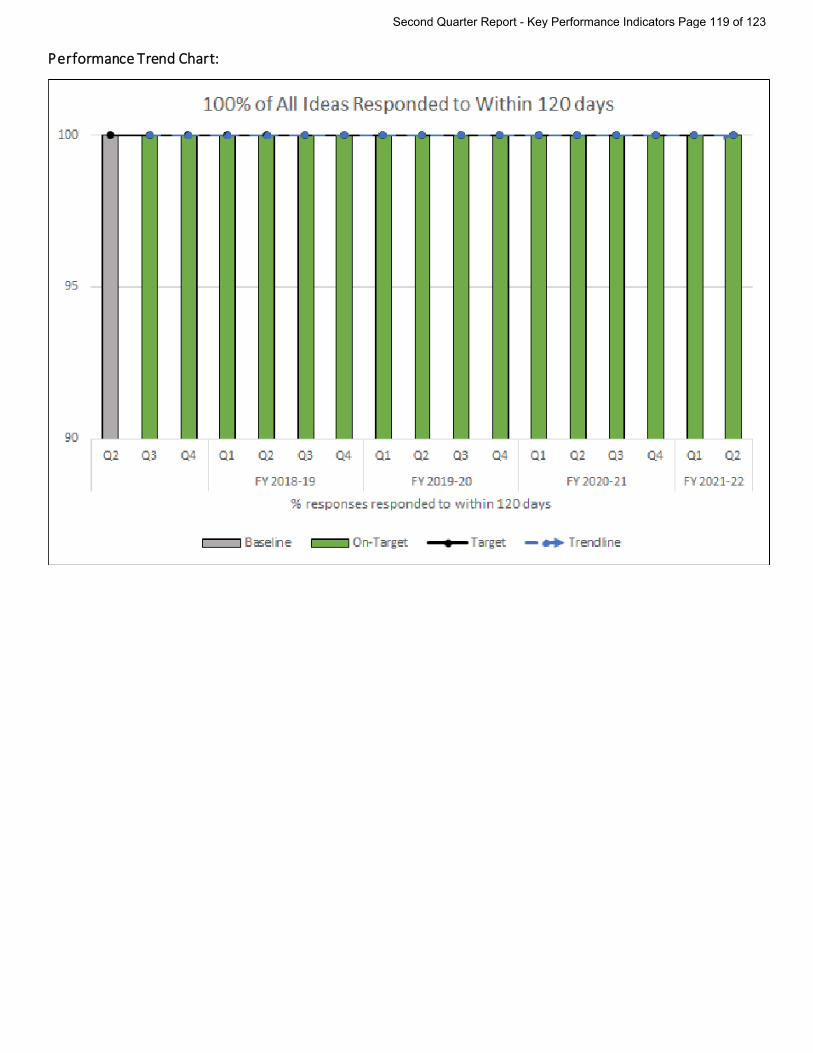
Performance Trend Chart:
Second Quarter Report - Key Performance Indicators Page 119 of 123
2021-22 Key Performance Indicator Summary (Quarter 2)
KPI Title: 80% of All Viable Ideas Implemented as Scheduled
Executive Owner: Doug Hoffner
Outcome Measure: Team Member Engagement
Core Process: Attracting & Supporting Team Members
Status: On-Target
Numeric Status: 100%
Description: Idea Factory is a CalPERS employee-driven innovation program, designed to inspire team
members to share ideas and solutions that will improve CalPERS. All ideas will be evaluated and scored based upon perceived business value and effort to implement by the Senior Leadership Council (SLC). Implementing ideas that are submitted through the program shows that leadership supports team members by being open to innovative thinking, values their ideas and solutions for continuous improvement, and encourages team member engagement.
Baseline: 100% as of 11/2017 Target: 80% of all viable ideas submitted through Idea Factory will be implemented as scheduled
• Viable idea: any idea that has been deemed feasible for implementation Refresh Frequency: Quarterly Reporting Range: 10/01/2021 – 12/31/2021 Thresholds: On-Target: 80% or more of all viable ideas are implemented as scheduled At-Risk: Less than 80% (50% - 79%) of all viable ideas are implemented as
scheduled Off-Target: Less than 50% of all viable ideas are implemented as scheduledStatus Narrative:
This KPI is at 100% and is On-Target for the quarter.
Second Quarter Report - Key Performance Indicators Page 120 of 123
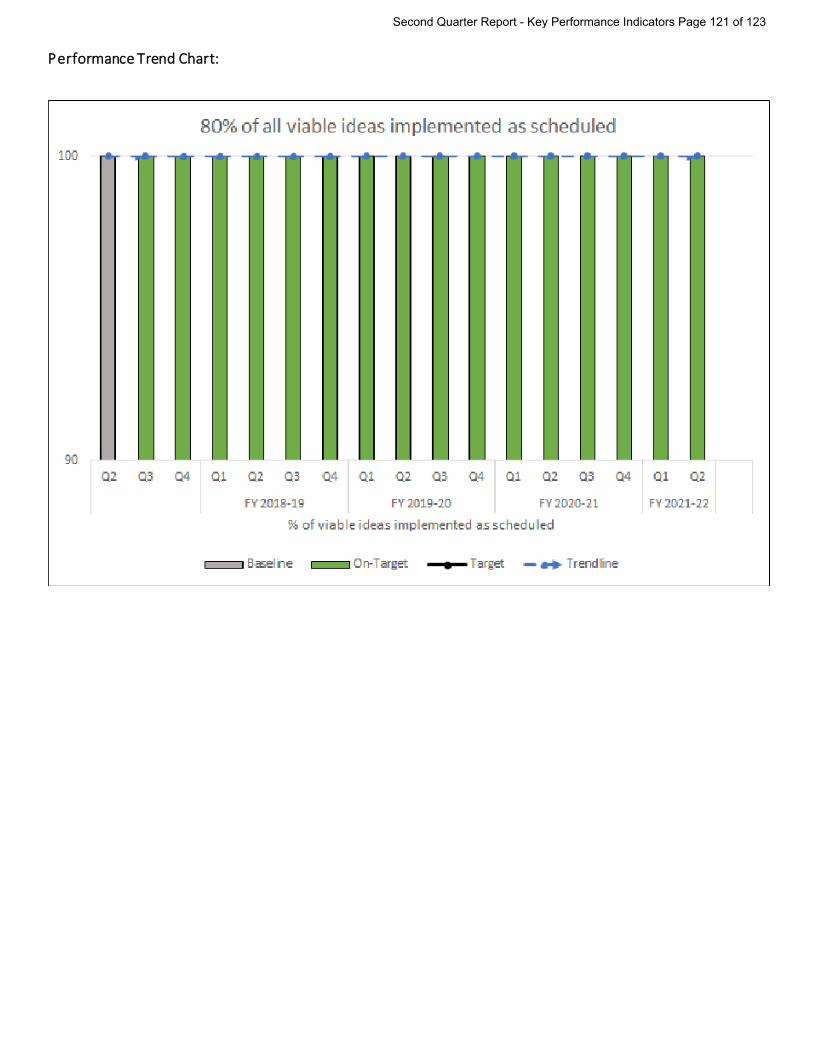
Performance Trend Chart:
Second Quarter Report - Key Performance Indicators Page 121 of 123

2021-22 Key Performance Indicator Summary (Quarter 2)
KPI Title: Our Promise and Annual Food Drive
Executive Owner: Brad Pacheco
Outcome Measure: Team Member Engagement
Core Process: Attracting & Supporting Team Members
Status: Not Applicable as KPI is Informational
Numeric Status: N/A
Description: Our goal is to gauge the level of outreach by cataloging our efforts to promote and
support the Our Promise and food drive campaigns.
Baseline: Not applicable as KPI is Informational Target: Not applicable as KPI is Informational Refresh Frequency: Annually, March
Reporting Range: 2021 fundraising efforts
Thresholds: Not applicable as KPI is Informational
Status Narrative:
The CalPERS team is participating in the virtual 2021 Our Promise campaign. CalPERS did not have an onsite Food Drive in 2021. Team members participated individually.
The 2021 Our Promise campaigns totals will not be known until March 2022.
Our Promise Totals
Number of Donors
Number of Employees
Percentage of Participation
Second Quarter Report - Key Performance Indicators Page 122 of 123
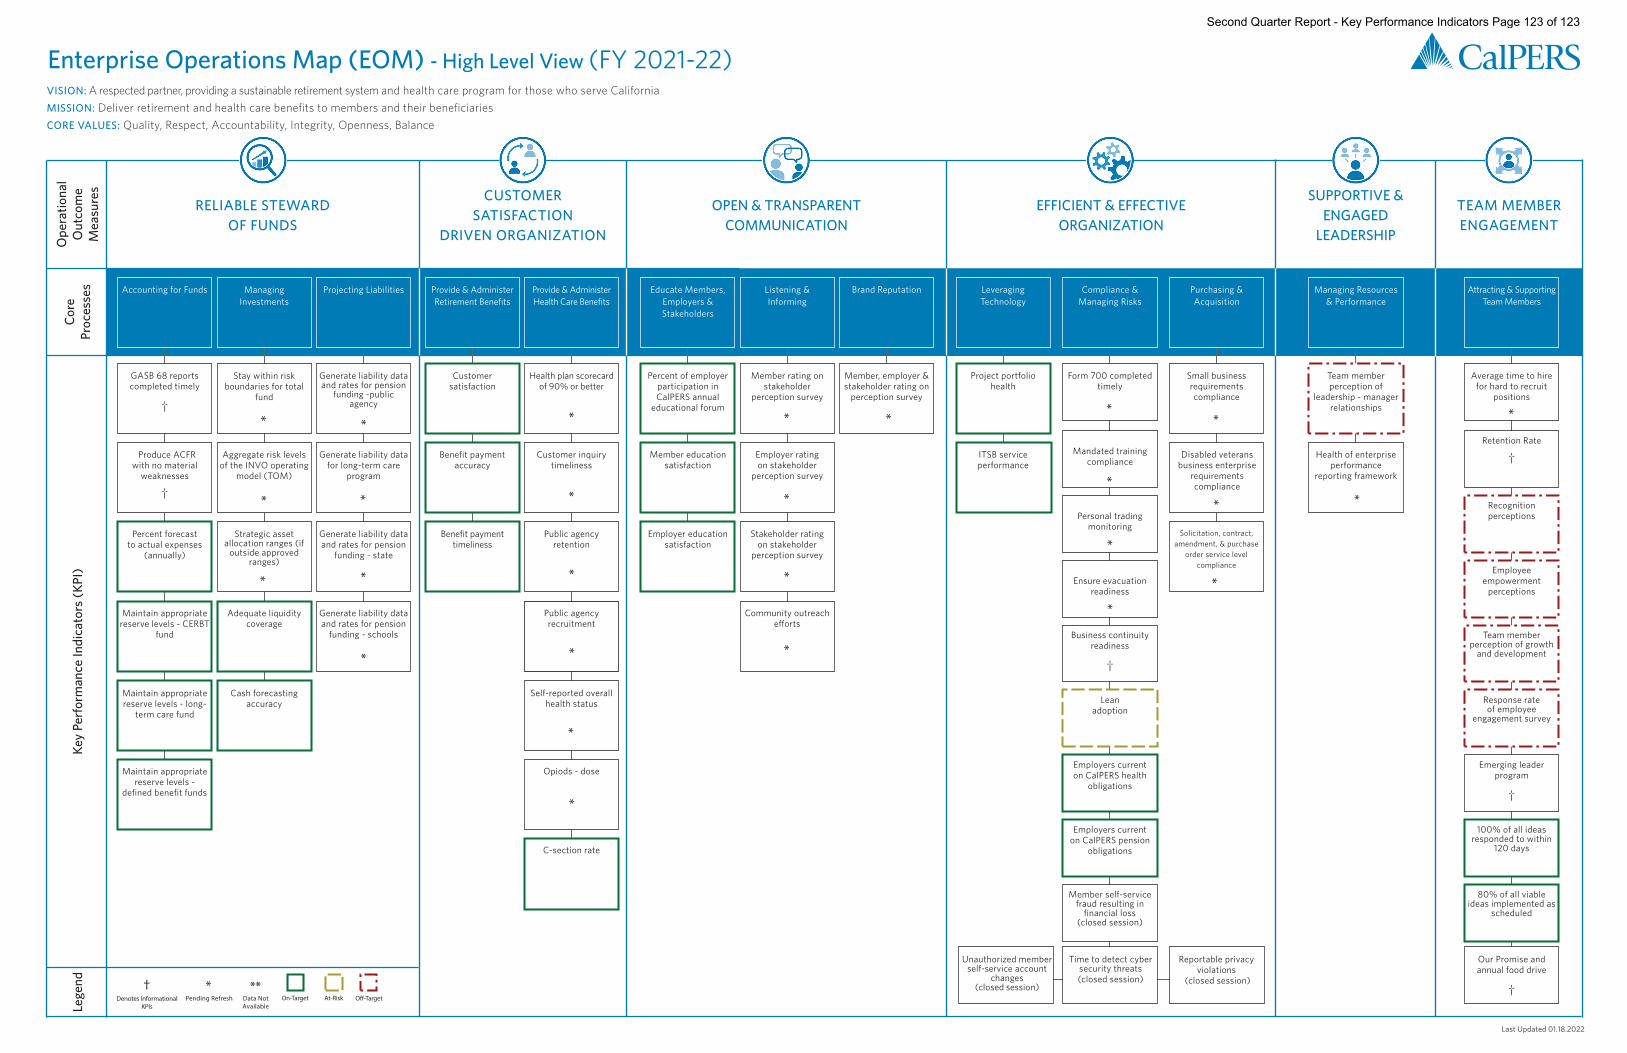
* *
* *
* *
*
* *
* *
* *
* *
*
*
Enterprise Operations Map (EOM) - High Level View (FY 2021-22) VISION: A respected partner, providing a sustainable retirement system and health care program for those who serve California MISSION: Deliver retirement and health care benefts to members and their benefciaries CORE VALUES: Quality, Respect, Accountability, Integrity, Openness, Balance
Ope
ratio
nal
Core
Lege
nd
Key
Perf
orm
ance
Indi
cato
rs (K
PI)
Out
com
ePr
oces
ses
Mea
sure
s CUSTOMER RELIABLE STEWARD
SATISFACTION OF FUNDS
DRIVEN ORGANIZATION
Accounting for Funds Managing Projecting Liabilities Provide & Administer Provide & Administer Investments Retirement Benefts Health Care Benefts
GASB 68 reports Stay within risk Generate liability data Customer Health plan scorecard completed timely boundaries for total and rates for pension satisfaction of 90% or better
fund funding -public agency †
Produce ACFR Aggregate risk levels Generate liability data Beneft payment Customer inquiry with no material of the INVO operating for long-term care accuracy timeliness
weaknesses model (TOM) program
†
Percent forecast Strategic asset Generate liability data Beneft payment Public agency to actual expenses allocation ranges (if and rates for pension timeliness retention
(annually) outside approved funding - state ranges)
Maintain appropriate Adequate liquidity Generate liability data Public agency reserve levels - CERBT coverage and rates for pension recruitment
fund funding - schools
Maintain appropriate Cash forecasting Self-reported overall reserve levels - long- accuracy health status
term care fund
Maintain appropriate Opiods - dose reserve levels -
defned beneft funds
C-section rate
† * ** Denotes Informational Pending Refresh Data Not On-Target At-Risk O Target
KPIs Available
OPEN & TRANSPARENT COMMUNICATION
Educate Members, Listening & Brand Reputation Employers & Informing Stakeholders
Percent of employer Member rating on Member, employer & participation in stakeholder stakeholder rating on CalPERS annual perception survey perception survey
educational forum
Member education Employer rating satisfaction on stakeholder
perception survey
Employer education Stakeholder rating satisfaction on stakeholder
perception survey
Community outreach e°orts
EFFICIENT & EFFECTIVE ORGANIZATION
Leveraging Compliance & Purchasing & Technology Managing Risks Acquisition
Project portfolio Form 700 completed Small business health timely requirements
compliance
Mandated training ITSB service Disabled veterans compliance performance business enterprise
requirements compliance
Personal trading monitoring
Solicitation, contract, amendment, & purchase
order service level compliance
Ensure evacuation readiness
Business continuity readiness
†
Lean adoption
Employers current on CalPERS health
obligations
Employers current on CalPERS pension
obligations
Member self-service fraud resulting in
fnancial loss (closed session)
Unauthorized member Time to detect cyber Reportable privacy self-service account security threats violations
changes (closed session) (closed session) (closed session)
SUPPORTIVE & ENGAGED
LEADERSHIP
Managing Resources & Performance
Team member perception of
leadership - manager relationships
Health of enterprise performance
reporting framework
TEAM MEMBER ENGAGEMENT
Attracting & Supporting Team Members
Average time to hire for hard to recruit
positions
Retention Rate
†
Recognition perceptions
Employee empowerment
perceptions
Team member perception of growth
and development
Response rate of employee
engagement survey
Emerging leader program
†
100% of all ideas responded to within
120 days
80% of all viable ideas implemented as
scheduled
Our Promise and annual food drive
†
* *
*
*
*
*
*
*
*
*
Last Updated 01.18.2022
Second Quarter Report - Key Performance Indicators Page 123 of 123
Related Documents