Welcome message from author
This document is posted to help you gain knowledge. Please leave a comment to let me know what you think about it! Share it to your friends and learn new things together.
Transcript


Key Performance Indicatorsfor Banks in Jordan
December, 2011
Prepared by: Shaher Suleiman MSC (UK), CRP (USA), CRISC (USA)Head of Risk Management and Compliance Group
Jordan Kuwait Bank
Conclusions and opinions stated in this study convey the subjective opinion of the analyst and shall not represent
in any way recommendation to sell or to buy or to adopt any investment decisions thereof.
This study was based on published financial statements; therefore, in light of possible human or technical errors
in said statements, the analyst may not guarantee the accuracy or completeness of the information and he shall
not be responsible for any mistakes, deletions or conclusions resulting from the use of these statements.
Kindly refer to this study when publishing or copying any data or tables therein.

Executive Summary 1
Objectives and Assumptions 2
Financial Position 3
Capital Adequacy 5
Assets Quality 6
Earnings 7
Share Performance 8
Tables 9
Contents


1
Executive Summary
The wave of negative impacts that stormed global economies as a •result of the global financial crisis contributed in the weak economic performance on the macro levels during 2011.
At the local level, the Jordanian economy was affected by the worst •financial crisis in modern memory which the world continues to suffer from its consequences specially the Euro zone, in addition to the effects of the global increase in goods and oil prices as well as the political developments in the Middle East.
In order to mitigate the negative impact and to boost the Jordanian •Dinar’s (JD) attractiveness, the Central Bank of Jordan continued its prudent and effective supervision over banks during 2011, in addition to the implementation of best practices in the area of risk management and the application of corporate governance concepts.
Banks’ assets grew by USD2.83 billion, at a growth rate of 4.2%, to •USD 69.66 billion. The highest growth was attained by the Arab Bank (USD849 million). The Arab Bank continued to dominate most of the banks’ assets; acquiring 48.4% of these assets.
The measures adopted by the Government and the Central Bank of •Jordan continued to have a positive impact. Deposits increased by USD2.316 billion, with a growth rate of 5.3%, reaching USD45.707 billion. These deposits finance 66% of the total banks’ assets.
Unlike 2010, banks’ deposits grew by USD173 million, to reach •USD6.684 billion. In 2012 the Central Bank of Jordan launched a new monetary instrument to enhance and motivate the interbank market.
Banks continued to enhance their shareholders’ equity, whereby it •increased by USD297 million, reaching USD10.254 billion. The Arab Bank, Housing Bank and Jordan Kuwait Bank continued to maintain the top three positions with regard to total shareholders’ equity.
The most worthy note about the structure of banks’ assets is the •increase of the net credit facilities by USD1.042 billion, reaching USD30.371 billion with a growth rate of 3.6%.The increase in credit facilities indicates the easing of banks’ and clients’ concerns in offering and demanding facilities.
Banks heavily invested in financial assets, whereby it increased by •USD2.409 billion, reaching USD14.84 billion with a growth rate of 19.4%
Unlike 2010, cash and balances in 2011 decreased by USD478 •million, reaching USD20.7 billion, a decrease of 2.3%.
All banks (except Jordan Commercial Bank) registered high capital •adequacy ratios and exceeded the Central Bank of Jordan’s minimum requirement, reaching an average of 16.10%, indicating that the Jordanian Banking Sector is well capitalized.
It is worth noting, that most Jordanian banks have already fulfilled •the required ratios, stipulated by the recent amendments to the Basel III requirement, although banks were required to meet those levels by the end of 2019.
The financial leverage ratio at banks reached (14.7%). All banks •exceeded the minimum of 6% required by the Central Bank of Jordan.
Despite its limitations, the global financial crisis persists to have •some effects on the local economy, evident in the increase of banks’ non-performing loans. Non-performing loans increased by USD244 million, an increase of 10.7%, reaching USD2.515 billion. The average non-performing loans/total credit facilities ratio reached 7.8% compared with 7.4% in the previous year. Nevertheless, this ratio remains below the maximum accepted international standard (less than 10%).
The non-performing loans ratio for banks were within the accepted •international standards, except for Bank al Etihad (11.9%), Capital Bank (16.5%), Invest Bank (11.9%) and Jordan Commercial Bank (16.1%)

2
Banks’ ability to cover non-performing loans increased, with the •Provision for Impairment in Direct Credit Facilities/Principal of Non- Performing Loans reaching 69.8%, compared to 65.2% in 2010. Cairo Amman Bank recorded the highest ratio (94.3%)
The pressure of non-performing loans on equity eased in 2011. The •Ratio declined and reached 7.4% against 7.9% by the end of 2010
Banks’ earnings before taxes increased by USD141.7 million, •reaching USD1.087 billion, with a growth rate of 15%, unlike 2009 and 2010 which witnessed decrease in earnings before taxes. The Arab Bank, Housing Bank and Jordan Kuwait Bank continued to maintain the top three positions.
Banks’ earnings structure continued to rely heavily on the net interest •which contributed to 67.4% of the gross income.
The descending trend of interest rates helped banks to maintain •lower cost of fund at 1.9%.
All banks demonstrated high efficiency in managing their expenses •and at different rates. The best and lowest record was achieved by Jordan Kuwait Bank, reaching 20.1%, while the highest expenses ratio was recorded by Cairo Amman Bank (34.6%).
Return on Average Assets (ROAA) increased to reach 1.6% compared •with 1.4% in 2010. The highest record was achieved by Cairo Amman Bank (2.7%) followed by Jordan Kuwait Bank (2.6%).
Return on Average Equity (ROAE) reached 10.8% compared with •9.6% in 2010. However, the highest rate of return was recorded by the Cairo Amman Bank (23.7%) followed by Jordan Islamic Bank (19.8%).
The lowest price to earnings ratio (P/E) was for Cairo Amman Bank’s •share (7.6 times), followed by Arab Banking Corporation Bank (7.8 times), while the highest (P/E) was for Capital Bank (194 times).
Banks market capitalization decreased by USD2.047 billion, reaching •USD12.056 billion by the end of 2011 with a decline ratio of 14.5%, noting that 2009 and 2010 witnessed a decline in the market capitalization as well. The Arab Bank, Housing Bank and Jordan Kuwait Bank continued to maintain the top three positions.
Key Performance Indicators for Banks Listed at theAmman Stock Exchange as of 31/12/2011
Study Objectives
This analytical study aims to show the key financial indicators for banks listed at the Amman Stock Exchange (ASE) on the basis of their financial statements for 2011, using the CAMEL methodology. This methodology measures financial indicators using a set of ratios, because comparing banks using absolute numbers only fails to express performance standards. The most prominent ratios have been used in this analytical study.
Study Assumptions
This study relied on the consolidated financial statements, published in banks’ annual reports. This study did not include banks that are not listed at the Amman Stock Exchange.
The analysis of the banks’ financial status on a consolidated basis complies with best international practices in term of comprehensive supervision over banks’ financial statements.
Banks’ operational results and performance indicators were measured on the basis of net profits before taxes, given the different tax legislations of countries where Jordanian banks are present in addition to the fact that some banks have not yet reached a final settlement with the Income Tax Department. Therefore, using the net profit before tax stands for a more accurate representation of banks’ real performance

3
and reflects the extent of the managements’ effectiveness in realizing these profits.
- The same principles used in previous studies were applied, whereby banks were divided into four categories according to the size of their assets as follows:
Category (A) includes the Arab Bank. •
Category (B), includes large banks with assets exceeding USD2.8 •billion
Category (C) includes medium banks with assets ranging between •USD1.4 billion and USD2.8 billion.
Category (D) includes small banks with assets less than USD1.4 •billion.
The attached tables clarify the detailed financial indicators for banks, and show the rank of each in relation to all other banks on one hand and in relation to its category on the other.
First: Financial Position / Banks’ Resources and Utilization of Funds
The year 2011 was characterized by a dramatic decline in the •global economy as a result of the weak economic performance that prevailed during the second half of 2011.
On the local level, the Jordanian economy was affected by the worst •financial crisis in modern memory which the world continues to suffer from its consequences specially the Euro zone, in addition to the effect of the global increase in the goods and oil prices as well as the political developments in the Middle East.
With the aim to mitigate the negative effects to the global crisis, •tight and prudent supervision was practiced by the Central Bank of
Jordan over the banking sector, in addition to implementing the best practices in risk management. On their part, the banks responded by applying CBJ’s instructions and applying the concepts related to corporate governance. This formed a strong fence that protected the banks against different risks as a result of the global financial crisis.
From the Positive Perspective:
Banks’ assets increased during 2011 by about USD2.83 billion, •reaching USD69.66 billion, with a growth rate of 4.2 %( Table 1). The largest growth was for the Arab Bank, with an increase in assets by USD849 million, representing 30% of the total increase in banks’ assets. The Arab Bank held the lead position with 48.4% of total banks’ assets (49.5% for 2010), followed by the Housing Bank, while the last position was for the recently established Jordan Dubai Islamic Bank.

4
The increase in the banks’ assets came as a direct result of the growth in main sources of funds, as shown below:
Customers’ deposits increased by USD 2.316 billion (Table 2), •reaching USD45.707 billion, at a growth rate of 5.3% (8.9% in 2010). These deposits finance about 66% of total banks’ assets, approximately the same ratio as in 2010. This increase is a clear indication of confidence in the Jordanian economy in general and the banking sector in particular.
The Arab Bank recorded the largest growth in customer deposits, •increasing by USD965 million, representing 42% of the total increase in customer deposits in all banks, moreover its deposits represents 45% of the total deposits in all banks.
Contrary to 2010, banks’ deposits increased by USD173 million, •reaching USD6.684 billion (Table 3). This came as a direct result of the increase in banks’ deposits with the Housing Bank, amounting to USD191 million. Banks normally resort to this source of funds for their temporary or permanent need for liquidity, and hence the need to look for longer-term sources of funds. It is worth mentioning that during 2012, the Central Bank of Jordan introduced new monetary instruments to enhance and motivate the interbank market.
Cash margins decreased by USD71.6 million, reaching USD4.651 •billion (Table 4).the largest decrease in cash margins was for Arab Bank by the amount of USD198 million. Cash margins cover about 15.3% of net credit facilities and finance 6.7% of total banks’ assets.
Owners’ equity (Table 5) increased by USD297 million, reaching •USD10.254 billion, at a growth rate of 3.0%, financing 14.7% of total banks’ assets. Owners’ equity increased in all banks at different rates, with the exception of the Bank al Etihad and Jordan Commercial Bank where they decreased by USD14.5 million and USD2.9 million respectively. The Arab Bank, Housing Bank and Jordan Kuwait Bank maintained their lead positions, same rankings as in previous years.
In general, banks strive to enhance their owners’ equity to enhance capital adequacy levels, in addition to increasing their credit capacity and increasing their ability to face any potential risks.
Banks’ Assets Structureas of Dec. 2011
Assets Distribution Accross the Banks’ Groupsas of Dec. 2011
Arab Bank48.4%
Large Banks34.0%
Small Banks7.9%
Medium Banks9.7%
Types of Facilities at Banksas of Dec. 2011
Non-Performing Loans7.8%
PerformingFacilities92.2%
Net Credit facilities43.6%
Cash & Balancesat banks29.7%
Financial Assets21.3%
Fixed &Intangible
Assets1.4%
Other Assets3.9%
5
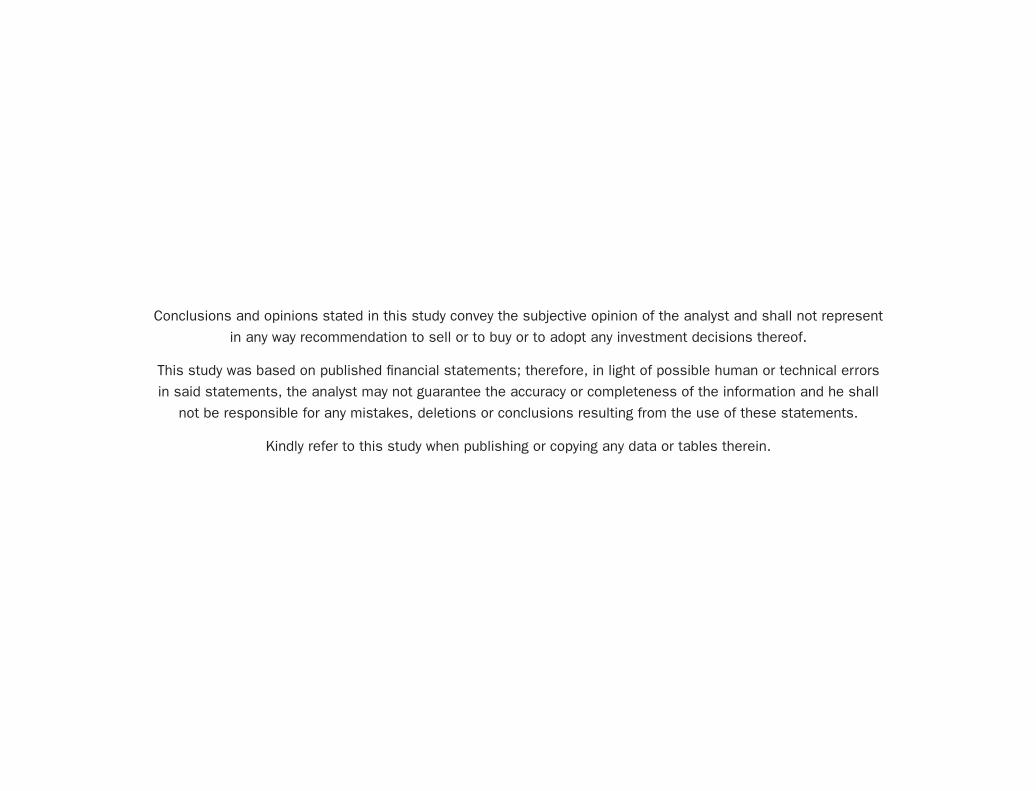
This increase in banks’ sources of funds reflected on their investments as follows:
The most prominent feature in banks’ investments is the increase in •net credit facilities of USD1.042 billion, reaching USD30.371 billion, with a growth rate of 3.6% (Table 6), reflecting the same direction from that prevailing in 2010, where facilities increased by about USD1.117 billion with a growth rate of 4%. The increase in credit facilities indicates the easing of banks’ and clients’ concerns in offering and demanding facilities.
The largest balance of credit facilities was at the Arab Bank, •representing about 46.5% of all net facilities at banks.
The financial assets portfolio (Table 7) increased by USD2.408 billion, •reaching USD14.841 billion, recording a growth rate of 19.4%.
Contrary to the prevailing situation during 2010, Cash and Balances •decreased by USD 478.6 million, to reach USD20.7 billion, a decline of 2.3% (Table 8). While Cash and Balances in 2010 increased by USD1.738 billion.
Arab Bank’s Cash and Balances represents 53% of total banks’ •Cash and Balances
Second: Capital Adequacy Indicator
With the exception of Jordan Commercial Bank, all banks recorded •a capital adequacy ratio higher than the minimum required by the Central Bank of Jordan (12%). According to the Central Bank of Jordan’s classification, any bank with a capital adequacy ratio exceeding 14% is considered to be well-capitalized. In this respect, all banks exceeded the limit mentioned, with the exception of the Jordan Ahli Bank and the Jordan Commercial Bank (Table 9).
Banks’ Assets Structureas of Dec. 2011
Assets Distribution Accross the Banks’ Groupsas of Dec. 2011
Arab Bank48.4%
Large Banks34.0%
Small Banks7.9%
Medium Banks9.7%
Types of Facilities at Banksas of Dec. 2011
Non-Performing Loans7.8%
PerformingFacilities92.2%
Net Credit facilities43.6%
Cash & Balancesat banks29.7%
Financial Assets21.3%
Fixed &Intangible
Assets1.4%
Other Assets3.9%

6
The average capital adequacy ratio at all banks reached 16.1%, •compared to 16.26% in 2010, which indicates that the banking sector is well capitalized. The highest ratio was achieved by Societe Generale Bank (25.9%) and the lowest was for Jordan Commercial Bank (10.68%).
However, achieving very high capital adequacy ratios represents a •burden on banks, adding pressure on dividends distribution, because the more the bank’s paid – up capital is, the higher the need to distribute dividends at larger amounts. Hence, banks should achieve a reasonable balance between capital adequacy and liquidity, and return on owners’ equity requirements.
Financial leverage ratios at banks reached 14.7% (Table 10) which •is almost the same ratio recorded in 2010. It can be noted that all banks largely surpassed the minimum ratio required by the Central Bank of Jordan, set at 6%. The highest ratio was achieved by Jordan Dubai Islamic Bank (32.8%), and the lowest by the Jordan Islamic Bank (7.1%).
Third: Assets Quality
Despite its limitations, some effects of the global financial crisis •over the local economy still persist, evident in the increase of banks’ non-performing loans. Non-performing loans increased by USD244 million reaching USD2.515 billion recording a growth rate of 10.7% (Table 11) while credit facilities increased by USD1.042 billion with growth rate of 3.6%.
The largest non-performing loans were recorded by the Arab Bank •followed by the Housing Bank and Jordan Kuwait Bank, amounting to USD961.4 million, USD308.6 million and USD178.5 million respectively, while the lowest NPL was achieved by Jordan Dubai Islamic Bank amounting to USD 12.3 million.
The ratio of non-performing loans to total credit facilities in 2011 •
reached around 7.8% compared to 7.4% at the end of 2010. This ratio however remains below the internationally minimum acceptable limit of 10% (Table 12).
The ratio of non-performing loans at most banks was below the •maximum internationally acceptable 10% benchmark, with the exception of Bank al Etihad (11.9%), Capital Bank (16.5%), Invest Bank (11.9%), and Jordan Commercial Bank (16.1%). The lowest ratio was achieved by Jordan Dubai Islamic Bank (3.3%) being one of the newly established banks in Jordan.
Banks’ Assets Structureas of Dec. 2011
Assets Distribution Accross the Banks’ Groupsas of Dec. 2011
Arab Bank48.4%
Large Banks34.0%
Small Banks7.9%
Medium Banks9.7%
Types of Facilities at Banksas of Dec. 2011
Non-Performing Loans7.8%
PerformingFacilities92.2%
Net Credit facilities43.6%
Cash & Balancesat banks29.7%
Financial Assets21.3%
Fixed &Intangible
Assets1.4%
Other Assets3.9%

7
Banks’ ability to cover non-performing loans increased reaching •69.8% compared to 65.2% by the end of 2010 (Table 13). The fact that banks made additional provisions to cover the non-performing loans in 2011 enhanced the ratio. The highest coverage ratio was achieved by the Cairo Amman Bank (94.3%), followed by the Arab Bank (84.9%) , while the lowest coverage ratio was for Jordan Dubai Islamic Bank (28.5%).
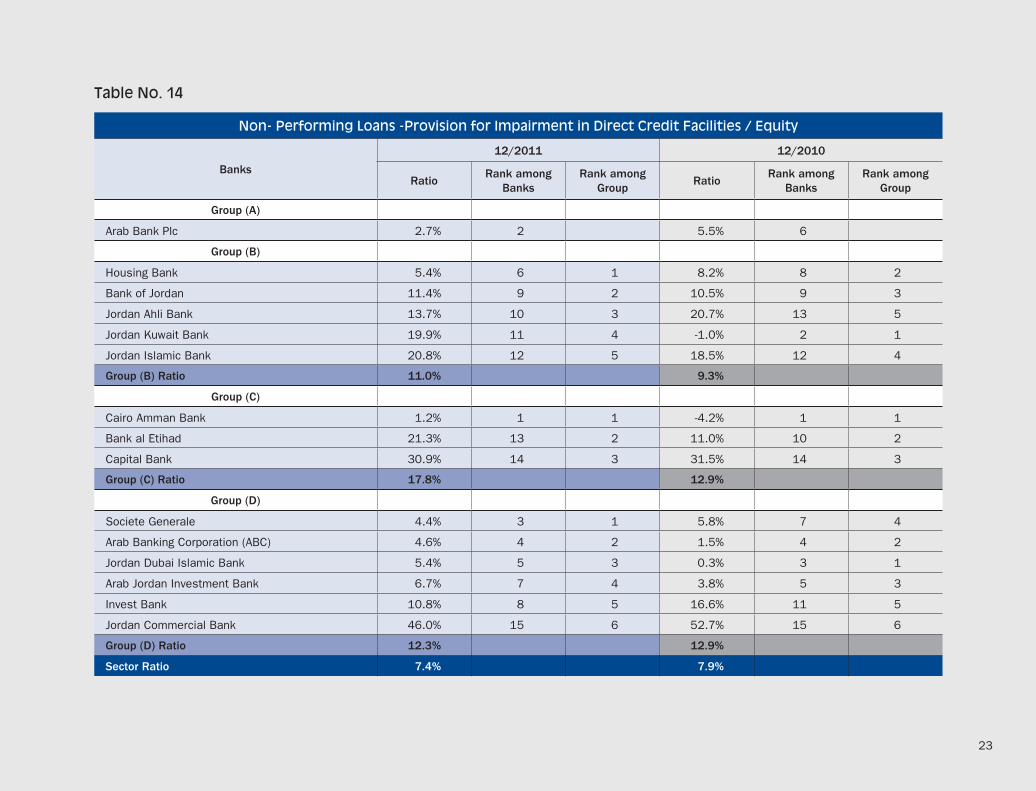
As for the ability of owners’ equity to cover non-performing loans •which measures the amount of pressure exerted by these non-performing loans on owners’ equity, (principal of non-performing loans - Provision for Impairment in Direct Credit Facilities / Equity), reached 7.4% compared to 7.9% at the end of 2010 (Table 14). This indicates a decrease in pressure exerted by non-performing loans on owners’ equity. The highest ratio was recorded by Jordan Commercial Bank (46%) followed by Capital Bank (30.9%), while the lowest ratio was recorded by Cairo Amman Bank (1.2%).
Fourth: Earnings
Unlike 2009 and 2010, the year 2011 witnessed an increase in •banks’ earnings before taxes by the amount of USD 141.7 million to reach USD1.087 billion with growth rate of 15%.
The Arab Bank, Housing Bank and Jordan Kuwait Bank continued to •achieve the highest three positions and recorded USD471.2 million, USD191.4 million and USD78.5 million respectively (Table 15). It is worth noting that Jordan Kuwait Bank continued to maintain the third position from the earning perspective despite the decrease of about USD25.7 million in earnings, which was used to further enhance the Bank’s provisions for non-performing loans, noting that these provisions are considered as reserves which will be released once the related non performing loan are recovered.
The most significant earnings indicators achieved by banks during 2011 were as follows:
Banks continued to heavily rely on net interest in their earnings •structure (Table 16). The ratio of net interest to gross income reached 67.4%, which is approximately the same ratio in 2010. The highest ratio was achieved by Jordan Kuwait Bank (78.6%) and the lowest by the Arab Bank (63.9%).
The total banks investment portfolios’ earnings in 2011 dropped to •USD67.3 million, with a decrease of USD20.2 million compared with 2010 . The largest decrease was recorded by the Arab Bank; it’s portfolio’s earnings reached USD3.4 million in 2011 compared to USD59.1 million in 2010 (Table 17).
As (Table 18) shows, interest rates during 2011 showed a down •trend. Weighted average interest rates on deposits and on credit facilities continued to decrease, with the exception of interest paid on time deposits, which increased by 6 basis points. Worthy to note that the Jordanian dinar continued to have a major competitive edge over other currencies.
As a result of the decline in the interest rate structure, the interest •rate margin (the difference between the interest rate on loans and advances and the interest rate on time deposits) decreased by 40 basis points compared to 2010.
Banks cost of funds average reached 1.9% which is the same in •2010 (Table 19). The lowest cost was recorded at the Housing Bank (1.6%), while Capital Bank recorded the highest cost at (3.4%) (Same order as 2010).

8
The performance of expenses management was as follows:
The ratio of general and administrative expenses to net interest and •commissions increased to reach 47.4% compared to 45.6% in 2010, despite the mentioned increase, banks managed their expenses efficiently on different levels staying below the 60% international standard ratio. The best ratio was recorded by Jordan Kuwait Bank (30.3%), while the highest ratio was at Societe Generale Bank (60.1%) (Table 20).
The general and administrative expenses to revenues ratio reached •28.4% for all banks compared to 27.4% in 2010 (Table 21). The best ratio was recorded by Jordan Kuwait Bank (20.1%), while the highest ratio was at Cairo Amman Bank (34.6%).
In conclusion, performance indicators highlighted the following facts and results:
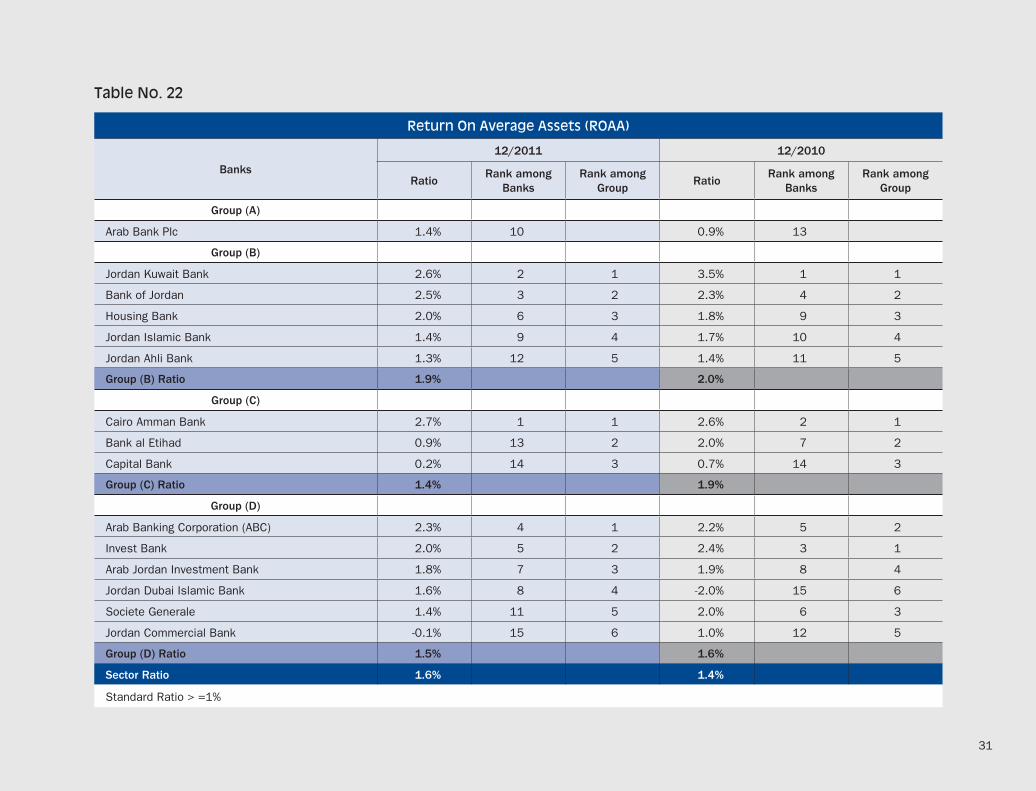
Return on Average Assets (ROAA) increased to 1.6%, compared •to 1.4% in 2010 (Table 22) and remains higher than the minimum acceptable international standards (1%). The highest return was achieved by Cairo Amman Bank (2.7%) followed by Jordan Kuwait Bank (2.6%), while the lowest ratio was recorded by Jordan Commercial Bank (loss).
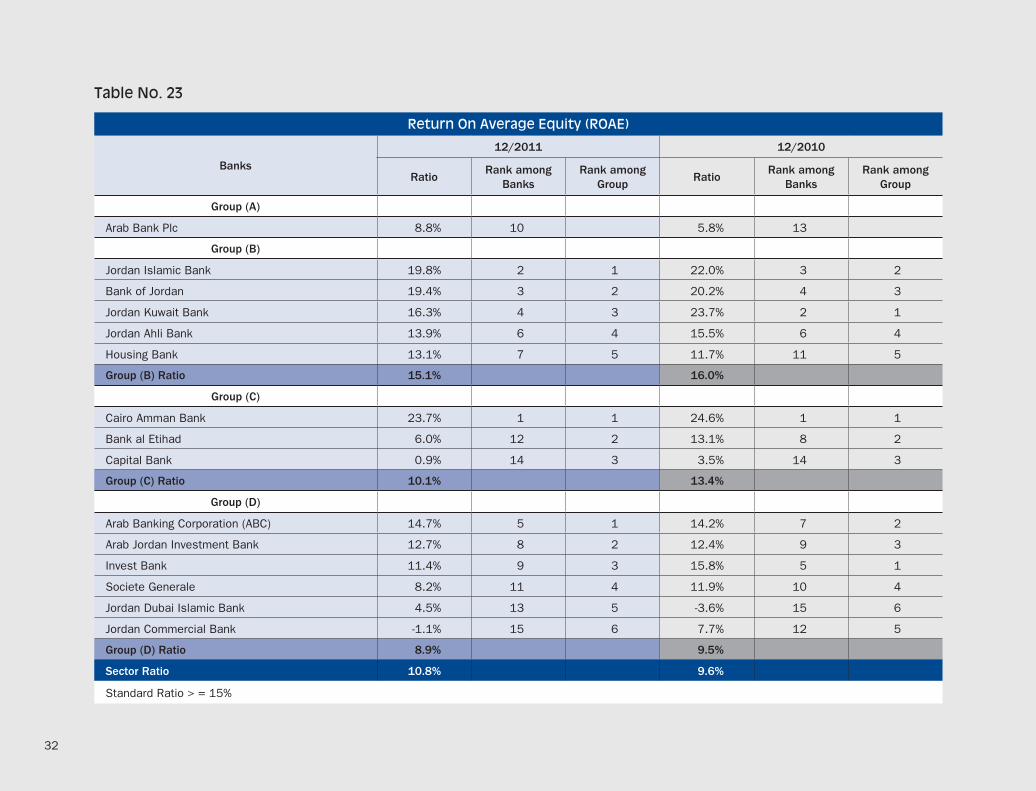
As for the Return on Average Equity (ROAE), it increased to 10.8% •compared with 9.6% in 2010 (Table 23). According to acceptable international standards, the ratio should exceed 15%. The highest ratio was achieved by Cairo Amman Bank (23.7%), followed by Jordan Islamic Bank (19.8%), while the lowest ratio was recorded by Jordan Commercial Bank (loss).
Fifth: Share Performance
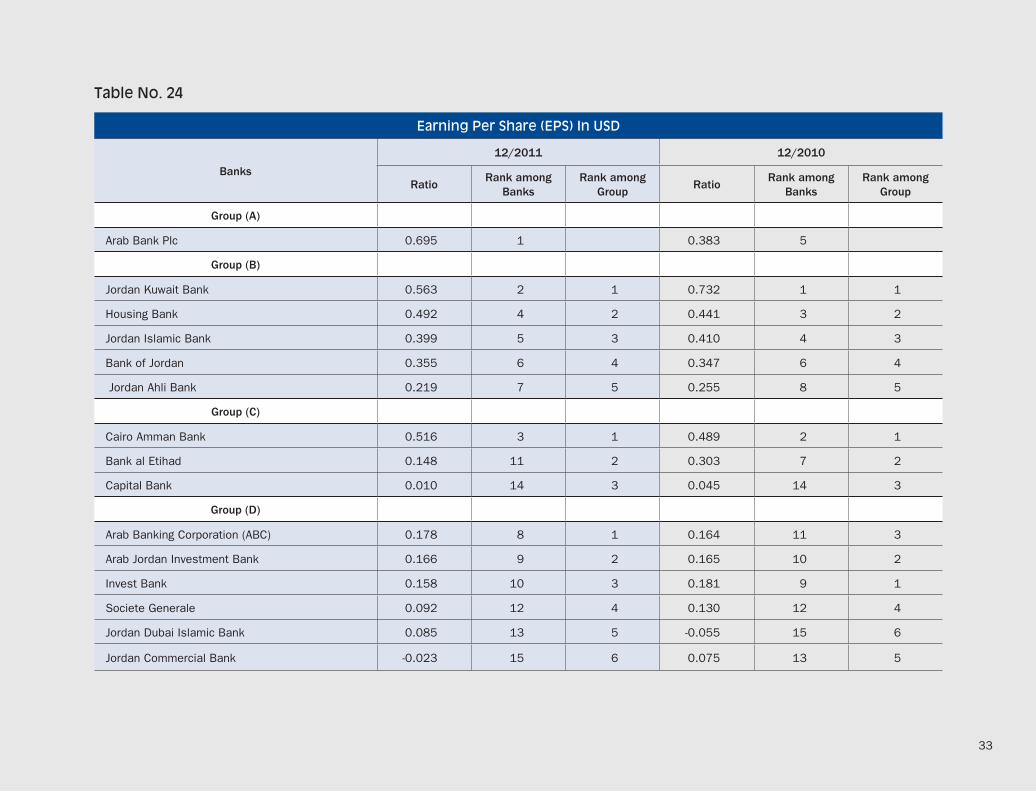
(Table 24) shows the earning per share indicator (EPS). The Arab •
Bank and the Jordan Kuwait Bank (EPS) ranked the first and second
positions at USD0.695 and USD0.563 respectively, while the lowest
earning per share was for Jordan Commercial Bank (loss).
As for the Price to Earning (P/E) ratio (Table 25), the lowest P/E ratio •
was for Cairo Amman Bank (7.6 times) followed by the Arab Banking
Corporation (7.8 times), while the highest P/E ratio was for Capital
Bank (194 times).
Market capitalization decreased by USD 2.047 billion, reaching •
USD12.056 billion by the end of 2011, a decline of 14.5% (Table 26).
This was due to the continued decline in the market capitalization
witnessed in 2009 and 2010by USD780 million and USD3.222
billion respectively. The largest Market Capitalizations decrease
was at the Arab Bank amounting to USD1.604 billion. Meanwhile,
the Arab Bank, Housing Bank and Jordan Kuwait Bank continued to
maintain the top three positions.

Page No.Table NameTable No.
10Total Assets1
11Customers Deposits2
12Banks Deposits3
13Cash Collaterals 4
14Total Owners’ Equity5
15Net Credit Facilities6
16Financial Assets 7
17Cash & Balances at Banks 8
18Capital Adequacy Ratio (CAR)9
19Leverage Ratio (Equity / Assets)10
20Non- Performing Loans (Principal)11
21Non- Performing Loans / Gross Loans12
22Coverage Ratio ( Provision for Impairment in Direct Credit Facilities / Principal of Non-Performing Loans) 13
23Non- Performing Loans - Provision for Impairment in Direct Credit Facilities / Equity14
24Pre-Taxes Profits (Losses)15
25Net-Interest / Gross Income16
26Income (loss) from Financial Assets17
27Credit and Deposits Interest Rate Structure ( % )18
28Funding Costs19
29General and Administrative Expenses / Net Interest and Commissions Ratio20
30General and Administrative Expenses / Revenues Ratio21
31Return On Average Assets (ROAA)22
32Return On Average Equity (ROAE)23
33Earning Per Share (EPS)24
34Price / Earning Ratio (P/E)25
35Market Capitalization26
List of Tables

10
Table No. 1
Total Assets (In millions USD)
Banks
12/2011 12/2010 Changes
BalanceRank
amongBanks
RankamongGroup
BalanceRank
amongBanks
RankamongGroup
RatioRank
amongBanks
RankamongGroup
Group (A)
Arab Bank Plc 33,739.8 1 32,890.6 1 2.6% 13
Group (B)
Housing Bank 9,785.6 2 1 9,421.2 2 1 3.9% 11 4
Jordan Islamic Bank 4,087.9 3 2 3,672.3 3 2 11.3% 3 1
Jordan Ahli Bank 3,690.6 4 3 3,554.3 4 3 3.8% 12 5
Jordan Kuwait Bank 3,206.8 5 4 2,939.3 5 4 9.1% 4 2
Bank of Jordan 2,895.4 6 5 2,777.2 6 5 4.3% 10 3
Total Group (B) 23,666.4 22,364.4 5.8%
Group (C)
Cairo Amman Bank 2,736.8 7 1 2,600.1 7 1 5.3% 8 2
Bank al Etihad 2,061.4 8 2 2,171.2 8 2 -5.1% 15 3
Capital Bank 1,968.7 9 3 1,699.3 9 3 15.9% 2 1
Total Group (C) 6,766.9 6,470.5 4.6%
Group (D)
Arab Jordan Investment Bank 1,307.8 10 1 1,228.7 10 1 6.4% 6 3
Jordan Commercial Bank 1,130.9 11 2 1,075.9 11 2 5.1% 9 5
Arab Banking Corporation (ABC) 1,069.2 12 3 983.4 12 3 8.7% 5 2
Invest Bank 975.7 13 4 955.2 13 4 2.1% 14 6
Societe Generale 509.1 14 5 483.3 14 5 5.3% 7 4
Jordan Dubai Islamic Bank 494.3 15 6 378.1 15 6 30.7% 1 1
Total Group (D) 5,487.0 5,104.0 7.5%
Grand Total 69,660.0 66,829.5 4.2%

11
Table No. 2
Customers Deposits (In Millions USD)
Banks
12/2011 12/2010 Changes
BalanceRank
amongBanks
RankamongGroup
BalanceRank
amongBanks
RankamongGroup
RatioRank
amongBanks
RankamongGroup
Group (A)
Arab Bank Plc 20,708.0 1 19,742.8 1 4.9% 9
Group (B)
Housing Bank 6,817.9 2 1 6,782.2 2 1 0.5% 14 5
Jordan Islamic Bank 3,647.1 3 2 3,194.5 3 2 14.2% 5 1
Jordan Ahli Bank 2,405.2 4 3 2,347.4 4 3 2.5% 12 3
Bank of Jordan 2,112.8 5 4 2,091.3 5 4 1.0% 13 4
Jordan Kuwait Bank 1,998.8 6 5 1,840.5 7 5 8.6% 7 2
Total Group (B) 16,981.8 16,255.9 4.5%
Group (C)
Cairo Amman Bank 1,939.5 7 1 1,884.1 6 1 2.9% 11 2
Capital Bank 1,252.3 8 2 1,064.5 9 3 17.6% 3 1
Bank al Etihad 1,233.1 9 3 1,286.9 8 2 -4.2% 15 3
Total Group (C) 4,425.0 4,235.6 4.5%
Group (D)
Jordan Commercial Bank 860.1 10 1 778.0 10 1 10.6% 6 4
Arab Jordan Investment Bank 769.1 11 2 729.3 11 2 5.5% 8 5
Invest Bank 662.4 12 3 633.7 12 3 4.5% 10 6
Arab Banking Corporation (ABC) 646.4 13 4 508.2 13 4 27.2% 2 2
Societe Generale 369.3 14 5 322.3 14 5 14.6% 4 3
Jordan Dubai Islamic Bank 284.8 15 6 185.0 15 6 54.0% 1 1
Total Group (D) 3,592.1 3,156.5 13.8%
Grand Total 45,707.0 43,390.7 5.3%

12
Table No. 3
Banks Deposits (In Millions USD)
Banks
12/2011 12/2010 Changes
BalanceRank
amongBanks
RankamongGroup
BalanceRank
amongBanks
RankamongGroup
RatioRank
amongBanks
RankamongGroup
Group (A)
Arab Bank Plc 3,543.3 1 3,573.5 1 -0.8% 9
Group (B)
Housing Bank 763.1 2 1 571.7 2 1 33.5% 2 2
Jordan Kuwait Bank 495.9 3 2 360.3 4 3 37.7% 1 1
Jordan Ahli Bank 494.4 4 3 503.2 3 2 -1.7% 10 4
Bank of Jordan 188.2 8 4 147.0 9 4 28.0% 4 3
Jordan Islamic Bank 27.6 12 5 62.1 13 5 -55.6% 14 5
Total Group (B) 1,969.2 1,644.3 19.8%
Group (C)
Cairo Amman Bank 240.0 6 1 186.1 8 2 28.9% 3 1
Bank al Etihad 199.6 7 2 339.8 5 1 -41.3% 13 3
Capital Bank 174.7 9 3 141.7 10 3 23.2% 5 2
Total Group (C) 614.2 667.7 -8.0%
Group (D)
Arab Jordan Investment Bank 297.9 5 1 252.9 6 1 17.8% 7 2
Arab Banking Corporation (ABC) 147.4 10 2 208.2 7 2 -29.2% 12 5
Jordan Commercial Bank 62.6 11 3 67.3 12 4 -7.1% 11 4
Invest Bank 25.8 13 4 77.0 11 3 -66.5% 15 6
Jordan Dubai Islamic Bank 18.0 14 5 15.0 14 5 19.7% 6 1
Societe Generale 6.1 15 6 5.3 15 6 15.3% 8 3
Total Group (D) 557.6 625.8 -10.9%
Grand Total 6,684.4 6,511.3 2.7%

13
Table No. 4
Cash Collaterals (In Millions USD)
Banks
12/2011 12/2010 Changes
BalanceRank
amongBanks
RankamongGroup
BalanceRank
amongBanks
RankamongGroup
RatioRank
amongBanks
RankamongGroup
Group (A)
Arab Bank Plc 2,851.5 1 3,049.6 1 -6.5% 10
Group (B)
Housing Bank 470.1 2 1 416.1 2 1 13.0% 4 1
Jordan Ahli Bank 341.9 3 2 305.9 3 2 11.8% 5 2
Bank of Jordan 143.9 5 3 143.4 6 4 0.4% 8 3
Jordan Kuwait Bank 122.9 6 4 170.7 4 3 -28.0% 14 5
Jordan Islamic Bank 42.8 12 5 50.7 13 5 -15.5% 12 4
Total Group (B) 1,121.6 1,086.8 3.2%
Group (C)
Bank al Etihad 261.7 4 1 156.5 5 1 67.2% 2 1
Capital Bank 81.5 7 2 73.4 8 2 10.9% 6 2
Cairo Amman Bank 66.9 10 3 62.8 10 3 6.5% 7 3
Total Group (C) 410.0 292.7 40.1%
Group (D)
Invest Bank 75.5 8 1 54.1 11 3 39.6% 3 2
Arab Banking Corporation (ABC) 70.4 9 2 75.1 7 1 -6.2% 9 3
Jordan Commercial Bank 55.2 11 3 64.3 9 2 -14.1% 11 4
Arab Jordan Investment Bank 36.0 13 4 44.4 14 5 -19.0% 13 5
Societe Generale 24.9 14 5 53.4 12 4 -53.3% 15 6
Jordan Dubai Islamic Bank 6.3 15 6 2.6 15 6 141.2% 1 1
Total Group (D) 268.3 293.9 -8.7%
Grand Total 4,651.4 4,723.0 -1.5%

14
Table No. 5
Total Owners’ Equity (In Millions USD)
Banks
12/2011 12/2010 Changes
BalanceRank
amongBanks
RankamongGroup
BalanceRank
amongBanks
RankamongGroup
RatioRank
amongBanks
RankamongGroup
Group (A)
Arab Bank Plc 5,378.7 1 5,340.8 1 0.7% 12
Group (B)
Housing Bank 1,479.0 2 1 1,444.2 2 1 2.4% 11 5
Jordan Kuwait Bank 496.5 3 2 466.5 3 2 6.4% 7 4
Bank of Jordan 391.1 4 3 332.5 4 3 17.6% 2 1
Jordan Ahli Bank 359.5 5 4 322.5 6 4 11.5% 3 2
Jordan Islamic Bank 291.8 9 5 273.1 9 5 6.9% 6 3
Total Group (B) 3,017.9 2,838.8 6.3%
Group (C)
Bank al Etihad 317.2 6 1 331.7 5 1 -4.4% 15 3
Cairo Amman Bank 315.3 7 2 290.4 8 3 8.6% 5 1
Capital Bank 312.1 8 3 302.0 7 2 3.3% 10 2
Total Group (C) 944.6 924.1 2.2%
Group (D)
Invest Bank 186.0 10 1 151.8 12 3 22.6% 1 1
Arab Jordan Investment Bank 183.1 11 2 182.4 10 1 0.4% 13 5
Arab Banking Corporation (ABC) 166.7 12 3 150.3 13 4 10.8% 4 2
Jordan Dubai Islamic Bank 162.3 13 4 155.0 11 2 4.7% 9 4
Jordan Commercial Bank 130.0 14 5 132.9 14 5 -2.2% 14 6
Societe Generale 84.9 15 6 80.8 15 6 5.0% 8 3
Total Group (D) 913.0 853.2 7.0%
Grand Total 10,254.3 9,956.9 3.0%

15
Table No. 6
Net Credit Facilities (In Millions USD)
Banks
12/2011 12/2010 Changes
BalanceRank
amongBanks
RankamongGroup
BalanceRank
amongBanks
RankamongGroup
RatioRank
amongBanks
RankamongGroup
Group (A)
Arab Bank Plc 14,109.4 1 14,191.4 1 -0.6% 14
Group (B)
Housing Bank 3,529.0 2 1 3,454.4 2 1 2.2% 11 5
Jordan Islamic Bank 1,875.2 3 2 1,736.7 3 2 8.0% 6 3
Jordan Kuwait Bank 1,761.2 4 3 1,650.9 4 3 6.7% 8 4
Jordan Ahli Bank 1,661.8 5 4 1,504.3 5 4 10.5% 4 1
Bank of Jordan 1,476.0 6 5 1,355.7 6 5 8.9% 5 2
Total Group (B) 10,303.2 9,701.9 6.2%
Group (C)
Cairo Amman Bank 1,336.5 7 1 1,160.9 7 1 15.1% 3 1
Bank al Etihad 1,020.9 8 2 1,003.9 8 2 1.7% 12 2
Capital Bank 925.0 9 3 945.2 9 3 -2.1% 15 3
Total Group (C) 3,282.4 3,110.0 5.5%
Group (D)
Jordan Commercial Bank 592.8 10 1 550.7 10 1 7.6% 7 3
Arab Banking Corporation (ABC) 556.1 11 2 440.2 13 4 26.3% 2 2
Invest Bank 493.7 12 3 494.0 11 2 -0.1% 13 6
Arab Jordan Investment Bank 468.6 13 4 456.7 12 3 2.6% 10 5
Jordan Dubai Islamic Bank 373.8 14 5 201.7 14 5 85.3% 1 1
Societe Generale 191.2 15 6 182.2 15 6 5.0% 9 4
Total Group (D) 2,676.2 2,325.6 15.1%
Grand Total 30,371.3 29,329.0 3.6%

16
Table No. 7
Financial Assets (In Millions USD)
Banks
12/2011 12/2010 Changes
BalanceRank
amongBanks
RankamongGroup
BalanceRank
amongBanks
RankamongGroup
RatioRank
amongBanks
RankamongGroup
Group (A)
Arab Bank Plc 6,508.1 1 5,479.0 1 18.8% 8
Group (B)
Housing Bank 2,960.6 2 1 2,219.1 2 1 33.4% 4 2
Jordan Ahli Bank 867.4 3 2 802.4 3 2 8.1% 12 4
Jordan Kuwait Bank 654.8 5 3 580.4 5 3 12.8% 10 3
Bank of Jordan 595.7 6 5 437.4 6 4 36.2% 3 1
Jordan Islamic Bank 143.1 14 4 171.2 13 5 -16.4% 14 5
Total Group (B) 5,221.6 4,210.5 24.0%
Group (C)
Cairo Amman Bank 692.4 4 1 593.2 4 1 16.7% 9 2
Capital Bank 510.7 7 3 355.6 9 3 43.6% 2 1
Bank al Etihad 359.1 9 2 433.8 7 2 -17.2% 15 3
Total Group (C) 1,562.2 1,382.6 13.0%
Group (D)
Arab Jordan Investment Bank 492.9 8 1 405.2 8 1 21.6% 7 4
Arab Banking Corporation (ABC) 334.4 10 2 273.3 10 2 22.3% 5 2
Jordan Commercial Bank 285.0 11 4 261.3 11 3 9.1% 11 5
Invest Bank 237.5 12 3 259.3 12 4 -8.4% 13 6
Societe Generale 185.1 13 5 151.7 14 5 22.0% 6 3
Jordan Dubai Islamic Bank 14.2 15 6 9.4 15 6 50.9% 1 1
Total Group (D) 1,549.0 1,360.3 13.9%
Grand Total 14,840.8 12,432.4 19.4%

17
Table No. 8
Cash&Balances at Banks (In Millions USD)
Banks
12/2011 12/2010 Changes
BalanceRank
amongBanks
RankamongGroup
BalanceRank
amongBanks
RankamongGroup
RatioRank
amongBanks
RankamongGroup
Group (A)
Arab Bank Plc 10,919.4 1 10,778.4 1 1.3% 5
Group (B)
Housing Bank 2,955.2 2 1 3,453.1 2 1 -14.4% 10 4
Jordan Islamic Bank 1,881.3 3 2 1,585.9 3 2 18.6% 3 1
Jordan Ahli Bank 917.6 4 3 1,017.9 4 3 -9.9% 8 3
Jordan Kuwait Bank 719.0 5 4 632.9 8 5 13.6% 4 2
Bank of Jordan 680.0 6 5 833.0 5 4 -18.4% 12 5
Total Group (B) 7,153.1 7,522.7 -4.9%
Group (C)
Bank al Etihad 598.7 7 1 653.7 7 2 -8.4% 6 2
Cairo Amman Bank 595.9 8 2 724.9 6 1 -17.8% 11 3
Capital Bank 462.9 9 3 316.5 9 3 46.2% 1 1
Total Group (C) 1,657.5 1,695.1 -2.2%
Group (D)
Arab Jordan Investment Bank 280.1 10 1 308.2 10 1 -9.1% 7 2
Jordan Commercial Bank 197.7 11 2 222.3 12 3 -11.1% 9 3
Invest Bank 172.7 12 3 139.7 13 4 23.6% 2 1
Arab Banking Corporation (ABC) 150.0 13 4 242.7 11 2 -38.2% 14 5
Societe Generale 95.2 14 5 138.2 14 5 -31.2% 13 4
Jordan Dubai Islamic Bank 73.9 15 6 130.9 15 6 -43.5% 15 6
Total Group (D) 969.5 1,182.0 -18.0%
Grand Total 20,699.6 21,178.2 -2.3%

18
Table No. 9
CAR According to CBJ Requirements
Banks
12/2011 12/2010
RatioRank among
Banks Rank among
Group Ratio
Rank amongBanks
Rank amongGroup
Group (A)
Arab Bank Plc 15.09% 9 14.40% 10
Group (B)
Housing Bank 20.69% 3 1 22.45% 3 1
Jordan Kuwait Bank 16.33% 8 2 19.09% 5 2
Bank of Jordan 14.27% 11 3 13.57% 12 3
Jordan Ahli Bank 12.26% 12 4 11.67% 13 4
Group (B) Ratio 17.19% 18.18%
Group (C)
Capital Bank 17.26% 6 1 19.79% 4 1
Bank al Etihad 16.91% 7 2 18.8% 6 2
Cairo Amman Bank 15.00% 10 3 14.93% 9 3
Group (C) Ratio 16.33% 17.73%
Group (D)
Societe Generale 25.91% 1 1 29.61% 1 1
Arab Banking Corporation (ABC) 24.65% 2 2 29.17% 2 2
Invest Bank 18.03% 4 3 16.64% 8 4
Arab Jordan Investment Bank 17.79% 5 4 18.01% 7 3
Jordan Commercial Bank 10.68% 13 5 13.58% 11 5
Group (D) Ratio 17.97% 19.12%
Sector Ratio 16.10% 16.26%
Standard Ratio > = 12%

19
Table No. 10
Leverage Ratio (Equity / Assets)
Banks
12/2011 12/2010
RatioRank among
Banks Rank among
Group Ratio
Rank amongBanks
Rank amongGroup
Group (A)
Arab Bank Plc 15.9% 4 16.2% 4
Group (B)
Jordan Kuwait Bank 15.5% 7 1 15.9% 6 1
Housing Bank 15.1% 9 2 15.3% 7 2
Bank of Jordan 13.5% 11 3 12.0% 12 3
Jordan Ahli Bank 9.7% 14 4 9.1% 14 4
Jordan Islamic Bank 7.1% 15 5 7.4% 15 5
Group (B) Ratio 12.8% 12.7%
Group (C)
Capital Bank 15.9% 5 1 17.8% 2 1
Bank al Etihad 15.4% 8 2 15.3% 9 2
Cairo Amman Bank 11.5% 12 3 11.2% 13 3
Group (C) Ratio 14.0% 14.3%
Group (D)
Jordan Dubai Islamic Bank 32.8% 1 1 41.0% 1 1
Invest Bank 19.1% 2 2 15.9% 5 3
Societe Generale 16.7% 3 3 16.7% 3 2
Arab Banking Corporation (ABC) 15.6% 4 4 15.3% 8 4
Arab Jordan Investment Bank 14.0% 5 5 14.8% 10 5
Jordan Commercial Bank 11.5% 6 6 12.4% 11 6
Group (D) Ratio 16.6% 16.7%
Sector Ratio 14.7% 14.9%
Standard Ratio > = 6%

20
Table No. 11
Non- Performing Loans (Principal) *(In Millions USD)
Banks
12/2011 12/2010 Changes
BalanceRank
amongBanks
RankamongGroup
BalanceRank
amongBanks
RankamongGroup
RatioRank
amongBanks
RankamongGroup
Group (A)
Arab Bank Plc 961.4 15 1,009.3 15 -4.8% 1
Group (B)
Jordan Islamic Bank 136.2 9 1 101.0 10 4 34.9% 9 4
Bank of Jordan 139.3 10 2 109.6 11 2 27.1% 8 3
Jordan Ahli Bank 173.4 12 3 181.0 13 3 -4.2% 3 1
Jordan Kuwait Bank 178.5 13 4 55.7 7 1 220.4% 14 5
Housing Bank 308.6 14 5 319.1 14 5 -3.3% 4 2
Total Group (B) 936.0 766.4 22.1%
Group (C)
Cairo Amman Bank 67.6 6 1 50.1 5 1 34.9% 10 2
Bank al Etihad 129.1 8 2 83.1 8 2 55.4% 12 3
Capital Bank 163.9 9 3 157.6 12 3 4.0% 5 1
Total Group (C) 360.7 290.9 24.0%
Group (D)
Jordan Dubai Islamic Bank 12.3 1 1 1.2 1 1 901.5% 15 6
Societe Generale 15.3 2 2 16.0 2 2 -4.4% 2 1
Arab Banking Corporation (ABC) 29.6 3 3 20.5 3 3 44.5% 11 4
Arab Jordan Investment Bank 32.9 4 4 20.8 4 4 58.6% 13 5
Invest Bank 64.2 5 5 54.3 6 5 18.3% 7 3
Jordan Commercial Bank 102.2 7 6 91.2 9 6 12.0% 6 2
Total Group (D) 256.5 204.0 25.7%
Grand Total 2,514.6 2,270.7 10.7%
* Loans = Direct Credit Facilities.

21
Table No. 12
Non- Performing Loans / Gross Loans
Banks
12/2011 12/2010
RatioRank among
Banks Rank among
Group Ratio
Rank among Banks
Rank among Group
Group (A)
Arab Bank Plc 6.4% 4 6.8% 7
Group (B)
Jordan Islamic Bank 7.0% 6 1 5.7% 6 2
Housing Bank 8.2% 8 2 8.7% 11 4
Bank of Jordan 8.9% 9 3 7.7% 8 3
Jordan Kuwait Bank 9.7% 10 4 3.3% 2 1
Jordan Ahli Bank 9.7% 11 5 11.2% 13 5
Group (B) Ratio 8.6% 7.5%
Group (C)
Cairo Amman Bank 4.8% 2 1 4.1% 3 1
Bank al Etihad 11.9% 12 2 7.9% 9 2
Capital Bank 16.5% 15 3 15.6% 14 3
Group (C) Ratio 10.4% 8.9%
Group (D)
Jordan Dubai Islamic Bank 3.3% 1 1 0.6% 1 1
Arab Banking Corporation (ABC) 5.1% 3 2 4.5% 5 3
Arab Jordan Investment Bank 6.7% 5 3 4.4% 4 2
Societe Generale 7.6% 7 4 8.3% 10 4
Invest Bank 11.9% 13 5 10.4% 12 5
Jordan Commercial Bank 16.1% 14 6 16.0% 15 6
Group (D) Ratio 9.1% 8.4%
Sector Ratio 7.8% 7.4%
Standard Ratio < 10%

22
Table No. 13
Coverage Ratio (Provision for Impairment in Direct Credit Facilities) / Principal of Non-Performing Loans)
Banks
12/2011 12/2010
RatioRank among
Banks Rank among
Group Ratio
Rank among Banks
Rank among Group
Group (A)
Arab Bank Plc 84.9% 2 70.7% 4
Group (B)
Housing Bank 74.0% 4 1 63.1% 9 4
Jordan Ahli Bank 71.6% 6 2 63.5% 8 3
Bank of Jordan 68.0% 8 3 68.1% 6 2
Jordan Islamic Bank 55.4% 10 4 49.9% 13 5
Jordan Kuwait Bank 44.7% 12 5 108.6% 2 1
Group (B) Ratio 64.4% 65.4%
Group (C)
Cairo Amman Bank 94.3% 1 1 124.6% 1 1
Bank al Etihad 47.8% 11 2 56.2% 11 2
Capital Bank 41.1% 14 3 39.8% 14 3
Group (C) Ratio 53.5% 59.1%
Group (D)
Societe Generale 75.8% 3 1 70.6% 5 2
Arab Banking Corporation (ABC) 73.9% 5 2 89.0% 3 1
Invest Bank 68.8% 7 3 53.5% 12 5
Arab Jordan Investment Bank 62.6% 9 4 66.6% 7 3
Jordan Commercial Bank 41.4% 13 5 23.3% 15 6
Jordan Dubai Islamic Bank 28.5% 15 6 56.5% 10 4
Group (D) Ratio 56.2% 46.3%
Sector Ratio 69.8% 65.2%
23
Table No. 14
Non- Performing Loans -Provision for Impairment in Direct Credit Facilities / Equity
Banks
12/2011 12/2010
RatioRank among
Banks Rank among
Group Ratio
Rank among Banks
Rank among Group
Group (A)
Arab Bank Plc 2.7% 2 5.5% 6
Group (B)
Housing Bank 5.4% 6 1 8.2% 8 2
Bank of Jordan 11.4% 9 2 10.5% 9 3
Jordan Ahli Bank 13.7% 10 3 20.7% 13 5
Jordan Kuwait Bank 19.9% 11 4 -1.0% 2 1
Jordan Islamic Bank 20.8% 12 5 18.5% 12 4
Group (B) Ratio 11.0% 9.3%
Group (C)
Cairo Amman Bank 1.2% 1 1 -4.2% 1 1
Bank al Etihad 21.3% 13 2 11.0% 10 2
Capital Bank 30.9% 14 3 31.5% 14 3
Group (C) Ratio 17.8% 12.9%
Group (D)
Societe Generale 4.4% 3 1 5.8% 7 4
Arab Banking Corporation (ABC) 4.6% 4 2 1.5% 4 2
Jordan Dubai Islamic Bank 5.4% 5 3 0.3% 3 1
Arab Jordan Investment Bank 6.7% 7 4 3.8% 5 3
Invest Bank 10.8% 8 5 16.6% 11 5
Jordan Commercial Bank 46.0% 15 6 52.7% 15 6
Group (D) Ratio 12.3% 12.9%
Sector Ratio 7.4% 7.9%

24
Table No. 15
Pre-Taxes Profits (Losses) In millions USD
Banks
12/2011 12/2010 Changes
BalanceRank
amongBanks
RankamongGroup
BalanceRank
amongBanks
RankamongGroup
RatioRank
amongBanks
RankamongGroup
Group (A)
Arab Bank Plc 471.2 1 308.5 1 52.7% 1
Group (B)
Housing Bank 191.4 2 1 164.2 2 1 16.6% 2 1
Jordan Kuwait Bank 78.5 3 2 104.2 3 2 -24.7% 10 5
Bank of Jordan 70.1 5 3 64.1 4 3 9.3% 4 2
Jordan Islamic Bank 56.0 6 4 57.4 6 4 -2.4% 8 4
Jordan Ahli Bank 47.4 7 5 48.6 7 5 -2.3% 7 3
Total Group (B) 443.4 438.4 1.1%
Group (C)
Cairo Amman Bank 71.8 4 1 66.5 5 1 8.1% 5 1
Bank al Etihad 19.5 10 2 42.8 8 2 -54.3% 13 2
Capital Bank 2.8 14 3 10.5 12 3 -73.1% 14 3
Total Group (C) 94.2 119.7 -21.3%
Group (D)
Arab Banking Corporation (ABC) 23.4 8 1 20.2 11 3 15.5% 3 1
Arab Jordan Investment Bank 23.2 9 2 22.3 10 2 3.8% 6 2
Invest Bank 19.3 11 3 22.4 9 1 -14.0% 9 3
Jordan Dubai Islamic Bank 7.1 12 4 -5.7 15 6 -224.9% 15 6
Societe Generale 6.8 13 5 9.3 14 5 -26.7% 11 4
Jordan Commercial Bank -1.4 15 6 10.1 13 4 -113.8% 12 5
Total Group (D) 78.2 78.6 -0.5%
Grand Total 1,087.0 945.3 15.0%

25
Table No. 16
Net-Interest / Gross Income
Banks
12/2011 12/2010
RatioRank among
Banks Rank among
Group Ratio
Rank among Banks
Rank among Group
Group (A)
Arab Bank Plc 63.9% 13 61.5% 13
Group (B)
Jordan Kuwait Bank 78.6% 1 1 76.5% 4 1
Bank of Jordan 71.8% 3 2 75.4% 5 2
Jordan Ahli Bank 69.9% 6 3 67.8% 11 4
Housing Bank 67.0% 10 4 71.8% 8 3
Group (B) Ratio 70.4% 72.6%
Group (C)
Bank al Etihad 77.1% 2 1 73.8% 6 2
Cairo Amman Bank 70.1% 5 2 72.5% 7 3
Capital Bank 65.6% 11 3 76.7% 3 1
Group (C) Ratio 70.8% 73.8%
Group (D)
Arab Banking Corporation (ABC) 70.5% 4 1 71.4% 9 3
Arab Jordan Investment Bank 68.5% 7 2 82.7% 1 1
Societe Generale 68.2% 8 3 68.0% 10 4
Invest Bank 67.8% 9 4 66.4% 12 5
Jordan Commercial Bank 65.6% 12 5 76.9% 2 2
Group (D) Ratio 61.3% 71.0%
Sector Ratio 67.4% 67.7%

26
Table No. 17
Income (loss) from Financial Assets (In Millions USD)
Banks
12/2011 12/2010 Changes
BalanceRank
amongBanks
RankamongGroup
BalanceRank
amongBanks
RankamongGroup
AmountRank
amongBanks
RankamongGroup
Group (A)
Arab Bank Plc 3.4 9 59.1 1 -55.7 15
Group (B)
Housing Bank 19.1 1 1 9.6 2 1 9.5 2 1
Bank of Jordan 8.4 3 2 3.9 6 5 4.4 4 2
Jordan Kuwait Bank 6.3 4 3 8.7 3 2 -2.4 13 4
Jordan Islamic Bank 4.5 7 4 5.8 4 3 -1.3 12 3
Jordan Ahli Bank 0.6 11 5 4.2 5 4 -3.6 14 5
Total Group (B) 38.9 32.3 6.6
Group (C)
Cairo Amman Bank 11.8 2 1 1.8 7 1 9.9 1 1
Capital Bank -0.4 13 2 -0.2 12 2 -0.3 11 3
Bank al Etihad -1.4 15 3 -1.2 13 3 -0.2 10 2
Total Group (C) 9.9 0.4 9.5
Group (D)
Arab Jordan Investment Bank 6.1 5 1 -3.1 14 5 9.2 3 1
Arab Banking Corporation (ABC) 4.7 6 2 0.9 9 2 3.8 6 3
Invest Bank 4.2 8 3 0.3 10 3 3.9 5 2
Jordan Dubai Islamic Bank 1.1 10 4 1.0 8 1 0.1 8 5
Societe Generale 0.03 12 5 0.01 11 4 0.0 9 6
Jordan Commercial Bank -1.0 14 6 -3.4 15 6 2.4 7 4
Total Group (D) 15.1 -4.3 19.4
Grand Total 67.3 87.5 -20.2

27
Table No. 18
Credit and Deposits Interest Rate Structure ( % )
Item’s 12 / 2011 12 / 2010Change
( Basis Point )
Deposits
Current 0.43 0.44 (0.01)
Saving 0.70 0.77 (0.07)
Time 3.46 3.40 0.06
Credit Facilities
Discounted Bills & Bounds 9.34 9.41 (0.07)
Loans and Advances 8.67 9.01 (0.34)
Overdraft 8.80 9.12 (0.32)
Prime Lending Rate 8.22 8.20 0.02
Source : Central Bank of Jordan / Monthly Statistical Bulletin.

28
Table No. 19
Funding Costs
Banks
12/2011 12/2010
RatioRank among
Banks Rank among
Group Ratio
Rank among Banks
Rank among Group
Group (A)
Arab Bank Plc 1.8% 2 1.7% 1
Group (B)
Housing Bank 1.6% 1 1 1.7% 2 1
Bank of Jordan 1.8% 3 2 1.8% 3 2
Jordan Kuwait Bank 1.9% 5 3 2.0% 5 3
Jordan Ahli Bank 2.1% 6 4 2.4% 7 4
Group (B) Ratio 1.8% 1.9%
Group (C)
Cairo Amman Bank 1.9% 4 1 2.0% 4 1
Bank al Etihad 2.5% 9 2 2.5% 8 2
Capital Bank 3.4% 13 3 3.5% 13 3
Group (C) Ratio 2.5% 2.5%
Group (D)
Arab Banking Corporation (ABC) 2.4% 7 1 2.3% 6 1
Arab Jordan Investment Bank 2.5% 8 2 2.9% 9 2
Invest Bank 3.1% 10 3 3.0% 10 3
Jordan Commercial Bank 3.1% 11 4 3.1% 11 4
Societe Generale 3.1% 12 5 3.1% 12 5
Group (D) Ratio 2.8% 2.8%
Sector Ratio 1.9% 1.9%

29
Table No. 20
General and Administrative Expenses / Net Interest and Commissions Ratio
Banks
12/2011 12/2010
RatioRank among
Banks Rank among
Group Ratio
Rank among Banks
Rank among Group
Group (A)
Arab Bank Plc 51.6% 9 50.1% 10
Group (B)
Jordan Kuwait Bank 30.3% 1 1 31.5% 2 1
Bank of Jordan 42.4% 5 2 43.7% 7 3
Housing Bank 42.6% 6 3 39.1% 4 2
Jordan Ahli Bank 55.6% 12 4 55.6% 13 4
Group (B) Ratio 42.8% 41.6%
Group (C)
Bank al Etihad 36.2% 2 1 29.5% 1 1
Capital Bank 39.3% 3 2 42.8% 6 2
Cairo Amman Bank 50.5% 8 3 48.5% 8 3
Group (C) Ratio 44.0% 41.7%
Group (D)
Invest Bank 39.6% 4 1 37.2% 3 1
Arab Jordan Investment Bank 46.1% 7 2 41.2% 5 2
Arab Banking Corporation (ABC) 54.3% 10 3 51.0% 11 4
Jordan Commercial Bank 55.0% 11 4 49.6% 9 3
Societe Generale 60.1% 13 5 52.0% 12 5
Group (D) Ratio 57.8% 52.4%
Sector Ratio 47.4% 45.6%
Standard Ratio < =60%

30
Table No. 21
General and Administrative Expenses / Revenues Ratio
Banks
12/2011 12/2010
RatioRank among
Banks Rank among
Group Ratio
Rank among Banks
Rank among Group
Group (A)
Arab Bank Plc 30.0% 9 28.4% 8
Group (B)
Jordan Kuwait Bank 20.1% 1 1 20.3% 2 1
Housing Bank 25.8% 6 2 24.4% 5 2
Bank of Jordan 28.8% 8 3 30.3% 11 3
Jordan Ahli Bank 34.2% 12 4 33.2% 12 4
Group (B) Ratio 26.9% 26.4%
Group (C)
Capital Bank 22.0% 3 1 23.0% 4 2
Bank al Etihad 22.3% 4 2 18.9% 1 1
Cairo Amman Bank 34.6% 13 3 34.2% 13 3
Group (C) Ratio 27.8% 26.8%
Group (D)
Invest Bank 21.6% 2 1 21.3% 3 1
Arab Jordan Investment Bank 24.7% 5 2 24.7% 6 2
Jordan Commercial Bank 27.4% 7 3 29.3% 9 4
Societe Generale 30.4% 10 4 27.9% 7 3
Arab Banking Corporation (ABC) 30.7% 11 5 29.9% 10 5
Group (D) Ratio 28.7% 29.8%
Sector Ratio 28.4% 27.4%
Standard Ratio 25%-30%
31
Table No. 22
Return On Average Assets (ROAA)
Banks
12/2011 12/2010
RatioRank among
Banks Rank among
Group Ratio
Rank among Banks
Rank among Group
Group (A)
Arab Bank Plc 1.4% 10 0.9% 13
Group (B)
Jordan Kuwait Bank 2.6% 2 1 3.5% 1 1
Bank of Jordan 2.5% 3 2 2.3% 4 2
Housing Bank 2.0% 6 3 1.8% 9 3
Jordan Islamic Bank 1.4% 9 4 1.7% 10 4
Jordan Ahli Bank 1.3% 12 5 1.4% 11 5
Group (B) Ratio 1.9% 2.0%
Group (C)
Cairo Amman Bank 2.7% 1 1 2.6% 2 1
Bank al Etihad 0.9% 13 2 2.0% 7 2
Capital Bank 0.2% 14 3 0.7% 14 3
Group (C) Ratio 1.4% 1.9%
Group (D)
Arab Banking Corporation (ABC) 2.3% 4 1 2.2% 5 2
Invest Bank 2.0% 5 2 2.4% 3 1
Arab Jordan Investment Bank 1.8% 7 3 1.9% 8 4
Jordan Dubai Islamic Bank 1.6% 8 4 -2.0% 15 6
Societe Generale 1.4% 11 5 2.0% 6 3
Jordan Commercial Bank -0.1% 15 6 1.0% 12 5
Group (D) Ratio 1.5% 1.6%
Sector Ratio 1.6% 1.4%
Standard Ratio > =1%
32
Table No. 23
Return On Average Equity (ROAE)
Banks
12/2011 12/2010
RatioRank among
Banks Rank among
Group Ratio
Rank among Banks
Rank among Group
Group (A)
Arab Bank Plc 8.8% 10 5.8% 13
Group (B)
Jordan Islamic Bank 19.8% 2 1 22.0% 3 2
Bank of Jordan 19.4% 3 2 20.2% 4 3
Jordan Kuwait Bank 16.3% 4 3 23.7% 2 1
Jordan Ahli Bank 13.9% 6 4 15.5% 6 4
Housing Bank 13.1% 7 5 11.7% 11 5
Group (B) Ratio 15.1% 16.0%
Group (C)
Cairo Amman Bank 23.7% 1 1 24.6% 1 1
Bank al Etihad 6.0% 12 2 13.1% 8 2
Capital Bank 0.9% 14 3 3.5% 14 3
Group (C) Ratio 10.1% 13.4%
Group (D)
Arab Banking Corporation (ABC) 14.7% 5 1 14.2% 7 2
Arab Jordan Investment Bank 12.7% 8 2 12.4% 9 3
Invest Bank 11.4% 9 3 15.8% 5 1
Societe Generale 8.2% 11 4 11.9% 10 4
Jordan Dubai Islamic Bank 4.5% 13 5 -3.6% 15 6
Jordan Commercial Bank -1.1% 15 6 7.7% 12 5
Group (D) Ratio 8.9% 9.5%
Sector Ratio 10.8% 9.6%
Standard Ratio > = 15%
33
Table No. 24
Earning Per Share (EPS) In USD
Banks
12/2011 12/2010
RatioRank among
Banks Rank among
Group Ratio
Rank among Banks
Rank among Group
Group (A)
Arab Bank Plc 0.695 1 0.383 5
Group (B)
Jordan Kuwait Bank 0.563 2 1 0.732 1 1
Housing Bank 0.492 4 2 0.441 3 2
Jordan Islamic Bank 0.399 5 3 0.410 4 3
Bank of Jordan 0.355 6 4 0.347 6 4
Jordan Ahli Bank 0.219 7 5 0.255 8 5
Group (C)
Cairo Amman Bank 0.516 3 1 0.489 2 1
Bank al Etihad 0.148 11 2 0.303 7 2
Capital Bank 0.010 14 3 0.045 14 3
Group (D)
Arab Banking Corporation (ABC) 0.178 8 1 0.164 11 3
Arab Jordan Investment Bank 0.166 9 2 0.165 10 2
Invest Bank 0.158 10 3 0.181 9 1
Societe Generale 0.092 12 4 0.130 12 4
Jordan Dubai Islamic Bank 0.085 13 5 -0.055 15 6
Jordan Commercial Bank -0.023 15 6 0.075 13 5

34
Table No. 25
Price / Earning Ratio (P/E)
Banks
12/2011 12/2010
RatioRank among
Banks Rank among
Group Ratio
Rank among Banks
Rank among Group
Group (A)
Arab Bank Plc 15.9 12 36.7 13
Group (B)
Bank of Jordan 8.1 3 1 12.0 8 4
Jordan Kuwait Bank 9.1 4 2 8.3 1 1
Jordan Ahli Bank 9.2 5 3 10.6 6 3
Jordan Islamic Bank 9.7 6 4 10.3 5 2
Housing Bank 22.9 13 5 25.9 11 5
Group (C)
Cairo Amman Bank 7.6 1 1 9.2 2 1
Bank al Etihad 13.7 9 2 9.3 3 2
Capital Bank 194.3 14 3 48.1 14 3
Group (D)
Arab Banking Corporation (ABC) 7.8 2 1 9.9 4 1
Arab Jordan Investment Bank 11.1 7 2 12.1 9 3
Invest Bank 12.0 8 3 12.6 10 4
Jordan Dubai Islamic Bank 14.5 10 4 -32.8 15 6
Societe Generale 14.6 11 5 11.7 7 2
Jordan Commercial Bank -68.8 15 6 33.0 12 5

35
Table No. 26
Market Capitalization (In millions USD)
Banks
12/2011 12/2010 Changes
BalanceRank
amongBanks
RankamongGroup
BalanceRank
amongBanks
RankamongGroup
RatioRank
amongBanks
RankamongGroup
Group (A)
Arab Bank Plc 5,912.4 1 7,516.7 1 -21.3% 13
Group (B)
Housing Bank 2,843.4 2 1 2,879.0 2 1 -1.2% 4 3
Jordan Kuwait Bank 510.6 3 2 609.3 3 2 -16.2% 11 5
Bank of Jordan 448.5 4 3 417.5 6 4 7.4% 2 1
Jordan Islamic Bank 387.9 6 4 423.1 5 3 -8.3% 7 4
Jordan Ahli Bank 302.5 7 5 297.9 8 5 1.6% 3 2
Total Group (B) 4,492.9 4,626.8 -2.9%
Group (C)
Cairo Amman Bank 390.7 5 1 448.5 4 1 -12.9% 10 2
Capital Bank 287.7 8 2 325.8 7 2 -11.7% 9 1
Bank al Etihad 203.1 9 3 283.5 9 3 -28.4% 14 3
Total Group (C) 881.5 1,057.8 -16.7%
Group (D)
Arab Jordan Investment Bank 184.8 10 1 200.3 10 1 -7.7% 6 3
Invest Bank 155.5 11 2 176.0 12 3 -11.7% 8 4
Jordan Commercial Bank 128.4 12 3 198.3 11 2 -35.3% 15 6
Arab Banking Corporation (ABC) 123.8 13 4 129.8 14 5 -4.6% 5 2
Jordan Dubai Islamic Bank 109.2 14 5 135.4 13 4 -19.3% 12 5
Societe Generale 67.0 15 6 61.6 15 6 8.7% 1 1
Total Group (D) 768.7 901.4 -14.7%
Grand Total 12,055.5 14,102.7 -14.5%
Related Documents


![Key Performance Indicators[1]](https://static.cupdf.com/doc/110x72/55cf99af550346d0339ea5e6/key-performance-indicators1.jpg)