KAZAKHSTAN AGRICULTURAL SECTOR RISK ASSESSMENT Sandra Broka, Åsa Giertz, Garry Christensen, Debra Rasmussen, Alexei Morgounov, Turi Fileccia, and Rhoda Rubaiza World Bank Group Report Number 103076-KZ FEBRUARY 2016 AGRICULTURE GLOBAL PRACTICE TECHNICAL ASSISTANCE PAPER Public Disclosure Authorized Public Disclosure Authorized Public Disclosure Authorized Public Disclosure Authorized

Welcome message from author
This document is posted to help you gain knowledge. Please leave a comment to let me know what you think about it! Share it to your friends and learn new things together.
Transcript
KAZAKHSTANAGRICULTURAL SECTOR RISK ASSESSMENT
Sandra Broka, Åsa Giertz, Garry Christensen, Debra Rasmussen, Alexei Morgounov, Turi Fileccia, and Rhoda Rubaiza
World Bank Group Report Number 103076-KZ FEBRUARY 2016
AGRiCulTuRe GloBAl PRACTiCe TeChniCAl ASSiSTAnCe PAPeR
Pub
lic D
iscl
osur
e A
utho
rized
Pub
lic D
iscl
osur
e A
utho
rized
Pub
lic D
iscl
osur
e A
utho
rized
Pub
lic D
iscl
osur
e A
utho
rized
KAZAKHSTANAGRICULTURAL SECTOR RISK ASSESSMENT
Sandra Broka, Åsa Giertz, Garry Christensen, Debra Rasmussen, Alexei Morgounov, Turi Fileccia, and Rhoda Rubaiza
World Bank Group Report Number 103076-KZ FEBRUARY 2016
AGRiCulTuRe GloBAl PRACTiCe TeChniCAl ASSiSTAnCe PAPeR
© 2016 World Bank Group
1818 H Street NW
Washington, DC 20433
Telephone: 202-473-1000
Internet: www.worldbank.org
Email: [email protected]
All rights reserved
This volume is a product of the staff of the World Bank Group. The findings, interpretations, and conclusions
expressed in this paper do not necessarily reflect the views of the Executive Directors of the World Bank Group
or the governments they represent.
The World Bank Group does not guarantee the accuracy of the data included in this work. The boundaries,
colors, denominations, and other information shown on any map in this work do not imply any judgment on
the part of the World Bank Group concerning the legal status of any territory or the endorsement or acceptance
of such boundaries.
Rights and Permissions
The material in this publication is copyrighted. Copying and/or transmitting portions or all of this work without
permission may be a violation of applicable law. World Bank Group encourages dissemination of its work and
will normally grant permission to reproduce portions of the work promptly.
For permission to photocopy or reprint any part of this work, please send a request with complete information
to the Copyright Clearance Center, Inc., 222 Rosewood Drive, Danvers, MA 01923, USA, telephone: 978-750-
8400, fax: 978-750-4470, http://www.copyright.com/.
All other queries on rights and licenses, including subsidiary rights, should be addressed to the Office of the
Publisher, World Bank Group, 1818 H Street NW, Washington, DC 20433, USA, fax: 202-522-2422, e-mail:
Cover image credit: Mariusz Kluzniak
ii
Contents
Abbreviations vi
Acknowledgements vii
Executive Summary viii
Introduction 1
Part I Risk Identification and Quantification 15
Crop Production 17
Livestock Production 21
Price Risks 26
Enabling Environment Risks 29
Agricultural Policy and Support 30
Costing and Prioritizing Agricultural Risks 34
Livestock Commodity Risks 38
A Timeline of Agriculture Sector Shocks: 1992–2012 40
Ranking and Prioritizing Agriculture Sector Risks 41
Solutions Area 1. Improve Wheat Productivity 48
Options for Scaling up 68
Potential Interventions 68
Solutions Area 2. Diversify Agricultural Production 78
Overview of the Risk Management Framework 90
Potential Interventions 94
Solutions Area 3. Improve Livestock Productivity 104
The Risk Management Framework 113
Potential Interventions 116
Summary and Recommendations of the Solutions Areas 128
Appendix A Risk Assessment Methodology 133
A. 1. Data Collection and Review of Each Country 133
A.2. Production: Price Derivation for Indicative Loss Analysis 135
Appendix B Chronology of Major Adverse Events in Kazakhstan 137
iii
Appendix C Coefficients of Variation and Adjusted Coefficients of Variation 139
Appendix D. Variation in Average Spring Wheat Grain Yield in Seven Regions of Kazakhstan, 1961–2014 140
Appendix E. Average Spring Wheat Area, Grain Yield, and Frequency of Poor Years in Seven Regions of
Kazakhstan and Saskatchewan Province of Canada, 1961–2014 147
Appendix F. Results of the Survey of the Stakeholders of Crop Risk Management Solutions in Kazakhstan,
March, 2015 (Total 37 Respondents) 148
Appendix G. Short Note on the Status of Wheat Varieties Release and Registration in the World with
Application to Kazakhstan 154
Appendix H Recommended Specialization Scheme in Kazakhstan, by Region and Rayon 156
Appendix I Review of Farms in Kazakhstan, by Region, 2013 181
References 182
List of Tables
Table ES.1 Agriculture Risk Management Action Plan Summary for Kazakhstan x
Table 1 Main Agro-Ecological Zones of Kazakhstan 7
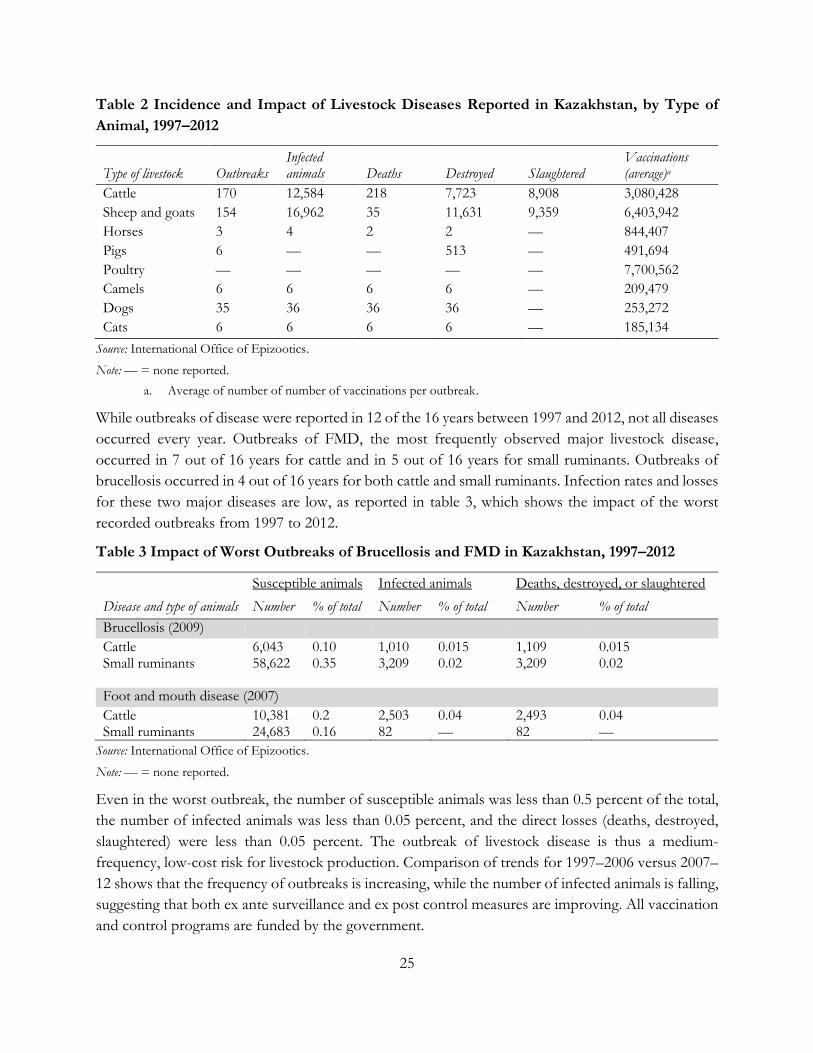
Table 2 Incidence and Impact of Livestock Diseases Reported in Kazakhstan, 1997–2012 25
Table 3 Impact of Worst Outbreaks of Brucellosis and FMD in Kazakhstan, 1997–2012 25
Table 4 Impact and Causes of Adverse Events for Aggregate Agricultural Output in Kazakhstan 35
Table 5 Impact and Causes of Adverse Events for Crop Commodities in Kazakhstan 37
Table 6 Impact and Causes of Adverse Events for Livestock Commodities in Kazakhstan 38
Table 7 Impact and Causes of Adverse Events for Commodity Prices in Kazakhstan 39
Table 8 Important Risks for Wheat Production in Northern Kazakhstan 51
Table 9 Current and Recommended Crop Area in Kazakhstan in 2013–20 54
Table 10 Risks and Proposed Responses 70
Table 11 Classification of Wheat Grain Quality in Major Exporting Countries 74
Table 12 Number of Varieties in the Formal Registration List in Kazakhstan, 2013 84
Table 13 Production, Imports, and Exports of Oilseed Crops in Kazakhstan, 2011–14 85
Table 14 Production, Imports, and Exports of Pulse Crops in Kazakhstan, 2011–14 tons (thousands) 87
Table 15 Waste and Losses along the Supply Chain for Key Crop Commodities in Kazakhstan 87
Table 16 Yield per Hectare of Annual Crops in Kazakhstan 90
Table 17 Structure of the Agriculture Development Budget in Kazakhstan 93
Table 18 Risks and proposed responses for diversification 96
Table 19 Private Farms Registered as Individual Entrepreneurs in Kazakhstan, 2013 97
iv
Table 20 Agricultural Enterprises in Kazakhstan, by Number of Units and Farmland Area, 2013 97
Table 21 Need for Machinery in No-Till Areas of Kazakhstan, 2015–20 98
Table 22 Envisaged Advancement of No-Till and Precision Agriculture Area in Kazakhstan, 2015–20 98
Table 23 Current Soil Moisture Observation Points of Kazhydromet 99
Table 24 Main Economic Indicators of Crops in Kazakhstan 100
Table 25 Risks and Proposed Responses 119
Table 26 Summary of Actions 129
List of Figures
Figure 1 Percentage of Land Irrigated in Kazakhstan 5
Figure 2 Annual Precipitation in Kazakhstan 6
Figure 3 Agro-Ecological Zones in Kazakhstan 6
Figure 4 Historic Trends in Temperature and Precipitation in Kazakhstan, 1950–2000 10
Figure 5 Implications of climate change for agriculture risk management 11
Figure 6 National and Agriculture GDP in Kazakhstan, 1990–2012 12
Figure 7 Components of Gross Agricultural Output in Kazakhstan, 1994–2011 13
Figure 8 Gross Agricultural Output in Kazakhstan, by Type of Farm, 1997–2013 14
Figure 9 Incidence of Natural Disasters in Kazakhstan, by Region, 1995–2012 15
Figure 10 Frequency of Natural Disasters in Kazakhstan, 1985–2013 16
Figure 11 Regions Affected by Locust Infestation in Kazakhstan 17
Figure 12 Wheat Production in Kazakhstan, 1990–2013 18
Figure 13 Potato Production in Kazakhstan, 1990–2013 19
Figure 14 Tomato Production in Kazakhstan, 1990–2013 20
Figure 15 Number of Livestock in Kazakhstan, 1990–2013 21
Figure 16 Annual Variation in Livestock Numbers in Kazakhstan, 1993–2013 22
Figure 17 Cow’s Milk Production in Kazakhstan, 1992–2012 23
Figure 18 Beef and Mutton Production in Kazakhstan, 1992–2012 23
Figure 19 Egg Production in Kazakhstan, 1992–2012 24
Figure 20 Wheat Prices in Kazakhstan, 1994–2012 27
Figure 21 Real Producer Prices for Potatoes and Tomatoes in Kazakhstan, 1994–2012 28
Figure 22 Real Producer Prices for Livestock Commodities in Kazakhstan, 1994–2012 29
Figure 23 Nominal Exchange Rates, 1994–2013 30
Figure 24 Budget Support for Agriculture (Real Prices) in Kazakhstan, 1997–2012 31
Figure 25 Indicative Losses in Constant Prices in Kazakhstan, 1993–2012 40
v
Figure 26 Indicative Losses in Real Prices in Kazakhstan, 1993–2012 41
Figure 27 Shocks to Physical Output in Constant Prices in Kazakhstan 42
Figure 28 Joint Shocks to Production and Prices in Real Prices in Kazakhstan 43
Figure 29 Shocks to Physical Output in Constant Prices in Kazakhstan, by Commodity 44
Figure 30 Joint Production and Price Shocks in Real Prices in Kazakhstan, by Commodity 44
Figure 31 Probability of Commodity Price Shocks in Real Prices in Kazakhstan 45
Figure 32 Dynamics of Wheat Grain Yield in Kazakhstan, 1961–1990 and 1991–2014 48
Figure 33 Changes in Air Temperature and Precipitation in Kazakhstan over Time 50
Figure 34 Average Yield of Spring Bread Wheat (BW) and Spring Durum Wheat (DW), 2004–14 59
Figure 35 Yields of Spring Wheat and Barley in Kazakhstan, by Region, 2006–14 62
Figure 36 Agro-Ecologies of Kazakhstan 79
Figure 37 Vulnerability to Climate Change in Kazakhstan, by Region 80
Figure 38 Expansion of Oilseed Crop Area in Kazakhstan, 1990–2014 Hectares (thousands) 81
Figure 39 Expansion of Fodder Crop Area in Kazakhstan, 1990–2014 Hectares (thousands) 81
Figure 40 Wheat Yields in Kazakhstan, 1990–2014 82
Figure 41 Area Share of Oilseed Crops in Kazakhstan, 2008–14 85
Figure 42 Cropped Area for Pulses in Kazakhstan, 1990–2013 86
Figure 43 Average Growth Rates for Red Grass (Solid Line) and Annual Pasture for Cereal Species 89
Figure 44 Total Sown Area in Kazakhstan, 1990–2014 (thousands of hectares) 90
Figure 45 Budget Priorities of the Agribusiness 2020 Program in Kazakhstan 92
Figure 46 Ministry of Agriculture Budget in Kazakhstan, 1997–2012 (US$ millions) 93
Figure 47 Ministry of Agriculture Budget in Kazakhstan, 1997–2012, by Main Categories 94
Figure 48 Profitability of Crops in Kazakhstan 101
Figure 49 Total Area Sown in Kazakhstan, by Oblast, 1990–2014 102
Figure 50 Risk Layering 118
List of Boxes
Box 1 Climate Change Risk Adaptation Strategies in Canada and Australia 65
Box 2 Features of No-till, Conservation Agriculture in Kazakhstan 83
Box 3 Weather Forecasting in the Kyrgyz Republic 115
Box 4 LEWS in Mongolia 124
Box 5 The Canada-China Feed Industry Project 126
vi
Abbreviations
ACP Agriculture Competitiveness Project
CIMMYT International Maize and Wheat Improvement Center
CO2 carbon dioxide
CV coefficient of variation
DMP Drylands Management Project
D-RMP Diversification-Risk Management Program
FAO Food and Agriculture Organization
FMD foot and mouth disease
GAO gross agricultural output
GDP gross domestic product
GEF Global Environment Fund
GIZ German Agency for International Cooperation
GMO genetically moderated organism
IPCC Intergovernmental Panel on Climate Change
ISTC International Science and Technology Center
KAI KazAgroInnovation
KASIB Kazakhstan-Siberia Regional Network on Spring Wheat Improvement
LEWS livestock early warning system
LSU livestock unit
MOA Ministry of Agriculture
NGO nongovernmental organization
OECD Organisation for Economic Co-operation and Development
OIE International Office of Epizootics
PES payment for environmental services
R&D research and development
SRM sustainable rangeland management
TOT training of trainers
UNDP United Nations Development Programme
UNFCCC United Nations Framework Convention on Climate Change
UPOV International Union for the Protection of New Varieties of Plants
WTO World Trade Organization
vii
Acknowledgements
This report was prepared by a team led by Sandra Broka (Task Team Leader, Senior Rural Finance
Specialist, GFADR) and Åsa Giertz (co-Task Team Leader, Senior Agriculture Economist, GFADR),
and comprising Garry Christensen (Lead Author), Debra Rasmussen, Alexei Morgounov, Turi
Fileccia, Rhoda Rubaiza, Talimjan Urazov, Ruslan Suzdykov, Kairat Nazhmidenov, Traci Johnson,
and Yelena Yakovleva. Jitendra Srivastava, Eugene Gurenko, Rupak Manvatkar, and Peter Wrede were
also part of the team. Elisabeth Forsyth and Gunnar Larson edited this report.
The team is grateful to the Government of Kazakhstan for their helpful collaboration and
contributions to the works during and beyond the field mission.
The team would like to thank Saroj Kumar Jha (Country Director, ECCU8), Dina Umali-Deininger
(Practice Manager, GWADR), and Ludmilla Butenko (Country Manager) for their valuable guidance
and support.
Diego Arias (Senior Agriculture Economist, GFADR); Daniel Clarke (Senior Insurance Specialist,
GFMDR); Heinz-Wilhelm Strubenhoff (Senior Operations Officer, GTCDR/IFC); and Amy Evans
(Food Safety Specialist, GFADR), and Adama Toure (Lead Agriculture Economist, GFADR) were
peer reviewers. Comments were also provided by Amy Evans (Food Safety Specialist, GFADR).
viii
Executive Summary
Agriculture is among the most risk-prone sectors in the economies of Central Asia. Production shocks
from weather, pests and diseases and adverse movements in agricultural product and input prices not
only impact farmers and agri-business firms, but can also strain government finances. Some of these
risks are small and localized and can be managed by producers. Others are the result of more severe,
exogenous shocks outside agriculture that require a broader response. Failure to respond adequately
to these more severe risks leads to a perpetual cycle of “shock-recovery-shock”, which reinforces
poverty traps and compromises long-term growth.
The agriculture sector’s exposure to production and price risk is increasing. Climate change is
increasing production risks in the short to medium-term by increasing the frequency and severity of
droughts and floods and in the longer-term by reducing the availability of water for irrigation due to
accelerated glacial melt. The modernization and commercialization of agricultural production and
processing, which is critical for sector growth, also raises the sector’s exposure to price risk at a time
of high volatility on international markets for agricultural commodities.
An effective response to these risks requires a broader, more integrated approach to risk management
than the current system of ex-ante, public sector activity associated with crop and livestock disease
and ad hoc, ex-post emergency responses to local disasters. Measures to strengthen risk mitigation
should be mainstreamed into sector development and investment programs, the potential for risk
transfer mechanisms should be developed where feasible, and a more systematic framework should
be developed for the public institutions responsible for ex-ante and ex-post risk management. A clear
view of the priorities for agriculture risk management is also required, together with a balanced view
of the respective roles of public and private sector stakeholders.
In response to these issues, the World Bank Group (WBG) initiated an agricultural sector risk
assessment in Kazakhstan in 2014, as part of a three-country study to improve agricultural risk
management at both national and regional level (the reports for the Kyrgyz Republic and Tajikistan
are also available). Based on a national agriculture sector risk assessment framework developed by the
Bank's Agricultural Risk Management Team, this work has three phases. Phase I identifies, analyses
and prioritizes the systemic risks affecting production, markets, the enabling environment, and public
sector support to agriculture. The second phase focuses on solutions and strategies, and on the
instruments that will be most effective in reducing major risks, including technical assistance,
investments by local governments and development agencies - and how these instruments can best be
scaled up. Phase III of the study, which is not covered in this report, involves support for the public
sector to develop a systematic agricultural risk management plan. The ultimate objective of this body
of work is to reduce short and medium term volatility in the agricultural sector while improving
resilience over the longer term, thereby reducing vulnerability among all stakeholders and increasing
the potential success of agricultural investment and development strategies.
For purposes of discussion and analysis, risks to agriculture are defined as an uncertain or
unpredictable event with adverse consequences for the volume or value of agricultural output. Risk
ix
thus differs from constraints to agriculture, which are permanent impediments to sector output.
Sudden shocks to production (droughts, floods, locusts), prices or the enabling environment (sudden
policy changes or sharp, unexpected exchange rate movements) are thus considered risks; while factors
such as low productivity, poor access to credit, lack of labor and lack of information are viewed as
constraints. Analysis is based on the risks that led to significant shocks to agricultural output, at both
aggregate and commodity level, for the period from 1994-2012.
The risk analysis showed that while drought is the most frequently observed risk to agriculture in
Kazakhstan, it is not the most severe. The largest shocks result from a combination of drought and
exogenous price shocks, as occurred in 1995, 1998, 2010 and 2012. Crop production is more
vulnerable to risk than livestock due to the high dependence on dry land wheat production for export,
which exposes the sector to both production and price risk. Significantly, this exposure to risk is rising
due to the increasing role of wheat in total crop production (wheat currently accounts for
approximately two-thirds of total cropped area, versus one-third before 1990).
These conclusions led to a series of recommendations on ways to improve risk management, based
on three “Solution Areas:” (i) wheat productivity improvement, (ii) agricultural diversification, and (iii)
improved livestock productivity. All of these recommendations focus on agriculture in northern
Kazakhstan, which is the major source of agricultural output and exports and the most risk-prone
zone of production. Agriculture in southern Kazakhstan is more diversified and adverse events there
have less impact on gross agricultural output. The Government is also advised to continue exploring
the potential use of hedging instruments to reduce cereal price risk, and to review ways to improve
access to agricultural insurance based on previous work by the World Bank Group.
Much can be done to improve the productivity of wheat in the drought prone environment of
northern Kazakhstan, beginning with an increased emphasis on the development of wheat varieties
more tolerant to drought, heat stress and disease. The national research programs for varietal
development and testing should be strengthened in this context, with an increased focus on drought
research, wheat pathology and climate-resilient production systems. Varietal research and
development should also be linked more closely to the characteristics sought in current and potential
export markets for wheat as a means to broaden and diversify the production base for wheat. A
revision of the current system for wheat classification should also be implemented to further align
wheat exports with export market requirements. There is also scope to use subsidy programs to
promote the adoption of the climate smart technologies developed as a result of these initiatives. A
feasibility study of the potential for irrigation is also recommended as further means to increase wheat
productivity.
The Ministry of Agriculture has already embraced the need to diversify crop production in northern
Kazakhstan as a means to reduce exposure to risk, through policy measures and support for
investment. A broader, more integrated framework for extending these initiatives is recommended,
under the themes of technology diversification, land use diversification and crop diversification. The
use of climate-smart production systems such as conservation agriculture, no-till production and
precision agriculture can be expanded within the framework of technology diversification, and linked
x
directly to increased use of new drought and pest tolerant varieties. Improved storage and post-harvest
technologies can also be used to reduce losses. Land use diversification would entail an expansion of
existing programs to improve the use of uncropped or underutilized land suited to crop production.
Support for crop diversification would strengthen existing programs to expand production of oilseeds,
pulses and fodder crops, plus new initiatives to increase the use of feed grains (pasture cropping).
A broad-based program to improve livestock productivity is recommended to strengthen the resilience
of livestock production systems and rangeland use in Kazakhstan. Proposed interventions include
measures to: (i) reverse degradation of water, soil and vegetation cover; (ii) safeguard the long-term
viability of rangeland ecosystems, while ensuring sustainable access to grazing land; and (iii) strengthen
livestock services (veterinary, animal health, feed and fodder supply, destocking, water and grazing
access, and weather and market information). These measures will enable farmers to manage their
resources better, to respond to climate and market signals and to protect their resource base in times
of drought.
The recommendations developed under these three solution areas continue the underlying emphasis
on mitigation as the foundation for risk management. They also highlight the mutually reinforcing
benefits of measures to improve crop and livestock productivity for both risk management and sector
growth.
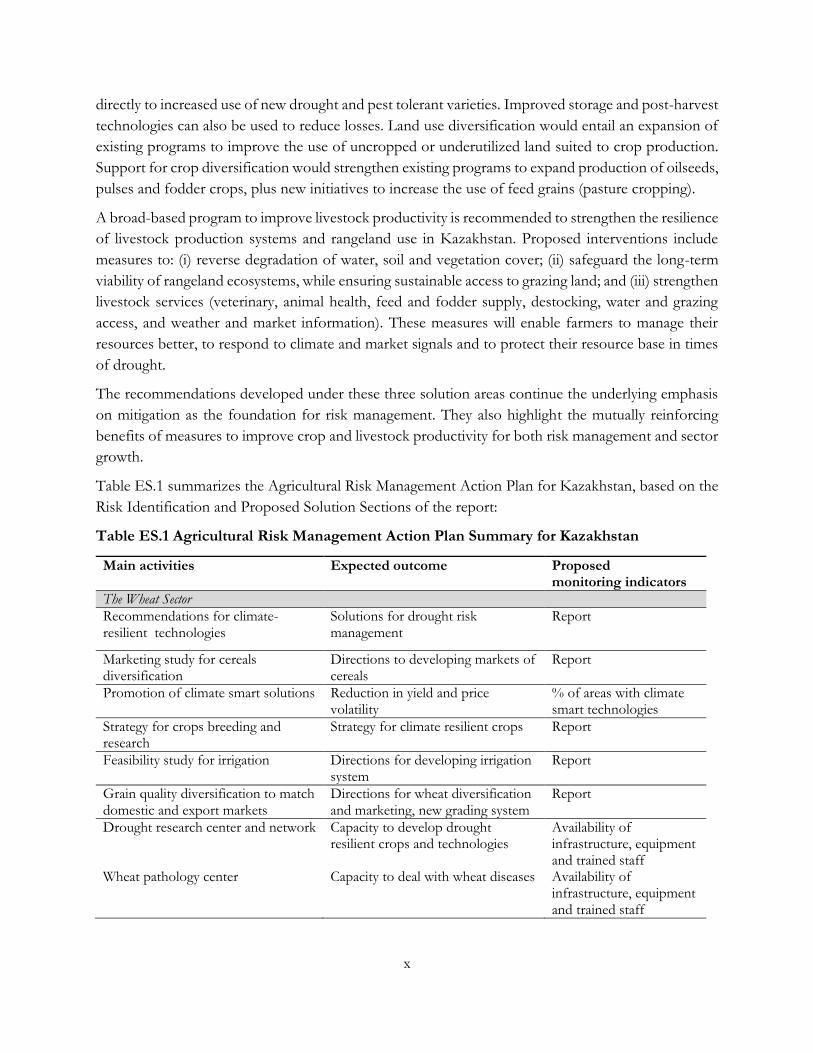
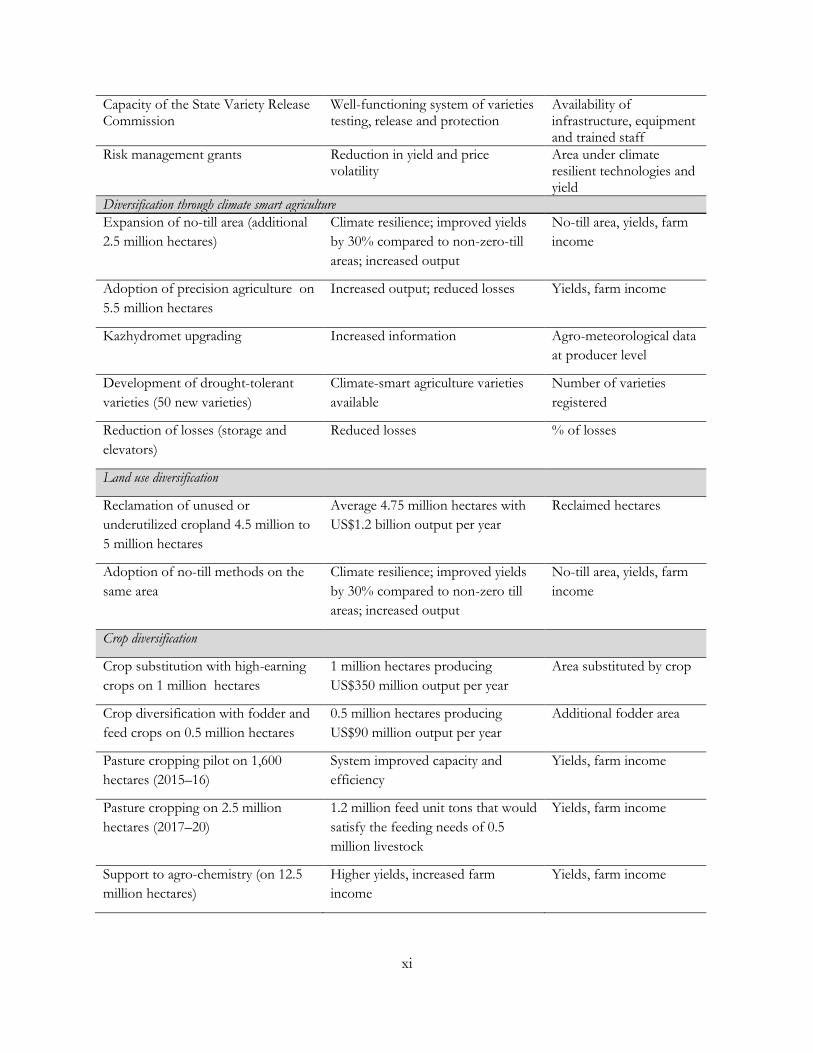
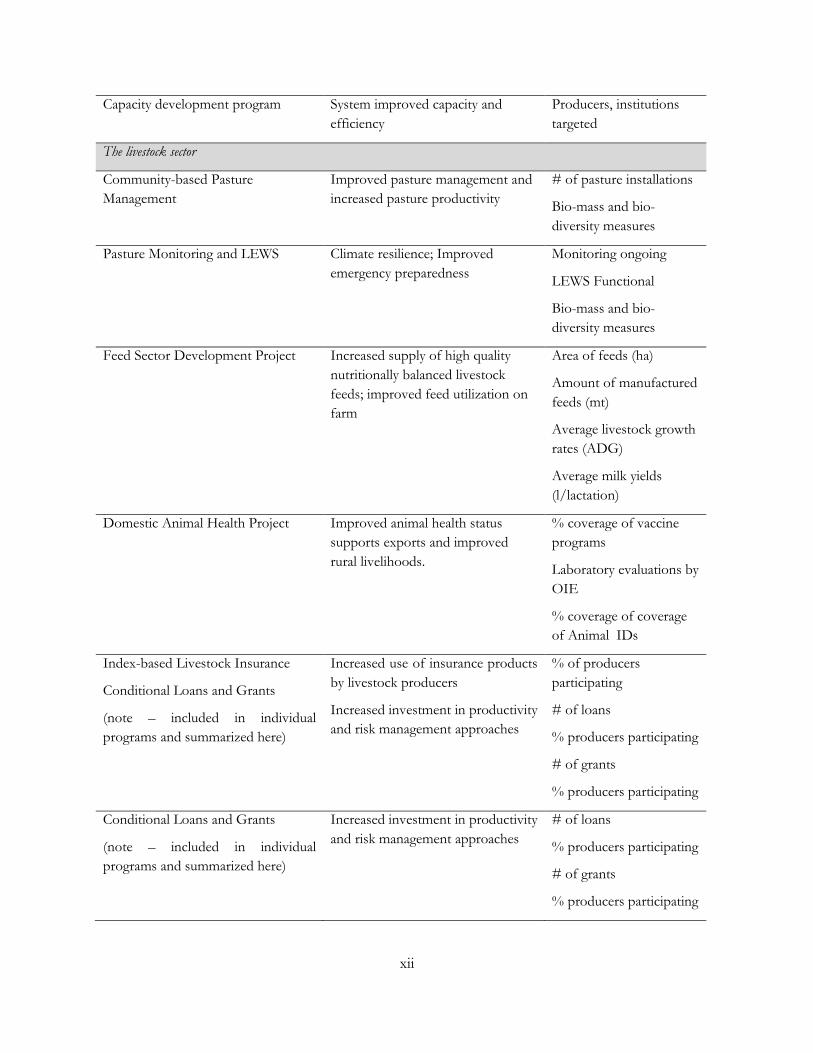
Table ES.1 summarizes the Agricultural Risk Management Action Plan for Kazakhstan, based on the
Risk Identification and Proposed Solution Sections of the report:
Table ES.1 Agricultural Risk Management Action Plan Summary for Kazakhstan
Main activities Expected outcome Proposed monitoring indicators
The Wheat Sector
Recommendations for climate-resilient technologies
Solutions for drought risk management
Report
Marketing study for cereals diversification
Directions to developing markets of cereals
Report
Promotion of climate smart solutions Reduction in yield and price volatility
% of areas with climate smart technologies
Strategy for crops breeding and research
Strategy for climate resilient crops Report
Feasibility study for irrigation Directions for developing irrigation system
Report
Grain quality diversification to match domestic and export markets
Directions for wheat diversification and marketing, new grading system
Report
Drought research center and network Capacity to develop drought resilient crops and technologies
Availability of infrastructure, equipment and trained staff
Wheat pathology center Capacity to deal with wheat diseases Availability of infrastructure, equipment and trained staff
xi
Capacity of the State Variety Release Commission
Well-functioning system of varieties testing, release and protection
Availability of infrastructure, equipment and trained staff
Risk management grants Reduction in yield and price volatility
Area under climate resilient technologies and yield
Diversification through climate smart agriculture
Expansion of no-till area (additional
2.5 million hectares)
Climate resilience; improved yields
by 30% compared to non-zero-till
areas; increased output
No-till area, yields, farm
income
Adoption of precision agriculture on
5.5 million hectares
Increased output; reduced losses Yields, farm income
Kazhydromet upgrading Increased information Agro-meteorological data
at producer level
Development of drought-tolerant
varieties (50 new varieties)
Climate-smart agriculture varieties
available
Number of varieties
registered
Reduction of losses (storage and
elevators)
Reduced losses % of losses
Land use diversification
Reclamation of unused or
underutilized cropland 4.5 million to
5 million hectares
Average 4.75 million hectares with
US$1.2 billion output per year
Reclaimed hectares
Adoption of no-till methods on the
same area
Climate resilience; improved yields
by 30% compared to non-zero till
areas; increased output
No-till area, yields, farm
income
Crop diversification
Crop substitution with high-earning
crops on 1 million hectares
1 million hectares producing
US$350 million output per year
Area substituted by crop
Crop diversification with fodder and
feed crops on 0.5 million hectares
0.5 million hectares producing
US$90 million output per year
Additional fodder area
Pasture cropping pilot on 1,600
hectares (2015–16)
System improved capacity and
efficiency
Yields, farm income
Pasture cropping on 2.5 million
hectares (2017–20)
1.2 million feed unit tons that would
satisfy the feeding needs of 0.5
million livestock
Yields, farm income
Support to agro-chemistry (on 12.5
million hectares)
Higher yields, increased farm
income
Yields, farm income
xii
Capacity development program System improved capacity and
efficiency
Producers, institutions
targeted
The livestock sector
Community-based Pasture
Management
Improved pasture management and
increased pasture productivity
# of pasture installations
Bio-mass and bio-
diversity measures
Pasture Monitoring and LEWS Climate resilience; Improved
emergency preparedness
Monitoring ongoing
LEWS Functional
Bio-mass and bio-
diversity measures
Feed Sector Development Project Increased supply of high quality
nutritionally balanced livestock
feeds; improved feed utilization on
farm
Area of feeds (ha)
Amount of manufactured
feeds (mt)
Average livestock growth
rates (ADG)
Average milk yields
(l/lactation)
Domestic Animal Health Project Improved animal health status
supports exports and improved
rural livelihoods.
% coverage of vaccine
programs
Laboratory evaluations by
OIE
% coverage of coverage
of Animal IDs
Index-based Livestock Insurance
Conditional Loans and Grants
(note – included in individual
programs and summarized here)
Increased use of insurance products
by livestock producers
Increased investment in productivity
and risk management approaches
% of producers
participating
# of loans
% producers participating
# of grants
% producers participating
Conditional Loans and Grants
(note – included in individual
programs and summarized here)
Increased investment in productivity
and risk management approaches
# of loans
% producers participating
# of grants
% producers participating
1
Introduction
Agriculture is among the most risk-prone sectors in the economies of the countries in the Central Asia
Region. The realization of these risks leads to a perpetual cycle of “shock-recovery-shock,” which
endangers the sustainability of ongoing initiatives and remains a major impediment to the
development of agricultural sectors in most countries. These risks can lead to and reinforce poverty
traps and pose serious consequences for all stakeholders. Adverse movements in agricultural
commodity and input prices, together with production-related shocks (e.g. from weather, pests, and
diseases) not only impact farmers and firms active in the agricultural sector, but may also put severe
strains on a government’s fiscal position. The prevalence and complexity of multiple risks facing
agriculture systems and the failure to address them on an ex-ante and integrated basis, continues to
leave countries and their agriculture sectors less competitive at best, and more often, extremely
vulnerable.
Risks in agricultural production have become more pressing after independence, with increased
reliance on local food production for livelihoods and food security. Yield variance in agricultural
production is, for example, 27 percent in Kazakhstan, compared to only 5 percent in the EU. Almost
80 percent of this variability is related to weather. Previously managed through redistribution systems
between sectors and regions in the Former Soviet Union, such risks are now left to the individual
governments to deal with.
Mainstreaming agricultural risk management, and thereby developing resilient and sustainable
agricultural systems in the medium term requires:
An integrated operational approach to agricultural resource management, which is embedded in country development and investment planning;
Expertise and capacity in the field of agricultural risk management;
Interaction and knowledge exchange by stakeholders and practitioners, to break down the often existing siloed approach to products, strategies, and risks.
In light of the above, the World Bank Group (WBG) initiated work on the agricultural sector risk
assessment in Kazakhstan, using in part the agricultural risk management framework developed by
the World Bank’s Agricultural Risk Management Team (ARMT). The framework is described below
in the Methodology section.
This study is the first step towards engaging in a comprehensive agricultural risk management dialogue
in Kazakhstan and developing the investment program. This report forms part of a three-country
study (the reports on the Kyrgyz Republic and Tajikistan are also available at this time), and also covers
the regional dimension given the proximity of the countries, which leads to sharing of some of the
same risks across more than one country.1
1 An overview of regional issues and regional responses is also available on the Forum for Agricultural Risk Management
website.
2
Within Kazakhstan, the report focuses on northern Kazakhstan, given the regional dependence on a
single strategic crop – wheat. Agriculture in the south of the country is much more diversified.
Methodology for National Agriculture Sector-Wide Risk Assessments (NASRA)
The World Bank’s Agricultural Risk Management Team (ARMT) has developed an approach for a
comprehensive and coherent Agricultural Sector-Wide Risk Management Framework, which covers
the following:
Pillar I: Risk Assessments and Management includes a number of Technical Assistance activities to help clients evaluate agricultural risks and put in place requisite systems for improved risk management.
Pillar II: Capacity Transfer offers a range of training products on various aspects of agricultural risk management.
Pillar III: Knowledge and Networks includes production of a number of knowledge products on agricultural risk management, which, among other things, facilitates dialogue and knowledge exchange among the practitioners and stakeholders.
The ultimate objective of such assessments is to reduce short and medium term volatility in the
agricultural sector while improving resilience over the longer term, thereby reducing vulnerabilities
among all stakeholders and increasing the potential success of agricultural investment strategies.
The NASRA Methodology is divided into three phases:
Phase 1. Based on a holistic framework for risk analysis and management, the agricultural sector risk
assessment will identify, analyze, quantify, and prioritize systemic risks (i.e., production, market,
enabling environment risks) that adversely impact the current functioning and future growth of the
bulk of a country’s agricultural commodities.
The risk assessment will also analyze the impact of agricultural risks on agricultural sector stakeholders
(e.g., farmers, vulnerable populations, commercial sector, and Government). It will evaluate existing
and potential risk management strategies (i.e., mitigation, transfer, and coping) to understand if
interventions are in line with the magnitude of existing risks and where gaps may exist. The ultimate
objective is to optimize the use of available public resources for improved agricultural risk
management and to build risk management capacity among local private and public stakeholders.
Phase 2: Once the risk assessment has been conducted through desk review and in close consultation
with relevant stakeholders, and the most appropriate risk management instruments have been
identified, a solutions assessment will be conducted. This phase involves a mapping of: 1) prioritized
risk management instruments already in place; 2) responsible institutions (including gaps and
overlaps); and 3) potential needs (e.g., TA, investments, policy support) for scaling up risk
management approaches to more effectively manage prioritized risks.
Phase 3: A third phase involves supporting Government efforts to: 1) develop an integrated and
systematic Agricultural Risk Management Plan that appropriately responds to priority risks; and 2) to
identify and allocate resources.
3
Agricultural Sector Risk Assessment Study in Kazakhstan
This study is limited to Phase 1 and Phase 2 of the NASRA methodology due to time and resource
considerations. Therefore, further work is needed to develop a broader integrated agricultural risk
management framework in the country, including the recommendations proposed in the Solutions
part of this study.
As part of the preparation of this report, fieldwork was undertaken multiple times during the risk
identification and solutions identification phases of work. The analysis draws on time-series data from
FAOSTAT, the World Bank’s World Development Indicators, national statistical agencies of each
country, and relevant sources of secondary data. The study assesses aggregate trends and risks in
agricultural production, but focuses on the three major crops grown in the region (wheat, cotton,
potatoes,), as well as the most important high-value vegetable crop (tomatoes) in Kazakhstan to
illustrate the main risks. Together, these four crops constitute 74 percent of the country’s gross
agricultural output and 68 percent of total area cultivated.
Summary of Recommendations
The risk analysis concluded that the largest sector shocks result from a combination of drought and
exogenous price shocks, as occurred in 1995, 1998, 2010 and 2012. Crop production is more
vulnerable to risk than livestock, due to the high dependence on dry land wheat production for export,
which exposes the sector to both production and price risk. Significantly, this exposure to risk is rising
due to the increasing role of wheat in total crop production.
Based on these findings, the recommendations of this report are targeted in three solutions areas: (i)
wheat productivity improvement; (ii) agricultural diversification; and (iii) improving livestock
productivity. All of these activities focus on Northern Kazakhstan, which is almost exclusively
dependent on wheat, the country’s strategic main export crop. Agriculture in southern Kazakhstan’s
is relatively diversified and adverse events there have had much less impact on the GOA.
The main recommendations of this report include.
1. Broaden and strengthen the use of conservation agriculture for crop production on medium and
large-scale crop farms in northern Kazakhstan. Conservation agriculture provides a basis for more
sustainable management of drought risk.
2. Increase support for research into ways to increase crop diversification in this region.
Given the prospective positive impacts of climate change, increasing diversification and
developing new drought-tolerant varieties are critical to effective risk management.
3. Review the potential use of hedging instruments. Hedging is one tool to reduce exposure to
cereal price risk.
4. Improve the effectiveness of the current agricultural insurance program. The program
should be reformed to improve access to insurance and increase the financial protection for
productive farms.
4
5. Encourage both large-scale agricultural enterprises and medium-scale peasant farms to diversify
further into lower risk, extensive livestock production. Diversification can reduce their
vulnerability to both drought and cereal price risk.
6. Improve livestock feed conservation techniques and access to seasonal finance for peasant farms
and small-scale household farms. These mechanisms can reduce vulnerability to droughts and
severe winters, and associated price hikes for animal feed.
Country Context
Agriculture produces only 5 percent of Kazakhstan’s gross domestic product (GDP), but employs
almost one-third of the country’s working population, making the sector essential for improving food
security and social livelihoods. Economic growth in Kazakhstan’s agriculture sector is robust,
averaging 6 percent a year between 2001 and 2011. Farms in the north have predominantly larger
operations focused on crop production, while smaller farms in the south specialize in meat and dairy
production. The small-farm sector employs the majority of Kazakhstan’s farmworkers and produces
46 percent of the country’s agricultural output and 80 percent of its livestock output (World Bank
2013b). Crop and livestock production accounts for roughly equal shares of sector output, with wheat
and potatoes as the major crops and milk, beef, pork, and mutton as the main livestock commodities.
With its vast land resources, Kazakhstan is well suited to extensive crop and livestock production. Of
the total land area of 272.5 million hectares, approximately one-third (90.34 million hectares) is classed
as agricultural land. Steppe grazing land accounts for approximately two-thirds (63.2 million hectares)
of this total, and arable land (24.4 million hectares) accounts for most of the rest. Most of the cereal
production that makes Kazakhstan one of the world’s major wheat exporters also occurs in the steppe
regions, which span the northern and central reaches of the country. South of the steppes, a vast semi-
desert and dry steppe region spans most of the remaining area of the country, except for the mountains
along the borders to the south and southeast. The lower reaches of these mountains provide the
resource base for more intensive, mixed agricultural production systems based on smallholder
agriculture. Most of the 2.4 million hectares of irrigated land is located in this southern and
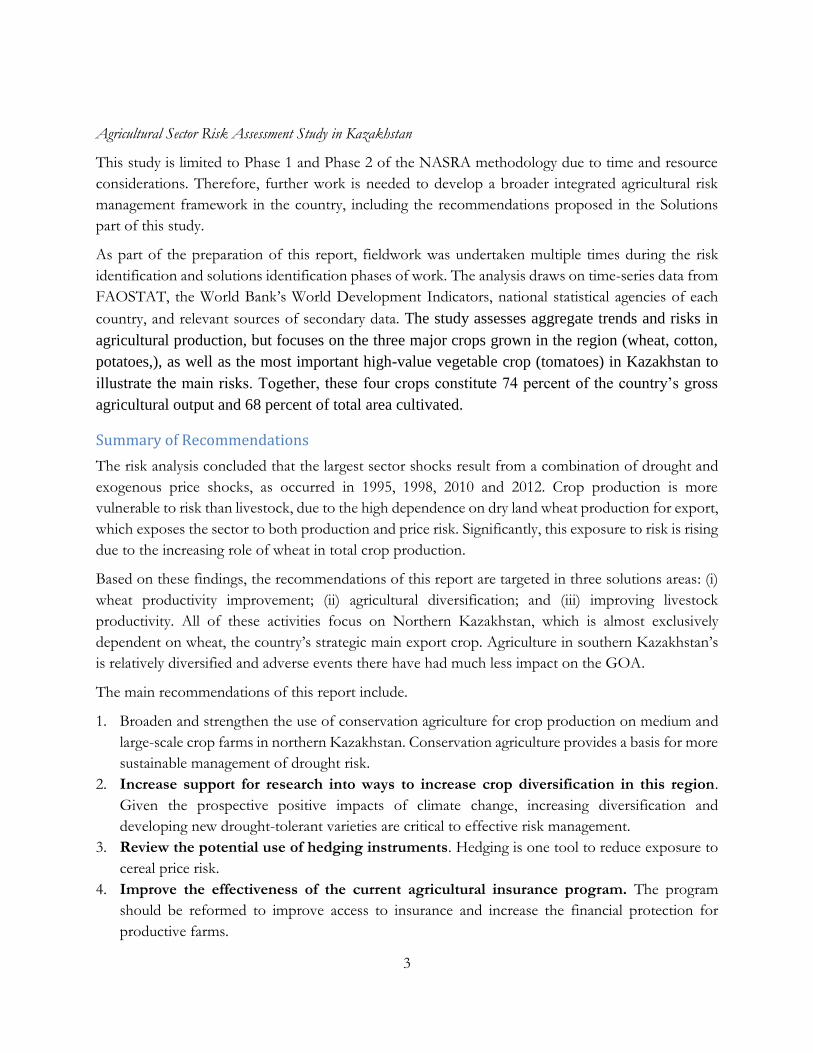
southeastern agricultural area (figure 1).
5
Figure 1 Percentage of Land Irrigated in Kazakhstan
Source: Based on FAO Aquastat.
Agro-Climatic Conditions
Kazakhstan’s geography and climate vary enormously: from steppe in the north, to desert and semi-
arid regions in the center, to mountains and foothills in the south and southeast. Summer temperatures
average 20°C in the north and 30°C in the south. Winter temperatures average −18°C in the north
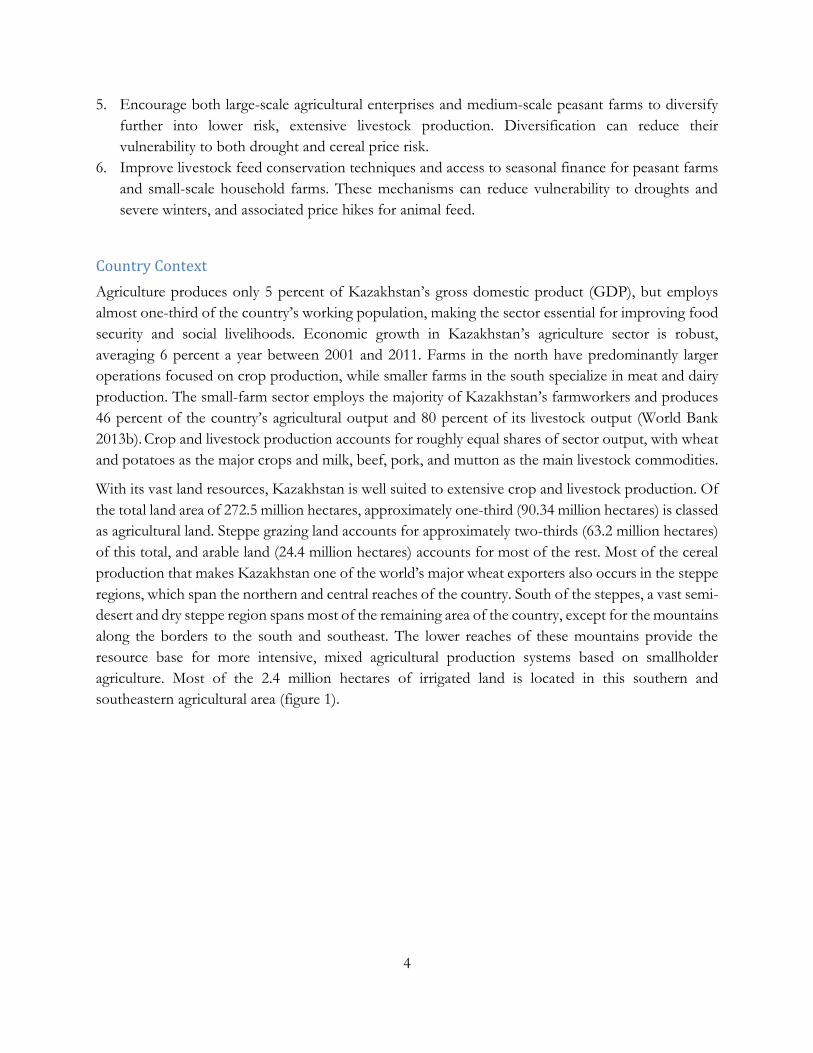
and −3°C in the south, but can fall to −40°C in the north. Precipitation varies from 100–200
millimeters in the desert, to 200–500 millimeters in the steppe regions, and to 500–1,600 millimeters
in the southern foothills (figure 2). The growing season ranges from 70 to 120 days, with most growth
in the spring. The combination of short growing seasons, hot dry summers, long cold winters, and
high winds increases the risks for both crop and livestock production.
Kazakhstan
Aral Sea
Lake Balkhash
6
Figure 2 Annual Precipitation in Kazakhstan
Source: Derived from FAO 2000.
Note: Data were averaged over a period of 37 years. Raster data-set was exported as ASCII raster file type.
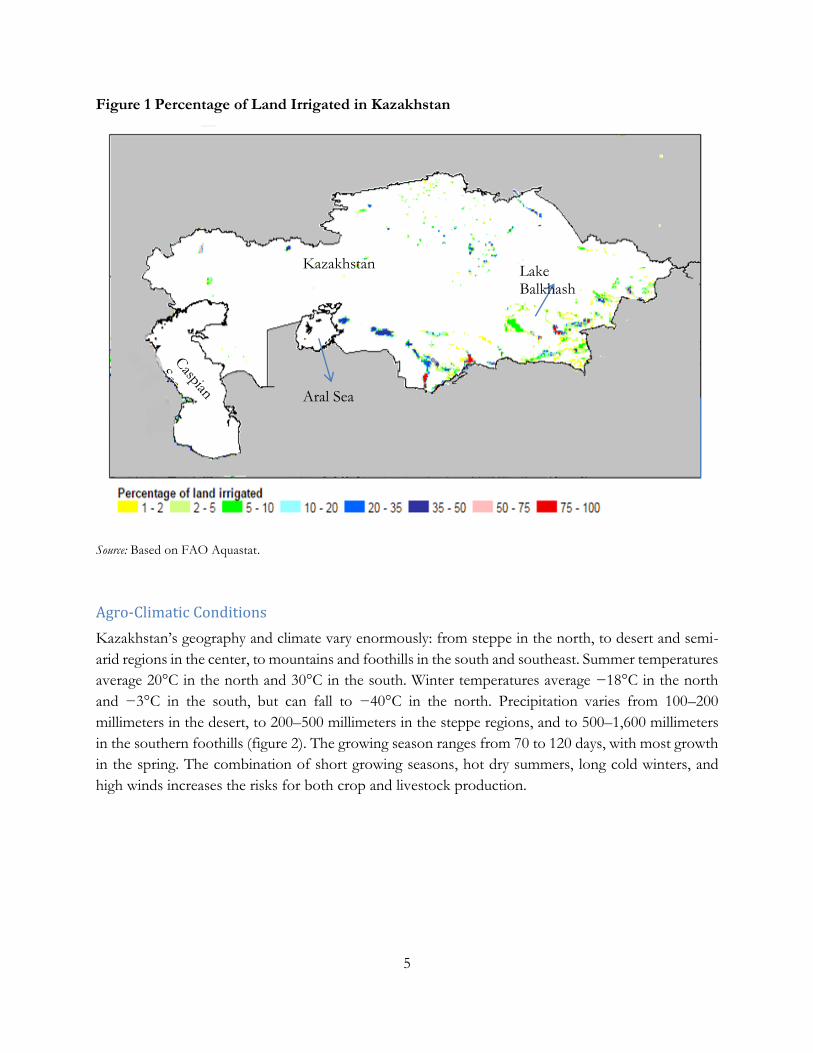
Kazakhstan has five main agro-ecological zones (figure 3), most of which run east-west across the
country. Of these, four (excluding the desert) are important for livestock and crop production.
Figure 3 Agro-Ecological Zones in Kazakhstan
Forest steppe Steppe Semi-desert Desert Mountains and
foothills Water bodies
Source: Based on map from Higher Education Press (journal.hep.cn).
Table 1 shows their relative importance in terms of land area and agricultural land use, followed by a
more detailed description of each zone.
7
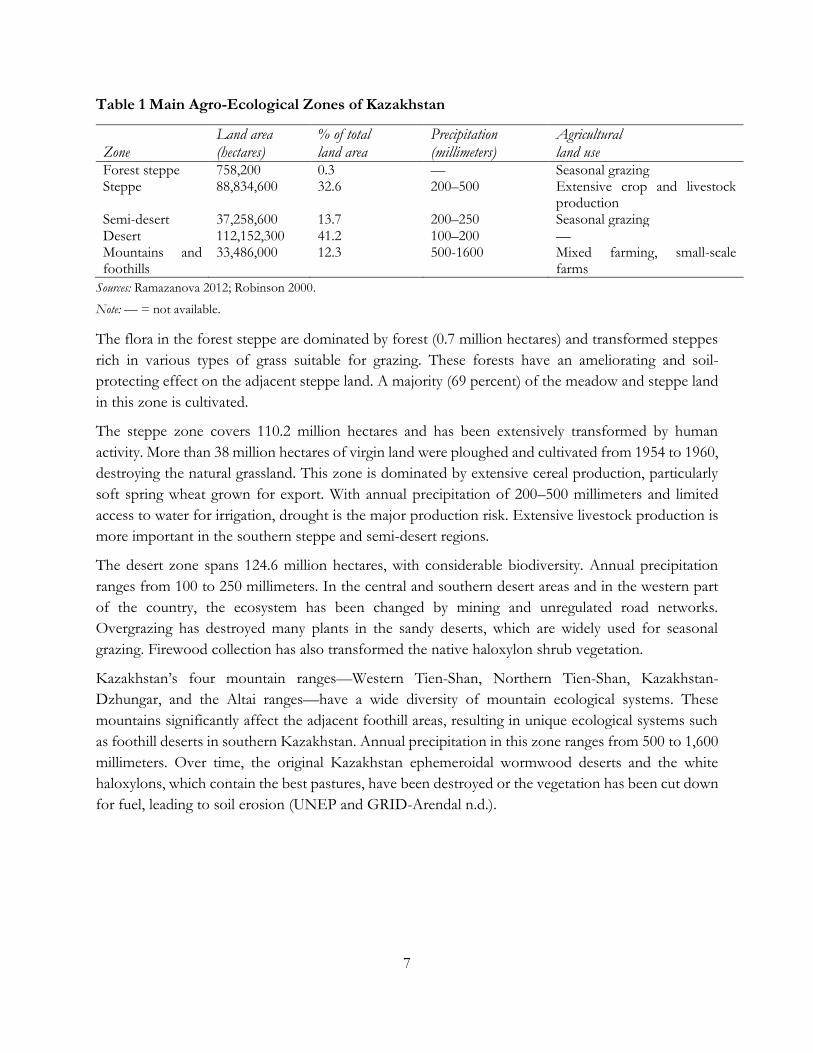
Table 1 Main Agro-Ecological Zones of Kazakhstan
Zone Land area (hectares)
% of total land area
Precipitation (millimeters)
Agricultural land use
Forest steppe 758,200 0.3 — Seasonal grazing Steppe 88,834,600 32.6 200–500 Extensive crop and livestock
production Semi-desert 37,258,600 13.7 200–250 Seasonal grazing Desert 112,152,300 41.2 100–200 — Mountains and foothills
33,486,000 12.3 500-1600 Mixed farming, small-scale farms
Sources: Ramazanova 2012; Robinson 2000.
Note: — = not available.
The flora in the forest steppe are dominated by forest (0.7 million hectares) and transformed steppes
rich in various types of grass suitable for grazing. These forests have an ameliorating and soil-
protecting effect on the adjacent steppe land. A majority (69 percent) of the meadow and steppe land
in this zone is cultivated.
The steppe zone covers 110.2 million hectares and has been extensively transformed by human
activity. More than 38 million hectares of virgin land were ploughed and cultivated from 1954 to 1960,
destroying the natural grassland. This zone is dominated by extensive cereal production, particularly
soft spring wheat grown for export. With annual precipitation of 200–500 millimeters and limited
access to water for irrigation, drought is the major production risk. Extensive livestock production is
more important in the southern steppe and semi-desert regions.
The desert zone spans 124.6 million hectares, with considerable biodiversity. Annual precipitation
ranges from 100 to 250 millimeters. In the central and southern desert areas and in the western part
of the country, the ecosystem has been changed by mining and unregulated road networks.
Overgrazing has destroyed many plants in the sandy deserts, which are widely used for seasonal
grazing. Firewood collection has also transformed the native haloxylon shrub vegetation.
Kazakhstan’s four mountain ranges—Western Tien-Shan, Northern Tien-Shan, Kazakhstan-
Dzhungar, and the Altai ranges—have a wide diversity of mountain ecological systems. These
mountains significantly affect the adjacent foothill areas, resulting in unique ecological systems such
as foothill deserts in southern Kazakhstan. Annual precipitation in this zone ranges from 500 to 1,600
millimeters. Over time, the original Kazakhstan ephemeroidal wormwood deserts and the white
haloxylons, which contain the best pastures, have been destroyed or the vegetation has been cut down
for fuel, leading to soil erosion (UNEP and GRID-Arendal n.d.).
8
Vulnerability to Climate Change
The fourth Intergovernmental Panel on Climate Change (IPCC) assessment reports a general warming
trend in Central Asia of 1–2°C since the beginning of the 20th century.2 In Kazakhstan, air temperature
has increased an average of 0.31°C every 10 years between 1936 and 2005. This trend is projected to
continue. Median scenarios forecast a rise in mean annual temperature of 1.4°С by 2030, 2.7°С by
2050, and 4.6°С by 2085. A corresponding decrease in the number of frost days is expected. Trends
in precipitation are less clear. Data for 1936–2005 show no well-defined trends in annual and seasonal
patterns of precipitation, although daily maximum rainfall in the winter increased in almost all areas
of the country. Analysis for 1950–2000 shows that annual precipitation has been increasing, although
at a decreasing rate (figure 4). Projections for spring rainfall are inconclusive, but a 1–28 percent rise
in rainfall is projected for other seasons.
National forecasts of climate change are of limited value in a country as huge and diverse as
Kazakhstan. Projections of the impact of climate change by region or agro-climatic zone are more
useful. Climate change is expected to lead to an increase in precipitation in the mountain areas on the
southern and eastern fringes of Kazakhstan. Higher temperatures will increase glacial melt in the
medium term, changing river flows and increasing flood risks. In the longer term, reduced glaciation
will reduce the flow of mountain rivers by the mid-century (Ministry of Environment and Water
Protection 2009). These trends are likely to be particularly significant for the rivers flowing into the
Lake Balhash basin, one of the largest and most densely populated areas of Kazakhstan.
2 The report makes references both to the fourth and fifth Intergovernmental Panel on Climate Change (IPCC) assessment report. The fifth report confirmed the trends indicated in the fourth report.

9
Figure 4 Historic Trends in Temperature and Precipitation in Kazakhstan, 1950–2000
a. Annual mean temperature
There has been an increase in annual mean temperature across Kazakhstan from 1950 to 2000. Global warming will heighten the country’s exposure to drought. By 2050, temperature is forecast to climb throughout the country by 2–4ºC.
b.
c. Annual % change in precipitation
The annual % change in precipitation has been increasing at a decreasing rate. Models of precipitation are inconclusive regarding patterns in spring, but produce a 1–28% rise for the remaining seasons. Areas projected to see increasing rainfall could provide expanding opportunities for rain-fed, high-yielding winter wheat, while other parts of the country face reduced water availability, sporadic drought, and lower cotton yields.
d.
Source: Map produced by ClimateWizard © University of Washington and The Nature Conservancy, 2009. Base Climate
Data from the Climate Research Unit (TS 2.10), University of East Anglia, U.K. (http://www.cru.uea.ac.uk).
Running average
Trend
Annual mean temperature
10
Climate change induced by environmental factors has made drought more frequent in southern and
eastern Kazakhstan. Owing to the desiccation of the Aral Sea, temperatures have risen in the
surrounding area, especially during summer. Consequently, the paths of cyclones bringing
precipitation have moved to the north and south of the Aral Sea area, and their velocity and turbulence
have increased. Due to the increasing prevalence of “dry” cyclones, precipitation has dropped 25–30
percent near the Aral Sea and West Kazakhstan. Salinization in the Aral Sea takes 10–15 percent of
cropland out of cultivation every year, and pasture areas have shrunk 50 percent. Meanwhile, cyclones
in the northern and northeastern provinces have increased the amount and variability of precipitation.
These impacts are projected to intensify in the future, threatening the development and security of the
region and the livelihoods of its people.
Rising temperatures will increase the risk of drought in the northern steppe regions and of
desertification in the southern steppes and semi-deserts. Desertification is a serious threat that may
affect up to two-thirds of the land area of Kazakhstan (World Bank 2013b). The country’s reliance on
wheat production also makes it vulnerable to pests and diseases, such as Hessian fly and wheat rust
(ICARDA 2009), which may become more damaging as a result of rising temperatures (Anderson et
al. 2004). These temperature trends will also increase the length of the growing season and reduce the
risk of frosts, increasing the range of potential crops and the scope for diversification. Available data
are unclear regarding the region-specific impacts of climate change on precipitation in the steppes and
semi-desert regions.
Agriculture in Kazakhstan is highly vulnerable to climate change due to its heavy reliance on dryland
crop and livestock production systems (Mizina et al. 1998). Climate change scenarios suggest that
future weather conditions will increase the vulnerability of grain production to drought in the northern
steppes, particularly for spring wheat in oblasts such as Kostanaiskaya, Akmolinskaya, and
Pavlodarskaya. The projected impact on pastures and livestock production is mixed, with potential
negative consequences, such as reduced productivity of pastures due to an increase in anomalous cold
winters and hot summers (Ministry of Environment and Water Protection 2013). But higher
temperatures also bring longer growing seasons, shorter winters, and a lower risk of frost.
The vulnerability of Kazakh agriculture to climate change is further increased by its weak adaptive
capacity. Continuing the Soviet-era legacy, agriculture is dominated by a small number of crops, which
are unsuited to the local environment, and characterized by poor management of water resources, soil
erosion, and inefficient nutrient conservation (World Bank 2009).
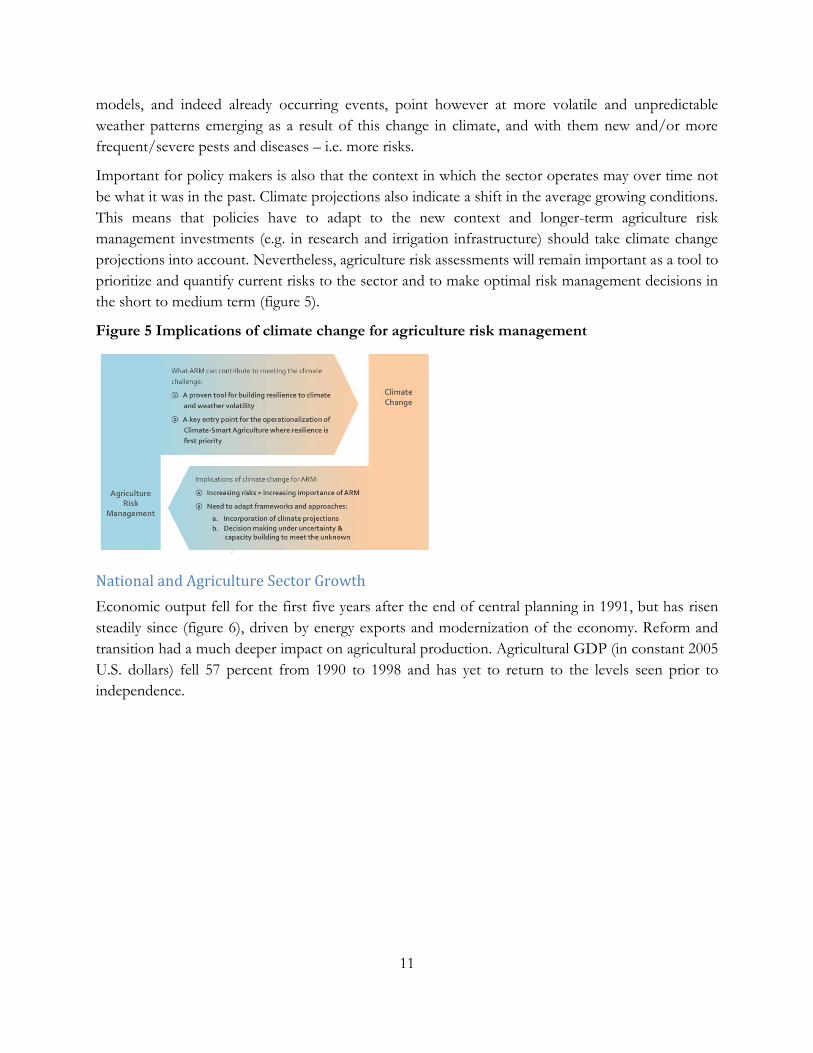
Conceptualizing Climate Change Implications for Agriculture Risk Management
Climate change will have important implications for agriculture risk management in that (i) it will
change the context in which the sector operates in, and (ii) it will likely change the patterns of the risks
that have occurred in the past in terms of frequency and impact. A changing climate is in itself not
considered a risks but rather a trend as it is a shift that occurs over a longer term and thereby is
predictable. Instead, agriculture risk assessments look at risk events that takes place as a result of
unpredicted and/or extreme weather events (among other risks). Globally, most climate change
11
models, and indeed already occurring events, point however at more volatile and unpredictable
weather patterns emerging as a result of this change in climate, and with them new and/or more
frequent/severe pests and diseases – i.e. more risks.
Important for policy makers is also that the context in which the sector operates may over time not
be what it was in the past. Climate projections also indicate a shift in the average growing conditions.
This means that policies have to adapt to the new context and longer-term agriculture risk
management investments (e.g. in research and irrigation infrastructure) should take climate change
projections into account. Nevertheless, agriculture risk assessments will remain important as a tool to
prioritize and quantify current risks to the sector and to make optimal risk management decisions in
the short to medium term (figure 5).
Figure 5 Implications of climate change for agriculture risk management
National and Agriculture Sector Growth
Economic output fell for the first five years after the end of central planning in 1991, but has risen
steadily since (figure 6), driven by energy exports and modernization of the economy. Reform and
transition had a much deeper impact on agricultural production. Agricultural GDP (in constant 2005
U.S. dollars) fell 57 percent from 1990 to 1998 and has yet to return to the levels seen prior to
independence.
12
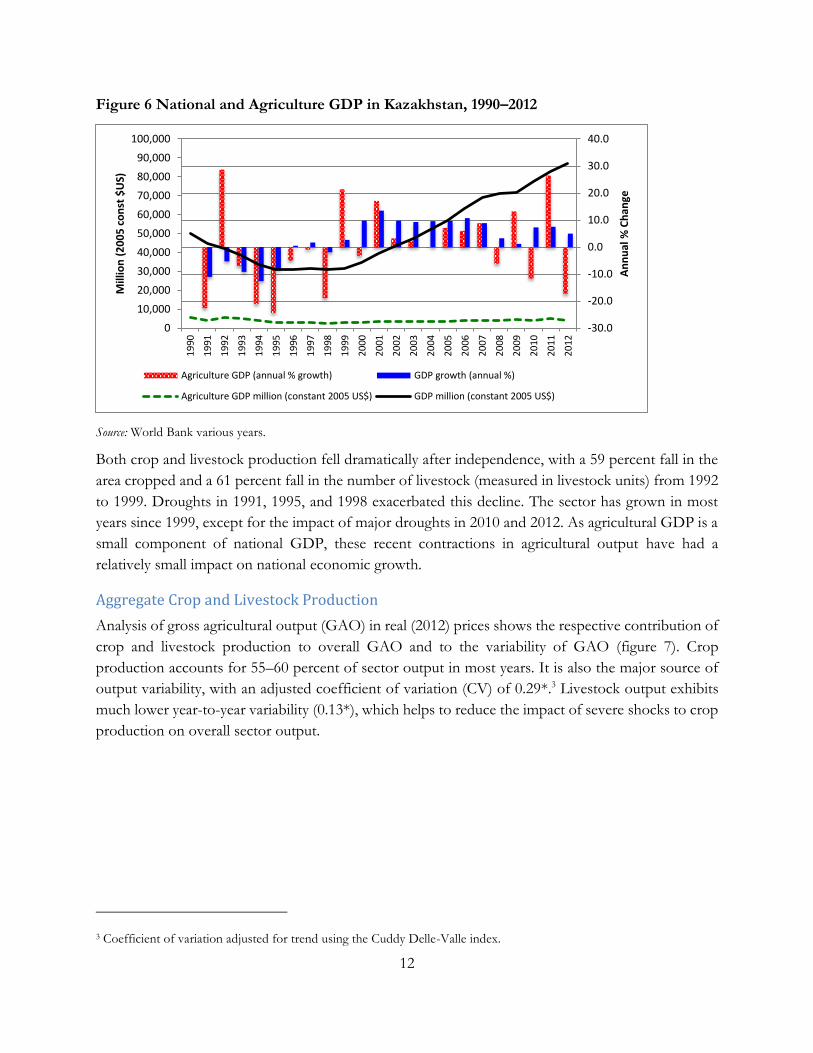
Figure 6 National and Agriculture GDP in Kazakhstan, 1990–2012
Source: World Bank various years.
Both crop and livestock production fell dramatically after independence, with a 59 percent fall in the
area cropped and a 61 percent fall in the number of livestock (measured in livestock units) from 1992
to 1999. Droughts in 1991, 1995, and 1998 exacerbated this decline. The sector has grown in most
years since 1999, except for the impact of major droughts in 2010 and 2012. As agricultural GDP is a
small component of national GDP, these recent contractions in agricultural output have had a
relatively small impact on national economic growth.
Aggregate Crop and Livestock Production
Analysis of gross agricultural output (GAO) in real (2012) prices shows the respective contribution of
crop and livestock production to overall GAO and to the variability of GAO (figure 7). Crop
production accounts for 55–60 percent of sector output in most years. It is also the major source of
output variability, with an adjusted coefficient of variation (CV) of 0.29*.3 Livestock output exhibits
much lower year-to-year variability (0.13*), which helps to reduce the impact of severe shocks to crop
production on overall sector output.
3 Coefficient of variation adjusted for trend using the Cuddy Delle-Valle index.
-30.0
-20.0
-10.0
0.0
10.0
20.0
30.0
40.0
0
10,000
20,000
30,000
40,000
50,000
60,000
70,000
80,000
90,000
100,000
19
90
19
91
19
92
19
93
19
94
19
95
19
96
19
97
19
98
19
99
20
00
20
01
20
02
20
03
20
04
20
05
20
06
20
07
20
08
20
09
20
10
20
11
20
12
An
nu
al %
Ch
ange
Mill
ion
(2
00
5 c
on
st $
US)
Agriculture GDP (annual % growth) GDP growth (annual %)
Agriculture GDP million (constant 2005 US$) GDP million (constant 2005 US$)
13
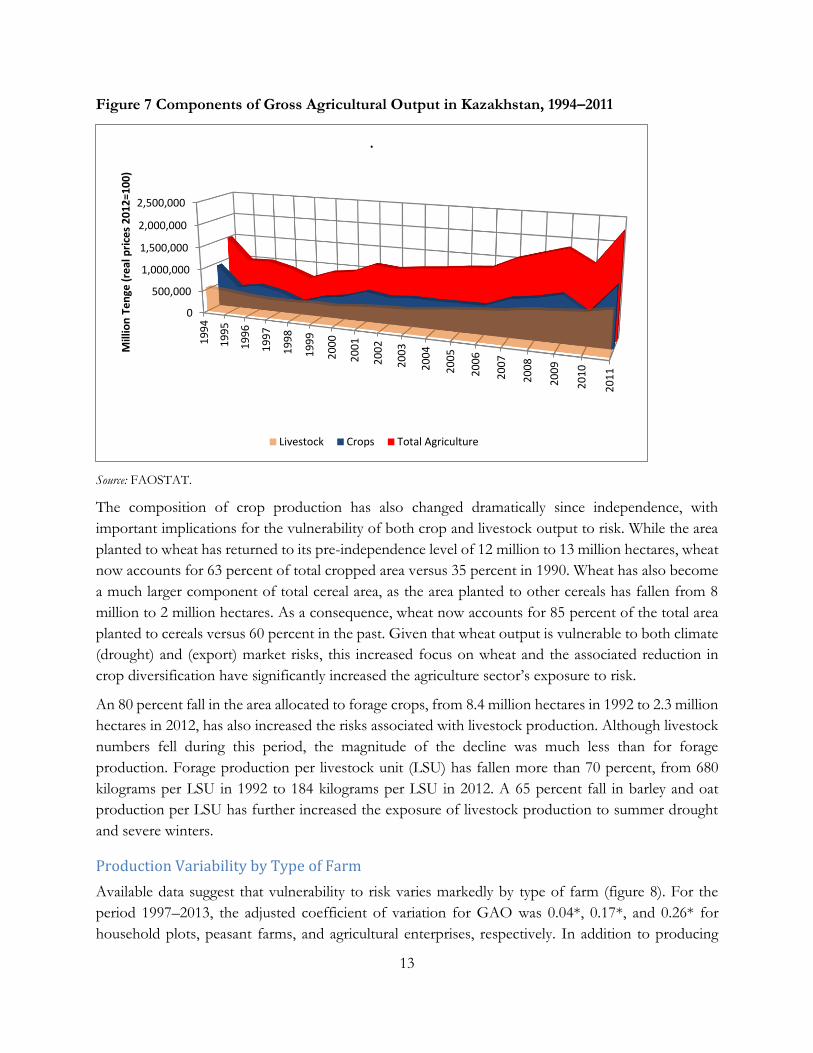
Figure 7 Components of Gross Agricultural Output in Kazakhstan, 1994–2011
Source: FAOSTAT.
The composition of crop production has also changed dramatically since independence, with
important implications for the vulnerability of both crop and livestock output to risk. While the area
planted to wheat has returned to its pre-independence level of 12 million to 13 million hectares, wheat
now accounts for 63 percent of total cropped area versus 35 percent in 1990. Wheat has also become
a much larger component of total cereal area, as the area planted to other cereals has fallen from 8
million to 2 million hectares. As a consequence, wheat now accounts for 85 percent of the total area
planted to cereals versus 60 percent in the past. Given that wheat output is vulnerable to both climate
(drought) and (export) market risks, this increased focus on wheat and the associated reduction in
crop diversification have significantly increased the agriculture sector’s exposure to risk.
An 80 percent fall in the area allocated to forage crops, from 8.4 million hectares in 1992 to 2.3 million
hectares in 2012, has also increased the risks associated with livestock production. Although livestock
numbers fell during this period, the magnitude of the decline was much less than for forage
production. Forage production per livestock unit (LSU) has fallen more than 70 percent, from 680
kilograms per LSU in 1992 to 184 kilograms per LSU in 2012. A 65 percent fall in barley and oat
production per LSU has further increased the exposure of livestock production to summer drought
and severe winters.
Production Variability by Type of Farm
Available data suggest that vulnerability to risk varies markedly by type of farm (figure 8). For the
period 1997–2013, the adjusted coefficient of variation for GAO was 0.04*, 0.17*, and 0.26* for
household plots, peasant farms, and agricultural enterprises, respectively. In addition to producing
0
500,000
1,000,000
1,500,000
2,000,000
2,500,0001
99
4
19
95
19
96
19
97
19
98
19
99
20
00
20
01
20
02
20
03
20
04
20
05
20
06
20
07
20
08
20
09
20
10
20
11
Mill
ion
Te
nge
(re
al p
rice
s 2
01
2=1
00
)
.
Livestock Crops Total Agriculture
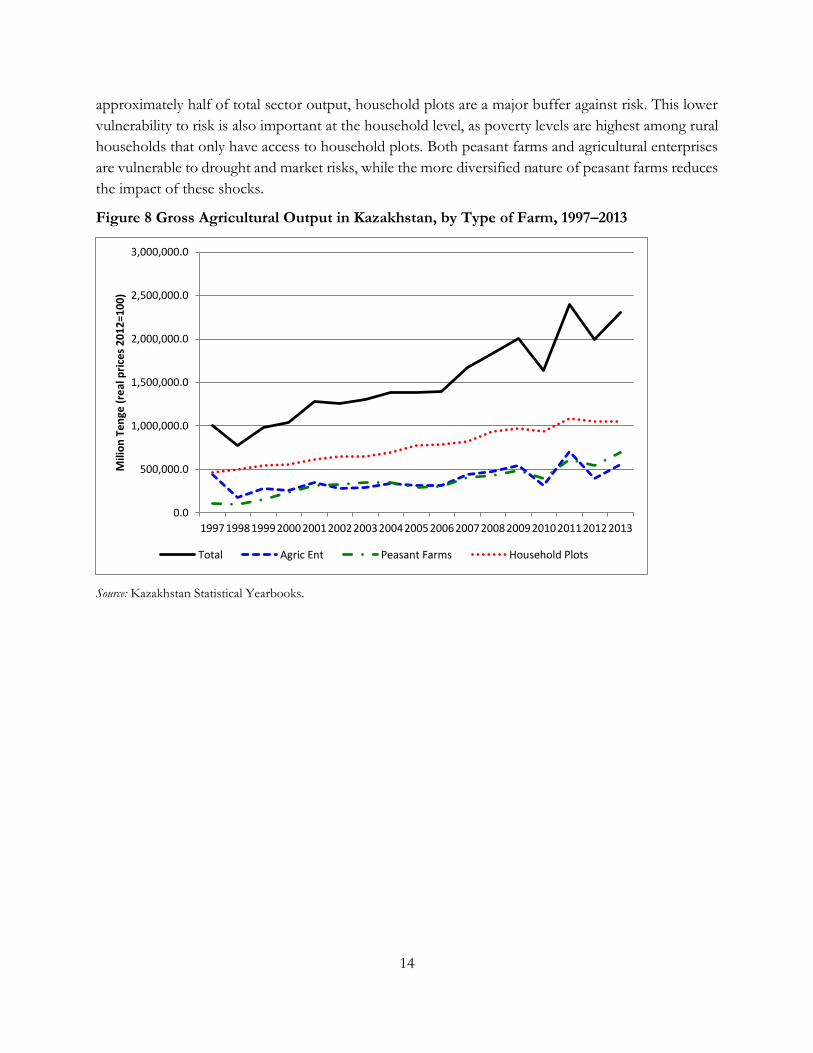
14
approximately half of total sector output, household plots are a major buffer against risk. This lower
vulnerability to risk is also important at the household level, as poverty levels are highest among rural
households that only have access to household plots. Both peasant farms and agricultural enterprises
are vulnerable to drought and market risks, while the more diversified nature of peasant farms reduces
the impact of these shocks.
Figure 8 Gross Agricultural Output in Kazakhstan, by Type of Farm, 1997–2013
Source: Kazakhstan Statistical Yearbooks.
0.0
500,000.0
1,000,000.0
1,500,000.0
2,000,000.0
2,500,000.0
3,000,000.0
19971998199920002001200220032004200520062007200820092010201120122013
Mili
on
Te
nge
(re
al p
rice
s 2
01
2=1
00
)
Total Agric Ent Peasant Farms Household Plots
15
Part I Risk Identification and Quantification
The study reviews aggregate national-level trends and systemic risks for crop and livestock production,
followed by a more-detailed review of key agricultural commodities which form approximately 70
percent of Kazakhstan’s total GAO: wheat, potatoes, tomatoes, cow’s milk, beef, mutton, and eggs.
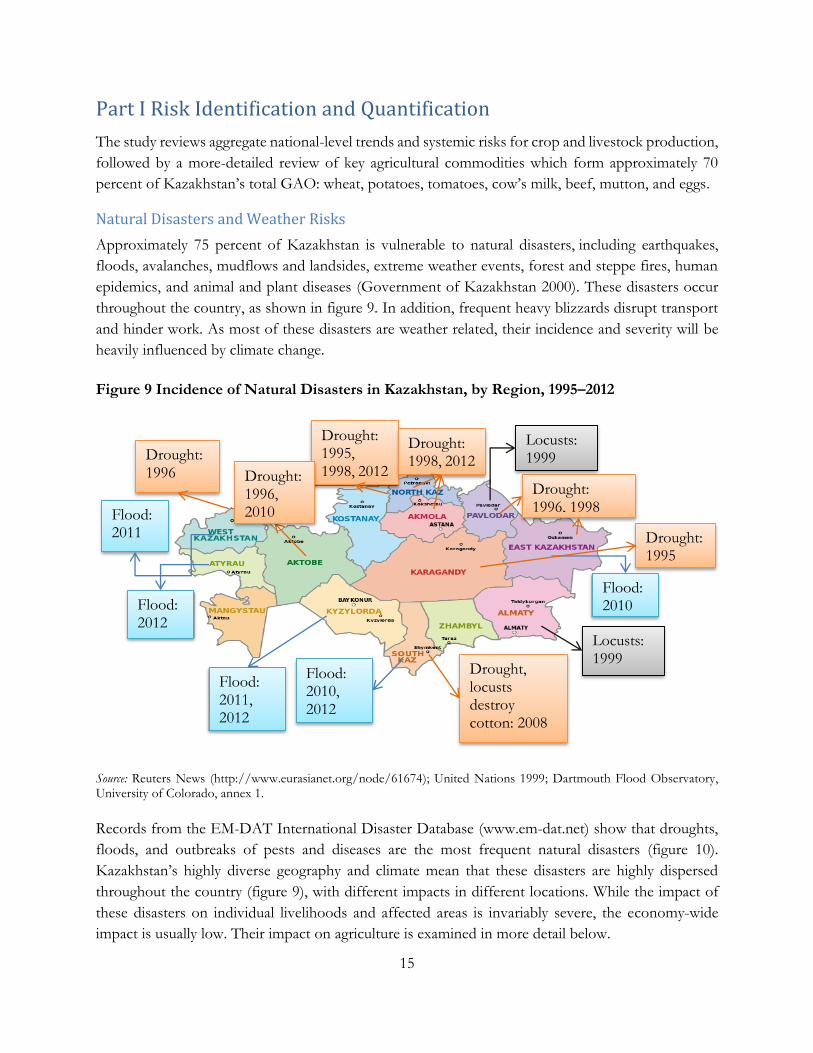
Natural Disasters and Weather Risks
Approximately 75 percent of Kazakhstan is vulnerable to natural disasters, including earthquakes,
floods, avalanches, mudflows and landsides, extreme weather events, forest and steppe fires, human
epidemics, and animal and plant diseases (Government of Kazakhstan 2000). These disasters occur
throughout the country, as shown in figure 9. In addition, frequent heavy blizzards disrupt transport
and hinder work. As most of these disasters are weather related, their incidence and severity will be
heavily influenced by climate change.
Figure 9 Incidence of Natural Disasters in Kazakhstan, by Region, 1995–2012
Source: Reuters News (http://www.eurasianet.org/node/61674); United Nations 1999; Dartmouth Flood Observatory, University of Colorado, annex 1.
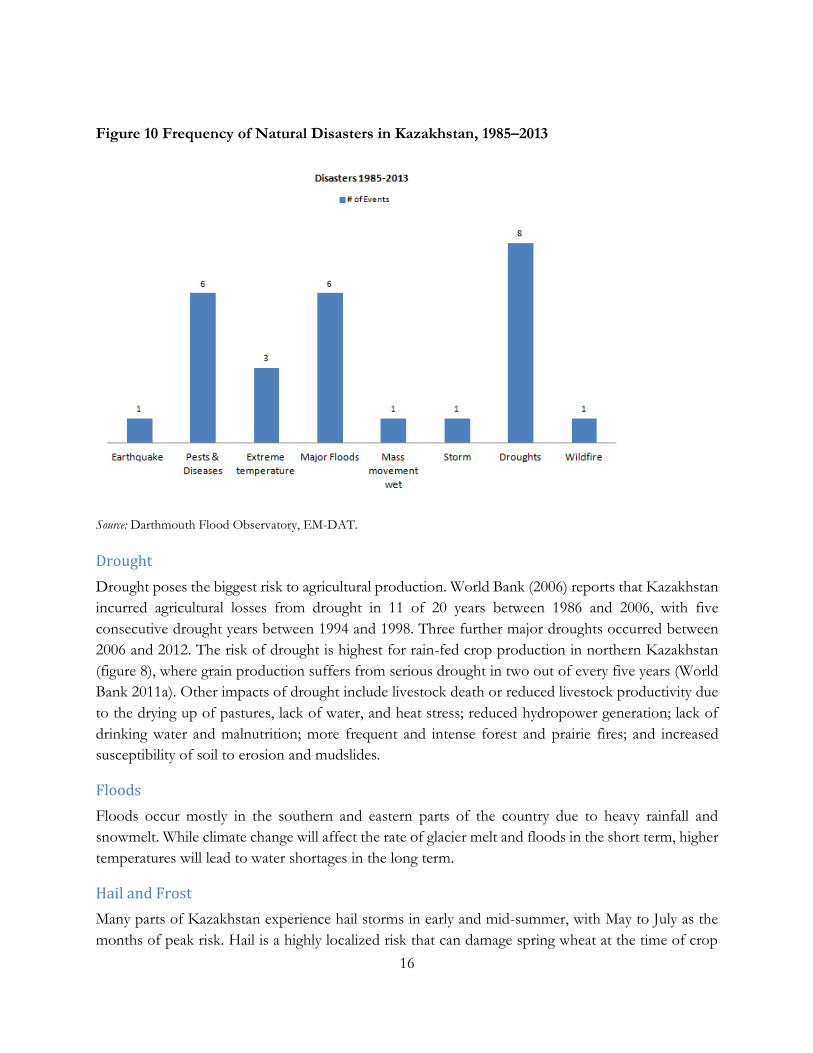
Records from the EM-DAT International Disaster Database (www.em-dat.net) show that droughts,
floods, and outbreaks of pests and diseases are the most frequent natural disasters (figure 10).
Kazakhstan’s highly diverse geography and climate mean that these disasters are highly dispersed
throughout the country (figure 9), with different impacts in different locations. While the impact of
these disasters on individual livelihoods and affected areas is invariably severe, the economy-wide
impact is usually low. Their impact on agriculture is examined in more detail below.
Drought: 1995, 1998, 2012
Drought: 1995
Drought: 1996
Drought: 1996, 1998
Drought: 1998, 2012
Drought: 1996, 2010
Drought, locusts destroy cotton: 2008
Locusts: 1999
Flood: 2010
Flood: 2010, 2012
Flood: 2011
Flood: 2011, 2012
Flood: 2012
Locusts: 1999
16
Figure 10 Frequency of Natural Disasters in Kazakhstan, 1985–2013
Source: Darthmouth Flood Observatory, EM-DAT.
Drought
Drought poses the biggest risk to agricultural production. World Bank (2006) reports that Kazakhstan
incurred agricultural losses from drought in 11 of 20 years between 1986 and 2006, with five
consecutive drought years between 1994 and 1998. Three further major droughts occurred between
2006 and 2012. The risk of drought is highest for rain-fed crop production in northern Kazakhstan
(figure 8), where grain production suffers from serious drought in two out of every five years (World
Bank 2011a). Other impacts of drought include livestock death or reduced livestock productivity due
to the drying up of pastures, lack of water, and heat stress; reduced hydropower generation; lack of
drinking water and malnutrition; more frequent and intense forest and prairie fires; and increased
susceptibility of soil to erosion and mudslides.
Floods
Floods occur mostly in the southern and eastern parts of the country due to heavy rainfall and
snowmelt. While climate change will affect the rate of glacier melt and floods in the short term, higher
temperatures will lead to water shortages in the long term.
Hail and Frost
Many parts of Kazakhstan experience hail storms in early and mid-summer, with May to July as the
months of peak risk. Hail is a highly localized risk that can damage spring wheat at the time of crop
17
harvest in August and early September (World Bank 2011a). Early autumn frosts, in late August and
early September, can be a problem for spring wheat production in some areas of northern Kazakhstan.
Late-sown crops are most vulnerable, especially those in the milk grain or dough phenology stages
prior to harvest (World Bank 2011a). Damage tends to be highly localized.
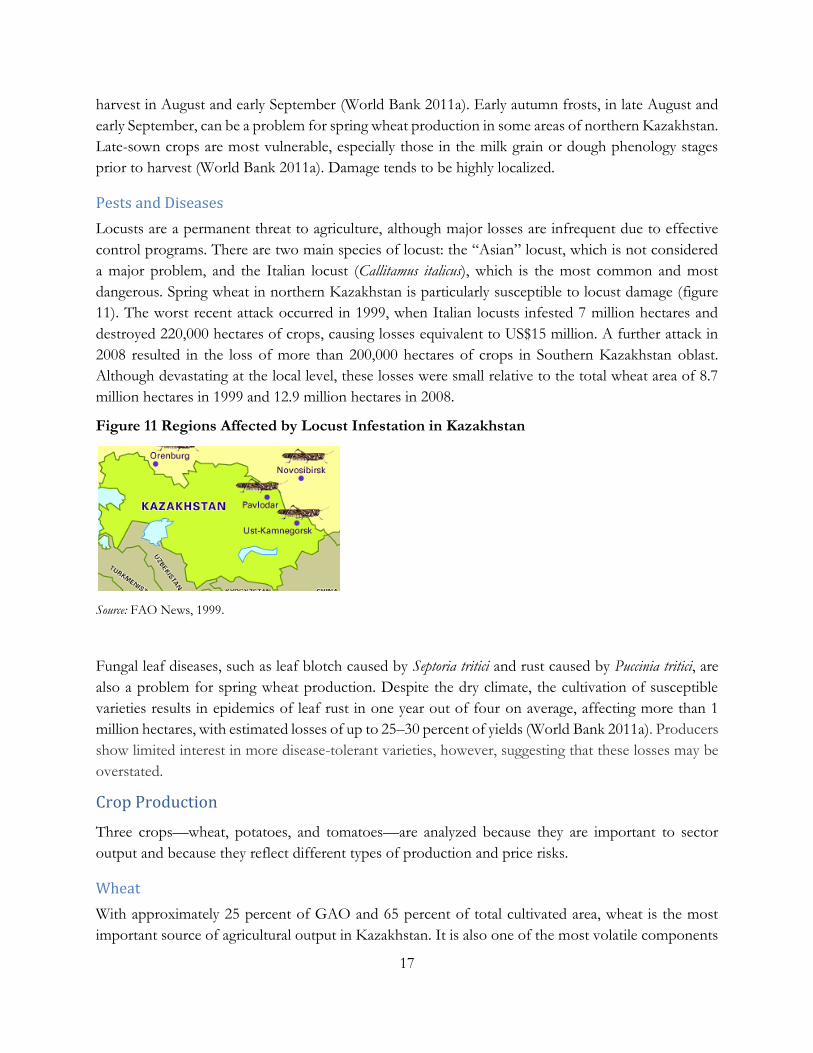
Pests and Diseases
Locusts are a permanent threat to agriculture, although major losses are infrequent due to effective
control programs. There are two main species of locust: the “Asian” locust, which is not considered
a major problem, and the Italian locust (Callitamus italicus), which is the most common and most
dangerous. Spring wheat in northern Kazakhstan is particularly susceptible to locust damage (figure
11). The worst recent attack occurred in 1999, when Italian locusts infested 7 million hectares and
destroyed 220,000 hectares of crops, causing losses equivalent to US$15 million. A further attack in
2008 resulted in the loss of more than 200,000 hectares of crops in Southern Kazakhstan oblast.
Although devastating at the local level, these losses were small relative to the total wheat area of 8.7
million hectares in 1999 and 12.9 million hectares in 2008.
Figure 11 Regions Affected by Locust Infestation in Kazakhstan
Source: FAO News, 1999.
Fungal leaf diseases, such as leaf blotch caused by Septoria tritici and rust caused by Puccinia tritici, are
also a problem for spring wheat production. Despite the dry climate, the cultivation of susceptible
varieties results in epidemics of leaf rust in one year out of four on average, affecting more than 1
million hectares, with estimated losses of up to 25–30 percent of yields (World Bank 2011a). Producers
show limited interest in more disease-tolerant varieties, however, suggesting that these losses may be
overstated.
Crop Production
Three crops—wheat, potatoes, and tomatoes—are analyzed because they are important to sector
output and because they reflect different types of production and price risks.
Wheat
With approximately 25 percent of GAO and 65 percent of total cultivated area, wheat is the most
important source of agricultural output in Kazakhstan. It is also one of the most volatile components
18
of sector output, with a CV of 0.35 for production and 0.29 for yield. This combination of high
volatility and high contribution to sector output also makes wheat a major source of overall sector
volatility.
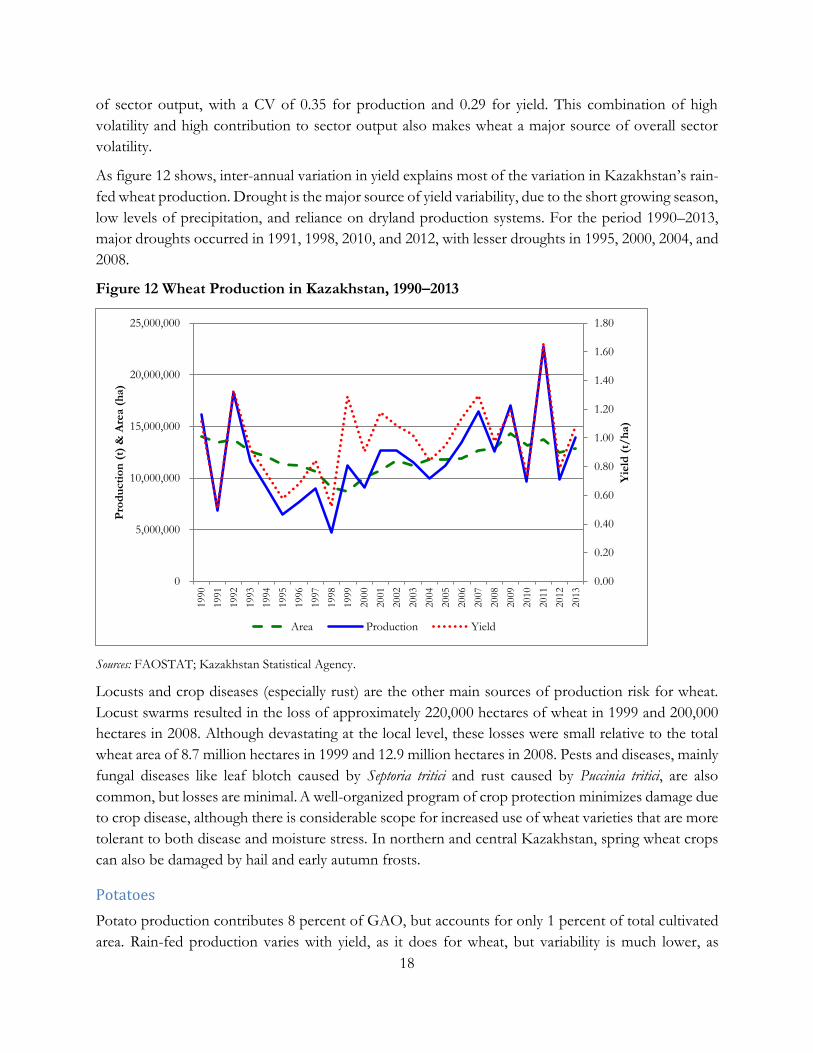
As figure 12 shows, inter-annual variation in yield explains most of the variation in Kazakhstan’s rain-
fed wheat production. Drought is the major source of yield variability, due to the short growing season,
low levels of precipitation, and reliance on dryland production systems. For the period 1990–2013,
major droughts occurred in 1991, 1998, 2010, and 2012, with lesser droughts in 1995, 2000, 2004, and
2008.
Figure 12 Wheat Production in Kazakhstan, 1990–2013
Sources: FAOSTAT; Kazakhstan Statistical Agency.
Locusts and crop diseases (especially rust) are the other main sources of production risk for wheat.
Locust swarms resulted in the loss of approximately 220,000 hectares of wheat in 1999 and 200,000
hectares in 2008. Although devastating at the local level, these losses were small relative to the total
wheat area of 8.7 million hectares in 1999 and 12.9 million hectares in 2008. Pests and diseases, mainly
fungal diseases like leaf blotch caused by Septoria tritici and rust caused by Puccinia tritici, are also
common, but losses are minimal. A well-organized program of crop protection minimizes damage due
to crop disease, although there is considerable scope for increased use of wheat varieties that are more
tolerant to both disease and moisture stress. In northern and central Kazakhstan, spring wheat crops
can also be damaged by hail and early autumn frosts.
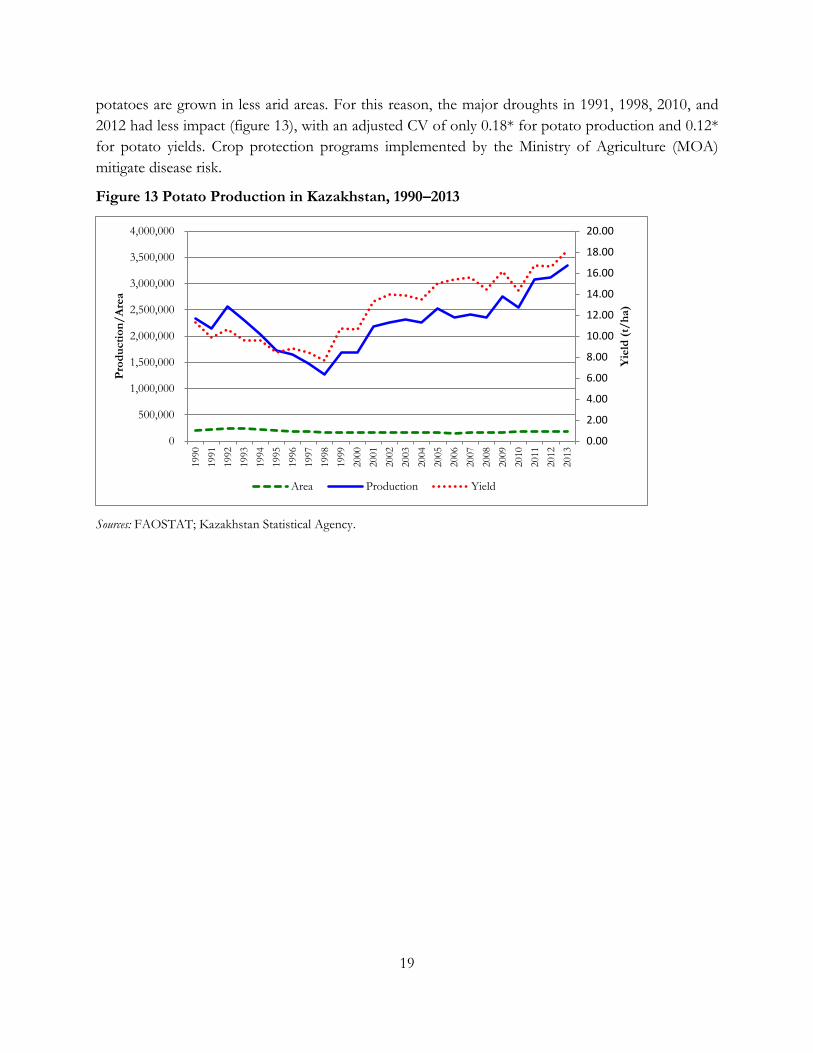
Potatoes
Potato production contributes 8 percent of GAO, but accounts for only 1 percent of total cultivated
area. Rain-fed production varies with yield, as it does for wheat, but variability is much lower, as
0.00
0.20
0.40
0.60
0.80
1.00
1.20
1.40
1.60
1.80
0
5,000,000
10,000,000
15,000,000
20,000,000
25,000,000
1990
1991
1992
1993
1994
1995
1996
1997
1998
1999
2000
2001
2002
2003
2004
2005
2006
2007
2008
2009
2010
2011
2012
2013
Yie
ld (
t/h
a)
Pro
du
cti
on
(t)
& A
rea (
ha)
Area Production Yield
19
potatoes are grown in less arid areas. For this reason, the major droughts in 1991, 1998, 2010, and
2012 had less impact (figure 13), with an adjusted CV of only 0.18* for potato production and 0.12*
for potato yields. Crop protection programs implemented by the Ministry of Agriculture (MOA)
mitigate disease risk.
Figure 13 Potato Production in Kazakhstan, 1990–2013
Sources: FAOSTAT; Kazakhstan Statistical Agency.
0.00
2.00
4.00
6.00
8.00
10.00
12.00
14.00
16.00
18.00
20.00
0
500,000
1,000,000
1,500,000
2,000,000
2,500,000
3,000,000
3,500,000
4,000,000
1990
1991
1992
1993
1994
1995
1996
1997
1998
1999
2000
2001
2002
2003
2004
2005
2006
2007
2008
2009
2010
2011
2012
2013
Yie
ld (
t/h
a)
Pro
du
cti
on
/A
rea
Area Production Yield
20
Tomatoes
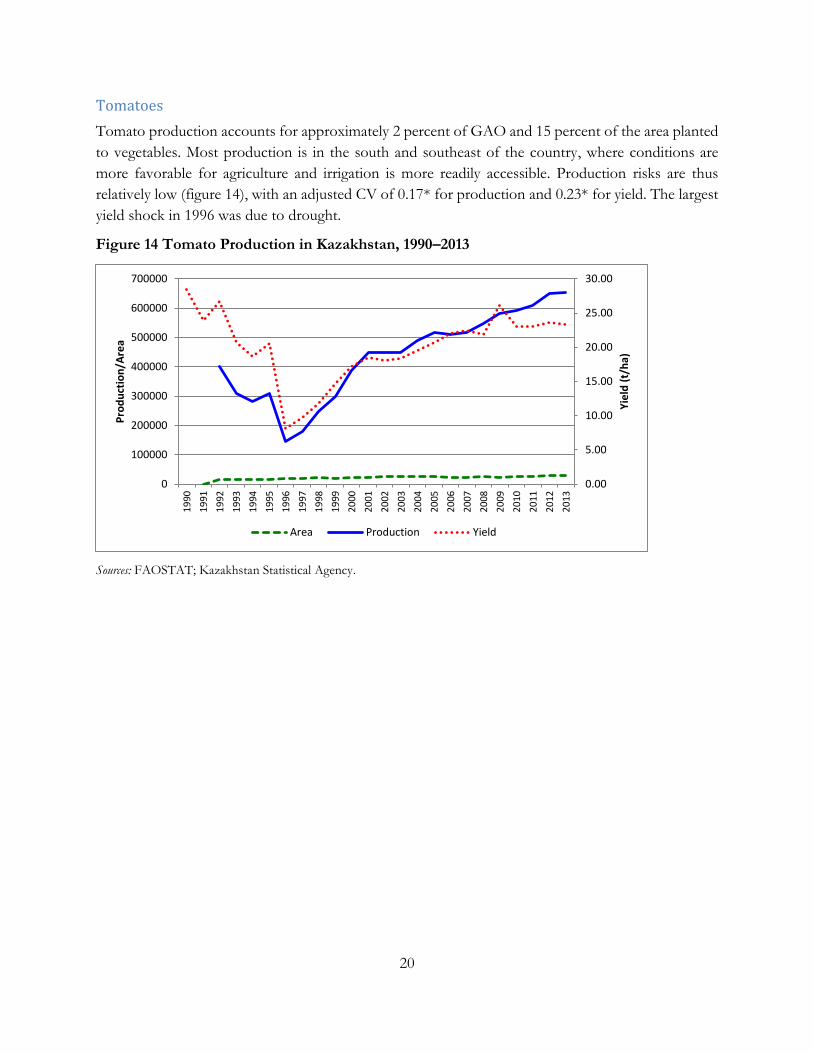
Tomato production accounts for approximately 2 percent of GAO and 15 percent of the area planted
to vegetables. Most production is in the south and southeast of the country, where conditions are
more favorable for agriculture and irrigation is more readily accessible. Production risks are thus
relatively low (figure 14), with an adjusted CV of 0.17* for production and 0.23* for yield. The largest
yield shock in 1996 was due to drought.
Figure 14 Tomato Production in Kazakhstan, 1990–2013
Sources: FAOSTAT; Kazakhstan Statistical Agency.
0.00
5.00
10.00
15.00
20.00
25.00
30.00
0
100000
200000
300000
400000
500000
600000
700000
19
90
19
91
19
92
19
93
19
94
19
95
19
96
19
97
19
98
19
99
20
00
20
01
20
02
20
03
20
04
20
05
20
06
20
07
20
08
20
09
20
10
20
11
20
12
20
13
Yie
ld (
t/h
a)
Pro
du
ctio
n/A
rea
Area Production Yield
21
Livestock Production
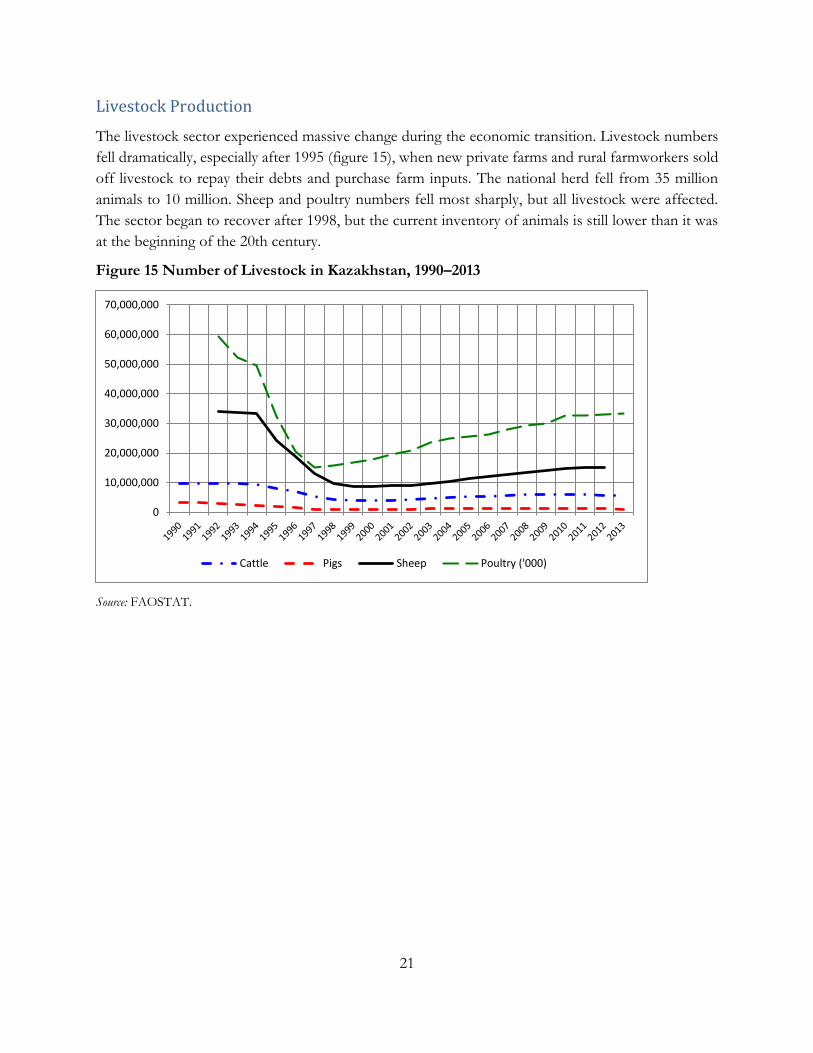
The livestock sector experienced massive change during the economic transition. Livestock numbers
fell dramatically, especially after 1995 (figure 15), when new private farms and rural farmworkers sold
off livestock to repay their debts and purchase farm inputs. The national herd fell from 35 million
animals to 10 million. Sheep and poultry numbers fell most sharply, but all livestock were affected.
The sector began to recover after 1998, but the current inventory of animals is still lower than it was
at the beginning of the 20th century.
Figure 15 Number of Livestock in Kazakhstan, 1990–2013
Source: FAOSTAT.
0
10,000,000
20,000,000
30,000,000
40,000,000
50,000,000
60,000,000
70,000,000
Cattle Pigs Sheep Poultry ('000)
22
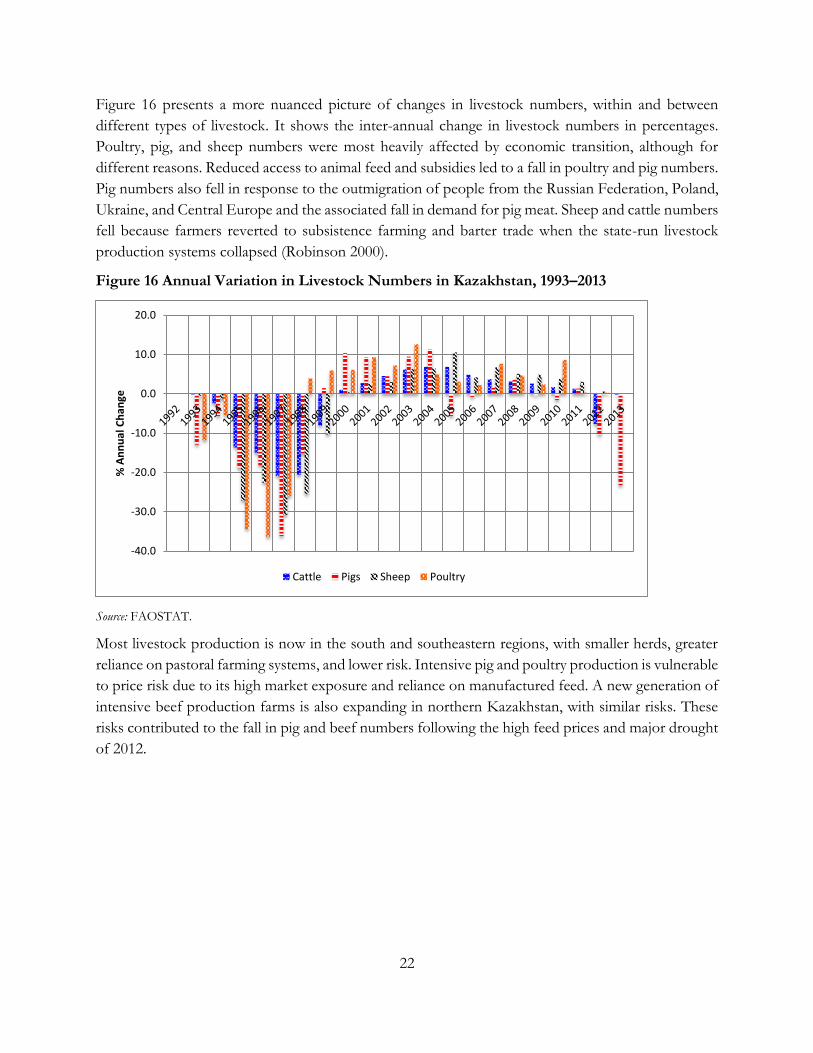
Figure 16 presents a more nuanced picture of changes in livestock numbers, within and between
different types of livestock. It shows the inter-annual change in livestock numbers in percentages.
Poultry, pig, and sheep numbers were most heavily affected by economic transition, although for
different reasons. Reduced access to animal feed and subsidies led to a fall in poultry and pig numbers.
Pig numbers also fell in response to the outmigration of people from the Russian Federation, Poland,
Ukraine, and Central Europe and the associated fall in demand for pig meat. Sheep and cattle numbers
fell because farmers reverted to subsistence farming and barter trade when the state-run livestock
production systems collapsed (Robinson 2000).
Figure 16 Annual Variation in Livestock Numbers in Kazakhstan, 1993–2013
Source: FAOSTAT.
Most livestock production is now in the south and southeastern regions, with smaller herds, greater
reliance on pastoral farming systems, and lower risk. Intensive pig and poultry production is vulnerable
to price risk due to its high market exposure and reliance on manufactured feed. A new generation of
intensive beef production farms is also expanding in northern Kazakhstan, with similar risks. These
risks contributed to the fall in pig and beef numbers following the high feed prices and major drought
of 2012.
-40.0
-30.0
-20.0
-10.0
0.0
10.0
20.0
% A
nn
ual
Ch
ange
Cattle Pigs Sheep Poultry
23
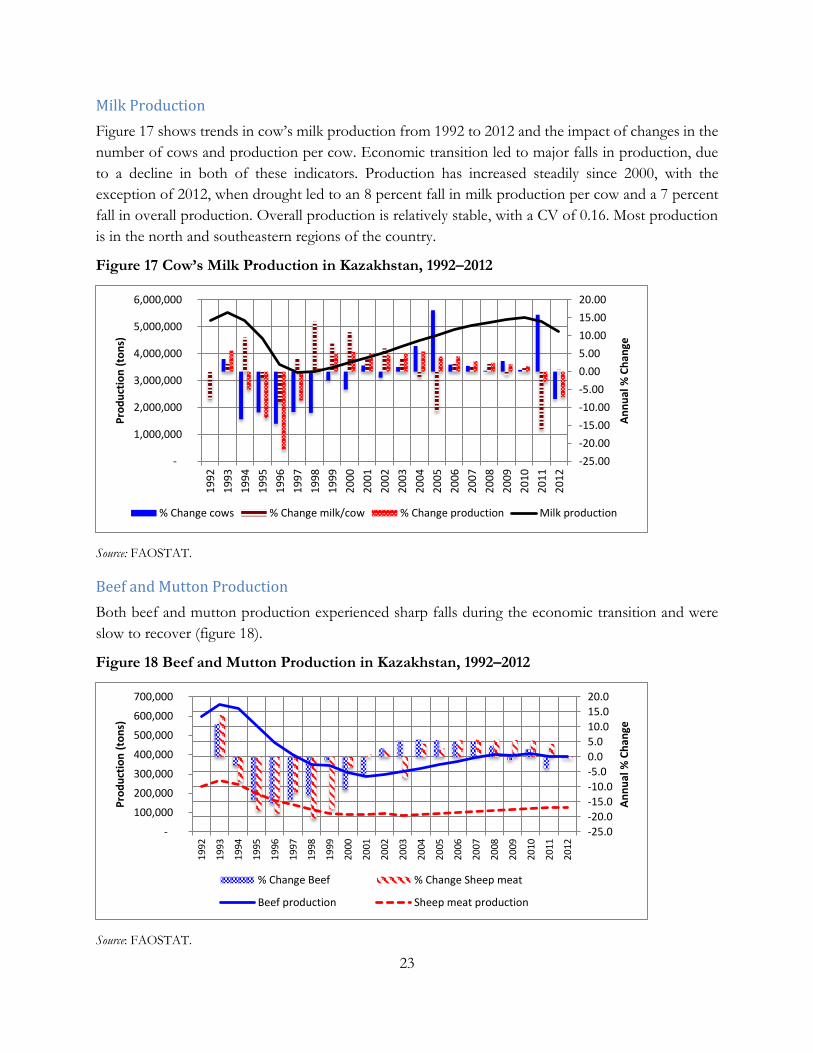
Milk Production
Figure 17 shows trends in cow’s milk production from 1992 to 2012 and the impact of changes in the
number of cows and production per cow. Economic transition led to major falls in production, due
to a decline in both of these indicators. Production has increased steadily since 2000, with the
exception of 2012, when drought led to an 8 percent fall in milk production per cow and a 7 percent
fall in overall production. Overall production is relatively stable, with a CV of 0.16. Most production
is in the north and southeastern regions of the country.
Figure 17 Cow’s Milk Production in Kazakhstan, 1992–2012
Source: FAOSTAT.
Beef and Mutton Production
Both beef and mutton production experienced sharp falls during the economic transition and were
slow to recover (figure 18).
Figure 18 Beef and Mutton Production in Kazakhstan, 1992–2012
Source: FAOSTAT.
-25.00
-20.00
-15.00
-10.00
-5.00
0.00
5.00
10.00
15.00
20.00
-
1,000,000
2,000,000
3,000,000
4,000,000
5,000,000
6,000,000
19
92
19
93
19
94
19
95
19
96
19
97
19
98
19
99
20
00
20
01
20
02
20
03
20
04
20
05
20
06
20
07
20
08
20
09
20
10
20
11
20
12
An
nu
al %
Ch
ange
Pro
du
ctio
n (
ton
s)
% Change cows % Change milk/cow % Change production Milk production
-25.0
-20.0
-15.0
-10.0
-5.0
0.0
5.0
10.0
15.0
20.0
-
100,000
200,000
300,000
400,000
500,000
600,000
700,000
19
92
19
93
19
94
19
95
19
96
19
97
19
98
19
99
20
00
20
01
20
02
20
03
20
04
20
05
20
06
20
07
20
08
20
09
20
10
20
11
20
12
An
nu
al %
Ch
ange
Pro
du
ctio
n (
ton
s)
% Change Beef % Change Sheep meat
Beef production Sheep meat production
24
Production has grown since 2001, apart from a small decline in beef production in 2011 due to a
reduction in the number of cattle and higher feed prices following the 2010 drought. Moderately high
adjusted CVs—0.23* for beef and 0.32* for mutton—reflect the impact of the economic transition.
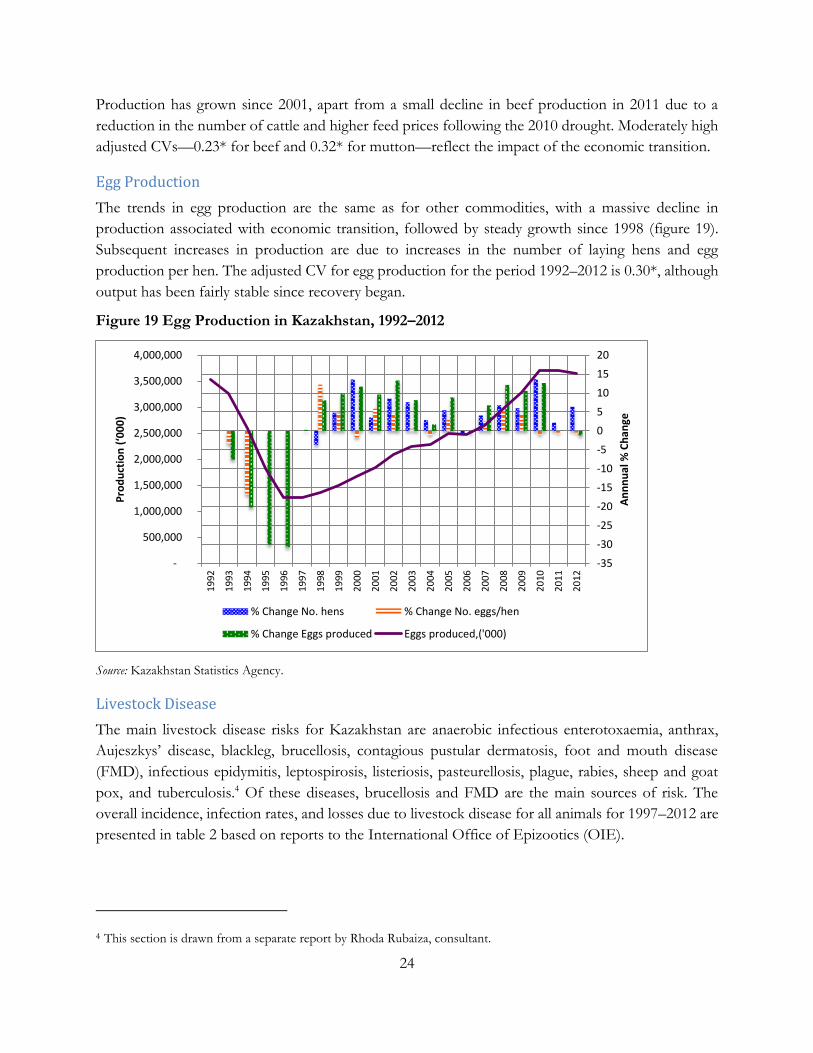
Egg Production
The trends in egg production are the same as for other commodities, with a massive decline in
production associated with economic transition, followed by steady growth since 1998 (figure 19).
Subsequent increases in production are due to increases in the number of laying hens and egg
production per hen. The adjusted CV for egg production for the period 1992–2012 is 0.30*, although
output has been fairly stable since recovery began.
Figure 19 Egg Production in Kazakhstan, 1992–2012
Source: Kazakhstan Statistics Agency.
Livestock Disease
The main livestock disease risks for Kazakhstan are anaerobic infectious enterotoxaemia, anthrax,
Aujeszkys’ disease, blackleg, brucellosis, contagious pustular dermatosis, foot and mouth disease
(FMD), infectious epidymitis, leptospirosis, listeriosis, pasteurellosis, plague, rabies, sheep and goat
pox, and tuberculosis.4 Of these diseases, brucellosis and FMD are the main sources of risk. The
overall incidence, infection rates, and losses due to livestock disease for all animals for 1997–2012 are
presented in table 2 based on reports to the International Office of Epizootics (OIE).
4 This section is drawn from a separate report by Rhoda Rubaiza, consultant.
-35
-30
-25
-20
-15
-10
-5
0
5
10
15
20
-
500,000
1,000,000
1,500,000
2,000,000
2,500,000
3,000,000
3,500,000
4,000,000
19
92
19
93
19
94
19
95
19
96
19
97
19
98
19
99
20
00
20
01
20
02
20
03
20
04
20
05
20
06
20
07
20
08
20
09
20
10
20
11
20
12
An
nn
ual
% C
han
ge
Pro
du
ctio
n (
‘00
0)
% Change No. hens % Change No. eggs/hen
% Change Eggs produced Eggs produced,('000)
25
Table 2 Incidence and Impact of Livestock Diseases Reported in Kazakhstan, by Type of
Animal, 1997–2012
Type of livestock Outbreaks Infected animals Deaths Destroyed Slaughtered
Vaccinations (average)a
Cattle 170 12,584 218 7,723 8,908 3,080,428
Sheep and goats 154 16,962 35 11,631 9,359 6,403,942
Horses 3 4 2 2 — 844,407
Pigs 6 — — 513 — 491,694
Poultry — — — — — 7,700,562
Camels 6 6 6 6 — 209,479
Dogs 35 36 36 36 — 253,272
Cats 6 6 6 6 — 185,134
Source: International Office of Epizootics.
Note: — = none reported.
a. Average of number of number of vaccinations per outbreak.
While outbreaks of disease were reported in 12 of the 16 years between 1997 and 2012, not all diseases
occurred every year. Outbreaks of FMD, the most frequently observed major livestock disease,
occurred in 7 out of 16 years for cattle and in 5 out of 16 years for small ruminants. Outbreaks of
brucellosis occurred in 4 out of 16 years for both cattle and small ruminants. Infection rates and losses
for these two major diseases are low, as reported in table 3, which shows the impact of the worst
recorded outbreaks from 1997 to 2012.
Table 3 Impact of Worst Outbreaks of Brucellosis and FMD in Kazakhstan, 1997–2012
Susceptible animals Infected animals Deaths, destroyed, or slaughtered
Disease and type of animals Number % of total Number % of total Number % of total
Brucellosis (2009)
Cattle 6,043 0.10 1,010 0.015 1,109 0.015 Small ruminants 58,622 0.35 3,209 0.02 3,209 0.02 Foot and mouth disease (2007)
Cattle 10,381 0.2 2,503 0.04 2,493 0.04 Small ruminants 24,683 0.16 82 — 82 —
Source: International Office of Epizootics.
Note: — = none reported.
Even in the worst outbreak, the number of susceptible animals was less than 0.5 percent of the total,
the number of infected animals was less than 0.05 percent, and the direct losses (deaths, destroyed,
slaughtered) were less than 0.05 percent. The outbreak of livestock disease is thus a medium-
frequency, low-cost risk for livestock production. Comparison of trends for 1997–2006 versus 2007–
12 shows that the frequency of outbreaks is increasing, while the number of infected animals is falling,
suggesting that both ex ante surveillance and ex post control measures are improving. All vaccination
and control programs are funded by the government.
26
Brucellosis is endemic to Kazakhstan, with animal infection rates estimated at 0.7 percent by the
National Veterinary Service. Infection is transmitted locally as well as from imported livestock
products and movements of illegal livestock. National vaccination programs were implemented in
2001–06, with varying levels of coverage. A test and slaughter program was then introduced in 2007,
based on biannual screening. Sero-positive animals are now slaughtered, and the owners are
compensated at market value. Half of this compensation comes from government, and the rest comes
from meat processors. Since 2009, screening has been complemented by animal identification of the
national herd to facilitate the tracking of sero-positive animals.
Foot and mouth disease is a highly contagious viral disease that affects cloven-hoofed domestic and
wild animals. Control is particularly challenging, as there are seven different serotypes, each of which
requires a separate vaccine. Asia 1 is the most common serotype in Kazakhstan, but A and O serotypes
are also observed. Control is based on national vaccination programs for these three serotypes, with
coverage estimated at 71 percent.
Humans are at risk from brucellosis, anthrax, rabies, and tuberculosis. Brucellosis poses the main risk
to humans, with a high and rising infection rate of 116 cases per 1 million persons, which is among
the 25 highest infection rates in the world (Pappas et al. 2006). Government has strengthened health
and safety controls on dairy imports from the Kyrgyz Republic to reduce sources of infection. Stronger
health and safety controls are also required for domestic livestock products, together with measures
to ensure that sero-positive animals are correctly identified and slaughtered. There have been three
anthrax outbreaks since 2004, with one to three infected animals in each outbreak. High vaccination
rates (86 percent) minimize this risk. Annual vaccination programs also minimize the risk of rabies
and tuberculosis, with the last outbreak for both diseases in 2004. Stronger measures to ensure
appropriate destruction of infected animals are essential to control these three diseases.
Price Risks
Wheat Prices
Kazakhstan is a major exporter of wheat, with sales of 6 million to 8 million tons a year. Producer
prices are heavily influenced by international prices, as shown by the high correlation between nominal
producer prices and international prices in figure 20. Trends in real prices reflect the combined
influence of international prices and domestic inflation. Real prices are less variable, however, with a
CV of 0.18 versus adjusted CVs of 0.24* and 0.26* for nominal wheat and international soft wheat
prices, respectively.
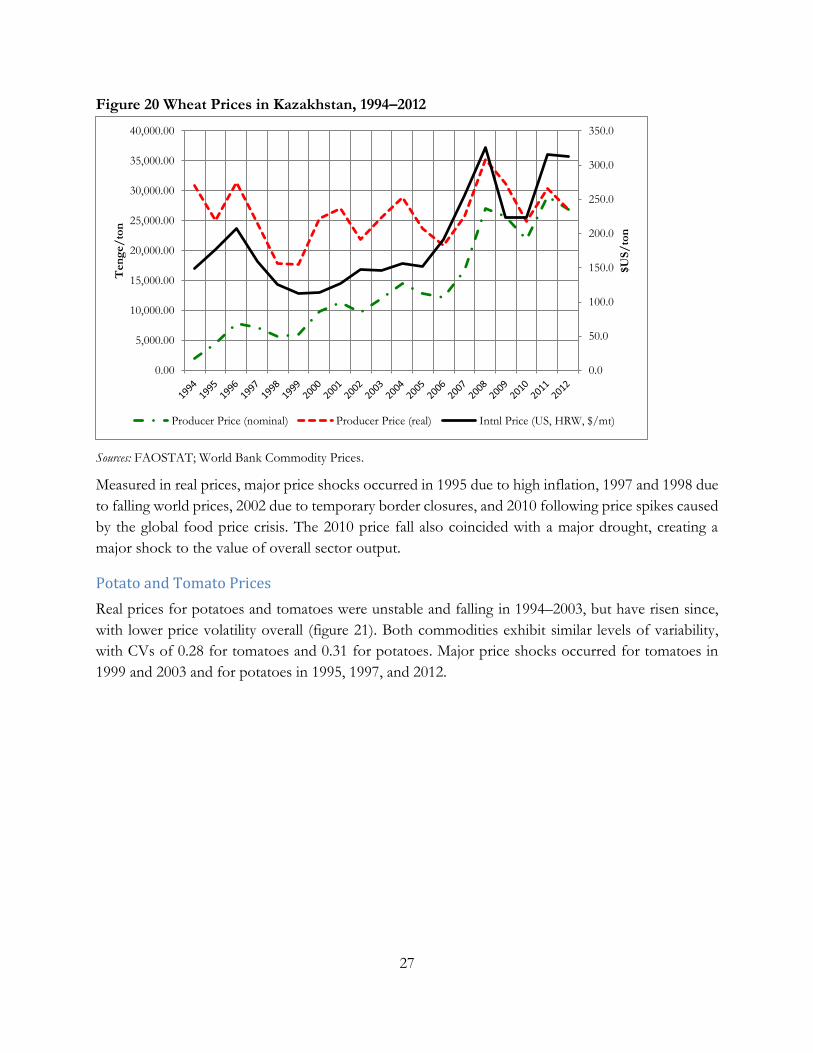
27
Figure 20 Wheat Prices in Kazakhstan, 1994–2012
Sources: FAOSTAT; World Bank Commodity Prices.
Measured in real prices, major price shocks occurred in 1995 due to high inflation, 1997 and 1998 due
to falling world prices, 2002 due to temporary border closures, and 2010 following price spikes caused
by the global food price crisis. The 2010 price fall also coincided with a major drought, creating a
major shock to the value of overall sector output.
Potato and Tomato Prices
Real prices for potatoes and tomatoes were unstable and falling in 1994–2003, but have risen since,
with lower price volatility overall (figure 21). Both commodities exhibit similar levels of variability,
with CVs of 0.28 for tomatoes and 0.31 for potatoes. Major price shocks occurred for tomatoes in
1999 and 2003 and for potatoes in 1995, 1997, and 2012.
0.0
50.0
100.0
150.0
200.0
250.0
300.0
350.0
0.00
5,000.00
10,000.00
15,000.00
20,000.00
25,000.00
30,000.00
35,000.00
40,000.00
$U
S/
ton
Ten
ge/
ton
Producer Price (nominal) Producer Price (real) Intnl Price (US, HRW, $/mt)
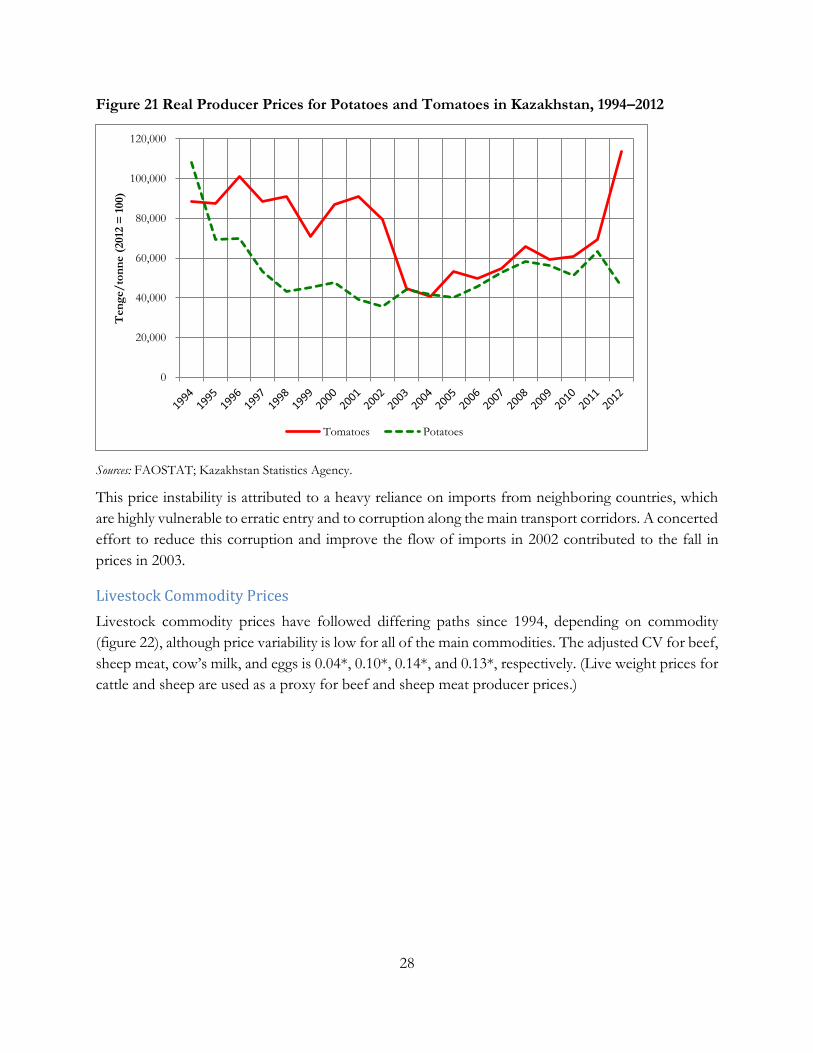
28
Figure 21 Real Producer Prices for Potatoes and Tomatoes in Kazakhstan, 1994–2012
Sources: FAOSTAT; Kazakhstan Statistics Agency.
This price instability is attributed to a heavy reliance on imports from neighboring countries, which
are highly vulnerable to erratic entry and to corruption along the main transport corridors. A concerted
effort to reduce this corruption and improve the flow of imports in 2002 contributed to the fall in
prices in 2003.
Livestock Commodity Prices
Livestock commodity prices have followed differing paths since 1994, depending on commodity
(figure 22), although price variability is low for all of the main commodities. The adjusted CV for beef,
sheep meat, cow’s milk, and eggs is 0.04*, 0.10*, 0.14*, and 0.13*, respectively. (Live weight prices for
cattle and sheep are used as a proxy for beef and sheep meat producer prices.)
0
20,000
40,000
60,000
80,000
100,000
120,000
Ten
ge/
ton
ne (
2012
= 1
00)
Tomatoes Potatoes
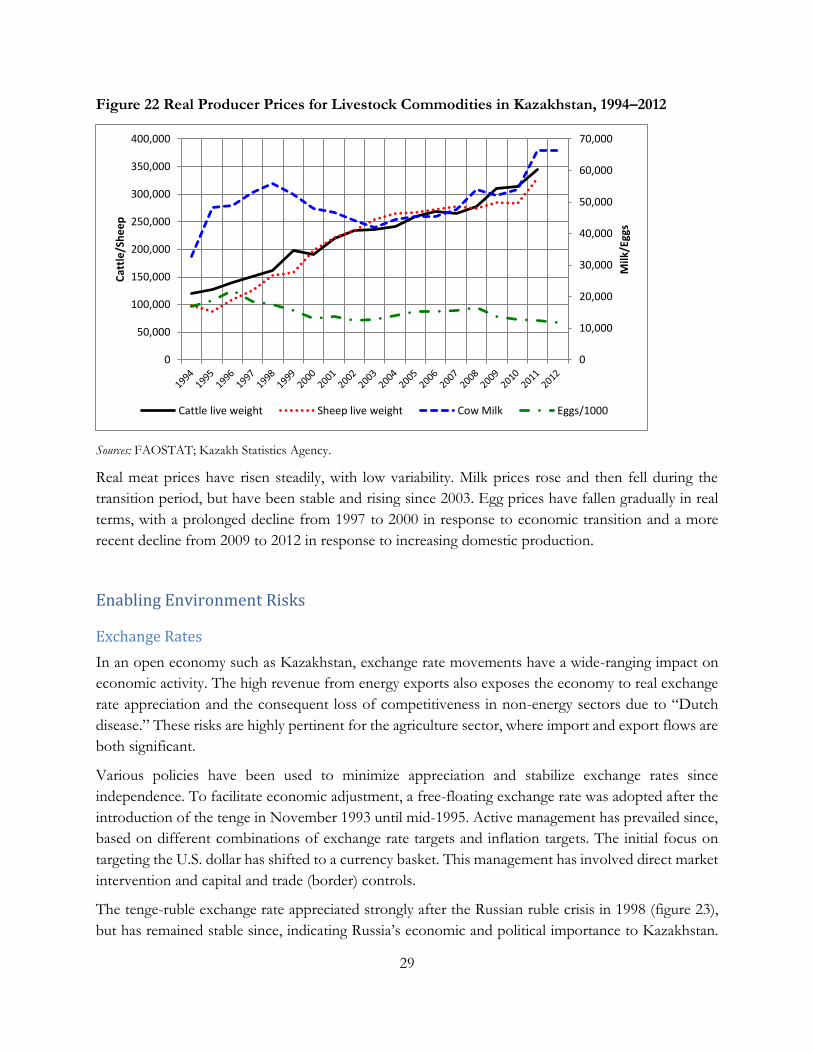
29
Figure 22 Real Producer Prices for Livestock Commodities in Kazakhstan, 1994–2012
Sources: FAOSTAT; Kazakh Statistics Agency.
Real meat prices have risen steadily, with low variability. Milk prices rose and then fell during the
transition period, but have been stable and rising since 2003. Egg prices have fallen gradually in real
terms, with a prolonged decline from 1997 to 2000 in response to economic transition and a more
recent decline from 2009 to 2012 in response to increasing domestic production.
Enabling Environment Risks
Exchange Rates
In an open economy such as Kazakhstan, exchange rate movements have a wide-ranging impact on
economic activity. The high revenue from energy exports also exposes the economy to real exchange
rate appreciation and the consequent loss of competitiveness in non-energy sectors due to “Dutch
disease.” These risks are highly pertinent for the agriculture sector, where import and export flows are
both significant.
Various policies have been used to minimize appreciation and stabilize exchange rates since
independence. To facilitate economic adjustment, a free-floating exchange rate was adopted after the
introduction of the tenge in November 1993 until mid-1995. Active management has prevailed since,
based on different combinations of exchange rate targets and inflation targets. The initial focus on
targeting the U.S. dollar has shifted to a currency basket. This management has involved direct market
intervention and capital and trade (border) controls.
The tenge-ruble exchange rate appreciated strongly after the Russian ruble crisis in 1998 (figure 23),
but has remained stable since, indicating Russia’s economic and political importance to Kazakhstan.
0
10,000
20,000
30,000
40,000
50,000
60,000
70,000
0
50,000
100,000
150,000
200,000
250,000
300,000
350,000
400,000
Milk
/Egg
s
Cat
tle
/Sh
ee
p
Cattle live weight Sheep live weight Cow Milk Eggs/1000
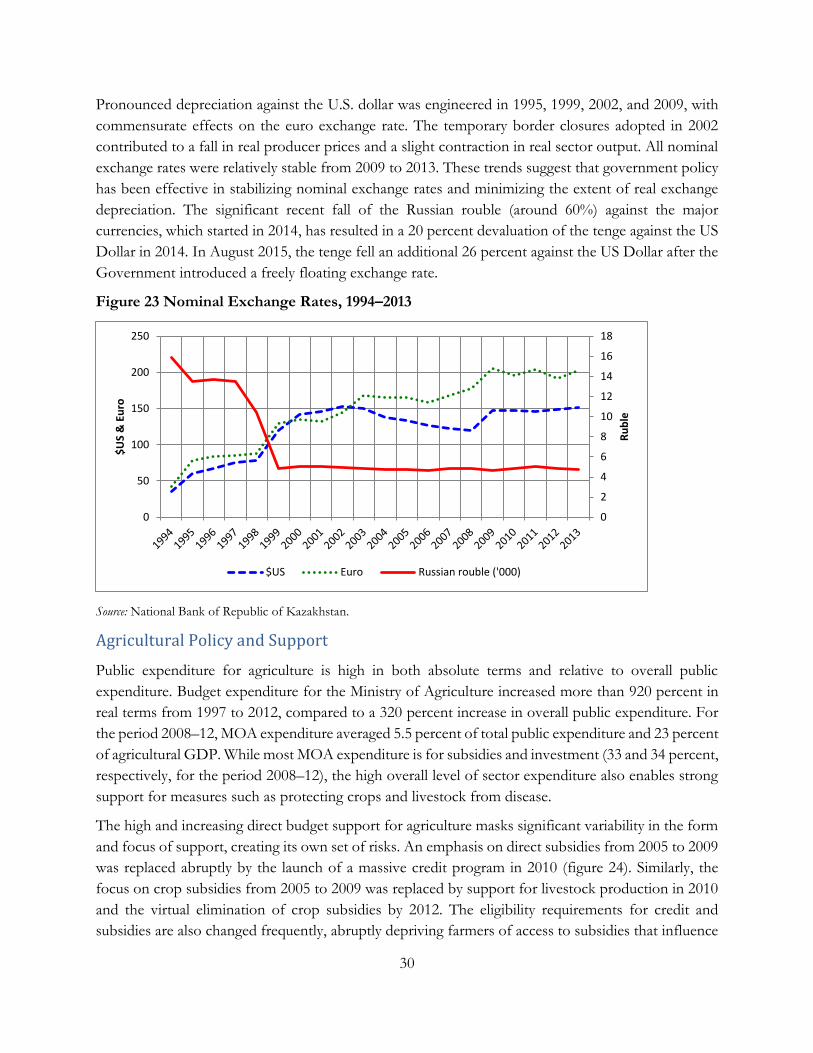
30
Pronounced depreciation against the U.S. dollar was engineered in 1995, 1999, 2002, and 2009, with
commensurate effects on the euro exchange rate. The temporary border closures adopted in 2002
contributed to a fall in real producer prices and a slight contraction in real sector output. All nominal
exchange rates were relatively stable from 2009 to 2013. These trends suggest that government policy
has been effective in stabilizing nominal exchange rates and minimizing the extent of real exchange
depreciation. The significant recent fall of the Russian rouble (around 60%) against the major
currencies, which started in 2014, has resulted in a 20 percent devaluation of the tenge against the US
Dollar in 2014. In August 2015, the tenge fell an additional 26 percent against the US Dollar after the
Government introduced a freely floating exchange rate.
Figure 23 Nominal Exchange Rates, 1994–2013
Source: National Bank of Republic of Kazakhstan.
Agricultural Policy and Support
Public expenditure for agriculture is high in both absolute terms and relative to overall public
expenditure. Budget expenditure for the Ministry of Agriculture increased more than 920 percent in
real terms from 1997 to 2012, compared to a 320 percent increase in overall public expenditure. For
the period 2008–12, MOA expenditure averaged 5.5 percent of total public expenditure and 23 percent
of agricultural GDP. While most MOA expenditure is for subsidies and investment (33 and 34 percent,
respectively, for the period 2008–12), the high overall level of sector expenditure also enables strong
support for measures such as protecting crops and livestock from disease.
The high and increasing direct budget support for agriculture masks significant variability in the form
and focus of support, creating its own set of risks. An emphasis on direct subsidies from 2005 to 2009
was replaced abruptly by the launch of a massive credit program in 2010 (figure 24). Similarly, the
focus on crop subsidies from 2005 to 2009 was replaced by support for livestock production in 2010
and the virtual elimination of crop subsidies by 2012. The eligibility requirements for credit and
subsidies are also changed frequently, abruptly depriving farmers of access to subsidies that influence
0
2
4
6
8
10
12
14
16
18
0
50
100
150
200
250
Ru
ble
$U
S &
Eu
ro
$US Euro Russian rouble ('000)
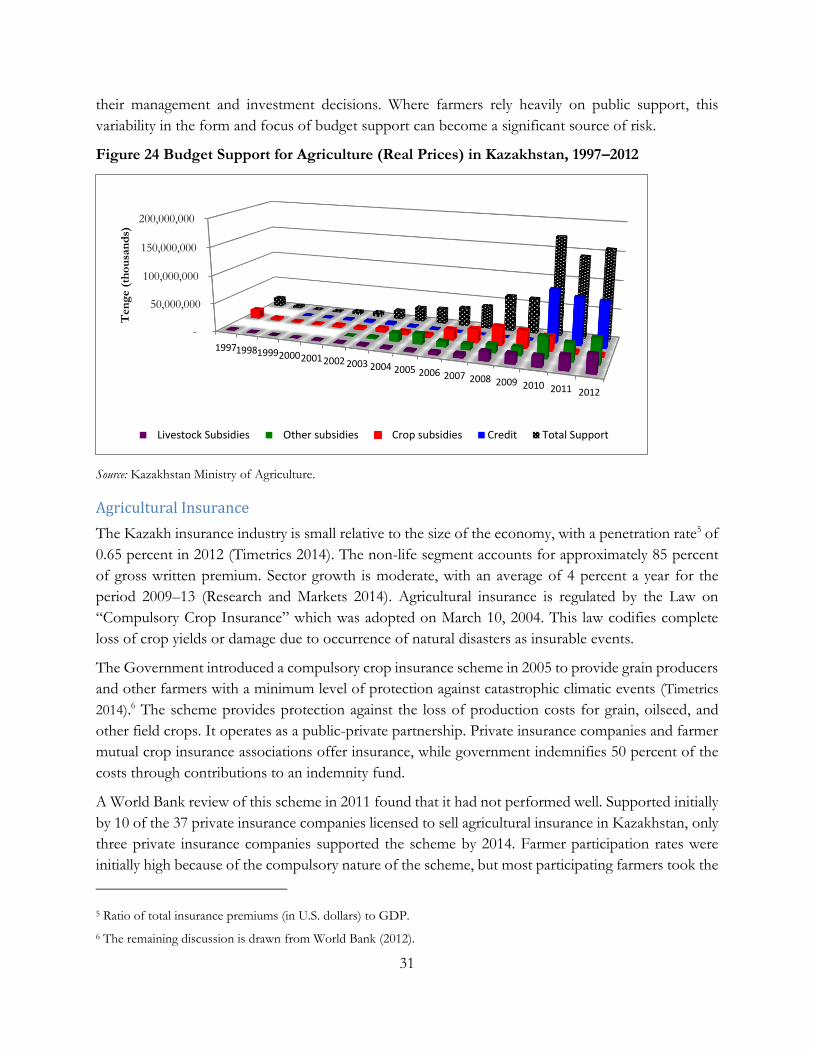
31
their management and investment decisions. Where farmers rely heavily on public support, this
variability in the form and focus of budget support can become a significant source of risk.
Figure 24 Budget Support for Agriculture (Real Prices) in Kazakhstan, 1997–2012
Source: Kazakhstan Ministry of Agriculture.
Agricultural Insurance
The Kazakh insurance industry is small relative to the size of the economy, with a penetration rate5 of
0.65 percent in 2012 (Timetrics 2014). The non-life segment accounts for approximately 85 percent
of gross written premium. Sector growth is moderate, with an average of 4 percent a year for the
period 2009–13 (Research and Markets 2014). Agricultural insurance is regulated by the Law on
“Compulsory Crop Insurance” which was adopted on March 10, 2004. This law codifies complete
loss of crop yields or damage due to occurrence of natural disasters as insurable events.
The Government introduced a compulsory crop insurance scheme in 2005 to provide grain producers
and other farmers with a minimum level of protection against catastrophic climatic events (Timetrics
2014).6 The scheme provides protection against the loss of production costs for grain, oilseed, and
other field crops. It operates as a public-private partnership. Private insurance companies and farmer
mutual crop insurance associations offer insurance, while government indemnifies 50 percent of the
costs through contributions to an indemnity fund.
A World Bank review of this scheme in 2011 found that it had not performed well. Supported initially
by 10 of the 37 private insurance companies licensed to sell agricultural insurance in Kazakhstan, only
three private insurance companies supported the scheme by 2014. Farmer participation rates were
initially high because of the compulsory nature of the scheme, but most participating farmers took the
5 Ratio of total insurance premiums (in U.S. dollars) to GDP.
6 The remaining discussion is drawn from World Bank (2012).
-
50,000,000
100,000,000
150,000,000
200,000,000
199719981999200020012002 2003 2004 2005 2006 2007 2008 2009 2010 2011 2012
Ten
ge (
tho
usa
nd
s)
Livestock Subsidies Other subsidies Crop subsidies Credit Total Support
32
minimum level of coverage, which did not provide adequate compensation in the event of loss. As
farmer resistance to the scheme increased, participation rates fell. By 2010 the number of policies
issued had fallen to 15,260 from 33,957 at the program’s peak in 2008. As of 2014, the average loss
ratio of claims paid to premium written was 146 percent, indicating a continued lack of financial
sustainability.
In brief, the current system of agricultural crop insurance suffers from the following problems:
1. Systemic risk and the lack of risk management: Kazakhstan is an area of high risk farming, with a high incidence of drought. The problem of frequent adverse weather events is further complicated by their systemic nature, with droughts affecting vast tracts of farm land at the same time, lead to massive losses for insurers. This problem is exacerbated by the current law, which precludes regional or global diversification of risk through re-insurance.
2. Insufficient insurance tariffs: The Law “On the compulsory crop insurance” specifies minimum and maximum tariffs for different crops. In practice, insurance premiums are calculated according to the minimum tariffs, which are too low to allow the establishment of a sufficient reserve for future insurance payments. This threatens the financial stability and sometimes even solvency of the insurer.
3. Inefficiency of government subsidies: Government support for compulsory crop insurance is provided through reimbursement of insurers and mutual insurance associations for 50 percent of indemnity payments. This subsidy reduces the motivation of insurance companies for proper claims assessment and in extreme cases may lead to collusion between the insurer and the insured with the purpose of fraudulent inflation of claims.
4. Absent regulation of mutual insurance associations: Due to the withdrawal of most commercial insurers from agricultural insurance, farmers increasingly rely for coverage on mutual insurance associations, which most frequently are founded by them. As these organizations are not subject to the insurance supervision by the National Bank or any auditing requirements, the risk of potential poor claims performance and fraud is high. In the absence of loss reserves, solvency margin and re-insurance, these mutual associations cannot provide meaningful insurance coverage against natural disasters and thus cannot be viewed as true underwriters and risk carriers. At the very best, they may act as self-help mutual insurance pools whose liabilities are limited by the amount of annual insurance premium collected from its members. While such an approach may work for diversifiable risks, it is unworkable for highly correlated risks where annual losses can easily exceed the premium manifold.
5. Flawed system of loss adjustment and claim settlement: As the law neither envisages insurers’ participation in the audits of insureds’ agricultural production practices nor allows insurers to be involved in the assessment of damages, insureds have no incentive to properly look after their crops or enhance their agricultural production practices to make their crops more resilient to climate change. As a result, the law makes it impossible for insurers to deny an insurance claim even in cases of obvious fraud (e.g. when a farmer claims loss of crop due to a natural disaster even though the area was never sown).
6. Insufficient minimum loss coverage. The minimum insurance coverage levels are extremely low and do not provide high enough payouts to sufficiently protect farmers in the event of a loss. Almost all farmer choose the lowest and cheapest level of coverage.
To improve the agricultural insurance the following changes should be considered:
33
Gradually convert the mandatory agricultural insurance system to a voluntary, market-based system, based on global best insurance and reinsurance industry practices.
The law should introduce a risk classification of farm lands and specify which crops are eligible for insurance coverage under the government subsidized program and which regions;
The law should revise the current approach to calculation of the indemnity payment by limiting the component of the farmers’ recoverable operating costs to a fraction of the crop replacement cost (as determined based on the survey of commercially viable farms);
To reduce instances of insurance fraud the law should require the insured to follow proper agricultural technologies and empower insurers to conduct subsequent insurance audits of insureds’ agricultural production practices.
To better align the financial incentives of farmers with those of insurers, the law should introduce a material deductible which would eliminate small claims and petty claims fraud.
The law should introduce a clear definition of insured loss, e.g. define at which level of fall in crop yields insurance coverage is activated.
The National Bank should introduce minimum regulatory requirements (including reserving and reinsurance and solvency margin) for all operators of the government agricultural insurance scheme, including mutual insurance associations.
The law should consider introducing an area yield index insurance product in lieu of the current one to improve the quality of coverage and reduce opportunities for fraud.
34
Costing and Prioritizing Agricultural Risks
This section analyzes the frequency, severity, and costs of adverse events as the basis for prioritizing
different sources of risk. Official information on losses due to adverse events is derived in different
ways and is invariably approximate. Analysis is thus based on estimates of the “indicative” value of
losses (defined below) to provide a more consistent basis for comparison. While these estimates draw
on actual data as much as possible, they represent indicative, not actual, losses.
Conceptual and Methodological Basis for Analysis
Risk is defined as exposure to a significant financial loss or other adverse outcome whose occurrence
and severity are unpredictable. It thus implies exposure to substantial losses, over and above the
normal costs of doing business. Agriculture is inherently variable, as producers incur losses every year
due to suboptimal climatic conditions at different times in the production cycle or departures from
expected prices. For the purposes of this study, risk refers to the more severe and unpredictable
adverse events that occur beyond these smaller events, measured as the inter-annual variation in the
value of output. A loss threshold was set to distinguish major adverse events from smaller, inter-
annual variations in output. Drawing on the results of agricultural risk analysis in other countries, this
threshold was set at 10 percent.
This definition also distinguishes between risks, which are unpredictable, and constraints, which are
known and so predictable. Sudden shocks to production (droughts, floods, locusts), prices or the
enabling environment (sudden policy changes or sharp, unexpected exchange rate movements) are
thus considered risks; while factors such as low productivity, poor access to credit, lack of labor and
lack of information are viewed as known, predictable constraints to sector output.
Indicative losses were calculated as follows. For production risks, the value of gross agricultural output
“lost” for each adverse event was first calculated in tenge as the difference between the actual change
in output and the threshold change in output, using constant producer prices (2004–06). The resultant
value was converted into U.S. dollars at 2012 exchange rates and also expressed as a percentage of the
value of GAO. The same methodology was used to derive the combined impact of production and
price shocks, based on actual production and real prices. This captures the joint impact of price and
production shocks, which is the reality that the sector faces.
As shown by the identities derived in appendix A, the losses due to the joint impact of production
and price shocks can be disaggregated into production impacts and price impacts. These identities are
used to calculate the indicative losses associated with price shocks alone for individual commodities.
Application of this methodology requires a consistent set of data on both production and prices for
an extended time period. Of the various sources of data available, FAOSTAT’s data series (1993–
2012) on the value of gross agricultural production and producer prices was considered the most
suitable. These data allowed the analysis of risk over a 19–20-year period for all products. The various
shocks derived from this analysis were attributed to specific events on the basis of interviews with
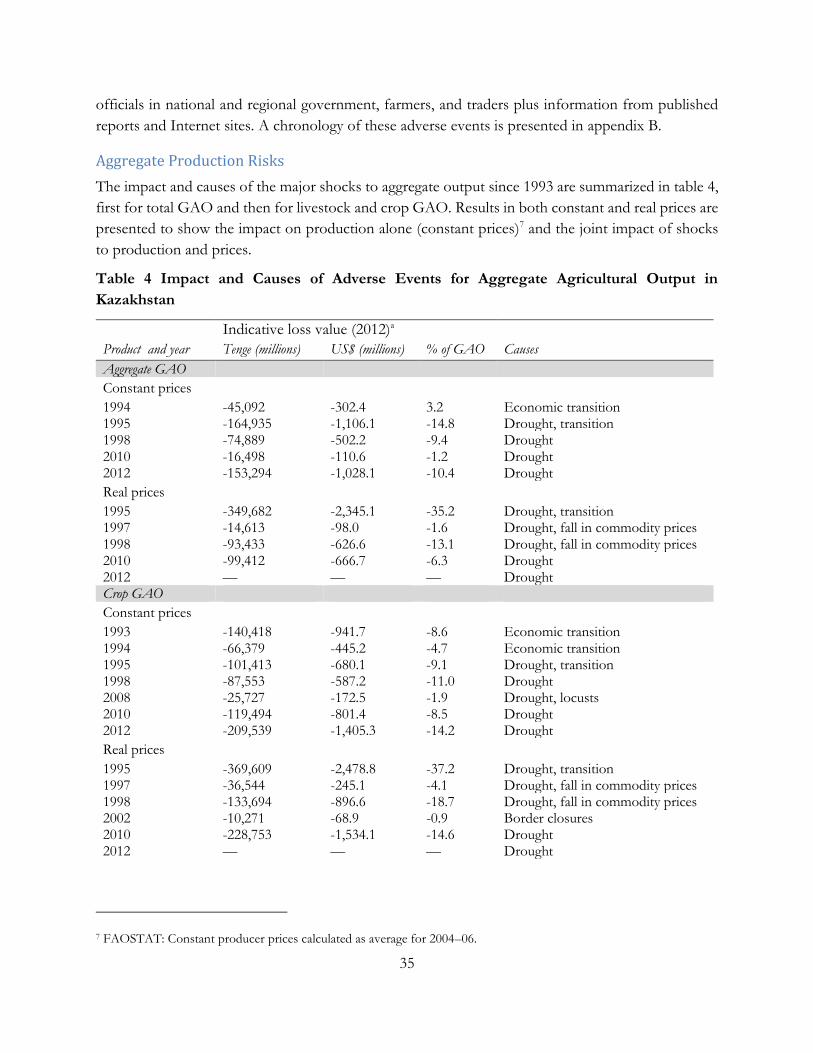
35
officials in national and regional government, farmers, and traders plus information from published
reports and Internet sites. A chronology of these adverse events is presented in appendix B.
Aggregate Production Risks
The impact and causes of the major shocks to aggregate output since 1993 are summarized in table 4,
first for total GAO and then for livestock and crop GAO. Results in both constant and real prices are
presented to show the impact on production alone (constant prices)7 and the joint impact of shocks
to production and prices.
Table 4 Impact and Causes of Adverse Events for Aggregate Agricultural Output in
Kazakhstan
Indicative loss value (2012)a
Product and year Tenge (millions) US$ (millions) % of GAO Causes
Aggregate GAO
Constant prices
1994 -45,092 -302.4 3.2 Economic transition 1995 -164,935 -1,106.1 -14.8 Drought, transition 1998 -74,889 -502.2 -9.4 Drought 2010 -16,498 -110.6 -1.2 Drought 2012 -153,294 -1,028.1 -10.4 Drought
Real prices
1995 -349,682 -2,345.1 -35.2 Drought, transition 1997 -14,613 -98.0 -1.6 Drought, fall in commodity prices 1998 -93,433 -626.6 -13.1 Drought, fall in commodity prices 2010 -99,412 -666.7 -6.3 Drought 2012 — — — Drought Crop GAO
Constant prices
1993 -140,418 -941.7 -8.6 Economic transition 1994 -66,379 -445.2 -4.7 Economic transition 1995 -101,413 -680.1 -9.1 Drought, transition 1998 -87,553 -587.2 -11.0 Drought 2008 -25,727 -172.5 -1.9 Drought, locusts 2010 -119,494 -801.4 -8.5 Drought 2012 -209,539 -1,405.3 -14.2 Drought
Real prices
1995 -369,609 -2,478.8 -37.2 Drought, transition 1997 -36,544 -245.1 -4.1 Drought, fall in commodity prices 1998 -133,694 -896.6 -18.7 Drought, fall in commodity prices 2002 -10,271 -68.9 -0.9 Border closures 2010 -228,753 -1,534.1 -14.6 Drought 2012 — — — Drought
7 FAOSTAT: Constant producer prices calculated as average for 2004–06.
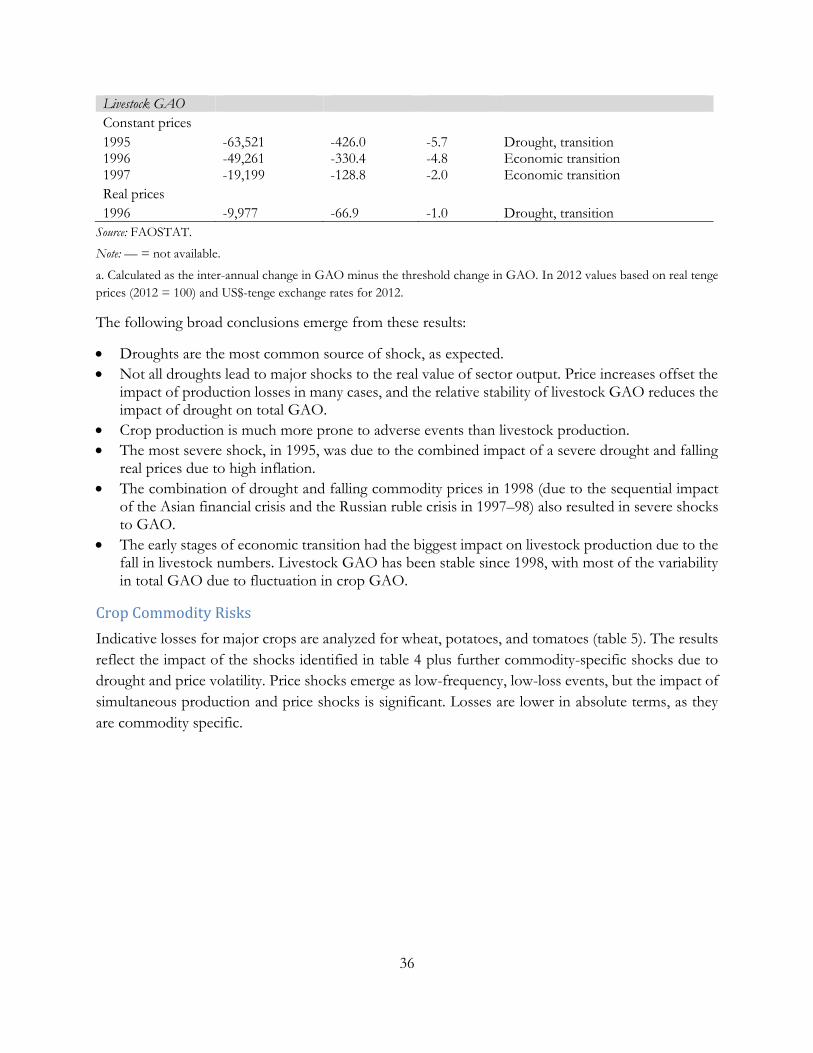
36
Livestock GAO
Constant prices
1995 -63,521 -426.0 -5.7 Drought, transition 1996 -49,261 -330.4 -4.8 Economic transition 1997 -19,199 -128.8 -2.0 Economic transition
Real prices
1996 -9,977 -66.9 -1.0 Drought, transition
Source: FAOSTAT.
Note: — = not available.
a. Calculated as the inter-annual change in GAO minus the threshold change in GAO. In 2012 values based on real tenge
prices (2012 = 100) and US$-tenge exchange rates for 2012.
The following broad conclusions emerge from these results:
Droughts are the most common source of shock, as expected.
Not all droughts lead to major shocks to the real value of sector output. Price increases offset the impact of production losses in many cases, and the relative stability of livestock GAO reduces the impact of drought on total GAO.
Crop production is much more prone to adverse events than livestock production.
The most severe shock, in 1995, was due to the combined impact of a severe drought and falling real prices due to high inflation.
The combination of drought and falling commodity prices in 1998 (due to the sequential impact of the Asian financial crisis and the Russian ruble crisis in 1997–98) also resulted in severe shocks to GAO.
The early stages of economic transition had the biggest impact on livestock production due to the fall in livestock numbers. Livestock GAO has been stable since 1998, with most of the variability in total GAO due to fluctuation in crop GAO.
Crop Commodity Risks
Indicative losses for major crops are analyzed for wheat, potatoes, and tomatoes (table 5). The results
reflect the impact of the shocks identified in table 4 plus further commodity-specific shocks due to
drought and price volatility. Price shocks emerge as low-frequency, low-loss events, but the impact of
simultaneous production and price shocks is significant. Losses are lower in absolute terms, as they
are commodity specific.
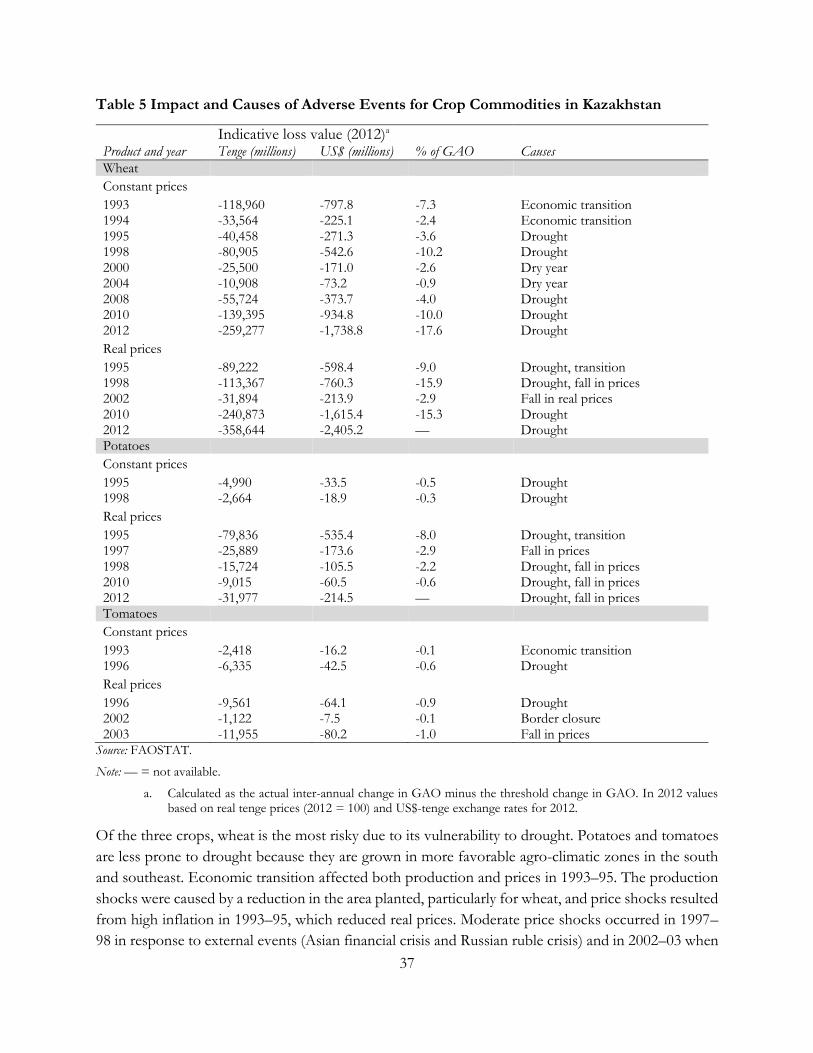
37
Table 5 Impact and Causes of Adverse Events for Crop Commodities in Kazakhstan
Indicative loss value (2012)a Product and year Tenge (millions) US$ (millions) % of GAO Causes Wheat
Constant prices
1993 -118,960 -797.8 -7.3 Economic transition 1994 -33,564 -225.1 -2.4 Economic transition 1995 -40,458 -271.3 -3.6 Drought 1998 -80,905 -542.6 -10.2 Drought 2000 -25,500 -171.0 -2.6 Dry year 2004 -10,908 -73.2 -0.9 Dry year 2008 -55,724 -373.7 -4.0 Drought 2010 -139,395 -934.8 -10.0 Drought 2012 -259,277 -1,738.8 -17.6 Drought
Real prices
1995 -89,222 -598.4 -9.0 Drought, transition 1998 -113,367 -760.3 -15.9 Drought, fall in prices 2002 -31,894 -213.9 -2.9 Fall in real prices 2010 -240,873 -1,615.4 -15.3 Drought 2012 -358,644 -2,405.2 — Drought Potatoes
Constant prices
1995 -4,990 -33.5 -0.5 Drought 1998 -2,664 -18.9 -0.3 Drought
Real prices
1995 -79,836 -535.4 -8.0 Drought, transition 1997 -25,889 -173.6 -2.9 Fall in prices 1998 -15,724 -105.5 -2.2 Drought, fall in prices 2010 -9,015 -60.5 -0.6 Drought, fall in prices 2012 -31,977 -214.5 — Drought, fall in prices Tomatoes
Constant prices
1993 -2,418 -16.2 -0.1 Economic transition 1996 -6,335 -42.5 -0.6 Drought
Real prices
1996 -9,561 -64.1 -0.9 Drought 2002 -1,122 -7.5 -0.1 Border closure 2003 -11,955 -80.2 -1.0 Fall in prices
Source: FAOSTAT.
Note: — = not available.
a. Calculated as the actual inter-annual change in GAO minus the threshold change in GAO. In 2012 values based on real tenge prices (2012 = 100) and US$-tenge exchange rates for 2012.
Of the three crops, wheat is the most risky due to its vulnerability to drought. Potatoes and tomatoes
are less prone to drought because they are grown in more favorable agro-climatic zones in the south
and southeast. Economic transition affected both production and prices in 1993–95. The production
shocks were caused by a reduction in the area planted, particularly for wheat, and price shocks resulted
from high inflation in 1993–95, which reduced real prices. Moderate price shocks occurred in 1997–
98 in response to external events (Asian financial crisis and Russian ruble crisis) and in 2002–03 when
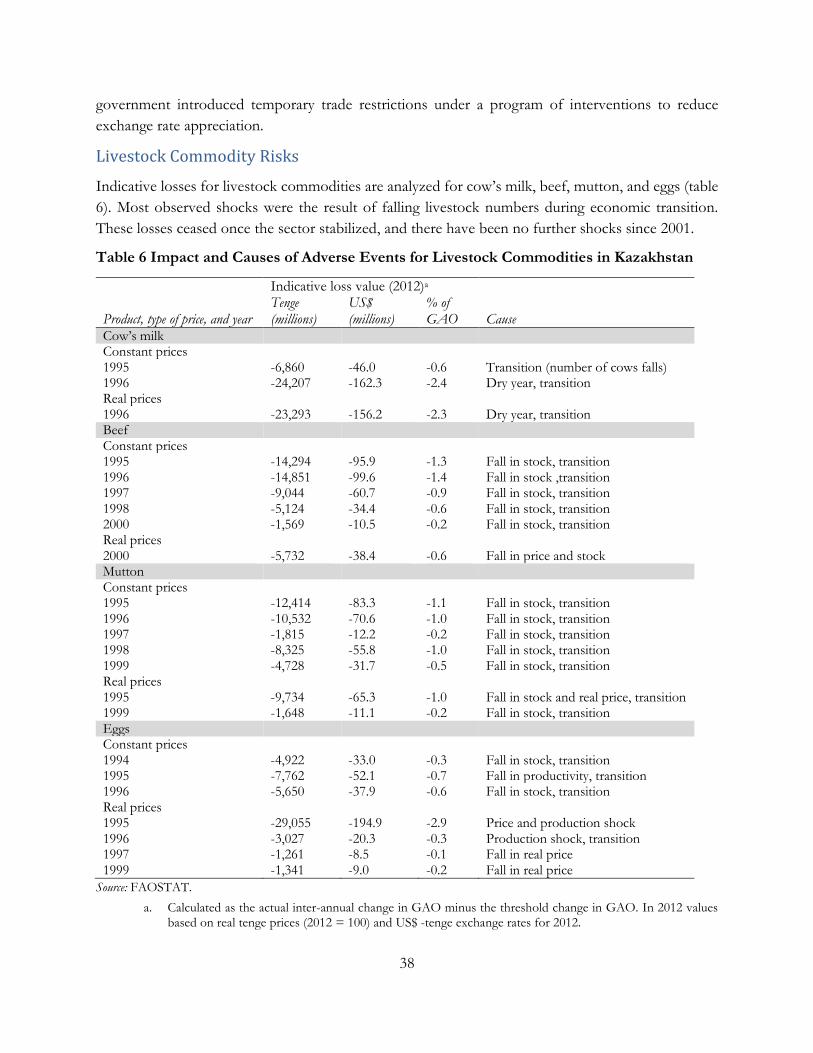
38
government introduced temporary trade restrictions under a program of interventions to reduce
exchange rate appreciation.
Livestock Commodity Risks
Indicative losses for livestock commodities are analyzed for cow’s milk, beef, mutton, and eggs (table
6). Most observed shocks were the result of falling livestock numbers during economic transition.
These losses ceased once the sector stabilized, and there have been no further shocks since 2001.
Table 6 Impact and Causes of Adverse Events for Livestock Commodities in Kazakhstan
Indicative loss value (2012)a
Product, type of price, and year Tenge (millions)
US$ (millions)
% of GAO Cause
Cow’s milk Constant prices 1995 -6,860 -46.0 -0.6 Transition (number of cows falls) 1996 -24,207 -162.3 -2.4 Dry year, transition Real prices 1996 -23,293 -156.2 -2.3 Dry year, transition Beef Constant prices 1995 -14,294 -95.9 -1.3 Fall in stock, transition 1996 -14,851 -99.6 -1.4 Fall in stock ,transition 1997 -9,044 -60.7 -0.9 Fall in stock, transition 1998 -5,124 -34.4 -0.6 Fall in stock, transition 2000 -1,569 -10.5 -0.2 Fall in stock, transition Real prices 2000 -5,732 -38.4 -0.6 Fall in price and stock Mutton Constant prices 1995 -12,414 -83.3 -1.1 Fall in stock, transition 1996 -10,532 -70.6 -1.0 Fall in stock, transition 1997 -1,815 -12.2 -0.2 Fall in stock, transition 1998 -8,325 -55.8 -1.0 Fall in stock, transition 1999 -4,728 -31.7 -0.5 Fall in stock, transition Real prices 1995 -9,734 -65.3 -1.0 Fall in stock and real price, transition 1999 -1,648 -11.1 -0.2 Fall in stock, transition Eggs Constant prices 1994 -4,922 -33.0 -0.3 Fall in stock, transition 1995 -7,762 -52.1 -0.7 Fall in productivity, transition 1996 -5,650 -37.9 -0.6 Fall in stock, transition Real prices 1995 -29,055 -194.9 -2.9 Price and production shock 1996 -3,027 -20.3 -0.3 Production shock, transition 1997 -1,261 -8.5 -0.1 Fall in real price 1999 -1,341 -9.0 -0.2 Fall in real price
Source: FAOSTAT.
a. Calculated as the actual inter-annual change in GAO minus the threshold change in GAO. In 2012 values based on real tenge prices (2012 = 100) and US$ -tenge exchange rates for 2012.
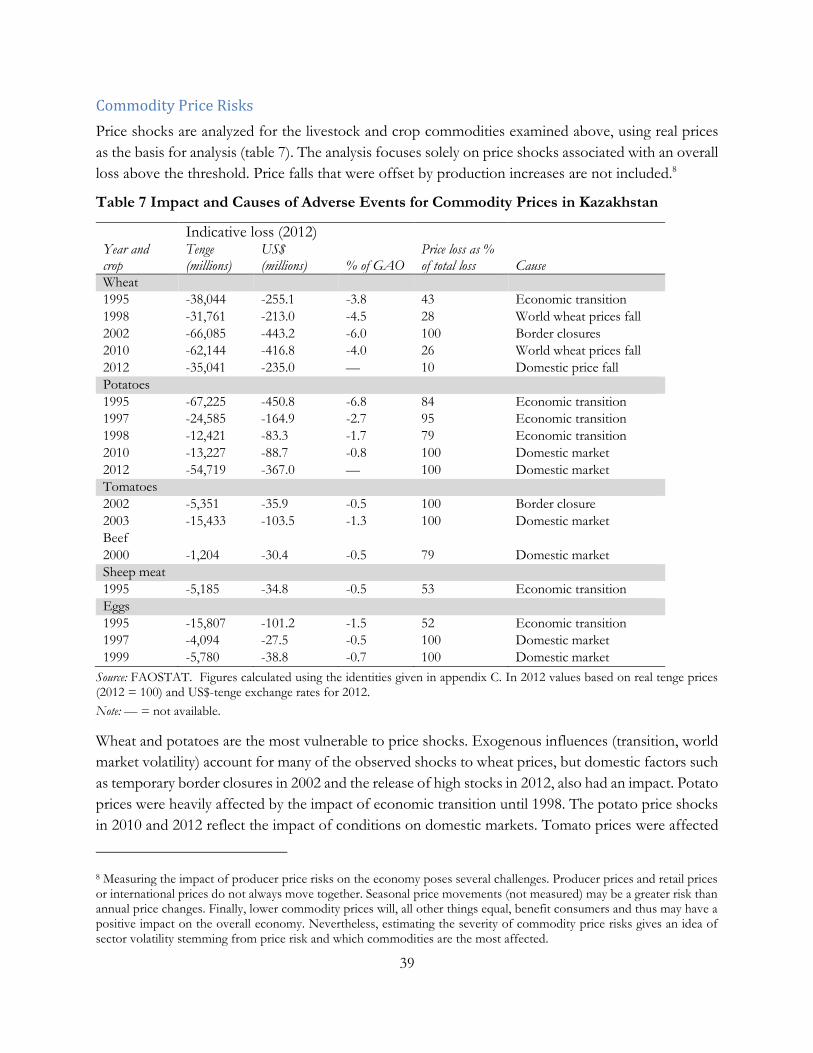
39
Commodity Price Risks
Price shocks are analyzed for the livestock and crop commodities examined above, using real prices
as the basis for analysis (table 7). The analysis focuses solely on price shocks associated with an overall
loss above the threshold. Price falls that were offset by production increases are not included.8
Table 7 Impact and Causes of Adverse Events for Commodity Prices in Kazakhstan
Indicative loss (2012) Year and crop
Tenge (millions)
US$ (millions) % of GAO
Price loss as % of total loss Cause
Wheat
1995 -38,044 -255.1 -3.8 43 Economic transition
1998 -31,761 -213.0 -4.5 28 World wheat prices fall
2002 -66,085 -443.2 -6.0 100 Border closures
2010 -62,144 -416.8 -4.0 26 World wheat prices fall
2012 -35,041 -235.0 — 10 Domestic price fall
Potatoes
1995 -67,225 -450.8 -6.8 84 Economic transition
1997 -24,585 -164.9 -2.7 95 Economic transition
1998 -12,421 -83.3 -1.7 79 Economic transition
2010 -13,227 -88.7 -0.8 100 Domestic market
2012 -54,719 -367.0 — 100 Domestic market
Tomatoes
2002 -5,351 -35.9 -0.5 100 Border closure
2003 -15,433 -103.5 -1.3 100 Domestic market
Beef
2000 -1,204 -30.4 -0.5 79 Domestic market
Sheep meat
1995 -5,185 -34.8 -0.5 53 Economic transition
Eggs
1995 -15,807 -101.2 -1.5 52 Economic transition
1997 -4,094 -27.5 -0.5 100 Domestic market
1999 -5,780 -38.8 -0.7 100 Domestic market
Source: FAOSTAT. Figures calculated using the identities given in appendix C. In 2012 values based on real tenge prices (2012 = 100) and US$-tenge exchange rates for 2012.
Note: — = not available.
Wheat and potatoes are the most vulnerable to price shocks. Exogenous influences (transition, world
market volatility) account for many of the observed shocks to wheat prices, but domestic factors such
as temporary border closures in 2002 and the release of high stocks in 2012, also had an impact. Potato
prices were heavily affected by the impact of economic transition until 1998. The potato price shocks
in 2010 and 2012 reflect the impact of conditions on domestic markets. Tomato prices were affected
8 Measuring the impact of producer price risks on the economy poses several challenges. Producer prices and retail prices or international prices do not always move together. Seasonal price movements (not measured) may be a greater risk than annual price changes. Finally, lower commodity prices will, all other things equal, benefit consumers and thus may have a positive impact on the overall economy. Nevertheless, estimating the severity of commodity price risks gives an idea of sector volatility stemming from price risk and which commodities are the most affected.
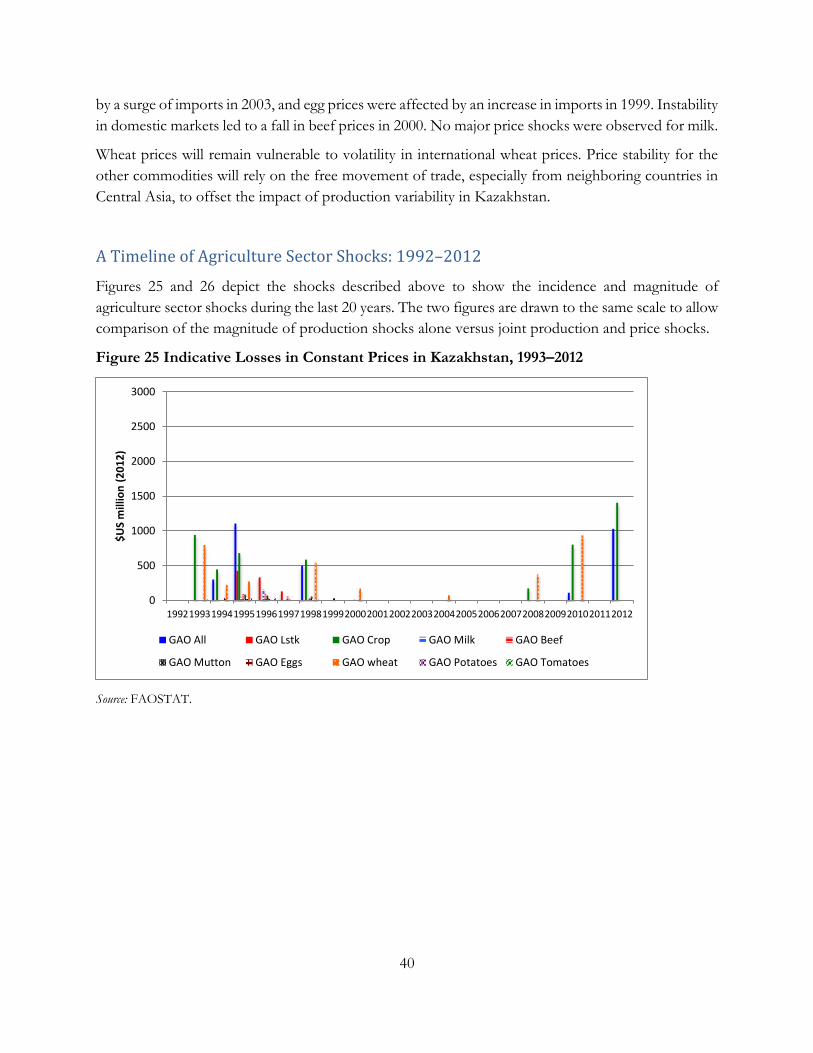
40
by a surge of imports in 2003, and egg prices were affected by an increase in imports in 1999. Instability
in domestic markets led to a fall in beef prices in 2000. No major price shocks were observed for milk.
Wheat prices will remain vulnerable to volatility in international wheat prices. Price stability for the
other commodities will rely on the free movement of trade, especially from neighboring countries in
Central Asia, to offset the impact of production variability in Kazakhstan.
A Timeline of Agriculture Sector Shocks: 1992–2012
Figures 25 and 26 depict the shocks described above to show the incidence and magnitude of
agriculture sector shocks during the last 20 years. The two figures are drawn to the same scale to allow
comparison of the magnitude of production shocks alone versus joint production and price shocks.
Figure 25 Indicative Losses in Constant Prices in Kazakhstan, 1993–2012
Source: FAOSTAT.
0
500
1000
1500
2000
2500
3000
199219931994199519961997199819992000200120022003200420052006200720082009201020112012
$U
S m
illio
n (
20
12
)
GAO All GAO Lstk GAO Crop GAO Milk GAO Beef
GAO Mutton GAO Eggs GAO wheat GAO Potatoes GAO Tomatoes
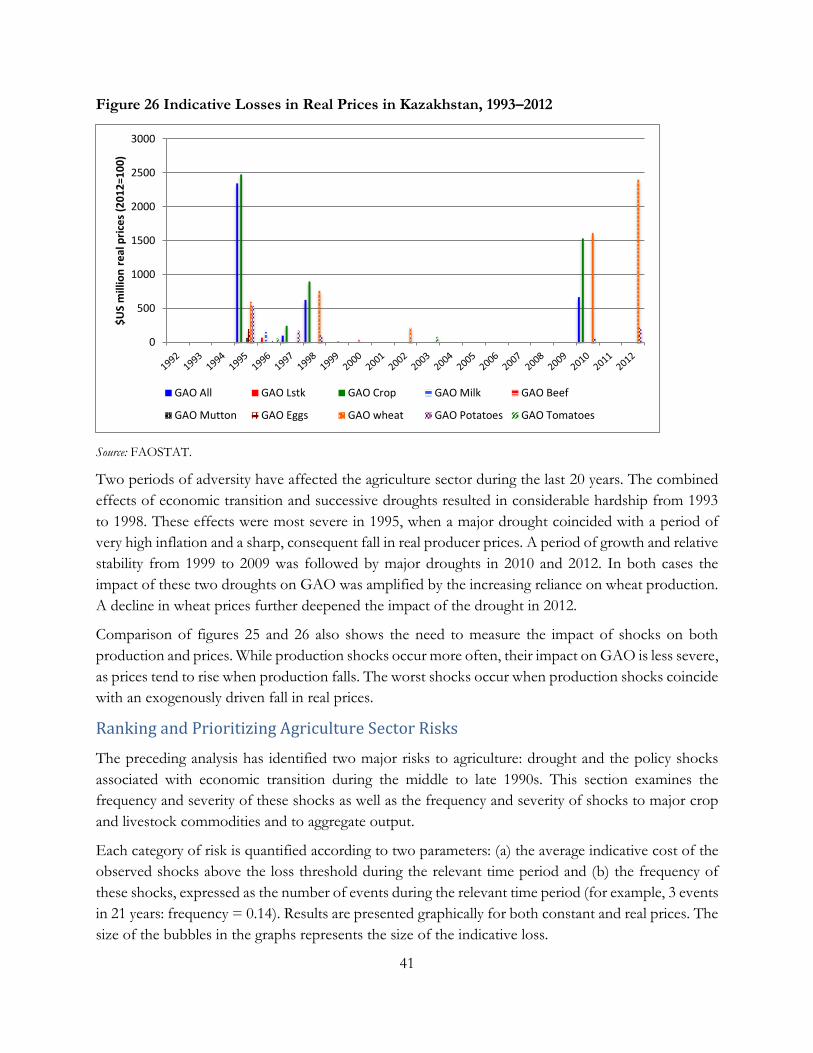
41
Figure 26 Indicative Losses in Real Prices in Kazakhstan, 1993–2012
Source: FAOSTAT.
Two periods of adversity have affected the agriculture sector during the last 20 years. The combined
effects of economic transition and successive droughts resulted in considerable hardship from 1993
to 1998. These effects were most severe in 1995, when a major drought coincided with a period of
very high inflation and a sharp, consequent fall in real producer prices. A period of growth and relative
stability from 1999 to 2009 was followed by major droughts in 2010 and 2012. In both cases the
impact of these two droughts on GAO was amplified by the increasing reliance on wheat production.
A decline in wheat prices further deepened the impact of the drought in 2012.
Comparison of figures 25 and 26 also shows the need to measure the impact of shocks on both
production and prices. While production shocks occur more often, their impact on GAO is less severe,
as prices tend to rise when production falls. The worst shocks occur when production shocks coincide
with an exogenously driven fall in real prices.
Ranking and Prioritizing Agriculture Sector Risks
The preceding analysis has identified two major risks to agriculture: drought and the policy shocks
associated with economic transition during the middle to late 1990s. This section examines the
frequency and severity of these shocks as well as the frequency and severity of shocks to major crop
and livestock commodities and to aggregate output.
Each category of risk is quantified according to two parameters: (a) the average indicative cost of the
observed shocks above the loss threshold during the relevant time period and (b) the frequency of
these shocks, expressed as the number of events during the relevant time period (for example, 3 events
in 21 years: frequency = 0.14). Results are presented graphically for both constant and real prices. The
size of the bubbles in the graphs represents the size of the indicative loss.
0
500
1000
1500
2000
2500
3000
$U
S m
illio
n r
eal
pri
ces
(20
12
=10
0)
GAO All GAO Lstk GAO Crop GAO Milk GAO Beef
GAO Mutton GAO Eggs GAO wheat GAO Potatoes GAO Tomatoes
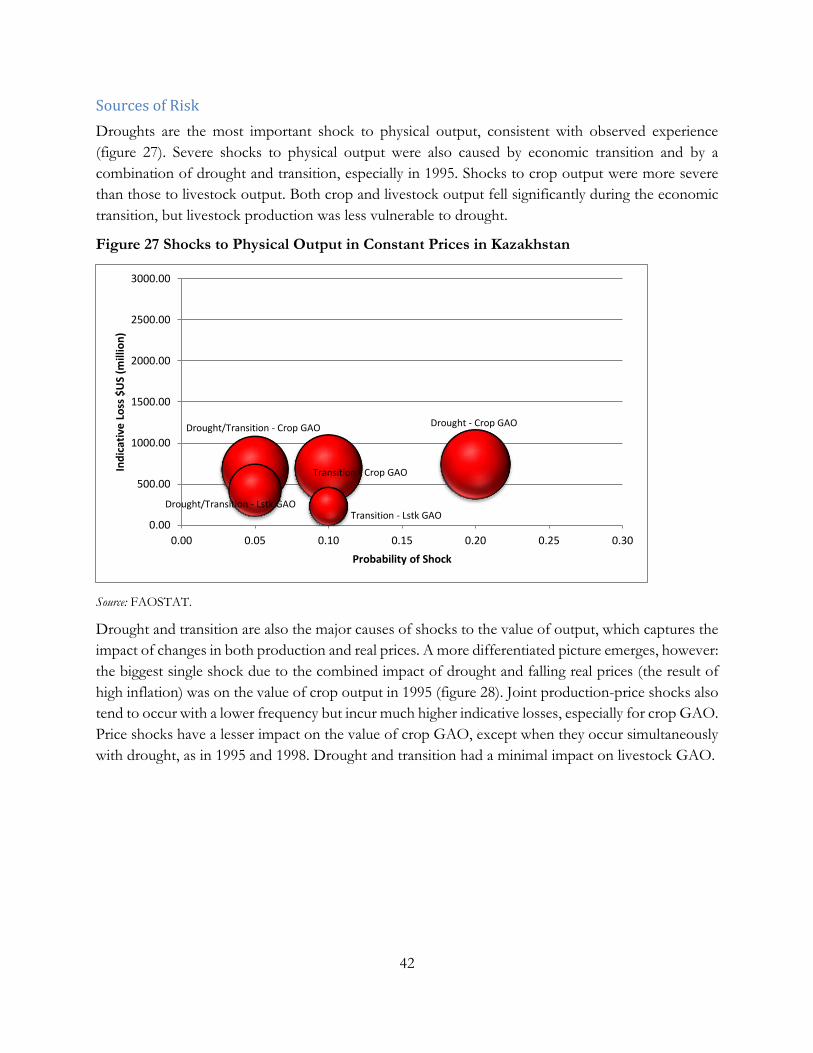
42
Sources of Risk
Droughts are the most important shock to physical output, consistent with observed experience
(figure 27). Severe shocks to physical output were also caused by economic transition and by a
combination of drought and transition, especially in 1995. Shocks to crop output were more severe
than those to livestock output. Both crop and livestock output fell significantly during the economic
transition, but livestock production was less vulnerable to drought.
Figure 27 Shocks to Physical Output in Constant Prices in Kazakhstan
Source: FAOSTAT.
Drought and transition are also the major causes of shocks to the value of output, which captures the
impact of changes in both production and real prices. A more differentiated picture emerges, however:
the biggest single shock due to the combined impact of drought and falling real prices (the result of
high inflation) was on the value of crop output in 1995 (figure 28). Joint production-price shocks also
tend to occur with a lower frequency but incur much higher indicative losses, especially for crop GAO.
Price shocks have a lesser impact on the value of crop GAO, except when they occur simultaneously
with drought, as in 1995 and 1998. Drought and transition had a minimal impact on livestock GAO.
0.00
500.00
1000.00
1500.00
2000.00
2500.00
3000.00
0.00 0.05 0.10 0.15 0.20 0.25 0.30
Ind
icat
ive
Lo
ss $
US
(mill
ion
)
Probability of Shock
Transition - Lstk GAO
Transition - Crop GAO
Drought/Transition - Crop GAO Drought - Crop GAO
Drought/Transition - Lstk GAO
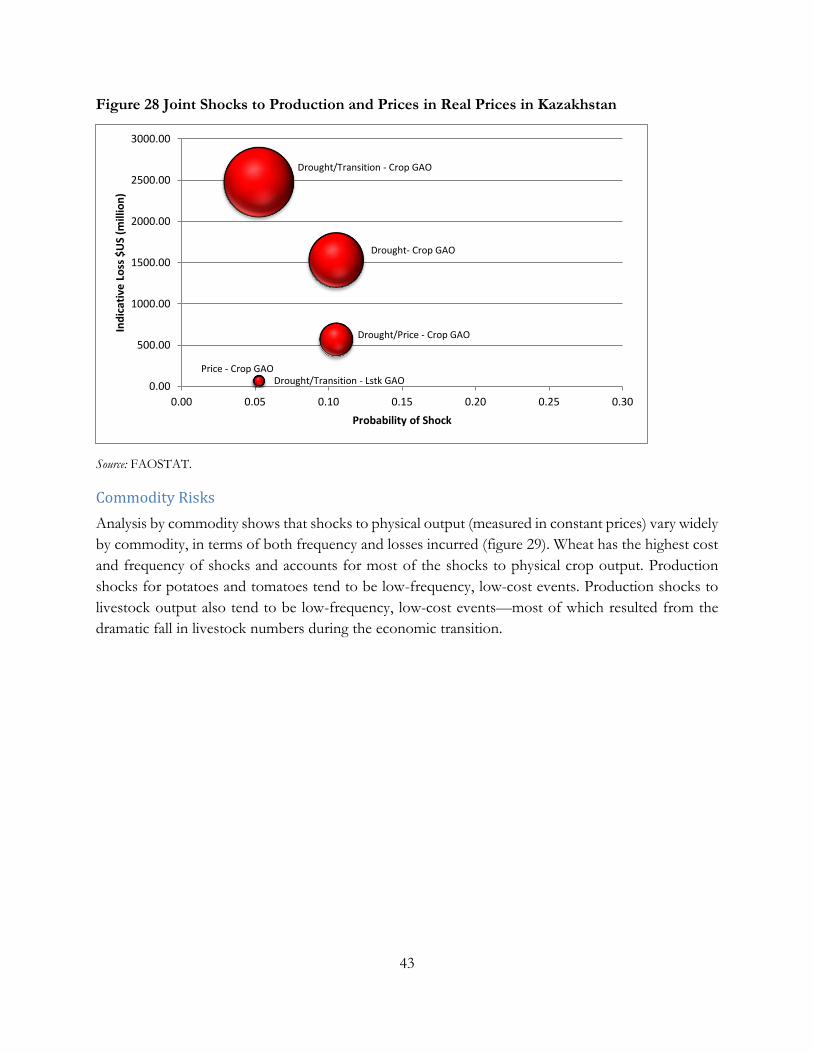
43
Figure 28 Joint Shocks to Production and Prices in Real Prices in Kazakhstan
Source: FAOSTAT.
Commodity Risks
Analysis by commodity shows that shocks to physical output (measured in constant prices) vary widely
by commodity, in terms of both frequency and losses incurred (figure 29). Wheat has the highest cost
and frequency of shocks and accounts for most of the shocks to physical crop output. Production
shocks for potatoes and tomatoes tend to be low-frequency, low-cost events. Production shocks to
livestock output also tend to be low-frequency, low-cost events—most of which resulted from the
dramatic fall in livestock numbers during the economic transition.
0.00
500.00
1000.00
1500.00
2000.00
2500.00
3000.00
0.00 0.05 0.10 0.15 0.20 0.25 0.30
Ind
icat
ive
Lo
ss $
US
(mill
ion
)
Probability of Shock
Price - Crop GAO
Drought/Transition - Crop GAO
Drought- Crop GAO
Drought/Price - Crop GAO
Drought/Transition - Lstk GAO
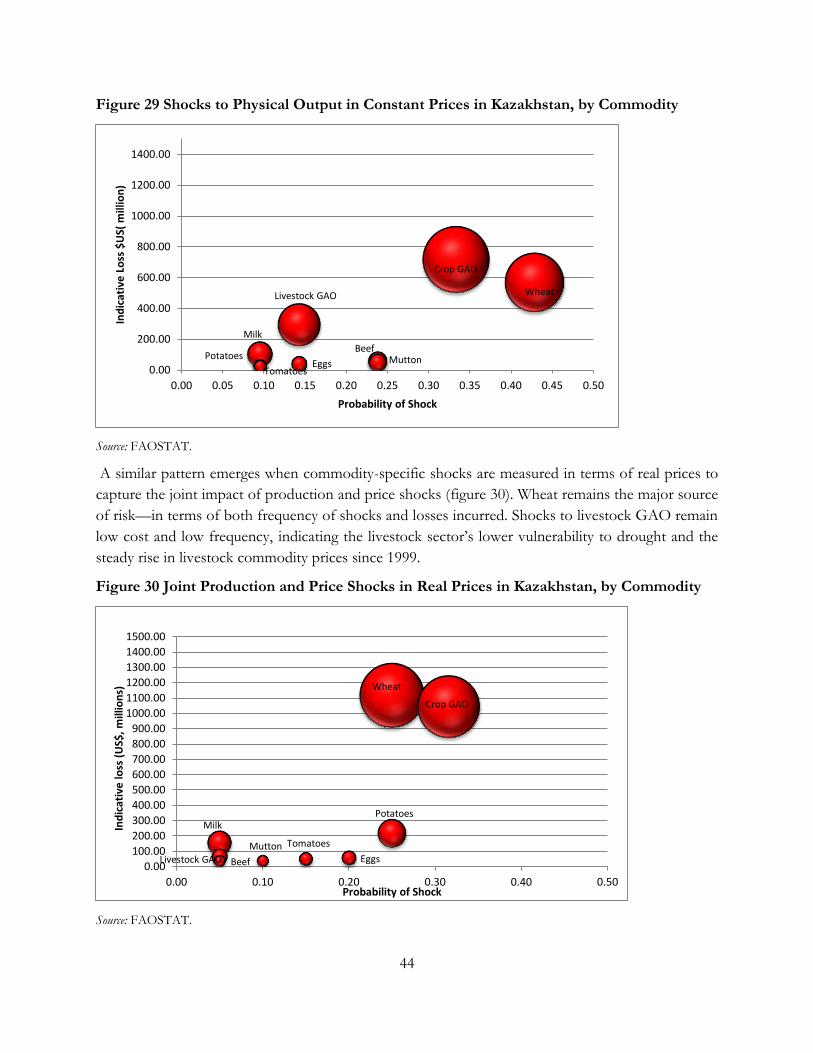
44
Figure 29 Shocks to Physical Output in Constant Prices in Kazakhstan, by Commodity
Source: FAOSTAT.
A similar pattern emerges when commodity-specific shocks are measured in terms of real prices to
capture the joint impact of production and price shocks (figure 30). Wheat remains the major source
of risk—in terms of both frequency of shocks and losses incurred. Shocks to livestock GAO remain
low cost and low frequency, indicating the livestock sector’s lower vulnerability to drought and the
steady rise in livestock commodity prices since 1999.
Figure 30 Joint Production and Price Shocks in Real Prices in Kazakhstan, by Commodity
Source: FAOSTAT.
0.00
200.00
400.00
600.00
800.00
1000.00
1200.00
1400.00
0.00 0.05 0.10 0.15 0.20 0.25 0.30 0.35 0.40 0.45 0.50
Ind
icat
ive
Lo
ss $
US(
mill
ion
)
Probability of Shock
Mutton
WheatLivestock GAO
Beef
Crop GAO
Milk
PotatoesEggs
Tomatoes
0.00
100.00
200.00
300.00
400.00
500.00
600.00
700.00
800.00
900.00
1000.00
1100.00
1200.00
1300.00
1400.00
1500.00
0.00 0.10 0.20 0.30 0.40 0.50
Ind
icat
ive
loss
(U
S$,
mill
ion
s)
Probability of Shock
Livestock GAO Eggs
Wheat
Mutton
Potatoes
Beef
Crop GAO
Milk
Tomatoes
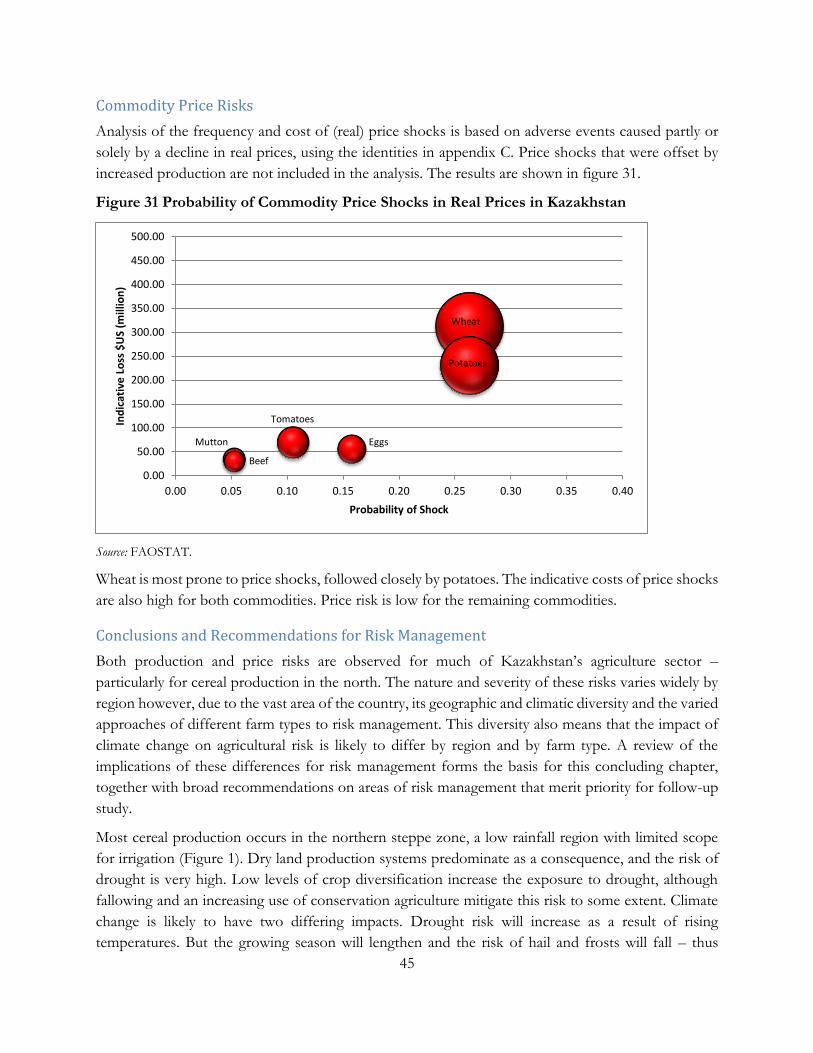
45
Commodity Price Risks
Analysis of the frequency and cost of (real) price shocks is based on adverse events caused partly or
solely by a decline in real prices, using the identities in appendix C. Price shocks that were offset by
increased production are not included in the analysis. The results are shown in figure 31.
Figure 31 Probability of Commodity Price Shocks in Real Prices in Kazakhstan
Source: FAOSTAT.
Wheat is most prone to price shocks, followed closely by potatoes. The indicative costs of price shocks
are also high for both commodities. Price risk is low for the remaining commodities.
Conclusions and Recommendations for Risk Management
Both production and price risks are observed for much of Kazakhstan’s agriculture sector –
particularly for cereal production in the north. The nature and severity of these risks varies widely by
region however, due to the vast area of the country, its geographic and climatic diversity and the varied
approaches of different farm types to risk management. This diversity also means that the impact of
climate change on agricultural risk is likely to differ by region and by farm type. A review of the
implications of these differences for risk management forms the basis for this concluding chapter,
together with broad recommendations on areas of risk management that merit priority for follow-up
study.
Most cereal production occurs in the northern steppe zone, a low rainfall region with limited scope
for irrigation (Figure 1). Dry land production systems predominate as a consequence, and the risk of
drought is very high. Low levels of crop diversification increase the exposure to drought, although
fallowing and an increasing use of conservation agriculture mitigate this risk to some extent. Climate
change is likely to have two differing impacts. Drought risk will increase as a result of rising
temperatures. But the growing season will lengthen and the risk of hail and frosts will fall – thus
0.00
50.00
100.00
150.00
200.00
250.00
300.00
350.00
400.00
450.00
500.00
0.00 0.05 0.10 0.15 0.20 0.25 0.30 0.35 0.40
Ind
icat
ive
Lo
ss $
US
(mill
ion
)
Probability of Shock
Tomatoes
EggsMutton
Potatoes
Beef
Wheat
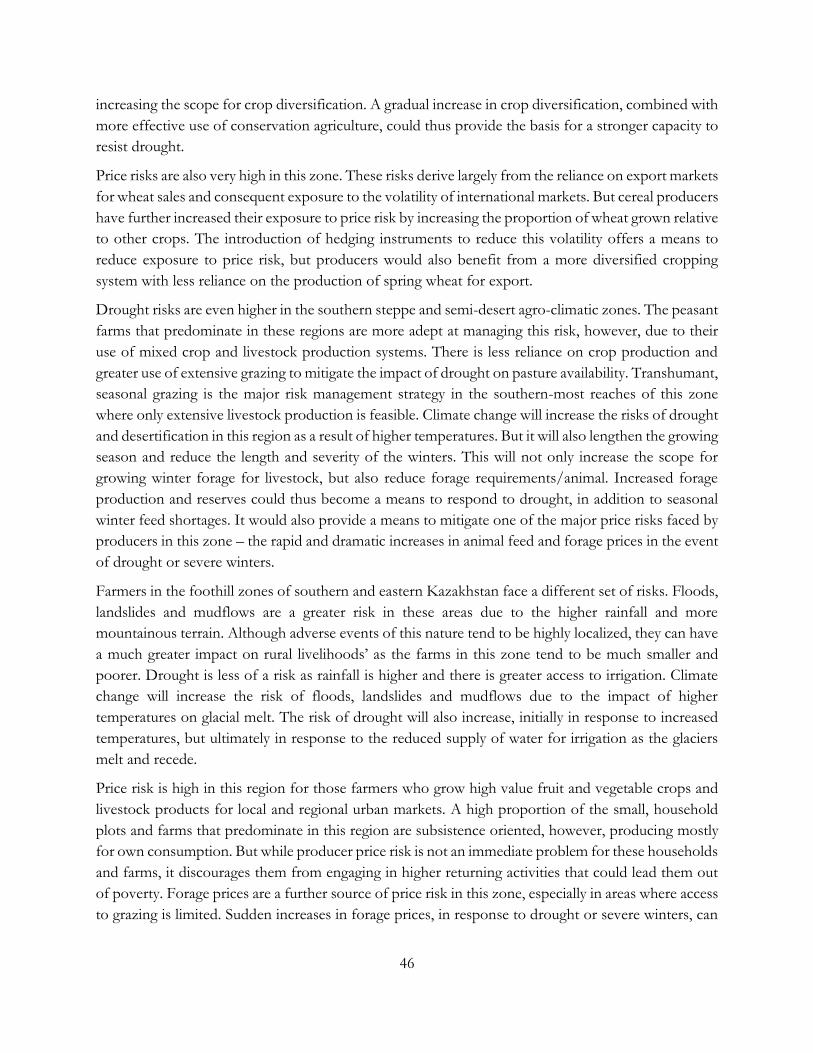
46
increasing the scope for crop diversification. A gradual increase in crop diversification, combined with
more effective use of conservation agriculture, could thus provide the basis for a stronger capacity to
resist drought.
Price risks are also very high in this zone. These risks derive largely from the reliance on export markets
for wheat sales and consequent exposure to the volatility of international markets. But cereal producers
have further increased their exposure to price risk by increasing the proportion of wheat grown relative
to other crops. The introduction of hedging instruments to reduce this volatility offers a means to
reduce exposure to price risk, but producers would also benefit from a more diversified cropping
system with less reliance on the production of spring wheat for export.
Drought risks are even higher in the southern steppe and semi-desert agro-climatic zones. The peasant
farms that predominate in these regions are more adept at managing this risk, however, due to their
use of mixed crop and livestock production systems. There is less reliance on crop production and
greater use of extensive grazing to mitigate the impact of drought on pasture availability. Transhumant,
seasonal grazing is the major risk management strategy in the southern-most reaches of this zone
where only extensive livestock production is feasible. Climate change will increase the risks of drought
and desertification in this region as a result of higher temperatures. But it will also lengthen the growing
season and reduce the length and severity of the winters. This will not only increase the scope for
growing winter forage for livestock, but also reduce forage requirements/animal. Increased forage
production and reserves could thus become a means to respond to drought, in addition to seasonal
winter feed shortages. It would also provide a means to mitigate one of the major price risks faced by
producers in this zone – the rapid and dramatic increases in animal feed and forage prices in the event
of drought or severe winters.
Farmers in the foothill zones of southern and eastern Kazakhstan face a different set of risks. Floods,
landslides and mudflows are a greater risk in these areas due to the higher rainfall and more
mountainous terrain. Although adverse events of this nature tend to be highly localized, they can have
a much greater impact on rural livelihoods’ as the farms in this zone tend to be much smaller and
poorer. Drought is less of a risk as rainfall is higher and there is greater access to irrigation. Climate
change will increase the risk of floods, landslides and mudflows due to the impact of higher
temperatures on glacial melt. The risk of drought will also increase, initially in response to increased
temperatures, but ultimately in response to the reduced supply of water for irrigation as the glaciers
melt and recede.
Price risk is high in this region for those farmers who grow high value fruit and vegetable crops and
livestock products for local and regional urban markets. A high proportion of the small, household
plots and farms that predominate in this region are subsistence oriented, however, producing mostly
for own consumption. But while producer price risk is not an immediate problem for these households
and farms, it discourages them from engaging in higher returning activities that could lead them out
of poverty. Forage prices are a further source of price risk in this zone, especially in areas where access
to grazing is limited. Sudden increases in forage prices, in response to drought or severe winters, can
47
severely compromise the livestock component of their production base. Support for measures to
increase forage production in this zone, could thus be an important response to agricultural risk.
Based on the above analysis, the main recommendations of the report are as follows:
Broaden and strengthen the use of conservation agriculture for crop production on medium and large-scale crop farms in northern Kazakhstan, as the basis for more sustainable management of drought risk.
Increase support for research into ways to increase crop diversification in this region, in response to the prospective positive impacts of climate change.
Review the potential use of hedging instruments to reduce cereal price risk;
Improve the effectiveness of the current agricultural insurance program with the view to increasing the financial protection for productive farms;
Encourage both large-scale agricultural enterprises and medium-scale peasant farms to diversify further into lower risk, extensive livestock production, in order to reduce their vulnerability to both drought and cereal price risk;
Improve livestock feed conservation techniques and access to seasonal finance for peasant farms and small-scale household farms as a means to reduce their vulnerability to droughts and severe winters, and associated price hikes for animal feed.
The following risk management recommendations were selected for in-depth review and form the
Solutions part of the report:
Solutions Area 1: Improve wheat productivity (given the crop’s share of 50 percent of gross agricultural
output);
Solutions Area 2: Agricultural diversification in Northern Kazakhstan;
Solutions area 3: Improve livestock productivity.
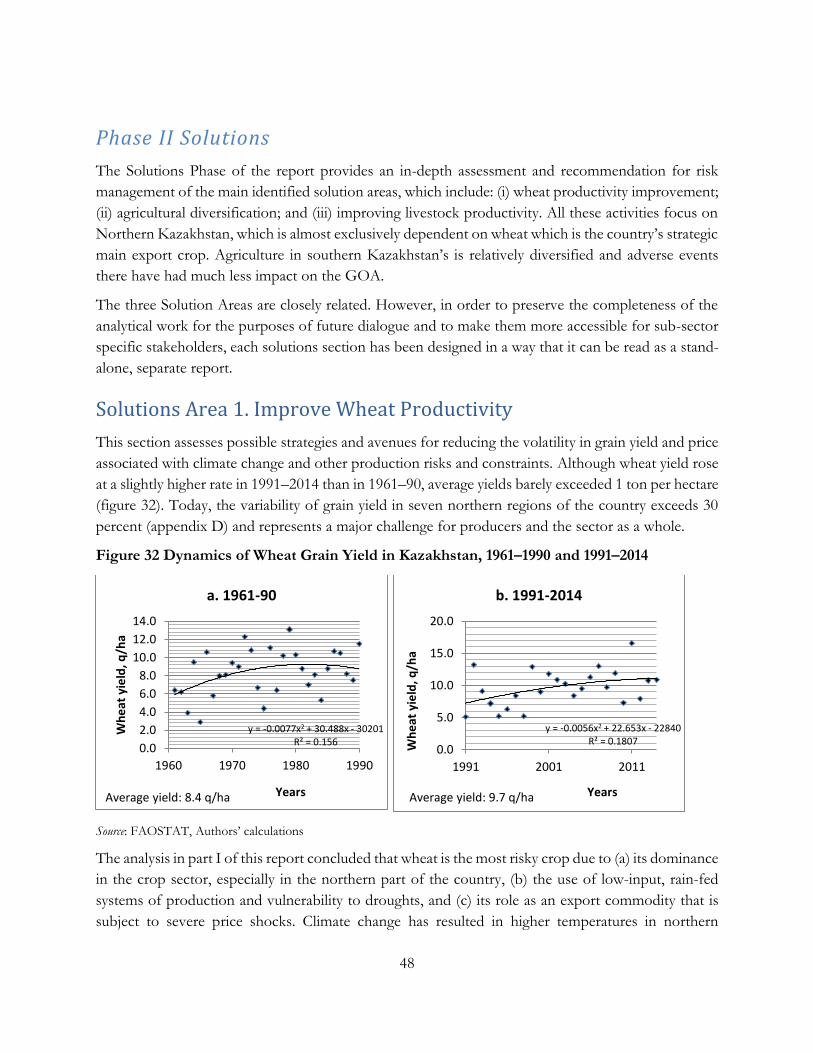
48
Phase II Solutions
The Solutions Phase of the report provides an in-depth assessment and recommendation for risk
management of the main identified solution areas, which include: (i) wheat productivity improvement;
(ii) agricultural diversification; and (iii) improving livestock productivity. All these activities focus on
Northern Kazakhstan, which is almost exclusively dependent on wheat which is the country’s strategic
main export crop. Agriculture in southern Kazakhstan’s is relatively diversified and adverse events
there have had much less impact on the GOA.
The three Solution Areas are closely related. However, in order to preserve the completeness of the
analytical work for the purposes of future dialogue and to make them more accessible for sub-sector
specific stakeholders, each solutions section has been designed in a way that it can be read as a stand-
alone, separate report.
Solutions Area 1. Improve Wheat Productivity
This section assesses possible strategies and avenues for reducing the volatility in grain yield and price
associated with climate change and other production risks and constraints. Although wheat yield rose
at a slightly higher rate in 1991–2014 than in 1961–90, average yields barely exceeded 1 ton per hectare
(figure 32). Today, the variability of grain yield in seven northern regions of the country exceeds 30
percent (appendix D) and represents a major challenge for producers and the sector as a whole.
Figure 32 Dynamics of Wheat Grain Yield in Kazakhstan, 1961–1990 and 1991–2014
Source: FAOSTAT, Authors’ calculations
The analysis in part I of this report concluded that wheat is the most risky crop due to (a) its dominance
in the crop sector, especially in the northern part of the country, (b) the use of low-input, rain-fed
systems of production and vulnerability to droughts, and (c) its role as an export commodity that is
subject to severe price shocks. Climate change has resulted in higher temperatures in northern
y = -0.0077x2 + 30.488x - 30201R² = 0.156
0.0
2.0
4.0
6.0
8.0
10.0
12.0
14.0
1960 1970 1980 1990
Wh
eat
yie
ld, q
/ha
Years
a. 1961-90
Average yield: 8.4 q/ha
y = -0.0056x2 + 22.653x - 22840R² = 0.1807
0.0
5.0
10.0
15.0
20.0
1991 2001 2011
Wh
eat
yie
ld, q
/ha
Years
b. 1991-2014
Average yield: 9.7 q/ha
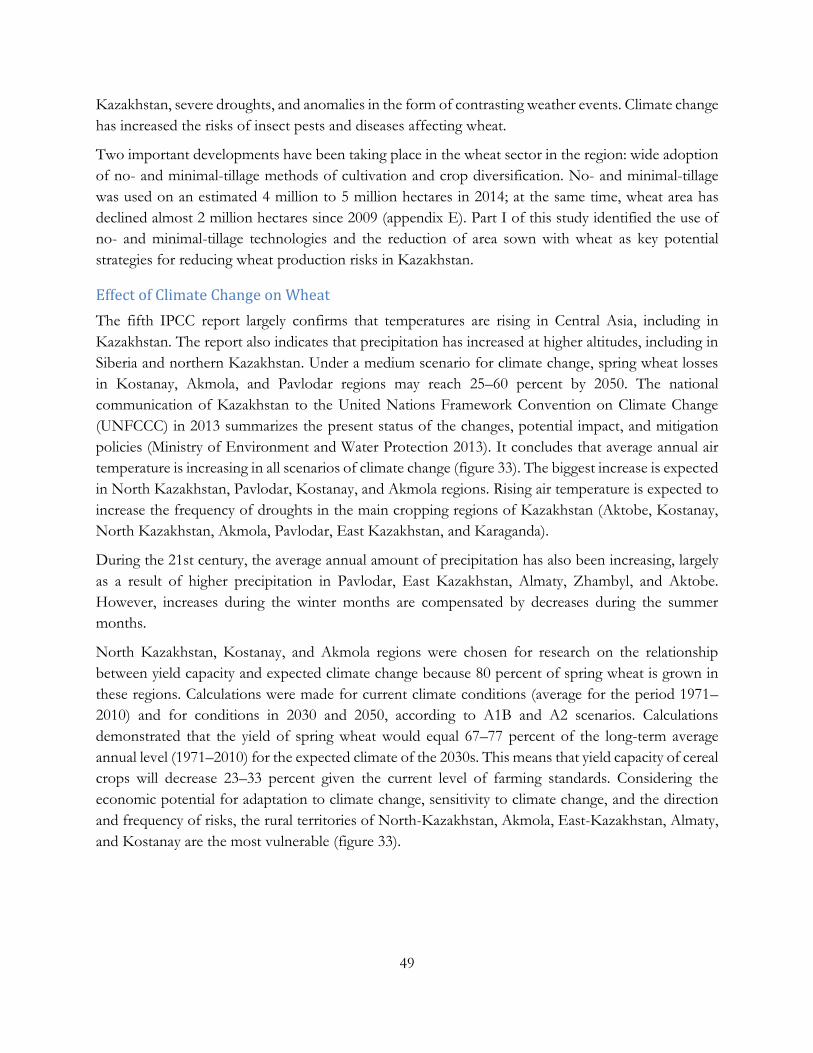
49
Kazakhstan, severe droughts, and anomalies in the form of contrasting weather events. Climate change
has increased the risks of insect pests and diseases affecting wheat.
Two important developments have been taking place in the wheat sector in the region: wide adoption
of no- and minimal-tillage methods of cultivation and crop diversification. No- and minimal-tillage
was used on an estimated 4 million to 5 million hectares in 2014; at the same time, wheat area has
declined almost 2 million hectares since 2009 (appendix E). Part I of this study identified the use of
no- and minimal-tillage technologies and the reduction of area sown with wheat as key potential
strategies for reducing wheat production risks in Kazakhstan.
Effect of Climate Change on Wheat
The fifth IPCC report largely confirms that temperatures are rising in Central Asia, including in
Kazakhstan. The report also indicates that precipitation has increased at higher altitudes, including in
Siberia and northern Kazakhstan. Under a medium scenario for climate change, spring wheat losses
in Kostanay, Akmola, and Pavlodar regions may reach 25–60 percent by 2050. The national
communication of Kazakhstan to the United Nations Framework Convention on Climate Change
(UNFCCC) in 2013 summarizes the present status of the changes, potential impact, and mitigation
policies (Ministry of Environment and Water Protection 2013). It concludes that average annual air
temperature is increasing in all scenarios of climate change (figure 33). The biggest increase is expected
in North Kazakhstan, Pavlodar, Kostanay, and Akmola regions. Rising air temperature is expected to
increase the frequency of droughts in the main cropping regions of Kazakhstan (Aktobe, Kostanay,
North Kazakhstan, Akmola, Pavlodar, East Kazakhstan, and Karaganda).
During the 21st century, the average annual amount of precipitation has also been increasing, largely
as a result of higher precipitation in Pavlodar, East Kazakhstan, Almaty, Zhambyl, and Aktobe.
However, increases during the winter months are compensated by decreases during the summer
months.
North Kazakhstan, Kostanay, and Akmola regions were chosen for research on the relationship
between yield capacity and expected climate change because 80 percent of spring wheat is grown in
these regions. Calculations were made for current climate conditions (average for the period 1971–
2010) and for conditions in 2030 and 2050, according to A1B and A2 scenarios. Calculations
demonstrated that the yield of spring wheat would equal 67–77 percent of the long-term average
annual level (1971–2010) for the expected climate of the 2030s. This means that yield capacity of cereal
crops will decrease 23–33 percent given the current level of farming standards. Considering the
economic potential for adaptation to climate change, sensitivity to climate change, and the direction
and frequency of risks, the rural territories of North-Kazakhstan, Akmola, East-Kazakhstan, Almaty,
and Kostanay are the most vulnerable (figure 33).
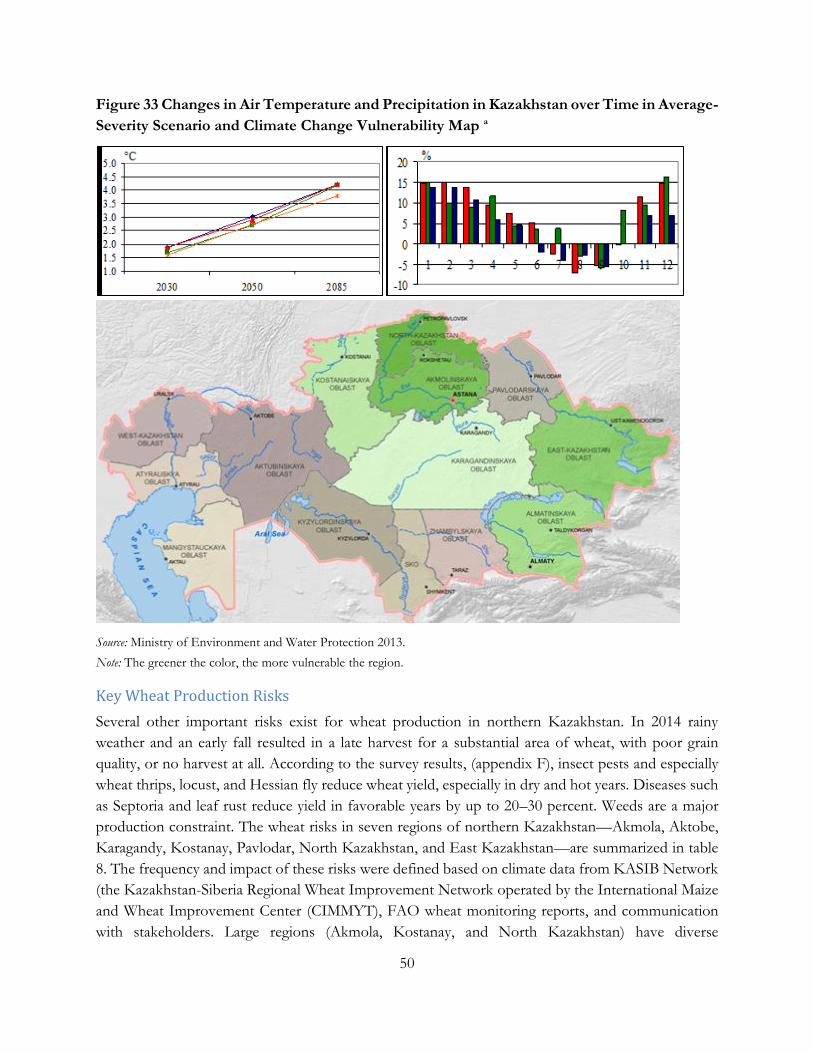
50
Figure 33 Changes in Air Temperature and Precipitation in Kazakhstan over Time in Average-
Severity Scenario and Climate Change Vulnerability Map a
Source: Ministry of Environment and Water Protection 2013.
Note: The greener the color, the more vulnerable the region.
Key Wheat Production Risks
Several other important risks exist for wheat production in northern Kazakhstan. In 2014 rainy
weather and an early fall resulted in a late harvest for a substantial area of wheat, with poor grain
quality, or no harvest at all. According to the survey results, (appendix F), insect pests and especially
wheat thrips, locust, and Hessian fly reduce wheat yield, especially in dry and hot years. Diseases such
as Septoria and leaf rust reduce yield in favorable years by up to 20–30 percent. Weeds are a major
production constraint. The wheat risks in seven regions of northern Kazakhstan—Akmola, Aktobe,
Karagandy, Kostanay, Pavlodar, North Kazakhstan, and East Kazakhstan—are summarized in table
8. The frequency and impact of these risks were defined based on climate data from KASIB Network
(the Kazakhstan-Siberia Regional Wheat Improvement Network operated by the International Maize
and Wheat Improvement Center (CIMMYT), FAO wheat monitoring reports, and communication
with stakeholders. Large regions (Akmola, Kostanay, and North Kazakhstan) have diverse
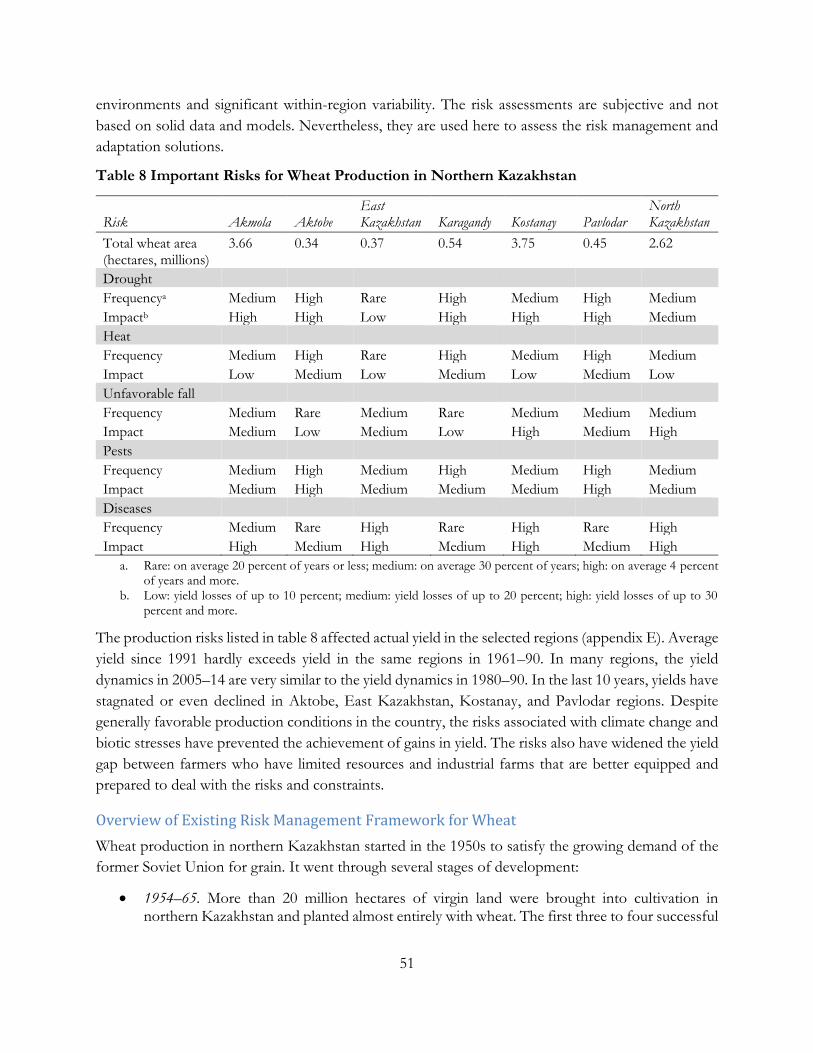
51
environments and significant within-region variability. The risk assessments are subjective and not
based on solid data and models. Nevertheless, they are used here to assess the risk management and
adaptation solutions.
Table 8 Important Risks for Wheat Production in Northern Kazakhstan
Risk Akmola Aktobe East Kazakhstan Karagandy Kostanay Pavlodar
North Kazakhstan
Total wheat area (hectares, millions)
3.66 0.34 0.37 0.54 3.75 0.45 2.62
Drought
Frequencya Medium High Rare High Medium High Medium
Impactb High High Low High High High Medium
Heat
Frequency Medium High Rare High Medium High Medium
Impact Low Medium Low Medium Low Medium Low
Unfavorable fall
Frequency Medium Rare Medium Rare Medium Medium Medium
Impact Medium Low Medium Low High Medium High
Pests
Frequency Medium High Medium High Medium High Medium
Impact Medium High Medium Medium Medium High Medium
Diseases
Frequency Medium Rare High Rare High Rare High
Impact High Medium High Medium High Medium High
a. Rare: on average 20 percent of years or less; medium: on average 30 percent of years; high: on average 4 percent of years and more.
b. Low: yield losses of up to 10 percent; medium: yield losses of up to 20 percent; high: yield losses of up to 30 percent and more.
The production risks listed in table 8 affected actual yield in the selected regions (appendix E). Average
yield since 1991 hardly exceeds yield in the same regions in 1961–90. In many regions, the yield
dynamics in 2005–14 are very similar to the yield dynamics in 1980–90. In the last 10 years, yields have
stagnated or even declined in Aktobe, East Kazakhstan, Kostanay, and Pavlodar regions. Despite
generally favorable production conditions in the country, the risks associated with climate change and
biotic stresses have prevented the achievement of gains in yield. The risks also have widened the yield
gap between farmers who have limited resources and industrial farms that are better equipped and
prepared to deal with the risks and constraints.
Overview of Existing Risk Management Framework for Wheat
Wheat production in northern Kazakhstan started in the 1950s to satisfy the growing demand of the
former Soviet Union for grain. It went through several stages of development:
1954–65. More than 20 million hectares of virgin land were brought into cultivation in northern Kazakhstan and planted almost entirely with wheat. The first three to four successful
52
years were followed by drought and widespread wind erosion, resulting in lower yields and losses of soil.
1966–75. The area planted with wheat was reduced 20 percent, and soil-conserving technologies were introduced gradually, as moldboard plough was replaced by deep undersoil cultivation. Wheat production intensified with the application of fertilizers and crop protection measures, the diversification of crops, and the development of animal husbandry. This period witnessed high gains in yield (figure 32).
1975–85. Further attempts were made to intensify production, but yields stagnated and even declined due to poor incentives, deterioration of farming practices, and droughts.
1986–90. A period of liberalization provided more independence to producers as the supply of inputs and machinery diminished.
1991–95. During the first years of independence, Kazakhstan experienced economic crisis, breaks in the supply chain, lack of markets, and restructuring of farms. As a result, both the area planted with wheat and wheat yields declined.
1996–2005. The economy improved as the supply chain was reestablished, farm restructuring was completed, wheat export markets were developed, and the conditions for wheat production were generally favorable (with severe drought and locusts only in 1998). Wheat area recovered gradually.
2006–14. Government played a strong role in supporting crop production through subsidies. There was widespread application of no-till and minimal-tillage production. Wheat area expanded to 14 million hectares, before falling to 12 million hectares due to diversification. The period was characterized by a combination of average, highly favorable (2011) and dry (2009, 2012) years.
Kazakhstan Agricultural Development Program
OECD (2013) provides a comprehensive review of sector development and policies. A new agriculture
development strategy prepared in 2011–12 shifted the focus from food security to business
competitiveness.
The state strategy of agricultural development in Kazakhstan is reflected in Agribusiness-2020, the
country’s key agricultural development program, which started in 2013 and will be completed in 2020.
The program and several master plans covering different sectors (grain, land use, forages) provide a
comprehensive framework for government policies, support, investment, and technologies related to
sector development in the country.
Funding for this program was T 339,717 billion (tenge) in 2013, increasing to T 448,424 billion by
2020. Almost 90 percent was from the MOA budget, 6 percent was from the local budgets, and 4
percent was from the KazAgro Corporation budget. The budget is allocated to four main categories
intended to support the agro-industrial complex: (a) financial support (T 4,620 billion in 2020); (b)
accessibility of products and services (T 378,476 billion); (c) development of state support (T 61,934
billion); and (d) enhancement of the efficiency of state regulation (T 3,393 billion). By 2020 around 84
percent of the budget will be used for category b, which is essentially subsidies.
53
Agribusiness-2020 sets the framework for sector development. Its main goal with regard to grain is to
stabilize production and reduce variability in yield, largely through measures to manage risk and adapt
to change.
According to Agribusiness-2020 and the master plans, Kazakhstan will maintain its leading role as a
grain exporter to Central Asia, the European Union, and Afghanistan, with demand reaching 10
million tons by 2020. However, lack of facilities for storing and processing grain in favorable years
(2011) is a significant constraint. The total capacity of grain storage in the country is sufficient to
accommodate 24 million tons. Few farmers have their own storage and cleaning facilities, and most
rely on central grain elevators. In years with high yield or rainy weather during the harvest, farmers are
not able to place their grain on elevators, which increases the risk of postharvest losses.
Grain exports from Kazakhstan compete with production in Ukraine and Russia, which compete
successfully because they have access to cheaper transportation. Agribusiness-2020 is seeking to make
agricultural products more competitive by offering more effective state support and creating favorable
environments for agribusiness. The key developments reflected in Agribusiness-2020 and related to
wheat production risk management are in the areas of technology, investment, and research and
development (R&D).
In the area of technology,
Low-input, extensive crop production is too resource intensive.
Moisture-conserving technologies and diversification are needed to increase crop production.
Protection against diseases and pests is needed to stabilize crop production.
The scheme of production specialization for each region and district has been developed and will guide the subsidies starting from 2017, creating incentives for diversification. The target area for different crops is listed in table 9.
In the area of investment,
The program seeks to expand the number of grain storage facilities to between 2 million and 3 million tons to enable Kazakhstan to respond to the growing demand for grain from China and the Organization of Islamic Cooperation.
In the area of research and development,
Agricultural research funding will increase to up to 0.1 percent of gross agricultural product. The priorities are to modernize infrastructure and equipment as well as to attract younger researchers. Important research topics are moisture-conserving technologies and drought-tolerant varieties, including genetically moderated organisms (GMOs).
The State Commission for Variety Release and Protection of Agricultural Crops will enhance its capacity by providing staff with machinery, equipment, and training.
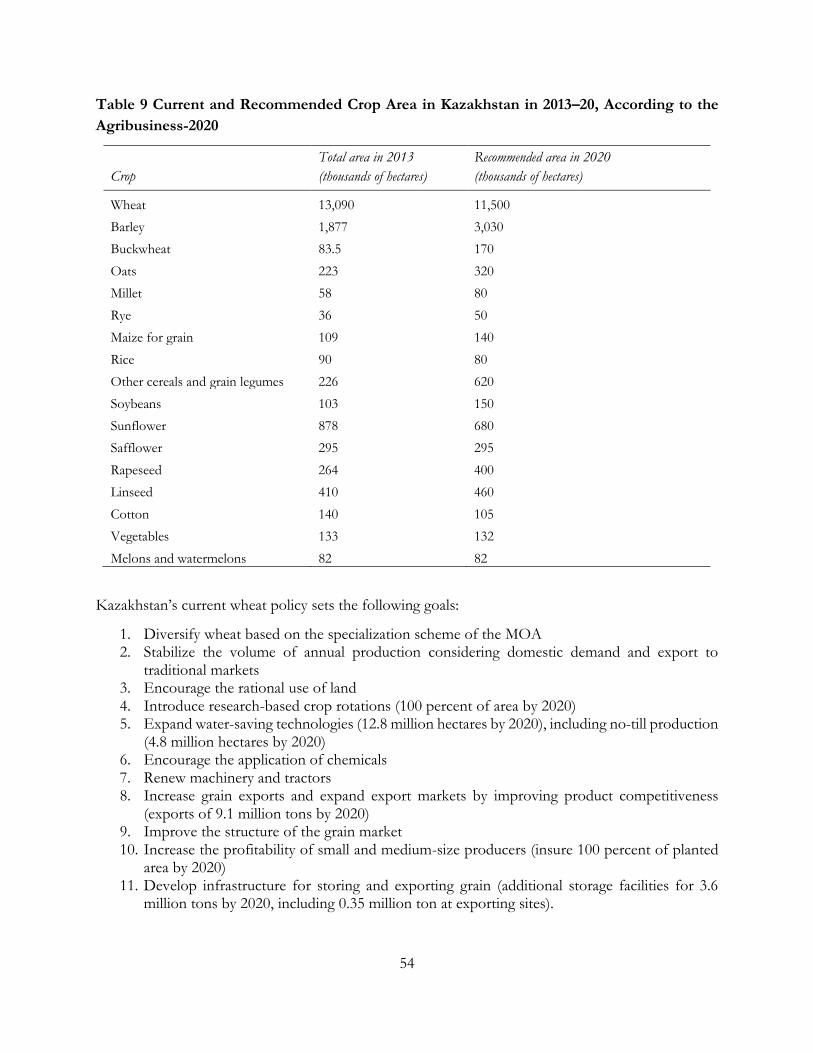
54
Table 9 Current and Recommended Crop Area in Kazakhstan in 2013–20, According to the
Agribusiness-2020
Crop
Total area in 2013
(thousands of hectares)
Recommended area in 2020
(thousands of hectares)
Wheat 13,090 11,500
Barley 1,877 3,030
Buckwheat 83.5 170
Oats 223 320
Millet 58 80
Rye 36 50
Maize for grain 109 140
Rice 90 80
Other cereals and grain legumes 226 620
Soybeans 103 150
Sunflower 878 680
Safflower 295 295
Rapeseed 264 400
Linseed 410 460
Cotton 140 105
Vegetables 133 132
Melons and watermelons 82 82
Kazakhstan’s current wheat policy sets the following goals:
1. Diversify wheat based on the specialization scheme of the MOA 2. Stabilize the volume of annual production considering domestic demand and export to
traditional markets 3. Encourage the rational use of land 4. Introduce research-based crop rotations (100 percent of area by 2020) 5. Expand water-saving technologies (12.8 million hectares by 2020), including no-till production
(4.8 million hectares by 2020) 6. Encourage the application of chemicals 7. Renew machinery and tractors 8. Increase grain exports and expand export markets by improving product competitiveness
(exports of 9.1 million tons by 2020) 9. Improve the structure of the grain market 10. Increase the profitability of small and medium-size producers (insure 100 percent of planted
area by 2020) 11. Develop infrastructure for storing and exporting grain (additional storage facilities for 3.6
million tons by 2020, including 0.35 million ton at exporting sites).
55
The government allocated T 90,222.2 million in 2013, with an increase to T 131,814.5 million for
implementation of this master plan. The beneficiaries of the program are agricultural producers,
although some tasks are targeted more toward small or medium farmers (numbers 10 and 11 above),
while others are targeted toward bigger industrial farms (number 8).
The national communication of Kazakhstan to the UNFCCC (Ministry of Environment and Water
Protection 2013) lists the measures that Kazakhstan is using to adapt crop production to climate
change:
No-till technology
Crop diversification
Implementation of effective irrigation system
More efficient weather monitoring and forecasting system
Modernization of agricultural machinery and equipment
Preparation and professional improvement of agricultural specialists
Improvement of crop insurance system.
The relevant adaptation measures have been incorporated into the Agribusiness-2020 program.
Projects of International Organizations Related to Risk Management
In 2006–13, the World Bank implemented the Agriculture Competitiveness Project (US$24 million)
to promote zero-till and minimal tillage as well as other wheat technologies. The project helped to
stabilize wheat production and to encourage conservation agriculture and diversification. The project
also established nine training and extension centers as part of KazAgroInnovation. These centers
encourage the introduction and spread of technologies and knowledge contributing to risk adaptation.
In 2010–14, the United Nations Development Programme (UNDP) implemented the Central Asian
Multi-Country Program on Climate Risk Management in Kazakhstan, the Kyrgyz Republic, Tajikistan,
Turkmenistan, and Uzbekistan, with US$5,997,000 from several donors. The program worked with
KazAgroInnovation on the national level.
The program sought to (1) strengthen institutional frameworks and technical capacity to manage
climate change risks and opportunities in an integrated manner; (2) develop climate-resilient strategies,
policies, and legislation in priority sectors and geographic areas; (3) expand financing options to meet
the national costs of climate change adaptation; (4) implement climate change adaptation interventions
in priority sectors; and (5) disseminate knowledge on how to incorporate climate change knowledge
and risks into development processes at the national, subnational, and local levels.
On the regional level, the project focused on (1) strengthening technical capacity to manage climate-
related risks and opportunities; (2) sharing knowledge on adjusting national development processes to
fully incorporate climate-related risks and opportunities; and (3) synthesizing and further developing
knowledge on glacial melting in Central Asia. Although the project did not specifically target
agriculture, it produced predictions of climatic change and developed adaptation measures in the
agriculture sector. The project contributed substantially to the III–VI National Communication of
Kazakhstan to the UNFCCC, including the risk map presented in figure 33 (Ministry of Environment
56
and Water Protection 2013). It also raised the priority that policy makers and the general public give
to the issue of climate change risk management.
In 2012–14 the UNDP in partnership with KazAgroInnovation also implemented Improving the
Climate Resiliency of Kazakhstan Wheat and Central Asian Food Security, with US$1.1 million in
funding from the U.S. Agency for International Development.
The program has three main components:
1. Improve monitoring and information sharing for climate-resilient wheat production. This component is intended to improve the ability to forecast weather conditions and to deliver this information to farmers so that they can make better decisions about which crop or variety to grow. The project works closely with Kazhydromet, Space Research Institute, and MOA to build their capacity in this area.
2. Develop climate resilience through adaptation measures. This component includes experimental planting of drought-resilient crops, alternative crop rotations, a shift from monoculture to diversified planting, and low-till and no-till farming methods. This is achieved through on-farm and on-station experiments and demonstrations as well as training at agricultural research institutes in Shortandy, Kostanay, and North-Kazakhstan.
3. Regional dialogue on wheat, climate change, and regional food security. Since Kazakhstan wheat is important for food security in the whole region, including Afghanistan, this activity involves periodic consultations, meetings, and networking at different levels.
Both UNDP projects are nearing completion but will be extended into a second phase.9 The projects
are well positioned to work with a range of stakeholders: policy makers, farming communities, research
and extension workers, and nongovernmental organizations (NGOs). The UNDP risk management
projects are too small to have immediate regional or national impact. However, they place risk
management on the agenda, establish communication on the subject, develop and promote adaptation
measures, and build capacity in key areas. The projects play an important catalytic role, and their
funding and scope could well be expanded.
The Food and Agriculture Organization was involved in monitoring wheat diseases, pests, and other
biotic constraints, including weeds, in 2011–13. Annual reports from this monitoring assisted in
identifying weeds and diseases as important risks for wheat production. In 2014 a technical
cooperation project titled Support to Development of Organic Farming and Institutional Capacity
Building in Kazakhstan was implemented. With a budget of US$338,000, this two-year project aims
to (a) evaluate the current status of organic agriculture and its prospects; (b) draft national legislation
on development of organic agriculture; (c) propose an institutional framework and certification system
for organic agriculture; and (d) improve the technical capacity of experts and information
dissemination in organic agriculture.
The main project beneficiaries will be specialists of the Ministry of Agriculture, farmers, and small-
farm households, whose income will be increased by production and marketing of high-value products
9 Project documents were not available at the time of meeting with the project staff.
57
such as organic foods. Other project beneficiaries will include farmer organizations, small
manufacturer enterprises, research institutions, service providers, and NGOs. Wheat is likely to be the
subject of an organic farming project. In the longer term, organic farming will increase the value of
production and reduce the risks associated with price volatility. Many crop production areas in
northern Kazakhstan are already low-input and will be relatively easy to convert to organic productions
using relevant technologies.
The International Maize and Wheat Improvement Center (CIMMYT) operates KASIB, the
Kazakhstan-Siberia Regional Network on Spring Wheat Improvement, which started in 2000 and
unites 18 research institutions and breeding programs from Kazakhstan and Russia. The main network
activities are to (1) exchange new wheat varieties and breeding lines; (2) conduct multilocational trials
across all cooperating programs to evaluate and select the best germplasm for yield, agronomic traits,
and disease resistance; (3) shuttle breeding with CIMMYT-Turkey to incorporate disease resistance
into spring wheat varieties grown in the region; and (4) exchange communication and information.
During 15 years of its operation, KASIB has been supported by different donors at an average rate of
US$0.1 million per year. KASIB plays a very important role in uniting and coordinating and maintains
a database on spring wheat performance in the region.
International Private Companies
The private companies operating in Kazakhstan generally focus on the provision of inputs (herbicides,
pesticides, and fungicides), varieties of field crops, and machinery and equipment. Bayer and Syngenta
are well established in the country and have a network of dealers. Machine and equipment
manufacturers from Europe, Argentina, the United States, and Canada are present in the market.
These companies have their own operational business models and priorities for Kazakhstan. Although
none of them has a formal risk management program or approach, their products and services help
wheat producers to manage risk and to be more efficient and productive. Their inputs protect the
grain yield from losses, and their machinery makes operations faster and more efficient. For this
reason, they are considered to be partners or investors in the development of risk management
interventions.
Wheat Risk Management Options
Diversification of crops and cropping practices is a key strategy for reducing the risks related to climate
change. This section focuses on cereal crops and on diversification of wheat into different groups or
classes of wheat as well as into other cereals. Table 9 lists the Agribusiness-2020 goals for different
crops to be achieved by 2020.
The overall tendency to reduce the area planted with wheat and to increase the area planted with other
crops has merit. The actual pace of changes and final figures will depend on many factors, including
government support for this program and subsidies as well as market forces and availability of varieties
and seeds.
The second important component of diversification is the specialization scheme issued by the MOA
in 2014 to be initiated in 2016 and be fully in force by 2020. The scheme lists the crops recommended
58
for cultivation for each region and district within the region. Current crop-specific subsidies can be
shifted towards “smart subsidies” to encourage great production balance in the sector and more
sustainable agriculture practices. In several drought-prone districts across the country, wheat
production is not recommended, but barley production is encouraged. Barley by its nature is more
drought tolerant and less demanding than wheat. Oats are also widely recommended. This scheme
will contribute to diversification, and most likely will be reviewed and corrected as needed.
Diversification into Different Types and Classes of Wheat
The monoculture of spring wheat in northern Kazakhstan is exacerbated by the uniformity of wheat
itself. Spring bread wheat is grown alone on almost 100 percent of the area in seven northern regions.
The first option for diversifying wheat is to allocate areas to winter wheat. With the warming climate,
this crop has a better chance of surviving and producing high yields that are less vulnerable to drought.
This crop extends the period of fieldwork and allows better use of machinery. Winter wheat is being
grown in the neighboring regions of Russia, and it may occupy as much as 10 percent of the wheat
area in Kostanay, North Kazakhstan, and Akmola region. Although the quality of winter wheat is
lower than that of spring wheat, its production will reduce the variability of wheat production.
The second option is to produce durum wheat, which is used to make pasta products for domestic
use and for export. Durum currently occupies very limited area, but the potential is high. Bread wheat
and durum respond differently to stresses, including drought, and is more resistant to disease, which
helps to stabilize yields (figure 34). Once the markets have been developed, durum will command
higher prices. The quality of durum will be higher in drier regions, such as Aktobe, Kostanay (South),
Akmola, and Pavlodar.
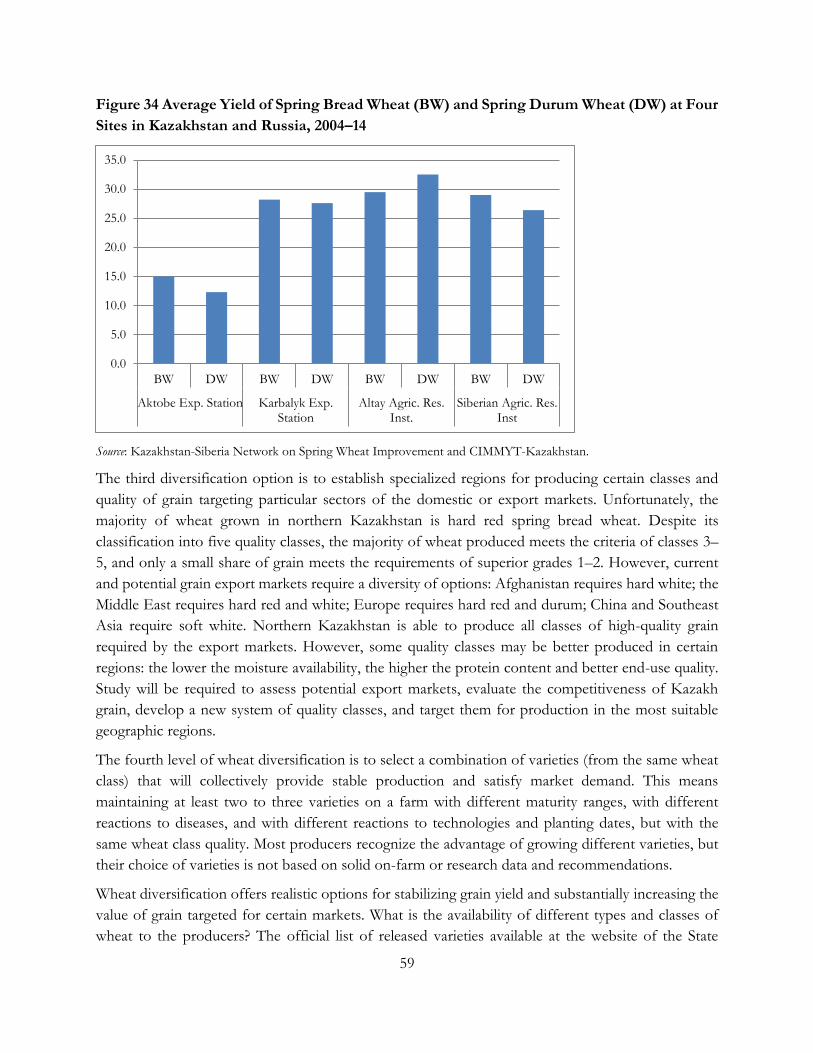
59
Figure 34 Average Yield of Spring Bread Wheat (BW) and Spring Durum Wheat (DW) at Four
Sites in Kazakhstan and Russia, 2004–14
Source: Kazakhstan-Siberia Network on Spring Wheat Improvement and CIMMYT-Kazakhstan.
The third diversification option is to establish specialized regions for producing certain classes and
quality of grain targeting particular sectors of the domestic or export markets. Unfortunately, the
majority of wheat grown in northern Kazakhstan is hard red spring bread wheat. Despite its
classification into five quality classes, the majority of wheat produced meets the criteria of classes 3–
5, and only a small share of grain meets the requirements of superior grades 1–2. However, current
and potential grain export markets require a diversity of options: Afghanistan requires hard white; the
Middle East requires hard red and white; Europe requires hard red and durum; China and Southeast
Asia require soft white. Northern Kazakhstan is able to produce all classes of high-quality grain
required by the export markets. However, some quality classes may be better produced in certain
regions: the lower the moisture availability, the higher the protein content and better end-use quality.
Study will be required to assess potential export markets, evaluate the competitiveness of Kazakh
grain, develop a new system of quality classes, and target them for production in the most suitable
geographic regions.
The fourth level of wheat diversification is to select a combination of varieties (from the same wheat
class) that will collectively provide stable production and satisfy market demand. This means
maintaining at least two to three varieties on a farm with different maturity ranges, with different
reactions to diseases, and with different reactions to technologies and planting dates, but with the
same wheat class quality. Most producers recognize the advantage of growing different varieties, but
their choice of varieties is not based on solid on-farm or research data and recommendations.
Wheat diversification offers realistic options for stabilizing grain yield and substantially increasing the
value of grain targeted for certain markets. What is the availability of different types and classes of
wheat to the producers? The official list of released varieties available at the website of the State
0.0
5.0
10.0
15.0
20.0
25.0
30.0
35.0
BW DW BW DW BW DW BW DW
Aktobe Exp. Station Karbalyk Exp.Station
Altay Agric. Res.Inst.
Siberian Agric. Res.Inst
60
Commission for Variety Release and Protection of Agricultural Crops (http://www.goscomsort.kz)
dated 2012 includes only one variety of winter wheat for North Kazakhstan, 70 varieties of spring
bread wheat, and 24 varieties of spring durum wheat. The actual description of newly released varieties
is available in yearly bulletins. However, the information is difficult to retrieve and compare with data
for different varieties and quality classes for a particular region. A Google search of “spring wheat
varieties recommended for North Kazakhstan” resulted in sites like agroinfo.kz or barayev.kz that
provide a general description of varieties from a particular breeding center, but no site that compares
the data from different varieties and sites. Similarly, if a producer wants to opt for a drought-tolerant
variety, no reliable data are available apart from his own experience or that of his network of farmers.
Since drought does not happen every year, the data on drought performance is not maintained.
Moreover, drought-tolerant varieties may have a smaller share when conditions are favorable because
they are less competitive in favorable conditions. So producers are not able to make well-informed,
data-based selection of wheat varieties or to obtain the seeds of these varieties.
The second issue with the varieties of spring wheat currently grown is their ability to survive the
climate and biotic risks listed in table 8. Based on KASIB observations and data, the varieties of spring
wheat currently being grown have the following characteristics:
1. Generally late and subject to risk of being affected by early fall. A substantial part of wheat area is occupied by Russian varieties developed in Omsk, most of which mature late. Earlier-maturity varieties should occupy at least 20–40 percent of wheat area depending on the region.
2. Susceptible to disease, especially leaf rust. More than 90 percent of wheat area is occupied by varieties that are not affected in dry years when disease is hardly present but that reduce their yield by 20–30 percent in wet years. Farmers tend to underestimate these losses because they obtain higher yields in dry years, but they would benefit by cultivating resistant varieties. There is a need for timely development and promotion of resistant varieties.
There is no information on drought and heat tolerance of spring wheat varieties except their
performance in dry years. Many wheat-producing countries (Australia, Canada, and Turkey) prone to
drought use special drought research sites or centers for reliable phenotyping and evaluation of
drought and heat tolerance independent of weather conditions in a particular season. Some expand
these drought centers into climate change research sites for conducting field evaluation of crops and
varieties with variable carbon dioxide (CO2) content, moisture, nutrients, and temperature. These are
costly centers, but considering the volume of wheat produced in Kazakhstan and potential benefits
from drought-tolerant crops and varieties, the cost may well be justified.
61
Diversification of Wheat into Other Cereals10
Winter rye
Winter rye is a good option, especially considering the high acceptance of rye and mixed wheat bread
in Kazakhstan. The current area planted with rye hardly satisfies the demand, and much rye is imported
from Russia. The area to be planned for rye production in 2020 is 50,000 hectares, but it may well be
larger. Winter rye can be called the “climate change crop” due to its ability to withstand harsh winters,
drought, and poor soils; it is generally less demanding than wheat. However, Kazakhstan does not
have a breeding program for this crop. The three varieties that are currently released are at least 25
years old, and two of them originate from Russia, making seed production quite problematic. The
geographic location for expanded production of winter rye is in East Kazakhstan and in Russia, in the
border areas of Pavlodar, North Kazakhstan, and Kostanay regions. From these areas, rye may also
be exported to big industrial cities of Ural and West Siberia regions of Russia.
Winter triticale
Winter triticale, a man-made crop, is a cross between wheat and rye and combines the advantages of
both. It is adapted to harsh conditions, similar to rye, and is also suitable for animal feed. No winter
triticale varieties are officially released in northern Kazakhstan, although excellent varieties are
available and cultivated in Novosibirsk and Omsk regions of Russia.
All three winter cereal crops (wheat, rye, and triticale) would help to stabilize grain production through
(a) an increase in yield in years that are unfavorable for spring wheat; (b) expansion of the range of
grain use and quality, including export and domestic markets; and (c) suitability for no-till and minimal-
tillage methods. However, the main challenge for introducing and expanding these crops is the
availability of suitable varieties and seeds as well as the need to train farmers in their production.
Barley
According to Agribusiness-2020, barley area will expand to 3 million hectares from the current 1.8
million hectares. This increase is well justified, considering that barley is a less demanding and more
drought-tolerant crop than wheat (figure 35). An increase in barley grain production will help to satisfy
the growing demand of the fodder processing and livestock industries. There are functioning barley
breeding programs in northern Kazakhstan, and well adapted varieties and seeds are available. Little
if any technical gaps exist to the expansion of barley to the targeted area.
10 Diversification strategies are also covered in the Solutions Area 2: Diversification Strategies for North Kazakhstan
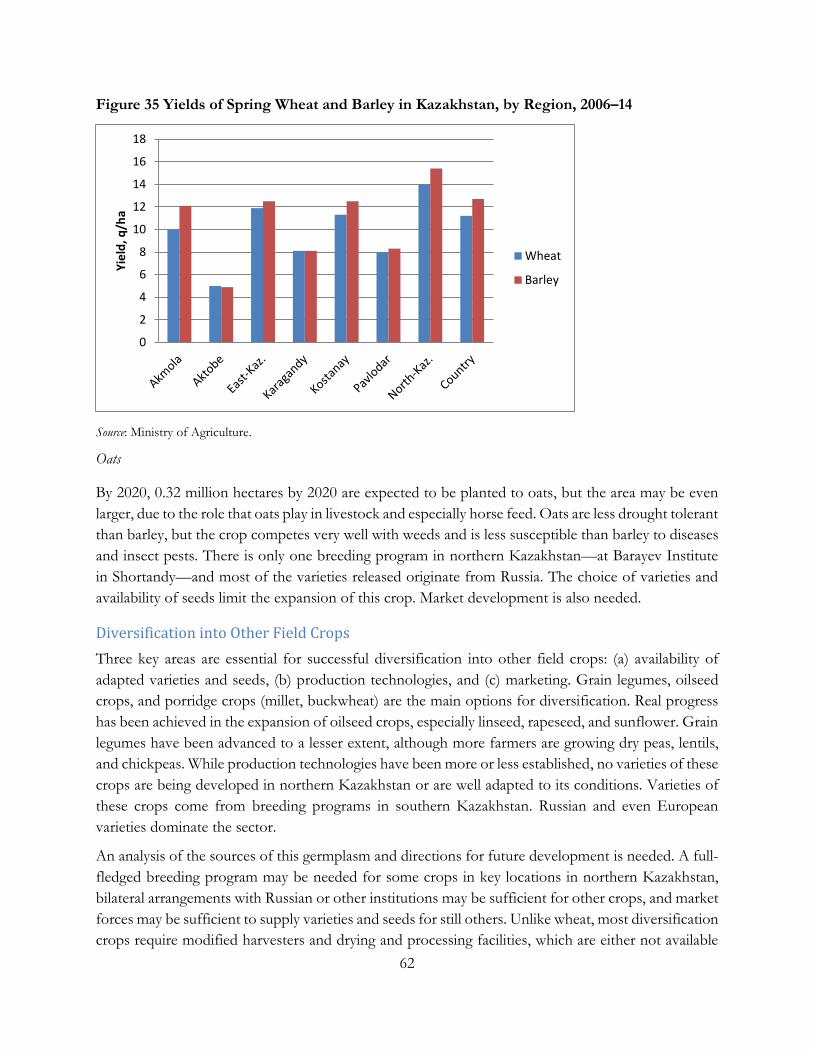
62
Figure 35 Yields of Spring Wheat and Barley in Kazakhstan, by Region, 2006–14
Source: Ministry of Agriculture.
Oats
By 2020, 0.32 million hectares by 2020 are expected to be planted to oats, but the area may be even
larger, due to the role that oats play in livestock and especially horse feed. Oats are less drought tolerant
than barley, but the crop competes very well with weeds and is less susceptible than barley to diseases
and insect pests. There is only one breeding program in northern Kazakhstan—at Barayev Institute
in Shortandy—and most of the varieties released originate from Russia. The choice of varieties and
availability of seeds limit the expansion of this crop. Market development is also needed.
Diversification into Other Field Crops
Three key areas are essential for successful diversification into other field crops: (a) availability of
adapted varieties and seeds, (b) production technologies, and (c) marketing. Grain legumes, oilseed
crops, and porridge crops (millet, buckwheat) are the main options for diversification. Real progress
has been achieved in the expansion of oilseed crops, especially linseed, rapeseed, and sunflower. Grain
legumes have been advanced to a lesser extent, although more farmers are growing dry peas, lentils,
and chickpeas. While production technologies have been more or less established, no varieties of these
crops are being developed in northern Kazakhstan or are well adapted to its conditions. Varieties of
these crops come from breeding programs in southern Kazakhstan. Russian and even European
varieties dominate the sector.
An analysis of the sources of this germplasm and directions for future development is needed. A full-
fledged breeding program may be needed for some crops in key locations in northern Kazakhstan,
bilateral arrangements with Russian or other institutions may be sufficient for other crops, and market
forces may be sufficient to supply varieties and seeds for still others. Unlike wheat, most diversification
crops require modified harvesters and drying and processing facilities, which are either not available
0
2
4
6
8
10
12
14
16
18
Yie
ld, q
/ha
Wheat
Barley
63
or too expensive to use, especially for small farmers. This issue is given attention in Agribusiness-
2020, and it is hoped that the situation will improve. GMO crops have the potential to be developed
or introduced and cultivated in Kazakhstan. This will require the relevant legal and technical
framework for safe and efficient testing and release of varieties.
The availability of crops, varieties, and seeds is an important precondition for successful
diversification, and the role of government support in promoting these crops cannot be
underestimated. A more detailed discussion of diversification appears later in this report.
Use of Climate-Resilient Production Technologies to Reduce Wheat Production Risks
Improved Soil Nutrients and Moisture through No-Till and Minimal Tillage
Conversion to technologies without any soil tillage or as little as possible is a very important strategy
for adapting to climate change and managing risk. These technologies help to preserve the soil’s
fertility and organic and live content; to retain moisture, especially in dry years; and to reduce expenses
and increase farm profitability.
However, the application of conservation agriculture requires special machinery, the application of
nitrogen fertilizer, and the application of chemicals to control weeds. It also brings a greater chance
of transmitting diseases through crop residue (Septoria, tan spot, and Fusarium, head blight).
The area under no- and minimal-tillage methods has been increasing quickly in Kazakhstan, and the
target area identified by Agribusiness-2020 essentially covers all arable land. There is government
support for herbicides, fertilizers, and credits for machinery, and these are expected to continue in the
future. However, the farming community tends to favor minimal tillage and deep furrowing once in
three to five years. As the technology is being applied in different regions and production scenarios,
it will be adjusted for its optimal use. The availability and cost of fertilizers (especially nitrogen)
represent a major challenge. Even though the use of fertilizers is expected to double by 2020, it will
satisfy only 15 percent of the expected need.
Weed Management
The stakeholder’s survey identified weeds as the most important biotic constraint for wheat
production. Weeds exacerbate the effects of drought, extracting moisture and reducing yields in
favorable years. Two forces affect the weed population in northern Kazakhstan. On the one hand, the
introduction of no-till and minimal-tillage technologies initially results in increased weed populations;
on the other hand, diversification and the inclusion of crops like barley, oats, and some oilseed crops
contribute to the reduction in weeds. Herbicides are the key means to control weeds, and farmers
routinely apply them. According to the master plan, the application of herbicides will reach 16.1
million hectares by 2020, up from 14.5 million in 2013. The availability of herbicides on the market as
well as their origin, composition, and quality need to be well monitored and regulated.
64
Disease Management
The spread of wheat diseases in northern Kazakhstan represents the major risk for crop production
in the next 5–10 years. The majority of varieties currently grown are susceptible to leaf rust (an
estimated 90 percent of the area is sown with highly susceptible varieties, which are affected in
favorable conditions). The incidence of Septoria (as reflected in survey and interviews) is growing, as is
tan spot associated with residue management in conservation agriculture. Knowledge and expertise
are lacking about these diseases and about the reaction of currently grown and new varieties to them.
There is potential for damage caused by Fusarium head blight, as happened in North Dakota and
Saskatchewan once conservation agriculture was introduced. Once established, head blight can make
huge bulks of grain unsuitable for human consumption due to toxins. There is little, if any, expertise
on this disease in Kazakhstan. Spring wheat programs in the United States and Canada have been
struggling for 20 years to identify resistant varieties; so far, chemical protection is not effective.
Stem rust, including Ug99 race, is a devastating disease. Non-Ug99 stem rust started to appear on
wheat in Kazakhstan in the last three to five years. Little is known about soil-borne pathogens, like
root rots and nematodes, due to lack of expertise. Northern Kazakhstan does not have facilities to
evaluate and screen for diseases, which is done by collecting, identifying, maintaining, and evaluating
pathogens and their hosts. The only specialized lab is located in the southern part of the country
(Institute of Biosafety), and it works on rusts with limited application in the northern part. The
phytosanitary master plan provides limited information on the direction and scale of disease control
in northern Kazakhstan; it is more concerned about quarantine diseases and pests as well as regulations
and restructuring. However, the risk of wheat diseases is as important as the risk of drought in
northern Kazakhstan.
Pest Management
Insect pests can devastate wheat or substantially reduce its yield and quality. There is a perception that
the risks from insect pests are rare for wheat and that the damage they cause is high. This is correct
for cyclical pests like locusts. They are easy to identify, and the damage they cause is easy to evaluate.
However, pests are present on wheat year after year and, though noticed, are not given attention, even
though the damage they cause may be substantial. Pests are also more active and damaging in hot and
dry seasons, when crops suffer from moisture or heat stress.
Controlling the diversity of pests in northern Kazakhstan may require different strategies: (a) chemical
protection by applying preventive (for locusts) or protective (for leaf miners and bugs) chemicals; (b)
genetic protection by developing resistant varieties (for stem pests like sawfly and Hessian fly); and (c)
agronomy measures by diversifying the crops grown and controlling insects by residue management.
Currently very few pesticides are applied on wheat, and the overall situation in northern Kazakhstan
is similar to biological control when the population of harmful insects is controlled by natural enemies
and diseases.
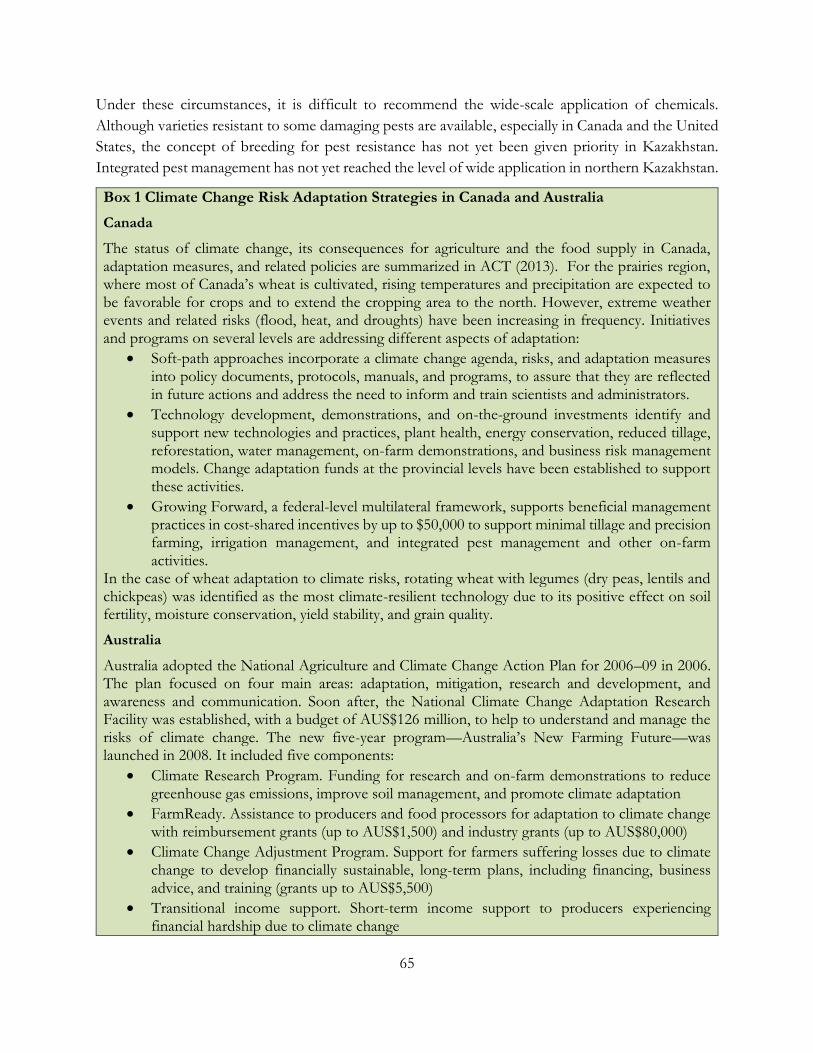
65
Under these circumstances, it is difficult to recommend the wide-scale application of chemicals.
Although varieties resistant to some damaging pests are available, especially in Canada and the United
States, the concept of breeding for pest resistance has not yet been given priority in Kazakhstan.
Integrated pest management has not yet reached the level of wide application in northern Kazakhstan.
Box 1 Climate Change Risk Adaptation Strategies in Canada and Australia
Canada
The status of climate change, its consequences for agriculture and the food supply in Canada, adaptation measures, and related policies are summarized in ACT (2013). For the prairies region, where most of Canada’s wheat is cultivated, rising temperatures and precipitation are expected to be favorable for crops and to extend the cropping area to the north. However, extreme weather events and related risks (flood, heat, and droughts) have been increasing in frequency. Initiatives and programs on several levels are addressing different aspects of adaptation:
Soft-path approaches incorporate a climate change agenda, risks, and adaptation measures into policy documents, protocols, manuals, and programs, to assure that they are reflected in future actions and address the need to inform and train scientists and administrators.
Technology development, demonstrations, and on-the-ground investments identify and support new technologies and practices, plant health, energy conservation, reduced tillage, reforestation, water management, on-farm demonstrations, and business risk management models. Change adaptation funds at the provincial levels have been established to support these activities.
Growing Forward, a federal-level multilateral framework, supports beneficial management practices in cost-shared incentives by up to $50,000 to support minimal tillage and precision farming, irrigation management, and integrated pest management and other on-farm activities.
In the case of wheat adaptation to climate risks, rotating wheat with legumes (dry peas, lentils and chickpeas) was identified as the most climate-resilient technology due to its positive effect on soil fertility, moisture conservation, yield stability, and grain quality.
Australia
Australia adopted the National Agriculture and Climate Change Action Plan for 2006–09 in 2006. The plan focused on four main areas: adaptation, mitigation, research and development, and awareness and communication. Soon after, the National Climate Change Adaptation Research Facility was established, with a budget of AUS$126 million, to help to understand and manage the risks of climate change. The new five-year program—Australia’s New Farming Future—was launched in 2008. It included five components:
Climate Research Program. Funding for research and on-farm demonstrations to reduce greenhouse gas emissions, improve soil management, and promote climate adaptation
FarmReady. Assistance to producers and food processors for adaptation to climate change with reimbursement grants (up to AUS$1,500) and industry grants (up to AUS$80,000)
Climate Change Adjustment Program. Support for farmers suffering losses due to climate change to develop financially sustainable, long-term plans, including financing, business advice, and training (grants up to AUS$5,500)
Transitional income support. Short-term income support to producers experiencing financial hardship due to climate change
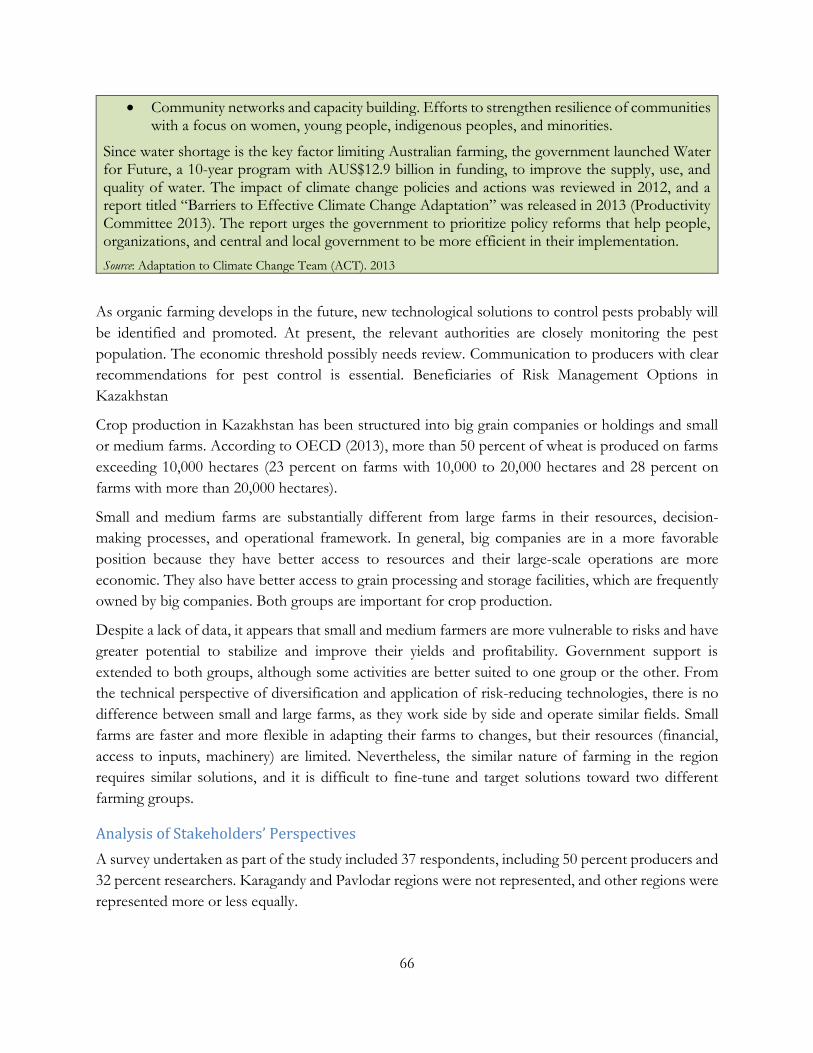
66
Community networks and capacity building. Efforts to strengthen resilience of communities with a focus on women, young people, indigenous peoples, and minorities.
Since water shortage is the key factor limiting Australian farming, the government launched Water for Future, a 10-year program with AUS$12.9 billion in funding, to improve the supply, use, and quality of water. The impact of climate change policies and actions was reviewed in 2012, and a report titled “Barriers to Effective Climate Change Adaptation” was released in 2013 (Productivity Committee 2013). The report urges the government to prioritize policy reforms that help people, organizations, and central and local government to be more efficient in their implementation.
Source: Adaptation to Climate Change Team (ACT). 2013
As organic farming develops in the future, new technological solutions to control pests probably will
be identified and promoted. At present, the relevant authorities are closely monitoring the pest
population. The economic threshold possibly needs review. Communication to producers with clear
recommendations for pest control is essential. Beneficiaries of Risk Management Options in
Kazakhstan
Crop production in Kazakhstan has been structured into big grain companies or holdings and small
or medium farms. According to OECD (2013), more than 50 percent of wheat is produced on farms
exceeding 10,000 hectares (23 percent on farms with 10,000 to 20,000 hectares and 28 percent on
farms with more than 20,000 hectares).
Small and medium farms are substantially different from large farms in their resources, decision-
making processes, and operational framework. In general, big companies are in a more favorable
position because they have better access to resources and their large-scale operations are more
economic. They also have better access to grain processing and storage facilities, which are frequently
owned by big companies. Both groups are important for crop production.
Despite a lack of data, it appears that small and medium farmers are more vulnerable to risks and have
greater potential to stabilize and improve their yields and profitability. Government support is
extended to both groups, although some activities are better suited to one group or the other. From
the technical perspective of diversification and application of risk-reducing technologies, there is no
difference between small and large farms, as they work side by side and operate similar fields. Small
farms are faster and more flexible in adapting their farms to changes, but their resources (financial,
access to inputs, machinery) are limited. Nevertheless, the similar nature of farming in the region
requires similar solutions, and it is difficult to fine-tune and target solutions toward two different
farming groups.
Analysis of Stakeholders’ Perspectives
A survey undertaken as part of the study included 37 respondents, including 50 percent producers and
32 percent researchers. Karagandy and Pavlodar regions were not represented, and other regions were
represented more or less equally.
67
More than 78 percent of respondents stated that the weather in the last 5–10 years has deteriorated
and negatively affected wheat yields. At the same time, they felt that the general environment for wheat
production, including the availability of inputs, machinery, credits, and subsidies, has improved (73
percent). As a result of the negative effect of climate and positive changes in production, 71.4 percent
of respondents said that wheat profitability either had not changed or had deteriorated. Dry and hot
spring and early summer months were listed as the most frequent, detrimental changes in climate. The
most severe biotic stresses were pests (33.3 percent), weeds (19.8 percent), Septoria (17.1 percent),
and rusts (12.6 percent).
As a risk management solution, the combination of no- and minimal tillage was preferred by 71.4
percent of respondents. Ecological (soil conservation) and economic (cost reduction) factors were
listed as the key advantages of this technology. Lack of appropriate machinery (44.9 percent) was the
main challenge for its application. Many cereal, grain legume, and oil crops were mentioned as
alternatives to wheat. However, the main challenge for their use was lack of markets (51.4 percent),
lack of availability of varieties and seeds (37.1 percent), additional costs (28.6 percent), and lack of
technical knowledge about how to grow them (20.0 percent).
More than 50 percent of respondents considered irrigation as a possible option in northern
Kazakhstan but said that the lack of availability of water (42.9 percent) and high initial costs (42.9
percent) prevent its use. For this reason, they prefer crop rotation (23.0 percent), varieties (18.9
percent), diversification (14.8 percent), minimal- and no-tillage methods (12.3 percent), and crop
protection (11.5 percent) as possible risk management options. In general, the survey reflects the real
situation in crop production and gives good guidance for future interventions.
Barriers to Participation
There are four major barriers to participation in different risk management options:
Financial. Related to availability of funds or access to credit for implementing climate-resilient technologies, especially those related to the use of new machinery, like no-till or minimal tillage. Small and medium farmers are disadvantaged here.
Technological. Availability of the crops, varieties, and inputs necessary for risk adaptation technologies. As discussed, this is especially important for diversification of crops and varieties as well as for selection of wheat varieties with drought and heat tolerance. There is either limited choice or limited information to make informed decisions and select the best-adapted crop and variety.
Knowledge. Training of farmers is required, especially dealing with new crops or technologies. The current efforts of extension centers could be expanded, and other training options, including the private sector, could be engaged.
Logistical. The Farmers Union raised the issue of access to grain storage and processing activities. Even with good and stable yield, farmers often have no place to store their grain and have obstacles to depositing their yield in elevators. Since most elevators are private, the owners serve their own needs first and then start accepting grain from other farmers in the fall. The evaluation of grain quality at the grain entry point may be biased to reduce the price
68
and sometimes the cost of cleaning and storing grain. This may affect 20–30 percent of all grain delivered.
Options for Scaling up
Agribusiness-2020 has defined activities and a fixed budget. Despite some budget flexibility, there are
limited opportunities to change the priorities of some activities. However, some projects offer options
for scaling up. The UNDP Climate Risk Management Project and Climate-Resilient Wheat Project are
attractive options for scaling up, as their priorities and directions are very much aligned with the
findings of this report. The World Bank may consider supporting these projects and becoming
involved in synergistic activities on risk management in Kazakhstan and the region. Coordination is
required to collect information on the performance of crops and varieties based on actual field data
so that farmers can easily access the information and make informed decisions when selecting crops
and varieties. This is a low-cost, but important, activity that can be undertaken by government
agencies, NGOs, or the private sector.
Gaps in Policy and Technology
The fundamental gap in the country is that climate change–related risks and mitigation or adaptation
options are not high on the agenda of policy makers and are not reflected in important policy and
technical documents. Development of the agriculture sector is still viewed as part of conventional
policies on production and competitiveness that do not necessarily prioritize risk management options
and climate change scenarios. This is partly due to the fact that no clear science-based link has been
established between weather events, climate change, and production volatility. The trends of higher
air temperatures and changes in precipitation have not been related to the actual yield of wheat or
other crops so that producers and policy makers do not fully realize their imminent effect and danger.
Policy makers and stakeholders have to be convinced of their importance. Once this is done, climate
change and risk management will form part of agricultural policy.
Several technical gaps have been mentioned, primarily related to the availability of crops, varieties, and
seeds, application of technologies, and need for capacity building. The proposed interventions will
address them through development of a vision and roadmap or through technical solutions.
Potential Interventions
Table 10 provides a summary of risks and proposed responses. Potential responses are organized by
risk layer: mitigation actions that farmers can undertake; risk sharing actions for marketable risks; and,
risk coping strategies for disaster recovery. Following this summary, detailed descriptions of potential
interventions are provided. Potential interventions focus on seven northern regions (Akmola, Aktobe,
Karagandy, Kostanay, Pavlodar, North Kazakhstan, and East Kazakhstan), but may also be applicable
in other parts of the country. The proposed interventions are intended to improve wheat yields,
especially in dry years, leading to more stable production and higher profitability due to enhanced
quality. They are also intended to enhance the capacity of national and local institutions to deal with
the climate change–related risks for crop production.
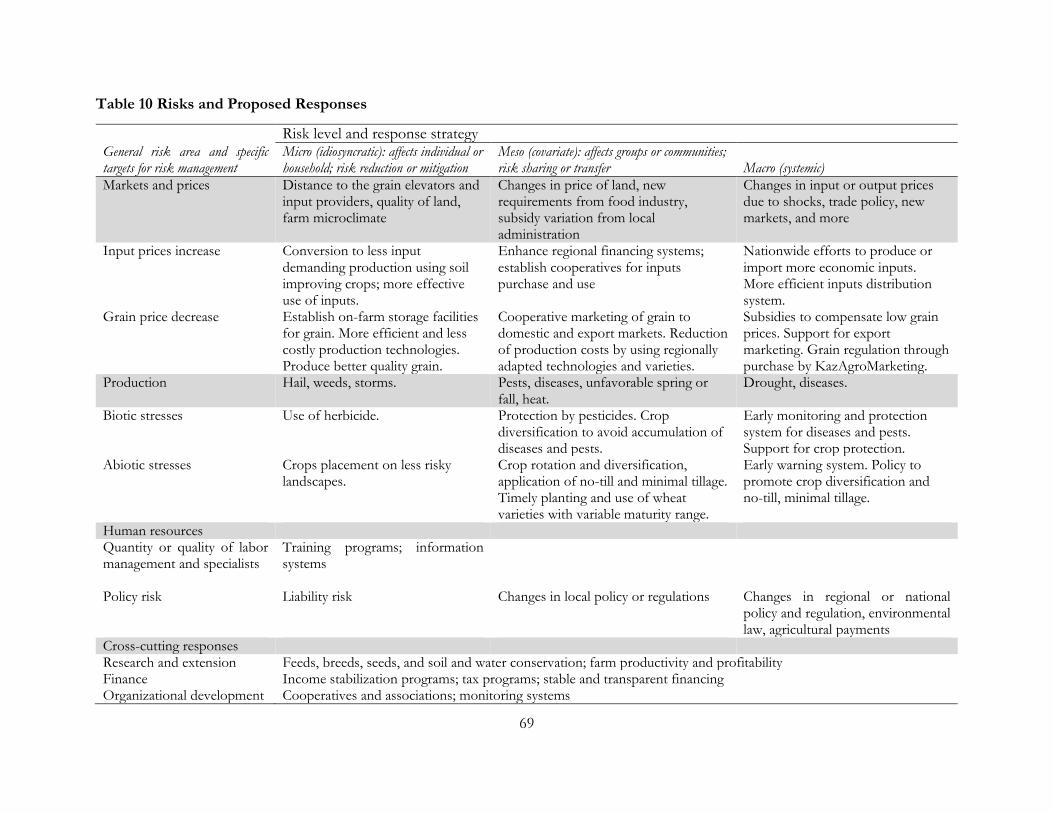
69
Table 10 Risks and Proposed Responses
Risk level and response strategy General risk area and specific targets for risk management
Micro (idiosyncratic): affects individual or household; risk reduction or mitigation
Meso (covariate): affects groups or communities; risk sharing or transfer Macro (systemic)
Markets and prices Distance to the grain elevators and input providers, quality of land, farm microclimate
Changes in price of land, new requirements from food industry, subsidy variation from local administration
Changes in input or output prices due to shocks, trade policy, new markets, and more
Input prices increase Conversion to less input demanding production using soil improving crops; more effective use of inputs.
Enhance regional financing systems; establish cooperatives for inputs purchase and use
Nationwide efforts to produce or import more economic inputs. More efficient inputs distribution system.
Grain price decrease Establish on-farm storage facilities for grain. More efficient and less costly production technologies. Produce better quality grain.
Cooperative marketing of grain to domestic and export markets. Reduction of production costs by using regionally adapted technologies and varieties.
Subsidies to compensate low grain prices. Support for export marketing. Grain regulation through purchase by KazAgroMarketing.
Production Hail, weeds, storms. Pests, diseases, unfavorable spring or fall, heat.
Drought, diseases.
Biotic stresses Use of herbicide. Protection by pesticides. Crop diversification to avoid accumulation of diseases and pests.
Early monitoring and protection system for diseases and pests. Support for crop protection.
Abiotic stresses Crops placement on less risky landscapes.
Crop rotation and diversification, application of no-till and minimal tillage. Timely planting and use of wheat varieties with variable maturity range.
Early warning system. Policy to promote crop diversification and no-till, minimal tillage.
Human resources Quantity or quality of labor management and specialists
Training programs; information systems
Policy risk Liability risk Changes in local policy or regulations Changes in regional or national
policy and regulation, environmental law, agricultural payments
Cross-cutting responses Research and extension Feeds, breeds, seeds, and soil and water conservation; farm productivity and profitability Finance Income stabilization programs; tax programs; stable and transparent financing Organizational development Cooperatives and associations; monitoring systems
70
Activity 1. Consolidate Recommendations for Climate-Resilient Crop Production
Sufficient knowledge has been accumulated in research institutions, the farming community, and
different projects to develop recommendations on climate-resilient technologies for reducing the risks
associated with drought, heat, diseases, and pests. These recommendations will be specific to the
region or ecological zone and based on the application of no- or minimal-tillage methods, diversity of
crops, appropriate varieties, timely field operations, and crop protection. They will be as specific as
possible to close the gap in yield between average and advanced farms.
The approach recommended here is to raise minimum yield in unfavorable years to reduce yield
volatility. At present, there is no single place for farmers to obtain information on field crop
technologies and varieties. The research institutes and extension centers distribute some information
through their websites and training courses. KazAgroMarketing and several other websites provide
scattered information to farmers. Private international companies (Bayer and Syngenta) aggressively
promote their own products and services, but these technologies are intended to maximize yield rather
that to stabilize variability.
The approach recommended here will focuses on field activities for reducing the effects of climate-
related risks in local conditions. The approach may incorporate grain legumes or green manure crops,
which contribute to nitrogen balance and soil fertility. Detailed description of varieties and their
reaction to drought and diseases will need to be incorporated. Terms of reference will need to be well
drafted. Once prepared by the multidisciplinary teams, discussed with the stakeholders, and finalized,
the resulting recommendations can be promoted at all levels to educate farmers and encourage them
to apply them on their land.
The target beneficiaries are small and medium agricultural producers. Researchers will also benefit
through improved capacity to carry out climate-oriented work. The MOA and agricultural research
system would lead the work with input from all stakeholders. Private companies involved in crop
protection, crop varieties, and machinery will also be included. The activity will consist of technical
assistance and will cost an estimated US$0.2 million. No regulatory framework, policy support, or
reforms are required. The project will formulate and promote technical solutions for managing
drought risk and other stresses in northern Kazakhstan. The goal is to stabilize yield and increase
profitability. As the level of minimal yield rises, the gap between average and potentially attainable
yield is expected to close.
Activity 2. Conduct a Marketing Study on Options for Cereals Diversification
The survey and interviews identified the availability of markets as a major challenge for wheat
diversification. The challenge is to determine how these markets can be optimized and developed to
satisfy the demand for crop products grown in northern Kazakhstan. One task is to understand the
commodity chain and current and future opportunities for domestic and export products as well as
processing, storage, transportation, and other expenses. Another is related to market development.
Many countries have associations of producers or exporters of different commodities. These
associations are normally funded by producers, and the state works with traders, the processing
71
industry, and consumers to develop markets and increase demand. This project seeks to evaluate the
current and potential markets for diversified crops, commodity and product chains, and associated
challenges and to develop recommendations for their promotion. The processing industry inside and
outside of Kazakhstan will be interested in using this study to access a supply of products with good
quality and economic price.
The target beneficiaries are agricultural producers. This activity would work with the MOA, KazAgro
Marketing, private companies from the processing sector, and other partners in conducting this study.
The activity will consist of technical assistance and is estimated at US$0.3 million. No regulatory
framework, policy support, or reforms are required. The project will identify gaps in the marketing of
diversification crops and the development of recommendations for their expansion, including policy
issues. This will result in higher demand, stable prices, and eventually higher profitability for producers.
Activity 3. Promote Climate-Smart Solutions
The current system of subsidies for field crops is too complicated and offers individual incentives for
the farmer based on the crop grown, technology applied, crop protection, and credits. The subsidies
system is described in OECD (2013). This system can be partly substituted or complemented by
“climate-resilient farm” subsidies based on various criteria for reducing production risks. This may
represent a list of climate-smart recommendations regarding crop production, animal husbandry,
rangeland use, and other activities. Despite the challenges involved in drafting and monitoring such a
program, the potential benefits for producers and the environment are tremendous. Such a system
will probably be introduced in steps, starting from a few essential requirements and expanding to more
components as the system matures.
The project intends to develop an incentives framework based on a systems approach to support a
“climate-resilient farm model.” This activity may take one or two years and will need to be developed
together with all stakeholders. The framework for the subsidies should be specific to the region and
ecological zone. Initially to support production, the subsidies could be expanded to include investment
support if needed.
The target beneficiaries are agricultural producers in northern Kazakhstan, who will benefit from the
long-term application of climate-resilient practices. Policy makers will benefit from the analysis and
options for informed allocation of resources in the future. Researchers and other stakeholders
involved in this work will benefit through enhanced capacity.
The activity will work with the MOA and relevant research and other institutions in developing this
policy. It will be based on the outcomes of the development and promotion of recommendations. An
estimated 10 percent of all subsidies for the target region will be required in the initial phase, with an
increase of up to 40–50 percent within five to seven years. No regulatory framework, policy support,
or reforms are required during development. Once developed, the proposals will go through the
regular approval procedure, requiring input from different organizations. Establishment of an
incentives framework to promote risk management practices will have a long-term impact in shaping
the direction of agricultural development in northern Kazakhstan.
72
Activity 4. Develop a Strategy for Breeding and Research System for Important Crops for Northern Kazakhstan
The share of wheat planted to varieties developed in Kazakhstan is below 50 percent, and the rest
originates from Russia. For some other important diversification crops (oats, grain legumes, oil crops),
this figure is even lower, with substantial dependence on crops and varieties from outside the country.
There is nothing wrong with cultivating varieties developed outside the country, especially from Russia
as part of the Eurasian Customs Union. However, several issues arise: (a) Do the varieties introduced
meet the adaptation and quality requirements of northern Kazakhstan? In the case of wheat, they
frequently do not. (b) Is there a clear priority for which strategic crops should be bred in the country
and which should be sourced in the market? There is not. (c) Is investment in research and
development for strategic crops sufficient to develop varieties and technologies able to withstand
current production risks? The answer is not clear.
This activity intends to develop a strategy for breeding, research, and development activities for the
next 5–10 years to meet the requirements of producers in climate-resilient varieties set by the
Agribusiness-2020 program.
The target beneficiaries are policy makers, who will benefit from the analysis and options for informed
allocation of resources in the future. Researchers will benefit through a better targeted research agenda
and funding. Agricultural producers will eventually benefit though the use of improved, better adapted
varieties.
The activity will work with the MOA to research the current situation of crops and varieties grown in
Kazakhstan. The National Agricultural Research System (KazAgroInnovation) is being reformed and
restructured, and its future framework has not yet been defined. However, it will be the main
counterpart in this review, including some research institutes from the Ministry of Education and
Science. International private companies involved in breeding and present in Kazakhstan market will
be important contributors to this study. This activity will consist of technical assistance and is
estimated to cost US$0.2 million. No regulatory framework, policy support, or reforms are required.
The strategy for breeding, research, and development of climate-resilient crops and varieties will
contribute to streamlining the research agenda of the national system, improve the allocation of
resources, make the provision of varieties and crops more efficient, and identify effective outsourcing
options, including private business.
Activity 5. Conduct a Feasibility Study for Irrigation
Many producers and scientists in northern Kazakhstan do not consider irrigation to be a viable risk
management option. However, the region is very diverse, and some areas in Pavlodar, North
Kazakhstan, Akmola, or Kostanay region may have water resources available for irrigation. The
UNDP report on water resources in Kazakhstan does not specifically address this issue. The Water
Resources and Irrigation Research Institute in Zhambyl reportedly conducted some studies in the past.
Irrigation techniques are progressing quickly, and what was difficult in the past may be much easier
now. As the region becomes drier, irrigation may become one of the few options left. The objective
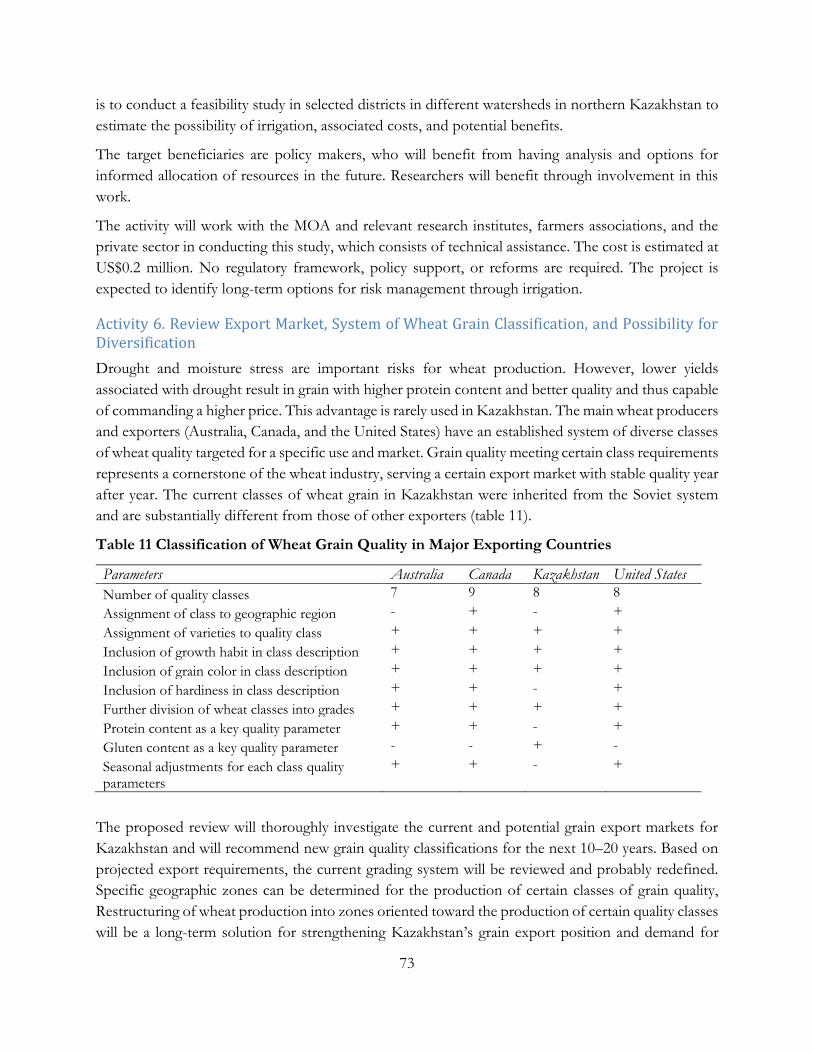
73
is to conduct a feasibility study in selected districts in different watersheds in northern Kazakhstan to
estimate the possibility of irrigation, associated costs, and potential benefits.
The target beneficiaries are policy makers, who will benefit from having analysis and options for
informed allocation of resources in the future. Researchers will benefit through involvement in this
work.
The activity will work with the MOA and relevant research institutes, farmers associations, and the
private sector in conducting this study, which consists of technical assistance. The cost is estimated at
US$0.2 million. No regulatory framework, policy support, or reforms are required. The project is
expected to identify long-term options for risk management through irrigation.
Activity 6. Review Export Market, System of Wheat Grain Classification, and Possibility for Diversification
Drought and moisture stress are important risks for wheat production. However, lower yields
associated with drought result in grain with higher protein content and better quality and thus capable
of commanding a higher price. This advantage is rarely used in Kazakhstan. The main wheat producers
and exporters (Australia, Canada, and the United States) have an established system of diverse classes
of wheat quality targeted for a specific use and market. Grain quality meeting certain class requirements
represents a cornerstone of the wheat industry, serving a certain export market with stable quality year
after year. The current classes of wheat grain in Kazakhstan were inherited from the Soviet system
and are substantially different from those of other exporters (table 11).
Table 11 Classification of Wheat Grain Quality in Major Exporting Countries
Parameters Australia Canada Kazakhstan United States
Number of quality classes 7 9 8 8
Assignment of class to geographic region - + - +
Assignment of varieties to quality class + + + +
Inclusion of growth habit in class description + + + +
Inclusion of grain color in class description + + + +
Inclusion of hardiness in class description + + - +
Further division of wheat classes into grades + + + +
Protein content as a key quality parameter + + - +
Gluten content as a key quality parameter - - + -
Seasonal adjustments for each class quality parameters
+ + - +
The proposed review will thoroughly investigate the current and potential grain export markets for
Kazakhstan and will recommend new grain quality classifications for the next 10–20 years. Based on
projected export requirements, the current grading system will be reviewed and probably redefined.
Specific geographic zones can be determined for the production of certain classes of grain quality,
Restructuring of wheat production into zones oriented toward the production of certain quality classes
will be a long-term solution for strengthening Kazakhstan’s grain export position and demand for
74
Kazakh products and will result in higher values of exported grain. Respectively, the share of
associated costs for transporting and processing exported grain will decline. Wheat areas that are not
competitive for the production of export-quality grain will also benefit from this intervention, as they
will be able to raise yield without concern for quality deterioration. The recent study of wheat markets
in the region does not cover the issue of grain quality (USAID 2011).
The target beneficiaries are policy makers, who will benefit as they will have options for making
informed decisions on the development of wheat production in the future. Wheat producers, including
small, medium, and large farms, will benefit through higher wheat prices and better farm profitability.
Consumers in Kazakhstan will benefit through generally better quality of wheat products.
The review will take place in close cooperation with the MOA, agricultural research institutes,
associations of producers and grain exporters, and the processing industry. The project will visit
importers. The quality of wheat grain from Kazakhstan will be assessed and compared with the main
export classes for current and potential markets.
This activity is almost entirely technical assistance, with a component of technical activities comparing
the quality of Kazakh grain to the quality of grain from its competitors in current and potential
markets. The estimated cost is US$0.5 million. No regulatory framework, policy support, or reforms
are required. A long-term roadmap for restructuring and diversifying wheat production in Kazakhstan
will eventually reduce the volatility of wheat prices and stabilize income for wheat producers.
Activity 7. Establish Drought (Climate Change) Research Centers and Network
Agribusiness-2020 states that the investments in agricultural research are low (0.17–0.25 percent of
gross agricultural production) and several times lower than in other countries. Leaving the overall issue
of agricultural research aside, the context of this study suggests the need to focus on management of
climate and related risks. Unfortunately, R&D related to climate adaptation and risk management has
not been fully incorporated into the research agenda. Considering the area, volume, and value of wheat
production alone, there is an urgent need to establish or reorient existing research facilities toward
climate change–related challenges and drought in particular.
The trend in this area is to create field-based precision phenotyping platforms allowing reliable and
detailed information on the performance of different crops and varieties as well as technologies under
a variable range of predicted environments. These platforms are essential for understanding the effects
of drought or other stresses on crops and developing solutions to reduce the related risks. In northern
Kazakhstan, with its vast area, variable soil, and different environments, creating a network of such
phenotyping platforms or centers is well justified. These centers could be incorporated into existing
research institutes and stations or established separately if the former are not suitable. In many
countries, these field platforms are complemented by advanced genomic research facilities to identify
and manipulate the genes contributing to drought and other stresses. The objective is to establish a
network of drought (climate change) research sites to develop technical solutions for key risks
associated with the climate change, drought, heat, and biotic stresses.
75
The target beneficiaries are agricultural producers, who will benefit through the use of climate-resilient
crops, varieties, and technologies. Researchers will benefit through improved capacity to carry out
climate-oriented work.
The activity will work with the MOA and the agricultural research system with input from all
stakeholders. There is scope for a private-public partnership and investment. This activity will
combine technical assistance, investment, and capacity building, including some infrastructure
improvement and equipment supply. The estimated cost is US$0.5 million. Agribusiness-2020
anticipates the use of GMOs for several field crops. If GMOs become the subject of research in the
new network, then the regulatory framework will have to be appraised and modified if needed. The
identification of future technical solutions for managing drought risk and other stresses will contribute
greatly to sustaining crop production in northern Kazakhstan.
Activity 8. Establish a Wheat Pathology Center and Facilities
Considering the uniformity of crops in northern Kazakhstan and the spread of minimal- and no-tillage
measures, the pressure of diseases on wheat is growing and may very soon result in disasters unless
urgent measures are taken. Diseases include wheat rusts, Septoria, and especially Fusarium head blight,
which sooner or later will come to the region. The efforts at Barayev Institute in the north and
Biosafety Institute and Crop Protection Institutes in the south are not sufficient. Unlike varieties that
can be brought from outside, the disease protection system needs to be developed inside the country.
There is limited capacity for this work. One or several research institutions in northern Kazakhstan
need to work with diseases under greenhouse or growth room conditions to be able to follow the
protocols for collecting, identifying, multiplying, and using artificial screening. The objective is to
reduce yield losses from diseases through development of resistant varieties and control measures.
The target beneficiaries are agricultural producers, who will benefit through the use of disease-resistant
varieties and disease control measures. Researchers will benefit through improved capacity to carry
out pathology work.
The activity will work with the MOA and the agricultural research system, with input from all
stakeholders. The activity combines technical assistance and capacity building, including some
infrastructure improvement and equipment supply. The cost is estimated at US$3 million. The activity
may require the movement of pathogens from one region to another and, if regulated by the state,
require adjustments. The identification of future technical solutions for disease risk management will
contribute to sustainable crop production in northern Kazakhstan.
Activity 9. Build Capacity of the State Commission for Variety Release and Protection of Agricultural Crops
National institutions related to crop production, such as the State Commission for Variety Release
and Protection of Agricultural Crops, have changed little since 1991. Substantial capacity building is
needed to meet the current challenges. The importance of this system was prioritized by the MOA
during the meeting, and a short comparative analysis of the Kazakh system with that of other grain
exporters was provided at its request (appendix G). The system of testing, releasing, and protecting
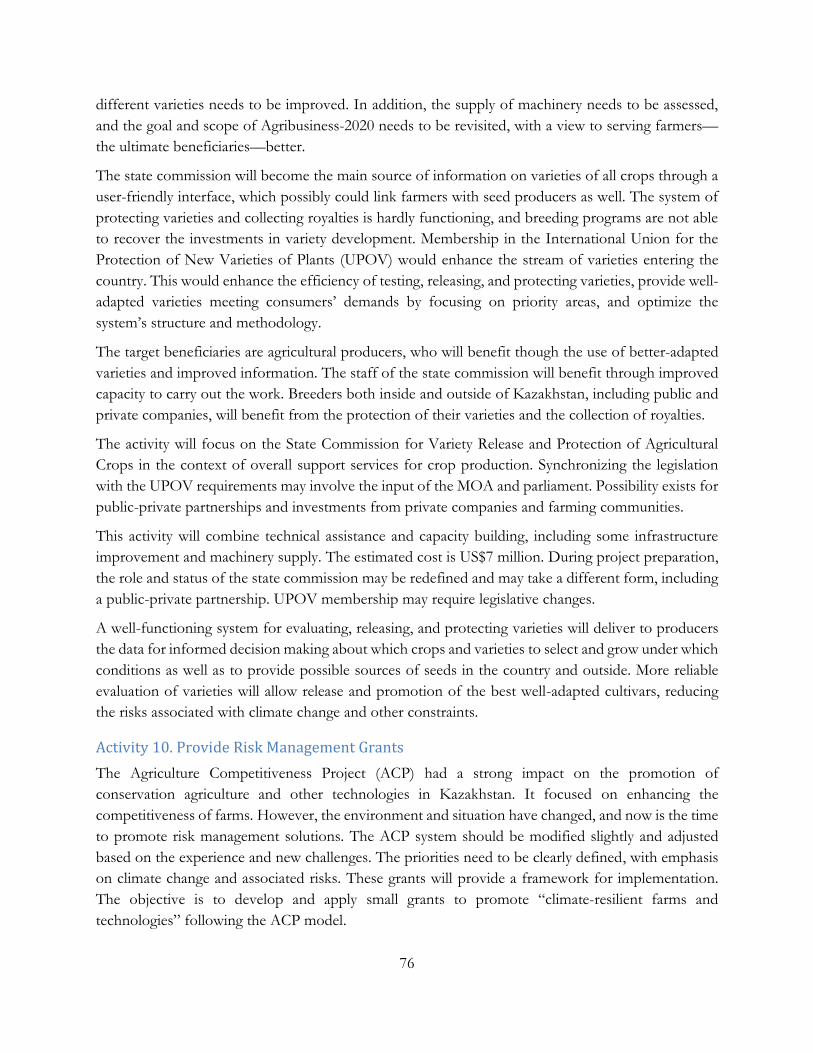
76
different varieties needs to be improved. In addition, the supply of machinery needs to be assessed,
and the goal and scope of Agribusiness-2020 needs to be revisited, with a view to serving farmers—
the ultimate beneficiaries––better.
The state commission will become the main source of information on varieties of all crops through a
user-friendly interface, which possibly could link farmers with seed producers as well. The system of
protecting varieties and collecting royalties is hardly functioning, and breeding programs are not able
to recover the investments in variety development. Membership in the International Union for the
Protection of New Varieties of Plants (UPOV) would enhance the stream of varieties entering the
country. This would enhance the efficiency of testing, releasing, and protecting varieties, provide well-
adapted varieties meeting consumers’ demands by focusing on priority areas, and optimize the
system’s structure and methodology.
The target beneficiaries are agricultural producers, who will benefit though the use of better-adapted
varieties and improved information. The staff of the state commission will benefit through improved
capacity to carry out the work. Breeders both inside and outside of Kazakhstan, including public and
private companies, will benefit from the protection of their varieties and the collection of royalties.
The activity will focus on the State Commission for Variety Release and Protection of Agricultural
Crops in the context of overall support services for crop production. Synchronizing the legislation
with the UPOV requirements may involve the input of the MOA and parliament. Possibility exists for
public-private partnerships and investments from private companies and farming communities.
This activity will combine technical assistance and capacity building, including some infrastructure
improvement and machinery supply. The estimated cost is US$7 million. During project preparation,
the role and status of the state commission may be redefined and may take a different form, including
a public-private partnership. UPOV membership may require legislative changes.
A well-functioning system for evaluating, releasing, and protecting varieties will deliver to producers
the data for informed decision making about which crops and varieties to select and grow under which
conditions as well as to provide possible sources of seeds in the country and outside. More reliable
evaluation of varieties will allow release and promotion of the best well-adapted cultivars, reducing
the risks associated with climate change and other constraints.
Activity 10. Provide Risk Management Grants
The Agriculture Competitiveness Project (ACP) had a strong impact on the promotion of
conservation agriculture and other technologies in Kazakhstan. It focused on enhancing the
competitiveness of farms. However, the environment and situation have changed, and now is the time
to promote risk management solutions. The ACP system should be modified slightly and adjusted
based on the experience and new challenges. The priorities need to be clearly defined, with emphasis
on climate change and associated risks. These grants will provide a framework for implementation.
The objective is to develop and apply small grants to promote “climate-resilient farms and
technologies” following the ACP model.
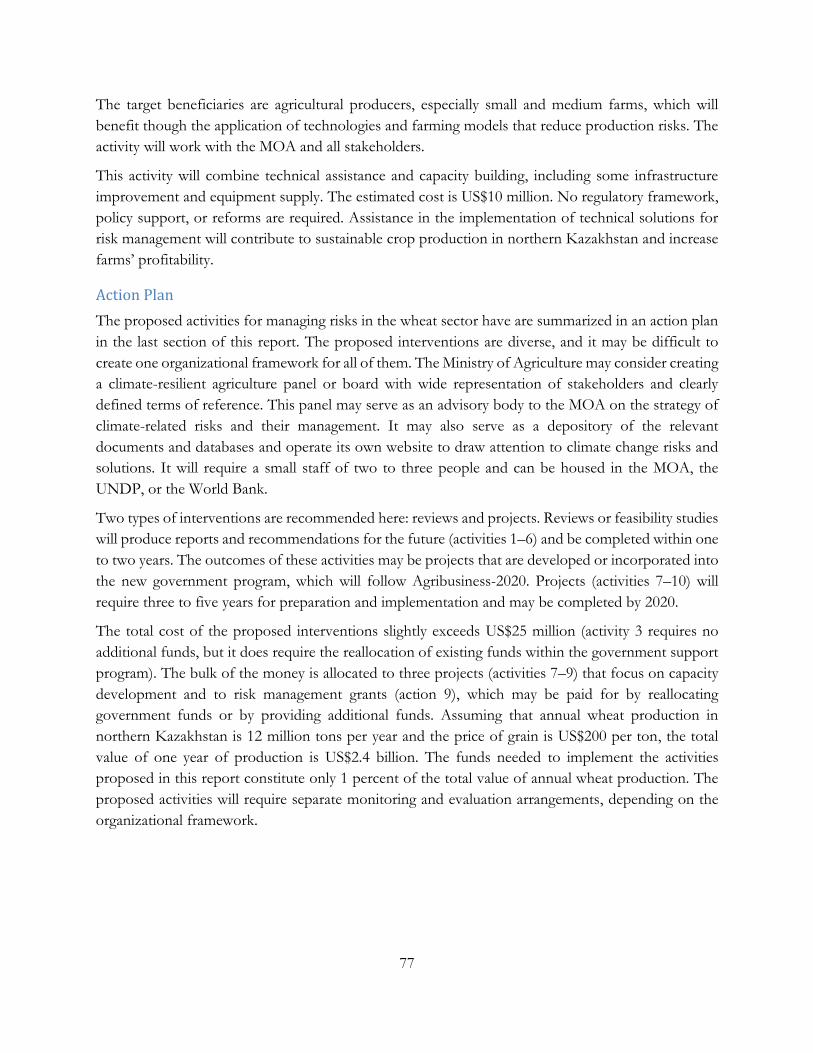
77
The target beneficiaries are agricultural producers, especially small and medium farms, which will
benefit though the application of technologies and farming models that reduce production risks. The
activity will work with the MOA and all stakeholders.
This activity will combine technical assistance and capacity building, including some infrastructure
improvement and equipment supply. The estimated cost is US$10 million. No regulatory framework,
policy support, or reforms are required. Assistance in the implementation of technical solutions for
risk management will contribute to sustainable crop production in northern Kazakhstan and increase
farms’ profitability.
Action Plan
The proposed activities for managing risks in the wheat sector have are summarized in an action plan
in the last section of this report. The proposed interventions are diverse, and it may be difficult to
create one organizational framework for all of them. The Ministry of Agriculture may consider creating
a climate-resilient agriculture panel or board with wide representation of stakeholders and clearly
defined terms of reference. This panel may serve as an advisory body to the MOA on the strategy of
climate-related risks and their management. It may also serve as a depository of the relevant
documents and databases and operate its own website to draw attention to climate change risks and
solutions. It will require a small staff of two to three people and can be housed in the MOA, the
UNDP, or the World Bank.
Two types of interventions are recommended here: reviews and projects. Reviews or feasibility studies
will produce reports and recommendations for the future (activities 1–6) and be completed within one
to two years. The outcomes of these activities may be projects that are developed or incorporated into
the new government program, which will follow Agribusiness-2020. Projects (activities 7–10) will
require three to five years for preparation and implementation and may be completed by 2020.
The total cost of the proposed interventions slightly exceeds US$25 million (activity 3 requires no
additional funds, but it does require the reallocation of existing funds within the government support
program). The bulk of the money is allocated to three projects (activities 7–9) that focus on capacity
development and to risk management grants (action 9), which may be paid for by reallocating
government funds or by providing additional funds. Assuming that annual wheat production in
northern Kazakhstan is 12 million tons per year and the price of grain is US$200 per ton, the total
value of one year of production is US$2.4 billion. The funds needed to implement the activities
proposed in this report constitute only 1 percent of the total value of annual wheat production. The
proposed activities will require separate monitoring and evaluation arrangements, depending on the
organizational framework.
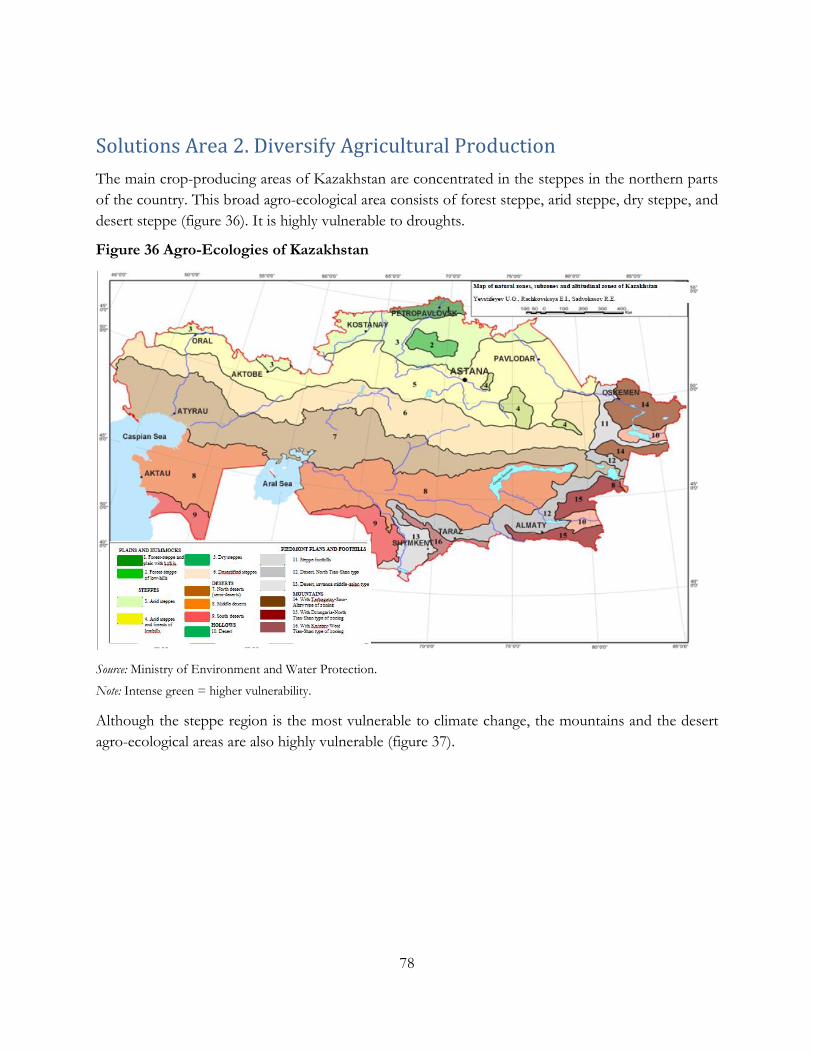
78
Solutions Area 2. Diversify Agricultural Production
The main crop-producing areas of Kazakhstan are concentrated in the steppes in the northern parts
of the country. This broad agro-ecological area consists of forest steppe, arid steppe, dry steppe, and
desert steppe (figure 36). It is highly vulnerable to droughts.
Figure 36 Agro-Ecologies of Kazakhstan
Source: Ministry of Environment and Water Protection.
Note: Intense green = higher vulnerability.
Although the steppe region is the most vulnerable to climate change, the mountains and the desert
agro-ecological areas are also highly vulnerable (figure 37).
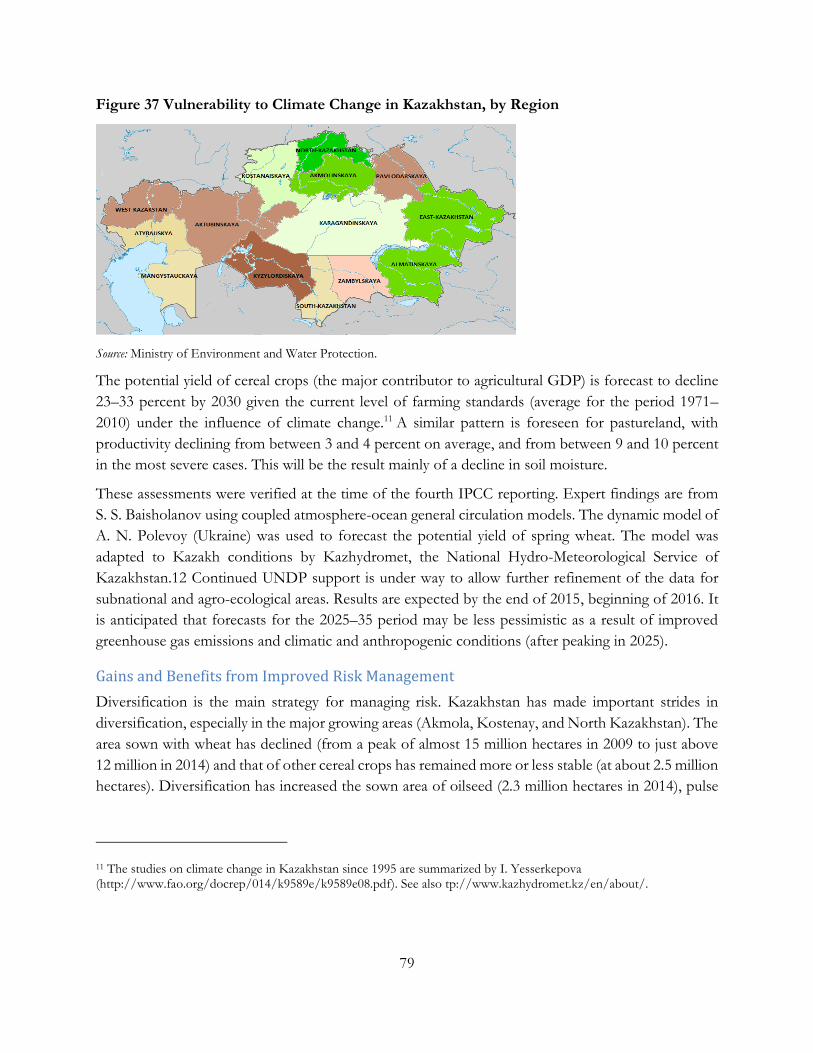
79
Figure 37 Vulnerability to Climate Change in Kazakhstan, by Region
Source: Ministry of Environment and Water Protection.
The potential yield of cereal crops (the major contributor to agricultural GDP) is forecast to decline
23–33 percent by 2030 given the current level of farming standards (average for the period 1971–
2010) under the influence of climate change.11 A similar pattern is foreseen for pastureland, with
productivity declining from between 3 and 4 percent on average, and from between 9 and 10 percent
in the most severe cases. This will be the result mainly of a decline in soil moisture.
These assessments were verified at the time of the fourth IPCC reporting. Expert findings are from
S. S. Baisholanov using coupled atmosphere-ocean general circulation models. The dynamic model of
A. N. Polevoy (Ukraine) was used to forecast the potential yield of spring wheat. The model was
adapted to Kazakh conditions by Kazhydromet, the National Hydro-Meteorological Service of
Kazakhstan.12 Continued UNDP support is under way to allow further refinement of the data for
subnational and agro-ecological areas. Results are expected by the end of 2015, beginning of 2016. It
is anticipated that forecasts for the 2025–35 period may be less pessimistic as a result of improved
greenhouse gas emissions and climatic and anthropogenic conditions (after peaking in 2025).
Gains and Benefits from Improved Risk Management
Diversification is the main strategy for managing risk. Kazakhstan has made important strides in
diversification, especially in the major growing areas (Akmola, Kostenay, and North Kazakhstan). The
area sown with wheat has declined (from a peak of almost 15 million hectares in 2009 to just above
12 million in 2014) and that of other cereal crops has remained more or less stable (at about 2.5 million
hectares). Diversification has increased the sown area of oilseed (2.3 million hectares in 2014), pulse
11 The studies on climate change in Kazakhstan since 1995 are summarized by I. Yesserkepova (http://www.fao.org/docrep/014/k9589e/k9589e08.pdf). See also tp://www.kazhydromet.kz/en/about/.
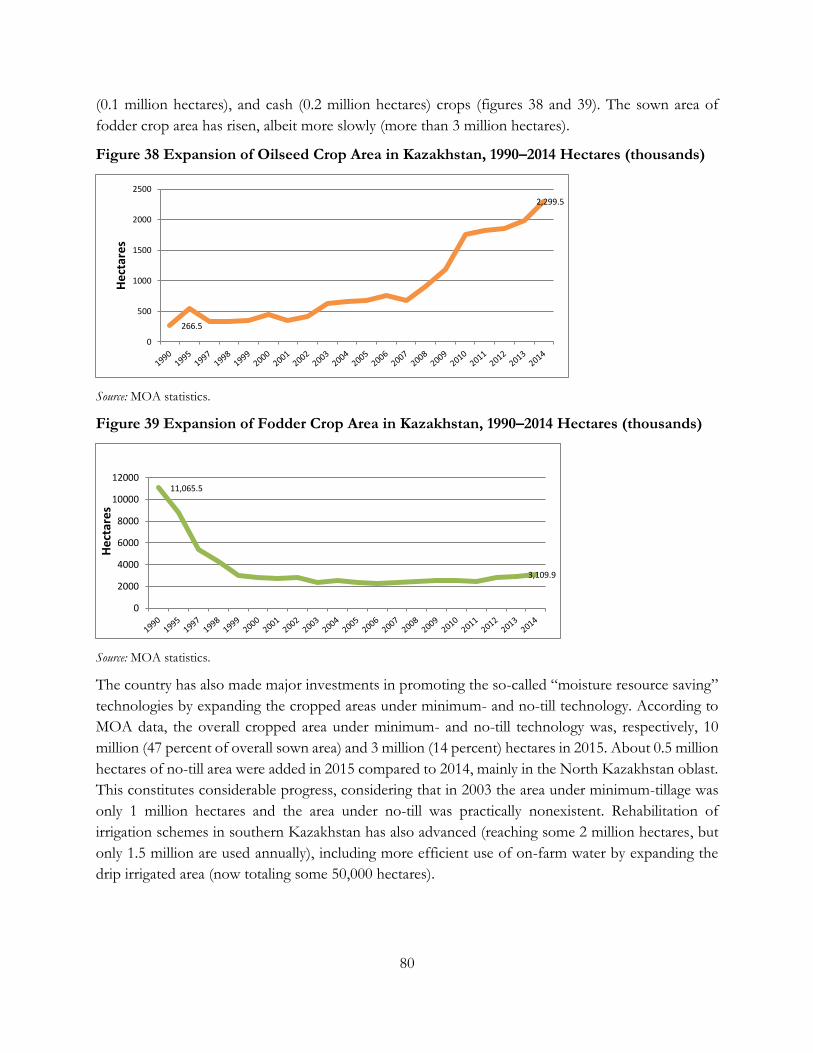
80
(0.1 million hectares), and cash (0.2 million hectares) crops (figures 38 and 39). The sown area of
fodder crop area has risen, albeit more slowly (more than 3 million hectares).
Figure 38 Expansion of Oilseed Crop Area in Kazakhstan, 1990–2014 Hectares (thousands)
Source: MOA statistics.
Figure 39 Expansion of Fodder Crop Area in Kazakhstan, 1990–2014 Hectares (thousands)
Source: MOA statistics.
The country has also made major investments in promoting the so-called “moisture resource saving”
technologies by expanding the cropped areas under minimum- and no-till technology. According to
MOA data, the overall cropped area under minimum- and no-till technology was, respectively, 10
million (47 percent of overall sown area) and 3 million (14 percent) hectares in 2015. About 0.5 million
hectares of no-till area were added in 2015 compared to 2014, mainly in the North Kazakhstan oblast.
This constitutes considerable progress, considering that in 2003 the area under minimum-tillage was
only 1 million hectares and the area under no-till was practically nonexistent. Rehabilitation of
irrigation schemes in southern Kazakhstan has also advanced (reaching some 2 million hectares, but
only 1.5 million are used annually), including more efficient use of on-farm water by expanding the
drip irrigated area (now totaling some 50,000 hectares).
266.5
2,299.5
0
500
1000
1500
2000
2500
He
ctar
es
11,065.5
3,109.9
0
2000
4000
6000
8000
10000
12000
He
ctar
es
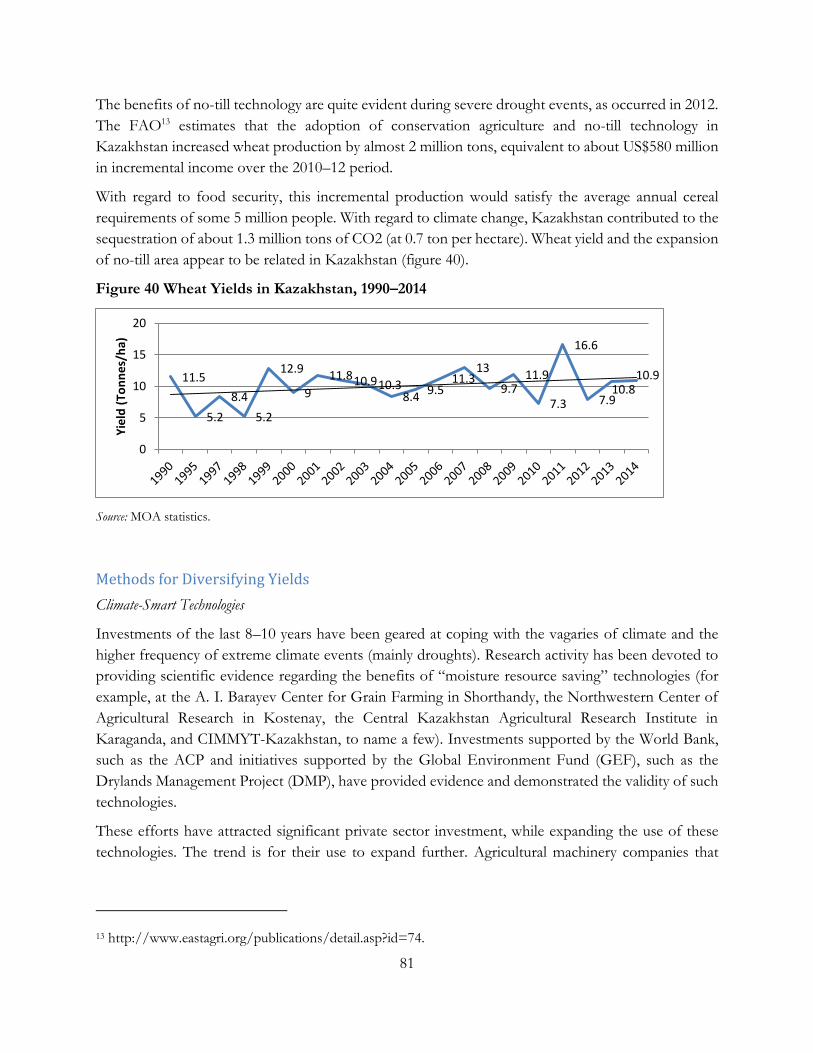
81
The benefits of no-till technology are quite evident during severe drought events, as occurred in 2012.
The FAO13 estimates that the adoption of conservation agriculture and no-till technology in
Kazakhstan increased wheat production by almost 2 million tons, equivalent to about US$580 million
in incremental income over the 2010–12 period.
With regard to food security, this incremental production would satisfy the average annual cereal
requirements of some 5 million people. With regard to climate change, Kazakhstan contributed to the
sequestration of about 1.3 million tons of CO2 (at 0.7 ton per hectare). Wheat yield and the expansion
of no-till area appear to be related in Kazakhstan (figure 40).
Figure 40 Wheat Yields in Kazakhstan, 1990–2014
Source: MOA statistics.
Methods for Diversifying Yields
Climate-Smart Technologies
Investments of the last 8–10 years have been geared at coping with the vagaries of climate and the
higher frequency of extreme climate events (mainly droughts). Research activity has been devoted to
providing scientific evidence regarding the benefits of “moisture resource saving” technologies (for
example, at the A. I. Barayev Center for Grain Farming in Shorthandy, the Northwestern Center of
Agricultural Research in Kostenay, the Central Kazakhstan Agricultural Research Institute in
Karaganda, and CIMMYT-Kazakhstan, to name a few). Investments supported by the World Bank,
such as the ACP and initiatives supported by the Global Environment Fund (GEF), such as the
Drylands Management Project (DMP), have provided evidence and demonstrated the validity of such
technologies.
These efforts have attracted significant private sector investment, while expanding the use of these
technologies. The trend is for their use to expand further. Agricultural machinery companies that
13 http://www.eastagri.org/publications/detail.asp?id=74.
11.5
5.2
8.4
5.2
12.9
9
11.810.910.38.4
9.511.3
13
9.711.9
7.3
16.6
7.910.8
10.9
0
5
10
15
20
Yie
ld (
Ton
ne
s/h
a)
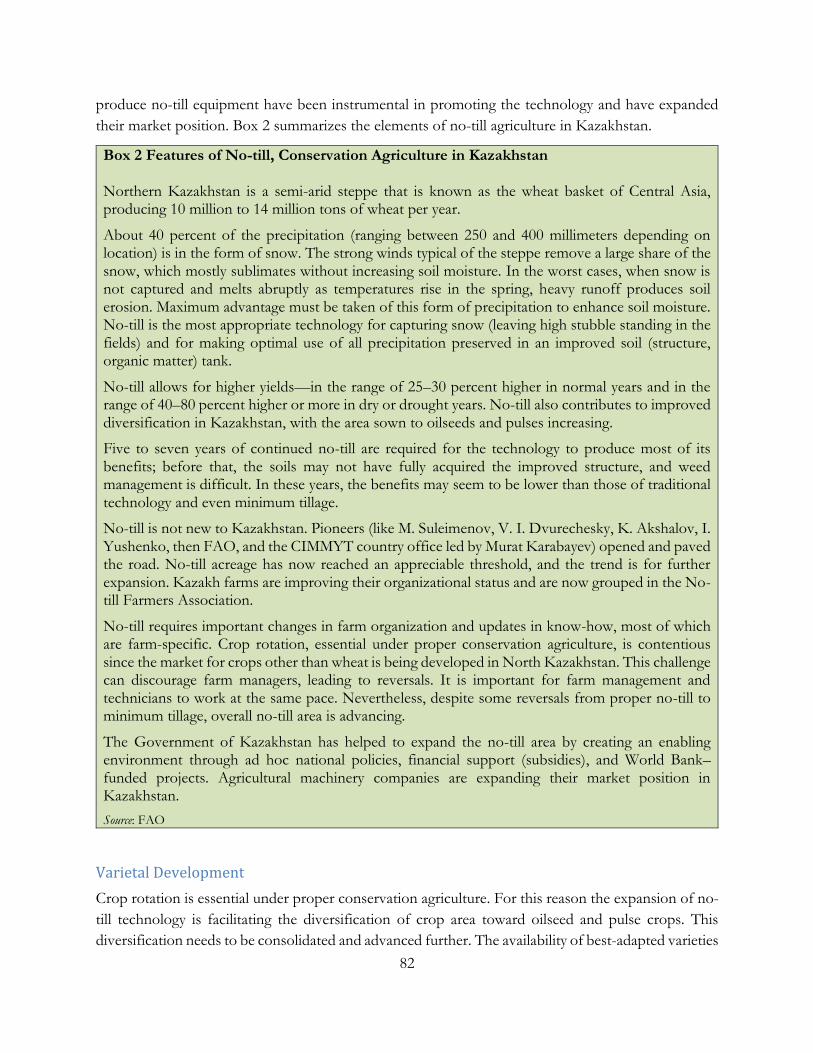
82
produce no-till equipment have been instrumental in promoting the technology and have expanded
their market position. Box 2 summarizes the elements of no-till agriculture in Kazakhstan.
Box 2 Features of No-till, Conservation Agriculture in Kazakhstan Northern Kazakhstan is a semi-arid steppe that is known as the wheat basket of Central Asia, producing 10 million to 14 million tons of wheat per year.
About 40 percent of the precipitation (ranging between 250 and 400 millimeters depending on location) is in the form of snow. The strong winds typical of the steppe remove a large share of the snow, which mostly sublimates without increasing soil moisture. In the worst cases, when snow is not captured and melts abruptly as temperatures rise in the spring, heavy runoff produces soil erosion. Maximum advantage must be taken of this form of precipitation to enhance soil moisture. No-till is the most appropriate technology for capturing snow (leaving high stubble standing in the fields) and for making optimal use of all precipitation preserved in an improved soil (structure, organic matter) tank.
No-till allows for higher yields—in the range of 25–30 percent higher in normal years and in the range of 40–80 percent higher or more in dry or drought years. No-till also contributes to improved diversification in Kazakhstan, with the area sown to oilseeds and pulses increasing.
Five to seven years of continued no-till are required for the technology to produce most of its benefits; before that, the soils may not have fully acquired the improved structure, and weed management is difficult. In these years, the benefits may seem to be lower than those of traditional technology and even minimum tillage.
No-till is not new to Kazakhstan. Pioneers (like M. Suleimenov, V. I. Dvurechesky, K. Akshalov, I. Yushenko, then FAO, and the CIMMYT country office led by Murat Karabayev) opened and paved the road. No-till acreage has now reached an appreciable threshold, and the trend is for further expansion. Kazakh farms are improving their organizational status and are now grouped in the No-till Farmers Association.
No-till requires important changes in farm organization and updates in know-how, most of which are farm-specific. Crop rotation, essential under proper conservation agriculture, is contentious since the market for crops other than wheat is being developed in North Kazakhstan. This challenge can discourage farm managers, leading to reversals. It is important for farm management and technicians to work at the same pace. Nevertheless, despite some reversals from proper no-till to minimum tillage, overall no-till area is advancing.
The Government of Kazakhstan has helped to expand the no-till area by creating an enabling environment through ad hoc national policies, financial support (subsidies), and World Bank–funded projects. Agricultural machinery companies are expanding their market position in Kazakhstan.
Source: FAO
Varietal Development
Crop rotation is essential under proper conservation agriculture. For this reason the expansion of no-
till technology is facilitating the diversification of crop area toward oilseed and pulse crops. This
diversification needs to be consolidated and advanced further. The availability of best-adapted varieties
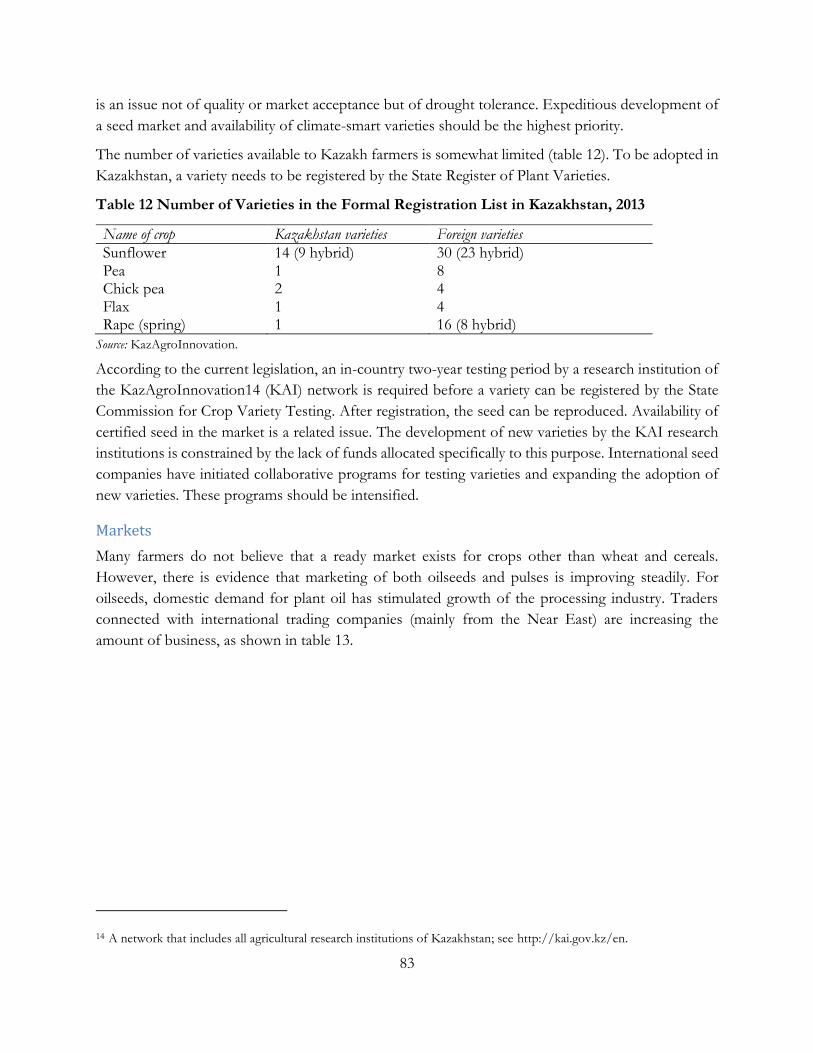
83
is an issue not of quality or market acceptance but of drought tolerance. Expeditious development of
a seed market and availability of climate-smart varieties should be the highest priority.
The number of varieties available to Kazakh farmers is somewhat limited (table 12). To be adopted in
Kazakhstan, a variety needs to be registered by the State Register of Plant Varieties.
Table 12 Number of Varieties in the Formal Registration List in Kazakhstan, 2013
Name of crop Kazakhstan varieties Foreign varieties
Sunflower 14 (9 hybrid) 30 (23 hybrid) Pea 1 8 Chick pea 2 4 Flax 1 4 Rape (spring) 1 16 (8 hybrid)
Source: KazAgroInnovation.
According to the current legislation, an in-country two-year testing period by a research institution of
the KazAgroInnovation14 (KAI) network is required before a variety can be registered by the State
Commission for Crop Variety Testing. After registration, the seed can be reproduced. Availability of
certified seed in the market is a related issue. The development of new varieties by the KAI research
institutions is constrained by the lack of funds allocated specifically to this purpose. International seed
companies have initiated collaborative programs for testing varieties and expanding the adoption of
new varieties. These programs should be intensified.
Markets
Many farmers do not believe that a ready market exists for crops other than wheat and cereals.
However, there is evidence that marketing of both oilseeds and pulses is improving steadily. For
oilseeds, domestic demand for plant oil has stimulated growth of the processing industry. Traders
connected with international trading companies (mainly from the Near East) are increasing the
amount of business, as shown in table 13.
14 A network that includes all agricultural research institutions of Kazakhstan; see http://kai.gov.kz/en.
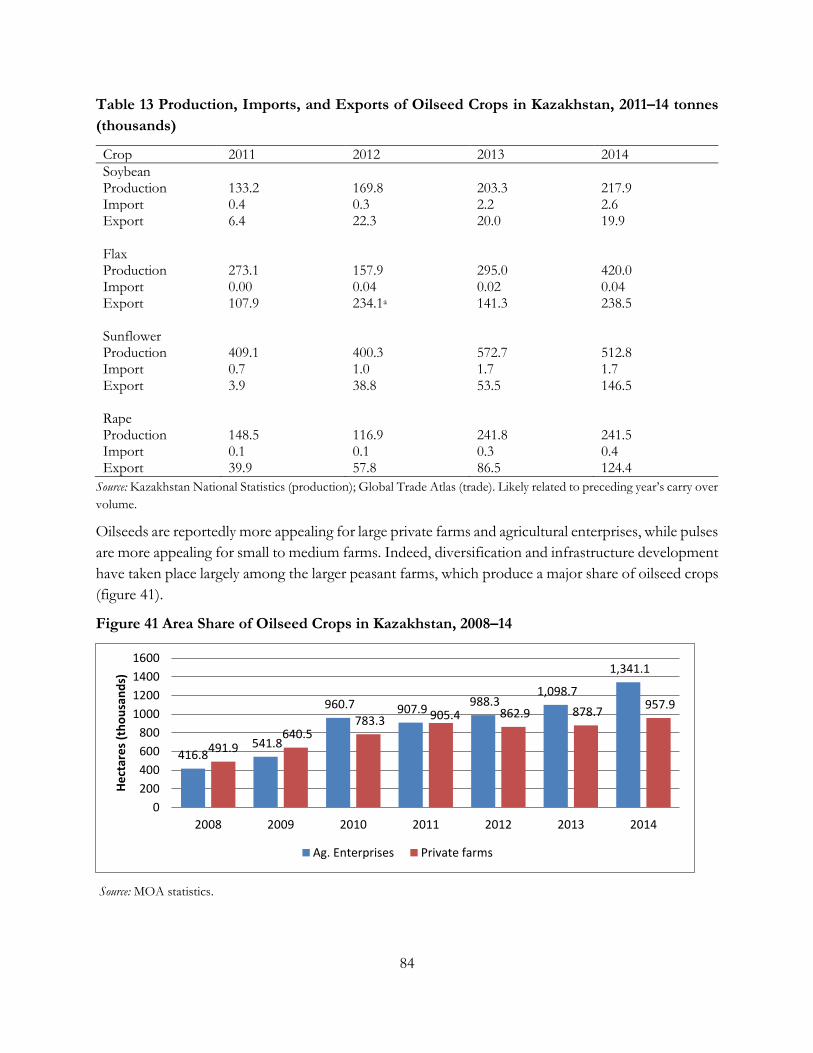
84
Table 13 Production, Imports, and Exports of Oilseed Crops in Kazakhstan, 2011–14 tonnes
(thousands)
Crop 2011 2012 2013 2014
Soybean Production 133.2 169.8 203.3 217.9 Import 0.4 0.3 2.2 2.6 Export 6.4 22.3 20.0 19.9 Flax Production 273.1 157.9 295.0 420.0 Import 0.00 0.04 0.02 0.04 Export 107.9 234.1a 141.3 238.5 Sunflower Production 409.1 400.3 572.7 512.8 Import 0.7 1.0 1.7 1.7 Export 3.9 38.8 53.5 146.5 Rape Production 148.5 116.9 241.8 241.5 Import 0.1 0.1 0.3 0.4 Export 39.9 57.8 86.5 124.4
Source: Kazakhstan National Statistics (production); Global Trade Atlas (trade). Likely related to preceding year’s carry over
volume.
Oilseeds are reportedly more appealing for large private farms and agricultural enterprises, while pulses
are more appealing for small to medium farms. Indeed, diversification and infrastructure development
have taken place largely among the larger peasant farms, which produce a major share of oilseed crops
(figure 41).
Figure 41 Area Share of Oilseed Crops in Kazakhstan, 2008–14
Source: MOA statistics.
416.8541.8
960.7 907.9 988.3
1,098.7
1,341.1
491.9640.5
783.3 905.4 862.9 878.7 957.9
0
200
400
600
800
1000
1200
1400
1600
2008 2009 2010 2011 2012 2013 2014
He
ctar
es
(th
ou
san
ds)
Ag. Enterprises Private farms
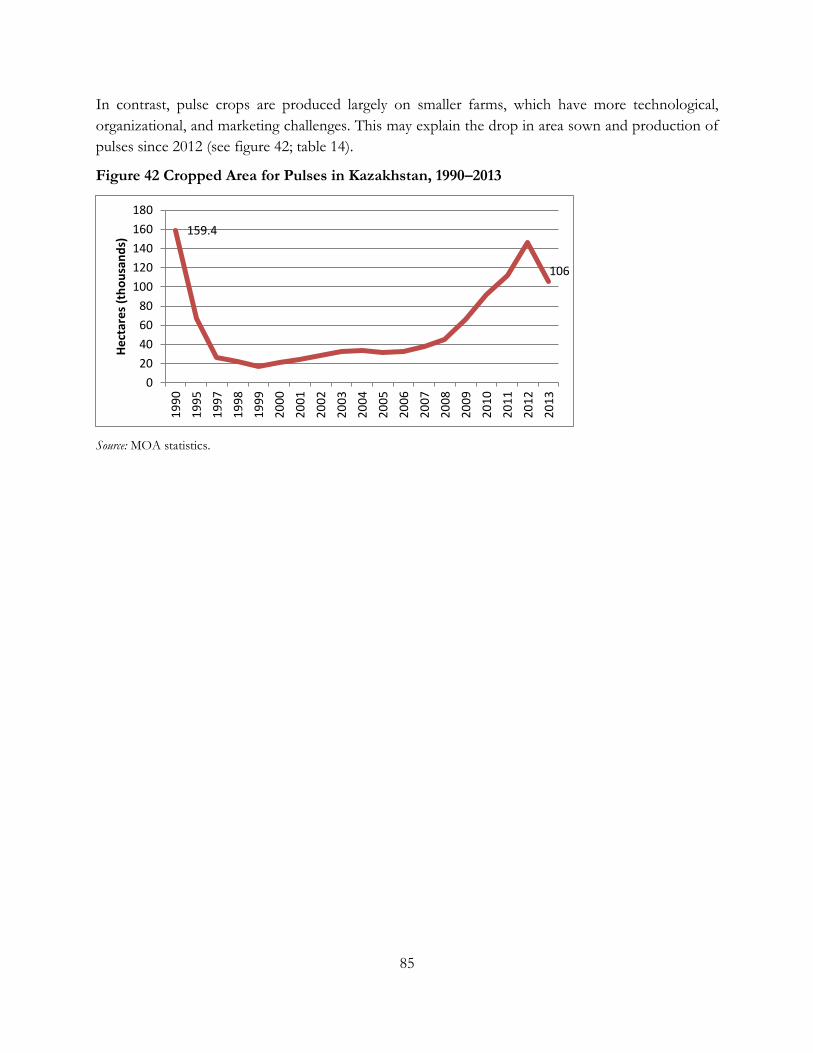
85
In contrast, pulse crops are produced largely on smaller farms, which have more technological,
organizational, and marketing challenges. This may explain the drop in area sown and production of
pulses since 2012 (see figure 42; table 14).
Figure 42 Cropped Area for Pulses in Kazakhstan, 1990–2013
Source: MOA statistics.
159.4
106
0
20
40
60
80
100
120
140
160
180
19
90
19
95
19
97
19
98
19
99
20
00
20
01
20
02
20
03
20
04
20
05
20
06
20
07
20
08
20
09
20
10
20
11
20
12
20
13
He
ctar
es
(th
ou
san
ds)
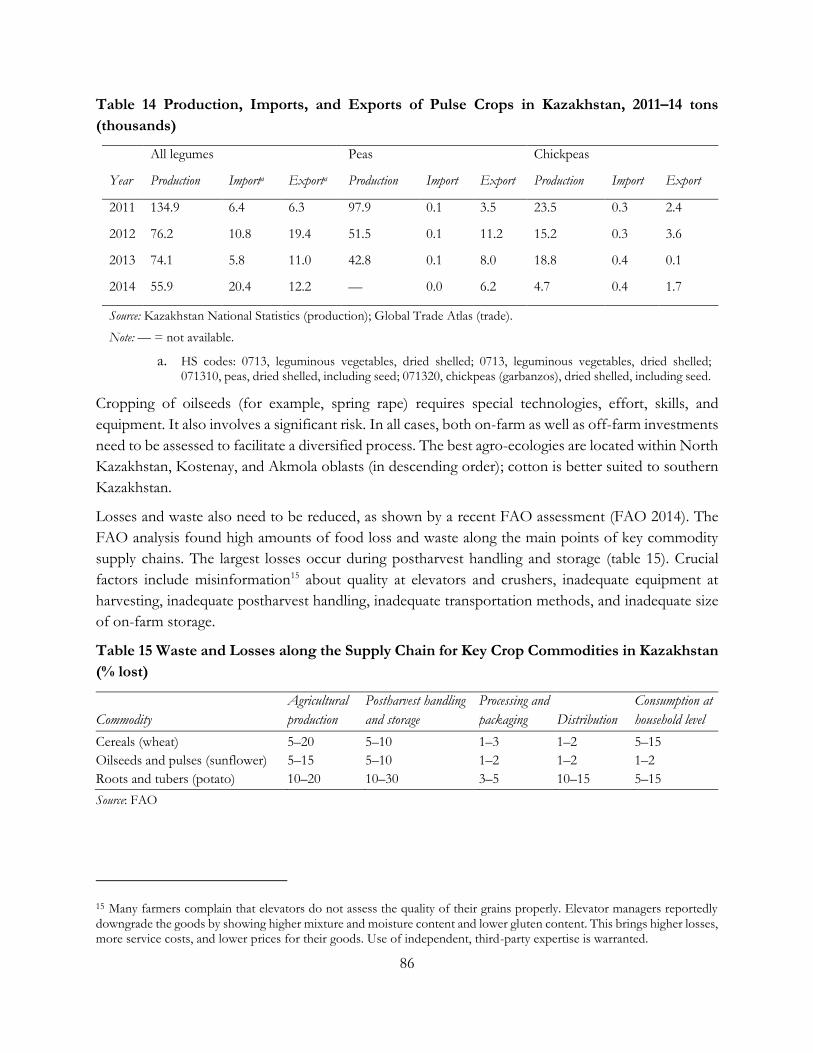
86
Table 14 Production, Imports, and Exports of Pulse Crops in Kazakhstan, 2011–14 tons
(thousands)
Year
All legumes Peas Chickpeas
Production Importa Exporta Production Import Export Production Import Export
2011 134.9 6.4 6.3 97.9 0.1 3.5 23.5 0.3 2.4
2012 76.2 10.8 19.4 51.5 0.1 11.2 15.2 0.3 3.6
2013 74.1 5.8 11.0 42.8 0.1 8.0 18.8 0.4 0.1
2014 55.9 20.4 12.2 — 0.0 6.2 4.7 0.4 1.7
Source: Kazakhstan National Statistics (production); Global Trade Atlas (trade).
Note: — = not available.
a. HS codes: 0713, leguminous vegetables, dried shelled; 0713, leguminous vegetables, dried shelled; 071310, peas, dried shelled, including seed; 071320, chickpeas (garbanzos), dried shelled, including seed.
Cropping of oilseeds (for example, spring rape) requires special technologies, effort, skills, and
equipment. It also involves a significant risk. In all cases, both on-farm as well as off-farm investments
need to be assessed to facilitate a diversified process. The best agro-ecologies are located within North
Kazakhstan, Kostenay, and Akmola oblasts (in descending order); cotton is better suited to southern
Kazakhstan.
Losses and waste also need to be reduced, as shown by a recent FAO assessment (FAO 2014). The
FAO analysis found high amounts of food loss and waste along the main points of key commodity
supply chains. The largest losses occur during postharvest handling and storage (table 15). Crucial
factors include misinformation15 about quality at elevators and crushers, inadequate equipment at
harvesting, inadequate postharvest handling, inadequate transportation methods, and inadequate size
of on-farm storage.
Table 15 Waste and Losses along the Supply Chain for Key Crop Commodities in Kazakhstan
(% lost)
Commodity
Agricultural
production
Postharvest handling
and storage
Processing and
packaging Distribution
Consumption at
household level
Cereals (wheat) 5–20 5–10 1–3 1–2 5–15
Oilseeds and pulses (sunflower) 5–15 5–10 1–2 1–2 1–2
Roots and tubers (potato) 10–20 10–30 3–5 10–15 5–15
Source: FAO
15 Many farmers complain that elevators do not assess the quality of their grains properly. Elevator managers reportedly downgrade the goods by showing higher mixture and moisture content and lower gluten content. This brings higher losses, more service costs, and lower prices for their goods. Use of independent, third-party expertise is warranted.
87
Fodder and Feed
Expanding the area sown and increasing the production of hay as well as fodder and forage would
enhance the development of Kazakhstan’s livestock sector. Fodder sown area is expanding at a good
pace. Together with other forage crops, this means that some 7.2 million tons of feed units are being
produced. An estimated 7.4 million tons of feed units from feed grains are available. Expansion of
extensive production systems appears to be a convenient technical option for increasing the output of
meat (sheep, beef, horse). However, the potential risk is that supply is not aligned with the growing
needs of a sector that is gradually intensifying its production systems (both for meat and for dairy
products). Further expansion of intensive meat production systems is viable only if the supply of low-
cost grains from the crop sector expands. The increased supply of feed grain will have to compete
with the increased demand for food grains. Appropriate mechanisms and arrangements, including at
the regional level, need to be forged in order to facilitate and sustain the supply-demand equilibrium.
In Kazakhstan, the feed industry is a weak segment of the supply chain, requiring targeted
strengthening.
Pasture cropping is one way to increase grain output. A no-till technique originally developed in
Australia (Permaculture Research Institute 2012), pasture cropping consists of sowing annual cereal
crops into living perennial pastures and growing these crops symbiotically with existing pastures. The
original concept of sowing crops into a dormant stand of summer-growing native grass, like red grass
(Bothriochloa macra), is an inexpensive method of sowing oats for stock feed. Over the years,
advances were made, and cereal crops were sown into winter-growing native perennial grass. The
results were good, with oat crops, for example, yielding more than 3 tons per hectare (figure 43).
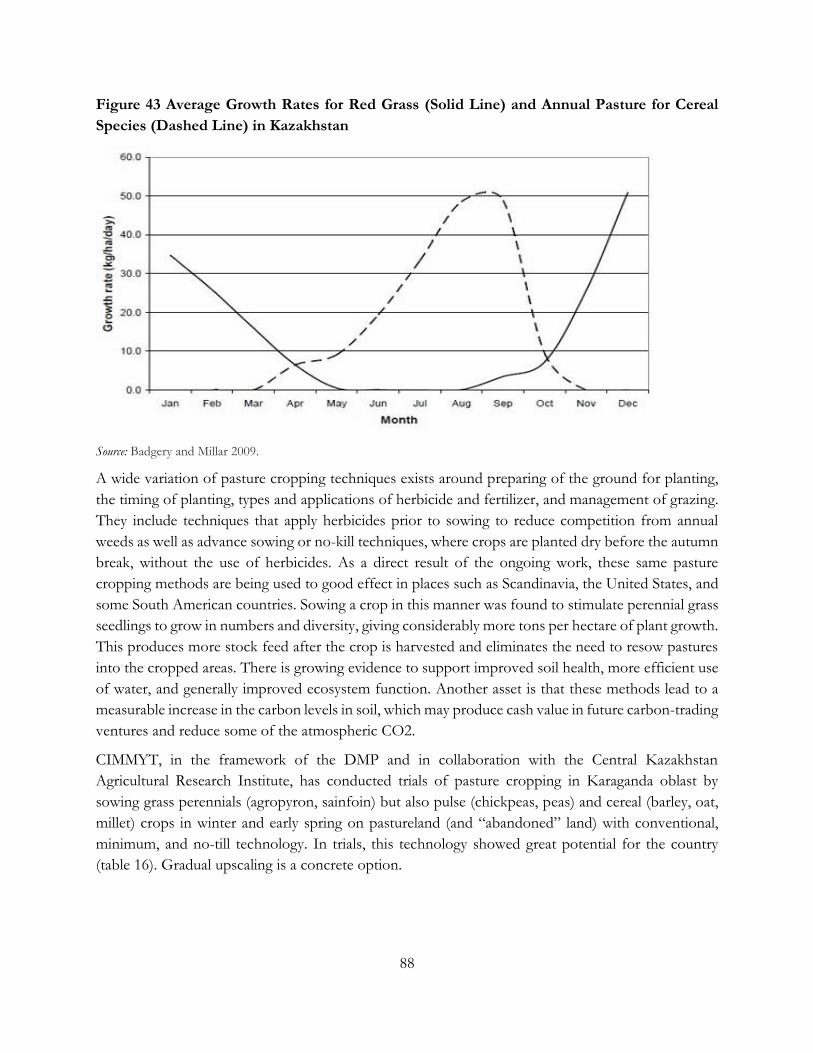
88
Figure 43 Average Growth Rates for Red Grass (Solid Line) and Annual Pasture for Cereal
Species (Dashed Line) in Kazakhstan
Source: Badgery and Millar 2009.
A wide variation of pasture cropping techniques exists around preparing of the ground for planting,
the timing of planting, types and applications of herbicide and fertilizer, and management of grazing.
They include techniques that apply herbicides prior to sowing to reduce competition from annual
weeds as well as advance sowing or no-kill techniques, where crops are planted dry before the autumn
break, without the use of herbicides. As a direct result of the ongoing work, these same pasture
cropping methods are being used to good effect in places such as Scandinavia, the United States, and
some South American countries. Sowing a crop in this manner was found to stimulate perennial grass
seedlings to grow in numbers and diversity, giving considerably more tons per hectare of plant growth.
This produces more stock feed after the crop is harvested and eliminates the need to resow pastures
into the cropped areas. There is growing evidence to support improved soil health, more efficient use
of water, and generally improved ecosystem function. Another asset is that these methods lead to a
measurable increase in the carbon levels in soil, which may produce cash value in future carbon-trading
ventures and reduce some of the atmospheric CO2.
CIMMYT, in the framework of the DMP and in collaboration with the Central Kazakhstan
Agricultural Research Institute, has conducted trials of pasture cropping in Karaganda oblast by
sowing grass perennials (agropyron, sainfoin) but also pulse (chickpeas, peas) and cereal (barley, oat,
millet) crops in winter and early spring on pastureland (and “abandoned” land) with conventional,
minimum, and no-till technology. In trials, this technology showed great potential for the country
(table 16). Gradual upscaling is a concrete option.
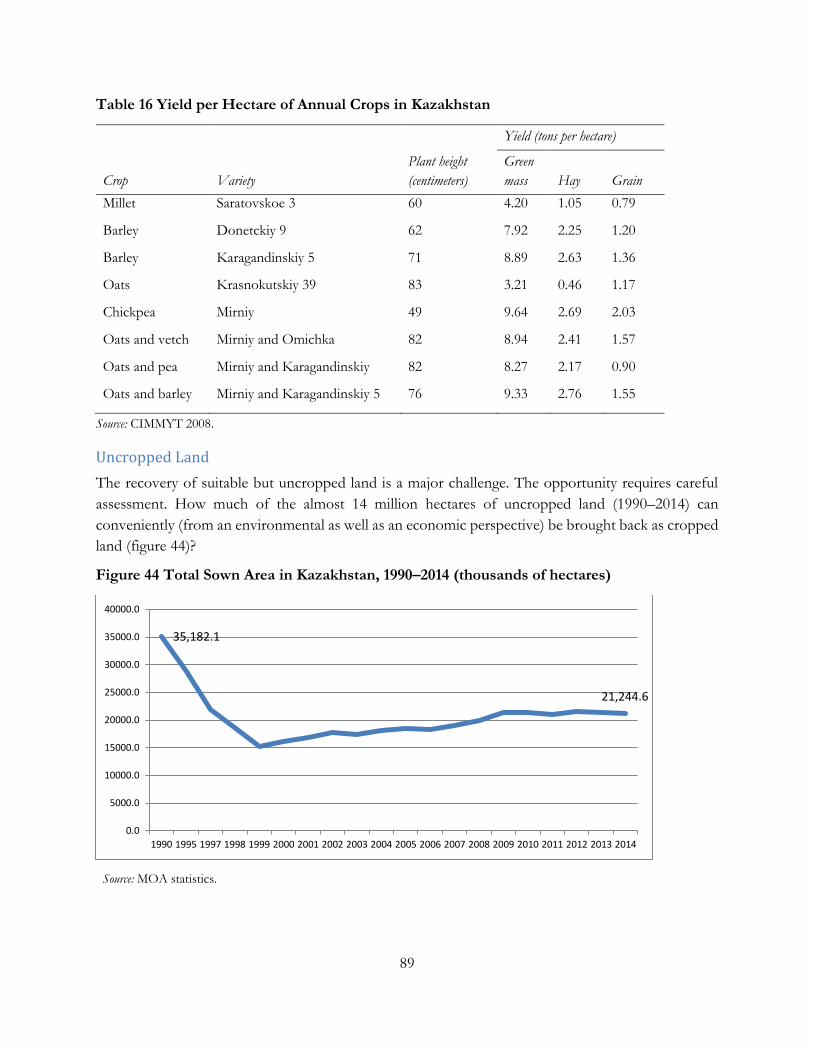
89
Table 16 Yield per Hectare of Annual Crops in Kazakhstan
Crop Variety
Plant height
(centimeters)
Yield (tons per hectare)
Green
mass Hay Grain
Millet Saratovskoe 3 60 4.20 1.05 0.79
Barley Donetckiy 9 62 7.92 2.25 1.20
Barley Karagandinskiy 5 71 8.89 2.63 1.36
Oats Krasnokutskiy 39 83 3.21 0.46 1.17
Chickpea Mirniy 49 9.64 2.69 2.03
Oats and vetch Mirniy and Omichka 82 8.94 2.41 1.57
Oats and pea Mirniy and Karagandinskiy 82 8.27 2.17 0.90
Oats and barley Mirniy and Karagandinskiy 5 76 9.33 2.76 1.55
Source: CIMMYT 2008.
Uncropped Land
The recovery of suitable but uncropped land is a major challenge. The opportunity requires careful
assessment. How much of the almost 14 million hectares of uncropped land (1990–2014) can
conveniently (from an environmental as well as an economic perspective) be brought back as cropped
land (figure 44)?
Figure 44 Total Sown Area in Kazakhstan, 1990–2014 (thousands of hectares)
Source: MOA statistics.
35,182.1
21,244.6
0.0
5000.0
10000.0
15000.0
20000.0
25000.0
30000.0
35000.0
40000.0
1990 1995 1997 1998 1999 2000 2001 2002 2003 2004 2005 2006 2007 2008 2009 2010 2011 2012 2013 2014
90
Activities such as the Drylands Management Project have demonstrated the opportunities.16
Interviews with producers confirm that the area sown with perennial and annual grasses has expanded
in recent years, increasing yield and dramatically lowering production costs.
Main Strategy and Policy Documents
Since 2009 the MOA has conducted several assessments and drafted several master plans. The FAO
also has reviewed the livestock sector, in coordination with the Analytical Center of Economic Policy
for the Agricultural Sector.17 These analytical exercises culminated in 2013 with approval of the MOA’s
Agribusiness-2020, a sectorial development program for 2013–20.
As described in part I of this report, the program aims to improve the competitiveness of the country’s
agriculture sector in the global market. It is substantially in line with the recommendation of the
Organization for Economic Cooperation and Development (OECD) to privilege public policy
support for agriculture, taking account of the rapidly growing demand for food, market fluctuations,
and volatility of global markets, and to move from production-oriented state subsidies for investments
to efforts to achieve improved performance and rational use of resources.
In 2014, the MOA issued a roadmap for implementation, including a subprogram of subsidies. Under
this roadmap, the measures of state support (subsidies) will be adjusted to reflect the specialization of
regions and agricultural subsidies will be phased out. A phased approach starting in 2016 is planned,
with full implementation by 2020.
Overview of the Risk Management Framework
The total expenditure for Agribusiness-2020 during 2013–20 is T 3,122.2 billion with an average of
about T 400 billion per year, equal to US$2.22 billion per year (figure 45).18
16 The DMP demonstrated the validity of sustainable land use in the marginal dryland ecosystem of a pilot area in the
Shetsky rayon (a county) in the southern part of the Karaganda oblast (province). As a result of project measures, a total
of 35,179 hectares were revegetated with perennials (mainly Agropyron) that were used mainly to produce hay for livestock.
Agropyron is a significant new technology that has resulted in an increase in the supply of animal fodder, a reduction in
grazing in areas close to villages, a reduction in land degradation, and an increase in the use of alternative sources of energy
(solar) to provide water in remote areas
17 See http://www.fao.org/investment/tci-publications/country-highlights/highlights-of-livestock-sub-sectors-in-kazakhstan/en/.
18 About T 300 billion will be allocated to support solvency, reduce credit load, and minimize the risk of bankruptcy for
overindebted agribusinesses through restructuring, refinancing, and financing to repay existing debts.
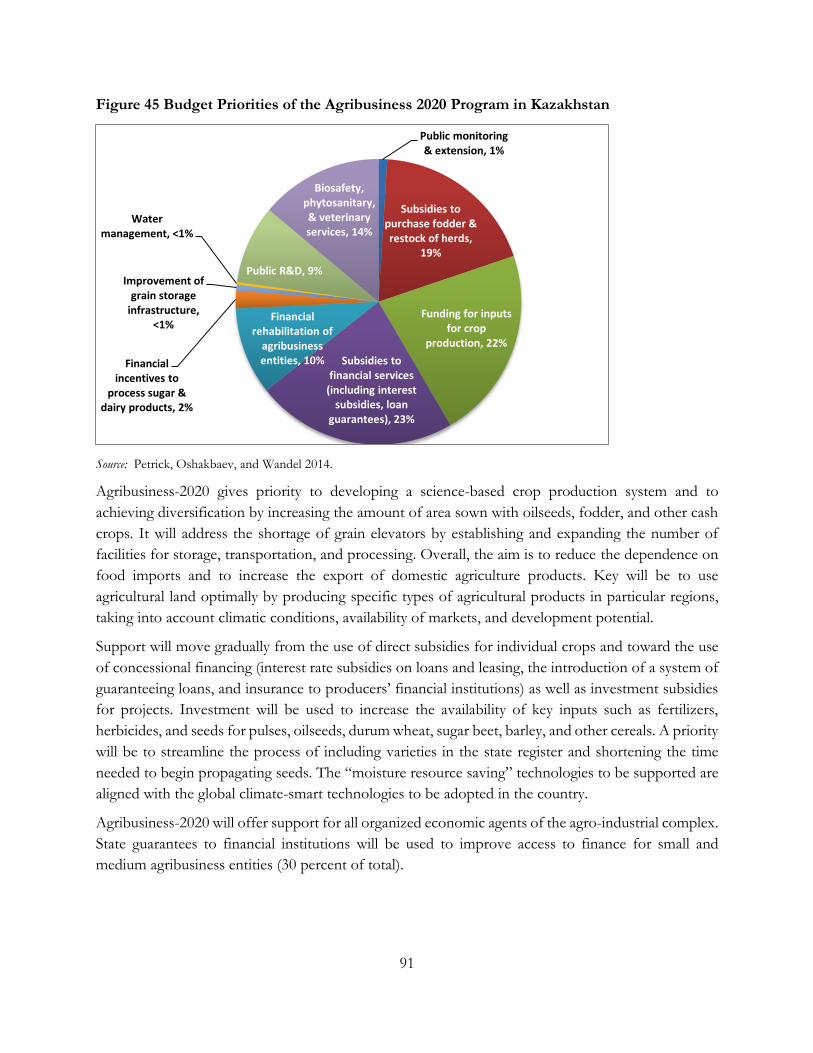
91
Figure 45 Budget Priorities of the Agribusiness 2020 Program in Kazakhstan
Source: Petrick, Oshakbaev, and Wandel 2014.
Agribusiness-2020 gives priority to developing a science-based crop production system and to
achieving diversification by increasing the amount of area sown with oilseeds, fodder, and other cash
crops. It will address the shortage of grain elevators by establishing and expanding the number of
facilities for storage, transportation, and processing. Overall, the aim is to reduce the dependence on
food imports and to increase the export of domestic agriculture products. Key will be to use
agricultural land optimally by producing specific types of agricultural products in particular regions,
taking into account climatic conditions, availability of markets, and development potential.
Support will move gradually from the use of direct subsidies for individual crops and toward the use
of concessional financing (interest rate subsidies on loans and leasing, the introduction of a system of
guaranteeing loans, and insurance to producers’ financial institutions) as well as investment subsidies
for projects. Investment will be used to increase the availability of key inputs such as fertilizers,
herbicides, and seeds for pulses, oilseeds, durum wheat, sugar beet, barley, and other cereals. A priority
will be to streamline the process of including varieties in the state register and shortening the time
needed to begin propagating seeds. The “moisture resource saving” technologies to be supported are
aligned with the global climate-smart technologies to be adopted in the country.
Agribusiness-2020 will offer support for all organized economic agents of the agro-industrial complex.
State guarantees to financial institutions will be used to improve access to finance for small and
medium agribusiness entities (30 percent of total).
Public monitoring & extension, 1%
Subsidies to purchase fodder & restock of herds,
19%
Funding for inputs for crop
production, 22%
Subsidies to financial services
(including interest subsidies, loan
guarantees), 23%
Financial rehabilitation of
agribusiness entities, 10%Financial
incentives to process sugar &
dairy products, 2%
Improvement of grain storage
infrastructure, <1%
Water management, <1%
Public R&D, 9%
Biosafety, phytosanitary, & veterinary services, 14%
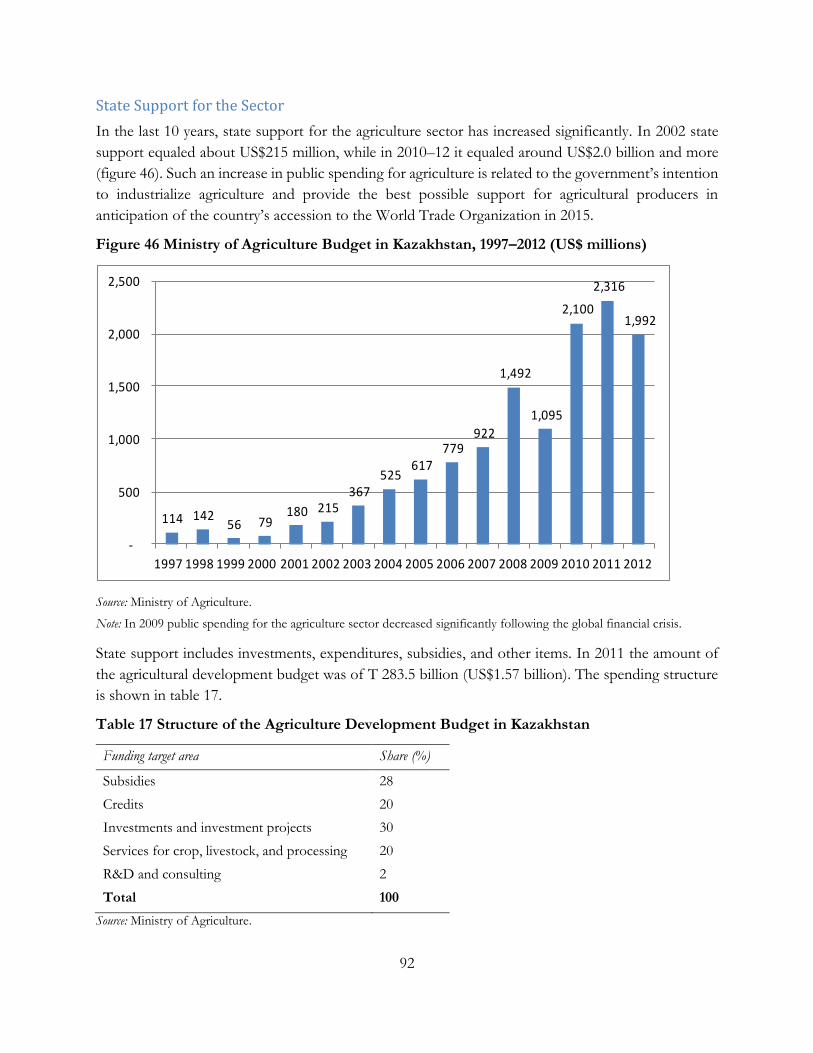
92
State Support for the Sector
In the last 10 years, state support for the agriculture sector has increased significantly. In 2002 state
support equaled about US$215 million, while in 2010–12 it equaled around US$2.0 billion and more
(figure 46). Such an increase in public spending for agriculture is related to the government’s intention
to industrialize agriculture and provide the best possible support for agricultural producers in
anticipation of the country’s accession to the World Trade Organization in 2015.
Figure 46 Ministry of Agriculture Budget in Kazakhstan, 1997–2012 (US$ millions)
Source: Ministry of Agriculture.
Note: In 2009 public spending for the agriculture sector decreased significantly following the global financial crisis.
State support includes investments, expenditures, subsidies, and other items. In 2011 the amount of
the agricultural development budget was of T 283.5 billion (US$1.57 billion). The spending structure
is shown in table 17.
Table 17 Structure of the Agriculture Development Budget in Kazakhstan
Funding target area Share (%)
Subsidies 28
Credits 20
Investments and investment projects 30
Services for crop, livestock, and processing 20
R&D and consulting 2
Total 100
Source: Ministry of Agriculture.
114 142 56 79
180 215 367
525 617
779 922
1,492
1,095
2,100
2,316
1,992
-
500
1,000
1,500
2,000
2,500
1997 1998 1999 2000 2001 2002 2003 2004 2005 2006 2007 2008 2009 2010 2011 2012
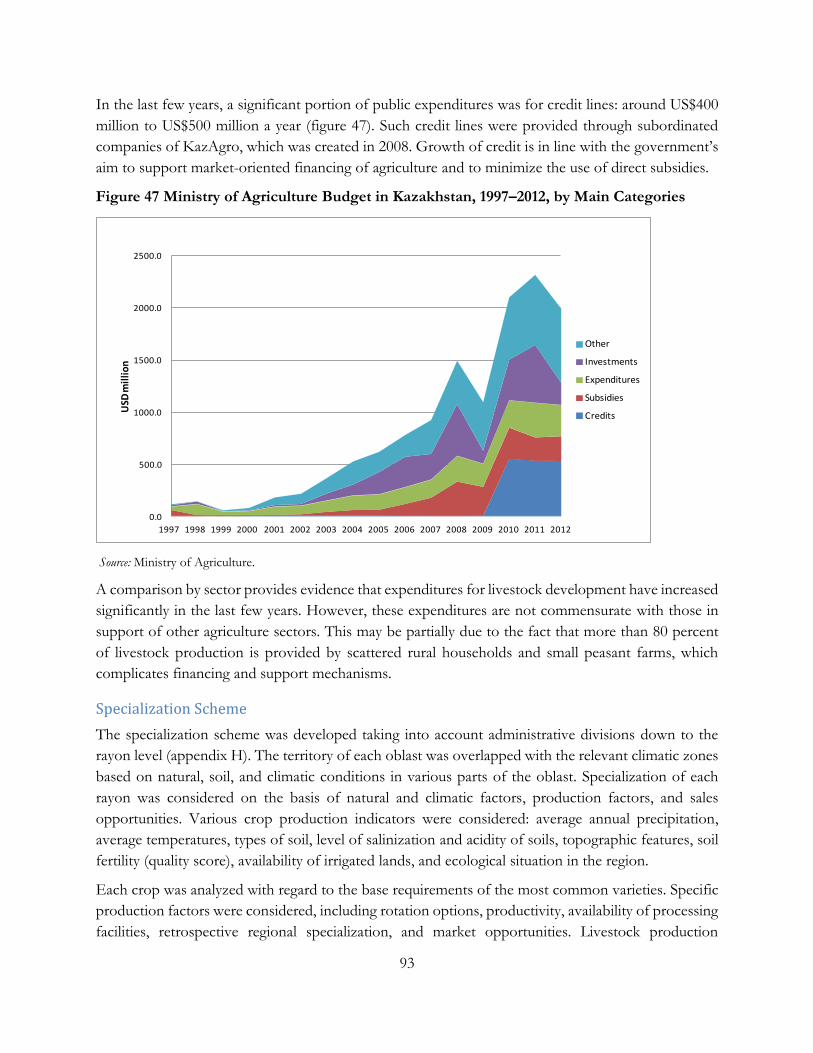
93
In the last few years, a significant portion of public expenditures was for credit lines: around US$400
million to US$500 million a year (figure 47). Such credit lines were provided through subordinated
companies of KazAgro, which was created in 2008. Growth of credit is in line with the government’s
aim to support market-oriented financing of agriculture and to minimize the use of direct subsidies.
Figure 47 Ministry of Agriculture Budget in Kazakhstan, 1997–2012, by Main Categories
Source: Ministry of Agriculture.
A comparison by sector provides evidence that expenditures for livestock development have increased
significantly in the last few years. However, these expenditures are not commensurate with those in
support of other agriculture sectors. This may be partially due to the fact that more than 80 percent
of livestock production is provided by scattered rural households and small peasant farms, which
complicates financing and support mechanisms.
Specialization Scheme
The specialization scheme was developed taking into account administrative divisions down to the
rayon level (appendix H). The territory of each oblast was overlapped with the relevant climatic zones
based on natural, soil, and climatic conditions in various parts of the oblast. Specialization of each
rayon was considered on the basis of natural and climatic factors, production factors, and sales
opportunities. Various crop production indicators were considered: average annual precipitation,
average temperatures, types of soil, level of salinization and acidity of soils, topographic features, soil
fertility (quality score), availability of irrigated lands, and ecological situation in the region.
Each crop was analyzed with regard to the base requirements of the most common varieties. Specific
production factors were considered, including rotation options, productivity, availability of processing
facilities, retrospective regional specialization, and market opportunities. Livestock production
0.0
500.0
1000.0
1500.0
2000.0
2500.0
1997 1998 1999 2000 2001 2002 2003 2004 2005 2006 2007 2008 2009 2010 2011 2012
USD
mil
lio
n
Other
Investments
Expenditures
Subsidies
Credits
94
systems were assessed based on the availability of pastures with suitable grasses, availability of surface
water and open water sources, availability of groundwater with acceptable mineralization, possibility
of growing fodder crops, and ecological situation in the region.
For livestock, the following production factors were considered: area under fodder croрs, hay
collection, including from cropland, availability of feedlots, and retrospective specialization of the
region and market opportunities. Information was obtained from the following state agencies: the
Institute of Geography, the Statistics Agency, and Kazhydromet. In addition, agro-climate data for
the Soviet period were used for reference.
Potential Interventions
In general terms, the diversification options to be adopted in northern Kazakhstan can be grouped
into the following clusters of programs:
Technology diversification through the use of climate-smart agriculture, including further upscaling of conservation agriculture and no-till technologies, adoption of precision agriculture, targeted development of drought-tolerant varieties, and reduction of output losses
Land use diversification through the reclamation of uncropped or underutilized land and the use of conservation agriculture or no-till technology on it
Crop diversification through the planting of higher cash-earning field crops (oilseeds and pulses), fodder and feed crops, and feed grains and the use of innovative technologies (pasture cropping)
A major capacity development program.
Table 18 provides an overview of identified risks and proposed areas for intervention.
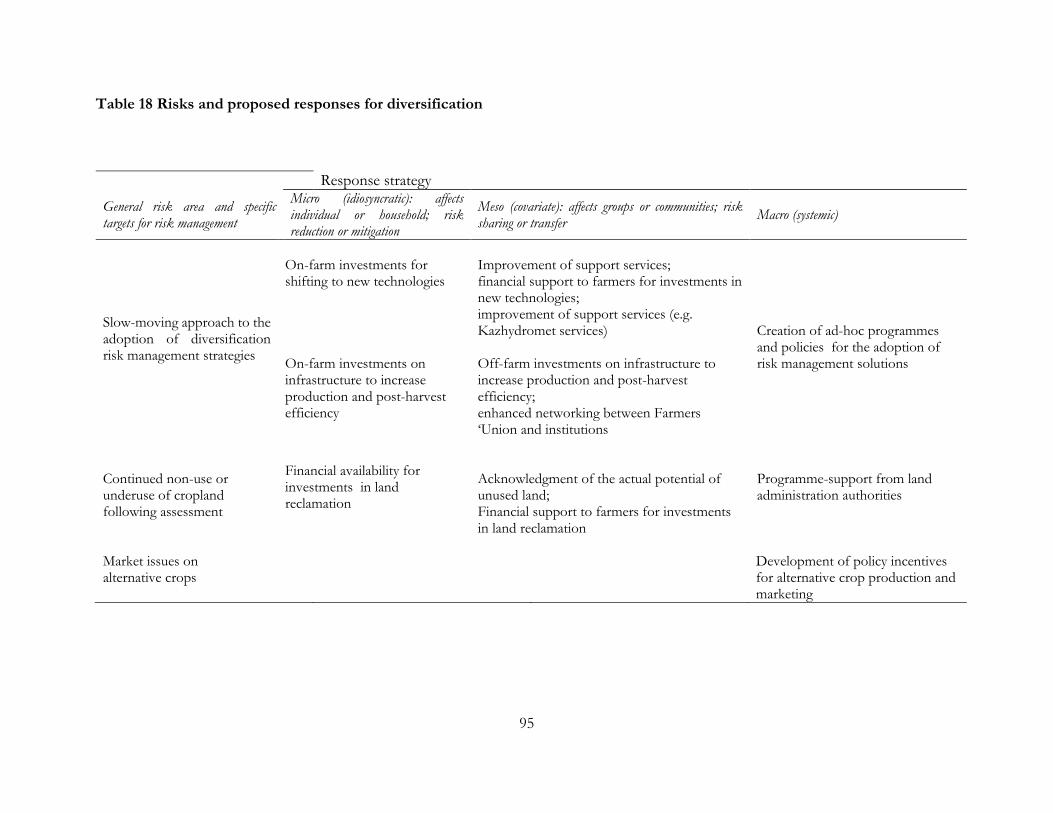
95
Table 18 Risks and proposed responses for diversification
Response strategy
General risk area and specific targets for risk management
Micro (idiosyncratic): affects individual or household; risk reduction or mitigation
Meso (covariate): affects groups or communities; risk sharing or transfer
Macro (systemic)
Slow-moving approach to the adoption of diversification risk management strategies
On-farm investments for shifting to new technologies On-farm investments on infrastructure to increase production and post-harvest efficiency
Improvement of support services; financial support to farmers for investments in new technologies; improvement of support services (e.g. Kazhydromet services) Off-farm investments on infrastructure to increase production and post-harvest efficiency; enhanced networking between Farmers ‘Union and institutions
Creation of ad-hoc programmes and policies for the adoption of risk management solutions
Continued non-use or underuse of cropland following assessment
Financial availability for investments in land reclamation
Acknowledgment of the actual potential of unused land; Financial support to farmers for investments in land reclamation
Programme-support from land administration authorities
Market issues on alternative crops
Development of policy incentives for alternative crop production and marketing
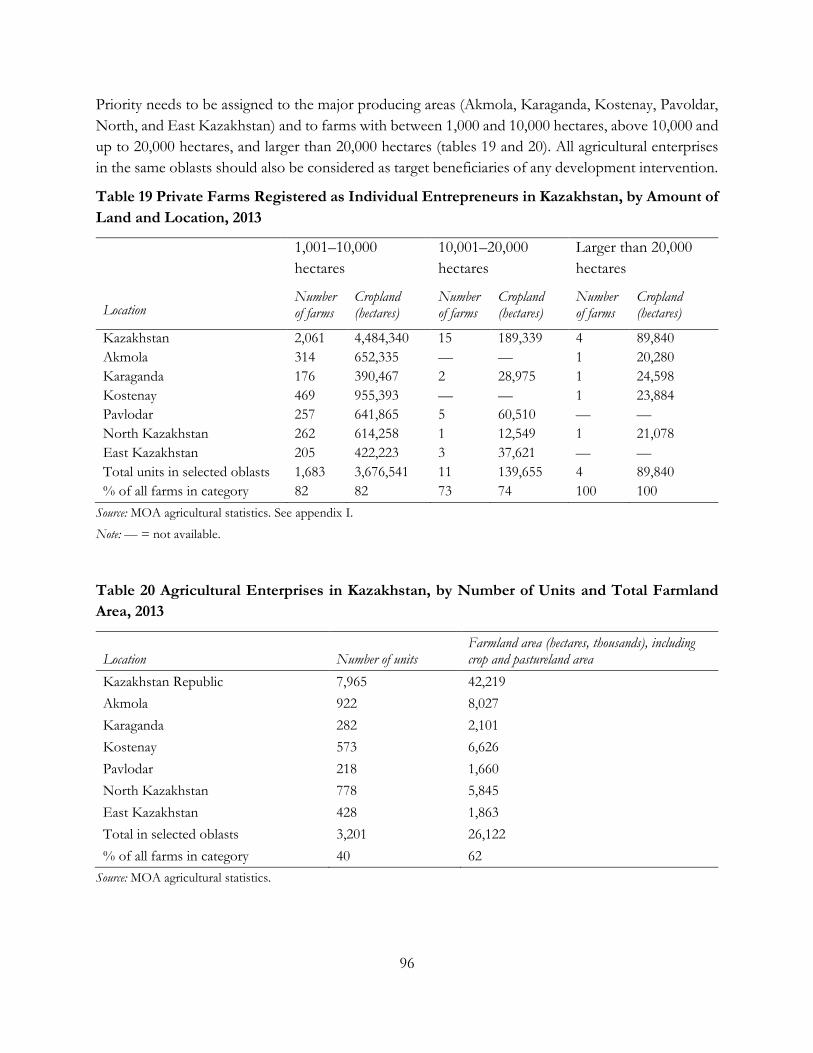
96
Priority needs to be assigned to the major producing areas (Akmola, Karaganda, Kostenay, Pavoldar,
North, and East Kazakhstan) and to farms with between 1,000 and 10,000 hectares, above 10,000 and
up to 20,000 hectares, and larger than 20,000 hectares (tables 19 and 20). All agricultural enterprises
in the same oblasts should also be considered as target beneficiaries of any development intervention.
Table 19 Private Farms Registered as Individual Entrepreneurs in Kazakhstan, by Amount of
Land and Location, 2013
1,001–10,000
hectares
10,001–20,000
hectares
Larger than 20,000
hectares
Location Number of farms
Cropland (hectares)
Number of farms
Cropland (hectares)
Number of farms
Cropland (hectares)
Kazakhstan 2,061 4,484,340 15 189,339 4 89,840
Akmola 314 652,335 — — 1 20,280
Karaganda 176 390,467 2 28,975 1 24,598
Kostenay 469 955,393 — — 1 23,884
Pavlodar 257 641,865 5 60,510 — —
North Kazakhstan 262 614,258 1 12,549 1 21,078
East Kazakhstan 205 422,223 3 37,621 — —
Total units in selected oblasts 1,683 3,676,541 11 139,655 4 89,840
% of all farms in category 82 82 73 74 100 100
Source: MOA agricultural statistics. See appendix I.
Note: — = not available.
Table 20 Agricultural Enterprises in Kazakhstan, by Number of Units and Total Farmland
Area, 2013
Location Number of units Farmland area (hectares, thousands), including crop and pastureland area
Kazakhstan Republic 7,965 42,219
Akmola 922 8,027
Karaganda 282 2,101
Kostenay 573 6,626
Pavlodar 218 1,660
North Kazakhstan 778 5,845
East Kazakhstan 428 1,863
Total in selected oblasts 3,201 26,122
% of all farms in category 40 62
Source: MOA agricultural statistics.
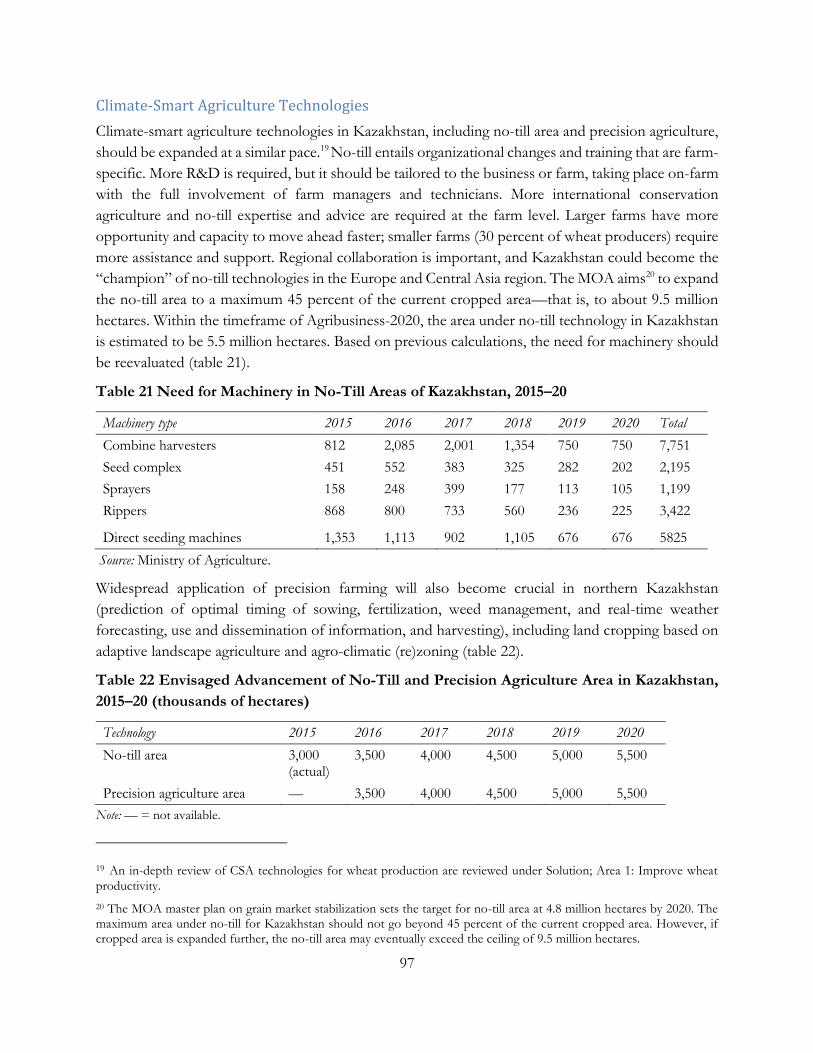
97
Climate-Smart Agriculture Technologies
Climate-smart agriculture technologies in Kazakhstan, including no-till area and precision agriculture,
should be expanded at a similar pace.19 No-till entails organizational changes and training that are farm-
specific. More R&D is required, but it should be tailored to the business or farm, taking place on-farm
with the full involvement of farm managers and technicians. More international conservation
agriculture and no-till expertise and advice are required at the farm level. Larger farms have more
opportunity and capacity to move ahead faster; smaller farms (30 percent of wheat producers) require
more assistance and support. Regional collaboration is important, and Kazakhstan could become the
“champion” of no-till technologies in the Europe and Central Asia region. The MOA aims20 to expand
the no-till area to a maximum 45 percent of the current cropped area—that is, to about 9.5 million
hectares. Within the timeframe of Agribusiness-2020, the area under no-till technology in Kazakhstan
is estimated to be 5.5 million hectares. Based on previous calculations, the need for machinery should
be reevaluated (table 21).
Table 21 Need for Machinery in No-Till Areas of Kazakhstan, 2015–20
Machinery type 2015 2016 2017 2018 2019 2020 Total
Combine harvesters 812 2,085 2,001 1,354 750 750 7,751
Seed complex 451 552 383 325 282 202 2,195
Sprayers 158 248 399 177 113 105 1,199
Rippers 868 800 733 560 236 225 3,422
Direct seeding machines 1,353 1,113 902 1,105 676 676 5825
Source: Ministry of Agriculture.
Widespread application of precision farming will also become crucial in northern Kazakhstan
(prediction of optimal timing of sowing, fertilization, weed management, and real-time weather
forecasting, use and dissemination of information, and harvesting), including land cropping based on
adaptive landscape agriculture and agro-climatic (re)zoning (table 22).
Table 22 Envisaged Advancement of No-Till and Precision Agriculture Area in Kazakhstan,
2015–20 (thousands of hectares)
Technology 2015 2016 2017 2018 2019 2020
No-till area 3,000 (actual)
3,500 4,000 4,500 5,000 5,500
Precision agriculture area — 3,500 4,000 4,500 5,000 5,500
Note: — = not available.
19 An in-depth review of CSA technologies for wheat production are reviewed under Solution; Area 1: Improve wheat
productivity.
20 The MOA master plan on grain market stabilization sets the target for no-till area at 4.8 million hectares by 2020. The maximum area under no-till for Kazakhstan should not go beyond 45 percent of the current cropped area. However, if cropped area is expanded further, the no-till area may eventually exceed the ceiling of 9.5 million hectares.
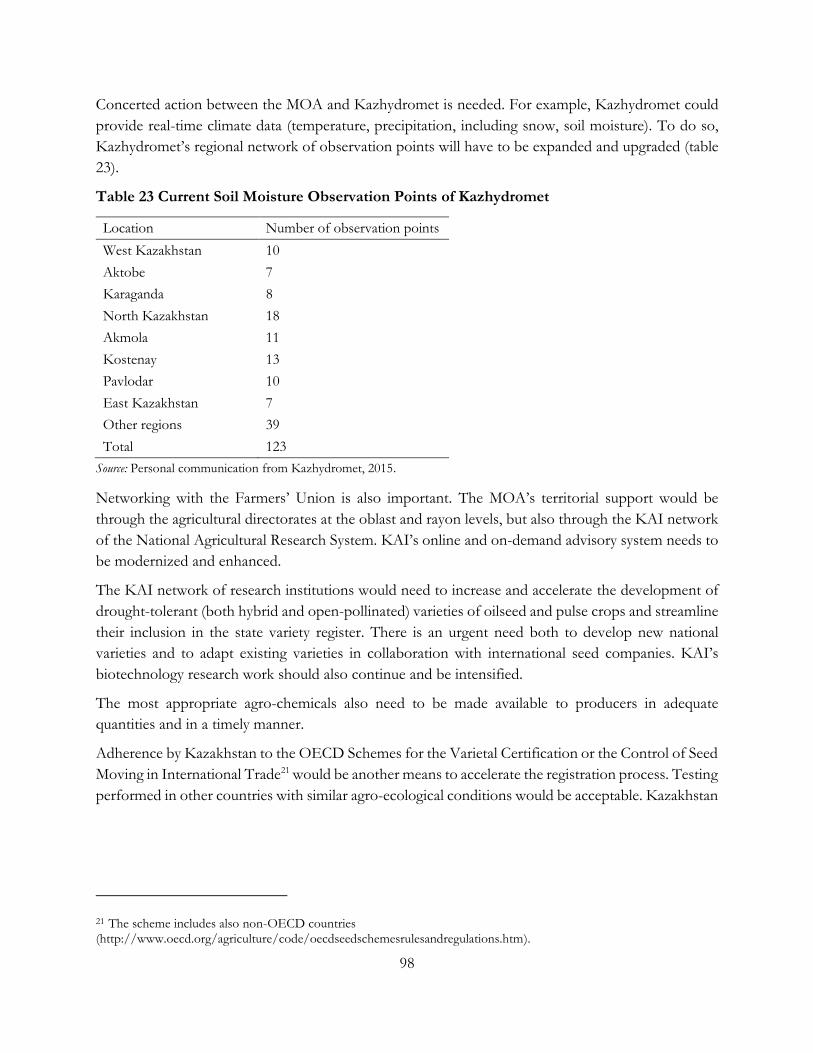
98
Concerted action between the MOA and Kazhydromet is needed. For example, Kazhydromet could
provide real-time climate data (temperature, precipitation, including snow, soil moisture). To do so,
Kazhydromet’s regional network of observation points will have to be expanded and upgraded (table
23).
Table 23 Current Soil Moisture Observation Points of Kazhydromet
Location Number of observation points
West Kazakhstan 10
Aktobe 7
Karaganda 8
North Kazakhstan 18
Akmola 11
Kostenay 13
Pavlodar 10
East Kazakhstan 7
Other regions 39
Total 123
Source: Personal communication from Kazhydromet, 2015.
Networking with the Farmers’ Union is also important. The MOA’s territorial support would be
through the agricultural directorates at the oblast and rayon levels, but also through the KAI network
of the National Agricultural Research System. KAI’s online and on-demand advisory system needs to
be modernized and enhanced.
The KAI network of research institutions would need to increase and accelerate the development of
drought-tolerant (both hybrid and open-pollinated) varieties of oilseed and pulse crops and streamline
their inclusion in the state variety register. There is an urgent need both to develop new national
varieties and to adapt existing varieties in collaboration with international seed companies. KAI’s
biotechnology research work should also continue and be intensified.
The most appropriate agro-chemicals also need to be made available to producers in adequate
quantities and in a timely manner.
Adherence by Kazakhstan to the OECD Schemes for the Varietal Certification or the Control of Seed
Moving in International Trade21 would be another means to accelerate the registration process. Testing
performed in other countries with similar agro-ecological conditions would be acceptable. Kazakhstan
21 The scheme includes also non-OECD countries (http://www.oecd.org/agriculture/code/oecdseedschemesrulesandregulations.htm).
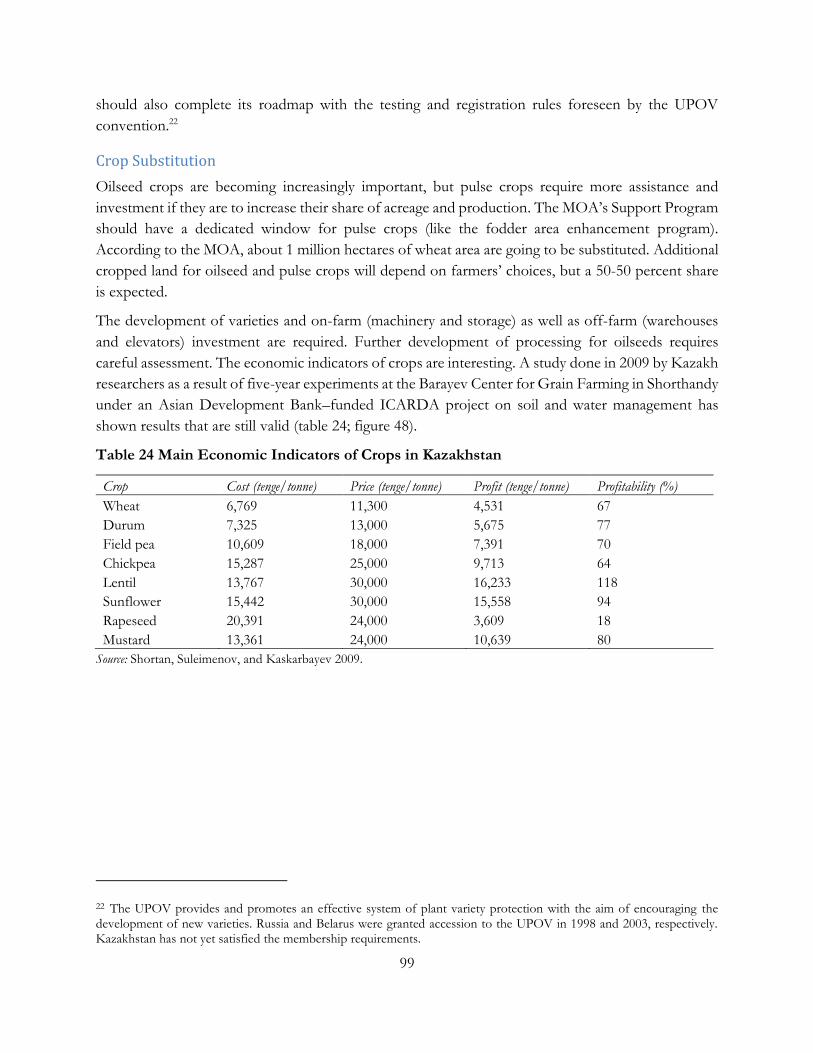
99
should also complete its roadmap with the testing and registration rules foreseen by the UPOV
convention.22
Crop Substitution
Oilseed crops are becoming increasingly important, but pulse crops require more assistance and
investment if they are to increase their share of acreage and production. The MOA’s Support Program
should have a dedicated window for pulse crops (like the fodder area enhancement program).
According to the MOA, about 1 million hectares of wheat area are going to be substituted. Additional
cropped land for oilseed and pulse crops will depend on farmers’ choices, but a 50-50 percent share
is expected.
The development of varieties and on-farm (machinery and storage) as well as off-farm (warehouses
and elevators) investment are required. Further development of processing for oilseeds requires
careful assessment. The economic indicators of crops are interesting. A study done in 2009 by Kazakh
researchers as a result of five-year experiments at the Barayev Center for Grain Farming in Shorthandy
under an Asian Development Bank–funded ICARDA project on soil and water management has
shown results that are still valid (table 24; figure 48).
Table 24 Main Economic Indicators of Crops in Kazakhstan
Crop Cost (tenge/tonne) Price (tenge/tonne) Profit (tenge/tonne) Profitability (%)
Wheat 6,769 11,300 4,531 67
Durum 7,325 13,000 5,675 77
Field pea 10,609 18,000 7,391 70
Chickpea 15,287 25,000 9,713 64
Lentil 13,767 30,000 16,233 118
Sunflower 15,442 30,000 15,558 94
Rapeseed 20,391 24,000 3,609 18
Mustard 13,361 24,000 10,639 80
Source: Shortan, Suleimenov, and Kaskarbayev 2009.
22 The UPOV provides and promotes an effective system of plant variety protection with the aim of encouraging the development of new varieties. Russia and Belarus were granted accession to the UPOV in 1998 and 2003, respectively. Kazakhstan has not yet satisfied the membership requirements.
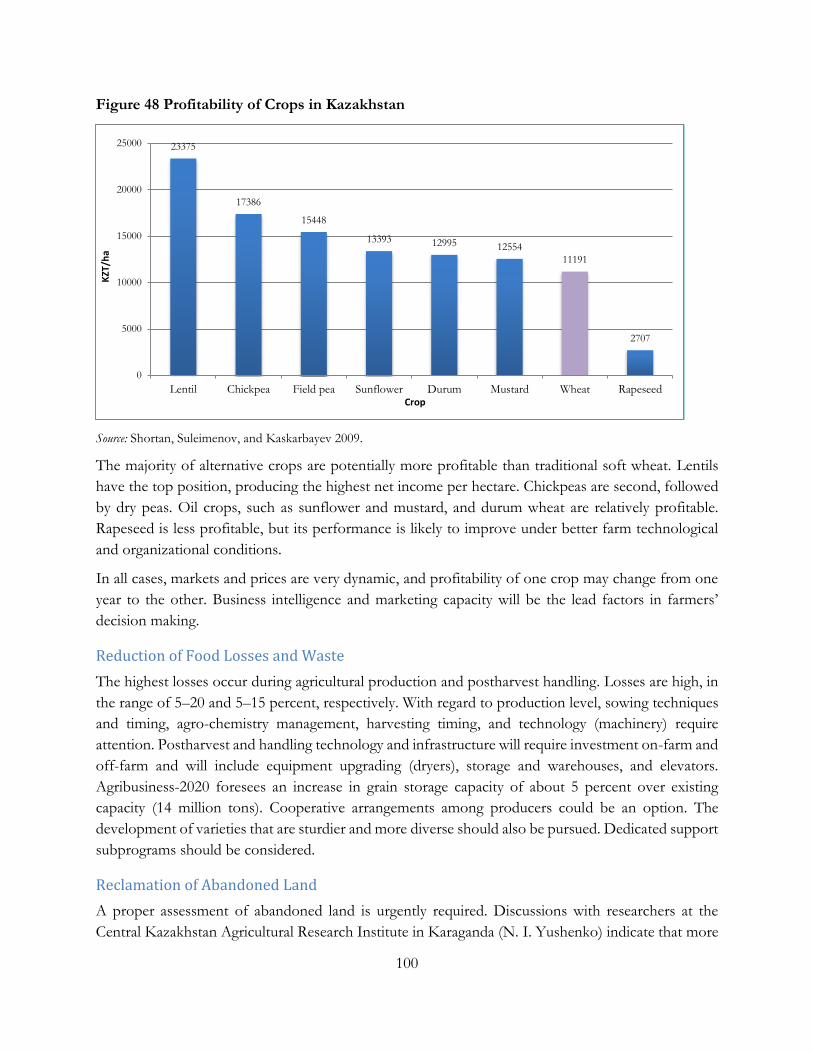
100
Figure 48 Profitability of Crops in Kazakhstan
Source: Shortan, Suleimenov, and Kaskarbayev 2009.
The majority of alternative crops are potentially more profitable than traditional soft wheat. Lentils
have the top position, producing the highest net income per hectare. Chickpeas are second, followed
by dry peas. Oil crops, such as sunflower and mustard, and durum wheat are relatively profitable.
Rapeseed is less profitable, but its performance is likely to improve under better farm technological
and organizational conditions.
In all cases, markets and prices are very dynamic, and profitability of one crop may change from one
year to the other. Business intelligence and marketing capacity will be the lead factors in farmers’
decision making.
Reduction of Food Losses and Waste
The highest losses occur during agricultural production and postharvest handling. Losses are high, in
the range of 5–20 and 5–15 percent, respectively. With regard to production level, sowing techniques
and timing, agro-chemistry management, harvesting timing, and technology (machinery) require
attention. Postharvest and handling technology and infrastructure will require investment on-farm and
off-farm and will include equipment upgrading (dryers), storage and warehouses, and elevators.
Agribusiness-2020 foresees an increase in grain storage capacity of about 5 percent over existing
capacity (14 million tons). Cooperative arrangements among producers could be an option. The
development of varieties that are sturdier and more diverse should also be pursued. Dedicated support
subprograms should be considered.
Reclamation of Abandoned Land
A proper assessment of abandoned land is urgently required. Discussions with researchers at the
Central Kazakhstan Agricultural Research Institute in Karaganda (N. I. Yushenko) indicate that more
23375
17386
15448
13393 12995 12554
11191
2707
0
5000
10000
15000
20000
25000
Lentil Chickpea Field pea Sunflower Durum Mustard Wheat Rapeseed
KZT
/ha
Crop
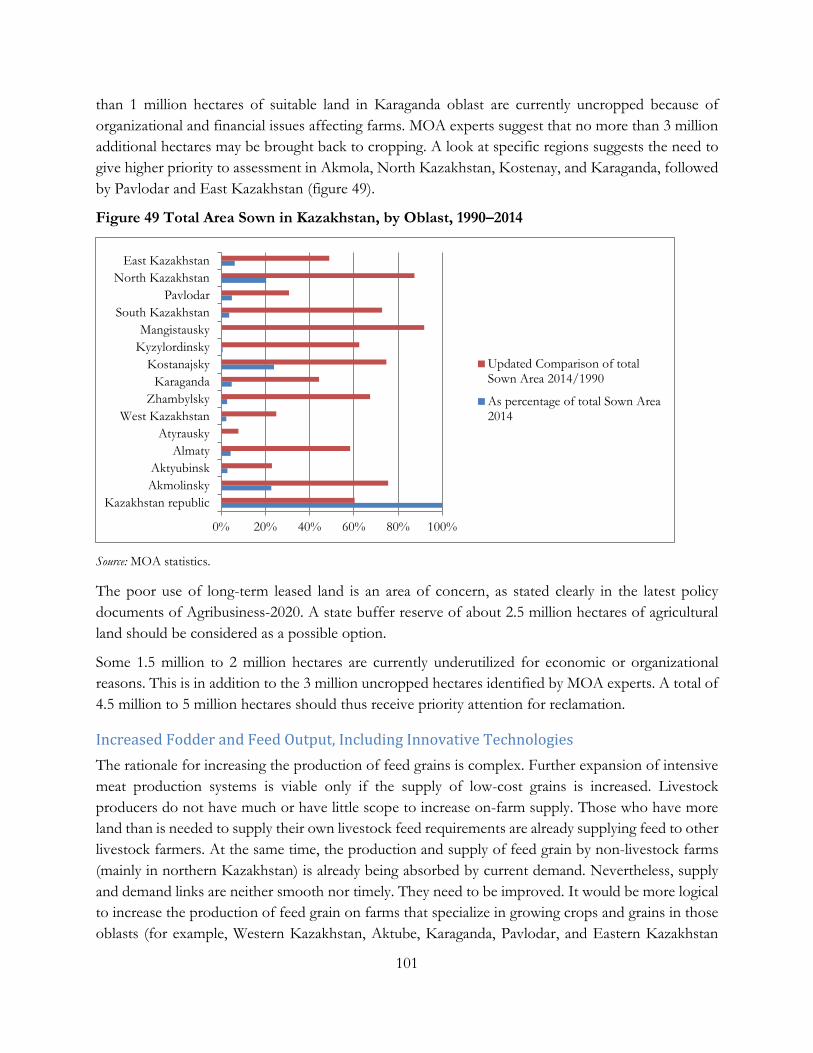
101
than 1 million hectares of suitable land in Karaganda oblast are currently uncropped because of
organizational and financial issues affecting farms. MOA experts suggest that no more than 3 million
additional hectares may be brought back to cropping. A look at specific regions suggests the need to
give higher priority to assessment in Akmola, North Kazakhstan, Kostenay, and Karaganda, followed
by Pavlodar and East Kazakhstan (figure 49).
Figure 49 Total Area Sown in Kazakhstan, by Oblast, 1990–2014
Source: MOA statistics.
The poor use of long-term leased land is an area of concern, as stated clearly in the latest policy
documents of Agribusiness-2020. A state buffer reserve of about 2.5 million hectares of agricultural
land should be considered as a possible option.
Some 1.5 million to 2 million hectares are currently underutilized for economic or organizational
reasons. This is in addition to the 3 million uncropped hectares identified by MOA experts. A total of
4.5 million to 5 million hectares should thus receive priority attention for reclamation.
Increased Fodder and Feed Output, Including Innovative Technologies
The rationale for increasing the production of feed grains is complex. Further expansion of intensive
meat production systems is viable only if the supply of low-cost grains is increased. Livestock
producers do not have much or have little scope to increase on-farm supply. Those who have more
land than is needed to supply their own livestock feed requirements are already supplying feed to other
livestock farmers. At the same time, the production and supply of feed grain by non-livestock farms
(mainly in northern Kazakhstan) is already being absorbed by current demand. Nevertheless, supply
and demand links are neither smooth nor timely. They need to be improved. It would be more logical
to increase the production of feed grain on farms that specialize in growing crops and grains in those
oblasts (for example, Western Kazakhstan, Aktube, Karaganda, Pavlodar, and Eastern Kazakhstan
0% 20% 40% 60% 80% 100%
Kazakhstan republic
Akmolinsky
Aktyubinsk
Almaty
Atyrausky
West Kazakhstan
Zhambylsky
Karaganda
Kostanajsky
Kyzylordinsky
Mangistausky
South Kazakhstan
Pavlodar
North Kazakhstan
East Kazakhstan
Updated Comparison of totalSown Area 2014/1990
As percentage of total Sown Area2014
102
oblasts), where livestock production is a higher priority than crop production and where feed grains
face less competition from food grains. In this case, facilitation of forward contractual arrangements
may be useful.
The MOA Support Program and its system of subsidies are triggering an increase in fodder crop areas.
This may lead to a further 0.5 million hectares of land under fodder or forage crops. Investment is
also required to improve productivity. In this regard, larger producers, wherever feasible and viable,
could invest in irrigation or water-harvesting reservoirs for their fodder and feed grain crops. Hayfields
could also be made more productive or be rehabilitated through reseeding with appropriate seed
mixes. In all cases, availability of seed for fodder crops is an issue that requires urgent attention.
However, any significant increase in fodder cropped area will need to be aligned with the reclamation
of uncropped or underutilized land (2.5 million hectares). The development of the feed industry
requires an ad hoc assessment.
Grain output might be increased by the use of pasture cropping. Although Kazakhstan has limited
direct experience with the use of pasture cropping, this option offers promise. A comparative
advantage exists in that the country has about 15 years of successful adoption of no-till technology
(which is part of the pasture cropping technique). The country also has vast pasturelands, which only
need to be used better. The potential is such that even limited use of this technology would produce
results. Trials done in the recent past provide a useful baseline.
Pasture cropping could be developed over four large pilot areas (100 hectares each, totaling 400
hectares): in central (Karaganda area) and northern (North Kazakhstan, Akmola, and Kostenay)
Kazakhstan. In each region, area-wide tests would have to be conducted using different techniques
and modalities.23
Eventually and through gradual increases, cereal yield of 0.6 tons per hectare over an area of 2.5 million
hectares of pastureland (1 percent of the total area resource base) would provide some 1.2 million feed
units tons that, in turn, would satisfy the needs of 0.5 million livestock units (corresponding to about
10 percent of current number of cows).
Action Plan
An overarching capacity development activity would set the rules for implementation and
coordination of the Diversification-Risk Management Program (D-RMP) investments, including
specifically designed and planned technical assistance and institutional strengthening activities. The
MOA would be the executing agency, which would need to organize a special unit responsible and
accountable for implementing its Risk Management Program. Implementing partners would include
KazAgroInnovation (Research and Extension Directorates) and the Farmers’ Union. A memorandum
of agreement with Kazhydromet would govern implementation of the precision agriculture
component. Collaborations for assistance and support would need to be sought with CIMMYT, FAO,
23 Crop trials: barley, wheat or oats, and dry pea. Sowing time replications: for each type of crop, different sowing times (in autumn and in spring, depending on latitude). Husbandry: diversified use of fertilizers and herbicides.
103
and the World Bank. The monitoring and evaluation system and operation would be organized in the
MOA through a special unit created for the D-RMP.
The implementation timeline of the D-RMP would need to coincide with that of Agribusiness-2020.
The D-RMP would cost an estimated T 1.26 trillion, or about US$7.015 billion, including MOA
support for the use of agrochemicals over an area of about 12.5 million hectares. The proposed actions
are summarized in table X in the last section of this report.
104
Solutions Area 3. Improve Livestock Productivity
This section builds on the Phase I recommendations for the livestock sector to identify and assess
strategies to strengthen the resiliency of livestock systems and rangelands in Kazakhstan. Interventions
are identified that could (1) reverse degradation of water, soil, and vegetation cover; (2) safeguard the
long-term viability of rangeland ecosystems, while ensuring sustainable access to grazing land; and (3)
strengthen livestock services (veterinary, animal health, feed and fodder supply, destocking, water and
grazing access, weather and market information, among others), enabling farmers to manage their
resources better, to respond to climate and market signals, and to protect their assets in times of
drought.
Overview of the Risk Environment and Framework
The government of Kazakstan is actively seeking to find new and expand current markets for its
agricultural products. It joined the Eurasia Customs Union in 2010 and is expected to join the World
Trade Organization (WTO) by 2016. Additional free trade agreements are to be negotiated. At the
same time that global market access provides the opportunity to increase the value of GAO, it also
introduces new competitors, which may be more heavily subsidized (unlevel playing field) than
Kazakh producers, accentuating the need to make Kazakh production more competitive. It also
introduces new exchange rate and political risks. Compliance with food safety and other standards
must be met. WTO accession may also require redrawing support programs as well as the design and
delivery of agricultural subsidies.
The guiding policy document for agriculture is Agribusiness-2020, which aims to support the financial
recovery of farms, make products more affordable, develop agro-industry, create a network to support
producers, and improve management of the system at the government level. Programs are focused on
investment and subsidies for intensive, commercial agribusiness. Within the policy framework, there
is a plan to reduce wheat production by 14 percent (2 million hectares) to 11.5 million hectares by
2020 and to increase feed grain production by 53 percent (1.5 million hectares) to 4.3 million hectares.
The Investment Subsidies Program provides rebates to agricultural producers for investment in
infrastructure and new enterprises. This includes a plan to install 400 new wells in pastures to
compensate for the 80 percent of wells that were destroyed after the Soviet era. The program will
reimburse 80 percent of the costs for construction and equipment. To date, 100 wells have been built.
The Dairy Program aims to establish three to five large farms (approximately 400 cows) and 20–50
medium farms annually to decrease milk imports by 200,000 liters per year. Dairy farmers are eligible
to be reimbursed for up to 20 percent of costs and receive subsidized interest rates. In addition,
subsidies are paid per liter of milk. Dairy processing facilities are also eligible for support. Feedlots
and poultry farms are eligible for investment support and for direct subsidies per unit of production
(per kilogram of beef or per egg).
The Beef Development Program 2016 supports breeding and selection, farms, feedlots, pastures, feed,
and individuals and entrepreneurs with a goal of acquiring 550,000 head of cattle. To date, 290,000
105
cows have been purchased for small business, including 50,000 Charolais and Limosin. Beef
production is supported by the importation of foreign genetics, and breeding farms with cross-
breeding programs have been set up. Feed production has been subsidized for dairy, meat, and poultry,
including home-grown feed and silage. Purchased feeds are eligible for rebates. Home-grown feeds
are subsidized using an imputed value. Silage is subsidized using an imputed cost of production for
barley and corn.
The Financial Rehabilitation of Agriculture Producers Program is intended to restructure existing
debts through the prolongation of loans and reduction of interest rates. In 2014, T 140 billion (US$770
million) was allocated to second-tier banks to restore agricultural companies to health.
Recognizing the risk of being heavily reliant on the wheat sector, the Diversification Program is
intended to diversify crop production into new crops, including forage. Direct subsidies provide
strong incentives for growers to introduce new crops. For example, canola and rapeseed receive
subsidies of US$42 per hectare, while wheat receives US$2.50 per hectare. In the past 10 years, oilseed
production has increased, but total oilseed (rapeseed and sunflower) production is still less than 1
million metric tons.
The Regional Specialization Program targets subsidies only to areas designated for specialization.
Within this framework, no wheat production is subsided in the far west. Similarly, if a crop has not
been identified as potentially competitive, no subsidies are provided. Beef is eligible for subsidies in
all regions except the far west. Access to remote pastures is supported through the redevelopment of
well infrastructure. Vertical linkages are made to feedlots and slaughter plants.
The Reform of Agriculture Science Program will move research institutes under the MOA to
strengthen ties to industry. KazAgro is a parastatal with seven subsidiaries, including, among others,
KazAgroMarketing, KazAgroInnovation, and KazAgroHoldings, which provides finance, collateral
guarantees, leasing, microfinance, and other financial services. KazAgroProduct, a subsidiary of
KazAgroHoldings, promotes exports, develops infrastructure, supports breeding farms, feedlots, and
meat plants, arranges purchases of feed, and finances purchases of cattle. Cattle can be used for up to
50 percent of total collateral. Eligibility criteria are set for the size of operation, with 3,000 head
feedlots preferred, followed by 1,500 and 400 head units. Public commissions at the local level are
used to select the producers.
Work is ongoing to create a database on creditworthiness. Lending criteria address availability of land,
experience, feed base, and specialists. Larger farms allow for more systematic and transparent
assessment than smaller farms in rural areas and small towns. Because of a deficit of information on
agribusinesses, anecdotal evidence from the governor in the provinces is used to assess applicants.
Because of the animal identification system used to control animal disease, the MOA has a good
animal database and records on marketing that can support credit analysis. KazAgro also produces
lending and livestock production manuals, which are available for clients. When a recipient is selected
for a government investment program, he signs a contract to collaborate with KazAgroInnovation’s
various institutions of researchers.
106
The World Bank conducted two agriculture projects between 2006 and 2013. The Second Agriculture
Post-Privatization Assistance Project provided a credit line for agriculture. The Agriculture
Competitiveness Project provided grants for applied research and, to some extent, extension services
and the introduction of new technology. The project successfully showed how the grant mechanism
could work, but the scale of the project could only serve a fraction of the need within the sector. As
the government’s subsidy program grew, the demand for project grants declined. Interest has returned,
as low oil prices have dampened public finance.
Other related projects include the Irrigation and Drainage Project and the Drylands Management
Project. The DMP was limited to one oblast, but successfully demonstrated approaches to convert
35,000 hectares of tilled land back to pasture. The project illustrated the viability of shifting out of
unsustainable wheat production and back into traditional livestock-based production.
The Sustainable Rangeland Management for Rural Livelihood and Environmental Integrity Project
was conducted by the government of Kazakhstan, the Global Environment Fund (GEF), the UNDP,
and the German Agency for International Cooperation (GIZ) from 2009 to 2012. The project was
part of a series of GEF projects in Central Asia. It demonstrated sustainable rangeland management
(SRM) practices, with the desired outcomes being to create an environment conductive to SRM, to
improve the capacity to implement SRM at the local government and community levels, and to
improve local infrastructure to facilitate the movement of herds. The project achieved a 23 percent
reduction in the amount of area with heavy soil erosion, an 8.6 percent reduction in the amount of
rangeland with unwanted plants, and a 20 percent increase in the use of remote pastures. As a result,
family income increased 32 percent.
The German-Kazakhstan Deutsches Agrarzentrum in Kasachstan Project (2010–16; 2016–18
handover) provides training and demonstration in innovative technologies and management for crop
and livestock production. The project operates in collaboration with foreign agriculture suppliers
active in the Kazakh market. Foreign advisers are used to conduct training of trainers (TOT) programs.
The Sustainable Pasture Management in Central Asia Project (2002–15) is being implemented by the
German Federal Ministry for Economic Cooperation and Development in Kazakhstan, the Kyrgyz
Republic, Tajikistan, Turkmenistan, and Uzbekistan. The objective is to introduce sustainable land use
approaches (pasture rotation, increased grazing mobility) and to reduce the overgrazing and
degradation of pastures, especially around settlements. User committees have been formed in four
communities of one district and prepare pasture management plans. In 2012 the Kazakh government
planned to establish a new law on pasture use, based on the results of the program.
Several projects are in the planning stage or about to be initiated that will potentially help to decrease
agricultural risk:
The World Bank is developing a regional project on climate change adaptation with some agricultural elements. The total regional project would provide US$200 million for five countries: Kazakhstan, the Kyrgyz Republic, Tajikistan, Uzbekistan, and Turkmenistan. The funding in Kazakhstan would be US$10 million, with US$5 million in co-financing. The
107
project will address the need for capacity development, technology, software, modeling, glacier monitoring, and information. No pasture monitoring is included at this point.
GIZ plans to launch a four-year project on climate change adaptation in Tajikistan, the Kyrgyz Republic, and Kazakstan.
The MOA intends to develop a GEF project on pasture management to replicate and scale up pasture management pilot projects undertaken by GIZ and the World Bank before 2011. The anticipated size of the project is US$2.0 million, with the MOA as a co-partner. The focal point for GEF in Kazakhstan is the Ministry of Energy. Proposal writing will begin in 2015.
The MOA has applied to the World Bank for a technical assistance project (next year) on meteorology and crop insurance.
The Agricultural Risk Environment
Phase I recommended more diversification into extensive livestock production, with concurrent
strategies to increase and secure feed supplies. The analysis here takes a supply-chain, value-chain
approach and looks at the systems and services for supplying inputs, feed, and strategic forage reserves,
animal health, medicines and vaccines, breeding stock, supplements, and market and agricultural-
weather information systems. This section draws heavily on stakeholder interviews conducted in April
2015.
Risks and their management approaches are multifaceted. This section investigates the high-priority
risks and management approaches identified in Phase I to identify weaknesses or gaps in risk
management. The analysis looks at the various types of risks that face livestock producers, including
market risk, price risk, production risk, business risk, financial risk, and policy risk. Issues with any
single risk or production problem will lead to suboptimal performance and profitability and ultimately
reduce the resilience to risk.
Market and Price Risk
The government’s program to commercialize agriculture has increased production and encouraged
diversification, but also created its own set of risks. Agricultural production has nearly doubled in the
past five years, and agricultural exports have more than doubled to US$3 billion. Government targets
are to increase meat exports by 60,000 metric tons. Kazakhstan remains dependent on imports for
more than 60 percent of dairy consumption; 1 million metric tons of milk and dairy products are
imported annually. Milk plants reconstitute powdered milk at a much lower cost than using local fresh
milk. The country is 70 percent self-sufficient in poultry meat production, with imports coming from
the United States and other countries. Kazakhstan is self-sufficient in egg production, but faces fierce
completion from imported products, especially since the devaluation of the ruble.
In light of the ruble crisis and its impact on agricultural prices, many of the highly capitalized, intensive
operations established through investment programs are facing marketing and financial challenges.
Some have cut their prices 20–25 percent to maintain their market share. This is resulting in many
calls for the imposition of tariff and nontariff barriers to limit foreign access to the market.
Stakeholders interviewed for this report identified numerous issues related to market and price risks:
108
Production is increasing rapidly, and there is a risk that domestic prices will fall if export markets are not developed for the additional supply of meat.
The devaluation of the ruble has placed cheaper goods into the market, driving down the prices of both milk and meat. Margins and profits have decreased, and expansion is on hold.
Existing product quality standards and procedures for labeling and expiry dates are not followed strictly. Stakeholders identified the need for the Committee for Consumer Rights to enforce standards strictly.
Kazakh productivity remains low, which leads to higher unit costs of production and issues of competitiveness. Frozen meat from Argentina is cheaper (T 500 per kilogram) than Kazakh meat (T 800 per kilogram). Costs to produce 1 liter of milk in northern Kazakhstan are reportedly between T 60 and T 111 in the south. Domestic plants using milk powder from Belarus can produce reconstituted product at T 48 per liter (or, in rubles, Rub 16 per liter). Limited information is available on costs of production from either the ministry or industry.
Production of both dairy and meat is seasonal, and the degree of seasonality depends on management and the amount of feed prepared.
Market infrastructure and systems are underdeveloped, with no large wholesale or reliable retail traders. Several producers recommended establishing an electronic market platform to improve transparency and efficiency.
There are not enough cattle in feedlots to supply a steady flow of quality cattle to slaughter plants and, ultimately, to export markets. There may not be enough operating credit or operating credit may be too expensive to make the purchase of calves and feed financially viable.
Uneven subsidization by countries within the Economic Union places Kazakh products at a disadvantage. For example, subsidy as a share of the cost of egg production in Kazakhstan is 15–17 percent (T 3 per egg), compared with 50 percent in Belarus and 25–30 percent in Russia.
The types, efficiency, and performance of subsidies are not optimal, and the system for distributing them needs to be modernized to speed up access and improve fairness.
Storage is not sufficient to handle large harvests, creating market gluts and price collapses in times of surplus and spikes in times of shortage.
The marketing infrastructure for milk is limited, with some farmers bringing fresh milk 600 kilometers from Kostanay to Kokshetau because the local plant reconstitutes powdered milk.
Quality and production standards are not adhered to, which compromises the quantity and quality of Kazakh livestock products.
Animal Health Risk
The Kazakh animal health system is relatively strong. All of the key components are in place, including
animal identification, vaccination programs, laboratories, a national reference laboratory, inspection,
and zoning. Adequate funding is in place to carry out effective vaccination programs. Farmers are
compensated for any animals destroyed through disease eradication or control programs, and the
country is divided into two zones for containment and control of animal diseases.
The country is in the process of requesting that the OIE and the WTO declare Kazakhstan free of
foot and mouth disease. Because of substantial risks at the border with various countries, the southern
region is a recognized (buffer) zone under the OIE. Prevention of production diseases (for example,
109
parasites) is the responsibility of municipalities. Veterinary control committees are established at this
level. Treatments and disinfections are done twice a year.
A private veterinary service was established in Kazakhstan but was unable to operate profitably in
rural areas due, at least partly, to competition from the government veterinary services, which provide
various free services. In rural areas, private veterinarians now work for the state. Clinics have a menu
of services—some priced and some free. Veterinary services were restructured in 2014 to move many
responsibilities to the oblast or district level, and guidelines and rules are being developed. More
responsibilities are at the local level, and staffing has been increased accordingly. Veterinarians conduct
inspections, provide treatment, and deliver vaccinations. Large farms are required to have a
veterinarian on staff.
Stakeholders mentioned the following animal health issues:
The smuggling of animals into Kazakhstan, particularly from the Kyrgyz Republic, allows infectious disease to enter the country. The risk zone is the southeast near Almaty and the border with the Kyrgyz Republic and China.
The lack of control of animal health in neighboring countries raises the risk that infectious and foreign animal diseases will be introduced to Kazakhstan. The Kyrgyz Republic does not have a functioning animal identification system, has an incomplete vaccination program, and has insufficient sampling and laboratory capacity to detect and respond to animal disease.
Inadequate capacity to test for production diseases and their specific strains constrains the ability to match available medications to the active strain of diseases. With the number of feedlots increasing, the ability to detect and properly treat “feedlot diseases” is important.
Producers do not pay adequate attention to animal health protocols, such as vaccination, quarantine, and herd separation, partly because they are not fully aware of the risks and proper procedures. Failure to follow a vaccine protocol places the industry at risk. Feedlot disease control is inadequate.
Feed Risks
Adequate livestock nutrition is essential for productivity and resilience. Feed resources include pasture,
forage crops, feed grains, and manufactured feed. Access to vitamins, minerals, and additives can
ensure balanced rations and optimal productivity. The GEF has estimated that fodder supplies fall 30
percent short of livestock’s physiological needs.
For extensive and semi-intensive livestock production, pasture is the main source of feed. Kazakhstan
has 183 million hectares of pasture, of which 130 million hectares are grazable. The destruction of
60,000 mechanical wells after the economic transition reduced the amount of usable pasture to 32
million hectares, leaving roughly 100 million hectares unused. According to the GEF, only 40 percent
of pastures can be served by surface water. Wells are needed on the remaining pastures. The loss of
water and the leasing of pastures have reduced access to pastures, especially for smaller producers
with less wealth and mobility.
In Kazakhstan’s semi-arid climate, dry years are frequent, and movement has traditionally been the
method of securing pasture resources. Because of the lack of access to remote pastures, pastureland
110
is not used efficiently, and nearby pastures are seriously degraded. While the national carrying capacity
is calculated at 12 million LSU, remote pastures are underutilized, while those near settlements are
overstocked); 76 percent of grazed areas are within 5 kilometers of a settlement (Harris) “Professional”
farmers are most likely to use remote pastures, but households can pay larger farmers for use of their
remote pastures. The fee varies by location and the relationship between the large farmer and the
household.
The use of pasture is regulated under the land code (2003), which, unlike in other countries in Central
Asia, allows for private ownership. Approximately 17 million hectares of land are considered
“commons,” meaning that they are available for community use at no charge. Government
pastureland is available for leases of up to 49 years at a very low price. Vague tenure arrangements
have resulted in large tracts of land being leased to a limited number of people and groups, with
negative impacts on the environment and sustainability of rural communities. The fracturing of
pasture into disjointed pieces disrupts the potential for efficient livestock mobility, with negative
impacts on the remaining areas of pasture. Under the current land code, pasture use around villages is
poorly managed. There is interest in amending the law to give farmers more responsibility and the
government more power to reallocate land that is not being used efficiently.
In general, institutional oversight of pasture management is not clearly established. Regulation of land
allocation is under the Land Resource Management Agency, local representative (maslikhat), and
government (ahkmate) bodies (van Veen et al. 2005). There is no Department of Pastures. Rather, the
Department of Agriculture handles pasture issues. When feed shortages arise, government response
is local and ad hoc.
The government of Kazakhstan is actively promoting crop diversification to secure greater feed
supplies for the growing livestock sector. Stakeholders noted the risk of having inadequate quality feed
for the intensive dairies and feedlots that have been created. These farms need to have high-quality
forage crops within their supply chain. While even well-established farms can face feed risk, new
farmers are particularly prone to this risk. The number of new farmers has grown rapidly over the past
eight years as a result of the government’s investment and subsidy programs. To some degree,
experienced farmers could be used to teach new farmers, possibly as lead farmers in extension
programs.
The following are the major feed risks:
Year-to-year variation in forage production (pasture and other), as drought and other weather conditions lead to feed shortages
Price shocks during drought or severe winter weather
Risk of permanent degradation and loss of productivity. Pastures are in poor condition because of overgrazing, the conversion of pasture to cropland after transition, and the unbalanced use of nearby and remote pastures
Availability of water now and in the future with climate change
Quality and variability of supplementary feed compounded by lack of feed processing, feed safety standards, and feed analysis capacity
111
Inadequate knowledge and skills in the formulation of least-cost feed and development of livestock rations
Poor coordination between farmers and feed manufacturers.
Financial Risks
Kazakh farmers have access to various forms of credit through commercial bands, KazAgro, the Fund
for the Support of Agriculture, and private sources. Government-sponsored programs provide soft
financing terms. Operating funds make up 20–30 percent of most investments and are available
annually on renewals. Operating credit interest rates are subsidized for the initial period, but the rate
may change at the time of renewal. In commercial lending, interest rates on capital and operating loans
are over 20 percent. The following issues affect agricultural lending and the ability of producers to
invest in risk management measures:
Registry (cadaster) of immovable assets, available in urban areas, is rarely used in rural areas because of the difficulty of assessing asset values.
Movable asset registries deal primarily with vehicles. Livestock can be used, but at a steeply discounted value.
Lenders do not have a database of land availability or profitability.
Leverage is a risk for those using government investment programs, which issue large loans for vertically integrated operations. These farms can lack liquidity. Market access is critical to their ability to maintain the cashflow required to service debt.
High interest rates discourage the purchase and storage of feed and feedstuffs.
Theft of livestock from remote pastures is an issue.
Human Resource Risks
Education is lagging behind business, and qualified skills are lacking in rural areas. Stakeholders
repeatedly cited human resources as a risk factor. Very modern technologies and management systems
are being introduced without the managers, specialists, or technicians in place to ensure efficient
production. The institutional capacity to prepare specialists in dairy, beef, or poultry production to
support these operations does not exist within the country.
Extension services lack professional advisory services to help with farm start-up in the first two years.
New farmers often have no background in agriculture. Farmers train themselves or seek advice from
international consultants. English skills are necessary to access international information on
technologies and standards and to deal effectively with foreign advisers.
There is limited knowledge in the country on feed, feed analysis, and feeding. Feed ingredient analysis
is inadequate, and balanced rations are not used. Intensive operations seeking to develop balanced
rations are hiring feed and nutrition consultants from as far away as Canada. With the ration
formulation in hand, local technicians produce the mixed feed. The concepts of feed efficiency are
not commonly understood. Similarly, foreign veterinarians are being hired to establish and monitor
herd health programs.
112
Pasture management skills are limited and highly specialized in academic and research institutions.
Good pasture management skills are needed at both the regional and local levels and in both
government and the private sector to support sustainable rangeland management. Institutions with
direct connections to pasture users, such as the KazAgroInnovation centers, should have better
capacity to provide information, training, and advisory services and to support pasture monitoring
activities.
Productivity Improvement and Adaptive Capacity
Research in Kazakhstan has not kept pace with developments in the international research community.
Science is poorly connected to the needs of industry, and the technology available in country exceeds
the capacity of local research. Researchers work with old technology and equipment and lack the
money to carry out research programs. The government of Kazakhstan is reforming the country’s
research institutions, putting them directly under the Ministry of Agriculture in the hopes of making
them more relevant to the business of agriculture.
Improving feed efficiency is an important strategy for optimizing the use of available feeds. R&D in
breeding and feeding systems has been neglected. Producers indicated that current programs for cross-
breeding have increased the average daily grain in feedlots from 500 grams per day to 1,000 grams per
day. Producers feel that research in livestock and feed production is not applicable to the Kazakh
livestock industry and that agribusiness operators “discovered” the production and use of corn.
Feeding trials are not conducted to establish local information on commonly used productivity,
growth, and feed efficiency indicators, such as weaning rates and weights, average daily grain, and
carcass quality.
Smallholders, Poverty, and Organizational Risk
Half of Kazakhstan’s population is rural and relies on agriculture as a livelihood. Agricultural
production is predominantly from household and peasant farms. Household production is responsible
for 75 percent of cattle production. Households are focused on minimal cost production and have
very little surplus for the commercial market. Investments are not made in improving feeding and
breeding, and this is reflected in the stagnant levels of productivity. Likewise, little quality control or
food safety is undertaken on farm.
The government aims to enlarge and unite smallholders through cooperatives. New cooperatives are
forming in order to access government subsidies on improved bulls and other rebates. Roadmap 2020
supports coops through micro loans for small business (up to T 3 million) at 4 percent or lower fixed
interest plus a grace period and training. Loans are available on completion of the “developing
entrepreneurship” program on business skills. Training in cooperative management can be arranged
on request. Some stakeholders have reservations about the potential for cooperatives to succeed,
saying that people, coming out of the communist command economy, prefer to operate independently
and to own their own businesses.
113
Policy Risk
The Kazakh investment and subsidy programs have had a significant impact on increasing agricultural
production and improving productivity in commercial operations. According to the Farmers Union,
only 0.2 percent of government funding goes to small and medium enterprises, with the remainder
going to large, insolvent companies, mainly medium and large enterprises. The government is trying
to streamline the application process by introducing an electronic platform for loan applications and
online prequalifications (www.kazagra). In 2015, subsidy programs will be available online.
The government sees that medium and large commercial farms could help subsistence farmers by
hiring farmworkers. To some extent, the new commercial operations are replicating the role of
previous state farms by carrying an excessive number of employees. For example, one large
commercial poultry farm had 300 employees, including 150 assigned to a single crop farm. By
comparison, a large beef feedlot operation had only 11 employees, including 4 security guards. While
the high number of employees may fulfill government and local social needs, the cost of labor drives
up production costs and seriously impairs the competitiveness and financial viability of the operation.
Stakeholders identified numerous issues and risks related to the policies and their implementation:
The large-scale commercial farms supported by government take on levels of debt that leave them vulnerable to currency and leverage risk.
Risk is not assessed and discounted accordingly.
Accession to the WTO may require a change in policy from in-put/out-put or commodity-specific subsidies to less-distorting approaches, with an unknown impact on farmers relying on subsidies for liquidity.
Government and industry do not have a common concept. Producers feel that government does not understand the details of the business of agriculture, especially regarding the new systems that are being introduced, and tries to influence the types of products that are produced. Consistency is needed with regard to aims and support.
Interest was expressed in using agricultural insurance for both crops and livestock, but crop insurance is currently riddled with numerous problems and livestock insurance is not available. Producers feel that they are left on their own in times of crisis.
Government support is not available equally to all producers. Smallholder extensive livestock producers are hampered by cost from accessing subsidies to drill new wells, which can cost as much as US$30,000. Moreover, the equipment for deep drilling is inadequate.
Consistency is needed between government aims and the support provided.
The Risk Management Framework
Information Systems
Producers consistently commented on the shortage of information. While there is a structure for
information under KazAgroMarketing, producers commented that information is collected but not
disseminated. Emergency warning systems that use text messaging exist in urban areas but do not
include advance warnings of emergencies. There are no effective emergency warning systems in rural
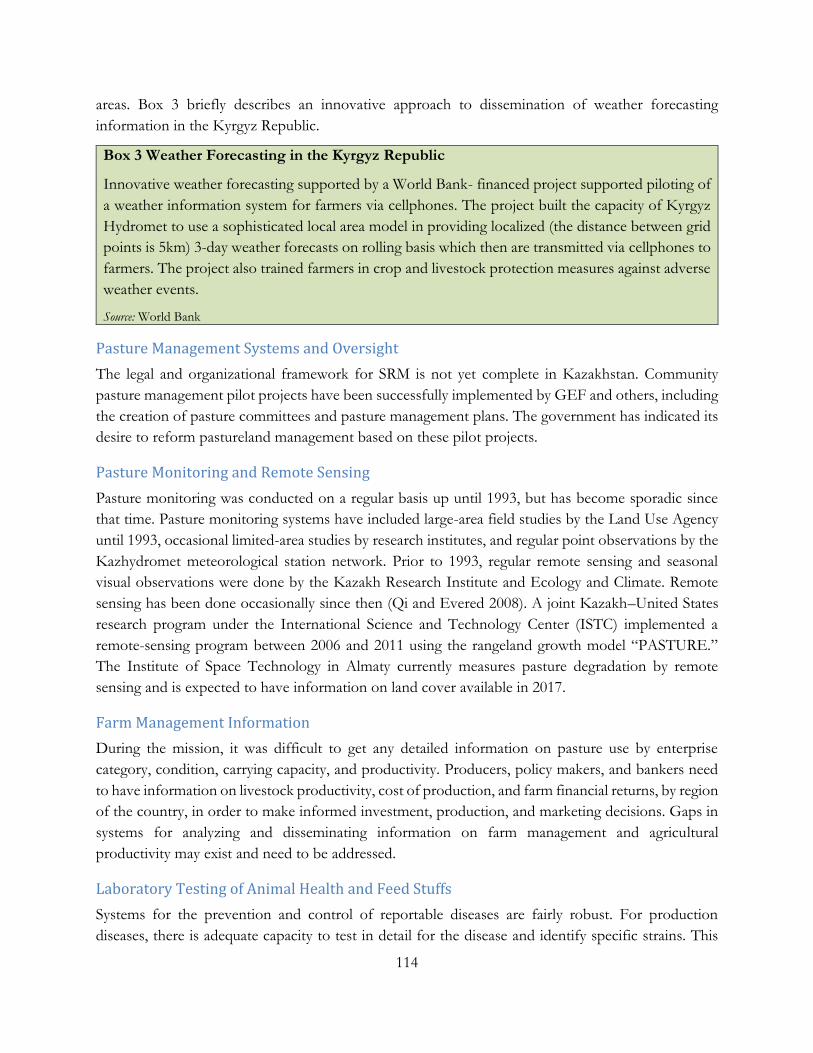
114
areas. Box 3 briefly describes an innovative approach to dissemination of weather forecasting
information in the Kyrgyz Republic.
Box 3 Weather Forecasting in the Kyrgyz Republic
Innovative weather forecasting supported by a World Bank- financed project supported piloting of
a weather information system for farmers via cellphones. The project built the capacity of Kyrgyz
Hydromet to use a sophisticated local area model in providing localized (the distance between grid
points is 5km) 3-day weather forecasts on rolling basis which then are transmitted via cellphones to
farmers. The project also trained farmers in crop and livestock protection measures against adverse
weather events.
Source: World Bank
Pasture Management Systems and Oversight
The legal and organizational framework for SRM is not yet complete in Kazakhstan. Community
pasture management pilot projects have been successfully implemented by GEF and others, including
the creation of pasture committees and pasture management plans. The government has indicated its
desire to reform pastureland management based on these pilot projects.
Pasture Monitoring and Remote Sensing
Pasture monitoring was conducted on a regular basis up until 1993, but has become sporadic since
that time. Pasture monitoring systems have included large-area field studies by the Land Use Agency
until 1993, occasional limited-area studies by research institutes, and regular point observations by the
Kazhydromet meteorological station network. Prior to 1993, regular remote sensing and seasonal
visual observations were done by the Kazakh Research Institute and Ecology and Climate. Remote
sensing has been done occasionally since then (Qi and Evered 2008). A joint Kazakh–United States
research program under the International Science and Technology Center (ISTC) implemented a
remote-sensing program between 2006 and 2011 using the rangeland growth model “PASTURE.”
The Institute of Space Technology in Almaty currently measures pasture degradation by remote
sensing and is expected to have information on land cover available in 2017.
Farm Management Information
During the mission, it was difficult to get any detailed information on pasture use by enterprise
category, condition, carrying capacity, and productivity. Producers, policy makers, and bankers need
to have information on livestock productivity, cost of production, and farm financial returns, by region
of the country, in order to make informed investment, production, and marketing decisions. Gaps in
systems for analyzing and disseminating information on farm management and agricultural
productivity may exist and need to be addressed.
Laboratory Testing of Animal Health and Feed Stuffs
Systems for the prevention and control of reportable diseases are fairly robust. For production
diseases, there is adequate capacity to test in detail for the disease and identify specific strains. This
115
limits the ability of producers to know what herd health problems exist and to determine the
appropriate treatment. There is very limited capacity in livestock feed and feed ingredient testing.
Research and Development
Research is lagging behind international standards and the needs of industry. There are limited
diagnostic laboratories, especially for food safety, production diseases, and feed and milk quality.
There is no capacity for genetic testing to support animal breeding research. The lack of research for
breeding programs and genetic selection could undermine the investment in foreign livestock genetics.
Feed research is minimal.
Improved research capacity is needed to support improved productivity of livestock and feed grain
under Kazakh conditions and to provide local knowledge on adaptation to climate change. Reforming
research would require a review of research programs in light of current international research and
standards. Young researchers could benefit from the opportunity to study overseas and to learn new
research methods. Additionally, investment is required into infrastructure and laboratories for a variety
of agriculture studies (feed analysis, dairy, genetics, among others).
Education, Training, and Extension
Weaknesses exist at the level of both universities and agricultural support call centers. The government
has made extension services a free service to encourage improved management by smallholders.
Stakeholders expressed concerns about the capacity of extension centers to serve the needs of modern
farms. To fill that gap, a German-Kazakh project is providing extension support for innovative
farming methods in a joint program with foreign suppliers active in the Kazakh market. Training is
targeted at giving farmers the skills and knowledge to manage new technologies coming from abroad.
Specialists from Germany, Canada, and other countries are developing and delivering training courses
on a variety of livestock and crop production topics. The program will conclude in 2016 and be handed
over to KazRenovation and two foreign economic partners from 2016 to 2018.
Insurance
Compulsory and subsidized crop insurance is functioning in Kazakhstan but suffers from numerous
problems. These include the lack of proper risk management of the systemic risk through reinsurance;
insufficient insurance tariffs; poorly structured and inefficient system of government subsidies for
indemnity payments; non-existent regulatory oversight over the activities of mutual insurance
associations; and deeply flawed system of claims management and loss adjustment. The government
has looked at insurance models from other countries, often with public-private partnerships and
different insurance pools. Turkey and Germany are considered good models for Kazakhstan.
To improve the current situation in the agricultural insurance the following amendments to the law
may be required:
1) The law should introduce a risk classification of farm lands and specify which crops are eligible
for insurance coverage under the government subsidized program and which regions;
116
2) The law should revise the current approach to the calculation of the indemnity payment by
limiting the component of the farmers’ recoverable operating costs to a fraction of the crop
replacement cost (as determined based on the survey of commercially viable farms);
3) To reduce instances of insurance fraud add a requirement for the insured to follow agricultural
technologies and foresee the right for the insurer of subsequent insurance audits of the insured
agricultural production practices, which can be done remotely through GPS based monitoring
applications.
4) To better align the financial incentives of farmers with those of insurers, introduce a material
deductible which would prevent small claims and petty claims fraud.
5) Introduction of a clear definition of insured loss, e.g. define at which level of drop in crop yields
insurance coverage is activated.
6) Introduce minimum regulatory requirements (including reserving and reinsurance and solvency
margin) for all operators of the government agricultural insurance scheme.
7) The law should consider introducing an area yield index insurance product in lieu of the current
one to improve the quality of coverage and reduce opportunities for fraud.
One factor contributing to the shortage of information is the limited number of meteorological
stations for tracking rainfall and weather. Accurate measurement of precipitation at local points is
required to develop the statistical basis for alternative index based insurance products.
Potential Interventions
The recommendations offered here are based on a holistic, layered approach to addressing agricultural
risk in Kazakhstan. They are based on an in-depth look at the nuanced sources of risk within the broad
areas of feed production, animal health, and finance. Successful programs and pilot projects that could
be scaled up and the relevant institutions for action are identified. Where possible, good regional and
global examples are provided.
Figure 50 illustrates the concept of risk layering. The first layer of high-frequency, low-loss risks is
addressed through mitigation, usually by the producer. The second layer includes low-frequency,
medium-loss events. These are dealt with using risk mitigation and risk transfer. Risk transfer can
include, among other things, insurance programs, risk sharing through contracting, and risk pooling
through collaborative producer actions. These second-layer responses are generally managed through
markets, but may see the involvement of the government either directly or through public-private
partnerships. The third layer deals with very low-frequency, very high-loss disasters. Here risk
mitigation and risk transfer are accompanied by risk-coping (disaster recovery) responses.
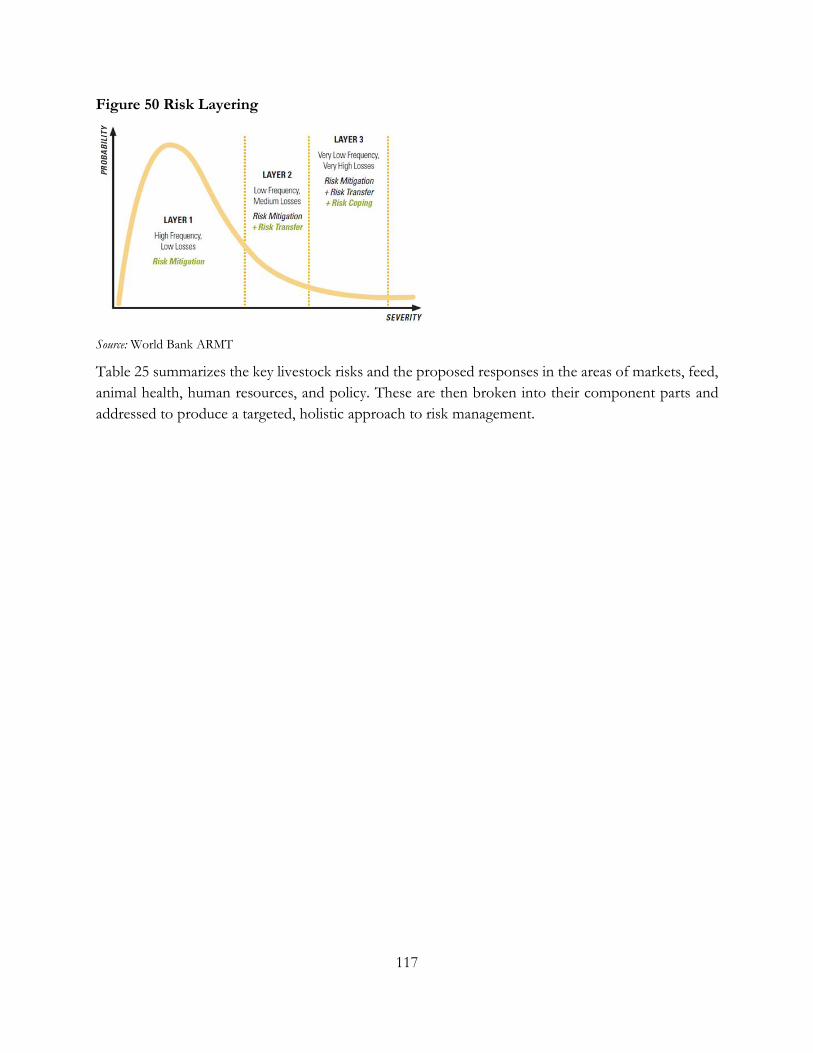
117
Figure 50 Risk Layering
Source: World Bank ARMT
Table 25 summarizes the key livestock risks and the proposed responses in the areas of markets, feed,
animal health, human resources, and policy. These are then broken into their component parts and
addressed to produce a targeted, holistic approach to risk management.
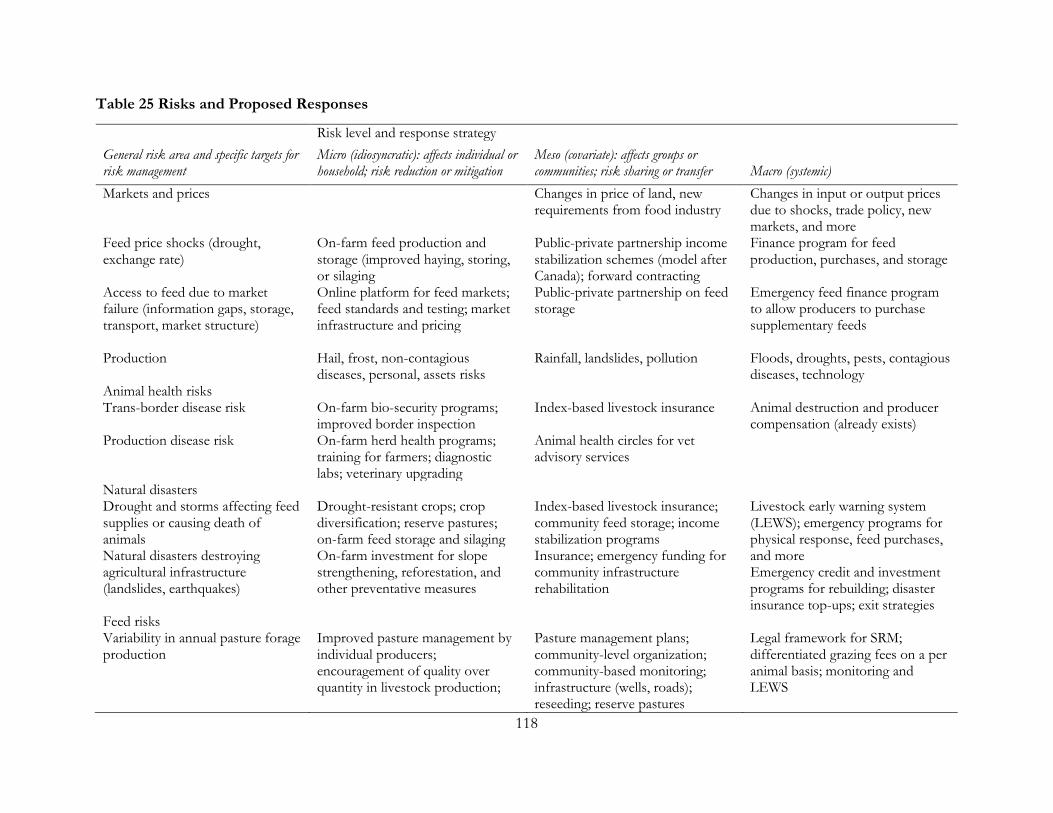
118
Table 25 Risks and Proposed Responses
Risk level and response strategy
General risk area and specific targets for risk management
Micro (idiosyncratic): affects individual or household; risk reduction or mitigation
Meso (covariate): affects groups or communities; risk sharing or transfer Macro (systemic)
Markets and prices Changes in price of land, new requirements from food industry
Changes in input or output prices due to shocks, trade policy, new markets, and more
Feed price shocks (drought, exchange rate)
On-farm feed production and storage (improved haying, storing, or silaging
Public-private partnership income stabilization schemes (model after Canada); forward contracting
Finance program for feed production, purchases, and storage
Access to feed due to market failure (information gaps, storage, transport, market structure)
Online platform for feed markets; feed standards and testing; market infrastructure and pricing
Public-private partnership on feed storage
Emergency feed finance program to allow producers to purchase supplementary feeds
Production Hail, frost, non-contagious
diseases, personal, assets risks Rainfall, landslides, pollution Floods, droughts, pests, contagious
diseases, technology Animal health risks Trans-border disease risk On-farm bio-security programs;
improved border inspection Index-based livestock insurance Animal destruction and producer
compensation (already exists) Production disease risk On-farm herd health programs;
training for farmers; diagnostic labs; veterinary upgrading
Animal health circles for vet advisory services
Natural disasters Drought and storms affecting feed supplies or causing death of animals
Drought-resistant crops; crop diversification; reserve pastures; on-farm feed storage and silaging
Index-based livestock insurance; community feed storage; income stabilization programs
Livestock early warning system (LEWS); emergency programs for physical response, feed purchases, and more Emergency credit and investment programs for rebuilding; disaster insurance top-ups; exit strategies
Natural disasters destroying agricultural infrastructure (landslides, earthquakes)
On-farm investment for slope strengthening, reforestation, and other preventative measures
Insurance; emergency funding for community infrastructure rehabilitation
Feed risks Variability in annual pasture forage production
Improved pasture management by individual producers; encouragement of quality over quantity in livestock production;
Pasture management plans; community-level organization; community-based monitoring; infrastructure (wells, roads); reseeding; reserve pastures
Legal framework for SRM; differentiated grazing fees on a per animal basis; monitoring and LEWS
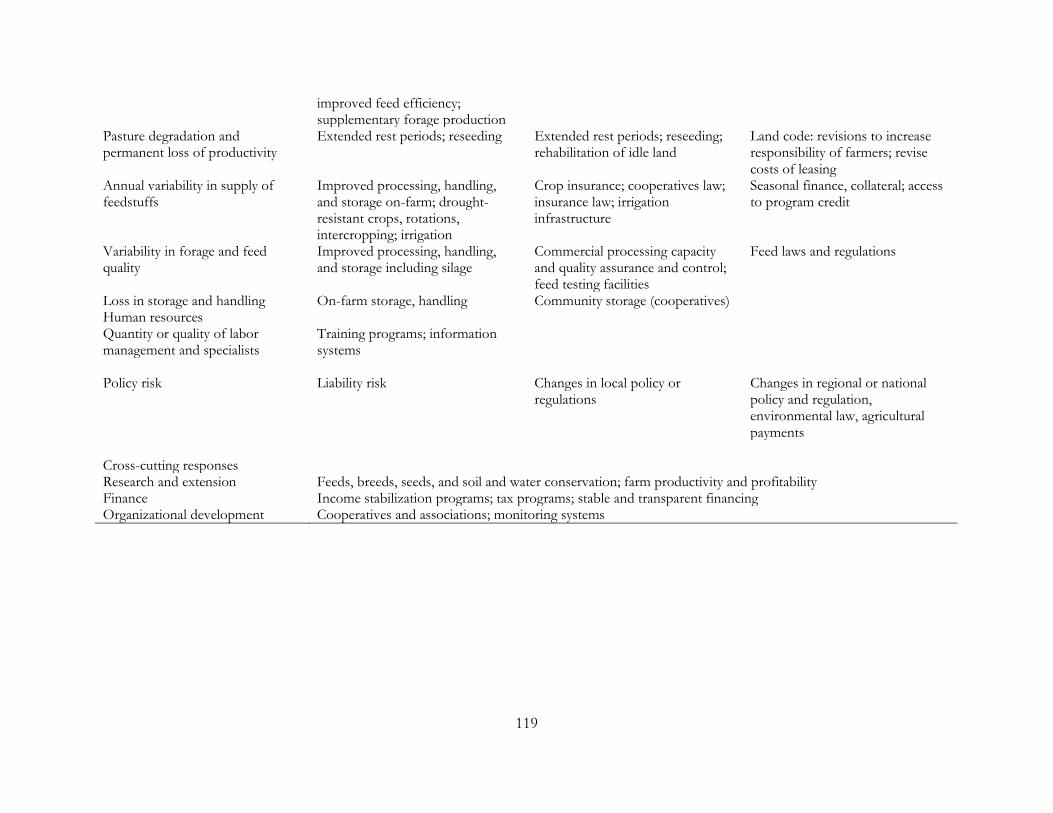
119
improved feed efficiency; supplementary forage production
Pasture degradation and permanent loss of productivity
Extended rest periods; reseeding Extended rest periods; reseeding; rehabilitation of idle land
Land code: revisions to increase responsibility of farmers; revise costs of leasing
Annual variability in supply of feedstuffs
Improved processing, handling, and storage on-farm; drought-resistant crops, rotations, intercropping; irrigation
Crop insurance; cooperatives law; insurance law; irrigation infrastructure
Seasonal finance, collateral; access to program credit
Variability in forage and feed quality
Improved processing, handling, and storage including silage
Commercial processing capacity and quality assurance and control; feed testing facilities
Feed laws and regulations
Loss in storage and handling On-farm storage, handling Community storage (cooperatives) Human resources Quantity or quality of labor management and specialists
Training programs; information systems
Policy risk Liability risk Changes in local policy or
regulations Changes in regional or national policy and regulation, environmental law, agricultural payments
Cross-cutting responses Research and extension Feeds, breeds, seeds, and soil and water conservation; farm productivity and profitability Finance Income stabilization programs; tax programs; stable and transparent financing Organizational development Cooperatives and associations; monitoring systems
120
Livestock Feed and Drought Cycle Management
The appropriate response to a localized, recurring drought should be community preparedness and
response carried out within the parameters of an effective national framework of fully funded policies,
agencies, and programs for protection, preparedness, early warning, response, and recovery.
Specifically, these approaches are defined as follows:
Drought cycle management. Drought is an expected, normal event. Specific indicators can be used to trigger preparation or various response interventions alone or in combination, depending on the nature of the drought conditions. Early and timely response is important and preferable in terms of cost-benefit analysis. For example, destocking allows households to decrease the grazing or feeding pressure while freeing up cash to procure additional feed and medicines or to fund household food purchases.
Community preparedness. Communities should be capable of planning and preparing for both slow and rapid onset emergencies. This can include shelter, feedstocks, water points, livestock vaccination, market development, pasture distribution, and organization of livestock movement to emergency pastures within the local area or in other jurisdictions through reciprocity arrangements with other jurisdictions.
The government-driven trend over the past 25 years—to increase wheat production and,
subsequently, to diversify into highly intensive meat and dairy production—has been fraught with
risks. Diversification of production into multiple crops and less-intensive livestock production can be
an effective strategy for modifying risks. However, cereal crop production and extensive livestock
production are exposed to the same drought risk, as drought threatens crop and pasture forage
production simultaneously. This diversification strategy has to be accompanied by efforts to increase
total feed supplies through improved pasture management, pasture rehabilitation, and supplementary
forage and feed grain production. Harvesting, feed conservation, and storage systems for livestock
feed and feedstuffs need to be in place to allow for year-to-year variations in crop and forage
production. Effective feed markets and transportation need to be in place to facilitate the movement
of feed and feedstuffs around the country. Finally, producers need to have access to affordable
seasonal credit to allow for the production of forage and feed grains and for the purchase of feed and
feedstuffs when on-farm production is insufficient. Research, testing, and extension systems around
livestock feeds and feeding need to put in place to support improvements in feed efficiency.
Community-Based Pasture Management and Monitoring
The model of community-based SRM demonstrated by GEF could be scaled up nationally. This would
provide the organizational framework for mobilizing the Kazakh government’s investments in pasture
infrastructure and livestock productivity. Placing responsibility for pasture management, monitoring,
and planning will increase the community ownership of pasture resources and create the motivation
to manage it sustainably. The beneficiaries of this approach would be the approximately 2 million
households and peasant farms responsible for 75 percent of livestock production. Scale-up should
focus on the southern steppe and semi-desert area, where extensive and semi-extensive livestock
production is concentrated.
121
Local pasture committees will become the functional unit for community-based pasture planning,
management, and monitoring. Their membership will be households and peasant farms using local
pasture. The committees will be responsible for preparing annual pasture management plans. Pasture
plans will use information on pasture condition and forage production to establish the number of
head to be grazed and the timing of seasonal pasture use. Pasture user fees should be charged on a
per animal basis (adjusted by standard LSUs), possibly with different fees according to the condition
of pasture and the species of animal (grazing pressure exerted). These fees should be managed by the
pasture committee and used for pasture infrastructure (wells), pasture rehabilitation (reseeding), and
social needs (yurts, power, satellite phones). Small-scale investment funds managed at the local
government level could be used to provide matching funds (on a grant or loan basis) for larger-scale
investments such as deep wells. Alternatively, or in addition to this, a portion of the national program
for well development could be earmarked for smallholders working through pasture committees or
their appropriate legal entities (that is, a pasture committee’s registered cooperative or shareholder
company).
The local government will play a central role in coordinating pasture management. Roles include
supporting the initial organization of pasture committees, coordinating or supporting pasture
monitoring activities, and ensuring that pasture management plans are submitted annually. The local
government would oversee the use of local matching funds for pasture investment with oversight by
an investment committee.
National organizations would provide technical support and oversight, including the Ministry of
Agriculture, Ministry of Environmental Protection, Land Management Agency, and Ministry of
Economy. Below that, oblast and rayon governments and departments would provide technical
support. Research institutes would play a role in pasture monitoring and analysis, including, among
others, the State Research and Production Center for Livestock Breeding and Veterinary Science, the
Affiliated State Enterprise Institute of Botany and Phyto-introduction, the Kazakh National Agrarian
University, the RSE Kazakh Research Institute on Environment and Climate, and the
KazAgroInnovation knowledge and dissemination centers.
Technical assistance and capacity-building support will be required in several areas for various
stakeholders. Pasture committee members will require training and technical support in pasture
management, monitoring, mapping, rotation, pasture rehabilitation, forage production, livestock
nutrition, and farm management along with other topics. TOT programs will be required for staff of
the innovation centers and other advisory services. Professional upgrading at universities and research
institutes will be required to support pasture research and adaptation. Organizational development
will be required for pasture committees. Management and governance training for pasture committee
members is needed. Likewise, those involved in technical support and advisory roles will need TOT
upgrading.
The GEF project identified constraints in the legal and regulatory framework that need to be
addressed before the SRM approach can be scaled up. The Pasture Law needs to be completed and
the related regulations drafted. Duplication within the legal code needs to be addressed, including the
122
use of remote pastures in the land code. Enforcement mechanism and incentives for SRM need to be
established. Various other legal issues and impediments to livestock mobility include user rights,
migration routes, licenses, and the legal status of herders. Legal recognition of pasture committees
may need to be established.
Implementing an SRM system will require clarification of the institutional responsibilities and
processes for pasture management at the national and lower levels. Currently, responsibility for
pastures is fractured between institutions and levels of government. Effective methods of
coordination between agencies and levels need to be established. Budget allocations may need to be
determined and technical staff and technology added at the provincial and local levels for the daily
work to be carried out effectively.
Pasture Monitoring and Regional Livestock Early Warning System (LEWS)
Local monitoring systems for the purpose of developing pasture management plans need to be
established to support SRM. This information needs to be shared with the national level to establish
a database of forage information. Participatory monitoring systems can help to build local knowledge
of pasture conditions, but the processes used need to be simple and cost-effective. The GreenGold
project in Mongolia and others have used combinations of clipping programs and photographic
sampling.
Most livestock emergencies involve drought. Animals weakened by malnutrition over the drought
period lack the body condition to survive harsh conditions without sufficient supplementary feed and
adequate winter shelter. These are considered “slow onset” emergencies, and good disaster
management systems integrate the information from drought and humanitarian early warning systems
into early decision making.
Early warning systems for drought, weather (including severe weather watches), and humanitarian
crises can be useful in determining the extent of an emergency and supporting sound decision making
regarding emergency response. Drought forecasting systems that integrate information on forage
quantity and quality can provide livestock producers with information necessary to adapt their grazing
patterns and decisions around fodder production and purchases. These systems help policy makers
and agencies to anticipate the location and extent of emergencies, population affected, and potential
needs and give them time to prepare adequate, coordinated responses.
A regional LEWS should be established to monitor pasture conditions in Kazakstan, the Kyrgyz
Republic, and Tajikistan. A joint Kazakh-United States ISTC project (2006–11) tested and
demonstrated pasture-monitoring technologies using remote-sensing and ground information based
on the rangeland growth model “PASTURE.” This system could be scaled up to the national and
regional levels. As the impacts of climate change create the potential for more frequent and severe
droughts, a regional system for drought warning and early response could provide policy makers and
producers with the advance planning required to take mitigating measures (see box 4 for an approach
to early warning in Mongolia).
123
Box 4 LEWS in Mongolia
Mongolia has established a LEWS with the assistance of the World Bank, Mercy Corp, and Texas
A&M University. LEWS integrates satellite monitoring and physical sampling to provide forage and
carrying-capacity reports and forecasts. This system will provide nationwide data and be
institutionalized at the National Agency of Meteorology, Hydrology, and Environmental
Monitoring, which conducts regular forage sampling that the LEWS will use to verify its forecasting
system to a high degree of reliability.
Source: World Bank 2011b
Pasture Rehabilitation and Reestablishment
Pasture rehabilitation should be part of a national program to preserve pasture area and potential.
Margin lands where wheat production has been abandoned or cannot be produced sustainably should
be converted back to pasture using the techniques successfully demonstrated through the World Bank
DMP. A program could be developed where pasture committees and individual farmers can apply for
government matching grants or loans for the purpose of rehabilitating or reestablishing pasture.
Technical assistance and training will have to be provided to farmers and herders. Equipment and
seed should be made available. Equipment could be on a lease or a rental basis. Research into varieties
and pasture establishment methods should be carried out.
Supplementary Feed Production, Conservation, and Storage
Supplementary feeds in the form of forage crops and feed grains are important for sustaining livestock
through winter and providing the reserve feeds necessary to keep livestock off early spring pastures,
when grass needs to attain a minimum level of growth prior to grazing. Three main approaches are
taken to providing supplemental feeds: (1) grow perennial hay crops, either native or seeded grasses
and legumes, and use either cut and baled or left as “standing hay crops,” (2) grow annual fodder
crops (such as oats and barley) and harvest and bale them before maturity to feed as “greenfeed” or
preserve as silage, and (3) grow feed grains (oats, barley) to maturity and use as high-energy feeds.
Additional sources of feed include crop by-products (distillers mash, canola, and soybean meal).
Promoting forage production by livestock producers requires various supporting activities.
Haymaking areas need to be allocated and, in most cases, fenced to ensure that livestock do not
consume the crop before it is harvested. Fencing is a major long-term investment and requires
materials and finance. Improving the stand of forage requires top seeding or reseeding and
fertilization. Seed must be purchased, and suitable equipment for seeding must be purchased or rented.
In many semi-arid locations, forage establishment is not possible without supplementary irrigation.
The introduction of more sustainable crop rotations into the grain sector can significantly increase the
supply of supplementary feedstuffs, provided there is suitable market incentive for crop producers to
do so. Crop rotations can include feed grains and legumes (alfalfa, field peas), which provide the added
benefit of nitrogen fixing. Integrating perennial pasture or forages and grain crops in long rotations
can have beneficial impacts on soil quality and crop yields. Introducing alfalfa or other nitrogen-fixing
124
legumes in a four-year rotation can improve soil fertility and disrupt weed and disease cycles, thus
decreasing input costs. Additional benefits include control of soil erosion and improved wildlife
habitat.
Switching to feed grains from a primary cash crop such as wheat may not provide sufficient economic
return to the farm business. In Canada, which has a similar cold climate and short growing season,
research has shown that intercropping spring and winter cereals (spring wheat with winter wheat or
fall rye) can extend the grazing season into the late fall without removing the main economic crop.
Another form of intercropping involves seeding annual crops such as barley into living mulch, an
established legume cover crop.
In Kazakhstan, where agroclimatic variation is wide, crop production is concentrated in the north,
and extensive livestock is concentrated in the south, transportation costs become critical. Given the
high feed conversion ratios in livestock production (6 to 9 kilograms of feed to produce 1 kilogram
of beef), it is always more economical to move livestock to the feed than to move feed to the livestock.
Efficient use of potential livestock feed resources suggests that the southern, semi-arid regions would
eventually focus on cow-calf and young sheep production using pasture and supplementary forages,
while livestock feeding and finishing would be concentrated in the north, where supplementary feeds
are grown in conjunction with cereal crops. This points to the future development of efficient markets
and transportation for livestock and feed. This approach increased the annual offtake of animals,
which reduces grazing pressure on pastures and accelerates cash flow for livestock producers.
The conservation and storage of feed need to be improved. Hay cut late and stored loose or in loose
bales is prone to high losses from breakage, sun, and water. As a result, little can be stored into
subsequent years. Proper conservation and storage can allow hay to be stored and to retain good
nutritional quality for multiple years. This is important for the ability to hold reserve supplies for use
during droughts and their aftermath. Methods of conservation range from the simple to the complex
and can include dense baling (large or small), round bales, bagging, and silaging. Improved storage
ranges from simple tarping to roofs or buildings. Silaging can be done in pits or silos, but pits are
economical and easy to construct. All of these approaches require some level of investment supported
by information and training for producers. Research into feed efficiency and economic returns should
underpin the introduction of any improved conservation and storage systems.
Agriculture-2020 is already supporting forage production, with the introduction of barley into
rotations being the most successful. Improving the overall effectiveness of the program by
encouraging improved fodder production by all producers across a range of agroclimatic zones could
involve the following:
Revise program criteria and mechanisms to ensure better access to smallholders, possibly through loans and grants to pasture committees or their legal cooperatives.
Integrate or revise a portion of the forage program as a payment for environmental services (PES) approach to incentivize producers to establish perennial forage stands and improve pasture productivity and, in the crop sector, introduce long rotations involving perennial forages.
125
Support the program with applied research and development that would involve variety trials, demonstrations and research into intercropping, and rotations that are technically feasible and economically viable in Kazakhstan’s environment and market.
Provide practical, hands-on training to livestock and crop producers on how to manage forage production and livestock feeds.
Research, Testing, and Extension
Kazakhstan’s research system needs to be revitalized to serve the needs of the agriculture sector as it
modernizes to compete in global markets and survive in the shifting environment caused by climate
change. Research programs need to be relevant within the current network of international research.
Researchers need to upgrade their academic training and research skills and be provided with the
laboratory and other research facilities and mandate needed to conduct research that is relevant to the
needs of industry. Research into drought-resistant varieties of cereals, feed grains, and forage crops
needs to be undertaken. Research into livestock feeds, feeding, and feed efficiency should be given
high priority.
The feed sector needs to be supported with research, testing, and extension (see box 5 for an example
from China). A feed testing laboratory fully capable of testing feeds and feed ingredients and screening
for contamination and adulteration should be in place to serve the industry. Building local capacity to
develop least-cost feed rations is required. Producer understanding of livestock nutrition feeds and
feeding is fundamental to creating the motivation to invest in improved pasture management and
supplementary feed production.
Box 5 The Canada-China Feed Industry Project
The Canada-China Feed Industry Project established a national feed testing laboratory in Beijing.
The program worked with feed millers across the country to improve feed milling facilities and
quality control processes. Least-cost ration formulation was introduced. The project helped to
modernize the Chinese livestock feed industry and helped to improve feed utilization in China.
Source: Agriteam Canada 2005.
Animal Health
Programs to protect animals from foreign diseases and control of infectious disease from neighboring
countries should be reinforced. A regional animal health program should be considered. Domestically,
greater emphasis should be placed on the diagnosis and control of production diseases. These diseases
(for example, internal and external parasites, mastitis, and IBF) can have significant impacts on the
quality and marketability of livestock products, decrease feed efficiency to a level that significantly
affects profitability and competitiveness, and result in livestock death. In terms of optimizing the use
of feed resources, the control of parasites is particularly important.
Investments in improved management of production disease should include diagnostic systems
capable of detecting the specific strains of disease so that accurate diagnosis and treatments can be
126
made. Veterinary upgrading needs to be undertaken. Farmer training needs to build awareness of the
impacts of production disease and the prevention, detection, and treatment of disease.
Livestock Insurance
Kazakhstan may consider introducing indexed-based livestock insurance, as has been introduced in
Mongolia with the assistance of a World Bank-financed project. Index-based insurance operates using
aggregate livestock mortality rates by species and geographic area (county) rather than by individual
household. The approach combines the three layers of risk response: self-insurance, market-based
insurance, and social safety net. If losses are low and do not threaten the viability of their business,
herders cover the cost themselves. If losses are larger, the private insurance industry pays. In the case
of catastrophic loss, the government bears the cost. Insurance is provided through partnerships with
private insurance companies. In Mongolia, the total contribution from the World Bank through the
pilot phase to 2010 and additional funding for scale-up to the national level was US$17.75 million with
co-financing provided by the Japanese government.
A pilot project could be considered in Kazakhstan, to introduce suitable pasture and/or livestock
insurance. The project should be preceded by an in-depth feasibility study of the available insurance
instruments, their suitability for Kazakhstan’s conditions, an in-depth assessment of the insurance
instrument, legal framework, as well as implementation modalities and ownership structure of the
facility.
Investment and Seasonal Credit
Access to credit is necessary for producers to invest in risk mitigation. This includes longer-term
investment in assets for feed production, conservation, and storage as well as on-farm infrastructure
for water and other environmental assets (retaining walls, berms).
Seasonal credit is required to plant forage and fodder crops or to purchase feeds prior to winter. Given
the relatively thin margins typical in agriculture, the long growing and storage periods, and the large
amounts of funds required for inputs or feed, operating credit needs to be available at low rates. The
reverse argument is that productivity levels of crops and livestock must be high enough to generate a
positive return over interest carrying charges. Seasonal credit products should be developed to:
Allow producers to finance using the expected crop or future sale of livestock as collateral
Link access to credit to the use of crop or livestock insurance to safeguard the loan in case of crop failure or livestock loss
Support good risk analysis and planning by including productivity and profitability assessments and collecting those assessments to create a database of agricultural performance data to support farm management, investment, and lending decision making. The International Finance Corporation has developed a tool that provides this type of analysis.
Organizational Development
Numerous organizations require capacity development to carry out their roles in the global
marketplace and in the face of climate change. Strengthening is required within organizations and in
127
the coordination between organizations at the national, provincial, and local levels. Capacity
development should be a central part of any program undertaken. Some of the target organizations
should include the following:
Producer groups. Pasture committees, cooperatives, and producer associations should be provided with training and technical support for governance, management, strategic planning, and member services.
Provincial and local government. Oblast departments of agriculture and oblast-level R&D institutes should be strengthened to support SRM and local community initiatives.
Research institutes. Many Kazakh research institutes, which are generating high-quality research on pasture management and natural resource management, need additional support and funding to be able to support broader implementation of SRM approaches and new approaches in livestock nutrition and crop production. This includes the Kazakh Scientific Research Institute of Animal Husbandry and Forage Production, National Center of Space Research and Technology, Regional Environmental Center for Central Asia, Institute of Ecology and Sustainable Development, Kazakh Water Resources Research and Development Institute (Astana), Institute of Geography, and Analytical Center of Economic Policy in Agriculture.
Line ministries. Ministry of Agriculture, Ministry of Natural Resources, Ministry of Finance.
Extension services. KazAgroInnovation and its centers, private advisory services, and technical support services provided by input suppliers.
Subsidy Reform and Disaster Relief
With accession to the WTO, Kazakhstan may have to reform its agricultural support programs. In
line with principals to decrease distortions in the sector, Kazakhstan may have to move from subsidies
that currently fall in the WTO Amber Box (price supports, deficiency payments, and stabilization
payments based on current output or area) to smart subsidies that fit within the WTO Green Box and
are less market distorting and less likely to promote environmental degradation. PES approaches could
be adopted and used to facilitate pasture rehabilitation and SRM. WTO Green Box includes support
for extension, pest and disease control, inspection services, and specific categories of insurance and
disaster relief payments, all of which are needed in Kazakhstan. Other support tools to consider
include tax easing and averaging and income stabilization programs.
Instead of responding in an ad hoc manner to disasters, disaster relief programs should be designed
that clearly define eligibility for participation. Mechanisms for assessment, compensation, and
distribution of funds should be established. Payments could be designed in two streams: for the
compensation of income losses and for the repair or replacement of damaged infrastructure and
productive assets.
The reform of support and disaster response programs should be assessed for their efficiency and
beneficiary impact. Programs should be developed within the concept of drought cycle management
and community preparedness. The devolution of budget and program management to the community
level should be considered where possible.
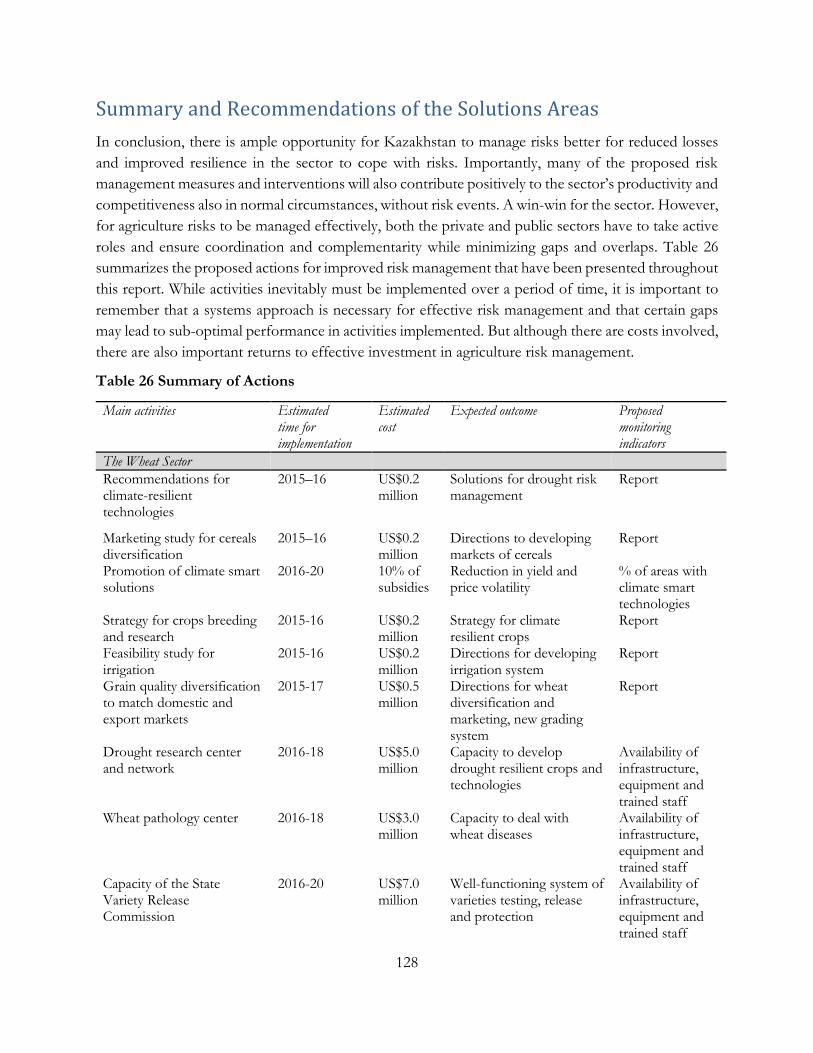
128
Summary and Recommendations of the Solutions Areas
In conclusion, there is ample opportunity for Kazakhstan to manage risks better for reduced losses
and improved resilience in the sector to cope with risks. Importantly, many of the proposed risk
management measures and interventions will also contribute positively to the sector’s productivity and
competitiveness also in normal circumstances, without risk events. A win-win for the sector. However,
for agriculture risks to be managed effectively, both the private and public sectors have to take active
roles and ensure coordination and complementarity while minimizing gaps and overlaps. Table 26
summarizes the proposed actions for improved risk management that have been presented throughout
this report. While activities inevitably must be implemented over a period of time, it is important to
remember that a systems approach is necessary for effective risk management and that certain gaps
may lead to sub-optimal performance in activities implemented. But although there are costs involved,
there are also important returns to effective investment in agriculture risk management.
Table 26 Summary of Actions
Main activities Estimated time for implementation
Estimated cost
Expected outcome Proposed monitoring indicators
The Wheat Sector
Recommendations for climate-resilient technologies
2015–16 US$0.2 million
Solutions for drought risk management
Report
Marketing study for cereals diversification
2015–16 US$0.2 million
Directions to developing markets of cereals
Report
Promotion of climate smart solutions
2016-20 10% of subsidies
Reduction in yield and price volatility
% of areas with climate smart technologies
Strategy for crops breeding and research
2015-16 US$0.2 million
Strategy for climate resilient crops
Report
Feasibility study for irrigation
2015-16 US$0.2 million
Directions for developing irrigation system
Report
Grain quality diversification to match domestic and export markets
2015-17 US$0.5 million
Directions for wheat diversification and marketing, new grading system
Report
Drought research center and network
2016-18 US$5.0 million
Capacity to develop drought resilient crops and technologies
Availability of infrastructure, equipment and trained staff
Wheat pathology center 2016-18 US$3.0 million
Capacity to deal with wheat diseases
Availability of infrastructure, equipment and trained staff
Capacity of the State Variety Release Commission
2016-20 US$7.0 million
Well-functioning system of varieties testing, release and protection
Availability of infrastructure, equipment and trained staff
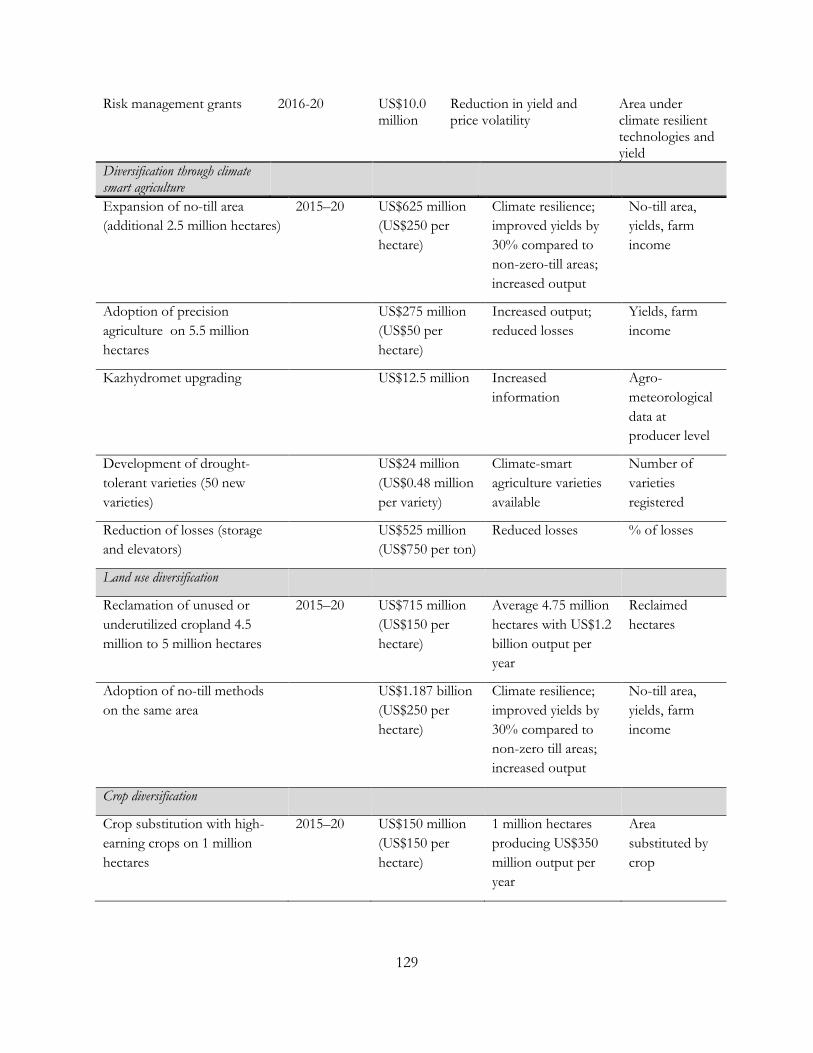
129
Risk management grants 2016-20 US$10.0 million
Reduction in yield and price volatility
Area under climate resilient technologies and yield
Diversification through climate smart agriculture
Expansion of no-till area
(additional 2.5 million hectares)
2015–20 US$625 million
(US$250 per
hectare)
Climate resilience;
improved yields by
30% compared to
non-zero-till areas;
increased output
No-till area,
yields, farm
income
Adoption of precision
agriculture on 5.5 million
hectares
US$275 million
(US$50 per
hectare)
Increased output;
reduced losses
Yields, farm
income
Kazhydromet upgrading US$12.5 million Increased
information
Agro-
meteorological
data at
producer level
Development of drought-
tolerant varieties (50 new
varieties)
US$24 million
(US$0.48 million
per variety)
Climate-smart
agriculture varieties
available
Number of
varieties
registered
Reduction of losses (storage
and elevators)
US$525 million
(US$750 per ton)
Reduced losses % of losses
Land use diversification
Reclamation of unused or
underutilized cropland 4.5
million to 5 million hectares
2015–20 US$715 million
(US$150 per
hectare)
Average 4.75 million
hectares with US$1.2
billion output per
year
Reclaimed
hectares
Adoption of no-till methods
on the same area
US$1.187 billion
(US$250 per
hectare)
Climate resilience;
improved yields by
30% compared to
non-zero till areas;
increased output
No-till area,
yields, farm
income
Crop diversification
Crop substitution with high-
earning crops on 1 million
hectares
2015–20 US$150 million
(US$150 per
hectare)
1 million hectares
producing US$350
million output per
year
Area
substituted by
crop
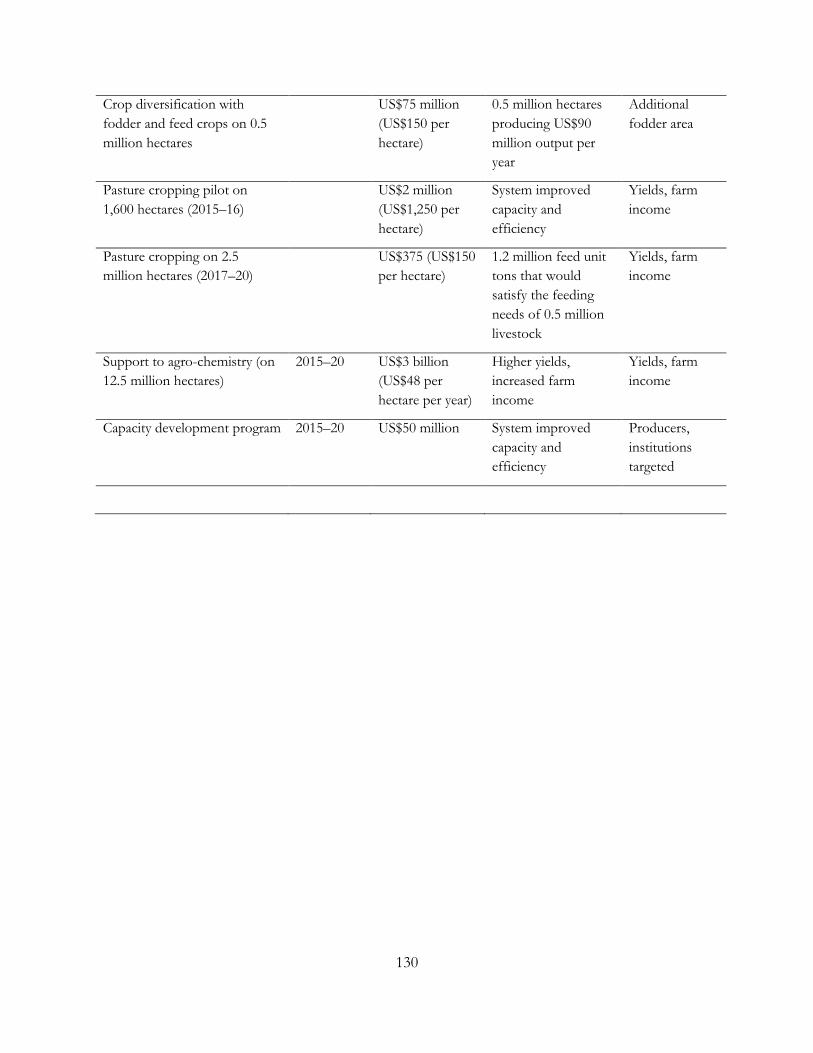
130
Crop diversification with
fodder and feed crops on 0.5
million hectares
US$75 million
(US$150 per
hectare)
0.5 million hectares
producing US$90
million output per
year
Additional
fodder area
Pasture cropping pilot on
1,600 hectares (2015–16)
US$2 million
(US$1,250 per
hectare)
System improved
capacity and
efficiency
Yields, farm
income
Pasture cropping on 2.5
million hectares (2017–20)
US$375 (US$150
per hectare)
1.2 million feed unit
tons that would
satisfy the feeding
needs of 0.5 million
livestock
Yields, farm
income
Support to agro-chemistry (on
12.5 million hectares)
2015–20 US$3 billion
(US$48 per
hectare per year)
Higher yields,
increased farm
income
Yields, farm
income
Capacity development program 2015–20 US$50 million System improved
capacity and
efficiency
Producers,
institutions
targeted
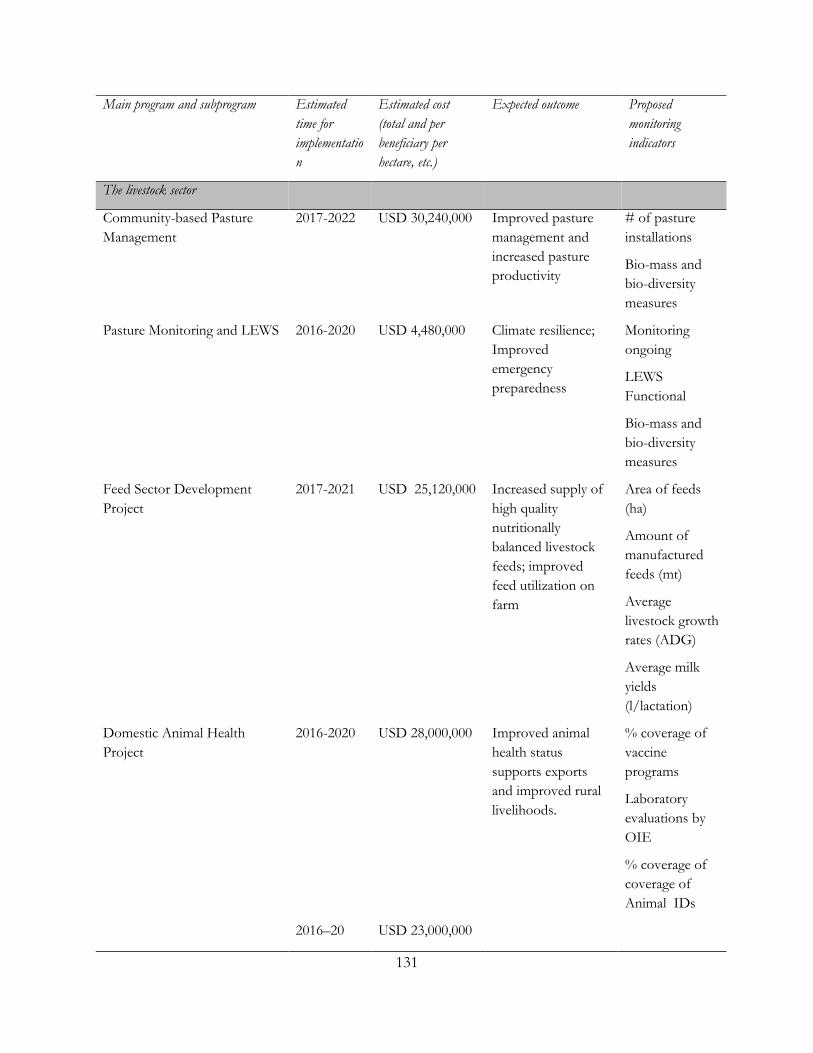
131
Main program and subprogram Estimated
time for
implementatio
n
Estimated cost
(total and per
beneficiary per
hectare, etc.)
Expected outcome Proposed
monitoring
indicators
The livestock sector
Community-based Pasture
Management
2017-2022
USD 30,240,000 Improved pasture
management and
increased pasture
productivity
# of pasture
installations
Bio-mass and
bio-diversity
measures
Pasture Monitoring and LEWS 2016-2020 USD 4,480,000 Climate resilience;
Improved
emergency
preparedness
Monitoring
ongoing
LEWS
Functional
Bio-mass and
bio-diversity
measures
Feed Sector Development
Project
2017-2021 USD 25,120,000 Increased supply of
high quality
nutritionally
balanced livestock
feeds; improved
feed utilization on
farm
Area of feeds
(ha)
Amount of
manufactured
feeds (mt)
Average
livestock growth
rates (ADG)
Average milk
yields
(l/lactation)
Domestic Animal Health
Project
2016-2020 USD 28,000,000 Improved animal
health status
supports exports
and improved rural
livelihoods.
% coverage of
vaccine
programs
Laboratory
evaluations by
OIE
% coverage of
coverage of
Animal IDs
2016–20 USD 23,000,000
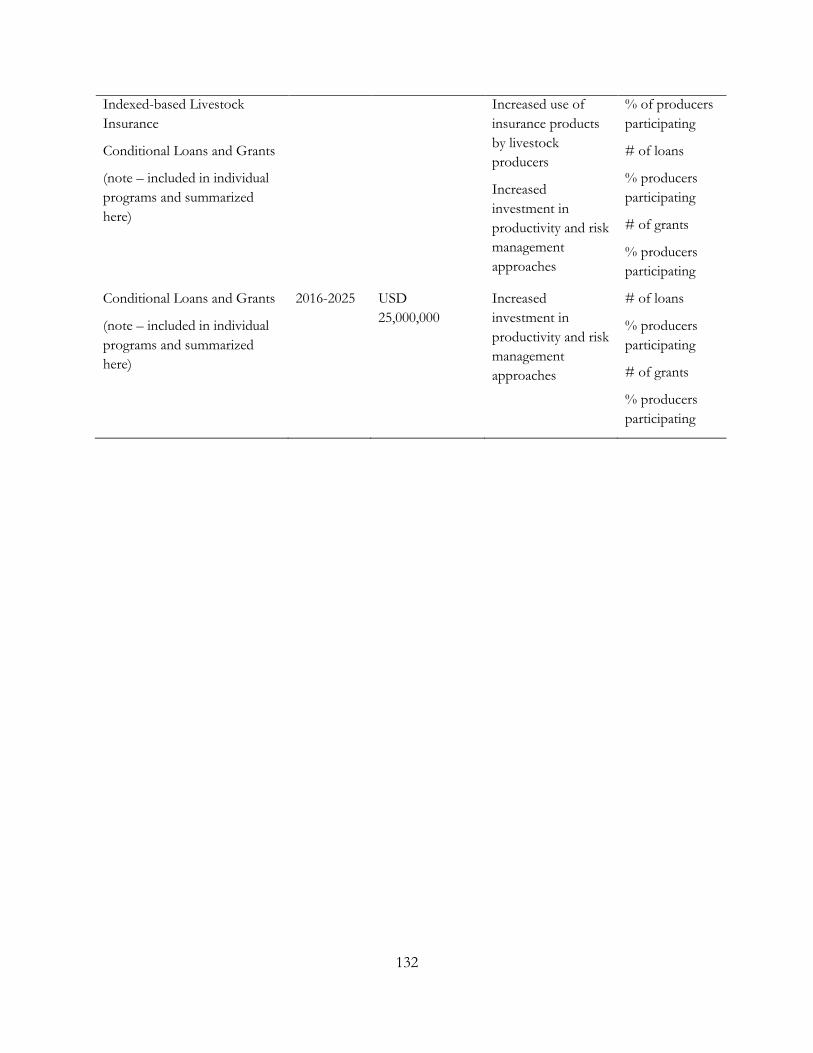
132
Indexed-based Livestock
Insurance
Conditional Loans and Grants
(note – included in individual
programs and summarized
here)
Increased use of
insurance products
by livestock
producers
Increased
investment in
productivity and risk
management
approaches
% of producers
participating
# of loans
% producers
participating
# of grants
% producers
participating
Conditional Loans and Grants
(note – included in individual
programs and summarized
here)
2016-2025 USD
25,000,000
Increased
investment in
productivity and risk
management
approaches
# of loans
% producers
participating
# of grants
% producers
participating
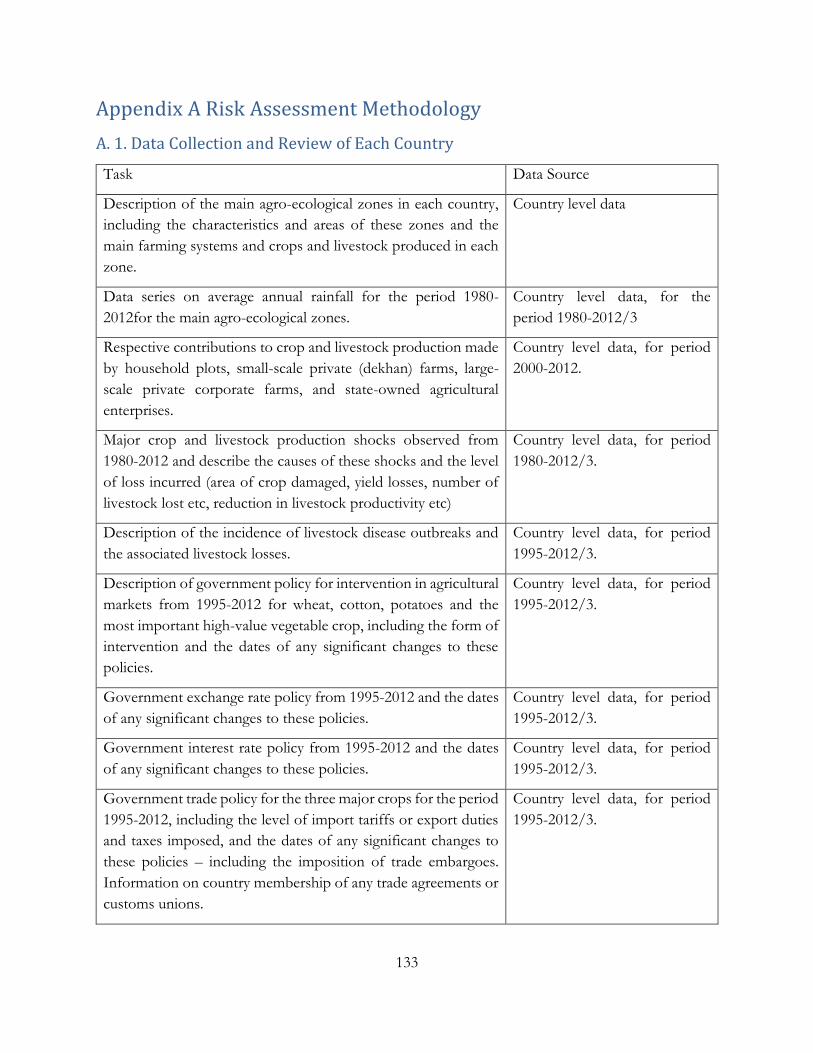
133
Appendix A Risk Assessment Methodology
A. 1. Data Collection and Review of Each Country
Task Data Source
Description of the main agro-ecological zones in each country,
including the characteristics and areas of these zones and the
main farming systems and crops and livestock produced in each
zone.
Country level data
Data series on average annual rainfall for the period 1980-
2012for the main agro-ecological zones.
Country level data, for the
period 1980-2012/3
Respective contributions to crop and livestock production made
by household plots, small-scale private (dekhan) farms, large-
scale private corporate farms, and state-owned agricultural
enterprises.
Country level data, for period
2000-2012.
Major crop and livestock production shocks observed from
1980-2012 and describe the causes of these shocks and the level
of loss incurred (area of crop damaged, yield losses, number of
livestock lost etc, reduction in livestock productivity etc)
Country level data, for period
1980-2012/3.
Description of the incidence of livestock disease outbreaks and
the associated livestock losses.
Country level data, for period
1995-2012/3.
Description of government policy for intervention in agricultural
markets from 1995-2012 for wheat, cotton, potatoes and the
most important high-value vegetable crop, including the form of
intervention and the dates of any significant changes to these
policies.
Country level data, for period
1995-2012/3.
Government exchange rate policy from 1995-2012 and the dates
of any significant changes to these policies.
Country level data, for period
1995-2012/3.
Government interest rate policy from 1995-2012 and the dates
of any significant changes to these policies.
Country level data, for period
1995-2012/3.
Government trade policy for the three major crops for the period
1995-2012, including the level of import tariffs or export duties
and taxes imposed, and the dates of any significant changes to
these policies – including the imposition of trade embargoes.
Information on country membership of any trade agreements or
customs unions.
Country level data, for period
1995-2012/3.
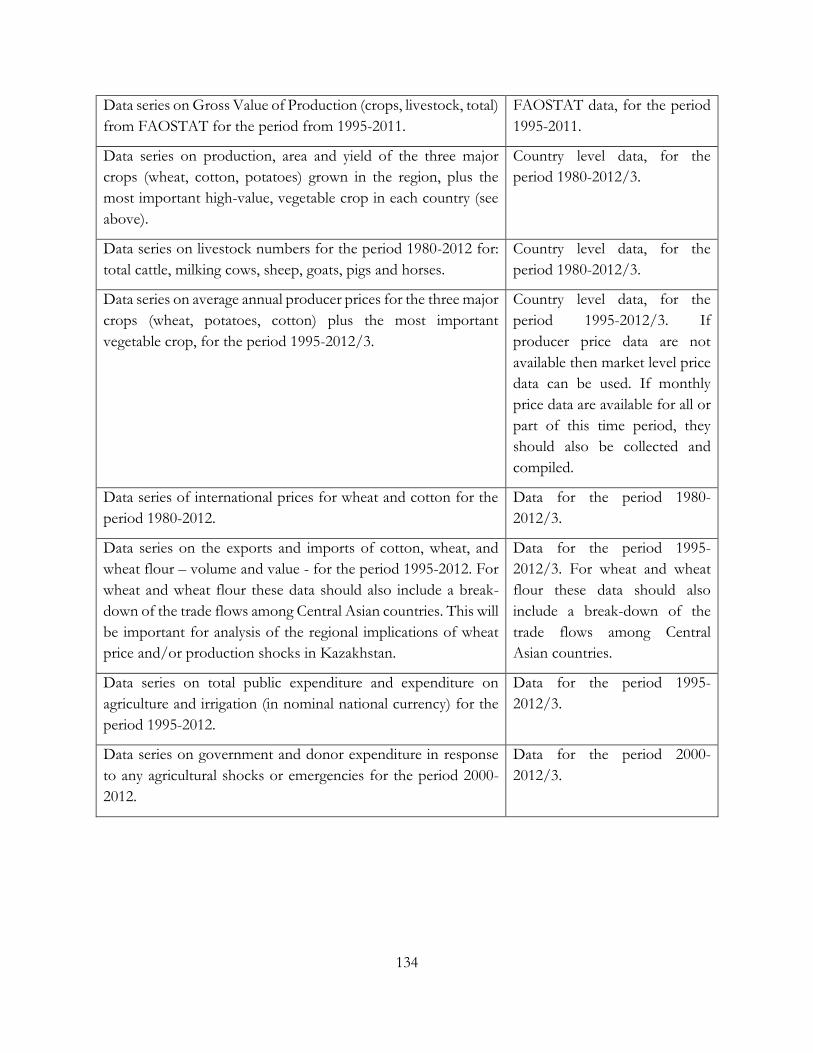
134
Data series on Gross Value of Production (crops, livestock, total)
from FAOSTAT for the period from 1995-2011.
FAOSTAT data, for the period
1995-2011.
Data series on production, area and yield of the three major
crops (wheat, cotton, potatoes) grown in the region, plus the
most important high-value, vegetable crop in each country (see
above).
Country level data, for the
period 1980-2012/3.
Data series on livestock numbers for the period 1980-2012 for:
total cattle, milking cows, sheep, goats, pigs and horses.
Country level data, for the
period 1980-2012/3.
Data series on average annual producer prices for the three major
crops (wheat, potatoes, cotton) plus the most important
vegetable crop, for the period 1995-2012/3.
Country level data, for the
period 1995-2012/3. If
producer price data are not
available then market level price
data can be used. If monthly
price data are available for all or
part of this time period, they
should also be collected and
compiled.
Data series of international prices for wheat and cotton for the
period 1980-2012.
Data for the period 1980-
2012/3.
Data series on the exports and imports of cotton, wheat, and
wheat flour – volume and value - for the period 1995-2012. For
wheat and wheat flour these data should also include a break-
down of the trade flows among Central Asian countries. This will
be important for analysis of the regional implications of wheat
price and/or production shocks in Kazakhstan.
Data for the period 1995-
2012/3. For wheat and wheat
flour these data should also
include a break-down of the
trade flows among Central
Asian countries.
Data series on total public expenditure and expenditure on
agriculture and irrigation (in nominal national currency) for the
period 1995-2012.
Data for the period 1995-
2012/3.
Data series on government and donor expenditure in response
to any agricultural shocks or emergencies for the period 2000-
2012.
Data for the period 2000-
2012/3.
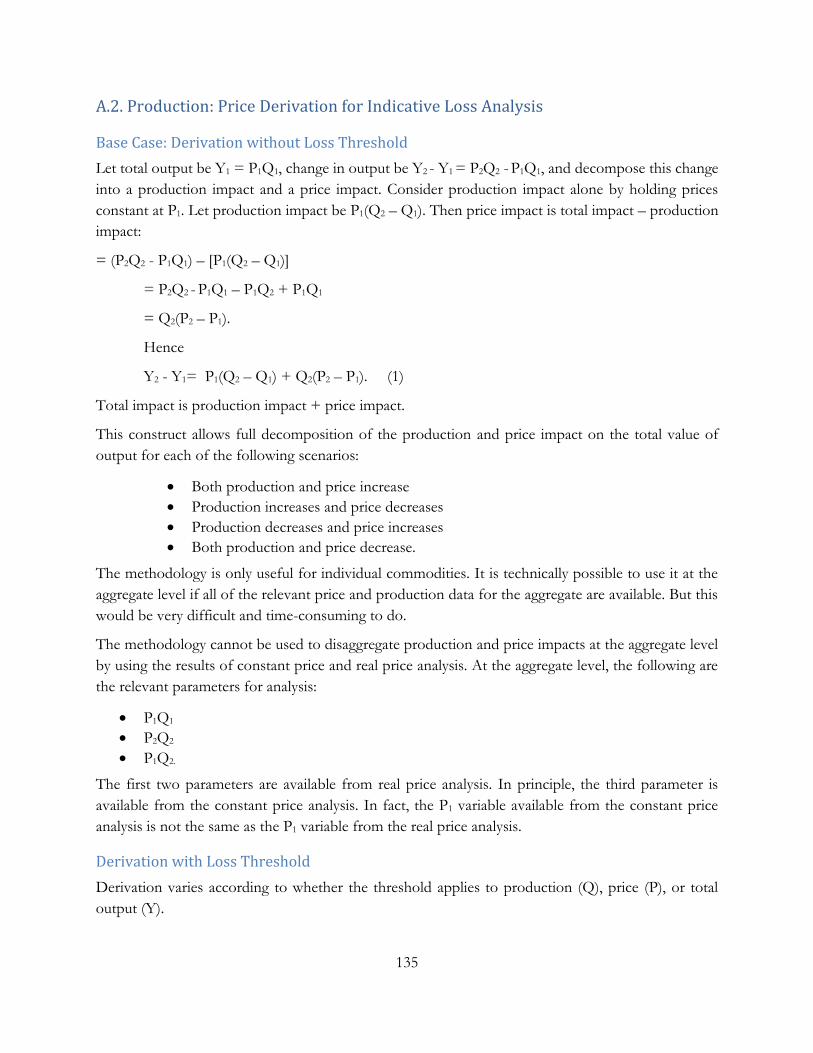
135
A.2. Production: Price Derivation for Indicative Loss Analysis
Base Case: Derivation without Loss Threshold
Let total output be Y1 = P1Q1, change in output be Y2 - Y1 = P2Q2 - P1Q1, and decompose this change
into a production impact and a price impact. Consider production impact alone by holding prices
constant at P1. Let production impact be P1(Q2 – Q1). Then price impact is total impact – production
impact:
= (P2Q2 - P1Q1) – [P1(Q2 – Q1)]
= P2Q2 - P1Q1 – P1Q2 + P1Q1
= Q2(P2 – P1).
Hence
Y2 - Y1= P1(Q2 – Q1) + Q2(P2 – P1). (1)
Total impact is production impact + price impact.
This construct allows full decomposition of the production and price impact on the total value of
output for each of the following scenarios:
Both production and price increase
Production increases and price decreases
Production decreases and price increases
Both production and price decrease.
The methodology is only useful for individual commodities. It is technically possible to use it at the
aggregate level if all of the relevant price and production data for the aggregate are available. But this
would be very difficult and time-consuming to do.
The methodology cannot be used to disaggregate production and price impacts at the aggregate level
by using the results of constant price and real price analysis. At the aggregate level, the following are
the relevant parameters for analysis:
P1Q1
P2Q2
P1Q2.
The first two parameters are available from real price analysis. In principle, the third parameter is
available from the constant price analysis. In fact, the P1 variable available from the constant price
analysis is not the same as the P1 variable from the real price analysis.
Derivation with Loss Threshold
Derivation varies according to whether the threshold applies to production (Q), price (P), or total
output (Y).
136
Where the loss threshold applies to production alone (Q), threshold = wQ1, where w = loss threshold in
percentage (for example, 0.1). Substitute Q1* for Q1, where Q1* = Q1 – wQ1.
Then indicative loss = Y2 - Y1 = P1(Q2 – Q*1) + Q2(P2 – P1). Price impact is unchanged in this scenario.
Production impact falls by the amount equivalent to the threshold.
Where the loss threshold applies to price alone (P), threshold = wP1, where w = loss threshold in percentage
(for example, 0.1). Substitute P1* for P1 where P1* = P1 – wP1. Then indicative loss = Y2 - Y1 = P*1(Q2
– Q1) + Q2(P2 – P*1). Price threshold affects both production and price impacts.
Where the loss threshold applies to total output (Y), threshold = wP1Q1, where w = loss threshold in
percentage (for example, 0.1). Let Y1* = Y1 - wP1Q1. Then indicative loss = Y2 – Y1* = Y2 – (Y1 -
wP1Q1) = (Y2 – Y1) + wP1Q1 = P1(Q2 – Q1) + Q2(P2 – P1) + wP1Q1.
Rearranging
= P1Q2 – P1Q1 + wP1Q1 + Q2(P2 – P1)
= P1(Q2 – Q1 + wQ1) + Q2(P2 – P1)
= P1[Q2 + Q1(w – 1)] + Q2(P2 – P1).
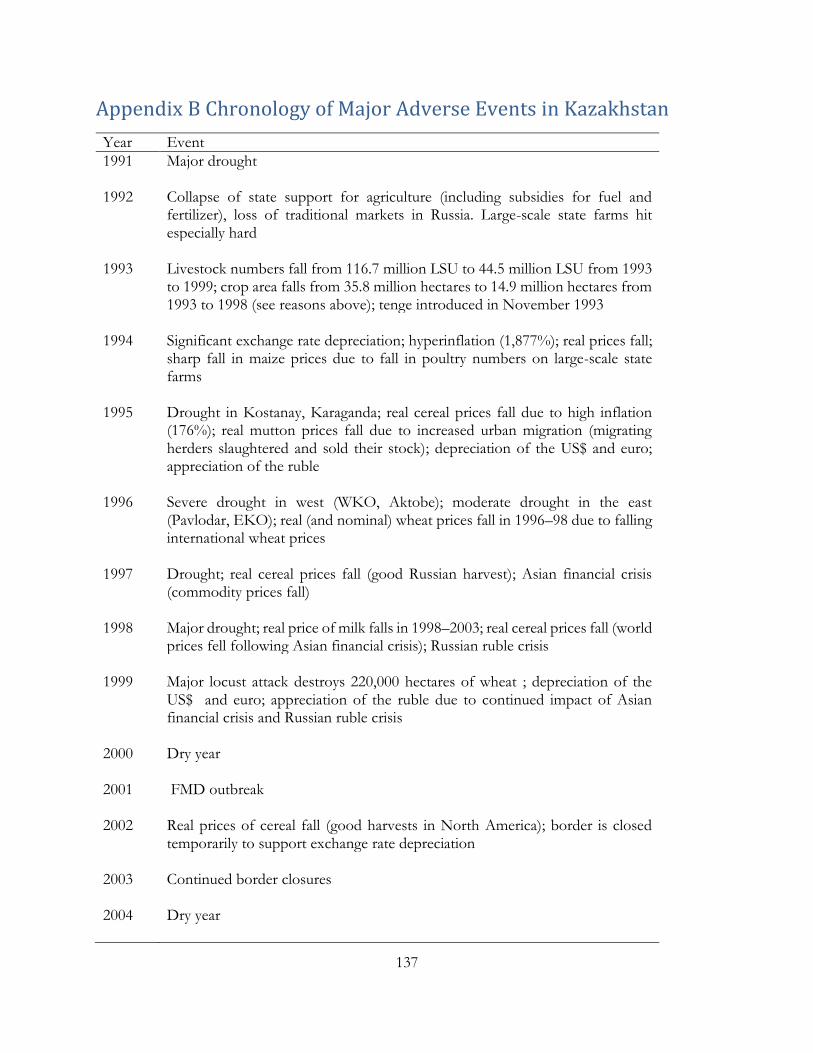
137
Appendix B Chronology of Major Adverse Events in Kazakhstan
Year Event
1991 Major drought 1992 Collapse of state support for agriculture (including subsidies for fuel and
fertilizer), loss of traditional markets in Russia. Large-scale state farms hit especially hard
1993 Livestock numbers fall from 116.7 million LSU to 44.5 million LSU from 1993
to 1999; crop area falls from 35.8 million hectares to 14.9 million hectares from 1993 to 1998 (see reasons above); tenge introduced in November 1993
1994 Significant exchange rate depreciation; hyperinflation (1,877%); real prices fall;
sharp fall in maize prices due to fall in poultry numbers on large-scale state farms
1995 Drought in Kostanay, Karaganda; real cereal prices fall due to high inflation
(176%); real mutton prices fall due to increased urban migration (migrating herders slaughtered and sold their stock); depreciation of the US$ and euro; appreciation of the ruble
1996 Severe drought in west (WKO, Aktobe); moderate drought in the east
(Pavlodar, EKO); real (and nominal) wheat prices fall in 1996–98 due to falling international wheat prices
1997 Drought; real cereal prices fall (good Russian harvest); Asian financial crisis
(commodity prices fall) 1998 Major drought; real price of milk falls in 1998–2003; real cereal prices fall (world
prices fell following Asian financial crisis); Russian ruble crisis 1999 Major locust attack destroys 220,000 hectares of wheat ; depreciation of the
US$ and euro; appreciation of the ruble due to continued impact of Asian financial crisis and Russian ruble crisis
2000 Dry year 2001 FMD outbreak 2002 Real prices of cereal fall (good harvests in North America); border is closed
temporarily to support exchange rate depreciation 2003 Continued border closures 2004 Dry year
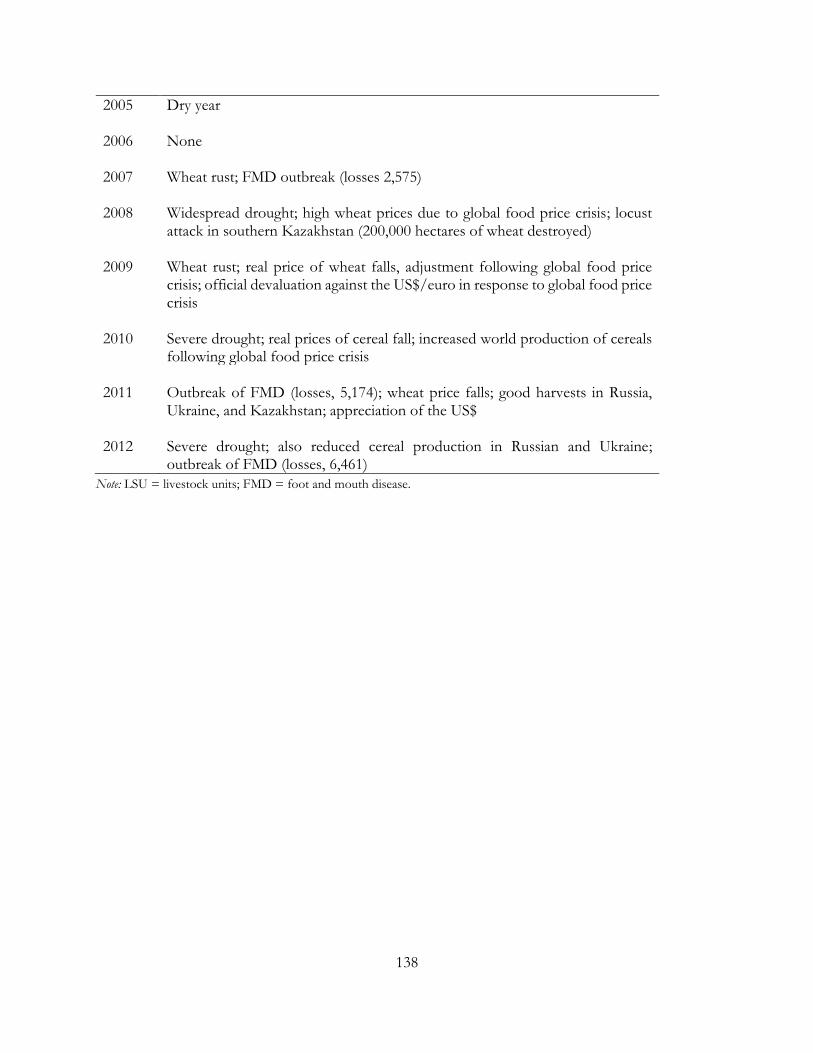
138
2005 Dry year 2006 None 2007 Wheat rust; FMD outbreak (losses 2,575) 2008 Widespread drought; high wheat prices due to global food price crisis; locust
attack in southern Kazakhstan (200,000 hectares of wheat destroyed) 2009 Wheat rust; real price of wheat falls, adjustment following global food price
crisis; official devaluation against the US$/euro in response to global food price crisis
2010 Severe drought; real prices of cereal fall; increased world production of cereals
following global food price crisis 2011 Outbreak of FMD (losses, 5,174); wheat price falls; good harvests in Russia,
Ukraine, and Kazakhstan; appreciation of the US$ 2012 Severe drought; also reduced cereal production in Russian and Ukraine;
outbreak of FMD (losses, 6,461)
Note: LSU = livestock units; FMD = foot and mouth disease.
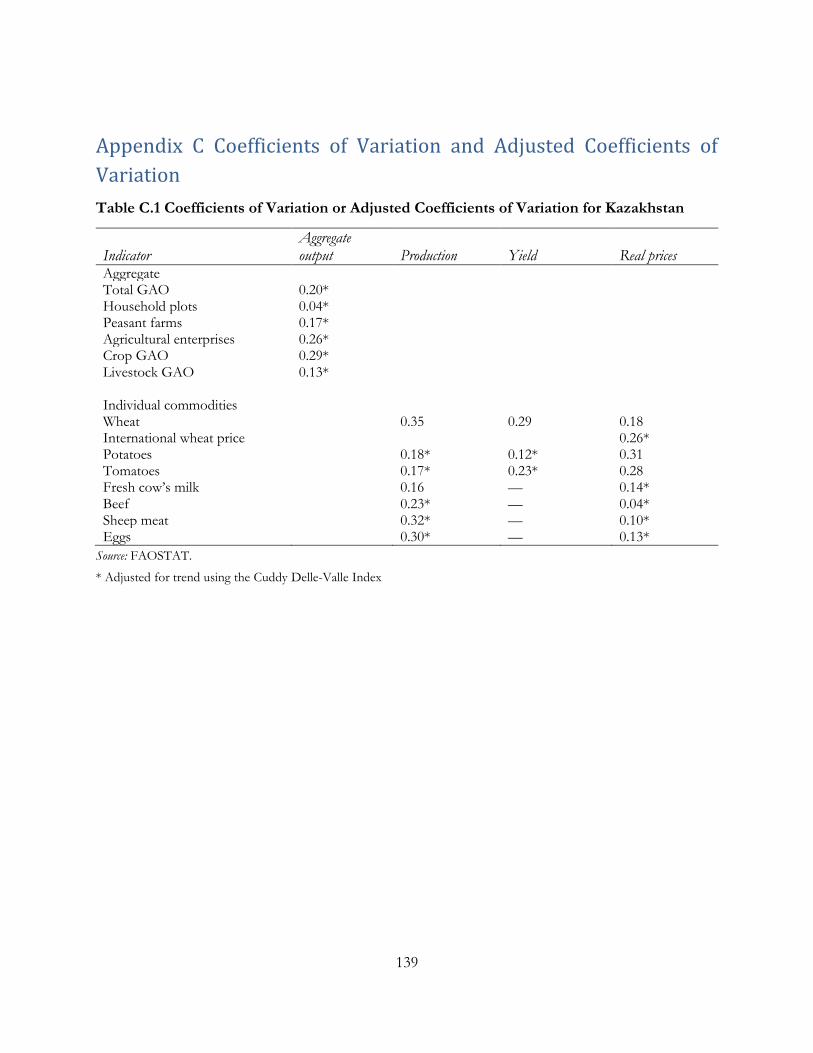
139
Appendix C Coefficients of Variation and Adjusted Coefficients of
Variation
Table C.1 Coefficients of Variation or Adjusted Coefficients of Variation for Kazakhstan
Indicator Aggregate output Production Yield Real prices
Aggregate Total GAO 0.20* Household plots 0.04* Peasant farms 0.17* Agricultural enterprises 0.26* Crop GAO 0.29* Livestock GAO 0.13* Individual commodities Wheat 0.35 0.29 0.18 International wheat price 0.26* Potatoes 0.18* 0.12* 0.31 Tomatoes 0.17* 0.23* 0.28 Fresh cow’s milk 0.16 — 0.14* Beef 0.23* — 0.04* Sheep meat 0.32* — 0.10* Eggs 0.30* — 0.13*
Source: FAOSTAT.
* Adjusted for trend using the Cuddy Delle-Valle Index
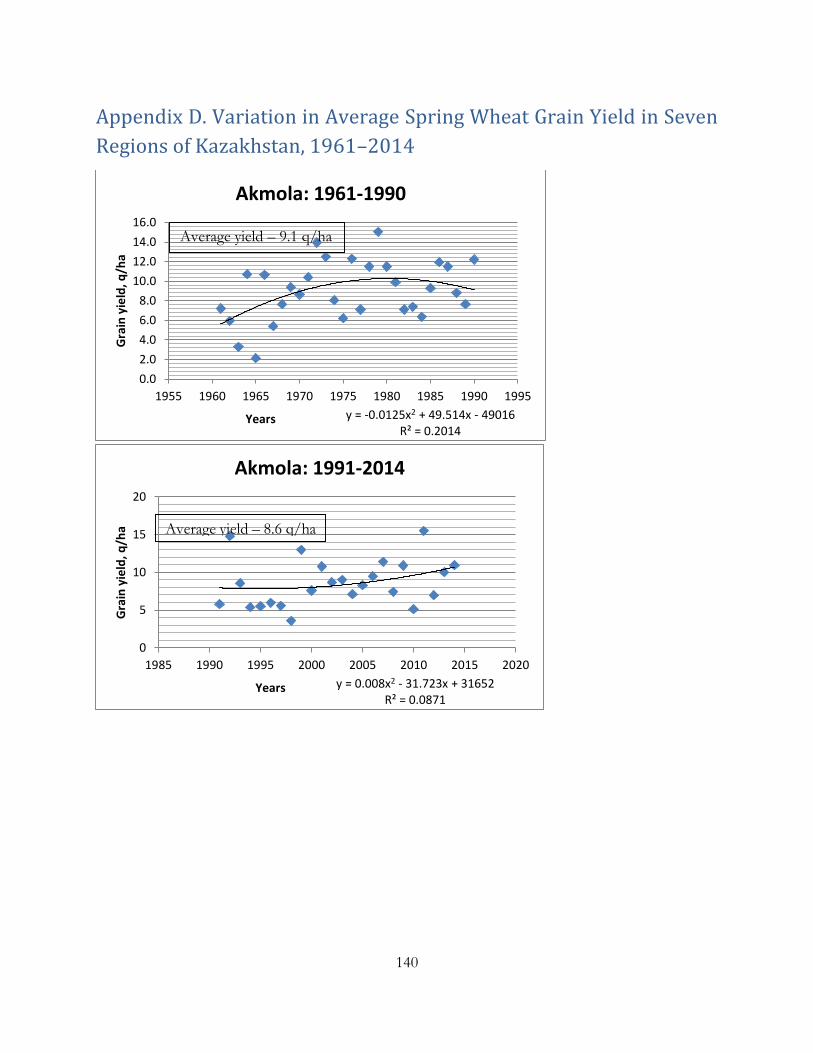
140
Appendix D. Variation in Average Spring Wheat Grain Yield in Seven
Regions of Kazakhstan, 1961–2014
y = -0.0125x2 + 49.514x - 49016R² = 0.2014
0.0
2.0
4.0
6.0
8.0
10.0
12.0
14.0
16.0
1955 1960 1965 1970 1975 1980 1985 1990 1995
Gra
in y
ield
, q/h
a
Years
Akmola: 1961-1990
y = 0.008x2 - 31.723x + 31652R² = 0.0871
0
5
10
15
20
1985 1990 1995 2000 2005 2010 2015 2020
Gra
in y
ield
, q/h
a
Years
Akmola: 1991-2014
Average yield – 9.1 q/ha
Average yield – 8.6 q/ha
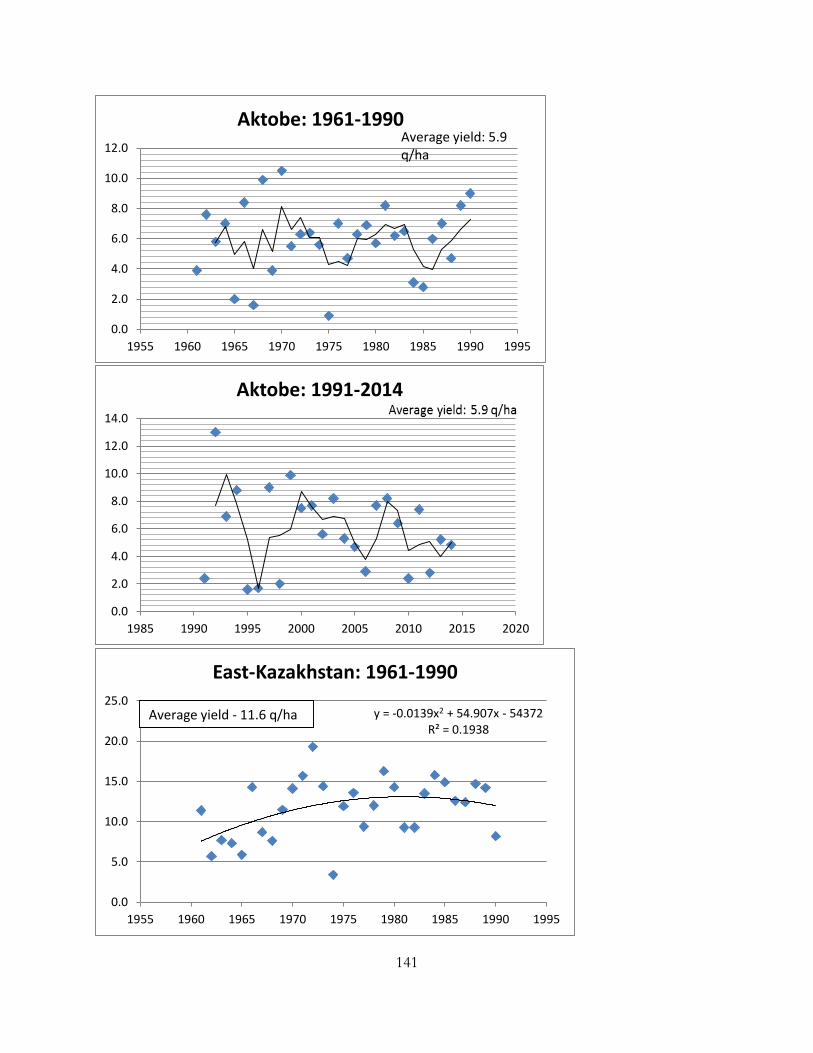
141
0.0
2.0
4.0
6.0
8.0
10.0
12.0
1955 1960 1965 1970 1975 1980 1985 1990 1995
Aktobe: 1961-1990Average yield: 5.9 q/ha
0.0
2.0
4.0
6.0
8.0
10.0
12.0
14.0
1985 1990 1995 2000 2005 2010 2015 2020
Aktobe: 1991-2014
y = -0.0139x2 + 54.907x - 54372R² = 0.1938
0.0
5.0
10.0
15.0
20.0
25.0
1955 1960 1965 1970 1975 1980 1985 1990 1995
East-Kazakhstan: 1961-1990
Average yield - 11.6 q/ha
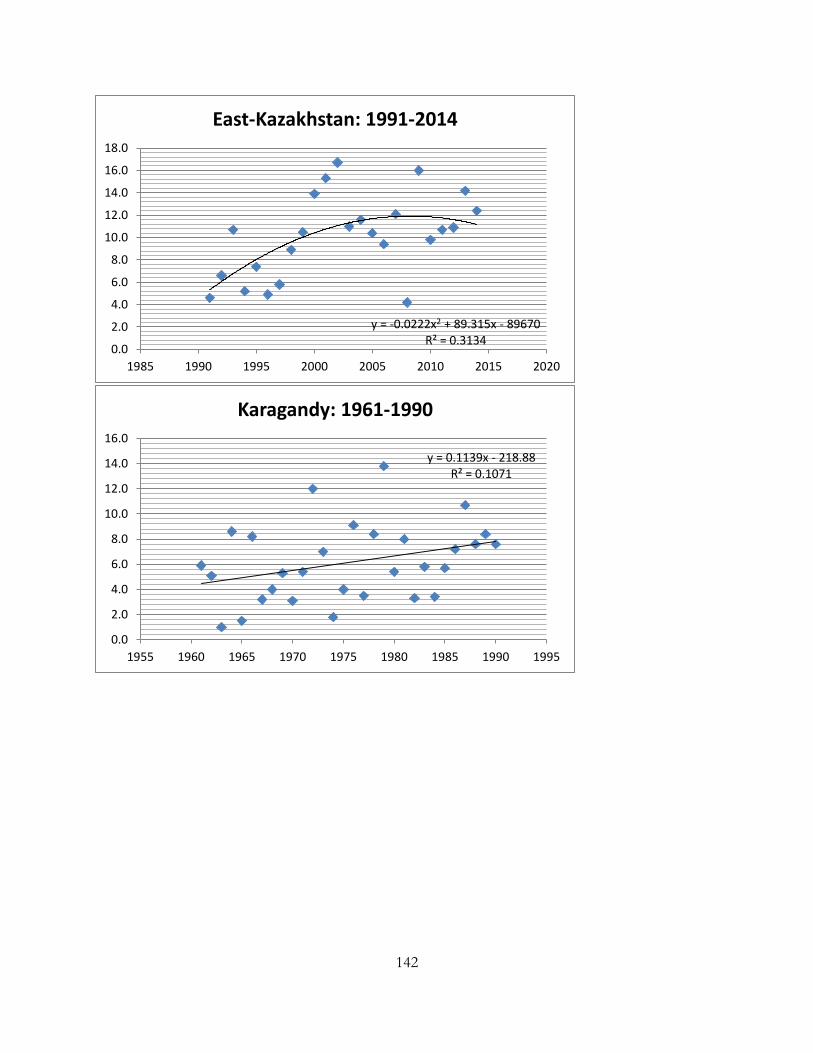
142
y = -0.0222x2 + 89.315x - 89670R² = 0.3134
0.0
2.0
4.0
6.0
8.0
10.0
12.0
14.0
16.0
18.0
1985 1990 1995 2000 2005 2010 2015 2020
East-Kazakhstan: 1991-2014
y = 0.1139x - 218.88R² = 0.1071
0.0
2.0
4.0
6.0
8.0
10.0
12.0
14.0
16.0
1955 1960 1965 1970 1975 1980 1985 1990 1995
Karagandy: 1961-1990
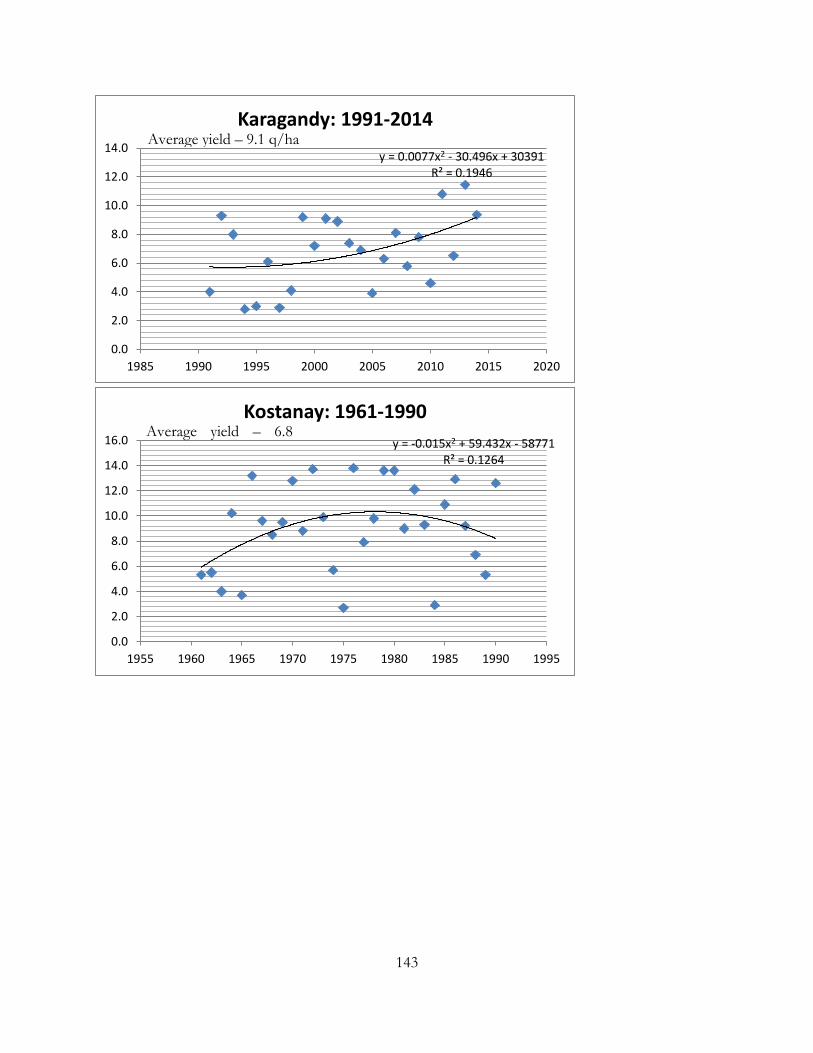
143
y = 0.0077x2 - 30.496x + 30391R² = 0.1946
0.0
2.0
4.0
6.0
8.0
10.0
12.0
14.0
1985 1990 1995 2000 2005 2010 2015 2020
Karagandy: 1991-2014
y = -0.015x2 + 59.432x - 58771R² = 0.1264
0.0
2.0
4.0
6.0
8.0
10.0
12.0
14.0
16.0
1955 1960 1965 1970 1975 1980 1985 1990 1995
Kostanay: 1961-1990Average yield – 6.8
q/ha
Average yield – 9.1 q/ha
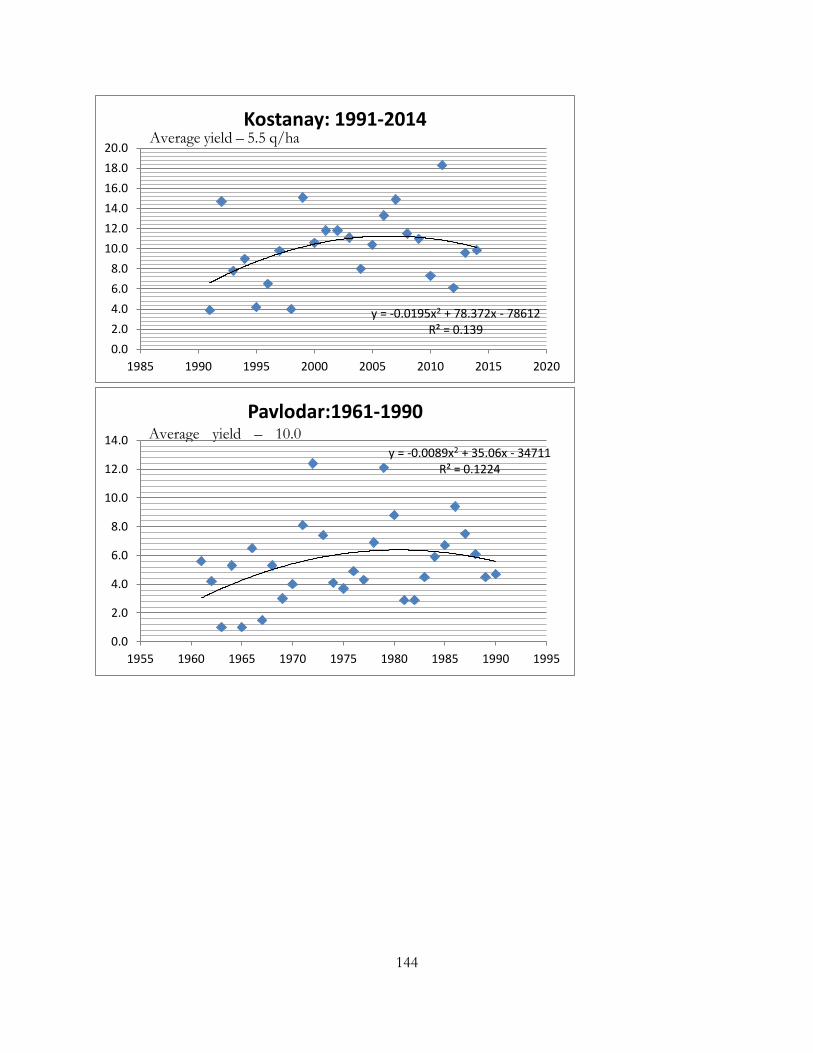
144
y = -0.0195x2 + 78.372x - 78612R² = 0.139
0.0
2.0
4.0
6.0
8.0
10.0
12.0
14.0
16.0
18.0
20.0
1985 1990 1995 2000 2005 2010 2015 2020
Kostanay: 1991-2014
y = -0.0089x2 + 35.06x - 34711R² = 0.1224
0.0
2.0
4.0
6.0
8.0
10.0
12.0
14.0
1955 1960 1965 1970 1975 1980 1985 1990 1995
Pavlodar:1961-1990Average yield – 10.0
q/ha
Average yield – 5.5 q/ha
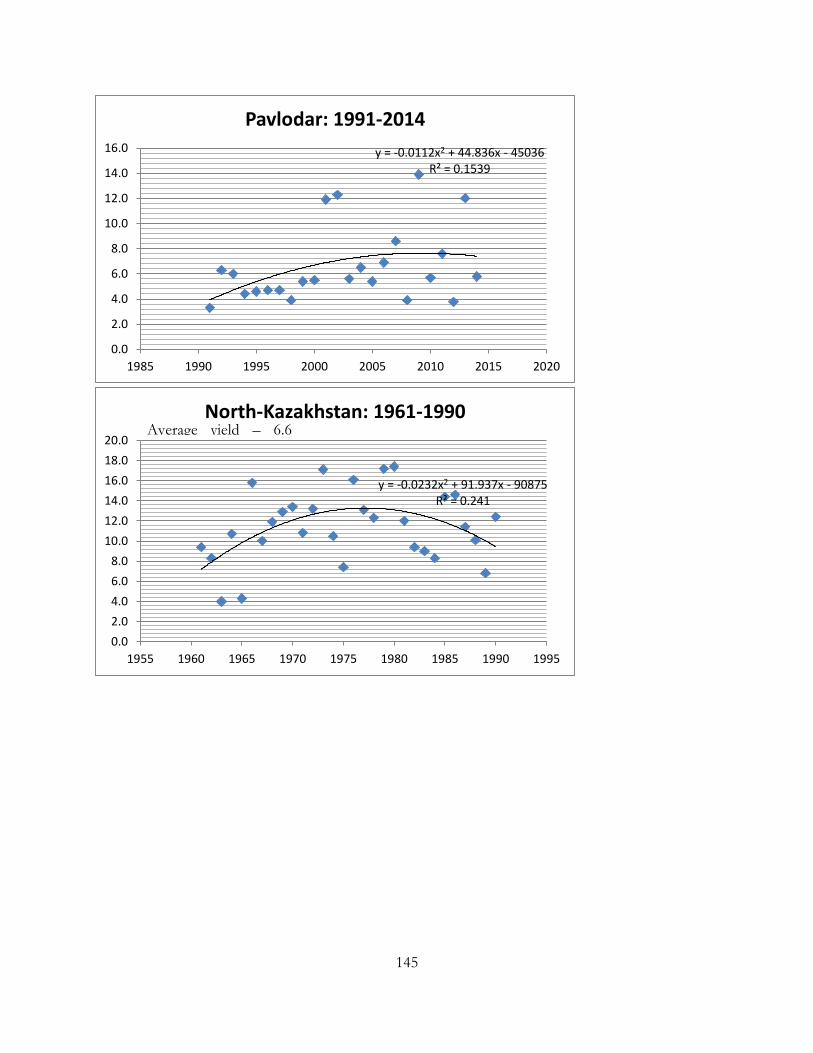
145
y = -0.0112x2 + 44.836x - 45036R² = 0.1539
0.0
2.0
4.0
6.0
8.0
10.0
12.0
14.0
16.0
1985 1990 1995 2000 2005 2010 2015 2020
Pavlodar: 1991-2014
y = -0.0232x2 + 91.937x - 90875R² = 0.241
0.0
2.0
4.0
6.0
8.0
10.0
12.0
14.0
16.0
18.0
20.0
1955 1960 1965 1970 1975 1980 1985 1990 1995
North-Kazakhstan: 1961-1990Average yield – 6.6
q/ha
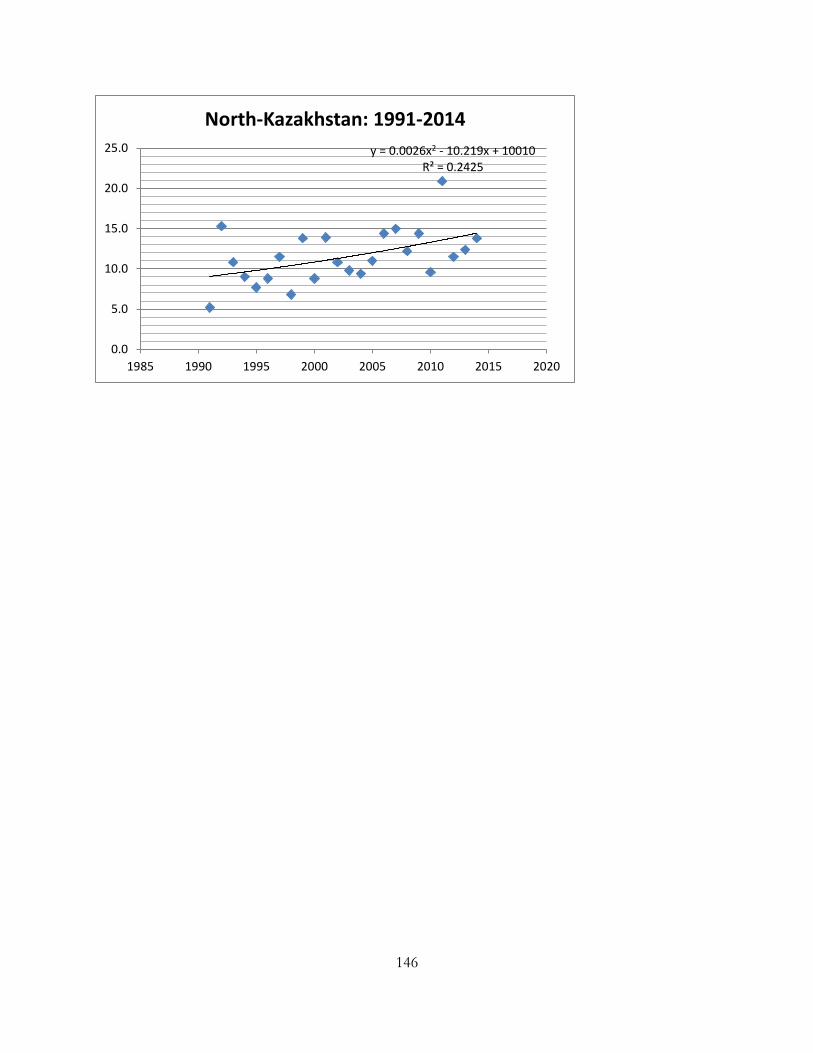
146
y = 0.0026x2 - 10.219x + 10010R² = 0.2425
0.0
5.0
10.0
15.0
20.0
25.0
1985 1990 1995 2000 2005 2010 2015 2020
North-Kazakhstan: 1991-2014
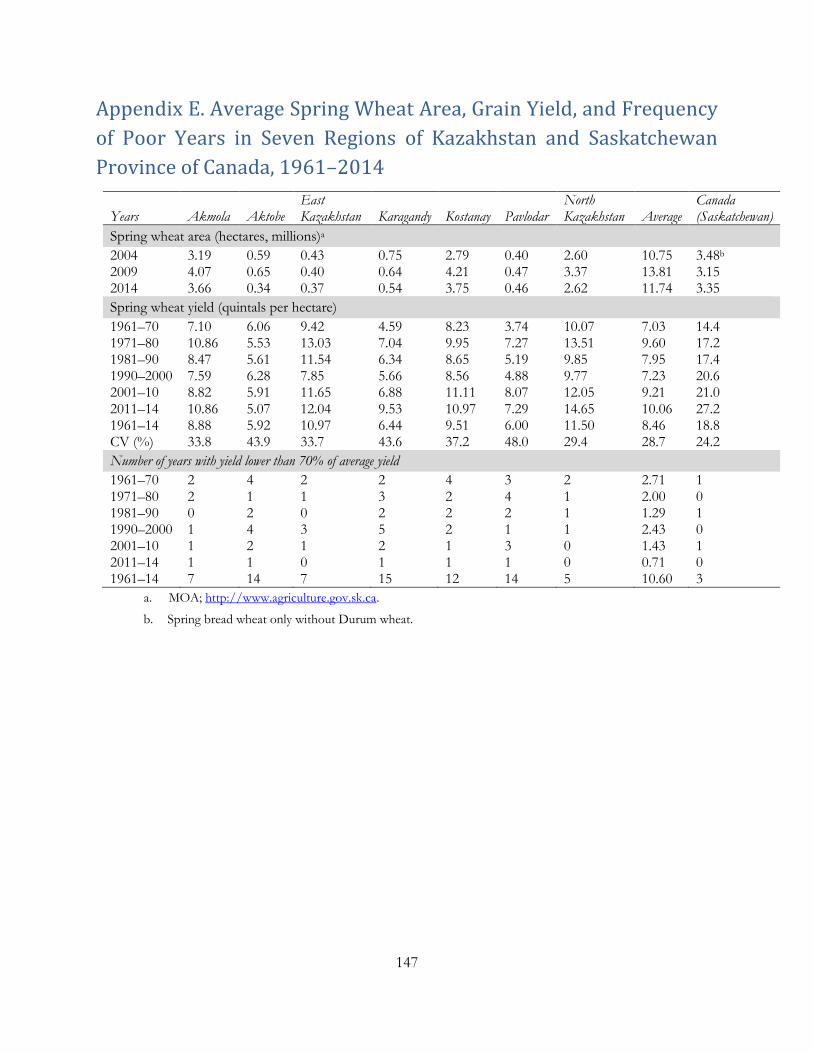
147
Appendix E. Average Spring Wheat Area, Grain Yield, and Frequency
of Poor Years in Seven Regions of Kazakhstan and Saskatchewan
Province of Canada, 1961–2014
Years Akmola Aktobe East Kazakhstan Karagandy Kostanay Pavlodar
North Kazakhstan Average
Canada (Saskatchewan)
Spring wheat area (hectares, millions)a
2004 3.19 0.59 0.43 0.75 2.79 0.40 2.60 10.75 3.48b 2009 4.07 0.65 0.40 0.64 4.21 0.47 3.37 13.81 3.15 2014 3.66 0.34 0.37 0.54 3.75 0.46 2.62 11.74 3.35
Spring wheat yield (quintals per hectare)
1961–70 7.10 6.06 9.42 4.59 8.23 3.74 10.07 7.03 14.4 1971–80 10.86 5.53 13.03 7.04 9.95 7.27 13.51 9.60 17.2 1981–90 8.47 5.61 11.54 6.34 8.65 5.19 9.85 7.95 17.4 1990–2000 7.59 6.28 7.85 5.66 8.56 4.88 9.77 7.23 20.6 2001–10 8.82 5.91 11.65 6.88 11.11 8.07 12.05 9.21 21.0 2011–14 10.86 5.07 12.04 9.53 10.97 7.29 14.65 10.06 27.2 1961–14 8.88 5.92 10.97 6.44 9.51 6.00 11.50 8.46 18.8 CV (%) 33.8 43.9 33.7 43.6 37.2 48.0 29.4 28.7 24.2
Number of years with yield lower than 70% of average yield
1961–70 2 4 2 2 4 3 2 2.71 1 1971–80 2 1 1 3 2 4 1 2.00 0 1981–90 0 2 0 2 2 2 1 1.29 1 1990–2000 1 4 3 5 2 1 1 2.43 0 2001–10 1 2 1 2 1 3 0 1.43 1 2011–14 1 1 0 1 1 1 0 0.71 0 1961–14 7 14 7 15 12 14 5 10.60 3
a. MOA; http://www.agriculture.gov.sk.ca.
b. Spring bread wheat only without Durum wheat.
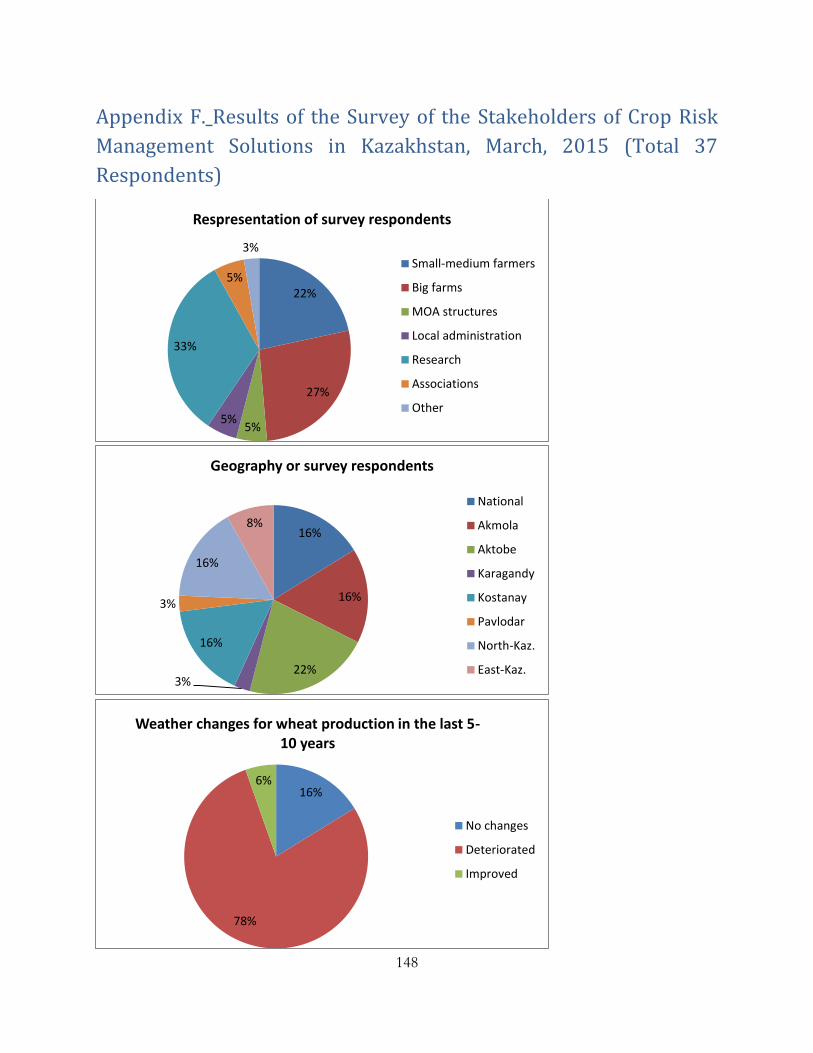
148
Appendix F. Results of the Survey of the Stakeholders of Crop Risk
Management Solutions in Kazakhstan, March, 2015 (Total 37
Respondents)
22%
27%
5%5%
33%
5%
3%
Respresentation of survey respondents
Small-medium farmers
Big farms
MOA structures
Local administration
Research
Associations
Other
16%
16%
22%3%
16%
3%
16%
8%
Geography or survey respondents
National
Akmola
Aktobe
Karagandy
Kostanay
Pavlodar
North-Kaz.
East-Kaz.
16%
78%
6%
Weather changes for wheat production in the last 5-10 years
No changes
Deteriorated
Improved
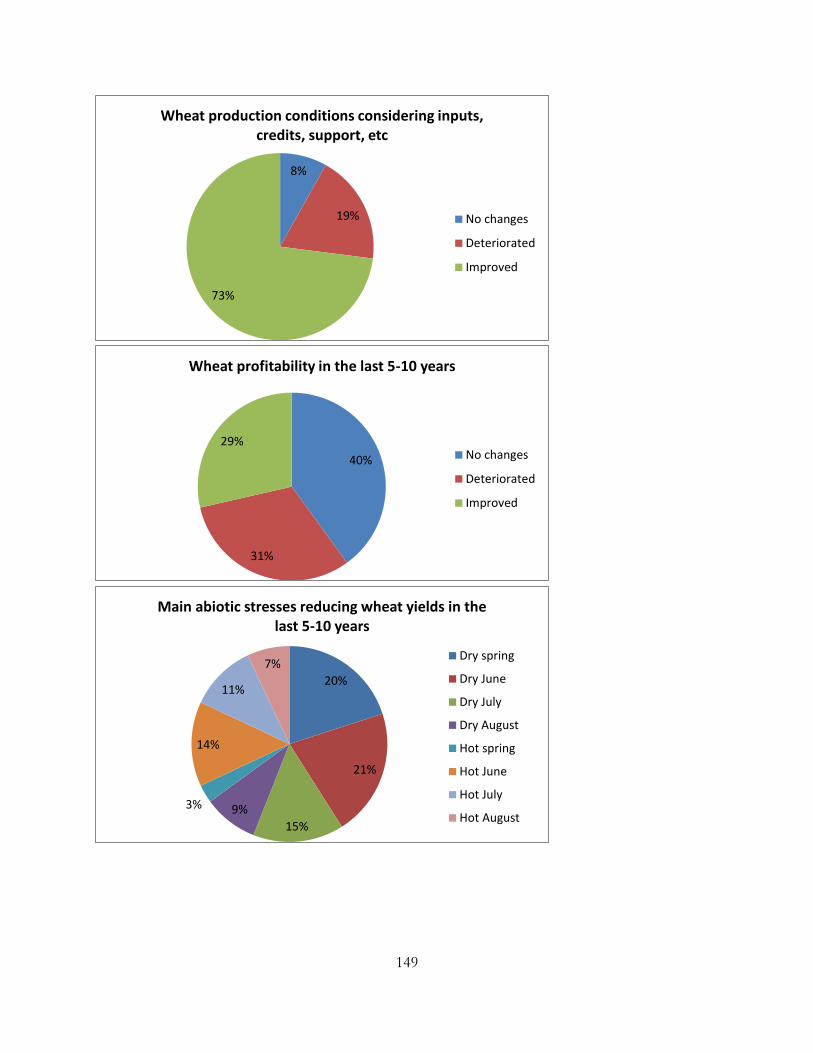
149
8%
19%
73%
Wheat production conditions considering inputs, credits, support, etc
No changes
Deteriorated
Improved
40%
31%
29%
Wheat profitability in the last 5-10 years
No changes
Deteriorated
Improved
20%
21%
15%
9%3%
14%
11%
7%
Main abiotic stresses reducing wheat yields in the last 5-10 years
Dry spring
Dry June
Dry July
Dry August
Hot spring
Hot June
Hot July
Hot August
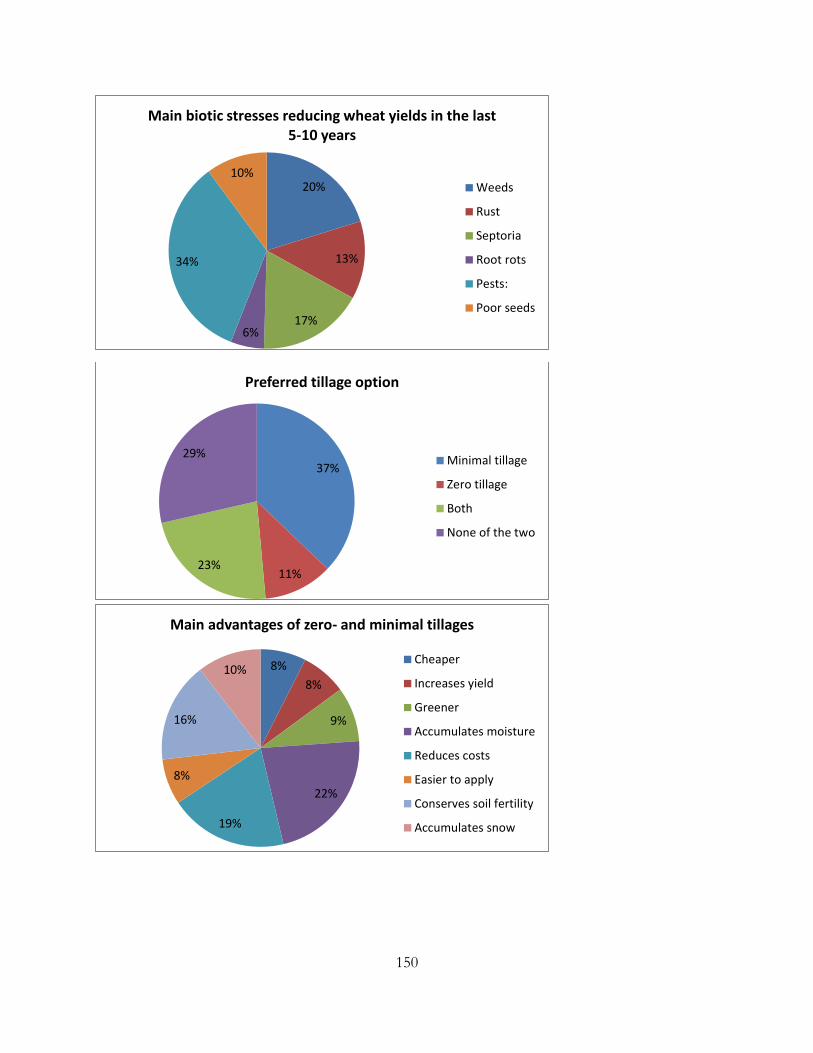
150
20%
13%
17%6%
34%
10%
Main biotic stresses reducing wheat yields in the last 5-10 years
Weeds
Rust
Septoria
Root rots
Pests:
Poor seeds
37%
11%23%
29%
Preferred tillage option
Minimal tillage
Zero tillage
Both
None of the two
8%
8%
9%
22%
19%
8%
16%
10%
Main advantages of zero- and minimal tillages
Cheaper
Increases yield
Greener
Accumulates moisture
Reduces costs
Easier to apply
Conserves soil fertility
Accumulates snow
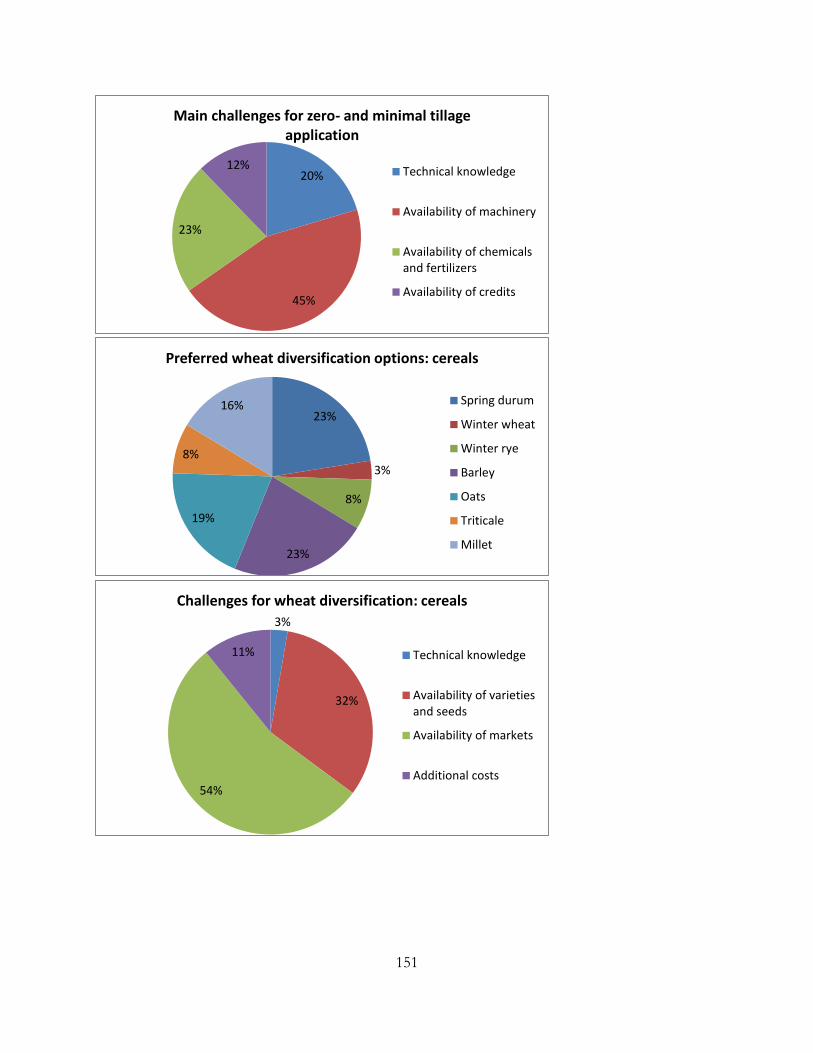
151
20%
45%
23%
12%
Main challenges for zero- and minimal tillage application
Technical knowledge
Availability of machinery
Availability of chemicalsand fertilizers
Availability of credits
23%
3%
8%
23%
19%
8%
16%
Preferred wheat diversification options: cereals
Spring durum
Winter wheat
Winter rye
Barley
Oats
Triticale
Millet
3%
32%
54%
11%
Challenges for wheat diversification: cereals
Technical knowledge
Availability of varietiesand seeds
Availability of markets
Additional costs
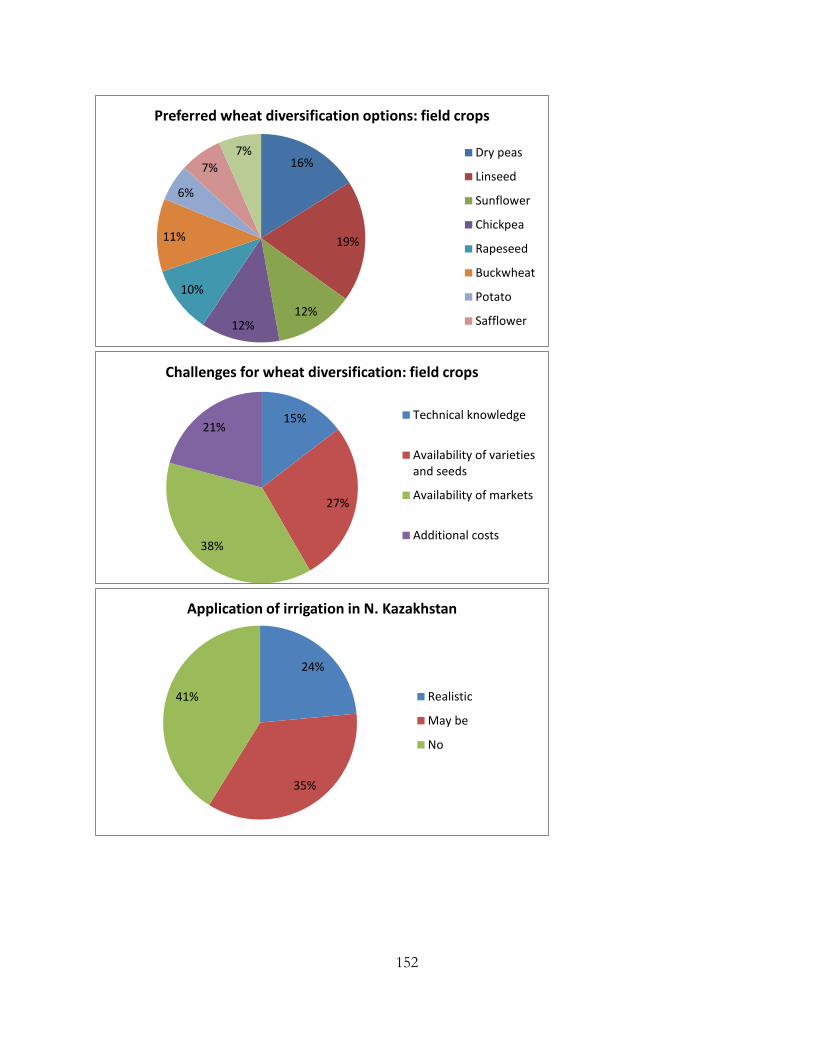
152
16%
19%
12%12%
10%
11%
6%
7%
7%
Preferred wheat diversification options: field crops
Dry peas
Linseed
Sunflower
Chickpea
Rapeseed
Buckwheat
Potato
Safflower
15%
27%
38%
21%
Challenges for wheat diversification: field crops
Technical knowledge
Availability of varietiesand seeds
Availability of markets
Additional costs
24%
35%
41%
Application of irrigation in N. Kazakhstan
Realistic
May be
No
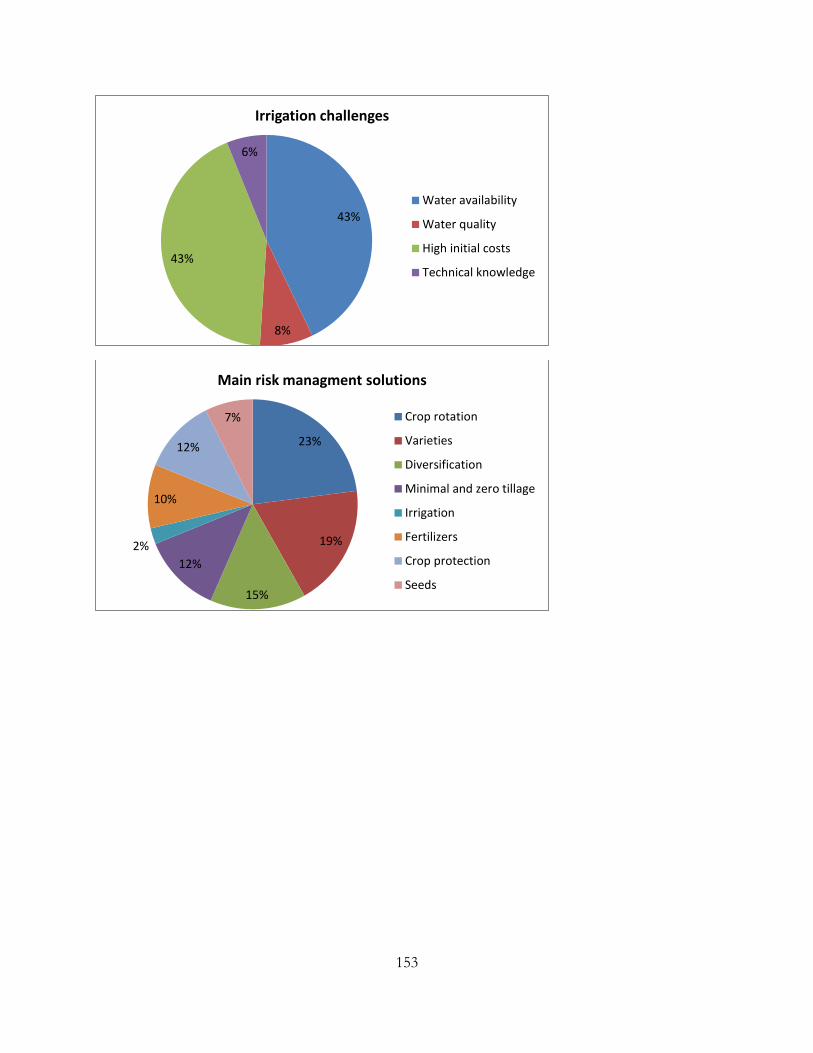
153
43%
8%
43%
6%
Irrigation challenges
Water availability
Water quality
High initial costs
Technical knowledge
23%
19%
15%
12%
2%
10%
12%
7%
Main risk managment solutions
Crop rotation
Varieties
Diversification
Minimal and zero tillage
Irrigation
Fertilizers
Crop protection
Seeds
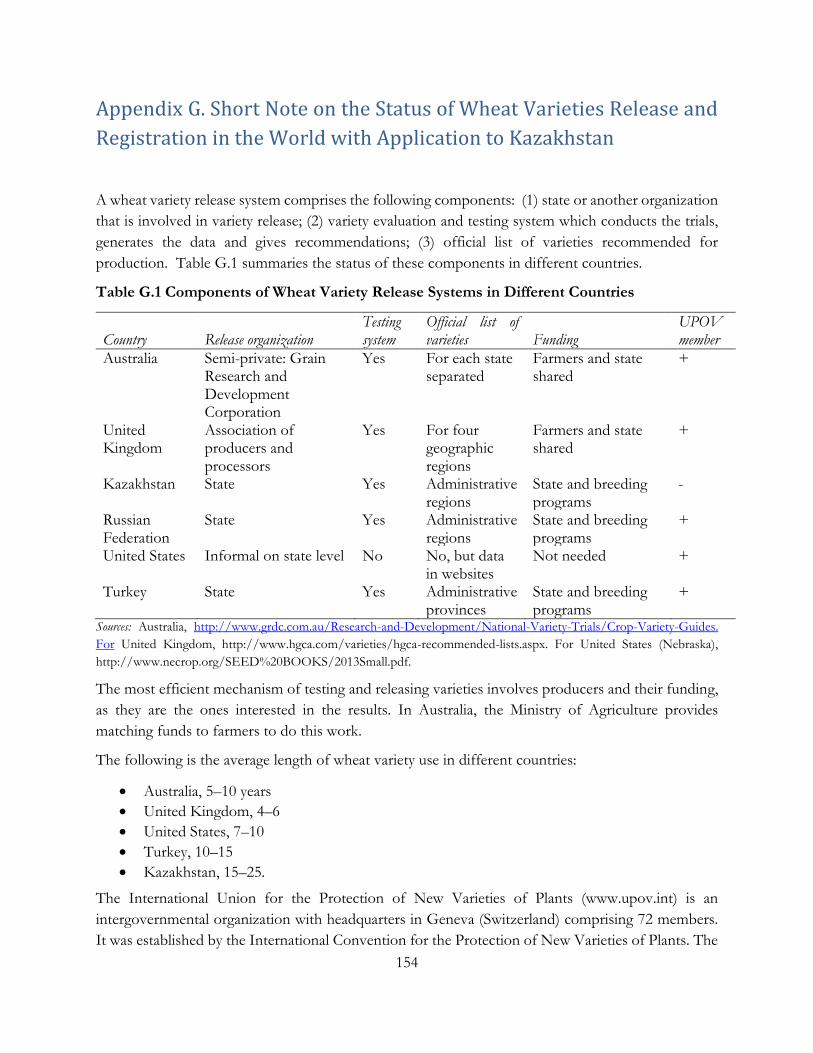
154
Appendix G. Short Note on the Status of Wheat Varieties Release and
Registration in the World with Application to Kazakhstan
A wheat variety release system comprises the following components: (1) state or another organization
that is involved in variety release; (2) variety evaluation and testing system which conducts the trials,
generates the data and gives recommendations; (3) official list of varieties recommended for
production. Table G.1 summaries the status of these components in different countries.
Table G.1 Components of Wheat Variety Release Systems in Different Countries
Country Release organization Testing system
Official list of varieties Funding
UPOV member
Australia Semi-private: Grain Research and Development Corporation
Yes For each state separated
Farmers and state shared
+
United Kingdom
Association of producers and processors
Yes For four geographic regions
Farmers and state shared
+
Kazakhstan State Yes Administrative regions
State and breeding programs
-
Russian Federation
State Yes Administrative regions
State and breeding programs
+
United States Informal on state level No No, but data in websites
Not needed +
Turkey State Yes Administrative provinces
State and breeding programs
+
Sources: Australia, http://www.grdc.com.au/Research-and-Development/National-Variety-Trials/Crop-Variety-Guides.
For United Kingdom, http://www.hgca.com/varieties/hgca-recommended-lists.aspx. For United States (Nebraska),
http://www.necrop.org/SEED%20BOOKS/2013Small.pdf.
The most efficient mechanism of testing and releasing varieties involves producers and their funding,
as they are the ones interested in the results. In Australia, the Ministry of Agriculture provides
matching funds to farmers to do this work.
The following is the average length of wheat variety use in different countries:
Australia, 5–10 years
United Kingdom, 4–6
United States, 7–10
Turkey, 10–15
Kazakhstan, 15–25.
The International Union for the Protection of New Varieties of Plants (www.upov.int) is an
intergovernmental organization with headquarters in Geneva (Switzerland) comprising 72 members.
It was established by the International Convention for the Protection of New Varieties of Plants. The
155
convention was adopted in Paris in 1961 and revised in 1972, 1978, and 1991. Its mission is to provide
and promote an effective system of plant variety protection, with the aim of encouraging the
development of new varieties of plants, for the benefit of society. The varieties exchange between the
UPOV members is much easier, as their laws and regulations are synchronized.
Kazakhstan maintains the old system for testing and releasing varieties, and adjustment is needed to
bring it up to the current challenges: the target of varieties release should be ecological zones rather
than administrative regions; producers should be actively participating in its work and the data from
the trials should be shared with them; the network of testing sites should be reviewed and adjusted;
agricultural research institutes and stations should participate in variety tests; prevailing wheat diseases
should be evaluated and resistance should be considered when deciding whether to include a variety
on official list.
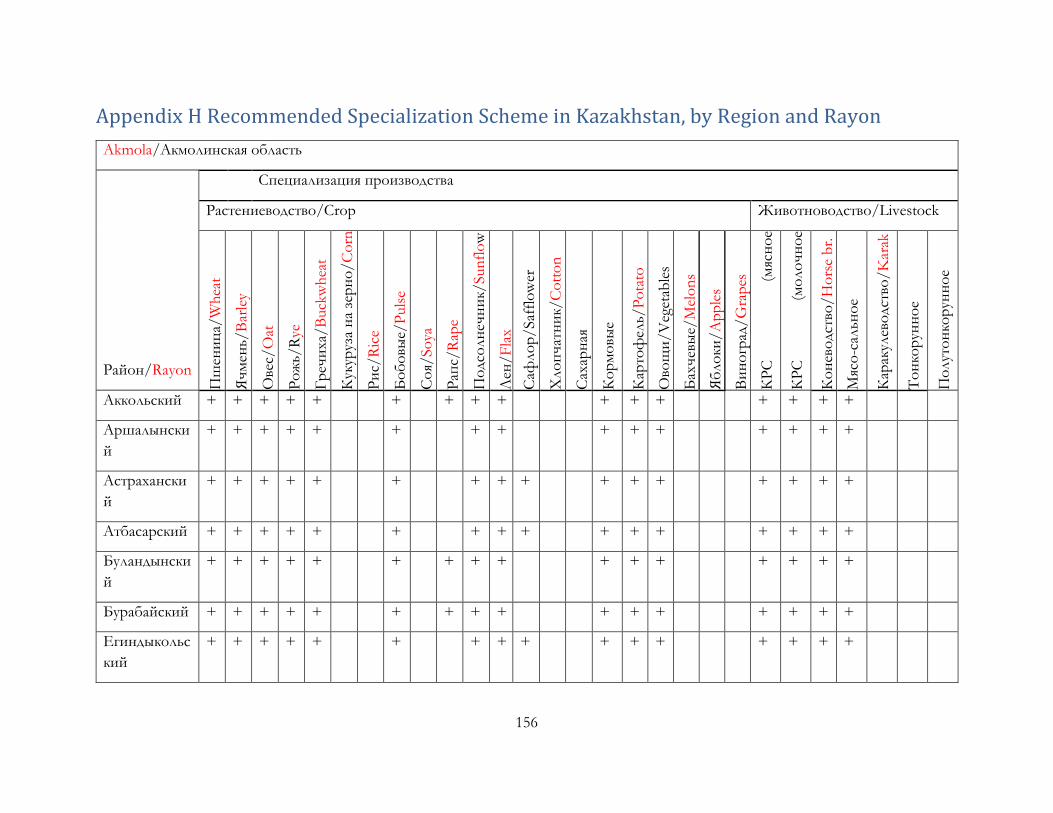
156
Appendix H Recommended Specialization Scheme in Kazakhstan, by Region and Rayon
Akmola/Акмолинская область
Район/Rayon
Специализация производства
Растениеводство/Crop Животноводство/Livestock П
шен
иц
а/W
hea
t
Яч
мен
ь/B
arle
y
Ове
с/O
at
Ро
жь/
Rye
Гр
ечи
ха/
Buck
wh
eat
Кук
уруз
а н
а зе
рн
о/
Co
rn
grai
n
Ри
с/R
ice
Бо
бо
вые/
Puls
e
Со
я/So
ya
Рап
с/R
ape
По
дсо
лн
ечн
ик/
Sun
flo
w
er
Лен
/F
lax
Саф
ло
р/
Saf
flo
wer
Хло
пч
атн
ик/
Co
tto
n
Сах
арн
ая
свек
ла/
Suga
rbee
t К
ор
мо
вые
культ
уры
/F
odder
К
арто
фел
ь/P
ota
to
Ово
щи
/V
eget
able
s
Бах
чев
ые/
Mel
on
s
Яб
ло
ки/A
pp
les
Ви
но
град
/G
rap
es
КР
С
(мяс
но
е
нап
рав
лен
ие)
/B
eef
cat
КР
С
(мо
ло
чн
ое
нап
рав
лен
ие)
/D
airy
cat
К
он
ево
дст
во/
Ho
rse
br.
Мяс
о-с
альн
ое
овц
ево
дст
во/
Sh
eep
mea
t К
арак
улев
одст
во/
Kar
ak
ul
То
нко
рун
но
е
овц
ево
дст
во/
Sh
eep
sem
i-fi
ne
wo
ol
По
лут
он
кор
унн
ое
овц
ево
дст
во/
Sh
eep
fi
ne
wo
ol
Аккольский + + + + + + + + + + + + + + + +
Аршалынски
й
+ + + + + + + + + + + + + + +
Астрахански
й
+ + + + + + + + + + + + + + + +
Атбасарский + + + + + + + + + + + + + + + +
Буландынски
й
+ + + + + + + + + + + + + + + +
Бурабайский + + + + + + + + + + + + + + + +
Егиндыкольс
кий
+ + + + + + + + + + + + + + + +
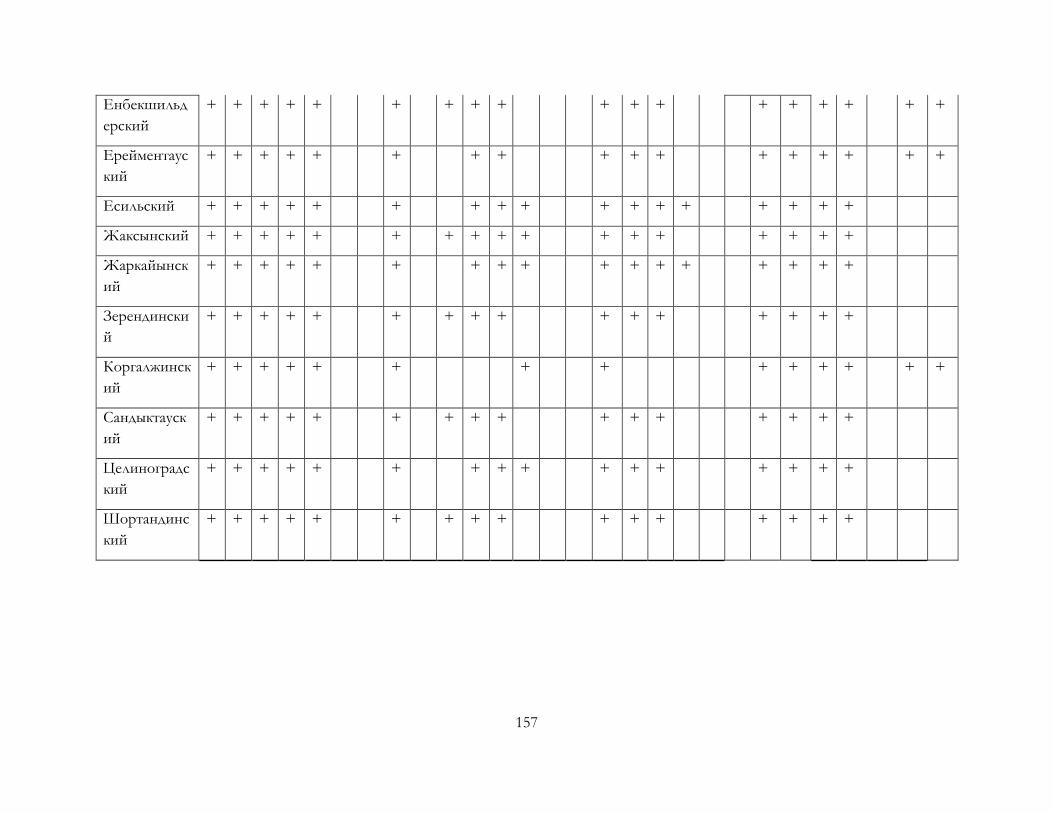
157
Енбекшильд
ерский
+ + + + + + + + + + + + + + + + + +
Ерейментаус
кий
+ + + + + + + + + + + + + + + + +
Есильский + + + + + + + + + + + + + + + + +
Жаксынский + + + + + + + + + + + + + + + + +
Жаркайынск
ий
+ + + + + + + + + + + + + + + + +
Зерендински
й
+ + + + + + + + + + + + + + + +
Коргалжинск
ий
+ + + + + + + + + + + + + +
Сандыктауск
ий
+ + + + + + + + + + + + + + + +
Целиноградс
кий
+ + + + + + + + + + + + + + + +
Шортандинс
кий
+ + + + + + + + + + + + + + + +
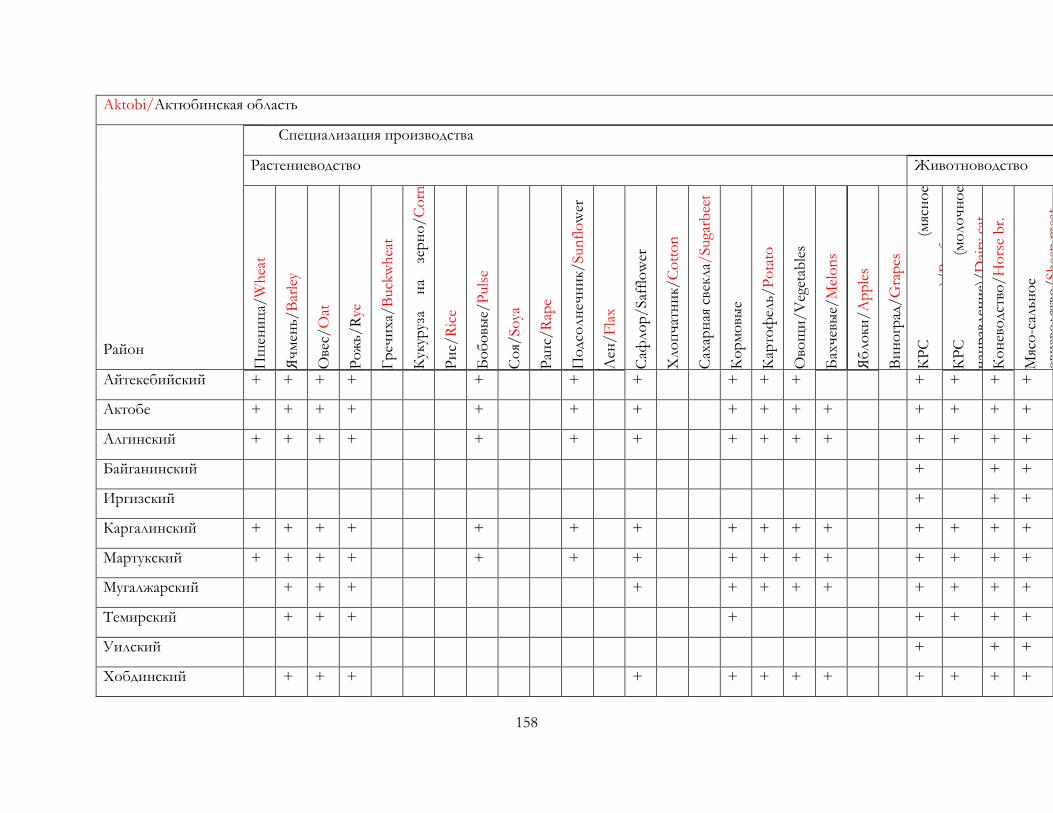
158
Aktobi/Актюбинская область
Район
Специализация производства
Растениеводство Животноводство
Пш
ени
ца/
Wh
eat
Яч
мен
ь/B
arle
y
Ове
с/O
at
Ро
жь/
Rye
Гр
ечи
ха/
Buck
wh
eat
Кук
уруз
а н
а зе
рн
о/C
orn
grai
n
Ри
с/R
ice
Бо
бо
вые/
Puls
e
Со
я/So
ya
Рап
с/R
ape
По
дсо
лн
ечн
ик/
Sun
flo
wer
Лен
/F
lax
Саф
ло
р/
Saf
flo
wer
Хло
пч
атн
ик/
Co
tto
n
Сах
арн
ая с
векл
а/Suga
rbee
t
Ко
рм
овы
е
культ
уры
/F
odder
К
арто
фел
ь/P
ota
to
Ово
щи
/V
eget
able
s
Бах
чев
ые/
Mel
on
s
Яб
ло
ки/A
pp
les
Ви
но
град
/G
rap
es
КР
С
(мяс
но
е
нап
рав
лен
ие)
/B
eef
cat
КР
С
(мо
ло
чн
ое
нап
рав
лен
ие)
/D
airy
cat
Ко
нев
одст
во/
Ho
rse
br.
Мяс
о-с
альн
ое
овц
ево
дст
во/
Sh
eep
mea
t К
арак
улев
одст
во/
Kar
akul
То
нко
рун
но
е
овц
ево
дст
во/
Sh
eep
se
mi-
fin
e w
oo
l П
олут
он
кор
унн
ое
овц
ево
дст
во/
Sh
eep
fin
e
wo
ol
Айтекебийский + + + + + + + + + + + + + +
Актобе + + + + + + + + + + + + + + + +
Алгинский + + + + + + + + + + + + + + + +
Байганинский + + +
Иргизский + + +
Каргалинский + + + + + + + + + + + + + + +
Мартукский + + + + + + + + + + + + + + +
Мугалжарский + + + + + + + + + + + + +
Темирский + + + + + + + +
Уилский + + +
Хобдинский + + + + + + + + + + + + +
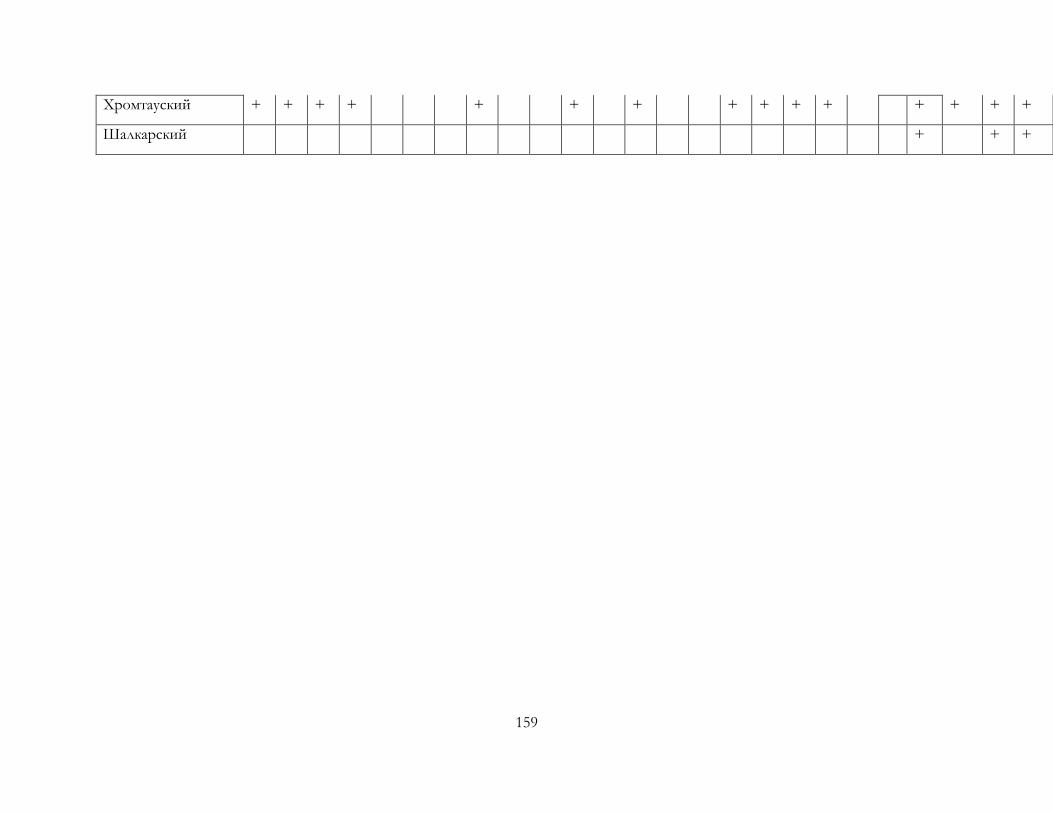
159
Хромтауский + + + + + + + + + + + + + + + +
Шалкарский + + +
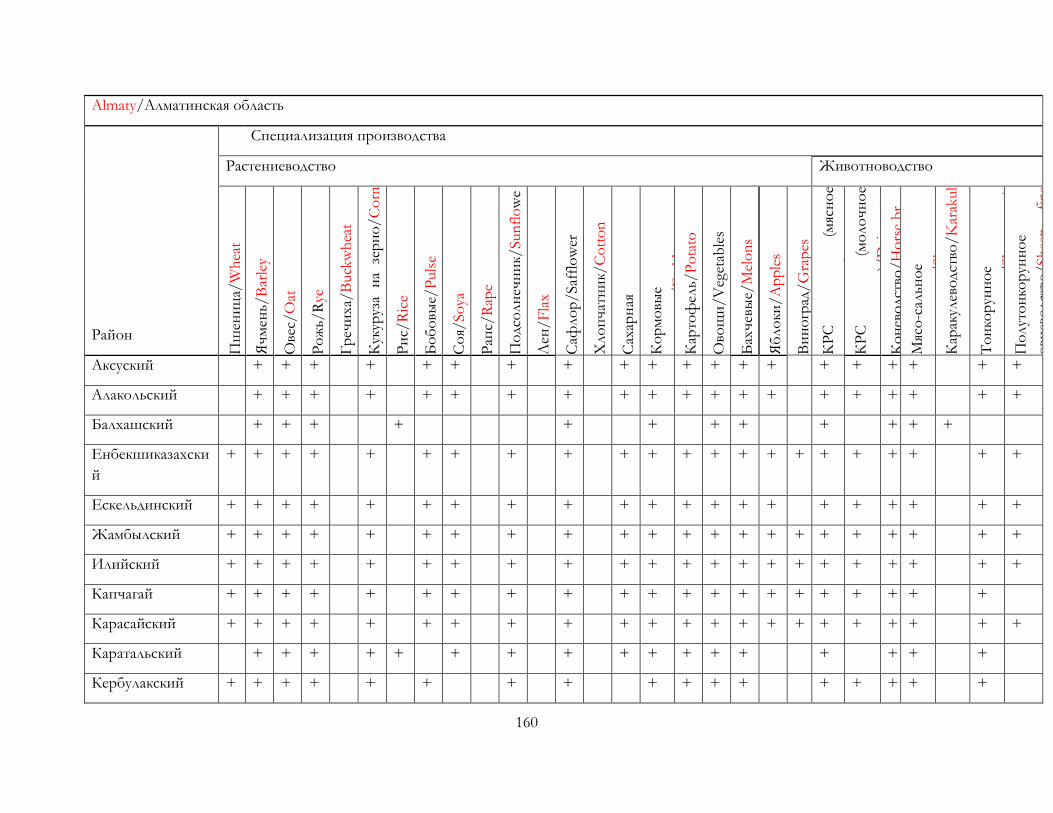
160
Almaty/Алматинская область
Район
Специализация производства
Растениеводство Животноводство
Пш
ени
ца/
Wh
eat
Яч
мен
ь/B
arle
y
Ове
с/O
at
Ро
жь/
Rye
Гр
ечи
ха/
Buck
wh
eat
Кук
уруз
а н
а зе
рн
о/
Co
rn
grai
n
Ри
с/R
ice
Бо
бо
вые/
Puls
e
Со
я/So
ya
Рап
с/R
ape
По
дсо
лн
ечн
ик/
Sun
flo
we
r Лен
/F
lax
Саф
ло
р/
Saf
flo
wer
Хло
пч
атн
ик/
Co
tto
n
Сах
арн
ая
свек
ла/
Suga
rbee
t К
ор
мо
вые
культ
уры
/F
odder
К
арто
фел
ь/P
ota
to
Ово
щи
/V
eget
able
s
Бах
чев
ые/
Mel
on
s
Яб
ло
ки/A
pp
les
Ви
но
град
/G
rap
es
КР
С
(мяс
но
е
нап
рав
лен
ие)
/B
eef
cat
КР
С
(мо
ло
чн
ое
нап
рав
лен
ие)
/D
airy
cat
К
он
ево
дст
во/
Ho
rse
br.
Мяс
о-с
альн
ое
овц
ево
дст
во/
Sh
eep
mea
t К
арак
улев
одст
во/
Kar
akul
То
нко
рун
но
е
овц
ево
дст
во/
Sh
eep
se
mi-
fin
e w
oo
l П
олут
он
кор
унн
ое
овц
ево
дст
во/
Sh
eep
fine
wo
ol
Аксуский + + + + + + + + + + + + + + + + + + + +
Алакольский + + + + + + + + + + + + + + + + + + + +
Балхашский + + + + + + + + + + + +
Енбекшиказахски
й
+ + + + + + + + + + + + + + + + + + + + + +
Ескельдинский + + + + + + + + + + + + + + + + + + + + +
Жамбылский + + + + + + + + + + + + + + + + + + + + + +
Илийский + + + + + + + + + + + + + + + + + + + + + +
Капчагай + + + + + + + + + + + + + + + + + + + + +
Карасайский + + + + + + + + + + + + + + + + + + + + + +
Каратальский + + + + + + + + + + + + + + + + +
Кербулакский + + + + + + + + + + + + + + + + +
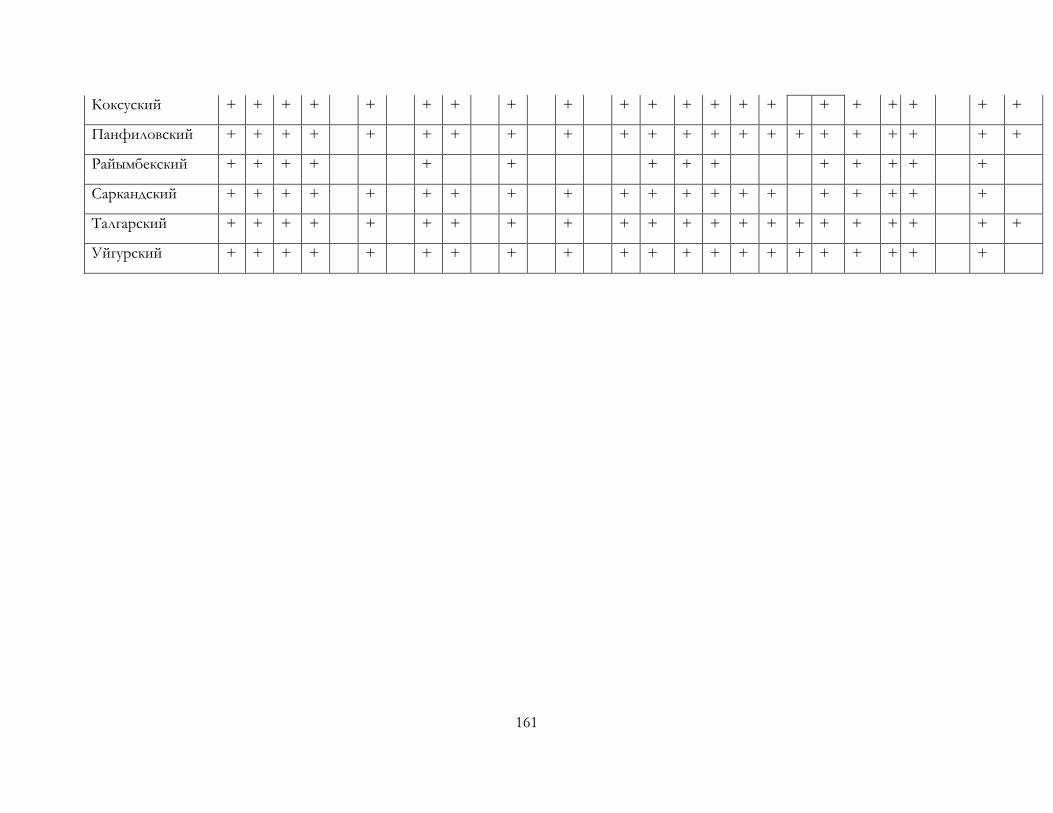
161
Коксуский + + + + + + + + + + + + + + + + + + + + +
Панфиловский + + + + + + + + + + + + + + + + + + + + + +
Райымбекский + + + + + + + + + + + + + +
Саркандский + + + + + + + + + + + + + + + + + + + +
Талгарский + + + + + + + + + + + + + + + + + + + + + +
Уйгурский + + + + + + + + + + + + + + + + + + + + +
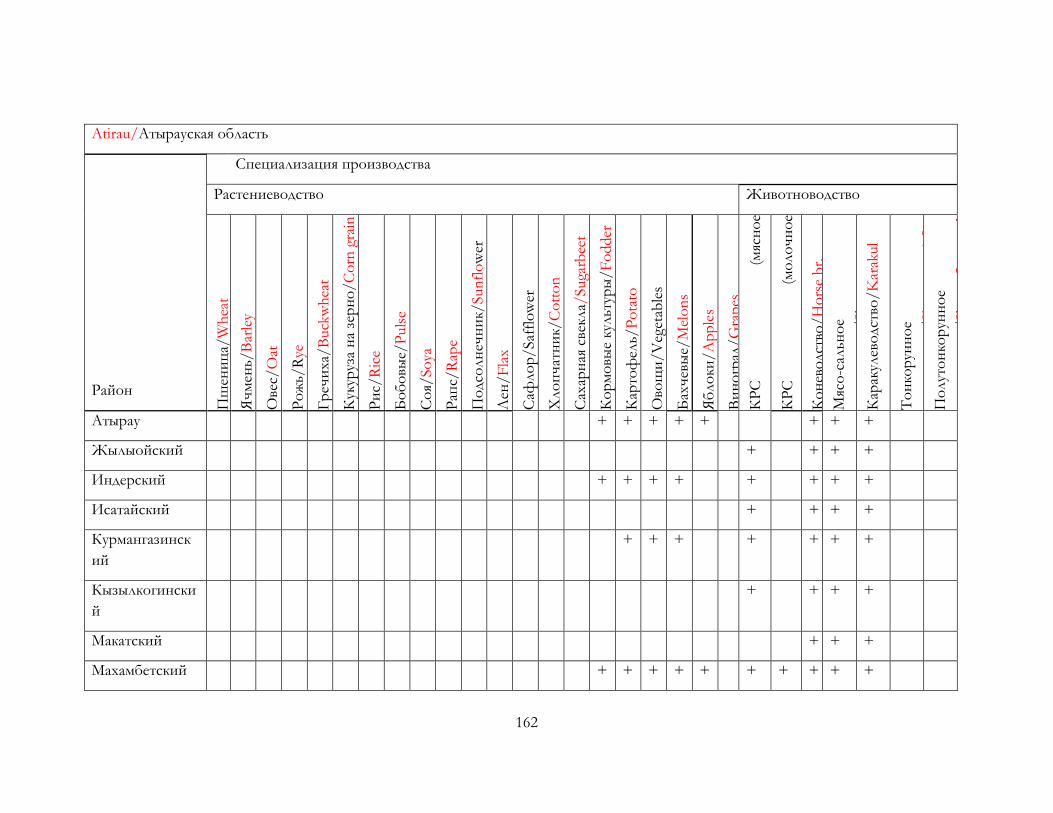
162
Atirau/Атырауская область
Район
Специализация производства
Растениеводство Животноводство
Пш
ени
ца/
Wh
eat
Яч
мен
ь/B
arle
y
Ове
с/O
at
Ро
жь/
Rye
Гр
ечи
ха/
Buck
wh
eat
Кук
уруз
а н
а зе
рн
о/C
orn
gra
in
Ри
с/R
ice
Бо
бо
вые/
Puls
e
Со
я/So
ya
Рап
с/R
ape
По
дсо
лн
ечн
ик/
Sun
flo
wer
Лен
/F
lax
Саф
ло
р/
Saf
flo
wer
Хло
пч
атн
ик/
Co
tto
n
Сах
арн
ая с
векл
а/Suga
rbee
t
Ко
рм
овы
е ку
льт
уры
/F
odder
Кар
тоф
ель/
Po
tato
Ово
щи
/V
eget
able
s
Бах
чев
ые/
Mel
on
s
Яб
ло
ки/A
pp
les
Ви
но
град
/G
rap
es
КР
С
(мяс
но
е
нап
рав
лен
ие)
/B
eef
cat
КР
С
(мо
ло
чн
ое
нап
рав
лен
ие)
/D
airy
cat
К
он
ево
дст
во/
Ho
rse
br.
Мяс
о-с
альн
ое
овц
ево
дст
во/
Sh
eep
mea
t К
арак
улев
одст
во/
Kar
akul
То
нко
рун
но
е
овц
ево
дст
во/
Sh
eep
se
mi-
fin
e
wo
ol
По
лут
он
кор
унн
ое
овц
ево
дст
во/
Sh
eep
fi
ne
wo
ol
Атырау + + + + + + + +
Жылыойский + + + +
Индерский + + + + + + + +
Исатайский + + + +
Курмангазинск
ий
+ + + + + + +
Кызылкогински
й
+ + + +
Макатский + + +
Махамбетский + + + + + + + + + +
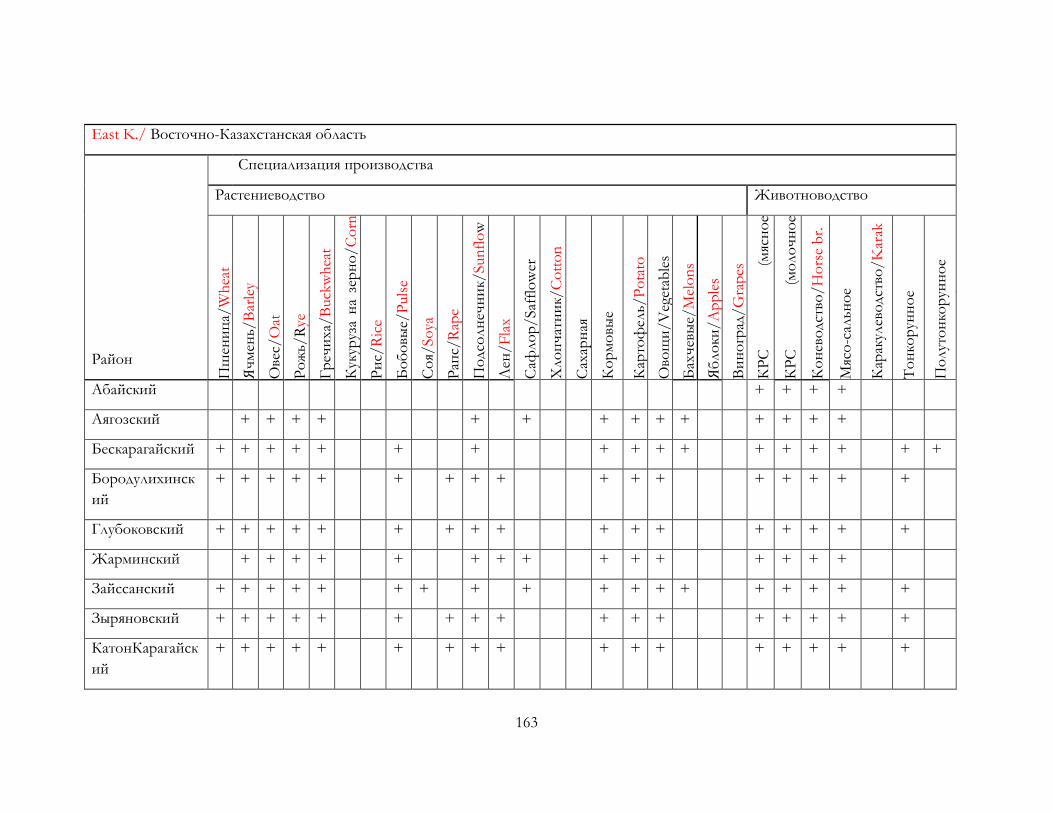
163
East K./ Восточно-Казахстанская область
Район
Специализация производства
Растениеводство Животноводство
Пш
ени
ца/
Wh
eat
Яч
мен
ь/B
arle
y
Ове
с/O
at
Ро
жь/
Rye
Гр
ечи
ха/
Buck
wh
eat
Кук
уруз
а н
а зе
рн
о/
Co
rn
grai
n
Ри
с/R
ice
Бо
бо
вые/
Puls
e
Со
я/So
ya
Рап
с/R
ape
По
дсо
лн
ечн
ик/
Sun
flo
w
er
Лен
/F
lax
Саф
ло
р/
Saf
flo
wer
Хло
пч
атн
ик/
Co
tto
n
Сах
арн
ая
свек
ла/
Suga
rbee
t К
ор
мо
вые
культ
уры
/F
odder
К
арто
фел
ь/P
ota
to
Ово
щи
/V
eget
able
s
Бах
чев
ые/
Mel
on
s
Яб
ло
ки/A
pp
les
Ви
но
град
/G
rap
es
КР
С
(мяс
но
е
нап
рав
лен
ие)
/B
eef
cat
КР
С
(мо
ло
чн
ое
нап
рав
лен
ие)
/D
airy
cat
К
он
ево
дст
во/
Ho
rse
br.
Мяс
о-с
альн
ое
овц
ево
дст
во/
Sh
eep
mea
t К
арак
улев
одст
во/
Kar
ak
ul
То
нко
рун
но
е
овц
ево
дст
во/
Sh
eep
sem
i-
fin
e w
oo
l П
олут
он
кор
унн
ое
овц
ево
дст
во/
Sh
eep
fi
ne
wo
ol
Абайский + + + +
Аягозский + + + + + + + + + + + + + +
Бескарагайский + + + + + + + + + + + + + + + + +
Бородулихинск
ий
+ + + + + + + + + + + + + + + + +
Глубоковский + + + + + + + + + + + + + + + + +
Жарминский + + + + + + + + + + + + + + +
Зайссанский + + + + + + + + + + + + + + + + + +
Зыряновский + + + + + + + + + + + + + + + + +
КатонКарагайск
ий
+ + + + + + + + + + + + + + + + +
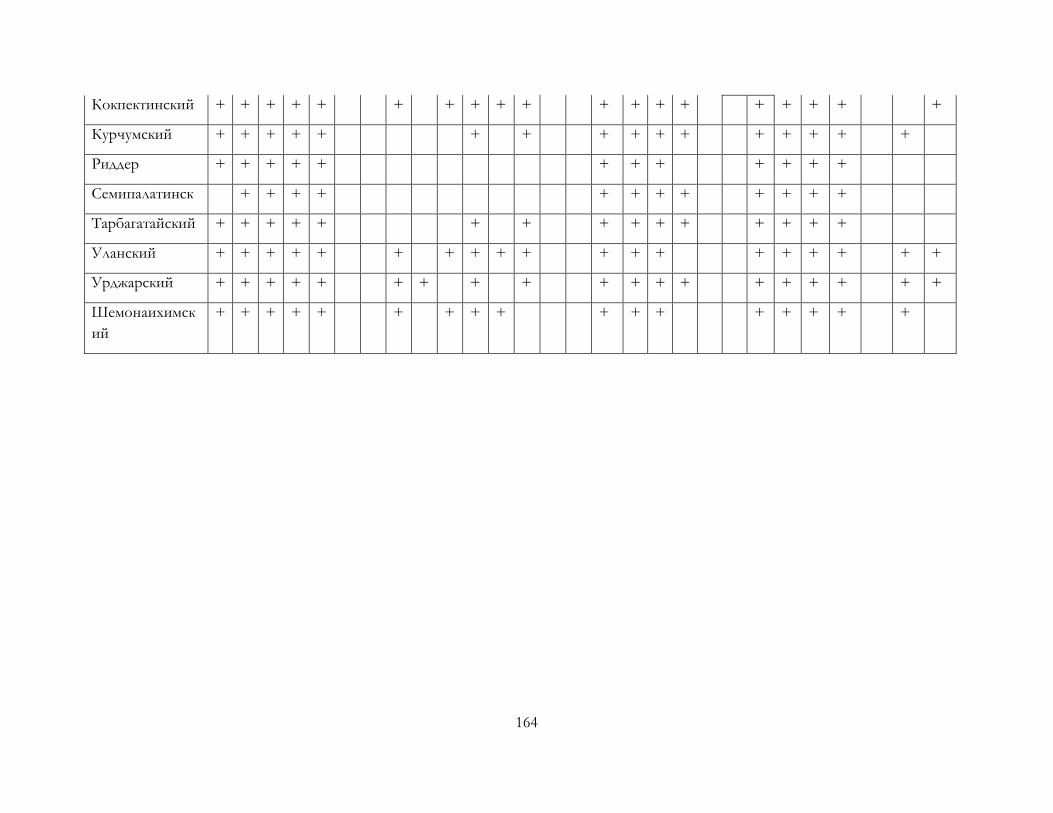
164
Кокпектинский + + + + + + + + + + + + + + + + + + +
Курчумский + + + + + + + + + + + + + + + +
Риддер + + + + + + + + + + + +
Семипалатинск + + + + + + + + + + + +
Тарбагатайский + + + + + + + + + + + + + + +
Уланский + + + + + + + + + + + + + + + + + + +
Урджарский + + + + + + + + + + + + + + + + + + +
Шемонаихимск
ий
+ + + + + + + + + + + + + + + + +
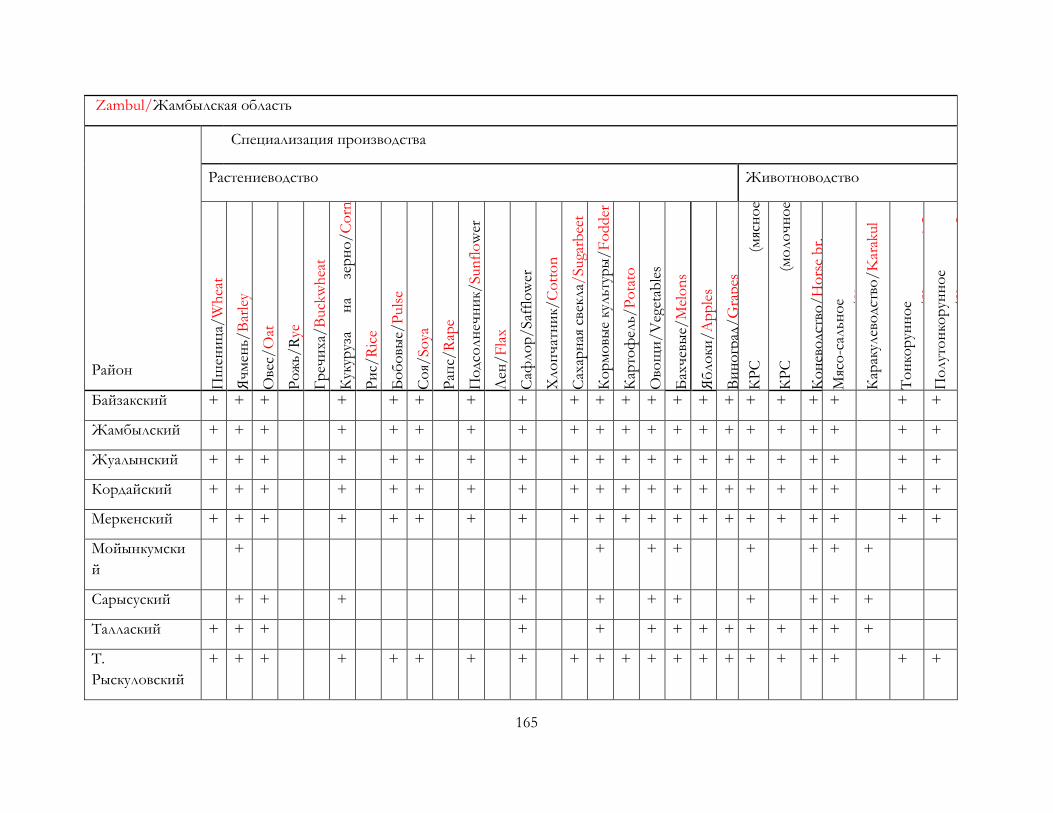
165
Zambul/Жамбылская область
Район
Специализация производства
Растениеводство Животноводство
Пш
ени
ца/
Wh
eat
Яч
мен
ь/B
arle
y
Ове
с/O
at
Ро
жь/
Rye
Гр
ечи
ха/
Buck
wh
eat
Кук
уруз
а н
а зе
рн
о/C
orn
grai
n
Ри
с/R
ice
Бо
бо
вые/
Puls
e
Со
я/So
ya
Рап
с/R
ape
По
дсо
лн
ечн
ик/
Sun
flo
wer
Лен
/F
lax
Саф
ло
р/
Saf
flo
wer
Хло
пч
атн
ик/
Co
tto
n
Сах
арн
ая с
векл
а/Suga
rbee
t
Ко
рм
овы
е ку
льт
уры
/F
odder
Кар
тоф
ель/
Po
tato
Ово
щи
/V
eget
able
s
Бах
чев
ые/
Mel
on
s
Яб
ло
ки/A
pp
les
Ви
но
град
/G
rap
es
КР
С
(мяс
но
е
нап
рав
лен
ие)
/B
eef
cat
КР
С
(мо
ло
чн
ое
нап
рав
лен
ие)
/D
airy
cat
К
он
ево
дст
во/
Ho
rse
br.
Мяс
о-с
альн
ое
овц
ево
дст
во/
Sh
eep
mea
t К
арак
улев
одст
во/
Kar
akul
То
нко
рун
но
е
овц
ево
дст
во/
Sh
eep
sem
i-fi
ne
wo
ol
По
лут
он
кор
унн
ое
овц
ево
дст
во/
Sh
eep
fin
e
wo
ol
Байзакский + + + + + + + + + + + + + + + + + + + + +
Жамбылский + + + + + + + + + + + + + + + + + + + + +
Жуалынский + + + + + + + + + + + + + + + + + + + + +
Кордайский + + + + + + + + + + + + + + + + + + + + +
Меркенский + + + + + + + + + + + + + + + + + + + + +
Мойынкумски
й
+ + + + + + + +
Сарысуский + + + + + + + + + + +
Таллаский + + + + + + + + + + + + + +
Т.
Рыскуловский
+ + + + + + + + + + + + + + + + + + + + +
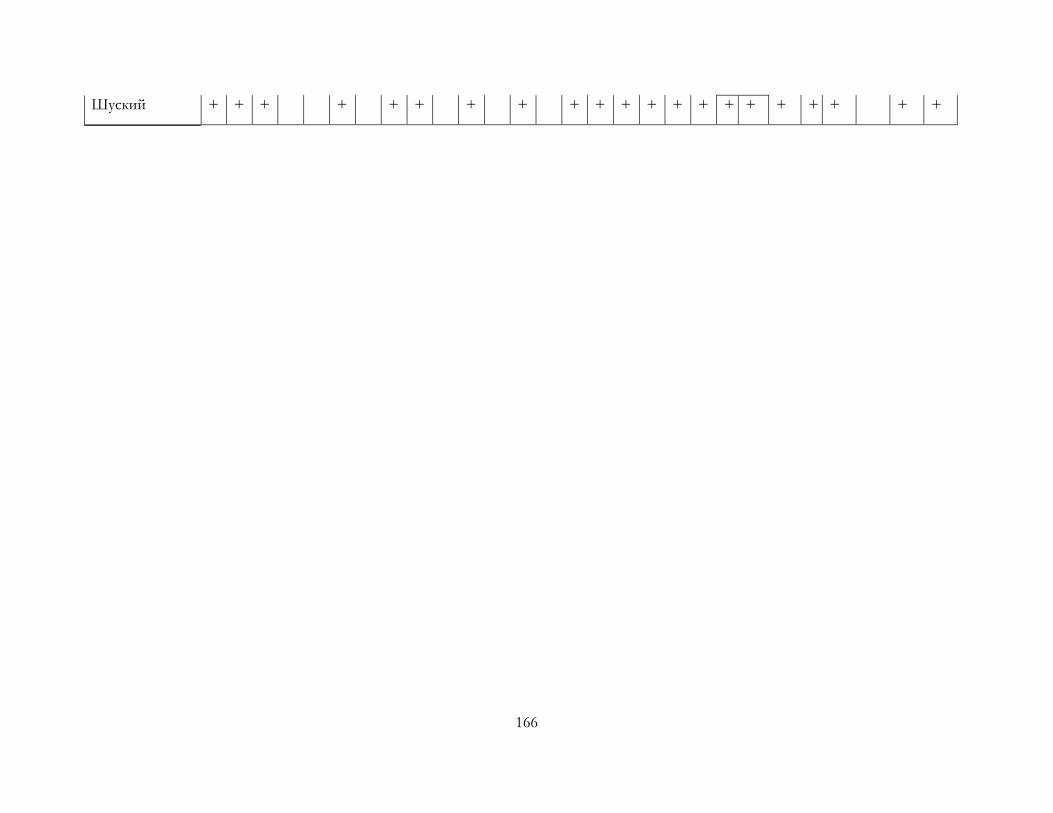
166
Шуский + + + + + + + + + + + + + + + + + + + + +
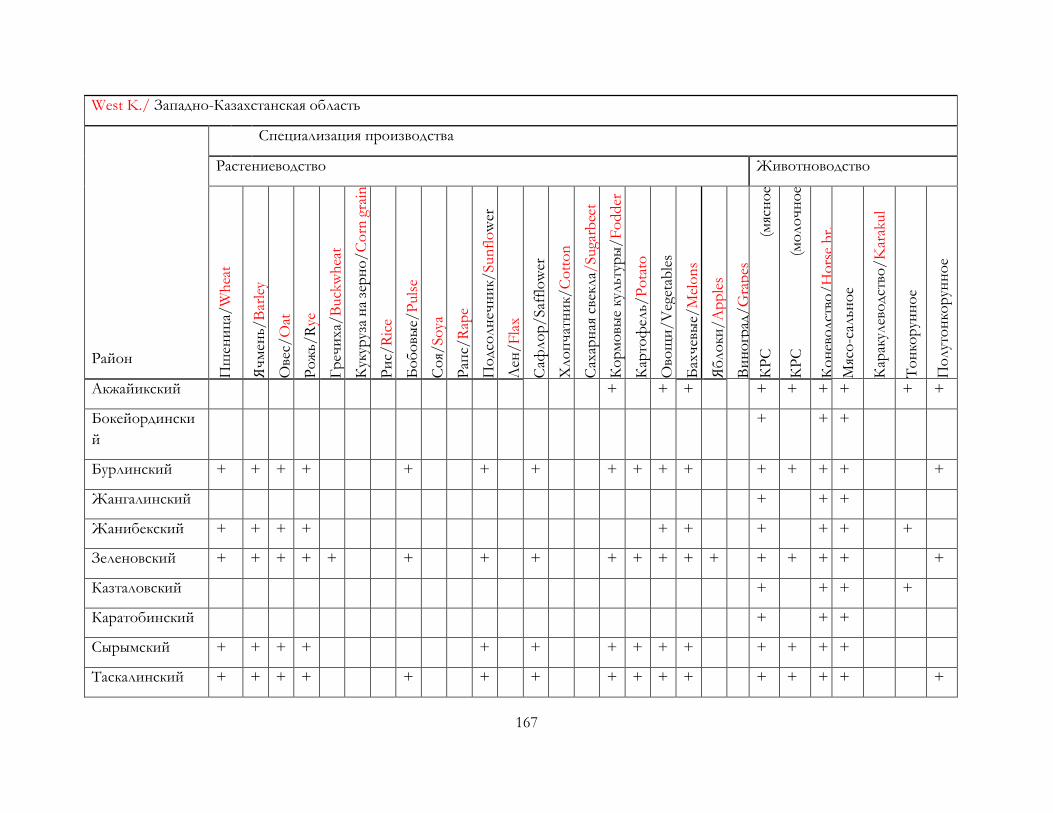
167
West K./ Западно-Казахстанская область
Район
Специализация производства
Растениеводство Животноводство
Пш
ени
ца/
Wh
eat
Яч
мен
ь/B
arle
y
Ове
с/O
at
Ро
жь/
Rye
Гр
ечи
ха/
Buck
wh
eat
Кук
уруз
а н
а зе
рн
о/
Co
rn g
rain
Ри
с/R
ice
Бо
бо
вые/
Puls
e
Со
я/So
ya
Рап
с/R
ape
По
дсо
лн
ечн
ик/
Sun
flo
wer
Лен
/F
lax
Саф
ло
р/
Saf
flo
wer
Хло
пч
атн
ик/
Co
tto
n
Сах
арн
ая с
векл
а/Suga
rbee
t
Ко
рм
овы
е ку
льт
уры
/F
odder
Кар
тоф
ель/
Po
tato
Ово
щи
/V
eget
able
s
Бах
чев
ые/
Mel
on
s
Яб
ло
ки/A
pp
les
Ви
но
град
/G
rap
es
КР
С
(мяс
но
е
нап
рав
лен
ие)
/B
eef
cat
КР
С
(мо
ло
чн
ое
нап
рав
лен
ие)
/D
airy
cat
К
он
ево
дст
во/
Ho
rse
br.
Мяс
о-с
альн
ое
овц
ево
дст
во/
Sh
eep
mea
t К
арак
улев
одст
во/
Kar
akul
То
нко
рун
но
е
овц
ево
дст
во/
Sh
eep
se
mi-
fin
e
wo
ol
По
лут
он
кор
унн
ое
овц
ево
дст
во/
Sh
eep
fi
ne
wo
ol
Акжайикский + + + + + + + + +
Бокейордински
й
+ + +
Бурлинский + + + + + + + + + + + + + + + +
Жангалинский + + +
Жанибекский + + + + + + + + + +
Зеленовский + + + + + + + + + + + + + + + + + +
Казталовский + + + +
Каратобинский + + +
Сырымский + + + + + + + + + + + + + +
Таскалинский + + + + + + + + + + + + + + + +
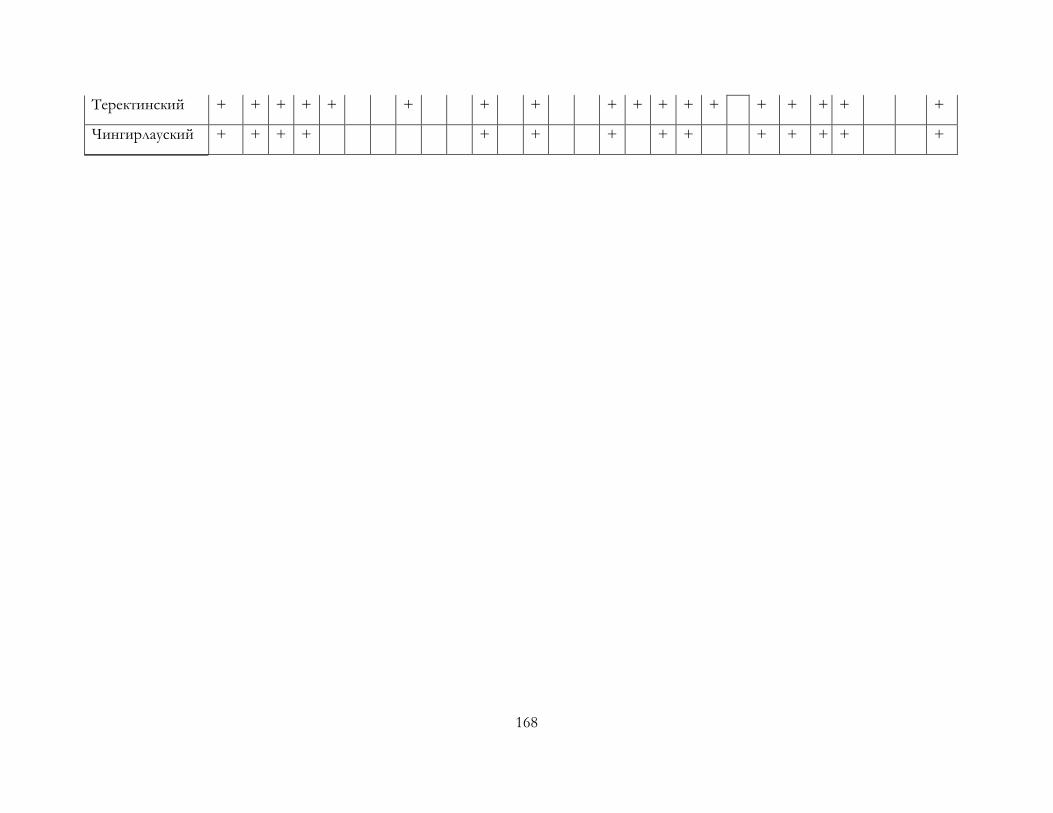
168
Теректинский + + + + + + + + + + + + + + + + + +
Чингирлауский + + + + + + + + + + + + + +
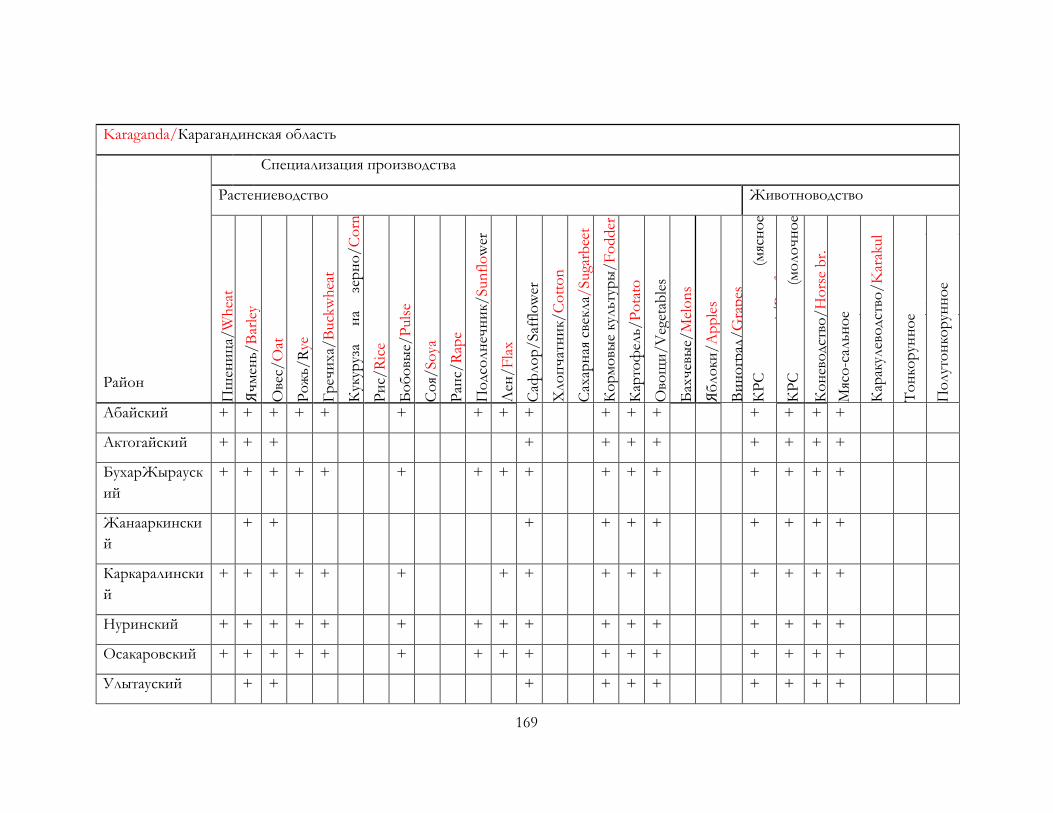
169
Karaganda/Карагандинская область
Район
Специализация производства
Растениеводство Животноводство
Пш
ени
ца/
Wh
eat
Яч
мен
ь/B
arle
y
Ове
с/O
at
Ро
жь/
Rye
Гр
ечи
ха/
Buck
wh
eat
Кук
уруз
а н
а зе
рн
о/C
orn
grai
n
Ри
с/R
ice
Бо
бо
вые/
Puls
e
Со
я/So
ya
Рап
с/R
ape
По
дсо
лн
ечн
ик/
Sun
flo
wer
Лен
/F
lax
Саф
ло
р/
Saf
flo
wer
Хло
пч
атн
ик/
Co
tto
n
Сах
арн
ая с
векл
а/Suga
rbee
t
Ко
рм
овы
е ку
льт
уры
/F
odder
Кар
тоф
ель/
Po
tato
Ово
щи
/V
eget
able
s
Бах
чев
ые/
Mel
on
s
Яб
ло
ки/A
pp
les
Ви
но
град
/G
rap
es
КР
С
(мяс
но
е
нап
рав
лен
ие)
/B
eef
cat
КР
С
(мо
ло
чн
ое
нап
рав
лен
ие)
/D
airy
cat
К
он
ево
дст
во/
Ho
rse
br.
Мяс
о-с
альн
ое
овц
ево
дст
во/
Sh
eep
mea
t К
арак
улев
одст
во/
Kar
akul
То
нко
рун
но
е
овц
ево
дст
во/
Sh
eep
sem
i-fi
ne
wo
ol
По
лут
он
кор
унн
ое
овц
ево
дст
во/
Sh
eep
fin
e
wo
ol
Абайский + + + + + + + + + + + + + + + +
Актогайский + + + + + + + + + + +
БухарЖырауск
ий
+ + + + + + + + + + + + + + + +
Жанааркински
й
+ + + + + + + + + +
Каркаралински
й
+ + + + + + + + + + + + + + +
Нуринский + + + + + + + + + + + + + + + +
Осакаровский + + + + + + + + + + + + + + + +
Улытауский + + + + + + + + + +
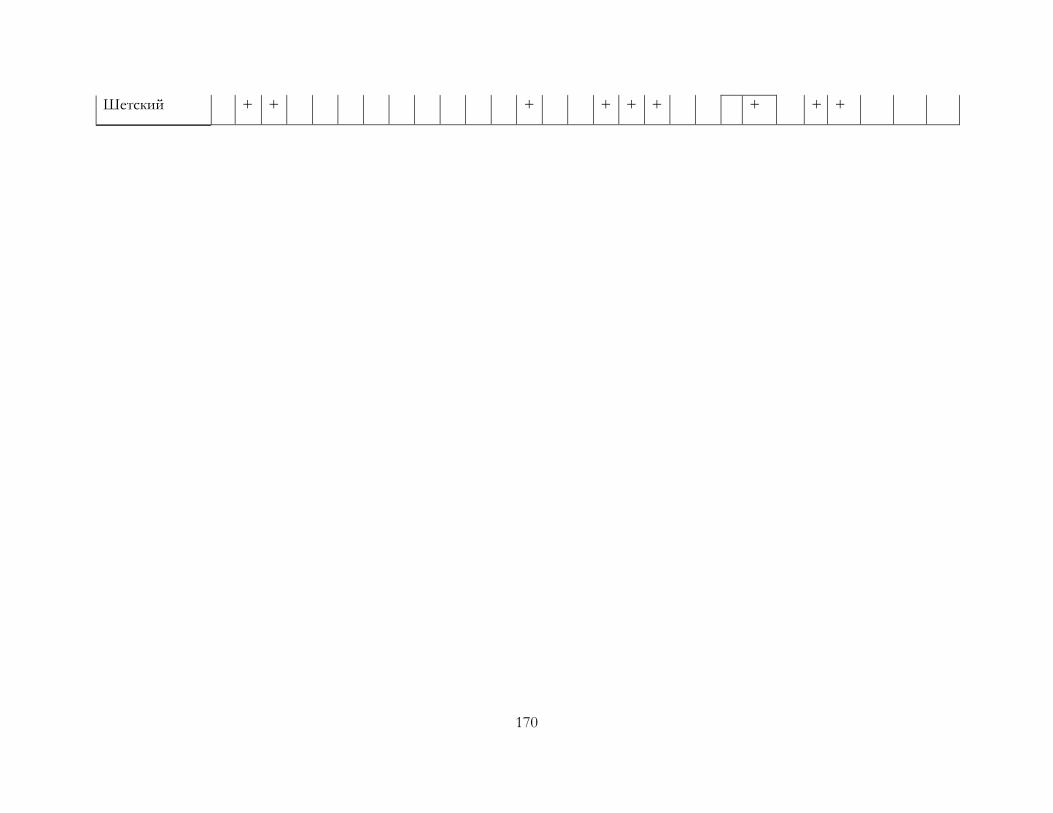
170
Шетский + + + + + + + + +
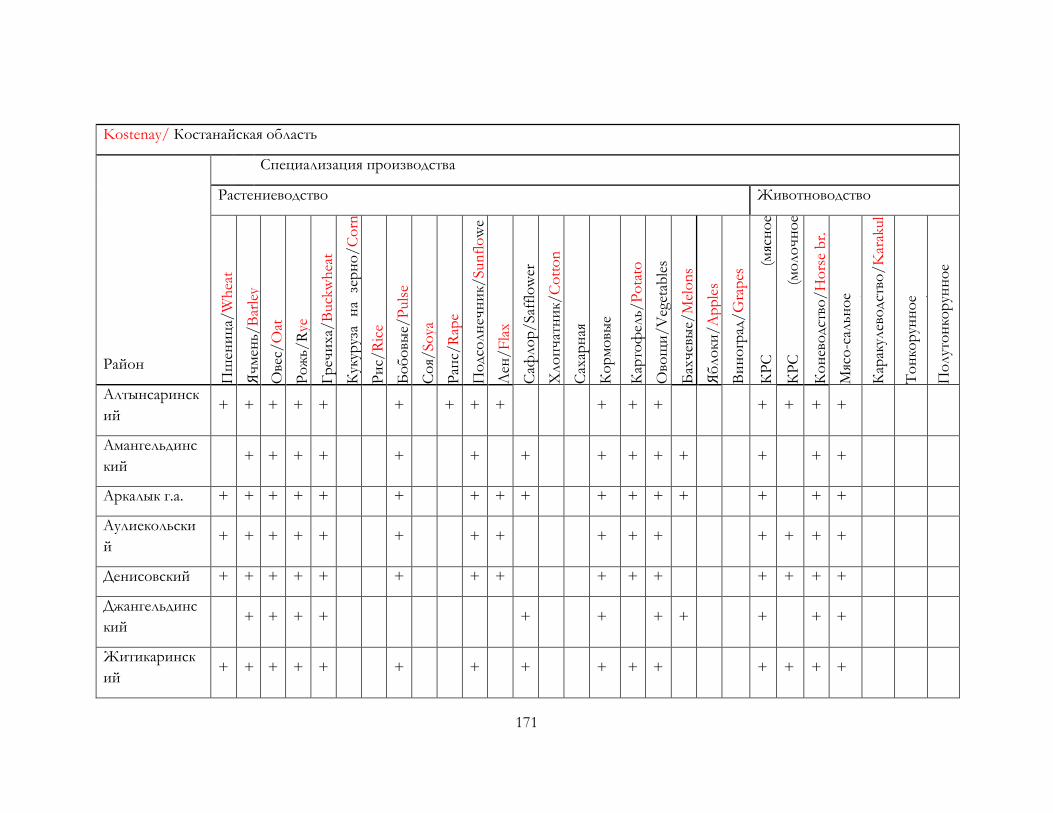
171
Kostenay/ Костанайская область
Район
Специализация производства
Растениеводство Животноводство
Пш
ени
ца/
Wh
eat
Яч
мен
ь/B
arle
y
Ове
с/O
at
Ро
жь/
Rye
Гр
ечи
ха/
Buck
wh
eat
Кук
уруз
а н
а зе
рн
о/
Co
rn
grai
n
Ри
с/R
ice
Бо
бо
вые/
Puls
e
Со
я/So
ya
Рап
с/R
ape
По
дсо
лн
ечн
ик/
Sun
flo
we
r Лен
/F
lax
Саф
ло
р/
Saf
flo
wer
Хло
пч
атн
ик/
Co
tto
n
Сах
арн
ая
свек
ла/
Suga
rbee
t К
ор
мо
вые
культ
уры
/F
odder
К
арто
фел
ь/P
ota
to
Ово
щи
/V
eget
able
s
Бах
чев
ые/
Mel
on
s
Яб
ло
ки/A
pp
les
Ви
но
град
/G
rap
es
КР
С
(мяс
но
е
нап
рав
лен
ие)
/B
eef
cat
КР
С
(мо
ло
чн
ое
нап
рав
лен
ие)
/D
airy
cat
К
он
ево
дст
во/
Ho
rse
br.
Мяс
о-с
альн
ое
овц
ево
дст
во/
Sh
eep
mea
t К
арак
улев
одст
во/
Kar
akul
То
нко
рун
но
е
овц
ево
дст
во/
Sh
eep
se
mi-
fin
e w
oo
l П
олут
он
кор
унн
ое
овц
ево
дст
во/
Sh
eep
fine
wo
ol
Алтынсаринск
ий + + + + + + + + + + + +
+ + + +
Амангельдинс
кий + + + + + + + + + + +
+ + +
Аркалык г.а. + + + + + + + + + + + + + + + +
Аулиекольски
й + + + + + + + + + + +
+ + + +
Денисовский + + + + + + + + + + + + + + +
Джангельдинс
кий + + + + + + + +
+ + +
Житикаринск
ий + + + + + + + + + + +
+ + + +
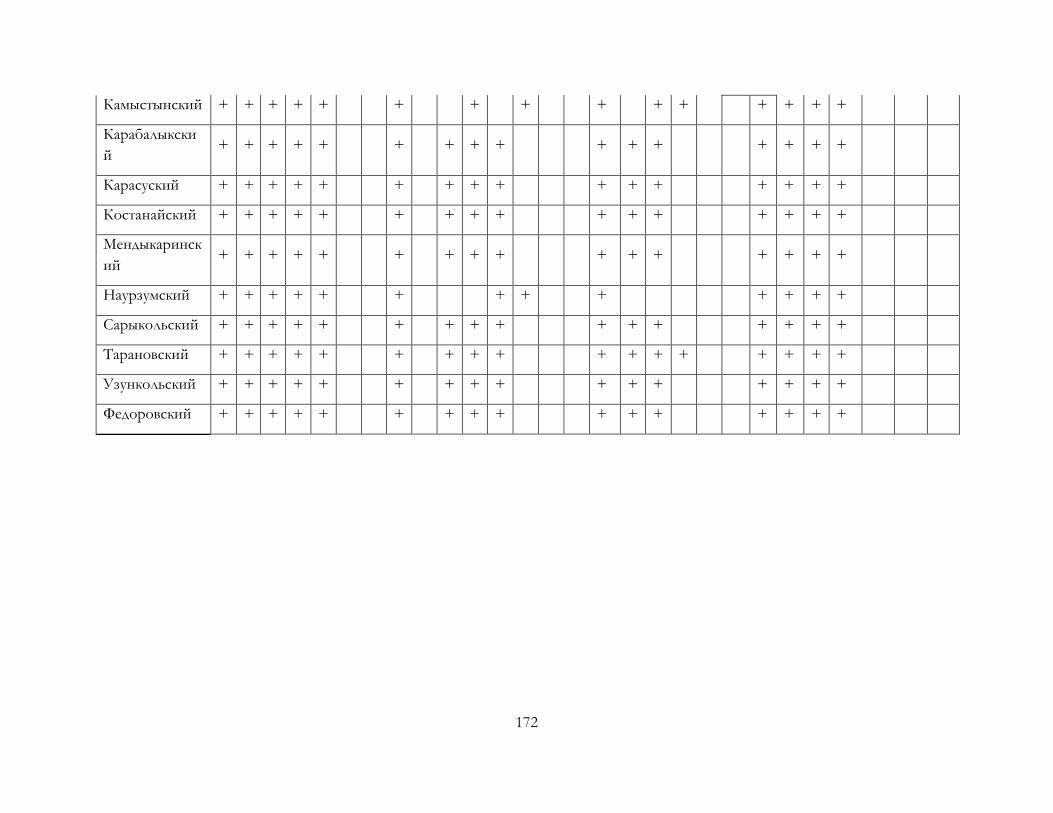
172
Камыстынский + + + + + + + + + + + + + + +
Карабалыкски
й + + + + + + + + + + + +
+ + + +
Карасуский + + + + + + + + + + + + + + + +
Костанайский + + + + + + + + + + + + + + + +
Мендыкаринск
ий + + + + + + + + + + + +
+ + + +
Наурзумский + + + + + + + + + + + + +
Сарыкольский + + + + + + + + + + + + + + + +
Тарановский + + + + + + + + + + + + + + + + +
Узункольский + + + + + + + + + + + + + + + +
Федоровский + + + + + + + + + + + + + + + +
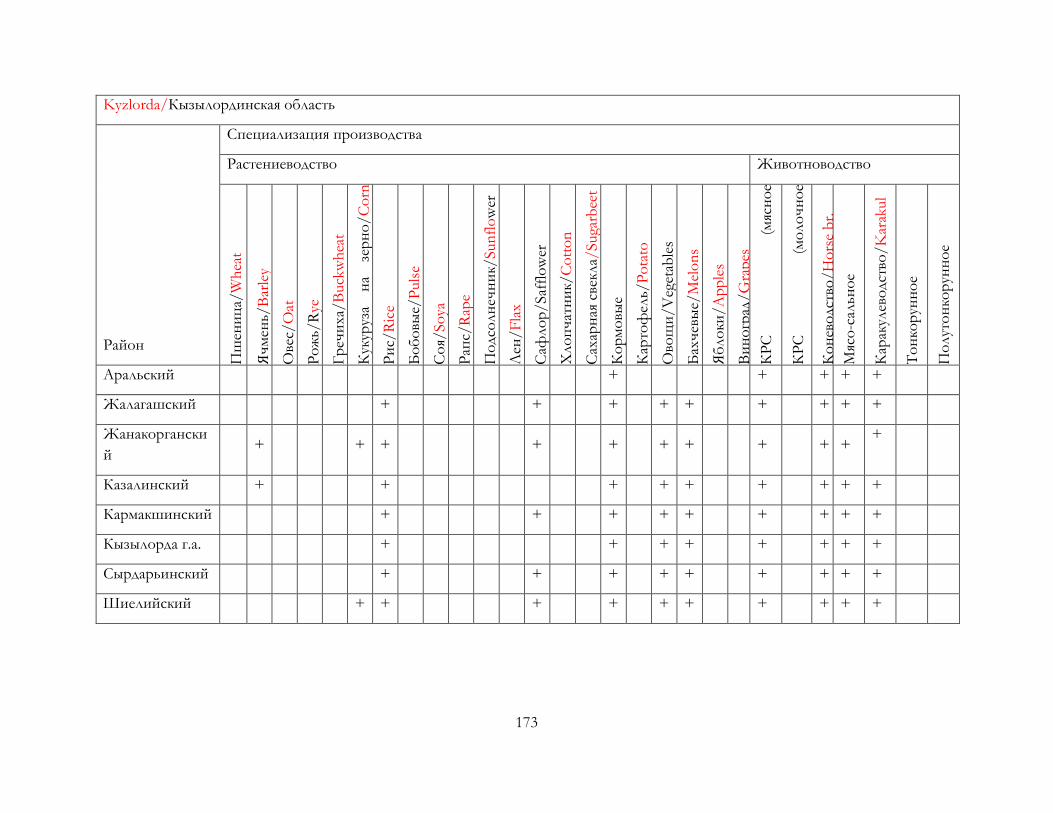
173
Kyzlorda/Кызылординская область
Район
Специализация производства
Растениеводство Животноводство
Пш
ени
ца/
Wh
eat
Яч
мен
ь/B
arle
y
Ове
с/O
at
Ро
жь/
Rye
Гр
ечи
ха/
Buck
wh
eat
Кук
уруз
а н
а зе
рн
о/
Co
rn
grai
n
Ри
с/R
ice
Бо
бо
вые/
Puls
e
Со
я/So
ya
Рап
с/R
ape
По
дсо
лн
ечн
ик/
Sun
flo
wer
Лен
/F
lax
Саф
ло
р/
Saf
flo
wer
Хло
пч
атн
ик/
Co
tto
n
Сах
арн
ая с
векл
а/Suga
rbee
t
Ко
рм
овы
е
культ
уры
/F
odder
К
арто
фел
ь/P
ota
to
Ово
щи
/V
eget
able
s
Бах
чев
ые/
Mel
on
s
Яб
ло
ки/A
pp
les
Ви
но
град
/G
rap
es
КР
С
(мяс
но
е
нап
рав
лен
ие)
/B
eef
cat
КР
С
(мо
ло
чн
ое
нап
рав
лен
ие)
/D
airy
cat
К
он
ево
дст
во/
Ho
rse
br.
Мяс
о-с
альн
ое
овц
ево
дст
во/
Sh
eep
mea
t К
арак
улев
одст
во/
Kar
akul
То
нко
рун
но
е
овц
ево
дст
во/
Sh
eep
se
mi-
fin
e w
oo
l П
олут
он
кор
унн
ое
овц
ево
дст
во/
Sh
eep
fin
e
wo
ol
Аральский + + + + +
Жалагашский + + + + + + + + +
Жанакоргански
й + + + + + + +
+ + +
+
Казалинский + + + + + + + + +
Кармакшинский + + + + + + + + +
Кызылорда г.а. + + + + + + + +
Сырдарьинский + + + + + + + + +
Шиелийский + + + + + + + + + +
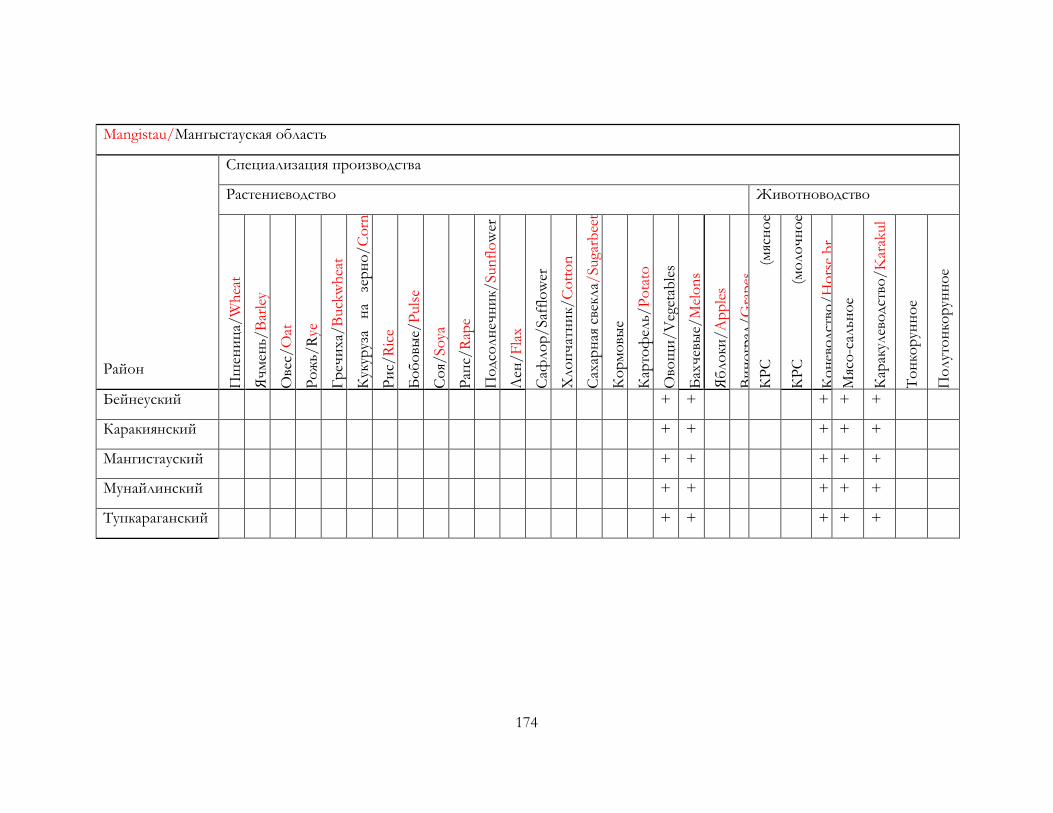
174
Mangistau/Мангыстауская область
Район
Специализация производства
Растениеводство Животноводство
Пш
ени
ца/
Wh
eat
Яч
мен
ь/B
arle
y
Ове
с/O
at
Ро
жь/
Rye
Гр
ечи
ха/
Buck
wh
eat
Кук
уруз
а н
а зе
рн
о/
Corn
grai
n
Ри
с/R
ice
Бо
бо
вые/
Puls
e
Со
я/So
ya
Рап
с/R
ape
По
дсо
лн
ечн
ик/
Sun
flo
wer
Лен
/F
lax
Саф
ло
р/
Saf
flo
wer
Хло
пч
атн
ик/
Co
tto
n
Сах
арн
ая с
векл
а/Suga
rbee
t
Ко
рм
овы
е
культ
уры
/F
odder
К
арто
фел
ь/P
ota
to
Ово
щи
/V
eget
able
s
Бах
чев
ые/
Mel
on
s
Яб
ло
ки/A
pp
les
Ви
но
град
/G
rap
es
КР
С
(мяс
но
е
нап
рав
лен
ие)
/B
eef
cat
КР
С
(мо
ло
чн
ое
нап
рав
лен
ие)
/D
airy
cat
К
он
ево
дст
во/
Ho
rse
br.
Мяс
о-с
альн
ое
овц
ево
дст
во/
Sh
eep
mea
t К
арак
улев
одст
во/
Kar
akul
То
нко
рун
но
е
овц
ево
дст
во/
Sh
eep
se
mi-
fin
e w
oo
l П
олут
он
кор
унн
ое
овц
ево
дст
во/
Sh
eep
fin
e
wo
ol
Бейнеуский + + + + +
Каракиянский + + + + +
Мангистауский + + + + +
Мунайлинский + + + + +
Тупкараганский + + + + +
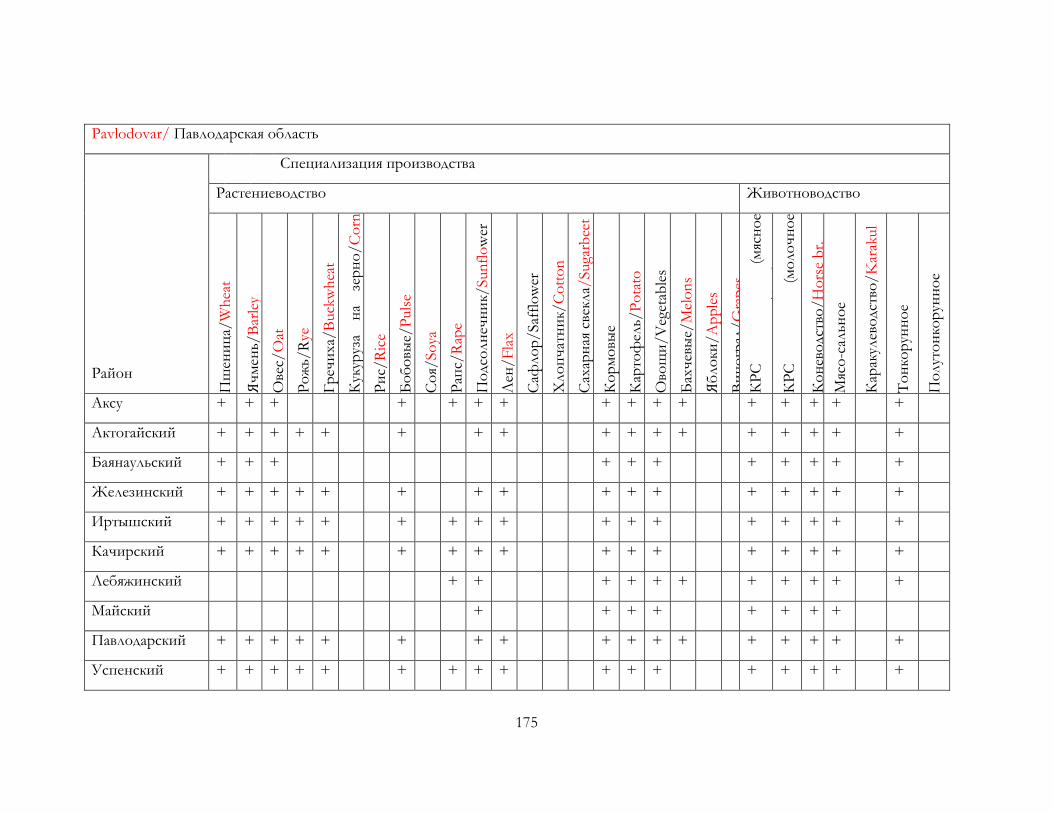
175
Pavlodovar/ Павлодарская область
Район
Специализация производства
Растениеводство Животноводство
Пш
ени
ца/
Wh
eat
Яч
мен
ь/B
arle
y
Ове
с/O
at
Ро
жь/
Rye
Гр
ечи
ха/
Buck
wh
eat
Кук
уруз
а н
а зе
рн
о/
Co
rn
grai
n
Ри
с/R
ice
Бо
бо
вые/
Puls
e
Со
я/So
ya
Рап
с/R
ape
По
дсо
лн
ечн
ик/
Sun
flo
wer
Лен
/F
lax
Саф
ло
р/
Saf
flo
wer
Хло
пч
атн
ик/
Co
tto
n
Сах
арн
ая с
векл
а/Suga
rbee
t
Ко
рм
овы
е
культ
уры
/F
odder
К
арто
фел
ь/P
ota
to
Ово
щи
/V
eget
able
s
Бах
чев
ые/
Mel
on
s
Яб
ло
ки/A
pp
les
Ви
но
град
/G
rap
es
КР
С
(мяс
но
е
нап
рав
лен
ие)
/B
eef
cat
КР
С
(мо
ло
чн
ое
нап
рав
лен
ие)
/D
airy
cat
К
он
ево
дст
во/
Ho
rse
br.
Мяс
о-с
альн
ое
овц
ево
дст
во/
Sh
eep
mea
t К
арак
улев
одст
во/
Kar
akul
То
нко
рун
но
е
овц
ево
дст
во/
Sh
eep
se
mi-
fin
e w
oo
l П
олут
он
кор
унн
ое
овц
ево
дст
во/
Sh
eep
fin
e
wo
ol
Аксу + + + + + + + + + + + + + + + +
Актогайский + + + + + + + + + + + + + + + + +
Баянаульский + + + + + + + + + + +
Железинский + + + + + + + + + + + + + + + +
Иртышский + + + + + + + + + + + + + + + + +
Качирский + + + + + + + + + + + + + + + + +
Лебяжинский + + + + + + + + + + +
Майский + + + + + + + +
Павлодарский + + + + + + + + + + + + + + + + +
Успенский + + + + + + + + + + + + + + + + +

176
Щербактинский + + + + + + + + + + + + + + + + +
Экибастуз + + + + + + + + + + + +
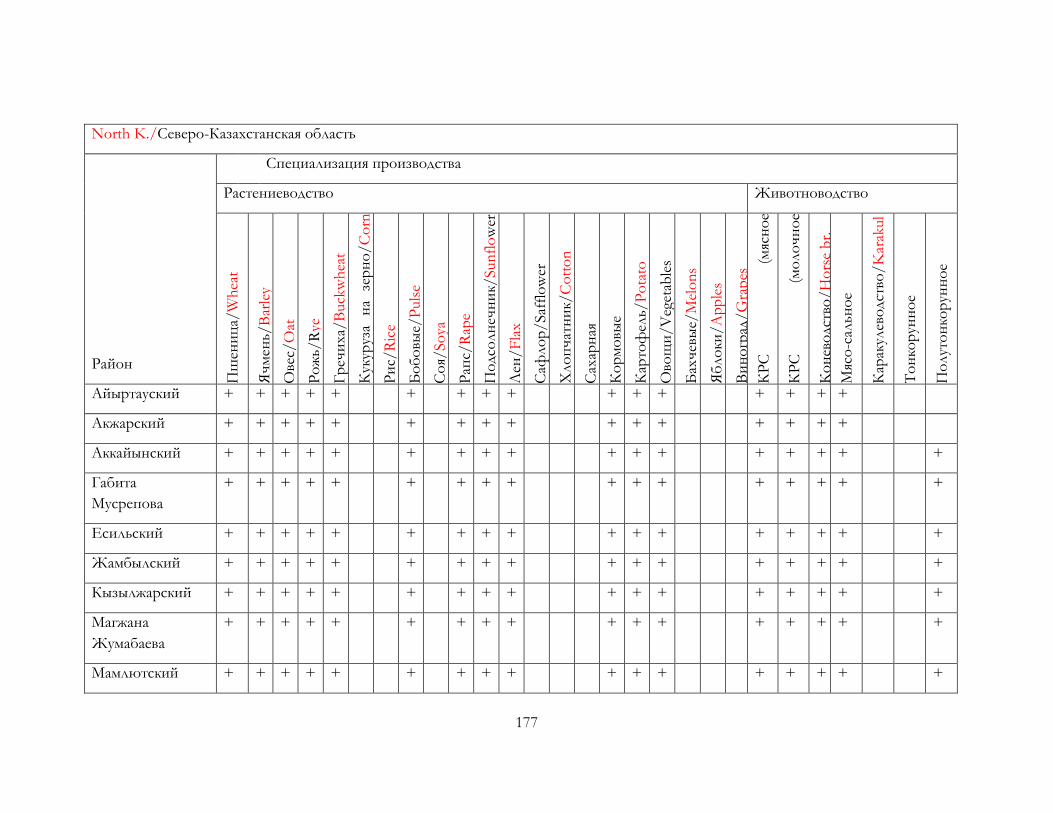
177
North K./Северо-Казахстанская область
Район
Специализация производства
Растениеводство Животноводство
Пш
ени
ца/
Wh
eat
Яч
мен
ь/B
arle
y
Ове
с/O
at
Ро
жь/
Rye
Гр
ечи
ха/
Buck
wh
eat
Кук
уруз
а н
а зе
рн
о/
Co
rn
grai
n
Ри
с/R
ice
Бо
бо
вые/
Puls
e
Со
я/So
ya
Рап
с/R
ape
По
дсо
лн
ечн
ик/
Sun
flo
wer
Лен
/F
lax
Саф
ло
р/
Saf
flo
wer
Хло
пч
атн
ик/
Co
tto
n
Сах
арн
ая
свек
ла/
Suga
rbee
t К
ор
мо
вые
культ
уры
/F
odder
К
арто
фел
ь/P
ota
to
Ово
щи
/V
eget
able
s
Бах
чев
ые/
Mel
on
s
Яб
ло
ки/A
pp
les
Ви
но
град
/G
rap
es
КР
С
(мяс
но
е
нап
рав
лен
ие)
/B
eef
cat
КР
С
(мо
ло
чн
ое
нап
рав
лен
ие)
/D
airy
cat
К
он
ево
дст
во/
Ho
rse
br.
Мяс
о-с
альн
ое
овц
ево
дст
во/
Sh
eep
mea
t К
арак
улев
одст
во/
Kar
akul
То
нко
рун
но
е
овц
ево
дст
во/
Sh
eep
se
mi-
fin
e w
oo
l П
олут
он
кор
унн
ое
овц
ево
дст
во/
Sh
eep
fin
e
wo
ol
Айыртауский + + + + + + + + + + + + + + + +
Акжарский + + + + + + + + + + + + + + + +
Аккайынский + + + + + + + + + + + + + + + + +
Габита
Мусрепова
+ + + + + + + + + + + + + + + + +
Есильский + + + + + + + + + + + + + + + + +
Жамбылский + + + + + + + + + + + + + + + + +
Кызылжарский + + + + + + + + + + + + + + + + +
Магжана
Жумабаева
+ + + + + + + + + + + + + + + + +
Мамлютский + + + + + + + + + + + + + + + + +
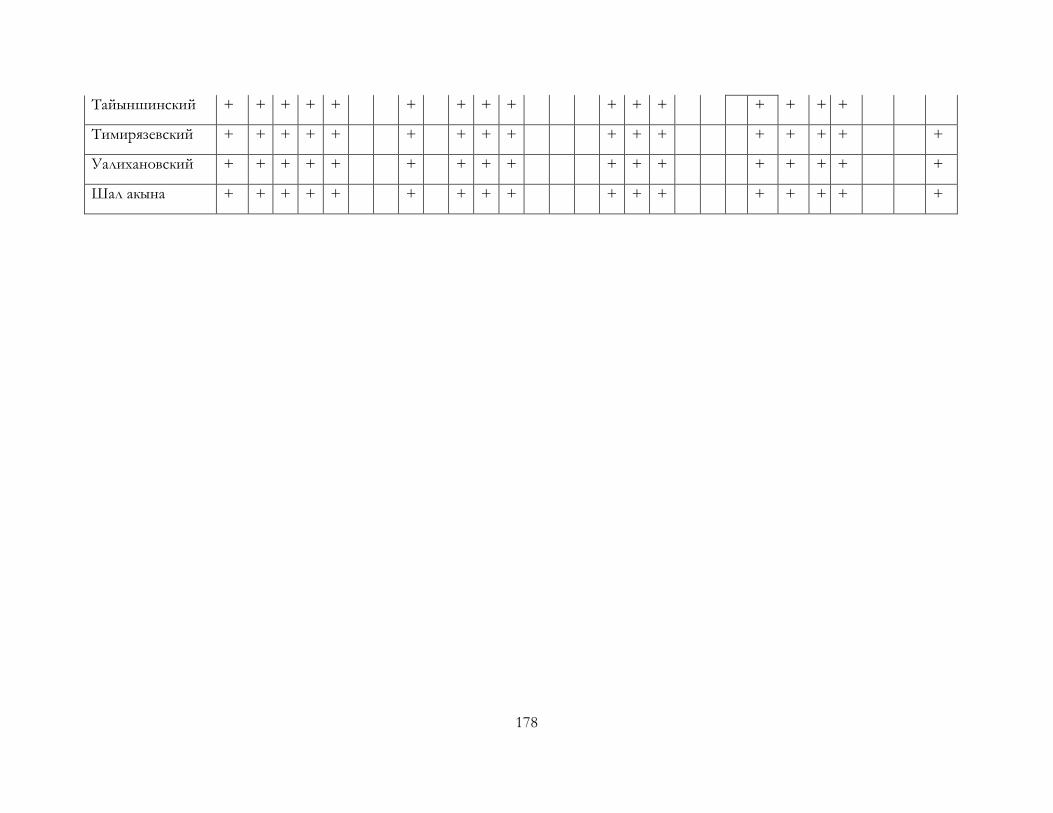
178
Тайыншинский + + + + + + + + + + + + + + + +
Тимирязевский + + + + + + + + + + + + + + + + +
Уалихановский + + + + + + + + + + + + + + + + +
Шал акына + + + + + + + + + + + + + + + + +
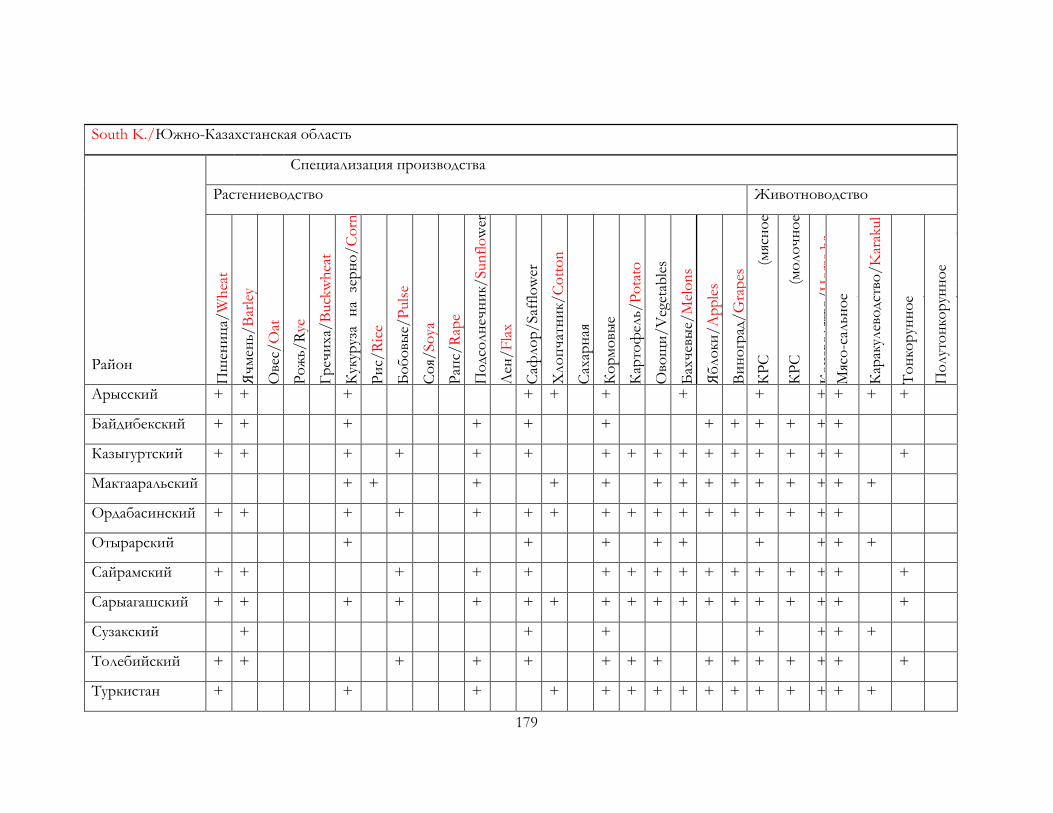
179
South K./Южно-Казахстанская область
Район
Специализация производства
Растениеводство Животноводство
Пш
ени
ца/
Wh
eat
Яч
мен
ь/B
arle
y
Ове
с/O
at
Ро
жь/
Rye
Гр
ечи
ха/
Buck
wh
eat
Кук
уруз
а н
а зе
рн
о/
Co
rn
grai
n
Ри
с/R
ice
Бо
бо
вые/
Puls
e
Со
я/So
ya
Рап
с/R
ape
По
дсо
лн
ечн
ик/
Sun
flo
wer
Лен
/F
lax
Саф
ло
р/
Saf
flo
wer
Хло
пч
атн
ик/
Co
tto
n
Сах
арн
ая
свек
ла/
Suga
rbee
t К
ор
мо
вые
культ
уры
/F
odder
К
арто
фел
ь/P
ota
to
Ово
щи
/V
eget
able
s
Бах
чев
ые/
Mel
on
s
Яб
ло
ки/A
pp
les
Ви
но
град
/G
rap
es
КР
С
(мяс
но
е
нап
рав
лен
ие)
/B
eef
cat
КР
С
(мо
ло
чн
ое
нап
рав
лен
ие)
/D
airy
cat
К
он
ево
дст
во/
Ho
rse
br.
М
ясо
-сал
ьно
е
овц
ево
дст
во/
Sh
eep
mea
t К
арак
улев
одст
во/
Kar
akul
То
нко
рун
но
е
овц
ево
дст
во/
Sh
eep
se
mi-
fin
e w
oo
l П
олут
он
кор
унн
ое
овц
ево
дст
во/
Sh
eep
fin
e
wo
ol
Арысский + + + + + + + + + + + +
Байдибекский + + + + + + + + + + + +
Казыгуртский + + + + + + + + + + + + + + + + +
Мактааральский + + + + + + + + + + + + + +
Ордабасинский + + + + + + + + + + + + + + + + +
Отырарский + + + + + + + + +
Сайрамский + + + + + + + + + + + + + + + +
Сарыагашский + + + + + + + + + + + + + + + + + +
Сузакский + + + + + + +
Толебийский + + + + + + + + + + + + + + +
Туркистан + + + + + + + + + + + + + + +
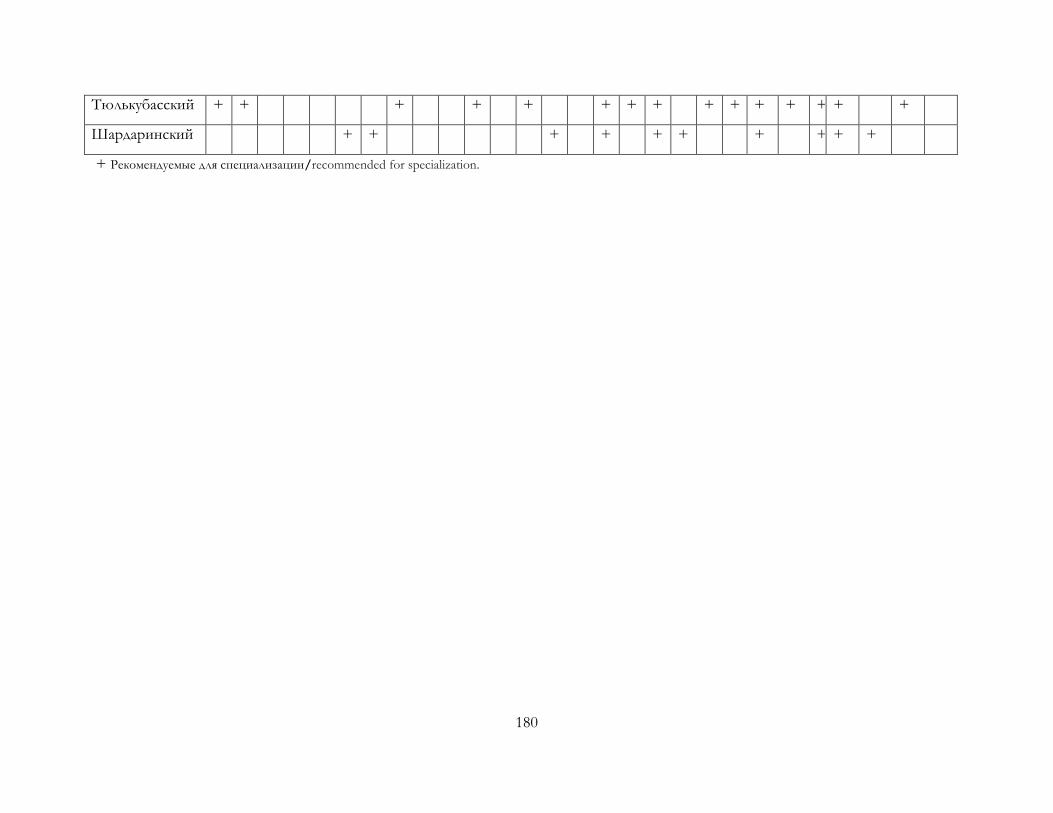
180
Тюлькубасский + + + + + + + + + + + + + + +
Шардаринский + + + + + + + + + +
+ Рекомендуемые для специализации/recommended for specialization.
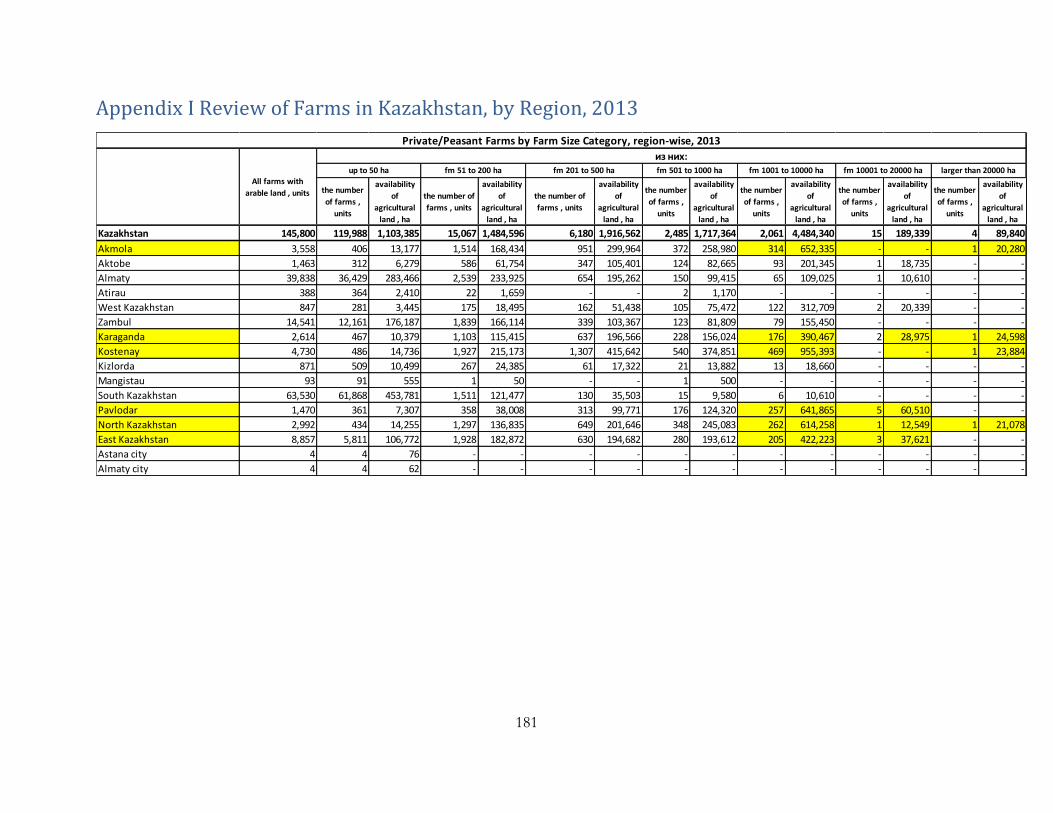
181
Appendix I Review of Farms in Kazakhstan, by Region, 2013
the number
of farms ,
units
availability
of
agricultural
land , ha
the number of
farms , units
availability
of
agricultural
land , ha
the number of
farms , units
availability
of
agricultural
land , ha
the number
of farms ,
units
availability
of
agricultural
land , ha
the number
of farms ,
units
availability
of
agricultural
land , ha
the number
of farms ,
units
availability
of
agricultural
land , ha
the number
of farms ,
units
availability
of
agricultural
land , ha
Kazakhstan 145,800 119,988 1,103,385 15,067 1,484,596 6,180 1,916,562 2,485 1,717,364 2,061 4,484,340 15 189,339 4 89,840
Akmola 3,558 406 13,177 1,514 168,434 951 299,964 372 258,980 314 652,335 - - 1 20,280
Aktobe 1,463 312 6,279 586 61,754 347 105,401 124 82,665 93 201,345 1 18,735 - -
Almaty 39,838 36,429 283,466 2,539 233,925 654 195,262 150 99,415 65 109,025 1 10,610 - -
Atirau 388 364 2,410 22 1,659 - - 2 1,170 - - - - - -
West Kazakhstan 847 281 3,445 175 18,495 162 51,438 105 75,472 122 312,709 2 20,339 - -
Zambul 14,541 12,161 176,187 1,839 166,114 339 103,367 123 81,809 79 155,450 - - - -
Karaganda 2,614 467 10,379 1,103 115,415 637 196,566 228 156,024 176 390,467 2 28,975 1 24,598
Kostenay 4,730 486 14,736 1,927 215,173 1,307 415,642 540 374,851 469 955,393 - - 1 23,884
Kizlorda 871 509 10,499 267 24,385 61 17,322 21 13,882 13 18,660 - - - -
Mangistau 93 91 555 1 50 - - 1 500 - - - - - -
South Kazakhstan 63,530 61,868 453,781 1,511 121,477 130 35,503 15 9,580 6 10,610 - - - -
Pavlodar 1,470 361 7,307 358 38,008 313 99,771 176 124,320 257 641,865 5 60,510 - -
North Kazakhstan 2,992 434 14,255 1,297 136,835 649 201,646 348 245,083 262 614,258 1 12,549 1 21,078
East Kazakhstan 8,857 5,811 106,772 1,928 182,872 630 194,682 280 193,612 205 422,223 3 37,621 - -
Astana city 4 4 76 - - - - - - - - - - - -
Almaty city 4 4 62 - - - - - - - - - - - -
fm 10001 tо 20000 hа larger than 20000 hа
Private/Peasant Farms by Farm Size Category, region-wise, 2013
All farms with
arable land , units
из них:up to 50 ha fm 51 tо 200 hа fm 201 tо 500 ha fm 501 tо 1000 hа fm 1001 tо 10000 hа
182
References
ACT (Adaptation to Climate Change Team). 2013. “Climate Change Adaptation and Canada’s Crops
and Food Supply.” Simon Fraser University, Vancouver, July 3.
Agriteam Canada. 2005. “China Feed Industry Centre Project, Final Report.” CIDA Project No.
201614.
Anderson, P. K., et al. 2004. “Emerging Infectious Diseases of Plants: Pathogen Pollution, Climate
Change, and Agrotechnology Drivers.” Trends in Ecology and Evolution 19 (10): 535–44.
Approval of the program for development of agriculture in the Republic of Kazakhstan for 2013-2020
years “Agribusiness 2020”
Badgery, W., and Millar, G. (2009). Pasture Cropping. Retrieved from NSW Department of Primary
Industries website: http://www.dpi.nsw.gov.au/__data/assets/pdf_file/0003/276807/Pasture-
cropping.pdf.
Carrying Capacity of Pasture and Fodder Resources in the Tajik Pamirs
https://cashmereforum.files.wordpress.com/2010/06/carrying-capacity-of-pasture-and-fodder-
resources-in-the-tajik-pamirs.pdf
CIMMYT (International Maize and Wheat Improvement Center). 2008. “Demonstration of Different
Methods of Sowing and Cultivation of Perennial and Annual Crops in Kazakhstan.” Part of World
Bank–GEF supported Drylands Management Project.
Controlled Grazing in the Management of an Apple Orchard. 1994. Ecological Farmers Association
of Ontario. http://eap.mcgill.ca/MagRack/EFA/EF_94_A_01.htm
Diagram specialization regions of Kazakhstan on the optimal use of agricultural land for the
production of specific types of agricultural products.
Cretaux, J. F., R. Letolle, and M. Bergé-Nguyen. 2013. “History of Aral Sea Level Variability and
Current Scientific Debates.” Global and Planetary Change 110 (A): 99–113.
FAO (Food and Agriculture Organization). 2000. “The Global Agro-Ecological Zones Study.” FAO,
Land and Water Development Division (AGL), with the collaboration of the International Institute
for Applied Systems Analysis (IIASA), Rome.
———. 2008. “A Review of Drought Occurrence and Monitoring and Planning Activities in the Near
East Region.” FAO, Rome.
———. 2009. “Grain Markets in Kazakhstan, the Russian Federation, and Ukraine.” FAO, Rome.
———. 2010. “Highlights on Four Livestock Sub-Sectors in Kazakhstan.” FAO, Rome.
———. 2012. “Advancement and Impact of Conservation Agriculture/No-Till Technology Adoption in Kazakhstan.” FAO, Rome.
———. 2014. “Food Losses and Waste in Kazakhstan.” FAO, Rome.
183
FAO Aquastat. 2012. http://www.fao.org/nr/water/aquastat/quickWMS/irrimap.htm.
FAO Investment Center. 2012. “Advancement and Impact of Conservation Agriculture/No-Till
Technology Adoption in Kazakhstan.” Information note, FAO, Rome, December 6.
FAO NEWS. 1999. “Locust alert in Kazakhstan and the Russian Federation”
http://www.fao.org/english/newsroom/highlights/1999/990801-e.htm.
GIZ, Flermoneca, European Union “Proceedings Summary - First Practitioners’ Conference on
Advancement of Sustainable Pasture Management in Central Asia”, Bishkek, 17-19 November 2014.
«Государственная комиссия по сортоиспытанию сельскохозяйственных культур» министерства
сельского хозяйства республики казахстан официальный бюллетень - ресми бюллетень.
Астана – 2012.
Government of Kazakhstan. 2000. “Kazakhstan Natural Disaster Preparedness Plan (Project of the
Government of the Republic of Kazakhstan.” KAZ/98/003/B/07/99, Almaty.
Grazing Livestock Under Orchards. Glen K. Fukumoto, County Extension Agent, Cooperative
Extension Service, College of Tropical Agriculture and Human Resources, University of Hawaii at
Manoa.
Grazing with livestock, Worcestershire Orchards. http://www.worcestershireorchards.co.uk/17.html
Harris, Peter S “Review of Grassland and Pasture Production – Working Paper ” World Bank Joint
Economic Research Programme, World Bank Astana, Kazakhstan, April 2014
Hertel, Heino; Yermolyomok, Dana “Forest and Biodiversity Governance including Environmental
Monitoring (FLERMONECA)”, Mission Report Kazakhstan Component ERCA, GIZ Regional
Program for Sustainable Use of Natural resources in Central Asia, June 2013
Immerzeel, W. W., and Bierkens, M. F. P. 2012. “Asia’s Water Balance.” Nature Geoscience 5.
Implementation Completion and Results Report (IBRD-47740) on a Loan in the Amount of US$24.0
Million to the Republic of Kazakhstan for an Agricultural Competitiveness Project, January 24, 2013
Implementation Completion and Results Report (TF-52161) on a Global Environment Facility Grant
in the Amount of US$ 5.27 Million to the Republic of Kazakhstan for a Drylands Management Project,
November 2010
IPCC (Intergovernmental Panel on Climate Change) Working Group. 2013. “Annex I: Atlas of Global
and Regional Climate Projections.” In Climate Change 2013: The Physical Science Basis, edited by G. J. Van
Oldenborgh et al. Contribution to the Fifth Assessment Report of the Intergovernmental Panel on
Climate Change.
ICARDA (International Center for Agricultural Research in the Dry Areas). 2009. “Food Security and
Climate Change in Central Asia and the Caucasus.” Tbilisi, Georgia, September.
IMF (International Monetary Fund). 2011. “Republic of Kazakhstan: Selected Issues.” Country
Report 11/151, IMF, Washington, DC, June.
184
KazAgro. 2014. “Mid-Level Assessment: Climate Forecasting in Kazakhstan.” Analytical Review of Grain
Market (October).
Lebed, Lyubov; Cherednichenko, Alexander; Bazarbayev, Alma; Qi, Ja.; Heilman, Ph. “Using MODIS
– Landsat information in ecological assessment of pasturelands in Kazakhstan”, Tashkent, 2013
Livestock Sector Review Base for Concept Note Regional Food Safety and Livestock Support Services
Project – Kazakhstan
Lioubimsteva, E., and G. M. Henebry. 2009. “Climate and Environmental Change in Arid Central
Asia: Impacts, Vulnerability, and Adaptations.” Journal of Arid Environments 73: 963–97.
Mansour, Lamia “Kazakhstan Final Evaluation Sustainable Rangeland Management for Rural
Livelihood and Environmental Integrity Project - Final Evaluation Report” June 3, 2012
Ministry of Environment and Water Protection. 2009. “Second National Communication of the
Republic of Kazakhstan to the UNFCCC.” Astana.
———. 2013. “The III–VI National Communication of the Republic of Kazakhstan to the UN
Framework Convention on Climate Change (UNFCCC).” Astana.
Mizina, et al. 1998. “An Evaluation of Adaptation Options for Climate Change Impacts on Agriculture
in Kazakhstan.” Mitigation and Adaptation Strategies for Global Change 4: 25–41.
MOA (Ministry of Agriculture). 2009. “Master Plan on Oilseeds.”
———. 2012a. “Master Plan for Forage Production Development.”
———. 2012b. “Master Plan on Land Use Management.”
———. 2012c. “Master Plan on Stabilization of Grain Market.”
———. 2013. “Agribusiness-2020.”
———. 2014. “Specialization Scheme.”
Мсх: программа по развитию агропромышленного комплекса в Pеспублике Kазахстан на 2013–
2020 годы «агробизнес - 2020».
Мсх: мастер-план «стабилизация зернового рынка». 2013.
OECD (Organisation for Economic Co-Operation and Development). 2013. OECD Review of
Agricultural Policies: Kazakhstan 2013. Paris: OECD Publishing.
http://dx.doi.org/10.1787/9789264191761-en.
Pappas, G., et al. 2006. “The New Global Map of Human Brucellosis.” Lancet Infectious Diseases 6 (2):
91–99.
Permaculture Research Institute. 2012. “Pasture Cropping: An Integrated Approach to Grain and
Pasture Production.”
Petrick, Martin, Dauren Oshakbaev, and Jürgen Wandel. 2014. “Kazakhstan’s Wheat, Beef, and Dairy
Sectors: An Assessment of Their Development Constraints and Recent Policy Responses.”
185
Points statements by the Minister of Agriculture or the panel session on the theme “The solution to
the problems in adapting agriculture to the changing climate” – Recommendations – May 22, 2014
Приказ министерства сельского хозяйства рк от 23.05.2014 г.за № 1-1/277 .об утверждении
«рекомендуемой схемы специализации регионов по оптимальному использованию
сельскохозяйственных угодий для производства конкретных видов сельскохозяйственной
продукции»
Productivity Committee. 2013. “Barriers to Effective Climate Change Adaptation.” Melbourne,
March.
Qu, Jiaguo, and Kyle Evered. 2008. Environmental Problems of Central Asia and Their Economic,
Social and Security Impacts. Springer Science and Business Media, January.
Ramazanova, Raushan. 2012. “Commercialization of Innovative Technologies in Agro-Ecology:
Problems and Solutions.” Paper for the Technology Transfer and Innovation International
Conference, November.
Research and Markets. 2014. “The Insurance Industry in Kazakhstan: Key Trends and Opportunities
to 2016.” Research and Markets, Dublin, November.
Robinson, Sarah. 2000. “Pastoralism and Land Degradation in Kazakhstan.” PhD thesis, University
of Warwick.
Scoping of a pasture and livestock sector National Appropriate Mitigation Action (NAMA) in the
Kyrgyz Republic, Aug 2014
Shortan, S., M. Suleimenov, and J. Kaskarbayev. 2009. “The Economic Potential for Crop
Diversification in Central Asia: The Case of Northern Kazakhstan.”
Support the Development of a Livestock Early Warning System (Mongolia LEWS project) (Annual
Report - 2010) Mercy Corps, Mongolia; December 10, 2010
Timetrics. 2014. “The Insurance Industry in Kyrgyzstan: Key Trends and Opportunities to 2017.” Timetrics, January.
U.K. AgroConsult. 2014. “Grain Harvest 2014 in Kazakhstan: Crop Growers Incurring Losses.”
October. http://www.blackseagrain.net/novosti/grain-harvest-2014-in-kazakhstan-crop-growers-
incurring-losses.
UN (United Nations). 1999. “Locust Infestation Threatens Crops in Parts of Commonwealth of
Independent States.” Press Release SAG 49.
http://www.un.org/press/en/1999/19990729.SAG49.html.
UNDP (United Nations Development Program). 2004. “Water Resources of Kazakhstan in the New
Millennium.” Almaty.
———. 2013. “Water Resources of Kazakhstan in the New Millennium.” New York.
186
UNEP and GRID-Arendal. n.d. “Central and Eastern Europe, Caucasus, and Central Asia.”
http://enrin.grida.no/htmls/kazahst/soe2/soee/nav/biodiv/ecosys.htm.
USAID (U.S. Agency for International Development). 2011. “Regional View of Wheat Markets and Food Security in Central Asia.” USAID, Washington, DC.
Van Veen et al. 2005. Kazakhstan’s Livestock Sector – Supporting Its Revival. Joint Economic
Research Program of the World Bank and the Government of Kazakhstan.
Wall, E., B. Smit, and J. Wandel, eds. 2007. Farming in a Changing Climate: Agricultural Adaptation
in Canada. UBS Press.
World Bank. 2006. “Drought Management and Mitigation Assessment for Central Asia and the
Caucasus: Regional and Country Profiles and Strategies.” World Bank, Washington, DC.
———. 2009. “Adapting to Climate Change in Europe and Central Asia.” World Bank, Washington,
DC.
———. 2011a. “Kazakhstan Agricultural Insurance Feasibility Study.” World Bank, Washington, DC.
———. 2011b. “Mongolia - Improving Feed and Fodder Supply for Dzud Management, Final
Report,” Agriteam Canada, Ulaanbaatar, Mongolia, June 2011.
———. 2012. “Agricultural Insurance Feasibility Study.” World Bank, Washington, DC, June.
———. 2013a. “Implementation Completion and Results Report (Ibrd-47740) on a Loan in the
Amount of US$24.0 Million to the Republic of Kazakhstan for an Agricultural Competitiveness
Project, January 24, 2013.” Report ICR 2395. World Bank, Washington, DC.
———. 2013b. “Overview of Climate Change Activities in Kazakhstan.” World Bank, Washington
DC.
———. 2014. “Kazakhstan: Partnership Program Snapshot.” World Bank, Washington, DC,
October.
———. Various years. World Development Indicators. Washington, DC: World Bank.
World Bank PowerPoint Presentation. n.d. Impact of Farm Reorganization, Tajikistan
World Bank, Fodder Production and Animal Nutrition, Republic of Kazakhstan Joint Economic
Research Program Report No: ACS10107, GFADR Europe and Central Asia, July 2014
World Bank and FAO. 2014. “MOA-WB Joint Economic Research Program: Fodder Production and
Animal Nutrition.” World Bank, Washington, DC.
WFP (World Food Programme). 2011. “Regional View of Wheat Markets and Food Security in
Central Asia with a Focus on Afghanistan and Tadjikistan.” WFP, Rome, July.
Yesserkepova, I. n.d. “Concise Report and Summary of National Publications on Climate Change
Dimensions and Impacts.” FAO, Rome. http://www.fao.org/docrep/014/k9589e/k9589e08.pdf.
W o r l d B a n K G r o U P r e P o r t n U m B e r 103076-KZ
1818 H Street, NWWashington, D.C. 20433 USATelephone: 202-473-1000Internet: www.worldbank.org/agricultureTwitter: @wb_agriculture
a G r i c U l t U r e G l o B a l P r a c t i c e t e c h n i c a l a s s i s t a n c e P a P e r
Related Documents