Page 1 of 21 Kaset Thai International Sugar Corporation PCL 29 November 2016

Welcome message from author
This document is posted to help you gain knowledge. Please leave a comment to let me know what you think about it! Share it to your friends and learn new things together.
Transcript
Page 1 of 21
Kaset Thai International Sugar Corporation PCL
29 November 2016
Page 2 of 21
Agenda
9M-2016 Operating Results
Projects in Progress
Sugar & Bio Industrial Trends
Page 3 of 21
9M-2016 Operating Results
Page 4 of 21
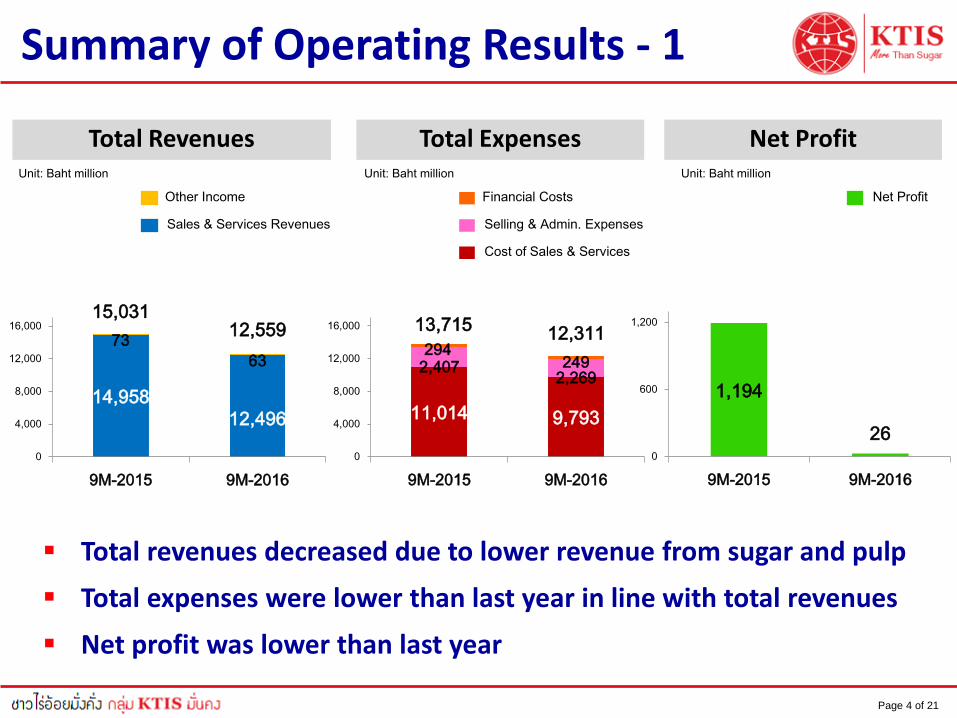
Summary of Operating Results - 1
Financial Costs
Total Revenues Total Expenses Net Profit
Total revenues decreased due to lower revenue from sugar and pulp
Total expenses were lower than last year in line with total revenues
Net profit was lower than last year
Unit: Baht million Unit: Baht million Unit: Baht million
14,958
12,496
73
63
15,03112,559
0
4,000
8,000
12,000
16,000
9M-2015 9M-2016
Other Income
Sales & Services Revenues
Net Profit
11,014 9,793
2,4072,269
294249
13,71512,311
0
4,000
8,000
12,000
16,000
9M-2015 9M-2016
Selling & Admin. Expenses
Cost of Sales & Services
1,194
260
600
1,200
9M-2015 9M-2016
Page 5 of 21
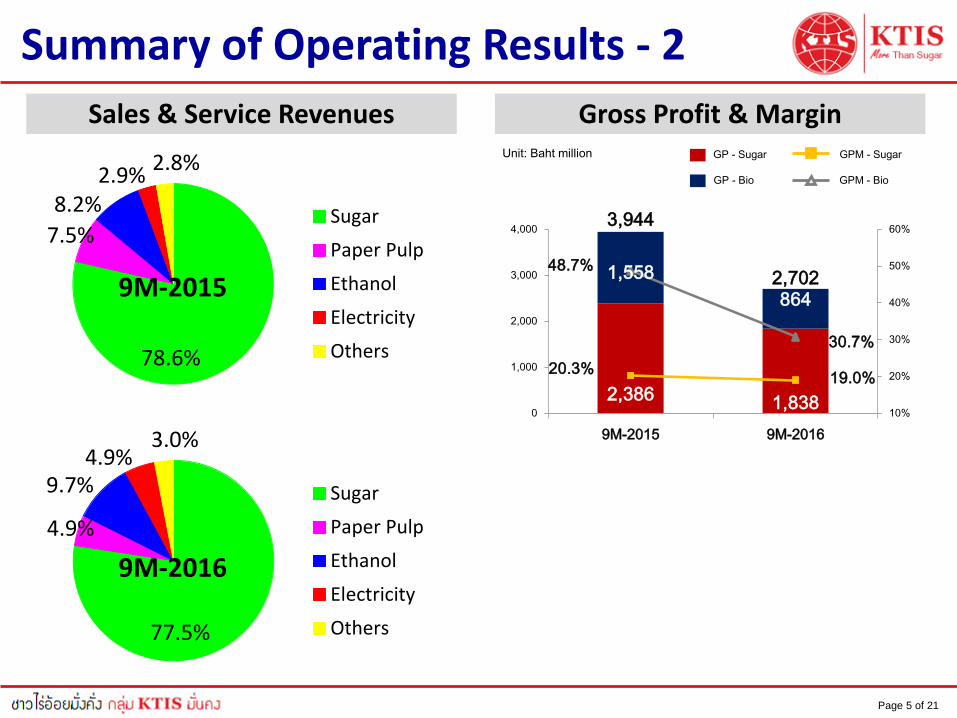
77.5%
4.9%
9.7%4.9%
3.0%
Sugar
Paper Pulp
Ethanol
Electricity
Others
Sales & Service Revenues Gross Profit & Margin
Summary of Operating Results - 2
Unit: Baht million GP - Sugar
GP - Bio
GPM - Sugar
GPM - Bio
2,386 1,838
1,558
864
3,944
2,702
20.3%19.0%
48.7%
30.7%
10%
20%
30%
40%
50%
60%
0
1,000
2,000
3,000
4,000
9M-2015 9M-2016
78.6%
7.5%
8.2%2.9%
2.8%
Sugar
Paper Pulp
Ethanol
Electricity
Others
9M-2015
9M-2016
Page 6 of 21
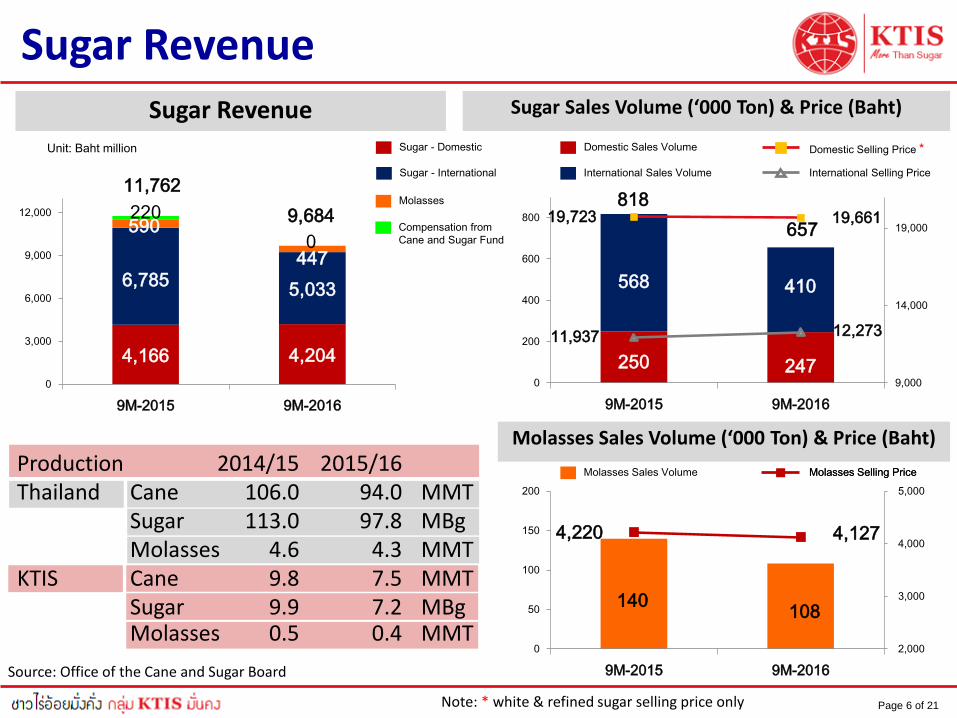
Sugar RevenueSugar Revenue Sugar Sales Volume (‘000 Ton) & Price (Baht)
250 247
568 410
818
65719,723 19,661
11,937 12,273
9,000
14,000
19,000
0
200
400
600
800
9M-2015 9M-2016
Sugar - Domestic
Sugar - International
Domestic Sales Volume
International Sales Volume
Domestic Selling Price *
International Selling Price
Molasses
140108
4,220 4,127
2,000
3,000
4,000
5,000
0
50
100
150
200
9M-2015 9M-2016
Molasses Sales Volume (‘000 Ton) & Price (Baht)
Molasses Sales Volume Molasses Selling Price
Note: * white & refined sugar selling price only
Source: Office of the Cane and Sugar Board
Production 2014/15 2015/16Thailand Cane 106.0 94.0 MMT
Sugar 113.0 97.8 MBgMolasses 4.6 4.3 MMT
KTIS Cane 9.8 7.5 MMTSugar 9.9 7.2 MBgMolasses 0.5 0.4 MMT
4,166 4,204
6,7855,033
590
447
220
0
11,762
9,684
0
3,000
6,000
9,000
12,000
9M-2015 9M-2016
Unit: Baht million
Compensation from
Cane and Sugar Fund
Molasses Selling Price
Page 7 of 21
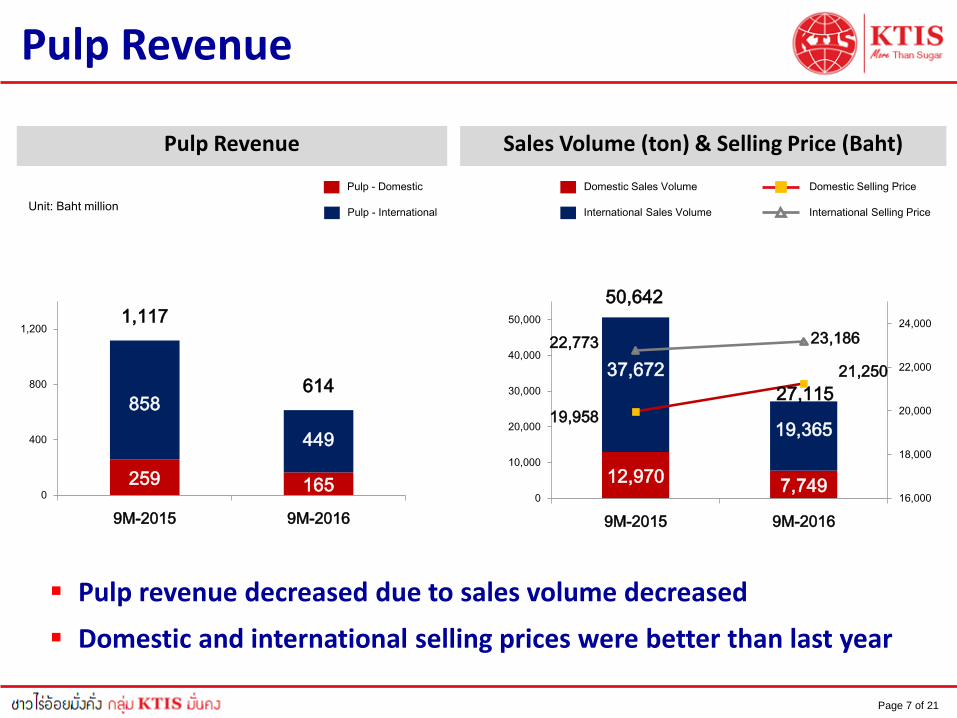
Pulp Revenue
259 165
858
449
1,117
614
0
400
800
1,200
9M-2015 9M-2016
Unit: Baht million
Pulp Revenue
12,9707,749
37,672
19,365
50,642
27,115
19,958
21,250
22,773 23,186
16,000
18,000
20,000
22,000
24,000
0
10,000
20,000
30,000
40,000
50,000
9M-2015 9M-2016
Sales Volume (ton) & Selling Price (Baht)
Pulp revenue decreased due to sales volume decreased
Domestic and international selling prices were better than last year
Pulp - Domestic
Pulp - International
Domestic Sales Volume Domestic Selling Price
International Sales Volume International Selling Price
Page 8 of 21
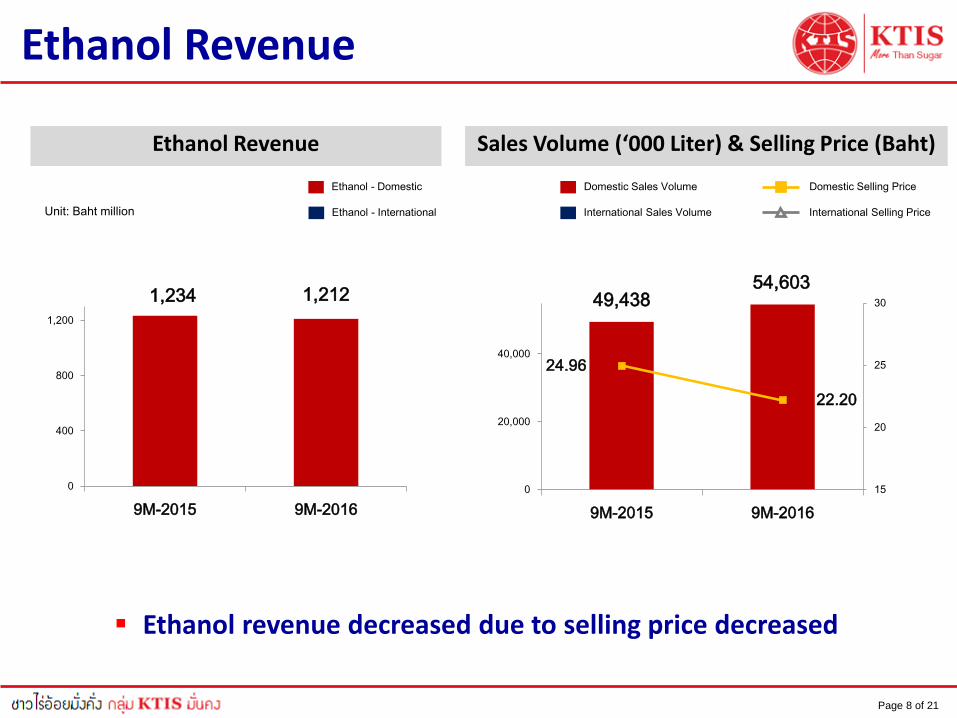
Ethanol Revenue
1,234 1,212
0
400
800
1,200
9M-2015 9M-2016
49,43854,603
24.96
22.20
15
20
25
30
0
20,000
40,000
9M-2015 9M-2016
Unit: Baht million
Ethanol Revenue Sales Volume (‘000 Liter) & Selling Price (Baht)
Ethanol revenue decreased due to selling price decreased
Ethanol - Domestic
Ethanol - International
Domestic Sales Volume Domestic Selling Price
International Sales Volume International Selling Price
Page 9 of 21
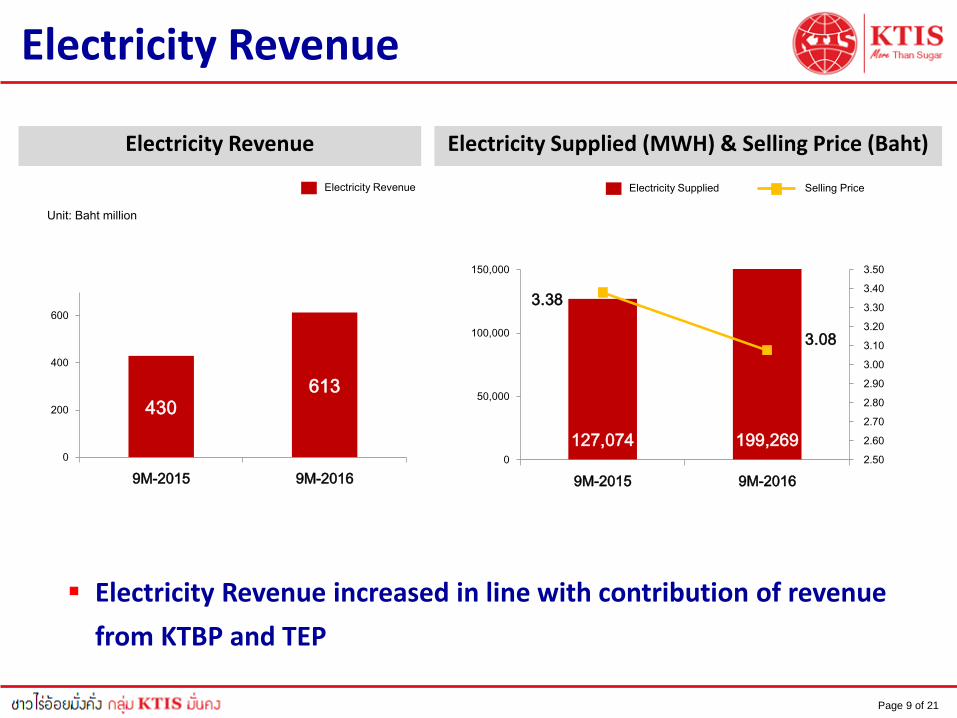
Electricity Revenue
430613
0
200
400
600
9M-2015 9M-2016
Unit: Baht million
Electricity Revenue
127,074 199,269
3.38
3.08
2.50
2.60
2.70
2.80
2.90
3.00
3.10
3.20
3.30
3.40
3.50
0
50,000
100,000
150,000
9M-2015 9M-2016
Electricity Supplied (MWH) & Selling Price (Baht)
Electricity Supplied Selling Price
Electricity Revenue increased in line with contribution of revenue
from KTBP and TEP
Electricity Revenue
Page 10 of 21
Projects in Progress
Page 11 of 21
Projects in Progress
Biomass power plants (RPBP 50MW)
Page 12 of 21
Sugar & Bio Industry Trends
Page 13 of 21
Positive Factors for Sugar
World Supply / Demand for 2016/17 are expected to be deficit
around 4 million tons.
With steady consumption growth, China, India and ASEAN region
continue to be in deficit, which leads to competitive advantages
of Thai sugar.
Although market consensus for Brazilian crop is still for 35 million
tons, mills are closing early. If production falls below this level,
trade balance deficits become bigger.
Thai regulation of the profit sharing system allows the
sustainable earning for both farmers and millers.
AFTA give better access and competitiveness to ASEAN countries.
Page 14 of 21
Negative Factors for Sugar
Global deficit forecast has been revised downwards due to
improved production prospects for EU, Mexico, and US, however
still deficit.
The fund position looks vulnerable. Later Oct saw the funds
reduce their net long position. A large scale sell-off remains a
threat to future market.
Chinese government has announced that it will release the
350,000 tons of stock. And market expects that the releasing
amount might be bigger, leading to less import demand.
Deregulation in EU sugar industry will encourage refined sugar
exports from late 2017.
Strong US dollar from US policy.
Page 15 of 21
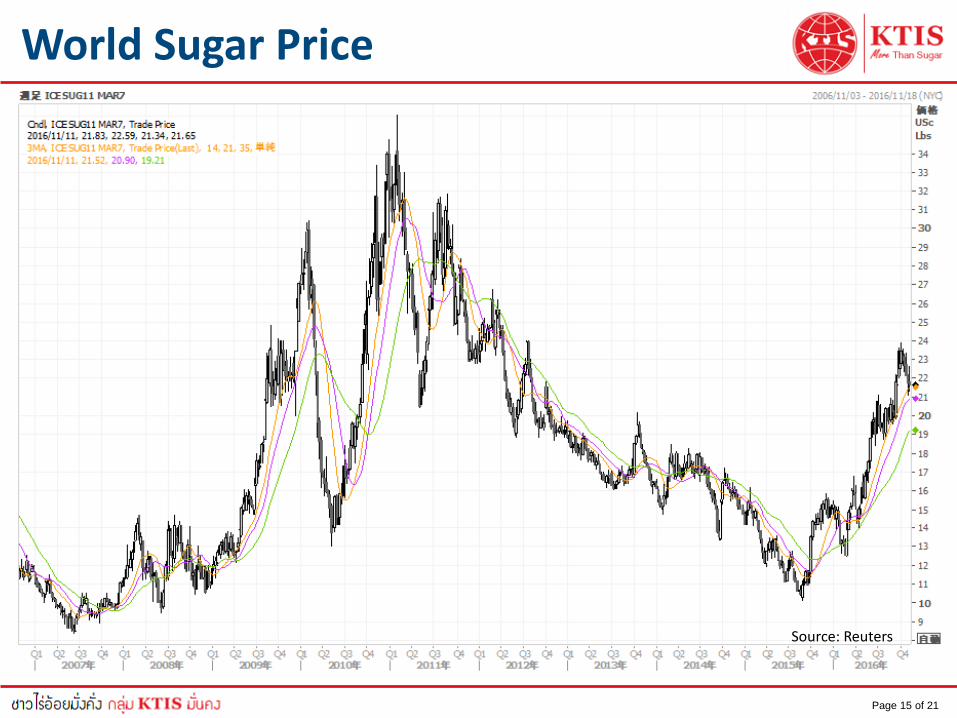
World Sugar Price
Source: Reuters
Page 16 of 21
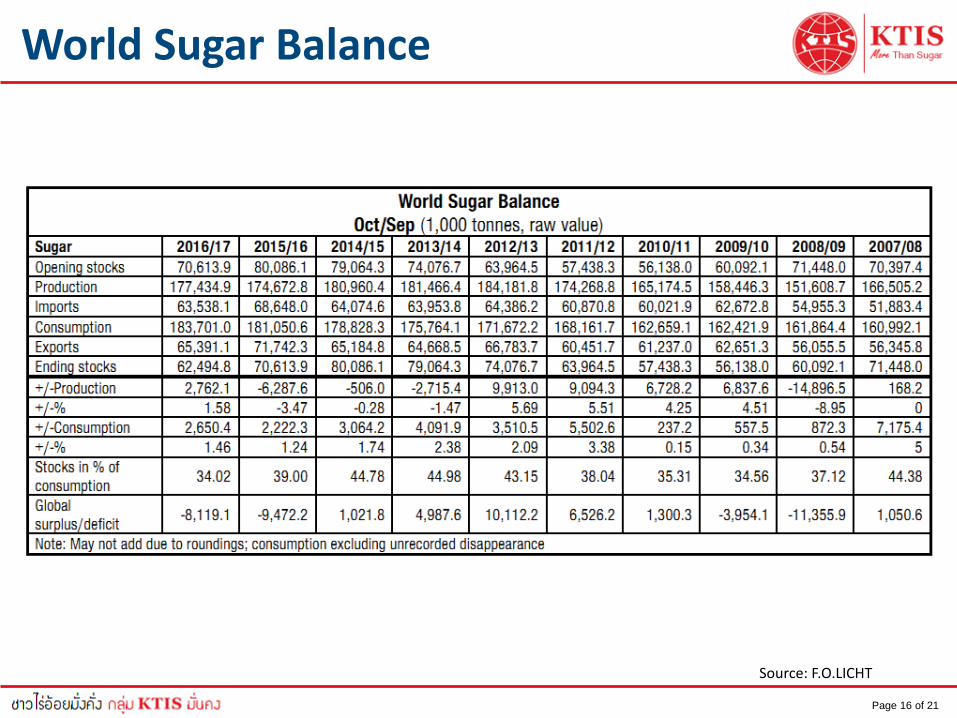
Source: F.O.LICHT
World Sugar Balance
Page 17 of 21
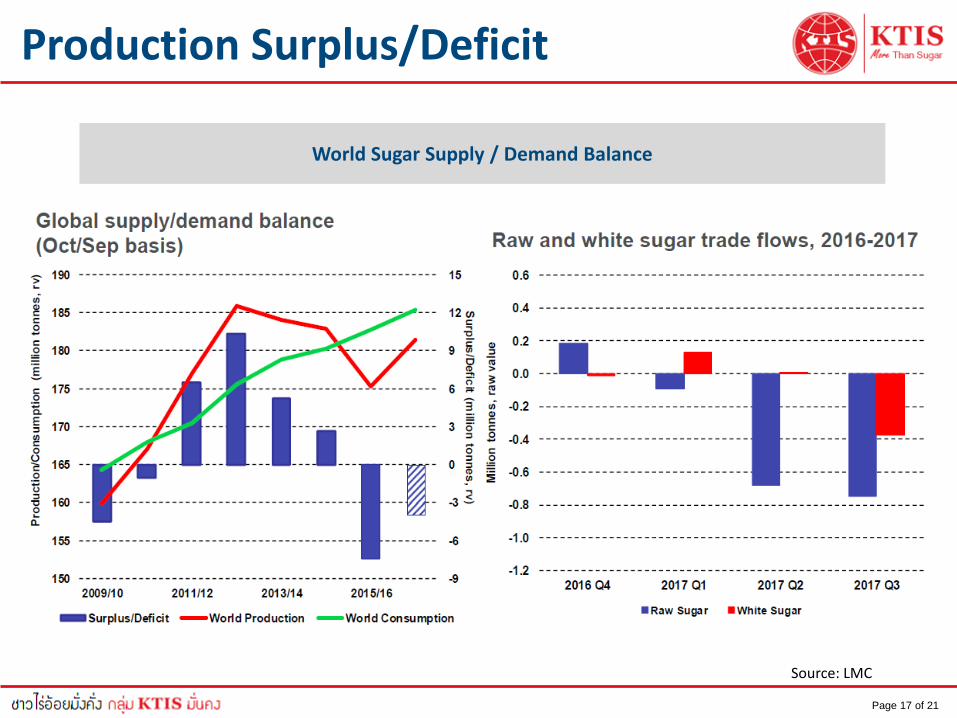
Source: LMC
Production Surplus/Deficit
World Sugar Supply / Demand Balance
Page 18 of 21
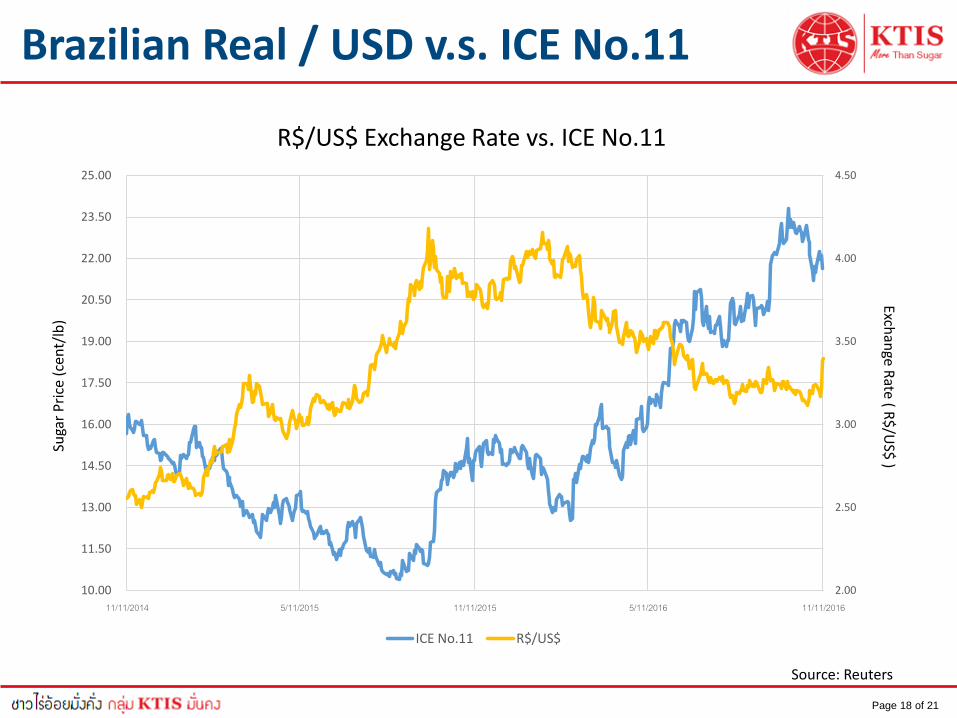
Brazilian Real / USD v.s. ICE No.11
Source: Reuters
2.00
2.50
3.00
3.50
4.00
4.50
10.00
11.50
13.00
14.50
16.00
17.50
19.00
20.50
22.00
23.50
25.00
11/11/2014 5/11/2015 11/11/2015 5/11/2016 11/11/2016
Exchan
ge Rate ( R
$/U
S$ )
Suga
r P
rice
(ce
nt/
lb)
R$/US$ Exchange Rate vs. ICE No.11
ICE No.11 R$/US$
Page 19 of 21
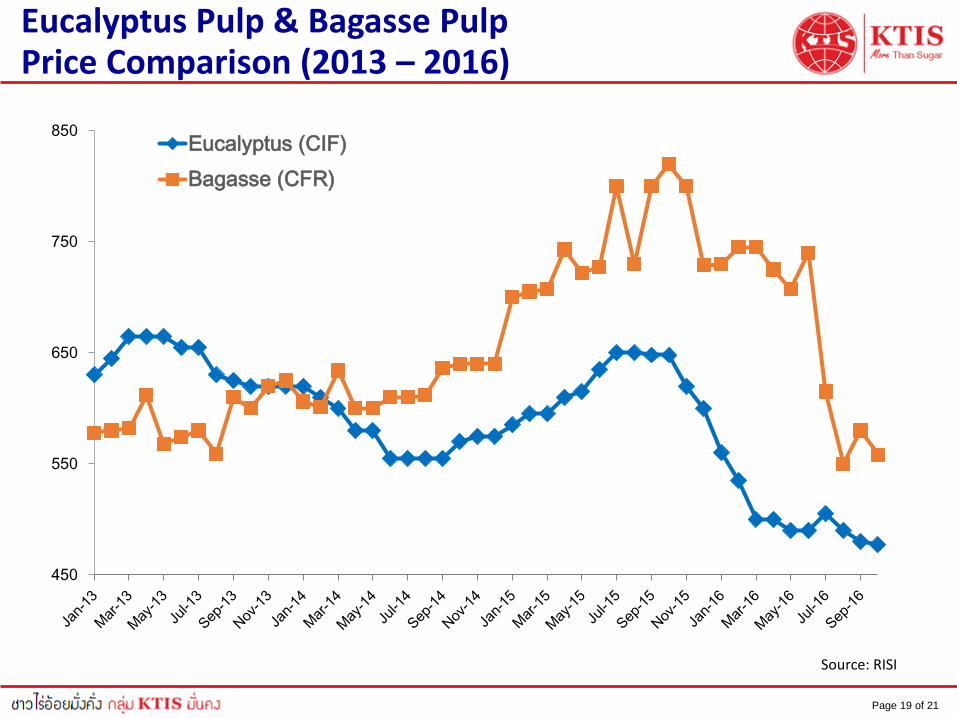
Eucalyptus Pulp & Bagasse PulpPrice Comparison (2013 – 2016)
450
550
650
750
850Eucalyptus (CIF)
Bagasse (CFR)
Source: RISI
Page 20 of 21
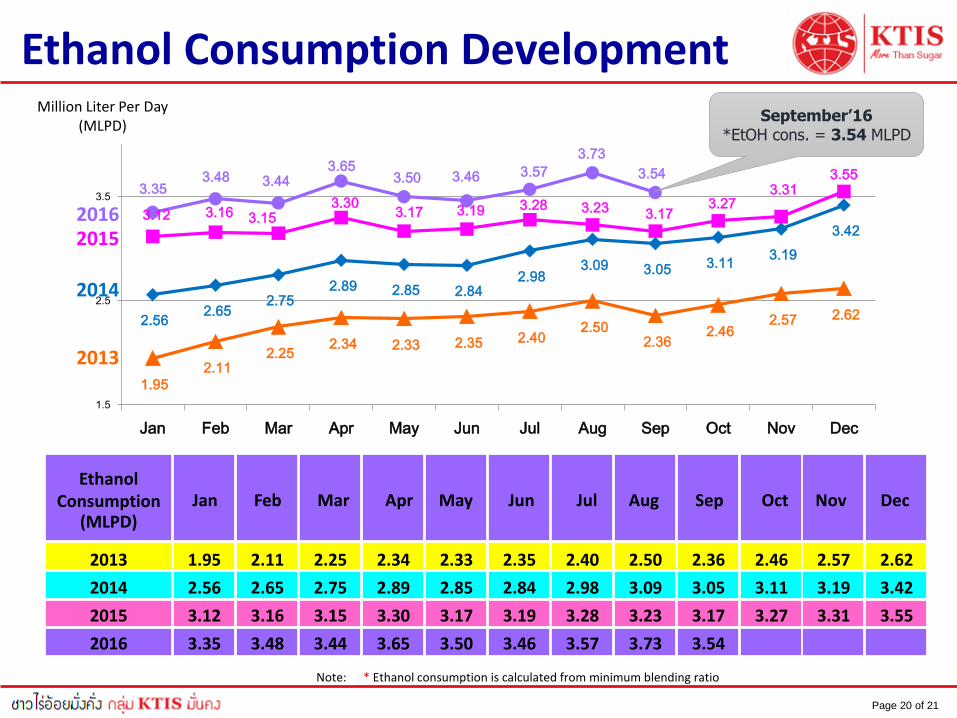
EthanolConsumption
(MLPD)Jan Feb Mar Apr May Jun Jul Aug Sep Oct Nov Dec
3.353.48 3.44
3.653.50 3.46 3.57
3.73
3.54
3.12 3.16 3.15 3.30
3.17 3.19 3.28 3.23 3.17 3.27
3.31 3.55
2.56 2.65
2.75 2.89 2.85 2.84
2.98 3.09 3.05 3.11
3.19
3.42
1.95
2.11 2.25
2.34 2.33 2.35 2.40 2.50
2.36 2.46
2.57 2.62
1.5
2.5
3.5
Jan Feb Mar Apr May Jun Jul Aug Sep Oct Nov Dec
Million Liter Per Day(MLPD)
2013
2014
2015
Ethanol Consumption Development
2013
2014
2015
2016
1.95
2.56
3.12
3.35
2.11
2.65
3.16
3.48
2.25
2.75
3.15
3.44
2.34
2.89
3.30
3.65
2.33
2.85
3.17
3.50
2.40
2.98
3.28
3.57
2.50
3.09
3.23
3.73
2.36
3.05
3.17
3.54
2.46
3.11
3.27
2.57
3.19
3.31
2.62
3.42
3.55
2.35
2.84
3.19
3.46
2016
Note: * Ethanol consumption is calculated from minimum blending ratio
September’16*EtOH cons. = 3.54 MLPD
Page 21 of 21
Important Notice
This presentation is confidential. This presentation is not a prospectus. This presentation does not constitute or form part of any offer
for sales or solicitation of any offer to buy any securities nor shall it or any part of it form the basis of or be relied on in connection
with any contract or commitment whatsoever.
This presentation has been prepared for the purpose of providing certain individuals with business, financial and other information
concerning Kaset Thai International Sugar Corporation Company Limited (“KTIS”)
The information contained in this presentation is intended solely for your personal reference only. If you are not an intended
recipient, you must not read, disclose, copy, circulate, retain, distribute or take any action in reliance upon this material. This
presentation is not intended to substitute your own analysis and investigation, and should not be considered a recommendation to
any recipient of this presentation. Some statements contained herein are forward-looking statements identified by the use of
forward- looking terminology such as “may” , “will” , “expect” , “anticipate”, “intend” , “estimate” , “continue”, “plan” or other similar
words, which are subject to various risks and uncertainties. These statements include statements with respect to KTIS’s corporate
plans, strategies and beliefs and other statements that are not historical facts. This presentation is prepared based on the
assumptions and beliefs of KTIS’s management in light of the information currently available to KTIS involving risks and uncertainties
which may cause the actual results, performance or achievements to be materially different from any future results, performance or
achievements expressed or implied by such forward-looking statements. Nothing in this presentation is, or shall be relied on as
promise or representation of KTIS as to the future.
For more information, contact : [email protected]
Related Documents