JUST THE FACTS 2018-2019

Welcome message from author
This document is posted to help you gain knowledge. Please leave a comment to let me know what you think about it! Share it to your friends and learn new things together.
Transcript
J U S TT H E
F A C T S
20 18-20 19
3
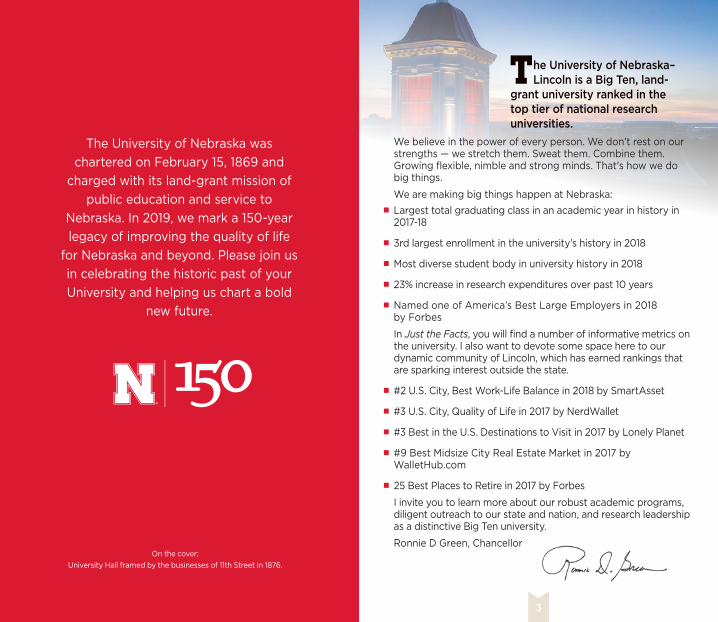
The University of Nebraska–Lincoln is a Big Ten, land-
grant university ranked in the top tier of national research universities.
We believe in the power of every person. We don’t rest on our strengths — we stretch them. Sweat them. Combine them. Growing flexible, nimble and strong minds. That's how we do big things.
We are making big things happen at Nebraska:
• Largest total graduating class in an academic year in history in 2017-18
• 3rd largest enrollment in the university’s history in 2018
• Most diverse student body in university history in 2018
• 23% increase in research expenditures over past 10 years
• Named one of America’s Best Large Employers in 2018 by Forbes
In Just the Facts, you will find a number of informative metrics on the university. I also want to devote some space here to our dynamic community of Lincoln, which has earned rankings that are sparking interest outside the state.
• #2 U.S. City, Best Work-Life Balance in 2018 by SmartAsset
• #3 U.S. City, Quality of Life in 2017 by NerdWallet
• #3 Best in the U.S. Destinations to Visit in 2017 by Lonely Planet
• #9 Best Midsize City Real Estate Market in 2017 by WalletHub.com
• 25 Best Places to Retire in 2017 by Forbes
I invite you to learn more about our robust academic programs, diligent outreach to our state and nation, and research leadership as a distinctive Big Ten university.
Ronnie D Green, ChancellorOn the cover:
University Hall framed by the businesses of 11th Street in 1876.
The University of Nebraska was chartered on February 15, 1869 and
charged with its land-grant mission of public education and service to
Nebraska. In 2019, we mark a 150-year legacy of improving the quality of life
for Nebraska and beyond. Please join us in celebrating the historic past of your University and helping us chart a bold
new future.
4 5
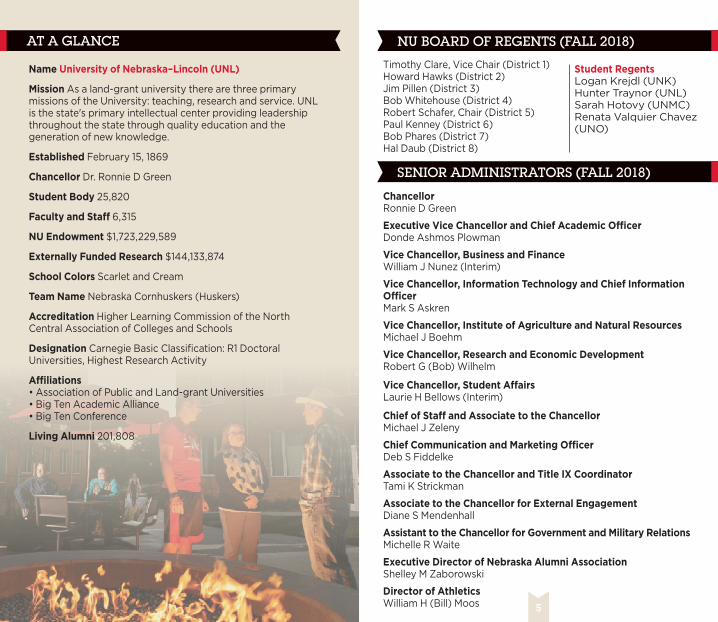
NU BOARD OF REGENTS (FALL 2015) Timothy Clare, Vice Chair (District 1) Howard Hawks (District 2)Jim Pillen (District 3)Bob Whitehouse (District 4)Robert Schafer, Chair (District 5)Paul Kenney (District 6)Bob Phares (District 7)Hal Daub (District 8) SENIOR ADMINISTRATORS (FALL 2015) Chancellor Ronnie D Green
Executive Vice Chancellor and Chief Academic Officer Donde Ashmos Plowman
Vice Chancellor, Business and Finance William J Nunez (Interim)
Vice Chancellor, Information Technology and Chief Information Officer Mark S Askren
Vice Chancellor, Institute of Agriculture and Natural Resources Michael J Boehm
Vice Chancellor, Research and Economic Development Robert G (Bob) Wilhelm Vice Chancellor, Student Affairs Laurie H Bellows (Interim) Chief of Staff and Associate to the Chancellor Michael J Zeleny
Chief Communication and Marketing Officer Deb S Fiddelke
Associate to the Chancellor and Title IX Coordinator Tami K Strickman
Associate to the Chancellor for External Engagement Diane S Mendenhall
Assistant to the Chancellor for Government and Military Relations Michelle R Waite
Executive Director of Nebraska Alumni Association Shelley M Zaborowski
Director of Athletics William H (Bill) Moos
Student Regents Logan Krejdl (UNK)Hunter Traynor (UNL)Sarah Hotovy (UNMC)Renata Valquier Chavez (UNO)
AT A GLANCE NU BOARD OF REGENTS (FALL 2018)
SENIOR ADMINISTRATORS (FALL 2018)
Name University of Nebraska–Lincoln (UNL) Mission As a land-grant university there are three primary missions of the University: teaching, research and service. UNL is the state's primary intellectual center providing leadership throughout the state through quality education and the generation of new knowledge. Established February 15, 1869 Chancellor Dr. Ronnie D Green
Student Body 25,820 Faculty and Staff 6,315 NU Endowment $1,723,229,589 Externally Funded Research $144,133,874 School Colors Scarlet and Cream Team Name Nebraska Cornhuskers (Huskers) Accreditation Higher Learning Commission of the North Central Association of Colleges and Schools Designation Carnegie Basic Classification: R1 Doctoral Universities, Highest Research Activity Affiliations • Association of Public and Land-grant Universities • Big Ten Academic Alliance • Big Ten Conference
Living Alumni 201,808
6 7
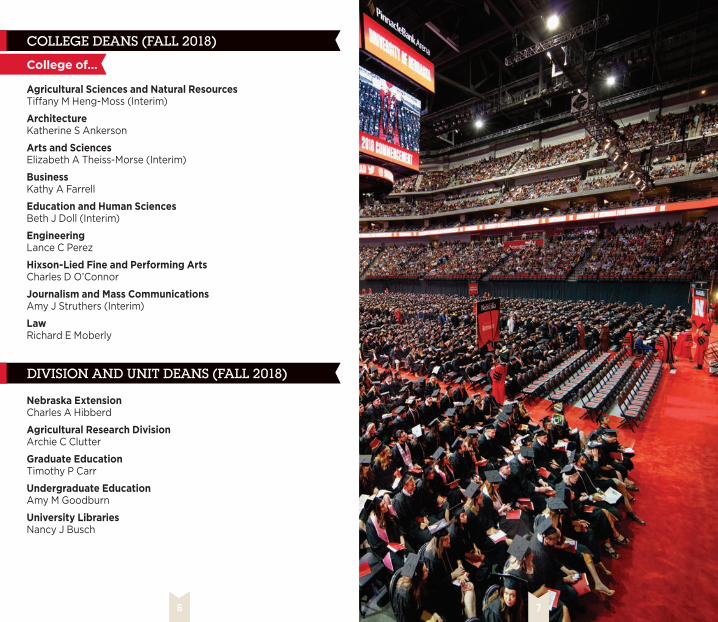
College of… Agricultural Sciences and Natural Resources Tiffany M Heng-Moss (Interim) Architecture Katherine S Ankerson Arts and Sciences Elizabeth A Theiss-Morse (Interim) Business Kathy A Farrell Education and Human Sciences Beth J Doll (Interim) Engineering Lance C Perez Hixson-Lied Fine and Performing Arts Charles D O’Connor
Journalism and Mass Communications Amy J Struthers (Interim) Law Richard E Moberly
Nebraska Extension Charles A Hibberd
Agricultural Research Division Archie C Clutter
Graduate Education Timothy P Carr
Undergraduate Education Amy M Goodburn University Libraries Nancy J Busch
COLLEGE DEANS (FALL 2018)
DIVISION AND UNIT DEANS (FALL 2018)
8 9
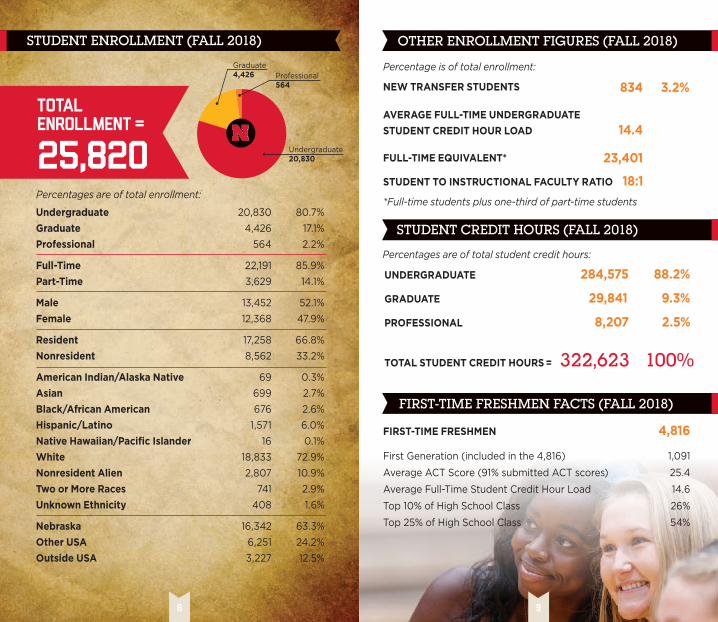
Percentages are of total enrollment:
Percentages are of total student credit hours:
Undergraduate 20,830 80.7%Graduate 4,426 17.1%Professional 564 2.2%
Full-Time 22,191 85.9%Part-Time 3,629 14.1%
Male 13,452 52.1%Female 12,368 47.9%
Resident 17,258 66.8%Nonresident 8,562 33.2%
American Indian/Alaska Native 69 0.3%Asian 699 2.7%Black/African American 676 2.6%Hispanic/Latino 1,571 6.0%Native Hawaiian/Pacific Islander 16 0.1%White 18,833 72.9%Nonresident Alien 2,807 10.9%Two or More Races 741 2.9%Unknown Ethnicity 408 1.6%
Nebraska 16,342 63.3%Other USA 6,251 24.2%Outside USA 3,227 12.5%
Percentage is of total enrollment:
STUDENT ENROLLMENT (FALL 2018) OTHER ENROLLMENT FIGURES (FALL 2018)
STUDENT CREDIT HOURS (FALL 2018)
FULL-TIME EQUIVALENT*
STUDENT TO INSTRUCTIONAL FACULTY RATIO 18:1
*Full-time students plus one-third of part-time students
UNDERGRADUATE 284,575 88.2%
GRADUATE 29,841 9.3%
PROFESSIONAL 8,207 2.5%
FIRST-TIME FRESHMEN FACTS (FALL 2018) FIRST-TIME FRESHMEN 4,816
First Generation (included in the 4,816) 1,091
Average ACT Score (91% submitted ACT scores) 25.4
Average Full-Time Student Credit Hour Load 14.6
Top 10% of High School Class 26%
Top 25% of High School Class 54%
NEW TRANSFER STUDENTS
AVERAGE FULL-TIME UNDERGRADUATE STUDENT CREDIT HOUR LOAD
834 3.2%
14.4
23,401
TOTAL STUDENT CREDIT HOURS = 322,623 100%
Undergraduate 20,830
Graduate 4,426 Professional
564
Total Enrollment = 25,820
10 11
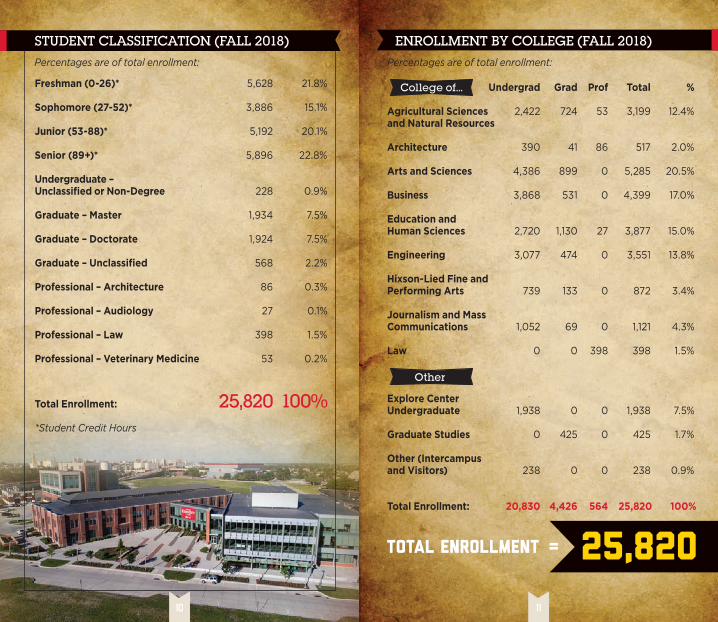
Undergrad Grad Prof Total % Agricultural Sciences 2,422 724 53 3,199 12.4% and Natural Resources
Architecture 390 41 86 517 2.0% Arts and Sciences 4,386 899 0 5,285 20.5%
Business 3,868 531 0 4,399 17.0%
Education and Human Sciences 2,720 1,130 27 3,877 15.0%
Engineering 3,077 474 0 3,551 13.8%
Hixson-Lied Fine and Performing Arts 739 133 0 872 3.4%
Journalism and Mass Communications 1,052 69 0 1,121 4.3%
Law 0 0 398 398 1.5%
Explore CenterUndergraduate 1,938 0 0 1,938 7.5% Graduate Studies 0 425 0 425 1.7%
Other (Intercampus and Visitors) 238 0 0 238 0.9%
Total Enrollment: 20,830 4,426 564 25,820 100%
College of…
Total Enrollment = 25,820
Percentages are of total enrollment:Percentages are of total enrollment:
Freshman (0-26)* 5,628 21.8% Sophomore (27-52)* 3,886 15.1% Junior (53-88)* 5,192 20.1% Senior (89+)* 5,896 22.8%
Undergraduate – Unclassified or Non-Degree 228 0.9% Graduate – Master 1,934 7.5%
Graduate – Doctorate 1,924 7.5%
Graduate – Unclassified 568 2.2% Professional – Architecture 86 0.3%
Professional – Audiology 27 0.1% Professional – Law 398 1.5% Professional – Veterinary Medicine 53 0.2%
Total Enrollment: 25,820 100% *Student Credit Hours
Other
STUDENT CLASSIFICATION (FALL 2018) ENROLLMENT BY COLLEGE (FALL 2018)
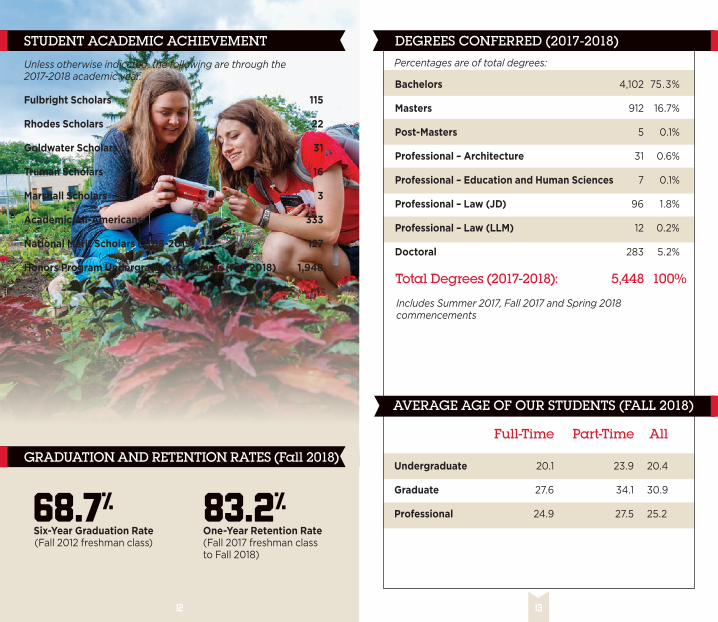
83.2%
12 13
Unless otherwise indicated, the following are through the 2017-2018 academic year.
One-Year Retention Rate (Fall 2017 freshman class to Fall 2018)
Includes Summer 2017, Fall 2017 and Spring 2018 commencements
Full-Time Part-Time All
Undergraduate 20.1 23.9 20.4
Graduate 27.6 34.1 30.9
Professional 24.9 27.5 25.2
Total Degrees (2017-2018): 5,448 100%
Fulbright Scholars 115 Rhodes Scholars 22 Goldwater Scholars 31 Truman Scholars 16 Marshall Scholars 3 Academic All-Americans 333 National Merit Scholars (2018-2019) 127 Honors Program Undergraduate Students (Fall 2018) 1,948
Bachelors 4,102 75.3%
Masters 912 16.7% Post-Masters 5 0.1% Professional – Architecture 31 0.6%
Professional – Education and Human Sciences 7 0.1%
Professional – Law (JD) 96 1.8%
Professional – Law (LLM) 12 0.2% Doctoral 283 5.2%
68.7%
Six-Year Graduation Rate (Fall 2012 freshman class)
Percentages are of total degrees:
STUDENT ACADEMIC ACHIEVEMENT
GRADUATION AND RETENTION RATES (Fall 2018)
DEGREES CONFERRED (2017-2018)
AVERAGE AGE OF OUR STUDENTS (FALL 2018)
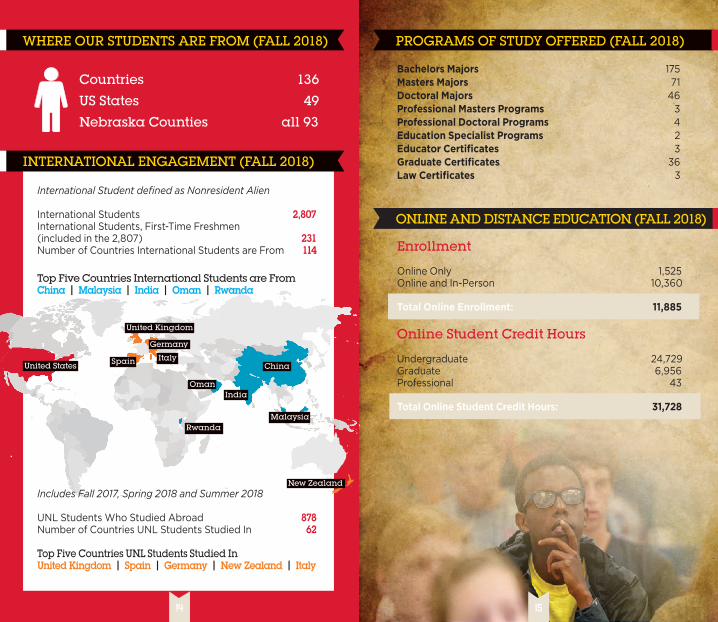
United States China
Oman
Malaysia
India
New Zealand
Italy
United Kingdom
Spain
Rwanda
Germany
WHERE OUR STUDENTS ARE FROM (FALL 2018) PROGRAMS OF STUDY OFFERED (FALL 2018)
14 15
International Student defined as Nonresident Alien International Students 2,807International Students, First-Time Freshmen (included in the 2,807) 231 Number of Countries International Students are From 114 Top Five Countries International Students are From China | Malaysia | India | Oman | Rwanda
Includes Fall 2017, Spring 2018 and Summer 2018
UNL Students Who Studied Abroad 878 Number of Countries UNL Students Studied In 62 Top Five Countries UNL Students Studied In United Kingdom | Spain | Germany | New Zealand | Italy
Countries 136
US States 49
Nebraska Counties all 93
Bachelors Majors 175Masters Majors 71Doctoral Majors 46Professional Masters Programs 3Professional Doctoral Programs 4Education Specialist Programs 2Educator Certificates 3Graduate Certificates 36 Law Certificates 3
Enrollment
Online Only 1,525 Online and In-Person 10,360 Total Online Enrollment: 11,885 Online Student Credit Hours Undergraduate 24,729 Graduate 6,956 Professional 43
Total Online Student Credit Hours: 31,728
ONLINE AND DISTANCE EDUCATION (FALL 2018)
INTERNATIONAL ENGAGEMENT (FALL 2018)
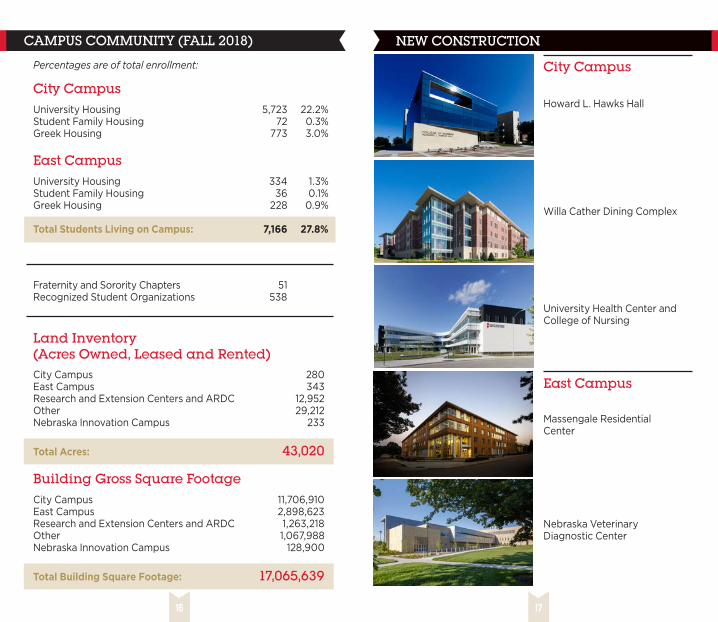
City Campus
Howard L. Hawks Hall
Willa Cather Dining Complex
University Health Center and College of Nursing
East Campus
Massengale Residential Center
Nebraska Veterinary Diagnostic Center
CAMPUS COMMUNITY (FALL 2018)
NEW CONSTRUCTION
16 17
Land Inventory (Acres Owned, Leased and Rented) City Campus 280 East Campus 343 Research and Extension Centers and ARDC 12,952 Other 29,212 Nebraska Innovation Campus 233
Total Acres: 43,020 Building Gross Square Footage
City Campus 11,706,910 East Campus 2,898,623 Research and Extension Centers and ARDC 1,263,218 Other 1,067,988 Nebraska Innovation Campus 128,900
Total Building Square Footage: 17,065,639
Percentages are of total enrollment: City Campus University Housing 5,723 22.2% Student Family Housing 72 0.3% Greek Housing 773 3.0% East Campus University Housing 334 1.3% Student Family Housing 36 0.1% Greek Housing 228 0.9% Total Students Living on Campus: 7,166 27.8%
Fraternity and Sorority Chapters 51 Recognized Student Organizations 538
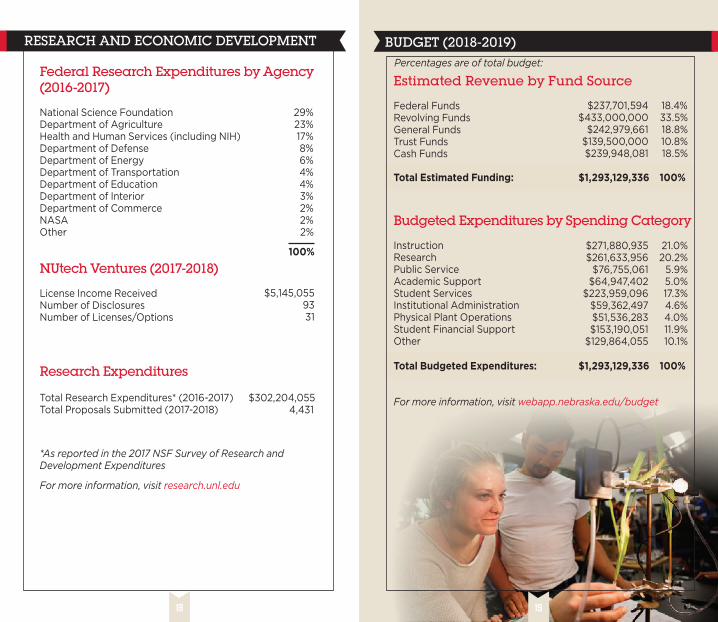
Percentages are of total budget:
BUDGET (2018-2019)
18 19
*As reported in the 2017 NSF Survey of Research and Development Expenditures For more information, visit research.unl.edu
Federal Research Expenditures by Agency (2016-2017)
National Science Foundation 29%Department of Agriculture 23%Health and Human Services (including NIH) 17%Department of Defense 8%Department of Energy 6%Department of Transportation 4%Department of Education 4%Department of Interior 3%Department of Commerce 2%NASA 2%Other 2%
NUtech Ventures (2017-2018)
License Income Received Number of Disclosures Number of Licenses/Options
RESEARCH AND ECONOMIC DEVELOPMENT
Total Research Expenditures* (2016-2017) $302,204,055 Total Proposals Submitted (2017-2018) 4,431
$5,145,0559331
Estimated Revenue by Fund Source
Federal Funds Revolving Funds General Funds Trust Funds Cash Funds Total Estimated Funding: $1,293,129,336 100%
Budgeted Expenditures by Spending Category Instruction Research Public Service Academic Support Student Services Institutional Administration Physical Plant OperationsStudent Financial SupportOther Total Budgeted Expenditures: $1,293,129,336 100% For more information, visit webapp.nebraska.edu/budget
$237,701,594 18.4% $433,000,000 33.5% $242,979,661 18.8% $139,500,000 10.8% $239,948,081 18.5%
$271,880,935 21.0% $261,633,956 20.2% $76,755,061 5.9% $64,947,402 5.0% $223,959,096 17.3% $59,362,497 4.6% $51,536,283 4.0% $153,190,051 11.9% $129,864,055 10.1%
Research Expenditures
100%
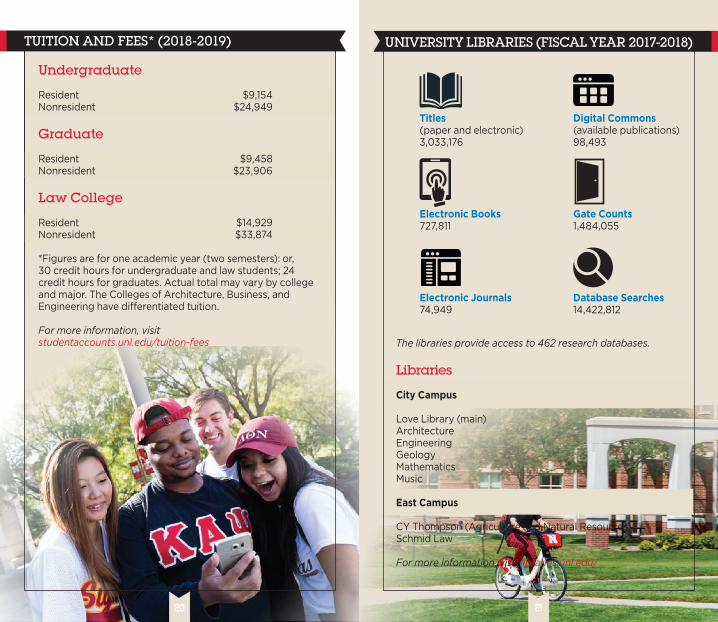
UNIVERSITY LIBRARIES (FISCAL YEAR 2017-2018)
TUITION AND FEES* (2018-2019)
Titles (paper and electronic) 3,033,176
Electronic Books 727,811
Electronic Journals 74,949
Digital Commons (available publications) 98,493
Gate Counts 1,484,055
Database Searches 14,422,812
20 21
Undergraduate Resident $9,154 Nonresident $24,949 Graduate Resident $9,458 Nonresident $23,906 Law College Resident $14,929 Nonresident $33,874 *Figures are for one academic year (two semesters): or, 30 credit hours for undergraduate and law students; 24 credit hours for graduates. Actual total may vary by college and major. The Colleges of Architecture, Business, and Engineering have differentiated tuition. For more information, visit studentaccounts.unl.edu/tuition-fees
The libraries provide access to 462 research databases. Libraries City Campus Love Library (main) Architecture Engineering Geology Mathematics Music East Campus CY Thompson (Agriculture and Natural Resources) Schmid Law For more information, visit libraries.unl.edu/
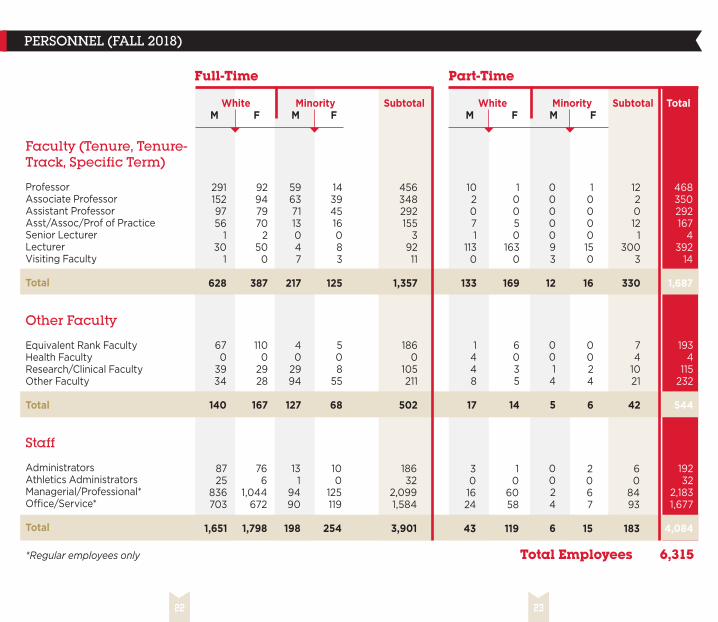
Full-Time Part-Time
PERSONNEL (FALL 2018)
22 23
White Minority Subtotal White Minority Subtotal Total M F M F M F M F
Faculty (Tenure, Tenure- Track, Specific Term)
Professor Associate Professor Assistant Professor Asst/Assoc/Prof of Practice Senior Lecturer Lecturer Visiting Faculty
Total
Other Faculty
Equivalent Rank Faculty Health Faculty Research/Clinical Faculty Other Faculty
Total
Staff
Administrators Athletics Administrators Managerial/Professional* Office/Service*
Total
*Regular employees only Total Employees 6,315
2911529756
130
1
628
670
3934
140
8725
836703
1,651
1448
17
301624
43
1100
2928
167
766
1,044672
1,798
6035
14
10
6058
119
40
2994
127
131
9490
198
001
4
5
0024
6
508
55
68
100
125119
254
0024
6
2067
15
1860
105211
502
18632
2,0991,584
3,901
74
1021
42
60
8493
183
1934
115232
544
19232
2,1831,677
4,084
102071
1130
133
59637113047
217
0000093
12
92947970
250
0
387
10050
1630
169
14394516083
125
10000150
16
456348292155
39211
1,357
1220121
3003
330
468350292167
4392
14
1,687
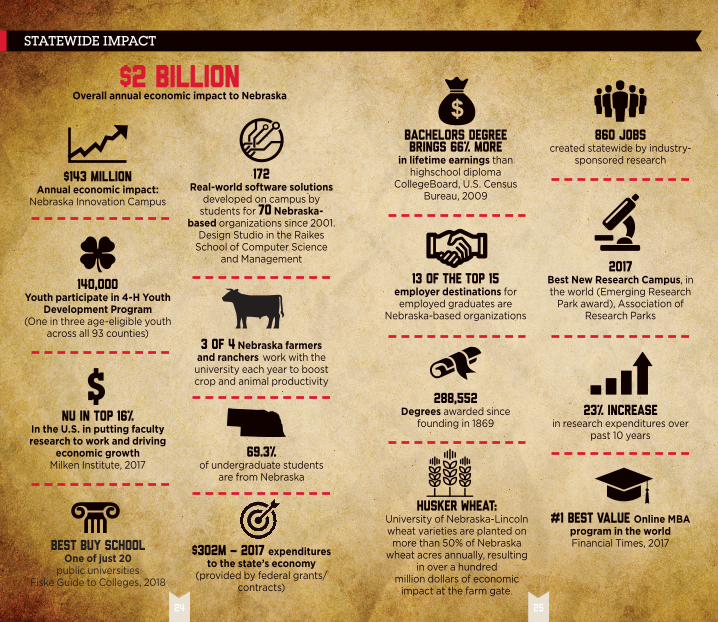
STATEWIDE IMPACT
$143 millionAnnual economic impact:
Nebraska Innovation Campus
140,000Youth participate in 4-H Youth
Development Program(One in three age-eligible youth
across all 93 counties)
NU in Top 16%In the U.S. in putting faculty research to work and driving
economic growth Milken Institute, 2017
172Real-world software solutions
developed on campus by students for 70 Nebraska-
based organizations since 2001.Design Studio in the Raikes
School of Computer Science and Management
3 of 4 Nebraska farmersand ranchers work with the university each year to boost crop and animal productivity
69.3%of undergraduate students
are from Nebraska
$302M – 2017 expenditures to the state’s economy
(provided by federal grants/contracts)
Bachelors degreebrings 66% more
in lifetime earnings than highschool diploma
CollegeBoard, U.S. Census Bureau, 2009
13 of the top 15employer destinations for employed graduates are
Nebraska-based organizations
288,552Degrees awarded since
founding in 1869
860 Jobscreated statewide by industry-
sponsored research
2017Best New Research Campus, in the world (Emerging Research
Park award), Association of Research Parks
23% Increase in research expenditures over
past 10 years
#1 Best Value Online MBA program in the worldFinancial Times, 2017
$2 billionOverall annual economic impact to Nebraska
24 25
HUSKER WHEAT: University of Nebraska-Lincoln wheat varieties are planted on more than 50% of Nebraska
wheat acres annually, resulting in over a hundred
million dollars of economic impact at the farm gate.
Best Buy SchoolOne of just 20
public universitiesFiske Guide to Colleges, 2018
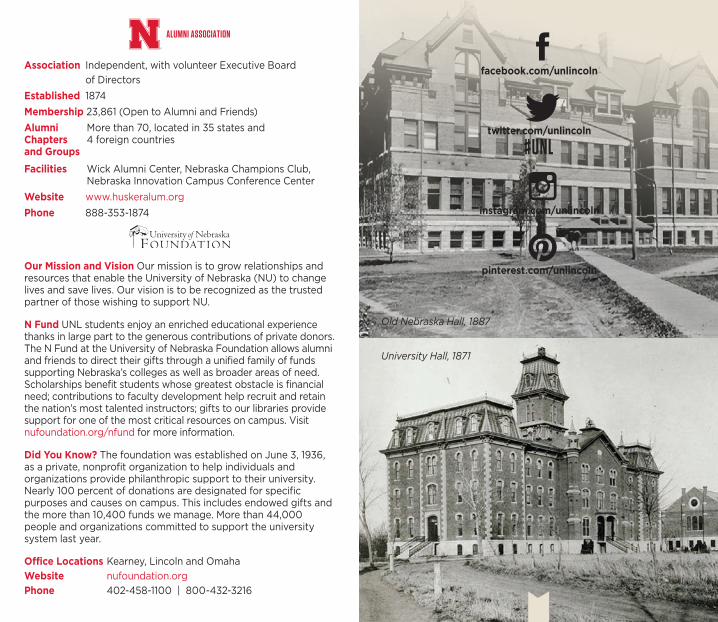
Association Independent, with volunteer Executive Board of Directors
Established 1874Membership 23,861 (Open to Alumni and Friends)Alumni More than 70, located in 35 states and Chapters 4 foreign countriesand Groups Facilities Wick Alumni Center, Nebraska Champions Club, Nebraska Innovation Campus Conference CenterWebsite www.huskeralum.orgPhone 888-353-1874
Our Mission and Vision Our mission is to grow relationships and resources that enable the University of Nebraska (NU) to change lives and save lives. Our vision is to be recognized as the trusted partner of those wishing to support NU.
N Fund UNL students enjoy an enriched educational experience thanks in large part to the generous contributions of private donors. The N Fund at the University of Nebraska Foundation allows alumni and friends to direct their gifts through a unified family of funds supporting Nebraska’s colleges as well as broader areas of need. Scholarships benefit students whose greatest obstacle is financial need; contributions to faculty development help recruit and retain the nation’s most talented instructors; gifts to our libraries provide support for one of the most critical resources on campus. Visit nufoundation.org/nfund for more information.
Did You Know? The foundation was established on June 3, 1936, as a private, nonprofit organization to help individuals and organizations provide philanthropic support to their university. Nearly 100 percent of donations are designated for specific purposes and causes on campus. This includes endowed gifts and the more than 10,400 funds we manage. More than 44,000 people and organizations committed to support the university system last year.
Office Locations Kearney, Lincoln and OmahaWebsite nufoundation.orgPhone 402-458-1100 | 800-432-3216
facebook.com/unlincoln
twitter.com/unlincoln
#UNL
instagram.com/unlincoln
pinterest.com/unlincoln
Old Nebraska Hall, 1887
University Hall, 1871
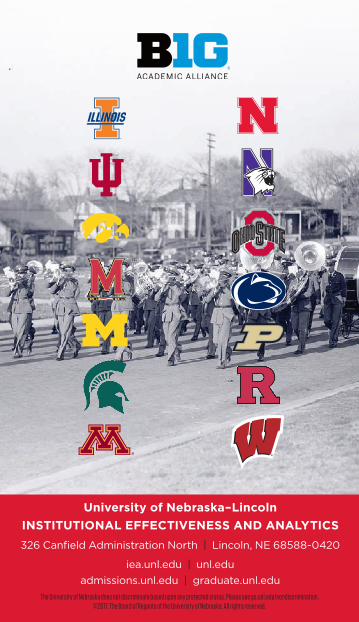
University of Nebraska–LincolnINSTITUTIONAL EFFECTIVENESS AND ANALYTICS326 Canfield Administration North | Lincoln, NE 68588-0420
iea.unl.edu | unl.edu
admissions.unl.edu | graduate.unl.eduThe University of Nebraska does not discriminate based upon any protected status. Please see go.unl.edu/nondiscrimination.
©2017, The Board of Regents of the University of Nebraska. All rights reserved.
Related Documents


