DISCLOSURE APPENDIX AT THE BACK OF THIS REPORT CONTAINS IMPORTANT DISCLOSURES, ANALYST CERTIFICATIONS, LEGAL ENTITY DISCLOSURE AND THE STATUS OF NON-US ANALYSTS. US Disclosure: Credit Suisse does and seeks to do business with companies covered in its research reports. As a result, investors should be aware that the Firm may have a conflict of interest that could affect the objectivity of this report. Investors should consider this report as only a single factor in making their investment decision. CREDIT SUISSE SECURITIES RESEARCH & ANALYTICS BEYOND INFORMATION ® Client-Driven Solutions, Insights, and Access 14 July 2016 Asia Pacific Equity Research Investment Strategy Jump-Start STRATEGY Jump-Start aims to provide you with a summary of the week that was and helps you prepare for the week ahead with a results calendar, economic forecasts and valuation summaries. China Property Sector: A new chapter—Go for quality. We assume coverage of China Property Sector (6 initiations and 16 assumptions) with MARKETWEIGHT and expect the overall sector to be range-bound amid stable sales outlook in 2H16-17E. In our view, the policy direction is no longer sufficient to drive sector performance and we therefore adopt a bottom-up approach to search for "quality" developers. We have non-consensus UNDERPERFORM calls on Vanke-H and Wanda. Our preferred names include COLI, CRL, Longfor, R&F, CIFI and Yuzhou. (Link) India Automobiles Sector: Mind the (regulatory) gap. India is going on a path of unprecedented tightening of its emissions and safety standards. We believe the market has re- rated auto stocks on possible GST implementation but it is not focusing on the regulatory headwinds ahead. GST implementation would result in a ~5-7% benefit for almost all segments within autos and should help offset some of the negative impact. Overall, gasoline PVs are best positioned as they will have the least price increases over the next four years. We still prefer Maruti as our top pick. (Link) China Internet Sector: Express Delivery—"Served in China". Express delivery service is riding the wave of e-commerce and O2O services boom, and has become an integral part of China's service infrastructure that has enhanced people's everyday life. Third-party express delivery companies such as STO, ZTO and SF Express are the largest beneficiaries of the boom. Our express company performance matrix and comparison analysis on various express delivery players show unit economic efficiency is the key driver for profitability. (Link) Must-read recently published reports 1) India Market Strategy– Agriculture: The problem is plenty (18/5) Neelkanth Mishra Volumes slowed in the past two years to 45-year lows, but the surprise has been price weakness. As India's per capita calorie consumption continues to fall and food habits change, cereal demand has peaked. Where demand is growing supply has grown with improving infrastructure and six years of elevated prices. 2) Research Institute— Emerging Consumer Survey 2016 (31/3) Richard Kersley Weak markets and currencies, and downgraded growth expectations have provided the backdrop to this year’s Emerging Consumer Survey. Negative cyclical influences underscore replies from our consumers, which are generally weaker than a year ago, if differing by country. 3) Asia Tobacco Sector— Emerging Asia Tobacco: Time to switch? (31/5) Arnab Mitra India is the world's most dominated cigarette market (outside China), with ITC having ~77%/96% volume/profit share. ITC's margins are the highest in the world. With FDI in cigarettes being banned, ITC's dominance remains unchallenged. 4) China Internet Sector – Express Delivery: "Served in China (11/7) Evan Zhou Express delivery service is riding the wave of e- commerce and O2O services boom, and has become an integral part of China's service infrastructure that has enhanced people's everyday life. 5) Asia Technology Strategy—Automotive- tech: Asian supply chain (29/6) Manish Nigam Tech products' sales into auto industry (we refer to it as 'automotive-tech') is set to grow rapidly over the coming decade. While the theme by itself isn't new, investors have been looking for Asian tech cos best exposed to this theme. Research Analyst Manish Nigam 852 2101 7067 [email protected] Credit Suisse forthcoming events Thematic Trip China Healthcare Tour Date 18-19 July, Zhengzhou and Beijing Analyst Iris Wang Shenzhen Auto Dealer Visit (Mandarin Speaker Only) Date 19 July, Shenzhen Analyst Bin Wang India Macro Tour – Reforms & Reforms Date 01-03 August, Mumbai, New Delhi Analyst Neelkanth Mishra Indonesia Conference Site Trip – Surabaya; Taking the pulse of Infrastructure, Property and Consumption Date 17-18 August, Surabaya, Indonesia Analyst Jahanzeb Naseer ASEAN Banks Tour – trough valuations? Date 22-26 August, Jakarta, Bangkok, Manila Analyst Sanjay Jain Corporate Days / Conferences 2016 Indonesia Conference Date 15-16 August, Singapore Analyst Jahanzeb Naseer 4th Asia Internet C-Level Conference Date 24-25 August, HK / 26 August, Singapore 17th Annual Asian Technology Conference Date 07-09 September, Taipei Analyst Manish Nigam Macau Gaming Corporate Day Date 13 September, Hong Kong Analyst Kenneth Fong Hong Kong / China (Non-deal roadshow) Vinda International Holdings Ltd (3331.HK) Post results Date 22 July, Hong Kong Analyst Raymond Ching Cheung Kong Infrastructure (1038.HK), Power Assets Holdings Limited (0006.HK) Post results Date 29 July, Hong Kong Analyst Dave Dai Hang Lung Properties (0101.HK) Date 29 July, Hong Kong Analyst Susanna Leung Singapore (Non-deal roadshow) Egis Technology Inc.(6462.TWO) Date 18-19 July, Singapore 20-22 July, Hong Kong Analyst Jerry Su China Gas Holdings Ltd (0384.HK) Post results Date 25-26 July, Singapore Analyst Dave Dai Contact [email protected] or your usual sales representative

Welcome message from author
This document is posted to help you gain knowledge. Please leave a comment to let me know what you think about it! Share it to your friends and learn new things together.
Transcript

DISCLOSURE APPENDIX AT THE BACK OF THIS REPORT CONTAINS IMPORTANT DISCLOSURES, ANALYST CERTIFICATIONS, LEGAL ENTITY DISCLOSURE AND THE STATUS OF NON-US ANALYSTS. US Disclosure: Credit Suisse does and seeks to do business with companies covered in its research reports. As a result, investors should be aware that the Firm may have a conflict of interest that could affect the objectivity of this report. Investors should consider this report as only a single factor in making their investment decision.
CREDIT SUISSE SECURITIES RESEARCH & ANALYTICS BEYOND INFORMATION®
Client-Driven Solutions, Insights, and Access
14 July 2016
Asia Pacific
Equity Research
Investment Strategy
Jump-Start STRATEGY
Jump-Start aims to provide you with a summary of the week that was and helps you prepare
for the week ahead with a results calendar, economic forecasts and valuation summaries.
China Property Sector: A new chapter—Go for quality. We assume coverage of China
Property Sector (6 initiations and 16 assumptions) with MARKETWEIGHT and expect the overall
sector to be range-bound amid stable sales outlook in 2H16-17E. In our view, the policy direction is
no longer sufficient to drive sector performance and we therefore adopt a bottom-up approach to
search for "quality" developers. We have non-consensus UNDERPERFORM calls on Vanke-H
and Wanda. Our preferred names include COLI, CRL, Longfor, R&F, CIFI and Yuzhou. (Link)
India Automobiles Sector: Mind the (regulatory) gap. India is going on a path of
unprecedented tightening of its emissions and safety standards. We believe the market has re-
rated auto stocks on possible GST implementation but it is not focusing on the regulatory
headwinds ahead. GST implementation would result in a ~5-7% benefit for almost all
segments within autos and should help offset some of the negative impact. Overall, gasoline
PVs are best positioned as they will have the least price increases over the next four years.
We still prefer Maruti as our top pick. (Link)
China Internet Sector: Express Delivery—"Served in China". Express delivery service is
riding the wave of e-commerce and O2O services boom, and has become an integral part of
China's service infrastructure that has enhanced people's everyday life. Third-party express
delivery companies such as STO, ZTO and SF Express are the largest beneficiaries of the
boom. Our express company performance matrix and comparison analysis on various express
delivery players show unit economic efficiency is the key driver for profitability. (Link)
Must-read recently published reports
1) India Market Strategy– Agriculture: The problem is plenty (18/5)
Neelkanth Mishra
Volumes slowed in the past two years to 45-year lows, but the surprise has been price weakness. As India's per capita calorie consumption continues to fall and food habits change, cereal demand has peaked. Where demand is growing supply has grown with improving infrastructure and six years of elevated prices.
2) Research Institute—Emerging Consumer Survey 2016 (31/3)
Richard Kersley Weak markets and currencies, and downgraded growth expectations have provided the backdrop to this year’s Emerging Consumer Survey. Negative cyclical influences underscore replies from our consumers, which are generally weaker than a year ago, if differing by country.
3) Asia Tobacco Sector— Emerging Asia Tobacco: Time to switch? (31/5)
Arnab Mitra India is the world's most dominated cigarette market (outside China), with ITC having ~77%/96% volume/profit share. ITC's margins are the highest in the world. With FDI in cigarettes being banned, ITC's dominance remains unchallenged.
4) China Internet Sector – Express Delivery: "Served in China (11/7)
Evan Zhou Express delivery service is riding the wave of e-commerce and O2O services boom, and has become an integral part of China's service infrastructure that has enhanced people's everyday life.
5) Asia Technology Strategy—Automotive-tech: Asian supply chain (29/6)
Manish Nigam Tech products' sales into auto industry (we refer to it as 'automotive-tech') is set to grow rapidly over the coming decade. While the theme by itself isn't new, investors have been looking for Asian tech cos best exposed to this theme.
Research Analyst
Manish Nigam
852 2101 7067
Credit Suisse forthcoming events
Thematic Trip
China Healthcare Tour
Date 18-19 July, Zhengzhou and Beijing
Analyst Iris Wang
Shenzhen Auto Dealer Visit (Mandarin Speaker Only)
Date 19 July, Shenzhen
Analyst Bin Wang
India Macro Tour – Reforms & Reforms
Date 01-03 August, Mumbai, New Delhi
Analyst Neelkanth Mishra
Indonesia Conference Site Trip – Surabaya; Taking the pulse of Infrastructure, Property and Consumption
Date 17-18 August, Surabaya, Indonesia
Analyst Jahanzeb Naseer
ASEAN Banks Tour – trough valuations?
Date 22-26 August, Jakarta, Bangkok, Manila
Analyst Sanjay Jain
Corporate Days / Conferences
2016 Indonesia Conference
Date 15-16 August, Singapore
Analyst Jahanzeb Naseer
4th Asia Internet C-Level Conference
Date 24-25 August, HK / 26 August, Singapore
17th Annual Asian Technology Conference
Date 07-09 September, Taipei
Analyst Manish Nigam
Macau Gaming Corporate Day
Date 13 September, Hong Kong
Analyst Kenneth Fong
Hong Kong / China (Non-deal roadshow)
Vinda International Holdings Ltd (3331.HK) Post results
Date 22 July, Hong Kong
Analyst Raymond Ching
Cheung Kong Infrastructure (1038.HK), Power Assets Holdings Limited (0006.HK) Post results
Date 29 July, Hong Kong
Analyst Dave Dai
Hang Lung Properties (0101.HK)
Date 29 July, Hong Kong
Analyst Susanna Leung
Singapore (Non-deal roadshow)
Egis Technology Inc.(6462.TWO)
Date 18-19 July, Singapore 20-22 July, Hong Kong
Analyst Jerry Su
China Gas Holdings Ltd (0384.HK) Post results
Date 25-26 July, Singapore
Analyst Dave Dai
Contact [email protected] or your usual sales representative

14 J
uly
201
6
Ju
mp
-Sta
rt 2
Weekly revision review
Company rating/earnings/target price changes
New EPS Old EPS
Last New Old forecasts forecasts % change
New Old closing target target % Curr Curr Curr Curr Curr Curr
Country Date RIC Company rating rating price price price change year yr + 1 year yr + 1 year yr + 1 Analyst
Upgrade
China 11 Jul 3383.HK Agile N U HK$ 3.869 HK$ 4.8 HK$ 2.4 100.0 Rmb 0.6383 Rmb 0.6886 Rmb 0.6681 Rmb 0.7669 -4.46 -10.21 Alvin Wong
China 11 Jul 1109.HK CRL O N HK$ 19.2 HK$ 24.4 HK$ 20.3 20.2 HK$ 2.4071 HK$ 2.884 HK$ 2.4862 HK$ 2.6439 -3.18 9.08 Alvin Wong
China 11 Jul 1813.HK KWG O N HK$ 3.921 HK$ 5.4 HK$ 5 8.0 Rmb 0.9588 Rmb 1.0494 Rmb 0.944 Rmb 1.009 1.57 4.01 Alvin Wong
China 11 Jul 2777.HK R&F O U HK$ 9.549 HK$ 13.2 HK$ 7.7 71.4 Rmb 2.2123 Rmb 2.488 Rmb 2.0607 Rmb 2.2881 7.36 8.74 Alvin Wong
China 11 Jul 2382.HK Sunny Optical O N HK$ 25.078 HK$ 32.5 HK$ 23.3 39.5 Rmb 1.0056 Rmb 1.3235 Rmb 1.0327 Rmb 1.3154 -2.62 0.62 Sam Li
Taiwan 12 Jul 1326.TW FCFC O N NT$ 82.2 NT$ 96 NT$ 78 23.1 NT$ 5.7789 NT$ 5.9793 NT$ 4.4924 NT$ 4.5443 28.64 31.58 Jeremy Chen
Taiwan 13 Jul 6239.TW PTI O N NT$ 73.9 NT$ 85.8 NT$ 78 10.0 NT$ 5.2018 NT$ 6.0018 NT$ 5.2018 NT$ 6.0032 0.00 -0.02 Randy Abrams
Upward revision
China 06 Jul 0291.HK China Res Beer N N HK$ 17.36 HK$ 17.5 HK$ 14.5 20.7 HK$ 0.5611 HK$ 0.6251 HK$ 0.3775 HK$ 0.4355 48.64 43.52 Simon Sun
China 07 Jul 0285.HK BYDE N N HK$ 4.645 HK$ 5.1 HK$ 4.7 8.5 Rmb 0.5279 Rmb 0.5098 Rmb 0.446 Rmb 0.4699 18.37 8.50 Sam Li
China 07 Jul 601238.SS Guangzhou Auto (A) U U Rmb 21.62 Rmb 10.02 Rmb 9.686 3.4 Rmb 1.0014 Rmb 1.1059 Rmb 0.9631 Rmb 1.0543 3.98 4.90 Bin Wang
China 07 Jul 2238.HK Guangzhou Auto (H) O O HK$ 8.601 HK$ 12 HK$ 11.6 3.4 Rmb 1.0014 Rmb 1.1059 Rmb 0.9631 Rmb 1.0543 3.98 4.90 Bin Wang
China 11 Jul 600519.SS Kweichow Moutai O O Rmb 324.73 Rmb 380 Rmb 310 22.6 Rmb 13.9329 Rmb 16.1894 Rmb 13.719 Rmb 15.1506 1.56 6.86 Simon Sun
China 11 Jul 000858.SZ Wuliangye O O Rmb 37.42 Rmb 45 Rmb 36 25.0 Rmb 1.9095 Rmb 2.2648 Rmb 1.8805 Rmb 2.1822 1.54 3.78 Simon Sun
China 11 Jul 002304.SZ Yanghe Brewery O O Rmb 76.12 Rmb 90 Rmb 85 5.9 Rmb 4.0736 Rmb 4.8513 Rmb 4.0417 Rmb 4.8129 0.79 0.80 Simon Sun
China 13 Jul 1347.HK Huahong Semi O O HK$ 0.922 HK$ 11 HK$ 11 0.0 US$ 0.1086 US$ 0.097 US$ 0.1086 US$ 0.0908 0.00 6.79 Randy Abrams
China 13 Jul 0981.HK SMIC O O HK$ 0.083 HK$ 0.93 HK$ 0.93 0.0 US$ 0.0066 US$ 0.0063 US$ 0.0066 US$ 0.0057 0.00 11.30 Randy Abrams
India 06 Jul NTPC.BO NTPC O O Rs 158 Rs 180 Rs 165 9.1 Rs 11.4053 Rs 13.5734 Rs 11.7494 Rs 13.1083 -2.93 3.55 Lokesh Garg
India 07 Jul PGRD.BO PGCIL O O Rs 166.55 Rs 200 Rs 200 0.0 Rs 14.5179 Rs 16.7885 Rs 14.3087 Rs 16.3171 1.46 2.89 Lokesh Garg
India 11 Jul BJFN.BO Bajaj Finance U U Rs 8625.35 Rs 5500 Rs 5500 0.0 Rs 327.9876 Rs 406.0609 Rs 326.0243 Rs 403.7172 0.60 0.58 Sunil Tirumalai
India 11 Jul BHAF.BO Bharat Financial N N Rs 778.65 Rs 660 Rs 660 0.0 Rs 56.3324 Rs 64.2231 Rs 54.7593 Rs 62.5485 2.87 2.68 Sunil Tirumalai
India 11 Jul SRTR.BO Shriram Transport O O Rs 1299.4 Rs 1500 Rs 1200 25.0 Rs 74.7443 Rs 114.2373 Rs 74.7462 Rs 110.719 0.00 3.18 Sunil Tirumalai
India 12 Jul LICH.BO LIC Housing Finance O O Rs 520.85 Rs 625 Rs 590 5.9 Rs 46.0053 Rs 58.7808 Rs 46.1671 Rs 59.0641 -0.35 -0.48 Sunil Tirumalai
Philippines 06 Jul RRHI.PS Robinsons Retail N N P 86.6 P 80.1 P 74.4 7.7 P 3.4809 P 4.034 P 3.5447 P 4.0444 -1.80 -0.26 Sofia Cabral
Singapore 06 Jul MONE.SI M1 U U S$ 2.87 S$ 2.05 S$ 2.05 0.0 S$ 0.1867 S$ 0.1575 S$ 0.184 S$ 0.1564 1.47 0.68 Varun Ahuja
Singapore 06 Jul MACT.SI MCT O O S$ 1.535 S$ 1.64 S$ 1.62 1.2 S$ 0.0675 S$ 0.0815 S$ 0.0784 S$ 0.0798 -13.96 2.13 Nicholas Teh
Singapore 06 Jul STAR.SI StarHub U U S$ 3.91 S$ 3 S$ 3 0.0 S$ 0.218 S$ 0.1892 S$ 0.2157 S$ 0.1889 1.09 0.13 Varun Ahuja
South Korea 06 Jul 005490.KS POSCO O O W 227000 W 280000 W 280000 0.0 W 16060 W 22416 W 14176 W 20508 13.29 9.30 Minseok Sinn
South Korea 08 Jul 130960.KQ CJ E&M O O W 73200 W 91000 W 91000 0.0 W 2530 W 3709 W 2505 W 3678 0.99 0.85 Ray Kim
South Korea 13 Jul 036570.KS NC Soft U U W 255500 W 199000 W 186000 7.0 W 10102 W 10955 W 10132 W 10414 -0.29 5.19 Eric Cha
Taiwan 06 Jul 2324.TW Compal N N NT$ 21.2 NT$ 20 NT$ 19 5.3 NT$ 2.1023 NT$ 2.3722 NT$ 2.033 NT$ 2.3216 3.41 2.18 Thompson Wu
Taiwan 06 Jul 2880.TW Hua Nan Financial N N NT$ 17.05 NT$ 16 NT$ 15.9 0.6 NT$ 1.4156 NT$ 1.4342 NT$ 1.3522 NT$ 1.4297 4.69 0.32 Chung Hsu
Taiwan 06 Jul 2887.TW Taishin Financial N N NT$ 12.75 NT$ 14 NT$ 12.8 9.4 NT$ 1.5824 NT$ 1.5014 NT$ 1.5778 NT$ 1.5319 0.29 -1.99 Chung Hsu
Taiwan 08 Jul 2360.TW Chroma O O NT$ 79.5 NT$ 88 NT$ 84 4.8 NT$ 4.4122 NT$ 4.9565 NT$ 4.4146 NT$ 4.9511 -0.05 0.11 Jerry Su
Taiwan 12 Jul 6505.TW FPCC O O NT$ 88 NT$ 105 NT$ 102 2.9 NT$ 5.933 NT$ 6.21 NT$ 4.8603 NT$ 5.0118 22.07 23.91 Jeremy Chen
Taiwan 12 Jul 1303.TW NYPC N N NT$ 62.5 NT$ 68 NT$ 64 6.3 NT$ 3.8341 NT$ 3.8414 NT$ 4.138 NT$ 4.2728 -7.34 -10.10 Jeremy Chen
Taiwan 13 Jul 2330.TW TSMC O O NT$ 168.5 NT$ 185 NT$ 177 4.5 NT$ 12.1465 NT$ 13.1998 NT$ 12.15 NT$ 13.2001 -0.03 0.00 Randy Abrams
Taiwan 13 Jul 3702.TW WPG N N NT$ 39.3 NT$ 40.2 NT$ 38 5.8 NT$ 3.2738 NT$ 3.8509 NT$ 3.2738 NT$ 3.8001 0.00 1.34 Randy Abrams

14 J
uly
201
6
Ju
mp
-Sta
rt 3
Company rating/earnings/target price changes (continued)
New EPS Old EPS
Last New Old forecasts forecasts % change
New Old closing target target % Curr Curr Curr Curr Curr Curr
Country Date RIC Company rating rating price price price change year yr + 1 year yr + 1 year yr + 1 Analyst
Downgrade
China 11 Jul 0081.HK COGO U O HK$ 2.33 HK$ 1.9 HK$ 3.7 -48.6 HK$ 0.3576 HK$ 0.3545 HK$ 0.7283 HK$ 0.8604 -50.90 -58.79 Alvin Wong
China 11 Jul 3333.HK Evergrande U N HK$ 4.188 HK$ 3.9 HK$ 4.8 -18.8 Rmb 0.0867 Rmb 0.1035 Rmb 0.5575 Rmb 0.6049 -84.44 -82.88 Alvin Wong
China 11 Jul 0817.HK Jinmao N O HK$ 2.26 HK$ 2.2 HK$ 2.7 -18.5 HK$ 0.2608 HK$ 0.305 HK$ 0.2608 HK$ 0.3981 0.03 -23.40 Kelvin Tam
China 11 Jul 0119.HK Poly Prop U O HK$ 2.01 HK$ 1.8 HK$ 2.9 -37.9 HK$ -0.1375 HK$ 0.0112 HK$ 0.0926 HK$ 0.0658 n.m. -82.98 Alvin Wong
China 11 Jul 0813.HK Shimao N O HK$ 8.652 HK$ 10.6 HK$ 14.5 -26.9 Rmb 1.3572 Rmb 1.4168 Rmb 1.9637 Rmb 2.1802 -30.89 -35.01 Kelvin Tam
China 11 Jul 0410.HK SOHO N O HK$ 3.344 HK$ 3.8 HK$ 5.1 -25.5 Rmb 0.0693 Rmb 0.071 Rmb 0.0734 Rmb 0.0789 -5.53 -9.98 Kelvin Tam
China 11 Jul 000002.SZ Vanke-A U O Rmb 18.32 Rmb 10.1 Rmb 20.8 -51.4 Rmb 1.8378 Rmb 2.0055 Rmb 2.0004 Rmb 2.1624 -8.13 -7.26 Alvin Wong
China 11 Jul 2202.HK Vanke-H U O HK$ 13.823 HK$ 12.1 HK$ 25.4 -52.4 Rmb 1.8361 Rmb 2.0037 Rmb 2.046 Rmb 2.4384 -10.26 -17.83 Alvin Wong
China 11 Jul 3699.HK Wanda U O HK$ 41.108 HK$ 35.4 HK$ 60 -41.0 Rmb 3.2751 Rmb 3.4809 Rmb 4.3079 Rmb 4.8702 -23.97 -28.53 Alvin Wong
Hong Kong 11 Jul 1426.HK Spring REIT N O HK$ 0.436 HK$ 3.6 HK$ 3.82 -5.8 US$ 0.0304 US$ 0.0302 US$ 0.034 US$ 0.0336 -10.61 -10.10 Kelvin Tam
Malaysia 11 Jul ALFG.KL Alliance Financial Group N O RM 4.06 RM 4 RM 3.97 0.8 RM 0.3464 RM 0.3815 RM 0.3561 RM 0.385 -2.73 -0.91 Danny Goh
Philippines 12 Jul MCP.PS Melco Crown (Phils) U O P 4.18 P 3.28 P 3.2 2.5 P -0.6582 P -0.3721 P -0.7061 P -0.3784 n.m. n.m. Patricia Palanca
Taiwan 06 Jul 2801.TW Chang Hwa Bank U N NT$ 16.65 NT$ 15 NT$ 16.5 -9.1 NT$ 1.3565 NT$ 1.2535 NT$ 1.3565 NT$ 1.3786 0.00 -9.08 Chung Hsu
Taiwan 06 Jul 2884.TW E. Sun Financial N O NT$ 19.1 NT$ 19.8 NT$ 22.4 -11.6 NT$ 1.8135 NT$ 1.8055 NT$ 1.8138 NT$ 2.0035 -0.02 -9.89 Chung Hsu
Taiwan 06 Jul 2886.TW Mega Financial N O NT$ 24.5 NT$ 25 NT$ 25.5 -2.0 NT$ 2.1194 NT$ 2.171 NT$ 2.2562 NT$ 2.3032 -6.06 -5.74 Chung Hsu
Taiwan 06 Jul 2888.TW Shin Kong FHC U N NT$ 6.4 NT$ 5.4 NT$ 7 -22.9 NT$ 0.509 NT$ 0.518 NT$ 0.509 NT$ 0.5271 0.00 -1.72 Chung Hsu
Taiwan 12 Jul 1301.TW Formosa Plastics N O NT$ 78 NT$ 86 NT$ 90 -4.4 NT$ 4.8076 NT$ 5.0724 NT$ 4.7695 NT$ 5.018 0.80 1.08 Jeremy Chen
Downward revision
China 11 Jul 2007.HK CG U U HK$ 2.818 HK$ 2.6 HK$ 2.6 0.0 Rmb 0.3578 Rmb 0.4176 Rmb 0.458 Rmb 0.4864 -21.88 -14.14 Alvin Wong
China 11 Jul 0941.HK China Mobile O O HK$ 78.509 HK$ 123.5 HK$ 125.17 -1.3 Rmb 5.7039 Rmb 6.1502 Rmb 5.7029 Rmb 6.1503 0.02 0.00 Colin McCallum
China 11 Jul 0728.HK China Telecom O O HK$ 3.12 HK$ 6.85 HK$ 7.55 -9.3 Rmb 0.2491 Rmb 0.3079 Rmb 0.2491 Rmb 0.3078 0.01 0.03 Colin McCallum
China 11 Jul 0762.HK China Unicom O O HK$ 6.86 HK$ 16 HK$ 18 -11.1 Rmb 0.3262 Rmb 0.5255 Rmb 0.3255 Rmb 0.5252 0.22 0.05 Colin McCallum
China 11 Jul 0688.HK COLI O O HK$ 25.6 HK$ 30 HK$ 30.5 -1.6 HK$ 3.0988 HK$ 3.5617 HK$ 3.4523 HK$ 3.9935 -10.24 -10.81 Alvin Wong
China 11 Jul 2369.HK Coolpad U U HK$ 1.32 HK$ 1.15 HK$ 1.2 -4.2 HK$ -0.0305 HK$ 0.0698 HK$ 0.0198 HK$ 0.0705 n.m. -1.10 Kyna Wong
China 11 Jul 3900.HK Greentown O O HK$ 5.093 HK$ 6.7 HK$ 8 -16.3 Rmb 0.4789 Rmb 0.562 Rmb 0.5173 Rmb 0.8423 -7.41 -33.28 Kelvin Tam
China 11 Jul 002475.SZ Luxshare O O Rmb 17.83 Rmb 26 Rmb 29.4 -11.6 Rmb 0.6395 Rmb 0.9109 Rmb 0.7201 Rmb 0.9531 -11.19 -4.43 Sam Li
China 11 Jul 3377.HK Sino-Ocean N N HK$ 2.887 HK$ 3.5 HK$ 4.2 -16.7 Rmb 0.3342 Rmb 0.3944 Rmb 0.4282 Rmb 0.5189 -21.95 -23.99 Alvin Wong
China 11 Jul 1918.HK Sunac U U HK$ 4.43 HK$ 4.1 HK$ 4.5 -8.9 Rmb 0.3433 Rmb 0.3508 Rmb 0.7051 Rmb 0.8437 -51.31 -58.42 Kelvin Tam
China 11 Jul 600050.SS Unicom (A) O O Rmb 4.05 Rmb 5 Rmb 5.6 -10.7 Rmb 0.1282 Rmb 0.1946 Rmb 0.1278 Rmb 0.1945 0.28 0.10 Colin McCallum
China 12 Jul 600871.SS Sinopec SSC (A) U U Rmb 4.25 Rmb 0.9 Rmb 1 -10.0 Rmb -0.2035 Rmb -0.1562 Rmb -0.0509 Rmb 0.0213 n.m. n.m. Horace Tse
China 12 Jul 1033.HK Sinopec SSC (H) U U HK$ 1.396 HK$ 1.1 HK$ 1.2 -8.3 Rmb -0.2035 Rmb -0.1562 Rmb -0.0509 Rmb 0.0213 n.m. n.m. Horace Tse
China 13 Jul 0836.HK CR Power U U HK$ 11.2 HK$ 10 HK$ 11 -9.1 HK$ 2.0978 HK$ 1.6482 HK$ 2.155 HK$ 1.7065 -2.65 -3.42 Dave Dai
China 13 Jul 601991.SS Datang (A) U U Rmb 4.05 Rmb 1.84 Rmb 1.9 -3.2 Rmb 0.2769 Rmb 0.2439 Rmb 0.285 Rmb 0.2511 -2.83 -2.86 Dave Dai
China 13 Jul 0991.HK Datang (H) N N HK$ 1.68 HK$ 2.1 HK$ 2.2 -4.5 Rmb 0.2769 Rmb 0.2439 Rmb 0.285 Rmb 0.2511 -2.83 -2.86 Dave Dai
China 13 Jul 600027.SS HDP (A) U U Rmb 5.12 Rmb 2.8 Rmb 2.9 -3.4 Rmb 0.4931 Rmb 0.4131 Rmb 0.5112 Rmb 0.4274 -3.55 -3.35 Dave Dai
China 13 Jul 1071.HK HDP (H) U U HK$ 3.059 HK$ 3.1 HK$ 3.4 -8.8 Rmb 0.4931 Rmb 0.4131 Rmb 0.5112 Rmb 0.4274 -3.55 -3.35 Dave Dai
China 13 Jul 600011.SS Huaneng (A) U U Rmb 7.2 Rmb 3.7 Rmb 3.8 -2.6 Rmb 0.6806 Rmb 0.5676 Rmb 0.7065 Rmb 0.5863 -3.67 -3.19 Dave Dai
China 13 Jul 0902.HK Huaneng (H) U U HK$ 3.947 HK$ 4 HK$ 4.3 -7.0 Rmb 0.6806 Rmb 0.5676 Rmb 0.7065 Rmb 0.5863 -3.67 -3.19 Dave Dai
Hong Kong 11 Jul 3311.HK CSCI O O HK$ 10.5 HK$ 13.6 HK$ 14.3 -4.9 HK$ 1.1803 HK$ 1.2919 HK$ 1.2332 HK$ 1.3955 -4.29 -7.42 Edmond Huang
India 06 Jul BHEL.BO BHEL U U Rs 138.3 Rs 100 Rs 100 0.0 Rs 4.5689 Rs 5.6068 Rs 4.7163 Rs 6.2112 -3.13 -9.73 Lokesh Garg
India 08 Jul SADE.BO Sadbhav Engg. O O Rs 286.85 Rs 340 Rs 350 -2.9 Rs 7.2501 Rs 8.6992 Rs 7.2501 Rs 8.7011 0.00 -0.02 Lokesh Garg
India 11 Jul INBF.BO Indiabulls Housing O O Rs 743.35 Rs 800 Rs 800 0.0 Rs 73.5807 Rs 91.3765 Rs 76.0698 Rs 94.4555 -3.27 -3.26 Sunil Tirumalai
India 11 Jul INBK.BO IndusInd Bank O O Rs 1124.4 Rs 1301 Rs 1301 0.0 Rs 49.7183 Rs 62.599 Rs 51.4128 Rs 64.656 -3.30 -3.18 Ashish Gupta
India 11 Jul MMFS.BO MMFSL O O Rs 356.75 Rs 410 Rs 410 0.0 Rs 22.9605 Rs 31.2345 Rs 23.5632 Rs 31.9317 -2.56 -2.18 Sunil Tirumalai
India 11 Jul SHCU.BO Shriram City O O Rs 1792.05 Rs 1880 Rs 1880 0.0 Rs 120.0518 Rs 157.0608 Rs 124.5171 Rs 163.9206 -3.59 -4.18 Sunil Tirumalai
India 12 Jul CADI.BO Cadila O O Rs 371.25 Rs 405 Rs 405 0.0 Rs 15.3906 Rs 20.3906 Rs 15.3907 Rs 20.3908 0.00 0.00 Anubhav Aggarwal
India 12 Jul COAL.BO Coal India O O Rs 316.85 Rs 400 Rs 400 0.0 Rs 22.5333 Rs 21.5088 Rs 22.5333 Rs 21.5089 0.00 0.00 Ravi Shankar

14 J
uly
201
6
Ju
mp
-Sta
rt 4
Company rating/earnings/target price changes (continued)
New EPS Old EPS
Last New Old forecasts forecasts % change
New Old closing target target % Curr Curr Curr Curr Curr Curr
Country Date RIC Company rating rating price price price change year yr + 1 year yr + 1 year yr + 1 Analyst
Downward revision
Malaysia 11 Jul RHBC.KL RHB Capital O O RM 5.15 RM 5.69 RM 7.4 -23.1 RM 0.5021 RM 0.5883 RM 0.6538 RM 0.767 -23.21 -23.29 Danny Goh
Malaysia 12 Jul SKPE.KL SapuraKencana N N RM 1.43 RM 1.4 RM 1.4 0.0 RM 0.0646 RM 0.0502 RM 0.0675 RM 0.0725 -4.27 -30.75 Muzhafar Mukhtar
Pakistan 11 Jul EGCH.KA Engro Corp O O PRs 339.11 PRs 375 PRs 410 -8.5 PRs 88.9975 PRs 27.4644 PRs 40.537 PRs 48.2456 119.55 -43.07 Farhan Rizvi
Philippines 07 Jul EMP.PS Emperador N N P 7.33 P 7.6 P 9.9 -23.2 P 0.4201 P 0.4565 P 0.4519 P 0.4956 -7.04 -7.89 Kathi Go
Singapore 06 Jul STEL.SI SingTel O O S$ 4.31 S$ 4.45 S$ 4.45 0.0 S$ 0.2357 S$ 0.25 S$ 0.2376 S$ 0.2503 -0.80 -0.09 Varun Ahuja
South Korea 06 Jul 000270.KS Kia O O W 41850 W 50000 W 61000 -18.0 W 6411 W 7800 W 7500 W 8007 -14.52 -2.59 Michael Sohn
South Korea 11 Jul 018880.KS HanOn U U W 10700 W 8000 W 8000 0.0 W 520 W 574 W 550 W 578 -5.56 -0.64 Michael Sohn
Taiwan 06 Jul 2882.TW Cathay FHC N N NT$ 35.1 NT$ 36 NT$ 40 -10.0 NT$ 3.0556 NT$ 2.927 NT$ 3.0526 NT$ 3.0285 0.10 -3.35 Chung Hsu
Taiwan 06 Jul 2883.TW CDF N N NT$ 7.71 NT$ 8.5 NT$ 8.5 0.0 NT$ 0.4183 NT$ 0.5364 NT$ 0.4566 NT$ 0.5744 -8.38 -6.61 Chung Hsu
Taiwan 06 Jul 2891.TW CTBC Holding O O NT$ 17.65 NT$ 20 NT$ 20 0.0 NT$ 1.5132 NT$ 1.8693 NT$ 1.7313 NT$ 1.9822 -12.60 -5.70 Chung Hsu
Taiwan 06 Jul 2881.TW Fubon FHC N N NT$ 37.9 NT$ 38 NT$ 40.8 -6.9 NT$ 4.0421 NT$ 3.9188 NT$ 4.0422 NT$ 3.9862 0.00 -1.69 Chung Hsu
Taiwan 06 Jul 2498.TW HTC U U NT$ 100 NT$ 57 NT$ 57 0.0 NT$ -3.4786 NT$ 0.5602 NT$ -3.4744 NT$ 0.7411 n.m. -24.41 Pauline Chen
Taiwan 06 Jul 1477.TW Makalot O O NT$ 163 NT$ 180 NT$ 209 -13.9 NT$ 9.9056 NT$ 12.0097 NT$ 11.5703 NT$ 13.8677 -14.39 -13.40 Jeremy Chen
Taiwan 06 Jul 3034.TW Novatek O O NT$ 112.5 NT$ 135 NT$ 140 -3.6 NT$ 9.1667 NT$ 10.2883 NT$ 9.9954 NT$ 11.1579 -8.29 -7.79 Jerry Su
Taiwan 06 Jul 4966.TWO Parade O O NT$ 303 NT$ 375 NT$ 380 -1.3 NT$ 18.5142 NT$ 20.9709 NT$ 18.8343 NT$ 20.9664 -1.70 0.02 Derrick Yang
Taiwan 11 Jul 2890.TW SinoPac Financial O O NT$ 9.85 NT$ 11 NT$ 11.5 -4.3 NT$ 0.9719 NT$ 1.1804 NT$ 1.0352 NT$ 1.0885 -6.12 8.44 Chung Hsu
Thailand 12 Jul DTAC.BK DTAC O O Bt 31.75 Bt 66 Bt 70 -5.7 Bt 1.5941 Bt 1.6978 Bt 2.0802 Bt 2.2579 -23.37 -24.80 Colin McCallum
Initiation
China 11 Jul 0884.HK CIFI O - HK$ 1.68 HK$ 2.5 - n.a. Rmb 0.3793 Rmb 0.4687 - - n.a. n.a. Alvin Wong
China 11 Jul 0207.HK Joy City O - HK$ 1.017 HK$ 1.4 - n.a. Rmb 0.0741 Rmb 0.1103 - - n.a. n.a. Alvin Wong
China 11 Jul 0960.HK Longfor O - HK$ 9.135 HK$ 12.4 - n.a. Rmb 1.3297 Rmb 1.5086 - - n.a. n.a. Alvin Wong
China 11 Jul 0123.HK Yuexiu Prop N - HK$ 0.836 HK$ 1 - n.a. Rmb 0.0989 Rmb 0.1084 - - n.a. n.a. Kelvin Tam
China 11 Jul 0405.HK Yuexiu REIT O - HK$ 3.844 HK$ 5.5 - n.a. Rmb 0.0946 Rmb 0.1036 - - n.a. n.a. Kelvin Tam
China 11 Jul 1628.HK Yuzhou O - HK$ 1.87 HK$ 2.8 - n.a. Rmb 0.4503 Rmb 0.5217 - - n.a. n.a. Alvin Wong
Malaysia 11 Jul WPHB.KL Westports U - RM 4.26 RM 3.7 - n.a. RM 0.1785 RM 0.1839 - - n.a. n.a. Muzhafar Mukhtar
Others
China 11 Jul 0272.HK SOL O O HK$ 1.749 HK$ 2.5 HK$ 2.5 0.0 Rmb 0.2612 Rmb 0.3359 Rmb 0.354 Rmb 0.2668 -26.21 25.93 Kelvin Tam
India 11 Jul GAIL.BO GAIL U U Rs 378.45 Rs 295 Rs 295 0.0 Rs 17.6095 Rs 22.7107 Rs 16.061 Rs 22.7108 9.64 0.00 Badrinath Srinivasan
India 12 Jul CUMM.BO Cummins India N N Rs 816.05 Rs 875 Rs 875 0.0 Rs 27.654 Rs 29.6948 Rs 27.123 Rs 29.7603 1.96 -0.22 Lokesh Garg
South Korea 07 Jul 105560.KS KB Financial O O W 33400 W 46000 W 46000 0.0 W 4669 W 5252 W 4652 W 5272 0.37 -0.39 Gil Kim
Taiwan 06 Jul 2892.TW First FHC N N NT$ 17.15 NT$ 17 NT$ 17 0.0 NT$ 1.381 NT$ 1.3851 NT$ 1.3537 NT$ 1.4073 2.02 -1.57 Chung Hsu
Taiwan 11 Jul 2823.TW China Life Taiwan O O NT$ 26.2 NT$ 30 NT$ 30 0.0 NT$ 2.802 NT$ 2.1314 NT$ 2.121 NT$ 2.1315 32.11 0.00 Chung Hsu
Taiwan 13 Jul 2454.TW MediaTek N N NT$ 247 NT$ 225 NT$ 225 0.0 NT$ 15.4961 NT$ 16.0032 NT$ 15.003 NT$ 16.0043 3.29 -0.01 Randy Abrams
Note: Prices are as of 13 Jul 2016, US$. Entries are organised by changes in rating first, followed by that in target price and earnings. Source: Credit Suisse estimates
14 July 2016
Jump-Start 5
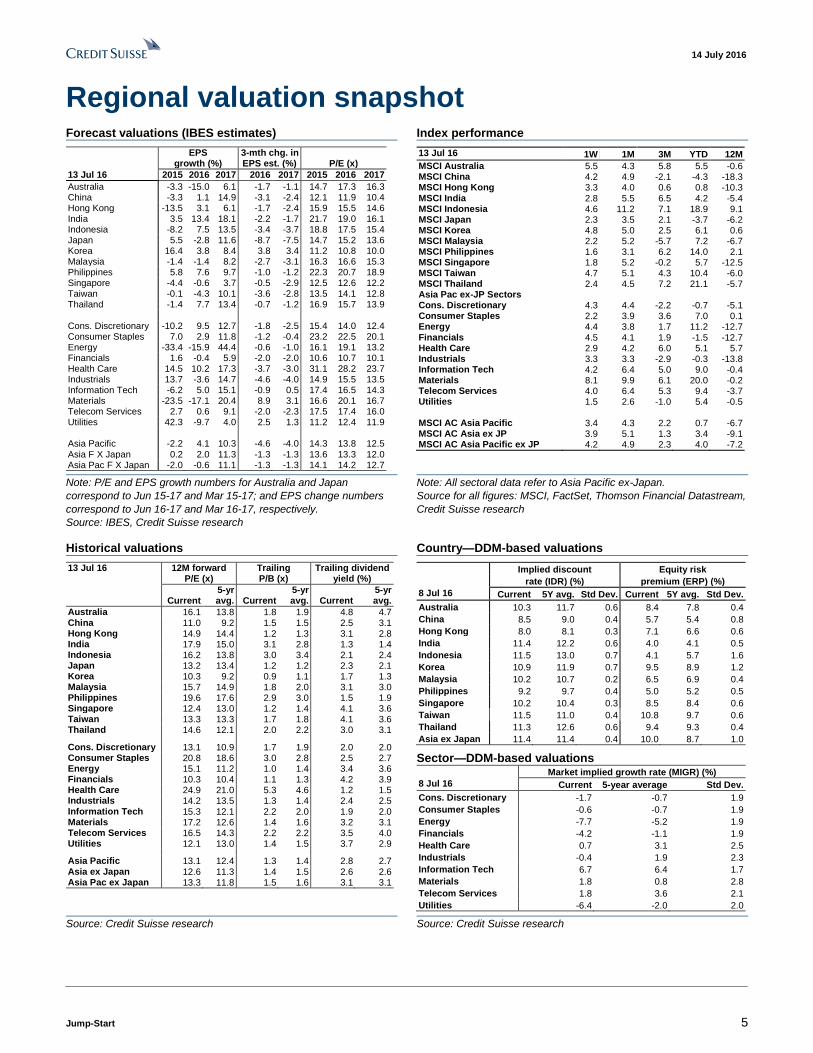
Regional valuation snapshot Forecast valuations (IBES estimates) Index performance
EPS 3-mth chg. in growth (%) EPS est. (%) P/E (x)
13 Jul 16 2015 2016 2017 2016 2017 2015 2016 2017
Australia -3.3 -15.0 6.1 -1.7 -1.1 14.7 17.3 16.3 China -3.3 1.1 14.9 -3.1 -2.4 12.1 11.9 10.4 Hong Kong -13.5 3.1 6.1 -1.7 -2.4 15.9 15.5 14.6 India 3.5 13.4 18.1 -2.2 -1.7 21.7 19.0 16.1 Indonesia -8.2 7.5 13.5 -3.4 -3.7 18.8 17.5 15.4 Japan 5.5 -2.8 11.6 -8.7 -7.5 14.7 15.2 13.6 Korea 16.4 3.8 8.4 3.8 3.4 11.2 10.8 10.0 Malaysia -1.4 -1.4 8.2 -2.7 -3.1 16.3 16.6 15.3 Philippines 5.8 7.6 9.7 -1.0 -1.2 22.3 20.7 18.9 Singapore -4.4 -0.6 3.7 -0.5 -2.9 12.5 12.6 12.2 Taiwan -0.1 -4.3 10.1 -3.6 -2.8 13.5 14.1 12.8 Thailand -1.4 7.7 13.4 -0.7 -1.2 16.9 15.7 13.9 Cons. Discretionary -10.2 9.5 12.7 -1.8 -2.5 15.4 14.0 12.4 Consumer Staples 7.0 2.9 11.8 -1.2 -0.4 23.2 22.5 20.1 Energy -33.4 -15.9 44.4 -0.6 -1.0 16.1 19.1 13.2 Financials 1.6 -0.4 5.9 -2.0 -2.0 10.6 10.7 10.1 Health Care 14.5 10.2 17.3 -3.7 -3.0 31.1 28.2 23.7 Industrials 13.7 -3.6 14.7 -4.6 -4.0 14.9 15.5 13.5 Information Tech -6.2 5.0 15.1 -0.9 0.5 17.4 16.5 14.3 Materials -23.5 -17.1 20.4 8.9 3.1 16.6 20.1 16.7 Telecom Services 2.7 0.6 9.1 -2.0 -2.3 17.5 17.4 16.0 Utilities 42.3 -9.7 4.0 2.5 1.3 11.2 12.4 11.9 Asia Pacific -2.2 4.1 10.3 -4.6 -4.0 14.3 13.8 12.5 Asia F X Japan 0.2 2.0 11.3 -1.3 -1.3 13.6 13.3 12.0 Asia Pac F X Japan -2.0 -0.6 11.1 -1.3 -1.3 14.1 14.2 12.7
13 Jul 16 1W 1M 3M YTD 12M
MSCI Australia 5.5 4.3 5.8 5.5 -0.6 MSCI China 4.2 4.9 -2.1 -4.3 -18.3 MSCI Hong Kong 3.3 4.0 0.6 0.8 -10.3 MSCI India 2.8 5.5 6.5 4.2 -5.4 MSCI Indonesia 4.6 11.2 7.1 18.9 9.1 MSCI Japan 2.3 3.5 2.1 -3.7 -6.2 MSCI Korea 4.8 5.0 2.5 6.1 0.6 MSCI Malaysia 2.2 5.2 -5.7 7.2 -6.7 MSCI Philippines 1.6 3.1 6.2 14.0 2.1 MSCI Singapore 1.8 5.2 -0.2 5.7 -12.5 MSCI Taiwan 4.7 5.1 4.3 10.4 -6.0 MSCI Thailand 2.4 4.5 7.2 21.1 -5.7 Asia Pac ex-JP Sectors Cons. Discretionary 4.3 4.4 -2.2 -0.7 -5.1 Consumer Staples 2.2 3.9 3.6 7.0 0.1 Energy 4.4 3.8 1.7 11.2 -12.7 Financials 4.5 4.1 1.9 -1.5 -12.7 Health Care 2.9 4.2 6.0 5.1 5.7 Industrials 3.3 3.3 -2.9 -0.3 -13.8 Information Tech 4.2 6.4 5.0 9.0 -0.4 Materials 8.1 9.9 6.1 20.0 -0.2 Telecom Services 4.0 6.4 5.3 9.4 -3.7 Utilities 1.5 2.6 -1.0 5.4 -0.5 MSCI AC Asia Pacific 3.4 4.3 2.2 0.7 -6.7 MSCI AC Asia ex JP 3.9 5.1 1.3 3.4 -9.1 MSCI AC Asia Pacific ex JP 4.2 4.9 2.3 4.0 -7.2
Note: P/E and EPS growth numbers for Australia and Japan
correspond to Jun 15-17 and Mar 15-17; and EPS change numbers
correspond to Jun 16-17 and Mar 16-17, respectively.
Source: IBES, Credit Suisse research
Note: All sectoral data refer to Asia Pacific ex-Japan.
Source for all figures: MSCI, FactSet, Thomson Financial Datastream,
Credit Suisse research
Historical valuations Country—DDM-based valuations
13 Jul 16 12M forward P/E (x)
Trailing P/B (x)
Trailing dividend yield (%)
Current 5-yr avg. Current
5-yr avg. Current
5-yr avg.
Australia 16.1 13.8 1.8 1.9 4.8 4.7 China 11.0 9.2 1.5 1.5 2.5 3.1 Hong Kong 14.9 14.4 1.2 1.3 3.1 2.8 India 17.9 15.0 3.1 2.8 1.3 1.4 Indonesia 16.2 13.8 3.0 3.4 2.1 2.4 Japan 13.2 13.4 1.2 1.2 2.3 2.1 Korea 10.3 9.2 0.9 1.1 1.7 1.3 Malaysia 15.7 14.9 1.8 2.0 3.1 3.0 Philippines 19.6 17.6 2.9 3.0 1.5 1.9 Singapore 12.4 13.0 1.2 1.4 4.1 3.6 Taiwan 13.3 13.3 1.7 1.8 4.1 3.6 Thailand 14.6 12.1 2.0 2.2 3.0 3.1 Cons. Discretionary 13.1 10.9 1.7 1.9 2.0 2.0 Consumer Staples 20.8 18.6 3.0 2.8 2.5 2.7 Energy 15.1 11.2 1.0 1.4 3.4 3.6 Financials 10.3 10.4 1.1 1.3 4.2 3.9 Health Care 24.9 21.0 5.3 4.6 1.2 1.5 Industrials 14.2 13.5 1.3 1.4 2.4 2.5 Information Tech 15.3 12.1 2.2 2.0 1.9 2.0 Materials 17.2 12.6 1.4 1.6 3.2 3.1 Telecom Services 16.5 14.3 2.2 2.2 3.5 4.0 Utilities 12.1 13.0 1.4 1.5 3.7 2.9 Asia Pacific 13.1 12.4 1.3 1.4 2.8 2.7 Asia ex Japan 12.6 11.3 1.4 1.5 2.6 2.6 Asia Pac ex Japan 13.3 11.8 1.5 1.6 3.1 3.1
Implied discount Equity risk
rate (IDR) (%) premium (ERP) (%)
8 Jul 16 Current 5Y avg. Std Dev. Current 5Y avg. Std Dev.
Australia 10.3 11.7 0.6 8.4 7.8 0.4
China 8.5 9.0 0.4 5.7 5.4 0.8
Hong Kong 8.0 8.1 0.3 7.1 6.6 0.6
India 11.4 12.2 0.6 4.0 4.1 0.5
Indonesia 11.5 13.0 0.7 4.1 5.7 1.6
Korea 10.9 11.9 0.7 9.5 8.9 1.2
Malaysia 10.2 10.7 0.2 6.5 6.9 0.4
Philippines 9.2 9.7 0.4 5.0 5.2 0.5
Singapore 10.2 10.4 0.3 8.5 8.4 0.6
Taiwan 11.5 11.0 0.4 10.8 9.7 0.6
Thailand 11.3 12.6 0.6 9.4 9.3 0.4
Asia ex Japan 11.4 11.4 0.4 10.0 8.7 1.0
Sector—DDM-based valuations Market implied growth rate (MIGR) (%)
8 Jul 16 Current 5-year average Std Dev.
Cons. Discretionary -1.7 -0.7 1.9
Consumer Staples -0.6 -0.7 1.9
Energy -7.7 -5.2 1.9
Financials -4.2 -1.1 1.9
Health Care 0.7 3.1 2.5
Industrials -0.4 1.9 2.3
Information Tech 6.7 6.4 1.7
Materials 1.8 0.8 2.8
Telecom Services 1.8 3.6 2.1
Utilities -6.4 -2.0 2.0
Source: Credit Suisse research
Source: Credit Suisse research
14 July 2016
Jump-Start 6
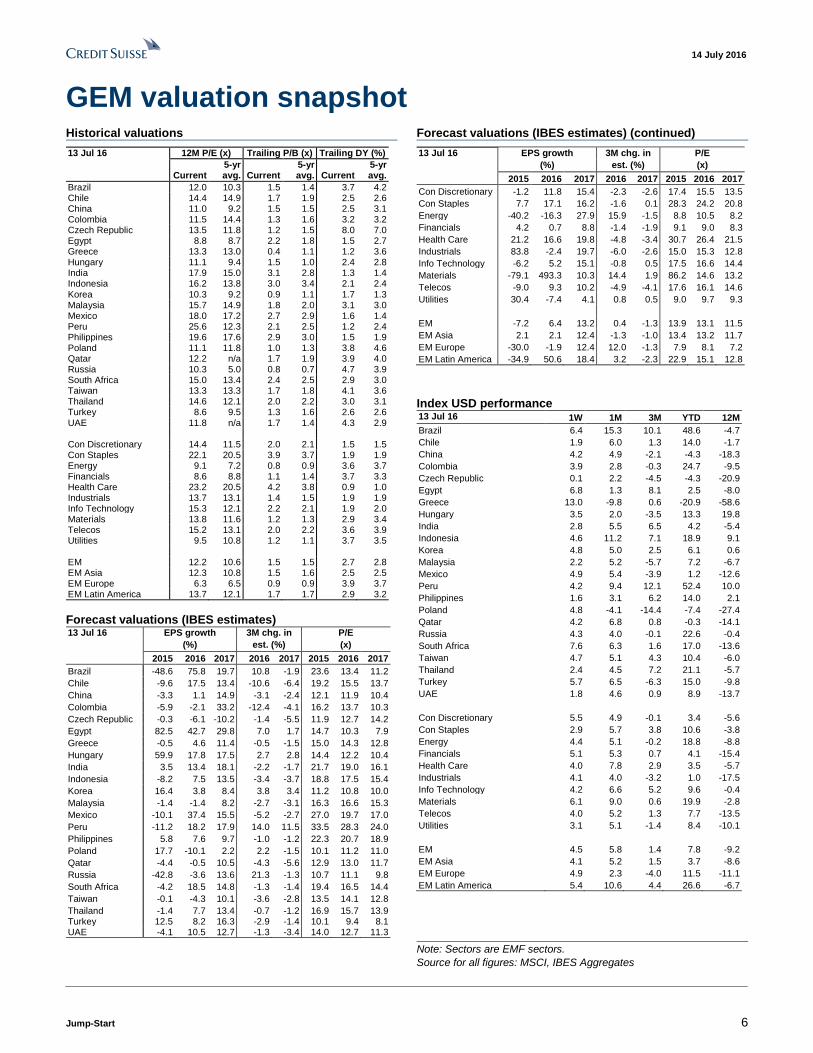
GEM valuation snapshot Historical valuations Forecast valuations (IBES estimates) (continued)
13 Jul 16 12M P/E (x) Trailing P/B (x) Trailing DY (%)
Current 5-yr
avg. Current 5-yr avg. Current
5-yr avg.
Brazil 12.0 10.3 1.5 1.4 3.7 4.2 Chile 14.4 14.9 1.7 1.9 2.5 2.6 China 11.0 9.2 1.5 1.5 2.5 3.1 Colombia 11.5 14.4 1.3 1.6 3.2 3.2 Czech Republic 13.5 11.8 1.2 1.5 8.0 7.0 Egypt 8.8 8.7 2.2 1.8 1.5 2.7 Greece 13.3 13.0 0.4 1.1 1.2 3.6 Hungary 11.1 9.4 1.5 1.0 2.4 2.8 India 17.9 15.0 3.1 2.8 1.3 1.4 Indonesia 16.2 13.8 3.0 3.4 2.1 2.4
Korea 10.3 9.2 0.9 1.1 1.7 1.3 Malaysia 15.7 14.9 1.8 2.0 3.1 3.0 Mexico 18.0 17.2 2.7 2.9 1.6 1.4 Peru 25.6 12.3 2.1 2.5 1.2 2.4 Philippines 19.6 17.6 2.9 3.0 1.5 1.9 Poland 11.1 11.8 1.0 1.3 3.8 4.6 Qatar 12.2 n/a 1.7 1.9 3.9 4.0 Russia 10.3 5.0 0.8 0.7 4.7 3.9 South Africa 15.0 13.4 2.4 2.5 2.9 3.0 Taiwan 13.3 13.3 1.7 1.8 4.1 3.6 Thailand 14.6 12.1 2.0 2.2 3.0 3.1 Turkey 8.6 9.5 1.3 1.6 2.6 2.6 UAE 11.8 n/a 1.7 1.4 4.3 2.9 Con Discretionary 14.4 11.5 2.0 2.1 1.5 1.5 Con Staples 22.1 20.5 3.9 3.7 1.9 1.9 Energy 9.1 7.2 0.8 0.9 3.6 3.7 Financials 8.6 8.8 1.1 1.4 3.7 3.3 Health Care 23.2 20.5 4.2 3.8 0.9 1.0 Industrials 13.7 13.1 1.4 1.5 1.9 1.9 Info Technology 15.3 12.1 2.2 2.1 1.9 2.0 Materials 13.8 11.6 1.2 1.3 2.9 3.4 Telecos 15.2 13.1 2.0 2.2 3.6 3.9 Utilities 9.5 10.8 1.2 1.1 3.7 3.5 EM 12.2 10.6 1.5 1.5 2.7 2.8 EM Asia 12.3 10.8 1.5 1.6 2.5 2.5 EM Europe 6.3 6.5 0.9 0.9 3.9 3.7 EM Latin America 13.7 12.1 1.7 1.7 2.9 3.2
Forecast valuations (IBES estimates) 13 Jul 16 EPS growth 3M chg. in P/E
(%) est. (%) (x)
2015 2016 2017 2016 2017 2015 2016 2017
Brazil -48.6 75.8 19.7 10.8 -1.9 23.6 13.4 11.2
Chile -9.6 17.5 13.4 -10.6 -6.4 19.2 15.5 13.7
China -3.3 1.1 14.9 -3.1 -2.4 12.1 11.9 10.4
Colombia -5.9 -2.1 33.2 -12.4 -4.1 16.2 13.7 10.3
Czech Republic -0.3 -6.1 -10.2 -1.4 -5.5 11.9 12.7 14.2
Egypt 82.5 42.7 29.8 7.0 1.7 14.7 10.3 7.9
Greece -0.5 4.6 11.4 -0.5 -1.5 15.0 14.3 12.8
Hungary 59.9 17.8 17.5 2.7 2.8 14.4 12.2 10.4
India 3.5 13.4 18.1 -2.2 -1.7 21.7 19.0 16.1
Indonesia -8.2 7.5 13.5 -3.4 -3.7 18.8 17.5 15.4
Korea 16.4 3.8 8.4 3.8 3.4 11.2 10.8 10.0
Malaysia -1.4 -1.4 8.2 -2.7 -3.1 16.3 16.6 15.3
Mexico -10.1 37.4 15.5 -5.2 -2.7 27.0 19.7 17.0
Peru -11.2 18.2 17.9 14.0 11.5 33.5 28.3 24.0
Philippines 5.8 7.6 9.7 -1.0 -1.2 22.3 20.7 18.9
Poland 17.7 -10.1 2.2 2.2 -1.5 10.1 11.2 11.0
Qatar -4.4 -0.5 10.5 -4.3 -5.6 12.9 13.0 11.7
Russia -42.8 -3.6 13.6 21.3 -1.3 10.7 11.1 9.8
South Africa -4.2 18.5 14.8 -1.3 -1.4 19.4 16.5 14.4
Taiwan -0.1 -4.3 10.1 -3.6 -2.8 13.5 14.1 12.8
Thailand -1.4 7.7 13.4 -0.7 -1.2 16.9 15.7 13.9 Turkey 12.5 8.2 16.3 -2.9 -1.4 10.1 9.4 8.1 UAE -4.1 10.5 12.7 -1.3 -3.4 14.0 12.7 11.3
13 Jul 16 EPS growth 3M chg. in P/E
(%) est. (%) (x)
2015 2016 2017 2016 2017 2015 2016 2017
Con Discretionary -1.2 11.8 15.4 -2.3 -2.6 17.4 15.5 13.5
Con Staples 7.7 17.1 16.2 -1.6 0.1 28.3 24.2 20.8
Energy -40.2 -16.3 27.9 15.9 -1.5 8.8 10.5 8.2
Financials 4.2 0.7 8.8 -1.4 -1.9 9.1 9.0 8.3
Health Care 21.2 16.6 19.8 -4.8 -3.4 30.7 26.4 21.5
Industrials 83.8 -2.4 19.7 -6.0 -2.6 15.0 15.3 12.8
Info Technology -6.2 5.2 15.1 -0.8 0.5 17.5 16.6 14.4
Materials -79.1 493.3 10.3 14.4 1.9 86.2 14.6 13.2
Telecos -9.0 9.3 10.2 -4.9 -4.1 17.6 16.1 14.6
Utilities 30.4 -7.4 4.1 0.8 0.5 9.0 9.7 9.3
EM -7.2 6.4 13.2 0.4 -1.3 13.9 13.1 11.5
EM Asia 2.1 2.1 12.4 -1.3 -1.0 13.4 13.2 11.7
EM Europe -30.0 -1.9 12.4 12.0 -1.3 7.9 8.1 7.2
EM Latin America -34.9 50.6 18.4 3.2 -2.3 22.9 15.1 12.8
Index USD performance 13 Jul 16 1W 1M 3M YTD 12M
Brazil 6.4 15.3 10.1 48.6 -4.7
Chile 1.9 6.0 1.3 14.0 -1.7
China 4.2 4.9 -2.1 -4.3 -18.3
Colombia 3.9 2.8 -0.3 24.7 -9.5
Czech Republic 0.1 2.2 -4.5 -4.3 -20.9
Egypt 6.8 1.3 8.1 2.5 -8.0
Greece 13.0 -9.8 0.6 -20.9 -58.6
Hungary 3.5 2.0 -3.5 13.3 19.8
India 2.8 5.5 6.5 4.2 -5.4
Indonesia 4.6 11.2 7.1 18.9 9.1
Korea 4.8 5.0 2.5 6.1 0.6
Malaysia 2.2 5.2 -5.7 7.2 -6.7
Mexico 4.9 5.4 -3.9 1.2 -12.6
Peru 4.2 9.4 12.1 52.4 10.0
Philippines 1.6 3.1 6.2 14.0 2.1
Poland 4.8 -4.1 -14.4 -7.4 -27.4
Qatar 4.2 6.8 0.8 -0.3 -14.1
Russia 4.3 4.0 -0.1 22.6 -0.4
South Africa 7.6 6.3 1.6 17.0 -13.6
Taiwan 4.7 5.1 4.3 10.4 -6.0
Thailand 2.4 4.5 7.2 21.1 -5.7
Turkey 5.7 6.5 -6.3 15.0 -9.8
UAE 1.8 4.6 0.9 8.9 -13.7
Con Discretionary 5.5 4.9 -0.1 3.4 -5.6
Con Staples 2.9 5.7 3.8 10.6 -3.8
Energy 4.4 5.1 -0.2 18.8 -8.8
Financials 5.1 5.3 0.7 4.1 -15.4
Health Care 4.0 7.8 2.9 3.5 -5.7
Industrials 4.1 4.0 -3.2 1.0 -17.5
Info Technology 4.2 6.6 5.2 9.6 -0.4
Materials 6.1 9.0 0.6 19.9 -2.8
Telecos 4.0 5.2 1.3 7.7 -13.5
Utilities 3.1 5.1 -1.4 8.4 -10.1
EM 4.5 5.8 1.4 7.8 -9.2
EM Asia 4.1 5.2 1.5 3.7 -8.6
EM Europe 4.9 2.3 -4.0 11.5 -11.1
EM Latin America 5.4 10.6 4.4 26.6 -6.7
Note: Sectors are EMF sectors.
Source for all figures: MSCI, IBES Aggregates

14 July 2016
Jump-Start 7
Operational and valuation data showing top ten VALUATION
Top 10 P/E (x) Top 10 P/B (x) Top 10 dividend yield (%)
FY1 FY1 FY1
1 6138.HK Harbin Bank 3.8 1 0119.HK Poly Prop 0.29 1 2455.TW VPEC 11.6
2 EGCH.KA Engro Corp 3.8 2 0845.HK Glorious 0.29 2 FAUF.KA Fauji Fertiliser 10.8
3 1685.HK Boer Power 3.9 3 086790.KS HFG 0.30 3 FATF.KA FATIMA 10.7
4 1055.HK CSA (H) 4.0 4 1133.HK Harbin Electric 0.30 4 5371.TWO Coretronic 10.3
5 1813.HK KWG 4.1 5 3323.HK CNBM 0.31 5 BJBR.JK Bank Jabar Banten 9.5
6 3618.HK CRCB 4.1 6 NOBG.SI Noble 0.32 6 NBPK.KA NBP 9.3
7 1628.HK Yuzhou 4.2 7 IOBK.BO IOB 0.32 7 2777.HK R&F 9.3
8 0486.HK Rusal 4.2 8 1136.HK TCC International 0.33 8 2548.TW Huaku 9.0
9 2777.HK R&F 4.3 9 0683.HK Kerry Prop 0.34 9 6176.TW Radiant 9.0
10 0884.HK CIFI 4.4 10 0123.HK Yuexiu Prop 0.34 10 8086.TWO AWSC 8.7
Top 10 sales growth (%) Top 10 gross margin (%) Top 10 EPS growth (%)
FY1 FY1 FY1
1 6462.TWO Egis Technology 289 1 0323.HK Maanshan (H) 822 1 0853.HK Microport 892
2 COE.N 51Talk 175 2 NOBG.SI Noble 766 2 IFAR.SI Indofood Agri 815
3 IDFB.BO IDFC Bank 155 3 SCMN.SI Sembcorp Marine 291 3 600019.SS Baosteel 696
4 PLC.PS PLC 145 4 COSC.SI COSCO Corp 231 4 PLC.PS PLC 626
5 0272.HK SOL 125 5 3673.TW TPK 222 5 HALC.BO Hindalco 614
6 034730.KS SK Holdings 120 6 010140.KS Samsung Heavy 151 6 005490.KS POSCO 611
7 002074.SZ Guoxuan High-Tech 119 7 0054.HK Hopewell 144 7 ITD.BK ITD 579
8 600900.SS Yangtze Power 111 8 0347.HK Angang Steel (H) 138 8 2331.HK Li Ning 579
9 0570.HK China TCM 106 9 009540.KS Hyundai Heavy 136 9 JKLC.BO JK Lakshmi 571
10 FGVH.KL FGV 94 10 042660.KS DSME 135 10 2686.HK AAG 558
Top 10 ROE (%) Top 10 Free Cashflow Yield (%) Top 10 Net cash/ equity (%)
FY1 FY1 FY1
1 EGCH.KA Engro Corp 52.8 1 COSC.SI COSCO Corp 146 1 DL.N CDEL 164
2 FATF.KA FATIMA 30.7 2 0884.HK CIFI 116 2 ZPIN.N Zhaopin 145
3 HALC.SI Halcyon Agri 30.6 3 0267.HK CITIC 115 3 8044.TWO PChome online 137
4 000625.SZ Changan Auto 30.5 4 0493.HK Gome 96 4 WB.OQ Weibo 136
5 CEB.PS Cebu Air 29.8 5 NOBG.SI Noble 69 5 MRTI.BO Maruti Suzuki 125
6 DIFu.BK DIF 24.4 6 1133.HK Harbin Electric 61 6 JD.OQ JD.com 125
7 LPN.BK L.P.N. 24.4 7 6176.TW Radiant 60 7 JUST.BO Just Dial 124
8 1055.HK CSA (H) 23.8 8 011210.KS Wia 55 8 COAL.BO Coal India 117
9 600674.SS Chuantou 23.5 9 0272.HK SOL 54 9 0493.HK Gome 117
10 AIRX.KL AirAsia X 22.7 10 0123.HK Yuexiu Prop 50 10 600835.SS SMEIC 116
RELATIVE PERFORMANCE
Top 10 performers Bottom 10 performers
1M% 1M%
1 MCP.PS Melco Crown (Phils) 61.6 1 300433.SZ LensTech -68.0
2 PNBK.BO PNB 46.0 2 2233.HK WCC -57.3
3 600188.SS Yanzhou Coal (A) 41.7 3 1836.HK Stella -31.3
4 VDAN.BO Vedanta 32.3 4 000002.SZ Vanke-A -29.3
5 1818.HK Zhaojin 30.5 5 2455.TW VPEC -22.4
6 SSI.PS SSI Group 30.4 6 8086.TWO AWSC -22.3
7 1898.HK CN Coal Energy (H) 30.4 7 1117.HK China Modern Dairy -22.0
8 2899.HK Zijin (H) 28.7 8 VNET.OQ 21 Vianet -19.3
9 2618.HK TCLC 26.7 9 DTAC.BK DTAC -18.5
10 1171.HK Yanzhou Coal (H) 26.7 10 2369.HK Coolpad -18.0
Note: Ratios based on Credit Suisse FY1 estimates. Source: Credit Suisse estimates

14 July 2016
Jump-Start 8
Credit Suisse macroeconomic forecasts
14 July 2016
Jump-Start 9
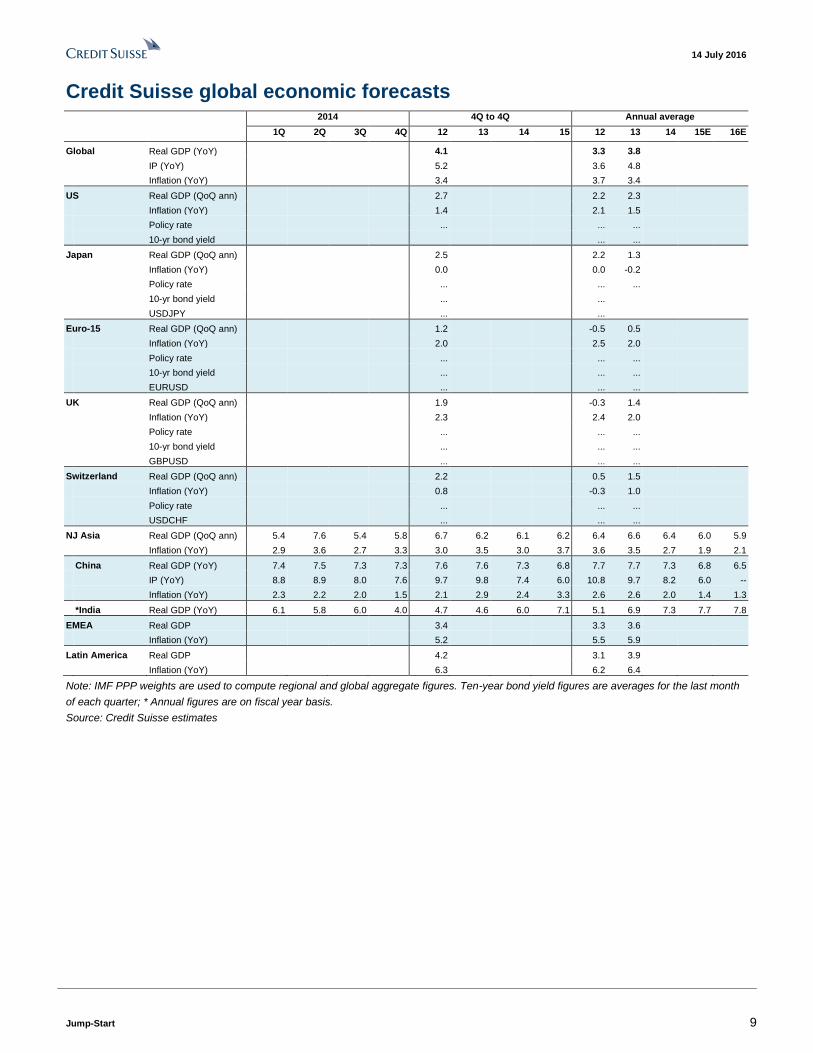
Credit Suisse global economic forecasts
2014 4Q to 4Q Annual average
1Q 2Q 3Q 4Q 12 13 14 15 12 13 14 15E 16E
Global Real GDP (YoY) 4.1 3.3 3.8 IP (YoY) 5.2 3.6 4.8 Inflation (YoY) 3.4 3.7 3.4
US Real GDP (QoQ ann) 2.7 2.2 2.3 Inflation (YoY) 1.4 2.1 1.5 Policy rate ... ... ... 10-yr bond yield ... ...
Japan Real GDP (QoQ ann) 2.5 2.2 1.3 Inflation (YoY) 0.0 0.0 -0.2 Policy rate ... ... ... 10-yr bond yield ... ... USDJPY ... ...
Euro-15 Real GDP (QoQ ann) 1.2 -0.5 0.5 Inflation (YoY) 2.0 2.5 2.0 Policy rate ... ... ... 10-yr bond yield ... ... ... EURUSD ... ... ...
UK Real GDP (QoQ ann) 1.9 -0.3 1.4 Inflation (YoY) 2.3 2.4 2.0 Policy rate ... ... ... 10-yr bond yield ... ... ... GBPUSD ... ... ...
Switzerland Real GDP (QoQ ann) 2.2 0.5 1.5 Inflation (YoY) 0.8 -0.3 1.0 Policy rate ... ... ... USDCHF ... ... ...
NJ Asia Real GDP (QoQ ann) 5.4 7.6 5.4 5.8 6.7 6.2 6.1 6.2 6.4 6.6 6.4 6.0 5.9
Inflation (YoY) 2.9 3.6 2.7 3.3 3.0 3.5 3.0 3.7 3.6 3.5 2.7 1.9 2.1
China Real GDP (YoY) 7.4 7.5 7.3 7.3 7.6 7.6 7.3 6.8 7.7 7.7 7.3 6.8 6.5 IP (YoY) 8.8 8.9 8.0 7.6 9.7 9.8 7.4 6.0 10.8 9.7 8.2 6.0 -- Inflation (YoY) 2.3 2.2 2.0 1.5 2.1 2.9 2.4 3.3 2.6 2.6 2.0 1.4 1.3
*India Real GDP (YoY) 6.1 5.8 6.0 4.0 4.7 4.6 6.0 7.1 5.1 6.9 7.3 7.7 7.8
EMEA Real GDP 3.4 3.3 3.6 Inflation (YoY) 5.2 5.5 5.9
Latin America Real GDP 4.2 3.1 3.9 Inflation (YoY) 6.3 6.2 6.4
Note: IMF PPP weights are used to compute regional and global aggregate figures. Ten-year bond yield figures are averages for the last month
of each quarter; * Annual figures are on fiscal year basis.
Source: Credit Suisse estimates

14 July 2016
Jump-Start 10
Credit Suisse Asian economic forecasts
Consensus
2013 2014 2015 2016E 2015 2016E 2017E
China Real GDP 7.7 7.3 6.9 6.5 6.9 6.5 6.3
Inflation 2.6 2.0 1.4 2.0 1.4 1.9 1.8
3-month interbank rate (year-end) 5.6 4.7 3.1 3.0 … … …
12m
Currency, per USD 6.78 6.20 6.43 6.84 … … …
Hong Kong Real GDP 3.1 2.5 2.4 1.3 2.4 1.7 1.9
Inflation 4.3 4.4 3.0 2.9 3.0 2.4 1.9
3-month HIBOR (year-end) 0.4 0.4 0.6 1.0 … … …
12m
Currency, per USD 7.80 7.76 7.75 7.80 … … …
India Real GDP 6.6 7.2 7.6 7.8 7.4 7.6 7.7
Inflation 9.5 9.9 4.9 5.2 5.0 5.1 5.1
Repo rate (year-end) 8.00 7.50 6.75 6.25 … … …
12m
Currency, per USD 71.00 62.50 66.30 70.00 … … …
Indonesia Real GDP 5.6 5.0 4.8 5.2 4.8 5.0 5.3
Inflation 6.4 6.4 6.4 4.0 6.4 4.3 4.9
Overnight SBI yield (year-end) 7.50 7.75 7.50 6.00 … … …
12m
Currency, per USD 14,200 12,440 13,795 13,800 … … …
Korea Real GDP 3.0 3.3 2.5 2.4 2.6 2.6 2.8
Inflation 1.3 1.3 0.7 1.0 0.7 1.2 1.8
Overnight call rate (year-end) 2.50 2.00 1.50 1.00 … … …
12m
Currency, per USD 1,245 1,100 1,170 1,210 … … …
Malaysia Real GDP 4.7 6.0 5.0 4.1 4.8 4.2 4.4
Inflation 2.1 3.1 2.1 2.2 2.1 2.5 2.7
Overnight Policy rate (year-end) 3.00 3.25 3.25 3.00 … … …
12m
Currency, per USD 4.25 3.50 4.29 4.23 … … …
Philippines Real GDP 7.1 6.2 5.9 6.2 5.8 5.9 5.9
Inflation 2.9 4.2 1.4 1.9 1.4 1.8 2.8
Overnight borrowing rate (year-end) 3.50 4.00 4.00 3.00 … … …
12m
Currency, per USD 47.50 44.62 47.17 47.00 … … …
Singapore Real GDP 4.7 3.3 2.0 1.3 2.0 1.7 2.2
Inflation 2.4 1.0 -0.5 -0.9 -0.5 -0.3 1.0
3m SIBOR (year-end) 0.4 0.5 1.2 1.3 … … …
12m
Currency, per USD 1.50 1.32 1.41 1.41 … … …
Taiwan Real GDP 2.2 3.9 0.7 1.2 0.9 1.3 2.1
Inflation 1.0 1.2 -0.3 0.4 -0.3 1.0 1.2
Overnight call rate (year-end) 0.4 0.4 0.3 0.2 … … …
12m
Currency, per USD 34.40 31.45 32.80 33.80 … … …
Thailand Real GDP 2.7 0.8 2.8 2.7 2.7 2.9 3.3
Inflation 2.2 1.9 -0.9 0.6 -0.9 0.4 1.9
Overnight Repo rate (year-end) 2.3 2.0 1.5 1.3 … … …
12m
Currency, per USD 36.50 32.90 35.99 36.20 … … …
* Through 2006, Thailand's policy rate was the 14-day repo rate
Source: CEIC, Asia Pacific Consensus Forecasts, Credit Suisse estimates

14 July 2016
Jump-Start 11
Real interest rates Real policy rates
1
Annual forecast
Current 2015 2016(F) 2017(F)
China 2.45 1.60 1.13 1.13
Hong Kong -2.05 -1.83 -0.79 -0.01
India 0.73 1.65 1.05 1.05
Indonesia 3.05 2.69 2.13 1.49
Korea 0.45 0.44 -0.27 -0.52
Malaysia 1.00 0.65 1.10 0.50
Philippines 1.10 3.01 0.50 0.10
Singapore 1.73 1.91 2.25 1.85
Taiwan 0.48 -0.08 -0.53 -1.32
Thailand 1.12 2.37 -0.35 -0.56
1 NJA Policy Rates: China=End Year Lending Rate, Hong kong-3 month interbank rate, India- Repo rate,
Indonesia-Overnight Rate, Korea- Base rate, Malaysia-overnight Rate, Philippines-Reverse repo rate,
Singapore-3 month interbank rate, Taiwan: Discount rate, Thailand- Overnight repo rate
2 NJA stands for Non-Japan Asia
Source: Central banks, CEIC, Statistical agencies, Credit Suisse
14 July 2016
Jump-Start 12
Top stories from Credit Suisse research last week

14 July 2016
Jump-Start 13
China Property Sector -------------------------- Assuming Coverage with MARKET WEIGHT New report: A new chapter—Go for quality Alvin Wong / Research Analyst / 852 2101 6486 / [email protected] Kelvin Tam, CFA / Research Analyst / 852 2101 6582 / [email protected] Jizhou Dong / Research Analyst / 852 2101 6538 / [email protected]
● We assume coverage of the China Property Sector (6 initiations and 16 assumptions) with a MARKET WEIGHT view and expect the overall sector to be range-bound amid a stable sales outlook in 2H16-17E. In our view, the policy direction itself is no longer sufficient to drive sector performance and we therefore adopt a bottom-up approach to search for "quality" developers. Full report.
● Sustainable sector rally existed only when developers generated positive FCF on aggregate. Bankruptcy is always a major concern. With this, developers have to show their sincerity to strengthen their balance sheets by improving their cashflow positions.
● The strategy of aiming for market-share gain (by contracted sales) but neglecting the profitability is not an ideal business model. We prefer developers to consistently report above sector-average earnings growth so as to gain the "earnings" share.
● We have non-consensus UNDERPERFORM calls on Vanke-H (management overhang) and Wanda (risk of privatisation failure). Our preferred names include COLI, CRL, Longfor, R&F, CIFI and Yuzhou.
Figure 1: We expect a range-bound market over 2H16-17
-70%
-60%
-50%
-40%
-30%
-20%
-10%
0%
10%
-20%
-10%
0%
10%
20%
30%
40%
50%
60%
Jan-09 Jan-10 Jan-11 Jan-12 Jan-13 Jan-14 Jan-15 Jan-16
Yoy change in commodity property GFA sold (LHS) NAV discount (RHS)
1 2 3 4 5 1 2 3 4 5 1 2
Source: CEIC, the BLOOMBERG PROFESSIONAL™ service, Credit Suisse estimates
Strength to rise above policy
We forecast commodity property sales growth of 10.4% and 1% YoY in 2016E and 2017E, respectively. This leads us to the midway between moderation and stabilisation phase of a property cycle where we see low chance of a sustainable sector rally. Looking forward, the overall policy stance should remain supportive amid a slowing economy, yet we have been seeing rising policy risks across first-tier cities and some second-tier cities. In our view, the policy direction itself is no longer sufficient to drive the sector performance and this requires a bottom-up investment approach for stock selection.
Positive free cashflow is the real key
Two sustainable sector rallies appeared in Aug-08–Jul-09 and Feb-12–Feb-13 only when developers generated positive FCF on aggregate by slowing down both new-starts and land purchases. Looking into 2H16E, most developers should focus on destocking, yet the overall sector's FCF will be dragged by several aggressive developers like Evergrande, CG and Sunac. Bankruptcy is always a major investment concern. Developers have to show their sincerity to strengthen their B/S by improving their cashflow positions.
Figure 2: Positive FCF is the key driver of sector outperformance
-50
0
50
100
150
200
Jan-05 Jan-06 Jan-07 Jan-08 Jan-09 Jan-10 Jan-11 Jan-12 Jan-13 Jan-14 Jan-15 Jan-16
60%
70% 3%
CS China Property H Shares Index ––– (tightening) ––– (easing) ––– (tightening/easing)+ / - indicate sector's FCF, which we expect to be negative in 2016E
Source: the BLOOMBERG PROFESSIONAL™ service, Credit Suisse research
Earnings share gain is a new theme
Rather than simply looking at developers' top-line numbers (i.e., contracted sales), it is even more important to focus on their bottom-line figures (i.e., profitability). We have been seeing many volume-driven developers such as Evergrande and Sunac gaining market share (by contracted sales) at the expense of declining profits and deteriorating balance sheets; while balanced-growth developers such as COLI and CRL have consistently gained market share (by core profits) with stable margins and healthy net gearings.
Figure 3: China property—2016E market-share gain
16.2%1.0%
6.4%21.2%
11.1%11.8%
0.9%3.7%
6.2%0.8%
5.7%2.0%2.0%2.0%2.1%
0.0%1.0%
2.3%1.4%
0.5%1.7%
Market share by core profit 2016E
17.2%12.8%
10.1%9.9%
6.1%6.1%
4.8%4.1%4.0%3.9%3.6%
2.8%2.7%2.6%
1.8%1.7%1.5%1.3%1.1%1.1%0.8%
Vanke-H
Evergrande
CG
COLI
CRL
Wanda
Sunac
Shimao
Longfor
Greentown
R&F
Agile
Sino-Ocean
CIFI
Jinmao
Poly Prop
Yuexiu Prop
KWG
Yuzhou
COGO
SOL
Market share by presales 2016E
Note: We expect Poly Prop to report core profit loss in FY16E. Source: Company data, Credit Suisse research
Non-consensus Underperforms: Vanke-H and Wanda
Unless there is any significant change in either GDP or policy direction, we believe the current sector NAV discount of 34% suggests limited upside potential, compared to an average NAV discount of 29% over the last moderation/stabilisation period (i.e., Mar-13–Dec-13). In our view, developers' share price performance will be differentiated from their individual business and operating performance. In addition to the above-mentioned key investment themes (i.e., positive cashflow and earnings share gain), we also study developers' land bank exposure which is a traditional way to gauge their quality. Our non-consensus UNDERPERFORM calls include Vanke-H (management overhang) and Wanda (risk of privatisation failure) while our preferred names include COLI, CRL, Longfor, R&F, CIFI and Yuzhou.
Extract from the Asian Daily, 12 July 2016.

14 July 2016
Jump-Start 14
India Automobiles Sector ------------------------------------------------------------------------------------ New report: Mind the (regulatory) gap Jatin Chawla / Research Analyst / 91 22 6777 3719 / [email protected] Akshay Saxena / Research Analyst / 91 22 6777 3825 / [email protected]
● India is going on a path of unprecedented tightening of its emissions and safety standards. We believe the market has re-rated auto stocks on possible GST implementation but it is not focusing on the regulatory headwinds ahead. Full report
● In order to assess the impact, we focus on (1) cost increases, and (2) the ability to pass them on. 2Ws will face cost increases of ~12-15%, in our view; given the competitive intensity, they also have the least ability to pass them on fully. Given the significant reduction required in emissions of diesel vehicles, CVs (~20% increase) and diesel PVs (~15%) have to incur sizeable cost of compliance.
● GST implementation would result in a ~5-7% benefit for almost all segments within autos and should help offset some of the negative impact. Overall, gasoline PVs are best positioned as they will have the least price increases over the next four years.
● We still prefer Maruti as our top pick and raise TP to Rs4,810 (from Rs4,540); downgrade Hero Motocorp to UNDERPERFORM (~15% downside); and stay UNDERPERFORM on TVS, as it will be difficult for it to show margin improvement amid such cost increases.
Figure 1: Gasoline PVs to see the least adverse impact from regulations
-1%
2% 2%
-2% -2%
5%
8%
12%
0%
8%
-4%
0%
4%
8%
12%
2W's (<125cc) 2W (>125 cc) CV's PV's (Gasoline) PV's (diesel)
Price increase needed by 2019 (BS-IV + Safety net of GST benefit)
Total by 2020 (BS-VI additional) Source: Company data, ICCT, Credit Suisse estimates
2Ws: Compliance costs much higher than GST benefit. For 2Ws, we expect the regulatory cost increases to offset the entire 6% price reduction that can happen from the GST. Movement to BS-IV emission standards from Apr-2017 should result in a ~2% price increase. 2Ws have generally had lenient emission standards when compared to cars but with BS-VI being implemented from Apr-2020, 2Ws also have very tough standards to meet. This would entail a further ~6% increase in prices. Similarly, on the safety side too, India
is taking a big lead when compared to ASEAN nations by making ABS (Anti-lock braking system) compulsory for >125cc vehicles and CBS (Combined braking system) compulsory for <125cc vehicles, which would mean a further 6%/3% price increase.
CVs: Highest cost impact from regulations. Commercial vehicles face the biggest cost increase going forward, primarily on higher emission compliance costs. BS-IV implementation from Apr-2017 will result in a ~7% price increase. Further going forward with BS-VI implementation in Apr-2020; CVs would need a further ~10% price increase. The safety compliance has already happened with the ABS implementation in Oct-2015. For CVs, price increases don’t tend to impact demand very significantly as that is more linked to freight demand. However, GST implementation can lead to an increase in the freight carrying capacity as truck travel becomes more efficient and hence could negatively impact demand. If the proposed voluntary scrappage plan were to be implemented it could take out some truck capacity from the system, but it has implementation challenges.
PVs: Gasoline vehicles are best placed. PVs by and large are already compliant with BS-IV emission norms and hence emission-related cost increases will happen only with BS-VI in Apr-2020. Even then, the price increase on gasoline vehicles will not be very significant. However, diesel vehicles will need a ~10% increase. On the safety side too, the implementation in cars is later than that in 2Ws and CVs. While new vehicles need to comply with both the frontal and lateral crash norms by Oct-2017, existing vehicles need to do so only by Oct-2018 for lateral collisions and Oct-2019 for frontal collisions.
Figure 2: Timeline for the implementation of emission norms in the country Norm Deadline Segment Technology and required price increase
BS-IV Apr-17 2W Improving oxidation catalyst (~2% increase) BS-IV Apr-17 CV Common rail fuel injection (~7% increase) BS-IV Apr-17 PV Already Compliant BS-VI Apr-20 2W Fuel injection technology (~6% increase) BS-VI Apr-20 CV After-treatment system (~10% increase) BS-VI Apr-20 PV Small change in gasoline, big in diesel
Source: MORTH, company data, ICCT, Credit Suisse
Figure 3: Timeline for the implementation of safety norms in the country Segment Deadline Regulation and required price increase
New 2W models Apr-18 ABS for >125cc (~6%), CBS for <125cc (~3%) All 2Ws Apr-19 ABS for >125cc, CBS for <125cc CVs Oct-15 ABS implementation already done New PV models Oct-17 Crash norms complaint (4-5% price increase in total) All PVs Oct-18 Lateral collision crash norm All PVs Oct-19 Fully complaint with crash norm (Frontal collision also)
Source: MORTH, company data, Credit Suisse
Valuation metrics
Rating TP Up/dn Div. yld ROE P/B Company Ticker (prev. Price chg to TP Year EPS chg (%) EPS EPS grth (%) P/E (x) (%) (%) (x)
rating) Local Target (%) (%) T T+1 T+2 T+1 T+2 T+1 T+2 T+1 T+2 T+1 T+1 T+1
Maruti Suzuki MRTI.BO O (O) 4,370 4,810 (4,540) 5.9 10 03/15 0 0 152 205 23 35 28.8 21.3 0.9 18.1 4.9 Hero Motocorp HROM.BO U (N) 3,244 2,750 (2,590) 6.2 (15) 03/15 0 0 157 170 23 8 20.7 19.1 2.3 43.2 8.1
Source: Company data, Credit Suisse estimates
Extract from the Asian Daily, 14 July 2016.

14 July 2016
Jump-Start 15
China Internet Sector ------------------------------------------------------------------------------------------ New report: Express Delivery—"Served in China"
Evan Zhou / Research Analyst / 852 2101 6745 / [email protected] Monica Chen / Research Analyst / 852 2101 7150 / [email protected]
● Express delivery service is riding the wave of e-commerce and O2O services boom, and has become an integral part of China's service infrastructure that has enhanced people's everyday life. Full report.
● Profitable growth. Third-party express delivery companies such as STO, ZTO and S.F. Express are the largest beneficiaries of the boom. Our express company performance matrix and comparison analysis on various express delivery players show unit economic efficiency is the key driver for profitability.
● From days to minutes. The emergence of high-frequency delivery is taking the infrastructure capability to the next level – i.e., to enable delivery of time-sensitive merchandises and services in minutes. Efficiency level for current high-frequency players still needs time to reach the ideal level.
● We see third-party express companies improvement to eclipse the speed and quality advantage of in-house delivery of VIPS (N, TP $12.5) and JD (N, TP $20.8). Incremental operating leverage from fulfilment expense will be more limited, and higher fulfilment cost due to BABA's Tmall Supermarket will drag near-term profitability.
Figure 1: Highlights of leading express delivery players SF STO YTO Yunda EMS
Revenue (Rmb mn) 48,101 7,711 11,747 5,053 25,885 GPM% 19.8% 16.6% 13.4% 31.1% 19.0% NPM% 2.3% 9.9% 6.1% 10.6% 3.5% Delivery volume (bn) 1.70 2.6 3.03 2.17 n.a. Growth CAGR (10-15) 32% 40% 61% 63% n.a. Mkt share % 8.3% 13.6% 14.6% 10.7% n.a. # of networks 45,000 10,000 24,000 20,000 45,000 # of vehicles 15,000 n.a. 32,000 28,400 10,000 # of employees 120,000 200,000 220,000 100,000 100,000 County coverage 88% 90% 94% 95% 100%
Source: Company data. Note: All metrics as of end-2015, except those for EMS which are as of end-2011.
China express delivery service is riding the wave of e-commerce and O2O services boom: The growth of China's overall logistics growth will continue to slow down due to macro headwinds, in our view. But the highway delivery segment – as one of its main sub-sectors, is expanding with decent growth, driven by the boom of e-commerce business. Among that, express and LTL are the growth layers, which accounted for 5%/40% of the highway delivery market, respectively. We expected continuing consolidation and mutual penetration of express and LTL players.
The LTL market is fragmented in China, with 90% occupied by self-employed vehicles. We expect to see an "Uber-style" business model emerging among LTL players and market consolidation should drive up efficiency and improve standardisation of service quality.
Express delivery – profitable growth. Driven by increasing penetration of online shopping, China's express delivery volume recorded more than 50% CAGR in the past five years, with aggregate volume at ~21 billion orders in 2015, within which at least 60% are the e-commerce related parcels. We expect the volume to reach 50 billion by 2020 and third-party express delivery companies such as STO, ZTO and S.F. Express can benefit the most from the e-commerce
boom. We analysed the performance of various express companies based on comparison of five metrics: network coverage, service quality, delivery speed, price attractiveness and value-added service and showed that unit economic efficiency is the key driver for profitability.
Meanwhile, e-commerce retailers are increasingly adopting in-house logistics capacity and delivery teams. We foresee both in-house and third-party logistics providers will continue to invest in the last mile infrastructure and resources, and to explore more innovative and efficient options to improve efficiency and service experience.
High-frequency delivery – from days to minutes. Apart from purchasing goods from e-commerce retailers, consumers also increasingly use O2O services that require on-demand intra-city delivery within hours. In-house delivery capacities are a competitive edge for most major O2O food take-out platforms. Meanwhile, crowdsourcing delivery service, a more cost-effective and flexible approach to address the long-tail demand, has also gained traction in volume ramp-up. The recent merger of Dada and JD Daojia, the two frontrunners in this sector, is expected to increase cost synergies and create another major player in this segment.
Figure 2: Comps for e-commerce in-house delivery peers Close Target Mkt cap PE
Company Ticker Ccy price Rating price (US$ mn) 2015 2016 2017
Alibaba BABA.N USD 79.35 O 100.0 199,361 38.0x 31.7x 24.9x JD.com JD.OQ USD 20.57 N 20.8 29,959 N/A N/A N/A Vipshop VIPS.N USD 11.81 N 12.5 6,742 22.7x 17.8x 13.9x Suning 002024.SZ CNY 10.88 O 22.5 15,119 N/A N/A N/A
Average 30.3x 24.7x 19.4x
Note: * Price as of 7 July, 2016; Source: Company data, Reuters, Credit Suisse estimates.
For listed B2C e-commerce players with in-house delivery teams, we see the network expansion/service quality improvement of third-party express delivery companies gradually eclipsing the advantage of speed and quality of in-house delivery teams of JD (N, TP $20.8) and VIPS (N, TP $12.5).
Fulfilment expense is the biggest and the most crucial cost item for all B2C e-commerce players. Efficiency improvement in fulfilment has been driving the profitability of e-commerce players such as JD, VIPS and BZUN in the past years. But incremental help on overall margin improvement will be more limited down the road. We estimate a 20 bp/30 bp improvement in fulfilment as a percentage of revenue for JD/VIPS in 2017E.
The ramp-up of food and grocery categories from Alibaba's Tmall Supermarket is likely to drive higher fulfilment cost and drag profitability incrementally in the coming quarters.
The author of this report wishes to acknowledge the contributions made by Dan Zhao, an employee of Evalueserve Research Hong Kong Ltd, a third-party provider to Credit Suisse of research support services.
Extract from the Asian Daily, 11 July 2016.

14 July 2016
Jump-Start 16
APAC Equity Strategy ----------------------------------------------------------------------------------------- New report: Is MSCI China's ROE bottoming? Sakthi Siva / Research Analyst / 65 6212 3027 / [email protected] Kin Nang Chik / Research Analyst / 852 2101 7482 / [email protected]
● After five years during which MSCI Asia ex-Japan (MXASJ) went nowhere (amid trading rallies) as MSCI China's ROE slowed from a peak of 17.2% in November 2011 to 12.4% currently, we highlight that MSCI China ROE has been flat at 12.4% for the last three months. The key question for investors is whether these are the first signs that MSCI China ROE is finally bottoming.
● As discussed in our report of 12 April China PPI leads ROE?, we believe the recent uptick in the China PPI (from -5.9% YoY in December 2015 to -2.6% in June 2016) acts as a proxy for commodity prices and leads China's ROE.
● Figure 2 highlights that MSCI China ROE ex Financials and Energy bottomed at 11.8% in November 2015 and has since risen to 13%. Figure 3 highlights that MSCI China ROE ex Financials (given rising NPLs) has risen from a low of 10.1% to 10.8% currently.
● While our biggest Overweight markets are Korea (the only market with rising ROE in the Asia Pacific) and Taiwan (the only market sitting on net cash), we reiterate our modest 1% Overweight on MSCI China given these early signs of ROE bottoming. Full report.
Figure 1: MSCI China ROE
11.0%
12.0%
13.0%
14.0%
15.0%
16.0%
17.0%
18.0%
Dec-05 Dec-07 Dec-09 Dec-11 Dec-13 Dec-15
MSCI China - ROE
12.4% now
High 17.2% Nov 2011
Source: MSCI
MSCI China ROE flat at 12.4% for three consecutive months
After five years during which MSCI Asia ex-Japan (MXASJ) went nowhere (amidst trading rallies) as MSCI China's ROE slowed from a peak of 17.2% in November 2011 to 12.4% currently, we highlight that MSCI China ROE has been flat at 12.4% for the last three months. The key question for investors is whether these are the first signs that MSCI China ROE is finally bottoming.
We believe Yes
As discussed in our report of 12 April China PPI leads ROE?, we believe the recent uptick in the China PPI (from -5.9% year-on-year in December 2015 to -2.6% in June 2016) acts as a proxy for commodity prices and leads China's ROE. Figure 2 highlights that MSCI China ROE ex Financials and Energy bottomed at 11.8% in November 2015 and has since risen to 13%. Figure 3 highlights that MSCI China ROE ex Financials (given rising NPLs) has risen from a low of 10.1% to 10.8% currently.
Reiterate our modest 1% Overweight on MSCI China
While our biggest Overweight markets are Korea (the only market with rising ROE in the Asia Pacific) and Taiwan (the only market sitting on net cash), we reiterate our modest 1% Overweight on MSCI China given these early signs of ROE bottoming.
Figure 2: MSCI China ex Financials ex Energy ROE
9.0%
10.0%
11.0%
12.0%
13.0%
14.0%
15.0%
16.0%
17.0%
18.0%
Dec-05 Dec-07 Dec-09 Dec-11 Dec-13 Dec-15
MSCI China ex Financials & Energy - ROE
13.0% now
Low 11.8%
Source: MSCI
Figure 3: MSCI China ex Financials ROE
8.0%
9.0%
10.0%
11.0%
12.0%
13.0%
14.0%
15.0%
16.0%
17.0%
18.0%
Dec-05 Dec-07 Dec-09 Dec-11 Dec-13 Dec-15
MSCI China ex Financials - ROE
10.8% now
Low 10.1%
Source: IBES
Extract from the Asian Daily, 12 July 2016.
14 July 2016
Jump-Start 17
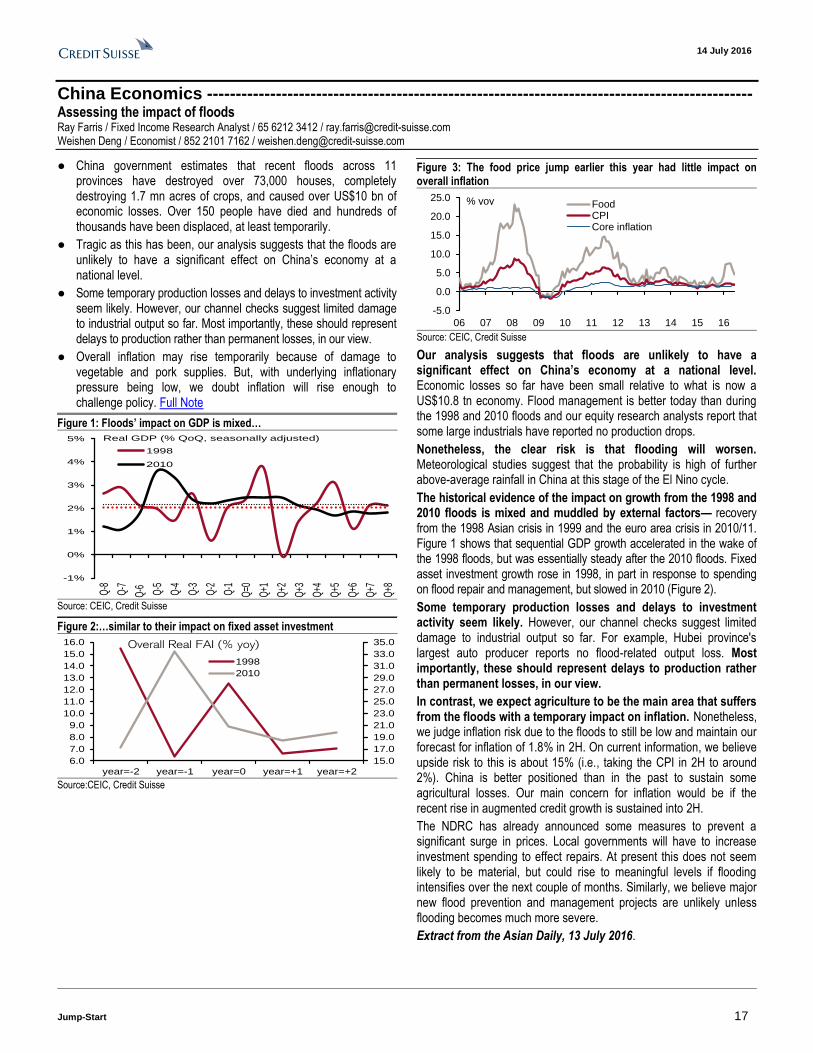
China Economics ----------------------------------------------------------------------------------------------- Assessing the impact of floods Ray Farris / Fixed Income Research Analyst / 65 6212 3412 / [email protected] Weishen Deng / Economist / 852 2101 7162 / [email protected]
● China government estimates that recent floods across 11 provinces have destroyed over 73,000 houses, completely destroying 1.7 mn acres of crops, and caused over US$10 bn of economic losses. Over 150 people have died and hundreds of thousands have been displaced, at least temporarily.
● Tragic as this has been, our analysis suggests that the floods are unlikely to have a significant effect on China’s economy at a national level.
● Some temporary production losses and delays to investment activity seem likely. However, our channel checks suggest limited damage to industrial output so far. Most importantly, these should represent delays to production rather than permanent losses, in our view.
● Overall inflation may rise temporarily because of damage to vegetable and pork supplies. But, with underlying inflationary pressure being low, we doubt inflation will rise enough to challenge policy. Full Note
Figure 1: Floods’ impact on GDP is mixed…
-1%
0%
1%
2%
3%
4%
5%
Q-8
Q-7
Q-6 Q-5
Q-4
Q-3
Q-2
Q-1
Q=0
Q+1
Q+2
Q+3
Q+4
Q+5
Q+6
Q+7
Q+8
1998
2010
Real GDP (% QoQ, seasonally adjusted)
Source: CEIC, Credit Suisse
Figure 2:…similar to their impact on fixed asset investment
15.0
17.0
19.0
21.0
23.0
25.0
27.0
29.0
31.0
33.0
35.0
6.0
7.0
8.0
9.0
10.0
11.0
12.0
13.0
14.0
15.0
16.0
year=-2 year=-1 year=0 year=+1 year=+2
1998
2010
Overall Real FAI (% yoy)
Source:CEIC, Credit Suisse
Figure 3: The food price jump earlier this year had little impact on overall inflation
-5.0
0.0
5.0
10.0
15.0
20.0
25.0
06 07 08 09 10 11 12 13 14 15 16
FoodCPICore inflation
% yoy
Source: CEIC, Credit Suisse
Our analysis suggests that floods are unlikely to have a significant effect on China’s economy at a national level. Economic losses so far have been small relative to what is now a US$10.8 tn economy. Flood management is better today than during the 1998 and 2010 floods and our equity research analysts report that some large industrials have reported no production drops.
Nonetheless, the clear risk is that flooding will worsen. Meteorological studies suggest that the probability is high of further above-average rainfall in China at this stage of the El Nino cycle.
The historical evidence of the impact on growth from the 1998 and 2010 floods is mixed and muddled by external factors— recovery from the 1998 Asian crisis in 1999 and the euro area crisis in 2010/11. Figure 1 shows that sequential GDP growth accelerated in the wake of the 1998 floods, but was essentially steady after the 2010 floods. Fixed asset investment growth rose in 1998, in part in response to spending on flood repair and management, but slowed in 2010 (Figure 2).
Some temporary production losses and delays to investment activity seem likely. However, our channel checks suggest limited damage to industrial output so far. For example, Hubei province's largest auto producer reports no flood-related output loss. Most importantly, these should represent delays to production rather than permanent losses, in our view.
In contrast, we expect agriculture to be the main area that suffers from the floods with a temporary impact on inflation. Nonetheless, we judge inflation risk due to the floods to still be low and maintain our forecast for inflation of 1.8% in 2H. On current information, we believe upside risk to this is about 15% (i.e., taking the CPI in 2H to around 2%). China is better positioned than in the past to sustain some agricultural losses. Our main concern for inflation would be if the recent rise in augmented credit growth is sustained into 2H.
The NDRC has already announced some measures to prevent a significant surge in prices. Local governments will have to increase investment spending to effect repairs. At present this does not seem likely to be material, but could rise to meaningful levels if flooding intensifies over the next couple of months. Similarly, we believe major new flood prevention and management projects are unlikely unless flooding becomes much more severe.
Extract from the Asian Daily, 13 July 2016.

14 July 2016
Jump-Start 18
China Economics ----------------------------------------------------------------------------------------------- Downhill from here Ray Farris / Fixed Income Research Analyst / 65 6212 3412 / [email protected] Weishen Deng / Economist / 852 2101 7162 / [email protected] Dong Tao / Economist / 852 2101 7469 / [email protected]
● We revise down our 2016 GDP growth forecast to 6.5% from previous forecast of 6.6%. We forecast that China's GDP growth will slow from about 6.6% (saar) in 2Q to 6.2% in 4Q before new stimulus drives a bounceback to 6.5% in 2017.
● Private investment growth, ex-real estate, has fallen sharply, government spending is set to slow sharply absent new fiscal stimulus, and the export outlook has deteriorated.
● The government is likely to continue to allow some of the balance of payments pressure to clear through CNY depreciation. We forecast USDCNY to rise to about 6.84 by end-2016 and 7.11 by end-2017.
● Monetary policy is likely to play only a passive role in any stimulus. We expect China’s reserve requirement ratios (RRR) to be cut by 100 bp. However, we believe continuing pressure on the CNY greatly limits the scope for lower interest rates. Full report.
Figure 1: Summary of forecasts Current Previous
14 15E 16F 17F 16F 17F
GDP 7.3 6.9 6.5 6.5 6.6 6.5 CPI inflation (yav) 2.0 1.4 2.0 1.7 2.0 1.7 One-year lending rate (%, ye) 5.60 4.35 4.35 4.35 3.60 3.60 M2 money supply (ye) 12.2 13.3 12.0 12.5 13.0 12.5 Exports (% YoY) 6.0 -2.9 -5.5 2.0 4.5 5.0 Imports (% YoY ) 0.5 -14.2 -10.0 0.0 -5.0 1.5 Trade balance (US$ bn) 383 593 636 679 780 875 Current account (as a % of GDP) 2.7 3.1 2.7 2.6 3.2 2.7 USDCNY exchange rate (ye) 6.20 6.43 6.84 7.11 6.72 6.98
Source: CEIC, Credit Suisse
We revise down our 2016 GDP growth forecast to 6.5% from previous forecast of 6.6%. We forecast that China's GDP growth will slow from about 6.6% (saar) in 2Q to 6.2% in 4Q before new stimulus drives a bounceback to 6.5% in 2017. Private investment growth, ex-real estate, has fallen sharply, government spending is set to slow sharply absent new fiscal stimulus, and the export outlook has deteriorated.
Growth momentum has clearly weakened and become more dependent on SOEs and government spending. This reflects the continuing deterioration in investment growth, despite government stimulus. In contrast, real estate investment is likely to rise through 3Q, supporting growth, but even this sector should taper into 4Q. Stronger infrastructure investment supported 1Q growth, but will likely slow in 2H. To be sure, fiscal policy is programmed to tighten in 2H. Official budget spending is planned to rise 2.8% this year, but grew 13.8% in the first five months as the government front-loaded spending. Stronger-than-expected government revenues and land sale revenues so far provide capacity to spend more, but no indications of changes to the official budgets yet exist.
Credit growth is also likely to continue moderating. Growth in total social financing, ex-equity financing, slowed to 12.4% YoY in May from 13.1% in March. Nonetheless, financial sector risk is likely to continue to rise rapidly. Even the official target for total social financing growth of 13% for 2015 implies that debt/GDP will rise, but
we estimate that it is more realistic to think of credit growing about 18% YoY this year. This would push credit/GDP (excluding government and financial bonds) to roughly 235%. Crucially, more of this credit this year is going to the real estate sector, which is dominated by smaller private developers, and takes the form of shadow activity funded by interbank borrowing. It is impossible to forecast when this could result in a problem that requires PBoC support, but we believe the risk is rising. As long as inflation remains low, the government’s capacity to contain the impact on the financial sector of unexpected defaults will remain high, in our view. To be sure, we forecast CPI inflation will remain low at 2% this year and 1.7% in 2017. The stabilisation of commodity prices and demand for basic materials lead us to expect PPI deflation to diminish to -1.5% to -2.0% by the end of 2016.
China's export outlook is proving worse than we expected; we now expect exports to contract 5.5% this year vs our previous forecast for 4.5% growth. We have pushed down our 2017 estimate to 2.0% growth from 5% previously. Some of this reflects export disappointment so far, but our post-Brexit cuts to our outlook for global growth imply a longer period of weaker growth. The widening of the services deficit leads us to expect China’s current account surplus to narrow to US$292 bn or 2.7% of GDP in 2016 and US$286 bn or 2.6% in 2017 from 3.1% of GDP in 2015.
A key implication of these trends is that China's balance of payments will likely remain in deficit. The ongoing surge in outward FDI leads us to expect net FDI to swing from inflows last year to net outflows of about US$77 bn this year and US$84 bn next year.
The government is likely to continue to allow some of this balance of payments pressure to clear through CNY depreciation. We forecast USDCNY to rise to about 6.84 by end-2016 and 7.11 by end-2017. However, our perception is that the government judges the August 2015 devaluation was a mistake that it does not want to repeat. We expect it to draw down on FX reserves to maintain a gradual, almost predictable, pace of depreciation.
Monetary policy is likely to play only a passive role in any stimulus, with the PBoC keeping banking sector liquidity conditions ample and backing away from recent greater oversight on lending. We expect China's reserve requirement ratios (RRR) to be cut by 100 bp, but stress that this is more likely to be simply to manage liquidity levels for the current interest rate structure rather than to lower rates. We see a chance that the PBoC could cut its policy guidance rates by another 25 bp later this year if the US Fed remains dovish. However, we believe continuing pressure on the CNY greatly limits the scope for lower interest rates.
Extract from the Asian Daily, 8 July 2016.

14 July 2016
Jump-Start 19
APAC Oil & Gas Sector --------------------------------------------------------------------------------------- CS raises 2016/17 oil price forecast Horace Tse / Research Analyst / 852 2101 7379 / [email protected] David Hewitt / Research Analyst / 65 6212 3064 / [email protected]
● CS Global Energy Team has raised near-term oil price forecast. Our new forecast (Brent) is $44/bbl in 2016 (from $38) and to $56/bbl in 2017 (from $54). Long-term remains unchanged at $70/bbl.
● Supply – broadly flat YoY (2016 vs 2015). We forecast growth in Iran, Iraq and Russia this year, but declines in the US, Venezuela, China, Nigeria and Colombia fully offset those gains.
● Demand – expects below-trend demand in 2017. We reduce our 2016 demand forecast to 1.4mb/d and materially reduce 2017 demand to just 900kb/d. As a result, the inventory draw required to rebalance excess inventories will take the majority of 2017, with incremental US supply being required in 2018 as we reach $60+.
● In China we continue to prefer CNOOC amid best execution on costs/returns vs peers. In Australia we prefer Santos, the most leveraged of the upstream plays. In India we prefer the Oil Marketing companies, specifically BPCL on strong demand growth. In Thailand we prefer PTT over PTTEP. In Japan we prefer Inpex with an (albeit delayed) strong earnings growth profile. Link to report
Valuation metrics Company Ticker Rating Price Year P/E (x) P/B (x)
Local Target T T+1 T+2 T+1
CNOOC 0883.HK O 9.82 11.50 12/15 n.m. 16.5 1.1 PetroChina (H) 0857.HK U 5.41 4.10 12/15 n.m. 40.9 0.8 Sinopec (H) 0386.HK N 5.78 5.00 12/15 19.1 11.2 0.9 Santos STO.AX O 4.80 4.10 12/15 n.m. 17.3 0.8 BPCL BPCL.BO O 545 600 03/15 9.9 10.7 2.8 IOCL IOC.BO O 478 530 03/15 10.4 8.4 1.5 ONGC ONGC.BO N 234 235 03/15 14.2 11.3 1.1 OILI OILI.BO N 371 375 03/15 11.2 9.5 1.0 PTT PTT.BK N 315 280 12/15 12.8 10.3 1.2 PTTEP PTTEP.BK U 82.2 73.0 12/15 38.7 14.3 0.8 Inpex 1605.T O 801 1,180 03/16 36.4 20.2 0.5
Note: O = OUTPERFORM, N = NEUTRAL, U = UNDERPERFORM Source: Company data, Credit Suisse estimates
Figure 1: Credit Suisse oil price forecast—new vs old (US$/bbl) 3Q16E 4Q16E 2016E 2017E 2018E 2019E LT
Brent - New 50.0 45.8 44.5 56.3 67.5 67.5 70.0 Brent - Old 38.0 43.5 37.5 54.3 67.5 67.5 70.0 Change ($/bbl) 12.0 2.3 7.0 2.0 0.0 0.0 0.0 Change (%) 32% 5% 19% 4% 0% 0% 0%
Source: Company data, Credit Suisse estimates
China – Prefer CNOOC > Sinopec > PetroChina: We like CNOOC being the best in execution in terms of cost/capex discipline plus improved returns (increased payout). We are concerned about PetroChina & Sinopec's reserves write-down and see risk of another significant write-down this year.
Australia – Santos is the most leveraged play: Big cap Australian E&Ps continue to price in ~US$65/bbl oil to perpetuity according to our models. Our preferred play on a 12-month view remains Santos. Whilst the business has a number of longer term (3-5 year) challenges to resolve, the next 12 months should provide relatively pure oil leverage with a bit of positive support from self-help in the form of a well-publicised cost out story.
Figure 2: Global supply / demand – history + CS forecast
92
93
94
95
96
97
98
Jun-14 Dec-14 Jun-15 Dec-15 Jun-16 Dec-16 Jun-17 Dec-17
Demand (3 mma)
Supply
Source: Credit Suisse estimates.
India – prefer IOCL & BPCL over HPCL: While the recent Kerosene subsidy reform helps upstream stocks (ONGC, Oil India), weak production momentum and subdued gas prices continue to be key overhangs. While CS Global Energy Team expect oil prices to recover to $68/bbl by CY18, due to ad-hoc government policy, the upside for upstream stocks are capped beyond oil at $45/bbl (at current policy). We remain positive on the Oil Marketing Companies.
Thailand – prefer PTT over PTTEP: We have an UNDERPEROFRM rating on PTTEP with concerns on declining reserves. We expect PTTEP's reserve to continue to deplete especially now that the process of Bongkot concession renewal is delayed further. According to latest schedule of the Energy Ministry, the bidding on concession extension is scheduled for 3Q17. Chances of a further delay is possible especially if there is an election and there is a new government by then. Further delay would increase chances of volume decline from 2019 onwards.
Figure 3: Actual and forecast stock changes (Mb/d)
(2.0)
(1.5)
(1.0)
(0.5)
-
0.5
1.0
1.5
2.0
2.5
3.0
implied inventory change 3 mma
reported inventory change 3 mma
Source: IEA, EIA, JODI, Country Data, Credit Suisse estimates.
Japan – Prefer Inpex for earnings growth: We move to a 2018 project start up at Inpex's Australian LNG project - Ichthys, which delays the company's earnings ramp-up slightly but the earnings trajectory is still robustly positive in the medium term; whereas with the shutting in of the pilot production at Japex's Canadian oil sands project their earnings future is far less certain.
Extract from the Asian Daily, 14 July 2016.

14 July 2016
Jump-Start 20
Asia Oil Weekly -------------------------------------------------------------------------------------------------- New report: Inauguration Horace Tse / Research Analyst / 852 2101 7379 / [email protected] Jessie Xu / Research Analyst / 852 2101 7650 / [email protected]
● This is an inaugural issue of our new Asia Oil Weekly product. This research product aims at recapping key news and material changes in the Asia Oil & Gas space over the past week, with key charts highlighting the latest price/demand trend in the region. Full report.
● Oil price (Brent) fell 3% WoW to $45. The US crude oil inventory data drew slower than expected. April's US gasoline demand (pre-driving season) was only +1% YoY, much lower than what the prior weekly data suggested. CS Singapore GRM were flat WoW at $8.8/bbl.
● Horace Tse assumes primary coverage on the large-cap Chinese Oils following a realignment of stock coverage. ExxonMobil's world-class discovery in offshore Guyana (CNOOC owns 25% via Nexen) is estimated to have 0.8-1.4 bn boe recoverable resource. Our assessment suggests that the block could be worth $5 bn, or HK$0.2/sh accretion to CNOOC with further exploration upside.
● Bloomberg reported that ExxonMobil is looking to buy stakes in Mozambique Area 1 project (PTTEP owns 8.5%). We believe this is negative to PTTEP, as a new development plan is likely but would mean another three years of delay from PTTEP's current plan.
Valuation Metrics Company Ticker Rating Price Year P/E (x) P/B (x)
Local Target T T+1 T+2 T+1
PetroChina (H) 0857.HK U 5.23 4.00 12/15 n.m. 41.5 0.8 Sinopec (H) 0386.HK N 5.40 5.00 12/15 33.3 10.8 0.8 CNOOC 0883.HK O 9.49 11.20 12/15 n.m. 17.1 1.1 PTTEP PTTEP.BK U 82.00 73.00 12/15 38.6 14.2 0.8
Note: O = OUTPERFORM, N = NEUTRAL, U = UNDERPERFORM Source: Company data, Credit Suisse estimates
Downhill from here. CS' China Economics Team has cut its China GDP forecast—now expecting GDP to reach 6.3% in 4Q16, slowest growth print since 1992 (excluding 1Q19 during GFC). China oil demand has been resilient YTD (+2%), but a potential further slowdown in industrial activities would likely depress diesel demand, which is already in doldrums (-8% YTD).
Figure 1: China oil demand growth is highly correlated to GDP growth
4%
6%
8%
10%
12%
14%
16%
-10%
-5%
0%
5%
10%
15%
20%
25%
30%
1Q01
1Q02
1Q03
1Q04
1Q05
1Q06
1Q07
1Q08
1Q09
1Q10
1Q11
1Q12
1Q13
1Q14
1Q15
1Q16
China oil demand growth (3MMA) - LHS China GDP growth - RHS
Source: China OGP, CEIC, Credit Suisse estimates.
Figure 2: CS Singapore GRM (6-2-3-1 margin)
6
8
10
12
14
16
Jan Feb Mar Apr May Jun Jul Aug Sep Oct Nov Dec
2014 2015 2016 Avg
(US$/bbl) Shaded area indicates historical 5-year range
Source: Thomson Reuters Datastream, Bloomberg, Credit Suisse Research
Figure 3: India total oil product demand growth
0%
5%
10%
15%
20%
0
100
200
300
400
500
2011 2012 2013 2014 2015 2016
3mma YoY, kb/d, LHS 3mma YoY%, RHS
(kb/d)
Source: PPAC, Credit Suisse Research
Figure 4: Asia O&G – 1W performance
-5%
-4%
-3%
-2%
-1%
0%
1%
GAI
L In
dia
Kunl
un
Sino
pec
PTTE
P
CN
OO
C
Sino
. Kan
tons
Petro
Chi
na
Oil
Indi
a
CO
SL
Sino
. SSC
ON
GC
PTT
SEG
Cai
rn In
dia
Rel
ianc
e
Source: Thomson Reuters Datastream, Credit Suisse Research
Figure 5: MSCI NJA Energy 12-month forward P/B – 2012 to current
0.6
0.8
1.0
1.2
1.4
1.6
Jan-12 Jan-13 Jan-14 Jan-15 Jan-16
(x)
+1 S.D. = 1.4x
-1 S.D. = 0.9x
Avg. = 1.1x
Source: Thomson Reuters Datastream, Credit Suisse Research
Extract from the Asian Daily, 11 July 2016.
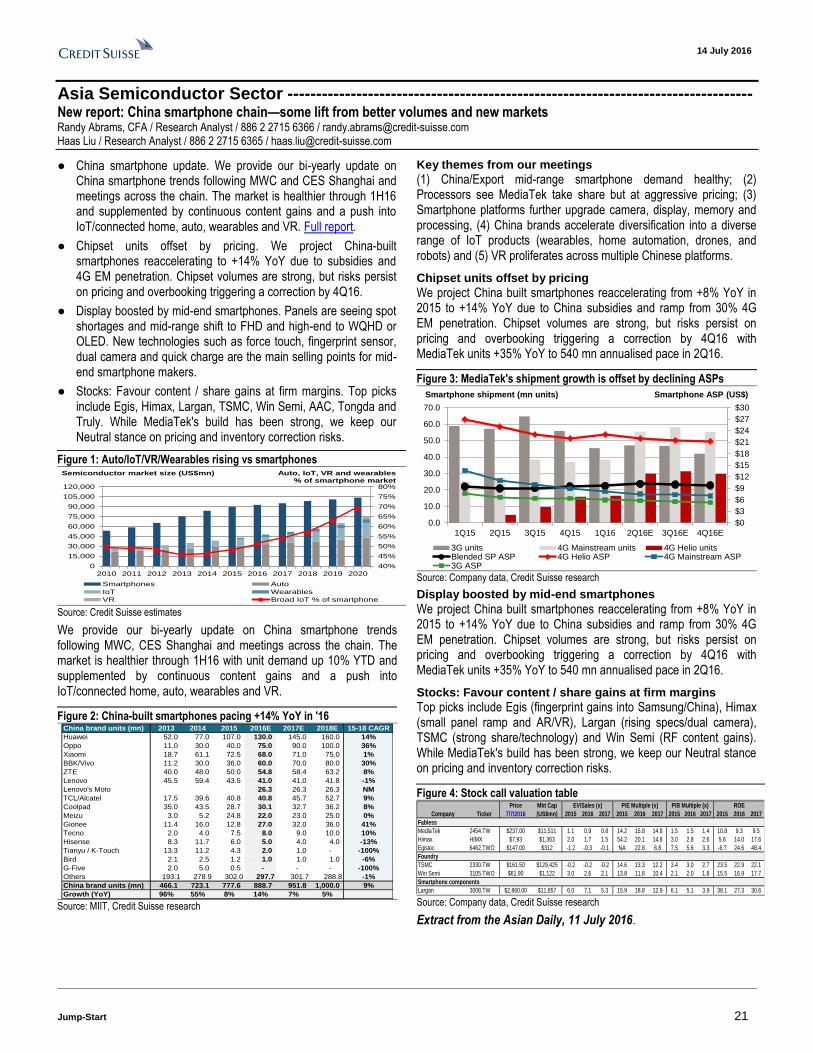
14 July 2016
Jump-Start 21
Asia Semiconductor Sector --------------------------------------------------------------------------------- New report: China smartphone chain—some lift from better volumes and new markets Randy Abrams, CFA / Research Analyst / 886 2 2715 6366 / [email protected] Haas Liu / Research Analyst / 886 2 2715 6365 / [email protected]
● China smartphone update. We provide our bi-yearly update on China smartphone trends following MWC and CES Shanghai and meetings across the chain. The market is healthier through 1H16 and supplemented by continuous content gains and a push into IoT/connected home, auto, wearables and VR. Full report.
● Chipset units offset by pricing. We project China-built smartphones reaccelerating to +14% YoY due to subsidies and 4G EM penetration. Chipset volumes are strong, but risks persist on pricing and overbooking triggering a correction by 4Q16.
● Display boosted by mid-end smartphones. Panels are seeing spot shortages and mid-range shift to FHD and high-end to WQHD or OLED. New technologies such as force touch, fingerprint sensor, dual camera and quick charge are the main selling points for mid-end smartphone makers.
● Stocks: Favour content / share gains at firm margins. Top picks include Egis, Himax, Largan, TSMC, Win Semi, AAC, Tongda and Truly. While MediaTek's build has been strong, we keep our Neutral stance on pricing and inventory correction risks.
Figure 1: Auto/IoT/VR/Wearables rising vs smartphones
40%
45%
50%
55%
60%
65%
70%
75%
80%
0
15,000
30,000
45,000
60,000
75,000
90,000
105,000
120,000
2010 2011 2012 2013 2014 2015 2016 2017 2018 2019 2020
Smartphones Auto
IoT Wearables
VR Broad IoT % of smartphone
Semiconductor market size (US$mn) Auto, IoT, VR and wearables% of smartphone market
Source: Credit Suisse estimates
We provide our bi-yearly update on China smartphone trends following MWC, CES Shanghai and meetings across the chain. The market is healthier through 1H16 with unit demand up 10% YTD and supplemented by continuous content gains and a push into IoT/connected home, auto, wearables and VR.
Figure 2: China-built smartphones pacing +14% YoY in '16 China brand units (mn) 2013 2014 2015 2016E 2017E 2018E 15-18 CAGR
Huawei 52.0 77.0 107.0 130.0 145.0 160.0 14%
Oppo 11.0 30.0 40.0 75.0 90.0 100.0 36%
Xiaomi 18.7 61.1 72.5 68.0 71.0 75.0 1%
BBK/Vivo 11.2 30.0 36.0 60.0 70.0 80.0 30%
ZTE 40.0 48.0 50.0 54.8 58.4 63.2 8%
Lenovo 45.5 59.4 43.5 41.0 41.0 41.8 -1%
Lenovo's Moto 26.3 26.3 26.3 NM
TCL/Alcatel 17.5 39.6 40.8 40.8 45.7 52.7 9%
Coolpad 35.0 43.5 28.7 30.1 32.7 36.2 8%
Meizu 3.0 5.2 24.8 22.0 23.0 25.0 0%
Gionee 11.4 16.0 12.8 27.0 32.0 36.0 41%
Tecno 2.0 4.0 7.5 8.0 9.0 10.0 10%
Hisense 8.3 11.7 6.0 5.0 4.0 4.0 -13%
Tianyu / K-Touch 13.3 11.2 4.3 2.0 1.0 - -100%
Bird 2.1 2.5 1.2 1.0 1.0 1.0 -6%
G-Five 2.0 5.0 0.5 - - - -100%
Others 193.1 278.9 302.0 297.7 301.7 288.8 -1%
China brand units (mn) 466.1 723.1 777.6 888.7 951.8 1,000.0 9%
Growth (YoY) 96% 55% 8% 14% 7% 5% Source: MIIT, Credit Suisse research
Key themes from our meetings
(1) China/Export mid-range smartphone demand healthy; (2) Processors see MediaTek take share but at aggressive pricing; (3) Smartphone platforms further upgrade camera, display, memory and processing, (4) China brands accelerate diversification into a diverse range of IoT products (wearables, home automation, drones, and robots) and (5) VR proliferates across multiple Chinese platforms.
Chipset units offset by pricing
We project China built smartphones reaccelerating from +8% YoY in 2015 to +14% YoY due to China subsidies and ramp from 30% 4G EM penetration. Chipset volumes are strong, but risks persist on pricing and overbooking triggering a correction by 4Q16 with MediaTek units +35% YoY to 540 mn annualised pace in 2Q16.
Figure 3: MediaTek's shipment growth is offset by declining ASPs
$0
$3
$6
$9
$12
$15
$18
$21
$24
$27
$30
0.0
10.0
20.0
30.0
40.0
50.0
60.0
70.0
1Q15 2Q15 3Q15 4Q15 1Q16 2Q16E 3Q16E 4Q16E
3G units 4G Mainstream units 4G Helio unitsBlended SP ASP 4G Helio ASP 4G Mainstream ASP3G ASP
Smartphone shipment (mn units) Smartphone ASP (US$)
Source: Company data, Credit Suisse research
Display boosted by mid-end smartphones
We project China built smartphones reaccelerating from +8% YoY in 2015 to +14% YoY due to China subsidies and ramp from 30% 4G EM penetration. Chipset volumes are strong, but risks persist on pricing and overbooking triggering a correction by 4Q16 with MediaTek units +35% YoY to 540 mn annualised pace in 2Q16.
Stocks: Favour content / share gains at firm margins
Top picks include Egis (fingerprint gains into Samsung/China), Himax (small panel ramp and AR/VR), Largan (rising specs/dual camera), TSMC (strong share/technology) and Win Semi (RF content gains). While MediaTek's build has been strong, we keep our Neutral stance on pricing and inventory correction risks.
Figure 4: Stock call valuation table Price Mkt Cap EV/Sales (x) P/E Multiple (x) P/B Multiple (x) ROE Trough/Peak (EV/Sales)
Company Ticker 7/7/2016 (US$mn) 2015 2016 2017 2015 2016 2017 2015 2016 2017 2015 2016 2017
Fabless
MediaTek 2454.TW $237.00 $11,511 1.1 0.9 0.8 14.2 15.8 14.8 1.5 1.5 1.4 10.8 9.3 9.5
Himax HIMX $7.93 $1,363 2.0 1.7 1.5 54.2 20.1 14.8 3.0 2.8 2.6 5.6 14.0 17.6
Egistec 6462.TWO $147.00 $312 -1.2 -0.3 -0.1 NA 22.8 6.8 7.5 5.6 3.3 -6.7 24.6 48.4
Foundry
TSMC 2330.TW $161.50 $129,425 -0.2 -0.2 -0.2 14.6 13.3 12.2 3.4 3.0 2.7 23.5 22.9 22.1
Win Semi 3105.TWO $61.90 $1,122 3.0 2.6 2.1 13.8 11.8 10.4 2.1 2.0 1.8 15.5 16.9 17.7
Smartphone components
Largan 3008.TW $2,860.00 $11,857 6.0 7.1 5.3 15.9 18.8 12.9 6.1 5.1 3.9 38.1 27.3 30.6 Source: Company data, Credit Suisse research
Extract from the Asian Daily, 11 July 2016.
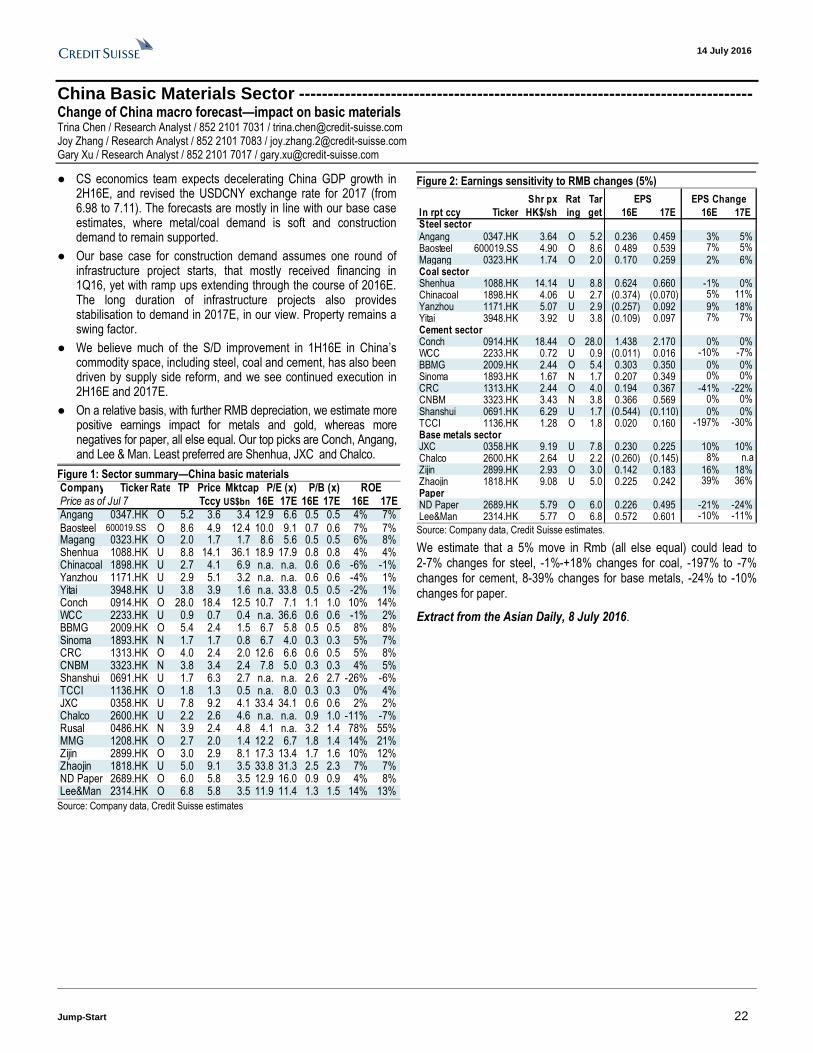
14 July 2016
Jump-Start 22
China Basic Materials Sector ------------------------------------------------------------------------------- Change of China macro forecast—impact on basic materials Trina Chen / Research Analyst / 852 2101 7031 / [email protected] Joy Zhang / Research Analyst / 852 2101 7083 / [email protected] Gary Xu / Research Analyst / 852 2101 7017 / [email protected]
● CS economics team expects decelerating China GDP growth in 2H16E, and revised the USDCNY exchange rate for 2017 (from 6.98 to 7.11). The forecasts are mostly in line with our base case estimates, where metal/coal demand is soft and construction demand to remain supported.
● Our base case for construction demand assumes one round of infrastructure project starts, that mostly received financing in 1Q16, yet with ramp ups extending through the course of 2016E. The long duration of infrastructure projects also provides stabilisation to demand in 2017E, in our view. Property remains a swing factor.
● We believe much of the S/D improvement in 1H16E in China’s commodity space, including steel, coal and cement, has also been driven by supply side reform, and we see continued execution in 2H16E and 2017E.
● On a relative basis, with further RMB depreciation, we estimate more positive earnings impact for metals and gold, whereas more negatives for paper, all else equal. Our top picks are Conch, Angang, and Lee & Man. Least preferred are Shenhua, JXC and Chalco.
Figure 1: Sector summary—China basic materials Company Ticker Price Mktcap P/E (x) P/B (x)Price as of Jul 7 Tccy US$bn 16E 17E 16E 17E 16E 17EAngang 0347.HK O 5.2 3.6 3.4 12.9 6.6 0.5 0.5 4% 7%Baosteel 600019.SS O 8.6 4.9 12.4 10.0 9.1 0.7 0.6 7% 7%Magang 0323.HK O 2.0 1.7 1.7 8.6 5.6 0.5 0.5 6% 8%Shenhua 1088.HK U 8.8 14.1 36.1 18.9 17.9 0.8 0.8 4% 4%Chinacoal 1898.HK U 2.7 4.1 6.9 n.a. n.a. 0.6 0.6 -6% -1%Yanzhou 1171.HK U 2.9 5.1 3.2 n.a. n.a. 0.6 0.6 -4% 1%Yitai 3948.HK U 3.8 3.9 1.6 n.a. 33.8 0.5 0.5 -2% 1%Conch 0914.HK O 28.0 18.4 12.5 10.7 7.1 1.1 1.0 10% 14%WCC 2233.HK U 0.9 0.7 0.4 n.a. 36.6 0.6 0.6 -1% 2%BBMG 2009.HK O 5.4 2.4 1.5 6.7 5.8 0.5 0.5 8% 8%Sinoma 1893.HK N 1.7 1.7 0.8 6.7 4.0 0.3 0.3 5% 7%CRC 1313.HK O 4.0 2.4 2.0 12.6 6.6 0.6 0.5 5% 8%CNBM 3323.HK N 3.8 3.4 2.4 7.8 5.0 0.3 0.3 4% 5%Shanshui 0691.HK U 1.7 6.3 2.7 n.a. n.a. 2.6 2.7 -26% -6%TCCI 1136.HK O 1.8 1.3 0.5 n.a. 8.0 0.3 0.3 0% 4%JXC 0358.HK U 7.8 9.2 4.1 33.4 34.1 0.6 0.6 2% 2%Chalco 2600.HK U 2.2 2.6 4.6 n.a. n.a. 0.9 1.0 -11% -7%Rusal 0486.HK N 3.9 2.4 4.8 4.1 n.a. 3.2 1.4 78% 55%MMG 1208.HK O 2.7 2.0 1.4 12.2 6.7 1.8 1.4 14% 21%Zijin 2899.HK O 3.0 2.9 8.1 17.3 13.4 1.7 1.6 10% 12%Zhaojin 1818.HK U 5.0 9.1 3.5 33.8 31.3 2.5 2.3 7% 7%ND Paper 2689.HK O 6.0 5.8 3.5 12.9 16.0 0.9 0.9 4% 8%Lee&Man 2314.HK O 6.8 5.8 3.5 11.9 11.4 1.3 1.5 14% 13%
ROERate TP
Source: Company data, Credit Suisse estimates
Figure 2: Earnings sensitivity to RMB changes (5%)
Shr px Rat Tar
In rpt ccy Ticker HK$/sh ing get 16E 17E 16E 17ESteel sectorAngang 0347.HK 3.64 O 5.2 0.236 0.459 3% 5%Baosteel 600019.SS 4.90 O 8.6 0.489 0.539 7% 5%Magang 0323.HK 1.74 O 2.0 0.170 0.259 2% 6%Coal sectorShenhua 1088.HK 14.14 U 8.8 0.624 0.660 -1% 0%Chinacoal 1898.HK 4.06 U 2.7 (0.374) (0.070) 5% 11%Yanzhou 1171.HK 5.07 U 2.9 (0.257) 0.092 9% 18%Yitai 3948.HK 3.92 U 3.8 (0.109) 0.097 7% 7%Cement sectorConch 0914.HK 18.44 O 28.0 1.438 2.170 0% 0%WCC 2233.HK 0.72 U 0.9 (0.011) 0.016 -10% -7%BBMG 2009.HK 2.44 O 5.4 0.303 0.350 0% 0%Sinoma 1893.HK 1.67 N 1.7 0.207 0.349 0% 0%CRC 1313.HK 2.44 O 4.0 0.194 0.367 -41% -22%CNBM 3323.HK 3.43 N 3.8 0.366 0.569 0% 0%Shanshui 0691.HK 6.29 U 1.7 (0.544) (0.110) 0% 0%TCCI 1136.HK 1.28 O 1.8 0.020 0.160 -197% -30%Base metals sectorJXC 0358.HK 9.19 U 7.8 0.230 0.225 10% 10%Chalco 2600.HK 2.64 U 2.2 (0.260) (0.145) 8% n.aZijin 2899.HK 2.93 O 3.0 0.142 0.183 16% 18%Zhaojin 1818.HK 9.08 U 5.0 0.225 0.242 39% 36%PaperND Paper 2689.HK 5.79 O 6.0 0.226 0.495 -21% -24%Lee&Man 2314.HK 5.77 O 6.8 0.572 0.601 -10% -11%
EPS ChangeEPS
Source: Company data, Credit Suisse estimates.
We estimate that a 5% move in Rmb (all else equal) could lead to 2-7% changes for steel, -1%-+18% changes for coal, -197% to -7% changes for cement, 8-39% changes for base metals, -24% to -10% changes for paper.
Extract from the Asian Daily, 8 July 2016.
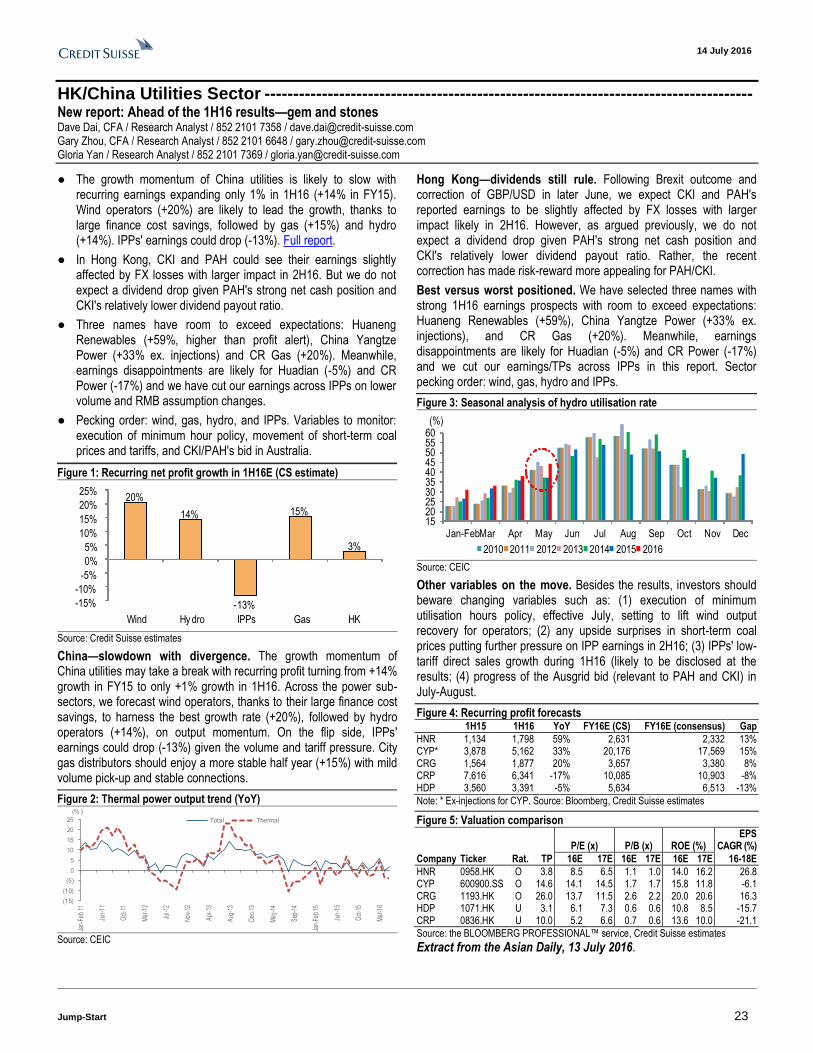
14 July 2016
Jump-Start 23
HK/China Utilities Sector ------------------------------------------------------------------------------------- New report: Ahead of the 1H16 results—gem and stones Dave Dai, CFA / Research Analyst / 852 2101 7358 / [email protected] Gary Zhou, CFA / Research Analyst / 852 2101 6648 / [email protected] Gloria Yan / Research Analyst / 852 2101 7369 / [email protected]
● The growth momentum of China utilities is likely to slow with recurring earnings expanding only 1% in 1H16 (+14% in FY15). Wind operators (+20%) are likely to lead the growth, thanks to large finance cost savings, followed by gas (+15%) and hydro (+14%). IPPs' earnings could drop (-13%). Full report.
● In Hong Kong, CKI and PAH could see their earnings slightly affected by FX losses with larger impact in 2H16. But we do not expect a dividend drop given PAH's strong net cash position and CKI's relatively lower dividend payout ratio.
● Three names have room to exceed expectations: Huaneng Renewables (+59%, higher than profit alert), China Yangtze Power (+33% ex. injections) and CR Gas (+20%). Meanwhile, earnings disappointments are likely for Huadian (-5%) and CR Power (-17%) and we have cut our earnings across IPPs on lower volume and RMB assumption changes.
● Pecking order: wind, gas, hydro, and IPPs. Variables to monitor: execution of minimum hour policy, movement of short-term coal prices and tariffs, and CKI/PAH's bid in Australia.
Figure 1: Recurring net profit growth in 1H16E (CS estimate)
20%
14%
-13%
15%
3%
-15%
-10%
-5%
0%
5%
10%
15%
20%
25%
Wind Hy dro IPPs Gas HK
Source: Credit Suisse estimates
China—slowdown with divergence. The growth momentum of China utilities may take a break with recurring profit turning from +14% growth in FY15 to only +1% growth in 1H16. Across the power sub-sectors, we forecast wind operators, thanks to their large finance cost savings, to harness the best growth rate (+20%), followed by hydro operators (+14%), on output momentum. On the flip side, IPPs' earnings could drop (-13%) given the volume and tariff pressure. City gas distributors should enjoy a more stable half year (+15%) with mild volume pick-up and stable connections.
Figure 2: Thermal power output trend (YoY)
(15)
(10)
(5)
0
5
10
15
20
25
Jan-
Feb
11
Jun-
11
Oct
-11
Mar
-12
Jul-1
2
Nov
-12
Apr
-13
Aug
-13
Dec
-13
May
-14
Sep
-14
Jan-
Feb
15
Jun-
15
Oct
-15
Mar
-16
(% )
Total Thermal
Source: CEIC
Hong Kong—dividends still rule. Following Brexit outcome and correction of GBP/USD in later June, we expect CKI and PAH's reported earnings to be slightly affected by FX losses with larger impact likely in 2H16. However, as argued previously, we do not expect a dividend drop given PAH's strong net cash position and CKI's relatively lower dividend payout ratio. Rather, the recent correction has made risk-reward more appealing for PAH/CKI.
Best versus worst positioned. We have selected three names with strong 1H16 earnings prospects with room to exceed expectations: Huaneng Renewables (+59%), China Yangtze Power (+33% ex. injections), and CR Gas (+20%). Meanwhile, earnings disappointments are likely for Huadian (-5%) and CR Power (-17%) and we cut our earnings/TPs across IPPs in this report. Sector pecking order: wind, gas, hydro and IPPs.
Figure 3: Seasonal analysis of hydro utilisation rate
15202530354045505560
Jan-FebMar Apr May Jun Jul Aug Sep Oct Nov Dec
(%)
2010 2011 2012 2013 2014 2015 2016
Source: CEIC
Other variables on the move. Besides the results, investors should beware changing variables such as: (1) execution of minimum utilisation hours policy, effective July, setting to lift wind output recovery for operators; (2) any upside surprises in short-term coal prices putting further pressure on IPP earnings in 2H16; (3) IPPs' low-tariff direct sales growth during 1H16 (likely to be disclosed at the results; (4) progress of the Ausgrid bid (relevant to PAH and CKI) in July-August.
Figure 4: Recurring profit forecasts 1H15 1H16 YoY FY16E (CS) FY16E (consensus) Gap
HNR 1,134 1,798 59% 2,631 2,332 13% CYP* 3,878 5,162 33% 20,176 17,569 15% CRG 1,564 1,877 20% 3,657 3,380 8% CRP 7,616 6,341 -17% 10,085 10,903 -8% HDP 3,560 3,391 -5% 5,634 6,513 -13%
Note: * Ex-injections for CYP. Source: Bloomberg, Credit Suisse estimates
Figure 5: Valuation comparison EPS P/E (x) P/B (x) ROE (%) CAGR (%)
Company Ticker Rat. TP 16E 17E 16E 17E 16E 17E 16-18E
HNR 0958.HK O 3.8 8.5 6.5 1.1 1.0 14.0 16.2 26.8 CYP 600900.SS O 14.6 14.1 14.5 1.7 1.7 15.8 11.8 -6.1 CRG 1193.HK O 26.0 13.7 11.5 2.6 2.2 20.0 20.6 16.3 HDP 1071.HK U 3.1 6.1 7.3 0.6 0.6 10.8 8.5 -15.7 CRP 0836.HK U 10.0 5.2 6.6 0.7 0.6 13.6 10.0 -21.1
Source: the BLOOMBERG PROFESSIONAL™ service, Credit Suisse estimates
Extract from the Asian Daily, 13 July 2016.
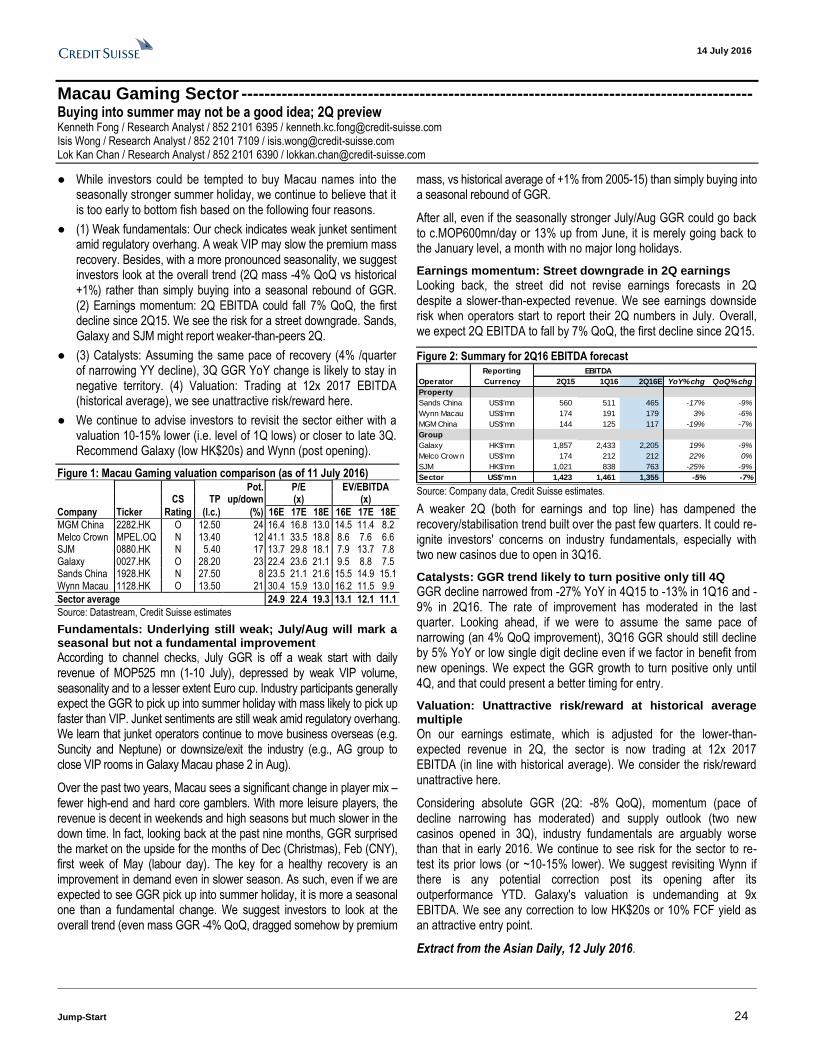
14 July 2016
Jump-Start 24
Macau Gaming Sector ----------------------------------------------------------------------------------------- Buying into summer may not be a good idea; 2Q preview Kenneth Fong / Research Analyst / 852 2101 6395 / [email protected] Isis Wong / Research Analyst / 852 2101 7109 / [email protected] Lok Kan Chan / Research Analyst / 852 2101 6390 / [email protected]
● While investors could be tempted to buy Macau names into the seasonally stronger summer holiday, we continue to believe that it is too early to bottom fish based on the following four reasons.
● (1) Weak fundamentals: Our check indicates weak junket sentiment amid regulatory overhang. A weak VIP may slow the premium mass recovery. Besides, with a more pronounced seasonality, we suggest investors look at the overall trend (2Q mass -4% QoQ vs historical +1%) rather than simply buying into a seasonal rebound of GGR. (2) Earnings momentum: 2Q EBITDA could fall 7% QoQ, the first decline since 2Q15. We see the risk for a street downgrade. Sands, Galaxy and SJM might report weaker-than-peers 2Q.
● (3) Catalysts: Assuming the same pace of recovery (4% /quarter of narrowing YY decline), 3Q GGR YoY change is likely to stay in negative territory. (4) Valuation: Trading at 12x 2017 EBITDA (historical average), we see unattractive risk/reward here.
● We continue to advise investors to revisit the sector either with a valuation 10-15% lower (i.e. level of 1Q lows) or closer to late 3Q. Recommend Galaxy (low HK$20s) and Wynn (post opening).
Figure 1: Macau Gaming valuation comparison (as of 11 July 2016) Pot. P/E EV/EBITDA CS TP up/down (x) (x)
Company Ticker Rating (l.c.) (%) 16E 17E 18E 16E 17E 18E
MGM China 2282.HK O 12.50 24 16.4 16.8 13.0 14.5 11.4 8.2 Melco Crown MPEL.OQ N 13.40 12 41.1 33.5 18.8 8.6 7.6 6.6 SJM 0880.HK N 5.40 17 13.7 29.8 18.1 7.9 13.7 7.8 Galaxy 0027.HK O 28.20 23 22.4 23.6 21.1 9.5 8.8 7.5 Sands China 1928.HK N 27.50 8 23.5 21.1 21.6 15.5 14.9 15.1 Wynn Macau 1128.HK O 13.50 21 30.4 15.9 13.0 16.2 11.5 9.9
Sector average 24.9 22.4 19.3 13.1 12.1 11.1
Source: Datastream, Credit Suisse estimates
Fundamentals: Underlying still weak; July/Aug will mark a seasonal but not a fundamental improvement
According to channel checks, July GGR is off a weak start with daily revenue of MOP525 mn (1-10 July), depressed by weak VIP volume, seasonality and to a lesser extent Euro cup. Industry participants generally expect the GGR to pick up into summer holiday with mass likely to pick up faster than VIP. Junket sentiments are still weak amid regulatory overhang. We learn that junket operators continue to move business overseas (e.g. Suncity and Neptune) or downsize/exit the industry (e.g., AG group to close VIP rooms in Galaxy Macau phase 2 in Aug).
Over the past two years, Macau sees a significant change in player mix – fewer high-end and hard core gamblers. With more leisure players, the revenue is decent in weekends and high seasons but much slower in the down time. In fact, looking back at the past nine months, GGR surprised the market on the upside for the months of Dec (Christmas), Feb (CNY), first week of May (labour day). The key for a healthy recovery is an improvement in demand even in slower season. As such, even if we are expected to see GGR pick up into summer holiday, it is more a seasonal one than a fundamental change. We suggest investors to look at the overall trend (even mass GGR -4% QoQ, dragged somehow by premium
mass, vs historical average of +1% from 2005-15) than simply buying into a seasonal rebound of GGR.
After all, even if the seasonally stronger July/Aug GGR could go back to c.MOP600mn/day or 13% up from June, it is merely going back to the January level, a month with no major long holidays.
Earnings momentum: Street downgrade in 2Q earnings
Looking back, the street did not revise earnings forecasts in 2Q despite a slower-than-expected revenue. We see earnings downside risk when operators start to report their 2Q numbers in July. Overall, we expect 2Q EBITDA to fall by 7% QoQ, the first decline since 2Q15.
Figure 2: Summary for 2Q16 EBITDA forecast Reporting
Operator Currency 2Q15 1Q16 2Q16E YoY% chg QoQ% chg
Property
Sands China US$'mn 560 511 465 -17% -9%
Wynn Macau US$'mn 174 191 179 3% -6%
MGM China US$'mn 144 125 117 -19% -7%
Group
Galaxy HK$'mn 1,857 2,433 2,205 19% -9%
Melco Crow n US$'mn 174 212 212 22% 0%
SJM HK$'mn 1,021 838 763 -25% -9%
Sector US$'mn 1,423 1,461 1,355 -5% -7%
EBITDA
Source: Company data, Credit Suisse estimates.
A weaker 2Q (both for earnings and top line) has dampened the recovery/stabilisation trend built over the past few quarters. It could re-ignite investors' concerns on industry fundamentals, especially with two new casinos due to open in 3Q16.
Catalysts: GGR trend likely to turn positive only till 4Q
GGR decline narrowed from -27% YoY in 4Q15 to -13% in 1Q16 and -9% in 2Q16. The rate of improvement has moderated in the last quarter. Looking ahead, if we were to assume the same pace of narrowing (an 4% QoQ improvement), 3Q16 GGR should still decline by 5% YoY or low single digit decline even if we factor in benefit from new openings. We expect the GGR growth to turn positive only until 4Q, and that could present a better timing for entry.
Valuation: Unattractive risk/reward at historical average multiple
On our earnings estimate, which is adjusted for the lower-than-expected revenue in 2Q, the sector is now trading at 12x 2017 EBITDA (in line with historical average). We consider the risk/reward unattractive here.
Considering absolute GGR (2Q: -8% QoQ), momentum (pace of decline narrowing has moderated) and supply outlook (two new casinos opened in 3Q), industry fundamentals are arguably worse than that in early 2016. We continue to see risk for the sector to re-test its prior lows (or ~10-15% lower). We suggest revisiting Wynn if there is any potential correction post its opening after its outperformance YTD. Galaxy's valuation is undemanding at 9x EBITDA. We see any correction to low HK$20s or 10% FCF yield as an attractive entry point.
Extract from the Asian Daily, 12 July 2016.

14 July 2016
Jump-Start 25
Blackmores Ltd ------------------------------------------ Initiating Coverage with OUTPERFORM China retail: The remedy to reach A$175 Ben Levin / Research Analyst / 61 3 9280 1766 / [email protected] Larry Gandler / Research Analyst / 61 3 9280 1855 / [email protected]
● We initiate coverage on Blackmores with an OUTPERFORM rating and a A$175 TP. Blackmores is a leading Australian supplier of vitamins and dietary supplements (VDS) ideally positioned to grow in China—the second largest VDS market in the world. Full report
● We see a new opportunity emerging in what we expect to be a US$10 bn China VDS market through the bricks and mortar retail channel by FY20. We believe Blackmores could capture US$150 mn (A$200 mn), adding 80% to its existing China sales base as new regulations assist Blackmores in tapping this large market.
● While in China, industry participants widely acknowledged Blackmores' potential to succeed and we estimate Blackmores has achieved a 4.5% market share in the online VDS market (including cross-border e-commerce and daigou). New regulations from the Chinese Food and Drug Administration (CFDA) should significantly expand its product range within Chinese stores.
● An attractive investment opportunity with a 16% EPS CAGR to FY20 and a 60% ROE—highest among ASX200 and global peers: At 17x FY18E EPS, Blackmores also trades below China VDS peers.
Click here for detailed financials
Blackmores is a leading Australian supplier of vitamins and dietary supplements (VDS) commanding a 20% domestic market share. Surging demand from Chinese consumers has caused the company's revenue to double in less than two years, with Chinese consumers now accounting for ~40% of group revenue. We envision another leg of growth doubling China revenue to A$580mn by FY20 or 50% of the group.
China on-shore retail may add US$150 mn (A$200 mn) in sales. New 'orange hat' regulation should enhance market access. Blackmores should soon be able to register a larger product portfolio inside China, thereby expanding distribution and shelf presence in
Chinese stores. In China, we observed pent-up demand for Blackmores' products underpinned by the perception of high quality.
Figure 1: China retail or 'direct' sales contribute the bulk of future revenue growth
472
706810
9211037
1161
A$0mn
A$200mn
A$400mn
A$600mn
A$800mn
A$1,000mn
A$1,200mn
A$1,400mn
FY15 FY16F FY17F FY18F FY19F FY20F
Australia, Infant Formula, BioCeuticals, NZ and Paw
Other Asia China Direct China Indirect
Source: Company data, Credit Suisse estimates
Blackmores' exports to China should continue to grow. Granted, the widely discussed 'Positive List' rule restricts export volume via the cross-border e-commerce channel. But, 70% of Blackmores' volume travels via the daigou channel—e.g., Australia-based selling agents using China personal post. Channel checks reveal daigou has been less affected.
An attractive investment opportunity with 16% EPS CAGR to FY20 and a 60% ROE—highest among ASX200 and global peers. At 17x FY18E EPS, Blackmores is also trading below China VDS peers. Our DCF based target price implies a re-rating to 19x FY19 PE which is justifiable considering there are 30 ASX200 industrials on a higher P/E with less growth and lower returns.
Figure 2: Blackmores is trading below 30 ASX 200 Industrials that have (1) less EPS growth; and (2) lower ROE (black circles)
0.0x
5.0x
10.0x
15.0x
20.0x
25.0x
30.0x
35.0x
40.0x
45.0x
50.0x
0.0% 10.0% 20.0% 30.0% 40.0% 50.0% 60.0% 70.0%
FY18
P/E
FY16E ROE
Lower EPS, Lower ROE, Lower P/E Higher EPS Growth, Higher P/E, Lower ROE
Blackmores Higher P/E, Lower ROE, Lower EPS Growth
Source: IBES, company data, Credit Suisse estimates
Key risk: Further regulation extending to the daigou channel. A bear case of A$95/share assumes a 30% cut to Australian indirect China sales (mainly daigou) from the current level, stunted development of China retail, pricing pressure and no EPS growth for four years.
(This is an extract from the Blackmores initiation report, "China retail: The remedy to reach A$175," published on 12 July 2016. For details, please see the CS Plus website.)
Extract from the Asian Daily, 13 July 2016.
Bbg/RIC BKL AU / BKL.AX Rating (prev. rating) O (NA) [V] Shares outstanding (mn) 17.23 Daily trad vol - 6m avg (mn) 0.2 Daily trad val - 6m avg (US$ mn) 33.6 Free float (%) 71.8 Major shareholders
Price (12 Jul 16, A$) 135.90 TP (prev. TP A$) 175.00 (NA) Est. pot. % chg. to TP 29 52-wk range (A$) 220.9-73.0 Mkt cap (A$/US$ mn) 2,340.9/ 1,777.7
Performance 1M 3M 12M
Absolute (%) (3.3) (18.0) 86.1 Relative (%) (4.1) (23.9) 88.3
Year 06/14A 06/15A 06/16E 06/17E 06/18E
Revenue (A$ mn) 346.8 471.6 706.2 810.5 920.9 EBITDA (A$ mn) 46.1 78.7 152.7 178.3 204.5 Net profit (A$ mn) 25.5 46.6 100.4 119.1 137.3 EPS (CS adj. A$) 1.49 2.69 5.82 6.96 8.02 - Change from prev. EPS (%) - Consensus EPS (A$) n.a. n.a. 5.90 6.90 7.52 EPS growth (%) n.a. 80.2 116.4 19.5 15.3 P/E (x) 91.0 50.5 23.3 19.5 16.9 Dividend yield (%) 0.9 1.5 3.2 3.8 4.7 EV/EBITDA (x) 52.0 29.9 15.3 13.0 11.4 P/B (x) 22.3 17.5 13.2 11.2 9.2 ROE (%) 24.4 39.3 65.0 62.0 59.7 Net debt(cash)/equity (%) 52.2 5.3 (2.4) (13.1) (4.0)
Note 1: Blackmores is a leading Australian supplier of vitamins and nutritional supplements with a history that dates back 80 years. It not only sells in Australia but throughout 15 countries throughout Asia Pacific.

14 July 2016
Jump-Start 26
Hindalco Industries Ltd ---------------------------------------------------- Maintain OUTPERFORM Cost benefits not fully factored in; supportive cost curve poses upside risks to our price assumption EPS: ▲ TP: ▲ Ravi Shankar / Research Analyst / 91 22 6777 3869 / [email protected] Neelkanth Mishra / Research Analyst / 91 22 6777 3716 / [email protected] Prateek Singh / Research Analyst / 91 22 6777 3894 / [email protected]
● Given abundant domestic coal availability, we expect e-auction prices to stay weak (link). This should benefit Hindalco which procures ~75% of its coal through auctions. Although Hindalco's Al power costs fell by ~US$150/t in 4Q, the savings are yet to be fully modelled-in by the street (scepticism around its sustainability).
● While some gains could get reversed (~US$35/t, courtesy higher clean energy cess), we now build-in US$70/t lower power cost given how closely Hindalco's cost tracks e-auction prices (Figure 1).
● With the sharp rise in global thermal coal prices (+21% in 3M), we see upside risks to our LME Al assumptions (US$1,618/t for FY17 vs US$1,662/t spot). Alumina too is up 23% vs its Jan-16 lows, giving further support to the cost curve. Hindalco remains highly sensitive to LME Al prices (Figure 2). Key risk to Al: stronger DXY.
● We build-in lower costs. Our FY17/18 EBITDA moves up by 7%/3% leading to a steeper rise in EPS (10-29%). Our new TP of Rs163 (6.5x EV-EBITDA for domestic, 8x for Novelis) calls for only a 7% change in EV. Hindalco remains cheap and also features as one of the top cyclical picks in the CS Regional portfolio (link).
Click here for detailed financials
Impact of lower power costs not fully built-in
Given abundant domestic coal availability, we expect e-auction prices to stay weak (link). This should benefit Hindalco which procures ~75% of its coal through auctions. Although Hindalco's Al power costs fell by ~US$150/t in 4Q, the savings are yet to be fully modelled-in by the street (scepticism around its sustainability).
While some gains could get reversed (~US$35/t, courtesy higher clean energy cess), we now build-in US$70/t lower power cost given how closely Hindalco's cost tracks e-auction prices (Figure 1).
With the sharp rise in global thermal coal prices (+21% in 3M), we see upside risks to our LME Al assumptions (US$1,618/t for FY17 vs US$1,662/t spot). Alumina too is up 23% vs its Jan-16 lows, giving further support to the cost curve. Hindalco remains highly sensitive to LME Al prices (Figure 2). Key risk to Al: stronger DXY.
Figure 1: Hindalco's power costs closely linked to CIL's e-auction prices
600
720
840
960
1,080
1,200
1,000
1,500
2,000
2,500
3,000
3,500
Jun-10 Jun-11 Jun-12 Jun-13 Jun-14 Jun-15 Jun-16
Coal India's e-auction ASP (Rs/t) Power cost ($/t of Al, RHS)
Rs/t $/t
Forecast
Source: Company data, Credit Suisse estimates.
Figure 2: High sensitivity to LME Al prices
TP Sensitivity LME Aluminium ($/t)
1400 1500 1618 1700 1800 1900
US Midwest Premium ($/t)
220 150 173 200 219 241 264 200 132 155 182 200 223 246 180 114 136 163 182 204 227 160 95 118 145 163 186 209 140 77 99 126 145 168 190
Source: Company data, Credit Suisse estimates.
Valuation remains reasonable vs history
We build-in lower costs. Our FY17/18 EBITDA moves up by 7%/3% leading to a steeper rise in EPS (10-29%). Our new TP of Rs163 (6.5x EV-EBITDA for domestic, 8x for Novelis) calls for only a 7% change in EV. Hindalco remains cheap and also features as one of the top cyclical picks in the CS Regional portfolio (link).
Figure 3: Current valuations reasonable vs history
0
3
6
9
12
15
0.0x
0.5x
1.0x
1.5x
2.0x
2.5x
Jan-02 Jan-04 Jan-06 Jan-08 Jan-10 Jan-12 Jan-14 Jan-16
P/B EV/EBITDA (RHS)
Source: Company data, Credit Suisse estimates.
Extract from the Asian Daily, 14 July 2016.
Bbg/RIC HNDL IN / HALC.BO Rating (prev. rating) O (O) [V] Shares outstanding (mn) 2,065.00 Daily trad vol - 6m avg (mn) 14.3 Daily trad val - 6m avg (US$ mn) 19.9 Free float (%) 62.0 Major shareholders Promoters- 38%
Price (13 Jul 16 , Rs) 135.75 TP (prev. TP Rs) 163.00 (115.00) Est. pot. % chg. to TP 20 52-wk range (Rs) 135.8 - 61.0 Mkt cap (Rs/US$ bn) 280.3/ 4.2
Performance 1M 3M 12M
Absolute (%) 18.5 41.0 29.8 Relative (%) 13.1 32.4 30.2
Year 03/14A 03/15A 03/16E 03/17E 03/18E
Revenue (Rs mn) 876,955 1,042,811 1,009,342 1,063,025 1,101,888 EBITDA (Rs mn) 82,863 89,446 81,028 112,250 117,702 Net profit (Rs mn) 21,750 8,542 2,608 23,973 27,941 EPS (CS adj. Rs) 10.9 4.1 1.3 11.6 13.5 - Change from prev. EPS (%) n.a. n.a. 0 28.8 9.5 - Consensus EPS (Rs) n.a. n.a. 2.1 9.3 13.3 EPS growth (%) (31.0) (62.1) (69.5) 819.4 16.5 P/E (x) 12.4 32.8 107.5 11.7 10.0 Dividend yield (%) 0.9 0.9 0.1 1.0 1.2 EV/EBITDA (x) 9.8 9.5 10.7 7.4 6.7 P/B (x) 0.7 0.7 0.7 0.7 0.7 ROE (%) 5.7 2.2 0.7 6.1 6.7 Net debt(cash)/equity (%) 125.1 143.9 147.7 132.1 116.0
Note 1: ORD/ADR=1.00. Note 2: Hindalco is a fully-integrated Aluminum producer in India and a leading downstream Al player globally through its subsidiary, Novelis. It also operates a 400kt Copper smelter in India and owns copper mines in Australia.
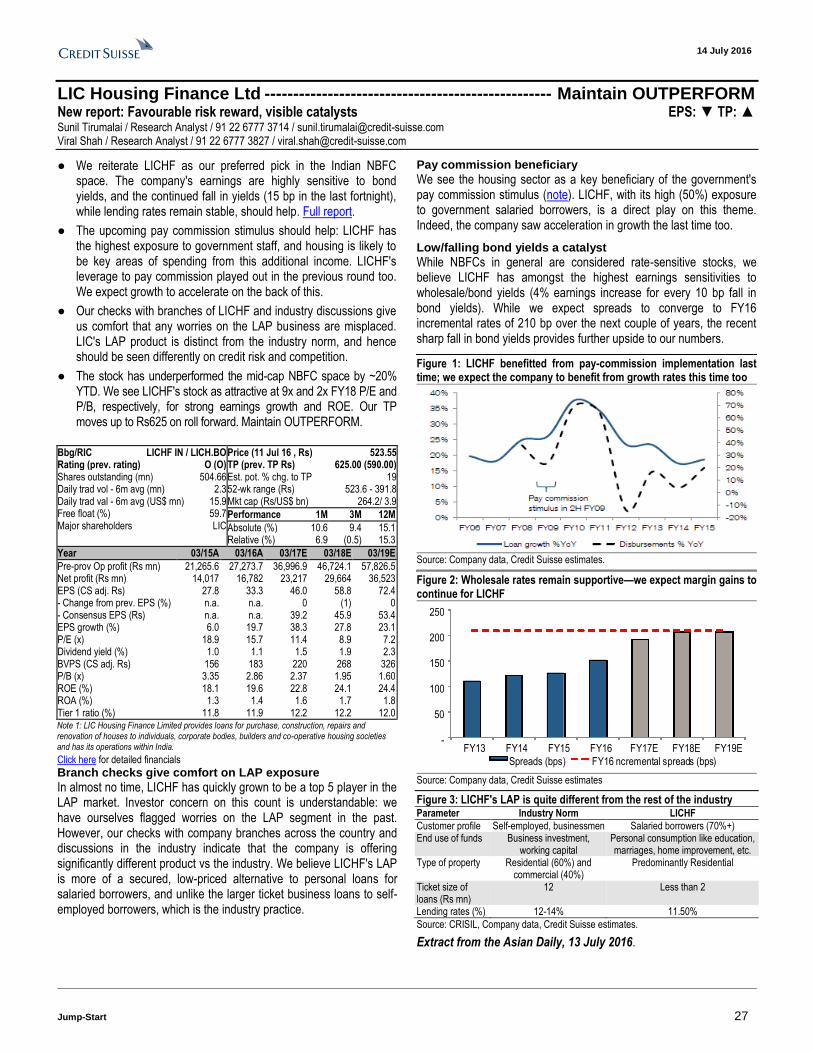
14 July 2016
Jump-Start 27
LIC Housing Finance Ltd -------------------------------------------------- Maintain OUTPERFORM New report: Favourable risk reward, visible catalysts EPS: ▼ TP: ▲ Sunil Tirumalai / Research Analyst / 91 22 6777 3714 / [email protected] Viral Shah / Research Analyst / 91 22 6777 3827 / [email protected]
● We reiterate LICHF as our preferred pick in the Indian NBFC space. The company's earnings are highly sensitive to bond yields, and the continued fall in yields (15 bp in the last fortnight), while lending rates remain stable, should help. Full report.
● The upcoming pay commission stimulus should help: LICHF has the highest exposure to government staff, and housing is likely to be key areas of spending from this additional income. LICHF's leverage to pay commission played out in the previous round too. We expect growth to accelerate on the back of this.
● Our checks with branches of LICHF and industry discussions give us comfort that any worries on the LAP business are misplaced. LIC's LAP product is distinct from the industry norm, and hence should be seen differently on credit risk and competition.
● The stock has underperformed the mid-cap NBFC space by ~20% YTD. We see LICHF's stock as attractive at 9x and 2x FY18 P/E and P/B, respectively, for strong earnings growth and ROE. Our TP moves up to Rs625 on roll forward. Maintain OUTPERFORM.
Click here for detailed financials
Branch checks give comfort on LAP exposure
In almost no time, LICHF has quickly grown to be a top 5 player in the LAP market. Investor concern on this count is understandable: we have ourselves flagged worries on the LAP segment in the past. However, our checks with company branches across the country and discussions in the industry indicate that the company is offering significantly different product vs the industry. We believe LICHF's LAP is more of a secured, low-priced alternative to personal loans for salaried borrowers, and unlike the larger ticket business loans to self-employed borrowers, which is the industry practice.
Pay commission beneficiary
We see the housing sector as a key beneficiary of the government's pay commission stimulus (note). LICHF, with its high (50%) exposure to government salaried borrowers, is a direct play on this theme. Indeed, the company saw acceleration in growth the last time too.
Low/falling bond yields a catalyst
While NBFCs in general are considered rate-sensitive stocks, we believe LICHF has amongst the highest earnings sensitivities to wholesale/bond yields (4% earnings increase for every 10 bp fall in bond yields). While we expect spreads to converge to FY16 incremental rates of 210 bp over the next couple of years, the recent sharp fall in bond yields provides further upside to our numbers.
Figure 1: LICHF benefitted from pay-commission implementation last time; we expect the company to benefit from growth rates this time too
Source: Company data, Credit Suisse estimates.
Figure 2: Wholesale rates remain supportive—we expect margin gains to continue for LICHF
-
50
100
150
200
250
FY13 FY14 FY15 FY16 FY17E FY18E FY19E
Spreads (bps) FY16 ncremental spreads (bps)
Source: Company data, Credit Suisse estimates
Figure 3: LICHF's LAP is quite different from the rest of the industry Parameter Industry Norm LICHF
Customer profile Self-employed, businessmen Salaried borrowers (70%+) End use of funds Business investment,
working capital Personal consumption like education, marriages, home improvement, etc.
Type of property Residential (60%) and commercial (40%)
Predominantly Residential
Ticket size of loans (Rs mn)
12 Less than 2
Lending rates (%) 12-14% 11.50%
Source: CRISIL, Company data, Credit Suisse estimates.
Extract from the Asian Daily, 13 July 2016.
Bbg/RIC LICHF IN / LICH.BO Rating (prev. rating) O (O) Shares outstanding (mn) 504.66 Daily trad vol - 6m avg (mn) 2.3 Daily trad val - 6m avg (US$ mn) 15.9 Free float (%) 59.7 Major shareholders LIC
Price (11 Jul 16 , Rs) 523.55 TP (prev. TP Rs) 625.00 (590.00) Est. pot. % chg. to TP 19 52-wk range (Rs) 523.6 - 391.8 Mkt cap (Rs/US$ bn) 264.2/ 3.9
Performance 1M 3M 12M
Absolute (%) 10.6 9.4 15.1 Relative (%) 6.9 (0.5) 15.3
Year 03/15A 03/16A 03/17E 03/18E 03/19E
Pre-prov Op profit (Rs mn) 21,265.6 27,273.7 36,996.9 46,724.1 57,826.5 Net profit (Rs mn) 14,017 16,782 23,217 29,664 36,523 EPS (CS adj. Rs) 27.8 33.3 46.0 58.8 72.4 - Change from prev. EPS (%) n.a. n.a. 0 (1) 0 - Consensus EPS (Rs) n.a. n.a. 39.2 45.9 53.4 EPS growth (%) 6.0 19.7 38.3 27.8 23.1 P/E (x) 18.9 15.7 11.4 8.9 7.2 Dividend yield (%) 1.0 1.1 1.5 1.9 2.3 BVPS (CS adj. Rs) 156 183 220 268 326 P/B (x) 3.35 2.86 2.37 1.95 1.60 ROE (%) 18.1 19.6 22.8 24.1 24.4 ROA (%) 1.3 1.4 1.6 1.7 1.8 Tier 1 ratio (%) 11.8 11.9 12.2 12.2 12.0
Note 1: LIC Housing Finance Limited provides loans for purchase, construction, repairs and renovation of houses to individuals, corporate bodies, builders and co-operative housing societies and has its operations within India.

14 July 2016
Jump-Start 28
POSCO --------------------------------------------------------------------------- Maintain OUTPERFORM New report: Supply reform in China real this time EPS: ◄► TP: ◄► Minseok Sinn / Research Analyst / 82 2 3707 8898 / [email protected] Hoonsik Min / Research Analyst / 82 2 3707 3761 / [email protected]
● We believe that a real restructuring in the China steel industry is happening led by banks’ credit tightening. Chinese government’s will for supply reform has never been as strong as it is currently given the plan is more detailed than in the past, and the targets have been repeatedly confirmed by multiple related authorities.
● Many of POSCO’s major consolidated subsidiaries appear to be currently passing through their cyclical/earnings bottoms in 2015-2016, while supply reform in China will help not only the parent POSCO but also most of its overseas subsidiaries.
● We also expect a notable decrease in POSCO’s net non-OP expense from W1.8 tn/W2.2 tn in 2014/15 to W1.0 tn/ W0.6 tn in 2016/17E, respectively. POSCO’s assets and balance sheet appear to have been fairly cleaned up as of end-2Q16 eventually.
● Reiterate Outperform. We believe POSCO currently offers an appealing risk-averse return. The stock’s compelling dividend yield and cheap valuation could minimize the downside risk, even if our positive view on steel margin outlook does not work. Full report.
Click here for detailed financials
A further drastic expansion of steel spread less likely in the near term. We expect steel spread in Asia to stay at around the current level for a while. Steel mills’ weak profitability, a lower inventory level, and a better-than-expected demand support the spread/margin outlook. On the other hand, a sharp rebound in steel production in China since March is likely to hinder any further expansion of the steel spread in the near term, while over-capacity issue still remains a key overhang on the industry.
Supply reform in China a key driver of mid-to-long-term margin outlook. We anticipate Chinese government’s supply reform plan to deliver a meaningful outcome over the next few years. It could work as a key driver for POSCO eventually by helping steel price/spread in
Asia. We believe that a real restructuring in China steel industry is happening this time led by banks’ credit tightening (Credit Suisse’s China materials team expects steel capacity shutdown of 150 mn t over 2016-18, equivalent to 14% of China’s current total capacity), while the Chinese government’s will for supply reform has never been as strong as it is currently.
Consolidated subsidiaries passing through the earnings bottom. We believe that many of POSCO’s major consolidated subsidiaries are currently passing through their cyclical/earnings bottoms in 2015-2016, even though a drastic turnaround is less likely in the near term. We anticipate the supply reform in China to help not only the parent POSCO but also most of its overseas subsidiaries, which are primarily into the steel business. On the other hand, a meaningful turnaround of its major subsidiaries in Korea, which are mostly non-steel companies, is likely to take more time.
Figure 1: POSCO—breakdown of operating profit and pre-tax profit (W bn) 2012 2013 2014 2015 2016E 2017E 2018E
Operating Profit 3,653 2,996 3,214 2,410 2,708 3,076 3,416 Steel 3,070 2,363 2,268 1,876 2,419 2,594 2,842 Trading 139 82 285 192 175 211 242 E&C 10 179 446 266 64 182 185 Energy & others 434 372 215 76 50 89 148 Non-OP expense (net) 285 1,050 1,835 2,229 973 614 583 Pre-tax profit 3,368 1,946 1,379 181 1,735 2,462 2,833
Source: Company data, Credit Suisse estimates
A notable decrease in non-OP expense 2H16 onwards. POSCO’s assets and balance sheet appear to have been fairly clean as of end-2Q16. We believe that POSCO’s sizable net non-operating losses in recent years had already peaked in 2014-15 and expect a notable decrease in its net non-OP expense from W1.8 tn/W2.2 tn in 2014/15 to W1.0 tn/W0.6 tn in 2016/17E, respectively.
Offering an appealing risk-averse return. We reiterate our OUTPERFORM rating and TP of W280,000. While we continue to believe that steel spread in Asia has already seen its bottom in late 2015, the earnings improvement of major consolidated overseas subsidiaries and a notable decrease in its net non-operating expense from 2H16 onwards are additional positives. The stock’s appealing dividend yield (c.2.7% currently) and cheap valuation (2016E P/B of only 0.4x currently) could minimise any downside risk, even if our positive view on the steel margin outlook does not work.
Risks. Credit Suisse’s Economics team has lately revised down its forecast for Korea’s GDP growth for 2016-17E from 2.6%/2.9% to 2.4%/2.7%, indicating a continuing weak demand growth outlook in the domestic market. Meanwhile, a strengthening USD (if it happens) may put pressure on steel price outlook given the close inverse correlation between USD and steel price historically.
Extract from the Asian Daily, 14 July 2016.
Bbg/RIC 005490 KS / 005490.KS Rating (prev. rating) O (O) Shares outstanding (mn) 87.19 Daily trad vol - 6m avg (mn) 0.4 Daily trad val - 6m avg (US$ mn) 70.6 Free float (%) 83.9 Major shareholders Korea National
Pension - 10.0%
Price (13 Jul 16 , W) 227,000 TP (prev. TP W) 280,000 (280,000) Est. pot. % chg. to TP 23 52-wk range (W) 249000.0 - 156000.0 Mkt cap (W/US$ bn) 19,791.4/ 17.3
Performance 1M 3M 12M
Absolute (%) 7.6 (8.3) 4.4 Relative (%) 6.2 (7.8) 7.0
Year 12/14A 12/15A 12/16E 12/17E 12/18E
Revenue (W bn) 65,098 58,192 54,126 56,680 57,573 EBITDA (W bn) 6,452 5,628 6,034 6,407 6,739 Net profit (W bn) 626 181 1,285 1,793 2,053 EPS (CS adj. W) 7,827 2,258 16,060 22,416 25,666 - Change from prev. EPS (%) n.a. n.a. 0 0 0 - Consensus EPS (W) n.a. n.a. 16,341 20,074 21,704 EPS growth (%) (54.6) (71.1) 611.2 39.6 14.5 P/E (x) 29.0 100.5 14.1 10.1 8.8 Dividend yield (%) 4.5 3.5 2.6 2.6 2.6 EV/EBITDA (x) 6.7 7.1 6.3 5.8 5.4 P/B (x) 0.4 0.4 0.4 0.4 0.4 ROE (%) 1.5 0.4 3.1 4.2 4.6 Net debt(cash)/equity (%) 52.1 45.2 39.8 37.4 33.5
Note 1: ORD/ADR=0.25. Note 2: POSCO is an integrated steel producer in Korea. POSCO's product portfolio consists of hot rolled steels, steel plates, wire rods, cold rolled steels, galvanized steels, electrical galvanized steels, electrical steels, stainless steels and titanium product

14 July 2016
Jump-Start 29
Sunny Optical Technology Group Co., Limited ----------------- Upgrade to OUTPERFORM New report: Back to the long-term bull camp on Sunny EPS: ▲ TP: ▲ Sam Li / Research Analyst / 852 2101 6775 / [email protected] Pauline Chen / Research Analyst / 886 2 2715 6323 / [email protected] Kyna Wong / Research Analyst / 852 2101 6950 / [email protected]
● We move back to the bull camp on Sunny with a new TP of HK$32.5 for the secular up-cycles of optical applications in auto and smartphone markets. Our confidence on the LT growth potential now exceeds prior concerns on NT handset market headwinds and
valuation, and thus drives our upgrade on the stock. Full report. ● Three reasons for our view change: (1) The ADAS market is entering
a decade long content increase cycle, while Sunny could be a key beneficiary with its favourable position in the global vehicle lens market. (2) The emergence of multi-cam solutions, such as the dual-cam in 2016/17, on smartphone would help double TAM, in which Sunny is clearly a front-runner. (3) For NT, strong June shipment numbers could help increase market confidence on Sunny's executions and relieve concerns on its full-year shipment guidance.
● More dual-cam model launches, penetration into dual-cam lens supply chain, recovering monthly shipments, and SZ-HK-Connect are key NT catalysts.
● Our new TP of HK$32.5 (from 23.3) is now based on 20x ADAS upstream average P/E and 2H17/1H18 EPS.
Click here for detailed financials
Upgrade to OUTPERFORM for secular up-cycle
We move back to the bull camp on Sunny with a new TP of HK$32.5, for the secular up-cycles of optical applications in the auto and smartphone
markets. Our confidence on the LT growth potential now exceeds prior concerns on NT handset market headwinds and valuation, and thus drives our upgrade on the stock.
Three reasons for our view change
(1) We see the ADAS (Advanced Driver Assistance Systems) market entering a decade long content increase cycle (Level 3/4 automations add semi content per car by US$300/450 vs Level 2), while Sunny could be a key beneficiary with its favorable position in the global vehicle lens market. (2) The emerge of multi-cam solutions, such as the dual-cam in 2016/17, on smartphone would help double the TAM for new applications on 3D/optical zooming/VR/AR, in which Sunny is clearly a front-runner. (3) For NT, strong June shipment numbers could help increase market confidence on Sunny's executions and relieve concerns on its full-year shipment guidance.
Catalysts
We see more dual-cam model launches, penetration into the dual-cam lens supply chain at key clients, recovering monthly shipment numbers, and SZ-HK-Connect as key NT catalysts.
Raise TP to HK$32.5
We cut 2016E EPS by 3% for NT headwinds but raise 2017/18E EPS by 1%/2% for the upsides in dual-cam/ADAS. New TP of HK$32.5 (from 23.3) is now based on 20x ADAS upstream average P/E and 2H17/1H18 EPS. Key downside risks: weakening China smartphone demand, pricing and margin pressure on competition, and slower-than-expected smartphone upgrades or ADAS adoptions.
Figure 1: Sunny's vehicle lens business in a secular up-cycle
0%
10%
20%
30%
40%
50%
60%
70%
80%
90%
0
500
1,000
1,500
2,000
2,500
3,000
3,500
4,000
4,500
5,000
2012 2013 2014 2015 2016E 2017E 2018E 2025E 2030E
Vehicle lens rev enue, Rmb mn YoY
Source: Company data, Credit Suisse estimates
Valuation metrics Rating TP Up/dn Div. yld ROE P/B Company Ticker (prev. Price Chg to TP Year EPS Chg(%) EPS EPS grth (%) P/E (x) (%) (%) (x)
rating) Local Target (%) (%) T T+1 T+2 T+1 T+2 T+1 T+2 T+1 T+2 T+1 T+1 T+1
Sunny Optical 2382.HK O (N) [V] 26.20 32.50 (23.30) 39 24 12/16 (2.6) 0.6 1.01 1.32 43 32 22.5 17.1 1.0 25.6 5.2
Note: O = OUTPERFORM, N = NEUTRAL, U = UNDERPERFORM Source: Company data, Credit Suisse estimates
Extract from the Asian Daily, 11 July 2016.
Bbg/RIC 2382 HK / 2382.HK Rating (prev. rating) O (N) [V] Shares outstanding (mn) 1,097.00 Daily trad vol - 6m avg (mn) 6.0 Daily trad val - 6m avg (US$ mn) 17.2 Free float (%) 61.6 Major shareholders Sun Xu Limited
Price (08 Jul 16 , HK$) 26.20 TP (prev. TP HK$) 32.50 (23.30) Est. pot. % chg. to TP 24 52-wk range (HK$) 28.1 - 12.1 Mkt cap (HK$/US$ mn) 28,741.4/ 3,705.0
Performance 1M 3M 12M
Absolute (%) 3.6 9.2 53.8 Relative (%) 4.7 10.9 73.6
Year 12/14A 12/15A 12/16E 12/17E 12/18E
Revenue (Rmb mn) 8,426 10,696 13,205 14,860 16,639 EBITDA (Rmb mn) 800 1,160 1,513 1,921 2,312 Net profit (Rmb mn) 566 762 1,090 1,434 1,735 EPS (CS adj. Rmb) 0.52 0.70 1.01 1.32 1.60 - Change from prev. EPS (%) n.a. n.a. (2.6) 0.6 1.9 - Consensus EPS (Rmb) n.a. n.a. 1.00 1.27 1.55 EPS growth (%) 20.5 34.1 43.1 31.6 21.0 P/E (x) 43.1 32.1 22.5 17.1 14.1 Dividend yield (%) 0.5 0.7 1.0 1.4 1.7 EV/EBITDA (x) 30.5 20.1 15.4 11.8 9.4 P/B (x) 7.5 6.4 5.2 4.2 3.5 ROE (%) 18.6 21.5 25.6 27.4 27.0 Net debt(cash)/equity (%) (11.8) (36.8) (32.5) (37.5) (42.9)
Note 1: ORD/ADR=10.00. Note 2: Headquartered in Zhejiang province and established in 1984, Sunny Optical is a leading China optical components maker and its product offerings include handset lens, vehicle lens and handset camera modules (HCM), etc.

14 July 2016
Jump-Start 30
Taiwan Semiconductor Manufacturing ------------------------------- Maintain OUTPERFORM Outlook stays positive looking beyond short-term correction risks EPS: ◄► TP: ▲ Randy Abrams, CFA / Research Analyst / 886 2 2715 6366 / [email protected] Haas Liu / Research Analyst / 886 2 2715 6365 / [email protected]
● Results and guidance to be solid. TSMC should report solid 2Q results and 3Q guidance Thursday. Strong June sales of +11% MoM pushed 2Q +9% vs guidance for a 6-8% rise, and should lift GMs to the high end of 49-51% guidance. We lift 3Q16 from +10% to +15% on peak-season builds for Apple, China smartphones and graphics.
● A potential late-year correction following the strong builds. We model 4Q16 -10% QoQ, although 2016 is intact at 8% sales growth and 10% EPS growth, in line with the street. Management may flag potential for high inventory exiting 3Q16 to trigger softness in 4Q16.
● Modest sell-off possible during an adjustment. Since the financial crisis, TSMC has had five brief periods lagging the TAIEX during inventory adjustments, down 15% vs 10% for the TAIEX, raising the risk to monitor into 2H16 of a cooldown from the strong builds.
● Longer-term position remains intact. While we acknowledge the risk of another swift seasonal correction, we stay positive with its longer-term technology, profitability and yield intact. We roll over our target to 14x 2017E P/E, lifting TP from NT$177 to NT$185, and stay OUTPERFORM with 2016/17E EPS intact at NT$12.15/NT$13.20.
Click here for detailed financials
Results and guidance on Thursday to be solid TSMC should report solid 2Q results and 3Q guidance on Thursday. June sales were NT$81.4 bn, up 11% MoM, taking 2Q16 to NT$221.8 bn (+9.0% QoQ), above the guidance for a 6-8% increase on China smartphone builds and rising LTE in emerging markets as noted in our smartphone supply chain report. We also expect GMs at 50.7%, the high end of the 49-51% guidance, lifting CS EPS to NT$2.69 vs the street's NT$2.62. 3Q16 outlook to be strong, but 4Q16 may face some adjustments We raise TSMC's 3Q16 from +10% to +15% QoQ vs the street's 13.2%, ramping up 100% of Apple's a10 with InFO and catching up to
28nm demand from China smartphones, networking and graphics. GMs could rise to new cycle highs of 52-53% as high utilisation and improving 16nm yields are slightly offset by the initial InFO ramp-up. Off the high 3Q16, we now model 4Q16 down 10% QoQ, although keep our 2016 estimates intact at +8% sales growth and 10% EPS growth, in line with the street. Management may flag potential for high inventory exiting 3Q16 to trigger softness in 4Q16 (normal seasonal is -3% YoY). Semi inventory exited 1Q16 elevated at 84 days and total tech at 45 days.
Figure 1: Strong peak-season sales post 2008 have triggered a pullback
-10%
-5%
0%
5%
10%
15%
20%
25%
30%
-$100,000
-$50,000
$0
$50,000
$100,000
$150,000
$200,000
$250,000
$300,000
1Q10
2Q10
3Q10
4Q10
1Q11
2Q11
3Q11
4Q11
1Q12
2Q12
3Q12
4Q12
1Q13
2Q13
3Q13
4Q13
1Q14
2Q14
3Q14
4Q14
1Q15
2Q15
3Q15
4Q15
1Q16
2Q16
3Q16
4Q16
Revenue QoQ Growth
Sales (NT$) QoQ Change
Source: Credit Suisse estimates
A modest sell-off possible during an inventory correction While we stay positive on TSMC in the longer term—with competitive position staying intact and catalysts from rising dividend again in 2017, better Apple cycle in 2H17 and share gains on 7nm in 2018—we could face a short cyclical correction into a 4Q16 slowdown. Since the financial crisis, TSMC has had five corrections of 1-5 months' duration with its own stock declining 15% vs the TAIEX's -10% during the adjustments. The stock is vulnerable with QFII ownership at 78.8% (vs 78.9% all-time high) and at 34% of foreigners' Taiwan holdings (a 14-year high).
Figure 2: TSMC's decline of 15% vs 10% for the TAIEX during corrections
Trough
Date
Peak
Date
Shr
Trough
Shr
Peak
Trough
PE
Peak
PE
Trough
to Peak
(Mos)
Peak to
Trough
(Mos)
Trough
PB
Peak
PB
TSMC
% Rise
TSMC
% Fall
TAIEX
% Rise
TAIEX
% Fall
Dec/08 May/11 37.0 75.9 9.5 12.8 30 3 2.0 3.3 105% -16% 101% -18%
Aug/11 Apr/12 63.9 86.0 11.4 15.4 8 3 2.7 3.4 35% -12% 2% -5%
Jul/12 May/13 75.8 114.5 13.0 17.1 10 3 2.9 3.9 51% -16% 17% -5%
Aug/13 Jul/14 96.4 136.5 14.0 15.5 11 1 3.1 3.7 42% -12% 21% -2%
Aug/14 Mar/15 120.0 154.0 13.3 14.8 8 5 3.2 3.7 28% -21% 3% -18%
Aug/15 Jul/16 121.0 170.0 11.2 14.6 11 2.7 3.4 40% 13%
Historical avg: 62.6 95.9 30.6 50.8 13 7 3.0 4.4 76% -27% 26% -17%
Post Crisis avg: 84.0 115.5 13.0 15.9 13 3 2.8 3.6 50% -15% 26% -10% Source: Company data, Credit Suisse estimates
TSMC's intact looking past a late-year adjustment We maintain our 2016/17E EPS at NT$12.15/NT$13.20 but raise our target price from NT$177 to NT$185 as we roll over to 14x 2017E EPS and 3x 2017E P/B. Although a 4Q16 potential correction could dampen the stock price later in 3Q, we stay positive due to intact technology leadership, high margins, benign landscape, and rising cash yield.
Figure 3: CS above street for 2Q16/3Q16, factoring in a 4Q16 slowdown 2Q16 3Q16 4Q16 2015
(NT$ mn) CS CS(old) Street CS CS(old) Street CS CS(old) Street
Sales 221,810 217,007 217,967 255,491 238,708 246,649 230,656 249,450 245,509
Chg (%) 9.0 6.6 7.1 15.2 10.0 13.2 -9.7 4.5 -0.5
GM (%) 50.7 50.0 49.8 52.4 51.4 50.5 49.3 51.6 49.8
OpM (%) 40.5 39.5 39.6 43.1 41.4 40.2 38.7 41.8 39.6
Net Inc. 69,631 66,552 68,130 99,740 89,612 89,634 80,794 94,091 87,974
PF EPS (NT$) 2.69 2.57 2.62 3.85 3.46 3.45 3.12 3.63 3.40 Source: Credit Suisse estimates, Bloomberg consensus
Extract from the Asian Daily, 12 July 2016.
Bbg/RIC 2330 TT / 2330.TW Rating (prev. rating) O (O) Shares outstanding (mn) 25,931 Daily trad vol - 6m avg (mn) 36.7 Daily trad val - 6m avg (US$ mn) 173.9 Free float (%) 87.3 Major shareholders National Development
Fund (6.4%)
Price (11 Jul 16, NT$) 170.00 TP (prev. TP NT$) 185.00 (177.00) Est. pot. % chg. to TP 9 52-wk range (NT$) 170.0 - 115.0 Mkt cap (NT$/US$ bn) 4,408.2/ 136.9
Performance 1M 3M 12M
Absolute (%) 2.7 7.3 24.5 Relative (%) 1.9 4.3 26.0
Year 12/14A 12/15A 12/16E 12/17E 12/18E
Revenue (NT$ mn) 762,806 843,497 911,452 978,272 — EBITDA (NT$ mn) 495,477 544,098 593,226 655,319 — Net profit (NT$ mn) 263,634 287,452 314,958 342,272 — EPS (CS adj. NT$) 10.2 11.1 12.1 13.2 - Change from prev. EPS (%) n.a. n.a. 0 0 - Consensus EPS (NT$) n.a. n.a. 12.0 13.3 15.0 EPS growth (%) 40.1 9.0 9.6 8.7 n.a. P/E (x) 16.7 15.3 14.0 12.9 — Dividend yield (%) 1.8 2.6 3.5 3.8 EV/EBITDA (x) 8.5 7.5 6.8 6.0 — P/B (x) 4.2 3.6 3.2 2.8 — ROE (%) 27.9 25.4 24.3 23.4 — Net debt(cash)/equity (%) (17.8) (27.1) (27.8) (30.7) —
Note 1: ORD/ADR=5.00. Note 2: Taiwan Semiconductor Manufacturing Co., Ltd. is principally engaged in the research, development, manufacture and distribution of integrated circuit (IC) related products. The company operates its businesses through wafer manufacture, mask production.

14 July 2016
Jump-Start 31
Westports Holdings ------------------------------- Initiating Coverage with UNDERPERFORM New report: Waiting for a better price Muzhafar Mukhtar, CFA / Research Analyst / 60 3 2723 2084 / [email protected] Amanda Foo / Research Assistant
● Initiating coverage with UNDERPERFORM, TP: RM3.70. Westports Holdings (WHB) operates a key gateway to Peninsular Malaysia and a leading ASEAN transhipment container hub, both of which are under a concession until 2054. Full report
● 2016-2017 throughput growth may remain healthy. But ongoing M&A activity, alliance shifts, sluggish economic growth, and a 30% rise in Straits of Malacca capacity may result in WHB's top-line growth disappointing from 2018.
● The stock's popularity has remained undented in recent months. WHB trades at 24x CY16F P/E vs peer averages of 16-18x; EV/EBITDA of 16x is similarly elevated (peer avg: 10-13x). Credit Suisse's HOLT® analysis also indicates the stock to be fully valued.
● This is a well-run business with a wide moat and strong long-term growth prospects, in our view. But the market is already pricing in uninterrupted growth; temporary disappointment may put premium valuations under pressure, and open up a longer-term opportunity. Risks: Throughput growth may remain healthy in 2017, partly due to one-off activity.
Click here for detailed financials
Initiating coverage on Westports Holdings (WHB; UNDERPERFORM, TP: RM3.70).
WHB develops and manages Westports under a concession expiring in 2054. Located along the Straits of Malacca (SoM), a key channel for global trade, Westports is the key gateway serving the Klang Valley hinterland, and one of the top ASEAN transhipment hubs. Container throughput contributes ~80% of gross profits with the remainder from conventional cargo (10%), marine services (6%), and rental income (4%), on our estimates. Transhipment drives 72% of container throughput, but only makes up 37% of gross profits, vs 43% for gateway containers, on our estimates. Conventional cargo is also gateway traffic, making ~53% of earnings geared to captive hinterland demand. Blessed
by geographical advantages, we think WHB enjoys an economic moat, of which its consistently high profitability and ROIC are symptomatic.
Figure 1: ~60% of earnings are captive on our estimates, but transhipment volumes up for competition with other SoM ports
Transhipment
container37%
Gateway container
43%
Conventional
10%
Marine6%
Rental4%
FY15E gross profit breakdown
Source: Company data, Credit Suisse estimates
2018 will be an interesting year
WHB has scope under the concession to expand capacity by 45%, supported by strong financial adequacy. Consensus estimates are pointing to 9% revenue and earnings CAGR by 2018 (from 2015), whilst the stock price implies a terminal growth rate of 4% beyond that. However, there is scope for temporary disappointment. Sluggish economic growth may affect gateway and transhipment volume growth. SoM capacity will grow ~30% by 2018, due to expansion at all three major ports, which will help keep a lid on transhipment tariffs. Recent M&A activity and shifts in alliances open up the possibility of losing some throughput on a net basis to PSA, though we think it is too early to tell if the net impact will be negative. There is certainly scope for a neutral outcome, but this seems to already be priced in. In the worst case scenario, throughput growth may only be affected in 2018, but the market may well react ahead of that.
Pricing in immunity
WHB trades at 24x CY16F P/E vs peer averages of 16-18x; EV/EBITDA of 16x is similarly elevated (peer avg: 10-13x). Credit Suisse's HOLT® analysis also suggests the stock is being fully valued. Admittedly, good quality Malaysian businesses tend to suffer from high valuations due to captive and growing domestic funds, which may be exacerbated in the case of Shariah compliant stocks. We think WHB is a great business, but the stock is already pricing in no impact from the network realignments following M&A and alliance shifts. High multiples and risks for potential disappointments (even temporary ones) rarely make for good bedfellows. Having said that, our view is a short-term one, relative to the investment horizon used by port operators themselves; any net loss of throughput should simply be seen as a delay for WHB's achievement of its full potential earnings, in our view. We would see any significant adverse stock price reaction as a longer term opportunity, considering the quality of the business. Our TP of RM3.70 is based on a 10% discount to our DCF-derived value using 7% WACC, 5% throughput CAGR, and full capacity expansion allowed under the concession.
Extract from the Asian Daily, 12 July 2016.
Bbg/RIC WPRTS MK / WPHB.KL Rating (prev. rating) U (NA) Shares outstanding (mn) 3,410.00 Daily trad vol - 6m avg (mn) 2.9 Daily trad val - 6m avg (US$ mn) 3.0 Free float (%) 52.0 Major shareholders Pembinaan Redzai,
Hutchison Port Holdings
Price (08 Jul 16 , RM) 4.24 TP (prev. TP RM) 3.70 (NA) Est. pot. % chg. to TP (13) 52-wk range (RM) 4.43 - 3.79 Mkt cap (RM/US$ mn) 14,458.4/ 3,587.7
Performance 1M 3M 12M
Absolute (%) (2.3) (0.5) 0.2 Relative (%) (2.5) 3.6 4.4
Year 12/14A 12/15A 12/16E 12/17E 12/18E
Revenue (RM mn) 1,503 1,578 1,765 1,879 1,972 EBITDAR 814.2 899.6 985.1 1,022.2 1,059.1 Net profit (RM mn) 512.2 504.9 608.5 627.0 625.8 EPS (CS adj. RM) 0.15 0.15 0.18 0.18 0.18 - Change from prev. EPS (%) n.a. n.a. - Consensus EPS (RM) n.a. n.a. 0.18 0.19 0.19 EPS growth (%) 8.4 (1.4) 20.5 3.0 (0.2) P/E (x) 28.2 28.6 23.8 23.1 23.1 Dividend yield (%) 2.4 2.7 3.2 3.3 3.2 EV/EBITDAR (x) 18.6 16.9 15.8 15.2 14.4 P/B (x) 8.2 7.6 7.1 6.6 6.1 ROE (%) 30.4 27.6 30.8 29.5 27.4 Net debt(cash)/equity (%) 40.0 39.7 54.5 48.5 35.3
Note 1: Westport Holdings provides port services, handling container and cargo. It also provides marine, rental and other ancillary services.

14 July 2016
Jump-Start 32
Yahoo Japan ---------------------------------------------- Initiating Coverage with OUTPERFORM Earnings momentum at turning point; shift from forward investment to profit expansion Keiichi Yoneshima / Research Analyst / 81 3 4550 9740 / [email protected]
● We initiate coverage on Yahoo Japan with an OUTPERFORM rating and a target price of ¥600 (potential return 34.8%). We believe earnings momentum is at a turning point and will prove to be a positive for the share price. Click here for full report.
● We expect positive earnings impacts from the company's E-commerce Revolution strategy owing to: (1) sales promotion expenses peaking out, (2) higher shopping-related advertising along with growth in gross platform sales, and (3) revision of auction and membership fees.
● As we believe earnings momentum is at a favorable turning point, we rate the stock OUTPERFORM. Risks include growth in PC and smartphone advertising revenue (improvement/deterioration), less favorable supply/demand for company stock due to disposal by Yahoo! Inc. in the US, and changes in strategy by parent Softbank resulting in lower earnings.
● Our ¥600 target price is based on DCF. We forecast cash flow through FY3/20 and apply an EBITDA of 12x to calculate EV for FY3/21 onward. We use a WACC of 8.45%.
Click here for detailed financials
The company’s E-Commerce Revolution strategy, unveiled in October 2013, entails growth in total platform sales even at the expense of margins. In FY3/16, the consolidation of Askul (one-off gain of ¥59.7bn in 2Q) provided a temporary earnings boost to nominal profits. However, real profits are struggling, reflecting marketing expenses in the shopping and credit card businesses plus weak advertising growth amid the shift to smartphones.
Starting in 2016, we expect earnings to benefit from upfront investment in the shopping business peaking out coupled with revisions to auction fees, premium membership fees and rebate point costs for member stores. We expect real earnings momentum to rebound in FY3/17, so we think earnings and the share price are at a turning point. We are focusing on the items below in particular.
(1) Cost efficiencies: expect margins to improve due to sales promotion expenses peaking out.
(2) E-commerce Revolution strategy starting to bear fruit; shopping-related advertising starting to take off.
(3) Getting serious about membership businesses; higher auction and premium membership fees are boosting earnings.
Figure 1: Shopping-related transaction value
Source: Company data, Credit Suisse estimates
Figure 2: Shopping-related advertising revenue
Source: Company data, Credit Suisse estimates
Reasons for our OUTPERFORM rating
● The monetisation of the company’s E-Commerce Revolution strategy is in mid-stream, but sales promotion expenses peaked in FY3/16, and we expect this to support improvement in Yahoo! Shopping earnings. (Positive)
● We expect revision of fees for Yahoo! Auction (higher revenue), a higher T-point expense burden on merchants (lower expenses), and the revision of Yahoo! Premium fees (higher revenue) to benefit earnings. (Positive)
● The P/E looks inexpensive among major Internet services companies (Yahoo Japan, Rakuten, Recruit Holdings).
● Although search advertising continues to decline, we expect in-feed advertising and shopping advertising to grow (from Negative to Neutral).
● Yahoo! Inc.'s plans for its Yahoo Japan stake are unclear, but even assuming it sells the shares, we believe negative share price impact can be absorbed via buybacks.
● A change of strategy by parent company Softbank could affect Yahoo Japan's strategy and capital structure. At present relations look positive.
(This is an extract from Keiichi Yoneshima's report "Yahoo Japan: Initiating at OUTPERFORM; earnings momentum at turning point; shift from forward investment to profit expansion," published on 7 July 2016. For the full report, please visit our CS Plus website.)
Extract from the Asian Daily, 8 July 2016.
Bbg/RIC 4689 JP / 4689.T Rating (prev. rating) O (NA) Shares outstanding (mn) 5,692.56 Daily trad vol - 6m avg (mn) 12.0 Daily trad val - 6m avg (US$ mn) 56.0 Free float (%) 20.0 Major shareholders
Price (06 Jul 16, ¥) 445.00 TP (prev. TP ¥) 600.00 (NA) Est. pot. % chg. to TP 35 52-wk range (¥) 570.0-404.0 Mkt cap (¥/US$ bn) 2,533.1/ 25.0
Performance 1M 3M 12M
Absolute (%) (13.7) (7.2) (6.1) Relative (%) (5.1) (2.4) 16.5
Year 03/15A 03/16A 03/17E 03/18E 03/19E
Revenue (¥ bn) 428.5 652.3 864.3 901.2 934.4 EBITDA (¥ bn) 214.1 255.7 251.6 272.7 289.1 Net profit (¥ bn) 133.1 171.6 136.2 149.7 160.3 EPS (CS adj. ¥) 23.4 30.1 23.9 26.3 28.2 - Change from prev. EPS (%) n.a. n.a. - Consensus EPS (¥) n.a. n.a. 23.6 26.4 29.5 EPS growth (%) n.a. 29.0 (20.7) 10.0 7.1 P/E (x) 19.2 14.9 18.8 17.1 15.9 Dividend yield (%) 2.0 2.0 2.0 2.0 2.0 EV/EBITDA (x) 10.1 8.5 8.6 7.9 7.5 P/B (x) 3.5 2.8 2.6 2.3 2.1 ROE (%) 18.3 21.9 15.3 15.3 14.8 Net debt(cash)/equity (%) (53.0) (43.0) (39.2) (35.6) (32.3)
Note 1: ORD/ADR=2.00. Note 2: Yahoo Japan provides a variety of information content on its web site such as news, shopping, map, finance, and entertainment. The Company provides services including Internet search engine, broadband Internet, online auction, and Internet advertising.

14 July 2016
Jump-Start 33
NJA equities events calendar Date Co./Analyst Location Market Sector
Analyst Marketing
Jul 12 - Jul 27 Alvin Wong/ Kelvin Tam Hong Kong Hong Kong Property
Jul 13 - Jul 21 Sakthi Siva Singapore Regional Strategy
Jul 18 - Jul 19 Chung Hsu Hong Kong Taiwan Banks/Financials
Jul 18 - Jul 19 Jatin Chawla Singapore India Automobiles
Jul 18 - Jul 19 Randy Abrams/ Jerry Su Singapore Taiwan Technology
Jul 19 - Jul 20 Li Chen Hong Kong China Strategy
Jul 20 - Jul 21 Randy Abrams/ Jerry Su Hong Kong Taiwan Technology
Jul 20 - Jul 22 Jatin Chawla Hong Kong India Automobiles
Jul 20 - Jul 22 Alvin Wong/ Kelvin Tam China Hong Kong Property
Jul 25 - Jul 26 Alvin Wong/ Kelvin Tam Singapore Hong Kong Property
Jul 25 David Hewitt Philippines Singapore Energy
Jul 26 Chate Benchavitvilai Hong Kong Vietnam Strategy
Jul 27 - Jul 28 Dave Dai Singapore China Utilities
Jul 28 - Jul 29 Kevin Yin China Hong Kong Consumer
Aug 1 - Aug 2 Sunil Tirumalai Singapore India Telecoms
Aug 3 - Aug 4 Sunil Tirumalai Hong Kong India Telecoms
Aug 3 - Aug 4 Sam Li/ Kyna Wong Singapore China Technology
Aug 5 Sam Li/ Kyna Wong Malaysia China Technology
Aug 16 Chris Counihan Japan Global Chemicals
Aug 17 Chris Counihan Hong Kong Global Chemicals
Aug 18 Chris Counihan Malaysia Global Chemicals
Aug 19 Chris Counihan Singapore Global Chemicals
Aug 22 - Sep 1 Michael Sohn US South Korea Automobiles
Date Co./Analyst Location Market Sector
Non-Deal RoadShow
Jul 18 - Jul 19 Egis Technology Inc. Singapore Taiwan Technology
Jul 20 - Jul 22 Egis Technology Inc. Hong Kong Taiwan Technology
Jul 22 Vinda International Holdings Ltd Hong Kong China Consumer
Jul 25 - Jul 26 China Gas Holdings Ltd Singapore China Utilities
Jul 27 Mapletree Industrial Trust (Luncheon) Singapore Singapore Real Estate
Jul 29 Hang Lung Properties Limited (Luncheon) Hong Kong Hong Kong Real Estate
Jul 29 Cheung Kong Infrastructure, Power Assets Holdings Limited Hong Kong Hong Kong Utilities
Aug 10 Champion REIT Hong Kong Hong Kong Property
Aug 12 - Aug 15 Li Ning Co Ltd Hong Kong China Consumer
Aug 17 - Aug 18 8990 Holdings, Inc. Singapore Singapore Property
Aug 18 China Suntien Green Energy Corporation Hong Kong China Utilities
Aug 18 Japfa Ltd Singapore Singapore Consumer
Aug 19 8990 Holdings, Inc. Hong Kong Singapore Property
Aug 19 Japfa Ltd Hong Kong Singapore Consumer
Aug 22 Clariant Hong Kong Global Chemicals
Aug 23 Xtep Hong Kong China Consumer
Aug 24 Clariant China Global Chemicals
Please contact your Credit Suisse sales representatives if you have any queries.
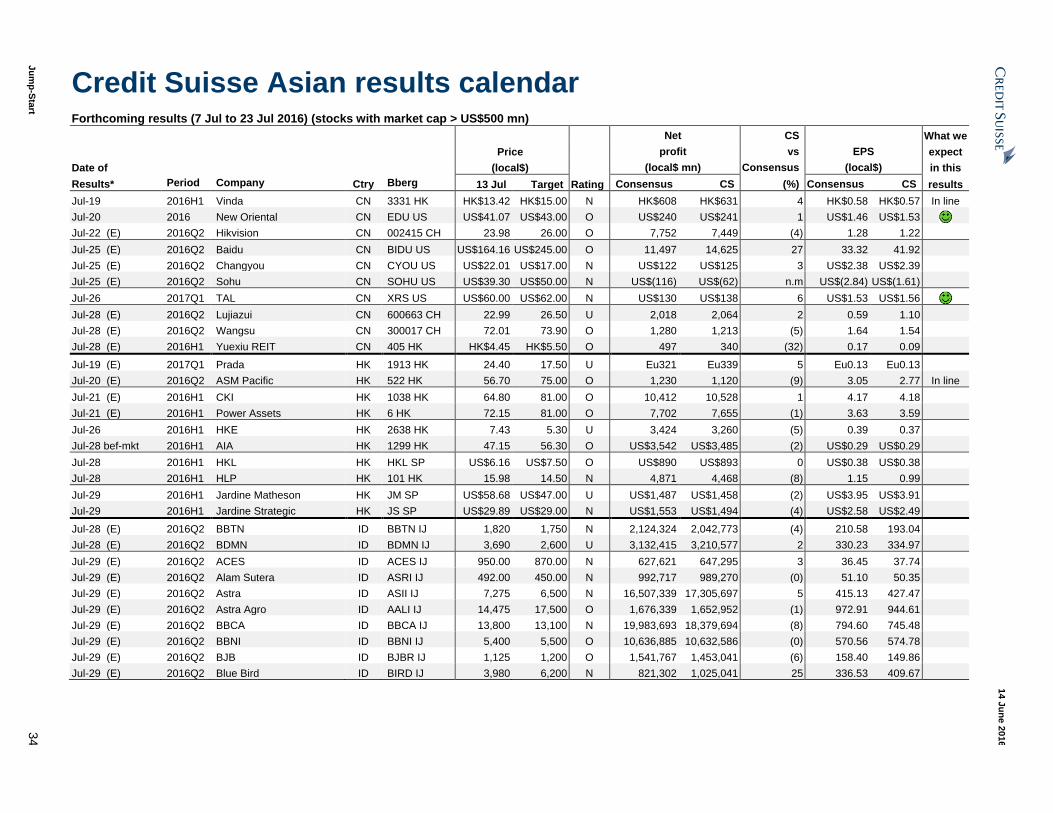
Ju
mp
-Sta
rt 3
4
14 J
un
e 2
016
Credit Suisse Asian results calendar Forthcoming results (7 Jul to 23 Jul 2016) (stocks with market cap > US$500 mn)
Net CS What we
Price profit vs EPS expect
Date of (local$) (local$ mn) Consensus (local$) in this
Results* Period Company Ctry Bberg 13 Jul Target Rating Consensus CS (%) Consensus CS results
Jul-19 2016H1 Vinda CN 3331 HK HK$13.42 HK$15.00 N HK$608 HK$631 4 HK$0.58 HK$0.57 In line
Jul-20 2016 New Oriental CN EDU US US$41.07 US$43.00 O US$240 US$241 1 US$1.46 US$1.53
Jul-22 (E) 2016Q2 Hikvision CN 002415 CH 23.98 26.00 O 7,752 7,449 (4) 1.28 1.22
Jul-25 (E) 2016Q2 Baidu CN BIDU US US$164.16 US$245.00 O 11,497 14,625 27 33.32 41.92
Jul-25 (E) 2016Q2 Changyou CN CYOU US US$22.01 US$17.00 N US$122 US$125 3 US$2.38 US$2.39
Jul-25 (E) 2016Q2 Sohu CN SOHU US US$39.30 US$50.00 N US$(116) US$(62) n.m US$(2.84) US$(1.61)
Jul-26 2017Q1 TAL CN XRS US US$60.00 US$62.00 N US$130 US$138 6 US$1.53 US$1.56
Jul-28 (E) 2016Q2 Lujiazui CN 600663 CH 22.99 26.50 U 2,018 2,064 2 0.59 1.10
Jul-28 (E) 2016Q2 Wangsu CN 300017 CH 72.01 73.90 O 1,280 1,213 (5) 1.64 1.54
Jul-28 (E) 2016H1 Yuexiu REIT CN 405 HK HK$4.45 HK$5.50 O 497 340 (32) 0.17 0.09
Jul-19 (E) 2017Q1 Prada HK 1913 HK 24.40 17.50 U Eu321 Eu339 5 Eu0.13 Eu0.13
Jul-20 (E) 2016Q2 ASM Pacific HK 522 HK 56.70 75.00 O 1,230 1,120 (9) 3.05 2.77 In line
Jul-21 (E) 2016H1 CKI HK 1038 HK 64.80 81.00 O 10,412 10,528 1 4.17 4.18
Jul-21 (E) 2016H1 Power Assets HK 6 HK 72.15 81.00 O 7,702 7,655 (1) 3.63 3.59
Jul-26 2016H1 HKE HK 2638 HK 7.43 5.30 U 3,424 3,260 (5) 0.39 0.37
Jul-28 bef-mkt 2016H1 AIA HK 1299 HK 47.15 56.30 O US$3,542 US$3,485 (2) US$0.29 US$0.29
Jul-28 2016H1 HKL HK HKL SP US$6.16 US$7.50 O US$890 US$893 0 US$0.38 US$0.38
Jul-28 2016H1 HLP HK 101 HK 15.98 14.50 N 4,871 4,468 (8) 1.15 0.99
Jul-29 2016H1 Jardine Matheson HK JM SP US$58.68 US$47.00 U US$1,487 US$1,458 (2) US$3.95 US$3.91
Jul-29 2016H1 Jardine Strategic HK JS SP US$29.89 US$29.00 N US$1,553 US$1,494 (4) US$2.58 US$2.49
Jul-28 (E) 2016Q2 BBTN ID BBTN IJ 1,820 1,750 N 2,124,324 2,042,773 (4) 210.58 193.04
Jul-28 (E) 2016Q2 BDMN ID BDMN IJ 3,690 2,600 U 3,132,415 3,210,577 2 330.23 334.97
Jul-29 (E) 2016Q2 ACES ID ACES IJ 950.00 870.00 N 627,621 647,295 3 36.45 37.74
Jul-29 (E) 2016Q2 Alam Sutera ID ASRI IJ 492.00 450.00 N 992,717 989,270 (0) 51.10 50.35
Jul-29 (E) 2016Q2 Astra ID ASII IJ 7,275 6,500 N 16,507,339 17,305,697 5 415.13 427.47
Jul-29 (E) 2016Q2 Astra Agro ID AALI IJ 14,475 17,500 O 1,676,339 1,652,952 (1) 972.91 944.61
Jul-29 (E) 2016Q2 BBCA ID BBCA IJ 13,800 13,100 N 19,983,693 18,379,694 (8) 794.60 745.48
Jul-29 (E) 2016Q2 BBNI ID BBNI IJ 5,400 5,500 O 10,636,885 10,632,586 (0) 570.56 574.78
Jul-29 (E) 2016Q2 BJB ID BJBR IJ 1,125 1,200 O 1,541,767 1,453,041 (6) 158.40 149.86
Jul-29 (E) 2016Q2 Blue Bird ID BIRD IJ 3,980 6,200 N 821,302 1,025,041 25 336.53 409.67
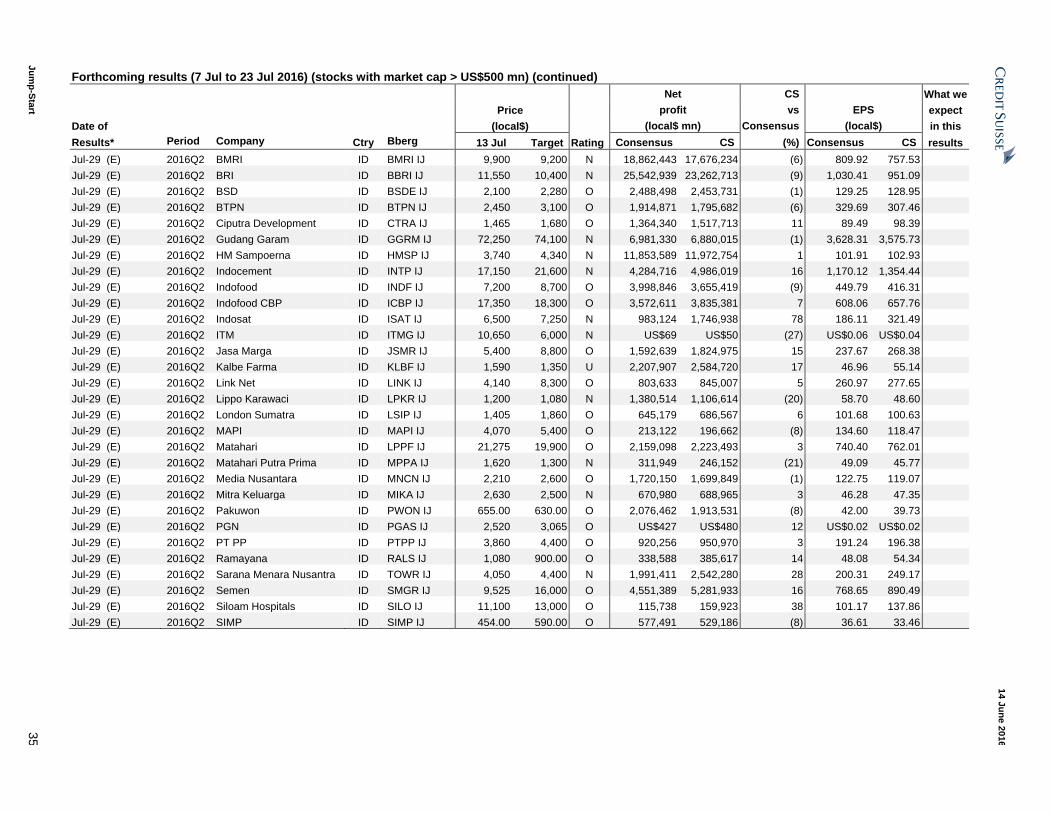
Ju
mp
-Sta
rt 3
5
14 J
un
e 2
016
Forthcoming results (7 Jul to 23 Jul 2016) (stocks with market cap > US$500 mn) (continued)
Net CS What we
Price profit vs EPS expect
Date of (local$) (local$ mn) Consensus (local$) in this
Results* Period Company Ctry Bberg 13 Jul Target Rating Consensus CS (%) Consensus CS results
Jul-29 (E) 2016Q2 BMRI ID BMRI IJ 9,900 9,200 N 18,862,443 17,676,234 (6) 809.92 757.53
Jul-29 (E) 2016Q2 BRI ID BBRI IJ 11,550 10,400 N 25,542,939 23,262,713 (9) 1,030.41 951.09
Jul-29 (E) 2016Q2 BSD ID BSDE IJ 2,100 2,280 O 2,488,498 2,453,731 (1) 129.25 128.95
Jul-29 (E) 2016Q2 BTPN ID BTPN IJ 2,450 3,100 O 1,914,871 1,795,682 (6) 329.69 307.46
Jul-29 (E) 2016Q2 Ciputra Development ID CTRA IJ 1,465 1,680 O 1,364,340 1,517,713 11 89.49 98.39
Jul-29 (E) 2016Q2 Gudang Garam ID GGRM IJ 72,250 74,100 N 6,981,330 6,880,015 (1) 3,628.31 3,575.73
Jul-29 (E) 2016Q2 HM Sampoerna ID HMSP IJ 3,740 4,340 N 11,853,589 11,972,754 1 101.91 102.93
Jul-29 (E) 2016Q2 Indocement ID INTP IJ 17,150 21,600 N 4,284,716 4,986,019 16 1,170.12 1,354.44
Jul-29 (E) 2016Q2 Indofood ID INDF IJ 7,200 8,700 O 3,998,846 3,655,419 (9) 449.79 416.31
Jul-29 (E) 2016Q2 Indofood CBP ID ICBP IJ 17,350 18,300 O 3,572,611 3,835,381 7 608.06 657.76
Jul-29 (E) 2016Q2 Indosat ID ISAT IJ 6,500 7,250 N 983,124 1,746,938 78 186.11 321.49
Jul-29 (E) 2016Q2 ITM ID ITMG IJ 10,650 6,000 N US$69 US$50 (27) US$0.06 US$0.04
Jul-29 (E) 2016Q2 Jasa Marga ID JSMR IJ 5,400 8,800 O 1,592,639 1,824,975 15 237.67 268.38
Jul-29 (E) 2016Q2 Kalbe Farma ID KLBF IJ 1,590 1,350 U 2,207,907 2,584,720 17 46.96 55.14
Jul-29 (E) 2016Q2 Link Net ID LINK IJ 4,140 8,300 O 803,633 845,007 5 260.97 277.65
Jul-29 (E) 2016Q2 Lippo Karawaci ID LPKR IJ 1,200 1,080 N 1,380,514 1,106,614 (20) 58.70 48.60
Jul-29 (E) 2016Q2 London Sumatra ID LSIP IJ 1,405 1,860 O 645,179 686,567 6 101.68 100.63
Jul-29 (E) 2016Q2 MAPI ID MAPI IJ 4,070 5,400 O 213,122 196,662 (8) 134.60 118.47
Jul-29 (E) 2016Q2 Matahari ID LPPF IJ 21,275 19,900 O 2,159,098 2,223,493 3 740.40 762.01
Jul-29 (E) 2016Q2 Matahari Putra Prima ID MPPA IJ 1,620 1,300 N 311,949 246,152 (21) 49.09 45.77
Jul-29 (E) 2016Q2 Media Nusantara ID MNCN IJ 2,210 2,600 O 1,720,150 1,699,849 (1) 122.75 119.07
Jul-29 (E) 2016Q2 Mitra Keluarga ID MIKA IJ 2,630 2,500 N 670,980 688,965 3 46.28 47.35
Jul-29 (E) 2016Q2 Pakuwon ID PWON IJ 655.00 630.00 O 2,076,462 1,913,531 (8) 42.00 39.73
Jul-29 (E) 2016Q2 PGN ID PGAS IJ 2,520 3,065 O US$427 US$480 12 US$0.02 US$0.02
Jul-29 (E) 2016Q2 PT PP ID PTPP IJ 3,860 4,400 O 920,256 950,970 3 191.24 196.38
Jul-29 (E) 2016Q2 Ramayana ID RALS IJ 1,080 900.00 O 338,588 385,617 14 48.08 54.34
Jul-29 (E) 2016Q2 Sarana Menara Nusantra ID TOWR IJ 4,050 4,400 N 1,991,411 2,542,280 28 200.31 249.17
Jul-29 (E) 2016Q2 Semen ID SMGR IJ 9,525 16,000 O 4,551,389 5,281,933 16 768.65 890.49
Jul-29 (E) 2016Q2 Siloam Hospitals ID SILO IJ 11,100 13,000 O 115,738 159,923 38 101.17 137.86
Jul-29 (E) 2016Q2 SIMP ID SIMP IJ 454.00 590.00 O 577,491 529,186 (8) 36.61 33.46
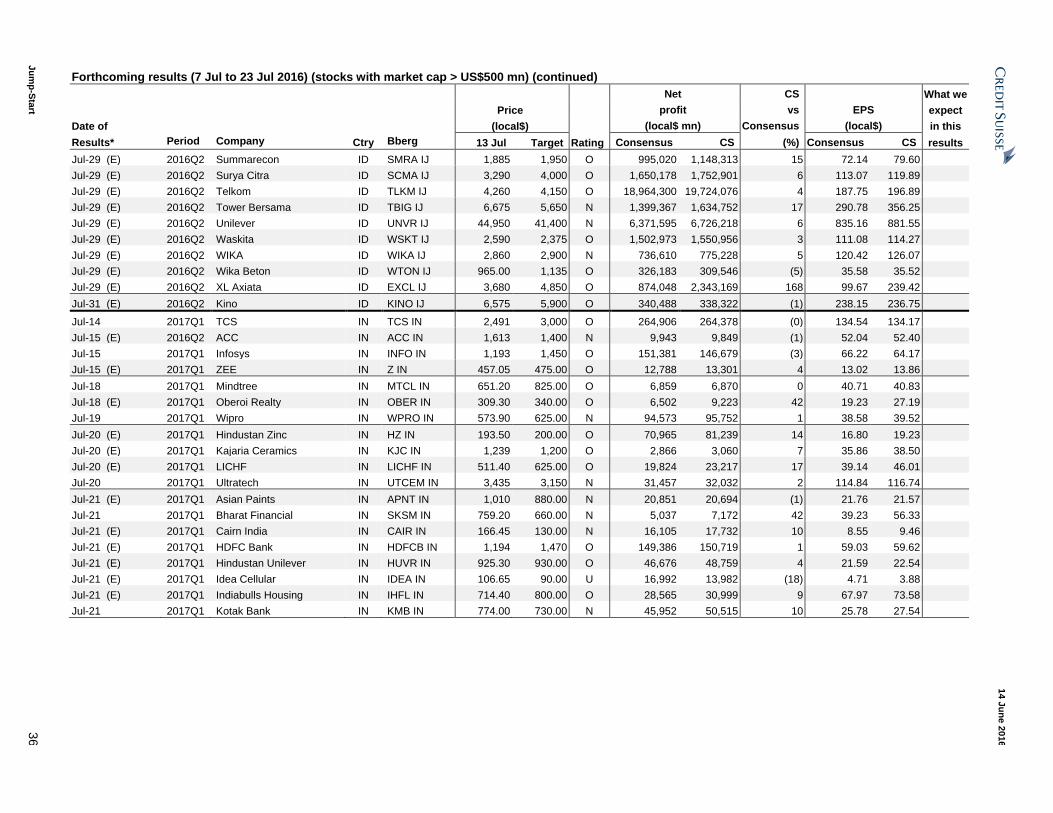
Ju
mp
-Sta
rt 3
6
14 J
un
e 2
016
Forthcoming results (7 Jul to 23 Jul 2016) (stocks with market cap > US$500 mn) (continued)
Net CS What we
Price profit vs EPS expect
Date of (local$) (local$ mn) Consensus (local$) in this
Results* Period Company Ctry Bberg 13 Jul Target Rating Consensus CS (%) Consensus CS results
Jul-29 (E) 2016Q2 Summarecon ID SMRA IJ 1,885 1,950 O 995,020 1,148,313 15 72.14 79.60
Jul-29 (E) 2016Q2 Surya Citra ID SCMA IJ 3,290 4,000 O 1,650,178 1,752,901 6 113.07 119.89
Jul-29 (E) 2016Q2 Telkom ID TLKM IJ 4,260 4,150 O 18,964,300 19,724,076 4 187.75 196.89
Jul-29 (E) 2016Q2 Tower Bersama ID TBIG IJ 6,675 5,650 N 1,399,367 1,634,752 17 290.78 356.25
Jul-29 (E) 2016Q2 Unilever ID UNVR IJ 44,950 41,400 N 6,371,595 6,726,218 6 835.16 881.55
Jul-29 (E) 2016Q2 Waskita ID WSKT IJ 2,590 2,375 O 1,502,973 1,550,956 3 111.08 114.27
Jul-29 (E) 2016Q2 WIKA ID WIKA IJ 2,860 2,900 N 736,610 775,228 5 120.42 126.07
Jul-29 (E) 2016Q2 Wika Beton ID WTON IJ 965.00 1,135 O 326,183 309,546 (5) 35.58 35.52
Jul-29 (E) 2016Q2 XL Axiata ID EXCL IJ 3,680 4,850 O 874,048 2,343,169 168 99.67 239.42
Jul-31 (E) 2016Q2 Kino ID KINO IJ 6,575 5,900 O 340,488 338,322 (1) 238.15 236.75
Jul-14 2017Q1 TCS IN TCS IN 2,491 3,000 O 264,906 264,378 (0) 134.54 134.17
Jul-15 (E) 2016Q2 ACC IN ACC IN 1,613 1,400 N 9,943 9,849 (1) 52.04 52.40
Jul-15 2017Q1 Infosys IN INFO IN 1,193 1,450 O 151,381 146,679 (3) 66.22 64.17
Jul-15 (E) 2017Q1 ZEE IN Z IN 457.05 475.00 O 12,788 13,301 4 13.02 13.86
Jul-18 2017Q1 Mindtree IN MTCL IN 651.20 825.00 O 6,859 6,870 0 40.71 40.83
Jul-18 (E) 2017Q1 Oberoi Realty IN OBER IN 309.30 340.00 O 6,502 9,223 42 19.23 27.19
Jul-19 2017Q1 Wipro IN WPRO IN 573.90 625.00 N 94,573 95,752 1 38.58 39.52
Jul-20 (E) 2017Q1 Hindustan Zinc IN HZ IN 193.50 200.00 O 70,965 81,239 14 16.80 19.23
Jul-20 (E) 2017Q1 Kajaria Ceramics IN KJC IN 1,239 1,200 O 2,866 3,060 7 35.86 38.50
Jul-20 (E) 2017Q1 LICHF IN LICHF IN 511.40 625.00 O 19,824 23,217 17 39.14 46.01
Jul-20 2017Q1 Ultratech IN UTCEM IN 3,435 3,150 N 31,457 32,032 2 114.84 116.74
Jul-21 (E) 2017Q1 Asian Paints IN APNT IN 1,010 880.00 N 20,851 20,694 (1) 21.76 21.57
Jul-21 2017Q1 Bharat Financial IN SKSM IN 759.20 660.00 N 5,037 7,172 42 39.23 56.33
Jul-21 (E) 2017Q1 Cairn India IN CAIR IN 166.45 130.00 N 16,105 17,732 10 8.55 9.46
Jul-21 (E) 2017Q1 HDFC Bank IN HDFCB IN 1,194 1,470 O 149,386 150,719 1 59.03 59.62
Jul-21 (E) 2017Q1 Hindustan Unilever IN HUVR IN 925.30 930.00 O 46,676 48,759 4 21.59 22.54
Jul-21 (E) 2017Q1 Idea Cellular IN IDEA IN 106.65 90.00 U 16,992 13,982 (18) 4.71 3.88
Jul-21 (E) 2017Q1 Indiabulls Housing IN IHFL IN 714.40 800.00 O 28,565 30,999 9 67.97 73.58
Jul-21 2017Q1 Kotak Bank IN KMB IN 774.00 730.00 N 45,952 50,515 10 25.78 27.54

Ju
mp
-Sta
rt 3
7
14 J
un
e 2
016
Forthcoming results (7 Jul to 23 Jul 2016) (stocks with market cap > US$500 mn) (continued)
Net CS What we
Price profit vs EPS expect
Date of (local$) (local$ mn) Consensus (local$) in this
Results* Period Company Ctry Bberg 13 Jul Target Rating Consensus CS (%) Consensus CS results
Jul-22 2017Q1 Axis Bank IN AXSB IN 556.65 592.00 O 88,332 89,468 1 36.91 37.45
Jul-22 (E) 2017Q1 Bajaj Auto IN BJAUT IN 2,656 2,420 N 41,207 42,654 4 142.10 147.55
Jul-22 (E) 2017Q1 Bajaj Finance IN BAF IN 8,585 5,500 U 16,716 17,564 5 306.92 327.99
Jul-22 (E) 2017Q1 Bharti Infratel IN BHIN IN 352.05 375.00 N 27,003 25,159 (7) 14.43 13.62
Jul-22 (E) 2017Q1 Concor IN CCRI IN 1,429 1,250 N 9,612 9,373 (2) 49.20 48.07
Jul-22 (E) 2017Q1 GAIL IN GAIL IN 390.15 310.00 U 33,982 34,305 1 26.85 27.04
Jul-22 (E) 2017Q1 JSW Energy IN JSW IN 81.05 72.00 N 13,436 11,704 (13) 8.18 7.14
Jul-22 (E) 2017Q1 Lupin IN LPC IN 1,649 1,905 O 29,961 31,434 5 65.73 70.10
Jul-22 (E) 2017Q1 MMFSL IN MMFS IN 345.40 410.00 O 8,853 13,063 48 15.77 22.96
Jul-22 (E) 2017Q1 TTK Prestige IN TTKPT IN 4,745 4,340 N 1,543 1,578 2 134.29 135.38
Jul-22 (E) 2017Q1 TVS IN TVSL IN 307.65 260.00 U 6,342 5,921 (7) 13.40 12.46
Jul-22 (E) 2017Q1 United Spirits IN UNSP IN 2,501 2,750 O 5,642 4,922 (13) 38.57 34.39
Jul-25 (E) 2017Q1 Havells IN HAVL IN 359.80 400.00 O 6,314 6,343 0 10.11 10.16
Jul-25 2017Q1 InfoEdge IN INFOE IN 830.00 825.00 N 1,240 896 (28) 10.49 7.39
Jul-25 (E) 2017Q1 IOB IN IOB IN 27.80 19.00 U (23,243) (1,216) n.m (9.70) (0.71)
Jul-26 2017Q1 Dr. Reddy's IN DRRD IN 3,608 3,070 N 23,773 21,219 (11) 138.79 125.11
Jul-26 2016Q2 Mahindra CIE IN MACA IN 186.70 250.00 O 2,884 2,750 (5) 8.92 8.51
Jul-27 (E) 2016Q2 Ambuja Cements IN ACEM IN 260.55 220.00 N 12,476 11,973 (4) 8.01 7.73
Jul-27 (E) 2017Q1 Just Dial IN JUST IN 580.35 800.00 N 1,304 1,030 (21) 18.69 14.50
Jul-27 (E) 2017Q1 Torrent IN TRP IN 1,418 1,500 O 12,458 11,803 (5) 73.66 69.74
Jul-28 (E) 2017Q1 BOI IN BOI IN 112.10 62.00 U 253 9,081 3,495 (0.17) 11.11
Jul-28 (E) 2017Q1 Dish TV IN DITV IN 98.45 108.00 O 3,369 3,570 6 3.20 3.35
Jul-28 (E) 2017Q1 HDFC IN HDFC IN 1,329 1,501 O 76,456 91,482 20 47.93 57.91
Jul-28 (E) 2017Q1 Maruti Suzuki IN MSIL IN 4,320 4,810 O 59,742 61,866 4 197.52 204.85
Jul-28 (E) 2017Q1 PNB IN PNB IN 124.95 62.00 U 19,332 25,206 30 9.55 12.84
Jul-28 (E) 2017Q1 Shriram City IN SCUF IN 1,754 1,880 O 6,422 7,915 23 98.38 120.05
Jul-28 (E) 2017Q1 Union Bank IN UNBK IN 135.05 145.00 O 16,203 14,993 (7) 22.51 21.81
Jul-28 (E) 2017Q1 Vedanta IN VEDL IN 164.20 120.00 O 37,278 44,546 19 11.94 15.02
Jul-29 (E) 2017Q1 BOB IN BOB IN 159.80 146.00 N 26,645 15,547 (42) 11.71 6.73
Jul-29 (E) 2017Q1 Dabur IN DABUR IN 316.80 280.00 N 14,326 14,318 (0) 8.16 8.14
Jul-29 (E) 2017Q1 Dalmia IN DBEL IN 1,205 625.00 U 4,190 3,476 (17) 44.44 39.19
Jul-29 (E) 2017Q1 Exide IN EXID IN 182.25 186.00 O 6,791 7,027 3 8.03 8.27
Jul-29 (E) 2017Q1 Glenmark IN GNP IN 844.85 840.00 N 13,308 10,371 (22) 46.81 36.90

Ju
mp
-Sta
rt 3
8
14 J
un
e 2
016
Forthcoming results (7 Jul to 23 Jul 2016) (stocks with market cap > US$500 mn) (continued)
Net CS What we
Price profit vs EPS expect
Date of (local$) (local$ mn) Consensus (local$) in this
Results* Period Company Ctry Bberg 13 Jul Target Rating Consensus CS (%) Consensus CS results
Jul-29 (E) 2017Q1 Godrej Consumer IN GCPL IN 1,602 1,550 O 13,642 14,332 5 40.04 42.09
Jul-29 (E) 2017Q1 Gujarat Pipavav IN GPPV IN 191.55 195.00 O 3,034 4,162 37 6.28 8.61
Jul-29 (E) 2017Q1 ICICI Bank IN ICICIBC IN 261.15 308.00 O 105,040 117,949 12 18.20 20.28
Jul-29 (E) 2017Q1 IDFC IN IDFC IN 52.05 82.00 O 9,011 7,346 (18) 5.62 4.61
Jul-29 (E) 2017Q1 IPCA IN IPCA IN 461.50 640.00 O 3,103 2,909 (6) 24.21 23.00
Jul-29 (E) 2017Q1 ITC IN ITC IN 247.00 273.33 O 113,280 109,624 (3) 9.02 9.12
Jul-29 (E) 2017Q1 JSW Steel IN JSTL IN 1,558 1,600 O 28,506 23,953 (16) 114.61 99.09
Jul-29 (E) 2017Q1 L&T IN LT IN 1,549 1,650 O 55,275 63,740 15 59.39 68.40
Jul-29 (E) 2016Q2 Nestle IN NEST IN 6,582 5,800 N 12,385 12,735 3 127.62 132.09
Jul-29 (E) 2017Q1 NTPC IN NTPC IN 157.35 180.00 O 96,770 94,042 (3) 11.67 11.41
Jul-29 (E) 2017Q1 Petronet LNG IN PLNG IN 287.70 305.00 O 11,745 12,111 3 15.67 16.15
Jul-29 (E) 2017Q1 Shriram IN SHTF IN 1,284 1,500 O 16,433 16,956 3 71.78 74.74
Jul-29 (E) 2017Q1 Strides IN STR IN 1,156 1,420 O 5,261 5,572 6 59.35 62.38
Jul-29 (E) 2017Q1 Sun TV IN SUNTV IN 372.30 375.00 N 10,422 10,224 (2) 26.43 25.94
Jul-29 (E) 2017Q1 Wabco IN WIL IN 5,685 6,400 O 2,653 3,185 20 139.87 167.94
Jul-29 (E) 2017Q1 Yes Bank IN YES IN 1,147 904.00 N 31,224 31,548 1 72.64 75.02
Jul-18 (E) 2016Q2 Hanssem KR 009240 KS 170,500 200,000 N 131,780 136,635 4 6,601 7,557
Jul-18 (E) 2016Q2 Shinsegae KR 004170 KS 190,000 240,000 N 176,668 158,142 (10) 16,855 16,063
Jul-19 (E) 2016Q2 Seoul Semi KR 046890 KS 14,800 14,300 N 27,966 33,137 18 497 568
Jul-20 (E) 2016Q2 Daewoo E&C KR 047040 KS 5,750 6,000 N 181,405 73,812 (59) 439 178
Jul-21 (E) 2016Q2 Doosan Heavy KR 034020 KS 24,250 31,800 O 191,043 121,040 (37) 1,621 1,225
Jul-21 @ 16:00 2016Q2 KFG KR 105560 KS 33,400 46,000 O 1,713,437 1,837,295 7 4,450 4,755
Jul-21 2016Q2 KT&G KR 033780 KS 126,500 143,000 O 1,085,342 1,140,595 5 8,208 9,060
Jul-21 2016Q2 POSCO KR 005490 KS 227,000 280,000 O 1,375,081 1,284,734 (7) 16,341 16,060
Jul-21 2016Q2 SFG KR 055550 KS 38,550 52,000 O 2,374,134 2,329,613 (2) 4,932 4,765
Jul-22 @ 16:00 2016Q2 HFG KR 086790 KS 23,750 32,000 O 1,165,694 1,246,987 7 3,924 4,213
Jul-22 (E) 2016Q2 Hotel Shilla KR 008770 KS 65,000 69,000 N 101,131 90,129 (11) 2,571 2,288
Jul-22 (E) 2016Q2 Hyundai Dev KR 012630 KS 39,350 65,000 O 298,219 293,069 (2) 3,819 3,983
Jul-22 (E) 2016Q2 Hyundai E&C KR 000720 KS 33,050 45,000 N 503,079 422,878 (16) 4,205 3,794
Jul-22 2016Q2 Hyundai Steel KR 004020 KS 50,700 72,000 O 838,835 764,326 (9) 6,328 5,863
Jul-22 2016Q2 SEMCO KR 009150 KS 49,850 65,000 O 161,121 220,159 37 2,079 2,947
Jul-25 (E) 2016Q2 LG H & H KR 051900 KS 1,095,000 1,260,000 O 604,540 659,992 9 37,024 37,250
Jul-26 2016Q2 Daelim KR 000210 KS 79,800 90,000 N 304,569 206,955 (32) 8,194 5,362
Jul-26 2016Q2 SK Hynix KR 000660 KS 32,650 42,000 O 1,833,263 1,932,964 5 2,541 2,738

Ju
mp
-Sta
rt 3
9
14 J
un
e 2
016
Forthcoming results (7 Jul to 23 Jul 2016) (stocks with market cap > US$500 mn) (continued)
Net CS What we
Price profit vs EPS expect
Date of (local$) (local$ mn) Consensus (local$) in this
Results* Period Company Ctry Bberg 13 Jul Target Rating Consensus CS (%) Consensus CS results
Jul-27 (E) 2016Q2 Hyundai Heavy KR 009540 KS 106,500 158,600 O 616,186 616,856 0 8,203 8,117
Jul-27 @ 14:10 2016Q2 Hyundai Motor KR 005380 KS 135,500 190,000 O 6,515,543 6,523,624 0 25,462 22,852
Jul-27 2016Q2 LG Display KR 034220 KS 28,150 23,700 N 296,738 270,663 (9) 797 739
Jul-27 @ 16:00 2016Q2 Mando KR 204320 KS 233,000 320,000 O 175,632 171,456 (2) 18,649 18,257
Jul-27 (E) 2016Q2 Samsung Heavy KR 010140 KS 9,740 16,000 O 61,293 74,426 21 283 363
Jul-28 2016Q2 BNK Financial KR 138930 KS 8,600 11,500 O 533,404 533,318 (0) 1,639 1,636
Jul-28 2016Q2 GS E&C KR 006360 KS 26,650 28,000 N 115,156 93,596 (19) 1,716 1,318
Jul-28 (E) 2016Q2 GS HS KR 028150 KS 170,600 200,000 N 105,074 112,817 7 15,955 17,190
Jul-28 @ 12:00 2016Q2 Hyundai Mobis KR 012330 KS 261,000 320,000 O 3,347,972 3,423,429 2 34,639 35,167
Jul-28 @ 14:00 2016Q2 Hyundai Wia KR 011210 KS 86,300 104,000 N 330,685 336,858 2 12,133 12,387
Jul-28 @ 10:00 2016Q2 Kia Motors KR 000270 KS 41,850 50,000 O 2,984,706 2,598,823 (13) 7,433 6,411
Jul-28 2016Q2 LGE KR 066570 KS 55,600 50,000 N 849,007 715,359 (16) 4,805 4,371
Jul-28 2016Q2 Samsung SDI KR 006400 KS 105,500 91,000 N 258,573 165,107 (36) 4,721 2,402
Jul-28 2016Q2 SEC KR 005930 KS 1,481,000 1,702,000 O 21,530,607 22,284,799 4 145,614 158,759
Jul-29 (E) 2016Q2 CJ Cheiljedang KR 097950 KS 403,000 500,000 O 358,734 338,664 (6) 25,181 26,471
Jul-29 2016Q2 Dongbu Insurance KR 005830 KS 65,300 67,000 N 458,872 478,958 4 6,907 6,765
Jul-29 2016Q2 Hyundai M&F KR 001450 KS 30,200 40,000 O 311,193 321,031 3 3,728 4,026
Jul-29 (E) 2016Q2 Hyundai Mipo KR 010620 KS 68,500 82,300 O 152,160 136,940 (10) 7,788 6,847
Jul-29 @ 16:00 2016Q2 IBK KR 024110 KS 11,250 13,000 N 1,154,426 1,145,226 (1) 1,860 1,879
Jul-29 2016Q2 KT Corp KR 030200 KS 30,700 37,000 O 688,362 706,268 3 2,663 2,885
Jul-29 2016Q2 Samsung F&M KR 000810 KS 272,000 364,000 O 924,746 948,664 3 20,951 23,783
Jul-15 (E) 2016Q2 Maxis MY MAXIS MK 6.00 5.30 U 1,863 1,659 (11) 0.25 0.22
Jul-28 (E) 2016Q2 BAT Malaysia MY ROTH MK 54.00 55.50 O 790 809 2 2.73 2.83
Jul-29 (E) 2016Q2 AirAsia MY AIRA MK 2.75 2.45 N 1,171 1,238 6 0.39 0.40
Jul-29 (E) 2016Q2 Malaysia Airports MY MAHB MK 6.20 5.30 U 154 322 109 0.09 0.19
Jul-29 (E) 2016Q2 Public Bank MY PBK MK 19.40 16.70 U 5,002 4,729 (5) 1.29 1.22
Jul-29 (E) 2016Q3 Tenaga MY TNB MK 14.32 12.20 U 7,073 7,615 8 1.26 1.35
Jul-29 (E) 2016Q2 Westports MY WPRTS MK 4.27 3.70 U 604 609 1 0.18 0.18
Jul-27 (E) 2016Q2 BDO PH BDO PM 113.40 94.80 N 26,090 26,467 1 7.18 7.26
Jul-27 (E) 2016Q2 Meralco PH MER PM 309.00 322.00 N 19,187 19,314 1 16.98 17.14
Jul-29 (E) 2016Q2 Aboitiz Power PH AP PM 44.95 44.60 N 18,828 19,057 1 2.57 2.59
Jul-29 (E) 2016Q2 AEV PH AEV PM 78.80 51.75 N 20,001 18,300 (9) 3.60 3.30
Jul-29 (E) 2016Q2 Belle Corp PH BEL PM 3.44 3.11 N 2,174 1,719 (21) 0.21 0.17
Jul-29 (E) 2016Q2 MWC PH MWC PM 27.50 21.00 U 5,549 5,503 (1) 2.60 2.68
Jul-29 (E) 2016Q2 SECB PH SECB PM 197.40 196.10 N 8,567 8,506 (1) 12.47 12.55
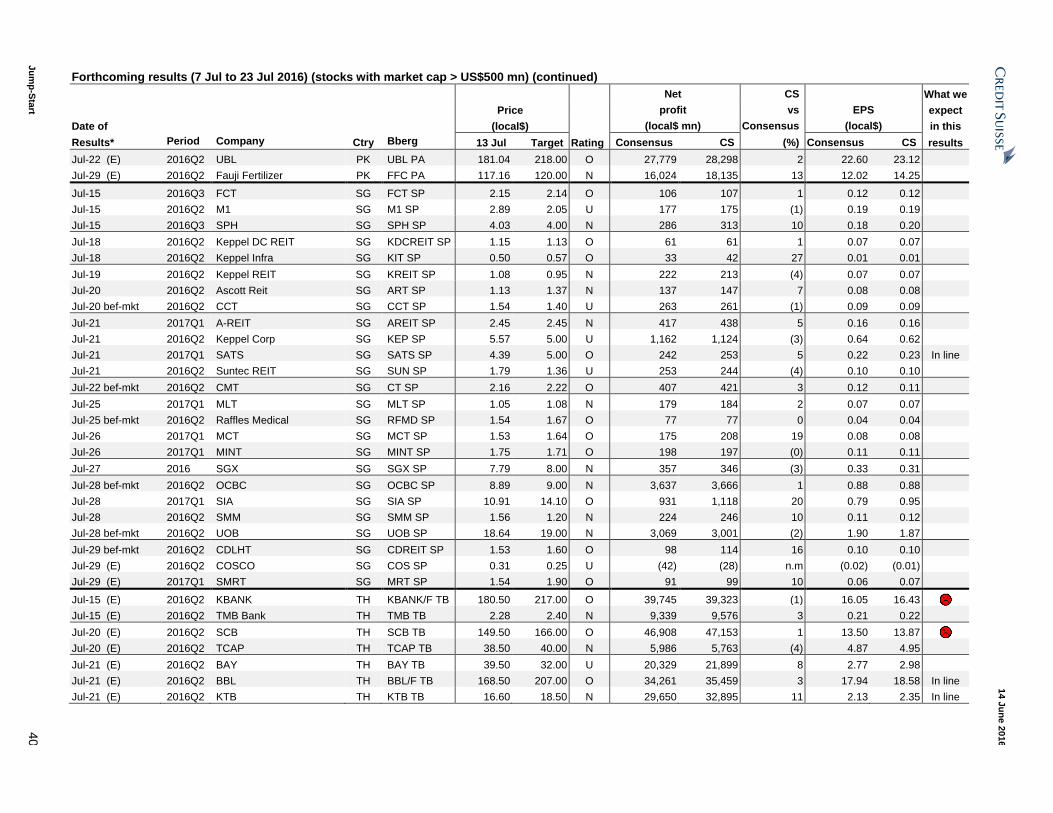
Ju
mp
-Sta
rt 4
0
14 J
un
e 2
016
Forthcoming results (7 Jul to 23 Jul 2016) (stocks with market cap > US$500 mn) (continued)
Net CS What we
Price profit vs EPS expect
Date of (local$) (local$ mn) Consensus (local$) in this
Results* Period Company Ctry Bberg 13 Jul Target Rating Consensus CS (%) Consensus CS results
Jul-22 (E) 2016Q2 UBL PK UBL PA 181.04 218.00 O 27,779 28,298 2 22.60 23.12
Jul-29 (E) 2016Q2 Fauji Fertilizer PK FFC PA 117.16 120.00 N 16,024 18,135 13 12.02 14.25
Jul-15 2016Q3 FCT SG FCT SP 2.15 2.14 O 106 107 1 0.12 0.12
Jul-15 2016Q2 M1 SG M1 SP 2.89 2.05 U 177 175 (1) 0.19 0.19
Jul-15 2016Q3 SPH SG SPH SP 4.03 4.00 N 286 313 10 0.18 0.20
Jul-18 2016Q2 Keppel DC REIT SG KDCREIT SP 1.15 1.13 O 61 61 1 0.07 0.07
Jul-18 2016Q2 Keppel Infra SG KIT SP 0.50 0.57 O 33 42 27 0.01 0.01
Jul-19 2016Q2 Keppel REIT SG KREIT SP 1.08 0.95 N 222 213 (4) 0.07 0.07
Jul-20 2016Q2 Ascott Reit SG ART SP 1.13 1.37 N 137 147 7 0.08 0.08
Jul-20 bef-mkt 2016Q2 CCT SG CCT SP 1.54 1.40 U 263 261 (1) 0.09 0.09
Jul-21 2017Q1 A-REIT SG AREIT SP 2.45 2.45 N 417 438 5 0.16 0.16
Jul-21 2016Q2 Keppel Corp SG KEP SP 5.57 5.00 U 1,162 1,124 (3) 0.64 0.62
Jul-21 2017Q1 SATS SG SATS SP 4.39 5.00 O 242 253 5 0.22 0.23 In line
Jul-21 2016Q2 Suntec REIT SG SUN SP 1.79 1.36 U 253 244 (4) 0.10 0.10
Jul-22 bef-mkt 2016Q2 CMT SG CT SP 2.16 2.22 O 407 421 3 0.12 0.11
Jul-25 2017Q1 MLT SG MLT SP 1.05 1.08 N 179 184 2 0.07 0.07
Jul-25 bef-mkt 2016Q2 Raffles Medical SG RFMD SP 1.54 1.67 O 77 77 0 0.04 0.04
Jul-26 2017Q1 MCT SG MCT SP 1.53 1.64 O 175 208 19 0.08 0.08
Jul-26 2017Q1 MINT SG MINT SP 1.75 1.71 O 198 197 (0) 0.11 0.11
Jul-27 2016 SGX SG SGX SP 7.79 8.00 N 357 346 (3) 0.33 0.31
Jul-28 bef-mkt 2016Q2 OCBC SG OCBC SP 8.89 9.00 N 3,637 3,666 1 0.88 0.88
Jul-28 2017Q1 SIA SG SIA SP 10.91 14.10 O 931 1,118 20 0.79 0.95
Jul-28 2016Q2 SMM SG SMM SP 1.56 1.20 N 224 246 10 0.11 0.12
Jul-28 bef-mkt 2016Q2 UOB SG UOB SP 18.64 19.00 N 3,069 3,001 (2) 1.90 1.87
Jul-29 bef-mkt 2016Q2 CDLHT SG CDREIT SP 1.53 1.60 O 98 114 16 0.10 0.10
Jul-29 (E) 2016Q2 COSCO SG COS SP 0.31 0.25 U (42) (28) n.m (0.02) (0.01)
Jul-29 (E) 2017Q1 SMRT SG MRT SP 1.54 1.90 O 91 99 10 0.06 0.07
Jul-15 (E) 2016Q2 KBANK TH KBANK/F TB 180.50 217.00 O 39,745 39,323 (1) 16.05 16.43
Jul-15 (E) 2016Q2 TMB Bank TH TMB TB 2.28 2.40 N 9,339 9,576 3 0.21 0.22
Jul-20 (E) 2016Q2 SCB TH SCB TB 149.50 166.00 O 46,908 47,153 1 13.50 13.87
Jul-20 (E) 2016Q2 TCAP TH TCAP TB 38.50 40.00 N 5,986 5,763 (4) 4.87 4.95
Jul-21 (E) 2016Q2 BAY TH BAY TB 39.50 32.00 U 20,329 21,899 8 2.77 2.98
Jul-21 (E) 2016Q2 BBL TH BBL/F TB 168.50 207.00 O 34,261 35,459 3 17.94 18.58 In line
Jul-21 (E) 2016Q2 KTB TH KTB TB 16.60 18.50 N 29,650 32,895 11 2.13 2.35 In line

Ju
mp
-Sta
rt 4
1
14 J
un
e 2
016
Forthcoming results (7 Jul to 23 Jul 2016) (stocks with market cap > US$500 mn) (continued)
Net CS What we
Price profit vs EPS expect
Date of (local$) (local$ mn) Consensus (local$) in this
Results* Period Company Ctry Bberg 13 Jul Target Rating Consensus CS (%) Consensus CS results
Jul-22 (E) 2016Q2 Big C TH BIGC TB 208.00 229.00 N 7,795 8,041 3 9.39 9.75
Jul-22 (E) 2016Q2 PTTEP TH PTTEP TB 82.25 73.00 U 12,408 10,253 (17) 2.99 2.13
Jul-27 (E) 2016Q2 Home Pro TH HMPRO TB 9.70 7.50 U 3,982 4,040 1 0.30 0.31
Jul-27 (E) 2016Q2 Jasmine TH JAS TB 5.45 5.50 O 2,833 1,990 (30) 0.38 0.19
Jul-28 (E) 2016Q2 SCCC TH SCCC TB 296.00 335.00 O 4,529 4,976 10 19.69 21.63
Jul-29 (E) 2016Q2 GLOW TH GLOW TB 85.00 109.00 O 8,783 9,320 6 6.01 6.37
Jul-29 (E) 2016Q2 SCC TH SCC TB 488.00 520.00 O 47,062 46,300 (2) 38.83 38.58
Jul-14 (E) 2016Q2 Feng Tay TW 9910 TT 162.00 150.00 N 4,628 5,132 11 7.84 8.61
Jul-14 2016Q2 Largan TW 3008 TT 3,175 3,400 O 22,731 20,385 (10) 169.49 151.97
Jul-14 2016Q2 TSMC TW 2330 TT 168.50 185.00 O 310,808 314,958 1 11.99 12.15
Jul-19 (E) 2016Q2 Airtac TW 1590 TT 241.00 275.00 O 1,987 1,980 (0) 11.18 11.06
Jul-26 (E) 2016Q2 Delta Elec TW 2308 TT 162.50 172.00 O 19,955 18,278 (8) 7.69 7.04
Jul-26 2016Q2 Powertech TW 6239 TT 73.90 85.80 O 4,719 4,586 (3) 5.91 6.00
Jul-27 2016Q2 AUO TW 2409 TT 11.30 13.00 O (2,324) (460) n.m (0.24) (0.05)
Jul-27 (E) 2016Q2 Kinsus TW 3189 TT 72.00 76.00 O 3,007 2,947 (2) 6.77 6.61
Jul-27 (E) 2016Q2 Realtek TW 2379 TT 107.50 107.50 N 3,123 3,284 5 6.26 6.50 In line
Jul-27 2016Q2 Taiwan Mobile TW 3045 TT 114.00 125.00 O 15,443 15,920 3 5.62 5.85
Jul-27 (E) 2016Q2 TPK TW 3673 TT 61.70 100.00 O 1,618 2,116 31 4.32 6.09
Jul-27 2016Q2 UMC TW 2303 TT 12.50 13.50 N 9,368 9,409 0 0.76 0.76 In line
Jul-27 (E) 2016Q2 Unimicron TW 3037 TT 13.55 17.00 N 695 571 (18) 0.47 0.37
Jul-28 2016Q2 Chroma TW 2360 TT 79.50 88.00 O 1,573 1,682 7 4.08 4.41
Jul-28 2016Q2 CHT TW 2412 TT 121.50 115.00 N 43,500 43,936 1 5.62 5.65
Jul-28 2016Q2 FET TW 4904 TT 76.40 83.00 O 11,891 11,884 (0) 3.64 3.65
Jul-29 (E) 2016Q2 HTC TW 2498 TT 100.00 57.00 U (8,303) (2,878) n.m (10.26) (3.48)
Jul-29 (E) 2016Q2 Win Semi TW 3105 TT 64.50 77.00 O 3,250 3,117 (4) 5.42 5.22
Notes: — Credit Suisse and consensus net profits and EPS are based on full year forecasts, — This calendar excludes stocks with market cap less than US$500 mn
— The date of release for stocks listed in US are based on HK date and time, all other stocks are based on the date & time of the listed exchange
* Confirmed dates but are subject to change, (E) = estimated date
Positive surprise, Negative surprise. Source: the BLOOMBERG PROFESSIONAL™ service., Company data, Datastream, Credit Suisse estimates.

Ju
mp
-Sta
rt 4
2
14 J
un
e 2
016
Results reported 2 Jun - 8 Jun 2016 (stocks with market cap > US$3 bn) % chg in CS % chg in
% Consensus Consensus cons. EPS CS CS EPS
Date of Price ($) upside / Reported YoY QoQ EPS EPS EPS post pre- EPS post
Results Period Company Ctry Sector Bberg Rating Ccy 13 Jun Target downside Ccy EPS (%) (%) pre-results 13 Jun results results 13 Jun results
Jul-11 2017Q1 IndusInd Bank IN Banks IIB IN O INR 1,104 1,301 17.8 INR Q1 n.a n.a n.a 49.75 49.91 0.3 51.41 49.72 (3.3)
Jul-08 2016Q2 E-mart KR Retailing 139480 KS O KRW 166,500 248,000 48.9 KRW Q2 n.a n.a n.a 13,294.14 13,194.02 (0.8) 14,344.94 14,344.94 0.0
Jul-11 2016Q2 DiGi MY Telecommunication Services DIGI MK U MYR 4.87 4.15 (14.8) MYR Q2 0.05 (9) 5 0.22 0.22 (0.9) 0.22 0.22 0.0
Jul-08 2016Q2 Cathay FHC TW Insurance 2882 TT N TWD 35.10 36.00 2.6 TWD Q2 n.a n.a n.a 3.46 3.46 0.0 3.06 3.06 0.0
Jul-08 2016Q2 Chang Hwa TW Banks 2801 TT U TWD 16.65 15.00 (9.9) TWD Q2 n.a n.a n.a 1.35 1.37 1.6 1.36 1.36 0.0
Jul-08 2016Q2 China Development FHC TW Diversified Financials 2883 TT N TWD 7.71 8.50 10.2 TWD Q2 n.a n.a n.a 0.57 0.52 (9.1) 0.42 0.42 0.0
Jul-08 2016Q2 CTBC Holding TW Banks 2891 TT O TWD 17.65 20.00 13.3 TWD Q2 n.a n.a n.a 1.81 1.81 0.0 1.51 1.51 0.0
Jul-08 2016Q2 E.Sun FHC TW Banks 2884 TT N TWD 19.10 19.80 3.7 TWD Q2 n.a n.a n.a 1.78 1.78 0.1 1.81 1.81 0.0
Jul-08 2016Q2 First FHC TW Banks 2892 TT N TWD 17.15 17.00 (0.9) TWD Q2 n.a n.a n.a 1.38 1.41 1.7 1.38 1.38 0.0
Jul-08 2016Q2 Fubon FHC TW Insurance 2881 TT N TWD 37.90 38.00 0.3 TWD Q2 n.a n.a n.a 4.69 4.69 0.0 4.04 4.04 0.0
Jul-08 2016Q2 Hua Nan FHC TW Banks 2880 TT N TWD 17.05 16.00 (6.2) TWD Q2 n.a n.a n.a 1.39 1.40 0.6 1.42 1.42 0.0
Jul-08 2016Q2 Mega FHC TW Banks 2886 TT N TWD 24.50 25.00 2.0 TWD Q2 n.a n.a n.a 2.21 2.21 0.0 2.12 2.12 0.0
Jul-08 2016Q2 SinoPac FHC TW Banks 2890 TT O TWD 9.85 11.00 11.7 TWD Q2 n.a n.a n.a 1.04 1.02 (1.7) 0.97 0.97 0.0
Jul-08 2016Q2 Taishin FHC TW Banks 2887 TT N TWD 12.75 14.00 9.8 TWD Q2 n.a n.a n.a 1.50 1.49 (0.5) 1.58 1.58 0.0
Jul-08 2016Q2 Yuanta FHC TW Diversified Financials 2885 TT O TWD 10.90 13.00 19.3 TWD Q2 n.a n.a n.a 1.05 1.05 0.0 1.01 1.01 0.0
Jul-11 2016Q2 FCFC TW Chemicals 1326 TT O TWD 82.20 96.00 16.8 TWD Q2 2.27 9 96 4.98 5.11 2.5 4.49 5.78 28.6
Jul-11 2016Q2 FPC TW Chemicals 1301 TT N TWD 78.00 86.00 10.3 TWD Q2 1.60 (6) 78 4.95 4.95 0.0 4.77 4.81 0.8
Jul-11 2016Q2 FPCC TW Energy 6505 TT O TWD 88.00 105.00 19.3 TWD Q2 2.71 5 146 4.79 4.97 3.7 4.86 5.93 22.1
Jul-11 2016Q2 NYP TW Chemicals 1303 TT N TWD 62.50 68.00 8.8 TWD Q2 1.05 (34) 54 4.48 4.49 0.3 4.14 3.83 (7.3)
Source: the BLOOMBERG PROFESSIONAL™ service, IBES, Credit Suisse estimates.

Ju
mp
-Sta
rt 4
3
14 J
un
e 2
016
EPS revisions - current vs start of reporting season
CS EPS revisions (%) Consensus EPS revisions (%) Current CS EPS/ Consensus EPS (%)
2016 2017 2016 2017 2016 2017
China -1.3 -1.2 -1.0 -0.7 99 101
Hong Kong -2.4 -3.6 -0.7 -1.3 101 101
India 1.4 1.3 0.1 -0.1 98 100
Indonesia -0.0 -0.0 -0.6 -0.5 101 102
Korea -0.4 0.1 1.1 0.5 103 107
Malaysia -1.1 -1.4 -1.3 -1.5 99 100
Philippines -0.1 -0.1 0.0 -0.4 99 100
Pakistan 11.0 0.0 -2.2 -1.5 117 115
Singapore -0.1 -0.0 -0.9 -1.2 101 102
Taiwan 0.9 0.5 -0.2 0.2 100 101
Thailand 1.4 0.3 0.4 0.1 100 101
Vietnam 0.0 0.0 -2.5 -2.6 103 104
Asia X Japan -0.7 -0.8 -0.5 -0.4 100 102
Automobiles & Components -0.7 0.2 0.1 -0.2 99 100
Banks -1.3 -1.6 -1.3 -1.1 100 101
Building Materials & Construction -0.5 -0.6 0.4 0.8 106 120
Capital Goods -0.3 -0.5 -0.7 -1.0 98 96
Chemicals 7.2 1.3 0.1 -0.3 102 100
Conglomerates -0.0 0.0 -0.9 -0.9 104 101
Consumer Durables & Apparel -0.1 -0.1 -1.0 -0.9 100 99
Consumer Staples 0.3 0.8 -3.2 -2.7 101 102
Diversified Financials 0.4 0.4 -1.3 -1.4 104 104
Energy 2.6 -0.1 3.1 3.4 59 83
Environmental Services -0.0 -0.0 0.0 -0.5 101 108
Healthcare 0.2 0.2 -0.1 0.0 101 103
Hotels, Restaurants & Leisure -15.7 -20.9 -1.7 -1.7 94 94
Insurance 0.1 -0.2 -1.5 -1.3 105 103
Media 0.0 0.0 -0.8 -0.5 107 106
Metals & Mining 2.2 1.9 5.5 4.9 89 116
Paper & Forest Products -0.0 -0.0 1.9 3.4 91 94
Real Estate -8.0 -7.6 -0.6 -0.4 96 96
Retailing 0.0 0.0 -0.4 -0.5 87 96
Technology -0.4 -0.3 0.1 -0.2 102 105
Telecommunication Services -1.8 -2.6 -0.1 -0.1 106 104
Transportation 1.2 0.9 -0.6 -1.2 115 106
Utilities -1.4 -1.2 -1.4 -0.9 99 97
Source: Credit Suisse estimates, IBES

Ju
mp
-Sta
rt 4
4
14 J
uly
201
6
Credit Suisse Valuation Summary (by country)

Ju
mp
-Sta
rt 4
5
14 J
uly
201
6
Summary—valuation summary Upside/ Market Last CS / Cons. EPS Dvd EV/ Sales EV/EBITDA NetDebt/ HOLT COUNTRY downside cap Absolute Performance (%) FYE EPS growth (%) PE (x) (%) Yld (%) ROE (%) P/BV (x) (x) (x) Equity (%) coverage
(%) (USDbn) 1w 1m 3m YTD 12m T T+1 T+2 T+3 T T+1 T+2 T+3 T+1 T+2 T+1 T+1 T+2 T+1 T+2 T+1 T+1 T+1 T+2
Australia 3 1,170 4 1 5 2 (3) Jun-15 (7) 10 8 16.4 17.8 16.2 15.1 101 102 4.2 10.7 11.2 1.8 1.8 1.9 10.2 45 40 644
China 12 4,537 4 5 (2) (4) (17) Dec-15 (2) 14 12 10.2 10.4 9.1 7.9 99 101 2.9 11.9 12.5 1.2 1.1 1.3 8.4 31 25 1,210
Hong Kong 5 672 4 4 (0) (3) (15) Dec-15 7 9 10 15.8 14.7 13.5 12.5 101 101 3.2 6.8 7.2 1.0 1.0 2.0 10.2 19 15 935
India 5 1,134 2 5 9 7 (0) Mar-15 (3) 28 23 22.7 23.4 18.3 14.9 92 99 1.7 12.0 14.0 2.7 2.5 2.1 12.2 44 41 616
Indonesia 4 296 3 6 6 11 4 Dec-15 14 15 17 20.9 18.4 15.9 13.6 101 102 2.3 17.5 18.0 3.1 2.7 2.7 11.3 27 20 201
Japan 13 2,290 5 1 (5) (16) (21) Mar-15 (0) 6 12 13.8 13.9 13.1 11.5 101 103 2.4 8.3 8.5 1.1 1.1 0.9 7.7 25 22 3,448
Korea 20 636 3 1 (1) 2 (3) Dec-15 6 12 7 10.5 9.9 8.8 8.0 101 106 2.0 8.8 9.2 0.8 0.8 0.7 4.9 20 14 688
Malaysia -1 234 0 2 (4) (2) (4) Dec-15 5 9 7 17.4 16.6 15.2 14.0 99 100 3.0 10.4 10.8 1.7 1.6 2.6 10.4 35 33 270
Pakistan 12 31 3 6 16 20 11 Dec-15 15 10 17 9.6 8.3 7.5 6.5 117 115 5.8 18.9 18.8 1.5 1.4 1.4 6.1 14 12 55
Philippines -4 177 2 5 8 14 5 Dec-15 13 11 13 22.6 20.0 18.1 14.8 99 100 1.7 13.6 13.7 2.6 2.3 3.1 11.5 51 44 103
Singapore 6 276 2 4 (0) 1 (12) Dec-15 22 7 7 16.4 13.4 12.5 11.5 100 101 4.1 9.1 9.4 1.2 1.1 1.1 12.4 42 41 277
Taiwan 6 580 3 4 2 6 (2) Dec-15 (1) 11 5 14.3 14.5 13.1 13.5 100 101 3.9 12.1 12.7 1.7 1.6 0.9 7.5 (8) (12) 660
Thailand 5 305 2 4 7 15 (0) Dec-15 23 13 15 19.9 16.2 14.3 11.8 100 101 3.1 12.9 13.5 2.0 1.9 1.7 9.5 41 33 232
Vietnam 3 24 4 8 16 17 6 Dec-15 4 27 14 18.8 18.1 14.3 12.5 99 101 1.1 12.6 14.3 2.2 1.9 2.0 11.5 37 28 30
SECTOR - NJA
Automobiles & Components 12 389 3 4 5 5 7 Dec-15 6 10 5 11.1 10.5 9.6 7.8 99 100 2.8 14.7 14.6 1.5 1.4 0.7 6.7 (9) (16) 184
Banks 8 1,687 2 2 2 (2) (16) Dec-15 (4) 6 6 6.0 6.2 5.9 5.5 102 105 4.7 13.6 13.3 0.8 0.7 n.a. n.a. n.a. n.a. 181
Building Materials & Construction 14 103 4 5 0 8 (7) Dec-15 18 33 4 18.9 16.1 12.1 9.3 106 120 2.2 9.0 11.4 1.4 1.3 1.8 9.2 60 49 209
Capital Goods 8 267 1 1 (6) (6) (23) Dec-15 157 10 5 32.0 12.5 11.3 9.8 97 95 2.0 9.6 10.0 1.2 1.1 0.7 9.5 52 49 714
Chemicals 3 100 1 0 3 7 6 Dec-15 6 4 11 17.1 16.1 15.5 13.1 102 100 3.8 13.7 13.3 2.1 2.0 1.8 10.1 15 13 249
Conglomerates 5 279 2 1 (2) 2 (7) Dec-15 5 9 9 11.2 10.6 9.8 10.2 102 101 2.5 7.7 8.0 0.8 0.8 1.3 6.5 24 19 57
Consumer Durables & Apparel 5 158 5 7 7 (2) (14) Dec-15 2 11 11 13.8 13.5 12.2 11.7 100 99 3.7 17.9 18.2 2.3 2.1 0.9 8.3 (24) (31) 260
Consumer Staples 6 647 3 6 11 16 13 Dec-15 12 12 8 26.9 24.0 21.4 18.3 101 102 2.0 17.0 17.8 4.0 3.6 2.1 14.5 16 9 406
Diversified Financials 9 250 3 5 1 (1) (10) Dec-15 (16) 12 14 9.4 11.2 10.0 10.2 104 104 2.7 12.0 12.7 1.3 1.2 n.a. n.a. n.a. n.a. 186
Energy -8 592 2 1 3 11 (14) Dec-15 (52) 128 71 18.0 39.0 16.5 11.3 59 83 1.9 3.3 6.9 1.0 1.0 0.9 7.9 35 31 179
Environmental Services 22 31 1 1 (6) (17) (18) Dec-15 119 32 10 33.7 15.4 11.7 10.6 101 108 1.7 13.0 15.6 1.9 1.7 3.6 12.3 69 74 23
Healthcare 6 267 5 7 4 (1) (3) Dec-15 15 16 15 26.9 23.5 20.2 17.8 101 103 0.9 17.2 17.9 3.8 3.4 2.2 15.6 (1) (12) 351
Hotels, Restaurants & Leisure 11 140 2 (0) (7) 1 (13) Dec-15 2 14 15 24.4 24.0 21.0 18.2 94 94 2.7 10.0 11.0 2.4 2.3 2.4 11.3 11 10 136
Insurance 24 411 1 (2) (7) (18) (27) Dec-15 (7) 9 11 10.4 11.2 10.2 9.2 105 103 2.0 11.6 11.7 1.2 1.1 n.a. n.a. n.a. n.a. 41
Media 8 29 1 3 6 6 9 Dec-15 8 14 10 26.8 24.9 21.8 17.9 106 105 2.7 20.1 21.6 4.9 4.6 5.0 13.3 22 16 135
Metals & Mining -2 236 5 12 9 24 (1) Dec-15 187 63 23 63.3 22.0 13.5 11.6 88 116 2.6 4.7 7.1 0.9 0.9 1.3 8.8 56 51 230
Real Estate -1 546 2 4 2 0 (3) Dec-15 10 11 8 12.8 11.7 10.5 9.7 96 96 3.4 8.0 8.5 0.9 0.8 2.1 9.4 39 38 328
REITS -4 53 2 8 9 15 8 Dec-15 (7) 6 3 18.9 20.3 19.3 18.8 97 98 5.2 4.8 5.0 0.9 0.9 n.a. 23.0 38 39 49
Retailing 15 112 2 3 (7) (10) (16) Dec-15 108 39 22 73.8 35.6 25.5 21.3 87 95 1.0 5.5 7.2 1.9 1.8 0.6 13.7 14 7 179
Software & Services 14 787 2 4 3 4 7 Dec-15 (1) 25 23 26.1 26.4 21.2 16.0 102 102 0.5 19.8 21.1 4.8 4.2 4.8 18.0 (32) (42) 187
Technology Hardware 9 652 1 3 6 10 6 Dec-15 1 18 9 13.3 13.1 11.2 9.9 102 106 2.9 11.5 12.6 1.5 1.3 0.8 5.4 (10) (14) 593
Telecommunication Services 22 629 3 3 3 6 (4) Dec-15 (3) 8 10 16.1 16.6 15.4 13.9 104 102 3.3 10.8 11.2 1.8 1.7 1.8 5.5 15 10 58
Transportation 9 154 2 2 (2) (3) (13) Dec-15 3 (4) (6) 11.8 11.4 11.9 11.3 115 106 2.7 13.0 11.9 1.5 1.4 2.1 8.2 46 46 205
Utilities 6 378 1 (0) (1) 1 (2) Dec-15 (13) (0) (0) 9.3 10.7 10.8 10.7 99 97 3.8 12.1 11.2 1.2 1.1 3.2 8.3 92 86 166
CS TOTAL - NJA 8 8,903 2 3 1 3 (9) Dec-15 (1) 13 10 12.8 12.4 10.9 9.2 99 100 2.8 11.2 11.8 1.3 1.2 1.4 8.7 27 22 5,277
CS TOTAL - ASIA PAC 13 12,363 1 1 1 (0) (8) Dec-15 0 13 10 12.9 12.5 11.0 9.6 100 102 2.9 10.6 11.1 1.3 1.2 1.2 8.3 27 21 9,369
Note: Prices are as of 13 Jul 2016
* Country/sector aggregates are based on Credit Suisse coverage universe.
Upside (%): bottom_up upside/downside to index
Source: Credit Suisse, Thomson Reuters, Credit Suisse HOLT®
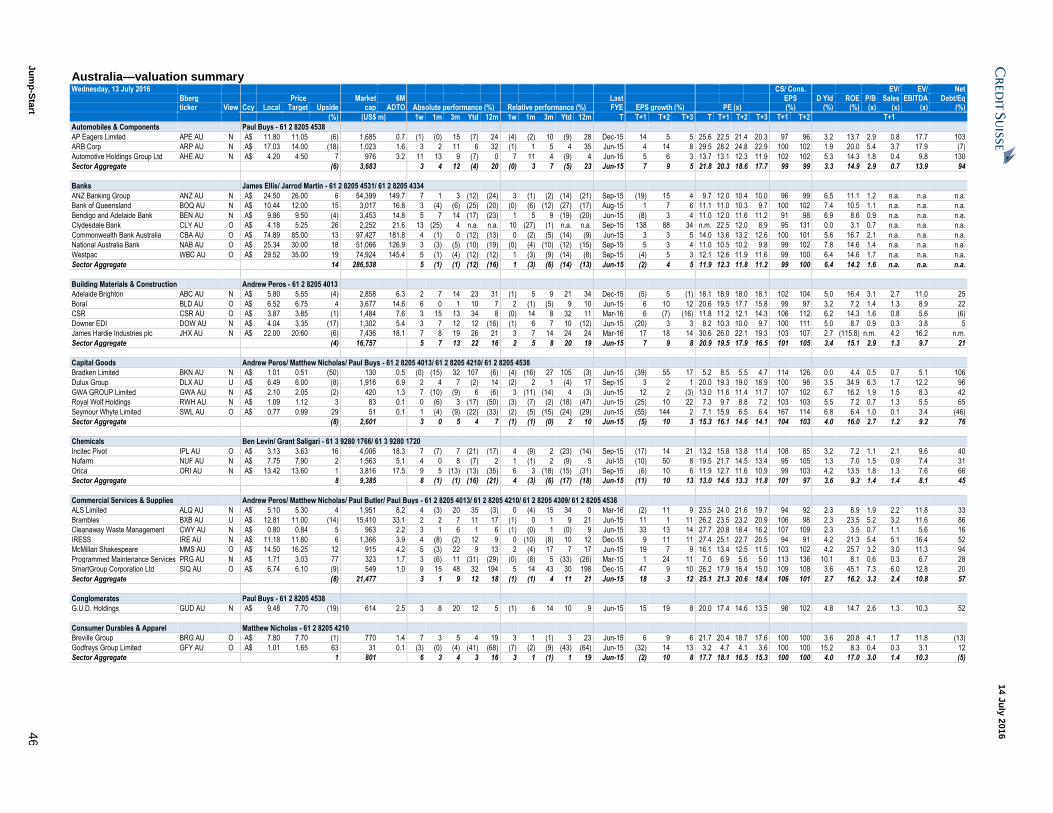
Ju
mp
-Sta
rt 4
6
14 J
uly
201
6
Australia—valuation summary Wednesday, 13 July 2016
CS/ Cons. EV/ EV/ Net
Bberg Price Market 6M Last EPS D Yld ROE P/B Sales EBITDA Debt/Eq ticker View Ccy Local Target Upside cap ADTO Absolute performance (%) Relative performance (%) FYE EPS growth (%) PE (x) (%) (%) (%) (x) (x) (x) (%)
(%) (US$ m) 1w 1m 3m Ytd 12m 1w 1m 3m Ytd 12m T T+1 T+2 T+3 T T+1 T+2 T+3 T+1 T+2 T+1
Automobiles & Components Paul Buys - 61 2 8205 4538
AP Eagers Limited APE AU N A$ 11.80 11.05 (6) 1,685 0.7 (1) (0) 15 (7) 24 (4) (2) 10 (9) 28 Dec-15 14 5 5 25.6 22.5 21.4 20.3 97 96 3.2 13.7 2.9 0.8 17.7 103
ARB Corp ARP AU N A$ 17.03 14.00 (18) 1,023 1.6 3 2 11 6 32 (1) 1 5 4 35 Jun-15 4 14 8 29.5 28.2 24.8 22.9 100 102 1.9 20.0 5.4 3.7 17.9 (7)
Automotive Holdings Group Ltd AHE AU N A$ 4.20 4.50 7 976 3.2 11 13 9 (7) 0 7 11 4 (9) 4 Jun-15 5 6 3 13.7 13.1 12.3 11.9 102 102 5.3 14.3 1.8 0.4 9.8 130
Sector Aggregate (6) 3,683 3 4 12 (4) 20 (0) 3 7 (5) 23 Jun-15 7 9 5 21.8 20.3 18.6 17.7 99 99 3.3 14.9 2.9 0.7 13.9 94
Banks James Ellis/ Jarrod Martin - 61 2 8205 4531/ 61 2 8205 4334
ANZ Banking Group ANZ AU N A$ 24.50 26.00 6 54,399 149.7 7 1 3 (12) (24) 3 (1) (2) (14) (21) Sep-15 (19) 15 4 9.7 12.0 10.4 10.0 96 99 6.5 11.1 1.2 n.a. n.a. n.a.
Bank of Queensland BOQ AU N A$ 10.44 12.00 15 3,017 16.8 3 (4) (6) (25) (20) (0) (6) (12) (27) (17) Aug-15 1 7 6 11.1 11.0 10.3 9.7 100 102 7.4 10.5 1.1 n.a. n.a. n.a.
Bendigo and Adelaide Bank BEN AU N A$ 9.86 9.50 (4) 3,453 14.8 5 7 14 (17) (23) 1 5 9 (19) (20) Jun-15 (8) 3 4 11.0 12.0 11.6 11.2 91 98 6.9 8.6 0.9 n.a. n.a. n.a.
Clydesdale Bank CLY AU O A$ 4.18 5.25 26 2,252 21.6 13 (25) 4 n.a. n.a. 10 (27) (1) n.a. n.a. Sep-15 138 88 34 n.m. 22.5 12.0 8.9 95 131 0.0 3.1 0.7 n.a. n.a. n.a.
Commonwealth Bank Australia CBA AU O A$ 74.89 85.00 13 97,427 181.8 4 (1) 0 (12) (13) 0 (2) (5) (14) (9) Jun-15 3 3 5 14.0 13.6 13.2 12.6 100 101 5.6 16.7 2.1 n.a. n.a. n.a.
National Australia Bank NAB AU O A$ 25.34 30.00 18 51,066 126.9 3 (3) (5) (10) (19) (0) (4) (10) (12) (15) Sep-15 5 3 4 11.0 10.5 10.2 9.8 99 102 7.8 14.6 1.4 n.a. n.a. n.a.
Westpac WBC AU O A$ 29.52 35.00 19 74,924 145.4 5 (1) (4) (12) (12) 1 (3) (9) (14) (8) Sep-15 (4) 5 3 12.1 12.6 11.9 11.6 99 100 6.4 14.6 1.7 n.a. n.a. n.a.
Sector Aggregate 14 286,538 5 (1) (1) (12) (16) 1 (3) (6) (14) (13) Jun-15 (2) 4 5 11.9 12.3 11.8 11.2 99 100 6.4 14.2 1.6 n.a. n.a. n.a.
Building Materials & Construction Andrew Peros - 61 2 8205 4013
Adelaide Brighton ABC AU N A$ 5.80 5.55 (4) 2,858 6.3 2 7 14 23 31 (1) 5 9 21 34 Dec-15 (5) 5 (1) 18.1 18.9 18.0 18.1 102 104 5.0 16.4 3.1 2.7 11.0 25
Boral BLD AU O A$ 6.52 6.75 4 3,677 14.6 6 0 1 10 7 2 (1) (5) 9 10 Jun-15 6 10 12 20.6 19.5 17.7 15.8 99 97 3.2 7.2 1.4 1.3 8.9 22
CSR CSR AU O A$ 3.87 3.85 (1) 1,484 7.6 3 15 13 34 8 (0) 14 8 32 11 Mar-16 6 (7) (16) 11.8 11.2 12.1 14.3 106 112 6.2 14.3 1.6 0.8 5.6 (6)
Downer EDI DOW AU N A$ 4.04 3.35 (17) 1,302 5.4 3 7 12 12 (16) (1) 6 7 10 (12) Jun-15 (20) 3 3 8.2 10.3 10.0 9.7 100 111 5.0 8.7 0.9 0.3 3.8 5
James Hardie Industries plc JHX AU N A$ 22.00 20.60 (6) 7,436 18.1 7 8 19 26 21 3 7 14 24 24 Mar-16 17 18 14 30.6 26.0 22.1 19.3 103 107 2.7 (115.8) n.m. 4.2 16.2 n.m.
Sector Aggregate (4) 16,757 5 7 13 22 16 2 5 8 20 19 Jun-15 7 9 8 20.9 19.5 17.9 16.5 101 105 3.4 15.1 2.9 1.3 9.7 21
Capital Goods Andrew Peros/ Matthew Nicholas/ Paul Buys - 61 2 8205 4013/ 61 2 8205 4210/ 61 2 8205 4538
Bradken Limited BKN AU N A$ 1.01 0.51 (50) 130 0.5 (0) (15) 32 107 (6) (4) (16) 27 105 (3) Jun-15 (39) 55 17 5.2 8.5 5.5 4.7 114 126 0.0 4.4 0.5 0.7 5.1 106
Dulux Group DLX AU U A$ 6.49 6.00 (8) 1,916 6.9 2 4 7 (2) 14 (2) 2 1 (4) 17 Sep-15 3 2 1 20.0 19.3 19.0 18.9 100 98 3.5 34.9 6.3 1.7 12.2 96
GWA GROUP Limited GWA AU N A$ 2.10 2.05 (2) 420 1.3 7 (10) (9) 6 (6) 3 (11) (14) 4 (3) Jun-15 12 2 (3) 13.0 11.6 11.4 11.7 107 102 6.7 16.2 1.9 1.5 8.3 42
Royal Wolf Holdings RWH AU N A$ 1.09 1.12 3 83 0.1 0 (6) 3 (17) (50) (3) (7) (2) (18) (47) Jun-15 (25) 10 22 7.3 9.7 8.8 7.2 103 103 5.5 7.2 0.7 1.3 5.5 65
Seymour Whyte Limited SWL AU O A$ 0.77 0.99 29 51 0.1 1 (4) (9) (22) (33) (2) (5) (15) (24) (29) Jun-15 (55) 144 2 7.1 15.9 6.5 6.4 167 114 6.8 6.4 1.0 0.1 3.4 (46)
Sector Aggregate (8) 2,601 3 0 5 4 7 (1) (1) (0) 2 10 Jun-15 (5) 10 3 15.3 16.1 14.6 14.1 104 103 4.0 16.0 2.7 1.2 9.2 76
Chemicals Ben Levin/ Grant Saligari - 61 3 9280 1766/ 61 3 9280 1720
Incitec Pivot IPL AU O A$ 3.13 3.63 16 4,006 18.3 7 (7) 7 (21) (17) 4 (9) 2 (23) (14) Sep-15 (17) 14 21 13.2 15.8 13.8 11.4 108 85 3.2 7.2 1.1 2.1 9.6 40
Nufarm NUF AU N A$ 7.75 7.90 2 1,563 5.1 4 0 8 (7) 2 1 (1) 2 (9) 5 Jul-15 (10) 50 8 19.5 21.7 14.5 13.4 95 105 1.3 7.0 1.5 0.9 7.4 31
Orica ORI AU N A$ 13.42 13.60 1 3,816 17.5 9 5 (13) (13) (35) 6 3 (18) (15) (31) Sep-15 (6) 10 6 11.9 12.7 11.6 10.9 99 103 4.2 13.5 1.8 1.3 7.6 66
Sector Aggregate 8 9,385 8 (1) (1) (16) (21) 4 (3) (6) (17) (18) Jun-15 (11) 10 13 13.0 14.6 13.3 11.8 101 97 3.6 9.3 1.4 1.4 8.1 45
Commercial Services & Supplies Andrew Peros/ Matthew Nicholas/ Paul Butler/ Paul Buys - 61 2 8205 4013/ 61 2 8205 4210/ 61 2 8205 4309/ 61 2 8205 4538
ALS Limited ALQ AU N A$ 5.10 5.30 4 1,951 8.2 4 (3) 20 35 (3) 0 (4) 15 34 0 Mar-16 (2) 11 9 23.5 24.0 21.6 19.7 94 92 2.3 8.9 1.9 2.2 11.8 33
Brambles BXB AU U A$ 12.81 11.00 (14) 15,410 33.1 2 2 7 11 17 (1) 0 1 9 21 Jun-15 11 1 11 26.2 23.5 23.2 20.9 106 98 2.3 23.5 5.2 3.2 11.6 86
Cleanaway Waste Management CWY AU N A$ 0.80 0.84 5 963 2.2 3 1 6 1 6 (1) (0) 1 (0) 9 Jun-15 33 13 14 27.7 20.8 18.4 16.2 107 109 2.3 3.5 0.7 1.1 5.6 16
IRESS IRE AU N A$ 11.18 11.80 6 1,366 3.9 4 (8) (2) 12 9 0 (10) (8) 10 12 Dec-15 9 11 11 27.4 25.1 22.7 20.5 94 91 4.2 21.3 5.4 5.1 16.4 52
McMillan Shakespeare MMS AU O A$ 14.50 16.25 12 915 4.2 5 (3) 22 9 13 2 (4) 17 7 17 Jun-15 19 7 9 16.1 13.4 12.5 11.5 103 102 4.2 25.7 3.2 3.0 11.3 94
Programmed Maintenance Services PRG AU N A$ 1.71 3.03 77 323 1.7 3 (6) 11 (31) (29) (0) (8) 5 (33) (26) Mar-15 1 24 11 7.0 6.9 5.6 5.0 113 136 10.1 8.1 0.6 0.3 6.7 28
SmartGroup Corporation Ltd SIQ AU O A$ 6.74 6.10 (9) 549 1.0 9 15 48 32 194 5 14 43 30 198 Dec-15 47 9 10 26.2 17.9 16.4 15.0 109 108 3.6 45.1 7.3 6.0 12.8 20
Sector Aggregate (8) 21,477 3 1 9 12 18 (1) (1) 4 11 21 Jun-15 18 3 12 25.1 21.3 20.6 18.4 106 101 2.7 16.2 3.3 2.4 10.8 57
Conglomerates Paul Buys - 61 2 8205 4538
G.U.D. Holdings GUD AU N A$ 9.48 7.70 (19) 614 2.5 3 8 20 12 5 (1) 6 14 10 9 Jun-15 15 19 8 20.0 17.4 14.6 13.5 98 102 4.8 14.7 2.6 1.3 10.3 52
Consumer Durables & Apparel Matthew Nicholas - 61 2 8205 4210
Breville Group BRG AU O A$ 7.80 7.70 (1) 770 1.4 7 3 5 4 19 3 1 (1) 3 23 Jun-15 6 9 6 21.7 20.4 18.7 17.6 100 100 3.6 20.8 4.1 1.7 11.8 (13)
Godfreys Group Limited GFY AU O A$ 1.01 1.65 63 31 0.1 (3) (0) (4) (41) (68) (7) (2) (9) (43) (64) Jun-15 (32) 14 13 3.2 4.7 4.1 3.6 100 100 15.2 8.3 0.4 0.3 3.1 12
Sector Aggregate 1 801 6 3 4 3 16 3 1 (1) 1 19 Jun-15 (2) 10 8 17.7 18.1 16.5 15.3 100 100 4.0 17.0 3.0 1.4 10.3 (5)
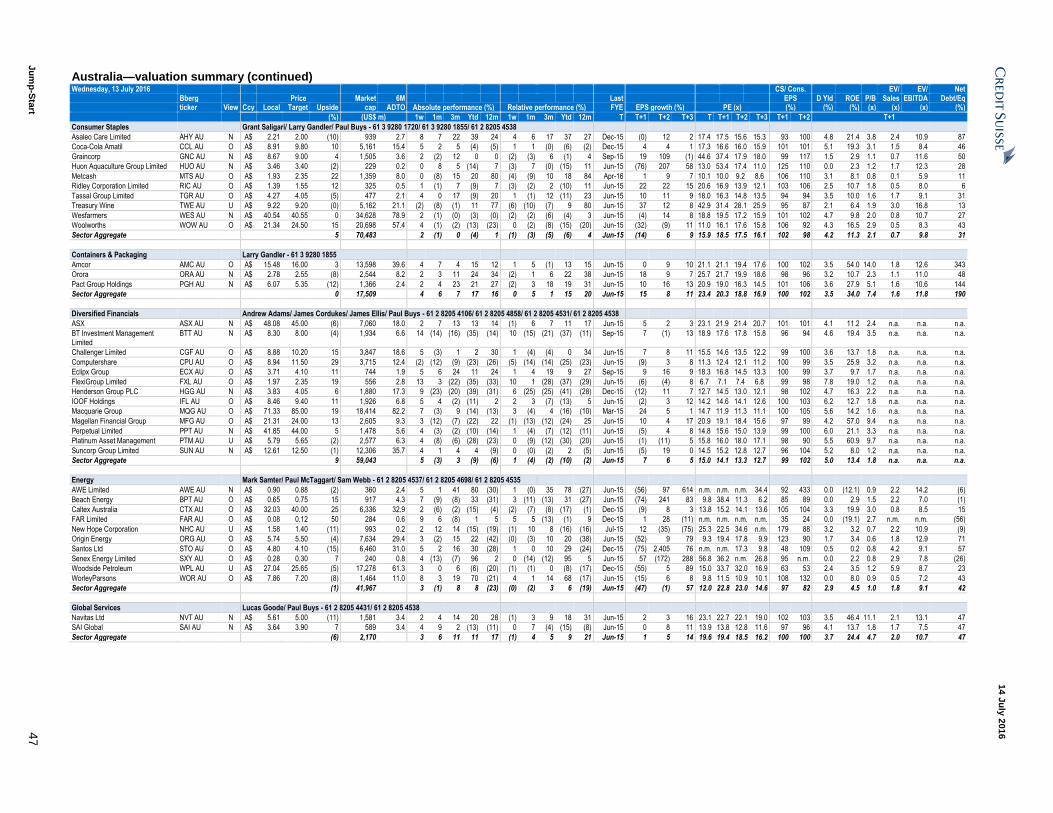
Ju
mp
-Sta
rt 4
7
14 J
uly
201
6
Australia—valuation summary (continued) Wednesday, 13 July 2016
CS/ Cons. EV/ EV/ Net
Bberg Price Market 6M Last EPS D Yld ROE P/B Sales EBITDA Debt/Eq ticker View Ccy Local Target Upside cap ADTO Absolute performance (%) Relative performance (%) FYE EPS growth (%) PE (x) (%) (%) (%) (x) (x) (x) (%)
(%) (US$ m) 1w 1m 3m Ytd 12m 1w 1m 3m Ytd 12m T T+1 T+2 T+3 T T+1 T+2 T+3 T+1 T+2 T+1
Consumer Staples Grant Saligari/ Larry Gandler/ Paul Buys - 61 3 9280 1720/ 61 3 9280 1855/ 61 2 8205 4538
Asaleo Care Limited AHY AU N A$ 2.21 2.00 (10) 939 2.7 8 7 22 39 24 4 6 17 37 27 Dec-15 (0) 12 2 17.4 17.5 15.6 15.3 93 100 4.8 21.4 3.8 2.4 10.9 87
Coca-Cola Amatil CCL AU O A$ 8.91 9.80 10 5,161 15.4 5 2 5 (4) (5) 1 1 (0) (6) (2) Dec-15 4 4 1 17.3 16.6 16.0 15.9 101 101 5.1 19.3 3.1 1.5 8.4 46
Graincorp GNC AU N A$ 8.67 9.00 4 1,505 3.6 2 (2) 12 0 0 (2) (3) 6 (1) 4 Sep-15 19 109 (1) 44.6 37.4 17.9 18.0 99 117 1.5 2.9 1.1 0.7 11.6 50
Huon Aquaculture Group Limited HUO AU N A$ 3.46 3.40 (2) 229 0.2 0 8 5 (14) 7 (3) 7 (0) (15) 11 Jun-15 (76) 207 58 13.0 53.4 17.4 11.0 125 110 0.0 2.3 1.2 1.7 12.3 28
Metcash MTS AU O A$ 1.93 2.35 22 1,359 8.0 0 (8) 15 20 80 (4) (9) 10 18 84 Apr-16 1 9 7 10.1 10.0 9.2 8.6 106 110 3.1 8.1 0.8 0.1 5.9 11
Ridley Corporation Limited RIC AU O A$ 1.39 1.55 12 325 0.5 1 (1) 7 (9) 7 (3) (2) 2 (10) 11 Jun-15 22 22 15 20.6 16.9 13.9 12.1 103 106 2.5 10.7 1.8 0.5 8.0 6
Tassal Group Limited TGR AU O A$ 4.27 4.05 (5) 477 2.1 4 0 17 (9) 20 1 (1) 12 (11) 23 Jun-15 10 11 9 18.0 16.3 14.8 13.5 94 94 3.5 10.0 1.6 1.7 9.1 31
Treasury Wine TWE AU U A$ 9.22 9.20 (0) 5,162 21.1 (2) (8) (1) 11 77 (6) (10) (7) 9 80 Jun-15 37 12 8 42.9 31.4 28.1 25.9 95 87 2.1 6.4 1.9 3.0 16.8 13
Wesfarmers WES AU N A$ 40.54 40.55 0 34,628 78.9 2 (1) (0) (3) (0) (2) (2) (6) (4) 3 Jun-15 (4) 14 8 18.8 19.5 17.2 15.9 101 102 4.7 9.8 2.0 0.8 10.7 27
Woolworths WOW AU O A$ 21.34 24.50 15 20,698 57.4 4 (1) (2) (13) (23) 0 (2) (8) (15) (20) Jun-15 (32) (9) 11 11.0 16.1 17.6 15.8 106 92 4.3 16.5 2.9 0.5 8.3 43
Sector Aggregate 5 70,483 2 (1) 0 (4) 1 (1) (3) (5) (6) 4 Jun-15 (14) 6 9 15.9 18.5 17.5 16.1 102 98 4.2 11.3 2.1 0.7 9.8 31
Containers & Packaging Larry Gandler - 61 3 9280 1855
Amcor AMC AU O A$ 15.48 16.00 3 13,598 39.6 4 7 4 15 12 1 5 (1) 13 15 Jun-15 0 9 10 21.1 21.1 19.4 17.6 100 102 3.5 54.0 14.0 1.8 12.6 343
Orora ORA AU N A$ 2.78 2.55 (8) 2,544 8.2 2 3 11 24 34 (2) 1 6 22 38 Jun-15 18 9 7 25.7 21.7 19.9 18.6 98 96 3.2 10.7 2.3 1.1 11.0 48
Pact Group Holdings PGH AU N A$ 6.07 5.35 (12) 1,366 2.4 2 4 23 21 27 (2) 3 18 19 31 Jun-15 10 16 13 20.9 19.0 16.3 14.5 101 106 3.6 27.9 5.1 1.6 10.6 144
Sector Aggregate 0 17,509 4 6 7 17 16 0 5 1 15 20 Jun-15 15 8 11 23.4 20.3 18.8 16.9 100 102 3.5 34.0 7.4 1.6 11.8 190
Diversified Financials Andrew Adams/ James Cordukes/ James Ellis/ Paul Buys - 61 2 8205 4106/ 61 2 8205 4858/ 61 2 8205 4531/ 61 2 8205 4538
ASX ASX AU N A$ 48.08 45.00 (6) 7,060 18.0 2 7 13 13 14 (1) 6 7 11 17 Jun-15 5 2 3 23.1 21.9 21.4 20.7 101 101 4.1 11.2 2.4 n.a. n.a. n.a.
BT Investment Management Limited
BTT AU N A$ 8.30 8.00 (4) 1,934 6.6 14 (14) (16) (35) (14) 10 (15) (21) (37) (11) Sep-15 7 (1) 13 18.9 17.6 17.8 15.8 96 94 4.6 19.4 3.5 n.a. n.a. n.a.
Challenger Limited CGF AU O A$ 8.88 10.20 15 3,847 18.6 5 (3) 1 2 30 1 (4) (4) 0 34 Jun-15 7 8 11 15.5 14.6 13.5 12.2 99 100 3.6 13.7 1.8 n.a. n.a. n.a.
Computershare CPU AU O A$ 8.94 11.50 29 3,715 12.4 (2) (12) (9) (23) (26) (5) (14) (14) (25) (23) Jun-15 (9) 3 8 11.3 12.4 12.1 11.2 100 99 3.5 25.9 3.2 n.a. n.a. n.a.
Eclipx Group ECX AU O A$ 3.71 4.10 11 744 1.9 5 6 24 11 24 1 4 19 9 27 Sep-15 9 16 9 18.3 16.8 14.5 13.3 100 99 3.7 9.7 1.7 n.a. n.a. n.a.
FlexiGroup Limited FXL AU O A$ 1.97 2.35 19 556 2.8 13 3 (22) (35) (33) 10 1 (28) (37) (29) Jun-15 (6) (4) 8 6.7 7.1 7.4 6.8 99 98 7.8 19.0 1.2 n.a. n.a. n.a.
Henderson Group PLC HGG AU N A$ 3.83 4.05 6 1,880 17.3 9 (23) (20) (39) (31) 6 (25) (25) (41) (28) Dec-15 (12) 11 7 12.7 14.5 13.0 12.1 98 102 4.7 16.3 2.2 n.a. n.a. n.a.
IOOF Holdings IFL AU O A$ 8.46 9.40 11 1,926 6.8 5 4 (2) (11) 2 2 3 (7) (13) 5 Jun-15 (2) 3 12 14.2 14.6 14.1 12.6 100 103 6.2 12.7 1.8 n.a. n.a. n.a.
Macquarie Group MQG AU O A$ 71.33 85.00 19 18,414 82.2 7 (3) 9 (14) (13) 3 (4) 4 (16) (10) Mar-15 24 5 1 14.7 11.9 11.3 11.1 100 105 5.6 14.2 1.6 n.a. n.a. n.a.
Magellan Financial Group MFG AU O A$ 21.31 24.00 13 2,605 9.3 3 (12) (7) (22) 22 (1) (13) (12) (24) 25 Jun-15 10 4 17 20.9 19.1 18.4 15.6 97 99 4.2 57.0 9.4 n.a. n.a. n.a.
Perpetual Limited PPT AU N A$ 41.85 44.00 5 1,478 5.6 4 (3) (2) (10) (14) 1 (4) (7) (12) (11) Jun-15 (5) 4 8 14.8 15.6 15.0 13.9 99 100 6.0 21.1 3.3 n.a. n.a. n.a.
Platinum Asset Management PTM AU U A$ 5.79 5.65 (2) 2,577 6.3 4 (8) (6) (28) (23) 0 (9) (12) (30) (20) Jun-15 (1) (11) 5 15.8 16.0 18.0 17.1 98 90 5.5 60.9 9.7 n.a. n.a. n.a.
Suncorp Group Limited SUN AU N A$ 12.61 12.50 (1) 12,306 35.7 4 1 4 4 (9) 0 (0) (2) 2 (5) Jun-15 (5) 19 0 14.5 15.2 12.8 12.7 96 104 5.2 8.0 1.2 n.a. n.a. n.a.
Sector Aggregate 9 59,043 5 (3) 3 (9) (6) 1 (4) (2) (10) (2) Jun-15 7 6 5 15.0 14.1 13.3 12.7 99 102 5.0 13.4 1.8 n.a. n.a. n.a.
Energy Mark Samter/ Paul McTaggart/ Sam Webb - 61 2 8205 4537/ 61 2 8205 4698/ 61 2 8205 4535
AWE Limited AWE AU N A$ 0.90 0.88 (2) 360 2.4 5 1 41 80 (30) 1 (0) 35 78 (27) Jun-15 (56) 97 614 n.m. n.m. n.m. 34.4 92 433 0.0 (12.1) 0.9 2.2 14.2 (6)
Beach Energy BPT AU O A$ 0.65 0.75 15 917 4.3 7 (9) (8) 33 (31) 3 (11) (13) 31 (27) Jun-15 (74) 241 83 9.8 38.4 11.3 6.2 85 89 0.0 2.9 1.5 2.2 7.0 (1)
Caltex Australia CTX AU O A$ 32.03 40.00 25 6,336 32.9 2 (6) (2) (15) (4) (2) (7) (8) (17) (1) Dec-15 (9) 8 3 13.8 15.2 14.1 13.6 105 104 3.3 19.9 3.0 0.8 8.5 15
FAR Limited FAR AU O A$ 0.08 0.12 50 284 0.6 9 6 (8) 1 5 5 5 (13) (1) 9 Dec-15 1 28 (11) n.m. n.m. n.m. n.m. 35 24 0.0 (19.1) 2.7 n.m. n.m. (56)
New Hope Corporation NHC AU U A$ 1.58 1.40 (11) 993 0.2 2 12 14 (15) (19) (1) 10 8 (16) (16) Jul-15 12 (35) (75) 25.3 22.5 34.6 n.m. 179 88 3.2 3.2 0.7 2.2 10.9 (9)
Origin Energy ORG AU O A$ 5.74 5.50 (4) 7,634 29.4 3 (2) 15 22 (42) (0) (3) 10 20 (38) Jun-15 (52) 9 79 9.3 19.4 17.8 9.9 123 90 1.7 3.4 0.6 1.8 12.9 71
Santos Ltd STO AU O A$ 4.80 4.10 (15) 6,460 31.0 5 2 16 30 (28) 1 0 10 29 (24) Dec-15 (75) 2,405 76 n.m. n.m. 17.3 9.8 48 109 0.5 0.2 0.8 4.2 9.1 57
Senex Energy Limited SXY AU O A$ 0.28 0.30 7 240 0.8 4 (13) (7) 96 2 0 (14) (12) 95 5 Jun-15 57 (172) 288 56.8 36.2 n.m. 26.8 95 n.m. 0.0 2.2 0.8 2.9 7.8 (26)
Woodside Petroleum WPL AU U A$ 27.04 25.65 (5) 17,278 61.3 3 0 6 (6) (20) (1) (1) 0 (8) (17) Dec-15 (55) 5 89 15.0 33.7 32.0 16.9 63 53 2.4 3.5 1.2 5.9 8.7 23
WorleyParsons WOR AU O A$ 7.86 7.20 (8) 1,464 11.0 8 3 19 70 (21) 4 1 14 68 (17) Jun-15 (15) 6 8 9.8 11.5 10.9 10.1 108 132 0.0 8.0 0.9 0.5 7.2 43
Sector Aggregate (1) 41,967 3 (1) 8 8 (23) (0) (2) 3 6 (19) Jun-15 (47) (1) 57 12.0 22.8 23.0 14.6 97 82 2.9 4.5 1.0 1.8 9.1 42
Global Services Lucas Goode/ Paul Buys - 61 2 8205 4431/ 61 2 8205 4538
Navitas Ltd NVT AU N A$ 5.61 5.00 (11) 1,581 3.4 2 4 14 20 28 (1) 3 9 18 31 Jun-15 2 3 16 23.1 22.7 22.1 19.0 102 103 3.5 46.4 11.1 2.1 13.1 47
SAI Global SAI AU N A$ 3.64 3.90 7 589 3.4 4 9 2 (13) (11) 0 7 (4) (15) (8) Jun-15 0 8 11 13.9 13.8 12.8 11.6 97 96 4.1 13.7 1.8 1.7 7.5 47
Sector Aggregate (6) 2,170 3 6 11 11 17 (1) 4 5 9 21 Jun-15 1 5 14 19.6 19.4 18.5 16.2 100 100 3.7 24.4 4.7 2.0 10.7 47
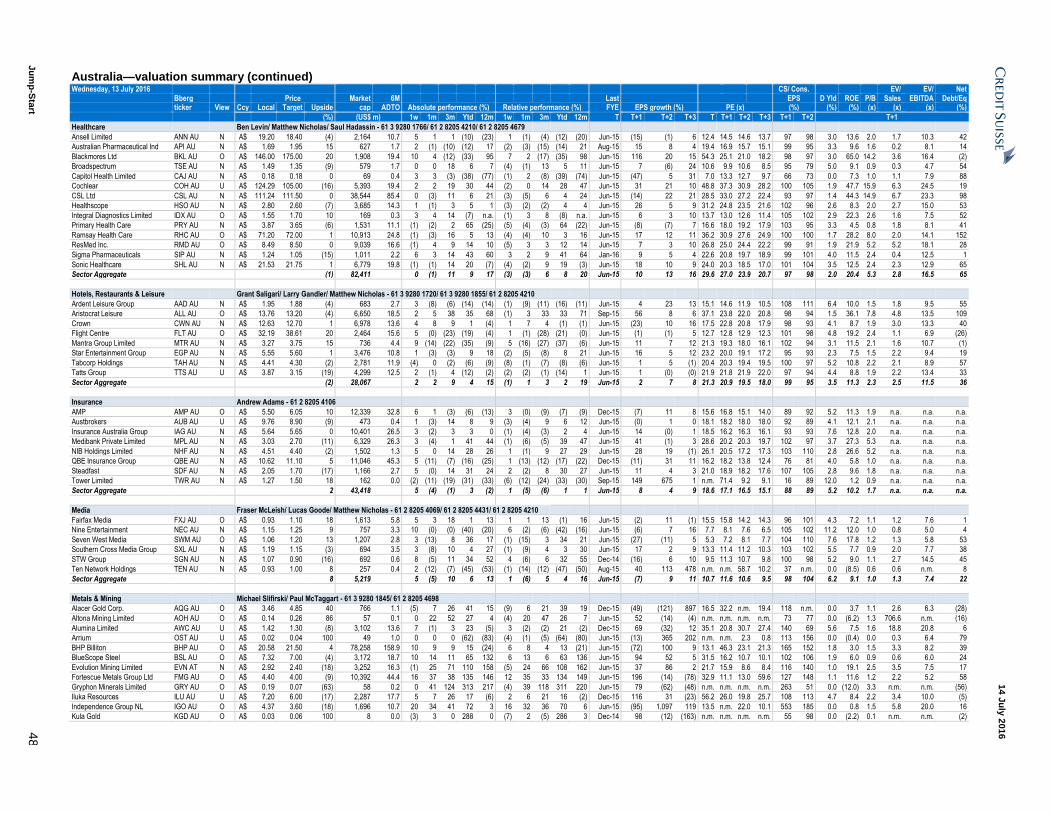
Ju
mp
-Sta
rt 4
8
14 J
uly
201
6
Australia—valuation summary (continued) Wednesday, 13 July 2016
CS/ Cons. EV/ EV/ Net
Bberg Price Market 6M Last EPS D Yld ROE P/B Sales EBITDA Debt/Eq ticker View Ccy Local Target Upside cap ADTO Absolute performance (%) Relative performance (%) FYE EPS growth (%) PE (x) (%) (%) (%) (x) (x) (x) (%)
(%) (US$ m) 1w 1m 3m Ytd 12m 1w 1m 3m Ytd 12m T T+1 T+2 T+3 T T+1 T+2 T+3 T+1 T+2 T+1
Healthcare Ben Levin/ Matthew Nicholas/ Saul Hadassin - 61 3 9280 1766/ 61 2 8205 4210/ 61 2 8205 4679
Ansell Limited ANN AU N A$ 19.20 18.40 (4) 2,164 10.7 5 1 1 (10) (23) 1 (1) (4) (12) (20) Jun-15 (15) (1) 6 12.4 14.5 14.6 13.7 97 98 3.0 13.6 2.0 1.7 10.3 42
Australian Pharmaceutical Ind API AU N A$ 1.69 1.95 15 627 1.7 2 (1) (10) (12) 17 (2) (3) (15) (14) 21 Aug-15 15 8 4 19.4 16.9 15.7 15.1 99 95 3.3 9.6 1.6 0.2 8.1 14
Blackmores Ltd BKL AU O A$ 146.00 175.00 20 1,908 19.4 10 4 (12) (33) 95 7 2 (17) (35) 98 Jun-15 116 20 15 54.3 25.1 21.0 18.2 98 97 3.0 65.0 14.2 3.6 16.4 (2)
Broadspectrum TSE AU N A$ 1.49 1.35 (9) 579 1.7 0 0 18 6 7 (4) (1) 13 5 11 Jun-15 7 (6) 24 10.6 9.9 10.6 8.5 95 79 5.0 9.1 0.9 0.3 4.7 54
Capitol Health Limited CAJ AU N A$ 0.18 0.18 0 69 0.4 3 3 (3) (38) (77) (1) 2 (8) (39) (74) Jun-15 (47) 5 31 7.0 13.3 12.7 9.7 66 73 0.0 7.3 1.0 1.1 7.9 88
Cochlear COH AU U A$ 124.29 105.00 (16) 5,393 19.4 2 2 19 30 44 (2) 0 14 28 47 Jun-15 31 21 10 48.8 37.3 30.9 28.2 100 105 1.9 47.7 15.9 6.3 24.5 19
CSL Ltd CSL AU N A$ 111.24 111.50 0 38,544 85.4 0 (3) 11 6 21 (3) (5) 6 4 24 Jun-15 (14) 22 21 28.5 33.0 27.2 22.4 93 97 1.4 44.3 14.9 6.7 23.3 98
Healthscope HSO AU N A$ 2.80 2.60 (7) 3,685 14.3 1 (1) 3 5 1 (3) (2) (2) 4 4 Jun-15 26 5 9 31.2 24.8 23.5 21.6 102 96 2.6 8.3 2.0 2.7 15.0 53
Integral Diagnostics Limited IDX AU O A$ 1.55 1.70 10 169 0.3 3 4 14 (7) n.a. (1) 3 8 (8) n.a. Jun-15 6 3 10 13.7 13.0 12.6 11.4 105 102 2.9 22.3 2.6 1.6 7.5 52
Primary Health Care PRY AU N A$ 3.87 3.65 (6) 1,531 11.1 (1) (2) 2 65 (25) (5) (4) (3) 64 (22) Jun-15 (8) (7) 7 16.6 18.0 19.2 17.9 103 95 3.3 4.5 0.8 1.8 8.1 41
Ramsay Health Care RHC AU O A$ 71.20 72.00 1 10,913 24.8 (1) (3) 16 5 13 (4) (4) 10 3 16 Jun-15 17 12 11 36.2 30.9 27.6 24.9 100 100 1.7 28.2 8.0 2.0 14.1 152
ResMed Inc. RMD AU O A$ 8.49 8.50 0 9,039 16.6 (1) 4 9 14 10 (5) 3 3 12 14 Jun-15 7 3 10 26.8 25.0 24.4 22.2 99 91 1.9 21.9 5.2 5.2 18.1 28
Sigma Pharmaceuticals SIP AU N A$ 1.24 1.05 (15) 1,011 2.2 6 3 14 43 60 3 2 9 41 64 Jan-16 9 5 4 22.6 20.8 19.7 18.9 99 101 4.0 11.5 2.4 0.4 12.5 1
Sonic Healthcare SHL AU N A$ 21.53 21.75 1 6,779 19.8 (1) (1) 14 20 (7) (4) (2) 9 19 (3) Jun-15 18 10 9 24.0 20.3 18.5 17.0 101 104 3.5 12.5 2.4 2.3 12.9 65
Sector Aggregate (1) 82,411 0 (1) 11 9 17 (3) (3) 6 8 20 Jun-15 10 13 16 29.6 27.0 23.9 20.7 97 98 2.0 20.4 5.3 2.8 16.5 65
Hotels, Restaurants & Leisure Grant Saligari/ Larry Gandler/ Matthew Nicholas - 61 3 9280 1720/ 61 3 9280 1855/ 61 2 8205 4210
Ardent Leisure Group AAD AU N A$ 1.95 1.88 (4) 683 2.7 3 (8) (6) (14) (14) (1) (9) (11) (16) (11) Jun-15 4 23 13 15.1 14.6 11.9 10.5 108 111 6.4 10.0 1.5 1.8 9.5 55
Aristocrat Leisure ALL AU O A$ 13.76 13.20 (4) 6,650 18.5 2 5 38 35 68 (1) 3 33 33 71 Sep-15 56 8 6 37.1 23.8 22.0 20.8 98 94 1.5 36.1 7.8 4.8 13.5 109
Crown CWN AU N A$ 12.63 12.70 1 6,978 13.6 4 8 9 1 (4) 1 7 4 (1) (1) Jun-15 (23) 10 16 17.5 22.8 20.8 17.9 98 93 4.1 8.7 1.9 3.0 13.3 40
Flight Centre FLT AU O A$ 32.19 38.61 20 2,464 15.6 5 (0) (23) (19) (4) 1 (1) (28) (21) (0) Jun-15 (1) (1) 5 12.7 12.8 12.9 12.3 101 98 4.8 19.2 2.4 1.1 6.9 (26)
Mantra Group Limited MTR AU N A$ 3.27 3.75 15 736 4.4 9 (14) (22) (35) (9) 5 (16) (27) (37) (6) Jun-15 11 7 12 21.3 19.3 18.0 16.1 102 94 3.1 11.5 2.1 1.6 10.7 (1)
Star Entertainment Group EGP AU N A$ 5.55 5.60 1 3,476 10.8 1 (3) (3) 9 18 (2) (5) (8) 8 21 Jun-15 16 5 12 23.2 20.0 19.1 17.2 95 93 2.3 7.5 1.5 2.2 9.4 19
Tabcorp Holdings TAH AU N A$ 4.41 4.30 (2) 2,781 11.9 (4) 0 (2) (6) (9) (8) (1) (7) (8) (6) Jun-15 1 5 (1) 20.4 20.3 19.4 19.5 100 97 5.2 10.8 2.2 2.1 8.9 57
Tatts Group TTS AU U A$ 3.87 3.15 (19) 4,299 12.5 2 (1) 4 (12) (2) (2) (2) (1) (14) 1 Jun-15 1 (0) (0) 21.9 21.8 21.9 22.0 97 94 4.4 8.8 1.9 2.2 13.4 33
Sector Aggregate (2) 28,067 2 2 9 4 15 (1) 1 3 2 19 Jun-15 2 7 8 21.3 20.9 19.5 18.0 99 95 3.5 11.3 2.3 2.5 11.5 36
Insurance Andrew Adams - 61 2 8205 4106
AMP AMP AU O A$ 5.50 6.05 10 12,339 32.8 6 1 (3) (6) (13) 3 (0) (9) (7) (9) Dec-15 (7) 11 8 15.6 16.8 15.1 14.0 89 92 5.2 11.3 1.9 n.a. n.a. n.a.
Austbrokers AUB AU U A$ 9.76 8.90 (9) 473 0.4 1 (3) 14 8 9 (3) (4) 9 6 12 Jun-15 (0) 1 0 18.1 18.2 18.0 18.0 92 89 4.1 12.1 2.1 n.a. n.a. n.a.
Insurance Australia Group IAG AU N A$ 5.64 5.65 0 10,401 26.5 3 (2) 3 3 0 (1) (4) (3) 2 4 Jun-15 14 (0) 1 18.5 16.2 16.3 16.1 93 93 7.6 12.8 2.0 n.a. n.a. n.a.
Medibank Private Limited MPL AU N A$ 3.03 2.70 (11) 6,329 26.3 3 (4) 1 41 44 (1) (6) (5) 39 47 Jun-15 41 (1) 3 28.6 20.2 20.3 19.7 102 97 3.7 27.3 5.3 n.a. n.a. n.a.
NIB Holdings Limited NHF AU N A$ 4.51 4.40 (2) 1,502 1.3 5 0 14 28 26 1 (1) 9 27 29 Jun-15 28 19 (1) 26.1 20.5 17.2 17.3 103 110 2.8 26.6 5.2 n.a. n.a. n.a.
QBE Insurance Group QBE AU N A$ 10.62 11.10 5 11,046 45.3 5 (11) (7) (16) (25) 1 (13) (12) (17) (22) Dec-15 (11) 31 11 16.2 18.2 13.8 12.4 76 81 4.0 5.8 1.0 n.a. n.a. n.a.
Steadfast SDF AU N A$ 2.05 1.70 (17) 1,166 2.7 5 (0) 14 31 24 2 (2) 8 30 27 Jun-15 11 4 3 21.0 18.9 18.2 17.6 107 105 2.8 9.6 1.8 n.a. n.a. n.a.
Tower Limited TWR AU N A$ 1.27 1.50 18 162 0.0 (2) (11) (19) (31) (33) (6) (12) (24) (33) (30) Sep-15 149 675 1 n.m. 71.4 9.2 9.1 16 89 12.0 1.2 0.9 n.a. n.a. n.a.
Sector Aggregate 2 43,418 5 (4) (1) 3 (2) 1 (5) (6) 1 1 Jun-15 8 4 9 18.6 17.1 16.5 15.1 88 89 5.2 10.2 1.7 n.a. n.a. n.a.
Media Fraser McLeish/ Lucas Goode/ Matthew Nicholas - 61 2 8205 4069/ 61 2 8205 4431/ 61 2 8205 4210
Fairfax Media FXJ AU O A$ 0.93 1.10 18 1,613 5.8 5 3 18 1 13 1 1 13 (1) 16 Jun-15 (2) 11 (1) 15.5 15.8 14.2 14.3 96 101 4.3 7.2 1.1 1.2 7.6 1
Nine Entertainment NEC AU N A$ 1.15 1.25 9 757 3.3 10 (0) (0) (40) (20) 6 (2) (6) (42) (16) Jun-15 (6) 7 16 7.7 8.1 7.6 6.5 105 102 11.2 12.0 1.0 0.8 5.0 4
Seven West Media SWM AU O A$ 1.06 1.20 13 1,207 2.8 3 (13) 8 36 17 (1) (15) 3 34 21 Jun-15 (27) (11) 5 5.3 7.2 8.1 7.7 104 110 7.6 17.8 1.2 1.3 5.8 53
Southern Cross Media Group SXL AU N A$ 1.19 1.15 (3) 694 3.5 3 (8) 10 4 27 (1) (9) 4 3 30 Jun-15 17 2 9 13.3 11.4 11.2 10.3 103 102 5.5 7.7 0.9 2.0 7.7 38
STW Group SGN AU N A$ 1.07 0.90 (16) 692 0.6 8 (5) 11 34 52 4 (6) 6 32 55 Dec-14 (16) 6 10 9.5 11.3 10.7 9.8 100 98 5.2 9.0 1.1 2.7 14.5 45
Ten Network Holdings TEN AU N A$ 0.93 1.00 8 257 0.4 2 (12) (7) (45) (53) (1) (14) (12) (47) (50) Aug-15 40 113 478 n.m. n.m. 58.7 10.2 37 n.m. 0.0 (8.5) 0.6 0.6 n.m. 8
Sector Aggregate 8 5,219 5 (5) 10 6 13 1 (6) 5 4 16 Jun-15 (7) 9 11 10.7 11.6 10.6 9.5 98 104 6.2 9.1 1.0 1.3 7.4 22
Metals & Mining Michael Slifirski/ Paul McTaggart - 61 3 9280 1845/ 61 2 8205 4698
Alacer Gold Corp. AQG AU O A$ 3.46 4.85 40 766 1.1 (5) 7 26 41 15 (9) 6 21 39 19 Dec-15 (49) (121) 897 16.5 32.2 n.m. 19.4 118 n.m. 0.0 3.7 1.1 2.6 6.3 (28)
Altona Mining Limited AOH AU O A$ 0.14 0.26 86 57 0.1 0 22 52 27 4 (4) 20 47 26 7 Jun-15 52 (14) (4) n.m. n.m. n.m. n.m. 73 77 0.0 (6.2) 1.3 706.6 n.m. (16)
Alumina Limited AWC AU U A$ 1.42 1.30 (8) 3,102 13.6 7 (1) 3 23 (5) 3 (2) (2) 21 (2) Dec-15 69 (32) 12 35.1 20.8 30.7 27.4 140 69 5.6 7.5 1.6 18.8 20.8 6
Arrium OST AU U A$ 0.02 0.04 100 49 1.0 0 0 0 (62) (83) (4) (1) (5) (64) (80) Jun-15 (13) 365 202 n.m. n.m. 2.3 0.8 113 156 0.0 (0.4) 0.0 0.3 6.4 79
BHP Billiton BHP AU O A$ 20.58 21.50 4 78,258 158.9 10 9 9 15 (24) 6 8 4 13 (21) Jun-15 (72) 100 9 13.1 46.3 23.1 21.3 165 152 1.8 3.0 1.5 3.3 8.2 39
BlueScope Steel BSL AU O A$ 7.32 7.00 (4) 3,172 18.7 10 14 11 65 132 6 13 6 63 136 Jun-15 94 52 5 31.5 16.2 10.7 10.1 102 106 1.9 6.0 0.9 0.6 6.0 24
Evolution Mining Limited EVN AT N A$ 2.92 2.40 (18) 3,252 16.3 (1) 25 71 110 158 (5) 24 66 108 162 Jun-15 37 86 2 21.7 15.9 8.6 8.4 116 140 1.0 19.1 2.5 3.5 7.5 17
Fortescue Metals Group Ltd FMG AU O A$ 4.40 4.00 (9) 10,392 44.4 16 37 38 135 146 12 35 33 134 149 Jun-15 196 (14) (78) 32.9 11.1 13.0 59.6 127 148 1.1 11.6 1.2 2.2 5.2 58
Gryphon Minerals Limited GRY AU O A$ 0.19 0.07 (63) 58 0.2 0 41 124 313 217 (4) 39 118 311 220 Jun-15 79 (62) (48) n.m. n.m. n.m. n.m. 263 51 0.0 (12.0) 3.3 n.m. n.m. (56)
Iluka Resources ILU AU U A$ 7.20 6.00 (17) 2,287 17.7 5 7 26 17 (6) 2 6 21 16 (2) Dec-15 116 31 (23) 56.2 26.0 19.8 25.7 108 113 4.7 8.4 2.2 3.4 10.0 (5)
Independence Group NL IGO AU O A$ 4.37 3.60 (18) 1,696 10.7 20 34 41 72 3 16 32 36 70 6 Jun-15 (95) 1,097 119 13.5 n.m. 22.0 10.1 553 185 0.0 0.8 1.5 5.8 20.0 16
Kula Gold KGD AU O A$ 0.03 0.06 100 8 0.0 (3) 3 0 288 0 (7) 2 (5) 286 3 Dec-14 98 (12) (163) n.m. n.m. n.m. n.m. 55 98 0.0 (2.2) 0.1 n.m. n.m. (2)

Ju
mp
-Sta
rt 4
9
14 J
uly
201
6
Australia—valuation summary (continued) Wednesday, 13 July 2016
CS/ Cons. EV/ EV/ Net
Bberg Price Market 6M Last EPS D Yld ROE P/B Sales EBITDA Debt/Eq ticker View Ccy Local Target Upside cap ADTO Absolute performance (%) Relative performance (%) FYE EPS growth (%) PE (x) (%) (%) (%) (x) (x) (x) (%)
(%) (US$ m) 1w 1m 3m Ytd 12m 1w 1m 3m Ytd 12m T T+1 T+2 T+3 T T+1 T+2 T+3 T+1 T+2 T+1
Metals & Mining Michael Slifirski/ Paul McTaggart - 61 3 9280 1845/ 61 2 8205 4698
Newcrest Mining NCM AU U A$ 26.20 19.20 (27) 15,233 68.9 1 17 47 102 103 (3) 16 41 100 106 Jun-15 (20) 195 6 35.9 45.1 15.3 14.4 105 151 0.3 4.9 2.2 5.2 13.3 33
Northern Star Resources Ltd NST AU U A$ 5.70 4.20 (26) 2,596 17.6 (1) 20 61 105 147 (5) 19 56 103 150 Jun-15 96 102 17 36.8 18.8 9.3 7.9 106 125 1.5 46.4 7.4 3.5 7.6 (68)
OceanaGold Corporation OGC AU U A$ 5.33 4.40 (17) 2,467 3.6 (6) 20 30 101 72 (10) 18 25 99 75 Dec-15 67 69 (33) 28.7 17.2 10.2 15.4 130 128 1.0 11.9 2.0 4.4 8.6 18
OZ Minerals OZL AU N A$ 6.84 5.70 (17) 1,574 10.0 12 23 27 69 73 8 22 22 67 76 Dec-15 (36) (13) (119) 15.9 24.9 28.7 n.m. 106 77 1.6 3.5 0.9 1.9 4.3 (27)
Perseus Mining PRU AU O A$ 0.65 0.85 31 503 1.9 (3) 25 53 102 58 (7) 24 47 100 62 Jun-15 (100) 3,953 128 4.0 n.m. 30.4 13.3 n.m. n.m. 0.0 0.1 1.0 1.8 12.5 (24)
Regis Resources Limited RRL AU U A$ 3.95 2.90 (27) 1,498 11.3 2 19 58 70 243 (2) 18 53 69 247 Jun-16 38 57 1 21.0 15.2 9.7 9.5 92 127 3.9 26.6 3.8 3.4 7.1 (35)
Rio Tinto RIO AU N A$ 50.78 50.00 (2) 61,728 89.3 8 15 4 14 (4) 5 14 (1) 12 (1) Dec-15 (24) 2 (25) 15.5 20.5 20.1 26.9 110 113 2.9 9.1 1.8 2.3 7.3 28
Sandfire Resources NL SFR AU U A$ 6.36 3.80 (40) 759 4.4 20 17 20 13 1 17 15 15 11 4 Jun-15 (13) (45) (71) 14.4 16.6 30.5 n.m. 111 43 1.6 16.3 2.6 2.5 5.4 (3)
Sims Metal Management SGM AU N A$ 8.81 8.00 (9) 1,321 8.8 8 7 (6) 22 (10) 4 6 (12) 20 (6) Jun-15 (72) 272 12 17.8 64.3 17.3 15.4 80 115 1.5 1.4 0.9 0.3 7.7 (15)
South 32 S32 AU N A$ 1.92 1.80 (6) 7,733 26.0 20 17 24 80 9 16 16 19 78 12 Jun-16 564 49 4 n.m. 17.7 11.9 11.5 155 158 2.3 4.5 0.8 1.1 4.8 (7)
St Barbara Mining SBM AU N A$ 3.62 2.95 (19) 1,359 10.6 4 12 58 154 514 0 11 53 152 517 Jun-15 521 64 1 84.1 13.6 8.3 8.2 98 113 0.0 66.5 7.0 3.0 6.4 37
Syrah Resources SYR AU O A$ 5.75 7.80 36 1,150 4.5 (3) (12) 35 47 52 (7) (13) 30 46 55 Dec-15 50 1,288 133 n.m. n.m. 16.9 7.3 182 n.m. 0.0 (2.1) 3.5 n.m. n.m. (29)
Western Areas WSA AU O A$ 3.01 2.50 (17) 619 3.4 25 31 39 34 (7) 22 30 33 33 (4) Jun-15 (186) 183 104 20.0 n.m. 28.2 13.8 60 140 0.0 (8.0) 1.9 3.6 26.5 (19)
Whitehaven Coal WHC AU N A$ 1.52 1.20 (21) 1,183 2.8 29 45 107 117 24 25 43 102 115 27 Jun-15 197 157 67 n.m. n.m. 60.4 36.1 245 68 0.0 0.3 0.5 2.1 12.4 30
Sector Aggregate (3) 202,818 9 15 17 38 19 5 13 11 36 22 Jun-15 (40) 38 0 15.6 25.8 18.7 18.6 115 131 2.4 5.9 1.5 2.4 7.4 31
Real Estate Ian Randall - 612 8205 4580
Lend Lease LLC AU O A$ 12.20 17.00 39 5,389 20.5 2 (10) (8) (14) (21) (2) (11) (14) (16) (18) Jun-15 12 8 10 11.4 10.2 9.4 8.5 100 101 4.8 13.2 1.3 n.a. 7.6 18
REITs Ian Randall/ Mikhail Mohl - 612 8205 4580/ 61 2 8205 4413
BWP Trust BWP AU U A$ 3.69 2.65 (28) 1,798 3.3 1 0 9 17 14 (3) (1) 4 15 18 Jun-15 5 3 2 23.2 22.1 21.3 20.8 100 101 4.5 11.3 2.5 n.a. 21.7 32
Charter Hall Group CHC AU U A$ 5.32 4.50 (15) 1,665 4.5 2 3 17 17 14 (2) 1 12 15 18 Jun-15 9 1 6 19.4 17.8 17.6 16.7 100 98 5.1 8.5 1.5 n.a. 17.0 (1)
Charter Hall Retail REIT CQR AU U A$ 4.85 3.84 (21) 1,487 4.3 2 (1) 5 16 14 (2) (2) 0 15 17 Jun-15 2 3 3 16.3 16.0 15.6 15.1 100 100 5.8 8.3 1.3 n.a. 18.1 49
Cromwell Property Group CMW AU U A$ 1.05 0.97 (8) 1,396 2.7 4 (1) 6 0 (2) 1 (2) 0 (2) 1 Jun-15 11 (8) 2 12.6 11.3 12.2 11.9 105 99 7.8 12.0 1.3 n.a. 13.3 82
Dexus Property Group DXSDA AU U A$ 9.29 7.78 (16) 6,821 20.4 0 4 13 24 26 (4) 3 8 22 30 Jun-15 6 (2) 2 15.6 14.7 15.1 14.8 90 104 4.7 8.6 1.2 n.a. 15.9 46
GDI Property Group GDI AU O A$ 0.92 1.00 9 374 0.5 3 1 7 7 6 (1) (0) 2 5 9 Jun-15 9 (1) 5 11.2 10.3 10.3 9.8 100 95 8.5 8.7 0.9 n.a. 12.4 44
Goodman Group GMGDA AU O A$ 7.25 7.10 (2) 9,779 24.0 2 (0) 9 16 13 (2) (2) 4 14 16 Jun-15 8 8 7 19.5 18.1 16.8 15.7 100 101 3.3 9.4 1.6 n.a. 15.9 15
GPT Group GPT AU U A$ 5.54 4.75 (14) 7,555 20.6 2 2 13 16 26 (2) 1 8 14 29 Dec-15 5 3 3 19.6 18.7 18.2 17.7 102 102 4.2 6.9 1.3 n.a. 19.7 35
Investa Office Fund IOF AU N A$ 4.43 4.17 (6) 2,063 6.0 3 3 9 11 13 (1) 1 4 9 16 Jun-15 2 2 3 16.0 15.7 15.4 15.0 108 108 4.4 8.1 1.3 n.a. 19.0 46
Mirvac Group MGR AU O A$ 2.09 2.06 (1) 5,868 19.8 2 5 9 6 11 (1) 3 4 4 14 Jun-15 6 7 6 17.0 16.1 15.0 14.2 100 101 4.7 6.8 1.1 n.a. 16.3 38
SCA Property Group SCP AU U A$ 2.43 1.97 (19) 1,352 3.3 5 3 8 14 14 1 2 3 12 17 Jun-15 7 4 2 19.0 17.8 17.2 16.8 94 100 5.0 7.5 1.3 n.a. 19.6 56
Scentre Group SCG AU O A$ 5.22 4.76 (9) 21,081 42.8 4 11 14 25 36 1 10 9 23 39 Dec-15 3 5 5 23.1 22.4 21.4 20.4 102 102 4.1 6.9 1.6 n.a. 21.3 64
Stockland Group SGP AU O A$ 4.89 4.68 (4) 8,872 23.4 1 4 15 19 16 (2) 3 10 18 20 Jun-15 8 8 5 18.9 17.5 16.3 15.5 100 102 5.1 7.4 1.3 n.a. 20.2 35
Vicinity Centres CRF AU N A$ 3.45 3.08 (11) 10,359 24.4 3 4 8 23 15 (1) 3 3 21 19 Jun-15 11 3 3 20.0 18.1 17.5 17.0 102 104 5.1 7.1 1.3 n.a. 19.8 44
Westfield Corporation WFD AU O A$ 11.00 11.47 4 17,339 39.1 1 4 10 16 14 (3) 2 4 14 17 Dec-15 (9) 8 12 22.1 24.2 22.3 20.0 101 102 3.0 7.1 1.6 n.a. 28.6 71
Sector Aggregate (7) 97,809 2 5 11 18 20 (2) 3 6 17 24 Jun-15 7 4 5 20.1 18.9 18.2 17.3 104 103 4.3 7.7 1.4 n.a. 19.8 47
Retailing Grant Saligari/ Lucas Goode/ Matthew Nicholas/ Paul Buys - 61 3 9280 1720/ 61 2 8205 4431/ 61 2 8205 4210/ 61 2 8205 4538
Harvey Norman HVN AU N A$ 4.36 4.70 8 3,679 9.0 1 (4) 0 4 (3) (3) (6) (5) 3 1 Jun-15 21 7 0 18.2 15.1 14.1 14.1 101 99 5.1 12.4 1.8 3.1 9.3 19
iCar Asia Ltd ICQ AU O A$ 0.81 1.00 23 152 0.2 (5) (9) (10) (16) 21 (9) (10) (15) (18) 24 Dec-15 40 42 84 n.m. n.m. n.m. n.m. 99 47 0.0 (22.1) 6.0 16.5 n.m. (33)
iSelect Limited ISU AU O A$ 1.15 1.20 4 208 0.4 (5) (2) 12 2 (22) (9) (4) 7 0 (18) Jun-15 (47) 73 25 14.1 26.5 15.4 12.3 94 89 2.0 4.5 1.2 1.1 8.7 (40)
JB Hi-Fi JBH AU O A$ 23.50 25.95 10 1,764 13.5 (0) 4 5 20 18 (4) 2 (0) 19 21 Jun-15 7 25 4 17.2 16.1 12.9 12.3 100 114 4.1 39.7 5.9 0.6 9.5 16
Myer Holdings MYR AU O A$ 1.16 1.40 21 719 4.9 3 1 6 (3) (1) (1) (0) 1 (5) 3 Jul-15 (33) 10 8 8.8 13.1 11.9 11.0 97 106 2.6 7.1 0.9 0.3 5.0 6
Premier Investments PMV AU U A$ 14.81 14.42 (3) 1,765 3.6 6 (2) (8) 4 12 3 (4) (13) 3 16 Jul-15 18 6 14 26.1 22.1 20.9 18.3 98 92 3.0 7.8 1.7 2.0 14.2 (14)
Super Retail Group SUL AU N A$ 9.10 8.90 (2) 1,361 6.3 6 2 12 (20) (1) 2 0 6 (22) 3 Jul-15 (0) 16 18 17.0 17.0 14.7 12.5 98 95 4.6 14.1 2.4 0.9 9.8 64
Webjet WEB AU O A$ 7.14 6.89 (4) 526 1.0 2 (1) 20 32 80 (2) (2) 15 30 84 Jun-15 6 45 19 31.6 29.9 20.6 17.3 94 94 1.9 15.7 3.9 4.3 18.6 (32)
Sector Aggregate 6 10,175 2 (1) 3 4 8 (1) (3) (3) 3 12 Jun-15 6 14 7 18.4 17.3 15.2 14.2 99 100 4.1 11.9 2.0 1.1 9.7 12
Software & Services Fraser McLeish/ Jack Briggs/ Lucas Goode/ Matthew Nicholas - 61 2 8205 4069/ 61 2 8205 4094/ 61 2 8205 4431/ 61 2 8205 4210
Aconex ACX AU O A$ 8.08 7.10 (12) 1,195 3.9 2 20 34 55 138 (2) 18 29 54 141 Jun-15 525 58 48 n.m. n.m. 88.1 59.5 126 121 0.0 (31.7) 53.0 11.9 92.9 (47)
APN Outdoor Group Limited APO AU O A$ 7.58 7.05 (7) 958 4.0 4 8 10 24 147 0 7 5 23 150 Dec-15 21 15 12 29.1 24.1 21.0 18.8 98 97 2.4 20.2 4.7 3.9 15.0 18
carsales.com.au CAR AU N A$ 12.12 11.30 (7) 2,217 8.0 (0) (3) 6 4 15 (4) (4) 1 2 19 Jun-15 10 12 9 29.2 26.6 23.8 21.8 101 101 3.1 47.0 12.1 9.0 18.2 70
Hansen Technologies HSN AU N A$ 3.71 3.75 1 506 1.0 (1) (0) 2 8 30 (5) (2) (3) 6 34 Jun-15 37 12 7 32.0 23.3 20.7 19.4 111 112 2.0 23.3 4.9 4.2 14.1 (24)
News Corporation NWS AU N A$ 16.64 17.70 6 7,129 3.4 5 2 (3) (14) (12) 2 0 (8) (16) (9) Jun-15 (9) 9 14 26.6 29.4 26.9 23.6 95 92 1.6 2.1 0.6 0.7 6.7 (11)
oOh!media Limited OML AU O A$ 5.18 4.95 (4) 590 1.8 2 8 6 10 111 (2) 7 0 8 114 Dec-15 28 15 15 27.2 21.2 18.5 16.1 106 103 2.1 14.0 2.9 2.7 12.0 30
REA Group REA AU O A$ 62.40 56.50 (9) 6,234 13.0 3 12 19 13 49 (1) 10 14 12 53 Jun-15 20 28 16 46.1 38.4 30.0 25.8 97 101 1.3 34.8 12.3 13.4 23.8 44
Seek SEK AU N A$ 15.60 14.35 (8) 4,088 14.2 5 (1) 3 1 10 1 (2) (3) (0) 14 Jun-15 (7) 15 23 28.9 31.0 27.0 21.9 96 95 2.6 14.3 4.1 5.7 14.8 10
WiseTech Global Pty Ltd WTC AU N A$ 5.16 4.32 (16) 1,137 0.9 5 18 28 n.a. n.a. 2 17 23 n.a. n.a. Jun-15 18 84 37 n.m. n.m. 57.5 41.8 100 98 0.0 15.0 7.9 13.7 46.7 (52)
Sector Aggregate (4) 24,054 4 6 9 4 30 0 4 3 2 33 Jun-15 11 17 17 36.3 32.9 28.2 24.1 97 97 1.7 5.3 1.7 2.2 13.2 (6)

Ju
mp
-Sta
rt 5
0
14 J
uly
201
6
Australia—valuation summary (continued) Wednesday, 13 July 2016
CS/ Cons. EV/ EV/ Net
Bberg Price Market 6M Last EPS D Yld ROE P/B Sales EBITDA Debt/Eq ticker View Ccy Local Target Upside cap ADTO Absolute performance (%) Relative performance (%) FYE EPS growth (%) PE (x) (%) (%) (%) (x) (x) (x) (%)
(%) (US$ m) 1w 1m 3m Ytd 12m 1w 1m 3m Ytd 12m T T+1 T+2 T+3 T T+1 T+2 T+3 T+1 T+2 T+1
Technology Hardware Jack Briggs - 61 2 8205 4094
NextDC NXT AU O A$ 3.45 3.80 10 640 1.6 (1) 0 22 44 50 (5) (1) 17 42 53 Jun-15 141 186 57 n.m. n.m. 56.6 36.1 133 130 0.0 1.8 2.5 9.6 30.7 4
Speedcast International SDA AU N A$ 3.59 3.90 9 331 0.4 3 (8) (22) (13) 15 (1) (9) (27) (15) 18 Dec-15 29 28 17 22.4 17.4 13.6 11.6 96 102 2.4 61.5 9.5 1.8 10.3 248
Sector Aggregate 10 971 0 (3) 7 24 38 (3) (4) 2 22 41 Jun-15 141 59 34 n.m. 46.0 29.0 21.5 103 108 0.7 1.8 3.4 3.9 18.9 34
Telecommunication Services Fraser McLeish/ Jack Briggs - 61 2 8205 4069/ 61 2 8205 4094
BigAir Group BGL AU N A$ 0.68 0.70 3 91 0.1 5 11 11 (16) 0 2 9 6 (18) 3 Jun-15 (3) 14 4 14.0 14.4 12.6 12.2 98 91 2.3 17.0 2.3 1.8 6.9 55
Telstra Corporation TLS AU U A$ 5.68 5.25 (8) 52,672 103.8 2 4 10 1 (10) (1) 3 5 (1) (7) Jun-15 0 6 13 16.6 16.5 15.5 13.7 98 101 5.5 29.4 4.8 3.1 7.7 92
TPG Telecom TPM AU U A$ 11.95 9.00 (25) 7,691 11.5 1 (0) 9 21 30 (3) (2) 4 19 33 Jul-15 34 15 11 38.5 28.8 25.2 22.7 100 98 1.3 26.8 6.4 4.7 14.5 71
Sector Aggregate (10) 60,453 2 3 10 4 (5) (2) 2 5 2 (2) Jun-15 2 7 13 17.9 17.5 16.3 14.4 98 100 4.9 29.1 4.9 3.2 8.1 90
Transportation Paul Butler/ Paul Buys - 61 2 8205 4309/ 61 2 8205 4538
Alliance Aviation Services Limited AQZ AU O A$ 0.52 0.80 54 47 0.0 3 12 10 3 11 (1) 11 4 1 14 Jun-15 (18) 22 12 4.1 5.1 4.1 3.7 101 100 4.8 10.0 0.5 0.7 3.1 59
Aurizon AZJ AU O A$ 5.03 4.75 (6) 7,828 28.3 3 10 24 15 (6) (1) 9 18 13 (2) Jun-15 (11) 12 6 17.7 19.9 17.7 16.7 102 104 5.0 9.9 1.8 3.9 9.4 59
Macquarie Atlas MQA AU O A$ 5.28 5.60 6 2,072 5.8 (2) (0) 12 30 66 (6) (2) 7 28 69 Dec-15 8 (18) 57 31.9 29.5 35.8 22.8 91 66 3.4 10.8 3.2 1072.9 n.m. (24)
Qantas QAN AU O A$ 2.99 4.80 61 4,677 32.0 9 (0) (25) (27) (16) 5 (2) (31) (29) (12) Jun-15 103 24 (13) 11.8 5.8 4.7 5.4 97 104 0.0 32.0 1.8 0.8 4.2 90
Sydney Airport SYD AU U A$ 7.01 6.40 (9) 11,854 27.1 (1) (1) 4 10 28 (5) (3) (1) 9 31 Dec-15 5 11 12 55.0 52.4 47.0 41.9 99 97 4.3 25.6 15.6 17.4 21.2 822
Transurban TCL AU O A$ 11.85 12.80 8 18,296 41.1 (2) (0) 6 13 22 (5) (2) 1 11 26 Jun-15 178 (17) 41 n.m. 77.7 94.2 66.9 110 66 3.8 5.8 4.3 16.8 22.5 176
Virgin Australia VBA AU N A$ 0.22 0.26 18 1,323 0.3 5 (26) (41) (53) (50) 1 (27) (46) (54) (47) Jun-15 1,484 (66) 45 n.m. 13.6 39.9 27.6 158 19 0.0 5.7 0.7 1.3 14.0 187
Sector Aggregate 7 46,099 1 1 4 8 15 (3) (1) (1) 6 18 Jun-15 163 8 1 66.3 25.2 23.3 22.9 102 91 3.5 13.4 3.1 3.3 12.4 149
Utilities Peter Wilson - 61 2 8205 4107
AGL Energy AGL AU N A$ 19.85 19.40 (2) 10,159 28.6 (2) 4 10 10 25 (6) 3 5 8 28 Jun-15 11 14 15 20.6 18.6 16.4 14.3 101 102 3.6 8.0 1.5 1.5 9.4 28
APA Group APA AU N A$ 9.40 8.75 (7) 7,945 16.6 (1) 7 9 8 9 (5) 5 4 7 12 Jun-15 (2) 20 0 45.9 46.7 39.0 39.0 110 105 4.4 6.9 3.3 9.5 14.9 228
AusNet Services SPN AU N A$ 1.65 1.60 (3) 4,449 6.1 0 4 10 11 18 (3) 3 4 9 22 Mar-16 (14) (9) (1) 17.7 20.5 22.4 22.7 98 96 5.3 6.1 1.3 6.8 11.9 188
DUET Group DUE AU U A$ 2.48 2.25 (9) 4,577 13.8 2 5 11 9 11 (2) 4 6 7 14 Jun-15 64 (31) 3 44.4 27.1 39.6 38.3 116 68 7.3 7.9 1.7 7.5 11.2 160
Spark Infrastructure Group SKI AU O A$ 2.47 2.35 (5) 3,151 9.7 (2) 4 22 30 32 (6) 3 16 28 36 Dec-15 (50) 26 8 32.5 65.1 51.7 48.0 39 49 5.9 3.0 2.0 19.3 20.2 (1)
Sector Aggregate (5) 30,280 (1) 5 11 12 18 (5) 4 6 10 22 Jun-15 7 0 7 26.9 25.2 25.1 23.3 101 92 4.8 7.8 1.8 3.8 11.8 108
Country Aggregate 5,389 5,535 3 1,170,189 4 1 5 2 (3) Jun-15 (7) 10 8 16.4 17.8 16.2 15.1 101 102 4.2 10.7 1.8 1.9 10.2 45
Note: Prices are as of 13 Jul 2016
* Country/ sector aggregates are for the coverage above,
Source: Company data, Thomson Financial IBES, Credit Suisse estimates
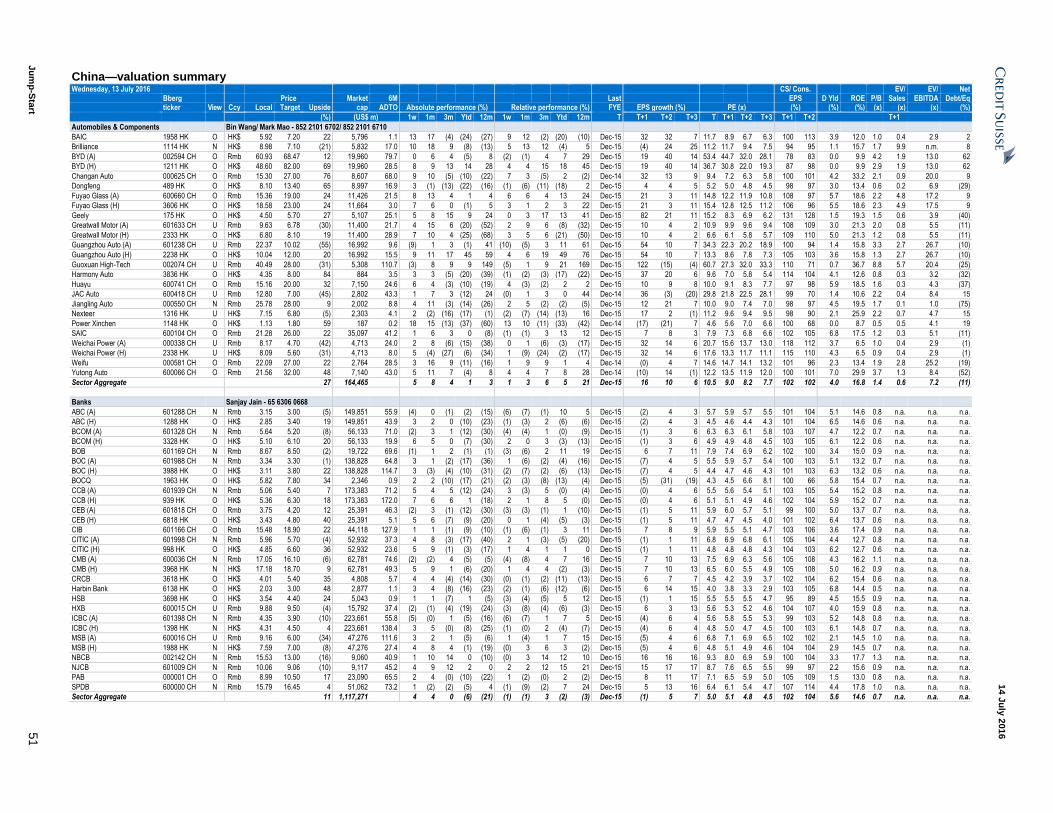
Ju
mp
-Sta
rt 5
1
14 J
uly
201
6
China—valuation summary Wednesday, 13 July 2016
CS/ Cons. EV/ EV/ Net
Bberg Price Market 6M Last EPS D Yld ROE P/B Sales EBITDA Debt/Eq ticker View Ccy Local Target Upside cap ADTO Absolute performance (%) Relative performance (%) FYE EPS growth (%) PE (x) (%) (%) (%) (x) (x) (x) (%)
(%) (US$ m) 1w 1m 3m Ytd 12m 1w 1m 3m Ytd 12m T T+1 T+2 T+3 T T+1 T+2 T+3 T+1 T+2 T+1
Automobiles & Components Bin Wang/ Mark Mao - 852 2101 6702/ 852 2101 6710
BAIC 1958 HK O HK$ 5.92 7.20 22 5,796 1.1 13 17 (4) (24) (27) 9 12 (2) (20) (10) Dec-15 32 32 7 11.7 8.9 6.7 6.3 100 113 3.9 12.0 1.0 0.4 2.9 2
Brilliance 1114 HK N HK$ 8.98 7.10 (21) 5,832 17.0 10 18 9 (8) (13) 5 13 12 (4) 5 Dec-15 (4) 24 25 11.2 11.7 9.4 7.5 94 95 1.1 15.7 1.7 9.9 n.m. 8
BYD (A) 002594 CH O Rmb 60.93 68.47 12 19,960 79.7 0 6 4 (5) 8 (2) (1) 4 7 29 Dec-15 19 40 14 53.4 44.7 32.0 28.1 78 83 0.0 9.9 4.2 1.9 13.0 62
BYD (H) 1211 HK O HK$ 48.60 82.00 69 19,960 28.5 8 9 13 14 28 4 4 15 18 45 Dec-15 19 40 14 36.7 30.8 22.0 19.3 87 98 0.0 9.9 2.9 1.9 13.0 62
Changan Auto 000625 CH O Rmb 15.30 27.00 76 8,607 68.0 9 10 (5) (10) (22) 7 3 (5) 2 (2) Dec-14 32 13 9 9.4 7.2 6.3 5.8 100 101 4.2 33.2 2.1 0.9 20.0 9
Dongfeng 489 HK O HK$ 8.10 13.40 65 8,997 16.9 3 (1) (13) (22) (16) (1) (6) (11) (18) 2 Dec-15 4 4 5 5.2 5.0 4.8 4.5 98 97 3.0 13.4 0.6 0.2 6.9 (29)
Fuyao Glass (A) 600660 CH O Rmb 15.36 19.00 24 11,426 21.5 8 13 4 1 4 6 6 4 13 24 Dec-15 21 3 11 14.8 12.2 11.9 10.8 108 97 5.7 18.6 2.2 4.8 17.2 9
Fuyao Glass (H) 3606 HK O HK$ 18.58 23.00 24 11,664 3.0 7 6 0 (1) 5 3 1 2 3 22 Dec-15 21 3 11 15.4 12.8 12.5 11.2 106 96 5.5 18.6 2.3 4.9 17.5 9
Geely 175 HK O HK$ 4.50 5.70 27 5,107 25.1 5 8 15 9 24 0 3 17 13 41 Dec-15 82 21 11 15.2 8.3 6.9 6.2 131 128 1.5 19.3 1.5 0.6 3.9 (40)
Greatwall Motor (A) 601633 CH U Rmb 9.63 6.78 (30) 11,400 21.7 4 15 6 (20) (52) 2 9 6 (8) (32) Dec-15 10 4 2 10.9 9.9 9.6 9.4 108 109 3.0 21.3 2.0 0.8 5.5 (11)
Greatwall Motor (H) 2333 HK O HK$ 6.80 8.10 19 11,400 28.9 7 10 4 (25) (68) 3 5 6 (21) (50) Dec-15 10 4 2 6.6 6.1 5.8 5.7 109 110 5.0 21.3 1.2 0.8 5.5 (11)
Guangzhou Auto (A) 601238 CH U Rmb 22.37 10.02 (55) 16,992 9.6 (9) 1 3 (1) 41 (10) (5) 3 11 61 Dec-15 54 10 7 34.3 22.3 20.2 18.9 100 94 1.4 15.8 3.3 2.7 26.7 (10)
Guangzhou Auto (H) 2238 HK O HK$ 10.04 12.00 20 16,992 15.5 9 11 17 45 59 4 6 19 49 76 Dec-15 54 10 7 13.3 8.6 7.8 7.3 105 103 3.6 15.8 1.3 2.7 26.7 (10)
Guoxuan High-Tech 002074 CH U Rmb 40.49 28.00 (31) 5,308 110.7 (3) 8 9 9 149 (5) 1 9 21 169 Dec-15 122 (15) (4) 60.7 27.3 32.0 33.3 110 71 0.7 36.7 8.8 5.7 20.4 (25)
Harmony Auto 3836 HK O HK$ 4.35 8.00 84 884 3.5 3 3 (5) (20) (39) (1) (2) (3) (17) (22) Dec-15 37 20 6 9.6 7.0 5.8 5.4 114 104 4.1 12.6 0.8 0.3 3.2 (32)
Huayu 600741 CH O Rmb 15.16 20.00 32 7,150 24.6 6 4 (3) (10) (19) 4 (3) (2) 2 2 Dec-15 10 9 8 10.0 9.1 8.3 7.7 97 98 5.9 18.5 1.6 0.3 4.3 (37)
JAC Auto 600418 CH U Rmb 12.80 7.00 (45) 2,802 43.3 1 7 3 (12) 24 (0) 1 3 0 44 Dec-14 36 (3) (20) 29.8 21.8 22.5 28.1 99 70 1.4 10.6 2.2 0.4 8.4 15
Jiangling Auto 000550 CH N Rmb 25.78 28.00 9 2,002 8.8 4 11 (3) (14) (26) 2 5 (2) (2) (5) Dec-15 12 21 7 10.0 9.0 7.4 7.0 98 97 4.5 19.5 1.7 0.1 1.0 (75)
Nexteer 1316 HK U HK$ 7.15 6.80 (5) 2,303 4.1 2 (2) (16) (17) (1) (2) (7) (14) (13) 16 Dec-15 17 2 (1) 11.2 9.6 9.4 9.5 98 90 2.1 25.9 2.2 0.7 4.7 15
Power Xinchen 1148 HK O HK$ 1.13 1.80 59 187 0.2 18 15 (13) (37) (60) 13 10 (11) (33) (42) Dec-14 (17) (21) 7 4.6 5.6 7.0 6.6 100 68 0.0 8.7 0.5 0.5 4.1 19
SAIC 600104 CH O Rmb 21.28 26.00 22 35,097 41.2 1 6 3 0 (8) (1) (1) 3 13 12 Dec-15 7 8 3 7.9 7.3 6.8 6.6 102 105 6.8 17.5 1.2 0.3 5.1 (11)
Weichai Power (A) 000338 CH U Rmb 8.17 4.70 (42) 4,713 24.0 2 8 (6) (15) (38) 0 1 (6) (3) (17) Dec-15 32 14 6 20.7 15.6 13.7 13.0 118 112 3.7 6.5 1.0 0.4 2.9 (1)
Weichai Power (H) 2338 HK U HK$ 8.09 5.60 (31) 4,713 8.0 5 (4) (27) (6) (34) 1 (9) (24) (2) (17) Dec-15 32 14 6 17.6 13.3 11.7 11.1 115 110 4.3 6.5 0.9 0.4 2.9 (1)
Weifu 000581 CH O Rmb 22.09 27.00 22 2,764 28.5 3 16 9 (11) (16) 1 9 9 1 4 Dec-14 (0) 4 7 14.6 14.7 14.1 13.2 101 96 2.3 13.4 1.9 2.8 25.2 (19)
Yutong Auto 600066 CH O Rmb 21.56 32.00 48 7,140 43.0 5 11 7 (4) 8 4 4 7 8 28 Dec-14 (10) 14 (1) 12.2 13.5 11.9 12.0 100 101 7.0 29.9 3.7 1.3 8.4 (52)
Sector Aggregate 27 164,465 5 8 4 1 3 1 3 6 5 21 Dec-15 16 10 6 10.5 9.0 8.2 7.7 102 102 4.0 16.8 1.4 0.6 7.2 (11)
Banks Sanjay Jain - 65 6306 0668
ABC (A) 601288 CH N Rmb 3.15 3.00 (5) 149,851 55.9 (4) 0 (1) (2) (15) (6) (7) (1) 10 5 Dec-15 (2) 4 3 5.7 5.9 5.7 5.5 101 104 5.1 14.6 0.8 n.a. n.a. n.a.
ABC (H) 1288 HK O HK$ 2.85 3.40 19 149,851 43.9 3 2 0 (10) (23) (1) (3) 2 (6) (6) Dec-15 (2) 4 3 4.5 4.6 4.4 4.3 101 104 6.5 14.6 0.6 n.a. n.a. n.a.
BCOM (A) 601328 CH N Rmb 5.64 5.20 (8) 56,133 71.0 (2) 3 1 (12) (30) (4) (4) 1 (0) (9) Dec-15 (1) 3 6 6.3 6.3 6.1 5.8 103 107 4.7 12.2 0.7 n.a. n.a. n.a.
BCOM (H) 3328 HK O HK$ 5.10 6.10 20 56,133 19.9 6 5 0 (7) (30) 2 0 3 (3) (13) Dec-15 (1) 3 6 4.9 4.9 4.8 4.5 103 105 6.1 12.2 0.6 n.a. n.a. n.a.
BOB 601169 CH N Rmb 8.67 8.50 (2) 19,722 69.6 (1) 1 2 (1) (1) (3) (6) 2 11 19 Dec-15 6 7 11 7.9 7.4 6.9 6.2 102 100 3.4 15.0 0.9 n.a. n.a. n.a.
BOC (A) 601988 CH N Rmb 3.34 3.30 (1) 138,828 64.8 3 1 (2) (17) (36) 1 (6) (2) (4) (16) Dec-15 (7) 4 5 5.5 5.9 5.7 5.4 100 103 5.1 13.2 0.7 n.a. n.a. n.a.
BOC (H) 3988 HK O HK$ 3.11 3.80 22 138,828 114.7 3 (3) (4) (10) (31) (2) (7) (2) (6) (13) Dec-15 (7) 4 5 4.4 4.7 4.6 4.3 101 103 6.3 13.2 0.6 n.a. n.a. n.a.
BOCQ 1963 HK O HK$ 5.82 7.80 34 2,346 0.9 2 2 (10) (17) (21) (2) (3) (8) (13) (4) Dec-15 (5) (31) (19) 4.3 4.5 6.6 8.1 100 66 5.8 15.4 0.7 n.a. n.a. n.a.
CCB (A) 601939 CH N Rmb 5.06 5.40 7 173,383 71.2 5 4 5 (12) (24) 3 (3) 5 (0) (4) Dec-15 (0) 4 6 5.5 5.6 5.4 5.1 103 105 5.4 15.2 0.8 n.a. n.a. n.a.
CCB (H) 939 HK O HK$ 5.36 6.30 18 173,383 172.0 7 6 6 1 (18) 2 1 8 5 (0) Dec-15 (0) 4 6 5.1 5.1 4.9 4.6 102 104 5.9 15.2 0.7 n.a. n.a. n.a.
CEB (A) 601818 CH O Rmb 3.75 4.20 12 25,391 46.3 (2) 3 (1) (12) (30) (3) (3) (1) 1 (10) Dec-15 (1) 5 11 5.9 6.0 5.7 5.1 99 100 5.0 13.7 0.7 n.a. n.a. n.a.
CEB (H) 6818 HK O HK$ 3.43 4.80 40 25,391 5.1 5 6 (7) (9) (20) 0 1 (4) (5) (3) Dec-15 (1) 5 11 4.7 4.7 4.5 4.0 101 102 6.4 13.7 0.6 n.a. n.a. n.a.
CIB 601166 CH O Rmb 15.48 18.90 22 44,118 127.9 1 1 (1) (9) (10) (1) (6) (1) 3 11 Dec-15 7 8 9 5.9 5.5 5.1 4.7 103 106 3.6 17.4 0.9 n.a. n.a. n.a.
CITIC (A) 601998 CH N Rmb 5.96 5.70 (4) 52,932 37.3 4 8 (3) (17) (40) 2 1 (3) (5) (20) Dec-15 (1) 1 11 6.8 6.9 6.8 6.1 105 104 4.4 12.7 0.8 n.a. n.a. n.a.
CITIC (H) 998 HK O HK$ 4.85 6.60 36 52,932 23.6 5 9 (1) (3) (17) 1 4 1 1 0 Dec-15 (1) 1 11 4.8 4.8 4.8 4.3 104 103 6.2 12.7 0.6 n.a. n.a. n.a.
CMB (A) 600036 CH N Rmb 17.05 16.10 (6) 62,781 74.6 (2) (2) 4 (5) (5) (4) (8) 4 7 16 Dec-15 7 10 13 7.5 6.9 6.3 5.6 105 108 4.3 16.2 1.1 n.a. n.a. n.a.
CMB (H) 3968 HK N HK$ 17.18 18.70 9 62,781 49.3 5 9 1 (6) (20) 1 4 4 (2) (3) Dec-15 7 10 13 6.5 6.0 5.5 4.9 105 108 5.0 16.2 0.9 n.a. n.a. n.a.
CRCB 3618 HK O HK$ 4.01 5.40 35 4,808 5.7 4 4 (4) (14) (30) (0) (1) (2) (11) (13) Dec-15 6 7 7 4.5 4.2 3.9 3.7 102 104 6.2 15.4 0.6 n.a. n.a. n.a.
Harbin Bank 6138 HK O HK$ 2.03 3.00 48 2,877 1.1 3 4 (8) (16) (23) (2) (1) (6) (12) (6) Dec-15 6 14 15 4.0 3.8 3.3 2.9 103 105 6.8 14.4 0.5 n.a. n.a. n.a.
HSB 3698 HK O HK$ 3.54 4.40 24 5,043 0.9 1 1 (7) 1 (5) (3) (4) (5) 5 12 Dec-15 (1) 1 15 5.5 5.5 5.5 4.7 95 89 4.5 15.5 0.9 n.a. n.a. n.a.
HXB 600015 CH U Rmb 9.88 9.50 (4) 15,792 37.4 (2) (1) (4) (19) (24) (3) (8) (4) (6) (3) Dec-15 6 3 13 5.6 5.3 5.2 4.6 104 107 4.0 15.9 0.8 n.a. n.a. n.a.
ICBC (A) 601398 CH N Rmb 4.35 3.90 (10) 223,661 55.8 (5) (0) 1 (5) (16) (6) (7) 1 7 5 Dec-15 (4) 6 4 5.6 5.8 5.5 5.3 99 103 5.2 14.8 0.8 n.a. n.a. n.a.
ICBC (H) 1398 HK N HK$ 4.31 4.50 4 223,661 138.4 3 5 (0) (8) (25) (1) (0) 2 (4) (7) Dec-15 (4) 6 4 4.8 5.0 4.7 4.5 100 103 6.1 14.8 0.7 n.a. n.a. n.a.
MSB (A) 600016 CH U Rmb 9.16 6.00 (34) 47,276 111.6 3 2 1 (5) (6) 1 (4) 1 7 15 Dec-15 (5) 4 6 6.8 7.1 6.9 6.5 102 102 2.1 14.5 1.0 n.a. n.a. n.a.
MSB (H) 1988 HK N HK$ 7.59 7.00 (8) 47,276 27.4 4 8 4 (1) (19) (0) 3 6 3 (2) Dec-15 (5) 4 6 4.8 5.1 4.9 4.6 104 104 2.9 14.5 0.7 n.a. n.a. n.a.
NBCB 002142 CH N Rmb 15.53 13.00 (16) 9,060 40.9 1 10 14 0 (10) (0) 3 14 12 10 Dec-15 16 16 16 9.3 8.0 6.9 5.9 100 104 3.3 17.7 1.3 n.a. n.a. n.a.
NJCB 601009 CH N Rmb 10.06 9.06 (10) 9,117 45.2 4 9 12 2 0 2 2 12 15 21 Dec-15 15 17 17 8.7 7.6 6.5 5.5 99 97 2.2 15.6 0.9 n.a. n.a. n.a.
PAB 000001 CH O Rmb 8.99 10.50 17 23,090 65.5 2 4 (0) (10) (22) 1 (2) (0) 2 (2) Dec-15 8 11 17 7.1 6.5 5.9 5.0 105 109 1.5 13.0 0.8 n.a. n.a. n.a.
SPDB 600000 CH N Rmb 15.79 16.45 4 51,062 73.2 1 (2) (2) (5) 4 (1) (9) (2) 7 24 Dec-15 5 13 16 6.4 6.1 5.4 4.7 107 114 4.4 17.8 1.0 n.a. n.a. n.a.
Sector Aggregate 11 1,117,271 4 4 0 (6) (21) (1) (1) 3 (2) (3) Dec-15 (1) 5 7 5.0 5.1 4.8 4.5 102 104 5.6 14.6 0.7 n.a. n.a. n.a.

Ju
mp
-Sta
rt 5
2
14 J
uly
201
6
China—valuation summary (continued) Wednesday, 13 July 2016
CS/ Cons. EV/ EV/ Net
Bberg Price Market 6M Last EPS D Yld ROE P/B Sales EBITDA Debt/Eq ticker View Ccy Local Target Upside cap ADTO Absolute performance (%) Relative performance (%) FYE EPS growth (%) PE (x) (%) (%) (%) (x) (x) (x) (%)
(%) (US$ m) 1w 1m 3m Ytd 12m 1w 1m 3m Ytd 12m T T+1 T+2 T+3 T T+1 T+2 T+3 T+1 T+2 T+1
Building Materials & Construction Trina Chen - 852 2101 7031
Anhui Conch (A) 600585 CH O Rmb 15.94 24.30 52 12,878 49.4 7 11 (11) (7) (24) 5 4 (11) 5 (4) Dec-15 1 51 1 11.2 11.1 7.3 7.3 103 134 2.8 10.5 1.1 1.7 6.0 5
Anhui Conch (H) 914 HK O HK$ 19.94 28.00 40 12,878 29.6 9 11 (11) (4) (24) 5 6 (9) (0) (6) Dec-15 1 51 1 12.1 12.0 7.9 7.9 103 138 2.6 10.5 1.2 1.7 6.0 5
BBMG Corp (A) 601992 CH N Rmb 4.12 4.70 14 5,953 13.1 (0) 8 (10) (12) (13) (2) 1 (9) 0 7 Dec-15 36 16 11 18.5 13.6 11.8 10.6 127 129 0.6 8.2 1.1 1.6 9.9 62
BBMG Corp (H) 2009 HK O HK$ 2.70 5.40 100 5,953 6.2 13 15 (14) 2 (17) 8 10 (12) 6 (0) Dec-15 36 16 11 10.4 7.7 6.7 6.0 115 118 1.0 8.2 0.6 1.6 9.9 62
CNBM 3323 HK N HK$ 3.64 3.80 4 2,533 9.6 7 6 (18) (2) (44) 3 1 (15) 2 (26) Dec-15 94 56 10 16.6 8.6 5.5 5.0 163 187 2.3 3.7 0.3 1.8 9.1 226
CNM 1893 HK N HK$ 1.76 1.70 (3) 810 1.0 5 5 (12) 19 (10) 1 0 (9) 23 7 Dec-15 (4) 68 5 7.0 7.3 4.4 4.1 109 136 2.0 4.8 0.3 0.4 3.1 46
CR Cement 1313 HK O HK$ 2.59 4.00 54 2,181 4.3 6 11 (11) 9 (38) 2 6 (8) 13 (21) Dec-15 37 90 (4) 18.3 13.4 7.1 7.3 89 159 1.0 4.7 0.6 1.3 8.0 64
Shanshui 691 HK U HK$ 6.29 1.70 (73) 2,740 0.0 0 0 0 0 0 (4) (5) 2 4 17 Dec-14 (546) (2) 80 45.3 n.m. n.m. n.m. 225 89 0.0 (18.6) 2.1 2.9 57.8 175
TCC International 1136 HK O HK$ 1.33 1.80 35 848 0.5 5 11 (16) (7) (40) 0 6 (14) (3) (22) Dec-15 126 696 13 n.m. 66.3 8.3 7.3 n.m. 1,453 0.4 0.7 0.3 1.1 7.8 25
WCC 2233 HK U HK$ 0.77 0.85 10 538 6.5 3 (53) (52) (52) (43) (2) (58) (50) (48) (26) Dec-15 81 243 364 n.m. n.m. 40.4 8.7 n.m. 27 0.0 (1.1) 0.6 1.9 7.6 45
Sector Aggregate 34 28,482 8 9 (12) (2) (23) 4 4 (10) 2 (6) Dec-15 30 65 6 17.2 13.3 8.1 6.8 111 144 1.8 5.5 0.7 1.5 8.1 90
Capital Goods Baiding Rong/ Edmond Huang/ Horace Tse - 852 2101 6703/ 852 2101 6701/ 852 2101 7379
AviChina 2357 HK O HK$ 5.87 11.89 103 4,515 6.3 7 12 (1) (4) (14) 2 7 1 0 3 Dec-14 18 28 30 35.4 29.9 23.5 18.1 107 107 0.5 8.3 2.4 1.0 8.5 8
Boer Power 1685 HK U HK$ 3.03 7.00 131 302 3.3 1 (4) (41) (78) (81) (3) (9) (38) (74) (64) Dec-15 (3) 11 9 3.9 4.0 3.6 3.3 94 91 6.5 22.5 0.9 1.5 5.3 90
CCCC (A) 601800 CH U Rmb 11.06 10.00 (10) 24,321 33.8 3 6 (12) (18) (33) 1 (0) (12) (5) (12) Dec-15 14 9 9 11.7 10.3 9.4 8.6 99 98 2.1 11.3 1.1 0.8 9.1 103
CCCC (H) 1800 HK O HK$ 8.56 11.40 33 24,321 29.5 6 (0) (14) 8 (20) 1 (5) (11) 12 (3) Dec-15 14 9 9 7.8 6.9 6.3 5.7 99 98 3.1 11.3 0.7 0.8 9.1 103
China High Speed 658 HK O HK$ 6.46 8.50 32 1,362 5.0 7 17 (2) 4 (6) 3 12 1 7 11 Dec-15 1 4 8 7.9 7.8 7.5 7.0 100 97 4.1 11.4 0.9 1.4 5.0 41
China XD 601179 CH N Rmb 5.34 6.45 21 4,095 11.5 3 1 (7) (22) (38) 1 (6) (7) (9) (17) Dec-14 40 22 9 42.6 30.4 24.8 22.8 100 95 1.0 4.9 1.5 1.5 13.3 (41)
CRCC (A) 601186 CH U Rmb 10.31 7.20 (30) 20,358 38.2 2 8 (10) (24) (41) 0 2 (10) (11) (21) Dec-15 (0) (2) (3) 11.2 11.2 11.5 11.9 88 79 1.5 10.7 1.1 0.4 6.2 57
CRCC (H) 1186 HK U HK$ 9.78 8.20 (16) 20,358 15.4 4 8 (5) 2 (11) (0) 3 (3) 6 7 Dec-15 (0) (2) (3) 9.2 9.2 9.4 9.7 88 78 1.8 10.7 0.9 0.4 6.2 57
CRG (A) 601390 CH U Rmb 7.19 4.55 (37) 23,201 60.4 2 7 (13) (34) (48) 0 (0) (13) (22) (28) Dec-15 4 1 (4) 12.7 12.3 12.1 12.6 100 94 1.4 10.8 1.3 0.4 8.0 56
CRG (H) 390 HK U HK$ 5.82 5.20 (11) 23,201 13.9 3 4 (12) (1) (22) (1) (1) (9) 3 (5) Dec-15 4 1 (4) 8.9 8.6 8.5 8.8 102 95 2.0 10.8 0.9 0.4 8.0 56
CRRC (A) 601766 CH U Rmb 9.43 5.45 (42) 36,407 107.4 2 4 (9) (27) (48) (0) (2) (8) (14) (27) Dec-15 8 4 9 22.8 21.2 20.4 18.7 94 89 1.3 12.0 2.4 0.9 9.6 (5)
CRRC (H) 1766 HK U HK$ 7.24 6.20 (14) 36,407 21.9 5 4 (10) (24) (32) 1 (1) (8) (20) (14) Dec-15 8 4 9 15.1 14.0 13.5 12.4 94 89 1.9 12.0 1.6 0.9 9.6 (5)
Dongfang Electric (A) 600875 CH U Rmb 10.22 6.00 (41) 3,841 27.7 1 7 (9) (25) (39) (1) 1 (9) (13) (19) Dec-15 22 17 24 73.7 60.3 51.4 41.4 109 75 0.6 1.7 1.0 0.2 7.4 (81)
Dongfang Electric (H) 1072 HK N HK$ 6.12 7.10 16 3,841 1.3 3 8 (8) (22) (48) (2) 3 (5) (18) (30) Dec-15 22 17 24 38.0 31.1 26.5 21.3 117 87 1.2 1.7 0.5 0.2 7.4 (81)
GCL-Poly 3800 HK N HK$ 1.09 1.45 33 2,612 7.9 (3) 6 (13) (6) (29) (7) 1 (11) (2) (11) Dec-15 (1) 20 13 7.2 7.3 6.1 5.4 104 106 0.0 12.7 0.8 2.6 5.5 189
Goldwind (A) 002202 CH O Rmb 15.83 21.60 36 5,999 69.2 2 10 (5) (31) (20) 1 3 (5) (18) 1 Dec-15 28 13 11 15.0 11.8 10.4 9.4 110 110 3.9 19.6 2.1 1.5 9.2 47
Goldwind (H) 2208 HK O HK$ 10.94 24.60 125 5,999 7.9 6 4 (8) (27) (32) 2 (1) (6) (23) (15) Dec-15 28 13 11 9.0 7.0 6.2 5.6 114 118 6.5 19.6 1.3 1.5 9.2 47
Guodian Nari 600406 CH N Rmb 14.02 17.00 21 5,094 46.1 5 9 (5) (16) (19) 3 2 (5) (4) 2 Dec-15 16 5 5 26.8 23.2 22.1 21.1 98 90 1.3 17.1 3.7 2.9 19.8 (39)
Han's Laser 002008 CH O Rmb 22.86 28.30 24 3,571 57.6 (2) 5 (2) (12) (18) (4) (1) (2) 1 2 Dec-15 38 9 16 36.1 26.1 23.9 20.6 91 84 1.2 18.4 4.5 3.6 24.3 5
Harbin Electric 1133 HK O HK$ 3.26 3.80 17 579 1.0 (0) 12 (11) (11) (38) (5) 7 (9) (7) (20) Dec-15 (40) 92 39 19.7 32.7 17.1 12.3 106 151 0.3 0.9 0.3 -0.4 -10.5 (101)
Hollysys HOLI US N US$ 18.53 18.30 (1) 1,093 1.6 9 9 (9) (16) (18) 5 4 (7) (12) (1) Jun-15 9 5 3 11.0 10.1 9.6 9.4 101 99 2.0 17.5 1.6 1.6 6.9 (32)
Inovance Tech 300124 CH O Rmb 19.35 24.05 24 4,643 39.3 1 8 (2) (18) (26) (1) 1 (2) (6) (5) Dec-15 19 20 25 38.1 32.0 26.7 21.4 99 97 1.4 22.3 6.7 8.4 33.6 (38)
Linyang Electronics 601222 CH U Rmb 39.33 27.00 (31) 2,929 29.0 (5) 25 6 7 27 (7) 18 7 19 47 Dec-15 7 27 17 31.2 29.1 23.0 19.7 88 85 0.6 9.5 2.4 6.4 19.4 3
Pinggao Electric 600312 CH N Rmb 16.57 13.90 (16) 2,819 37.7 4 21 1 (15) (27) 3 14 1 (3) (6) Dec-15 29 12 3 23.3 18.1 16.2 15.7 99 91 3.0 14.0 2.2 2.1 9.8 (8)
Shanghai Electric (A) 601727 CH R Rmb 8.07 13,172 34.5 (1) 7 (11) (30) (41) (3) 0 (11) (18) (20) Dec-14 (27) 13 10 42.7 58.7 52.0 47.3 85 89 0.6 4.7 2.6 0.8 10.5 (50)
SIASUN 300024 CH U Rmb 26.17 15.71 (40) 6,108 131.5 2 6 (8) (47) (63) 0 (1) (8) (34) (43) Dec-15 (10) 66 10 n.m. n.m. n.m. 98.7 48 66 0.2 4.3 7.6 21.4 130.9 (35)
Sifang Automation 601126 CH U Rmb 10.37 6.00 (42) 1,261 14.5 (3) 10 (10) (22) (34) (4) 3 (10) (10) (13) Dec-14 (6) (12) n.a. 26.3 27.9 31.8 n.a. 88 63 1.1 8.5 2.3 2.4 28.6 (15)
Singyes 750 HK O HK$ 2.93 3.39 16 315 2.4 9 7 (12) (47) (68) 4 2 (10) (43) (51) Dec-15 115 29 17 19.2 8.9 6.9 5.9 53 62 0.0 6.5 0.5 1.1 6.1 78
Sinopec Engineering 2386 HK U HK$ 7.36 5.50 (25) 4,201 2.1 6 8 7 11 9 2 3 9 15 26 Dec-15 (7) (5) (4) 8.5 9.1 9.6 10.0 102 94 4.3 12.0 1.1 0.3 3.4 (53)
Sinopec Kantons 934 HK O HK$ 4.05 5.00 23 1,298 1.3 2 7 0 (12) (24) (2) 2 2 (8) (6) Dec-15 (4) 16 17 9.8 10.2 8.8 7.6 85 90 1.2 10.0 1.0 7.2 10.0 31
SMEIC 600835 CH N Rmb 20.26 25.00 23 3,100 18.6 2 9 (12) (33) (34) 0 3 (12) (21) (14) Dec-15 14 7 5 21.8 19.2 18.0 17.1 75 74 1.6 12.7 2.3 0.3 3.7 (116)
TBEA 600089 CH N Rmb 8.80 9.50 8 4,270 31.6 2 8 (5) (25) (35) 1 1 (5) (13) (15) Dec-15 18 22 1 17.3 14.7 12.0 11.9 86 89 2.1 9.0 1.3 0.9 8.3 29
Tianwei Baobian 600550 CH U Rmb 6.29 1.50 (76) 1,444 9.0 4 13 (11) (29) (35) 2 6 (11) (16) (14) Dec-15 117 148 14 n.m. n.m. 62.3 54.5 102 101 0.0 6.3 6.1 2.9 23.7 109
Wasion Group 3393 HK N HK$ 4.54 4.35 (4) 594 4.6 5 21 (6) (44) (59) 1 16 (4) (40) (42) Dec-15 8 9 10 10.5 9.7 8.9 8.1 89 88 4.7 9.9 0.9 1.2 6.2 (3)
XJ Electric 000400 CH N Rmb 16.24 15.90 (2) 2,450 29.8 5 15 5 (16) (25) 3 8 5 (4) (5) Dec-15 21 33 3 23.6 19.5 14.6 14.1 96 94 0.6 12.6 2.3 1.9 13.9 (10)
Zhuzhou CSR 3898 HK N HK$ 42.55 44.00 3 6,448 12.1 4 2 (11) (6) (21) (0) (3) (8) (2) (4) Dec-15 12 13 10 15.1 13.5 12.0 10.9 99 101 1.4 21.5 2.7 2.5 9.6 (27)
Sector Aggregate 4 179,229 4 6 (8) (11) (24) (0) 1 (6) (7) (7) Dec-15 9 7 5 12.4 11.4 10.6 9.8 97 93 2.0 11.1 1.2 0.7 8.4 38
Chemicals Horace Tse - 852 2101 7379
Wanhua Chemical 600309 CH O Rmb 18.17 21.80 20 5,877 24.5 2 14 13 2 (13) (0) 7 13 14 7 Dec-14 (21) 71 3 16.2 20.6 12.1 11.7 119 119 2.5 16.5 3.1 3.5 12.3 181
Conglomerates Baoying Zhai/ Kenneth Fong - 852 2101 7135/ 852 2101 6395
CITIC 267 HK N HK$ 11.50 13.10 14 43,126 19.0 4 6 (6) (16) (17) (0) 1 (4) (12) 0 Dec-14 (1) 9 7 7.2 7.3 6.7 6.3 100 107 2.6 9.3 0.6 1.5 3.4 41
Fousn 656 HK O HK$ 10.04 17.50 74 11,147 13.1 1 0 (12) (17) (42) (3) (5) (10) (13) (25) Dec-14 2 23 19 8.5 8.4 6.8 5.7 92 113 1.6 12.9 1.0 1.5 5.8 70
Legend 3396 HK N HK$ 18.60 20.00 8 5,650 2.5 3 6 (8) (32) (55) (1) 1 (6) (29) (38) Dec-14 3 (3) 47 7.7 7.5 7.7 5.3 100 93 1.4 11.5 0.7 0.3 10.6 65
SIHL 363 HK O HK$ 17.70 23.80 34 2,478 3.0 3 5 (2) (13) (26) (1) 0 1 (9) (8) Dec-14 (10) 7 1 6.2 6.9 6.5 6.4 104 115 4.6 7.7 0.5 2.1 6.1 39
Sector Aggregate 22 62,400 3 5 (7) (18) (25) (1) (0) (5) (14) (8) Dec-15 14 13 12 7.8 6.9 6.1 5.8 107 104 3.3 9.6 0.6 0.9 3.9 32
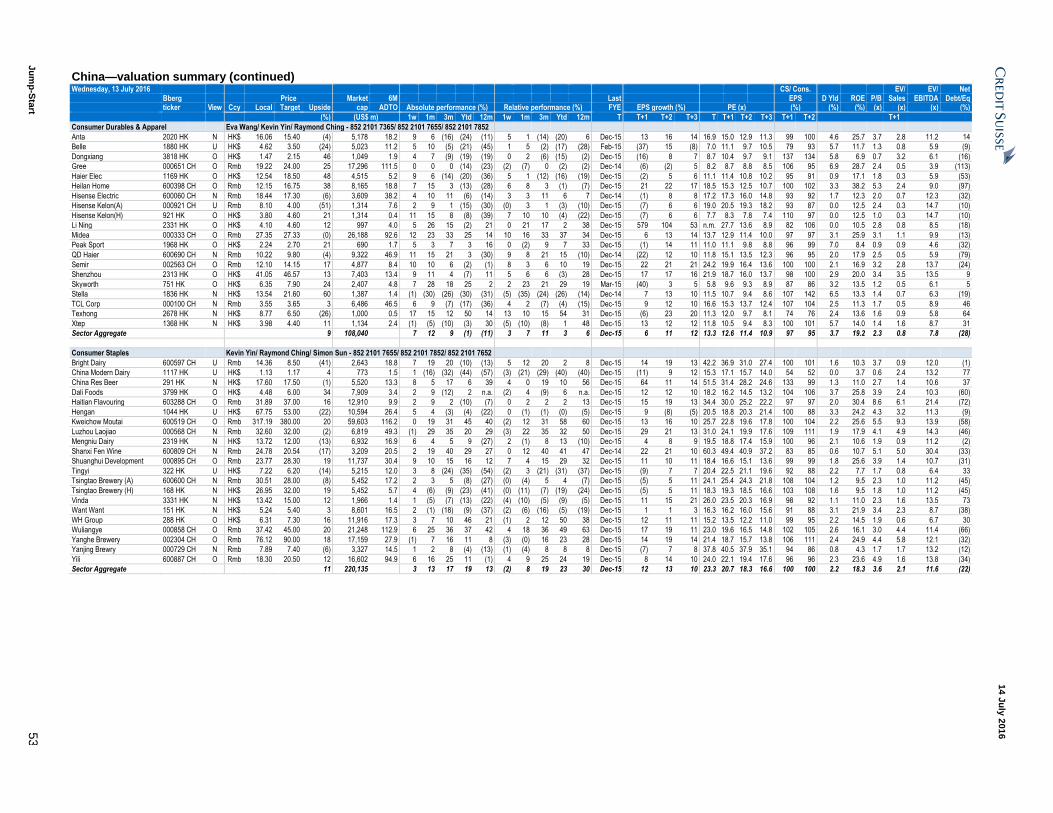
Ju
mp
-Sta
rt 5
3
14 J
uly
201
6
China—valuation summary (continued) Wednesday, 13 July 2016
CS/ Cons. EV/ EV/ Net
Bberg Price Market 6M Last EPS D Yld ROE P/B Sales EBITDA Debt/Eq ticker View Ccy Local Target Upside cap ADTO Absolute performance (%) Relative performance (%) FYE EPS growth (%) PE (x) (%) (%) (%) (x) (x) (x) (%)
(%) (US$ m) 1w 1m 3m Ytd 12m 1w 1m 3m Ytd 12m T T+1 T+2 T+3 T T+1 T+2 T+3 T+1 T+2 T+1
Consumer Durables & Apparel Eva Wang/ Kevin Yin/ Raymond Ching - 852 2101 7365/ 852 2101 7655/ 852 2101 7852
Anta 2020 HK N HK$ 16.06 15.40 (4) 5,178 18.2 9 6 (16) (24) (11) 5 1 (14) (20) 6 Dec-15 13 16 14 16.9 15.0 12.9 11.3 99 100 4.6 25.7 3.7 2.8 11.2 14
Belle 1880 HK U HK$ 4.62 3.50 (24) 5,023 11.2 5 10 (5) (21) (45) 1 5 (2) (17) (28) Feb-15 (37) 15 (8) 7.0 11.1 9.7 10.5 79 93 5.7 11.7 1.3 0.8 5.9 (9)
Dongxiang 3818 HK O HK$ 1.47 2.15 46 1,049 1.9 4 7 (9) (19) (19) 0 2 (6) (15) (2) Dec-15 (16) 8 7 8.7 10.4 9.7 9.1 137 134 5.8 6.9 0.7 3.2 6.1 (16)
Gree 000651 CH O Rmb 19.22 24.00 25 17,296 111.5 0 0 0 (14) (23) (2) (7) 0 (2) (2) Dec-14 (6) (2) 5 8.2 8.7 8.8 8.5 106 95 6.9 28.7 2.4 0.5 3.9 (113)
Haier Elec 1169 HK O HK$ 12.54 18.50 48 4,515 5.2 9 6 (14) (20) (36) 5 1 (12) (16) (19) Dec-15 (2) 5 6 11.1 11.4 10.8 10.2 95 91 0.9 17.1 1.8 0.3 5.9 (53)
Heilan Home 600398 CH O Rmb 12.15 16.75 38 8,165 18.8 7 15 3 (13) (28) 6 8 3 (1) (7) Dec-15 21 22 17 18.5 15.3 12.5 10.7 100 102 3.3 38.2 5.3 2.4 9.0 (97)
Hisense Electric 600060 CH N Rmb 18.44 17.30 (6) 3,609 38.2 4 10 11 (6) (14) 3 3 11 6 7 Dec-14 (1) 8 8 17.2 17.3 16.0 14.8 93 92 1.7 12.3 2.0 0.7 12.3 (32)
Hisense Kelon(A) 000921 CH U Rmb 8.10 4.00 (51) 1,314 7.6 2 9 1 (15) (30) (0) 3 1 (3) (10) Dec-15 (7) 6 6 19.0 20.5 19.3 18.2 93 87 0.0 12.5 2.4 0.3 14.7 (10)
Hisense Kelon(H) 921 HK O HK$ 3.80 4.60 21 1,314 0.4 11 15 8 (8) (39) 7 10 10 (4) (22) Dec-15 (7) 6 6 7.7 8.3 7.8 7.4 110 97 0.0 12.5 1.0 0.3 14.7 (10)
Li Ning 2331 HK O HK$ 4.10 4.60 12 997 4.0 5 26 15 (2) 21 0 21 17 2 38 Dec-15 579 104 53 n.m. 27.7 13.6 8.9 82 106 0.0 10.5 2.8 0.8 8.5 (18)
Midea 000333 CH O Rmb 27.35 27.33 (0) 26,188 92.6 12 23 33 25 14 10 16 33 37 34 Dec-15 6 13 14 13.7 12.9 11.4 10.0 97 97 3.1 25.9 3.1 1.1 9.9 (13)
Peak Sport 1968 HK O HK$ 2.24 2.70 21 690 1.7 5 3 7 3 16 0 (2) 9 7 33 Dec-15 (1) 14 11 11.0 11.1 9.8 8.8 96 99 7.0 8.4 0.9 0.9 4.6 (32)
QD Haier 600690 CH N Rmb 10.22 9.80 (4) 9,322 46.9 11 15 21 3 (30) 9 8 21 15 (10) Dec-14 (22) 12 10 11.8 15.1 13.5 12.3 96 95 2.0 17.9 2.5 0.5 5.9 (79)
Semir 002563 CH O Rmb 12.10 14.15 17 4,877 8.4 10 10 6 (2) (1) 8 3 6 10 19 Dec-15 22 21 21 24.2 19.9 16.4 13.6 100 100 2.1 16.9 3.2 2.8 13.7 (24)
Shenzhou 2313 HK O HK$ 41.05 46.57 13 7,403 13.4 9 11 4 (7) 11 5 6 6 (3) 28 Dec-15 17 17 16 21.9 18.7 16.0 13.7 98 100 2.9 20.0 3.4 3.5 13.5 9
Skyworth 751 HK O HK$ 6.35 7.90 24 2,407 4.8 7 28 18 25 2 2 23 21 29 19 Mar-15 (40) 3 5 5.8 9.6 9.3 8.9 87 86 3.2 13.5 1.2 0.5 6.1 5
Stella 1836 HK N HK$ 13.54 21.60 60 1,387 1.4 (1) (30) (26) (30) (31) (5) (35) (24) (26) (14) Dec-14 7 13 10 11.5 10.7 9.4 8.6 107 142 6.5 13.3 1.4 0.7 6.3 (19)
TCL Corp 000100 CH N Rmb 3.55 3.65 3 6,486 46.5 6 9 (7) (17) (36) 4 2 (7) (4) (15) Dec-15 9 12 10 16.6 15.3 13.7 12.4 107 104 2.5 11.3 1.7 0.5 8.9 46
Texhong 2678 HK N HK$ 8.77 6.50 (26) 1,000 0.5 17 15 12 50 14 13 10 15 54 31 Dec-15 (6) 23 20 11.3 12.0 9.7 8.1 74 76 2.4 13.6 1.6 0.9 5.8 64
Xtep 1368 HK N HK$ 3.98 4.40 11 1,134 2.4 (1) (5) (10) (3) 30 (5) (10) (8) 1 48 Dec-15 13 12 12 11.8 10.5 9.4 8.3 100 101 5.7 14.0 1.4 1.6 8.7 31
Sector Aggregate 9 108,040 7 12 9 (1) (11) 3 7 11 3 6 Dec-15 6 11 12 13.3 12.6 11.4 10.9 97 95 3.7 19.2 2.3 0.8 7.8 (28)
Consumer Staples Kevin Yin/ Raymond Ching/ Simon Sun - 852 2101 7655/ 852 2101 7852/ 852 2101 7652
Bright Dairy 600597 CH U Rmb 14.36 8.50 (41) 2,643 18.8 7 19 20 (10) (13) 5 12 20 2 8 Dec-15 14 19 13 42.2 36.9 31.0 27.4 100 101 1.6 10.3 3.7 0.9 12.0 (1)
China Modern Dairy 1117 HK U HK$ 1.13 1.17 4 773 1.5 1 (16) (32) (44) (57) (3) (21) (29) (40) (40) Dec-15 (11) 9 12 15.3 17.1 15.7 14.0 54 52 0.0 3.7 0.6 2.4 13.2 77
China Res Beer 291 HK N HK$ 17.60 17.50 (1) 5,520 13.3 8 5 17 6 39 4 0 19 10 56 Dec-15 64 11 14 51.5 31.4 28.2 24.6 133 99 1.3 11.0 2.7 1.4 10.6 37
Dali Foods 3799 HK O HK$ 4.48 6.00 34 7,909 3.4 2 9 (12) 2 n.a. (2) 4 (9) 6 n.a. Dec-15 12 12 10 18.2 16.2 14.5 13.2 104 106 3.7 25.8 3.9 2.4 10.3 (60)
Haitian Flavouring 603288 CH O Rmb 31.89 37.00 16 12,910 9.9 2 9 2 (10) (7) 0 2 2 2 13 Dec-15 15 19 13 34.4 30.0 25.2 22.2 97 97 2.0 30.4 8.6 6.1 21.4 (72)
Hengan 1044 HK U HK$ 67.75 53.00 (22) 10,594 26.4 5 4 (3) (4) (22) 0 (1) (1) (0) (5) Dec-15 9 (8) (5) 20.5 18.8 20.3 21.4 100 88 3.3 24.2 4.3 3.2 11.3 (9)
Kweichow Moutai 600519 CH O Rmb 317.19 380.00 20 59,603 116.2 0 19 31 45 40 (2) 12 31 58 60 Dec-15 13 16 10 25.7 22.8 19.6 17.8 100 104 2.2 25.6 5.5 9.3 13.9 (58)
Luzhou Laojiao 000568 CH N Rmb 32.60 32.00 (2) 6,819 49.3 (1) 29 35 20 29 (3) 22 35 32 50 Dec-15 29 21 13 31.0 24.1 19.9 17.6 109 111 1.9 17.9 4.1 4.9 14.3 (46)
Mengniu Dairy 2319 HK N HK$ 13.72 12.00 (13) 6,932 16.9 6 4 5 9 (27) 2 (1) 8 13 (10) Dec-15 4 8 9 19.5 18.8 17.4 15.9 100 96 2.1 10.6 1.9 0.9 11.2 (2)
Shanxi Fen Wine 600809 CH N Rmb 24.78 20.54 (17) 3,209 20.5 2 19 40 29 27 0 12 40 41 47 Dec-14 22 21 10 60.3 49.4 40.9 37.2 83 85 0.6 10.7 5.1 5.0 30.4 (33)
Shuanghui Development 000895 CH O Rmb 23.77 28.30 19 11,737 30.4 9 10 15 16 12 7 4 15 29 32 Dec-15 11 10 11 18.4 16.6 15.1 13.6 99 99 1.8 25.6 3.9 1.4 10.7 (31)
Tingyi 322 HK U HK$ 7.22 6.20 (14) 5,215 12.0 3 8 (24) (35) (54) (2) 3 (21) (31) (37) Dec-15 (9) 7 7 20.4 22.5 21.1 19.6 92 88 2.2 7.7 1.7 0.8 6.4 33
Tsingtao Brewery (A) 600600 CH N Rmb 30.51 28.00 (8) 5,452 17.2 2 3 5 (8) (27) (0) (4) 5 4 (7) Dec-15 (5) 5 11 24.1 25.4 24.3 21.8 108 104 1.2 9.5 2.3 1.0 11.2 (45)
Tsingtao Brewery (H) 168 HK N HK$ 26.95 32.00 19 5,452 5.7 4 (6) (9) (23) (41) (0) (11) (7) (19) (24) Dec-15 (5) 5 11 18.3 19.3 18.5 16.6 103 108 1.6 9.5 1.8 1.0 11.2 (45)
Vinda 3331 HK N HK$ 13.42 15.00 12 1,966 1.4 1 (5) (7) (13) (22) (4) (10) (5) (9) (5) Dec-15 11 15 21 26.0 23.5 20.3 16.9 98 92 1.1 11.0 2.3 1.6 13.5 73
Want Want 151 HK N HK$ 5.24 5.40 3 8,601 16.5 2 (1) (18) (9) (37) (2) (6) (16) (5) (19) Dec-15 1 1 3 16.3 16.2 16.0 15.6 91 88 3.1 21.9 3.4 2.3 8.7 (38)
WH Group 288 HK O HK$ 6.31 7.30 16 11,916 17.3 3 7 10 46 21 (1) 2 12 50 38 Dec-15 12 11 11 15.2 13.5 12.2 11.0 99 95 2.2 14.5 1.9 0.6 6.7 30
Wuliangye 000858 CH O Rmb 37.42 45.00 20 21,248 112.9 6 25 36 37 42 4 18 36 49 63 Dec-15 17 19 11 23.0 19.6 16.5 14.8 102 105 2.6 16.1 3.0 4.4 11.4 (66)
Yanghe Brewery 002304 CH O Rmb 76.12 90.00 18 17,159 27.9 (1) 7 16 11 8 (3) (0) 16 23 28 Dec-15 14 19 14 21.4 18.7 15.7 13.8 106 111 2.4 24.9 4.4 5.8 12.1 (32)
Yanjing Brewry 000729 CH N Rmb 7.89 7.40 (6) 3,327 14.5 1 2 8 (4) (13) (1) (4) 8 8 8 Dec-15 (7) 7 8 37.8 40.5 37.9 35.1 94 86 0.8 4.3 1.7 1.7 13.2 (12)
Yili 600887 CH O Rmb 18.30 20.50 12 16,602 94.9 6 16 25 11 (1) 4 9 25 24 19 Dec-15 8 14 10 24.0 22.1 19.4 17.6 96 96 2.3 23.6 4.9 1.6 13.8 (34)
Sector Aggregate 11 220,135 3 13 17 19 13 (2) 8 19 23 30 Dec-15 12 13 10 23.3 20.7 18.3 16.6 100 100 2.2 18.3 3.6 2.1 11.6 (22)

Ju
mp
-Sta
rt 5
4
14 J
uly
201
6
China—valuation summary (continued) Wednesday, 13 July 2016
CS/ Cons. EV/ EV/ Net
Bberg Price Market 6M Last EPS D Yld ROE P/B Sales EBITDA Debt/Eq ticker View Ccy Local Target Upside cap ADTO Absolute performance (%) Relative performance (%) FYE EPS growth (%) PE (x) (%) (%) (%) (x) (x) (x) (%)
(%) (US$ m) 1w 1m 3m Ytd 12m 1w 1m 3m Ytd 12m T T+1 T+2 T+3 T T+1 T+2 T+3 T+1 T+2 T+1
Diversified Financials Charles Zhou/ Sanjay Jain - 852 2101 6177/ 65 6306 0668
China Merchants Securities 600999 CH N Rmb 17.64 15.40 (13) 15,326 72.1 1 14 (4) (19) (28) (1) 7 (4) (6) (8) Dec-15 (35) 10 13 9.4 14.5 13.2 11.7 100 100 2.8 13.9 1.9 n.a. n.a. n.a.
Cinda 1359 HK O HK$ 2.52 3.82 52 11,778 12.2 4 (1) (7) (12) (32) (0) (6) (4) (8) (15) Dec-15 13 11 n.a. 5.6 5.0 4.5 n.a. 100 96 6.0 14.7 0.7 n.a. n.a. n.a.
Citic Securities (A) 600030 CH N Rmb 16.94 18.80 11 30,012 321.5 2 9 (6) (12) (34) 1 2 (6) (0) (14) Dec-15 (21) 14 29 9.9 12.5 11.0 8.5 101 105 2.8 11.1 1.3 n.a. n.a. n.a.
Citic Securities (H) 6030 HK O HK$ 17.30 21.50 24 30,012 24.8 4 3 (8) (5) (26) 0 (2) (6) (1) (9) Dec-15 (21) 14 29 8.7 11.0 9.7 7.5 101 104 3.2 11.1 1.2 n.a. n.a. n.a.
Everbright Securities 601788 CH U Rmb 18.16 13.40 (26) 10,613 116.6 3 16 (8) (21) (22) 1 9 (8) (9) (1) Dec-15 (47) 9 17 8.7 16.4 15.0 12.8 113 113 1.4 10.4 1.9 n.a. n.a. n.a.
Galaxy Securities 6881 HK O HK$ 7.17 8.70 21 8,815 21.2 5 14 (11) 1 (14) 1 9 (9) 5 3 Dec-15 (37) 17 7 5.6 8.8 7.5 7.0 107 112 4.5 11.6 1.0 n.a. n.a. n.a.
GF Securities (A) 000776 CH N Rmb 17.40 17.50 1 19,347 132.2 2 13 0 (11) (17) 0 6 0 2 3 Dec-15 (30) 10 20 9.4 13.5 12.3 10.2 105 102 1.2 14.1 2.1 n.a. n.a. n.a.
GF Securities (H) 1776 HK O HK$ 17.96 20.00 11 19,347 10.1 5 2 (7) (8) 6 1 (3) (4) (4) 23 Dec-15 (30) 10 20 8.4 12.0 10.9 9.0 106 101 1.3 14.1 1.9 n.a. n.a. n.a.
Haitong Securities (A) 600837 CH N Rmb 16.37 14.30 (13) 25,512 130.0 4 10 9 3 (20) 2 3 10 16 1 Dec-15 (23) 13 5 11.1 14.3 12.7 12.1 111 107 2.0 11.7 1.6 n.a. n.a. n.a.
Haitong Securities (H) 6837 HK O HK$ 12.96 16.50 27 25,512 27.6 0 4 (3) (5) (15) (4) (1) (1) (1) 3 Dec-15 (23) 13 5 7.5 9.8 8.7 8.3 111 107 2.9 11.7 1.1 n.a. n.a. n.a.
HH 3903 HK U HK$ 0.90 0.89 (1) 534 0.1 (1) (4) (13) (17) (32) (5) (9) (10) (13) (15) Dec-15 (12) (6) 6 11.8 13.3 14.2 13.4 100 101 2.3 3.9 0.5 n.a. n.a. n.a.
HT Securities (A) 601688 CH N Rmb 21.22 16.79 (21) 21,078 117.6 5 23 18 8 (5) 3 16 18 20 15 Dec-15 (22) 4 16 12.9 16.6 16.0 13.7 116 103 2.4 11.0 1.8 n.a. n.a. n.a.
HT Securities (H) 6886 HK O HK$ 17.14 20.00 17 21,078 13.7 6 10 (8) (5) (5) 2 5 (5) (1) 13 Dec-15 (22) 4 16 9.0 11.5 11.1 9.5 109 96 3.5 11.0 1.2 n.a. n.a. n.a.
Huarong 2799 HK O HK$ 3.06 3.59 17 15,412 2.1 0 2 7 (0) n.a. (4) (3) 9 4 n.a. Dec-14 5 13 17 6.9 6.6 5.8 5.0 93 99 2.2 17.1 1.0 n.a. n.a. n.a.
Sinolink 600109 CH U Rmb 13.91 5.60 (60) 6,293 109.1 1 14 (3) (14) (27) (1) 7 (3) (1) (7) Dec-15 (35) 16 (14) 17.4 26.9 23.2 26.9 94 94 0.3 9.2 2.4 n.a. n.a. n.a.
Sector Aggregate 10 164,719 3 7 (5) (8) (17) (1) 2 (3) (4) 1 Dec-15 (19) 12 16 7.9 9.8 8.8 9.1 104 102 2.8 12.7 1.2 n.a. n.a. n.a.
Energy David Hewitt/ Horace Tse - 65 6212 3064/ 852 2101 7379
AAG 2686 HK O HK$ 1.32 2.25 70 566 0.0 21 11 (5) (6) (30) 17 6 (3) (2) (13) Dec-15 558 90 69 n.m. 13.1 6.9 4.1 133 118 0.0 6.1 0.8 3.0 3.3 (37)
Anton Oil 3337 HK U HK$ 0.82 0.40 (51) 234 0.4 2 17 0 9 (39) (2) 12 2 13 (22) Dec-15 (96) 13 13 n.m. n.m. n.m. n.m. 17 n.m. 0.0 (22.4) 1.0 2.0 37.9 103
CNOOC 883 HK O HK$ 9.82 11.20 14 56,520 85.6 4 5 2 22 (2) (1) (0) 4 26 15 Dec-15 (157) 285 97 18.7 n.m. 17.7 9.0 n.m. 99 2.4 (3.2) 1.1 3.8 7.9 39
COOEC 600583 CH O Rmb 7.40 8.50 15 4,894 31.2 4 9 (1) (17) (37) 2 2 (1) (5) (16) Dec-15 (35) 8 6 8.5 13.1 12.2 11.5 114 115 1.5 10.4 1.3 2.2 6.8 (23)
COSL (A) 601808 CH U Rmb 12.75 7.00 (45) 7,131 12.6 3 4 (5) (18) (35) 1 (2) (5) (6) (14) Dec-15 (76) 484 n.a. 56.1 n.m. 39.7 n.a. 2,753 124 0.1 0.6 1.3 2.9 12.1 49
COSL (H) 2883 HK O HK$ 6.36 8.00 26 7,131 13.2 9 (0) (2) (5) (39) 4 (5) 0 (1) (22) Dec-15 (76) 484 n.a. 24.1 99.5 17.0 n.a. n.m. 197 0.2 0.6 0.6 2.9 12.1 49
GDG GDG LN O p 225.00 790.00 251 466 0.0 2 (7) (13) 0 (28) (2) (12) (11) 4 (11) Dec-15 143 1,108 n.a. n.m. n.m. 22.8 n.a. 60 131 0.0 0.2 0.6 11.9 27.6 8
Hilong 1623 HK N HK$ 0.92 1.00 9 201 0.3 5 18 (3) (32) (55) 0 13 (1) (28) (38) Dec-15 (50) 80 16 8.4 16.8 9.3 8.0 49 69 1.0 2.6 0.4 1.3 4.8 37
Kunlun Energy 135 HK N HK$ 6.20 5.70 (8) 6,452 9.1 (1) (2) (10) (10) (13) (5) (7) (8) (6) 4 Dec-15 2,584 26 46 n.m. 13.6 10.8 7.4 94 94 1.6 7.3 1.0 2.8 6.5 57
PetroChina (A) 601857 CH U Rmb 7.41 3.50 (53) 194,195 40.8 2 3 (5) (11) (40) 0 (4) (5) 1 (19) Dec-15 (130) 287 220 38.2 n.m. 68.2 21.3 n.m. 40 0.8 (1.0) 1.3 1.3 10.2 42
PetroChina (H) 857 HK U HK$ 5.41 4.00 (26) 194,195 60.3 5 0 1 6 (33) 1 (5) 4 10 (15) Dec-15 (130) 287 220 24.0 n.m. 42.9 13.4 n.m. 39 1.3 (1.0) 0.8 1.3 10.2 42
Sinopec (A) 600028 CH N Rmb 4.89 4.40 (10) 88,909 78.1 2 4 (3) (1) (30) 0 (3) (3) 11 (10) Dec-15 (48) 209 15 18.2 34.9 11.3 9.8 54 110 1.1 2.5 0.9 0.4 6.6 25
Sinopec (H) 386 HK N HK$ 5.78 5.00 (13) 88,909 62.3 7 7 7 24 (5) 3 2 9 27 12 Dec-15 (48) 209 15 18.6 35.6 11.5 10.0 50 106 1.1 2.5 0.9 0.4 6.6 25
Sinopec Shanghai Petrochem (A)
600688 CH U Rmb 6.40 4.00 (38) 8,710 49.1 3 10 (14) (1) (14) 1 3 (14) 11 6 Dec-14 573 17 2 n.m. 21.1 18.0 17.7 100 92 1.6 18.0 3.5 0.9 9.9 5
Sinopec Shanghai Petrochem (H)
338 HK O HK$ 3.81 4.70 23 8,710 9.4 8 3 2 23 13 4 (2) 4 27 30 Dec-14 573 17 2 n.m. 10.8 9.2 9.1 100 95 3.0 18.0 1.8 0.9 9.9 5
Sinopec SSC (A) 600871 CH U Rmb 4.35 0.90 (79) 8,267 56.3 12 14 (15) (47) (52) 11 7 (15) (34) (32) Dec-15 (24,436) 23 93 n.m. n.m. n.m. n.m. 34 6 0.0 (12.4) 2.8 2.2 29.1 79
Sinopec SSC (H) 1033 HK U HK$ 1.59 1.10 (31) 8,267 1.5 8 11 (10) (22) (44) 4 6 (8) (18) (27) Dec-15 (24,436) 23 93 n.m. n.m. n.m. n.m. 19 n.m. 0.0 (12.4) 0.9 2.2 29.1 79
SPT Energy 1251 HK U HK$ 0.52 0.20 (62) 103 0.1 0 (2) (16) (27) (53) (4) (7) (14) (23) (36) Dec-15 (6) 9 42 n.m. n.m. n.m. n.m. 33 17 0.0 (48.0) 1.0 1.4 n.m. 65
Yantai Jereh Oilfield 002353 CH O Rmb 19.95 21.00 5 2,858 58.3 3 1 13 (21) (55) 2 (5) 13 (9) (35) Dec-15 (30) 16 n.a. n.m. n.m. n.m. n.a. 48 36 0.1 1.6 2.4 8.5 68.6 (43)
Sector Aggregate (14) 379,507 6 3 2 11 (21) 1 (2) 4 15 (4) Dec-15 (106) 1,687 100 21.7 n.m. 22.4 11.6 n.m. 69 1.5 0.1 0.9 0.9 8.8 36
Environmental Services Joy Zhang/ Trina Chen - 852 2101 7083/ 852 2101 7031
BE Water 371 HK N HK$ 4.51 4.70 4 5,061 13.2 2 5 (9) (17) (25) (2) (0) (7) (13) (8) Dec-15 26 15 (5) 16.0 12.7 11.0 11.6 104 100 2.6 18.0 2.2 4.1 13.9 119
Beijing Capital 600008 CH U Rmb 4.10 3.30 (20) 2,957 23.6 1 8 (6) (20) (28) (1) 2 (6) (7) (8) Dec-15 28 17 20 36.6 28.6 24.5 20.5 90 92 2.4 7.9 2.2 4.1 14.5 112
Canvest 1381 HK O HK$ 3.44 5.50 60 902 1.3 (1) (1) (8) 2 (12) (6) (6) (6) 6 6 Dec-15 58 51 5 25.3 16.0 10.6 10.1 109 122 0.0 16.9 2.5 5.5 11.7 66
CEI 257 HK O HK$ 8.31 13.50 62 4,802 10.0 (0) 1 (8) (17) (36) (5) (3) (5) (13) (18) Dec-15 29 65 21 17.9 13.8 8.4 7.0 102 134 2.9 14.9 2.0 4.4 10.2 62
Conch Venture 586 HK O HK$ 15.30 18.50 21 3,560 4.3 3 1 (5) (5) (15) (2) (4) (3) (1) 2 Dec-15 5 45 6 12.2 11.7 8.0 7.6 105 127 2.4 12.0 1.3 7.9 22.7 (6)
CT Environment 1363 HK O HK$ 2.35 2.89 23 1,914 2.9 4 13 (1) (7) (8) (0) 8 1 (3) 9 Dec-15 36 15 11 23.9 17.6 15.2 13.7 107 101 1.1 22.2 3.6 8.1 12.4 83
Dongjiang (A) 002672 CH U Rmb 17.41 15.65 (10) 2,090 16.1 0 0 0 (14) (7) (2) (7) 0 (1) 13 Dec-15 35 38 18 44.5 33.0 23.9 20.3 100 102 0.6 15.6 4.8 5.1 19.6 73
Dongjiang (H) 895 HK O HK$ 13.46 18.00 34 2,090 1.0 4 13 20 2 (9) (1) 8 22 6 8 Dec-15 35 38 18 29.7 22.0 15.9 13.5 100 102 1.0 15.6 3.2 5.1 19.6 73
Dynagreen 1330 HK O HK$ 3.40 5.50 62 458 0.5 0 3 (9) (33) (36) (4) (2) (7) (29) (19) Dec-15 43 44 (0) 13.5 9.5 6.6 6.6 107 113 0.0 12.6 1.1 2.5 8.4 72
Guodian Tech 1296 HK N HK$ 0.43 0.49 14 332 0.1 1 (6) (17) (38) (51) (3) (11) (14) (34) (34) Dec-15 96 23 11 n.m. n.m. n.m. n.m. n.m. n.m. 0.0 (4.6) 0.5 0.8 5.7 118
SIIC Env SIIC SP O S$ 0.63 0.90 43 1,055 1.3 (1) 2 (7) (18) (31) (5) (3) (4) (14) (14) Dec-15 35 29 26 18.3 13.6 10.5 8.4 108 108 0.0 9.0 1.2 4.5 12.7 59
Sound Global 967 HK O HK$ 2.98 7.60 155 579 4.6 0 0 0 (57) (57) (4) (5) 2 (53) (40) Dec-15 76 20 14 8.5 4.8 4.0 3.5 109 112 0.0 15.6 0.7 1.4 4.6 39
Tianjin Capital (A) 600874 CH U Rmb 8.05 3.39 (58) 2,778 12.9 2 9 (9) (24) (26) (0) 2 (9) (11) (6) Dec-15 8 8 2 34.8 32.0 29.8 29.3 98 99 0.9 7.9 2.5 11.2 20.4 21
Tianjin Capital (H) 1065 HK N HK$ 3.64 3.90 7 1,979 0.8 2 3 (23) (40) (29) (2) (2) (21) (36) (11) Dec-15 8 8 2 13.5 12.5 11.6 11.4 98 99 2.4 7.9 1.0 8.1 14.8 21
Tus-Sound 000826 CH N Rmb 32.00 41.00 28 4,089 24.3 5 10 (1) (19) 4 4 3 (1) (7) 25 Dec-14 27 22 19 33.5 26.4 21.7 18.2 111 105 0.4 18.1 4.4 4.8 18.0 63
Yonker Environment 300187 CH U Rmb 14.00 3.67 (74) 1,356 24.1 0 4 (19) (22) 20 (2) (2) (19) (10) 41 Dec-14 46 19 (9) n.m. n.m. 88.7 97.0 73 71 0.1 7.4 6.6 9.5 72.3 16
Sector Aggregate 21 31,133 2 5 (6) (16) (19) (2) 0 (3) (12) (1) Dec-15 128 34 12 36.1 15.8 11.8 10.6 101 107 1.7 13.0 1.9 3.6 12.6 69
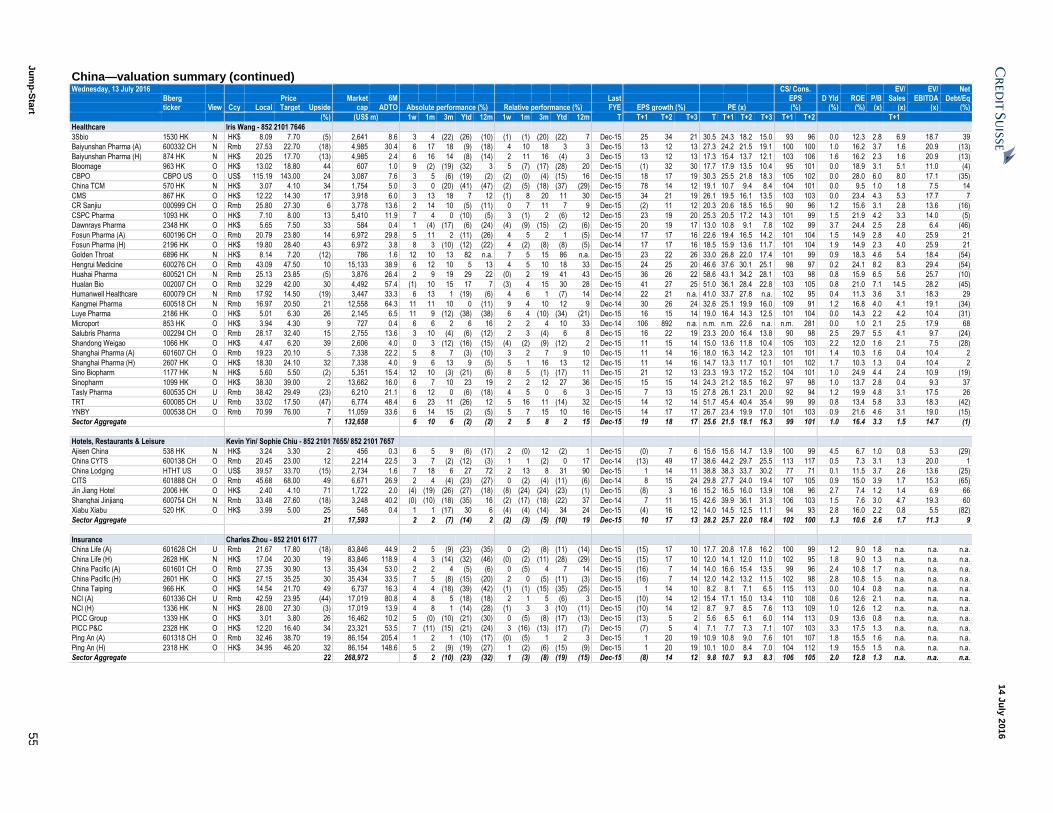
Ju
mp
-Sta
rt 5
5
14 J
uly
201
6
China—valuation summary (continued) Wednesday, 13 July 2016
CS/ Cons. EV/ EV/ Net
Bberg Price Market 6M Last EPS D Yld ROE P/B Sales EBITDA Debt/Eq ticker View Ccy Local Target Upside cap ADTO Absolute performance (%) Relative performance (%) FYE EPS growth (%) PE (x) (%) (%) (%) (x) (x) (x) (%)
(%) (US$ m) 1w 1m 3m Ytd 12m 1w 1m 3m Ytd 12m T T+1 T+2 T+3 T T+1 T+2 T+3 T+1 T+2 T+1
Healthcare Iris Wang - 852 2101 7646
3Sbio 1530 HK N HK$ 8.09 7.70 (5) 2,641 8.6 3 4 (22) (26) (10) (1) (1) (20) (22) 7 Dec-15 25 34 21 30.5 24.3 18.2 15.0 93 96 0.0 12.3 2.8 6.9 18.7 39
Baiyunshan Pharma (A) 600332 CH N Rmb 27.53 22.70 (18) 4,985 30.4 6 17 18 (9) (18) 4 10 18 3 3 Dec-15 13 12 13 27.3 24.2 21.5 19.1 100 100 1.0 16.2 3.7 1.6 20.9 (13)
Baiyunshan Pharma (H) 874 HK N HK$ 20.25 17.70 (13) 4,985 2.4 6 16 14 (8) (14) 2 11 16 (4) 3 Dec-15 13 12 13 17.3 15.4 13.7 12.1 103 106 1.6 16.2 2.3 1.6 20.9 (13)
Bloomage 963 HK O HK$ 13.02 18.80 44 607 1.0 9 (2) (19) (32) 3 5 (7) (17) (28) 20 Dec-15 (1) 32 30 17.7 17.9 13.5 10.4 95 101 0.0 18.9 3.1 5.1 11.0 (4)
CBPO CBPO US O US$ 115.19 143.00 24 3,087 7.6 3 5 (6) (19) (2) (2) (0) (4) (15) 16 Dec-15 18 17 19 30.3 25.5 21.8 18.3 105 102 0.0 28.0 6.0 8.0 17.1 (35)
China TCM 570 HK N HK$ 3.07 4.10 34 1,754 5.0 3 0 (20) (41) (47) (2) (5) (18) (37) (29) Dec-15 78 14 12 19.1 10.7 9.4 8.4 104 101 0.0 9.5 1.0 1.8 7.5 14
CMS 867 HK O HK$ 12.22 14.30 17 3,918 6.0 3 13 18 7 12 (1) 8 20 11 30 Dec-15 34 21 19 26.1 19.5 16.1 13.5 103 103 0.0 23.4 4.3 5.3 17.7 7
CR Sanjiu 000999 CH O Rmb 25.80 27.30 6 3,778 13.6 2 14 10 (5) (11) 0 7 11 7 9 Dec-15 (2) 11 12 20.3 20.6 18.5 16.5 90 96 1.2 15.6 3.1 2.8 13.6 (16)
CSPC Pharma 1093 HK O HK$ 7.10 8.00 13 5,410 11.9 7 4 0 (10) (5) 3 (1) 2 (6) 12 Dec-15 23 19 20 25.3 20.5 17.2 14.3 101 99 1.5 21.9 4.2 3.3 14.0 (5)
Dawnrays Pharma 2348 HK O HK$ 5.65 7.50 33 584 0.4 1 (4) (17) (6) (24) (4) (9) (15) (2) (6) Dec-15 20 19 17 13.0 10.8 9.1 7.8 102 99 3.7 24.4 2.5 2.8 6.4 (46)
Fosun Pharma (A) 600196 CH O Rmb 20.79 23.80 14 6,972 29.8 5 11 2 (11) (26) 4 5 2 1 (5) Dec-14 17 17 16 22.6 19.4 16.5 14.2 101 104 1.5 14.9 2.8 4.0 25.9 21
Fosun Pharma (H) 2196 HK O HK$ 19.80 28.40 43 6,972 3.8 8 3 (10) (12) (22) 4 (2) (8) (8) (5) Dec-14 17 17 16 18.5 15.9 13.6 11.7 101 104 1.9 14.9 2.3 4.0 25.9 21
Golden Throat 6896 HK N HK$ 8.14 7.20 (12) 786 1.6 12 10 13 82 n.a. 7 5 15 86 n.a. Dec-15 23 22 26 33.0 26.8 22.0 17.4 101 99 0.9 18.3 4.6 5.4 18.4 (54)
Hengrui Medicine 600276 CH O Rmb 43.09 47.50 10 15,133 38.9 6 12 10 5 13 4 5 10 18 33 Dec-15 24 25 20 46.6 37.6 30.1 25.1 98 97 0.2 24.1 8.2 8.3 29.4 (54)
Huahai Pharma 600521 CH N Rmb 25.13 23.85 (5) 3,876 26.4 2 9 19 29 22 (0) 2 19 41 43 Dec-15 36 26 22 58.6 43.1 34.2 28.1 103 98 0.8 15.9 6.5 5.6 25.7 (10)
Hualan Bio 002007 CH O Rmb 32.29 42.00 30 4,492 57.4 (1) 10 15 17 7 (3) 4 15 30 28 Dec-15 41 27 25 51.0 36.1 28.4 22.8 103 105 0.8 21.0 7.1 14.5 28.2 (45)
Humanwell Healthcare 600079 CH N Rmb 17.92 14.50 (19) 3,447 33.3 6 13 1 (19) (6) 4 6 1 (7) 14 Dec-14 22 21 n.a. 41.0 33.7 27.8 n.a. 102 95 0.4 11.3 3.6 3.1 18.3 29
Kangmei Pharma 600518 CH N Rmb 16.97 20.50 21 12,558 64.3 11 11 10 0 (11) 9 4 10 12 9 Dec-14 30 26 24 32.6 25.1 19.9 16.0 109 91 1.2 16.8 4.0 4.1 19.1 (34)
Luye Pharma 2186 HK O HK$ 5.01 6.30 26 2,145 6.5 11 9 (12) (38) (38) 6 4 (10) (34) (21) Dec-15 16 15 14 19.0 16.4 14.3 12.5 101 104 0.0 14.3 2.2 4.2 10.4 (31)
Microport 853 HK O HK$ 3.94 4.30 9 727 0.4 6 6 2 6 16 2 2 4 10 33 Dec-14 106 892 n.a. n.m. n.m. 22.6 n.a. n.m. 281 0.0 1.0 2.1 2.5 17.9 68
Salubris Pharma 002294 CH O Rmb 28.17 32.40 15 2,755 13.6 3 10 (4) (6) (12) 2 3 (4) 6 8 Dec-15 16 22 19 23.3 20.0 16.4 13.8 90 98 2.5 29.7 5.5 4.1 9.7 (24)
Shandong Weigao 1066 HK O HK$ 4.47 6.20 39 2,606 4.0 0 3 (12) (16) (15) (4) (2) (9) (12) 2 Dec-15 11 15 14 15.0 13.6 11.8 10.4 105 103 2.2 12.0 1.6 2.1 7.5 (28)
Shanghai Pharma (A) 601607 CH O Rmb 19.23 20.10 5 7,338 22.2 5 8 7 (3) (10) 3 2 7 9 10 Dec-15 11 14 16 18.0 16.3 14.2 12.3 101 101 1.4 10.3 1.6 0.4 10.4 2
Shanghai Pharma (H) 2607 HK O HK$ 18.30 24.10 32 7,338 4.0 9 6 13 9 (5) 5 1 16 13 12 Dec-15 11 14 16 14.7 13.3 11.7 10.1 101 102 1.7 10.3 1.3 0.4 10.4 2
Sino Biopharm 1177 HK N HK$ 5.60 5.50 (2) 5,351 15.4 12 10 (3) (21) (6) 8 5 (1) (17) 11 Dec-15 21 12 13 23.3 19.3 17.2 15.2 104 101 1.0 24.9 4.4 2.4 10.9 (19)
Sinopharm 1099 HK O HK$ 38.30 39.00 2 13,662 16.0 6 7 10 23 19 2 2 12 27 36 Dec-15 15 15 14 24.3 21.2 18.5 16.2 97 98 1.0 13.7 2.8 0.4 9.3 37
Tasly Pharma 600535 CH U Rmb 38.42 29.49 (23) 6,210 21.1 6 12 0 (6) (18) 4 5 0 6 3 Dec-15 7 13 15 27.8 26.1 23.1 20.0 92 94 1.2 19.9 4.8 3.1 17.5 26
TRT 600085 CH U Rmb 33.02 17.50 (47) 6,774 48.4 6 23 11 (26) 12 5 16 11 (14) 32 Dec-15 14 12 14 51.7 45.4 40.4 35.4 99 99 0.8 13.4 5.8 3.3 18.3 (42)
YNBY 000538 CH O Rmb 70.99 76.00 7 11,059 33.6 6 14 15 (2) (5) 5 7 15 10 16 Dec-15 14 17 17 26.7 23.4 19.9 17.0 101 103 0.9 21.6 4.6 3.1 19.0 (15)
Sector Aggregate 7 132,658 6 10 6 (2) (2) 2 5 8 2 15 Dec-15 19 18 17 25.6 21.5 18.1 16.3 99 101 1.0 16.4 3.3 1.5 14.7 (1)
Hotels, Restaurants & Leisure Kevin Yin/ Sophie Chiu - 852 2101 7655/ 852 2101 7657
Ajisen China 538 HK N HK$ 3.24 3.30 2 456 0.3 6 5 9 (6) (17) 2 (0) 12 (2) 1 Dec-15 (0) 7 6 15.6 15.6 14.7 13.9 100 99 4.5 6.7 1.0 0.8 5.3 (29)
China CYTS 600138 CH O Rmb 20.45 23.00 12 2,214 22.5 3 7 (2) (12) (3) 1 1 (2) 0 17 Dec-14 (13) 49 17 38.6 44.2 29.7 25.5 113 117 0.5 7.3 3.1 1.3 20.0 1
China Lodging HTHT US O US$ 39.57 33.70 (15) 2,734 1.6 7 18 6 27 72 2 13 8 31 90 Dec-15 1 14 11 38.8 38.3 33.7 30.2 77 71 0.1 11.5 3.7 2.6 13.6 (25)
CITS 601888 CH O Rmb 45.68 68.00 49 6,671 26.9 2 4 (4) (23) (27) 0 (2) (4) (11) (6) Dec-14 8 15 24 29.8 27.7 24.0 19.4 107 105 0.9 15.0 3.9 1.7 15.3 (65)
Jin Jiang Hotel 2006 HK O HK$ 2.40 4.10 71 1,722 2.0 (4) (19) (26) (27) (18) (8) (24) (24) (23) (1) Dec-15 (8) 3 16 15.2 16.5 16.0 13.9 108 96 2.7 7.4 1.2 1.4 6.9 66
Shanghai Jinjiang 600754 CH N Rmb 33.48 27.60 (18) 3,248 40.2 (0) (10) (18) (35) 16 (2) (17) (18) (22) 37 Dec-14 7 11 15 42.6 39.9 36.1 31.3 106 103 1.5 7.6 3.0 4.7 19.3 60
Xiabu Xiabu 520 HK O HK$ 3.99 5.00 25 548 0.4 1 1 (17) 30 6 (4) (4) (14) 34 24 Dec-15 (4) 16 12 14.0 14.5 12.5 11.1 94 93 2.8 16.0 2.2 0.8 5.5 (82)
Sector Aggregate 21 17,593 2 2 (7) (14) 2 (2) (3) (5) (10) 19 Dec-15 10 17 13 28.2 25.7 22.0 18.4 102 100 1.3 10.6 2.6 1.7 11.3 9
Insurance Charles Zhou - 852 2101 6177
China Life (A) 601628 CH U Rmb 21.67 17.80 (18) 83,846 44.9 2 5 (9) (23) (35) 0 (2) (8) (11) (14) Dec-15 (15) 17 10 17.7 20.8 17.8 16.2 100 99 1.2 9.0 1.8 n.a. n.a. n.a.
China Life (H) 2628 HK N HK$ 17.04 20.30 19 83,846 118.9 4 3 (14) (32) (46) (0) (2) (11) (28) (29) Dec-15 (15) 17 10 12.0 14.1 12.0 11.0 102 95 1.8 9.0 1.3 n.a. n.a. n.a.
China Pacific (A) 601601 CH O Rmb 27.35 30.90 13 35,434 53.0 2 2 4 (5) (6) 0 (5) 4 7 14 Dec-15 (16) 7 14 14.0 16.6 15.4 13.5 99 96 2.4 10.8 1.7 n.a. n.a. n.a.
China Pacific (H) 2601 HK O HK$ 27.15 35.25 30 35,434 33.5 7 5 (8) (15) (20) 2 0 (5) (11) (3) Dec-15 (16) 7 14 12.0 14.2 13.2 11.5 102 98 2.8 10.8 1.5 n.a. n.a. n.a.
China Taiping 966 HK O HK$ 14.54 21.70 49 6,737 16.3 4 4 (18) (39) (42) (1) (1) (15) (35) (25) Dec-15 1 14 10 8.2 8.1 7.1 6.5 115 113 0.0 10.4 0.8 n.a. n.a. n.a.
NCI (A) 601336 CH U Rmb 42.59 23.95 (44) 17,019 80.8 4 8 5 (18) (18) 2 1 5 (6) 3 Dec-15 (10) 14 12 15.4 17.1 15.0 13.4 110 108 0.6 12.6 2.1 n.a. n.a. n.a.
NCI (H) 1336 HK N HK$ 28.00 27.30 (3) 17,019 13.9 4 8 1 (14) (28) (1) 3 3 (10) (11) Dec-15 (10) 14 12 8.7 9.7 8.5 7.6 113 109 1.0 12.6 1.2 n.a. n.a. n.a.
PICC Group 1339 HK O HK$ 3.01 3.80 26 16,462 10.2 5 (0) (10) (21) (30) 0 (5) (8) (17) (13) Dec-15 (13) 5 2 5.6 6.5 6.1 6.0 114 113 0.9 13.6 0.8 n.a. n.a. n.a.
PICC P&C 2328 HK O HK$ 12.20 16.40 34 23,321 53.5 7 (11) (15) (21) (24) 3 (16) (13) (17) (7) Dec-15 (7) 5 4 7.1 7.7 7.3 7.1 107 103 3.3 17.5 1.3 n.a. n.a. n.a.
Ping An (A) 601318 CH O Rmb 32.46 38.70 19 86,154 205.4 1 2 1 (10) (17) (0) (5) 1 2 3 Dec-15 1 20 19 10.9 10.8 9.0 7.6 101 107 1.8 15.5 1.6 n.a. n.a. n.a.
Ping An (H) 2318 HK O HK$ 34.95 46.20 32 86,154 148.6 5 2 (9) (19) (27) 1 (2) (6) (15) (9) Dec-15 1 20 19 10.1 10.0 8.4 7.0 104 112 1.9 15.5 1.5 n.a. n.a. n.a.
Sector Aggregate 22 268,972 5 2 (10) (23) (32) 1 (3) (8) (19) (15) Dec-15 (8) 14 12 9.8 10.7 9.3 8.3 106 105 2.0 12.8 1.3 n.a. n.a. n.a.
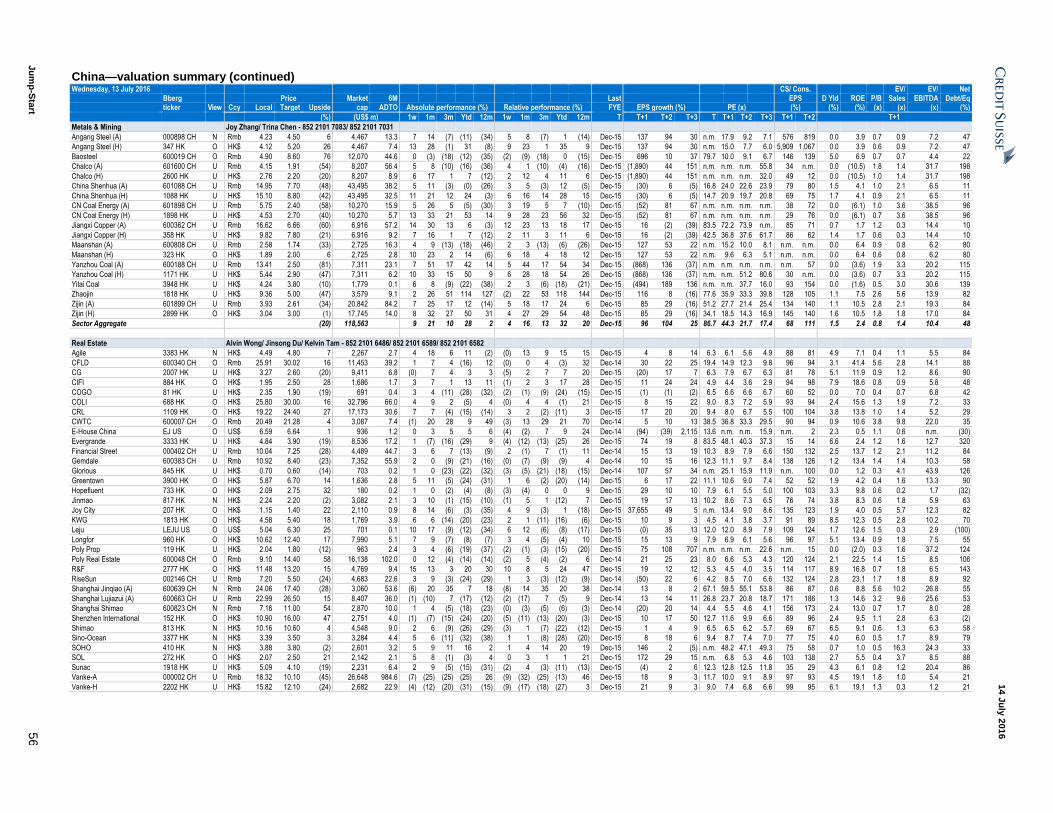
Ju
mp
-Sta
rt 5
6
14 J
uly
201
6
China—valuation summary (continued) Wednesday, 13 July 2016
CS/ Cons. EV/ EV/ Net
Bberg Price Market 6M Last EPS D Yld ROE P/B Sales EBITDA Debt/Eq ticker View Ccy Local Target Upside cap ADTO Absolute performance (%) Relative performance (%) FYE EPS growth (%) PE (x) (%) (%) (%) (x) (x) (x) (%)
(%) (US$ m) 1w 1m 3m Ytd 12m 1w 1m 3m Ytd 12m T T+1 T+2 T+3 T T+1 T+2 T+3 T+1 T+2 T+1
Metals & Mining Joy Zhang/ Trina Chen - 852 2101 7083/ 852 2101 7031
Angang Steel (A) 000898 CH N Rmb 4.23 4.50 6 4,467 13.3 7 14 (7) (11) (34) 5 8 (7) 1 (14) Dec-15 137 94 30 n.m. 17.9 9.2 7.1 576 819 0.0 3.9 0.7 0.9 7.2 47
Angang Steel (H) 347 HK O HK$ 4.12 5.20 26 4,467 7.4 13 28 (1) 31 (8) 9 23 1 35 9 Dec-15 137 94 30 n.m. 15.0 7.7 6.0 5,909 1,067 0.0 3.9 0.6 0.9 7.2 47
Baosteel 600019 CH O Rmb 4.90 8.60 76 12,070 44.6 0 (3) (18) (12) (35) (2) (9) (18) 0 (15) Dec-15 696 10 37 79.7 10.0 9.1 6.7 146 139 5.0 6.9 0.7 0.7 4.4 22
Chalco (A) 601600 CH U Rmb 4.15 1.91 (54) 8,207 56.4 5 8 (10) (16) (36) 4 1 (10) (4) (16) Dec-15 (1,890) 44 151 n.m. n.m. n.m. 55.8 34 n.m. 0.0 (10.5) 1.8 1.4 31.7 198
Chalco (H) 2600 HK U HK$ 2.76 2.20 (20) 8,207 8.9 6 17 1 7 (12) 2 12 4 11 6 Dec-15 (1,890) 44 151 n.m. n.m. n.m. 32.0 49 12 0.0 (10.5) 1.0 1.4 31.7 198
China Shenhua (A) 601088 CH U Rmb 14.95 7.70 (48) 43,495 38.2 5 11 (3) (0) (26) 3 5 (3) 12 (5) Dec-15 (30) 6 (5) 16.8 24.0 22.6 23.9 79 80 1.5 4.1 1.0 2.1 6.5 11
China Shenhua (H) 1088 HK U HK$ 15.10 8.80 (42) 43,495 32.5 11 21 12 24 (3) 6 16 14 28 15 Dec-15 (30) 6 (5) 14.7 20.9 19.7 20.8 69 75 1.7 4.1 0.9 2.1 6.5 11
CN Coal Energy (A) 601898 CH U Rmb 5.75 2.40 (58) 10,270 15.9 5 26 5 (5) (30) 3 19 5 7 (10) Dec-15 (52) 81 67 n.m. n.m. n.m. n.m. 38 72 0.0 (6.1) 1.0 3.6 38.5 96
CN Coal Energy (H) 1898 HK U HK$ 4.53 2.70 (40) 10,270 5.7 13 33 21 53 14 9 28 23 56 32 Dec-15 (52) 81 67 n.m. n.m. n.m. n.m. 29 76 0.0 (6.1) 0.7 3.6 38.5 96
Jiangxi Copper (A) 600362 CH U Rmb 16.62 6.66 (60) 6,916 57.2 14 30 13 6 (3) 12 23 13 18 17 Dec-15 16 (2) (39) 83.5 72.2 73.9 n.m. 85 71 0.7 1.7 1.2 0.3 14.4 10
Jiangxi Copper (H) 358 HK U HK$ 9.82 7.80 (21) 6,916 9.2 7 16 1 7 (12) 2 11 3 11 6 Dec-15 16 (2) (39) 42.5 36.8 37.6 61.7 86 62 1.4 1.7 0.6 0.3 14.4 10
Maanshan (A) 600808 CH U Rmb 2.58 1.74 (33) 2,725 16.3 4 9 (13) (18) (46) 2 3 (13) (6) (26) Dec-15 127 53 22 n.m. 15.2 10.0 8.1 n.m. n.m. 0.0 6.4 0.9 0.8 6.2 80
Maanshan (H) 323 HK O HK$ 1.89 2.00 6 2,725 2.8 10 23 2 14 (6) 6 18 4 18 12 Dec-15 127 53 22 n.m. 9.6 6.3 5.1 n.m. n.m. 0.0 6.4 0.6 0.8 6.2 80
Yanzhou Coal (A) 600188 CH U Rmb 13.41 2.50 (81) 7,311 23.1 7 51 17 42 14 5 44 17 54 34 Dec-15 (868) 136 (37) n.m. n.m. n.m. n.m. n.m. 57 0.0 (3.6) 1.9 3.3 20.2 115
Yanzhou Coal (H) 1171 HK U HK$ 5.44 2.90 (47) 7,311 6.2 10 33 15 50 9 6 28 18 54 26 Dec-15 (868) 136 (37) n.m. n.m. 51.2 80.6 30 n.m. 0.0 (3.6) 0.7 3.3 20.2 115
Yitai Coal 3948 HK U HK$ 4.24 3.80 (10) 1,779 0.1 6 8 (9) (22) (38) 2 3 (6) (18) (21) Dec-15 (494) 189 136 n.m. n.m. 37.7 16.0 93 154 0.0 (1.6) 0.5 3.0 30.6 139
Zhaojin 1818 HK U HK$ 9.36 5.00 (47) 3,579 9.1 2 26 51 114 127 (2) 22 53 118 144 Dec-15 116 8 (16) 77.6 35.9 33.3 39.8 128 105 1.1 7.5 2.6 5.6 13.9 82
Zijin (A) 601899 CH U Rmb 3.93 2.61 (34) 20,842 84.2 7 25 17 12 (14) 5 18 17 24 6 Dec-15 85 29 (16) 51.2 27.7 21.4 25.4 134 140 1.1 10.5 2.8 2.1 19.3 84
Zijin (H) 2899 HK O HK$ 3.04 3.00 (1) 17,745 14.0 8 32 27 50 31 4 27 29 54 48 Dec-15 85 29 (16) 34.1 18.5 14.3 16.9 145 140 1.6 10.5 1.8 1.8 17.0 84
Sector Aggregate (20) 118,563 9 21 10 28 2 4 16 13 32 20 Dec-15 96 104 25 86.7 44.3 21.7 17.4 68 111 1.5 2.4 0.8 1.4 10.4 48
Real Estate Alvin Wong/ Jinsong Du/ Kelvin Tam - 852 2101 6486/ 852 2101 6589/ 852 2101 6582
Agile 3383 HK N HK$ 4.49 4.80 7 2,267 2.7 4 18 6 11 (2) (0) 13 9 15 15 Dec-15 4 8 14 6.3 6.1 5.6 4.9 88 81 4.9 7.1 0.4 1.1 5.5 84
CFLD 600340 CH O Rmb 25.91 30.02 16 11,453 39.2 1 7 4 (16) 12 (0) 0 4 (3) 32 Dec-14 30 22 25 19.4 14.9 12.3 9.8 96 94 3.1 41.4 5.6 2.8 14.1 88
CG 2007 HK U HK$ 3.27 2.60 (20) 9,411 6.8 (0) 7 4 3 3 (5) 2 7 7 20 Dec-15 (20) 17 7 6.3 7.9 6.7 6.3 81 78 5.1 11.9 0.9 1.2 8.6 90
CIFI 884 HK O HK$ 1.95 2.50 28 1,686 1.7 3 7 1 13 11 (1) 2 3 17 28 Dec-15 11 24 24 4.9 4.4 3.6 2.9 94 98 7.9 18.6 0.8 0.9 5.8 48
COGO 81 HK U HK$ 2.35 1.90 (19) 691 0.4 3 4 (11) (28) (32) (2) (1) (9) (24) (15) Dec-15 (1) (1) (2) 6.5 6.6 6.6 6.7 60 52 0.0 7.0 0.4 0.7 6.8 42
COLI 688 HK O HK$ 25.80 30.00 16 32,796 66.0 4 9 2 (5) 4 (0) 4 4 (1) 21 Dec-15 8 15 22 9.0 8.3 7.2 5.9 93 94 2.4 15.6 1.3 1.9 7.2 33
CRL 1109 HK O HK$ 19.22 24.40 27 17,173 30.6 7 7 (4) (15) (14) 3 2 (2) (11) 3 Dec-15 17 20 20 9.4 8.0 6.7 5.5 100 104 3.8 13.8 1.0 1.4 5.2 29
CWTC 600007 CH O Rmb 20.49 21.28 4 3,087 7.4 (1) 20 28 9 49 (3) 13 29 21 70 Dec-14 5 10 13 38.5 36.8 33.3 29.5 90 94 0.9 10.6 3.8 9.8 22.0 35
E-House China EJ US O US$ 6.59 6.64 1 936 1.2 0 3 5 5 6 (4) (2) 7 9 24 Dec-14 (94) (39) 2,115 13.6 n.m. n.m. 15.9 n.m. 2 2.3 0.5 1.1 0.6 n.m. (30)
Evergrande 3333 HK U HK$ 4.84 3.90 (19) 8,536 17.2 1 (7) (16) (29) 9 (4) (12) (13) (25) 26 Dec-15 74 19 8 83.5 48.1 40.3 37.3 15 14 6.6 2.4 1.2 1.6 12.7 320
Financial Street 000402 CH U Rmb 10.04 7.25 (28) 4,489 44.7 3 6 7 (13) (9) 2 (1) 7 (1) 11 Dec-14 15 13 19 10.3 8.9 7.9 6.6 150 132 2.5 13.7 1.2 2.1 11.2 84
Gemdale 600383 CH U Rmb 10.92 8.40 (23) 7,352 55.9 2 0 (9) (21) (16) (0) (7) (9) (9) 4 Dec-14 10 15 16 12.3 11.1 9.7 8.4 138 126 1.2 13.4 1.4 1.4 10.3 58
Glorious 845 HK U HK$ 0.70 0.60 (14) 703 0.2 1 0 (23) (22) (32) (3) (5) (21) (18) (15) Dec-14 107 57 34 n.m. 25.1 15.9 11.9 n.m. 100 0.0 1.2 0.3 4.1 43.9 126
Greentown 3900 HK O HK$ 5.87 6.70 14 1,636 2.8 5 11 (5) (24) (31) 1 6 (2) (20) (14) Dec-15 6 17 22 11.1 10.6 9.0 7.4 52 52 1.9 4.2 0.4 1.6 13.3 90
Hopefluent 733 HK O HK$ 2.09 2.75 32 180 0.2 1 0 (2) (4) (8) (3) (4) 0 0 9 Dec-15 29 10 10 7.9 6.1 5.5 5.0 100 103 3.3 9.8 0.6 0.2 1.7 (32)
Jinmao 817 HK N HK$ 2.24 2.20 (2) 3,082 2.1 3 10 (1) (15) (10) (1) 5 1 (12) 7 Dec-15 19 17 13 10.2 8.6 7.3 6.5 76 74 3.8 8.3 0.6 1.8 5.9 63
Joy City 207 HK O HK$ 1.15 1.40 22 2,110 0.9 8 14 (6) (3) (35) 4 9 (3) 1 (18) Dec-15 37,655 49 5 n.m. 13.4 9.0 8.6 135 123 1.9 4.0 0.5 5.7 12.3 82
KWG 1813 HK O HK$ 4.58 5.40 18 1,769 3.9 6 6 (14) (20) (23) 2 1 (11) (16) (6) Dec-15 10 9 3 4.5 4.1 3.8 3.7 91 89 8.5 12.3 0.5 2.8 10.2 70
Leju LEJU US O US$ 5.04 6.30 25 701 0.1 10 17 (9) (12) (34) 6 12 (6) (8) (17) Dec-15 (0) 35 13 12.0 12.0 8.9 7.9 109 124 1.7 12.6 1.5 0.3 2.9 (100)
Longfor 960 HK O HK$ 10.62 12.40 17 7,990 5.1 7 9 (7) (8) (7) 3 4 (5) (4) 10 Dec-15 15 13 9 7.9 6.9 6.1 5.6 96 97 5.1 13.4 0.9 1.8 7.5 55
Poly Prop 119 HK U HK$ 2.04 1.80 (12) 963 2.4 3 4 (6) (19) (37) (2) (1) (3) (15) (20) Dec-15 75 108 707 n.m. n.m. n.m. 22.6 n.m. 15 0.0 (2.0) 0.3 1.6 37.2 124
Poly Real Estate 600048 CH O Rmb 9.10 14.40 58 16,138 102.0 0 12 (4) (14) (14) (2) 5 (4) (2) 6 Dec-14 21 25 23 8.0 6.6 5.3 4.3 120 124 2.1 22.5 1.4 1.5 8.5 106
R&F 2777 HK O HK$ 11.48 13.20 15 4,769 9.4 15 13 3 20 30 10 8 5 24 47 Dec-15 19 12 12 5.3 4.5 4.0 3.5 114 117 8.9 16.8 0.7 1.8 6.5 143
RiseSun 002146 CH U Rmb 7.20 5.50 (24) 4,683 22.6 3 9 (3) (24) (29) 1 3 (3) (12) (9) Dec-14 (50) 22 6 4.2 8.5 7.0 6.6 132 124 2.8 23.1 1.7 1.8 8.9 92
Shanghai Jinqiao (A) 600639 CH N Rmb 24.06 17.40 (28) 3,060 53.6 (6) 20 35 7 18 (8) 14 35 20 38 Dec-14 13 8 2 67.1 59.5 55.1 53.8 86 87 0.6 8.8 5.6 10.2 26.8 55
Shanghai Lujiazui (A) 600663 CH U Rmb 22.99 26.50 15 8,407 36.0 (1) (10) 7 (17) (12) (2) (17) 7 (5) 9 Dec-14 13 14 11 26.8 23.7 20.8 18.7 171 186 1.3 14.6 3.2 9.6 25.6 53
Shanghai Shimao 600823 CH N Rmb 7.16 11.00 54 2,870 10.0 1 4 (5) (18) (23) (0) (3) (5) (6) (3) Dec-14 (20) 20 14 4.4 5.5 4.6 4.1 156 173 2.4 13.0 0.7 1.7 8.0 28
Shenzhen International 152 HK O HK$ 10.90 16.00 47 2,751 4.0 (1) (7) (15) (24) (20) (5) (11) (13) (20) (3) Dec-15 10 17 50 12.7 11.6 9.9 6.6 89 96 2.4 9.5 1.1 2.8 6.3 (2)
Shimao 813 HK N HK$ 10.16 10.60 4 4,548 9.0 2 6 (9) (26) (29) (3) 1 (7) (22) (12) Dec-15 1 4 9 6.5 6.5 6.2 5.7 69 67 6.5 9.1 0.6 1.3 6.3 58
Sino-Ocean 3377 HK N HK$ 3.39 3.50 3 3,284 4.4 5 6 (11) (32) (38) 1 1 (8) (28) (20) Dec-15 8 18 6 9.4 8.7 7.4 7.0 77 75 4.0 6.0 0.5 1.7 8.9 79
SOHO 410 HK N HK$ 3.88 3.80 (2) 2,601 3.2 5 9 11 16 2 1 4 14 20 19 Dec-15 146 2 (5) n.m. 48.2 47.1 49.3 75 58 0.7 1.0 0.5 16.3 24.3 33
SOL 272 HK O HK$ 2.07 2.50 21 2,142 2.1 5 8 (1) (3) 4 0 3 1 1 21 Dec-15 172 29 15 n.m. 6.8 5.3 4.6 103 138 2.7 5.5 0.4 3.7 8.5 88
Sunac 1918 HK U HK$ 5.09 4.10 (19) 2,231 6.4 2 9 (5) (15) (31) (2) 4 (3) (11) (13) Dec-15 (4) 2 6 12.3 12.8 12.5 11.8 35 29 4.3 6.1 0.8 1.2 20.4 86
Vanke-A 000002 CH U Rmb 18.32 10.10 (45) 26,648 984.6 (7) (25) (25) (25) 26 (9) (32) (25) (13) 46 Dec-15 18 9 3 11.7 10.0 9.1 8.9 97 93 4.5 19.1 1.8 1.0 5.4 21
Vanke-H 2202 HK U HK$ 15.82 12.10 (24) 2,682 22.9 (4) (12) (20) (31) (15) (9) (17) (18) (27) 3 Dec-15 21 9 3 9.0 7.4 6.8 6.6 99 95 6.1 19.1 1.3 0.3 1.2 21

Ju
mp
-Sta
rt 5
7
14 J
uly
201
6
China—valuation summary (continued) Wednesday, 13 July 2016
CS/ Cons. EV/ EV/ Net
Bberg Price Market 6M Last EPS D Yld ROE P/B Sales EBITDA Debt/Eq ticker View Ccy Local Target Upside cap ADTO Absolute performance (%) Relative performance (%) FYE EPS growth (%) PE (x) (%) (%) (%) (x) (x) (x) (%)
(%) (US$ m) 1w 1m 3m Ytd 12m 1w 1m 3m Ytd 12m T T+1 T+2 T+3 T T+1 T+2 T+3 T+1 T+2 T+1
Real Estate Alvin Wong/ Jinsong Du/ Kelvin Tam - 852 2101 6486/ 852 2101 6589/ 852 2101 6582
Wanda 3699 HK U HK$ 47.20 35.40 (25) 27,547 20.0 2 (5) 0 4 (18) (2) (10) 2 8 (1) Dec-15 6 6 (10) 13.2 12.4 11.7 13.0 77 73 2.4 8.0 1.0 2.4 7.9 69
WGQ (A) 600648 CH N Rmb 20.69 20.50 (1) 2,893 25.7 3 13 5 (21) (23) 1 6 5 (9) (3) Dec-14 23 21 11 33.7 27.4 22.6 20.4 157 100 0.9 9.5 2.6 3.3 17.3 90
Yuexiu Prop 123 HK N HK$ 0.98 1.00 2 1,567 4.2 3 0 (15) (27) (36) (1) (5) (13) (23) (19) Dec-15 7 10 14 9.1 8.5 7.8 6.8 95 91 3.5 4.1 0.3 1.5 9.6 68
Yuexiu REIT 405 HK O HK$ 4.45 5.50 24 1,632 2.2 2 3 7 7 6 (2) (2) 9 11 23 Dec-15 11 9 10 44.9 40.5 37.0 33.5 57 62 7.0 2.5 0.8 20.8 75
Yuzhou 1628 HK O HK$ 2.21 2.80 27 1,087 1.5 3 8 1 5 29 (1) 3 3 9 47 Dec-15 13 16 16 4.8 4.2 3.7 3.1 99 101 5.9 16.9 0.7 1.2 5.1 80
Sector Aggregate 1 240,551 2 2 (4) (11) (4) (3) (3) (1) (7) 14 Dec-15 19 16 12 10.8 9.1 7.8 7.1 92 93 3.6 12.3 1.0 1.5 7.4 66
Renewable Energy Patrick Jobin - 212 325 0843
JA Solar JASO US N US$ 7.13 9.69 36 339 1.1 4 2 (20) (26) (8) (0) (3) (18) (23) 10 Dec-15 4 14 (28) 4.5 4.3 3.8 5.3 100 135 0.0 8.2 0.3 0.4 3.5 68
JinkoSolar JKS US O US$ 19.80 40.00 102 621 2.8 (1) (3) (7) (28) (25) (3) (6) (11) (34) (27) Dec-15 7 15 (9) 3.7 3.4 3.0 3.3 126 129 0.0 19.5 0.6 0.5 3.7 91
ReneSola SOL US U US$ 1.25 1.50 20 127 0.1 2 (4) (12) (26) (9) (2) (9) (10) (23) 8 Dec-15 322 (53) (47) n.m. 11.2 23.8 45.2 101 105 0.0 9.8 1.1 0.5 4.7 406
Trina Solar TSL US N US$ 8.73 12.00 37 807 2.6 11 23 (11) (21) (18) 7 18 (9) (17) (1) Dec-15 55 11 (20) 11.9 7.6 6.9 8.6 94 143 0.0 10.2 0.7 0.5 7.6 83
Yingli Green Energy YGE US U US$ 4.00 3.00 (25) 73 0.1 (2) (6) (22) (12) (60) (7) (11) (19) (8) (43) Dec-15 102 (193) 9 n.m. 3.6 n.m. n.m. n.m. 397 0.0 (2.2) n.m. 1.1 6.0 n.m.
Sector Aggregate 52 1,967 5 8 (12) (24) (19) 1 4 (10) (20) (2) Dec-15 172 2 (16) n.m. 5.1 4.9 5.9 119 165 0.0 18.0 0.8 0.6 5.0 169
Retailing Bin Wang/ Kevin Yin/ Simon Sun - 852 2101 6702/ 852 2101 7655/ 852 2101 7652
Baoxin 1293 HK O HK$ 4.24 5.70 34 1,398 4.5 0 (14) (12) (13) (2) (4) (19) (10) (9) 15 Dec-15 271 12 9 42.5 11.4 10.2 9.3 108 99 0.0 15.3 1.6 0.5 6.3 63
Better Life 002251 CH O Rmb 13.58 20.80 53 1,582 16.4 2 17 1 (17) (19) 1 10 1 (4) 1 Dec-14 (40) 18 24 23.5 38.9 32.9 26.4 126 151 1.0 6.5 2.1 0.7 13.3 (5)
Gome 493 HK N HK$ 0.98 0.85 (13) 2,800 12.1 3 10 (12) (24) (33) (1) 5 (9) (20) (16) Dec-15 (33) 7 9 11.9 17.8 16.6 15.2 72 72 2.9 4.4 0.8 0.0 -1.1 (117)
JD.com JD US N US$ 22.21 20.80 (6) 32,347 82.1 9 6 (25) (31) (35) 5 1 (23) (27) (17) Dec-15 67 116 481 n.m. n.m. n.m. 71.9 4 19 0.0 (10.8) 7.4 0.7 n.m. (125)
Sun Art 6808 HK O HK$ 5.56 5.95 7 6,838 4.5 4 14 (2) (5) (20) 0 9 1 (1) (3) Dec-15 (6) (3) 9 18.7 20.0 20.5 18.9 95 90 2.1 10.7 2.1 0.4 6.4 (27)
Suning 002024 CH O Rmb 11.08 22.50 103 15,431 120.4 1 2 (7) (18) (25) (1) (5) (7) (5) (5) Dec-15 (50) 332 61 n.m. n.m. 55.0 34.1 123 243 0.0 1.4 3.4 0.7 37.3 12
YH Superstores 601933 CH O Rmb 4.48 5.00 12 5,452 29.8 7 11 2 (11) (16) 6 4 2 1 4 Dec-15 11 20 9 60.2 54.5 45.5 41.8 75 74 0.9 4.7 2.1 0.5 14.7 (60)
Yongda 3669 HK O HK$ 3.34 5.20 56 637 0.9 12 (3) (23) (43) (34) 8 (8) (21) (39) (16) Dec-15 22 20 20 8.1 6.7 5.6 4.6 141 93 4.5 14.3 0.9 0.2 4.9 87
ZBJT 000759 CH N Rmb 7.56 8.00 6 770 4.5 3 9 (3) (12) (14) 1 3 (3) 0 6 Dec-15 1,153 45 44 n.m. 73.2 50.6 35.2 131 111 1.0 2.4 1.7 0.3 11.3 (7)
Zhengtong 1728 HK O HK$ 2.84 4.50 58 809 1.1 1 (3) (4) (20) (43) (4) (8) (2) (16) (25) Dec-15 36 11 16 8.8 6.4 5.8 5.0 98 93 4.7 9.5 0.6 0.3 5.1 52
Zhongsheng 881 HK O HK$ 4.24 4.40 4 1,173 0.8 1 2 8 (10) (10) (3) (3) 10 (6) 8 Dec-15 73 20 17 18.9 10.9 9.1 7.8 93 94 2.0 6.9 0.7 0.4 7.5 115
Sector Aggregate 23 69,237 6 6 (14) (22) (28) 2 1 (12) (18) (11) Dec-15 285 133 44 n.m. n.m. 43.9 30.4 56 83 0.6 3.0 2.8 0.5 19.3 (27)
Software & Services Dick Wei/ Evan Zhou/ Sam Li/ Zoe Zhao - 852 2101 7339/ 852 2101 6745/ 852 2101 6775/ 852 2101 7201
58.com WUBA US O US$ 48.01 70.00 46 5,547 10.6 4 3 (21) (27) (23) 0 (2) (19) (23) (5) Dec-15 39 90 1,143 n.m. n.m. n.m. 47.6 48 n.m. 0.0 (4.9) 2.6 4.1 66.9 (16)
Alibaba BABA US O US$ 81.74 100.00 22 205,366 249.1 4 8 3 1 0 (0) 3 5 5 18 Mar-16 10 38 32 32.6 29.5 21.4 16.2 87 95 0.0 19.6 5.1 9.4 17.8 (40)
Autohome ATHM US U US$ 21.96 18.00 (18) 2,489 4.1 2 (12) (27) (37) (51) (2) (17) (25) (33) (34) Dec-15 (8) (4) (10) 15.5 16.7 17.4 19.3 85 69 0.0 19.0 1.4 1.9 11.5 (90)
Baidu BIDU US O US$ 164.98 245.00 49 57,124 177.3 2 1 (16) (13) (14) (2) (4) (13) (9) 4 Dec-15 (58) 63 41 11.0 26.3 16.2 11.4 126 141 0.0 15.6 3.6 3.9 15.5 (58)
Baozun BZUN US O US$ 6.99 7.20 3 346 0.2 9 (3) 10 (15) (14) 5 (7) 12 (11) 4 Dec-15 358 67 38 88.6 19.3 11.6 8.4 142 93 0.0 10.2 1.9 0.5 12.2 (49)
Bitauto BITA US O US$ 28.00 34.00 21 1,692 3.4 10 21 2 (1) (42) 6 16 4 3 (24) Dec-15 27 81 39 31.5 24.8 13.7 9.8 90 113 0.0 6.4 1.6 1.8 21.9 (15)
CDEL DL US U US$ 11.00 11.50 5 389 0.2 1 22 (26) (20) (18) (3) 17 (24) (16) (1) Sep-15 (11) 21 (1) 14.8 16.6 13.7 13.8 98 99 8.3 38.0 12.1 2.9 11.6 (164)
Changyou CYOU US N US$ 21.33 17.00 (20) 1,113 0.7 8 8 7 (14) (11) 3 3 10 (10) 6 Dec-15 (45) (3) 169 4.9 8.9 9.2 3.4 100 94 0.0 10.4 0.8 1.1 3.9 (40)
Cheetah Mobile CMCM US U US$ 10.11 8.50 (16) 1,415 2.4 11 (1) (40) (37) (62) 7 (6) (38) (33) (44) Dec-14 93 (54) 78 38.1 19.7 42.7 24.0 99 94 0.0 19.2 3.3 2.0 31.5 (65)
Chinasofti 354 HK O HK$ 3.10 3.60 16 863 4.5 4 8 6 (3) (16) (0) 3 8 1 2 Dec-15 9 22 18 20.3 18.5 15.2 12.9 94 95 0.0 9.7 1.7 0.9 8.8 (2)
Ctrip CTRP US O US$ 41.95 48.00 14 19,388 59.6 4 6 (14) (9) 13 0 1 (12) (5) 30 Dec-15 (74) 234 47 32.9 n.m. 37.8 25.7 n.m. 186 0.0 2.4 2.7 7.1 n.m. 13
DC Holdings 861 HK N HK$ 6.14 6.20 1 931 9.4 4 6 (2) 2 11 0 1 1 6 28 Dec-15 283 (42) 20 33.1 8.6 14.9 12.4 185 106 3.5 14.3 1.2 0.7 15.8 13
Jumei JMEI US O US$ 4.20 9.00 114 616 2.3 7 (13) (34) (54) (78) 3 (18) (32) (50) (61) Dec-14 (65) 91 68 9.1 26.1 13.7 8.1 95 76 0.0 4.6 1.2 0.2 13.1 (80)
Kingdee 268 HK N HK$ 2.42 2.50 3 917 6.6 1 (1) (9) (32) (38) (3) (6) (7) (28) (20) Dec-15 72 58 25 57.9 33.8 21.3 17.0 92 99 0.3 5.5 1.8 3.4 10.8 (14)
Kingsoft 3888 HK U HK$ 13.56 14.00 3 2,277 16.8 4 (6) (29) (29) (40) (0) (11) (27) (25) (23) Dec-14 (27) 32 61 14.9 20.5 15.5 9.7 197 139 0.0 11.7 1.9 1.1 9.7 (88)
Netease NTES US O US$ 197.33 200.00 1 25,944 62.6 6 21 40 9 36 2 16 42 13 53 Dec-15 41 13 10 23.5 16.7 14.7 13.3 108 107 1.5 33.0 5.1 4.3 13.6 (57)
New Oriental Education EDU US O US$ 40.93 43.00 5 6,406 13.9 (1) 6 16 30 76 (5) 1 18 34 93 May-15 16 20 20 30.9 26.7 22.2 18.5 105 98 0.0 18.0 4.4 3.3 19.4 (104)
Shiji 002153 CH N Rmb 26.86 25.43 (5) 4,286 44.2 2 11 (16) (47) (33) (0) 4 (16) (34) (12) Dec-15 24 41 20 69.0 55.5 39.3 32.7 110 126 0.2 10.6 5.6 11.6 54.2 (47)
Sina SINA US O US$ 54.24 75.00 38 3,789 10.7 8 7 8 10 20 4 2 11 14 38 Dec-15 12 118 56 72.4 64.9 29.8 19.1 103 124 0.0 2.3 1.4 3.3 25.7 (21)
Sohu SOHU US N US$ 40.00 50.00 25 1,547 4.6 8 3 (17) (30) (16) 4 (2) (15) (26) 1 Dec-14 97 (1,588) (33) n.m. n.m. n.m. n.m. 63 176 0.0 (0.3) 1.2 0.1 1.0 (75)
SouFun SFUN US O US$ 5.55 6.50 17 2,464 5.5 15 12 (9) (25) (28) 11 7 (7) (21) (10) Dec-15 (2,057) 63 112 n.m. n.m. n.m. n.m. 54 n.m. 0.0 (35.4) 4.1 2.2 n.m. (9)
TAL XRS US N US$ 60.01 62.00 3 4,685 8.2 (4) 11 9 29 79 (8) 7 12 33 96 Feb-15 45 6 46 58.9 40.7 38.4 26.3 99 102 0.0 34.3 12.0 7.2 43.0 (57)
Tarena TEDU US O US$ 10.50 12.00 14 689 0.4 1 4 (6) 2 (10) (3) (1) (4) 6 7 Dec-15 23 18 17 17.6 14.3 12.2 10.4 99 93 1.4 19.1 2.5 2.5 17.6 (37)
Tencent 700 HK O HK$ 181.20 190.00 5 219,754 368.9 4 7 10 19 19 (0) 2 12 23 37 Dec-15 36 25 n.a. 45.9 33.6 26.8 n.a. 106 104 0.0 32.0 9.6 10.4 23.7 (9)
Vipshop VIPS US N US$ 12.74 12.50 (2) 7,273 22.8 11 10 (13) (17) (44) 7 5 (10) (13) (27) Dec-15 15 26 21 23.5 20.4 16.2 13.4 94 93 0.0 55.0 9.0 0.8 11.0 (77)
Wangsu 300017 CH O Rmb 72.01 73.90 3 8,503 89.9 6 8 21 20 35 5 2 21 32 55 Dec-15 32 43 36 62.0 46.9 32.8 24.1 94 90 0.3 25.3 8.0 11.7 37.5 (74)
Weibo WB US O US$ 32.56 28.00 (14) 6,926 5.9 14 22 48 67 118 10 17 50 71 135 Dec-14 1,254 87 78 n.m. n.m. 61.0 34.3 89 97 0.0 10.5 11.4 13.8 112.8 (53)
YGSoft 002063 CH N Rmb 15.37 12.90 (16) 1,358 42.2 1 17 (1) (27) (22) (1) 10 (1) (15) (2) Dec-15 1 77 20 68.8 68.1 38.5 32.0 90 99 0.4 7.8 5.1 7.5 70.4 (56)
Yonyou 600588 CH U Rmb 20.40 11.60 (43) 4,468 59.1 3 14 (7) (36) (58) (1) 9 (5) (32) (41) Dec-15 32 31 20 88.6 67.1 51.1 42.7 96 95 1.0 8.0 5.3 6.0 101.2 (17)
Zhaopin ZPIN US U US$ 14.54 12.00 (17) 738 0.4 1 2 (9) (5) (3) (3) (3) (7) (1) 15 Jun-15 (11) (1) 21 19.9 22.2 22.4 18.5 96 81 0.0 21.4 4.2 2.0 10.2 (145)
Sector Aggregate 13 599,305 4 8 4 6 9 (0) 3 7 10 26 Dec-15 (2) 35 36 31.0 31.6 23.4 16.1 103 102 0.1 18.8 5.4 6.4 21.5 (34)

Ju
mp
-Sta
rt 5
8
14 J
uly
201
6
China—valuation summary (continued) Wednesday, 13 July 2016
CS/ Cons. EV/ EV/ Net
Bberg Price Market 6M Last EPS D Yld ROE P/B Sales EBITDA Debt/Eq ticker View Ccy Local Target Upside cap ADTO Absolute performance (%) Relative performance (%) FYE EPS growth (%) PE (x) (%) (%) (%) (x) (x) (x) (%)
(%) (US$ m) 1w 1m 3m Ytd 12m 1w 1m 3m Ytd 12m T T+1 T+2 T+3 T T+1 T+2 T+3 T+1 T+2 T+1
Technology Hardware Kyna Wong/ Randy Abrams/ Sam Li - 852 2101 6950/ 886 2 2715 6366/ 852 2101 6775
AAC 2018 HK O HK$ 66.35 75.70 14 10,504 25.4 4 6 14 31 55 (0) 1 17 35 72 Dec-15 28 23 12 22.6 17.6 14.3 12.8 104 109 2.2 31.8 5.1 4.7 12.8 (3)
BYDE 285 HK N HK$ 5.38 5.10 (5) 1,563 4.5 14 21 13 29 (43) 10 16 16 33 (26) Dec-15 31 (3) (5) 11.5 8.8 9.1 9.6 104 89 1.1 10.7 0.9 0.2 3.0 (26)
Coolpad 2369 HK U HK$ 1.32 1.15 (13) 854 2.2 (8) (15) (3) (15) (38) (12) (20) (1) (11) (21) Dec-15 59 329 31 n.m. n.m. 18.9 14.4 n.m. 94 0.0 (2.3) 1.1 0.4 n.m. (13)
Dahua 002236 CH O Rmb 14.19 19.70 39 6,155 49.1 2 12 (29) (31) (35) 0 5 (29) (19) (14) Dec-15 (44) 23 14 12.0 21.4 17.3 15.2 105 96 0.8 26.4 5.1 3.1 20.9 (10)
GeorTek 002241 CH O Rmb 28.25 36.80 30 6,451 64.5 0 3 3 (18) (2) (2) (3) 3 (6) 18 Dec-15 22 34 17 34.5 28.3 21.1 18.0 88 93 0.4 15.1 4.0 2.6 16.9 24
Hikvision 002415 CH O Rmb 23.98 26.00 8 21,893 64.0 (0) 17 (0) (9) (4) (2) 10 0 3 17 Dec-15 (16) 18 20 16.5 19.6 16.6 13.9 96 86 2.8 35.3 6.4 4.1 19.1 (46)
Huahong Semi 1347 HK O HK$ 7.15 11.00 54 953 0.9 0 (0) (10) (5) (25) (4) (5) (7) (1) (7) Dec-14 (0) (11) 10 8.5 8.5 9.5 8.6 99 94 0.0 7.6 0.6 1.0 3.7 (22)
Luxshare 002475 CH O Rmb 17.83 26.00 46 5,030 27.2 (9) (5) (7) (16) (25) (11) (12) (7) (4) (4) Dec-15 (25) 42 29 20.8 27.9 19.6 15.2 87 93 0.5 15.5 3.2 2.2 15.0 (37)
NFME 002156 CH N Rmb 13.27 11.54 (13) 1,931 41.6 (1) 19 24 (10) 35 (3) 12 24 3 55 Dec-15 30 56 16 83.6 64.3 41.3 35.7 100 100 0.2 5.2 3.3 3.5 19.8 17
Ofilm 002456 CH N Rmb 31.50 25.60 (19) 4,856 109.9 9 15 12 2 (17) 8 9 12 14 4 Dec-15 85 21 2 67.9 36.6 30.2 29.7 99 92 0.4 13.8 4.8 1.7 20.9 50
SMIC 981 HK O HK$ 0.64 0.93 45 3,481 10.7 3 3 (9) (19) (18) (1) (2) (6) (15) (1) Dec-14 42 (5) 10 17.7 12.5 13.1 11.9 132 105 0.0 8.5 1.0 1.4 4.3 (6)
Sunny Optical 2382 HK O HK$ 28.30 32.50 15 4,002 17.7 9 12 18 59 63 5 7 21 63 80 Dec-15 43 32 21 34.7 24.3 18.4 15.2 101 104 0.9 25.6 5.6 1.9 16.7 (32)
TCLC 2618 HK N HK$ 7.20 7.50 4 1,184 1.5 1 (0) 40 26 10 (3) (5) 43 30 27 Dec-15 (49) 49 10 8.6 17.0 11.4 10.3 63 89 2.4 13.2 2.2 0.4 20.2 64
Tongda 698 HK O HK$ 1.48 2.00 35 1,094 2.8 0 1 (10) 8 (4) (4) (4) (7) 12 13 Dec-15 35 19 11 12.4 9.2 7.8 7.0 94 93 3.6 21.8 1.9 1.2 6.2 11
TSHT 002185 CH O Rmb 12.88 14.23 10 2,053 35.4 (2) 21 17 (7) (8) (4) 14 17 6 13 Dec-15 12 33 10 37.2 33.1 24.8 22.5 99 105 0.5 8.6 2.7 2.5 12.6 (23)
ZTE (A) 000063 CH U Rmb 14.89 9.20 (38) 10,172 74.3 4 13 0 (20) (10) 2 6 0 (8) 11 Dec-15 (3) 5 (3) 19.3 19.8 18.9 19.5 80 72 1.5 10.1 1.9 0.6 16.7 (3)
ZTE (H) 763 HK N HK$ 10.10 10.30 2 10,172 10.0 7 5 (16) (43) (45) 3 (0) (14) (39) (28) Dec-15 (3) 5 (3) 11.3 11.6 11.1 11.4 89 85 2.6 10.1 1.1 0.6 16.7 (3)
Sector Aggregate 22 94,152 2 3 (5) (11) (9) (3) (2) (3) (7) 8 Dec-15 (4) 21 12 19.5 20.2 16.8 15.3 95 92 1.7 15.3 2.8 1.7 13.2 (2)
Telecommunication Services Colin McCallum - 852 2101 6514
21 Vianet VNET US O US$ 10.14 15.80 56 886 5.0 11 (17) (51) (52) (49) 6 (22) (49) (48) (32) Dec-15 22 42 55 n.m. n.m. n.m. n.m. 58 105 0.0 (7.5) 1.2 1.2 10.4 (22)
China Mobile 941 HK O HK$ 91.30 123.50 35 240,991 161.6 5 5 2 4 (5) 1 (0) 4 8 12 Dec-15 8 8 8 14.8 13.8 12.8 11.9 106 105 3.1 12.3 1.6 1.6 4.4 (44)
China Telecom 728 HK O HK$ 3.63 6.85 89 37,872 24.8 6 6 (15) (0) (18) 1 1 (13) 4 (0) Dec-15 1 24 19 12.6 12.6 10.2 8.6 103 110 3.2 6.5 0.8 1.0 3.6 31
China Unicom 762 HK O HK$ 7.97 16.00 101 24,604 42.0 1 (3) (21) (16) (29) (3) (8) (18) (12) (12) Dec-15 (26) 61 60 15.6 21.1 13.1 8.2 106 120 1.9 3.3 0.7 1.0 3.2 51
Unicom (A) 600050 CH O Rmb 4.34 5.00 15 13,761 56.8 11 13 (3) (30) (40) 9 6 (3) (18) (20) Dec-15 (22) 52 59 26.5 33.9 22.3 14.0 89 108 1.0 3.4 1.1 1.2 4.2 51
Sector Aggregate 46 318,114 5 4 (2) 1 (10) 1 (0) (0) 5 7 Dec-15 3 14 15 15.0 14.5 12.7 11.1 105 107 2.9 9.3 1.3 1.3 4.0 (5)
Transportation Baiding Rong/ Baoying Zhai/ Edmond Huang/ Isis Wong - 852 2101 6703/ 852 2101 7135/ 852 2101 6701/ 852 2101 7109
Air China (A) 601111 CH N Rmb 7.88 6.20 (21) 13,398 36.6 11 13 8 (8) (49) 9 6 8 4 (28) Dec-15 12 (5) (9) 8.7 7.7 8.1 8.9 141 126 2.4 19.6 1.5 1.7 6.0 141
Air China (H) 753 HK O HK$ 5.70 7.00 23 13,398 10.0 7 10 (9) (7) (35) 3 5 (6) (3) (18) Dec-15 12 (5) (9) 5.4 4.8 5.1 5.5 136 125 3.9 19.6 0.9 1.7 6.0 141
BCIA 694 HK N HK$ 8.37 8.80 5 4,673 4.1 4 3 (4) 0 (2) (0) (1) (2) 4 16 Dec-15 4 13 12 19.0 18.3 16.2 14.4 95 93 2.2 9.1 1.6 4.3 8.6 36
China Southern Airlines (A) 600029 CH U Rmb 8.62 3.20 (63) 10,767 80.5 16 26 34 1 (25) 14 19 34 13 (5) Dec-15 6 (18) (21) 8.9 8.5 10.4 13.2 158 116 1.7 23.8 1.9 1.4 5.9 173
China Southern Airlines (H) 1055 HK U HK$ 4.75 3.60 (24) 10,767 7.4 9 9 (10) (21) (43) 5 4 (8) (17) (25) Dec-15 6 (18) (21) 4.2 4.0 4.9 6.3 143 118 3.6 23.8 0.9 1.4 5.9 173
CRSC 3969 HK U HK$ 5.31 3.70 (30) 6,017 1.5 3 10 5 3 n.a. (1) 5 7 7 n.a. Dec-15 (6) 11 (6) 16.1 17.0 15.3 16.4 84 80 1.2 11.9 1.9 1.0 7.9 (53)
Daqin 601006 CH U Rmb 6.10 4.50 (26) 13,566 54.5 (8) (4) (11) (29) (46) (9) (11) (11) (17) (26) Dec-15 (38) (23) (5) 7.2 11.6 15.1 16.0 92 74 4.3 8.6 1.0 2.0 6.3 (3)
GBIA 600004 CH O Rmb 12.94 14.80 14 2,226 12.0 2 8 1 (9) (12) 0 1 2 3 8 Dec-15 4 5 (45) 11.9 11.4 10.9 19.7 106 103 2.6 13.0 1.4 2.8 6.9 14
Guangshen Railway (A) 601333 CH N Rmb 4.10 4.40 7 4,138 19.6 3 5 (2) (18) (29) 1 (2) (2) (6) (9) Dec-15 8 17 15 23.5 21.7 18.6 16.1 114 117 1.8 4.8 1.0 1.6 7.6 (9)
Guangshen Railway (H) 525 HK O HK$ 3.64 5.00 37 4,138 1.8 2 3 (1) (6) (6) (2) (2) 1 (2) 12 Dec-15 8 17 15 18.0 16.6 14.2 12.4 110 110 2.4 4.8 0.8 1.6 7.6 (9)
SIAC 600009 CH O Rmb 27.25 36.40 34 7,855 25.7 4 0 (6) (8) (9) 2 (6) (6) 5 11 Dec-15 15 13 9 20.7 18.0 15.9 14.5 102 100 1.7 13.7 2.3 6.5 12.0 (28)
Spring Airlines 601021 CH O Rmb 49.23 66.69 35 5,891 22.6 4 (1) (0) (19) (22) 2 (8) (0) (7) (2) Dec-15 40 19 17 28.8 20.6 17.3 14.7 102 94 0.7 25.8 4.8 4.6 13.4 36
SZAC 000089 CH O Rmb 8.47 9.80 16 2,598 13.6 1 3 4 4 8 (0) (3) 4 16 29 Dec-15 19 21 16 33.3 27.9 23.1 20.0 101 100 0.7 5.9 1.6 4.7 11.2 (25)
Sector Aggregate 2 71,129 3 4 (6) (13) (28) (1) (1) (3) (9) (10) Dec-15 (1) (8) (8) 8.3 8.4 9.1 9.9 120 106 2.8 13.6 1.2 1.9 6.8 55
Utilities Dave Dai/ Joy Zhang - 852 2101 7358/ 852 2101 7083
Beijing Enterprise 392 HK O HK$ 44.90 66.00 47 7,306 10.8 2 9 5 (4) (19) (3) 4 7 (0) (2) Dec-15 11 9 3 10.0 9.0 8.3 8.1 100 103 3.3 10.2 0.9 1.6 15.4 39
China Datang 1798 HK O HK$ 0.85 1.24 46 797 0.2 9 5 (7) (12) (21) 5 (0) (4) (8) (4) Dec-14 159 480 70 n.m. 60.1 10.4 6.1 610 168 0.2 0.8 0.5 8.5 10.0 304
China Gas 384 HK O HK$ 12.10 16.00 32 7,659 7.1 4 6 (2) 8 (6) (1) 1 0 12 11 Mar-16 106 18 13 26.4 12.8 10.9 9.6 107 112 2.2 23.8 2.8 2.1 10.0 60
China Longyuan 916 HK O HK$ 6.22 8.00 29 6,444 12.0 1 7 2 6 (31) (3) 2 4 10 (13) Dec-15 40 44 16 15.0 10.7 7.4 6.4 112 135 1.9 10.1 1.0 5.5 8.1 152
Chuantou 600674 CH N Rmb 8.88 9.10 2 5,847 27.4 3 7 1 (17) (25) 1 (0) 1 (5) (5) Dec-15 21 (12) (15) 10.1 8.4 9.6 11.3 118 106 3.7 23.5 1.8 38.3 71.6 24
CR Gas 1193 HK O HK$ 23.15 26.00 12 6,637 9.5 2 3 (5) 0 5 (2) (2) (2) 4 22 Dec-15 29 19 14 17.7 13.8 11.6 10.2 109 116 1.8 20.0 2.6 1.9 7.9 20
CR Power 836 HK U HK$ 11.18 10.00 (11) 6,928 12.9 1 (2) (27) (26) (46) (3) (7) (25) (22) (28) Dec-15 (0) (21) (21) 5.3 5.3 6.8 8.6 94 81 7.6 13.6 0.7 2.4 5.2 111
CSG 956 HK N HK$ 0.90 1.12 24 431 0.8 6 13 5 (27) (44) 2 8 7 (23) (27) Dec-14 (17) 56 33 8.5 10.3 6.6 4.9 168 141 3.4 3.8 0.4 3.0 8.1 119
Datang (A) 601991 CH U Rmb 4.08 1.84 (55) 6,925 8.8 3 6 (6) (21) (43) 1 (1) (6) (8) (23) Dec-15 32 (12) (6) 19.5 14.7 16.7 17.7 142 90 2.7 7.9 1.1 4.4 10.5 298
Datang (H) 991 HK N HK$ 1.93 2.10 9 6,925 5.5 (2) (6) (20) (18) (45) (6) (11) (17) (14) (28) Dec-15 32 (12) (6) 7.9 6.0 6.8 7.2 108 83 6.7 7.9 0.5 4.4 10.5 298
ENN Energy 2688 HK O HK$ 38.50 52.00 35 5,372 11.2 4 (2) (18) (7) (19) (0) (6) (16) (3) (1) Dec-15 45 25 15 17.6 12.1 9.7 8.5 101 113 2.2 20.4 2.3 1.4 7.6 41
Guangdong Investment 270 HK N HK$ 11.58 11.40 (2) 9,352 10.0 4 2 17 5 13 (0) (3) 19 9 30 Dec-15 11 (1) 6 18.5 16.6 16.9 15.8 97 88 3.3 13.4 2.1 6.3 10.7 (8)
HDF 816 HK O HK$ 1.74 3.10 78 1,886 4.4 3 4 (15) (22) (51) (1) (1) (12) (18) (34) Dec-14 6 30 37 6.4 6.0 4.6 3.4 115 117 3.2 13.2 0.8 5.1 8.5 312
HDP (A) 600027 CH U Rmb 5.12 2.80 (45) 7,020 17.2 2 (1) (10) (25) (37) 0 (8) (10) (12) (17) Dec-15 (39) (16) (15) 6.4 10.4 12.4 14.6 78 67 3.9 10.8 1.1 2.7 6.8 194
HDP (H) 1071 HK U HK$ 3.53 3.10 (12) 7,020 5.9 0 (2) (28) (30) (55) (4) (7) (26) (26) (38) Dec-15 (39) (16) (15) 3.8 6.2 7.4 8.7 76 71 6.5 10.8 0.6 2.7 6.8 194
HNR 958 HK O HK$ 2.57 3.80 48 3,223 8.3 2 6 3 11 (22) (3) 1 5 15 (5) Dec-15 41 31 23 11.6 8.2 6.3 5.1 115 126 2.4 14.0 1.1 8.0 8.9 270
Huaneng (A) 600011 CH U Rmb 7.21 3.70 (49) 14,100 13.3 (8) (1) (9) (17) (37) (10) (8) (9) (5) (16) Dec-15 (28) (17) (23) 7.7 10.6 12.7 16.6 91 84 4.7 11.9 1.2 2.2 6.7 142
Huaneng (H) 902 HK U HK$ 4.58 4.00 (13) 14,100 26.6 (1) (11) (36) (32) (51) (5) (16) (34) (28) (34) Dec-15 (28) (17) (23) 4.2 5.8 7.0 9.1 89 82 8.6 11.9 0.7 2.2 6.7 142

Ju
mp
-Sta
rt 5
9
14 J
uly
201
6
China—valuation summary (continued) Wednesday, 13 July 2016
CS/ Cons. EV/ EV/ Net
Bberg Price Market 6M Last EPS D Yld ROE P/B Sales EBITDA Debt/Eq ticker View Ccy Local Target Upside cap ADTO Absolute performance (%) Relative performance (%) FYE EPS growth (%) PE (x) (%) (%) (%) (x) (x) (x) (%)
(%) (US$ m) 1w 1m 3m Ytd 12m 1w 1m 3m Ytd 12m T T+1 T+2 T+3 T T+1 T+2 T+3 T+1 T+2 T+1
Utilities Dave Dai/ Joy Zhang - 852 2101 7358/ 852 2101 7083
Jingneng 600578 CH N Rmb 4.52 5.80 28 3,122 9.1 2 7 (10) (26) (34) 1 1 (10) (13) (14) Dec-14 (7) (3) 12 8.2 8.8 9.1 8.1 90 102 4.0 15.7 1.3 2.9 6.9 50
SDIC 600886 CH N Rmb 6.68 7.40 11 6,781 51.6 2 2 (3) (20) (56) 1 (5) (3) (8) (36) Dec-15 19 (6) (12) 8.4 7.0 7.5 8.5 119 111 5.0 22.5 1.5 5.2 7.6 214
SZ Gas 601139 CH U Rmb 8.63 6.00 (30) 2,813 6.1 4 14 1 (5) (10) 2 7 1 7 10 Dec-15 12 14 10 25.9 23.1 20.2 18.5 99 95 1.4 10.0 2.2 2.2 15.5 (6)
Yangtze Power 600900 CH O Rmb 13.04 14.60 12 42,913 39.9 0 4 7 (4) (11) (1) (3) 7 8 9 Dec-15 31 (3) (9) 18.7 14.2 14.6 16.1 115 112 5.0 15.8 1.8 8.9 11.0 105
Sector Aggregate 11 145,556 1 2 (5) (10) (24) (3) (3) (3) (6) (6) Dec-15 5 (1) (4) 9.9 9.4 9.5 9.8 102 99 4.6 13.6 1.1 3.7 8.6 135
Country Aggregate 5,830 6,520 12 4,537,489 4 5 (2) (4) (17) Dec-15 (2) 14 12 10.2 10.4 9.1 7.9 99 101 2.9 11.9 1.2 1.3 8.4 31
Note: Prices are as of 13 Jul 2016
* Country/ sector aggregates are for the coverage above
Source: Company data, Thomson Financial IBES, Credit Suisse estimates

Ju
mp
-Sta
rt 6
0
14 J
uly
201
6
Hong Kong—valuation summary Wednesday, 13 July 2016
CS/ Cons. EV/ EV/ Net
Bberg Price Market 6M Last EPS D Yld ROE P/B Sales EBITDA Debt/Eq ticker View Ccy Local Target Upside cap ADTO Absolute performance (%) Relative performance (%) FYE EPS growth (%) PE (x) (%) (%) (%) (x) (x) (x) (%)
(%) (US$ m) 1w 1m 3m Ytd 12m 1w 1m 3m Ytd 12m T T+1 T+2 T+3 T T+1 T+2 T+3 T+1 T+2 T+1
Capital Goods Edmond Huang - 852 2101 6701
CSCI 3311 HK O HK$ 10.58 13.60 29 6,121 11.8 5 5 (11) (21) (17) 1 1 (11) (19) (2) Dec-15 14 9 18 10.2 9.0 8.2 7.0 97 90 3.2 19.9 1.6 1.4 9.0 41
Conglomerates Gerald Wong/ Kelvin Tam/ Kenneth Fong/ Susanna Leung - 65 6212 3037/ 852 2101 6582/ 852 2101 6395/ 852 2101 6590
CKH 1 HK O HK$ 85.95 120.00 40 42,765 87.9 4 (4) (13) (18) (23) 0 (8) (13) (15) (8) Dec-15 (2) 13 13 10.6 10.8 9.6 8.5 99 99 3.0 7.6 0.8 1.3 5.5 31
Hopewell 54 HK O HK$ 24.70 34.30 39 2,770 1.3 1 1 (9) (11) (8) (3) (3) (9) (9) 7 Jun-15 19 (26) 10 13.0 11.0 14.7 13.3 115 109 4.9 4.3 0.5 9.1 18.5 (1)
Jardine Matheson JM SP U US$ 58.00 47.00 (19) 41,251 34.5 1 5 (0) 19 7 (3) 1 (0) 22 22 Dec-15 7 8 6 15.9 14.8 13.7 12.9 99 100 2.0 7.2 1.0 1.3 12.2 11
Jardine Strategic JS SP N US$ 29.85 29.00 (3) 33,105 8.0 1 3 (3) 9 (2) (3) (1) (3) 12 13 Dec-15 5 9 6 12.5 12.0 11.0 10.3 96 97 1.0 6.1 0.7 1.3 10.8 8
Wharf 4 HK U HK$ 48.55 42.00 (13) 18,970 26.7 4 9 13 13 (8) 0 6 13 16 7 Dec-15 16 2 10 13.4 11.5 11.3 10.3 103 102 4.2 4.0 0.4 4.6 10.5 14
Wheelock 20 HK U HK$ 38.10 27.50 (28) 9,980 6.3 5 10 8 17 (7) 1 6 8 19 8 Dec-15 17 (9) 5 7.3 6.2 6.9 6.5 112 105 3.0 6.0 0.4 2.6 6.4 18
Sector Aggregate 3 148,840 2 3 (3) 5 (7) (2) (1) (2) 7 8 Dec-15 6 7 9 12.1 11.5 10.8 9.8 101 100 2.5 6.1 0.7 1.5 8.0 17
Consumer Durables & Apparel Baiding Rong/ Eva Wang/ Isis Wong - 852 2101 6703/ 852 2101 7365/ 852 2101 7109
Chow Sang Sang 116 HK N HK$ 15.96 12.38 (22) 1,393 0.5 6 21 37 26 7 2 17 37 29 22 Dec-15 (26) 20 17 9.6 13.0 10.8 9.3 88 93 2.9 9.0 1.1 0.4 7.4 (20)
CTF Jewellery 1929 HK N HK$ 5.84 5.30 (9) 7,528 3.0 4 8 9 17 (21) 0 4 9 20 (6) Mar-15 (34) 14 18 10.7 16.3 14.3 12.2 122 119 10.3 8.9 1.4 1.0 10.4 3
Luk Fook 590 HK N HK$ 20.45 15.20 (26) 1,548 1.9 7 14 19 24 (9) 3 10 20 27 6 Mar-15 (44) 13 11 7.5 13.3 11.8 10.6 94 104 5.4 10.4 1.3 0.7 7.2 (31)
Pacific Textiles 1382 HK N HK$ 10.16 13.30 31 1,894 2.6 6 11 (0) (15) (15) 2 7 (0) (12) 0 Mar-15 7 6 10 13.7 12.7 12.0 10.9 102 107 7.9 34.8 4.7 2.0 10.8 3
Prada 1913 HK U HK$ 24.40 17.50 (28) 8,049 2.3 (0) (6) (6) 1 (33) (4) (10) (6) 4 (18) Jan-16 2 9 1 22.0 21.5 19.7 19.5 105 105 3.7 10.9 2.3 2.0 8.7 (3)
Samsonite 1910 HK N HK$ 23.00 22.50 (2) 4,183 12.8 6 1 (11) (1) (8) 2 (4) (9) 3 9 Dec-15 13 13 11 21.1 18.6 16.5 14.9 101 100 2.7 15.8 2.8 1.5 9.2 (14)
Techtronic 669 HK O HK$ 33.45 37.90 13 7,909 13.0 2 9 10 6 27 (2) 5 10 9 42 Dec-15 27 24 17 22.4 17.5 14.1 12.0 105 110 1.5 19.5 3.2 1.4 11.3 4
Texwinca 321 HK N HK$ 6.08 8.00 32 1,083 1.5 9 (15) (20) (25) (30) 5 (19) (20) (22) (15) Mar-15 73 (30) 11 10.8 6.2 8.9 8.1 128 124 9.5 21.2 1.3 0.5 5.3 (45)
Sector Aggregate (5) 33,586 3 4 4 6 (9) (1) 0 4 9 6 Dec-15 2 15 12 16.4 16.0 13.9 14.0 108 112 3.9 12.9 2.0 1.2 8.9 (12)
Consumer Staples Isis Wong - 852 2101 7109
L'Occitane 973 HK N HK$ 15.76 14.40 (9) 3,001 2.5 2 2 13 5 (25) (2) (2) 13 8 (10) Mar-15 (10) 23 16 22.1 24.5 19.9 17.2 100 103 1.6 12.9 3.2 1.9 10.4 (39)
Diversified Financials Charles Zhou - 852 2101 6177
VP 806 HK N HK$ 6.86 6.94 1 1,635 5.4 (1) (3) (16) (24) (36) (5) (7) (15) (21) (21) Dec-15 122 68 17 46.2 20.8 12.4 10.6 144 144 1.4 15.2 3.0 n.a. n.a. n.a.
Hotels, Restaurants & Leisure Isis Wong/ Kenneth Fong/ Sophie Chiu - 852 2101 7109/ 852 2101 6395/ 852 2101 7657
China Travel HK 308 HK O HK$ 2.40 3.20 33 1,694 3.5 5 9 (3) (26) (20) 1 5 (3) (24) (5) Dec-15 (47) 29 4 10.0 18.9 14.6 14.1 96 106 2.1 4.6 0.8 2.3 7.7 (12)
Galaxy 27 HK O HK$ 24.10 28.20 17 13,253 49.5 9 0 (17) (1) (34) 5 (4) (17) 2 (19) Dec-15 6 (5) 12 24.9 23.5 24.8 22.1 83 79 1.3 10.5 2.4 1.7 10.0 (28)
Macau Legend 1680 HK U HK$ 1.04 1.00 (4) 845 0.9 0 8 (8) 3 (56) (4) 4 (8) 6 (41) Dec-15 95 258 189 n.m. n.m. n.m. n.m. 936 n.m. 0.0 (0.2) 0.9 6.1 23.9 53
Melco 200 HK N HK$ 7.54 8.00 6 1,503 3.3 8 (7) (28) (35) (48) 4 (11) (28) (32) (32) Dec-15 135 28 133 n.m. 49.1 38.4 16.5 81 67 0.4 1.9 0.9 22.4 n.m. (13)
MGM China 2282 HK O HK$ 10.38 12.50 20 5,085 7.2 5 2 (15) 7 (39) 1 (2) (15) 10 (24) Dec-15 (25) (2) 30 12.7 16.9 17.3 13.4 101 98 1.8 41.5 6.3 3.6 14.8 196
MPEL MPEL US N US$ 12.70 13.40 6 6,904 12.9 4 (6) (24) (21) (40) 0 (10) (24) (19) (25) Dec-15 49 23 78 65.0 43.7 35.6 20.0 87 76 0.9 3.8 1.8 2.0 10.3 55
NagaCorp 3918 HK N HK$ 5.28 5.20 (2) 1,545 1.7 3 0 (5) 8 (12) (1) (4) (5) 10 4 Dec-15 (8) (36) 15 9.0 9.7 15.1 13.1 97 89 5.1 19.6 2.3 2.5 5.7 (11)
Sands China 1928 HK N HK$ 26.55 27.50 4 27,621 60.0 7 1 (14) 0 (18) 3 (3) (14) 3 (3) Dec-15 (23) 12 (3) 19.0 24.5 22.0 22.5 84 84 7.3 20.9 5.6 4.9 16.1 72
SJM 880 HK N HK$ 4.75 5.40 14 3,464 6.9 5 0 (13) (14) (47) 1 (4) (13) (11) (32) Dec-15 (23) (54) 65 10.9 14.1 30.7 18.6 99 73 3.5 8.0 1.1 0.6 8.1 (7)
Tsui Wah 1314 HK N HK$ 1.28 1.80 41 233 0.2 2 (9) (19) (29) (45) (2) (13) (19) (27) (30) Mar-15 (11) 12 22 11.6 13.1 11.7 9.6 192 97 5.4 11.1 1.4 0.6 4.9 (46)
Wynn Macau 1128 HK O HK$ 11.96 13.50 13 8,010 20.8 9 4 (2) 39 (20) 5 0 (2) 41 (5) Dec-15 (21) 92 22 25.7 32.6 17.0 14.0 86 104 2.5 70.0 46.4 4.0 17.0 2,235
Sector Aggregate 10 70,158 7 1 (14) 1 (27) 3 (3) (14) 3 (12) Dec-15 (15) 7 17 20.2 23.9 22.3 19.2 88 86 4.0 12.1 3.0 2.7 13.1 37
Insurance Charles Zhou/ Kevin R. Choquette - 852 2101 6177/ 416-352-4585
AIA Group 1299 HK O HK$ 47.15 56.30 19 73,239 143.4 3 5 3 1 (6) (1) 1 3 4 10 Nov-15 26 15 14 26.5 21.0 18.2 16.0 99 92 1.7 11.1 2.2 n.a. n.a. n.a.
Manulife 945 HK O HK$ 105.00 22.00 (79) 26,697 0.6 2 (4) (4) (11) (26) (2) (8) (4) (9) (11) Dec-15 13 13 n.a. 10.6 9.3 8.2 n.a. 101 102 4.2 10.3 1.0 n.a. n.a. n.a.
Sector Aggregate 21 99,936 3 2 1 (2) (11) (1) (1) 1 1 4 Dec-15 19 15 14 18.5 15.5 13.5 15.8 100 98 2.4 10.9 1.6 n.a. n.a. n.a.
Metals & Mining Joy Zhang/ Trina Chen - 852 2101 7083/ 852 2101 7031
MMG 1208 HK O HK$ 2.00 2.70 35 1,364 0.6 3 18 8 36 (10) (1) 14 8 39 5 Dec-15 111 82 247 n.m. 12.2 6.7 1.9 n.m. 183 2.5 15.5 1.8 4.2 7.8 378
Rusal 486 HK O HK$ 2.58 3.90 51 5,053 0.3 8 13 (4) 9 (33) 4 9 (4) 12 (18) Dec-15 110 56 23 9.1 4.3 2.8 2.2 154 203 0.0 127.7 3.4 0.9 3.9 497
Sector Aggregate 48 6,417 7 14 (2) 15 (28) 3 10 (2) 17 (13) Dec-15 374 58 46 n.m. 5.0 3.2 2.2 190 202 0.5 78.3 2.8 1.7 5.5 424
Paper & Forest Products Joy Zhang - 852 2101 7083
Lee & Man Paper 2314 HK O HK$ 6.02 6.80 13 3,536 4.8 4 9 12 39 18 (0) 5 12 42 33 Dec-15 13 5 11 11.9 10.5 10.0 9.0 98 93 3.0 14.4 1.4 2.2 9.7 72
Nine Dragons Paper 2689 HK O HK$ 5.96 6.00 1 3,585 6.4 3 5 (3) 30 (6) (1) 1 (3) 33 10 Jun-15 (25) 119 20 17.0 22.7 10.4 8.6 67 89 1.0 4.1 0.9 1.5 10.2 89
Sector Aggregate 7 7,121 3 7 4 34 6 (1) 3 4 37 21 Dec-15 21 24 12 14.5 12.0 9.7 8.6 90 94 2.3 9.3 1.1 1.7 9.0 79

Ju
mp
-Sta
rt 6
1
14 J
uly
201
6
Hong Kong—valuation summary (continued) Wednesday, 13 July 2016
CS/ Cons. EV/ EV/ Net
Bberg Price Market 6M Last EPS D Yld ROE P/B Sales EBITDA Debt/Eq ticker View Ccy Local Target Upside cap ADTO Absolute performance (%) Relative performance (%) FYE EPS growth (%) PE (x) (%) (%) (%) (x) (x) (x) (%)
(%) (US$ m) 1w 1m 3m Ytd 12m 1w 1m 3m Ytd 12m T T+1 T+2 T+3 T T+1 T+2 T+3 T+1 T+2 T+1
Real Estate Kelvin Tam/ Susanna Leung - 852 2101 6582/ 852 2101 6590
CK Property 1113 HK O HK$ 51.30 59.60 16 25,431 39.5 4 8 1 2 (21) 0 4 1 4 (6) Dec-15 28 5 5 12.7 9.9 9.5 9.0 112 112 3.5 7.4 0.7 3.2 7.2 (1)
Great Eagle 41 HK U HK$ 32.70 20.80 (36) 2,851 1.3 4 7 17 38 23 (0) 3 17 41 38 Dec-15 8 7 8 12.2 11.3 10.5 9.7 116 121 2.2 3.5 0.4 7.0 15.0 28
Henderson Land 12 HK U HK$ 44.15 37.80 (14) 20,702 23.4 2 6 (3) 2 (7) (2) 2 (3) 5 8 Dec-15 (17) 1 1 13.2 15.9 15.8 15.6 95 94 3.3 3.8 0.6 7.2 23.5 14
HLP 101 HK N HK$ 15.98 14.50 (9) 9,264 13.5 5 8 2 (9) (28) 1 4 2 (7) (13) Dec-15 1 13 7 16.3 16.1 14.2 13.2 86 97 4.7 3.5 0.6 8.8 11.4 6
Hongkong Land HKL SP O US$ 6.11 7.50 23 14,376 21.3 (1) 1 (4) (13) (24) (5) (3) (4) (10) (9) Dec-15 (1) 3 (5) 15.9 16.1 15.5 16.3 99 95 3.1 3.1 0.5 8.4 16.7 5
Hysan 14 HK N HK$ 34.95 32.20 (8) 4,710 5.3 3 5 5 10 5 (1) 1 5 13 21 Dec-15 4 2 4 16.3 15.6 15.2 14.7 100 102 3.9 3.5 0.6 11.4 13.8 4
Kerry Prop 683 HK U HK$ 19.68 19.10 (3) 3,661 4.9 3 4 (10) (7) (31) (1) 0 (10) (4) (15) Dec-15 18 1 (12) 8.2 6.9 6.8 7.8 109 95 4.3 4.9 0.3 4.3 9.7 29
Midland 1200 HK U HK$ 2.22 2.50 13 205 0.1 5 12 (10) (31) (34) 1 8 (10) (28) (18) Dec-15 39 111 728 n.m. n.m. n.m. 29.6 144 23 0.0 (4.7) 1.3 0.1 n.m. (86)
NWD 17 HK N HK$ 8.12 8.50 5 9,827 14.5 4 10 4 6 (16) 0 6 4 9 (1) Jun-15 (9) 4 5 10.5 11.5 11.1 10.6 81 95 5.3 3.8 0.5 3.1 14.0 36
SHKP 16 HK N HK$ 103.00 104.30 1 38,440 61.5 6 14 6 10 (16) 2 10 6 13 (1) Jun-15 24 (16) 16 14.6 11.8 14.0 12.0 106 91 3.6 5.5 0.6 3.8 11.1 11
Sino Land 83 HK N HK$ 12.94 11.70 (10) 10,284 7.4 1 7 2 14 5 (3) 4 2 17 20 Jun-15 (2) (11) 2 14.9 15.3 17.1 16.7 99 90 3.9 4.2 0.6 4.6 13.2 (15)
Swire Properties 1972 HK N HK$ 21.35 23.80 11 16,101 5.8 3 1 1 (5) (13) (1) (3) 1 (2) 2 Dec-15 8 (1) 3 17.6 16.3 16.4 15.9 104 98 3.3 3.5 0.6 8.7 13.8 10
Sector Aggregate 2 155,854 4 8 2 3 (15) (0) 4 2 6 1 Dec-15 4 2 2 13.6 13.1 12.8 12.4 100 99 3.7 4.5 0.6 4.7 12.4 10
REITs Kelvin Tam/ Susanna Leung - 852 2101 6582/ 852 2101 6590
Champion REIT 2778 HK O HK$ 4.47 4.50 1 3,334 2.1 1 10 10 15 1 (3) 6 10 18 16 Dec-15 (61) 3 (2) 7.8 20.1 19.5 19.9 107 104 5.2 2.9 0.5 n.a. 20.0 27
Link REIT 823 HK N HK$ 55.50 52.80 (5) 16,049 35.3 5 9 18 20 23 1 5 18 22 38 Mar-16 5 9 7 26.7 25.4 23.3 21.8 100 101 4.0 3.8 0.9 n.a. 22.4 19
Spring REIT 1426 HK N HK$ 3.42 3.60 5 496 0.4 1 4 7 13 (2) (3) 0 7 16 13 Dec-15 (7) (1) (2) 13.4 14.5 14.6 15.0 98 97 7.4 4.1 0.6 n.a. 17.7 50
Sector Aggregate (4) 19,879 5 9 16 19 19 0 5 17 21 34 Dec-15 (21) 7 5 19.1 24.1 22.6 21.5 99 101 4.2 3.6 0.8 n.a. 22.0 22
Retailing Eva Wang - 852 2101 7365
Lifestyle Intl 1212 HK O HK$ 11.22 10.57 (6) 2,318 0.6 0 (0) 11 18 (5) (4) (4) 11 21 10 Dec-15 (12) 7 7 9.5 10.7 9.9 9.3 98 101 3.8 14.6 1.5 4.1 9.7 36
Sa Sa 178 HK U HK$ 3.22 1.60 (50) 1,201 0.9 4 22 27 23 (14) 0 18 27 26 1 Mar-15 (49) 10 15 10.9 21.5 19.4 16.9 112 120 5.6 18.3 4.1 1.1 13.6 (11)
Sector Aggregate (21) 3,518 2 7 17 20 (8) (2) 3 17 22 7 Dec-15 (12) 9 7 11.2 12.7 11.7 10.9 102 104 4.0 15.6 1.9 2.3 10.4 29
Technology Hardware Kyna Wong/ Randy Abrams/ Sam Li/ Thompson Wu - 852 2101 6950/ 886 2 2715 6366/ 852 2101 6775/ 886 2 2715 6386
ASM Pacific 522 HK O HK$ 56.70 75.00 32 2,968 5.3 (1) (3) (11) (7) (24) (5) (7) (11) (4) (9) Dec-14 (45) 9 26 12.4 22.3 20.5 16.2 107 91 2.5 13.2 2.9 1.8 11.4 5
FIH 2038 HK N HK$ 2.54 2.93 15 2,585 3.6 2 1 (22) (9) (39) (2) (3) (22) (6) (24) Dec-15 (61) 56 17 11.2 28.7 18.4 15.7 104 127 2.6 2.4 0.7 0.2 7.4 (41)
Lenovo Group 992 HK O HK$ 4.62 7.50 62 6,616 44.2 0 (6) (28) (41) (52) (4) (10) (28) (39) (36) Mar-16 315 41 n.a. n.m. 8.0 5.7 n.a. 116 138 4.4 26.9 2.1 0.1 3.1 (6)
Truly 732 HK O HK$ 3.86 4.20 9 1,447 3.5 8 7 47 108 41 3 2 49 111 59 Dec-15 14 26 9 13.3 11.7 9.3 8.5 103 122 2.6 12.9 1.4 0.8 5.5 57
Sector Aggregate 41 13,616 1 (3) (15) (12) (33) (3) (7) (15) (9) (18) Dec-15 123 76 13 34.3 15.4 8.7 12.0 102 126 3.7 9.9 1.5 0.2 5.0 (8)
Telecommunication Services Varun Ahuja - 65 6212 3017
HKBN 1310 HK O HK$ 8.64 11.50 33 1,120 2.8 7 (1) (8) (14) (0) 3 (5) (8) (11) 15 Aug-15 37 22 21 36.2 26.4 21.6 17.9 97 96 4.6 26.0 7.2 4.4 11.7 292
HKT Trust 6823 HK O HK$ 11.62 11.80 2 11,342 13.6 3 4 8 17 27 (1) (0) 8 20 42 Dec-14 24 18 0 27.5 22.2 18.7 18.7 100 106 4.7 10.4 2.3 3.5 10.0 86
HTHK 215 HK O HK$ 2.73 3.10 14 1,696 0.8 5 7 (2) 1 (20) 1 4 (2) 4 (5) Dec-15 (11) 11 5 14.4 16.1 14.6 13.8 93 99 4.6 7.0 1.1 1.1 6.2 25
PCCW 8 HK N HK$ 5.53 4.90 (11) 5,493 5.7 6 8 7 22 22 2 4 7 24 37 Dec-14 (32) (0) 1 12.3 18.1 18.2 18.0 100 91 4.5 22.1 4.0 1.9 6.4 257
Smartone 315 HK O HK$ 13.70 17.50 28 1,909 2.5 3 7 4 16 (4) (1) 3 4 19 11 Jun-15 (8) 15 2 15.4 16.7 14.5 14.2 102 111 4.5 21.8 3.5 0.7 4.7 (36)
Sector Aggregate 3 21,561 4 5 6 15 18 (0) 1 6 18 33 Dec-15 9 3 8 19.8 18.2 17.7 16.4 100 97 5.0 13.8 2.5 2.1 7.6 108
Transportation Isis Wong/ Jinsong Du - 852 2101 7109/ 852 2101 6589
Cathay Pacific 293 HK N HK$ 12.00 12.00 0 6,085 7.3 5 1 (10) (11) (37) 1 (3) (10) (8) (22) Dec-15 8 (1) 10 8.2 7.6 7.7 7.0 118 114 4.8 12.5 0.9 1.0 6.5 103
Kerry Logistics 636 HK O HK$ 10.28 13.10 27 2,246 1.2 3 (1) (6) (9) (13) (1) (5) (6) (6) 3 Dec-15 7 5 1 16.4 15.3 14.6 14.4 94 91 1.7 7.0 1.0 0.9 7.7 7
Sector Aggregate 7 8,331 5 0 (9) (10) (31) 1 (4) (9) (7) (15) Dec-15 8 (0) 9 9.5 8.8 8.8 8.1 113 110 3.9 11.1 0.9 1.0 6.7 77
Utilities Dave Dai - 852 2101 7358
CKI 1038 HK O HK$ 64.80 81.00 25 22,143 31.0 0 (11) (12) (10) 5 (4) (15) (12) (7) 20 Dec-15 (6) (1) 3 14.6 15.5 15.7 15.2 100 99 3.5 10.0 1.5 32.3 59.2 7
CLP 2 HK N HK$ 79.20 66.00 (17) 25,795 32.5 (1) 5 10 20 21 (5) 1 10 23 36 Dec-15 (26) 2 2 12.8 17.3 17.0 16.7 96 94 3.5 12.1 2.0 3.3 11.6 49
HKCG 3 HK U HK$ 13.98 11.09 (21) 22,919 19.1 (1) 3 3 1 (2) (5) (1) 4 4 13 Dec-15 (1) 5 7 24.4 24.5 23.3 21.9 98 99 2.5 13.4 3.2 7.1 18.8 36
HKE 2638 HK U HK$ 7.43 5.30 (29) 8,463 5.6 3 8 7 14 38 (1) 4 7 17 53 Dec-15 (9) (8) (2) 18.3 20.1 21.8 22.2 95 92 5.3 6.7 1.3 9.2 12.7 80
PAH 6 HK O HK$ 72.15 81.00 12 19,851 39.4 2 (5) (10) 1 2 (2) (9) (10) 4 17 Dec-15 (1) (1) 3 19.9 20.1 20.3 19.7 99 98 3.8 6.1 1.2 73.9 89.2 (46)
Sector Aggregate (4) 99,170 0 (1) (1) 5 10 (4) (5) (1) 8 25 Dec-15 (11) 0 3 16.7 18.9 18.8 18.2 98 97 3.5 9.4 1.7 6.8 18.6 14
Country Aggregate 21,322 22,403 5 672,049 4 4 (0) (3) (15) Dec-15 7 9 10 15.8 14.7 13.5 12.5 101 101 3.2 6.8 1.0 2.0 10.2 19
Note: Prices are as of 13 Jul 2016
* Country/ sector aggregates are for the coverage above
Source: Company data, Thomson Financial IBES, Credit Suisse estimates

Ju
mp
-Sta
rt 6
2
14 J
uly
201
6
India—valuation summary Wednesday, 13 July 2016
CS/ Cons. EV/ EV/ Net
Bberg Price Market 6M Last EPS D Yld ROE P/B Sales EBITDA Debt/Eq ticker View Ccy Local Target Upside cap ADTO Absolute performance (%) Relative performance (%) FYE EPS growth (%) PE (x) (%) (%) (%) (x) (x) (x) (%)
(%) (US$ m) 1w 1m 3m Ytd 12m 1w 1m 3m Ytd 12m T T+1 T+2 T+3 T T+1 T+2 T+3 T+1 T+2 T+1
Automobiles & Components Akshay Saxena/ Anantha Narayan/ Jatin Chawla - 91 22 6777 3825/ 91 22 6777 3730/ 91 22 6777 3719
Apollo Tyres APTY IN O Rs 156.10 190.00 22 1,182 5.9 (0) 5 (8) (0) (15) (3) 0 (16) (7) (14) Mar-15 (2) (8) 17 7.5 7.6 8.3 7.1 100 94 1.4 18.9 1.3 0.8 4.7 23
Ashok Leyland AL IN N Rs 93.55 96.00 3 3,962 18.4 1 (11) (15) 6 26 (1) (16) (24) (0) 27 Mar-15 232 44 15 79.5 24.0 16.6 14.5 100 106 1.2 20.1 4.5 1.5 13.1 29
Bajaj Auto BJAUT IN N Rs 2,652.15 2,420.00 (9) 11,420 10.6 1 3 3 5 6 (1) (3) (6) (2) 7 Mar-15 25 13 9 25.3 20.3 18.0 16.5 104 104 2.3 31.6 6.0 2.9 14.0 (78)
Bharat Forge BHFC IN N Rs 750.75 810.00 8 2,601 9.0 (2) 1 (9) (16) (32) (5) (5) (18) (22) (32) Mar-15 (9) 12 28 24.1 26.4 23.6 18.5 101 97 1.2 18.1 4.5 2.6 13.8 55
BKT BIL IN N Rs 663.30 700.00 6 954 0.4 (2) (2) 5 3 (2) (4) (7) (3) (4) (2) Mar-15 22 (23) 22 13.6 11.1 14.5 11.9 100 86 0.8 22.7 2.3 2.2 8.2 28
Bosch Ltd. BOS IN O Rs 23,375.90 24,500.00 5 10,922 6.2 4 8 17 25 (0) 1 3 8 19 0 Mar-15 21 23 27 70.6 58.6 47.6 37.4 100 99 0.4 16.1 8.9 6.7 37.7 (27)
Eicher Motors EIM IN N Rs 19,668.60 20,200.00 3 7,950 18.7 1 7 (1) 17 (5) (1) 1 (10) 10 (5) Mar-15 108 34 22 86.6 41.6 31.0 25.4 101 105 0.5 42.8 15.3 3.3 21.0 (43)
Exide Industries EXID IN O Rs 177.05 186.00 5 2,239 3.6 4 12 32 21 16 1 7 23 15 17 Mar-16 13 13 12 24.2 21.4 18.9 16.8 103 102 1.4 15.1 3.1 2.0 13.0 2
Hero Motocorp HMCL IN N Rs 3,243.75 2,590.00 (20) 9,639 18.4 4 7 3 20 23 2 1 (6) 14 23 Mar-15 23 8 8 25.5 20.7 19.1 17.7 100 98 2.3 43.2 8.1 2.2 13.8 (41)
Mahindra & Mahindra MM IN N Rs 1,473.15 1,390.00 (6) 13,616 20.3 1 9 11 16 16 (1) 3 2 9 16 Mar-15 4 10 15 30.3 29.2 26.5 23.0 101 88 0.9 15.2 4.2 2.2 20.2 (2)
Mahindra CIE MACA IN O Rs 186.95 250.00 34 900 0.7 2 (5) (10) (25) (21) (1) (11) (18) (32) (21) Dec-15 49 45 21 32.7 22.0 15.2 12.5 95 107 0.0 12.8 2.6 1.2 10.8 34
Maruti Suzuki MSIL IN O Rs 4,370.05 4,540.00 4 19,644 53.9 5 6 17 (5) 8 2 0 8 (12) 8 Mar-15 23 35 31 35.6 28.8 21.3 16.3 100 104 0.9 18.1 4.9 1.8 11.4 (112)
Motherson Sumi MSS IN U Rs 293.05 240.00 (18) 5,769 12.8 3 2 14 (0) (16) 0 (3) 5 (7) (16) Mar-15 24 27 21 37.7 30.5 24.0 19.8 98 95 1.7 35.5 10.1 1.1 13.1 65
Tata Motors TTMT IN N Rs 484.20 430.00 (11) 20,803 65.5 5 9 19 24 26 3 4 10 17 26 Mar-15 (4) 16 (3) 11.1 11.7 10.1 10.4 107 101 0.2 21.1 2.1 0.7 4.5 57
TVS TVSL IN U Rs 304.70 260.00 (15) 2,154 8.5 (1) 6 (7) 5 14 (3) 0 (15) (1) 15 Mar-15 23 39 28 41.6 33.9 24.4 19.1 97 93 0.7 23.7 7.4 1.4 19.7 44
WABCO WIL IN O Rs 5,758.90 6,400.00 11 1,625 0.6 (2) 1 (2) (5) 6 (4) (4) (10) (12) 6 Mar-15 74 52 26 90.5 52.1 34.3 27.1 103 120 0.2 21.9 10.4 5.8 33.7 (28)
Sector Aggregate (4) 115,382 3 6 10 11 10 1 0 1 5 10 Mar-15 13 18 12 24.7 22.0 18.6 16.6 103 100 1.0 21.7 4.3 1.4 9.8 4
Banks Ashish Gupta - 91 22 6777 3895
Axis Bank AXSB IN O Rs 560.85 592.00 6 19,926 73.7 4 6 27 25 (4) 2 0 19 18 (4) Mar-16 4 13 17 15.5 15.0 13.2 11.3 101 95 1.2 15.8 2.2 n.a. n.a. n.a.
BOB BOB IN N Rs 160.75 146.00 (9) 5,512 23.9 1 10 5 3 3 (2) 5 (3) (4) 4 Mar-16 128 123 43 n.m. 23.9 10.7 7.5 57 81 1.2 4.3 1.0 n.a. n.a. n.a.
BOI BOI IN U Rs 114.05 62.00 (46) 1,585 6.9 3 30 21 (1) (37) 1 25 12 (7) (37) Mar-16 114 101 44 n.m. 10.3 5.1 3.6 n.m. 136 1.5 3.5 0.4 n.a. n.a. n.a.
HDFC Bank HDFCB IN O Rs 1,199.60 1,470.00 23 45,254 25.4 3 4 11 11 10 1 (1) 2 4 10 Mar-16 23 24 24 24.7 20.1 16.2 13.1 101 102 1.0 19.2 3.6 n.a. n.a. n.a.
ICICI ICICIBC IN O Rs 261.55 308.00 18 22,641 71.9 7 7 9 0 (17) 4 2 (0) (6) (16) Mar-16 22 17 12 15.7 12.9 11.0 9.8 111 108 2.3 12.6 1.6 n.a. n.a. n.a.
IDFC Bank IDFCBK IN O Rs 52.15 59.00 13 2,635 3.3 13 11 (4) (14) n.a. 10 6 (12) (21) n.a. Mar-15 n.a. 112 33 n.a. 39.9 18.8 14.2 56 108 0.6 1.3 n.a. n.a. n.a.
IndusInd Bank IIB IN O Rs 1,124.40 1,301.00 16 9,968 22.4 2 1 14 16 22 (1) (4) 5 10 22 Mar-16 22 26 27 27.6 22.6 18.0 14.1 100 99 0.7 16.0 3.4 n.a. n.a. n.a.
IOB IOB IN U Rs 28.15 19.00 (33) 795 0.8 1 9 (8) (9) (27) (2) 4 (17) (16) (26) Mar-15 (171) 84 269 n.m. n.m. n.m. 23.5 477 1,373 0.0 (4.5) 0.3 n.a. n.a. n.a.
J&K Bank JKBK IN O Rs 70.30 77.00 10 507 1.5 1 9 19 (15) (32) (1) 3 11 (21) (32) Mar-16 72 18 33 8.2 4.8 4.0 3.0 118 105 5.0 10.7 0.5 n.a. n.a. n.a.
Kotak KMB IN N Rs 763.60 730.00 (4) 20,860 19.0 3 1 10 6 7 1 (4) 2 (0) 8 Mar-16 46 26 22 40.5 27.7 22.0 18.0 107 104 0.2 14.2 3.7 n.a. n.a. n.a.
PNB PNB IN U Rs 126.30 62.00 (51) 3,691 16.1 11 52 49 9 (13) 8 47 41 3 (12) Mar-16 221 29 35 n.m. 9.8 7.6 5.6 134 96 1.7 6.9 0.7 n.a. n.a. n.a.
SBI SBIN IN N Rs 226.45 185.00 (18) 26,159 79.6 2 12 18 1 (16) (1) 7 10 (6) (15) Mar-16 40 36 19 17.3 12.3 9.1 7.6 111 110 1.8 9.5 1.1 n.a. n.a. n.a.
UnionBank UNBK IN O Rs 137.85 145.00 5 1,410 10.2 2 16 5 (7) (21) (0) 11 (4) (14) (20) Mar-16 7 48 24 6.7 6.3 4.3 3.4 97 108 1.9 7.1 0.4 n.a. n.a. n.a.
Yes Bank YES IN N Rs 1,153.75 904.00 (22) 7,231 52.7 3 8 33 59 42 0 3 24 52 42 Mar-16 24 23 23 19.1 15.4 12.6 10.2 103 101 1.2 21.0 3.0 n.a. n.a. n.a.
Sector Aggregate 4 168,173 4 7 15 10 1 1 2 7 4 1 Mar-15 (47) 96 29 16.8 32.0 16.3 12.6 106 109 1.0 6.8 1.9 n.a. n.a. n.a.
Building Materials & Construction Anubhav Aggarwal - 91 22 6777 3808
ACC ACC IN N Rs 1,618.75 1,400.00 (14) 4,524 6.1 2 4 10 19 9 (0) (1) 2 13 10 Dec-14 (50) 68 48 26.2 51.9 30.9 20.9 79 101 1.2 7.0 3.6 2.4 24.3 (23)
Ambuja Cements ACEM IN N Rs 260.65 220.00 (16) 6,019 8.5 3 11 13 28 4 1 5 4 22 4 Dec-14 (46) 48 57 27.0 50.0 33.7 21.5 100 96 1.7 8.0 4.0 3.8 25.0 (45)
Dalmia DBEL IN U Rs 1,210.85 625.00 (48) 1,600 0.4 0 24 40 41 100 (2) 18 31 35 101 Mar-15 3,876 162 33 n.m. 81.1 30.9 23.3 64 88 0.1 3.9 3.1 2.8 13.0 230
JK Cem JKCE IN O Rs 705.45 715.00 1 734 0.3 1 16 6 20 14 (2) 10 (3) 14 15 Mar-15 (47) 212 69 34.8 65.0 20.9 12.4 75 105 0.3 4.9 3.1 2.1 13.9 167
JK Lakshmi JKLC IN O Rs 401.90 380.00 (5) 704 0.6 1 11 17 23 21 (1) 6 8 17 21 Mar-15 (128) 571 146 46.0 n.m. 35.4 14.4 n.m. 94 0.9 (2.2) 3.7 2.5 27.1 150
Ultratech Cement UTCEM IN N Rs 3,480.10 3,150.00 (9) 14,212 14.1 3 3 6 25 11 1 (3) (2) 18 11 Mar-15 9 40 36 45.5 41.8 29.8 22.0 100 102 0.3 11.6 4.6 3.9 21.5 19
Sector Aggregate (13) 27,793 3 6 11 25 15 0 1 2 19 15 Mar-15 (14) 57 41 39.8 46.0 29.2 21.0 94 101 0.8 9.1 4.1 3.3 20.3 22
Capital Goods Anantha Narayan/ Arnab Mitra/ Lokesh Garg - 91 22 6777 3730/ 91 22 6777 3806/ 91 22 6777 3743
BHEL BHEL IN U Rs 138.30 100.00 (28) 5,037 15.1 (1) 15 4 (18) (49) (3) 10 (5) (25) (49) Mar-16 223 23 1 n.m. 30.3 24.7 24.4 152 88 0.7 3.3 1.0 0.6 28.7 (45)
Cummins India KKC IN N Rs 816.05 875.00 7 3,366 4.1 (3) 2 (10) (21) (15) (5) (3) (19) (27) (14) Mar-15 10 7 13 32.5 29.5 27.5 24.3 105 95 1.7 25.3 7.1 4.7 28.7 (12)
Havells HAVL IN O Rs 357.05 400.00 12 3,320 8.8 (3) (0) 6 18 21 (6) (6) (3) 12 21 Mar-15 8 18 19 44.6 41.4 35.1 29.6 111 100 1.7 21.4 8.4 3.9 28.5 (32)
Kajaria Ceramics KJC IN O Rs 1,221.95 1,200.00 (2) 1,445 1.3 1 6 23 24 63 (2) 0 14 18 63 Mar-15 31 34 25 55.3 42.4 31.7 25.5 100 107 0.4 27.5 10.5 4.1 21.5 23
L&T LT IN O Rs 1,568.00 1,650.00 5 21,743 44.7 (0) 7 27 23 (16) (3) 2 18 16 (15) Mar-15 13 23 14 31.8 28.2 22.9 20.1 110 115 1.2 12.0 3.2 2.4 19.7 193
Thermax TMX IN U Rs 890.80 725.00 (19) 1,580 0.8 5 9 18 (1) (15) 2 4 9 (8) (14) Mar-15 6 (1) 16 41.0 38.5 38.9 33.5 100 90 0.7 12.3 4.5 1.9 23.6 (2)
Voltas VOLT IN O Rs 318.25 390.00 23 1,567 7.8 (2) (1) 12 (2) 2 (4) (7) 4 (8) 2 Mar-15 2 32 20 31.1 30.5 23.2 19.3 100 110 0.9 15.4 4.4 1.6 21.4 (50)
Sector Aggregate 1 38,058 (1) 7 18 11 (13) (3) 1 9 5 (13) Mar-15 (20) 55 16 32.0 39.8 25.6 22.1 109 114 1.1 7.3 2.8 2.2 26.6 89
Chemicals Arnab Mitra - 91 22 6777 3806
Asian Paints APNT IN N Rs 1,018.65 880.00 (14) 14,540 15.8 3 2 17 15 24 1 (3) 8 9 24 Mar-15 25 16 15 68.7 54.9 47.2 41.1 100 99 0.7 34.3 17.3 6.3 34.7 (4)
Conglomerates Anubhav Aggarwal - 91 22 6777 3808
Grasim Industries GRASIM IN O Rs 4,640.15 4,050.00 (13) 6,446 4.8 2 8 14 24 28 (0) 2 5 17 28 Mar-15 25 18 22 24.3 19.4 16.5 13.4 93 85 0.0 9.2 1.7 1.4 7.9 17

Ju
mp
-Sta
rt 6
3
14 J
uly
201
6
India—valuation summary (continued) Wednesday, 13 July 2016
CS/ Cons. EV/ EV/ Net
Bberg Price Market 6M Last EPS D Yld ROE P/B Sales EBITDA Debt/Eq ticker View Ccy Local Target Upside cap ADTO Absolute performance (%) Relative performance (%) FYE EPS growth (%) PE (x) (%) (%) (%) (x) (x) (x) (%)
(%) (US$ m) 1w 1m 3m Ytd 12m 1w 1m 3m Ytd 12m T T+1 T+2 T+3 T T+1 T+2 T+3 T+1 T+2 T+1
Consumer Durables & Apparel Arnab Mitra - 91 22 6777 3806
Page PAG IN U Rs 13,271.95 11,000.00 (17) 2,206 2.5 (4) (2) 3 (1) (9) (6) (8) (5) (7) (9) Mar-15 19 22 23 75.5 63.7 52.0 42.2 100 100 0.7 52.2 29.4 8.4 39.0 20
TTK Prestige TTKPT IN N Rs 4,700.45 4,340.00 (8) 814 0.4 1 5 3 (0) 20 (1) (0) (5) (7) 21 Mar-15 26 36 23 59.3 47.1 34.7 28.1 98 101 0.5 16.9 7.5 3.5 29.4 (13)
Sector Aggregate (15) 3,020 (2) (0) 3 (0) (1) (5) (6) (5) (7) (1) Mar-15 21 27 23 70.4 58.1 45.9 37.2 99 100 0.6 30.8 16.5 6.1 35.9 1
Consumer Staples Anantha Narayan/ Arnab Mitra - 91 22 6777 3730/ 91 22 6777 3806
Colgate CLGT IN N Rs 932.35 900.00 (3) 3,774 4.6 (1) 8 12 (4) (7) (3) 2 3 (10) (7) Mar-15 6 10 13 45.4 43.0 39.2 34.6 97 99 1.7 73.2 30.1 6.1 27.7 (49)
Dabur DABUR IN N Rs 314.05 280.00 (11) 8,232 6.1 2 4 18 14 6 (0) (2) 9 7 7 Mar-15 17 15 14 51.7 44.2 38.6 33.8 100 100 0.7 33.4 13.4 6.5 36.4 (10)
Emami HMN IN O Rs 1,122.70 1,210.00 8 3,792 3.3 (0) 12 15 12 (2) (3) 6 6 6 (2) Mar-15 18 22 21 52.5 44.4 36.4 30.1 160 117 0.6 43.3 17.9 9.9 37.9 36
GCPL GCPL IN O Rs 1,618.80 1,550.00 (4) 8,203 5.8 (2) 9 18 23 35 (5) 3 9 16 35 Mar-15 26 24 20 60.0 47.8 38.5 32.0 101 105 0.5 24.5 10.8 6.2 34.8 20
GSK Consumer SKB IN O Rs 6,205.70 6,550.00 6 3,884 1.8 1 10 3 (3) (1) (1) 5 (5) (10) (0) Mar-15 18 16 16 44.7 38.0 32.9 28.4 100 104 1.0 30.0 10.6 5.8 28.6 (94)
Hindustan Unilever HUVR IN O Rs 922.90 930.00 1 29,723 19.3 4 6 3 7 (0) 1 0 (6) 0 (0) Mar-15 (5) 19 16 46.3 48.6 40.9 35.3 100 104 1.5 103.4 47.3 6.2 34.2 (82)
ITC ITC IN O Rs 248.05 273.33 10 44,590 43.9 2 6 13 14 20 (0) 1 4 8 20 Mar-15 2 11 13 31.0 30.3 27.2 24.1 101 101 2.3 31.1 9.1 7.9 21.0 (33)
Kaveri KSCL IN O Rs 440.05 650.00 48 452 4.9 (1) (3) 10 25 (40) (3) (8) 1 19 (39) Mar-15 (34) 23 25 10.1 15.1 12.3 9.8 116 110 1.7 24.3 3.4 3.0 12.0 (51)
Marico MRCO IN N Rs 273.15 275.00 1 5,244 5.7 1 8 9 21 24 (2) 3 0 14 25 Mar-15 19 21 18 57.9 48.5 40.1 34.0 100 104 0.5 34.8 15.0 5.7 32.5 (12)
Nestle NEST IN N Rs 6,422.75 5,800.00 (10) 9,215 4.0 (2) (2) 5 10 8 (4) (7) (3) 4 8 Dec-15 126 20 19 n.m. 48.6 40.7 34.1 104 101 1.6 44.5 21.4 6.1 27.8 (28)
United Spirits UNSP IN O Rs 2,546.10 2,750.00 8 5,506 14.2 (5) 4 7 (15) (27) (8) (1) (1) (21) (26) Mar-15 137 55 46 n.m. n.m. 74.0 50.6 182 89 0.0 26.1 20.5 4.6 44.9 247
Sector Aggregate 3 122,615 1 6 10 11 10 (1) 0 1 4 10 Mar-15 8 18 16 44.1 40.7 34.5 29.8 100 102 1.5 36.4 14.0 6.7 27.9 (21)
Diversified Financials Ashish Gupta/ Sunil Tirumalai - 91 22 6777 3895/ 91 22 6777 3714
Bajaj Finance BAF IN U Rs 8,625.35 5,500.00 (36) 6,915 11.6 6 15 16 43 70 3 10 8 37 70 Mar-16 37 24 26 36.1 26.3 21.2 16.8 107 103 0.3 21.4 5.1 n.a. n.a. n.a.
Bharat Financial SKSM IN N Rs 778.65 660.00 (15) 1,478 15.5 2 16 39 56 53 (1) 11 31 50 54 Mar-16 136 14 1 32.7 13.8 12.1 12.0 144 130 0.0 41.2 4.7 n.a. n.a. n.a.
HDFC HDFC IN O Rs 1,332.75 1,501.00 13 31,376 55.6 6 10 20 6 1 3 5 11 (1) 2 Mar-16 35 1 17 31.0 23.0 22.8 19.5 121 108 1.8 25.5 5.6 n.a. n.a. n.a.
IDFC IDFC IN O Rs 53.15 82.00 54 1,261 3.7 7 8 22 10 (30) 4 3 13 4 (29) Mar-15 (115) 383 25 4.8 n.m. 11.5 9.2 n.m. 82 5.6 (1.6) 0.5 n.a. n.a. n.a.
Indiabulls Housing IHFL IN O Rs 743.35 800.00 8 4,661 16.2 9 7 19 1 16 7 1 10 (6) 17 Mar-16 21 24 27 12.3 10.1 8.1 6.4 108 112 4.7 27.2 2.6 n.a. n.a. n.a.
LIC Housing Finance LICHF IN O Rs 520.85 625.00 20 3,912 16.0 5 11 8 2 13 2 5 (0) (4) 14 Mar-16 38 28 23 15.7 11.3 8.9 7.2 118 128 1.5 22.8 2.4 n.a. n.a. n.a.
MMFSL MMFS IN O Rs 356.75 410.00 15 3,019 7.3 1 9 31 47 28 (2) 4 23 41 29 Mar-16 69 36 32 26.3 15.5 11.4 8.7 146 155 1.4 18.7 2.7 n.a. n.a. n.a.
Shriram City SCUF IN O Rs 1,792.05 1,880.00 5 1,758 1.0 3 6 16 12 7 0 1 7 5 7 Mar-16 43 31 43 21.4 14.9 11.4 8.0 122 135 1.4 16.0 2.2 n.a. n.a. n.a.
Shriram Transport SHTF IN O Rs 1,299.40 1,500.00 15 4,387 9.8 6 12 31 52 43 3 7 23 45 44 Mar-16 43 53 27 24.9 17.4 11.4 9.0 104 130 0.8 15.7 2.6 n.a. n.a. n.a.
Sector Aggregate 7 58,767 6 11 20 17 17 3 5 12 10 17 Mar-15 (2) 45 18 26.0 26.6 18.3 15.6 89 116 1.6 15.6 3.9 n.a. n.a. n.a.
Energy Badrinath Srinivasan/ David Hewitt - 91 22 6777 3698/ 65 6212 3064
BPCL BPCL IN O Rs 1,120.10 1,200.00 7 24,105 21.5 2 11 21 25 21 (0) 6 12 19 21 Mar-15 66 (8) 18 16.9 10.2 11.0 9.4 100 98 3.4 31.7 2.9 1.0 12.6 66
Cairn CAIR IN N Rs 162.55 130.00 (20) 4,535 7.7 9 16 5 18 (5) 7 11 (4) 11 (4) Mar-15 (68) 23 82 6.8 21.2 17.2 9.4 67 111 5.5 2.5 0.5 1.3 3.5 (30)
GAIL GAIL IN U Rs 378.45 295.00 (22) 7,144 9.0 (2) 2 3 1 1 (5) (3) (6) (6) 2 Mar-15 (29) 29 43 15.3 21.5 16.7 11.6 99 85 1.3 6.4 1.4 1.2 10.6 39
GSPL GUJS IN O Rs 133.95 165.00 23 1,123 0.8 (1) (0) (2) (2) 7 (3) (5) (11) (8) 8 Mar-15 8 46 13 18.4 17.0 11.6 10.2 100 116 0.8 11.6 1.9 7.3 8.4 3
HPCL HPCL IN O Rs 1,065.55 1,090.00 2 5,369 15.6 3 19 25 27 26 1 13 17 21 26 Mar-15 238 (23) 9 24.1 7.1 9.2 8.4 103 97 4.0 32.1 2.1 0.4 6.0 181
IOCL IOCL IN O Rs 476.55 530.00 11 17,218 9.1 (0) 15 14 11 9 (2) 9 6 5 9 Mar-15 128 24 11 23.6 10.3 8.3 7.5 114 107 3.5 15.5 1.5 0.5 6.7 45
OILI OINL IN N Rs 365.75 345.00 (6) 3,272 2.2 (2) 4 14 (3) (17) (4) (1) 6 (10) (16) Mar-15 (23) (4) 47 8.4 11.0 11.5 7.8 79 85 2.7 9.0 1.0 2.3 7.5 1
ONGC ONGC IN N Rs 227.75 220.00 (3) 28,996 16.3 (1) 7 7 (6) (21) (3) 1 (2) (12) (21) Mar-15 (23) 2 77 10.6 13.8 13.5 7.6 70 88 2.2 7.7 1.0 1.7 5.8 23
Petronet LNG PLNG IN O Rs 294.65 305.00 4 3,289 5.7 (0) 8 14 16 52 (3) 2 5 9 52 Mar-15 4 33 50 25.0 24.2 18.2 12.2 98 103 0.8 15.2 3.5 0.8 13.8 (3)
RIL RIL IN N Rs 1,002.10 1,075.00 7 48,356 58.4 1 2 (6) (1) 0 (1) (3) (15) (8) 1 Mar-15 17 (29) 6 13.8 11.7 16.5 15.6 92 68 1.0 12.0 1.3 1.7 10.4 55
Sector Aggregate 3 143,406 1 7 7 6 2 (2) 2 (2) (1) 3 Mar-15 17 (7) 28 13.9 11.9 12.8 10.0 91 87 2.2 11.2 1.4 1.0 8.2 38
Healthcare Anubhav Aggarwal/ Chunky Shah - 91 22 6777 3808/ 91 22 6777 3872
Apollo Hospitals APHS IN N Rs 1,378.70 1,260.00 (9) 2,854 4.7 2 5 2 (6) 2 0 (1) (6) (13) 3 Mar-15 (5) 24 26 56.4 59.6 48.0 38.1 107 95 0.4 10.6 6.0 3.5 27.1 56
Aurobindo ARBP IN O Rs 778.85 950.00 22 6,782 25.3 1 4 (1) (11) 3 (1) (1) (9) (18) 4 Mar-15 31 24 20 28.9 22.1 17.8 14.9 104 102 0.4 33.5 6.4 3.6 16.7 54
Cadila CDH IN O Rs 371.25 405.00 9 5,656 5.4 11 16 16 13 (3) 9 11 7 7 (3) Mar-16 4 32 18 25.0 24.1 18.2 15.4 97 105 1.0 26.6 5.8 3.7 18.9 12
Cipla CIPLA IN O Rs 516.20 565.00 9 6,173 16.7 2 10 1 (21) (22) (1) 5 (8) (27) (22) Mar-15 27 6 27 35.1 27.5 25.9 20.4 100 91 0.6 13.1 3.4 3.3 18.3 35
Dr. Reddy DRRD IN N Rs 3,591.30 3,070.00 (15) 9,114 20.3 4 16 16 16 (5) 2 11 7 9 (5) Mar-15 3 6 36 31.4 30.4 28.7 21.1 101 90 0.5 16.7 4.8 3.9 15.3 (12)
Glenmark GNP IN N Rs 839.20 840.00 0 3,524 8.4 2 9 8 (9) (20) (1) 4 (1) (16) (20) Mar-15 42 47 27 47.7 33.5 22.7 17.9 98 79 0.3 19.3 5.4 3.4 16.1 54
IPCA IPCA IN O Rs 469.40 640.00 36 882 2.9 (2) 2 (5) (37) (32) (5) (3) (14) (43) (32) Mar-15 (33) 82 39 25.1 37.2 20.4 14.7 171 95 0.3 4.4 2.6 2.4 18.8 34
Lupin LPC IN O Rs 1,672.05 1,905.00 14 11,219 44.2 7 15 8 (9) (13) 5 10 (0) (16) (12) Mar-15 (6) 38 23 31.2 33.0 23.9 19.3 101 107 0.4 22.9 6.8 5.7 21.9 57
Strides STR IN O Rs 1,182.85 1,420.00 20 1,573 7.5 2 7 7 (8) (5) 0 1 (1) (15) (5) Mar-15 71 111 27 68.2 39.9 19.0 15.0 107 105 0.3 12.0 3.3 4.0 22.5 66
Sun Pharma SUNP IN O Rs 783.75 880.00 12 28,070 43.4 1 5 (6) (4) (15) (1) (0) (14) (11) (14) Mar-15 19 42 20 41.5 34.9 24.6 20.5 100 106 0.3 18.7 6.0 6.4 22.2 (34)
Taro Pharma TARO US O US$ 142.14 190.00 34 6,088 31.5 (2) (2) 1 (8) (1) (4) (5) (3) (13) (3) Mar-15 12 2 (4) 12.6 11.3 11.0 11.5 100 100 0.0 32.4 3.2 5.1 7.7 (63)
Torrent TRP IN O Rs 1,442.30 1,500.00 4 3,632 3.7 3 8 (2) (1) 9 1 2 (11) (7) 9 Mar-15 133 (33) 16 32.5 13.9 20.7 17.9 94 95 2.1 56.4 6.6 3.9 9.9 30
Sector Aggregate 10 85,566 3 8 2 (4) (9) 1 3 (6) (11) (9) Mar-15 21 21 21 32.4 26.7 22.1 18.3 100 100 0.5 21.8 5.3 4.6 17.4 2
Hotels, Restaurants & Leisure Arnab Mitra - 91 22 6777 3806
Jubilant Foodworks JUBI IN O Rs 1,175.10 1,250.00 6 1,151 11.0 (5) 13 (7) (21) (37) (7) 8 (15) (27) (37) Mar-15 (7) 20 37 62.5 67.3 55.9 40.8 101 93 0.0 15.7 9.8 3.2 27.1 1
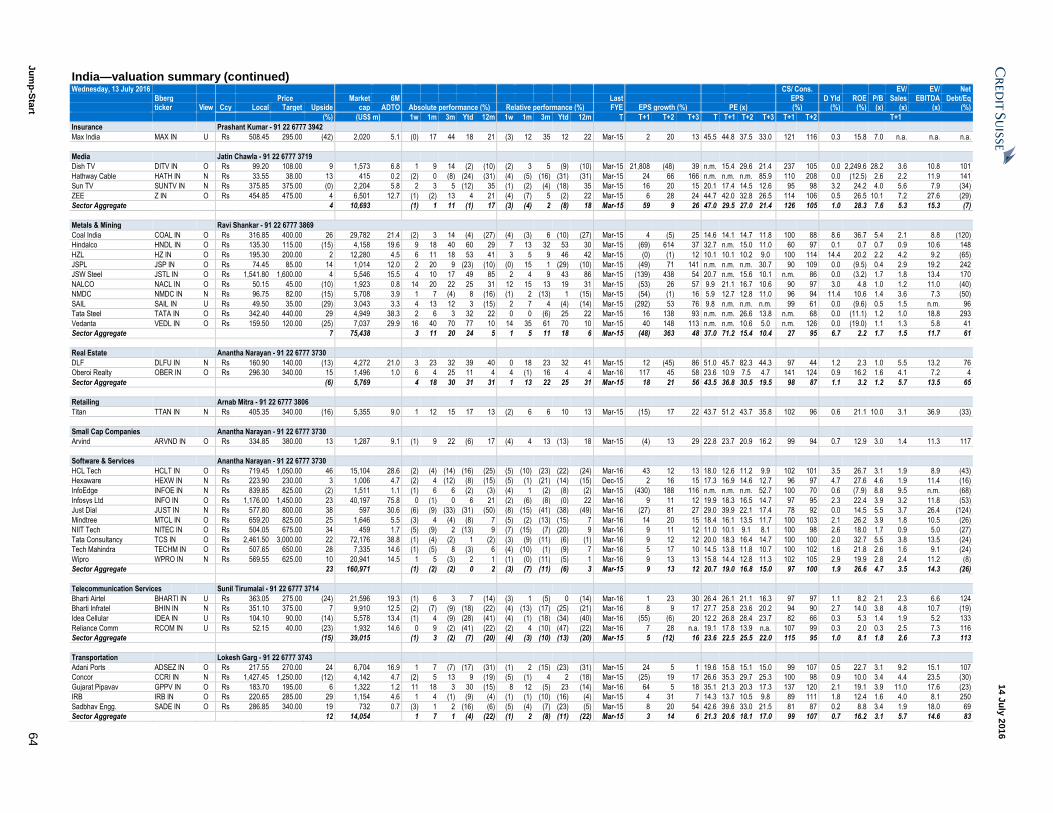
Ju
mp
-Sta
rt 6
4
14 J
uly
201
6
India—valuation summary (continued) Wednesday, 13 July 2016
CS/ Cons. EV/ EV/ Net
Bberg Price Market 6M Last EPS D Yld ROE P/B Sales EBITDA Debt/Eq ticker View Ccy Local Target Upside cap ADTO Absolute performance (%) Relative performance (%) FYE EPS growth (%) PE (x) (%) (%) (%) (x) (x) (x) (%)
(%) (US$ m) 1w 1m 3m Ytd 12m 1w 1m 3m Ytd 12m T T+1 T+2 T+3 T T+1 T+2 T+3 T+1 T+2 T+1
Insurance Prashant Kumar - 91 22 6777 3942
Max India MAX IN U Rs 508.45 295.00 (42) 2,020 5.1 (0) 17 44 18 21 (3) 12 35 12 22 Mar-15 2 20 13 45.5 44.8 37.5 33.0 121 116 0.3 15.8 7.0 n.a. n.a. n.a.
Media Jatin Chawla - 91 22 6777 3719
Dish TV DITV IN O Rs 99.20 108.00 9 1,573 6.8 1 9 14 (2) (10) (2) 3 5 (9) (10) Mar-15 21,808 (48) 39 n.m. 15.4 29.6 21.4 237 105 0.0 2,249.6 28.2 3.6 10.8 101
Hathway Cable HATH IN N Rs 33.55 38.00 13 415 0.2 (2) 0 (8) (24) (31) (4) (5) (16) (31) (31) Mar-15 24 66 166 n.m. n.m. n.m. 85.9 110 208 0.0 (12.5) 2.6 2.2 11.9 141
Sun TV SUNTV IN N Rs 375.85 375.00 (0) 2,204 5.8 2 3 5 (12) 35 (1) (2) (4) (18) 35 Mar-15 16 20 15 20.1 17.4 14.5 12.6 95 98 3.2 24.2 4.0 5.6 7.9 (34)
ZEE Z IN O Rs 454.85 475.00 4 6,501 12.7 (1) (2) 13 4 21 (4) (7) 5 (2) 22 Mar-15 6 28 24 44.7 42.0 32.8 26.5 114 106 0.5 26.5 10.1 7.2 27.6 (29)
Sector Aggregate 4 10,693 (1) 1 11 (1) 17 (3) (4) 2 (8) 18 Mar-15 59 9 26 47.0 29.5 27.0 21.4 126 105 1.0 28.3 7.6 5.3 15.3 (7)
Metals & Mining Ravi Shankar - 91 22 6777 3869
Coal India COAL IN O Rs 316.85 400.00 26 29,782 21.4 (2) 3 14 (4) (27) (4) (3) 6 (10) (27) Mar-15 4 (5) 25 14.6 14.1 14.7 11.8 100 88 8.6 36.7 5.4 2.1 8.8 (120)
Hindalco HNDL IN O Rs 135.30 115.00 (15) 4,158 19.6 9 18 40 60 29 7 13 32 53 30 Mar-15 (69) 614 37 32.7 n.m. 15.0 11.0 60 97 0.1 0.7 0.7 0.9 10.6 148
HZL HZ IN O Rs 195.30 200.00 2 12,280 4.5 6 11 18 53 41 3 5 9 46 42 Mar-15 (0) (1) 12 10.1 10.1 10.2 9.0 100 114 14.4 20.2 2.2 4.2 9.2 (65)
JSPL JSP IN O Rs 74.45 85.00 14 1,014 12.0 2 20 9 (23) (10) (0) 15 1 (29) (10) Mar-15 (49) 71 141 n.m. n.m. n.m. 30.7 90 109 0.0 (9.5) 0.4 2.9 19.2 242
JSW Steel JSTL IN O Rs 1,541.80 1,600.00 4 5,546 15.5 4 10 17 49 85 2 4 9 43 86 Mar-15 (139) 438 54 20.7 n.m. 15.6 10.1 n.m. 86 0.0 (3.2) 1.7 1.8 13.4 170
NALCO NACL IN O Rs 50.15 45.00 (10) 1,923 0.8 14 20 22 25 31 12 15 13 19 31 Mar-15 (53) 26 57 9.9 21.1 16.7 10.6 90 97 3.0 4.8 1.0 1.2 11.0 (40)
NMDC NMDC IN N Rs 96.75 82.00 (15) 5,708 3.9 1 7 (4) 8 (16) (1) 2 (13) 1 (15) Mar-15 (54) (1) 16 5.9 12.7 12.8 11.0 96 94 11.4 10.6 1.4 3.6 7.3 (50)
SAIL SAIL IN U Rs 49.50 35.00 (29) 3,043 3.3 4 13 12 3 (15) 2 7 4 (4) (14) Mar-15 (292) 53 76 9.8 n.m. n.m. n.m. 99 61 0.0 (9.6) 0.5 1.5 n.m. 96
Tata Steel TATA IN O Rs 342.40 440.00 29 4,949 38.3 2 6 3 32 22 0 0 (6) 25 22 Mar-15 16 138 93 n.m. n.m. 26.6 13.8 n.m. 68 0.0 (11.1) 1.2 1.0 18.8 293
Vedanta VEDL IN O Rs 159.50 120.00 (25) 7,037 29.9 16 40 70 77 10 14 35 61 70 10 Mar-15 40 148 113 n.m. n.m. 10.6 5.0 n.m. 126 0.0 (19.0) 1.1 1.3 5.8 41
Sector Aggregate 7 75,438 3 11 20 24 5 1 5 11 18 6 Mar-15 (48) 363 48 37.0 71.2 15.4 10.4 27 95 6.7 2.2 1.7 1.5 11.7 61
Real Estate Anantha Narayan - 91 22 6777 3730
DLF DLFU IN N Rs 160.90 140.00 (13) 4,272 21.0 3 23 32 39 40 0 18 23 32 41 Mar-15 12 (45) 86 51.0 45.7 82.3 44.3 97 44 1.2 2.3 1.0 5.5 13.2 76
Oberoi Realty OBER IN O Rs 296.30 340.00 15 1,496 1.0 6 4 25 11 4 4 (1) 16 4 4 Mar-16 117 45 58 23.6 10.9 7.5 4.7 141 124 0.9 16.2 1.6 4.1 7.2 4
Sector Aggregate (6) 5,769 4 18 30 31 31 1 13 22 25 31 Mar-15 18 21 56 43.5 36.8 30.5 19.5 98 87 1.1 3.2 1.2 5.7 13.5 65
Retailing Arnab Mitra - 91 22 6777 3806
Titan TTAN IN N Rs 405.35 340.00 (16) 5,355 9.0 1 12 15 17 13 (2) 6 6 10 13 Mar-15 (15) 17 22 43.7 51.2 43.7 35.8 102 96 0.6 21.1 10.0 3.1 36.9 (33)
Small Cap Companies Anantha Narayan - 91 22 6777 3730
Arvind ARVND IN O Rs 334.85 380.00 13 1,287 9.1 (1) 9 22 (6) 17 (4) 4 13 (13) 18 Mar-15 (4) 13 29 22.8 23.7 20.9 16.2 99 94 0.7 12.9 3.0 1.4 11.3 117
Software & Services Anantha Narayan - 91 22 6777 3730
HCL Tech HCLT IN O Rs 719.45 1,050.00 46 15,104 28.6 (2) (4) (14) (16) (25) (5) (10) (23) (22) (24) Mar-16 43 12 13 18.0 12.6 11.2 9.9 102 101 3.5 26.7 3.1 1.9 8.9 (43)
Hexaware HEXW IN N Rs 223.90 230.00 3 1,006 4.7 (2) 4 (12) (8) (15) (5) (1) (21) (14) (15) Dec-15 2 16 15 17.3 16.9 14.6 12.7 96 97 4.7 27.6 4.6 1.9 11.4 (16)
InfoEdge INFOE IN N Rs 839.85 825.00 (2) 1,511 1.1 (1) 6 6 (2) (3) (4) 1 (2) (8) (2) Mar-15 (430) 188 116 n.m. n.m. n.m. 52.7 100 70 0.6 (7.9) 8.8 9.5 n.m. (68)
Infosys Ltd INFO IN O Rs 1,176.00 1,450.00 23 40,197 75.8 0 (1) 0 6 21 (2) (6) (8) (0) 22 Mar-16 9 11 12 19.9 18.3 16.5 14.7 97 95 2.3 22.4 3.9 3.2 11.8 (53)
Just Dial JUST IN N Rs 577.80 800.00 38 597 30.6 (6) (9) (33) (31) (50) (8) (15) (41) (38) (49) Mar-16 (27) 81 27 29.0 39.9 22.1 17.4 78 92 0.0 14.5 5.5 3.7 26.4 (124)
Mindtree MTCL IN O Rs 659.20 825.00 25 1,646 5.5 (3) 4 (4) (8) 7 (5) (2) (13) (15) 7 Mar-16 14 20 15 18.4 16.1 13.5 11.7 100 103 2.1 26.2 3.9 1.8 10.5 (26)
NIIT Tech NITEC IN O Rs 504.05 675.00 34 459 1.7 (5) (9) 2 (13) 9 (7) (15) (7) (20) 9 Mar-16 9 11 12 11.0 10.1 9.1 8.1 100 98 2.6 18.0 1.7 0.9 5.0 (27)
Tata Consultancy TCS IN O Rs 2,461.50 3,000.00 22 72,176 38.8 (1) (4) (2) 1 (2) (3) (9) (11) (6) (1) Mar-16 9 12 12 20.0 18.3 16.4 14.7 100 100 2.0 32.7 5.5 3.8 13.5 (24)
Tech Mahindra TECHM IN O Rs 507.65 650.00 28 7,335 14.6 (1) (5) 8 (3) 6 (4) (10) (1) (9) 7 Mar-16 5 17 10 14.5 13.8 11.8 10.7 100 102 1.6 21.8 2.6 1.6 9.1 (24)
Wipro WPRO IN N Rs 569.55 625.00 10 20,941 14.5 1 5 (3) 2 1 (1) (0) (11) (5) 1 Mar-16 9 13 13 15.8 14.4 12.8 11.3 102 105 2.9 19.9 2.8 2.4 11.2 (8)
Sector Aggregate 23 160,971 (1) (2) (2) 0 2 (3) (7) (11) (6) 3 Mar-15 9 13 12 20.7 19.0 16.8 15.0 97 100 1.9 26.6 4.7 3.5 14.3 (26)
Telecommunication Services Sunil Tirumalai - 91 22 6777 3714
Bharti Airtel BHARTI IN U Rs 363.05 275.00 (24) 21,596 19.3 (1) 6 3 7 (14) (3) 1 (5) 0 (14) Mar-16 1 23 30 26.4 26.1 21.1 16.3 97 97 1.1 8.2 2.1 2.3 6.6 124
Bharti Infratel BHIN IN N Rs 351.10 375.00 7 9,910 12.5 (2) (7) (9) (18) (22) (4) (13) (17) (25) (21) Mar-16 8 9 17 27.7 25.8 23.6 20.2 94 90 2.7 14.0 3.8 4.8 10.7 (19)
Idea Cellular IDEA IN U Rs 104.10 90.00 (14) 5,578 13.4 (1) 4 (9) (28) (41) (4) (1) (18) (34) (40) Mar-16 (55) (6) 20 12.2 26.8 28.4 23.7 82 66 0.3 5.3 1.4 1.9 5.2 133
Reliance Comm RCOM IN U Rs 52.15 40.00 (23) 1,932 14.6 0 9 (2) (41) (22) (2) 4 (10) (47) (22) Mar-16 7 28 n.a. 19.1 17.8 13.9 n.a. 107 99 0.3 2.0 0.3 2.5 7.3 116
Sector Aggregate (15) 39,015 (1) 3 (2) (7) (20) (4) (3) (10) (13) (20) Mar-15 5 (12) 16 23.6 22.5 25.5 22.0 115 95 1.0 8.1 1.8 2.6 7.3 113
Transportation Lokesh Garg - 91 22 6777 3743
Adani Ports ADSEZ IN O Rs 217.55 270.00 24 6,704 16.9 1 7 (7) (17) (31) (1) 2 (15) (23) (31) Mar-15 24 5 1 19.6 15.8 15.1 15.0 99 107 0.5 22.7 3.1 9.2 15.1 107
Concor CCRI IN N Rs 1,427.45 1,250.00 (12) 4,142 4.7 (2) 5 13 9 (19) (5) (1) 4 2 (18) Mar-15 (25) 19 17 26.6 35.3 29.7 25.3 100 98 0.9 10.0 3.4 4.4 23.5 (30)
Gujarat Pipavav GPPV IN O Rs 183.70 195.00 6 1,322 1.2 11 18 3 30 (15) 8 12 (5) 23 (14) Mar-16 64 5 18 35.1 21.3 20.3 17.3 137 120 2.1 19.1 3.9 11.0 17.6 (23)
IRB IRB IN O Rs 220.65 285.00 29 1,154 4.6 1 4 (1) (9) (4) (1) (1) (10) (16) (4) Mar-15 4 31 7 14.3 13.7 10.5 9.8 89 111 1.8 12.4 1.6 4.0 8.1 250
Sadbhav Engg. SADE IN O Rs 286.85 340.00 19 732 0.7 (3) 1 2 (16) (6) (5) (4) (7) (23) (5) Mar-15 8 20 54 42.6 39.6 33.0 21.5 81 87 0.2 8.8 3.4 1.9 18.0 69
Sector Aggregate 12 14,054 1 7 1 (4) (22) (1) 2 (8) (11) (22) Mar-15 3 14 6 21.3 20.6 18.1 17.0 99 107 0.7 16.2 3.1 5.7 14.6 83
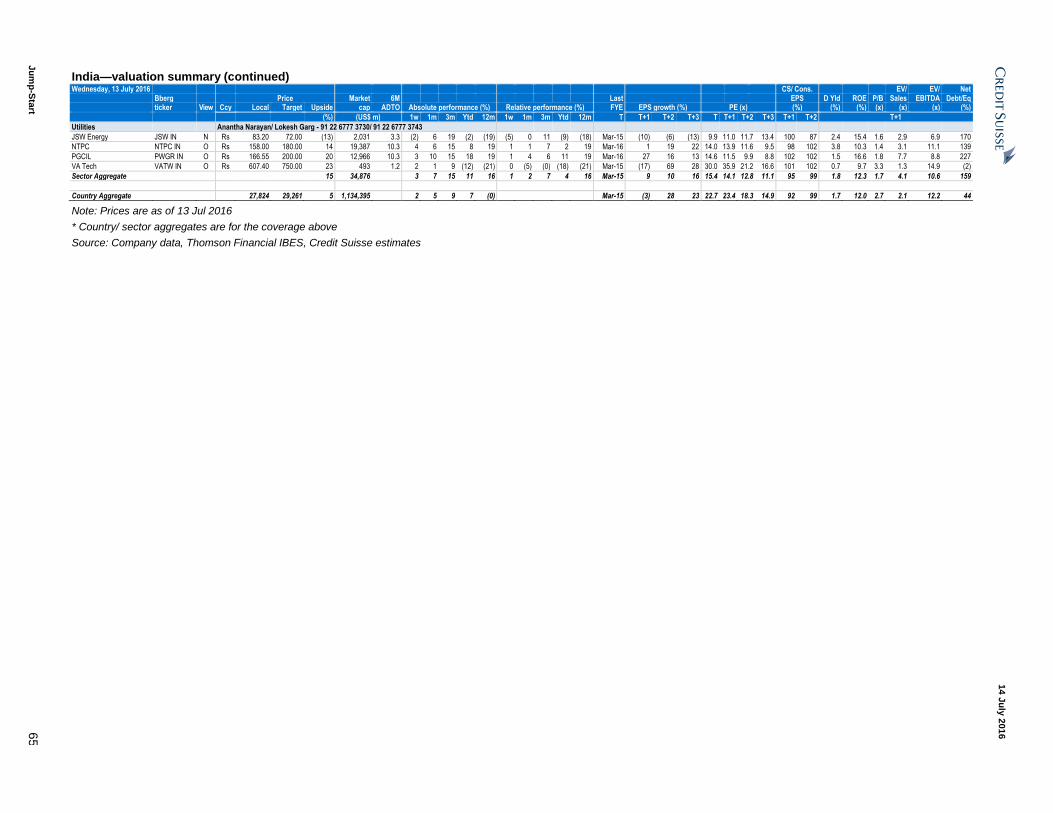
Ju
mp
-Sta
rt 6
5
14 J
uly
201
6
India—valuation summary (continued) Wednesday, 13 July 2016
CS/ Cons. EV/ EV/ Net
Bberg Price Market 6M Last EPS D Yld ROE P/B Sales EBITDA Debt/Eq ticker View Ccy Local Target Upside cap ADTO Absolute performance (%) Relative performance (%) FYE EPS growth (%) PE (x) (%) (%) (%) (x) (x) (x) (%)
(%) (US$ m) 1w 1m 3m Ytd 12m 1w 1m 3m Ytd 12m T T+1 T+2 T+3 T T+1 T+2 T+3 T+1 T+2 T+1
Utilities Anantha Narayan/ Lokesh Garg - 91 22 6777 3730/ 91 22 6777 3743
JSW Energy JSW IN N Rs 83.20 72.00 (13) 2,031 3.3 (2) 6 19 (2) (19) (5) 0 11 (9) (18) Mar-15 (10) (6) (13) 9.9 11.0 11.7 13.4 100 87 2.4 15.4 1.6 2.9 6.9 170
NTPC NTPC IN O Rs 158.00 180.00 14 19,387 10.3 4 6 15 8 19 1 1 7 2 19 Mar-16 1 19 22 14.0 13.9 11.6 9.5 98 102 3.8 10.3 1.4 3.1 11.1 139
PGCIL PWGR IN O Rs 166.55 200.00 20 12,966 10.3 3 10 15 18 19 1 4 6 11 19 Mar-16 27 16 13 14.6 11.5 9.9 8.8 102 102 1.5 16.6 1.8 7.7 8.8 227
VA Tech VATW IN O Rs 607.40 750.00 23 493 1.2 2 1 9 (12) (21) 0 (5) (0) (18) (21) Mar-15 (17) 69 28 30.0 35.9 21.2 16.6 101 102 0.7 9.7 3.3 1.3 14.9 (2)
Sector Aggregate 15 34,876 3 7 15 11 16 1 2 7 4 16 Mar-15 9 10 16 15.4 14.1 12.8 11.1 95 99 1.8 12.3 1.7 4.1 10.6 159
Country Aggregate 27,824 29,261 5 1,134,395 2 5 9 7 (0) Mar-15 (3) 28 23 22.7 23.4 18.3 14.9 92 99 1.7 12.0 2.7 2.1 12.2 44
Note: Prices are as of 13 Jul 2016
* Country/ sector aggregates are for the coverage above
Source: Company data, Thomson Financial IBES, Credit Suisse estimates
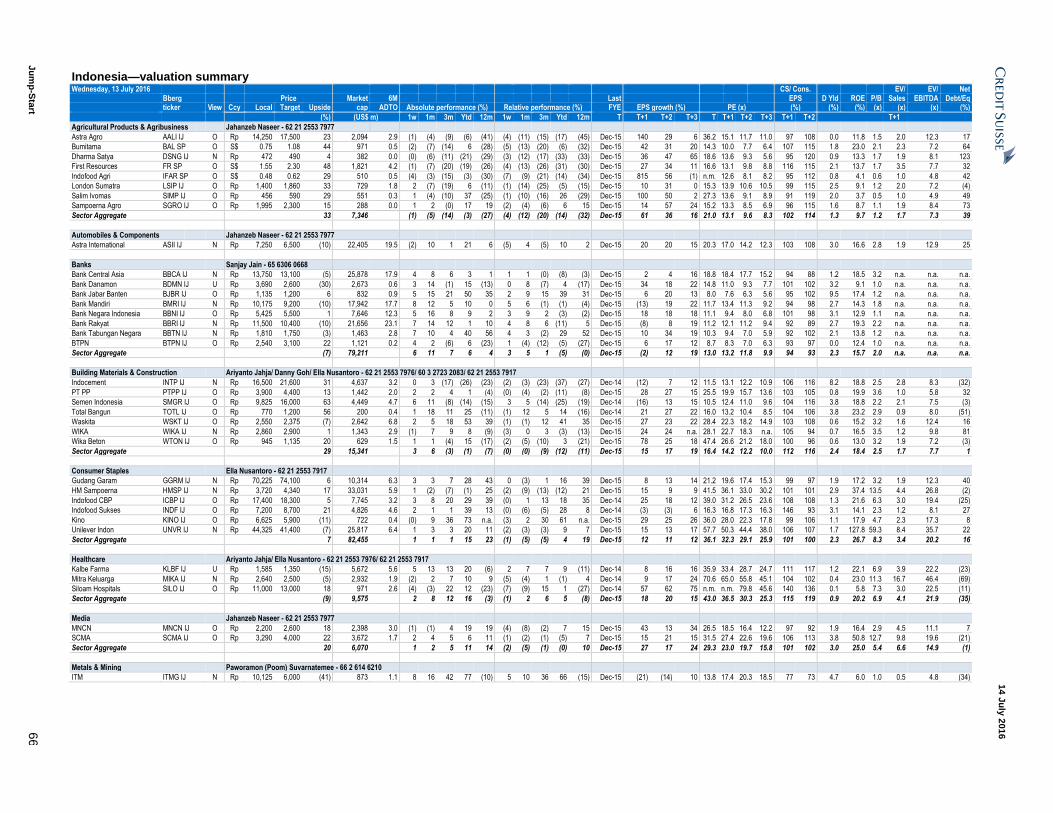
Ju
mp
-Sta
rt 6
6
14 J
uly
201
6
Indonesia—valuation summary Wednesday, 13 July 2016
CS/ Cons. EV/ EV/ Net
Bberg Price Market 6M Last EPS D Yld ROE P/B Sales EBITDA Debt/Eq ticker View Ccy Local Target Upside cap ADTO Absolute performance (%) Relative performance (%) FYE EPS growth (%) PE (x) (%) (%) (%) (x) (x) (x) (%)
(%) (US$ m) 1w 1m 3m Ytd 12m 1w 1m 3m Ytd 12m T T+1 T+2 T+3 T T+1 T+2 T+3 T+1 T+2 T+1
Agricultural Products & Agribusiness Jahanzeb Naseer - 62 21 2553 7977
Astra Agro AALI IJ O Rp 14,250 17,500 23 2,094 2.9 (1) (4) (9) (6) (41) (4) (11) (15) (17) (45) Dec-15 140 29 6 36.2 15.1 11.7 11.0 97 108 0.0 11.8 1.5 2.0 12.3 17
Bumitama BAL SP O S$ 0.75 1.08 44 971 0.5 (2) (7) (14) 6 (28) (5) (13) (20) (6) (32) Dec-15 42 31 20 14.3 10.0 7.7 6.4 107 115 1.8 23.0 2.1 2.3 7.2 64
Dharma Satya DSNG IJ N Rp 472 490 4 382 0.0 (0) (6) (11) (21) (29) (3) (12) (17) (33) (33) Dec-15 36 47 65 18.6 13.6 9.3 5.6 95 120 0.9 13.3 1.7 1.9 8.1 123
First Resources FR SP O S$ 1.55 2.30 48 1,821 4.2 (1) (7) (20) (19) (26) (4) (13) (26) (31) (30) Dec-15 27 34 11 16.6 13.1 9.8 8.8 116 115 2.1 13.7 1.7 3.5 7.7 32
Indofood Agri IFAR SP O S$ 0.48 0.62 29 510 0.5 (4) (3) (15) (3) (30) (7) (9) (21) (14) (34) Dec-15 815 56 (1) n.m. 12.6 8.1 8.2 95 112 0.8 4.1 0.6 1.0 4.8 42
London Sumatra LSIP IJ O Rp 1,400 1,860 33 729 1.8 2 (7) (19) 6 (11) (1) (14) (25) (5) (15) Dec-15 10 31 0 15.3 13.9 10.6 10.5 99 115 2.5 9.1 1.2 2.0 7.2 (4)
Salim Ivomas SIMP IJ O Rp 456 590 29 551 0.3 1 (4) (10) 37 (25) (1) (10) (16) 26 (29) Dec-15 100 50 2 27.3 13.6 9.1 8.9 91 119 2.0 3.7 0.5 1.0 4.9 49
Sampoerna Agro SGRO IJ O Rp 1,995 2,300 15 288 0.0 1 2 (0) 17 19 (2) (4) (6) 6 15 Dec-15 14 57 24 15.2 13.3 8.5 6.9 96 115 1.6 8.7 1.1 1.9 8.4 73
Sector Aggregate 33 7,346 (1) (5) (14) (3) (27) (4) (12) (20) (14) (32) Dec-15 61 36 16 21.0 13.1 9.6 8.3 102 114 1.3 9.7 1.2 1.7 7.3 39
Automobiles & Components Jahanzeb Naseer - 62 21 2553 7977
Astra International ASII IJ N Rp 7,250 6,500 (10) 22,405 19.5 (2) 10 1 21 6 (5) 4 (5) 10 2 Dec-15 20 20 15 20.3 17.0 14.2 12.3 103 108 3.0 16.6 2.8 1.9 12.9 25
Banks Sanjay Jain - 65 6306 0668
Bank Central Asia BBCA IJ N Rp 13,750 13,100 (5) 25,878 17.9 4 8 6 3 1 1 1 (0) (8) (3) Dec-15 2 4 16 18.8 18.4 17.7 15.2 94 88 1.2 18.5 3.2 n.a. n.a. n.a.
Bank Danamon BDMN IJ U Rp 3,690 2,600 (30) 2,673 0.6 3 14 (1) 15 (13) 0 8 (7) 4 (17) Dec-15 34 18 22 14.8 11.0 9.3 7.7 101 102 3.2 9.1 1.0 n.a. n.a. n.a.
Bank Jabar Banten BJBR IJ O Rp 1,135 1,200 6 832 0.9 5 15 21 50 35 2 9 15 39 31 Dec-15 6 20 13 8.0 7.6 6.3 5.6 95 102 9.5 17.4 1.2 n.a. n.a. n.a.
Bank Mandiri BMRI IJ N Rp 10,175 9,200 (10) 17,942 17.7 8 12 5 10 0 5 6 (1) (1) (4) Dec-15 (13) 19 22 11.7 13.4 11.3 9.2 94 98 2.7 14.3 1.8 n.a. n.a. n.a.
Bank Negara Indonesia BBNI IJ O Rp 5,425 5,500 1 7,646 12.3 5 16 8 9 2 3 9 2 (3) (2) Dec-15 18 18 18 11.1 9.4 8.0 6.8 101 98 3.1 12.9 1.1 n.a. n.a. n.a.
Bank Rakyat BBRI IJ N Rp 11,500 10,400 (10) 21,656 23.1 7 14 12 1 10 4 8 6 (11) 5 Dec-15 (8) 8 19 11.2 12.1 11.2 9.4 92 89 2.7 19.3 2.2 n.a. n.a. n.a.
Bank Tabungan Negara BBTN IJ N Rp 1,810 1,750 (3) 1,463 2.8 7 10 4 40 56 4 3 (2) 29 52 Dec-15 10 34 19 10.3 9.4 7.0 5.9 92 102 2.1 13.8 1.2 n.a. n.a. n.a.
BTPN BTPN IJ O Rp 2,540 3,100 22 1,121 0.2 4 2 (6) 6 (23) 1 (4) (12) (5) (27) Dec-15 6 17 12 8.7 8.3 7.0 6.3 93 97 0.0 12.4 1.0 n.a. n.a. n.a.
Sector Aggregate (7) 79,211 6 11 7 6 4 3 5 1 (5) (0) Dec-15 (2) 12 19 13.0 13.2 11.8 9.9 94 93 2.3 15.7 2.0 n.a. n.a. n.a.
Building Materials & Construction Ariyanto Jahja/ Danny Goh/ Ella Nusantoro - 62 21 2553 7976/ 60 3 2723 2083/ 62 21 2553 7917
Indocement INTP IJ N Rp 16,500 21,600 31 4,637 3.2 0 3 (17) (26) (23) (2) (3) (23) (37) (27) Dec-14 (12) 7 12 11.5 13.1 12.2 10.9 106 116 8.2 18.8 2.5 2.8 8.3 (32)
PT PP PTPP IJ O Rp 3,900 4,400 13 1,442 2.0 2 2 4 1 (4) (0) (4) (2) (11) (8) Dec-15 28 27 15 25.5 19.9 15.7 13.6 103 105 0.8 19.9 3.6 1.0 5.8 32
Semen Indonesia SMGR IJ O Rp 9,825 16,000 63 4,449 4.7 6 11 (8) (14) (15) 3 5 (14) (25) (19) Dec-14 (16) 13 15 10.5 12.4 11.0 9.6 104 116 3.8 18.8 2.2 2.1 7.5 (3)
Total Bangun TOTL IJ O Rp 770 1,200 56 200 0.4 1 18 11 25 (11) (1) 12 5 14 (16) Dec-14 21 27 22 16.0 13.2 10.4 8.5 104 106 3.8 23.2 2.9 0.9 8.0 (51)
Waskita WSKT IJ O Rp 2,550 2,375 (7) 2,642 6.8 2 5 18 53 39 (1) (1) 12 41 35 Dec-15 27 23 22 28.4 22.3 18.2 14.9 103 108 0.6 15.2 3.2 1.6 12.4 16
WIKA WIKA IJ N Rp 2,860 2,900 1 1,343 2.9 (1) 7 9 8 (9) (3) 0 3 (3) (13) Dec-15 24 24 n.a. 28.1 22.7 18.3 n.a. 105 94 0.7 16.5 3.5 1.2 9.8 81
Wika Beton WTON IJ O Rp 945 1,135 20 629 1.5 1 1 (4) 15 (17) (2) (5) (10) 3 (21) Dec-15 78 25 18 47.4 26.6 21.2 18.0 100 96 0.6 13.0 3.2 1.9 7.2 (3)
Sector Aggregate 29 15,341 3 6 (3) (1) (7) (0) (0) (9) (12) (11) Dec-15 15 17 19 16.4 14.2 12.2 10.0 112 116 2.4 18.4 2.5 1.7 7.7 1
Consumer Staples Ella Nusantoro - 62 21 2553 7917
Gudang Garam GGRM IJ N Rp 70,225 74,100 6 10,314 6.3 3 3 7 28 43 0 (3) 1 16 39 Dec-15 8 13 14 21.2 19.6 17.4 15.3 99 97 1.9 17.2 3.2 1.9 12.3 40
HM Sampoerna HMSP IJ N Rp 3,720 4,340 17 33,031 5.9 1 (2) (7) (1) 25 (2) (9) (13) (12) 21 Dec-15 15 9 9 41.5 36.1 33.0 30.2 101 101 2.9 37.4 13.5 4.4 26.8 (2)
Indofood CBP ICBP IJ O Rp 17,400 18,300 5 7,745 3.2 3 8 20 29 39 (0) 1 13 18 35 Dec-14 25 18 12 39.0 31.2 26.5 23.6 108 108 1.3 21.6 6.3 3.0 19.4 (25)
Indofood Sukses INDF IJ O Rp 7,200 8,700 21 4,826 4.6 2 1 1 39 13 (0) (6) (5) 28 8 Dec-14 (3) (3) 6 16.3 16.8 17.3 16.3 146 93 3.1 14.1 2.3 1.2 8.1 27
Kino KINO IJ O Rp 6,625 5,900 (11) 722 0.4 (0) 9 36 73 n.a. (3) 2 30 61 n.a. Dec-15 29 25 26 36.0 28.0 22.3 17.8 99 106 1.1 17.9 4.7 2.3 17.3 8
Unilever Indon UNVR IJ N Rp 44,325 41,400 (7) 25,817 6.4 1 3 3 20 11 (2) (3) (3) 9 7 Dec-15 15 13 17 57.7 50.3 44.4 38.0 106 107 1.7 127.8 59.3 8.4 35.7 22
Sector Aggregate 7 82,455 1 1 1 15 23 (1) (5) (5) 4 19 Dec-15 12 11 12 36.1 32.3 29.1 25.9 101 100 2.3 26.7 8.3 3.4 20.2 16
Healthcare Ariyanto Jahja/ Ella Nusantoro - 62 21 2553 7976/ 62 21 2553 7917
Kalbe Farma KLBF IJ U Rp 1,585 1,350 (15) 5,672 5.6 5 13 13 20 (6) 2 7 7 9 (11) Dec-14 8 16 16 35.9 33.4 28.7 24.7 111 117 1.2 22.1 6.9 3.9 22.2 (23)
Mitra Keluarga MIKA IJ N Rp 2,640 2,500 (5) 2,932 1.9 (2) 2 7 10 9 (5) (4) 1 (1) 4 Dec-14 9 17 24 70.6 65.0 55.8 45.1 104 102 0.4 23.0 11.3 16.7 46.4 (69)
Siloam Hospitals SILO IJ O Rp 11,000 13,000 18 971 2.6 (4) (3) 22 12 (23) (7) (9) 15 1 (27) Dec-14 57 62 75 n.m. n.m. 79.8 45.6 140 136 0.1 5.8 7.3 3.0 22.5 (11)
Sector Aggregate (9) 9,575 2 8 12 16 (3) (1) 2 6 5 (8) Dec-15 18 20 15 43.0 36.5 30.3 25.3 115 119 0.9 20.2 6.9 4.1 21.9 (35)
Media Jahanzeb Naseer - 62 21 2553 7977
MNCN MNCN IJ O Rp 2,200 2,600 18 2,398 3.0 (1) (1) 4 19 19 (4) (8) (2) 7 15 Dec-15 43 13 34 26.5 18.5 16.4 12.2 97 92 1.9 16.4 2.9 4.5 11.1 7
SCMA SCMA IJ O Rp 3,290 4,000 22 3,672 1.7 2 4 5 6 11 (1) (2) (1) (5) 7 Dec-15 15 21 15 31.5 27.4 22.6 19.6 106 113 3.8 50.8 12.7 9.8 19.6 (21)
Sector Aggregate 20 6,070 1 2 5 11 14 (2) (5) (1) (0) 10 Dec-15 27 17 24 29.3 23.0 19.7 15.8 101 102 3.0 25.0 5.4 6.6 14.9 (1)
Metals & Mining Paworamon (Poom) Suvarnatemee - 66 2 614 6210
ITM ITMG IJ N Rp 10,125 6,000 (41) 873 1.1 8 16 42 77 (10) 5 10 36 66 (15) Dec-15 (21) (14) 10 13.8 17.4 20.3 18.5 77 73 4.7 6.0 1.0 0.5 4.8 (34)

Ju
mp
-Sta
rt 6
7
14 J
uly
201
6
Indonesia—valuation summary (continued) Wednesday, 13 July 2016
CS/ Cons. EV/ EV/ Net
Bberg Price Market 6M Last EPS D Yld ROE P/B Sales EBITDA Debt/Eq ticker View Ccy Local Target Upside cap ADTO Absolute performance (%) Relative performance (%) FYE EPS growth (%) PE (x) (%) (%) (%) (x) (x) (x) (%)
(%) (US$ m) 1w 1m 3m Ytd 12m 1w 1m 3m Ytd 12m T T+1 T+2 T+3 T T+1 T+2 T+3 T+1 T+2 T+1
Real Estate Laurensius Teiseran - 62 21 255 37931
Alam Sutera ASRI IJ N Rp 486 450 (7) 729 2.0 2 25 26 42 (12) (1) 18 20 30 (17) Dec-15 66 26 20 16.0 9.7 7.7 6.4 99 111 0.8 14.0 1.3 5.6 9.0 94
Bekasi Fajar BEST IJ O Rp 270 330 22 199 1.0 2 2 (5) (8) (37) (0) (5) (11) (19) (41) Dec-15 23 17 36 12.2 9.9 8.5 6.2 106 105 1.7 8.7 0.8 5.1 9.0 32
BSD BSDE IJ O Rp 2,110 2,280 8 3,100 4.4 1 15 16 17 17 (2) 9 9 6 13 Dec-15 15 30 30 18.8 16.4 12.6 9.7 100 114 0.5 12.2 1.9 6.4 12.8 20
Ciputra Development CTRA IJ O Rp 1,450 1,690 17 1,707 1.9 2 12 13 (1) 17 (1) 5 7 (12) 13 Dec-15 13 17 18 16.6 14.6 12.5 10.6 111 110 1.5 16.8 2.3 3.0 9.2 11
Jababeka KIJA IJ O Rp 288 350 22 454 0.4 1 0 12 17 5 (1) (6) 6 5 0 Dec-15 4 17 26 17.6 17.0 14.5 11.5 87 83 0.0 7.3 1.2 2.5 7.8 43
Lippo Karawaci LPKR IJ N Rp 1,170 1,080 (8) 2,061 4.8 2 21 13 13 (0) (1) 15 7 2 (5) Dec-15 107 35 25 49.8 24.1 17.8 14.3 83 99 0.0 7.9 1.8 3.5 14.5 53
Pakuwon PWON IJ O Rp 660 630 (5) 2,426 2.7 9 25 32 33 57 6 18 26 22 53 Dec-15 52 28 18 25.2 16.6 12.9 11.0 95 102 0.8 23.7 3.6 6.4 11.8 33
Summarecon SMRA IJ O Rp 1,880 1,950 4 2,070 3.3 4 22 26 14 9 1 16 20 3 5 Dec-15 34 52 15 31.7 23.6 15.5 13.5 110 151 0.8 17.7 3.9 4.8 12.5 65
Surya Semesta SSIA IJ O Rp 630 960 52 226 1.1 2 (5) (14) (12) (34) (1) (11) (20) (23) (38) Dec-14 16 2 6 7.7 6.6 6.5 6.1 147 145 5.1 16.1 1.0 0.5 3.4 (13)
Sector Aggregate 4 12,974 3 18 19 17 17 1 12 13 6 13 Dec-15 32 28 21 21.9 16.6 12.9 10.6 100 112 0.8 13.5 2.1 4.1 11.1 37
Retailing Ella Nusantoro - 62 21 2553 7917
Ace ACES IJ N Rp 960 870 (9) 1,257 0.4 1 4 12 16 40 (2) (3) 6 5 36 Dec-15 10 5 12 28.0 25.4 24.1 21.5 104 98 1.4 22.4 5.3 3.0 18.0 (32)
MAPI MAPI IJ O Rp 4,070 5,400 33 516 0.3 1 (3) (8) 7 (21) (2) (9) (14) (4) (26) Dec-15 427 94 49 n.m. 34.4 17.7 11.9 88 100 0.1 7.5 2.5 0.7 7.2 88
Matahari Dept Store LPPF IJ O Rp 20,800 19,900 (4) 4,633 6.7 5 11 16 18 18 3 4 10 7 14 Dec-15 25 15 18 34.1 27.3 23.8 20.1 103 102 2.1 43.0 10.7 5.6 19.6 (94)
MPPA MPPA IJ N Rp 1,600 1,300 (19) 657 1.1 6 26 (2) (12) (47) 3 20 (9) (24) (51) Dec-15 35 61 16 47.0 35.0 21.7 18.8 93 105 2.1 8.8 3.0 0.5 12.7 (10)
Ramayana RALS IJ O Rp 1,010 900 (11) 547 0.4 (2) 12 44 57 50 (5) 6 38 45 45 Dec-15 15 9 8 21.3 18.6 17.1 15.9 113 109 2.6 11.1 2.0 0.9 7.5 (56)
TELE TELE IJ O Rp 650 900 38 353 0.3 (2) (4) (12) (16) (32) (4) (11) (18) (27) (36) Dec-15 26 17 14 12.7 10.1 8.6 7.5 100 93 2.0 15.5 1.5 0.3 7.5 92
Sector Aggregate (2) 7,963 4 9 13 16 14 1 3 7 5 9 Dec-15 26 20 18 31.7 25.1 21.0 17.7 102 101 1.9 20.9 5.0 1.3 13.9 3
Telecommunication Services Colin McCallum - 852 2101 6514
Indosat ISAT IJ N Rp 6,600 7,250 10 2,738 0.2 4 2 5 20 52 1 (5) (1) 9 48 Dec-15 233 27 11 n.m. 20.5 16.2 14.6 173 119 1.9 13.4 2.7 2.0 4.5 151
Link Net LINK IJ O Rp 4,090 8,300 103 950 0.3 0 (3) (0) 2 (23) (3) (9) (6) (9) (27) Dec-15 32 41 26 19.4 14.7 10.5 8.3 106 122 1.7 21.1 2.9 3.9 6.8 (11)
Protelindo TOWR IJ N Rp 4,170 4,400 6 3,248 0.1 4 (2) 1 (12) 4 1 (8) (5) (23) 0 Dec-15 (14) 19 10 14.4 16.7 14.1 12.8 124 124 1.8 29.7 4.5 10.3 12.1 116
Telkom TLKM IJ O Rp 4,100 4,150 1 31,548 25.7 3 9 21 33 43 1 3 15 21 39 Dec-15 26 15 8 26.3 20.8 18.1 16.8 105 105 2.9 24.9 4.9 3.6 7.2 5
Tower Bersama TBIG IJ N Rp 6,600 5,650 (14) 2,417 0.9 0 2 14 12 (26) (3) (4) 8 1 (30) Dec-15 17 53 15 21.7 18.5 12.1 10.5 123 160 2.7 84.3 12.9 13.3 15.8 805
XL Axiata EXCL IJ O Rp 3,600 4,850 35 2,937 2.0 (0) (1) (6) (0) 11 (3) (7) (12) (11) 7 Dec-15 7,859 (16) 20 n.m. 15.0 17.8 14.8 240 129 3.7 13.1 1.6 2.3 5.7 67
Sector Aggregate 6 43,837 3 6 16 25 33 0 0 10 13 29 Dec-15 51 16 10 29.6 19.6 16.9 15.3 116 112 2.8 23.2 4.2 3.6 7.2 46
Transportation Ella Nusantoro/ Jahanzeb Naseer - 62 21 2553 7917/ 62 21 2553 7977
Blue Bird BIRD IJ N Rp 3,990 6,200 55 762 0.4 (0) (3) (20) (44) (50) (3) (9) (26) (55) (54) Dec-14 13 23 17 13.6 12.0 9.7 8.3 101 122 3.7 22.1 2.5 1.8 5.8 2
Jasa JSMR IJ O Rp 5,375 8,800 64 2,790 2.4 4 2 0 3 (7) 2 (4) (6) (8) (11) Dec-14 8 21 15 26.0 24.2 20.0 17.4 103 113 1.7 14.6 3.4 5.0 12.0 112
Sector Aggregate 62 3,552 3 1 (4) (7) (16) 1 (5) (10) (18) (20) Dec-15 22 16 29 19.9 16.3 14.1 10.9 116 126 2.5 18.2 2.8 3.7 8.8 74
Utilities Ariyanto Jahja - 62 21 2553 7976
Perusahaan Gas PGAS IJ O Rp 2,520 3,065 22 4,663 8.1 8 2 (5) (8) (41) 5 (5) (11) (19) (45) Dec-15 17 12 6 11.4 9.7 8.7 8.2 99 111 3.5 15.0 1.4 2.1 6.7 46
Country Aggregate 5,109 5,298 4 296,265 3 6 6 11 4 Dec-15 14 15 17 20.9 18.4 15.9 13.6 101 102 2.3 17.5 3.1 2.7 11.3 27
Note: Prices are as of 13 Jul 2016
* Country/ sector aggregates are for the coverage above
Source: Company data, Thomson Financial IBES, Credit Suisse estimates

Ju
mp
-Sta
rt 6
8
14 J
uly
201
6
Japan—valuation summary Wednesday, 13 July 2016
CS/ Cons. EV/ EV/ Net
Bberg Price Market 6M Last EPS D Yld ROE P/B Sales EBITDA Debt/Eq ticker View Ccy Local Target Upside cap ADTO Absolute performance (%) Relative performance (%) FYE EPS growth (%) PE (x) (%) (%) (%) (x) (x) (x) (%)
(%) (US$ m) 1w 1m 3m Ytd 12m 1w 1m 3m Ytd 12m T T+1 T+2 T+3 T T+1 T+2 T+3 T+1 T+2 T+1
Automobiles & Components Koji Takahashi/ Masahiro Akita/ Shinya Yamada - 81 3 4550 7884/ 81 3 4550 7361/ 81 3 4550 9910
Aisan Industry 7283 JP N ¥ 709 750 6 427 1.4 11 (10) (19) (43) (38) 6 (12) (14) (27) (18) Mar-16 8 25 23 7.1 6.6 5.3 4.3 118 122 4.8 8.0 0.5 0.2 1.6 (12)
Aisin Seiki 7259 JP O ¥ 4,230 5,400 28 11,501 43.6 11 0 (1) (19) (16) 5 (1) 4 (3) 4 Mar-16 5 22 11 12.3 11.7 9.7 8.7 107 116 2.6 9.0 1.0 0.3 3.0 (1)
Bridgestone 5108 JT N ¥ 3,428 4,000 17 25,756 117.1 8 (3) (17) (18) (26) 2 (4) (12) (2) (6) Dec-15 (2) 15 6 9.4 9.6 8.3 7.9 95 99 4.1 12.2 1.1 0.7 3.8 (2)
Calsonic Kansei 7248 JP N ¥ 811 800 (1) 2,086 14.9 8 (11) 4 (25) (5) 2 (12) 9 (9) 16 Mar-16 20 7 3 9.6 8.0 7.5 7.2 105 104 1.8 12.3 0.9 0.2 2.6 (19)
DaikyoNishikawa 4246 JP O ¥ 1,251 1,600 28 887 6.7 4 (21) (22) (45) 12 (1) (23) (16) (29) 33 Mar-16 (1) 17 16 7.8 7.9 6.7 5.8 97 105 2.7 20.1 1.5 0.4 2.5 (42)
Denso 6902 JP N ¥ 3,757 4,000 6 28,593 94.4 12 (0) (14) (35) (37) 6 (1) (9) (19) (16) Mar-16 (5) 7 9 12.2 12.8 11.9 11.0 98 95 3.2 7.4 0.9 0.6 5.0 (5)
Exedy 7278 JP N ¥ 2,284 2,450 7 1,053 3.9 8 (3) (3) (22) (24) 3 (4) 2 (6) (3) Mar-16 (8) 15 13 9.1 9.9 8.6 7.6 93 99 3.1 6.7 0.7 0.5 3.4 9
Fuji Heavy Industries 7270 JP O ¥ 3,788 4,450 17 28,378 181.5 15 1 2 (25) (18) 9 (0) 7 (9) 3 Mar-16 (21) 13 14 6.8 8.5 7.5 6.6 107 110 3.8 24.2 1.9 0.9 4.5 (15)
GS Yuasa Corp 6674 JP N ¥ 418 450 8 1,656 12.5 9 (1) (17) (8) (13) 4 (2) (12) 8 8 Mar-16 53 15 9 19.1 12.5 10.9 10.0 109 101 2.4 8.6 1.0 0.6 5.6 31
Hino Motors 7205 JP N ¥ 1,059 1,100 4 5,829 28.7 13 5 (12) (25) (27) 8 3 (7) (9) (6) Mar-16 (14) 11 10 9.3 10.8 9.8 8.9 99 96 3.6 12.5 1.3 0.4 5.3 16
Honda Motor 7267 JP N ¥ 2,739 3,000 10 47,380 160.5 11 (1) (11) (30) (30) 6 (3) (5) (14) (10) Mar-16 55 9 9 14.3 9.3 8.5 7.8 113 105 3.4 7.7 0.7 0.7 8.0 65
Ichikoh Industries 7244 JP O ¥ 276 400 45 254 0.6 10 (8) 11 16 (5) 5 (9) 16 32 15 Mar-16 20 53 28 10.6 8.8 5.8 4.5 100 100 1.6 12.6 1.0 0.3 3.5 48
Isuzu Motors 7202 JP O ¥ 1,317 1,550 18 9,964 48.1 3 3 12 0 (18) (2) 2 17 16 2 Mar-16 8 9 9 9.5 8.8 8.0 7.4 102 103 2.6 14.8 1.2 0.5 3.7 (15)
Keihin 7251 JP N ¥ 1,592 1,700 7 1,130 5.3 10 (4) (3) (26) (2) 4 (6) 2 (10) 18 Mar-16 160 15 10 20.7 8.0 7.0 6.4 105 111 2.5 8.7 0.7 0.2 1.4 (27)
Koito Manufacturing 7276 JP U ¥ 4,825 4,000 (17) 7,443 30.8 9 (0) 1 (4) (0) 3 (2) 6 12 21 Mar-16 11 6 6 16.7 15.1 14.3 13.5 99 95 0.9 16.7 2.3 0.7 5.2 (44)
Mazda Motor 7261 JP N ¥ 1,430 1,650 15 24,940 154.6 14 (14) (14) (43) (42) 9 (15) (9) (27) (21) Mar-16 3 11 10 6.4 6.2 5.6 5.1 110 104 2.4 13.6 0.8 0.8 9.9 5
Mitsubishi Motors 7211 JP U ¥ 492 400 (19) 4,645 84.8 10 (7) (42) (52) (53) 5 (8) (37) (36) (33) Mar-16 (216) 144 25 6.7 n.m. 13.1 10.5 128 74 2.0 (17.9) 1.0 0.0 0.1 (61)
Musashi Seimitsu Industry 7220 JP N ¥ 2,021 2,200 9 605 3.6 8 (10) (4) (19) (8) 2 (11) 1 (3) 12 Mar-16 7 18 13 9.3 8.6 7.3 6.5 95 104 2.6 10.4 0.9 0.7 4.0 45
NGK Insulators 5333 JP O ¥ 2,169 3,000 38 6,696 32.3 9 (3) 1 (21) (31) 3 (4) 6 (5) (10) Mar-16 (6) 7 18 13.3 14.1 13.2 11.2 104 101 1.8 11.5 1.6 1.7 7.5 4
Nifco 7988 JP O ¥ 5,590 6,400 14 2,885 12.0 8 0 6 (1) 8 2 (1) 11 15 28 Mar-16 14 9 7 16.1 14.1 12.9 12.0 107 105 2.3 15.8 2.1 1.1 6.8 2
Nissan Motor 7201 JP O ¥ 1,012 1,250 24 39,449 156.2 9 0 (3) (21) (17) 4 (1) 2 (5) 3 Mar-16 15 15 7 8.1 7.1 6.1 5.7 107 110 4.7 12.7 0.9 0.9 8.5 115
Shimano 7309 JP N ¥ 15,360 15,500 1 13,672 49.8 8 0 (12) (18) (12) 2 (1) (7) (2) 8 Dec-15 (31) 10 8 18.7 27.1 24.8 23.0 93 89 1.0 13.5 3.5 3.8 13.8 (50)
Stanley Electric 6923 JP N ¥ 2,333 2,400 3 3,729 20.1 13 (3) (3) (13) (6) 8 (4) 2 3 15 Mar-16 14 11 10 15.3 13.4 12.0 10.9 102 102 1.5 10.0 1.3 0.7 3.8 (27)
Sumitomo Rubber Industries 5110 JP N ¥ 1,431 1,650 15 3,604 23.0 9 (5) (16) (9) (21) 3 (6) (11) 6 (1) Dec-15 (1) (4) 6 6.7 6.8 7.1 6.7 103 103 3.8 12.7 0.9 0.7 4.5 41
Suzuki Motor 7269 JP O ¥ 3,042 3,400 12 12,886 97.9 16 12 (1) (18) (26) 11 11 5 (2) (5) Mar-16 3 14 10 12.9 12.5 11.0 10.0 108 110 1.2 10.7 1.3 0.3 2.8 (24)
Takata Corp 7312 JP N ¥ 388 400 3 310 5.7 7 (4) (5) (52) (69) 1 (5) (0) (36) (49) Mar-16 207 50 (5) n.m. 2.3 1.5 1.6 100 100 0.0 10.9 0.2 0.1 0.8 10
Tokai Rika 6995 JP N ¥ 1,545 1,700 10 1,353 9.8 11 (7) (24) (49) (47) 6 (9) (19) (33) (27) Mar-16 258 5 10 25.2 7.0 6.7 6.1 101 98 4.2 9.2 0.6 0.2 2.2 (13)
Topre 5975 JP O ¥ 2,308 2,900 26 1,197 3.5 4 3 1 (17) 3 (1) 2 7 (1) 23 Mar-16 19 20 14 11.1 9.3 7.8 6.9 107 111 1.9 11.0 1.0 0.6 3.7 (13)
Toyoda Gosei 7282 JP N ¥ 1,926 2,000 4 2,393 8.1 11 (0) (7) (30) (31) 5 (1) (1) (14) (10) Mar-16 9 9 8 12.3 11.3 10.4 9.6 99 98 2.9 7.1 0.8 0.3 2.6 (11)
Toyota Boshoku 3116 JP O ¥ 2,177 2,800 29 3,879 15.9 11 (1) 12 (11) 3 6 (2) 17 5 23 Mar-16 797 17 10 n.m. 11.5 9.9 9.0 102 106 2.0 16.6 1.8 0.2 3.3 (25)
Toyota Industries 6201 JP O ¥ 4,315 5,500 27 13,016 32.4 13 0 (13) (34) (37) 7 (1) (7) (18) (16) Mar-16 (34) 4 5 7.4 11.3 10.8 10.3 97 95 2.8 5.8 0.6 0.9 7.2 28
Toyota Motor 7203 JP N ¥ 5,628 6,000 7 166,075 676.1 11 4 (3) (25) (31) 6 2 2 (9) (11) Mar-16 (22) 10 9 7.6 9.8 8.9 8.2 105 103 3.7 10.5 1.0 0.8 8.0 36
Unipres 5949 JP N ¥ 1,671 1,900 14 723 8.1 10 (12) (10) (39) (30) 4 (13) (5) (23) (9) Mar-16 16 20 10 7.7 6.6 5.5 5.0 101 107 2.4 9.0 0.6 0.2 1.7 (2)
Yamaha Motor 7272 JP N ¥ 1,685 1,900 13 5,649 56.1 17 3 (10) (39) (38) 12 2 (5) (23) (17) Dec-15 28 4 10 9.8 7.6 7.4 6.7 106 96 4.2 15.0 1.1 0.5 4.7 33
Sector Aggregate 11 480,041 11 1 (6) (24) (27) 6 (0) (1) (8) (6) Mar-15 6 (8) 14 9.6 9.1 9.9 8.7 100 105 3.2 11.5 1.0 0.7 6.2 37
Banks Takashi Miura - 81 3 4550 9941
Aozora Bank 8304 JP N ¥ 368 360 (2) 4,121 45.2 5 4 (4) (13) (21) (0) 3 1 3 (1) Mar-16 (26) 3 3 9.9 13.3 12.9 12.5 77 81 5.0 7.8 1.0 n.a. n.a. n.a.
Bank of Kyoto 8369 JP O ¥ 723 830 15 2,632 11.4 22 12 (5) (36) (50) 17 11 (0) (20) (30) Mar-16 (27) 4 (0) 12.8 17.7 17.0 17.1 88 103 1.7 2.4 0.4 n.a. n.a. n.a.
Chiba Bank 8331 JP N ¥ 501 510 2 3,909 24.7 10 (1) (14) (42) (47) 5 (2) (9) (26) (27) Mar-16 (12) 2 2 7.5 8.5 8.4 8.2 94 95 3.2 5.4 0.5 n.a. n.a. n.a.
Concordia FG 7186 JP O ¥ 429 500 17 5,355 20.4 11 (4) (19) n.a. n.a. 6 (5) (14) n.a. n.a. Mar-16 60 (48) 1 6.9 4.3 8.4 8.3 104 102 3.3 11.6 0.5 n.a. n.a. n.a.
Fukuoka Financial Group 8354 JP U ¥ 362 300 (17) 2,985 22.6 11 3 (6) (40) (44) 6 2 (1) (24) (23) Mar-16 (10) (5) (5) 7.0 7.8 8.2 8.6 102 92 3.6 5.1 0.4 n.a. n.a. n.a.
Mitsubishi UFJ Financial Group
8306 JP O ¥ 498 580 16 66,878 470.6 15 (1) (8) (34) (44) 9 (3) (3) (18) (23) Mar-16 1 3 3 7.1 7.1 6.9 6.7 102 103 3.6 6.1 0.4 n.a. n.a. n.a.
Mizuho Financial Group 8411 JP N ¥ 160 170 6 38,931 305.0 12 1 (6) (34) (40) 7 (0) (1) (18) (19) Mar-16 (19) 1 6 5.9 7.3 7.2 6.8 92 98 4.7 6.7 0.5 n.a. n.a. n.a.
Resona 8308 JP N ¥ 397 420 6 8,846 65.7 9 4 (5) (33) (41) 3 3 0 (17) (21) Mar-16 (33) 1 (4) 5.1 7.6 7.5 7.8 80 81 5.3 7.7 0.5 n.a. n.a. n.a.
Shinsei Bank 8303 JP O ¥ 152 190 25 3,780 35.4 12 (1) (3) (32) (42) 6 (2) 3 (16) (21) Mar-16 (4) 13 13 6.2 6.4 5.7 5.1 104 110 2.0 7.5 0.5 n.a. n.a. n.a.
Shizuoka Bank 8355 JP U ¥ 747 640 (14) 4,402 18.9 11 0 (12) (37) (43) 6 (1) (6) (21) (23) Mar-16 (17) 2 2 9.6 11.5 11.3 11.1 93 86 2.7 4.2 0.5 n.a. n.a. n.a.
Sumitomo Mitsui Financial Group
8316 JP O ¥ 3,128 3,600 15 41,055 365.9 11 (1) (12) (32) (43) 6 (2) (7) (16) (22) Mar-16 11 7 7 6.6 5.9 5.5 5.2 103 111 4.8 7.8 0.5 n.a. n.a. n.a.
Sumitomo Mitsui Trust 8309 JP N ¥ 347 360 4 12,824 71.5 16 2 2 (25) (38) 11 0 7 (9) (18) Mar-16 (6) 2 2 7.8 8.3 8.2 8.0 93 92 4.0 6.4 0.5 n.a. n.a. n.a.
Suruga Bank 8358 JP N ¥ 2,344 2,100 (10) 5,224 24.2 10 0 15 (7) (11) 5 (1) 20 9 10 Mar-16 22 7 7 15.0 12.4 11.6 10.8 110 110 1.0 13.7 1.6 n.a. n.a. n.a.
Sector Aggregate 11 200,940 13 0 (8) (32) (41) 7 (1) (2) (16) (20) Mar-15 (5) (3) 1 6.5 6.9 7.1 7.0 100 98 3.9 7.2 0.5 n.a. n.a. n.a.
Building Materials & Construction Shinya Yamada - 81 3 4550 9910
Fujikura 5803 JP N ¥ 481 540 12 1,364 11.4 7 (6) (15) (27) (29) 2 (7) (10) (11) (8) Mar-16 24 21 6 12.7 10.3 8.5 8.0 102 106 2.9 6.3 0.6 0.5 5.4 63
Furukawa Electric 5801 JP U ¥ 258 200 (22) 1,749 18.9 8 3 (0) 0 24 3 2 5 16 45 Mar-16 20 17 6 18.2 15.2 13.0 12.3 87 86 1.6 6.5 0.9 0.5 6.8 95
Sumitomo Electric Industries 5802 JP O ¥ 1,391 1,800 29 10,411 48.5 9 (6) 3 (19) (29) 4 (8) 8 (3) (8) Mar-16 19 19 9 12.1 10.2 8.5 7.8 109 116 2.5 7.7 0.8 0.5 4.6 18
Sector Aggregate 21 13,524 9 (5) 1 (18) (22) 3 (6) 6 (2) (1) Mar-15 (19) 19 19 10.3 12.7 10.7 8.9 100 106 2.3 6.3 0.8 0.5 5.3 33

Ju
mp
-Sta
rt 6
9
14 J
uly
201
6
Japan—valuation summary (continued) Wednesday, 13 July 2016
CS/ Cons. EV/ EV/ Net
Bberg Price Market 6M Last EPS D Yld ROE P/B Sales EBITDA Debt/Eq ticker View Ccy Local Target Upside cap ADTO Absolute performance (%) Relative performance (%) FYE EPS growth (%) PE (x) (%) (%) (%) (x) (x) (x) (%)
(%) (US$ m) 1w 1m 3m Ytd 12m 1w 1m 3m Ytd 12m T T+1 T+2 T+3 T T+1 T+2 T+3 T+1 T+2 T+1
Capital Goods Hideyuki Maekawa/ Masahiro Mochizuki/ Shinji Kuroda - 81 3 4550 9723/ 81 3 4550 7389/ 81 3 4550 9994
Amada 6113 JP N ¥ 1,060 1,150 8 3,715 22.3 8 (5) (6) (9) (16) 3 (6) (1) 7 4 Mar-16 3 (14) 17 14.2 13.8 16.1 13.8 108 94 4.0 6.6 0.9 1.0 6.1 (21)
Anritsu 6754 JP O ¥ 624 1,000 60 822 7.3 9 4 2 (22) (24) 4 3 7 (6) (4) Mar-15 10 7 9 11.2 10.2 9.5 8.8 223 158 3.8 10.3 1.0 0.7 4.5 (20)
Chiyoda Corp 6366 JP N ¥ 725 700 (3) 1,803 22.3 9 4 (16) (21) (33) 4 3 (10) (5) (12) Mar-16 19 18 15 55.6 46.9 40.0 34.8 68 37 0.8 2.0 0.9 0.2 4.2 (50)
Daikin Industries 6367 JP O ¥ 8,828 11,000 25 24,728 108.7 8 2 0 (1) 3 2 1 6 15 23 Mar-16 2 12 10 18.8 18.4 16.4 14.9 101 102 1.4 13.1 2.3 1.3 9.1 16
DMG Mori Seiki 6141 JP N ¥ 1,080 1,250 16 1,245 22.9 14 (11) (19) (24) (54) 9 (12) (14) (8) (33) Dec-15 (43) (7) 15 5.0 8.8 9.5 8.3 107 85 2.4 9.1 0.8 0.7 6.6 56
Ebara 6361 JP N ¥ 570 570 0 2,545 20.0 3 8 9 (2) (0) (2) 6 14 14 20 Mar-16 22 (6) 14 15.4 12.6 13.4 11.8 96 87 2.5 8.5 1.1 0.6 5.9 9
Fanuc 6954 JP U ¥ 17,180 13,000 (24) 31,973 206.2 10 6 (10) (19) (29) 5 5 (4) (3) (9) Mar-16 (42) (3) 15 21.0 36.2 37.2 32.3 86 69 1.7 7.0 2.5 5.0 17.3 (62)
HASEKO Corp 1808 JP N ¥ 1,061 1,200 13 3,062 30.9 9 (5) (1) (21) (32) 4 (6) 4 (5) (11) Mar-16 10 (3) (1) 6.2 5.6 5.8 5.9 104 100 1.9 26.8 1.3 0.3 2.9 (33)
Hitachi Construction Machinery
6305 JP U ¥ 1,565 1,400 (11) 3,195 31.2 10 1 (19) (18) (23) 5 (0) (13) (2) (2) Mar-16 (26) 31 59 37.8 51.2 39.2 24.7 61 49 0.6 1.6 0.8 0.6 7.4 24
IHI 7013 JP O ¥ 303 350 16 4,499 62.7 7 10 27 (10) (45) 2 9 32 6 (24) Mar-16 1,665 28 29 n.m. 17.3 13.5 10.5 101 95 2.0 8.3 1.4 0.5 6.8 77
JGC Corp 1963 JP N ¥ 1,572 1,500 (5) 3,810 33.9 9 5 (14) (16) (30) 4 3 (9) 0 (10) Mar-16 (49) (8) 0 9.3 18.0 19.5 19.5 78 73 1.9 5.2 0.9 0.3 5.2 (45)
JTEKT 6473 JP N ¥ 1,250 1,500 20 4,116 23.0 18 (0) (17) (38) (44) 13 (1) (12) (22) (23) Mar-16 (13) 0 11 8.8 10.1 10.1 9.1 100 89 3.4 9.0 0.9 0.4 4.4 23
Kajima Corp 1812 JP U ¥ 727 700 (4) 7,248 47.5 2 5 4 0 20 (4) 4 9 16 41 Mar-16 (3) 11 1 10.4 10.8 9.8 9.7 99 106 1.8 14.0 1.4 0.5 7.2 22
Kawasaki Heavy Industries 7012 JP U ¥ 281 260 (7) 4,506 62.1 3 (7) (14) (38) (50) (2) (8) (9) (22) (30) Mar-16 (13) 7 16 10.2 11.7 10.9 9.4 93 90 2.8 9.0 1.0 0.5 7.8 76
Keyence 6861 JP N ¥ 73,700 65,500 (11) 42,925 116.1 3 8 15 10 11 (2) 7 20 26 31 Mar-16 7 5 8 32.6 30.4 29.0 26.8 99 94 0.3 13.3 3.8 9.4 17.6 (59)
Komatsu 6301 JP N ¥ 1,900 1,800 (5) 17,189 86.8 10 3 (7) (5) (17) 4 2 (2) 11 4 Mar-16 (28) 0 16 13.0 18.1 18.1 15.6 98 87 3.1 6.4 1.2 1.3 7.7 18
Kubota 6326 JP O ¥ 1,434 1,900 32 17,108 81.1 10 1 (9) (24) (31) 5 (1) (4) (8) (10) Dec-15 32 10 11 16.2 12.3 11.2 10.1 98 100 2.7 12.2 1.5 1.3 8.5 27
LIXIL Group 5938 JP N ¥ 1,779 1,900 7 4,885 34.5 8 (4) (23) (34) (30) 3 (5) (18) (18) (10) Mar-16 285 26 25 n.m. 14.8 11.8 9.4 98 98 3.4 6.2 0.9 0.5 8.7 89
Makita 6586 JP N ¥ 6,610 7,000 6 8,613 35.7 0 (1) (5) (6) (6) (5) (2) 0 10 15 Mar-16 6 5 3 21.6 20.3 19.4 18.8 96 93 1.5 9.2 1.9 1.8 10.1 (32)
Mitsubishi Heavy Industries 7011 JP N ¥ 458 450 (2) 14,791 73.8 12 14 7 (14) (37) 6 12 12 2 (16) Mar-16 77 44 15 24.1 13.6 9.4 8.2 88 102 2.6 6.6 0.9 0.5 4.5 35
Nabtesco Corp 6268 JP U ¥ 2,602 2,300 (12) 3,085 22.9 7 0 0 5 (11) 1 (1) 5 21 10 Dec-15 50 7 2 29.3 19.5 18.3 18.0 93 88 1.9 11.2 2.2 1.3 9.2 (11)
NSK 6471 JP O ¥ 838 1,100 31 4,250 29.5 19 2 (17) (37) (52) 13 0 (12) (21) (31) Mar-16 (36) 3 22 6.8 10.6 10.2 8.3 97 91 4.5 9.3 1.0 0.6 4.9 19
NTN 6472 JP N ¥ 286 350 22 1,460 19.5 14 (7) (20) (45) (61) 9 (8) (14) (29) (41) Mar-16 (3) 8 8 10.1 10.4 9.6 8.9 88 71 4.2 6.2 0.6 0.6 5.2 92
Obayashi Corp 1802 JP N ¥ 1,092 1,300 19 7,531 45.1 1 4 2 (2) 16 (4) 3 7 14 36 Mar-16 11 1 2 12.4 11.1 11.0 10.9 101 99 1.7 12.9 1.4 0.5 7.3 16
Okuma Corp 6103 JP N ¥ 728 750 3 1,120 19.2 15 1 (18) (26) (45) 10 (1) (13) (10) (24) Mar-16 (20) (30) 49 8.5 10.6 15.2 10.1 111 81 2.5 8.2 0.9 0.4 3.2 (31)
Penta-Ocean Construction 1893 JP O ¥ 571 690 21 1,567 11.2 7 8 18 13 11 1 7 23 29 31 Mar-16 55 5 3 20.9 13.5 12.9 12.5 102 96 1.8 14.1 1.8 0.3 6.2 7
Rinnai 5947 JP N ¥ 9,470 8,600 (9) 4,728 15.1 3 7 (6) (12) 1 (2) 5 (1) 4 22 Mar-16 4 3 7 21.7 20.8 20.2 18.9 98 96 0.9 8.9 1.8 1.1 8.0 (38)
Shimizu Corp 1803 JP O ¥ 1,004 1,300 29 7,563 34.6 5 7 3 1 (4) 0 6 9 17 17 Mar-16 16 8 8 13.3 11.4 10.6 9.8 101 103 1.8 13.6 1.5 0.5 7.7 16
SMC 6273 JP N ¥ 25,550 27,000 6 16,478 65.9 8 (2) (7) (20) (27) 2 (3) (2) (4) (7) Mar-16 (2) 1 13 18.6 19.1 18.9 16.7 98 93 0.8 9.2 1.7 2.8 9.7 (40)
Sumitomo Heavy Industries 6302 JP N ¥ 471 520 10 2,771 20.1 10 (3) (0) (14) (31) 4 (4) 5 2 (10) Mar-16 (15) (3) 11 8.7 10.3 10.6 9.6 101 94 3.0 7.2 0.7 0.4 4.0 (4)
Taisei Corp 1801 JP O ¥ 855 990 16 9,489 66.3 4 7 14 7 18 (1) 6 19 23 38 Mar-16 2 9 2 13.0 12.7 11.6 11.4 102 107 2.1 14.4 1.8 0.5 7.0 (31)
THK 6481 JP N ¥ 1,900 1,900 0 2,309 21.6 13 (4) (17) (16) (24) 7 (5) (12) 0 (4) Mar-16 8 (3) 15 17.7 16.4 16.8 14.6 107 93 1.8 5.8 1.0 0.7 5.5 (17)
TOTO 5332 JP U ¥ 4,340 3,200 (26) 7,047 36.5 9 7 19 1 6 3 6 24 17 27 Mar-16 (5) 10 8 20.4 21.4 19.5 18.1 94 101 1.6 11.9 2.4 1.2 10.2 (15)
Tsubakimoto Chain 6371 JP O ¥ 678 950 40 1,211 5.7 11 (5) (10) (28) (39) 5 (6) (5) (12) (18) Mar-16 7 4 11 9.9 9.3 8.9 8.0 99 96 3.2 9.3 0.9 0.6 3.9 3
Sector Aggregate 2 273,388 7 4 (0) (9) (13) 2 3 5 7 7 Mar-15 2 2 8 17.6 17.3 17.0 15.8 103 97 1.9 9.6 1.6 0.9 7.7 7
Chemicals Masami Sawato - 81 3 4550 9729
Asahi Kasei 3407 JP N ¥ 752 820 9 10,087 47.8 7 12 (0) (9) (20) 2 11 5 7 0 Mar-16 0 4 7 11.4 11.4 10.9 10.2 100 97 2.7 8.6 0.9 0.7 5.4 27
Denka 4061 JP N ¥ 440 450 2 1,869 12.2 8 1 (8) (19) (15) 2 0 (3) (3) 5 Mar-16 7 7 10 10.2 9.6 8.9 8.2 100 98 3.2 9.4 0.9 0.8 5.5 46
Hitachi Chemical 4217 JP O ¥ 1,976 2,400 21 3,950 18.1 5 1 2 2 (9) (0) (0) 7 18 12 Mar-16 1 10 7 10.7 10.6 9.6 8.9 110 110 2.5 10.5 1.1 0.6 4.1 (18)
JSR 4185 JP N ¥ 1,467 1,450 (1) 3,177 18.0 12 (1) (5) (23) (31) 7 (3) 0 (7) (10) Mar-16 (1) 12 7 13.8 13.9 12.4 11.7 93 96 3.4 6.6 0.9 0.7 5.7 (15)
Kuraray 3405 JP N ¥ 1,278 1,530 20 4,305 24.0 5 (5) (7) (13) (12) (0) (6) (1) 3 8 Dec-15 9 4 1 12.6 11.5 11.1 10.9 99 97 3.1 7.7 0.9 0.8 4.0 (0)
Kureha 4023 JP N ¥ 386 410 6 636 2.7 6 2 4 (18) (17) 0 1 9 (2) 4 Mar-16 13 5 15 9.0 8.0 7.6 6.6 108 113 2.8 6.9 0.5 1.2 7.9 84
Mitsubishi Chemical 4188 JP O ¥ 520 820 58 7,354 38.6 17 3 (8) (33) (32) 12 2 (2) (17) (11) Mar-16 94 11 10 16.4 8.5 7.6 6.9 103 103 3.1 9.5 0.8 0.5 4.4 70
Mitsubishi Gas Chemical 4182 JP N ¥ 553 500 (10) 2,345 14.2 7 (2) (9) (11) (16) 2 (3) (4) 5 4 Mar-16 (31) 15 7 7.2 10.4 9.0 8.4 100 106 2.9 6.1 0.6 0.6 6.5 22
Mitsui Chemicals 4183 JP N ¥ 382 400 5 3,674 39.2 2 (1) 3 (30) (12) (3) (2) 8 (14) 8 Mar-16 57 15 10 16.6 10.6 9.2 8.4 97 101 2.4 9.1 0.9 0.6 6.4 75
Nippon Kayaku 4272 JP N ¥ 963 960 (0) 1,601 11.1 3 (9) (18) (24) (25) (3) (11) (13) (9) (4) Mar-16 (26) 12 11 10.0 13.5 12.1 10.9 98 102 2.6 6.9 0.9 0.9 5.1 (6)
Nippon Shokubai 4114 JP N ¥ 6,240 6,000 (4) 2,431 18.0 9 (2) 6 (26) (25) 4 (3) 11 (10) (4) Mar-16 (19) 7 3 9.7 12.1 11.3 10.9 91 89 2.4 7.3 0.9 0.8 5.5 (6)
Nippon Soda 4041 JP N ¥ 437 460 5 653 5.1 10 (9) (23) (40) (42) 5 (10) (18) (24) (21) Mar-16 (36) 1 4 4.7 7.3 7.2 6.9 95 93 2.7 7.0 0.5 0.7 8.0 21
Sanyo Chemical 4471 JP O ¥ 847 1,090 29 896 2.1 11 (2) 1 (12) (3) 6 (3) 6 4 18 Mar-16 34 8 7 13.5 10.0 9.3 8.7 99 102 2.1 8.0 0.8 0.5 4.1 (4)
Shin-Etsu Chemical 4063 JP N ¥ 6,228 6,600 6 25,468 80.4 4 3 1 (6) (16) (1) 2 6 10 4 Mar-16 1 6 6 17.8 17.7 16.7 15.8 99 98 1.8 7.2 1.2 1.5 6.2 (35)
Showa Denko 4004 JP N ¥ 1,001 1,200 20 1,372 15.5 9 (6) (12) (30) (35) 3 (7) (7) (14) (15) Dec-15 1,861 11 17 n.m. 7.5 6.8 5.8 123 121 3.0 6.2 0.5 0.6 6.0 95
SUMCO 3436 JP U ¥ 710 540 (24) 1,999 38.6 15 2 3 (23) (49) 10 1 8 (7) (28) Dec-15 (70) 25 25 10.5 34.7 27.8 22.2 79 61 2.8 2.9 1.0 1.6 8.8 53
Sumitomo Chemical 4005 JP N ¥ 445 450 1 6,982 51.7 10 (2) (12) (37) (37) 5 (3) (7) (21) (17) Mar-16 (2) 23 2 8.9 9.1 7.4 7.3 93 99 3.1 10.1 0.9 0.7 5.3 55
Teijin 3401 JP N ¥ 387 400 3 3,657 28.8 10 7 (3) (7) (18) 5 6 2 9 3 Mar-16 16 10 5 12.2 10.6 9.6 9.2 101 102 2.6 11.4 1.2 0.8 5.8 58
Tokuyama 4043 JP U ¥ 292 220 (25) 975 12.5 1 11 67 11 27 (4) 10 72 27 48 Mar-16 117 12 11 n.m. 6.0 5.3 4.8 126 129 0.0 24.5 1.2 0.7 4.6 119
Toray Industries 3402 JP O ¥ 937 1,470 57 14,376 60.4 6 5 (1) (17) (6) 1 4 4 (1) 15 Mar-16 18 8 7 16.6 14.1 13.0 12.2 104 104 1.5 10.8 1.5 0.9 7.6 53
Tosoh 4042 JP N ¥ 492 500 2 3,064 25.7 11 (4) (2) (22) (24) 6 (5) 3 (6) (3) Mar-16 8 9 5 7.9 7.3 6.7 6.4 101 103 3.0 12.3 0.9 0.6 4.2 22
Ube Industries 4208 JP N ¥ 180 200 11 1,828 21.0 9 (1) (12) (30) (20) 4 (2) (7) (14) 1 Mar-16 5 10 20 10.0 9.5 8.7 7.2 94 89 3.3 7.3 0.7 0.5 5.0 55
Zeon 4205 JP N ¥ 696 710 2 1,483 10.9 11 (6) (5) (29) (37) 5 (7) 0 (13) (16) Mar-16 25 12 9 8.7 7.0 6.2 5.7 110 114 2.3 10.1 0.7 0.7 3.6 20
Sector Aggregate 16 104,181 7 2 (2) (16) (19) 2 1 3 (0) 2 Mar-15 8 26 10 15.9 14.8 11.7 10.7 100 100 2.3 7.0 1.0 0.7 5.3 30
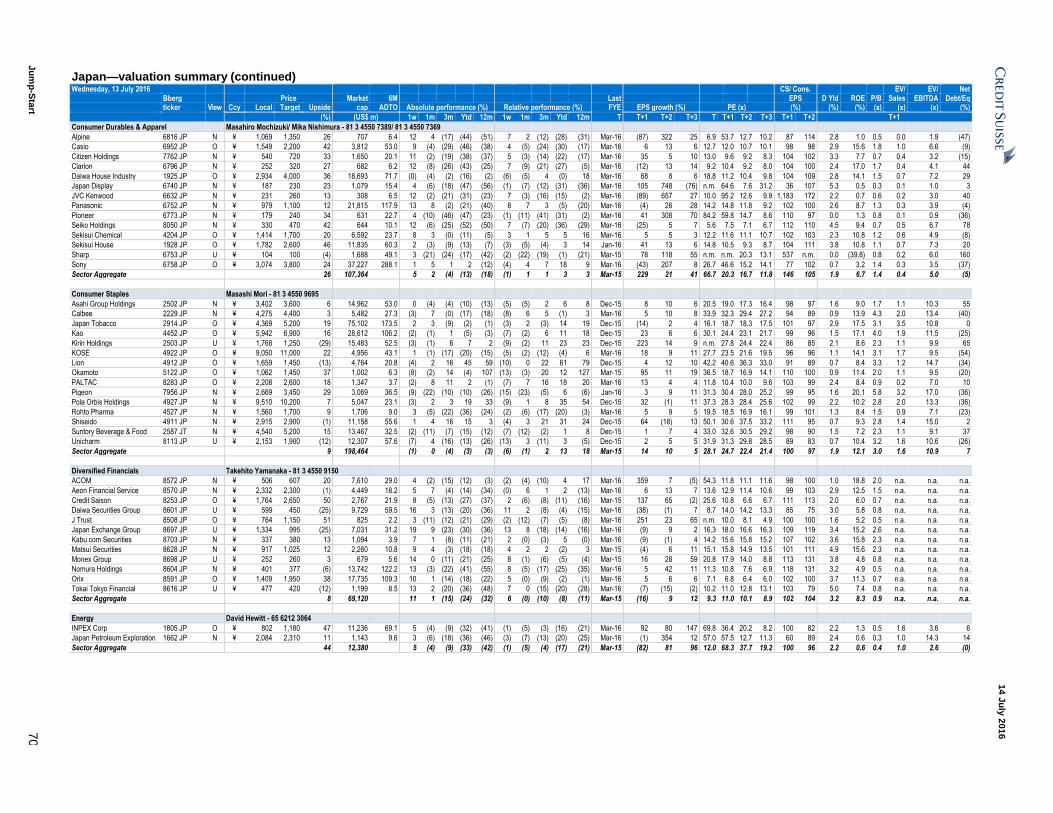
Ju
mp
-Sta
rt 7
0
14 J
uly
201
6
Japan—valuation summary (continued) Wednesday, 13 July 2016
CS/ Cons. EV/ EV/ Net
Bberg Price Market 6M Last EPS D Yld ROE P/B Sales EBITDA Debt/Eq ticker View Ccy Local Target Upside cap ADTO Absolute performance (%) Relative performance (%) FYE EPS growth (%) PE (x) (%) (%) (%) (x) (x) (x) (%)
(%) (US$ m) 1w 1m 3m Ytd 12m 1w 1m 3m Ytd 12m T T+1 T+2 T+3 T T+1 T+2 T+3 T+1 T+2 T+1
Consumer Durables & Apparel Masahiro Mochizuki/ Mika Nishimura - 81 3 4550 7389/ 81 3 4550 7369
Alpine 6816 JP N ¥ 1,069 1,350 26 707 6.4 12 4 (17) (44) (51) 7 2 (12) (28) (31) Mar-16 (87) 322 25 6.9 53.7 12.7 10.2 87 114 2.8 1.0 0.5 0.0 1.9 (47)
Casio 6952 JP O ¥ 1,549 2,200 42 3,812 53.0 9 (4) (29) (46) (38) 4 (5) (24) (30) (17) Mar-16 6 13 6 12.7 12.0 10.7 10.1 98 98 2.9 15.6 1.8 1.0 6.6 (9)
Citizen Holdings 7762 JP N ¥ 540 720 33 1,650 20.1 11 (2) (19) (38) (37) 5 (3) (14) (22) (17) Mar-16 35 5 10 13.0 9.6 9.2 8.3 104 102 3.3 7.7 0.7 0.4 3.2 (15)
Clarion 6796 JP N ¥ 252 320 27 682 6.2 12 (8) (26) (43) (25) 7 (9) (21) (27) (5) Mar-16 (12) 13 14 9.2 10.4 9.2 8.0 104 100 2.4 17.0 1.7 0.4 4.1 44
Daiwa House Industry 1925 JP O ¥ 2,934 4,000 36 18,693 71.7 (0) (4) (2) (16) (2) (6) (5) 4 (0) 18 Mar-16 68 8 6 18.8 11.2 10.4 9.8 104 109 2.8 14.1 1.5 0.7 7.2 29
Japan Display 6740 JP N ¥ 187 230 23 1,079 15.4 4 (6) (18) (47) (56) (1) (7) (12) (31) (36) Mar-16 105 748 (76) n.m. 64.6 7.6 31.2 36 107 5.3 0.5 0.3 0.1 1.0 3
JVC Kenwood 6632 JP N ¥ 231 260 13 308 6.5 12 (2) (21) (31) (23) 7 (3) (16) (15) (2) Mar-16 (89) 657 27 10.0 95.2 12.6 9.9 1,183 172 2.2 0.7 0.6 0.2 3.0 40
Panasonic 6752 JP N ¥ 979 1,100 12 21,815 117.9 13 8 (2) (21) (40) 8 7 3 (5) (20) Mar-16 (4) 26 28 14.2 14.8 11.8 9.2 102 100 2.6 8.7 1.3 0.3 3.9 (4)
Pioneer 6773 JP N ¥ 179 240 34 631 22.7 4 (10) (46) (47) (23) (1) (11) (41) (31) (2) Mar-16 41 308 70 84.2 59.8 14.7 8.6 110 97 0.0 1.3 0.8 0.1 0.9 (36)
Seiko Holdings 8050 JP N ¥ 330 470 42 644 10.1 12 (6) (25) (52) (50) 7 (7) (20) (36) (29) Mar-16 (25) 5 7 5.6 7.5 7.1 6.7 112 110 4.5 9.4 0.7 0.5 6.7 78
Sekisui Chemical 4204 JP O ¥ 1,414 1,700 20 6,592 23.7 8 3 (0) (11) (5) 3 1 5 5 16 Mar-16 5 5 3 12.2 11.6 11.1 10.7 102 103 2.3 10.8 1.2 0.6 4.9 (8)
Sekisui House 1928 JP O ¥ 1,782 2,600 46 11,835 60.3 2 (3) (9) (13) (7) (3) (5) (4) 3 14 Jan-16 41 13 6 14.8 10.5 9.3 8.7 104 111 3.8 10.8 1.1 0.7 7.3 20
Sharp 6753 JP U ¥ 104 100 (4) 1,688 49.1 3 (21) (24) (17) (42) (2) (22) (19) (1) (21) Mar-15 78 118 55 n.m. n.m. 20.3 13.1 537 n.m. 0.0 (39.8) 0.8 0.2 6.0 160
Sony 6758 JP O ¥ 3,074 3,800 24 37,227 288.1 1 5 1 2 (12) (4) 4 7 18 9 Mar-16 (43) 207 8 26.7 46.6 15.2 14.1 77 102 0.7 3.2 1.4 0.3 3.5 (37)
Sector Aggregate 26 107,364 5 2 (4) (13) (18) (1) 1 1 3 3 Mar-15 229 21 41 66.7 20.3 16.7 11.8 146 105 1.9 6.7 1.4 0.4 5.0 (5)
Consumer Staples Masashi Mori - 81 3 4550 9695
Asahi Group Holdings 2502 JP N ¥ 3,402 3,600 6 14,962 53.0 0 (4) (4) (10) (13) (5) (5) 2 6 8 Dec-15 8 10 6 20.5 19.0 17.3 16.4 98 97 1.6 9.0 1.7 1.1 10.3 55
Calbee 2229 JP N ¥ 4,275 4,400 3 5,482 27.3 (3) 7 (0) (17) (18) (8) 6 5 (1) 3 Mar-16 5 10 8 33.9 32.3 29.4 27.2 94 89 0.9 13.9 4.3 2.0 13.4 (40)
Japan Tobacco 2914 JP O ¥ 4,369 5,200 19 75,102 173.5 2 3 (9) (2) (1) (3) 2 (3) 14 19 Dec-15 (14) 2 4 16.1 18.7 18.3 17.5 101 97 2.9 17.5 3.1 3.5 10.8 0
Kao 4452 JP O ¥ 5,942 6,900 16 28,612 106.2 (2) (1) 1 (5) (3) (7) (2) 6 11 18 Dec-15 23 6 6 30.1 24.4 23.1 21.7 99 96 1.5 17.1 4.0 1.9 11.5 (25)
Kirin Holdings 2503 JP U ¥ 1,768 1,250 (29) 15,483 52.5 (3) (1) 6 7 2 (9) (2) 11 23 23 Dec-15 223 14 9 n.m. 27.8 24.4 22.4 86 85 2.1 8.6 2.3 1.1 9.9 65
KOSE 4922 JP O ¥ 9,050 11,000 22 4,956 43.1 1 (1) (17) (20) (15) (5) (2) (12) (4) 6 Mar-16 18 9 11 27.7 23.5 21.6 19.5 96 96 1.1 14.1 3.1 1.7 9.5 (54)
Lion 4912 JP O ¥ 1,659 1,450 (13) 4,764 20.8 (4) 2 16 45 59 (10) 0 22 61 79 Dec-15 4 12 10 42.2 40.6 36.3 33.0 91 89 0.7 8.4 3.3 1.2 14.7 (34)
Okamoto 5122 JP O ¥ 1,062 1,450 37 1,002 6.3 (8) (2) 14 (4) 107 (13) (3) 20 12 127 Mar-15 95 11 19 36.5 18.7 16.9 14.1 110 100 0.9 11.4 2.0 1.1 9.5 (20)
PALTAC 8283 JP O ¥ 2,208 2,600 18 1,347 3.7 (2) 8 11 2 (1) (7) 7 16 18 20 Mar-16 13 4 4 11.8 10.4 10.0 9.6 103 99 2.4 8.4 0.9 0.2 7.0 10
Pigeon 7956 JP N ¥ 2,669 3,450 29 3,069 36.5 (9) (22) (10) (10) (26) (15) (23) (5) 6 (6) Jan-16 3 9 11 31.3 30.4 28.0 25.2 99 95 1.6 20.1 5.8 3.2 17.0 (36)
Pola Orbis Holdings 4927 JP N ¥ 9,510 10,200 7 5,047 23.1 (3) 2 3 19 33 (9) 1 8 35 54 Dec-15 32 (1) 11 37.3 28.3 28.4 25.6 102 99 2.2 10.2 2.8 2.0 13.3 (36)
Rohto Pharma 4527 JP N ¥ 1,560 1,700 9 1,706 9.0 3 (5) (22) (36) (24) (2) (6) (17) (20) (3) Mar-16 5 9 5 19.5 18.5 16.9 16.1 99 101 1.3 8.4 1.5 0.9 7.1 (23)
Shiseido 4911 JP N ¥ 2,915 2,900 (1) 11,158 55.6 1 4 16 15 3 (4) 3 21 31 24 Dec-15 64 (18) 13 50.1 30.6 37.5 33.2 111 95 0.7 9.3 2.8 1.4 15.0 2
Suntory Beverage & Food 2587 JT N ¥ 4,540 5,200 15 13,467 32.5 (2) (11) (7) (15) (12) (7) (12) (2) 1 8 Dec-15 1 7 4 33.0 32.6 30.5 29.2 98 90 1.5 7.2 2.3 1.1 9.1 37
Unicharm 8113 JP U ¥ 2,153 1,900 (12) 12,307 57.6 (7) 4 (16) (13) (26) (13) 3 (11) 3 (5) Dec-15 2 5 5 31.9 31.3 29.8 28.5 89 83 0.7 10.4 3.2 1.6 10.6 (26)
Sector Aggregate 9 198,464 (1) 0 (4) (3) (3) (6) (1) 2 13 18 Mar-15 14 10 5 28.1 24.7 22.4 21.4 100 97 1.9 12.1 3.0 1.6 10.9 7
Diversified Financials Takehito Yamanaka - 81 3 4550 9150
ACOM 8572 JP N ¥ 506 607 20 7,610 29.0 4 (2) (15) (12) (3) (2) (4) (10) 4 17 Mar-16 359 7 (5) 54.3 11.8 11.1 11.6 98 100 1.0 18.8 2.0 n.a. n.a. n.a.
Aeon Financial Service 8570 JP N ¥ 2,332 2,300 (1) 4,449 18.2 5 7 (4) (14) (34) (0) 6 1 2 (13) Mar-16 6 13 7 13.6 12.9 11.4 10.6 99 103 2.9 12.5 1.5 n.a. n.a. n.a.
Credit Saison 8253 JP O ¥ 1,764 2,650 50 2,767 21.9 8 (5) (13) (27) (37) 2 (6) (8) (11) (16) Mar-15 137 65 (2) 25.6 10.8 6.6 6.7 111 113 2.0 6.0 0.7 n.a. n.a. n.a.
Daiwa Securities Group 8601 JP U ¥ 599 450 (25) 9,729 59.5 16 3 (13) (20) (36) 11 2 (8) (4) (15) Mar-16 (38) (1) 7 8.7 14.0 14.2 13.3 85 75 3.0 5.8 0.8 n.a. n.a. n.a.
J Trust 8508 JP O ¥ 764 1,150 51 825 2.2 3 (11) (12) (21) (29) (2) (12) (7) (5) (8) Mar-16 251 23 65 n.m. 10.0 8.1 4.9 100 100 1.6 5.2 0.5 n.a. n.a. n.a.
Japan Exchange Group 8697 JP U ¥ 1,334 995 (25) 7,031 31.2 19 9 (23) (30) (36) 13 8 (18) (14) (16) Mar-16 (9) 9 2 16.3 18.0 16.6 16.3 109 119 3.4 15.2 2.6 n.a. n.a. n.a.
Kabu.com Securities 8703 JP N ¥ 337 380 13 1,094 3.9 7 1 (8) (11) (21) 2 (0) (3) 5 (0) Mar-16 (9) (1) 4 14.2 15.6 15.8 15.2 107 102 3.6 15.8 2.3 n.a. n.a. n.a.
Matsui Securities 8628 JP N ¥ 917 1,025 12 2,260 10.8 9 4 (3) (18) (18) 4 2 2 (2) 3 Mar-15 (4) 6 11 15.1 15.8 14.9 13.5 101 111 4.9 15.6 2.3 n.a. n.a. n.a.
Monex Group 8698 JP U ¥ 252 260 3 679 5.6 14 0 (11) (21) (25) 8 (1) (6) (5) (4) Mar-15 16 28 59 20.8 17.9 14.0 8.8 113 131 3.8 4.8 0.8 n.a. n.a. n.a.
Nomura Holdings 8604 JP N ¥ 401 377 (6) 13,742 122.2 13 (3) (22) (41) (55) 8 (5) (17) (25) (35) Mar-16 5 42 11 11.3 10.8 7.6 6.9 118 131 3.2 4.9 0.5 n.a. n.a. n.a.
Orix 8591 JP O ¥ 1,409 1,950 38 17,735 109.3 10 1 (14) (18) (22) 5 (0) (9) (2) (1) Mar-16 5 6 6 7.1 6.8 6.4 6.0 102 100 3.7 11.3 0.7 n.a. n.a. n.a.
Tokai Tokyo Financial 8616 JP U ¥ 477 420 (12) 1,199 8.5 13 2 (20) (36) (48) 7 0 (15) (20) (28) Mar-16 (7) (15) (2) 10.2 11.0 12.8 13.1 103 79 5.0 7.4 0.8 n.a. n.a. n.a.
Sector Aggregate 8 69,120 11 1 (15) (24) (32) 6 (0) (10) (8) (11) Mar-15 (16) 9 12 9.3 11.0 10.1 8.9 102 104 3.2 8.3 0.9 n.a. n.a. n.a.
Energy David Hewitt - 65 6212 3064
INPEX Corp 1605 JP O ¥ 802 1,180 47 11,236 69.1 5 (4) (9) (32) (41) (1) (5) (3) (16) (21) Mar-16 92 80 147 69.8 36.4 20.2 8.2 100 82 2.2 1.3 0.5 1.6 3.6 6
Japan Petroleum Exploration 1662 JP N ¥ 2,084 2,310 11 1,143 9.6 3 (6) (18) (36) (46) (3) (7) (13) (20) (25) Mar-16 (1) 354 12 57.0 57.5 12.7 11.3 60 89 2.4 0.6 0.3 1.0 14.3 14
Sector Aggregate 44 12,380 5 (4) (9) (33) (42) (1) (5) (4) (17) (21) Mar-15 (82) 81 96 12.0 68.3 37.7 19.2 100 96 2.2 0.6 0.4 1.0 2.6 (0)
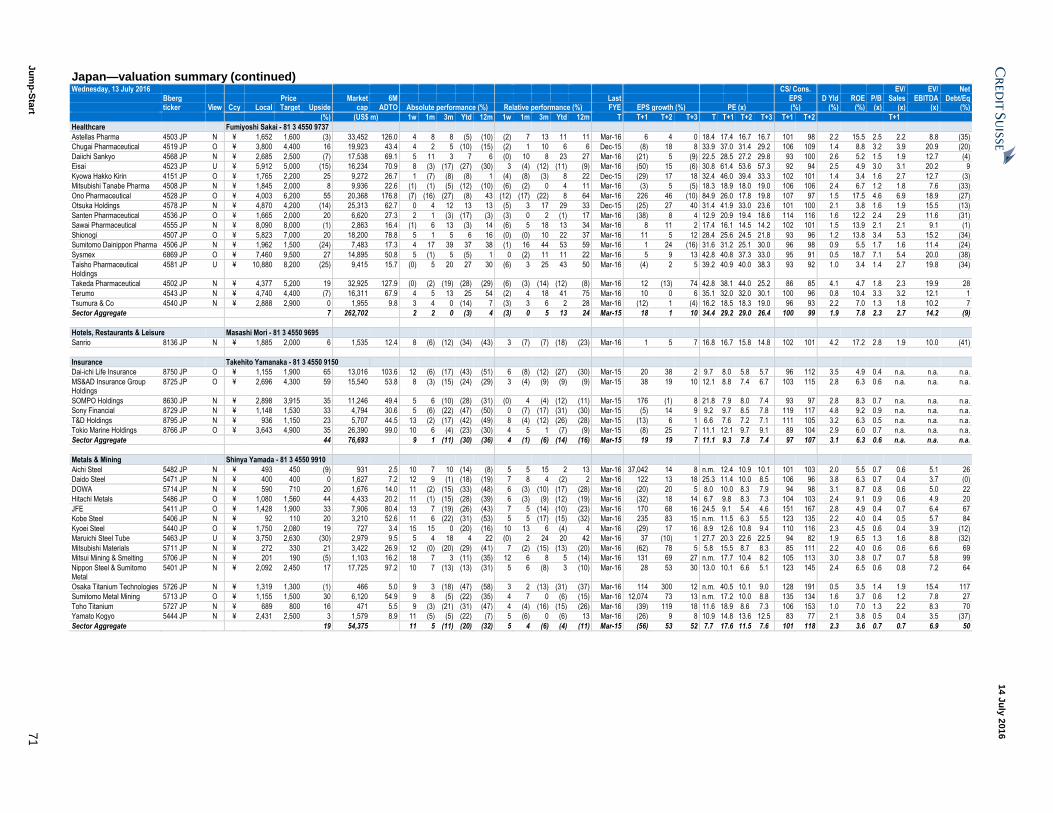
Ju
mp
-Sta
rt 7
1
14 J
uly
201
6
Japan—valuation summary (continued) Wednesday, 13 July 2016
CS/ Cons. EV/ EV/ Net
Bberg Price Market 6M Last EPS D Yld ROE P/B Sales EBITDA Debt/Eq ticker View Ccy Local Target Upside cap ADTO Absolute performance (%) Relative performance (%) FYE EPS growth (%) PE (x) (%) (%) (%) (x) (x) (x) (%)
(%) (US$ m) 1w 1m 3m Ytd 12m 1w 1m 3m Ytd 12m T T+1 T+2 T+3 T T+1 T+2 T+3 T+1 T+2 T+1
Healthcare Fumiyoshi Sakai - 81 3 4550 9737
Astellas Pharma 4503 JP N ¥ 1,652 1,600 (3) 33,452 126.0 4 8 8 (5) (10) (2) 7 13 11 11 Mar-16 6 4 0 18.4 17.4 16.7 16.7 101 98 2.2 15.5 2.5 2.2 8.8 (35)
Chugai Pharmaceutical 4519 JP O ¥ 3,800 4,400 16 19,923 43.4 4 2 5 (10) (15) (2) 1 10 6 6 Dec-15 (8) 18 8 33.9 37.0 31.4 29.2 106 109 1.4 8.8 3.2 3.9 20.9 (20)
Daiichi Sankyo 4568 JP N ¥ 2,685 2,500 (7) 17,538 69.1 5 11 3 7 6 (0) 10 8 23 27 Mar-16 (21) 5 (9) 22.5 28.5 27.2 29.8 93 100 2.6 5.2 1.5 1.9 12.7 (4)
Eisai 4523 JP U ¥ 5,912 5,000 (15) 16,234 70.9 8 (3) (17) (27) (30) 3 (4) (12) (11) (9) Mar-16 (50) 15 (6) 30.8 61.4 53.6 57.3 92 94 2.5 4.9 3.0 3.1 20.2 9
Kyowa Hakko Kirin 4151 JP O ¥ 1,765 2,200 25 9,272 26.7 1 (7) (8) (8) 1 (4) (8) (3) 8 22 Dec-15 (29) 17 18 32.4 46.0 39.4 33.3 102 101 1.4 3.4 1.6 2.7 12.7 (3)
Mitsubishi Tanabe Pharma 4508 JP N ¥ 1,845 2,000 8 9,936 22.6 (1) (1) (5) (12) (10) (6) (2) 0 4 11 Mar-16 (3) 5 (5) 18.3 18.9 18.0 19.0 106 106 2.4 6.7 1.2 1.8 7.6 (33)
Ono Pharmaceutical 4528 JP O ¥ 4,003 6,200 55 20,368 176.8 (7) (16) (27) (8) 43 (12) (17) (22) 8 64 Mar-16 226 46 (10) 84.9 26.0 17.8 19.8 107 97 1.5 17.5 4.6 6.9 18.9 (27)
Otsuka Holdings 4578 JP N ¥ 4,870 4,200 (14) 25,313 62.7 0 4 12 13 13 (5) 3 17 29 33 Dec-15 (25) 27 40 31.4 41.9 33.0 23.6 101 100 2.1 3.8 1.6 1.9 15.5 (13)
Santen Pharmaceutical 4536 JP O ¥ 1,665 2,000 20 6,620 27.3 2 1 (3) (17) (3) (3) 0 2 (1) 17 Mar-16 (38) 8 4 12.9 20.9 19.4 18.6 114 116 1.6 12.2 2.4 2.9 11.6 (31)
Sawai Pharmaceutical 4555 JP N ¥ 8,090 8,000 (1) 2,863 16.4 (1) 6 13 (3) 14 (6) 5 18 13 34 Mar-16 8 11 2 17.4 16.1 14.5 14.2 102 101 1.5 13.9 2.1 2.1 9.1 (1)
Shionogi 4507 JP O ¥ 5,823 7,000 20 18,200 78.8 5 1 5 6 16 (0) (0) 10 22 37 Mar-16 11 5 12 28.4 25.6 24.5 21.8 93 96 1.2 13.8 3.4 5.3 15.2 (34)
Sumitomo Dainippon Pharma 4506 JP N ¥ 1,962 1,500 (24) 7,483 17.3 4 17 39 37 38 (1) 16 44 53 59 Mar-16 1 24 (16) 31.6 31.2 25.1 30.0 96 98 0.9 5.5 1.7 1.6 11.4 (24)
Sysmex 6869 JP O ¥ 7,460 9,500 27 14,895 50.8 5 (1) 5 (5) 1 0 (2) 11 11 22 Mar-16 5 9 13 42.8 40.8 37.3 33.0 95 91 0.5 18.7 7.1 5.4 20.0 (38)
Taisho Pharmaceutical Holdings
4581 JP U ¥ 10,880 8,200 (25) 9,415 15.7 (0) 5 20 27 30 (6) 3 25 43 50 Mar-16 (4) 2 5 39.2 40.9 40.0 38.3 93 92 1.0 3.4 1.4 2.7 19.8 (34)
Takeda Pharmaceutical 4502 JP N ¥ 4,377 5,200 19 32,925 127.9 (0) (2) (19) (28) (29) (6) (3) (14) (12) (8) Mar-16 12 (13) 74 42.8 38.1 44.0 25.2 86 85 4.1 4.7 1.8 2.3 19.9 28
Terumo 4543 JP N ¥ 4,740 4,400 (7) 16,311 67.9 4 5 13 25 54 (2) 4 18 41 75 Mar-16 10 0 6 35.1 32.0 32.0 30.1 100 96 0.8 10.4 3.3 3.2 12.1 1
Tsumura & Co 4540 JP N ¥ 2,888 2,900 0 1,955 9.8 3 4 0 (14) 7 (3) 3 6 2 28 Mar-16 (12) 1 (4) 16.2 18.5 18.3 19.0 96 93 2.2 7.0 1.3 1.8 10.2 7
Sector Aggregate 7 262,702 2 2 0 (3) 4 (3) 0 5 13 24 Mar-15 18 1 10 34.4 29.2 29.0 26.4 100 99 1.9 7.8 2.3 2.7 14.2 (9)
Hotels, Restaurants & Leisure Masashi Mori - 81 3 4550 9695
Sanrio 8136 JP N ¥ 1,885 2,000 6 1,535 12.4 8 (6) (12) (34) (43) 3 (7) (7) (18) (23) Mar-16 1 5 7 16.8 16.7 15.8 14.8 102 101 4.2 17.2 2.8 1.9 10.0 (41)
Insurance Takehito Yamanaka - 81 3 4550 9150
Dai-ichi Life Insurance 8750 JP O ¥ 1,155 1,900 65 13,016 103.6 12 (6) (17) (43) (51) 6 (8) (12) (27) (30) Mar-15 20 38 2 9.7 8.0 5.8 5.7 96 112 3.5 4.9 0.4 n.a. n.a. n.a.
MS&AD Insurance Group Holdings
8725 JP O ¥ 2,696 4,300 59 15,540 53.8 8 (3) (15) (24) (29) 3 (4) (9) (9) (9) Mar-15 38 19 10 12.1 8.8 7.4 6.7 103 115 2.8 6.3 0.6 n.a. n.a. n.a.
SOMPO Holdings 8630 JP N ¥ 2,898 3,915 35 11,246 49.4 5 6 (10) (28) (31) (0) 4 (4) (12) (11) Mar-15 176 (1) 8 21.8 7.9 8.0 7.4 93 97 2.8 8.3 0.7 n.a. n.a. n.a.
Sony Financial 8729 JP N ¥ 1,148 1,530 33 4,794 30.6 5 (6) (22) (47) (50) 0 (7) (17) (31) (30) Mar-15 (5) 14 9 9.2 9.7 8.5 7.8 119 117 4.8 9.2 0.9 n.a. n.a. n.a.
T&D Holdings 8795 JP N ¥ 936 1,150 23 5,707 44.5 13 (2) (17) (42) (49) 8 (4) (12) (26) (28) Mar-15 (13) 6 1 6.6 7.6 7.2 7.1 111 105 3.2 6.3 0.5 n.a. n.a. n.a.
Tokio Marine Holdings 8766 JP O ¥ 3,643 4,900 35 26,390 99.0 10 6 (4) (23) (30) 4 5 1 (7) (9) Mar-15 (8) 25 7 11.1 12.1 9.7 9.1 89 104 2.9 6.0 0.7 n.a. n.a. n.a.
Sector Aggregate 44 76,693 9 1 (11) (30) (36) 4 (1) (6) (14) (16) Mar-15 19 19 7 11.1 9.3 7.8 7.4 97 107 3.1 6.3 0.6 n.a. n.a. n.a.
Metals & Mining Shinya Yamada - 81 3 4550 9910
Aichi Steel 5482 JP N ¥ 493 450 (9) 931 2.5 10 7 10 (14) (8) 5 5 15 2 13 Mar-16 37,042 14 8 n.m. 12.4 10.9 10.1 101 103 2.0 5.5 0.7 0.6 5.1 26
Daido Steel 5471 JP N ¥ 400 400 0 1,627 7.2 12 9 (1) (18) (19) 7 8 4 (2) 2 Mar-16 122 13 18 25.3 11.4 10.0 8.5 106 96 3.8 6.3 0.7 0.4 3.7 (0)
DOWA 5714 JP N ¥ 590 710 20 1,676 14.0 11 (2) (15) (33) (48) 6 (3) (10) (17) (28) Mar-16 (20) 20 5 8.0 10.0 8.3 7.9 94 98 3.1 8.7 0.8 0.6 5.0 22
Hitachi Metals 5486 JP O ¥ 1,080 1,560 44 4,433 20.2 11 (1) (15) (28) (39) 6 (3) (9) (12) (19) Mar-16 (32) 18 14 6.7 9.8 8.3 7.3 104 103 2.4 9.1 0.9 0.6 4.9 20
JFE 5411 JP O ¥ 1,428 1,900 33 7,906 80.4 13 7 (19) (26) (43) 7 5 (14) (10) (23) Mar-16 170 68 16 24.5 9.1 5.4 4.6 151 167 2.8 4.9 0.4 0.7 6.4 67
Kobe Steel 5406 JP N ¥ 92 110 20 3,210 52.6 11 6 (22) (31) (53) 5 5 (17) (15) (32) Mar-16 235 83 15 n.m. 11.5 6.3 5.5 123 135 2.2 4.0 0.4 0.5 5.7 84
Kyoei Steel 5440 JP O ¥ 1,750 2,080 19 727 3.4 15 15 0 (20) (16) 10 13 6 (4) 4 Mar-16 (29) 17 16 8.9 12.6 10.8 9.4 110 116 2.3 4.5 0.6 0.4 3.9 (12)
Maruichi Steel Tube 5463 JP U ¥ 3,750 2,630 (30) 2,979 9.5 5 4 18 4 22 (0) 2 24 20 42 Mar-16 37 (10) 1 27.7 20.3 22.6 22.5 94 82 1.9 6.5 1.3 1.6 8.8 (32)
Mitsubishi Materials 5711 JP N ¥ 272 330 21 3,422 26.9 12 (0) (20) (29) (41) 7 (2) (15) (13) (20) Mar-16 (62) 78 5 5.8 15.5 8.7 8.3 85 111 2.2 4.0 0.6 0.6 6.6 69
Mitsui Mining & Smelting 5706 JP N ¥ 201 190 (5) 1,103 16.2 18 7 3 (11) (35) 12 6 8 5 (14) Mar-16 131 69 27 n.m. 17.7 10.4 8.2 105 113 3.0 3.8 0.7 0.7 5.8 99
Nippon Steel & Sumitomo Metal
5401 JP N ¥ 2,092 2,450 17 17,725 97.2 10 7 (13) (13) (31) 5 6 (8) 3 (10) Mar-16 28 53 30 13.0 10.1 6.6 5.1 123 145 2.4 6.5 0.6 0.8 7.2 64
Osaka Titanium Technologies 5726 JP N ¥ 1,319 1,300 (1) 466 5.0 9 3 (18) (47) (58) 3 2 (13) (31) (37) Mar-16 114 300 12 n.m. 40.5 10.1 9.0 128 191 0.5 3.5 1.4 1.9 15.4 117
Sumitomo Metal Mining 5713 JP O ¥ 1,155 1,500 30 6,120 54.9 9 8 (5) (22) (35) 4 7 0 (6) (15) Mar-16 12,074 73 13 n.m. 17.2 10.0 8.8 135 134 1.6 3.7 0.6 1.2 7.8 27
Toho Titanium 5727 JP N ¥ 689 800 16 471 5.5 9 (3) (21) (31) (47) 4 (4) (16) (15) (26) Mar-16 (39) 119 18 11.6 18.9 8.6 7.3 106 153 1.0 7.0 1.3 2.2 8.3 70
Yamato Kogyo 5444 JP N ¥ 2,431 2,500 3 1,579 8.9 11 (5) (5) (22) (7) 5 (6) 0 (6) 13 Mar-16 (26) 9 8 10.9 14.8 13.6 12.5 83 77 2.1 3.8 0.5 0.4 3.5 (37)
Sector Aggregate 19 54,375 11 5 (11) (20) (32) 5 4 (6) (4) (11) Mar-15 (56) 53 52 7.7 17.6 11.5 7.6 101 118 2.3 3.6 0.7 0.7 6.9 50
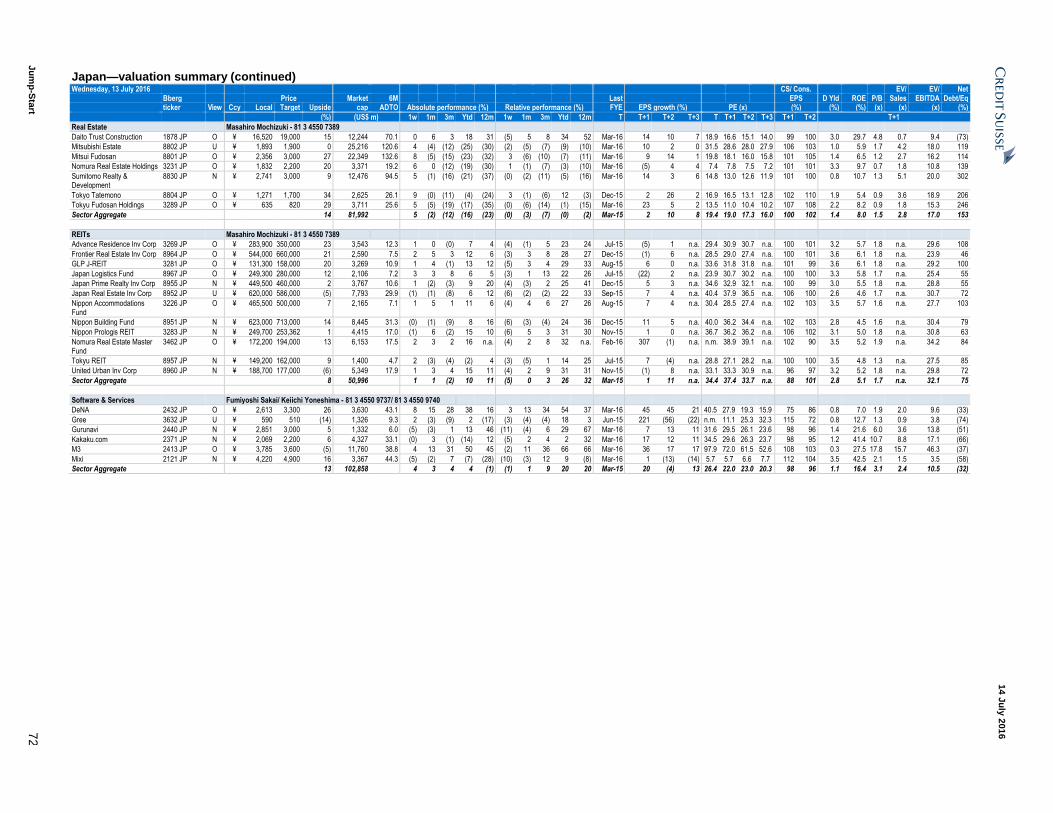
Ju
mp
-Sta
rt 7
2
14 J
uly
201
6
Japan—valuation summary (continued) Wednesday, 13 July 2016
CS/ Cons. EV/ EV/ Net
Bberg Price Market 6M Last EPS D Yld ROE P/B Sales EBITDA Debt/Eq ticker View Ccy Local Target Upside cap ADTO Absolute performance (%) Relative performance (%) FYE EPS growth (%) PE (x) (%) (%) (%) (x) (x) (x) (%)
(%) (US$ m) 1w 1m 3m Ytd 12m 1w 1m 3m Ytd 12m T T+1 T+2 T+3 T T+1 T+2 T+3 T+1 T+2 T+1
Real Estate Masahiro Mochizuki - 81 3 4550 7389
Daito Trust Construction 1878 JP O ¥ 16,520 19,000 15 12,244 70.1 0 6 3 18 31 (5) 5 8 34 52 Mar-16 14 10 7 18.9 16.6 15.1 14.0 99 100 3.0 29.7 4.8 0.7 9.4 (73)
Mitsubishi Estate 8802 JP U ¥ 1,893 1,900 0 25,216 120.6 4 (4) (12) (25) (30) (2) (5) (7) (9) (10) Mar-16 10 2 0 31.5 28.6 28.0 27.9 106 103 1.0 5.9 1.7 4.2 18.0 119
Mitsui Fudosan 8801 JP O ¥ 2,356 3,000 27 22,349 132.6 8 (5) (15) (23) (32) 3 (6) (10) (7) (11) Mar-16 9 14 1 19.8 18.1 16.0 15.8 101 105 1.4 6.5 1.2 2.7 16.2 114
Nomura Real Estate Holdings 3231 JP O ¥ 1,832 2,200 20 3,371 19.2 6 0 (12) (19) (30) 1 (1) (7) (3) (10) Mar-16 (5) 4 4 7.4 7.8 7.5 7.2 101 101 3.3 9.7 0.7 1.8 10.8 139
Sumitomo Realty & Development
8830 JP N ¥ 2,741 3,000 9 12,476 94.5 5 (1) (16) (21) (37) (0) (2) (11) (5) (16) Mar-16 14 3 6 14.8 13.0 12.6 11.9 101 100 0.8 10.7 1.3 5.1 20.0 302
Tokyo Tatemono 8804 JP O ¥ 1,271 1,700 34 2,625 26.1 9 (0) (11) (4) (24) 3 (1) (6) 12 (3) Dec-15 2 26 2 16.9 16.5 13.1 12.8 102 110 1.9 5.4 0.9 3.6 18.9 206
Tokyu Fudosan Holdings 3289 JP O ¥ 635 820 29 3,711 25.6 5 (5) (19) (17) (35) (0) (6) (14) (1) (15) Mar-16 23 5 2 13.5 11.0 10.4 10.2 107 108 2.2 8.2 0.9 1.8 15.3 246
Sector Aggregate 14 81,992 5 (2) (12) (16) (23) (0) (3) (7) (0) (2) Mar-15 2 10 8 19.4 19.0 17.3 16.0 100 102 1.4 8.0 1.5 2.8 17.0 153
REITs Masahiro Mochizuki - 81 3 4550 7389
Advance Residence Inv Corp 3269 JP O ¥ 283,900 350,000 23 3,543 12.3 1 0 (0) 7 4 (4) (1) 5 23 24 Jul-15 (5) 1 n.a. 29.4 30.9 30.7 n.a. 100 101 3.2 5.7 1.8 n.a. 29.6 108
Frontier Real Estate Inv Corp 8964 JP O ¥ 544,000 660,000 21 2,590 7.5 2 5 3 12 6 (3) 3 8 28 27 Dec-15 (1) 6 n.a. 28.5 29.0 27.4 n.a. 100 101 3.6 6.1 1.8 n.a. 23.9 46
GLP J-REIT 3281 JP O ¥ 131,300 158,000 20 3,269 10.9 1 4 (1) 13 12 (5) 3 4 29 33 Aug-15 6 0 n.a. 33.6 31.8 31.8 n.a. 101 99 3.6 6.1 1.8 n.a. 29.2 100
Japan Logistics Fund 8967 JP O ¥ 249,300 280,000 12 2,106 7.2 3 3 8 6 5 (3) 1 13 22 26 Jul-15 (22) 2 n.a. 23.9 30.7 30.2 n.a. 100 100 3.3 5.8 1.7 n.a. 25.4 55
Japan Prime Realty Inv Corp 8955 JP N ¥ 449,500 460,000 2 3,767 10.6 1 (2) (3) 9 20 (4) (3) 2 25 41 Dec-15 5 3 n.a. 34.6 32.9 32.1 n.a. 100 99 3.0 5.5 1.8 n.a. 28.8 55
Japan Real Estate Inv Corp 8952 JP U ¥ 620,000 586,000 (5) 7,793 29.9 (1) (1) (8) 6 12 (6) (2) (2) 22 33 Sep-15 7 4 n.a. 40.4 37.9 36.5 n.a. 106 100 2.6 4.6 1.7 n.a. 30.7 72
Nippon Accommodations Fund
3226 JP O ¥ 465,500 500,000 7 2,165 7.1 1 5 1 11 6 (4) 4 6 27 26 Aug-15 7 4 n.a. 30.4 28.5 27.4 n.a. 102 103 3.5 5.7 1.6 n.a. 27.7 103
Nippon Building Fund 8951 JP N ¥ 623,000 713,000 14 8,445 31.3 (0) (1) (9) 8 16 (6) (3) (4) 24 36 Dec-15 11 5 n.a. 40.0 36.2 34.4 n.a. 102 103 2.8 4.5 1.6 n.a. 30.4 79
Nippon Prologis REIT 3283 JP N ¥ 249,700 253,362 1 4,415 17.0 (1) 6 (2) 15 10 (6) 5 3 31 30 Nov-15 1 0 n.a. 36.7 36.2 36.2 n.a. 106 102 3.1 5.0 1.8 n.a. 30.8 63
Nomura Real Estate Master Fund
3462 JP O ¥ 172,200 194,000 13 6,153 17.5 2 3 2 16 n.a. (4) 2 8 32 n.a. Feb-16 307 (1) n.a. n.m. 38.9 39.1 n.a. 102 90 3.5 5.2 1.9 n.a. 34.2 84
Tokyu REIT 8957 JP N ¥ 149,200 162,000 9 1,400 4.7 2 (3) (4) (2) 4 (3) (5) 1 14 25 Jul-15 7 (4) n.a. 28.8 27.1 28.2 n.a. 100 100 3.5 4.8 1.3 n.a. 27.5 85
United Urban Inv Corp 8960 JP N ¥ 188,700 177,000 (6) 5,349 17.9 1 3 4 15 11 (4) 2 9 31 31 Nov-15 (1) 8 n.a. 33.1 33.3 30.9 n.a. 96 97 3.2 5.2 1.8 n.a. 29.8 72
Sector Aggregate 8 50,996 1 1 (2) 10 11 (5) 0 3 26 32 Mar-15 1 11 n.a. 34.4 37.4 33.7 n.a. 88 101 2.8 5.1 1.7 n.a. 32.1 75
Software & Services Fumiyoshi Sakai/ Keiichi Yoneshima - 81 3 4550 9737/ 81 3 4550 9740
DeNA 2432 JP O ¥ 2,613 3,300 26 3,630 43.1 8 15 28 38 16 3 13 34 54 37 Mar-16 45 45 21 40.5 27.9 19.3 15.9 75 86 0.8 7.0 1.9 2.0 9.6 (33)
Gree 3632 JP U ¥ 590 510 (14) 1,326 9.3 2 (3) (9) 2 (17) (3) (4) (4) 18 3 Jun-15 221 (56) (22) n.m. 11.1 25.3 32.3 115 72 0.8 12.7 1.3 0.9 3.8 (74)
Gurunavi 2440 JP N ¥ 2,851 3,000 5 1,332 6.0 (5) (3) 1 13 46 (11) (4) 6 29 67 Mar-16 7 13 11 31.6 29.5 26.1 23.6 98 96 1.4 21.6 6.0 3.6 13.8 (51)
Kakaku.com 2371 JP N ¥ 2,069 2,200 6 4,327 33.1 (0) 3 (1) (14) 12 (5) 2 4 2 32 Mar-16 17 12 11 34.5 29.6 26.3 23.7 98 95 1.2 41.4 10.7 8.8 17.1 (66)
M3 2413 JP O ¥ 3,785 3,600 (5) 11,760 38.8 4 13 31 50 45 (2) 11 36 66 66 Mar-16 36 17 17 97.9 72.0 61.5 52.6 108 103 0.3 27.5 17.8 15.7 46.3 (37)
Mixi 2121 JP N ¥ 4,220 4,900 16 3,367 44.3 (5) (2) 7 (7) (28) (10) (3) 12 9 (8) Mar-16 1 (13) (14) 5.7 5.7 6.6 7.7 112 104 3.5 42.5 2.1 1.5 3.5 (58)
Sector Aggregate 13 102,858 4 3 4 4 (1) (1) 1 9 20 20 Mar-15 20 (4) 13 26.4 22.0 23.0 20.3 98 96 1.1 16.4 3.1 2.4 10.5 (32)

Ju
mp
-Sta
rt 7
3
14 J
uly
201
6
Japan—valuation summary (continued) Wednesday, 13 July 2016
CS/ Cons. EV/ EV/ Net
Bberg Price Market 6M Last EPS D Yld ROE P/B Sales EBITDA Debt/Eq ticker View Ccy Local Target Upside cap ADTO Absolute performance (%) Relative performance (%) FYE EPS growth (%) PE (x) (%) (%) (%) (x) (x) (x) (%)
(%) (US$ m) 1w 1m 3m Ytd 12m 1w 1m 3m Ytd 12m T T+1 T+2 T+3 T T+1 T+2 T+3 T+1 T+2 T+1
Technology Hardware Akinori Kanemoto/ Hideyuki Maekawa/ Shinji Kuroda - 81 3 4550 7363/ 81 3 4550 9723/ 81 3 4550 9994
Advantest 6857 JP U ¥ 1,155 765 (34) 1,936 22.9 11 2 9 14 (9) 6 1 14 30 12 Mar-16 (55) (75) (211) 25.4 55.9 n.m. n.m. 59 13 1.3 2.7 1.5 0.7 10.7 (73)
Alps Electric 6770 JP O ¥ 1,942 2,900 49 3,652 98.2 11 (11) (2) (41) (47) 6 (13) 3 (25) (27) Mar-16 (2) 17 4 9.7 9.9 8.5 8.1 115 113 1.5 15.6 1.5 0.4 3.3 (23)
DISCO 6146 JP N ¥ 10,120 9,450 (7) 3,477 30.7 14 3 0 (12) 2 9 2 5 4 22 Mar-16 (25) (2) 13 15.7 20.9 21.3 18.8 87 74 2.5 10.1 2.1 2.5 9.4 (38)
Fujitsu 6702 JP N ¥ 390 450 15 7,753 55.8 10 (4) (7) (36) (43) 4 (5) (2) (20) (23) Mar-16 (7) 47 1 9.3 10.0 6.8 6.7 96 108 2.0 9.7 1.0 0.2 2.8 4
Hirose Electric 6806 JP N ¥ 12,780 12,200 (5) 4,290 14.2 6 (4) (5) (13) (22) 1 (5) (0) 3 (1) Mar-15 (7) (5) 5 18.9 20.3 21.5 20.4 106 105 1.9 7.6 1.5 2.3 6.7 (61)
Hitachi 6501 JP O ¥ 453 760 68 21,006 139.4 11 (1) (13) (34) (42) 6 (2) (8) (18) (21) Mar-15 (2) 38 15 9.1 9.3 6.7 5.9 137 141 2.6 7.5 0.7 0.5 4.3 56
Hitachi Kokusai Electric 6756 JP O ¥ 1,574 1,980 26 1,552 15.1 (4) 4 18 (5) (11) (9) 3 23 11 10 Mar-16 14 5 (9) 12.4 10.9 10.4 11.4 129 113 1.9 14.5 1.5 0.6 3.9 (53)
IBIDEN 4062 JP N ¥ 1,212 1,370 13 1,548 17.3 13 (3) (19) (30) (40) 8 (4) (13) (14) (20) Mar-15 (28) (42) 38 8.8 12.1 21.0 15.2 181 1,476 2.9 3.7 0.4 0.3 1.6 (15)
Japan Aviation Electronics Industry
6807 JP N ¥ 1,450 1,350 (7) 1,265 13.8 10 (5) 9 (17) (52) 5 (7) 15 (1) (31) Mar-15 (21) 2 17 8.4 10.5 10.3 8.9 100 116 2.1 12.1 1.2 0.6 3.0 (22)
Kyocera 6971 JP N ¥ 5,190 5,800 12 18,278 73.8 10 2 0 (8) (19) 4 1 5 8 1 Mar-15 (27) 0 8 16.4 22.6 22.5 20.9 77 103 1.9 3.8 0.8 0.8 8.1 (29)
Mitsubishi Electric 6503 JP N ¥ 1,235 1,340 9 25,451 89.8 7 (2) (1) (4) (19) 2 (3) 4 12 2 Mar-15 (8) 7 12 11.3 12.2 11.4 10.2 95 112 2.3 11.4 1.4 0.6 5.2 (11)
Mitsumi Electric 6767 JP N ¥ 445 500 12 347 4.9 17 (2) (18) (35) (46) 11 (3) (13) (19) (25) Mar-15 (252) 78 19 10.2 n.m. n.m. n.m. 174 129 0.0 (6.0) 0.4 0.1 5.9 (13)
Murata Manufacturing 6981 JP O ¥ 12,250 16,500 35 25,018 182.1 16 1 (16) (30) (38) 11 0 (11) (14) (17) Mar-16 (8) 14 12 12.7 13.9 12.2 10.9 107 109 1.8 14.4 1.9 1.8 5.9 (33)
NEC 6701 JP N ¥ 274 265 (3) 6,835 52.6 11 11 (6) (29) (28) 6 10 (1) (13) (7) Mar-16 (14) 19 11 10.4 12.1 10.2 9.1 98 105 2.2 7.6 0.9 0.4 6.1 35
NGK Spark Plug 5334 JP O ¥ 1,634 2,550 56 3,414 27.1 15 (11) (27) (49) (49) 9 (12) (22) (33) (29) Mar-16 6 18 28 11.5 10.8 9.2 7.2 99 103 2.6 9.2 1.0 0.9 4.7 (8)
Nidec 6594 JP O ¥ 8,234 10,000 21 23,395 117.5 14 5 8 (7) (14) 9 4 13 9 6 Mar-16 19 10 10 26.7 22.4 20.4 18.6 109 106 1.2 13.6 2.9 2.0 11.5 (6)
Nissha Printing 7915 JP N ¥ 1,886 2,100 11 777 8.6 4 (15) 10 (20) (12) (1) (16) 15 (4) 9 Mar-15 (40) 15 (6) 7.2 11.9 10.4 11.1 98 141 1.6 11.8 1.2 0.5 3.3 (33)
ROHM 6963 JP O ¥ 4,240 7,300 72 4,305 33.0 13 (4) (15) (31) (44) 8 (5) (10) (15) (24) Mar-15 (32) (10) 26 10.1 14.9 16.6 13.2 117 147 3.1 4.1 0.6 0.4 1.8 (42)
SCREEN 7735 JP N ¥ 1,115 1,000 (10) 2,528 34.2 4 5 23 24 49 (2) 4 28 40 70 Mar-16 22 8 7 14.1 11.5 10.7 10.0 115 120 1.3 17.6 1.9 0.9 7.2 (4)
Shinko Electric Industries 6967 JP N ¥ 535 830 55 694 4.5 12 (7) (18) (32) (37) 7 (8) (13) (16) (16) Mar-15 (31) 47 18 11.2 16.4 11.1 9.4 127 366 4.7 3.2 0.5 0.2 1.0 (34)
Taiyo Yuden 6976 JP O ¥ 927 2,000 116 1,046 27.5 16 (13) (19) (45) (43) 11 (14) (14) (29) (23) Mar-15 38 2 10 10.8 7.8 7.7 7.0 95 167 1.6 9.6 0.7 0.5 2.6 8
TDK 6762 JP O ¥ 5,980 9,000 51 7,240 96.4 14 (2) (5) (24) (33) 8 (4) 0 (8) (12) Mar-15 38 3 5 15.2 11.0 10.7 10.2 105 47 2.0 8.9 1.0 0.6 4.2 0
Tokyo Electron 8035 JP O ¥ 8,730 10,200 17 13,747 89.2 4 13 17 19 9 (2) 11 22 35 29 Mar-16 25 16 (1) 18.9 15.1 13.1 13.1 110 116 3.3 16.2 2.3 1.6 7.4 (43)
Toshiba 6502 JP O ¥ 300 360 20 12,198 115.5 8 9 31 20 (21) 3 7 36 36 (1) Mar-16 138 (10) 16 n.m. 7.3 8.0 6.9 151 173 0.0 42.0 2.5 0.3 4.8 63
Wacom 6727 JP U ¥ 415 380 (8) 652 5.8 7 5 (13) (14) (9) 2 3 (8) 2 12 Mar-15 (8) 12 11 19.9 21.7 19.4 17.4 137 125 4.3 9.3 2.0 0.7 7.9 (39)
Yaskawa Electric Corp 6506 JP O ¥ 1,331 1,550 16 3,402 34.9 9 1 (4) (20) (16) 4 (1) 1 (4) 4 Mar-16 (16) 8 13 15.7 18.7 17.3 15.3 98 92 1.5 10.0 1.9 0.9 8.3 0
Yokogawa Electric Corp 6841 JP O ¥ 1,253 1,400 12 3,211 19.0 9 9 5 (14) (15) 4 8 10 1 5 Mar-16 (21) 5 4 11.0 13.9 13.2 12.7 99 98 2.0 9.7 1.3 0.7 5.6 (16)
Sector Aggregate 25 199,018 11 2 (1) (14) (24) 5 1 4 2 (3) Mar-15 (33) 76 12 14.6 21.6 12.3 11.0 105 111 1.8 5.9 1.3 0.6 6.7 5
Country Aggregate 1,300 1,471 13 2,289,573 5 1 (5) (16) (21) Mar-15 (0) 6 12 13.8 13.9 13.1 11.5 101 103 2.4 8.3 1.1 0.9 7.7 25
Note: Prices are as of 13 Jul 2016
* Country/ sector aggregates are for the coverage above
Source: Company data, Thomson Financial IBES, Credit Suisse estimates

Ju
mp
-Sta
rt 7
4
14 J
uly
201
6
South Korea—valuation summary Wednesday, 13 July 2016
CS/ Cons. EV/ EV/ Net
Bberg Price Market 6M Last EPS D Yld ROE P/B Sales EBITDA Debt/Eq ticker View Ccy Local Target Upside cap ADTO Absolute performance (%) Relative performance (%) FYE EPS growth (%) PE (x) (%) (%) (%) (x) (x) (x) (%)
(%) (US$ m) 1w 1m 3m Ytd 12m 1w 1m 3m Ytd 12m T T+1 T+2 T+3 T T+1 T+2 T+3 T+1 T+2 T+1
Automobiles & Components Michael Sohn - 82 2 3707 3739
Hankook Tire 161390 KS N W 55,000 55,000 0 5,939 11.4 8 6 4 17 34 6 5 4 15 37 Dec-15 7 4 7 10.4 9.7 9.3 8.7 92 92 0.8 12.8 1.2 1.3 6.1 33
HanOn 018880 KS U W 10,700 8,000 (25) 4,979 10.8 6 (10) 13 3 48 3 (11) 13 1 51 Dec-15 (76) 11 9 5.0 20.6 18.6 17.1 89 87 1.9 15.5 3.1 1.0 9.2 (11)
HMC 005380 KS O W 135,500 190,000 40 26,018 60.0 4 0 (11) (9) 8 2 (1) (10) (11) 11 Dec-15 2 11 3 6.0 5.9 5.3 5.2 90 97 2.6 10.0 0.6 0.1 1.6 (22)
Kia 000270 KS O W 41,850 50,000 19 14,788 39.1 1 (7) (13) (20) 3 (2) (9) (12) (23) 6 Dec-15 (1) 22 2 6.4 6.5 5.4 5.3 86 101 3.1 10.4 0.7 0.3 3.9 (7)
Mando 204320 KS O W 233,000 320,000 37 1,907 12.5 10 3 34 41 114 7 2 34 39 116 Dec-15 36 26 16 17.4 12.8 10.1 8.7 98 108 2.1 12.3 1.5 0.6 6.5 62
Mobis 012330 KS O W 261,000 320,000 23 22,147 35.5 5 3 9 6 32 3 1 9 4 35 Dec-15 11 5 5 8.2 7.4 7.1 6.8 102 100 1.9 12.6 0.9 0.5 5.6 (17)
Nexen Tire 002350 KS N W 13,400 14,500 8 1,126 2.0 1 (5) (13) 9 0 (2) (7) (12) 6 3 Dec-15 12 5 5 11.0 9.8 9.4 8.9 90 90 0.4 12.8 1.2 1.2 5.9 82
Wia 011210 KS N W 86,300 104,000 21 2,046 12.1 3 (6) (18) (23) (9) 0 (7) (17) (25) (6) Dec-15 3 16 4 7.2 7.0 6.0 5.7 102 95 1.0 10.1 0.7 0.3 4.1 9
Sector Aggregate 23 78,951 4 (1) (2) (3) 20 2 (2) (2) (5) 23 Dec-15 (3) 11 4 6.9 7.1 6.4 6.2 92 98 2.2 10.9 0.8 0.3 3.6 (13)
Banks Gil Kim - 82 2 3707 3763
BNK Financial Group 138930 KS O W 8,600 11,500 34 2,443 7.6 10 (2) (11) 2 (38) 7 (3) (10) (0) (35) Dec-15 (15) 5 2 4.5 5.3 5.1 5.0 99 96 2.9 9.4 0.4 n.a. n.a. n.a.
DGB Financial 139130 KS N W 8,680 9,600 11 1,279 4.4 2 (7) (5) (14) (23) (1) (8) (4) (16) (21) Dec-15 (4) 5 6 5.0 5.2 5.0 4.7 99 100 3.5 7.8 0.4 n.a. n.a. n.a.
IBK 024110 KS N W 11,250 13,000 16 5,492 12.8 1 (4) (9) (9) (19) (2) (5) (8) (11) (16) Dec-15 (0) 4 6 6.2 6.2 6.0 5.7 97 95 3.6 7.1 0.4 n.a. n.a. n.a.
KB Financial 105560 KS O W 33,400 46,000 38 11,249 27.9 5 (2) (1) 1 (9) 2 (4) (0) (2) (6) Dec-15 6 12 7 7.6 7.2 6.4 6.0 105 116 3.3 6.1 0.4 n.a. n.a. n.a.
SFG 055550 KS O W 38,550 52,000 35 15,935 28.7 3 (2) (8) (3) (6) 1 (3) (8) (5) (3) Dec-15 (1) 9 6 8.2 8.3 7.6 7.2 95 103 3.5 7.8 0.6 n.a. n.a. n.a.
Sector Aggregate 32 36,398 4 (3) (6) (3) (11) 1 (4) (6) (5) (9) Dec-15 (0) 9 6 7.1 7.2 6.6 6.2 99 104 3.4 7.2 0.5 n.a. n.a. n.a.
Building Materials & Construction Minseok Sinn - 82 2 3707 8898
KCC 002380 KS O W 379,000 500,000 32 3,488 8.6 2 (4) (9) (9) (28) (1) (5) (8) (11) (25) Dec-15 23 9 (4) 20.2 16.4 15.0 15.6 91 90 2.4 3.8 0.6 1.4 9.9 17
Capital Goods Hayoung Chung/ Henry Kwon/ Minseok Sinn - 822 3707 3795/ 82 2 3707 3732/ 82 2 3707 8898
Daelim Industrial 000210 KS N W 79,800 90,000 13 2,421 14.9 3 (2) (13) 19 (7) 0 (3) (13) 17 (4) Dec-15 0 40 (2) 14.9 14.9 10.7 10.9 65 72 0.4 4.7 0.7 0.3 8.9 14
Daewoo E&C 047040 KS N W 5,750 6,000 4 2,083 5.7 2 (2) (8) 3 (10) (1) (3) (7) 0 (8) Dec-15 (48) 151 18 16.7 32.4 12.9 10.9 40 68 0.0 2.6 0.8 0.4 10.2 74
DHI 034020 KS O W 24,250 31,800 31 2,244 15.1 13 13 (9) 18 (1) 11 11 (8) 15 2 Dec-15 112 23 19 n.m. 19.8 16.1 13.5 76 80 3.3 3.7 0.8 0.7 8.0 127
DSME 042660 KS O W 4,510 9,800 117 1,075 7.8 6 (4) (21) (11) (64) 4 (5) (20) (13) (61) Dec-15 101 296 35 n.m. 55.5 14.0 10.4 314 61 0.0 6.6 3.6 0.8 25.2 1,805
GS E&C 006360 KS N W 26,650 28,000 5 1,649 16.5 (3) (8) (9) 35 (6) (5) (9) (8) 33 (4) Dec-15 259 104 (3) 72.6 20.2 9.9 10.2 77 80 0.0 2.8 0.6 0.3 8.9 31
Hyundai Dev 012630 KS O W 39,350 65,000 65 2,586 14.4 3 (7) (19) 1 (45) (0) (8) (18) (1) (42) Dec-15 35 28 4 13.4 9.9 7.7 7.4 104 108 1.3 11.8 1.1 0.7 6.9 17
Hyundai E&C 000720 KS N W 33,050 45,000 36 3,208 23.2 1 (2) (20) 16 (20) (2) (3) (19) 14 (18) Dec-15 15 18 4 10.0 8.7 7.4 7.1 90 92 1.5 7.0 0.6 0.2 2.6 (10)
Hyundai Elevator 017800 KS O W 61,300 70,000 14 1,316 8.2 0 (2) 7 2 (29) (2) (4) 8 (0) (27) Dec-14 (106) 938 339 23.8 n.m. 44.5 10.1 113 153 0.0 (0.8) 2.3 0.9 8.1 (22)
Hyundai Heavy 009540 KS O W 106,500 158,600 49 7,056 24.5 4 (2) (10) 21 (7) 2 (4) (9) 19 (5) Dec-15 146 40 5 n.m. 13.1 9.4 8.9 99 104 7.0 4.4 0.6 0.5 9.2 77
Hyundai Mipo 010620 KS O W 68,500 82,300 20 1,194 9.4 (0) (7) (0) 31 5 (3) (8) 0 29 8 Dec-15 243 (6) (14) 34.3 10.0 10.6 12.3 88 74 2.9 7.9 0.8 1.0 21.5 160
Samsung Heavy 010140 KS O W 9,740 16,000 64 1,960 15.5 10 4 (16) (10) (44) 7 2 (16) (12) (41) Dec-15 106 44 5 n.m. 26.8 18.7 17.8 128 94 0.0 1.4 0.4 0.7 17.9 96
Sector Aggregate 39 26,793 4 (1) (11) 13 (18) 1 (3) (11) 11 (15) Dec-15 129 44 5 n.m. 14.6 10.2 9.6 88 90 2.6 4.7 0.7 0.5 9.3 76
Commercial Services & Supplies Hayoung Chung - 822 3707 3795
KEPCO KPS 051600 KS O W 65,600 120,000 83 2,573 10.5 0 (8) (5) (26) (47) (3) (9) (5) (29) (44) Dec-14 1 10 19 17.5 17.4 15.7 13.3 100 118 2.9 22.8 3.7 2.3 13.4 (28)
Consumer Durables & Apparel Minseok Sinn - 82 2 3707 8898
Hanssem 009240 KS N W 170,500 200,000 17 3,498 15.5 4 0 (16) (26) (44) 1 (1) (15) (29) (41) Dec-15 19 26 19 26.9 22.6 18.0 15.1 114 118 0.8 27.6 5.6 1.8 20.2 (52)
Consumer Staples A-Hyung Cho/ Hayoung Chung - 82 2 3707 3735/ 822 3707 3795
Amorepacific 090430 KS O W 426,000 526,000 23 21,708 40.6 (3) 4 5 3 6 (6) 3 5 1 9 Dec-15 39 22 14 43.1 30.9 25.4 22.3 114 115 0.3 21.5 6.1 3.9 19.9 (18)
CJCJ 097950 KS O W 403,000 500,000 24 4,623 15.9 3 8 13 7 (7) 0 7 13 4 (5) Dec-15 79 21 11 27.2 15.2 12.6 11.4 105 108 0.7 10.5 1.5 0.7 7.7 84
Hyundai Green Food 005440 KS O W 18,550 27,000 46 1,580 4.0 2 (2) (3) (25) (11) (1) (3) (3) (27) (8) Dec-14 (7) 30 16 16.6 17.8 13.7 11.7 100 114 0.3 6.4 1.1 0.8 14.6 (15)
KT&G 033780 KS O W 126,500 143,000 13 15,139 29.3 (4) 1 12 21 29 (6) (0) 13 19 31 Dec-15 10 5 6 15.4 14.0 13.3 12.5 110 111 2.8 17.4 2.5 3.7 9.7 (2)
LG H&H 051900 KS O W 1,095,000 1,260,000 15 14,908 34.6 (5) 4 13 4 46 (8) 2 14 2 49 Dec-15 43 18 13 42.2 29.4 24.9 22.2 101 101 0.5 26.0 6.9 2.7 16.0 4
Orion 001800 KS O W 933,000 1,140,000 22 4,860 14.4 1 0 0 (20) (20) (1) (1) 1 (22) (17) Dec-15 45 14 10 34.3 23.6 20.7 18.8 99 100 0.9 15.8 3.5 2.5 11.5 37
Sector Aggregate 19 62,820 (3) 3 9 5 18 (6) 2 9 3 20 Dec-15 30 14 10 28.0 21.5 18.9 17.4 108 109 1.0 17.3 3.6 2.1 12.7 19
Diversified Financials Gil Kim - 82 2 3707 3763
HFG 086790 KS O W 23,750 32,000 35 6,128 22.7 6 (4) (5) 1 (23) 3 (5) (4) (2) (20) Dec-15 32 10 9 7.7 5.9 5.3 4.9 103 108 3.6 5.4 0.3 n.a. n.a. n.a.

Ju
mp
-Sta
rt 7
5
14 J
uly
201
6
South Korea—valuation summary (continued) Wednesday, 13 July 2016
CS/ Cons. EV/ EV/ Net
Bberg Price Market 6M Last EPS D Yld ROE P/B Sales EBITDA Debt/Eq ticker View Ccy Local Target Upside cap ADTO Absolute performance (%) Relative performance (%) FYE EPS growth (%) PE (x) (%) (%) (%) (x) (x) (x) (%)
(%) (US$ m) 1w 1m 3m Ytd 12m 1w 1m 3m Ytd 12m T T+1 T+2 T+3 T T+1 T+2 T+3 T+1 T+2 T+1
Hotels, Restaurants & Leisure A-Hyung Cho/ Hayoung Chung/ Ray Kim - 82 2 3707 3735/ 822 3707 3795/ 82 2 3707 3776
GKL 114090 KS O W 25,250 36,000 43 1,361 8.2 (8) (4) (7) 4 (20) (11) (5) (7) 2 (17) Dec-15 33 (13) 2 17.0 12.8 14.7 14.4 108 89 4.2 25.8 3.2 2.5 8.0 (36)
Hana Tour 039130 KS O W 79,300 140,000 77 803 12.3 (4) (8) (10) (31) (50) (7) (10) (9) (33) (48) Dec-14 (4) 73 24 25.4 26.5 15.3 12.3 104 156 1.3 15.0 3.8 1.5 14.3 (109)
Hotel Shilla 008770 KS N W 65,000 69,000 6 2,224 39.2 (2) (2) (3) (16) (52) (4) (3) (2) (18) (49) Dec-15 393 43 26 n.m. 28.4 19.9 15.8 89 83 0.6 11.5 3.1 0.8 14.1 66
Kangwon Land 035250 KS O W 41,100 54,000 31 7,665 10.5 0 (4) (2) 7 3 (2) (6) (2) 5 6 Dec-15 16 13 17 18.9 16.3 14.4 12.3 104 108 2.9 16.3 2.7 4.7 11.2 (13)
Paradise 034230 KS N W 15,200 15,000 (1) 1,205 11.3 (8) (4) (7) (14) (41) (11) (5) (9) (17) (33) Dec-15 9 10 (4) 19.9 18.2 16.6 17.2 104 114 2.4 6.7 1.3 2.3 13.9 16
Sector Aggregate 28 13,258 (2) (4) (4) (1) (16) (5) (5) (3) (4) (13) Dec-15 30 13 15 22.4 17.1 15.1 13.2 105 103 2.6 14.9 2.5 2.0 11.3 (2)
Insurance Gil Kim - 82 2 3707 3763
DBI 005830 KS N W 65,300 67,000 3 4,030 9.9 1 (10) (14) (7) 18 (2) (11) (13) (9) 20 Dec-15 16 9 4 11.2 9.7 8.8 8.5 98 95 2.5 12.6 1.0 n.a. n.a. n.a.
HLI 088350 KS N W 5,740 8,000 39 4,346 4.2 2 (9) (11) (22) (31) (1) (10) (10) (25) (28) Dec-14 44 3 18 12.0 8.3 8.1 6.9 111 118 3.5 6.7 0.5 n.a. n.a. n.a.
HMF 001450 KS O W 30,200 40,000 32 2,354 7.2 7 (2) (11) (16) 5 5 (3) (11) (18) 7 Dec-15 59 11 4 11.9 7.5 6.8 6.5 108 104 3.0 12.1 0.8 n.a. n.a. n.a.
SFM 000810 KS O W 272,000 364,000 34 11,233 19.2 4 (0) (9) (12) (6) 1 (2) (9) (14) (3) Dec-15 26 14 9 14.4 11.4 10.0 9.2 114 119 2.4 9.2 1.0 n.a. n.a. n.a.
SLI 032830 KS O W 96,800 135,000 39 16,876 28.3 2 (4) (20) (12) (7) (1) (5) (19) (14) (5) Dec-15 88 (32) 8 14.9 7.9 11.7 10.9 115 109 2.0 8.5 0.6 n.a. n.a. n.a.
Sector Aggregate 34 38,839 3 (4) (15) (13) (6) 0 (5) (14) (15) (4) Dec-15 46 (9) 7 13.0 8.9 9.7 9.1 113 112 2.3 8.8 0.7 n.a. n.a. n.a.
Metals & Mining Minseok Sinn - 82 2 3707 8898
Hyundai Steel 004020 KS O W 50,700 72,000 42 5,898 22.3 11 6 (18) 2 (24) 8 4 (17) (1) (21) Dec-15 4 33 12 9.0 8.6 6.5 5.8 93 107 1.5 4.9 0.4 1.1 6.3 70
POSCO 005490 KS O W 227,000 280,000 23 17,252 70.6 13 8 (8) 36 4 10 6 (8) 34 7 Dec-15 611 40 14 n.m. 14.1 10.1 8.8 98 112 2.6 3.1 0.4 0.7 6.3 40
Sector Aggregate 28 23,150 12 7 (11) 27 (3) 10 6 (10) 25 (0) Dec-15 130 37 14 28.0 12.2 8.9 7.8 96 110 2.3 3.6 0.4 0.8 6.3 48
Retailing A-Hyung Cho - 82 2 3707 3735
E-Mart 139480 KS O W 166,500 248,000 49 4,046 13.0 0 (7) (5) (12) (30) (2) (8) (5) (14) (28) Dec-15 (12) 19 8 10.2 11.6 9.8 9.0 109 114 0.9 5.6 0.6 0.5 8.6 57
GS Home Shopping 028150 KS N W 170,600 200,000 17 976 2.5 1 (4) (9) 2 (9) (1) (5) (10) (1) (2) Dec-14 (22) 19 4 9.3 11.8 9.9 9.5 111 108 4.1 10.5 1.2 0.1 1.8 (98)
Hyundai Dept. Store 069960 KS O W 127,500 171,000 34 2,601 7.9 (0) (5) (10) 1 (6) (3) (7) (10) (1) (3) Dec-15 34 7 6 12.4 9.2 8.6 8.1 109 107 0.6 9.0 0.8 0.6 5.5 6
Hyundai Home 057050 KS O W 121,000 166,000 37 1,266 5.1 0 (8) (7) 5 9 (2) (9) (7) 3 12 Dec-14 (5) 12 10 10.9 11.5 10.3 9.4 128 108 1.1 9.5 1.1 0.2 5.0 (65)
Lotte Shopping 023530 KS U W 197,500 206,000 4 5,422 11.0 (0) (6) (27) (15) (14) (3) (8) (26) (17) (12) Dec-15 250 14 13 n.m. 13.3 11.7 10.4 96 92 1.0 2.7 0.4 0.6 10.2 72
Shinsegae 004170 KS N W 190,000 240,000 26 1,631 8.8 (1) (6) (6) (17) (11) (4) (8) (5) (20) (9) Dec-15 (61) 19 9 4.6 11.8 9.9 9.1 95 92 0.7 4.9 0.6 0.7 8.1 48
Sector Aggregate 26 15,941 (0) (6) (14) (9) (15) (3) (8) (13) (12) (12) Dec-15 59 13 9 18.2 11.4 10.1 9.3 103 102 1.1 4.8 0.5 0.5 8.4 48
Software & Services Eric Cha/ Minseok Sinn/ Ray Kim - 822 3707 3764/ 82 2 3707 8898/ 82 2 3707 3776
CJ E&M 130960 KS O W 73,200 91,000 24 2,471 18.8 6 (1) 19 (9) 1 4 (2) 18 (12) 8 Dec-15 80 47 16 52.0 28.9 19.7 17.1 129 137 0.3 6.3 1.9 2.1 6.7 23
Com2uS 078340 KS O W 126,200 180,000 43 1,415 19.9 1 (9) 1 6 (4) (2) (10) (0) 4 4 Dec-14 24 41 8 15.6 12.6 8.9 8.2 94 100 0.0 36.3 3.2 4.2 10.8 40
Daum 035720 KS U W 94,500 69,000 (27) 5,561 29.0 (0) 1 (6) (18) (29) (3) (0) (7) (21) (22) Dec-15 11 37 4 49.0 44.4 32.5 31.2 109 91 0.2 4.4 1.7 4.8 23.3 25
Gamevil 063080 KS N W 89,900 85,000 (5) 511 6.2 5 (2) 0 16 (13) 3 (3) (1) 13 (6) Dec-14 (11) 129 6 25.8 29.1 12.7 11.9 100 107 0.0 10.0 2.8 4.0 80.6 7
NC Soft 036570 KS U W 255,500 199,000 (22) 4,884 28.9 4 10 5 20 17 1 9 6 18 19 Dec-15 30 8 5 32.8 25.3 23.3 22.3 83 69 1.2 11.8 2.9 5.6 17.7 (14)
Samsung SDS 018260 KS U W 143,000 130,000 (9) 9,645 32.1 5 (5) (12) (44) (45) 2 (7) (11) (46) (42) Dec-15 13 3 5 25.2 22.4 21.6 20.5 102 99 0.3 10.3 2.2 1.1 8.8 (43)
Sector Aggregate (9) 24,489 3 (1) (3) (18) (21) 1 (2) (3) (20) (19) Dec-15 26 13 6 29.8 23.7 21.0 22.3 100 94 0.4 9.6 2.1 2.1 11.4 (9)
Technology Hardware Keon Han - 82 2 3707 3740
LG Display 034220 KS N W 28,150 23,700 (16) 8,780 30.5 5 17 5 15 14 3 16 5 12 17 Dec-14 5 (72) 84 11.2 10.7 38.1 20.7 98 93 1.8 7.9 0.8 0.5 2.7 27
LG Electronics 066570 KS N W 55,600 50,000 (10) 7,932 45.5 1 (0) (13) 3 28 (2) (2) (12) 1 30 Dec-14 (69) 239 44 13.4 43.2 12.7 8.8 188 91 0.8 1.6 0.7 0.3 7.6 52
SDI 006400 KS N W 105,500 91,000 (14) 6,324 29.5 (2) (7) 1 (7) (4) (5) (8) 2 (10) (1) Dec-14 (72) 304 123 49.0 n.m. 43.9 19.7 78 51 0.9 0.4 0.7 1.0 13.8 4
SEC 005930 KS O W 1,481,000 1,702,000 15 184,574 260.2 4 8 14 18 21 2 7 14 15 24 Dec-15 21 13 9 11.3 9.3 8.2 7.5 109 119 2.1 11.2 1.0 0.9 3.7 (8)
SEMCO 009150 KS O W 49,850 65,000 30 3,246 19.0 3 (5) (10) (21) (0) 1 (6) (9) (23) 2 Dec-14 (98) 1,850 35 7.3 n.m. 16.9 12.6 104 142 1.0 0.3 0.9 0.7 5.7 23
SK Hynix 000660 KS O W 32,650 42,000 29 20,720 86.6 7 15 20 6 (14) 4 14 20 4 (11) Dec-14 6 (55) 19 5.7 5.3 11.9 10.0 102 108 1.5 21.4 1.0 1.4 2.9 12
SSC 046890 KS N W 14,800 14,300 (3) 752 6.9 1 4 0 (6) (5) (1) 3 (1) (9) 2 Dec-14 4,175 24 (13) n.m. 32.2 26.0 29.9 158 114 0.6 4.3 1.4 1.0 7.2 31
Sector Aggregate 14 232,328 4 8 12 15 17 2 7 13 12 19 Dec-15 7 16 10 10.9 10.2 8.8 7.6 108 117 2.0 9.8 1.0 0.8 3.8 (3)
Telecommunication Services Eric Cha - 822 3707 3764
KT 030200 KS O W 30,700 37,000 21 6,988 13.8 2 3 (1) 9 5 (1) 1 (0) 6 8 Dec-15 (28) 12 12 7.7 10.6 9.5 8.5 108 112 2.6 5.7 0.6 0.6 2.8 40
LGU 032640 KS O W 10,950 12,800 17 4,168 11.9 1 7 (4) 5 6 (1) 5 (3) 3 9 Dec-15 17 10 17 13.6 11.6 10.5 9.0 98 100 2.6 9.0 1.0 0.8 3.6 81
Sector Aggregate 19 11,155 2 4 (2) 7 6 (1) 3 (1) 5 8 Dec-15 (17) 12 13 9.2 11.0 9.8 8.7 104 108 2.6 6.6 0.7 0.6 3.0 51

Ju
mp
-Sta
rt 7
6
14 J
uly
201
6
South Korea—valuation summary (continued) Wednesday, 13 July 2016
CS/ Cons. EV/ EV/ Net
Bberg Price Market 6M Last EPS D Yld ROE P/B Sales EBITDA Debt/Eq ticker View Ccy Local Target Upside cap ADTO Absolute performance (%) Relative performance (%) FYE EPS growth (%) PE (x) (%) (%) (%) (x) (x) (x) (%)
(%) (US$ m) 1w 1m 3m Ytd 12m 1w 1m 3m Ytd 12m T T+1 T+2 T+3 T T+1 T+2 T+3 T+1 T+2 T+1
Utilities A-Hyung Cho - 82 2 3707 3735
KEPCO 015760 KS O W 59,600 74,000 24 33,353 50.3 1 (1) 0 19 22 (2) (2) 1 17 24 Dec-15 (43) (1) (2) 2.9 5.0 5.1 5.3 92 91 2.5 10.8 0.5 1.5 4.2 73
Country Aggregate 2,006 2,417 20 635,972 3 1 (1) 2 (3) Dec-15 6 12 7 10.5 9.9 8.8 8.0 101 106 2.0 8.8 0.8 0.7 4.9 20
Note: Prices are as of 13 Jul 2016,* Country/ sector aggregates are for the coverage above
Source: Company data, Thomson Financial IBES, Credit Suisse estimates
Malaysia—valuation summary Wednesday, 13 July 2016
CS/ Cons. EV/ EV/ Net
Bberg Price Market 6M Last EPS D Yld ROE P/B Sales EBITDA Debt/Eq ticker View Ccy Local Target Upside cap ADTO Absolute performance (%) Relative performance (%) FYE EPS growth (%) PE (x) (%) (%) (%) (x) (x) (x) (%)
(%) (US$ m) 1w 1m 3m Ytd 12m 1w 1m 3m Ytd 12m T T+1 T+2 T+3 T T+1 T+2 T+3 T+1 T+2 T+1
Banks Danny Goh - 60 3 2723 2083
Alliance Financial Group AFG MK N RM 4.06 4.00 (1) 1,575 1.2 (1) 1 (4) 14 (6) (1) (0) (1) 16 (2) Mar-16 3 10 11 12.0 11.7 10.6 9.6 98 101 3.8 10.7 1.2 n.a. n.a. n.a.
CIMB Group CIMB MK N RM 4.38 5.10 16 9,580 16.8 1 (0) (11) (4) (18) 0 (2) (7) (1) (14) Dec-15 42 14 7 13.0 9.2 8.0 7.5 108 109 4.3 9.6 0.9 n.a. n.a. n.a.
Hong Leong Bank HLBK MK N RM 13.24 13.10 (1) 7,191 2.4 1 2 (2) (1) 2 0 0 2 1 5 Jun-15 (12) 2 11 11.1 12.6 12.4 11.2 108 102 3.0 11.2 1.3 n.a. n.a. n.a.
Maybank MAY MK U RM 8.20 6.90 (16) 20,564 25.8 0 0 (10) (2) (11) (0) (1) (7) (0) (7) Dec-15 (8) 9 9 11.7 12.8 11.7 10.7 96 98 5.9 10.2 1.3 n.a. n.a. n.a.
Public Bank PBK MK U RM 19.36 16.70 (14) 18,832 26.7 (0) 2 1 5 2 (1) (0) 5 7 6 Dec-15 (7) 6 4 14.8 15.9 15.0 14.4 94 94 2.9 14.5 2.2 n.a. n.a. n.a.
RHB Capital RHBC MK O RM 5.15 5.69 10 5,175 1.9 0 (16) (16) (9) (29) (0) (17) (12) (7) (25) Dec-15 38 17 12 14.1 10.3 8.8 7.8 83 91 2.9 9.6 1.0 n.a. n.a. n.a.
Sector Aggregate (6) 62,917 0 (0) (6) (1) (8) (0) (2) (3) 2 (4) Dec-15 4 10 8 12.9 12.5 11.3 10.5 97 99 4.1 10.8 1.3 n.a. n.a. n.a.
Capital Goods Danny Goh/ Gerald Wong - 60 3 2723 2083/ 65 6212 3037
Gamuda GAM MK O RM 4.87 5.70 17 2,949 4.4 (0) 2 0 7 3 (1) 1 4 9 7 Jul-15 7 30 14 19.7 18.4 14.1 12.4 105 119 2.5 10.1 1.5 3.1 21.0 32
IJM Corporation IJM MK O RM 3.45 4.20 22 3,111 4.7 0 0 (2) 3 2 (0) (2) 2 5 5 Mar-16 (6) 20 14 15.6 16.7 13.8 12.1 102 109 2.4 8.0 1.3 2.3 11.1 48
MMHE MMHE MK U RM 1.09 0.80 (27) 437 0.3 (3) (8) (8) 9 (6) (3) (9) (5) 11 (2) Dec-15 81 3 6 39.7 21.9 21.3 20.0 86 85 0.0 2.9 0.6 0.5 5.8 (29)
Sector Aggregate 16 6,497 (0) 1 (1) 5 2 (1) (1) 3 7 6 Dec-15 1 17 15 16.8 16.7 14.2 13.1 105 112 2.3 8.5 1.3 2.4 12.9 30
Chemicals Paworamon (Poom) Suvarnatemee - 66 2 614 6210
Petronas Chem PCHEM MK U RM 6.52 6.00 (8) 13,069 11.1 (1) 1 (3) (10) 2 (1) (1) 1 (8) 6 Dec-15 (26) 55 9 19.2 25.9 16.7 15.3 74 105 1.9 8.0 2.1 3.6 12.9 (21)
Consumer Staples Joanna Cheah/ Tingmin Tan - 6 03 2723 2081/ 60 3 2723 2080
BAT Malaysia ROTH MK O RM 54.72 55.50 1 3,915 4.7 1 7 (1) (2) (15) 1 5 3 (0) (11) Dec-15 (11) 3 3 17.2 19.3 18.7 18.2 104 105 4.9 142.7 26.6 3.7 14.0 35
FGV FGV MK N RM 1.51 1.43 (5) 1,380 2.1 1 5 2 (12) (8) 0 3 6 (10) (4) Dec-15 152 47 (33) n.m. 51.5 35.1 52.7 61 58 2.0 1.7 0.8 0.3 8.0 53
Genting Plantations GENP MK O RM 10.60 12.60 19 2,102 2.0 1 1 (3) 0 5 0 (1) 1 2 9 Dec-15 52 35 16 43.7 28.7 21.2 18.3 97 107 0.7 7.0 2.1 5.8 18.4 29
IOI Corp IOI MK U RM 4.36 4.00 (8) 7,059 9.4 (0) 1 (3) (2) 3 (1) (1) 1 (0) 7 Jun-15 20 18 12 31.2 26.0 22.0 19.6 108 104 2.3 20.5 5.1 2.8 18.1 82
KLK KLK MK N RM 23.18 23.70 2 6,200 6.4 (0) 0 (3) 1 2 (1) (1) 1 3 5 Sep-15 51 (14) 6 28.4 18.8 21.9 20.8 110 96 2.0 13.2 2.4 2.9 18.7 38
Sime Darby SIME MK N RM 7.57 7.20 (5) 12,001 7.7 0 1 (5) (2) (11) (0) (1) (1) (0) (8) Jun-15 (21) 34 8 20.3 25.7 19.2 17.7 105 107 2.6 5.6 1.3 1.4 16.2 32
Sector Aggregate (2) 32,658 0 2 (3) (2) (5) (0) (0) 1 0 (1) Dec-15 12 11 3 24.9 22.3 20.1 20.7 104 101 2.8 9.5 2.1 1.6 14.4 39
Diversified Financials Danny Goh - 60 3 2723 2083
HLFG HLFG MK O RM 15.00 17.70 18 4,313 1.1 1 4 (4) 7 (0) 0 2 (0) 10 4 Jun-15 (9) 3 12 9.7 10.7 10.4 9.2 103 99 2.8 11.3 1.1 n.a. n.a. n.a.
Energy Muzhafar Mukhtar - 60 3 2723 2084
Bumi Armada BAB MK O RM 0.74 0.95 28 1,088 4.2 1 1 2 (27) (31) 1 (0) 6 (25) (28) Dec-15 (56) 205 (9) 12.6 28.6 9.4 10.3 70 110 1.1 2.1 0.6 7.1 16.6 125
Dialog DLG MK O RM 1.53 1.90 24 2,020 2.0 0 0 (3) (4) (4) (0) (2) 1 (2) (0) Jun-15 15 21 (0) 30.2 26.2 21.7 21.8 104 114 1.6 14.7 3.6 2.4 22.0 4
Icon ICON MK O RM 0.35 0.50 43 103 0.1 0 (7) (8) (19) (10) (0) (8) (4) (17) (7) Dec-15 (79) 947 49 15.7 76.7 7.3 4.9 91 137 0.0 0.7 0.6 4.1 9.4 77
SapuraKencana SAKP MK N RM 1.43 1.40 (2) 2,147 8.2 (1) (8) (24) (29) (38) (1) (9) (20) (27) (35) Jan-16 (60) (22) 70 8.9 22.1 28.5 16.8 90 60 1.3 3.3 0.7 3.3 9.9 118
Uzma UZMA MK O RM 1.81 2.40 33 132 0.2 (3) (10) (8) (10) (28) (4) (11) (4) (7) (25) Dec-15 18 44 8 13.4 11.4 7.9 7.3 87 104 2.7 12.9 1.4 1.7 8.8 94
Sector Aggregate 15 5,490 (0) (3) (10) (19) (24) (0) (5) (6) (17) (20) Dec-15 (42) 29 18 13.0 22.4 17.3 14.7 89 91 1.4 4.3 0.9 3.4 12.1 108
Healthcare Ariyanto Jahja/ Joanna Cheah - 62 21 2553 7976/ 6 03 2723 2081
IHH Healthcare IHH MK O RM 6.65 6.80 2 13,716 11.3 1 5 (0) 1 14 0 3 3 3 18 Dec-14 48 22 21 72.2 48.8 39.9 33.1 119 124 0.5 5.6 2.7 6.5 25.4 14
Karex Bhd KAREX MK O RM 2.31 2.80 21 580 1.1 (4) 1 (13) (16) 12 (5) (0) (9) (14) 15 Jun-15 21 30 23 38.9 32.1 24.6 20.0 101 106 1.2 15.7 4.8 6.2 22.0 (18)
Kossan Rubber KRI MK O RM 6.76 7.90 17 1,083 2.3 (1) 4 7 (27) 2 (1) 3 11 (25) 5 Dec-15 18 15 19 21.3 18.1 15.7 13.2 103 107 2.2 22.4 3.8 2.3 10.8 (2)
KPJ KPJ MK N RM 4.30 4.00 (7) 1,141 0.7 2 (1) 1 2 (0) 1 (3) 5 4 3 Dec-14 29 14 16 39.1 30.3 26.5 22.9 114 113 1.9 11.2 3.2 1.9 15.1 59
Top Glove TOPG MK N RM 4.50 5.00 11 1,415 7.5 (3) (10) (14) (34) 22 (3) (12) (10) (32) 26 Aug-15 40 7 2 20.1 14.4 13.4 13.2 101 109 3.5 22.9 3.1 2.1 9.6 24
Sector Aggregate 4 17,935 0 3 (1) (4) 13 (0) 1 2 (2) 17 Dec-15 22 17 19 38.5 31.6 26.9 13.2 116 118 0.9 8.9 2.7 4.0 17.3 14
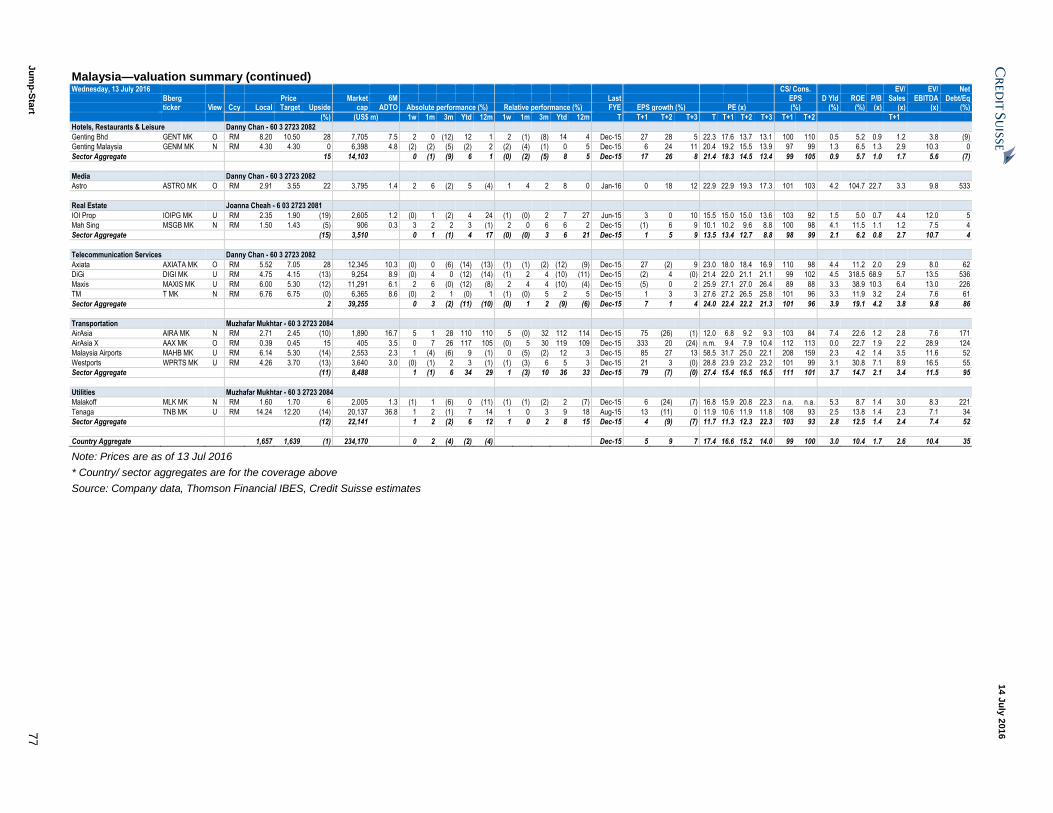
Ju
mp
-Sta
rt 7
7
14 J
uly
201
6
Malaysia—valuation summary (continued) Wednesday, 13 July 2016
CS/ Cons. EV/ EV/ Net
Bberg Price Market 6M Last EPS D Yld ROE P/B Sales EBITDA Debt/Eq ticker View Ccy Local Target Upside cap ADTO Absolute performance (%) Relative performance (%) FYE EPS growth (%) PE (x) (%) (%) (%) (x) (x) (x) (%)
(%) (US$ m) 1w 1m 3m Ytd 12m 1w 1m 3m Ytd 12m T T+1 T+2 T+3 T T+1 T+2 T+3 T+1 T+2 T+1
Hotels, Restaurants & Leisure Danny Chan - 60 3 2723 2082
Genting Bhd GENT MK O RM 8.20 10.50 28 7,705 7.5 2 0 (12) 12 1 2 (1) (8) 14 4 Dec-15 27 28 5 22.3 17.6 13.7 13.1 100 110 0.5 5.2 0.9 1.2 3.8 (9)
Genting Malaysia GENM MK N RM 4.30 4.30 0 6,398 4.8 (2) (2) (5) (2) 2 (2) (4) (1) 0 5 Dec-15 6 24 11 20.4 19.2 15.5 13.9 97 99 1.3 6.5 1.3 2.9 10.3 0
Sector Aggregate 15 14,103 0 (1) (9) 6 1 (0) (2) (5) 8 5 Dec-15 17 26 8 21.4 18.3 14.5 13.4 99 105 0.9 5.7 1.0 1.7 5.6 (7)
Media Danny Chan - 60 3 2723 2082
Astro ASTRO MK O RM 2.91 3.55 22 3,795 1.4 2 6 (2) 5 (4) 1 4 2 8 0 Jan-16 0 18 12 22.9 22.9 19.3 17.3 101 103 4.2 104.7 22.7 3.3 9.8 533
Real Estate Joanna Cheah - 6 03 2723 2081
IOI Prop IOIPG MK U RM 2.35 1.90 (19) 2,605 1.2 (0) 1 (2) 4 24 (1) (0) 2 7 27 Jun-15 3 0 10 15.5 15.0 15.0 13.6 103 92 1.5 5.0 0.7 4.4 12.0 5
Mah Sing MSGB MK N RM 1.50 1.43 (5) 906 0.3 3 2 2 3 (1) 2 0 6 6 2 Dec-15 (1) 6 9 10.1 10.2 9.6 8.8 100 98 4.1 11.5 1.1 1.2 7.5 4
Sector Aggregate (15) 3,510 0 1 (1) 4 17 (0) (0) 3 6 21 Dec-15 1 5 9 13.5 13.4 12.7 8.8 98 99 2.1 6.2 0.8 2.7 10.7 4
Telecommunication Services Danny Chan - 60 3 2723 2082
Axiata AXIATA MK O RM 5.52 7.05 28 12,345 10.3 (0) 0 (6) (14) (13) (1) (1) (2) (12) (9) Dec-15 27 (2) 9 23.0 18.0 18.4 16.9 110 98 4.4 11.2 2.0 2.9 8.0 62
DiGi DIGI MK U RM 4.75 4.15 (13) 9,254 8.9 (0) 4 0 (12) (14) (1) 2 4 (10) (11) Dec-15 (2) 4 (0) 21.4 22.0 21.1 21.1 99 102 4.5 318.5 68.9 5.7 13.5 536
Maxis MAXIS MK U RM 6.00 5.30 (12) 11,291 6.1 2 6 (0) (12) (8) 2 4 4 (10) (4) Dec-15 (5) 0 2 25.9 27.1 27.0 26.4 89 88 3.3 38.9 10.3 6.4 13.0 226
TM T MK N RM 6.76 6.75 (0) 6,365 8.6 (0) 2 1 (0) 1 (1) (0) 5 2 5 Dec-15 1 3 3 27.6 27.2 26.5 25.8 101 96 3.3 11.9 3.2 2.4 7.6 61
Sector Aggregate 2 39,255 0 3 (2) (11) (10) (0) 1 2 (9) (6) Dec-15 7 1 4 24.0 22.4 22.2 21.3 101 96 3.9 19.1 4.2 3.8 9.8 86
Transportation Muzhafar Mukhtar - 60 3 2723 2084
AirAsia AIRA MK N RM 2.71 2.45 (10) 1,890 16.7 5 1 28 110 110 5 (0) 32 112 114 Dec-15 75 (26) (1) 12.0 6.8 9.2 9.3 103 84 7.4 22.6 1.2 2.8 7.6 171
AirAsia X AAX MK O RM 0.39 0.45 15 405 3.5 0 7 26 117 105 (0) 5 30 119 109 Dec-15 333 20 (24) n.m. 9.4 7.9 10.4 112 113 0.0 22.7 1.9 2.2 28.9 124
Malaysia Airports MAHB MK U RM 6.14 5.30 (14) 2,553 2.3 1 (4) (6) 9 (1) 0 (5) (2) 12 3 Dec-15 85 27 13 58.5 31.7 25.0 22.1 208 159 2.3 4.2 1.4 3.5 11.6 52
Westports WPRTS MK U RM 4.26 3.70 (13) 3,640 3.0 (0) (1) 2 3 (1) (1) (3) 6 5 3 Dec-15 21 3 (0) 28.8 23.9 23.2 23.2 101 99 3.1 30.8 7.1 8.9 16.5 55
Sector Aggregate (11) 8,488 1 (1) 6 34 29 1 (3) 10 36 33 Dec-15 79 (7) (0) 27.4 15.4 16.5 16.5 111 101 3.7 14.7 2.1 3.4 11.5 95
Utilities Muzhafar Mukhtar - 60 3 2723 2084
Malakoff MLK MK N RM 1.60 1.70 6 2,005 1.3 (1) 1 (6) 0 (11) (1) (1) (2) 2 (7) Dec-15 6 (24) (7) 16.8 15.9 20.8 22.3 n.a. n.a. 5.3 8.7 1.4 3.0 8.3 221
Tenaga TNB MK U RM 14.24 12.20 (14) 20,137 36.8 1 2 (1) 7 14 1 0 3 9 18 Aug-15 13 (11) 0 11.9 10.6 11.9 11.8 108 93 2.5 13.8 1.4 2.3 7.1 34
Sector Aggregate (12) 22,141 1 2 (2) 6 12 1 0 2 8 15 Dec-15 4 (9) (7) 11.7 11.3 12.3 22.3 103 93 2.8 12.5 1.4 2.4 7.4 52
Country Aggregate 1,657 1,639 (1) 234,170 0 2 (4) (2) (4) Dec-15 5 9 7 17.4 16.6 15.2 14.0 99 100 3.0 10.4 1.7 2.6 10.4 35
Note: Prices are as of 13 Jul 2016
* Country/ sector aggregates are for the coverage above
Source: Company data, Thomson Financial IBES, Credit Suisse estimates
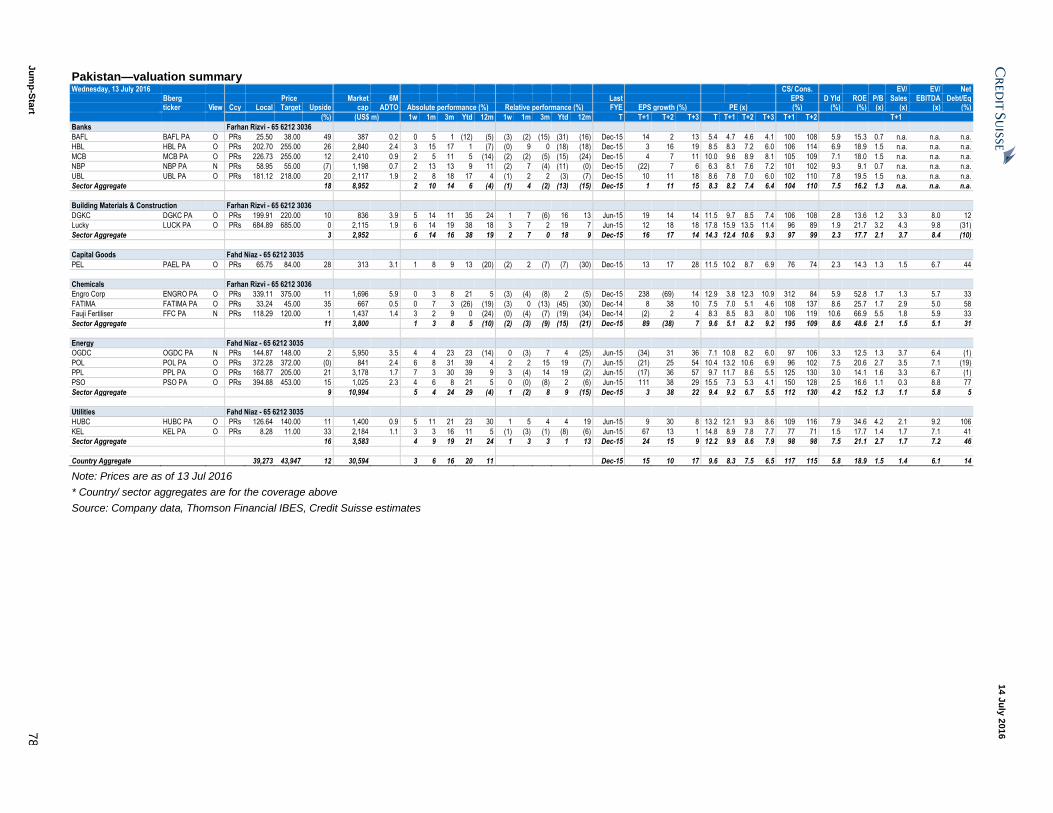
Ju
mp
-Sta
rt 7
8
14 J
uly
201
6
Pakistan—valuation summary Wednesday, 13 July 2016
CS/ Cons. EV/ EV/ Net
Bberg Price Market 6M Last EPS D Yld ROE P/B Sales EBITDA Debt/Eq ticker View Ccy Local Target Upside cap ADTO Absolute performance (%) Relative performance (%) FYE EPS growth (%) PE (x) (%) (%) (%) (x) (x) (x) (%)
(%) (US$ m) 1w 1m 3m Ytd 12m 1w 1m 3m Ytd 12m T T+1 T+2 T+3 T T+1 T+2 T+3 T+1 T+2 T+1
Banks Farhan Rizvi - 65 6212 3036
BAFL BAFL PA O PRs 25.50 38.00 49 387 0.2 0 5 1 (12) (5) (3) (2) (15) (31) (16) Dec-15 14 2 13 5.4 4.7 4.6 4.1 100 108 5.9 15.3 0.7 n.a. n.a. n.a.
HBL HBL PA O PRs 202.70 255.00 26 2,840 2.4 3 15 17 1 (7) (0) 9 0 (18) (18) Dec-15 3 16 19 8.5 8.3 7.2 6.0 106 114 6.9 18.9 1.5 n.a. n.a. n.a.
MCB MCB PA O PRs 226.73 255.00 12 2,410 0.9 2 5 11 5 (14) (2) (2) (5) (15) (24) Dec-15 4 7 11 10.0 9.6 8.9 8.1 105 109 7.1 18.0 1.5 n.a. n.a. n.a.
NBP NBP PA N PRs 58.95 55.00 (7) 1,198 0.7 2 13 13 9 11 (2) 7 (4) (11) (0) Dec-15 (22) 7 6 6.3 8.1 7.6 7.2 101 102 9.3 9.1 0.7 n.a. n.a. n.a.
UBL UBL PA O PRs 181.12 218.00 20 2,117 1.9 2 8 18 17 4 (1) 2 2 (3) (7) Dec-15 10 11 18 8.6 7.8 7.0 6.0 102 110 7.8 19.5 1.5 n.a. n.a. n.a.
Sector Aggregate 18 8,952 2 10 14 6 (4) (1) 4 (2) (13) (15) Dec-15 1 11 15 8.3 8.2 7.4 6.4 104 110 7.5 16.2 1.3 n.a. n.a. n.a.
Building Materials & Construction Farhan Rizvi - 65 6212 3036
DGKC DGKC PA O PRs 199.91 220.00 10 836 3.9 5 14 11 35 24 1 7 (6) 16 13 Jun-15 19 14 14 11.5 9.7 8.5 7.4 106 108 2.8 13.6 1.2 3.3 8.0 12
Lucky LUCK PA O PRs 684.89 685.00 0 2,115 1.9 6 14 19 38 18 3 7 2 19 7 Jun-15 12 18 18 17.8 15.9 13.5 11.4 96 89 1.9 21.7 3.2 4.3 9.8 (31)
Sector Aggregate 3 2,952 6 14 16 38 19 2 7 0 18 9 Dec-15 16 17 14 14.3 12.4 10.6 9.3 97 99 2.3 17.7 2.1 3.7 8.4 (10)
Capital Goods Fahd Niaz - 65 6212 3035
PEL PAEL PA O PRs 65.75 84.00 28 313 3.1 1 8 9 13 (20) (2) 2 (7) (7) (30) Dec-15 13 17 28 11.5 10.2 8.7 6.9 76 74 2.3 14.3 1.3 1.5 6.7 44
Chemicals Farhan Rizvi - 65 6212 3036
Engro Corp ENGRO PA O PRs 339.11 375.00 11 1,696 5.9 0 3 8 21 5 (3) (4) (8) 2 (5) Dec-15 238 (69) 14 12.9 3.8 12.3 10.9 312 84 5.9 52.8 1.7 1.3 5.7 33
FATIMA FATIMA PA O PRs 33.24 45.00 35 667 0.5 0 7 3 (26) (19) (3) 0 (13) (45) (30) Dec-14 8 38 10 7.5 7.0 5.1 4.6 108 137 8.6 25.7 1.7 2.9 5.0 58
Fauji Fertiliser FFC PA N PRs 118.29 120.00 1 1,437 1.4 3 2 9 0 (24) (0) (4) (7) (19) (34) Dec-14 (2) 2 4 8.3 8.5 8.3 8.0 106 119 10.6 66.9 5.5 1.8 5.9 33
Sector Aggregate 11 3,800 1 3 8 5 (10) (2) (3) (9) (15) (21) Dec-15 89 (38) 7 9.6 5.1 8.2 9.2 195 109 8.6 48.6 2.1 1.5 5.1 31
Energy Fahd Niaz - 65 6212 3035
OGDC OGDC PA N PRs 144.87 148.00 2 5,950 3.5 4 4 23 23 (14) 0 (3) 7 4 (25) Jun-15 (34) 31 36 7.1 10.8 8.2 6.0 97 106 3.3 12.5 1.3 3.7 6.4 (1)
POL POL PA O PRs 372.28 372.00 (0) 841 2.4 6 8 31 39 4 2 2 15 19 (7) Jun-15 (21) 25 54 10.4 13.2 10.6 6.9 96 102 7.5 20.6 2.7 3.5 7.1 (19)
PPL PPL PA O PRs 168.77 205.00 21 3,178 1.7 7 3 30 39 9 3 (4) 14 19 (2) Jun-15 (17) 36 57 9.7 11.7 8.6 5.5 125 130 3.0 14.1 1.6 3.3 6.7 (1)
PSO PSO PA O PRs 394.88 453.00 15 1,025 2.3 4 6 8 21 5 0 (0) (8) 2 (6) Jun-15 111 38 29 15.5 7.3 5.3 4.1 150 128 2.5 16.6 1.1 0.3 8.8 77
Sector Aggregate 9 10,994 5 4 24 29 (4) 1 (2) 8 9 (15) Dec-15 3 38 22 9.4 9.2 6.7 5.5 112 130 4.2 15.2 1.3 1.1 5.8 5
Utilities Fahd Niaz - 65 6212 3035
HUBC HUBC PA O PRs 126.64 140.00 11 1,400 0.9 5 11 21 23 30 1 5 4 4 19 Jun-15 9 30 8 13.2 12.1 9.3 8.6 109 116 7.9 34.6 4.2 2.1 9.2 106
KEL KEL PA O PRs 8.28 11.00 33 2,184 1.1 3 3 16 11 5 (1) (3) (1) (8) (6) Jun-15 67 13 1 14.8 8.9 7.8 7.7 77 71 1.5 17.7 1.4 1.7 7.1 41
Sector Aggregate 16 3,583 4 9 19 21 24 1 3 3 1 13 Dec-15 24 15 9 12.2 9.9 8.6 7.9 98 98 7.5 21.1 2.7 1.7 7.2 46
Country Aggregate 39,273 43,947 12 30,594 3 6 16 20 11 Dec-15 15 10 17 9.6 8.3 7.5 6.5 117 115 5.8 18.9 1.5 1.4 6.1 14
Note: Prices are as of 13 Jul 2016
* Country/ sector aggregates are for the coverage above
Source: Company data, Thomson Financial IBES, Credit Suisse estimates
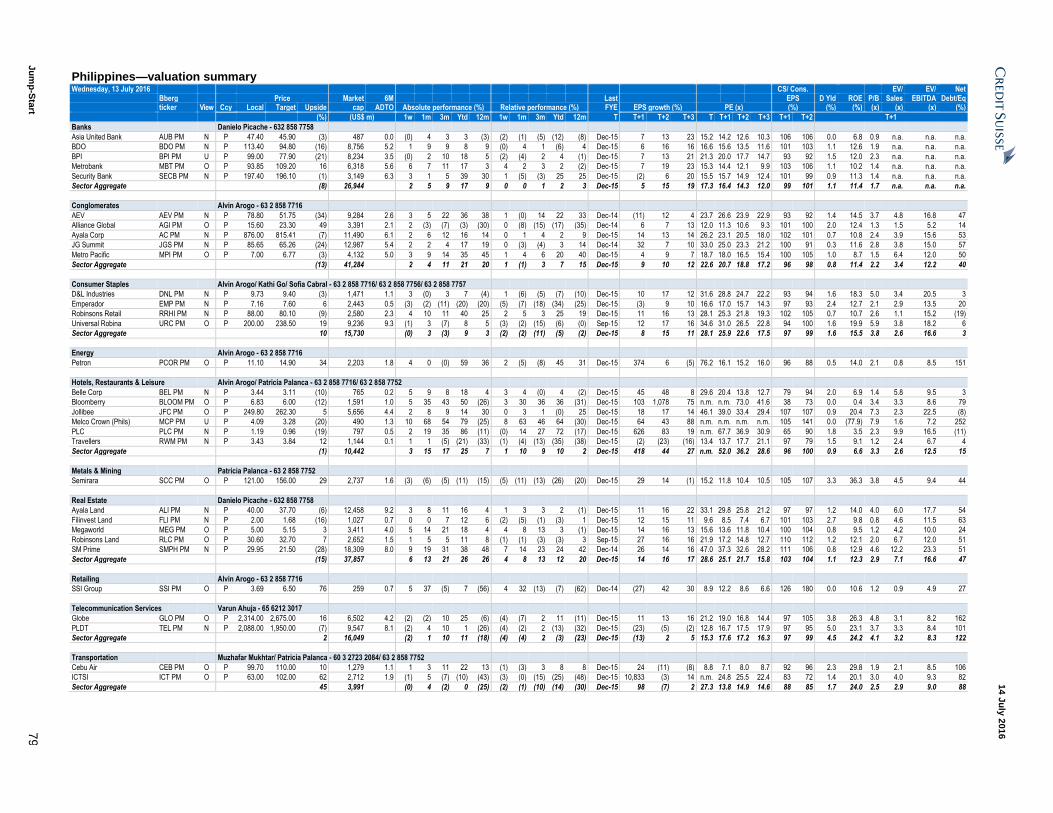
Ju
mp
-Sta
rt 7
9
14 J
uly
201
6
Philippines—valuation summary Wednesday, 13 July 2016
CS/ Cons. EV/ EV/ Net
Bberg Price Market 6M Last EPS D Yld ROE P/B Sales EBITDA Debt/Eq ticker View Ccy Local Target Upside cap ADTO Absolute performance (%) Relative performance (%) FYE EPS growth (%) PE (x) (%) (%) (%) (x) (x) (x) (%)
(%) (US$ m) 1w 1m 3m Ytd 12m 1w 1m 3m Ytd 12m T T+1 T+2 T+3 T T+1 T+2 T+3 T+1 T+2 T+1
Banks Danielo Picache - 632 858 7758
Asia United Bank AUB PM N P 47.40 45.90 (3) 487 0.0 (0) 4 3 3 (3) (2) (1) (5) (12) (8) Dec-15 7 13 23 15.2 14.2 12.6 10.3 106 106 0.0 6.8 0.9 n.a. n.a. n.a.
BDO BDO PM N P 113.40 94.80 (16) 8,756 5.2 1 9 9 8 9 (0) 4 1 (6) 4 Dec-15 6 16 16 16.6 15.6 13.5 11.6 101 103 1.1 12.6 1.9 n.a. n.a. n.a.
BPI BPI PM U P 99.00 77.90 (21) 8,234 3.5 (0) 2 10 18 5 (2) (4) 2 4 (1) Dec-15 7 13 21 21.3 20.0 17.7 14.7 93 92 1.5 12.0 2.3 n.a. n.a. n.a.
Metrobank MBT PM O P 93.85 109.20 16 6,318 5.6 6 7 11 17 3 4 2 3 2 (2) Dec-15 7 19 23 15.3 14.4 12.1 9.9 103 106 1.1 10.2 1.4 n.a. n.a. n.a.
Security Bank SECB PM N P 197.40 196.10 (1) 3,149 6.3 3 1 5 39 30 1 (5) (3) 25 25 Dec-15 (2) 6 20 15.5 15.7 14.9 12.4 101 99 0.9 11.3 1.4 n.a. n.a. n.a.
Sector Aggregate (8) 26,944 2 5 9 17 9 0 0 1 2 3 Dec-15 5 15 19 17.3 16.4 14.3 12.0 99 101 1.1 11.4 1.7 n.a. n.a. n.a.
Conglomerates Alvin Arogo - 63 2 858 7716
AEV AEV PM N P 78.80 51.75 (34) 9,284 2.6 3 5 22 36 38 1 (0) 14 22 33 Dec-14 (11) 12 4 23.7 26.6 23.9 22.9 93 92 1.4 14.5 3.7 4.8 16.8 47
Alliance Global AGI PM O P 15.60 23.30 49 3,391 2.1 2 (3) (7) (3) (30) 0 (8) (15) (17) (35) Dec-14 6 7 13 12.0 11.3 10.6 9.3 101 100 2.0 12.4 1.3 1.5 5.2 14
Ayala Corp AC PM N P 876.00 815.41 (7) 11,490 6.1 2 6 12 16 14 0 1 4 2 9 Dec-15 14 13 14 26.2 23.1 20.5 18.0 102 101 0.7 10.8 2.4 3.9 15.6 53
JG Summit JGS PM N P 85.65 65.26 (24) 12,987 5.4 2 2 4 17 19 0 (3) (4) 3 14 Dec-14 32 7 10 33.0 25.0 23.3 21.2 100 91 0.3 11.6 2.8 3.8 15.0 57
Metro Pacific MPI PM O P 7.00 6.77 (3) 4,132 5.0 3 9 14 35 45 1 4 6 20 40 Dec-15 4 9 7 18.7 18.0 16.5 15.4 100 105 1.0 8.7 1.5 6.4 12.0 50
Sector Aggregate (13) 41,284 2 4 11 21 20 1 (1) 3 7 15 Dec-15 9 10 12 22.6 20.7 18.8 17.2 96 98 0.8 11.4 2.2 3.4 12.2 40
Consumer Staples Alvin Arogo/ Kathi Go/ Sofia Cabral - 63 2 858 7716/ 63 2 858 7756/ 63 2 858 7757
D&L Industries DNL PM N P 9.73 9.40 (3) 1,471 1.1 3 (0) 3 7 (4) 1 (6) (5) (7) (10) Dec-15 10 17 12 31.6 28.8 24.7 22.2 93 94 1.6 18.3 5.0 3.4 20.5 3
Emperador EMP PM N P 7.16 7.60 6 2,443 0.5 (3) (2) (11) (20) (20) (5) (7) (18) (34) (25) Dec-15 (3) 9 10 16.6 17.0 15.7 14.3 97 93 2.4 12.7 2.1 2.9 13.5 20
Robinsons Retail RRHI PM N P 88.00 80.10 (9) 2,580 2.3 4 10 11 40 25 2 5 3 25 19 Dec-15 11 16 13 28.1 25.3 21.8 19.3 102 105 0.7 10.7 2.6 1.1 15.2 (19)
Universal Robina URC PM O P 200.00 238.50 19 9,236 9.3 (1) 3 (7) 8 5 (3) (2) (15) (6) (0) Sep-15 12 17 16 34.6 31.0 26.5 22.8 94 100 1.6 19.9 5.9 3.8 18.2 6
Sector Aggregate 10 15,730 (0) 3 (3) 9 3 (2) (2) (11) (5) (2) Dec-15 8 15 11 28.1 25.9 22.6 17.5 97 99 1.6 15.5 3.8 2.6 16.6 3
Energy Alvin Arogo - 63 2 858 7716
Petron PCOR PM O P 11.10 14.90 34 2,203 1.8 4 0 (0) 59 36 2 (5) (8) 45 31 Dec-15 374 6 (5) 76.2 16.1 15.2 16.0 96 88 0.5 14.0 2.1 0.8 8.5 151
Hotels, Restaurants & Leisure Alvin Arogo/ Patricia Palanca - 63 2 858 7716/ 63 2 858 7752
Belle Corp BEL PM N P 3.44 3.11 (10) 765 0.2 5 9 8 18 4 3 4 (0) 4 (2) Dec-15 45 48 8 29.6 20.4 13.8 12.7 79 94 2.0 6.9 1.4 5.8 9.5 3
Bloomberry BLOOM PM O P 6.83 6.00 (12) 1,591 1.0 5 35 43 50 (26) 3 30 36 36 (31) Dec-15 103 1,078 75 n.m. n.m. 73.0 41.6 38 73 0.0 0.4 3.4 3.3 8.6 79
Jollibee JFC PM O P 249.80 262.30 5 5,656 4.4 2 8 9 14 30 0 3 1 (0) 25 Dec-15 18 17 14 46.1 39.0 33.4 29.4 107 107 0.9 20.4 7.3 2.3 22.5 (8)
Melco Crown (Phils) MCP PM U P 4.09 3.28 (20) 490 1.3 10 68 54 79 (25) 8 63 46 64 (30) Dec-15 64 43 88 n.m. n.m. n.m. n.m. 105 141 0.0 (77.9) 7.9 1.6 7.2 252
PLC PLC PM N P 1.19 0.96 (19) 797 0.5 2 19 35 86 (11) (0) 14 27 72 (17) Dec-15 626 83 19 n.m. 67.7 36.9 30.9 65 90 1.8 3.5 2.3 9.9 16.5 (11)
Travellers RWM PM N P 3.43 3.84 12 1,144 0.1 1 1 (5) (21) (33) (1) (4) (13) (35) (38) Dec-15 (2) (23) (16) 13.4 13.7 17.7 21.1 97 79 1.5 9.1 1.2 2.4 6.7 4
Sector Aggregate (1) 10,442 3 15 17 25 7 1 10 9 10 2 Dec-15 418 44 27 n.m. 52.0 36.2 28.6 96 100 0.9 6.6 3.3 2.6 12.5 15
Metals & Mining Patricia Palanca - 63 2 858 7752
Semirara SCC PM O P 121.00 156.00 29 2,737 1.6 (3) (6) (5) (11) (15) (5) (11) (13) (26) (20) Dec-15 29 14 (1) 15.2 11.8 10.4 10.5 105 107 3.3 36.3 3.8 4.5 9.4 44
Real Estate Danielo Picache - 632 858 7758
Ayala Land ALI PM N P 40.00 37.70 (6) 12,458 9.2 3 8 11 16 4 1 3 3 2 (1) Dec-15 11 16 22 33.1 29.8 25.8 21.2 97 97 1.2 14.0 4.0 6.0 17.7 54
Filinvest Land FLI PM N P 2.00 1.68 (16) 1,027 0.7 0 0 7 12 6 (2) (5) (1) (3) 1 Dec-15 12 15 11 9.6 8.5 7.4 6.7 101 103 2.7 9.8 0.8 4.6 11.5 63
Megaworld MEG PM O P 5.00 5.15 3 3,411 4.0 5 14 21 18 4 4 8 13 3 (1) Dec-15 14 16 13 15.6 13.6 11.8 10.4 100 104 0.8 9.5 1.2 4.2 10.0 24
Robinsons Land RLC PM O P 30.60 32.70 7 2,652 1.5 1 5 5 11 8 (1) (1) (3) (3) 3 Sep-15 27 16 16 21.9 17.2 14.8 12.7 110 112 1.2 12.1 2.0 6.7 12.0 51
SM Prime SMPH PM N P 29.95 21.50 (28) 18,309 8.0 9 19 31 38 48 7 14 23 24 42 Dec-14 26 14 16 47.0 37.3 32.6 28.2 111 106 0.8 12.9 4.6 12.2 23.3 51
Sector Aggregate (15) 37,857 6 13 21 26 26 4 8 13 12 20 Dec-15 14 16 17 28.6 25.1 21.7 15.8 103 104 1.1 12.3 2.9 7.1 16.6 47
Retailing Alvin Arogo - 63 2 858 7716
SSI Group SSI PM O P 3.69 6.50 76 259 0.7 5 37 (5) 7 (56) 4 32 (13) (7) (62) Dec-14 (27) 42 30 8.9 12.2 8.6 6.6 126 180 0.0 10.6 1.2 0.9 4.9 27
Telecommunication Services Varun Ahuja - 65 6212 3017
Globe GLO PM O P 2,314.00 2,675.00 16 6,502 4.2 (2) (2) 10 25 (6) (4) (7) 2 11 (11) Dec-15 11 13 16 21.2 19.0 16.8 14.4 97 105 3.8 26.3 4.8 3.1 8.2 162
PLDT TEL PM N P 2,088.00 1,950.00 (7) 9,547 8.1 (2) 4 10 1 (26) (4) (2) 2 (13) (32) Dec-15 (23) (5) (2) 12.8 16.7 17.5 17.9 97 95 5.0 23.1 3.7 3.3 8.4 101
Sector Aggregate 2 16,049 (2) 1 10 11 (18) (4) (4) 2 (3) (23) Dec-15 (13) 2 5 15.3 17.6 17.2 16.3 97 99 4.5 24.2 4.1 3.2 8.3 122
Transportation Muzhafar Mukhtar/ Patricia Palanca - 60 3 2723 2084/ 63 2 858 7752
Cebu Air CEB PM O P 99.70 110.00 10 1,279 1.1 1 3 11 22 13 (1) (3) 3 8 8 Dec-15 24 (11) (8) 8.8 7.1 8.0 8.7 92 96 2.3 29.8 1.9 2.1 8.5 106
ICTSI ICT PM O P 63.00 102.00 62 2,712 1.9 (1) 5 (7) (10) (43) (3) (0) (15) (25) (48) Dec-15 10,833 (3) 14 n.m. 24.8 25.5 22.4 83 72 1.4 20.1 3.0 4.0 9.3 82
Sector Aggregate 45 3,991 (0) 4 (2) 0 (25) (2) (1) (10) (14) (30) Dec-15 98 (7) 2 27.3 13.8 14.9 14.6 88 85 1.7 24.0 2.5 2.9 9.0 88
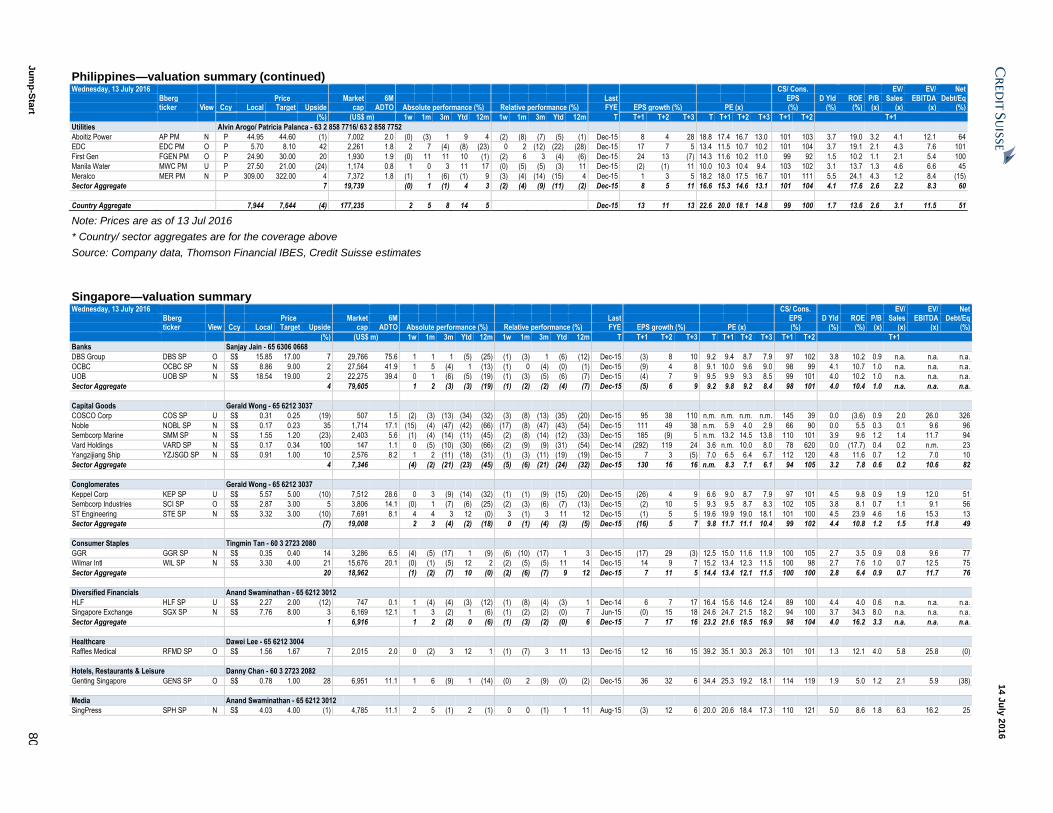
Ju
mp
-Sta
rt 8
0
14 J
uly
201
6
Philippines—valuation summary (continued) Wednesday, 13 July 2016
CS/ Cons. EV/ EV/ Net
Bberg Price Market 6M Last EPS D Yld ROE P/B Sales EBITDA Debt/Eq ticker View Ccy Local Target Upside cap ADTO Absolute performance (%) Relative performance (%) FYE EPS growth (%) PE (x) (%) (%) (%) (x) (x) (x) (%)
(%) (US$ m) 1w 1m 3m Ytd 12m 1w 1m 3m Ytd 12m T T+1 T+2 T+3 T T+1 T+2 T+3 T+1 T+2 T+1
Utilities Alvin Arogo/ Patricia Palanca - 63 2 858 7716/ 63 2 858 7752
Aboitiz Power AP PM N P 44.95 44.60 (1) 7,002 2.0 (0) (3) 1 9 4 (2) (8) (7) (5) (1) Dec-15 8 4 28 18.8 17.4 16.7 13.0 101 103 3.7 19.0 3.2 4.1 12.1 64
EDC EDC PM O P 5.70 8.10 42 2,261 1.8 2 7 (4) (8) (23) 0 2 (12) (22) (28) Dec-15 17 7 5 13.4 11.5 10.7 10.2 101 104 3.7 19.1 2.1 4.3 7.6 101
First Gen FGEN PM O P 24.90 30.00 20 1,930 1.9 (0) 11 11 10 (1) (2) 6 3 (4) (6) Dec-15 24 13 (7) 14.3 11.6 10.2 11.0 99 92 1.5 10.2 1.1 2.1 5.4 100
Manila Water MWC PM U P 27.50 21.00 (24) 1,174 0.8 1 0 3 11 17 (0) (5) (5) (3) 11 Dec-15 (2) (1) 11 10.0 10.3 10.4 9.4 103 102 3.1 13.7 1.3 4.6 6.6 45
Meralco MER PM N P 309.00 322.00 4 7,372 1.8 (1) 1 (6) (1) 9 (3) (4) (14) (15) 4 Dec-15 1 3 5 18.2 18.0 17.5 16.7 101 111 5.5 24.1 4.3 1.2 8.4 (15)
Sector Aggregate 7 19,739 (0) 1 (1) 4 3 (2) (4) (9) (11) (2) Dec-15 8 5 11 16.6 15.3 14.6 13.1 101 104 4.1 17.6 2.6 2.2 8.3 60
Country Aggregate 7,944 7,644 (4) 177,235 2 5 8 14 5 Dec-15 13 11 13 22.6 20.0 18.1 14.8 99 100 1.7 13.6 2.6 3.1 11.5 51
Note: Prices are as of 13 Jul 2016
* Country/ sector aggregates are for the coverage above
Source: Company data, Thomson Financial IBES, Credit Suisse estimates
Singapore—valuation summary Wednesday, 13 July 2016
CS/ Cons. EV/ EV/ Net
Bberg Price Market 6M Last EPS D Yld ROE P/B Sales EBITDA Debt/Eq ticker View Ccy Local Target Upside cap ADTO Absolute performance (%) Relative performance (%) FYE EPS growth (%) PE (x) (%) (%) (%) (x) (x) (x) (%)
(%) (US$ m) 1w 1m 3m Ytd 12m 1w 1m 3m Ytd 12m T T+1 T+2 T+3 T T+1 T+2 T+3 T+1 T+2 T+1
Banks Sanjay Jain - 65 6306 0668
DBS Group DBS SP O S$ 15.85 17.00 7 29,766 75.6 1 1 1 (5) (25) (1) (3) 1 (6) (12) Dec-15 (3) 8 10 9.2 9.4 8.7 7.9 97 102 3.8 10.2 0.9 n.a. n.a. n.a.
OCBC OCBC SP N S$ 8.86 9.00 2 27,564 41.9 1 5 (4) 1 (13) (1) 0 (4) (0) (1) Dec-15 (9) 4 8 9.1 10.0 9.6 9.0 98 99 4.1 10.7 1.0 n.a. n.a. n.a.
UOB UOB SP N S$ 18.54 19.00 2 22,275 39.4 0 1 (6) (5) (19) (1) (3) (5) (6) (7) Dec-15 (4) 7 9 9.5 9.9 9.3 8.5 99 101 4.0 10.2 1.0 n.a. n.a. n.a.
Sector Aggregate 4 79,605 1 2 (3) (3) (19) (1) (2) (2) (4) (7) Dec-15 (5) 6 9 9.2 9.8 9.2 8.4 98 101 4.0 10.4 1.0 n.a. n.a. n.a.
Capital Goods Gerald Wong - 65 6212 3037
COSCO Corp COS SP U S$ 0.31 0.25 (19) 507 1.5 (2) (3) (13) (34) (32) (3) (8) (13) (35) (20) Dec-15 95 38 110 n.m. n.m. n.m. n.m. 145 39 0.0 (3.6) 0.9 2.0 26.0 326
Noble NOBL SP N S$ 0.17 0.23 35 1,714 17.1 (15) (4) (47) (42) (66) (17) (8) (47) (43) (54) Dec-15 111 49 38 n.m. 5.9 4.0 2.9 66 90 0.0 5.5 0.3 0.1 9.6 96
Sembcorp Marine SMM SP N S$ 1.55 1.20 (23) 2,403 5.6 (1) (4) (14) (11) (45) (2) (8) (14) (12) (33) Dec-15 185 (9) 5 n.m. 13.2 14.5 13.8 110 101 3.9 9.6 1.2 1.4 11.7 94
Vard Holdings VARD SP N S$ 0.17 0.34 100 147 1.1 0 (5) (10) (30) (66) (2) (9) (9) (31) (54) Dec-14 (292) 119 24 3.6 n.m. 10.0 8.0 78 620 0.0 (17.7) 0.4 0.2 n.m. 23
Yangzijiang Ship YZJSGD SP N S$ 0.91 1.00 10 2,576 8.2 1 2 (11) (18) (31) (1) (3) (11) (19) (19) Dec-15 7 3 (5) 7.0 6.5 6.4 6.7 112 120 4.8 11.6 0.7 1.2 7.0 10
Sector Aggregate 4 7,346 (4) (2) (21) (23) (45) (5) (6) (21) (24) (32) Dec-15 130 16 16 n.m. 8.3 7.1 6.1 94 105 3.2 7.8 0.6 0.2 10.6 82
Conglomerates Gerald Wong - 65 6212 3037
Keppel Corp KEP SP U S$ 5.57 5.00 (10) 7,512 28.6 0 3 (9) (14) (32) (1) (1) (9) (15) (20) Dec-15 (26) 4 9 6.6 9.0 8.7 7.9 97 101 4.5 9.8 0.9 1.9 12.0 51
Sembcorp Industries SCI SP O S$ 2.87 3.00 5 3,806 14.1 (0) 1 (7) (6) (25) (2) (3) (6) (7) (13) Dec-15 (2) 10 5 9.3 9.5 8.7 8.3 102 105 3.8 8.1 0.7 1.1 9.1 56
ST Engineering STE SP N S$ 3.32 3.00 (10) 7,691 8.1 4 4 3 12 (0) 3 (1) 3 11 12 Dec-15 (1) 5 5 19.6 19.9 19.0 18.1 101 100 4.5 23.9 4.6 1.6 15.3 13
Sector Aggregate (7) 19,008 2 3 (4) (2) (18) 0 (1) (4) (3) (5) Dec-15 (16) 5 7 9.8 11.7 11.1 10.4 99 102 4.4 10.8 1.2 1.5 11.8 49
Consumer Staples Tingmin Tan - 60 3 2723 2080
GGR GGR SP N S$ 0.35 0.40 14 3,286 6.5 (4) (5) (17) 1 (9) (6) (10) (17) 1 3 Dec-15 (17) 29 (3) 12.5 15.0 11.6 11.9 100 105 2.7 3.5 0.9 0.8 9.6 77
Wilmar Intl WIL SP N S$ 3.30 4.00 21 15,676 20.1 (0) (1) (5) 12 2 (2) (5) (5) 11 14 Dec-15 14 9 7 15.2 13.4 12.3 11.5 100 98 2.7 7.6 1.0 0.7 12.5 75
Sector Aggregate 20 18,962 (1) (2) (7) 10 (0) (2) (6) (7) 9 12 Dec-15 7 11 5 14.4 13.4 12.1 11.5 100 100 2.8 6.4 0.9 0.7 11.7 76
Diversified Financials Anand Swaminathan - 65 6212 3012
HLF HLF SP U S$ 2.27 2.00 (12) 747 0.1 1 (4) (4) (3) (12) (1) (8) (4) (3) 1 Dec-14 6 7 17 16.4 15.6 14.6 12.4 89 100 4.4 4.0 0.6 n.a. n.a. n.a.
Singapore Exchange SGX SP N S$ 7.76 8.00 3 6,169 12.1 1 3 (2) 1 (6) (1) (2) (2) (0) 7 Jun-15 (0) 15 18 24.6 24.7 21.5 18.2 94 100 3.7 34.3 8.0 n.a. n.a. n.a.
Sector Aggregate 1 6,916 1 2 (2) 0 (6) (1) (3) (2) (0) 6 Dec-15 7 17 16 23.2 21.6 18.5 16.9 98 104 4.0 16.2 3.3 n.a. n.a. n.a.
Healthcare Dawei Lee - 65 6212 3004
Raffles Medical RFMD SP O S$ 1.56 1.67 7 2,015 2.0 0 (2) 3 12 1 (1) (7) 3 11 13 Dec-15 12 16 15 39.2 35.1 30.3 26.3 101 101 1.3 12.1 4.0 5.8 25.8 (0)
Hotels, Restaurants & Leisure Danny Chan - 60 3 2723 2082
Genting Singapore GENS SP O S$ 0.78 1.00 28 6,951 11.1 1 6 (9) 1 (14) (0) 2 (9) (0) (2) Dec-15 36 32 6 34.4 25.3 19.2 18.1 114 119 1.9 5.0 1.2 2.1 5.9 (38)
Media Anand Swaminathan - 65 6212 3012
SingPress SPH SP N S$ 4.03 4.00 (1) 4,785 11.1 2 5 (1) 2 (1) 0 0 (1) 1 11 Aug-15 (3) 12 6 20.0 20.6 18.4 17.3 110 121 5.0 8.6 1.8 6.3 16.2 25

Ju
mp
-Sta
rt 8
1
14 J
uly
201
6
Singapore—valuation summary (continued) Wednesday, 13 July 2016
CS/ Cons. EV/ EV/ Net
Bberg Price Market 6M Last EPS D Yld ROE P/B Sales EBITDA Debt/Eq ticker View Ccy Local Target Upside cap ADTO Absolute performance (%) Relative performance (%) FYE EPS growth (%) PE (x) (%) (%) (%) (x) (x) (x) (%)
(%) (US$ m) 1w 1m 3m Ytd 12m 1w 1m 3m Ytd 12m T T+1 T+2 T+3 T T+1 T+2 T+3 T+1 T+2 T+1
Paper & Forest Products Gerald Wong - 65 6212 3037
Halcyon Agri HACL SP O S$ 0.74 0.90 22 329 1.1 2 2 0 11 19 1 (2) 0 10 32 Dec-14 316 77 56 n.m. 11.3 6.4 4.1 333 102 1.4 22.0 2.3 0.4 5.6 135
Real Estate Louis Chua - 65 6212 5721
CapitaLand CAPL SP N S$ 3.05 3.50 15 9,671 25.2 2 2 (3) (9) (10) 0 (2) (2) (10) 3 Dec-15 26 12 20 19.7 15.6 13.9 11.6 113 117 3.0 4.6 0.7 7.1 10.3 50
CDL CIT SP O S$ 8.26 11.70 42 5,572 12.8 2 (5) (5) 8 (16) 0 (9) (4) 8 (4) Dec-15 24 4 5 13.7 11.1 10.6 10.2 111 120 1.9 7.3 0.8 2.4 8.8 20
Sector Aggregate 25 15,243 2 (0) (3) (3) (12) 0 (5) (3) (3) 0 Dec-15 25 9 13 17.0 13.6 12.5 11.0 112 118 2.6 5.5 0.7 4.6 9.8 40
REITs Nicholas Teh - 65 6212 3026
AREIT AREIT SP N S$ 2.48 2.45 (1) 4,920 18.4 0 6 0 9 0 (1) 2 1 8 12 Mar-16 5 1 2 16.7 16.0 15.8 15.5 101 96 6.3 7.8 1.3 n.a. 18.7 62
Ascott REIT ART SP N S$ 1.12 1.37 22 1,370 1.9 0 (0) (0) (5) (15) (1) (5) (0) (6) (3) Dec-14 27 13 (1) 23.1 18.2 16.1 16.2 104 93 7.0 4.4 0.8 n.a. 19.0 60
CCT CCT SP U S$ 1.55 1.40 (10) 3,399 8.6 2 12 9 15 2 0 7 9 14 15 Dec-15 (8) 4 0 17.6 19.2 18.5 18.4 94 99 5.7 4.6 0.9 n.a. 38.4 47
CDL REIT CDREIT SP O S$ 1.51 1.60 6 1,109 1.4 2 7 8 14 (8) 1 2 8 13 4 Dec-15 14 3 1 16.7 14.6 14.2 14.1 99 100 6.8 6.5 0.9 n.a. 18.5 54
CMT CT SP O S$ 2.17 2.22 2 5,702 15.9 0 7 1 12 0 (2) 2 2 12 13 Dec-15 1 3 1 19.5 19.3 18.8 18.5 98 96 5.3 6.2 1.1 n.a. 20.1 40
FCT FCT SP O S$ 2.15 2.14 (0) 1,465 1.3 2 9 8 17 3 1 4 8 16 16 Sep-15 1 (0) 6 19.5 19.3 19.4 18.2 94 92 5.4 5.7 1.1 n.a. 23.7 39
Keppel DC REIT KDCREIT SP O S$ 1.15 1.13 (2) 750 1.5 (1) 7 7 13 8 (2) 2 7 12 20 Dec-15 4 4 2 16.9 16.2 15.6 15.2 99 101 6.1 7.6 1.2 n.a. 17.5 42
K-REIT KREIT SP N S$ 1.08 0.95 (12) 2,613 2.9 1 2 7 16 (5) (0) (2) 8 15 7 Dec-15 29 1 (1) 28.9 22.3 22.0 22.1 85 86 6.1 3.3 0.7 n.a. 47.9 46
MCT MCT SP O S$ 1.54 1.64 6 2,430 2.6 5 6 7 18 6 4 2 8 17 18 Mar-16 (9) 21 4 20.6 22.7 18.8 18.0 83 94 5.5 5.9 1.2 n.a. 23.1 62
MINT MINT SP O S$ 1.79 1.71 (4) 2,385 3.0 2 11 10 17 14 1 7 10 17 26 Mar-16 (0) 7 3 16.6 16.6 15.5 15.1 99 97 6.1 7.8 1.3 n.a. 19.5 43
MLT MLT SP N S$ 1.05 1.08 3 1,941 3.4 3 7 4 6 (8) 1 2 4 5 4 Mar-16 19 1 3 13.7 11.6 11.4 11.0 124 121 6.9 8.9 1.0 n.a. 17.6 70
SPH REIT SPHREIT SP N S$ 0.96 1.02 6 1,801 0.8 2 3 1 0 (7) 0 (2) 1 (1) 5 Aug-15 1 2 2 20.6 20.5 20.1 19.8 86 88 5.8 4.9 1.0 n.a. 22.1 31
SUNT SUN SP U S$ 1.80 1.36 (24) 3,379 6.6 1 10 7 16 5 (0) 6 7 15 17 Dec-15 (12) 23 0 18.9 21.4 17.4 17.3 103 122 5.5 3.9 0.8 n.a. 34.0 50
Sector Aggregate (2) 33,266 1 7 5 12 0 (0) 3 5 11 13 Dec-15 2 5 2 18.4 18.1 17.2 16.9 98 99 5.9 5.7 1.0 n.a. 23.2 50
Technology Hardware Anand Swaminathan - 65 6212 3012
Venture VMS SP N S$ 8.74 7.75 (11) 1,797 3.2 3 5 5 7 12 2 1 5 6 25 Dec-14 14 10 10 17.2 15.1 13.7 12.5 104 107 5.7 8.9 1.4 0.8 9.7 (22)
Telecommunication Services Varun Ahuja - 65 6212 3017
M1 M1 SP U S$ 2.87 2.05 (29) 1,995 3.5 5 13 18 6 (13) 3 9 18 5 (0) Dec-15 (2) (16) (11) 15.1 15.4 18.2 20.5 98 84 5.2 40.6 6.0 2.6 9.0 87
SingTel ST SP O S$ 4.31 4.45 3 50,977 63.1 4 12 13 17 (0) 2 7 13 17 12 Mar-16 (3) 6 6 17.7 18.3 17.2 16.2 95 93 4.0 14.9 2.7 4.7 15.4 38
StarHub STH SP U S$ 3.91 3.00 (23) 5,022 7.4 4 9 16 6 (2) 3 5 16 5 11 Dec-15 0 (13) (4) 18.0 17.9 20.7 21.5 108 94 5.1 185.2 30.8 3.0 9.9 265
Sector Aggregate (0) 57,995 4 12 14 16 (1) 2 7 14 15 12 Dec-15 (2) 2 5 17.7 18.0 17.7 16.9 97 93 4.2 16.8 3.0 4.4 14.4 41
Transportation Christopher Siow/ Louis Chua - 65 6212 3062/ 65 6212 5721
ComfortDelGro CD SP O S$ 2.85 3.70 30 4,558 13.3 2 8 (2) (7) (6) 0 3 (2) (7) 6 Dec-15 7 6 12 20.2 18.9 17.9 16.0 95 91 3.4 13.5 2.5 1.2 6.1 (38)
SATS SATS SP O S$ 4.35 5.00 15 3,627 6.9 3 6 8 13 19 2 1 8 12 31 Mar-16 15 8 9 22.1 19.3 17.8 16.2 104 109 3.9 16.6 3.1 2.5 13.9 (27)
Singapore Airlines SIA SP O S$ 10.89 14.10 29 9,693 14.7 1 3 (5) (3) (2) (0) (1) (5) (4) 11 Mar-16 38 (8) (12) 15.9 11.4 12.5 14.2 120 110 4.7 8.6 1.0 1.1 6.4 (19)
SMRT MRT SP O S$ 1.54 1.90 23 1,735 2.5 2 1 0 2 9 0 (3) 0 1 21 Mar-16 (9) 7 39 21.4 23.6 21.9 15.7 102 97 2.3 10.6 2.5 2.0 8.0 32
Sector Aggregate 26 19,614 2 4 (2) (0) 2 0 (0) (1) (1) 14 Dec-15 30 3 (1) 19.8 15.2 14.8 15.0 109 106 4.0 9.6 1.5 1.3 7.2 (21)
Utilities Gerald Wong - 65 6212 3037
Hyflux HYF SP N S$ 0.61 0.50 (18) 388 0.7 1 5 (4) 7 (30) (1) 1 (4) 6 (18) Dec-15 (153) 347 50 22.4 n.m. 17.2 11.4 n.m. 439 2.8 (1.4) 0.6 2.8 19.3 90
Keppel Infra KIT SP O S$ 0.51 0.57 12 1,445 0.9 1 2 1 (1) (5) (1) (2) 1 (2) 8 Dec-14 64 12 22 86.1 52.6 46.8 38.4 n.a. 108 7.4 2.9 1.6 4.9 13.8 105
Sector Aggregate 6 1,833 1 3 (0) 1 (10) (1) (2) 0 (0) 2 Dec-15 (51) 177 50 40.9 84.3 30.5 11.4 74 152 6.4 1.5 1.2 3.9 15.2 103
Country Aggregate 2,908 3,079 6 275,666 2 4 (0) 1 (12) Dec-15 22 7 7 16.4 13.4 12.5 11.5 100 101 4.1 9.1 1.2 1.1 12.4 42
Note: Prices are as of 13 Jul 2016
* Country/ sector aggregates are for the coverage above
Source: Company data, Thomson Financial IBES, Credit Suisse estimates
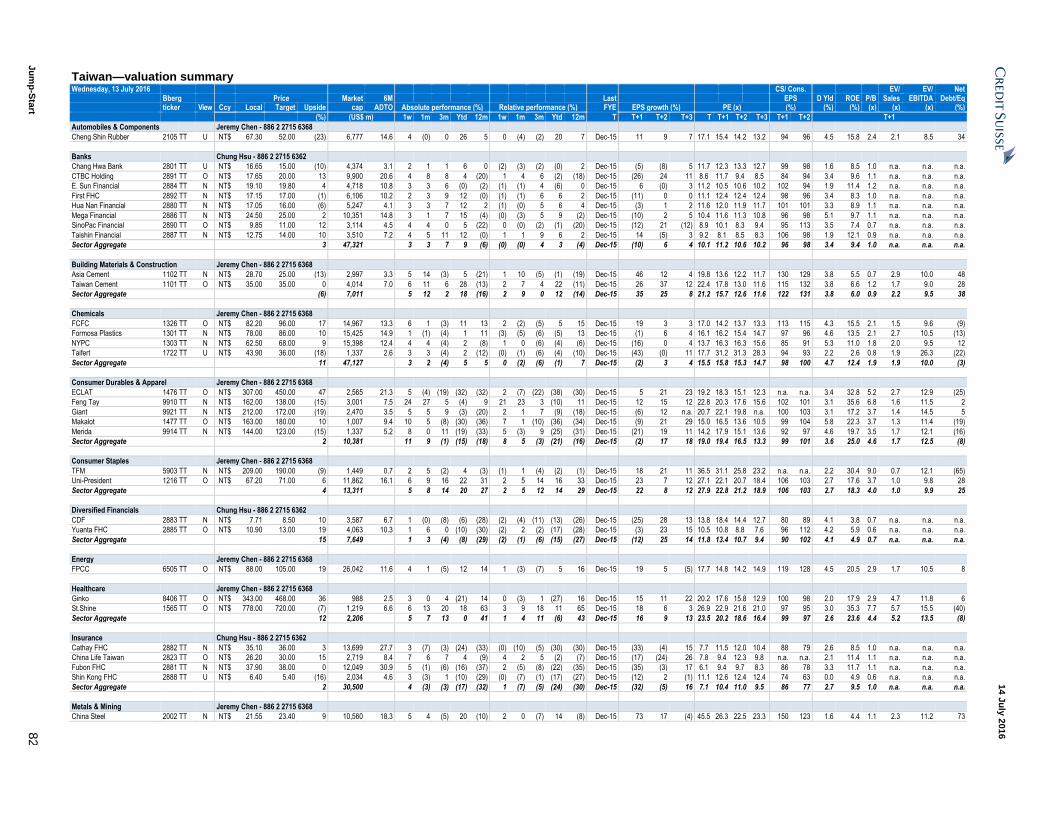
Ju
mp
-Sta
rt 8
2
14 J
uly
201
6
Taiwan—valuation summary Wednesday, 13 July 2016
CS/ Cons. EV/ EV/ Net
Bberg Price Market 6M Last EPS D Yld ROE P/B Sales EBITDA Debt/Eq ticker View Ccy Local Target Upside cap ADTO Absolute performance (%) Relative performance (%) FYE EPS growth (%) PE (x) (%) (%) (%) (x) (x) (x) (%)
(%) (US$ m) 1w 1m 3m Ytd 12m 1w 1m 3m Ytd 12m T T+1 T+2 T+3 T T+1 T+2 T+3 T+1 T+2 T+1
Automobiles & Components Jeremy Chen - 886 2 2715 6368
Cheng Shin Rubber 2105 TT U NT$ 67.30 52.00 (23) 6,777 14.6 4 (0) 0 26 5 0 (4) (2) 20 7 Dec-15 11 9 7 17.1 15.4 14.2 13.2 94 96 4.5 15.8 2.4 2.1 8.5 34
Banks Chung Hsu - 886 2 2715 6362
Chang Hwa Bank 2801 TT U NT$ 16.65 15.00 (10) 4,374 3.1 2 1 1 6 0 (2) (3) (2) (0) 2 Dec-15 (5) (8) 5 11.7 12.3 13.3 12.7 99 98 1.6 8.5 1.0 n.a. n.a. n.a.
CTBC Holding 2891 TT O NT$ 17.65 20.00 13 9,900 20.6 4 8 8 4 (20) 1 4 6 (2) (18) Dec-15 (26) 24 11 8.6 11.7 9.4 8.5 84 94 3.4 9.6 1.1 n.a. n.a. n.a.
E. Sun Financial 2884 TT N NT$ 19.10 19.80 4 4,718 10.8 3 3 6 (0) (2) (1) (1) 4 (6) 0 Dec-15 6 (0) 3 11.2 10.5 10.6 10.2 102 94 1.9 11.4 1.2 n.a. n.a. n.a.
First FHC 2892 TT N NT$ 17.15 17.00 (1) 6,106 10.2 2 3 9 12 (0) (1) (1) 6 6 2 Dec-15 (11) 0 0 11.1 12.4 12.4 12.4 98 96 3.4 8.3 1.0 n.a. n.a. n.a.
Hua Nan Financial 2880 TT N NT$ 17.05 16.00 (6) 5,247 4.1 3 3 7 12 2 (1) (0) 5 6 4 Dec-15 (3) 1 2 11.6 12.0 11.9 11.7 101 101 3.3 8.9 1.1 n.a. n.a. n.a.
Mega Financial 2886 TT N NT$ 24.50 25.00 2 10,351 14.8 3 1 7 15 (4) (0) (3) 5 9 (2) Dec-15 (10) 2 5 10.4 11.6 11.3 10.8 96 98 5.1 9.7 1.1 n.a. n.a. n.a.
SinoPac Financial 2890 TT O NT$ 9.85 11.00 12 3,114 4.5 4 4 0 5 (22) 0 (0) (2) (1) (20) Dec-15 (12) 21 (12) 8.9 10.1 8.3 9.4 95 113 3.5 7.4 0.7 n.a. n.a. n.a.
Taishin Financial 2887 TT N NT$ 12.75 14.00 10 3,510 7.2 4 5 11 12 (0) 1 1 9 6 2 Dec-15 14 (5) 3 9.2 8.1 8.5 8.3 106 98 1.9 12.1 0.9 n.a. n.a. n.a.
Sector Aggregate 3 47,321 3 3 7 9 (6) (0) (0) 4 3 (4) Dec-15 (10) 6 4 10.1 11.2 10.6 10.2 96 98 3.4 9.4 1.0 n.a. n.a. n.a.
Building Materials & Construction Jeremy Chen - 886 2 2715 6368
Asia Cement 1102 TT N NT$ 28.70 25.00 (13) 2,997 3.3 5 14 (3) 5 (21) 1 10 (5) (1) (19) Dec-15 46 12 4 19.8 13.6 12.2 11.7 130 129 3.8 5.5 0.7 2.9 10.0 48
Taiwan Cement 1101 TT O NT$ 35.00 35.00 0 4,014 7.0 6 11 6 28 (13) 2 7 4 22 (11) Dec-15 26 37 12 22.4 17.8 13.0 11.6 115 132 3.8 6.6 1.2 1.7 9.0 28
Sector Aggregate (6) 7,011 5 12 2 18 (16) 2 9 0 12 (14) Dec-15 35 25 8 21.2 15.7 12.6 11.6 122 131 3.8 6.0 0.9 2.2 9.5 38
Chemicals Jeremy Chen - 886 2 2715 6368
FCFC 1326 TT O NT$ 82.20 96.00 17 14,967 13.3 6 1 (3) 11 13 2 (2) (5) 5 15 Dec-15 19 3 3 17.0 14.2 13.7 13.3 113 115 4.3 15.5 2.1 1.5 9.6 (9)
Formosa Plastics 1301 TT N NT$ 78.00 86.00 10 15,425 14.9 1 (1) (4) 1 11 (3) (5) (6) (5) 13 Dec-15 (1) 6 4 16.1 16.2 15.4 14.7 97 96 4.6 13.5 2.1 2.7 10.5 (13)
NYPC 1303 TT N NT$ 62.50 68.00 9 15,398 12.4 4 4 (4) 2 (8) 1 0 (6) (4) (6) Dec-15 (16) 0 4 13.7 16.3 16.3 15.6 85 91 5.3 11.0 1.8 2.0 9.5 12
Taifert 1722 TT U NT$ 43.90 36.00 (18) 1,337 2.6 3 3 (4) 2 (12) (0) (1) (6) (4) (10) Dec-15 (43) (0) 11 17.7 31.2 31.3 28.3 94 93 2.2 2.6 0.8 1.9 26.3 (22)
Sector Aggregate 11 47,127 3 2 (4) 5 5 0 (2) (6) (1) 7 Dec-15 (2) 3 4 15.5 15.8 15.3 14.7 98 100 4.7 12.4 1.9 1.9 10.0 (3)
Consumer Durables & Apparel Jeremy Chen - 886 2 2715 6368
ECLAT 1476 TT O NT$ 307.00 450.00 47 2,565 21.3 5 (4) (19) (32) (32) 2 (7) (22) (38) (30) Dec-15 5 21 23 19.2 18.3 15.1 12.3 n.a. n.a. 3.4 32.8 5.2 2.7 12.9 (25)
Feng Tay 9910 TT N NT$ 162.00 138.00 (15) 3,001 7.5 24 27 5 (4) 9 21 23 3 (10) 11 Dec-15 12 15 12 22.8 20.3 17.6 15.6 102 101 3.1 35.6 6.8 1.6 11.5 2
Giant 9921 TT N NT$ 212.00 172.00 (19) 2,470 3.5 5 5 9 (3) (20) 2 1 7 (9) (18) Dec-15 (6) 12 n.a. 20.7 22.1 19.8 n.a. 100 103 3.1 17.2 3.7 1.4 14.5 5
Makalot 1477 TT O NT$ 163.00 180.00 10 1,007 9.4 10 5 (8) (30) (36) 7 1 (10) (36) (34) Dec-15 (9) 21 29 15.0 16.5 13.6 10.5 99 104 5.8 22.3 3.7 1.3 11.4 (19)
Merida 9914 TT N NT$ 144.00 123.00 (15) 1,337 5.2 8 0 11 (19) (33) 5 (3) 9 (25) (31) Dec-15 (21) 19 11 14.2 17.9 15.1 13.6 92 97 4.6 19.7 3.5 1.7 12.1 (16)
Sector Aggregate 2 10,381 11 9 (1) (15) (18) 8 5 (3) (21) (16) Dec-15 (2) 17 18 19.0 19.4 16.5 13.3 99 101 3.6 25.0 4.6 1.7 12.5 (8)
Consumer Staples Jeremy Chen - 886 2 2715 6368
TFM 5903 TT N NT$ 209.00 190.00 (9) 1,449 0.7 2 5 (2) 4 (3) (1) 1 (4) (2) (1) Dec-15 18 21 11 36.5 31.1 25.8 23.2 n.a. n.a. 2.2 30.4 9.0 0.7 12.1 (65)
Uni-President 1216 TT O NT$ 67.20 71.00 6 11,862 16.1 6 9 16 22 31 2 5 14 16 33 Dec-15 23 7 12 27.1 22.1 20.7 18.4 106 103 2.7 17.6 3.7 1.0 9.8 28
Sector Aggregate 4 13,311 5 8 14 20 27 2 5 12 14 29 Dec-15 22 8 12 27.9 22.8 21.2 18.9 106 103 2.7 18.3 4.0 1.0 9.9 25
Diversified Financials Chung Hsu - 886 2 2715 6362
CDF 2883 TT N NT$ 7.71 8.50 10 3,587 6.7 1 (0) (8) (6) (28) (2) (4) (11) (13) (26) Dec-15 (25) 28 13 13.8 18.4 14.4 12.7 80 89 4.1 3.8 0.7 n.a. n.a. n.a.
Yuanta FHC 2885 TT O NT$ 10.90 13.00 19 4,063 10.3 1 6 0 (10) (30) (2) 2 (2) (17) (28) Dec-15 (3) 23 15 10.5 10.8 8.8 7.6 96 112 4.2 5.9 0.6 n.a. n.a. n.a.
Sector Aggregate 15 7,649 1 3 (4) (8) (29) (2) (1) (6) (15) (27) Dec-15 (12) 25 14 11.8 13.4 10.7 9.4 90 102 4.1 4.9 0.7 n.a. n.a. n.a.
Energy Jeremy Chen - 886 2 2715 6368
FPCC 6505 TT O NT$ 88.00 105.00 19 26,042 11.6 4 1 (5) 12 14 1 (3) (7) 5 16 Dec-15 19 5 (5) 17.7 14.8 14.2 14.9 119 128 4.5 20.5 2.9 1.7 10.5 8
Healthcare Jeremy Chen - 886 2 2715 6368
Ginko 8406 TT O NT$ 343.00 468.00 36 988 2.5 3 0 4 (21) 14 0 (3) 1 (27) 16 Dec-15 15 11 22 20.2 17.6 15.8 12.9 100 98 2.0 17.9 2.9 4.7 11.8 6
St.Shine 1565 TT O NT$ 778.00 720.00 (7) 1,219 6.6 6 13 20 18 63 3 9 18 11 65 Dec-15 18 6 3 26.9 22.9 21.6 21.0 97 95 3.0 35.3 7.7 5.7 15.5 (40)
Sector Aggregate 12 2,206 5 7 13 0 41 1 4 11 (6) 43 Dec-15 16 9 13 23.5 20.2 18.6 16.4 99 97 2.6 23.6 4.4 5.2 13.5 (8)
Insurance Chung Hsu - 886 2 2715 6362
Cathay FHC 2882 TT N NT$ 35.10 36.00 3 13,699 27.7 3 (7) (3) (24) (33) (0) (10) (5) (30) (30) Dec-15 (33) (4) 15 7.7 11.5 12.0 10.4 88 79 2.6 8.5 1.0 n.a. n.a. n.a.
China Life Taiwan 2823 TT O NT$ 26.20 30.00 15 2,719 8.4 7 6 7 4 (9) 4 2 5 (2) (7) Dec-15 (17) (24) 26 7.8 9.4 12.3 9.8 n.a. n.a. 2.1 11.4 1.1 n.a. n.a. n.a.
Fubon FHC 2881 TT N NT$ 37.90 38.00 0 12,049 30.9 5 (1) (6) (16) (37) 2 (5) (8) (22) (35) Dec-15 (35) (3) 17 6.1 9.4 9.7 8.3 86 78 3.3 11.7 1.1 n.a. n.a. n.a.
Shin Kong FHC 2888 TT U NT$ 6.40 5.40 (16) 2,034 4.6 3 (3) 1 (10) (29) (0) (7) (1) (17) (27) Dec-15 (12) 2 (1) 11.1 12.6 12.4 12.4 74 63 0.0 4.9 0.6 n.a. n.a. n.a.
Sector Aggregate 2 30,500 4 (3) (3) (17) (32) 1 (7) (5) (24) (30) Dec-15 (32) (5) 16 7.1 10.4 11.0 9.5 86 77 2.7 9.5 1.0 n.a. n.a. n.a.
Metals & Mining Jeremy Chen - 886 2 2715 6368
China Steel 2002 TT N NT$ 21.55 23.40 9 10,560 18.3 5 4 (5) 20 (10) 2 0 (7) 14 (8) Dec-15 73 17 (4) 45.5 26.3 22.5 23.3 150 123 1.6 4.4 1.1 2.3 11.2 73

Ju
mp
-Sta
rt 8
3
14 J
uly
201
6
Taiwan—valuation summary (continued) Wednesday, 13 July 2016
CS/ Cons. EV/ EV/ Net
Bberg Price Market 6M Last EPS D Yld ROE P/B Sales EBITDA Debt/Eq ticker View Ccy Local Target Upside cap ADTO Absolute performance (%) Relative performance (%) FYE EPS growth (%) PE (x) (%) (%) (%) (x) (x) (x) (%)
(%) (US$ m) 1w 1m 3m Ytd 12m 1w 1m 3m Ytd 12m T T+1 T+2 T+3 T T+1 T+2 T+3 T+1 T+2 T+1
Real Estate Chung Hsu/ Jeremy Chen - 886 2 2715 6362/ 886 2 2715 6368
Huaku 2548 TT U NT$ 55.00 48.00 (13) 473 2.6 (1) (3) (6) (7) (16) (4) (7) (8) (13) (13) Dec-15 (9) (9) (29) 5.7 6.3 7.0 9.9 89 97 9.0 16.6 1.0 2.6 10.4 80
Ruentex Development 9945 TT N NT$ 37.45 36.00 (4) 1,621 6.8 2 1 (3) (13) (12) (1) (2) (5) (19) (10) Dec-15 (33) (1) 14 6.5 9.7 9.8 8.6 100 100 0.0 17.2 1.5 18.6 110.8 56
Sector Aggregate (6) 2,094 2 0 (4) (11) (13) (2) (3) (6) (17) (11) Dec-15 (27) (4) 1 6.3 8.7 9.0 8.9 96 99 2.0 17.0 1.4 6.9 29.9 63
Retailing Jeremy Chen - 886 2 2715 6368
President Chain Store 2912 TT O NT$ 257.00 256.00 (0) 8,300 9.4 2 7 12 25 20 (1) 4 10 19 22 Dec-15 16 10 4 32.4 28.0 25.5 24.6 103 104 2.8 35.0 9.5 1.1 13.7 (72)
Software & Services Jeremy Chen - 886 2 2715 6368
PChome online 8044 TT O NT$ 342.00 420.00 23 1,061 5.6 3 (5) (5) 4 (25) (1) (9) (7) (2) (23) Dec-15 21 25 26 43.9 36.4 29.1 23.2 100 99 1.3 18.4 6.5 0.9 17.4 (137)
Technology Hardware Derrick Yang/ Jerry Su/ Pauline Chen/ Randy Abrams/ Thompson Wu - 886 2 2715 6367/ 886 2 2715 6361/ 886 2 2715 6323/ 886 2 2715 6366/ 886 2 2715 6386
Acer 2353 TT U NT$ 15.50 10.00 (35) 1,484 7.7 3 6 27 28 11 0 2 24 22 13 Dec-15 (193) 139 (90) 77.0 n.m. n.m. n.m. n.m. 17 0.0 (0.9) 0.7 0.1 6.3 (47)
Advantech 2395 TT O NT$ 247.00 270.00 9 4,839 6.8 2 (1) 7 17 19 (1) (5) 5 11 21 Dec-15 15 16 17 30.6 26.6 22.9 19.6 101 103 2.8 23.9 6.1 3.6 20.5 (15)
Airtac 1590 TT O NT$ 241.00 275.00 14 1,340 5.7 (2) 5 13 59 54 (6) 1 10 52 56 Dec-15 45 17 11 31.5 21.8 18.6 16.8 99 99 2.3 18.6 3.8 4.9 14.3 58
Asustek 2357 TT N NT$ 280.00 260.00 (7) 6,461 11.8 5 0 (1) 3 (0) 2 (3) (3) (3) 2 Dec-15 (1) 8 n.a. 10.7 10.8 10.0 n.a. 103 106 6.0 11.2 1.2 0.4 7.9 (17)
AUO 2409 TT O NT$ 11.30 13.00 15 3,379 18.9 3 25 14 16 (11) (1) 21 12 10 (9) Dec-15 (109) 1,679 (73) 22.1 n.m. 15.0 55.2 509 119 0.0 (0.3) 0.6 0.5 4.1 29
AWSC 8086 TT N NT$ 54.90 62.00 13 239 11.6 (1) (20) (13) (38) (48) (5) (23) (15) (45) (46) Dec-15 (26) 26 15 7.0 9.4 7.5 6.5 95 79 8.7 25.0 2.3 1.7 4.8 (53)
Casetek 5264 TT N NT$ 116.00 153.00 32 1,224 7.2 4 1 (33) (14) (38) 0 (3) (35) (20) (36) Dec-15 (15) 8 2 7.0 8.3 7.6 7.5 97 91 7.8 15.0 1.2 0.8 2.8 (37)
Catcher 2474 TT O NT$ 229.50 290.00 26 5,450 57.9 4 (7) (15) (17) (38) 1 (11) (17) (23) (36) Dec-15 (16) 5 8 7.0 8.4 8.0 7.4 96 94 4.4 17.3 1.4 1.6 3.3 (33)
Chicony 2385 TT N NT$ 74.40 90.00 21 1,603 3.0 6 (3) (9) 3 (10) 3 (7) (11) (3) (8) Dec-15 17 11 14 13.6 11.6 10.5 9.2 106 101 6.9 19.7 2.3 0.6 6.9 5
Chipbond 6147 TT O NT$ 43.20 55.00 27 871 8.1 7 (1) (5) (9) (23) 3 (5) (8) (15) (21) Dec-15 (4) 33 13 13.6 14.1 10.6 9.4 101 103 4.7 8.4 1.2 1.8 5.8 9
Chroma 2360 TT O NT$ 79.50 88.00 11 945 1.4 4 (1) 15 24 20 0 (5) 12 18 22 Dec-15 35 12 n.a. 24.4 18.0 16.0 n.a. 108 105 3.9 16.7 2.7 2.4 12.1 (33)
Compal 2324 TT N NT$ 21.20 20.00 (6) 2,915 7.9 5 10 5 15 (5) 2 6 3 8 (3) Dec-15 5 13 6 10.6 10.1 8.9 8.4 103 109 5.9 8.6 0.9 0.1 5.0 (5)
Coretronic 5371 TT O NT$ 28.00 37.00 32 472 1.6 (2) (5) (9) 3 (10) (5) (9) (11) (4) (8) Dec-14 (33) 15 12 5.4 8.0 6.9 6.2 103 113 5.4 8.5 0.7 0.1 1.5 (38)
Delta 2308 TT O NT$ 162.50 172.00 6 13,113 23.6 3 8 14 5 7 (0) 5 11 (2) 9 Dec-15 (2) 15 11 22.6 23.1 20.1 18.1 91 93 3.0 14.4 3.3 1.8 11.6 (26)
E Ink 8069 TT N NT$ 17.85 14.70 (18) 632 4.2 2 6 9 14 34 (1) 2 6 8 36 Dec-15 236 (4) n.a. 37.7 11.3 11.7 n.a. 94 83 5.8 6.8 0.7 1.1 19.4 (22)
Egis Technology 6462 TT O NT$ 170.00 250.00 47 363 3.5 16 12 27 19 39 12 8 25 13 41 Dec-15 548 235 23 n.m. 26.4 7.9 6.4 75 104 1.9 28.2 6.5 5.3 22.3 (43)
Elan 2458 TT U NT$ 36.50 28.00 (23) 500 3.8 1 8 (1) (20) (13) (3) 4 (3) (27) (11) Dec-15 0 16 1 19.5 19.5 16.8 16.7 111 97 4.2 11.4 2.3 2.2 14.2 (27)
Epistar 2448 TT N NT$ 22.55 19.50 (14) 765 12.9 4 23 (2) (12) (37) 1 19 (5) (18) (35) Dec-15 32 95 400 n.m. n.m. n.m. 78.5 126 761 0.0 (3.9) 0.5 1.3 8.6 21
Everlight 2393 TT O NT$ 54.50 57.00 5 740 5.3 5 20 14 14 (4) 2 17 12 8 (2) Dec-15 7 13 8 12.9 12.1 10.7 9.9 102 111 6.5 11.0 1.3 0.9 6.5 27
FocalTech 3545 TT N NT$ 26.10 31.00 19 239 1.5 1 1 (7) (24) (33) (3) (3) (9) (30) (31) Dec-15 124 72 n.a. 32.4 14.4 8.4 n.a. 164 172 4.5 4.6 0.6 0.3 7.7 (29)
FTC 2354 TT O NT$ 76.50 78.00 2 3,293 11.8 5 4 5 10 (28) 2 (0) 3 4 (26) Dec-15 (21) 13 13 8.8 11.1 9.8 8.7 97 104 3.2 10.3 1.1 0.6 3.3 (63)
Himax HIMX US O US$ 9.00 13.00 44 1,547 5.9 13 (1) (14) 10 7 11 (4) (18) 4 5 Dec-15 170 35 26 61.5 22.8 16.8 13.3 102 111 3.5 14.5 3.2 1.8 16.0 (7)
Hiwin 2049 TT N NT$ 149.00 145.00 (3) 1,246 11.5 6 10 (2) 15 (27) 3 6 (4) 9 (25) Dec-15 0 29 24 24.4 24.4 18.9 15.2 110 112 1.4 11.6 2.7 3.5 15.4 84
Hon Hai 2317 TT O NT$ 83.50 96.00 15 40,565 74.5 2 6 1 3 (7) (1) 2 (1) (3) (5) Dec-15 (11) 11 n.a. 8.7 9.8 8.8 n.a. 100 104 4.9 12.8 1.2 0.2 3.8 (39)
HTC 2498 TT U NT$ 100.00 57.00 (43) 2,570 76.9 4 10 21 28 43 0 6 19 22 46 Dec-15 81 116 72 n.m. n.m. n.m. n.m. 295 n.m. 0.0 (4.6) 1.3 0.6 n.m. (46)
Innolux 3481 TT O NT$ 10.60 14.00 32 3,277 18.1 (1) 13 (5) 7 (23) (4) 9 (7) 0 (21) Dec-15 (157) 252 (73) 9.8 n.m. 11.2 41.3 167 n.m. 0.0 (2.7) 0.5 0.4 3.2 7
Inventec 2356 TT N NT$ 25.25 21.00 (17) 2,814 12.2 12 14 15 17 24 8 10 13 11 26 Dec-15 18 11 n.a. 16.3 13.8 12.5 n.a. 101 98 5.8 11.5 1.6 0.2 6.3 (17)
Kinsus 3189 TT O NT$ 72.00 76.00 6 998 5.2 5 2 7 8 (7) 2 (2) 4 1 (5) Dec-15 1 5 6 11.1 10.9 10.4 9.9 98 99 4.9 10.1 1.1 0.9 3.2 (35)
Largan 3008 TT O NT$ 3,175.00 3,400.00 7 13,231 80.7 11 9 34 40 (9) 8 5 31 34 (7) Dec-15 (16) 46 12 17.6 20.9 14.3 12.8 90 101 1.7 29.5 5.7 8.0 13.8 (66)
Lextar 3698 TT O NT$ 15.65 21.00 34 283 1.1 (0) (5) (2) (9) (20) (4) (8) (4) (15) (18) Dec-15 93 36 9 34.3 17.7 13.0 11.9 266 138 4.2 3.6 0.7 0.5 3.0 (14)
Lite-on Tech 2301 TT N NT$ 49.85 43.00 (14) 3,616 8.1 10 15 24 57 41 7 12 22 50 43 Dec-15 14 12 10 16.1 14.2 12.7 11.5 100 105 5.1 10.6 1.5 0.4 4.8 (33)
MediaTek 2454 TT N NT$ 247.00 225.00 (9) 12,059 58.0 4 12 7 (1) (37) 1 9 5 (7) (34) Dec-15 (7) 3 n.a. 14.8 15.9 15.4 n.a. 104 100 4.5 9.8 1.5 0.9 7.9 (51)
Merry 2439 TT N NT$ 71.50 70.00 (2) 411 8.3 1 6 15 22 13 (3) 2 12 16 15 Dec-15 55 24 12 20.6 13.3 10.7 9.6 107 106 3.4 16.3 2.1 0.9 7.4 (20)
Novatek 3034 TT O NT$ 112.50 135.00 20 2,127 15.4 (5) 3 (3) (13) (12) (8) (1) (6) (19) (10) Dec-15 (13) 12 7 10.7 12.3 10.9 10.2 98 101 7.0 19.6 2.4 1.1 7.9 (56)
NYPCB 8046 TT N NT$ 28.70 39.00 36 576 0.3 3 1 (10) (14) (18) (0) (3) (13) (21) (15) Dec-14 (47) 2 24 11.5 21.5 21.0 16.9 100 209 3.5 2.3 0.5 0.2 3.6 (32)
Parade 4966 TT O NT$ 303.00 375.00 24 716 15.2 1 (3) (10) 37 (15) (2) (6) (12) 31 (13) Dec-15 23 13 8 20.1 16.4 14.4 13.4 96 91 1.7 20.3 3.1 2.1 11.3 (50)
Pegatron 4938 TT N NT$ 73.10 75.00 3 5,850 20.9 8 7 1 2 (21) 5 3 (1) (5) (19) Dec-15 (10) 14 n.a. 7.9 8.7 7.7 n.a. 103 106 6.3 14.4 1.2 0.1 2.8 (26)
PTI 6239 TT O NT$ 73.90 85.80 16 1,789 6.4 7 6 0 13 19 3 2 (2) 7 21 Dec-14 23 15 10 17.4 14.2 12.3 11.2 101 101 4.1 12.3 1.7 1.3 3.7 (9)
Quanta 2382 TT U NT$ 65.40 45.00 (31) 7,847 10.0 10 13 17 23 (4) 7 9 15 17 (2) Dec-15 (6) 4 n.a. 14.1 15.0 14.4 n.a. 94 90 5.3 12.6 1.9 0.3 11.8 30
Radiant 6176 TT U NT$ 53.20 40.00 (25) 769 12.3 7 11 (13) (29) (49) 3 7 (15) (36) (47) Dec-15 1 (7) (9) 8.0 7.9 8.5 9.4 97 94 8.6 12.5 1.0 0.1 0.6 (85)
Realtek 2379 TT N NT$ 107.50 107.50 0 1,686 10.8 10 13 22 37 39 7 9 20 30 41 Dec-14 (21) 35 11 17.6 22.4 16.5 14.9 105 104 5.6 10.9 2.4 1.1 11.1 (81)
Synnex 2347 TT N NT$ 36.95 34.00 (8) 1,822 3.8 9 11 12 15 (16) 5 7 9 9 (14) Dec-15 68 8 3 18.4 11.0 10.2 9.8 99 104 7.3 12.1 1.3 0.3 17.5 75
Teco 1504 TT N NT$ 27.70 26.00 (6) 1,723 2.3 6 8 6 5 14 2 4 4 (1) 16 Dec-15 9 8 6 17.5 16.0 14.9 14.0 96 95 3.6 7.1 1.1 1.0 8.2 (13)
TOPOINT 8021 TT O NT$ 21.85 28.00 28 108 0.4 3 8 (1) (5) (8) 0 4 (3) (11) (6) Dec-15 (22) 17 (0) 9.4 12.0 10.2 10.2 81 100 4.8 6.1 0.7 0.9 2.8 (13)

Ju
mp
-Sta
rt 8
4
14 J
uly
201
6
Taiwan—valuation summary (continued) Wednesday, 13 July 2016
CS/ Cons. EV/ EV/ Net
Bberg Price Market 6M Last EPS D Yld ROE P/B Sales EBITDA Debt/Eq ticker View Ccy Local Target Upside cap ADTO Absolute performance (%) Relative performance (%) FYE EPS growth (%) PE (x) (%) (%) (%) (x) (x) (x) (%)
(%) (US$ m) 1w 1m 3m Ytd 12m 1w 1m 3m Ytd 12m T T+1 T+2 T+3 T T+1 T+2 T+3 T+1 T+2 T+1
Technology Hardware Derrick Yang/ Jerry Su/ Pauline Chen/ Randy Abrams/ Thompson Wu - 886 2 2715 6367/ 886 2 2715 6361/ 886 2 2715 6323/ 886 2 2715 6366/ 886 2 2715 6386
TPK 3673 TT O NT$ 61.70 100.00 62 664 30.2 2 (2) (9) (25) (63) (1) (6) (11) (31) (61) Dec-15 111 62 n.a. n.m. 10.1 6.2 n.a. 141 122 4.9 6.6 0.7 0.4 4.3 71
Tripod 3044 TT O NT$ 63.10 67.00 6 1,030 2.1 2 2 5 13 14 (2) (2) 3 6 16 Dec-15 4 4 5 11.7 11.3 10.8 10.3 100 101 5.3 9.7 1.1 0.5 3.4 (38)
TSMC 2330 TT O NT$ 168.50 185.00 10 135,735 174.5 4 4 4 18 22 1 0 2 12 24 Dec-15 10 9 n.a. 15.2 13.9 12.8 n.a. 101 99 3.6 24.3 3.2 4.4 6.7 (28)
TSMT 6278 TT N NT$ 26.20 31.00 18 240 0.3 2 (5) (7) (10) (20) (1) (9) (9) (16) (18) Dec-15 4 15 n.a. 8.6 8.2 7.2 n.a. 112 100 6.1 8.0 0.6 0.2 2.7 (18)
TXC 3042 TT N NT$ 46.80 43.00 (8) 450 2.8 5 3 11 31 27 1 (1) 9 24 29 Dec-15 9 9 9 15.4 14.1 12.9 11.9 93 99 5.7 10.7 1.5 1.4 6.1 (5)
UMC 2303 TT N NT$ 12.50 13.50 8 4,902 14.2 1 2 (3) 3 3 (2) (1) (5) (3) 5 Dec-14 11 (30) 12 12.9 11.6 16.5 14.7 105 100 4.4 5.9 0.7 0.9 2.2 (15)
Unimicron 3037 TT N NT$ 13.55 17.00 25 630 3.4 (3) 0 (15) (3) (17) (6) (4) (17) (9) (15) Dec-15 98 74 83 72.3 36.5 21.0 11.5 79 94 4.4 1.3 0.5 0.5 3.2 25
Vanguard 5347 TT N NT$ 55.10 53.00 (4) 2,803 7.8 6 3 8 29 32 3 (1) 6 23 34 Dec-14 (24) 38 9 16.7 22.0 16.0 14.7 100 101 9.4 15.1 3.3 3.9 13.0 0
VPEC 2455 TT N NT$ 40.60 50.00 23 311 8.2 (11) (20) (21) (14) (18) (14) (24) (23) (20) (16) Dec-15 9 19 15 16.9 15.6 13.1 11.4 89 97 11.5 19.3 3.3 3.4 8.9 (40)
Win Semi 3105 TT O NT$ 64.50 77.00 19 1,176 13.6 4 (4) 2 30 68 1 (7) 0 24 70 Dec-15 16 14 13 14.4 12.3 10.8 9.6 96 101 5.4 17.5 2.1 2.7 6.0 (2)
Wistron 3231 TT N NT$ 24.45 16.00 (35) 2,007 9.2 8 17 29 31 11 4 13 26 25 13 Dec-15 128 24 n.a. 43.4 19.1 15.4 n.a. 81 86 4.2 4.4 0.8 0.2 7.9 65
WPG 3702 TT N NT$ 39.30 40.20 2 2,021 4.1 4 8 15 25 4 1 4 12 19 6 Dec-14 (7) 18 9 11.2 12.0 10.2 9.4 108 105 6.4 11.7 1.4 0.3 14.9 136
Sector Aggregate 7 310,470 5 6 6 14 7 1 2 4 8 9 Dec-15 3 15 3 14.4 14.0 12.1 13.3 102 103 3.9 13.3 1.8 0.7 6.1 (21)
Telecommunication Services Varun Ahuja - 65 6212 3017
CHT 2412 TT N NT$ 121.50 115.00 (5) 29,280 31.1 3 8 11 23 24 0 5 9 16 26 Dec-15 3 2 2 22.1 21.5 21.1 20.8 100 99 4.6 11.9 2.6 3.9 10.6 (9)
FET 4904 TT O NT$ 76.40 83.00 9 7,734 10.8 (4) 2 7 13 4 (7) (2) 5 7 6 Dec-15 3 6 6 21.7 20.9 19.8 18.7 100 101 5.1 16.6 3.5 2.8 10.1 41
TWM 3045 TT O NT$ 114.00 125.00 10 12,115 12.2 3 0 9 14 11 (0) (3) 6 8 13 Dec-15 1 3 5 19.8 19.5 18.9 18.0 104 99 5.2 26.8 6.6 3.6 12.5 59
Sector Aggregate 1 49,129 2 5 10 19 17 (1) 2 8 13 19 Dec-15 2 3 3 21.4 20.9 20.3 19.7 101 100 4.8 14.3 3.2 3.6 11.0 7
Country Aggregate 8,858 9,396 6 579,940 3 4 2 6 (2) Dec-15 (1) 11 5 14.3 14.5 13.1 13.5 100 101 3.9 12.1 1.7 0.9 7.5 (8)
Note: Prices are as of 13 Jul 2016
* Country/ sector aggregates are for the coverage above
Source: Company data, Thomson Financial IBES, Credit Suisse estimates

Ju
mp
-Sta
rt 8
5
14 J
uly
201
6
Thailand—valuation summary Wednesday, 13 July 2016
CS/ Cons. EV/ EV/ Net
Bberg Price Market 6M Last EPS D Yld ROE P/B Sales EBITDA Debt/Eq ticker View Ccy Local Target Upside cap ADTO Absolute performance (%) Relative performance (%) FYE EPS growth (%) PE (x) (%) (%) (%) (x) (x) (x) (%)
(%) (US$ m) 1w 1m 3m Ytd 12m 1w 1m 3m Ytd 12m T T+1 T+2 T+3 T T+1 T+2 T+3 T+1 T+2 T+1
Automobiles & Components Putt Virasathienpornkul - 66 2 614 6212
PCSGH PCSGH TB U Bt 5.65 4.50 (20) 248 0.1 (6) 8 1 4 (23) (8) 3 (6) (11) (22) Dec-15 4 6 6 16.1 15.5 14.6 13.8 95 97 5.7 11.4 1.8 1.9 6.6 (20)
Somboon Advance Technology
SAT TB O Bt 14.40 17.50 22 174 0.2 (1) 8 3 (11) (23) (3) 4 (4) (26) (23) Dec-15 (6) 9 10 9.5 10.2 9.4 8.5 98 99 4.2 10.5 1.0 0.9 5.2 31
Thai Stanley Electric STANLY TB O Bt 172.00 207.00 20 375 0.0 (3) (1) 4 1 (18) (5) (5) (3) (14) (18) Mar-16 (6) 15 14 10.1 10.7 9.3 8.2 104 108 3.5 9.5 1.0 0.8 3.6 (33)
Sector Aggregate 8 797 (4) 4 3 (1) (21) (6) (1) (4) (16) (20) Dec-15 (2) 9 11 11.4 11.6 10.7 9.6 100 102 4.2 10.3 1.2 1.0 4.9 (15)
Banks Dan Fineman/ Thaniya Kevalee - 66 2 614 6218/ 66 2 614 6219
BAY BAY TB U Bt 40.75 32.00 (21) 8,518 1.1 7 12 23 37 23 4 8 16 22 24 Dec-15 18 11 9 16.1 13.7 12.3 11.3 108 109 2.5 11.1 1.5 n.a. n.a. n.a.
BBL BBL/F TB O Bt 169.00 207.00 22 9,167 7.2 2 3 2 9 (4) 0 (1) (5) (6) (3) Dec-15 4 6 4 9.4 9.1 8.6 8.2 104 101 5.5 9.4 0.8 n.a. n.a. n.a.
KBANK KBANK/F TB O Bt 182.50 217.00 19 12,412 10.5 2 9 14 22 (4) (0) 5 7 7 (4) Dec-15 (0) 24 21 11.1 11.1 9.0 7.4 102 107 2.3 13.0 1.4 n.a. n.a. n.a.
KTB KTB TB N Bt 16.70 18.50 11 6,633 23.1 0 (1) (5) 0 (5) (2) (5) (12) (15) (5) Dec-15 15 8 23 8.2 7.1 6.6 5.4 110 105 5.6 12.6 0.8 n.a. n.a. n.a.
SCB SCB TB O Bt 148.50 166.00 12 14,327 36.1 5 11 10 24 (2) 3 7 3 9 (2) Dec-15 (0) 19 8 10.7 10.7 9.0 8.3 103 108 4.7 14.8 1.5 n.a. n.a. n.a.
TCAP TCAP TB N Bt 39.00 40.00 3 1,337 4.5 6 15 10 7 17 4 10 3 (8) 18 Dec-15 16 16 11 9.2 7.9 6.8 6.2 102 108 5.1 10.7 0.8 n.a. n.a. n.a.
TISCO TISCO TB N Bt 51.00 53.00 4 1,160 2.1 4 13 10 20 11 1 9 3 5 11 Dec-15 20 13 13 9.6 8.0 7.1 6.3 104 111 4.7 17.1 1.3 n.a. n.a. n.a.
TMB TMB TB N Bt 2.30 2.40 4 2,863 10.9 4 4 (5) (5) 0 2 (1) (12) (20) 0 Dec-15 3 18 17 10.8 10.5 8.9 7.6 103 103 3.3 12.0 1.2 n.a. n.a. n.a.
Sector Aggregate 9 56,417 3 8 9 18 2 1 4 2 3 2 Dec-15 6 15 13 10.6 10.1 8.8 7.8 105 106 4.0 12.2 1.2 n.a. n.a. n.a.
Building Materials & Construction Paworamon (Poom) Suvarnatemee - 66 2 614 6210
SCC SCC TB O Bt 482.00 520.00 8 16,436 27.7 1 1 7 5 (5) (1) (3) 0 (10) (5) Dec-15 2 6 (1) 12.7 12.5 11.8 11.9 99 101 3.6 21.1 2.5 1.7 9.0 51
SCCC SCCC TB O Bt 296.00 335.00 13 1,935 1.3 1 (0) (7) (7) (21) (1) (5) (14) (22) (21) Dec-15 9 10 9 14.9 13.7 12.4 11.4 110 113 5.5 21.9 2.9 2.2 9.0 21
Sector Aggregate 8 18,371 1 1 6 4 (7) (1) (3) (1) (12) (7) Dec-15 3 7 0 12.9 12.6 11.8 11.8 100 103 3.8 21.2 2.5 1.7 9.0 49
Capital Goods Atul Sethi - 66 2 614 6211
CK CK TB O Bt 31.00 36.00 16 1,492 11.7 9 16 23 7 15 7 12 16 (8) 15 Dec-15 (31) 19 14 24.0 34.7 29.1 25.6 87 115 0.8 7.2 2.4 2.5 33.4 229
ITD ITD TB U Bt 6.55 5.60 (15) 983 11.7 (1) 0 (11) (13) (20) (3) (4) (18) (28) (19) Dec-15 579 122 15 n.m. n.m. 78.0 67.8 76 76 0.0 1.5 2.6 1.1 11.8 204
STECON STEC TB O Bt 23.60 30.00 27 1,023 5.4 1 7 5 (6) (1) (1) 3 (2) (21) (1) Dec-15 (5) 20 23 23.6 24.8 20.8 16.9 119 121 1.9 14.8 3.5 1.5 15.9 (17)
Sector Aggregate 11 4,066 4 9 7 (4) 0 2 5 0 (19) 1 Dec-15 (8) 26 15 32.6 35.4 28.1 24.5 98 110 1.1 8.0 2.7 1.7 17.4 159
Chemicals Paworamon (Poom) Suvarnatemee - 66 2 614 6210
Indorama Ventures IVL TB N Bt 31.00 31.00 0 4,241 26.0 2 (3) 34 46 15 (0) (7) 27 30 15 Dec-15 76 (9) 10 22.6 12.8 14.1 12.8 137 124 3.9 16.8 2.0 0.9 9.0 123
IRPC IRPC TB N Bt 4.84 4.70 (3) 2,811 19.1 (0) (1) (5) 13 12 (2) (5) (12) (3) 12 Dec-15 (3) 7 12 10.5 10.9 10.2 9.1 85 90 4.4 11.6 1.2 0.8 8.2 78
PTTGC PTTGC TB N Bt 58.75 64.00 9 7,528 22.5 1 (2) (0) 18 (13) (1) (6) (7) 2 (13) Dec-15 8 20 33 12.9 11.9 10.0 7.5 89 93 4.6 9.3 1.1 0.9 6.5 17
Sector Aggregate 4 14,579 1 (2) 9 25 (0) (1) (6) 2 10 0 Dec-15 17 9 24 14.1 12.0 10.9 8.9 97 98 4.4 11.1 1.3 0.9 7.6 52
Consumer Staples Nicholas Teh/ Putt Virasathienpornkul/ Warayut Luangmettakul - 65 6212 3026/ 66 2 614 6212/ 662 614 6214
Big C Supercenter BIGC TB N Bt 209.00 229.00 10 4,900 2.0 (2) 0 (16) 3 9 (4) (4) (23) (12) 10 Dec-15 17 13 9 25.0 21.4 19.0 17.4 104 104 1.4 16.1 3.3 1.4 12.6 13
C.P. ALL CPALL TB O Bt 52.00 62.00 19 13,274 33.2 1 9 18 32 12 (1) 5 11 17 13 Dec-15 22 23 19 34.1 27.9 22.6 19.0 104 108 1.8 39.1 9.9 1.4 17.0 322
CBG CBG TB U Bt 53.25 28.50 (46) 1,513 2.5 5 12 36 54 25 3 8 29 39 26 Dec-15 7 8 11 42.4 39.8 36.9 33.1 90 81 1.2 21.3 8.4 5.7 28.2 (27)
CPF CPF TB O Bt 27.50 32.00 16 6,051 21.4 (1) (4) 8 50 23 (3) (9) 1 35 23 Dec-15 119 36 25 48.3 22.0 16.2 13.0 81 99 2.6 7.7 1.7 1.0 12.5 122
Home Pro HMPRO TB U Bt 9.60 7.50 (22) 3,588 4.8 2 8 19 41 47 0 4 12 26 47 Dec-15 15 13 13 36.1 31.3 27.6 24.5 101 102 2.9 23.2 7.1 2.4 16.2 80
ICHI ICHI TB O Bt 12.70 16.50 30 469 1.1 9 2 2 3 (34) 6 (3) (5) (12) (34) Dec-15 20 12 15 20.3 16.9 15.1 13.2 110 112 3.9 16.2 2.8 2.7 10.9 32
Siam Global GLOBAL TB U Bt 13.30 10.20 (23) 1,383 1.6 (1) 6 28 48 60 (4) 1 21 33 60 Dec-15 45 21 18 55.3 38.0 31.5 26.8 103 106 0.5 11.3 4.1 2.8 20.5 27
Siam Makro MAKRO TB N Bt 33.25 36.00 8 4,535 0.1 1 1 (1) (6) (14) (1) (4) (8) (21) (14) Dec-15 3 15 12 29.7 28.9 25.1 22.4 98 97 2.8 37.2 10.3 1.0 17.7 40
Thai Union TU TB O Bt 22.00 23.50 7 2,983 6.0 1 (0) 1 28 9 (1) (5) (6) 13 9 Dec-15 17 7 4 18.4 15.7 14.7 14.1 108 102 3.3 14.2 2.1 1.0 11.0 71
ThaiBev THBEV SP O S$ 0.96 0.90 (6) 17,883 9.9 2 7 34 39 27 1 2 34 38 39 Sep-15 18 6 5 27.8 23.7 22.3 21.2 98 99 2.7 22.0 5.0 3.4 21.1 28
Sector Aggregate 3 56,579 1 5 17 32 19 (1) 1 10 17 19 Dec-15 23 15 16 30.1 24.5 21.3 18.1 98 101 2.3 18.4 4.3 1.5 16.0 92
Energy Paworamon (Poom) Suvarnatemee - 66 2 614 6210
PTT PTT TB N Bt 313.00 280.00 (11) 25,406 57.1 1 (1) 9 28 (7) (1) (5) 2 13 (7) Dec-15 349 24 21 57.1 12.7 10.2 8.4 88 99 3.1 9.8 1.2 0.7 4.0 18
PTTEP PTTEP TB U Bt 82.50 73.00 (12) 9,307 48.1 (1) 2 18 44 (18) (3) (2) 11 29 (17) Dec-15 126 171 36 n.m. 38.8 14.3 10.5 71 114 2.5 2.5 0.8 2.4 3.4 5
TOP TOP TB N Bt 60.25 63.00 5 3,493 12.8 1 (5) (14) (9) 11 (1) (9) (21) (24) 11 Dec-15 14 (7) 1 10.1 8.9 9.5 9.4 91 86 5.1 14.4 1.2 0.4 5.6 18
Sector Aggregate (9) 38,206 0 (1) 9 29 (8) (2) (5) 2 14 (8) Dec-15 2,000 33 22 n.m. 14.5 10.9 9.0 86 100 3.2 7.7 1.1 0.8 3.9 15
Healthcare Thaniya Kevalee - 66 2 614 6219
Bangkok Chain Hospital BCH TB O Bt 12.60 13.50 7 893 3.2 2 0 17 39 70 0 (4) 10 24 71 Dec-15 37 30 19 59.9 43.9 33.6 28.4 102 111 1.5 15.7 6.6 5.2 19.8 70
Bangkok Dusit BDMS TB N Bt 23.50 25.00 6 10,345 17.5 (2) (1) (3) 5 12 (4) (5) (10) (10) 12 Dec-15 14 24 26 47.2 41.4 33.4 26.6 99 105 1.2 15.7 6.2 5.5 24.8 34
Bumrungrad Hosp BH TB N Bt 183.00 190.00 4 3,789 9.9 0 (1) (9) (13) (11) (2) (5) (16) (28) (11) Dec-15 7 17 16 39.2 36.5 31.2 27.0 100 104 1.5 26.3 8.9 7.2 24.0 (13)
Chularat Hospital CHG TB N Bt 3.16 3.00 (5) 988 3.2 0 5 4 19 70 (2) 1 (3) 4 70 Dec-15 38 27 29 64.6 46.7 36.8 28.5 111 113 1.5 24.3 11.0 9.2 31.4 (5)
Sector Aggregate 5 16,015 (1) (0) (3) 4 13 (3) (5) (10) (11) 14 Dec-15 14 22 23 46.3 40.5 33.1 26.9 100 105 1.3 18.0 6.9 5.9 24.5 26

Ju
mp
-Sta
rt 8
6
14 J
uly
201
6
Thailand—valuation summary (continued) Wednesday, 13 July 2016
CS/ Cons. EV/ EV/ Net
Bberg Price Market 6M Last EPS D Yld ROE P/B Sales EBITDA Debt/Eq ticker View Ccy Local Target Upside cap ADTO Absolute performance (%) Relative performance (%) FYE EPS growth (%) PE (x) (%) (%) (%) (x) (x) (x) (%)
(%) (US$ m) 1w 1m 3m Ytd 12m 1w 1m 3m Ytd 12m T T+1 T+2 T+3 T T+1 T+2 T+3 T+1 T+2 T+1
Hotels, Restaurants & Leisure Thaniya Kevalee - 66 2 614 6219
Centel CENTEL TB N Bt 38.50 40.00 4 1,477 2.7 2 (1) (8) (13) 1 (0) (6) (15) (28) 2 Dec-15 9 16 11 30.5 28.0 24.2 21.8 97 99 1.4 18.9 5.0 2.9 13.2 63
Erawan ERW TB O Bt 4.38 5.50 26 311 0.7 (1) (4) (4) 2 4 (3) (9) (11) (13) 5 Dec-15 84 44 18 54.3 29.6 20.5 17.4 106 115 1.3 7.5 2.2 3.2 11.3 153
MINT MINT TB N Bt 41.50 38.00 (8) 5,198 9.1 5 7 8 14 39 3 3 1 (1) 40 Dec-15 20 15 14 39.0 32.4 28.2 24.8 94 93 1.4 16.4 5.0 4.4 22.3 109
Sector Aggregate (4) 6,986 4 5 4 8 30 2 1 (3) (7) 30 Dec-15 19 16 13 37.3 31.2 26.8 23.6 95 96 1.4 16.0 4.7 3.9 18.7 104
Media Thaniya Kevalee/ Warayut Luangmettakul - 66 2 614 6219/ 662 614 6214
BEC World BEC TB U Bt 24.60 27.00 10 1,398 1.3 7 1 (8) (19) (33) 5 (3) (15) (34) (33) Dec-15 2 5 7 16.5 16.1 15.4 14.5 124 120 5.7 38.3 6.1 3.1 6.9 10
Major Cineplex MAJOR TB N Bt 32.75 30.00 (8) 832 2.2 (2) 3 2 (7) 3 (4) (1) (5) (22) 4 Dec-15 15 8 12 29.7 25.9 24.1 21.6 94 87 3.5 17.2 4.4 3.8 14.1 65
MCOT MCOT TB U Bt 9.50 8.60 (9) 185 0.1 4 7 7 15 (25) 2 2 (0) 0 (25) Dec-14 (84) 61 26 13.0 81.8 50.8 40.5 145 n.m. 2.1 1.1 0.9 1.9 7.5 3
VGI Global VGI TB N Bt 6.80 4.30 (37) 1,326 2.1 7 31 47 84 38 5 27 40 69 38 Mar-15 (17) 14 12 46.2 55.6 48.8 43.7 91 95 1.8 43.9 23.3 22.7 38.7 6
Sector Aggregate (12) 3,742 5 12 15 22 0 3 8 8 7 1 Dec-15 6 7 7 26.7 25.1 23.5 14.5 116 110 3.6 21.9 5.4 4.5 11.5 23
Real Estate Atul Sethi - 66 2 614 6211
AP (Thailand) AP TB O Bt 7.65 7.80 2 684 2.0 6 16 26 43 13 4 12 19 28 13 Dec-15 18 34 11 9.6 8.2 6.1 5.5 105 112 3.7 15.7 1.2 1.6 9.9 73
CPN CPN TB O Bt 58.75 63.00 7 7,493 8.7 0 6 11 25 21 (2) 2 4 10 22 Dec-15 19 13 12 33.5 28.1 24.9 22.2 101 98 1.4 19.1 5.1 10.1 18.8 43
L.P.N. LPN TB O Bt 13.40 19.00 42 562 2.9 2 0 (4) (16) (27) (1) (4) (11) (31) (27) Dec-15 26 2 5 8.2 6.5 6.4 6.1 118 122 8.4 24.4 1.5 1.4 6.5 41
Land and Houses LH TB O Bt 9.80 10.60 8 3,280 4.1 9 9 7 4 17 7 5 0 (11) 17 Dec-15 10 15 2 16.7 15.2 13.3 13.1 104 106 5.1 16.6 2.5 4.7 18.3 78
Pruksa PS TB N Bt 26.25 26.50 1 1,665 3.5 2 3 (1) (1) 5 (0) (1) (8) (16) 6 Dec-15 (7) 6 5 7.6 8.2 7.7 7.3 99 100 5.5 19.9 1.5 1.6 8.2 54
Quality Houses QH TB O Bt 2.70 3.10 15 822 3.1 2 5 14 17 11 (1) 0 7 2 11 Dec-15 7 7 5 9.4 8.7 8.1 7.8 103 99 5.6 14.6 1.2 2.4 15.2 104
Supalai SPALI TB O Bt 25.50 25.50 0 1,244 3.3 8 16 34 40 40 6 12 27 25 41 Dec-15 12 13 11 10.1 9.0 8.0 7.2 103 105 3.9 22.5 1.9 2.7 9.2 75
Sector Aggregate 8 15,750 3 7 11 18 17 1 3 4 3 18 Dec-15 10 12 7 15.9 14.5 12.9 12.0 103 103 3.4 18.5 2.6 3.5 13.6 65
Retailing Warayut Luangmettakul - 662 614 6214
Robinson Department Store ROBINS TB O Bt 63.00 68.00 8 1,988 4.7 (3) 3 22 45 38 (6) (1) 15 30 38 Dec-15 19 21 18 32.5 27.4 22.7 19.2 101 104 1.8 18.1 4.7 2.6 14.0 0
Software & Services Warayut Luangmettakul - 662 614 6214
Workpoint Ent. WORK TB O Bt 38.25 56.00 46 454 0.7 (1) (1) (10) (13) (1) (3) (6) (17) (28) (1) Dec-15 137 54 34 86.9 36.6 23.8 17.7 123 127 1.9 15.1 5.4 5.0 13.5 (14)
Telecommunication Services Colin McCallum - 852 2101 6514
AIS ADVANC TB O Bt 169.00 202.00 20 14,278 60.6 7 5 11 11 (30) 5 0 4 (4) (29) Dec-15 (37) 11 (1) 12.8 20.5 18.5 18.6 80 85 4.9 50.8 10.4 3.9 9.5 132
DIF DIF TB O Bt 14.70 16.80 14 2,426 3.6 (1) 1 (1) 19 18 (3) (4) (8) 3 18 Dec-15 279 (70) 2 16.9 4.5 14.7 14.5 334 99 6.6 24.4 1.0 14.5 14.9 14
DTAC DTAC TB O Bt 31.75 66.00 108 2,136 22.6 (2) (14) (7) 5 (61) (4) (18) (14) (10) (61) Dec-15 (36) 7 157 12.8 19.9 18.7 7.3 96 95 2.5 13.4 2.6 1.3 4.0 109
Intouch INTUCH TB O Bt 58.00 73.00 26 5,285 22.3 7 6 11 12 (27) 5 2 4 (4) (26) Dec-15 (13) (18) 5 12.5 14.3 17.5 16.6 95 77 7.0 94.4 13.9 13.7 14.2 (7)
Jasmine JAS TB O Bt 5.25 5.50 5 1,065 40.9 (5) 6 31 62 (3) (7) 2 24 47 (2) Dec-15 (92) 42 16 2.3 28.1 19.7 17.0 50 63 2.1 8.2 1.7 1.1 7.1 (59)
True Corp TRUE TB U Bt 8.60 2.00 (77) 8,155 29.5 13 20 15 29 (26) 11 16 8 14 (26) Dec-15 (155) 41 (20) 48.0 n.m. n.m. n.m. 114 34 0.0 (3.3) 2.6 2.6 14.2 22
Sector Aggregate 2 33,345 7 7 11 17 (26) 5 3 4 2 (26) Dec-15 (33) (19) 14 13.5 20.1 24.6 21.6 111 81 3.9 20.0 3.8 3.4 9.9 34
Transportation Muzhafar Mukhtar/ Thaniya Kevalee/ Warayut Luangmettakul - 60 3 2723 2084/ 66 2 614 6219/ 662 614 6214
AOT AOT TB O Bt 384.00 500.00 30 15,589 36.7 (1) (1) (2) 11 23 (3) (5) (9) (4) 24 Sep-15 27 20 14 34.8 27.3 22.8 20.0 105 108 1.5 17.5 4.5 10.6 17.2 (7)
Asia Aviation AAV TB N Bt 6.05 6.60 9 834 8.3 (2) 1 1 15 27 (4) (3) (6) 0 28 Dec-15 112 17 10 24.8 11.7 10.0 9.1 112 126 2.1 11.9 1.3 2.0 11.9 16
BEM BEM TB O Bt 6.85 6.20 (9) 2,975 15.8 1 9 23 n.a. n.a. (1) 4 16 n.a. n.a. Dec-15 (0) 31 (1) 39.5 39.7 30.4 30.7 95 92 1.3 8.9 3.5 11.2 19.2 143
BTS Group Holdings BTS TB O Bt 9.80 11.20 14 3,324 6.4 2 8 7 8 (2) 0 4 0 (7) (2) Mar-15 (34) 5 23 44.1 67.3 64.2 52.3 124 85 6.8 3.5 2.4 22.5 58.5 5
BTS Infra. Fund BTSGIF TB N Bt 12.60 11.44 (9) 2,072 2.1 (2) 5 8 24 23 (4) 1 1 9 23 Mar-15 12 12 13 20.7 18.6 16.6 14.6 98 98 5.9 6.1 1.2 16.5 17.1 (0)
Sector Aggregate 19 24,794 (0) 2 3 12 20 (2) (2) (4) (3) 20 Dec-15 22 18 4 33.0 27.0 22.8 20.2 103 105 2.1 11.6 3.1 8.6 18.1 16
Utilities Wattana Punyawattanakul - 66 2 614 6215
EA EA TB U Bt 21.50 19.00 (12) 2,279 1.8 1 1 (3) (4) (2) (1) (3) (10) (20) (1) Dec-15 63 11 73 29.8 18.3 16.4 9.5 93 83 0.3 41.1 6.3 8.1 13.9 149
EGCO EGCO TB N Bt 188.00 185.00 (2) 2,813 4.1 0 5 3 24 20 (2) 1 (4) 9 20 Dec-15 86 7 5 22.9 12.4 11.6 11.0 96 89 3.5 10.1 1.2 10.4 19.1 103
GLOW GLOW TB O Bt 85.00 109.00 28 3,533 2.7 1 3 (4) 15 1 (1) (2) (11) (0) 1 Dec-15 12 (2) (2) 14.9 13.3 13.6 13.8 106 107 6.8 19.3 2.6 2.4 9.1 74
GPSC GPSC TB O Bt 37.50 37.00 (1) 1,597 5.2 11 14 47 69 47 9 9 40 54 47 Dec-15 14 21 35 26.8 23.5 19.4 14.4 98 98 2.8 6.4 1.5 2.8 16.0 17
RATCH RATCH TB N Bt 51.75 50.00 (3) 2,132 1.0 1 0 3 9 (8) (1) (4) (4) (6) (8) Dec-15 101 5 (4) 23.5 11.7 11.2 11.6 93 94 4.4 10.1 1.2 1.4 9.7 13
SPCG SPCG TB O Bt 21.60 24.00 11 567 1.0 5 5 4 1 (17) 3 1 (3) (14) (17) Dec-15 9 16 9 9.1 8.4 7.2 6.6 98 104 6.1 31.2 2.4 5.6 7.9 111
Sector Aggregate 5 12,921 2 4 5 19 8 0 (0) (2) 3 8 Dec-15 44 6 14 19.9 13.8 13.0 11.4 98 95 4.0 13.3 1.8 3.4 12.2 65
Country Aggregate 1,482 1,560 5 305,011 2 4 7 15 (0) Dec-15 23 13 15 19.9 16.2 14.3 11.8 100 101 3.1 12.9 2.0 1.7 9.5 41
Note: Prices are as of 13 Jul 2016
* Country/ sector aggregates are for the coverage above
Source: Company data, Thomson Financial IBES, Credit Suisse estimates

Ju
mp
-Sta
rt 8
7
14 J
uly
201
6
Vietnam—valuation summary Wednesday, 13 July 2016
CS/ Cons. EV/ EV/ Net
Bberg Price Market 6M Last EPS D Yld ROE P/B Sales EBITDA Debt/Eq ticker View Ccy Local Target Upside cap ADTO Absolute performance (%) Relative performance (%) FYE EPS growth (%) PE (x) (%) (%) (%) (x) (x) (x) (%)
(%) (US$ m) 1w 1m 3m Ytd 12m 1w 1m 3m Ytd 12m T T+1 T+2 T+3 T T+1 T+2 T+3 T+1 T+2 T+1
Banks Chate Benchavitvilai - 65 6212 3241
ACB ACB VN N D 18,500 22,500 22 744 0.1 0 (2) 4 (7) (20) (4) (10) (12) (23) (26) Dec-15 12 14 27 16.3 14.5 12.7 10.0 95 100 0.0 8.5 1.2 n.a. n.a. n.a.
BIDV BID VN U D 17,800 16,000 (10) 2,729 1.2 (1) (3) 12 (14) (29) (5) (11) (4) (30) (35) Dec-15 (19) 11 9 11.2 13.9 12.6 11.5 90 94 0.0 10.1 1.3 n.a. n.a. n.a.
Vietinbank CTG VN U D 17,700 15,600 (12) 2,955 0.7 3 1 10 (5) (22) (1) (8) (6) (21) (28) Dec-15 6 7 14 14.7 13.8 12.9 11.3 95 93 0.0 8.2 1.1 n.a. n.a. n.a.
Sector Aggregate (5) 7,525 1 (1) 9 (7) (22) (3) (9) (7) (24) (28) Dec-15 (7) 10 14 12.1 13.1 11.9 10.5 94 96 0.0 9.2 1.2 n.a. n.a. n.a.
Conglomerates Fahd Niaz - 65 6212 3035
Masan Group MSN VN O D 67,000 85,000 27 2,272 0.9 0 (3) (4) (14) (27) (4) (11) (20) (30) (33) Dec-15 33 23 21 26.2 19.8 16.1 13.3 117 103 0.0 14.2 2.6 1.9 10.6 89
Consumer Staples Farhan Rizvi - 65 6212 3036
VINAMILK VNM VN O D 147,000 158,000 7 7,911 3.9 3 7 4 15 49 (1) (1) (13) (2) 44 Dec-15 14 13 12 25.2 22.1 19.6 17.5 98 101 2.5 35.1 7.1 3.6 16.0 (46)
Energy Shew Heng Tan - 65 6212 3014
PetroVietnam Drilling PVD VN O D 29,500 50,000 69 460 2.2 (3) (8) 23 11 (39) (7) (16) 7 (5) (45) Dec-15 (83) 173 119 6.1 36.4 13.3 6.1 56 100 0.7 2.3 0.9 1.7 7.5 16
PTSC PVS VN O D 18,200 28,500 57 365 1.4 1 (5) 12 9 (34) (3) (13) (4) (8) (40) Dec-15 (20) 35 24 5.4 6.7 5.0 4.0 114 131 6.6 11.5 0.8 0.1 1.1 (51)
Sector Aggregate 64 825 (1) (6) 18 10 (37) (5) (15) 2 (6) (43) Dec-15 (53) 63 55 5.8 12.3 7.6 4.9 95 119 3.3 6.4 0.8 0.5 4.2 (16)
Real Estate Farhan Rizvi - 65 6212 3036
Vingroup VIC VN N D 52,000 43,694 (16) 5,021 2.0 2 10 10 26 31 (2) 2 (6) 10 25 Dec-15 165 121 3 90.8 34.3 15.5 15.1 122 109 0.0 11.7 3.7 2.5 13.1 81
Software & Services Chate Benchavitvilai - 65 6212 3241
FPT Corp. FPT VN O D 42,600 54,348 28 877 1.4 1 5 3 1 4 (3) (3) (13) (15) (1) Dec-15 9 16 11 11.2 10.3 8.9 8.0 92 87 4.1 23.1 2.0 0.6 4.8 29
Country Aggregate 675 697 3 24,430 4 8 16 17 6 Dec-15 4 27 14 18.8 18.1 14.3 12.5 99 101 1.1 12.6 2.2 2.0 11.5 37
Note: Prices are as of 13 Jul 2016
* Country/ sector aggregates are for the coverage above
Source: Company data, Thomson Financial IBES, Credit Suisse estimates

14 July 2016
Jump-Start 88
Appendix I: Research published in the past week Global Analysts’ name Date
Emerging Markets Quarterly – Q3 2016 Berna Bayazitoglu 7 Jul
Asia – Regional Analysts’ name Date
Jump-start Manish Nigam 7 Jul
APAC Equity Strategy – Korea: Fourth consecutive month of consensus EPS upgrades Sakthi Siva 8 Jul
APAC Equity Strategy – Is MSCI China's ROE bottoming? Sakthi Siva 11 Jul
APAC Equity Strategy – Which sectors are leading the EPS upgrades? Sakthi Siva 11 Jul
APAC Equity Strategy – Which markets are seeing greatest foreigninvestor capitulation? Sakthi Siva 11 Jul
Asia Oil Weekly – Inauguration Horace Tse 11 Jul
Asia Semiconductor Sector – China smartphone chain: Some lift from better volumes and new markets Randy Abrams 11 Jul
Asia Semiconductor Sector – 2Q16 preview: Chip builds strong, but raises risk of an adjustment Randy Abrams 13 Jul
APAC Equity Strategy – Cyclicals to defensives valuation gap still attractive? Sakthi Siva 13 Jul
Asia Semiconductor Sector – June Taiwan Tech sales: 2Q16 sales led by upstream, downstream to catch up in 2H Randy Abrams 14 Jul
Australia Analysts’ name Date
Blackmores – China retail: The remedy to reach A$175 Ben Levin 12 Jul
China Analysts’ name Date
China Internet Sector – Express Delivery: "Served in China" Evan Zhou 11 Jul
China Property Sector – A new chapter: Go for quality Alvin Wong 11 Jul
Sunny Optical Technology Group Co., Limited – Back to the long-term bull camp on Sunny Sam Li 11 Jul
Hong Kong Analysts’ name Date
Hong Kong Property Sector – Weekly update: Cherry-pick under intensifying competition Susanna Leung 11 Jul
HK/China Utilities Sector – Ahead of the 1H16 results: gem and stones Dave Dai 13 Jul
India Analysts’ name Date
India Utilities Sector – Sector inflection; slow creep begins Lokesh Garg 7 Jul
Coal India – Higher output to offset lower ASP Ravi Shankar 7 Jul
LIC Housing Finance Ltd – Favourable risk reward, visible catalysts Sunil Tirumalai 12 Jul
India Automobiles Sector – Mind the (regulatory) gap Jatin Chawla 13 Jul
Japan Analysts’ name Date
Yahoo Japan – Initiating at OUTPERFORM; earnings momentum at turning point; shift from forward investment
to profit expansion
Keiichi Yoneshima 7 Jul
GMO Internet – Initiate at OUTPERFORM: looks undervalued; improved earnings structure at domain business
a potential catalyst
Keiichi Yoneshima 12 Jul
Malaysia Analysts’ name Date
Westports Holdings – Waiting for a better price Muzhafar Mukhtar 11 Jul
Pakistan Analysts’ name Date
Engro Corporation Ltd – Assessing the impact of recent divestments Farhan Rizvi 11 Jul
South Korea Analysts’ name Date
NCSOFT – Late to the party... Eric Cha 13 Jul
POSCO – Supply reform in China real this time Minseok Sinn 13 Jul
Taiwan Analysts’ name Date
Taiwan Components Sector – June sales review: Apple supply chain disappointed Pauline Chen 11 Jul
Taiwan Chemicals Sector – 2Q16 results beat; FPCC is retained as our top pick; upgrading FCFC to an
OUTPERFORM
Jeremy Chen 12 Jul

14 July 2016
Jump-Start 89
Disclosure Appendix
Important Global Disclosures
The analysts identified in this report each certify, with respect to the companies or securities that the individual analyzes, that (1) the views expressed in this report accurately reflect his or her personal views about all of the subject companies and securities and (2) no part of his or her compensation was, is or will be directly or indirectly related to the specific recommendations or views expressed in this report.
The analyst(s) responsible for preparing this research report received Compensation that is based upon various factors including Credit Suisse's total revenues, a portion of which are generated by Credit Suisse's investment banking activities
As of December 10, 2012 Analysts’ stock rating are defined as follows:
Outperform (O) : The stock’s total return is expected to outperform the relevant benchmark* over the next 12 months.
Neutral (N) : The stock’s total return is expected to be in line with the relevant benchmark* over the next 12 months.
Underperform (U) : The stock’s total return is expected to underperform the relevant benchmark* over the next 12 months.
*Relevant benchmark by region: As of 10th December 2012, Japanese ratings are based on a stock’s total return relative to the analyst's coverage universe which consists of all companies covered by the analyst within the relevant sector, with Outperforms representing the most attractiv e, Neutrals the less attractive, and Underperforms the least attractive investment opportunities. As of 2nd October 2012, U.S. and Canadian as well as European ratings are based on a stock’s total return relative to the analyst's coverage universe which consists of all companies covered by the analyst within the relevant sector, with Outperforms representing the most attractive, Neutrals the less attractive, and Underperforms the least attractive investment opportunities. For Latin American and non -Japan Asia stocks, ratings are based on a stock’s total return relative to the average total return of the relevant country or regional benchmark; prior to 2nd October 2012 U.S. and Canadian ratings were based on (1) a stock’s absolute total return potential to its current share price and (2) the relative attractiveness of a stock’s total return potential within an analyst’s coverage universe. For Australian and New Zealand stocks, the expected total return (ETR) calculation includes 12 -month rolling dividend yield. An Outperform rating is assigned where an ETR is greater than or equal to 7.5%; Underperform where an ETR less than or equal to 5%. A Neutral may be assigned where the ETR is between -5% and 15%. The overlapping rating range allows analysts to assign a rating that puts ETR in the context of associated risks. Prior to 18 May 2015, ETR ranges for Outperform and Underperform ratings did not overlap with Neutral thresholds between 15% and 7.5%, which was in operation from 7 July 2011.
Restricted (R) : In certain circumstances, Credit Suisse policy and/or applicable law and regulations preclude certain types of communications, including an investment recommendation, during the course of Credit Suisse's engagement in an investment banking transaction and in certain other circumstances.
Not Rated : Credit Suisse Equity Research does not have an investment rating or view on the stock or any other securities related to the company at this time.
Not Covered (NC) : Credit Suisse Equity Research does not provide ongoing coverage of the company or offer an investment rating or investment view on the equity security of the company or related products.
Volatility Indicator [V] : A stock is defined as volatile if the stock price has moved up or down by 20% or more in a month in at least 8 of the past 24 months or the analyst expects significant volatility going forward.
Analysts’ sector weightings are distinct from analysts’ stock ratings and are based on the analyst’s expectations for the fundamentals and/or valuation of the sector* relative to the group’s historic fundamentals and/or valuation:
Overweight : The analyst’s expectation for the sector’s fundamentals and/or valuation is favorable over the next 12 months.
Market Weight : The analyst’s expectation for the sector’s fundamentals and/or valuation is neutral over the next 12 months.
Underweight : The analyst’s expectation for the sector’s fundamentals and/or valuation is cautious over the next 12 months.
*An analyst’s coverage sector consists of all companies covered by the analyst within the relevant sector. An analyst may cover multiple sectors.
Credit Suisse's distribution of stock ratings (and banking clients) is:
Global Ratings Distribution
Rating Versus universe (%) Of which banking clients (%)
Outperform/Buy* 51% (41% banking clients)
Neutral/Hold* 36% (17% banking clients)
Underperform/Sell* 13% (38% banking clients)
Restricted 0%
*For purposes of the NYSE and NASD ratings distribution disclosure requirements, our stock ratings of Outperform, Neutral, an d Underperform most closely correspond to Buy, Hold, and Sell, respectively; however, the meanings are not the same, as our stock ratings are determined on a relative basis. (Please refer to definitions above.) An investor's decision to buy or sell a security should be based on investment objectives, current holdin gs, and other individual factors.
14 July 2016
Jump-Start 90
Credit Suisse’s policy is to update research reports as it deems appropriate, based on developments with the subject company, the sector or the market that may have a material impact on the research views or opinions stated herein.
Credit Suisse's policy is only to publish investment research that is impartial, independent, clear, fair and not misleading. For more detail please refer to Credit Suisse's Policies for Managing Conflicts of Interest in connection with Investment Research: http://www.csfb.com/research-and-analytics/disclaimer/managing_conflicts_disclaimer.html
Credit Suisse does not provide any tax advice. Any statement herein regarding any US federal tax is not intended or written to be used, and cannot be used, by any taxpayer for the purposes of avoiding any penalties.
For a history of recommendations for the subject company(ies) featured in this report, disseminated within the past 12 months, please refer to https://rave.credit-suisse.com/disclosures/view/report?i=76283&v=-3j380awoblobev0f1mwq2ybhg .
Important Regional Disclosures
Singapore recipients should contact Credit Suisse AG, Singapore Branch for any matters arising from this research report.
The analyst(s) involved in the preparation of this report may participate in events hosted by the subject company, including site visits. Credit Suisse does not accept or permit analysts to accept payment or reimbursement for travel expenses associated with these events.
Restrictions on certain Canadian securities are indicated by the following abbreviations: NVS--Non-Voting shares; RVS--Restricted Voting Shares; SVS--Subordinate Voting Shares.
Individuals receiving this report from a Canadian investment dealer that is not affiliated with Credit Suisse should be advised that this report may not contain regulatory disclosures the non-affiliated Canadian investment dealer would be required to make if this were its own report.
For Credit Suisse Securities (Canada), Inc.'s policies and procedures regarding the dissemination of equity research, please visit https://www.credit-suisse.com/sites/disclaimers-ib/en/canada-research-policy.html.
As of the date of this report, Credit Suisse acts as a market maker or liquidity provider in the equities securities that are the subject of this report.
Principal is not guaranteed in the case of equities because equity prices are variable.
Commission is the commission rate or the amount agreed with a customer when setting up an account or at any time after that.
This research report is authored by:
Credit Suisse (Hong Kong) Limited ............................................................................................................................... Credit Suisse Asia Eq. Res.
Please find the full reports, including disclosure information, on Credit Suisse's Research and Analytics Website (http://www.researchandanalytics.com)
Important MSCI Disclosures
The MSCI sourced information is the exclusive property of Morgan Stanley Capital International Inc. (MSCI). Without prior written permission of MSCI, this information and any other MSCI intellectual property may not be reproduced, re-disseminated or used to create and financial products, including any indices. This information is provided on an "as is" basis. The user assumes the entire risk of any use made of this information. MSCI, its affiliates and any third party involved in, or related to, computing or compiling the information hereby expressly disclaim all warranties of originality, accuracy, completeness, merchantability or fitness for a particular purpose with respect to any of this information. Without limiting any of the foregoing, in no event shall MSCI, any of its affiliates or any third party involved in, or related to, computing or compiling the information have any liability for any damages of any kind. MSCI, Morgan Stanley Capital International and the MSCI indexes are services marks of MSCI and its affiliates.
The Global Industry Classification Standard (GICS) was developed by and is the exclusive property of Morgan Stanley Capital International Inc. and Standard & Poor’s. GICS is a service mark of MSCI and S&P and has been licensed for use by Credit Suisse.
Important Credit Suisse HOLT Disclosures
With respect to the analysis in this report based on the Credit Suisse HOLT methodology, Credit Suisse certifies that (1) the views expressed in this report accurately reflect the Credit Suisse HOLT methodology and (2) no part of the Firm’s compensation was, is, or will be directly related to the specific views disclosed in this report.
The Credit Suisse HOLT methodology does not assign ratings to a security. It is an analytical tool that involves use of a set of proprietary quantitative algorithms and warranted value calculations, collectively called the Credit Suisse HOLT valuation model, that are consistently applied to all the companies included in its database. Third-party data (including consensus earnings estimates) are systematically translated into a number of default algorithms available in the Credit Suisse HOLT valuation model. The source financial statement, pricing, and earnings data provided by outside data vendors are subject to quality control and may also be adjusted to more closely measure the underlying economics of firm performance. The adjustments provide consistency when analyzing a single company across time, or analyzing multiple companies across industries or national borders. The default scenario that is produced by the Credit Suisse HOLT valuation model establishes the baseline valuation for a security, and a user then may adjust the default variables to produce alternative scenarios, any of which could occur.
Additional information about the Credit Suisse HOLT methodology is available on request.

14 July 2016
Jump-Start 91
The Credit Suisse HOLT methodology does not assign a price target to a security. The default scenario that is produced by the Credit Suisse HOLT valuation model establishes a warranted price for a security, and as the third-party data are updated, the warranted price may also change. The default variable may also be adjusted to produce alternative warranted prices, any of which could occur.
CFROI®, HOLT, HOLTfolio, ValueSearch, AggreGator, Signal Flag and “Powered by HOLT” are trademarks or service marks or registered trademarks or registered service marks of Credit Suisse or its affiliates in the United States and other countries. HOLT is a corporate performance and valuation advisory service of Credit Suisse.
For Credit Suisse disclosure information on other companies mentioned in this report, please visit the website at https://rave.credit-suisse.com/disclosures or call +1 (877) 291-2683.
14 July 2016
Jump-Start 92
This report is produced by subsidiaries and affiliates of Credit Suisse operating under its Global Markets Division. For more information on our structure, please use the following link: https://www.credit-suisse.com/who-we-are This report may contain material that is not directed to, or intended for distribution to or use by, any person or entity who is a citizen or resident of or located in any locality, state, country or other jurisdiction where such distribution, publication, availability or use would be contrary to law or regulation or which would subject Credit Suisse or its affiliates ("CS") to any registration or licensing requirement within such jurisdiction. All material presented in this report, unless specifically indicated otherwise, is under copyright to CS. None of the material, nor its content, nor any copy of it, may be altered in any way, transmitted to, copied or distributed to any other party, without the prior express written permission of CS. All trademarks, service marks and logos used in this report are trademarks or service marks or registered trademarks or service marks of CS or its affiliates.The information, tools and material presented in this report are provided to you for information purposes only and are not to be used or considered as an offer or the solicitation of an offer to sell or to buy or subscribe for securities or other financial instruments. CS may not have taken any steps to ensure that the securities referred to in this report are suitable for any particular investor. CS will not treat recipients of this report as its customers by virtue of their receiving this report. The investments and services contained or referred to in this report may not be suitable for you and it is recommended that you consult an independent investment advisor if you are in doubt about such investments or investment services. Nothing in this report constitutes investment, legal, accounting or tax advice, or a representation that any investment or strategy is suitable or appropriate to your individual circumstances, or otherwise constitutes a personal recommendation to you. CS does not advise on the tax consequences of investments and you are advised to contact an independent tax adviser. Please note in particular that the bases and levels of taxation may change. Information and opinions presented in this report have been obtained or derived from sources believed by CS to be reliable, but CS makes no representation as to their accuracy or completeness. CS accepts no liability for loss arising from the use of the material presented in this report, except that this exclusion of liability does not apply to the extent that such liability arises under specific statutes or regulations applicable to CS. This report is not to be relied upon in substitution for the exercise of independent judgment. CS may have issued, and may in the future issue, other communications that are inconsistent with, and reach different conclusions from, the information presented in this report. Those communications reflect the different assumptions, views and analytical methods of the analysts who prepared them and CS is under no obligation to ensure that such other communications are brought to the attention of any recipient of this report. Some investments referred to in this report will be offered solely by a single entity and in the case of some investments solely by CS, or an associate of CS or CS may be the only market maker in such investments. Past performance should not be taken as an indication or guarantee of future performance, and no representation or warranty, express or implied, is made regarding future performance. Information, opinions and estimates contained in this report reflect a judgment at its original date of publication by CS and are subject to change without notice. The price, value of and income from any of the securities or financial instruments mentioned in this report can fall as well as rise. The value of securities and financial instruments is subject to exchange rate fluctuation that may have a positive or adverse effect on the price or income of such securities or financial instruments. Investors in securities such as ADR's, the values of which are influenced by currency volatility, effectively assume this risk. Structured securities are complex instruments, typically involve a high degree of risk and are intended for sale only to sophisticated investors who are capable of understanding and assuming the risks involved. The market value of any structured security may be affected by changes in economic, financial and political factors (including, but not limited to, spot and forward interest and exchange rates), time to maturity, market conditions and volatility, and the credit quality of any issuer or reference issuer. Any investor interested in purchasing a structured product should conduct their own investigation and analysis of the product and consult with their own professional advisers as to the risks involved in making such a purchase. Some investments discussed in this report may have a high level of volatility. High volatility investments may experience sudden and large falls in their value causing losses when that investment is realised. Those losses may equal your original investment. Indeed, in the case of some investments the potential losses may exceed the amount of initial investment and, in such circumstances, you may be required to pay more money to support those losses. Income yields from investments may fluctuate and, in consequence, initial capital paid to make the investment may be used as part of that income yield. Some investments may not be readily realisable and it may be difficult to sell or realise those investments, similarly it may prove difficult for you to obtain reliable information about the value, or risks, to which such an investment is exposed. This report may provide the addresses of, or contain hyperlinks to, websites. Except to the extent to which the report refers to website material of CS, CS has not reviewed any such site and takes no responsibility for the content contained therein. Such address or hyperlink (including addresses or hyperlinks to CS's own website material) is provided solely for your convenience and information and the content of any such website does not in any way form part of this document. Accessing such website or following such link through this report or CS's website shall be at your own risk. This report is issued and distributed in European Union (except Switzerland): by Credit Suisse Securities (Europe) Limited, One Cabot Square, London E14 4QJ, England, which is authorised by the Prudential Regulation Authority and regulated by the Financial Conduct Authority and the Prudential Regulation Authority. Germany: Credit Suisse Securities (Europe) Limited Niederlassung Frankfurt am Main regulated by the Bundesanstalt fuer Finanzdienstleistungsaufsicht ("BaFin"). United States and Canada: Credit Suisse Securities (USA) LLC; Switzerland: Credit Suisse AG; Brazil: Banco de Investimentos Credit Suisse (Brasil) S.A or its affiliates; Mexico: Banco Credit Suisse (México), S.A. (transactions related to the securities mentioned in this report will only be effected in compliance with applicable regulation); Japan: by Credit Suisse Securities (Japan) Limited, Financial Instruments Firm, Director-General of Kanto Local Finance Bureau ( Kinsho) No. 66, a member of Japan Securities Dealers Association, The Financial Futures Association of Japan, Japan Investment Advisers Association, Type II Financial Instruments Firms Association; Hong Kong: Credit Suisse (Hong Kong) Limited; Australia: Credit Suisse Equities (Australia) Limited; Thailand: Credit Suisse Securities (Thailand) Limited, regulated by the Office of the Securities and Exchange Commission, Thailand, having registered address at 990 Abdulrahim Place, 27th Floor, Unit 2701, Rama IV Road, Silom, Bangrak, Bangkok10500, Thailand, Tel. +66 2614 6000; Malaysia: Credit Suisse Securities (Malaysia) Sdn Bhd, Credit Suisse AG, Singapore Branch; India: Credit Suisse Securities (India) Private Limited (CIN no.U67120MH1996PTC104392) regulated by the Securities and Exchange Board of India as Research Analyst (registration no. INH 000001030) and as Stock Broker (registration no. INB230970637; INF230970637; INB010970631; INF010970631), having registered address at 9th Floor, Ceejay House, Dr.A.B. Road, Worli, Mumbai - 18,
India, T- +91-22 6777 3777; South Korea: Credit Suisse Securities (Europe) Limited, Seoul Branch; Taiwan: Credit Suisse AG Taipei Securities Branch; Indonesia: PT Credit Suisse Securities Indonesia; Philippines: Credit Suisse Securities (Philippines ) Inc., and elsewhere in the world by the relevant authorised affiliate of the above. Additional Regional Disclaimers Hong Kong: Credit Suisse (Hong Kong) Limited ("CSHK") is licensed and regulated by the Securities and Futures Commission of Hong Kong under the laws of Hong Kong, which differ from Australian laws. CSHKL does not hold an Australian financial services licence (AFSL) and is exempt from the requirement to hold an AFSL under the Corporations Act 2001 (the Act) under Class Order 03/1103 published by the ASIC in respect of financial services provided to Australian wholesale clients (within the meaning of section 761G of the Act). Research on Taiwanese securities produced by Credit Suisse AG, Taipei Securities Branch has been prepared by a registered Senior Business Person. Malaysia: Research provided to residents of Malaysia is authorised by the Head of Research for Credit Suisse Securities (Malaysia) Sdn Bhd, to whom they should direct any queries on +603 2723 2020. Singapore: This report has been prepared and issued for distribution in Singapore to institutional investors, accredited investors and expert investors (each as defined under the Financial Advisers Regulations) only, and is also distributed by Credit Suisse AG, Singapore branch to overseas investors (as defined under the Financial Advisers Regulations). By virtue of your status as an institutional investor, accredited investor, expert investor or overseas investor, Credit Suisse AG, Singapore branch is exempted from complying with certain compliance requirements under the Financial Advisers Act, Chapter 110 of Singapore (the "FAA"), the Financial Advisers Regulations and the relevant Notices and Guidelines issued thereunder, in respect of any financial advisory service which Credit Suisse AG, Singapore branch may provide to you. UAE: This information is being distributed by Credit Suisse AG (DIFC Branch), duly licensed and regulated by the Dubai Financial Services Authority (“DFSA”). Related financial services or products are only made available to Professional Clients or Market Counterparties, as defined by the DFSA, and are not intended for any other persons. Credit Suisse AG (DIFC Branch) is located on Level 9 East, The Gate Building, DIFC, Dubai, United Arab Emirates. EU: This report has been produced by subsidiaries and affiliates of Credit Suisse operating under its Global Markets Division This research may not conform to Canadian disclosure requirements. In jurisdictions where CS is not already registered or licensed to trade in securities, transactions will only be effected in accordance with applicable securities legislation, which will vary from jurisdiction to jurisdiction and may require that the trade be made in accordance with applicable exemptions from registration or licensing requirements. Non-US customers wishing to effect a transaction should contact a CS entity in their local jurisdiction unless governing law permits otherwise. US customers wishing to effect a transaction should do so only by contacting a representative at Credit Suisse Securities (USA) LLC in the US. Please note that this research was originally prepared and issued by CS for distribution to their market professional and institutional investor customers. Recipients who are not market professional or institutional investor customers of CS should seek the advice of their independent financial advisor prior to taking any investment decision based on this report or for any necessary explanation of its contents. This research may relate to investments or services of a person outside of the UK or to other matters which are not authorised by the Prudential Regulation Authority and regulated by the Financial Conduct Authority and the Prudential Regulation Authority or in respect of which the protections of the Prudential Regulation Authority and Financial Conduct Authority for private customers and/or the UK compensation scheme may not be available, and further details as to where this may be the case are available upon request in respect of this report. CS may provide various services to US municipal entities or obligated persons ("municipalities"), including suggesting individual transactions or trades and entering into such transactions. Any services CS provides to municipalities are not viewed as "advice" within the meaning of Section 975 of the Dodd-Frank Wall Street Reform and Consumer Protection Act. CS is providing any such services and related information solely on an arm's length basis and not as an advisor or fiduciary to the municipality. In connection with the provision of the any such services, there is no agreement, direct or indirect, between any municipality (including the officials,management, employees or agents thereof) and CS for CS to provide advice to the municipality. Municipalities should consult with their financial, accounting and legal advisors regarding any such services provided by CS. In addition, CS is not acting for direct or indirect compensation to solicit the municipality on behalf of an unaffiliated broker, dealer, municipal securities dealer, municipal advisor, or investment adviser for the purpose of obtaining or retaining an engagement by the municipality for or in connection with Municipal Financial Products, the issuance of municipal securities, or of an investment adviser to provide investment advisory services to or on behalf of the municipality. If this report is being distributed by a financial institution other than Credit Suisse AG, or its affiliates, that financial institution is solely responsible for distribution. Clients of that institution should contact that institution to effect a transaction in the securities mentioned in this report or require further information. This report does not constitute investment advice by Credit Suisse to the clients of the distributing financial institution, and neither Credit Suisse AG, its affiliates, and their respective officers, directors and employees accept any liability whatsoever for any direct or consequential loss arising from their use of this report or its content. Principal is not guaranteed. Commission is the commission rate or the amount agreed with a customer when setting up an account or at any time after that. Copyright © 2016 CREDIT SUISSE AG and/or its affiliates. All rights reserved.
Investment principal on bonds can be eroded depending on sale price or market price. In addition, there are bonds on which investment principal can be eroded due to changes in redemption amounts. Care is required when investing in such instruments. When you purchase non-listed Japanese fixed income securities (Japanese government bonds, Japanese municipal bonds, Japanese government guaranteed bonds, Japanese corporate bonds) from CS as a seller, you will be requested to pay the purchase price only.
0714_jump start.doc
Related Documents