Annual Reporting and Accountability by Municipalities in Canada: An Empirical Investigation* HUGUETTE BLANCO, Laurentian University JOHN LENNARD, Davies Ward Phillips & Vineberg LLP SYLVAIN LAMONTAGNE, Mansour Mining Technologies Inc. ABSTRACT Prior research regarding reporting and accountability by local governments in sev- eral countries has questioned the value of traditional annual reporting and the level of accountability to the public. This article reports on comparable research for local governments throughout Canada. The disclosure index methodology is used to evaluate the quality and quantity of information published in the annual reports and in the financial statements of Canadian local governments in 2003 with a com- parison in 2005. Although all municipalities published audited financial statements, less than one-third of municipalities published a comprehensive annual report in 2003. The results show an overall low disclosure index with significant improve- ments in 2005 compared to 2003 and significant differences across the country. The results, largely consistent with previously published international studies, raise questions about local government accountability and about the conceptual frame- work for local government reporting. Keywords Local government; Financial reporting; Municipal reporting; Accountability RAPPORT ANNUEL ET REDDITION DE COMPTES DES MUNICIPALITÉS CANADIENNES : UNE ÉTUDE EMPIRIQUE RÉSUMÉ Les e´tudes pre´ce´dentes portant sur la reddition de comptes des administrations locales de plusieurs pays et sur les informations qu’elles publient ont remis en question la valeur des rapports annuels traditionnels et du niveau de reddition de comptes a` la collectivite´. Les auteurs font e´tat de donne´es comparables pour les administrations locales de l’ensemble du Canada. Ils appliquent la me´thodologie de l’indice d’information pour e´valuer la qualite´ et la quantite´ des informations publie´es dans les rapports annuels et les e´tats financiers des administrations locales canadiennes en 2003 comparativement a` 2005. Bien que toutes les municipalite´s aient publie´ des e´tats financiers audite´s, moins du tiers des municipalite´s ont * We gratefully acknowledge financial support from CGA-Canada and helpful guidance and comments from two anonymous reviewers. AP Vol. 10 No. 3 — PC Vol. 10, n o 3 (2011) pages 195 – 224 ª CAAA /ACPC doi:10.1111/j.1911-3838.2011.00024.x

Welcome message from author
This document is posted to help you gain knowledge. Please leave a comment to let me know what you think about it! Share it to your friends and learn new things together.
Transcript
Annual Reporting and Accountability byMunicipalities in Canada: An Empirical
Investigation*
HUGUETTE BLANCO, Laurentian University
JOHN LENNARD, Davies Ward Phillips & Vineberg LLP
SYLVAIN LAMONTAGNE, Mansour Mining Technologies Inc.
ABSTRACTPrior research regarding reporting and accountability by local governments in sev-eral countries has questioned the value of traditional annual reporting and the levelof accountability to the public. This article reports on comparable research for localgovernments throughout Canada. The disclosure index methodology is used toevaluate the quality and quantity of information published in the annual reportsand in the financial statements of Canadian local governments in 2003 with a com-parison in 2005. Although all municipalities published audited financial statements,less than one-third of municipalities published a comprehensive annual report in2003. The results show an overall low disclosure index with significant improve-ments in 2005 compared to 2003 and significant differences across the country. Theresults, largely consistent with previously published international studies, raisequestions about local government accountability and about the conceptual frame-work for local government reporting.
Keywords Local government; Financial reporting; Municipal reporting;Accountability
RAPPORT ANNUEL ET REDDITION DE COMPTES DES MUNICIPALITÉSCANADIENNES : UNE ÉTUDE EMPIRIQUE
RÉSUMÉLes etudes precedentes portant sur la reddition de comptes des administrationslocales de plusieurs pays et sur les informations qu’elles publient ont remis enquestion la valeur des rapports annuels traditionnels et du niveau de reddition decomptes a la collectivite. Les auteurs font etat de donnees comparables pour lesadministrations locales de l’ensemble du Canada. Ils appliquent la methodologie del’indice d’information pour evaluer la qualite et la quantite des informationspubliees dans les rapports annuels et les etats financiers des administrations localescanadiennes en 2003 comparativement a 2005. Bien que toutes les municipalitesaient publie des etats financiers audites, moins du tiers des municipalites ont
* We gratefully acknowledge financial support from CGA-Canada and helpful guidance and
comments from two anonymous reviewers.
AP Vol. 10 No. 3 — PC Vol. 10, no 3 (2011) pages 195 – 224 ª CAAA /ACPCdoi:10.1111/j.1911-3838.2011.00024.x
produit un rapport annuel exhaustif en 2003. Les resultats de l’etude revelent que lefaible indice global d’information affiche une amelioration sensible en 2005 parrapport a 2003, avec d’importants ecarts selon le lieu geographique au pays. Cesresultats, qui confirment essentiellement ceux des etudes internationalesanterieurement publiees, soulevent des questions en ce qui a trait a la reddition decomptes des administrations locales et au cadre conceptuel des informationspubliees par les administrations locales.
Mots clés : administration locale, information financiere, information municipale,reddition de comptes
Over the past few years, there has been an increased emphasis on performance andaccountability in the public sector in many countries (Stanley, Jennings, and Mack,2008). The studies of local government reporting in Wales by Boyne and Law(1991), in the United Kingdom by Jones and Pendlebury (2004), in Spain by BruscaAlijarde (1997), in Australia by Ryan, Stanley, and Nelson (2002), in Malaysia byTayib, Coombs, and Ameen (1999), and in Italy by Steccolini (2004) have ques-tioned the value of traditional annual reporting and the level of accountability tothe public. Comparable research has not been carried out in Canada until now.
As Kitchen and Slack (2003) observe, municipalities in Canada have beenoperating in a difficult fiscal environment: they have faced increasing responsibilitiesin delivering services as a result of pressure from their citizens and transferof responsibilities (downloading) from the Canadian provincial and federalgovernments; at the same time, funds transfers from the provincial and federalgovernments have not kept pace with their increasing roles and responsibilities.Since provincial legislation generally prohibits them from operating under deficitand restricts their capital borrowing capacities, many municipalities have resortedto politically risky choices such as increase in direct or indirect taxation and ⁄ordecrease in services to meet any shortfall in revenues (Lightbody, 2003). As a result,demands for accountability have become louder.
Municipalities have promoted the budgeting process as the opportunity formanagers and councilors to hear from the citizens. Through public information ses-sions they listen to citizens and advocacy groups before finalizing their estimate ofexpenditures in the budget. However, budgeting is only an intermediate step in thecycle that starts with planning and priority setting and that ends with periodicreporting and auditing. For meaningful and informed input in budgeting, citizensand councilors require pertinent information that is gathered and presented in thereporting step. And as Lightbody (2003) observes, with complex and lengthy budgetdocuments, citizens, advocacy groups and even councilors do not have adequateinformation to make meaningful contribution to the process (the budget documentsof a city of 160,000 inhabitants can easily be over 500 pages long). As stated byBoyne and Law (1991: 179), the annual report, including the financial statements,compiled in the final stage of the cycle, ‘‘is the only comprehensive statement ofstewardship available to the public’’.
196 ACCOUNTING PERSPECTIVES / PERSPECTIVES COMPTABLES
AP Vol. 10 No. 3 — PC vol. 10, no 3 (2011)
The research reported in this article focuses on the importance of the annualreport as a vehicle for discharging accountability. The purpose is to determine howwell Canadian municipalities use the annual report to discharge their accountabilityresponsibilities. To this end, this article reports on an evaluation of the extent andquality of information published in financial statements and annual reports1 ofmunicipalities across Canada in 2003, with a follow-up comparison in 2005.
The article is organized as follows: the next section provides a brief description ofthe Canadian environment for local reporting and section 3 summarizes some of therelevant papers; the methodology is described in section 4, followed by the results insection 5 and the discussion and conclusions, including limitations, in section 6.
BACKGROUND ON THE CANADIAN ENVIRONMENT FOR MUNICIPALREPORTING
The Canadian Institute of Chartered Accountants (CICA), through several boards,is responsible for developing and publishing the generally accepted accountingprinciples (GAAP) that govern accounting and reporting for Canadiancorporations and governments. The Public Sector Accounting Board (PSAB) issuesrecommendations that are specific to federal, provincial, territorial, and local2 gov-ernments and that are national in scope. Over the period covered by our study thePSAB Handbook included two sections directed specifically to local governments(Objectives of financial statements – PS1700, and General standards of financialstatements presentations – PS1800) as well as other sections (series 2000 and 3000)dealing with specific items that applied to all levels of governments. The section onaccounting for capital assets did not apply to local governments, and consequentlylocal governments were not required to capitalize their capital assets and were notrequired to follow full accrual accounting.3
Until 2004, local governments had little guidance to report on their perfor-mance to their stakeholders. The first ‘‘statement of recommended practice’’(SORP) issued by PSAB for governments was published in June 2004 to ‘‘provideguidance to a government choosing to provide supplementary information beyondthat contained in the financial statements’’. SORP 1 is a description of the contentand characteristics of a financial statement discussion and analysis that would helpusers make a better assessment of the government financial position and account-ability.4 Prior to 2004, governments could get assistance from the guidance docu-ment issued in 1996 for reporting issuers subject to Canadian securities regulations.
1. Annual reports typically include the audited financial statements as well as some narrative of the
organization and its operations.2. PSAB refers to local government; in this study the words local and municipal are used
interchangeably.3. Since January 2009, full accrual accounting for capital assets is required for all local
governments.4. SORPs 2, 3, and 4 were published in 2006, 2008, and 2009 respectively, after this study was
conceived.
ANNUAL REPORTING AND ACCOUNTABILITY BY MUNICIPALITIES IN CANADA 197
AP Vol. 10 No. 3 — PC vol. 10, no 3 (2011)
All Canadian provinces have enacted legislation to prescribe the minimum stan-dards for financial reporting at the municipal level. Over the period covered by ourstudy most but not all provinces required that their municipalities adopt the PSABrecommendations and base their annual audited statements on GAAP for local gov-ernments. Municipalities in the province of Quebec had to follow a presentationmandated by the province, and municipalities in the provinces of Nova Scotia andNew Brunswick were only required to publish special purpose financial statementswhich were generally not consolidated nor presented on a cumulative or combinedbasis and not GAAP-compliant. Also, in 2003 Canadian municipalities were notlegally required to publish an annual report. Only British Columbia enacted a com-munity Charter5 which took effect in 2004 and required municipalities to publish anannual report.
However, the legal requirement imposed by each province is only a minimum.Like all corporations, municipalities can design their communication strategy to fittheir objectives, including their accountability responsibilities. For example, theCity of Halifax in Nova Scotia chose in 2005 to publish an annual report and itsaudited financial statements were GAAP-based because ‘‘PSAB compliant financialstatements aid the municipality in comparing itself with other Canadian municipali-ties and over time provide Council with a more complete picture of our financialposition’’ (2005 Annual Report). Except for municipalities in British Columbia in2005, all Canadian municipalities had the choice of whether or not to publish anannual report, and their financial statements could have been GAAP-complianteven if it was not legally required.
PREVIOUS RELATED RESEARCH
Public Sector Accountability
Of the two commonly accepted objectives for annual reporting, accountability anddecision usefulness, PSAB selects the accountability objective as being the most rele-vant (1700.21) and researchers also agree (Roberts and Scapens, 1985; Skinner,1987; Governmental Accounting Standards Board, 1987; Pallot, 1992; Nelson,Banks, and Fisher, 2003; Christensen and Skærbæk, 2007; Jones and Pendlebury,2004; Stanley et al., 2008).
Accountability is a complex concept that has evolved and changed over time(Nelson et al., 2003). For Ijiri (1983) accountability requires a flow of informationbetween the accountor and the accountee that satisfies both the right to know ofthe accountee and the right to protect privacy of the accountor. Robert and Sca-pens (1985: 447) agree that accountability is the ‘‘giving and demanding of reasonsfor conduct’’, with ‘‘reciprocal rights and obligations’’. The flow of information is
5. The BC Community Charter received Royal Assent on May 29, 2003 and came into force on
January 1, 2004. The transitional provisions only allowed a few exemptions regarding the content
of the first and of the second required annual reports.
198 ACCOUNTING PERSPECTIVES / PERSPECTIVES COMPTABLES
AP Vol. 10 No. 3 — PC vol. 10, no 3 (2011)
bidirectional, with the interest of both sides to be taken into account. Accountorsare expected to publish comprehensive information that allows accountees to assessfinancial health and performance of the entity. Of importance are the power rela-tionship between accountor and accountee and the potential conflicts that can arisearound issues of type, quantity, and quality of information provided and demanded(Mayston, 1992; Ryan, Dunstan, and Brown, 2002). While more information isalways better for the accountee, it may not necessarily be better for the accountor.Objectivity and verifiability of accounting information is indispensable to neutralizethe incentive of the accountor to present the best performance possible (Ijiri, 1983).
Many forms and models of accountability have been presented in the literature.Broadbent, Dietrich, and Laughlin (1996) discuss the five rungs of accountabilityladder developed by Stewart (1984) from a principal-agent perspective. Each rungin the ladder (probity and legality, process, performance, program, and policy)implies a different relationship between principal and agent so that agents areexpected to provide increasingly precise information about actions taken, means,outcomes, and goals. Sinclair (1995) developed a model based on the type ofaccountee. She identifies five forms of accountability: political, public, managerial,professional, and personal, with political, public, and managerial accountabilitybeing particularly relevant in reference to local governments. Referring to these twoaccountability models, Kloot and Martin (2001) find that accountability of localgovernment managers includes all of the rungs in Stewart’s ladder and can bedescribed as political, public and managerial. Using a different approach, Ryan,Dunstan, and Brown (2002) build a ‘‘chain of accountability’’ model that differenti-ates between the links of accountability and the bonds of accountability defined byStewart (1984). A link of accountability refers to the mutual relationship betweenaccountee and accountor to seek information, whereas a bond of accountabilityincludes the elements of responsibility and of power to assess and improve per-formance which are essential to the accountability relationship. Information isprovided by management so that stakeholders can exercise their power to evaluateand improve on performance.
It is clear from the above discussion that the roles played by both accountorsand accountees in the accountability relationship are important. However, the focusof this study is placed on the accountor ⁄agent ⁄manager side of the accountabilityrelationship.
Researchers have focused on the publication of the annual report as the mainmechanism by which governments meet their accountability responsibilities (Boyneand Law, 1991; Pallot, 1992; Ryan, Dunstan, and Brown, 2002; Nelson et al.,2003). Local government managers surveyed by Kloot and Martin (2001) andRyan, Dunstan, and Brown (2002) agree that the annual report is a valuable toolfor discharging accountability, although they recognize that other specific forms ofcommunication can be used to meet the accountability needs of different groupsof accountees. Compared to other forms of reporting such as newspaper columnsor articles, radio segments, or community consultations, the annual report benefits
ANNUAL REPORTING AND ACCOUNTABILITY BY MUNICIPALITIES IN CANADA 199
AP Vol. 10 No. 3 — PC vol. 10, no 3 (2011)
from the regulatory framework, includes audited statutory financial information, isviewed as a formal and more complete form of communication (Ryan, Dunstan,and Brown, 2002), and is regarded as the ‘‘cornerstone of public and Parliamentaryscrutiny’’ (Nelson et al., 2003: 79). Pablos, Carcaba, and Lopez (2002) also arguethat the annual report plays a central role in the communication toolkit of localgovernments.
Content and Quality of Reporting
To discharge their political, public and managerial accountability obligations, pub-lic sector managers are expected to provide more than a cash flow statement andstatement of financial position (Skinner, 1987; Boyne and Law, 1991), and it is clearthat the five rungs in Stewart’s ladder of accountability require disclosure of infor-mation that is much broader than financial but that may be difficult to quantify. Inthe model presented by Pablos et al. (2002) the annual report includes not only thefinancial statements but also analyses of their content and information on projects,goals, achievements, outcomes and labor relations so that there can be an assess-ment of actual performance.
Several empirical studies have looked at the quality of information provided tothe accountees (Boyne and Law, 1991; Brusca Alijarde, 1997; Ryan, Stanley, andNelson, 2002; Steccolini, 2004; Stanley et al., 2008). These studies are generally criti-cal of the information published annually by local governments, even after severalinitiatives were introduced to improve public reporting and performance measure-ment. In their initial study of Welsh District Councils, Boyne and Law (1991: 193)find the information provided to be ‘‘generally of poor quality’’ and they concludethat accountability of local governments requires them to specify ‘‘what they expectto achieve and to report on their progress towards such achievements’’. In anotherarticle with broader objectives of accountability, Boyne, Gould-Williams, Law, andWalker (2002) report that the reforms in public reporting brought about by theU.K. government had contributed little to the accountability of public organiza-tions. Similarly, in her empirical study of Italian local government annual reportsSteccolini (2004) finds that reforms did not lead to greater accountability and thatthe information in the annual report was generally of poor quality and scant, onlyserving to comply with legal requirements. Stanley et al. (2008) also report thatreforms in Queensland, Australia did not bring the expected increase in quality ofreporting, although there was improvement in the understandability of the informa-tion. In Spain, Brusca Alijarde (1997) finds that new regulations which requiredlocal governments to publish financial reports have had limited benefits, facilitatingthe accountability process only for some specific groups of users. Several research-ers (Steccolini, 2004; Jones and Pendlebury, 2004; Christensen and Skærbæk, 2007;Stanley et al., 2008) argue that the general financial reports are too complex forordinary taxpayers and that there is a need to develop other models of reporting.There is no reason to believe that the content and quality of reporting differ inCanada, but only specific Canadian research will provide an answer.
200 ACCOUNTING PERSPECTIVES / PERSPECTIVES COMPTABLES
AP Vol. 10 No. 3 — PC vol. 10, no 3 (2011)
As stated previously, in Canada PSAB provides a framework for accountingand financial reporting with minimum standards of disclosure, and until the firstSORP was published in 2004 PSAB had not published guidelines concerning annualreports. Without legal or regulatory requirement, municipalities have considerablelatitude to decide whether to publish an annual report and to define its content.Consequently, municipalities can demonstrate their level of accountability by theextent and the quality of the information they publish in their annual report. There-fore, a study of annual municipal reporting in Canada provides insight into theimportance that municipal management attach to their accountability duties.
Accountees and Users of Municipal Reports
According to PSAB (1700.15 to .20), the main group of accountees is the public,who provide resources to the municipalities and who are the owner of the assetsand of the funds under municipal management. Other potential users identified byPSAB include councils who represent the public, upper levels of governments, inves-tors, and analysts, including the media and internal users. Researchers of public sec-tor annual reporting practices have tried to establish who the users of reports are.They have identified as potential user groups creditors and investors, especially iflocal authorities can borrow on the open markets as in the United States, citizens,councils, internal users, external auditors, and political parties, all with differentlevels of interest (Daniels and Daniels, 1991; Collins, Keenan, and Lapsley, 1991;Brusca Alijarde, 1997; Tayib et al., 1999; Brusca and Condor, 2002; Steccolini, 2004).There is uncertainty about the identity of the users, and no consensus about theextent to which accountee groups use the reports. However, as Ijiri (1983) states, it isthe existence of the reports that is of central importance, even if no one reads them.
Of particular relevance for this research are the empirical studies that have beendesigned to probe the perception that local government managers or preparers ofinformation have concerning the users of the information they prepare and theidentity of the accountees. Results of surveys, interviews or questionnaires indicatethat municipal managements rate their accountability to councilors and otherinternal stakeholders as very high (Brusca Alijarde, 1997; Steccolini, 2004; Klootand Martin, 2001; Ryan, Dunstan, and Brown, 2002). In only the Kloot andMartin study is the accountability to ratepayers perceived to be high. These resultssupport Ryan, Dunstan, and Brown’s (2002) chain of accountability model for localgovernments mentioned above which sets management direct bonds of account-ability with the elected officials who in turn have direct bonds of accountability withthe electorate. These results also support the public form of accountability discussedby Sinclair (1995).
External auditors have been mentioned as users of published information (Brus-ca Alijarde, 1997; Collins et al., 1991; Steccolini, 2004) and as stakeholders in therelationship (Kloot and Martin, 2001; Ryan, Dunstan, and Brown, 2002). Theirrole in this accountor-accountee relationship can be seen in the managerial form ofaccountability described by Sinclair (1995) and in the principal-agent accountability
ANNUAL REPORTING AND ACCOUNTABILITY BY MUNICIPALITIES IN CANADA 201
AP Vol. 10 No. 3 — PC vol. 10, no 3 (2011)
relationship discussed by Broadbent et al. (1996). Because external audits enhancethe value of the information by providing control of the information productionprocess and adding credibility to the information, they provide comfort to bothaccountors and accountees. The audit process provides some control and ‘‘implicitassurance’’ of the underlying accounting and reporting systems (Jones and Pendle-bury, 2004: 321), thus helping management meet its process accountability. Also,the audit reassures users that the municipality ‘‘operates with appropriate proprietyand regularity’’ (Wynne, 2004: 6) and that the accounting information has beensubjected to an external objective examination, with results published in the audi-tor’s report, thus decreasing users potential conflict with management. The roleassumed by external auditors in the accountor-accountee relationship is thereforespecial and essential.
Thus, consistent with the previous discussion, the views of councilors and externalauditors about the importance of disclosed information was sought in this study.
Variables Influencing Accounting and Reporting Policies
Several researchers have studied the influence that external auditors have onaccounting and reporting. For examples in the private sector, Craswell and Taylor(1992) or Rowbottom (2002) show that the choice of accounting policy was influ-enced by the size of the external auditor. In other studies Bar-Yosef and Livnat(1984), Titman and Trueman (1986), Khurana and Raman (2004), and Francis andWang (2008) find that auditor quality is used as a signal of the quality of reportingby the company audited, with auditor quality equated to the size of the auditor(DeAngelo, 1981). In the public sector, the results of Copley’s study (1991) provideevidence of the positive association between audit quality as measured by the pres-ence of a (then) Big 8 auditor and the level of disclosure in the financial statementsof local governments. It is therefore reasonable to expect that municipalities auditedby a Big 4 firm would have higher quality reporting.
However, prior studies that have used the size of the external auditor (big firmversus non-big firm) as a proxy for audit quality report strong associations betweenauditor size and client size in both the corporate and the public sectors (Rubin,1988; Hay and Davis, 2004; Khurana and Raman, 2004; Behn, Choi, and Kang,2008; Lawrence, Minutti-Meza, and Zhang, 2011). Except for the recent Lawrenceet al. study, these studies confirm the positive big firm effect on financial reportingquality; the Lawrence et al. results put in doubt the big firm effect and suggests thatclient characteristics, and specifically size, may be the underlying factor driving theresults.
Indeed, size of a company has been reported as a factor that influences informa-tion disclosure (Marston and Shrives, 1991). Also, in the public sector Ryan,Stanley, and Nelson (2002) and Stanley et al. (2008) find a correlation between thesize of the population of local authorities in Australia and the quality of their Com-munity Financial Reports, and Nelson et al. (2003) report a significant correlation
202 ACCOUNTING PERSPECTIVES / PERSPECTIVES COMPTABLES
AP Vol. 10 No. 3 — PC vol. 10, no 3 (2011)
between the size of the university, as measured by revenue, and its quality ofaccountability information. It is therefore anticipated that both the type of externalauditor as well as the size of the municipality will influence the quality of disclosure,with a possible interaction between the two factors.
There is also evidence that geographic location influences the level of account-ability. Studies reviewed by Marston and Shrives (1991) have found that the regula-tory environment influences information disclosure. Kloot and Martin (2001)speculate that the differences between states in Australia in the level of local govern-ment accountabilities and how accountability is demonstrated can be attributed inpart to the different economic and political circumstances in each state. Also,Anessi-Pessina, Nasi, and Steccolini (2008) used geographic location as a proxy forthe socioeconomic characteristics of community environment which may influencethe decision making and policy formulation in communities. In Canada, provincesset the regulatory environment and influence the socioeconomic and political con-text in which municipalities operate. Consequently, it is reasonable to expect thatthe geographic location of a municipality will have an influence on the reportingpolicy of the municipality.
Accounting and reporting standards are constantly evolving, and organizationschange their annual and financial reporting policies and practices over time.For example, in their studies of accountability disclosures by universities, Coy,Tower, and Dixon (1993) and Nelson et al. (2003) find improvement in accountabil-ity and reporting over time, mainly as a result of external factors and an increasingawareness by universities of the needs of the community. Ryan, Stanley, and Nelson(2002) show a significant improvement of the extent of disclosure of information bylocal governments in Australia in the three-year period 1997 – 1999, and Kloot andMartin (2001) also report a perception by managers of local governments in Austra-lia that accountability to the wider community has increased over time. With thefirst SORP published by PSAB in 2004, it is reasonable to expect that, compared to2003, the quality of local government reporting in 2005 would be improved.
Therefore we would anticipate that the quality of reporting is better for munici-palities audited by a Big 4 auditor, is increasing with the size of the population, isdependent on geographic location, and is improving with time.
RESEARCH METHOD
Measuring the Level of Accountability: The Accountability Disclosure Index
The level of accountability is an abstract concept that cannot be measured directly.Hooks, Coy, and Davey (2002) and others have argued that measurement of disclo-sure levels in annual reports provides a surrogate indicator of a company’s level ofaccountability. The disclosure index methodology has been used in several studiesto determine the extent and quality of information included in corporate annualreports in general (Cooke, 1989), or in the context of investment in common equi-ties (Buzby, 1974), or in municipal bonds (Robbins and Austin, 1986). In the public
ANNUAL REPORTING AND ACCOUNTABILITY BY MUNICIPALITIES IN CANADA 203
AP Vol. 10 No. 3 — PC vol. 10, no 3 (2011)
sector, Coy et al. (1993), Nelson et al. (2003) and Coy and Dixon (2004) use disclo-sure indices in the context of accountability for universities; Ryan, Stanley, andNelson (2002) use an index to measure the level of disclosure in annual reports ofQueensland local government authorities; and Wei, Davey, and Coy (2008) also useone to measure the quality of reporting by museums.
A disclosure index is designed to measure the existence of a series of items andthe quality of the information presented for each item. By aggregating the scoresfor the several items it is possible to calculate a total score that suggests the quan-tity and quality of the disclosures. To arrive at the final disclosure index the scoresgiven to the individual items can be aggregated without taking into account theirlevel of importance (a simple or unweighted index), or they can be weighted accord-ing to their level of importance to the accountee (a weighted index) (Coy et al.,1993).
Several issues, namely measurement scale and subjectivity, have been posited aslimitations to the disclosure index methodology. The question of the level of mea-surement achieved by a disclosure index and consequently the appropriate statisticalanalysis has been discussed in the literature. In their review Marston and Shrives(1991: 200) conclude: ‘‘The arguments of statisticians seem to indicate that para-metric methods are permissible despite the fact that measurement on an intervalscale has probably not been achieved.’’ However, except for Coy and Dixon (2004),the studies mentioned above and conducted since the 1990s generally agree on anordinal scale measurement level which theoretically requires nonparametric statisti-cal analysis. Nevertheless, both parametric and nonparametric calculations and testshave been reported in the literature and are deemed reasonable (Coy, Tower, andDixon, 1994). Also, all the researchers mentioned above have recognized the issueof subjectivity, including the choice of items, scoring, aggregation of scores, andweights. After a thorough review of these issues Coy and Dixon (2004: 84) con-clude: ‘‘We believe that so-called subjectivity is something one has to both live withand take care to ameliorate.’’
Building the Disclosure Index and Scoring
Development of the disclosure index occurred through an iterative process whichstarted with the indices used by Buzby (1974) and by Coy et al. (1993, 1994) (MADindex). Several other documents were consulted including the CICA recommenda-tions for the public sector applicable to local governments (PS sections 1700, 1800,sections 2000 and 3000), SORP 1, the CICA Guidance on Management Discussionand Analysis, and the CICA Research Study Local Government Financial Report-ing (2001). The researchers reviewed the initial draft several times after preliminaryevaluations of annual reports to eliminate redundancy, to simplify some items andto detail others. Consistent with Coy and Dixon (2004), mandatory disclosures wereincluded since the extent of disclosure can vary. The draft disclosure index wassubmitted to two external auditors for their comments; their suggestions wereincorporated in the final version.
204 ACCOUNTING PERSPECTIVES / PERSPECTIVES COMPTABLES
AP Vol. 10 No. 3 — PC vol. 10, no 3 (2011)
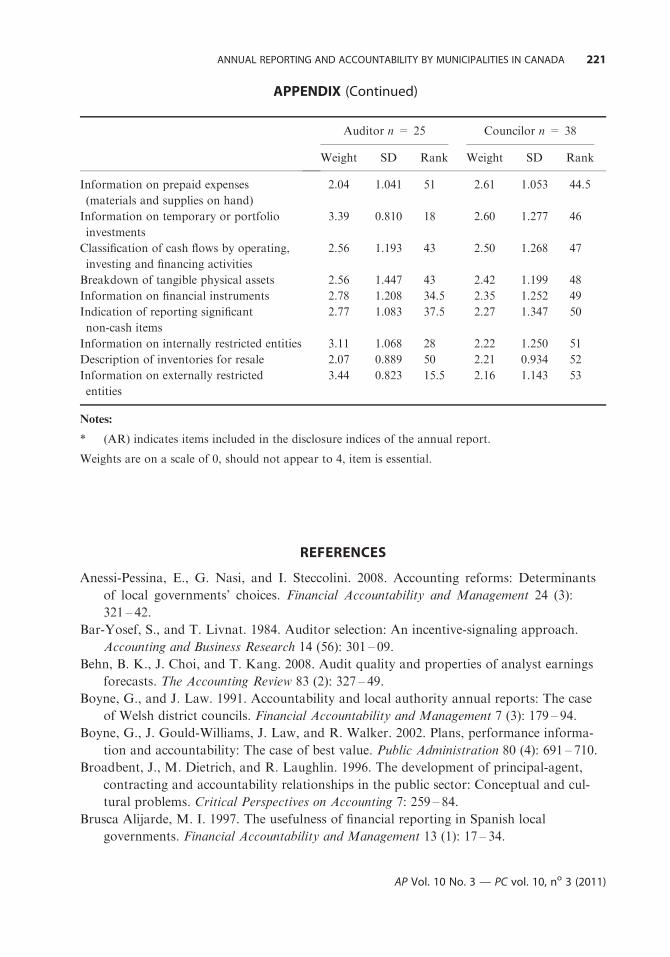
The final disclosure index consisted of a list of items commonly expected to beincluded in either the financial statements or the annual report of a Canadianmunicipality. A total of 53 main items were included as shown in the appendix.
Consistent with the MAD index, each annual report and financial statementwas examined and the items were scored on a scale of 0 to 5, as explainedbelow:
0 The annual report and financial statements contained no information; theitem was judged to be not applicable under some circumstances (for exampledisclosure of long term debt, if the municipality does not have any);
1 The annual report and financial statements contained no information; theitem was judged to be applicable under all circumstances (in the case ofreceivables, for example);
2 The annual report and financial statements contained some qualitative butno quantitative information or vice versa; the information disclosed wasjudged to be minimal and ⁄or of poor quality;
3 The annual report and financial statements contained some qualitativeand ⁄or quantitative information; the information disclosed lacked specificdetail and ⁄or the terminology lacked clarity and understandability;
4 The annual report and financial statements contained good qualitative andquantitative information; the information disclosed lacked some detail, butwas generally sufficient with clear and understandable terminology to pro-vide the reader with a good understanding of the item;
5 The annual report and financial statements contained excellent qualitativeand quantitative information; a reader would have a thorough understand-ing of the item.
For many items, such as disclosure of pension plan and employee benefits or oflong term debt, a complete assessment could only be made by evaluating a list ofsubitems. In such cases, each subitem was assigned a number from 1 to 5, with thesimple average of the subitems applied to the main item.
Standards and statements of ideal disclosure or best practice for each item andsubitem were defined, with criteria specified for each of the lesser scores. Hence, asindicated above, a score of 5 is representative of the ‘‘ideal disclosure’’, and lesserscores indicate disclosures lacking by varying degrees of detail and quality.
Three persons, a professor of accounting and two senior accounting students,participated in the scoring process, starting with a thorough discussion of each itemand subitems, then defining the above standards, best practices, and criteria forlesser scores, and finally scoring the reports. Each municipality was blindly assignedto one of the scorers and each item and subitem scored. Several steps were taken toincrease the validity of the scoring process: throughout the process, scorers oftenseparately evaluated the same municipality, compared their results, discussed and
ANNUAL REPORTING AND ACCOUNTABILITY BY MUNICIPALITIES IN CANADA 205
AP Vol. 10 No. 3 — PC vol. 10, no 3 (2011)
resolved discrepancies, and reviewed previous scores when appropriate; scorers alsoperiodically discussed and compared reports and scores of different municipalities.Furthermore, at the end of the 2003 and 2005 scoring process, one researcher choseat random 10 of the 53 items (19 percent) and rescored all the 2003 and 2005reports and statements. Any discrepancies between these second scores and theinitial scores assigned to these ten items were reviewed and resolved. There werediscrepancies in fewer than 2 percent of the scores, indicating good reliability of thescoring process.
Data Source and Collection
Because there was no intent to study the extent of distribution of the reports, twomethods were used to obtain the reports: direct mail request and a search of themunicipal websites. One hundred ninety-nine municipalities, including all Canadianmunicipalities with a population greater than 8,000, were asked to provide copies oftheir 20036 annual reports and financial statements. Reminder e-mails were sent tomunicipalities that did not reply and finally their websites were searched. Usefulinformation was obtained from 177 municipalities, including 50 annual reports andfinancial statements and 127 financial statements.
The same process was used to obtain copies of 2005 annual reports and finan-cial statements. Usable information was obtained from 171 municipalities, with58 copies of both annual report and audited financial statements. Furthermore, toensure that our information set was complete, the websites of all the municipalitieswere searched for the presence of a 2003 and a 2005 annual report.
In summary, the 2003 and 2005 reports of 168 municipalities were obtained.For 12 other municipalities information was obtained for only one year, nine for2003 and three for 2005. These 12 cases were excluded when making comparisonsbetween results for 2003 and for 2005.
Subjective Weighting
Weighting permits the recognition, in calculating the final disclosure index, thataccountee groups may attach a different level of importance to the items includedin the index (Coy and Dixon, 2004). To derive weightings for the 53 items in thedisclosure index, a questionnaire was sent to the external auditors and councilorsof each municipality. The questionnaire included the 53 items and asked therecipient to evaluate on a scale of 0 to 4 (Buzby, 1974; Hooks et al., 2002) theimportance of disclosing each item in the reports. These numbers are explained asfollows:
6. The year 2003 was chosen as a result of the publication of the Nelson, Banks, and Fisher article
and of a discussion of municipal reporting in an Advance Accounting class; with the publication
of SORP 1 in 2004 it was felt that the two-year gap would allow for a meaningful comparison.
206 ACCOUNTING PERSPECTIVES / PERSPECTIVES COMPTABLES
AP Vol. 10 No. 3 — PC vol. 10, no 3 (2011)
0 Item should not appear in the annual report or financial statements;
1 Item has little importance; its omission would not noticeably affect the com-prehension of the reports;
2 Item has some importance; its presence in the reports is suggested, but notessential;
3 Item is relevant and material; its presence in the reports is strongly suggested;
4 Item is relevant and material; its presence is essential to completely under-stand the reports.
An attempt was made to contact the external auditor(s) from each municipality.Four municipalities had more than one auditor. However, some municipalitiesshared the same auditor and in the case of 21 municipalities, auditor contact infor-mation was lacking. Consequently, the questionnaire was sent to 101 municipalauditors. Twenty-five auditors, representing a response rate of 24.75 percent,responded to the questionnaire. An attempt was also made to contact four munici-pal councilors from each of the 180 municipalities. Due to difficulties in obtaininglists and addresses of councilors from some municipalities, only 727 questionnaireswere sent. Thirty-eight councilors responded to the questionnaire, representing aresponse rate of 5.2 percent.
The weight assigned to each item in the disclosure index was calculated as theaverage of the weights given by the group of respondents to the item. Each item inthe disclosure index was thus assigned two weights: auditor and councilor.
Disclosure Scores
For each municipality, indices in percentage representing the quality of the financialstatements, the quality of the annual report, and the overall disclosure quality werecalculated. For the financial statements of each municipality an unweighted highestpossible disclosure total (UHPF) was determined by assigning a 5 to each item inthe list that had a score greater than 0, and summing up the numbers. An unweightedlowest possible disclosure total for the financial statements (ULPF) was determinedby assigning a 1 to each item on the list that had a score greater than 0, andsumming up the numbers. In effect, UHPF = 5 · ULPF. The actual unweighteddisclosure total for the financial statements (FST) was determined by summingthe score given to each item. An unweighted percentage disclosure index for thefinancial statements (UFS), representing the financial statement disclosure index,was then calculated for each municipality using the following formula:
UFS ¼ FST�ULPF
UHPF�ULPF
As a result, for each municipality, the unweighted financial statement disclosureindex represents the increase in its score from its minimum score, calculated as apercent of its maximum possible increase. Without this percentage calculation it
ANNUAL REPORTING AND ACCOUNTABILITY BY MUNICIPALITIES IN CANADA 207
AP Vol. 10 No. 3 — PC vol. 10, no 3 (2011)
would be impossible to compare municipalities and to analyze the results. Thissame process was applied to the annual report for each municipality to calculate anunweighted disclosure index for the annual report or UAR.
The weights, as determined by the average responses from each of the externalauditors and councilors, were multiplied by the corresponding score for each itemto arrive at weighted highest possible, weighted lowest possible, and weighted actualtotals for the financial statement and for the annual report of each municipality.Weighted disclosure indices were then calculated using the above formula for thefinancial statements (WFS) and for the annual reports (WAR). Each municipalitywas thus assigned six disclosure indices expressed in percentage, one unweightedand two weighted for the financial statements and one unweighted and twoweighted for the annual report.
Finally, for each municipality three overall disclosure indices, one unweighted(UDI) and two weighted (WDI), were calculated by assigning a 50 percent value tothe corresponding annual report disclosure index and a 50 percent value to thecorresponding financial statements disclosure index. Equal weighting reflectsthe importance of nonfinancial information to assess performance, as discussedpreviously, and the high ratings that councilors and auditors gave to the financialstatements and to the annual reports (see the Appendix).
RESULTS
Descriptive Statistics of the Municipalities
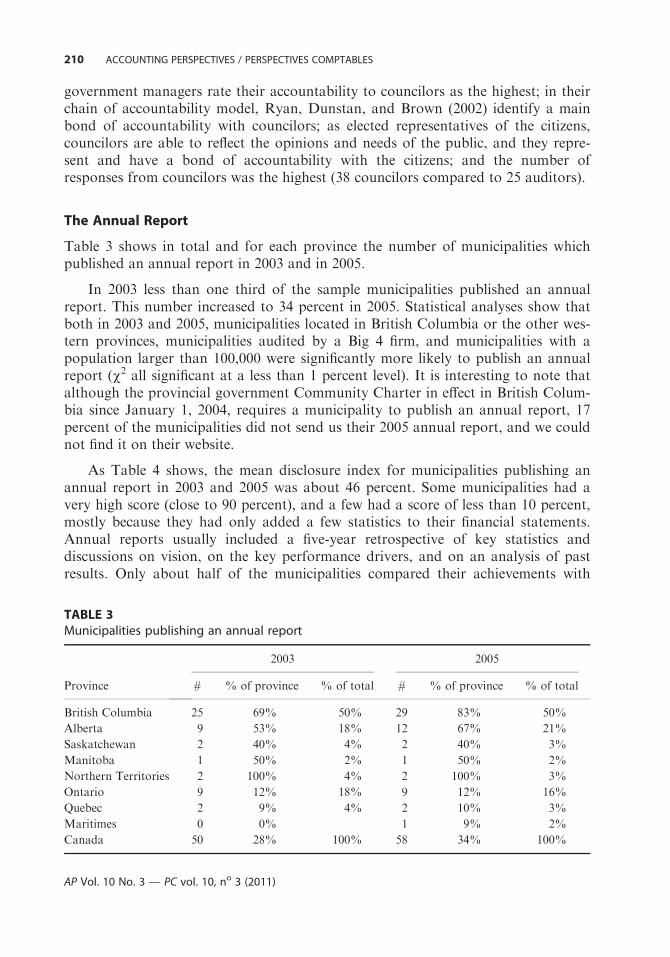
Tables 1 and 2 show descriptive information for the municipalities, including thenumber of inhabitants, the province, and the type of auditor. Provincial groupingas shown in Table 1 reflects generally the socioeconomic, political, and legal envi-ronments found in Canada. Statistical analyses show a significant positive correla-tion between the type of auditor and the size of the population of the municipality(Chi2 = 32.75, p = .000), but no correlation between the type of auditor and theprovince. As anticipated, larger municipalities were significantly more likely to beaudited by one of the Big 4 firms, regardless of the province.
The Weights
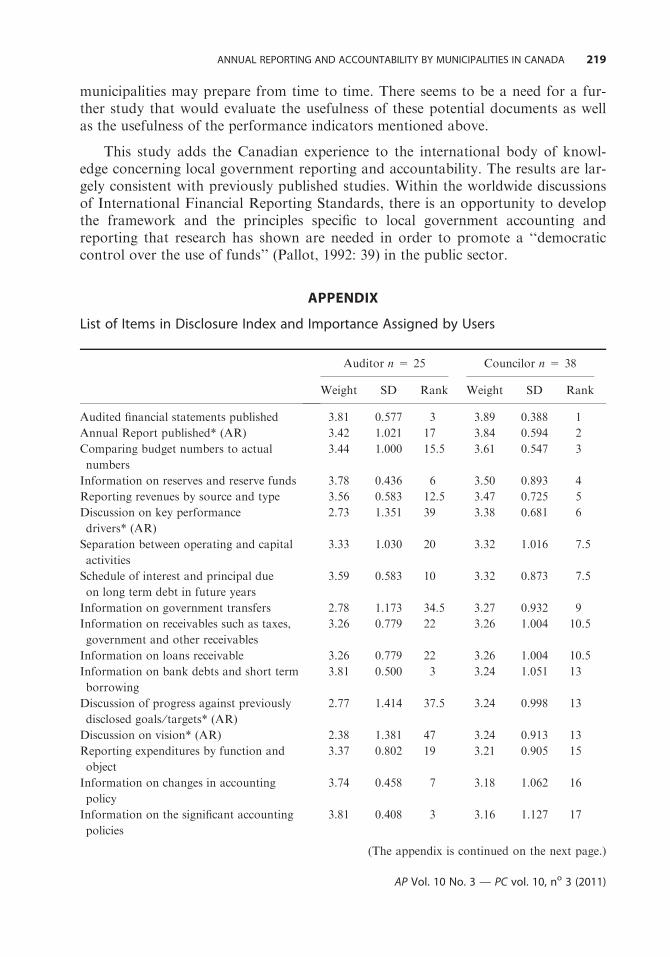
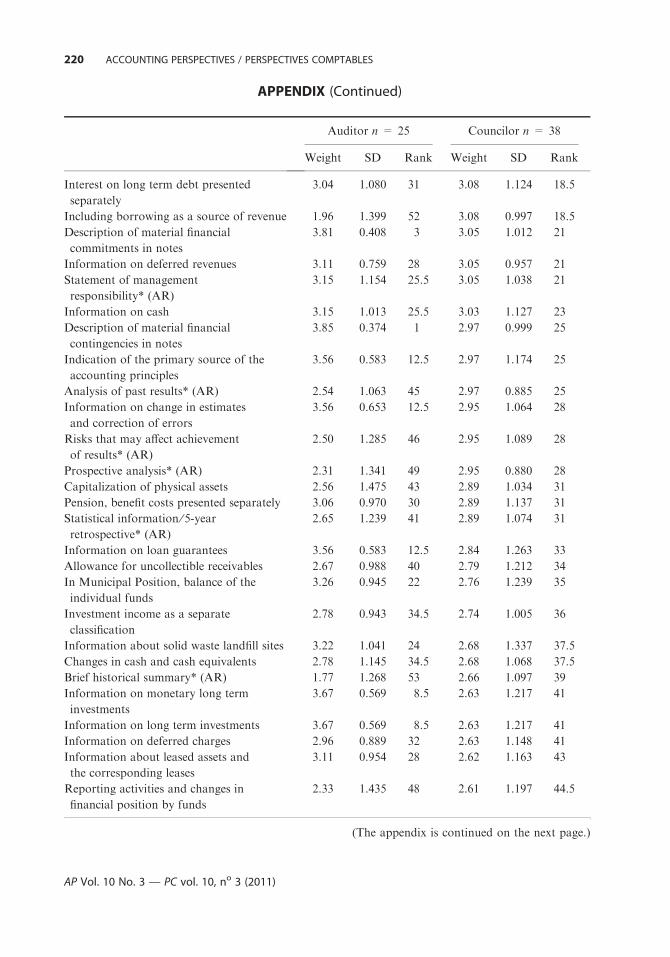
The Appendix shows the weights assigned by the two groups of potential users, audi-tors and councilors, and their ranking from most important (rank 1) to least (rank53). Correlation tests show significant correlations at the .01 level between the weightsassigned by the two groups to the items making up the index (Pearson coefficient.396, sig. .003; Spearman rho .393, sig. .004) or between the rankings (Pearson coeffi-cient .397, sig. .003; Spearman rho .393, sig. .004). Although as discussed previouslythe interests of auditors and councilors in the information potentially provided in anannual report diverge, it is interesting to note the convergence in the degree of impor-tance they attach to the items making up an annual report.
208 ACCOUNTING PERSPECTIVES / PERSPECTIVES COMPTABLES
AP Vol. 10 No. 3 — PC vol. 10, no 3 (2011)
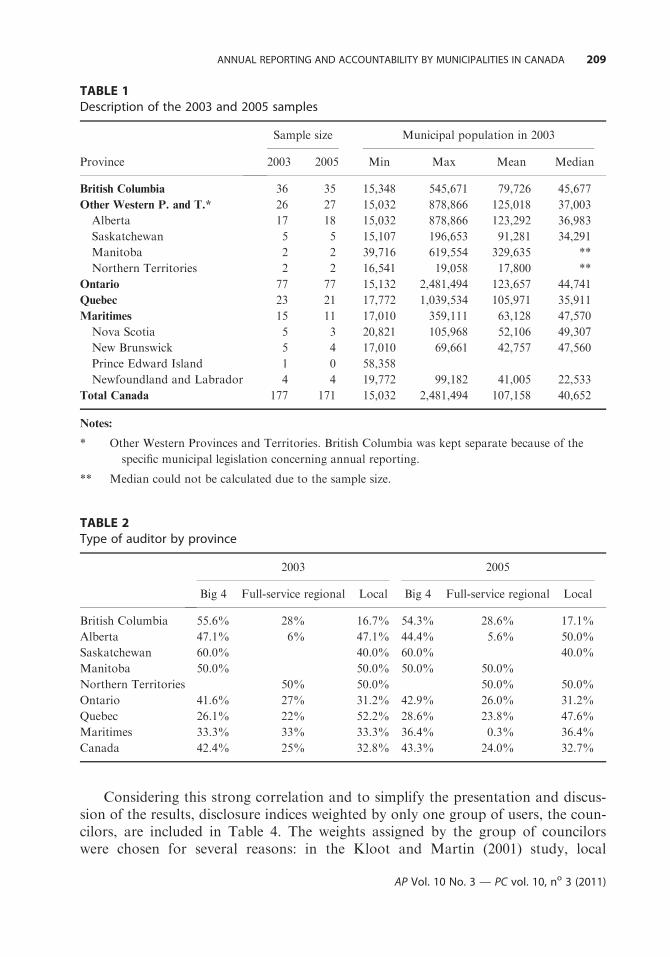
Considering this strong correlation and to simplify the presentation and discus-sion of the results, disclosure indices weighted by only one group of users, the coun-cilors, are included in Table 4. The weights assigned by the group of councilorswere chosen for several reasons: in the Kloot and Martin (2001) study, local
TABLE 2Type of auditor by province
2003 2005
Big 4 Full-service regional Local Big 4 Full-service regional Local
British Columbia 55.6% 28% 16.7% 54.3% 28.6% 17.1%
Alberta 47.1% 6% 47.1% 44.4% 5.6% 50.0%
Saskatchewan 60.0% 40.0% 60.0% 40.0%
Manitoba 50.0% 50.0% 50.0% 50.0%
Northern Territories 50% 50.0% 50.0% 50.0%
Ontario 41.6% 27% 31.2% 42.9% 26.0% 31.2%
Quebec 26.1% 22% 52.2% 28.6% 23.8% 47.6%
Maritimes 33.3% 33% 33.3% 36.4% 0.3% 36.4%
Canada 42.4% 25% 32.8% 43.3% 24.0% 32.7%
TABLE 1Description of the 2003 and 2005 samples
Province
Sample size Municipal population in 2003
2003 2005 Min Max Mean Median
British Columbia 36 35 15,348 545,671 79,726 45,677
Other Western P. and T.* 26 27 15,032 878,866 125,018 37,003
Alberta 17 18 15,032 878,866 123,292 36,983
Saskatchewan 5 5 15,107 196,653 91,281 34,291
Manitoba 2 2 39,716 619,554 329,635 **
Northern Territories 2 2 16,541 19,058 17,800 **
Ontario 77 77 15,132 2,481,494 123,657 44,741
Quebec 23 21 17,772 1,039,534 105,971 35,911
Maritimes 15 11 17,010 359,111 63,128 47,570
Nova Scotia 5 3 20,821 105,968 52,106 49,307
New Brunswick 5 4 17,010 69,661 42,757 47,560
Prince Edward Island 1 0 58,358
Newfoundland and Labrador 4 4 19,772 99,182 41,005 22,533
Total Canada 177 171 15,032 2,481,494 107,158 40,652
Notes:
* Other Western Provinces and Territories. British Columbia was kept separate because of the
specific municipal legislation concerning annual reporting.
** Median could not be calculated due to the sample size.
ANNUAL REPORTING AND ACCOUNTABILITY BY MUNICIPALITIES IN CANADA 209
AP Vol. 10 No. 3 — PC vol. 10, no 3 (2011)
government managers rate their accountability to councilors as the highest; in theirchain of accountability model, Ryan, Dunstan, and Brown (2002) identify a mainbond of accountability with councilors; as elected representatives of the citizens,councilors are able to reflect the opinions and needs of the public, and they repre-sent and have a bond of accountability with the citizens; and the number ofresponses from councilors was the highest (38 councilors compared to 25 auditors).
The Annual Report
Table 3 shows in total and for each province the number of municipalities whichpublished an annual report in 2003 and in 2005.
In 2003 less than one third of the sample municipalities published an annualreport. This number increased to 34 percent in 2005. Statistical analyses show thatboth in 2003 and 2005, municipalities located in British Columbia or the other wes-tern provinces, municipalities audited by a Big 4 firm, and municipalities with apopulation larger than 100,000 were significantly more likely to publish an annualreport (v2 all significant at a less than 1 percent level). It is interesting to note thatalthough the provincial government Community Charter in effect in British Colum-bia since January 1, 2004, requires a municipality to publish an annual report, 17percent of the municipalities did not send us their 2005 annual report, and we couldnot find it on their website.
As Table 4 shows, the mean disclosure index for municipalities publishing anannual report in 2003 and 2005 was about 46 percent. Some municipalities had avery high score (close to 90 percent), and a few had a score of less than 10 percent,mostly because they had only added a few statistics to their financial statements.Annual reports usually included a five-year retrospective of key statistics anddiscussions on vision, on the key performance drivers, and on an analysis of pastresults. Only about half of the municipalities compared their achievements with
TABLE 3Municipalities publishing an annual report
Province
2003 2005
# % of province % of total # % of province % of total
British Columbia 25 69% 50% 29 83% 50%
Alberta 9 53% 18% 12 67% 21%
Saskatchewan 2 40% 4% 2 40% 3%
Manitoba 1 50% 2% 1 50% 2%
Northern Territories 2 100% 4% 2 100% 3%
Ontario 9 12% 18% 9 12% 16%
Quebec 2 9% 4% 2 10% 3%
Maritimes 0 0% 1 9% 2%
Canada 50 28% 100% 58 34% 100%
210 ACCOUNTING PERSPECTIVES / PERSPECTIVES COMPTABLES
AP Vol. 10 No. 3 — PC vol. 10, no 3 (2011)
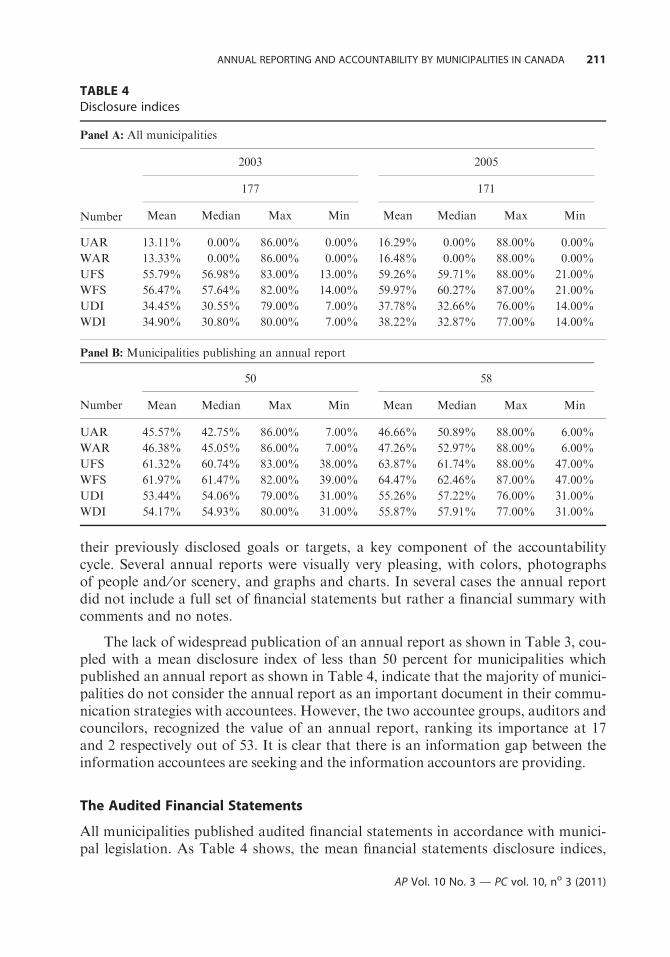
their previously disclosed goals or targets, a key component of the accountabilitycycle. Several annual reports were visually very pleasing, with colors, photographsof people and ⁄or scenery, and graphs and charts. In several cases the annual reportdid not include a full set of financial statements but rather a financial summary withcomments and no notes.
The lack of widespread publication of an annual report as shown in Table 3, cou-pled with a mean disclosure index of less than 50 percent for municipalities whichpublished an annual report as shown in Table 4, indicate that the majority of munici-palities do not consider the annual report as an important document in their commu-nication strategies with accountees. However, the two accountee groups, auditors andcouncilors, recognized the value of an annual report, ranking its importance at 17and 2 respectively out of 53. It is clear that there is an information gap between theinformation accountees are seeking and the information accountors are providing.
The Audited Financial Statements
All municipalities published audited financial statements in accordance with munici-pal legislation. As Table 4 shows, the mean financial statements disclosure indices,
TABLE 4Disclosure indices
Panel A: All municipalities
2003 2005
Number
177 171
Mean Median Max Min Mean Median Max Min
UAR 13.11% 0.00% 86.00% 0.00% 16.29% 0.00% 88.00% 0.00%
WAR 13.33% 0.00% 86.00% 0.00% 16.48% 0.00% 88.00% 0.00%
UFS 55.79% 56.98% 83.00% 13.00% 59.26% 59.71% 88.00% 21.00%
WFS 56.47% 57.64% 82.00% 14.00% 59.97% 60.27% 87.00% 21.00%
UDI 34.45% 30.55% 79.00% 7.00% 37.78% 32.66% 76.00% 14.00%
WDI 34.90% 30.80% 80.00% 7.00% 38.22% 32.87% 77.00% 14.00%
Panel B: Municipalities publishing an annual report
Number
50 58
Mean Median Max Min Mean Median Max Min
UAR 45.57% 42.75% 86.00% 7.00% 46.66% 50.89% 88.00% 6.00%
WAR 46.38% 45.05% 86.00% 7.00% 47.26% 52.97% 88.00% 6.00%
UFS 61.32% 60.74% 83.00% 38.00% 63.87% 61.74% 88.00% 47.00%
WFS 61.97% 61.47% 82.00% 39.00% 64.47% 62.46% 87.00% 47.00%
UDI 53.44% 54.06% 79.00% 31.00% 55.26% 57.22% 76.00% 31.00%
WDI 54.17% 54.93% 80.00% 31.00% 55.87% 57.91% 77.00% 31.00%
ANNUAL REPORTING AND ACCOUNTABILITY BY MUNICIPALITIES IN CANADA 211
AP Vol. 10 No. 3 — PC vol. 10, no 3 (2011)
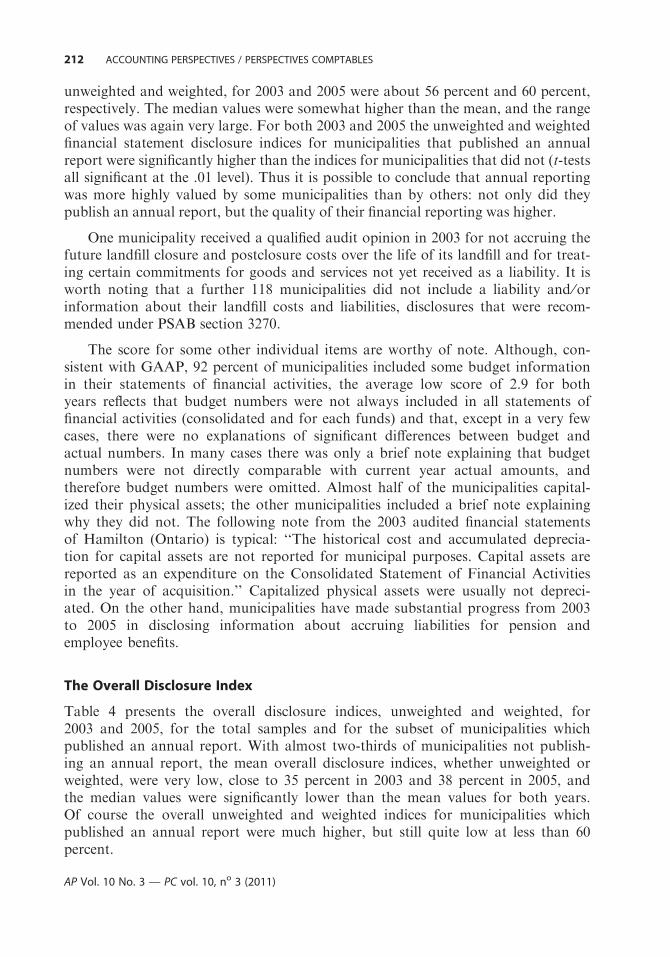
unweighted and weighted, for 2003 and 2005 were about 56 percent and 60 percent,respectively. The median values were somewhat higher than the mean, and the rangeof values was again very large. For both 2003 and 2005 the unweighted and weightedfinancial statement disclosure indices for municipalities that published an annualreport were significantly higher than the indices for municipalities that did not (t-testsall significant at the .01 level). Thus it is possible to conclude that annual reportingwas more highly valued by some municipalities than by others: not only did theypublish an annual report, but the quality of their financial reporting was higher.
One municipality received a qualified audit opinion in 2003 for not accruing thefuture landfill closure and postclosure costs over the life of its landfill and for treat-ing certain commitments for goods and services not yet received as a liability. It isworth noting that a further 118 municipalities did not include a liability and ⁄orinformation about their landfill costs and liabilities, disclosures that were recom-mended under PSAB section 3270.
The score for some other individual items are worthy of note. Although, con-sistent with GAAP, 92 percent of municipalities included some budget informationin their statements of financial activities, the average low score of 2.9 for bothyears reflects that budget numbers were not always included in all statements offinancial activities (consolidated and for each funds) and that, except in a very fewcases, there were no explanations of significant differences between budget andactual numbers. In many cases there was only a brief note explaining that budgetnumbers were not directly comparable with current year actual amounts, andtherefore budget numbers were omitted. Almost half of the municipalities capital-ized their physical assets; the other municipalities included a brief note explainingwhy they did not. The following note from the 2003 audited financial statementsof Hamilton (Ontario) is typical: ‘‘The historical cost and accumulated deprecia-tion for capital assets are not reported for municipal purposes. Capital assets arereported as an expenditure on the Consolidated Statement of Financial Activitiesin the year of acquisition.’’ Capitalized physical assets were usually not depreci-ated. On the other hand, municipalities have made substantial progress from 2003to 2005 in disclosing information about accruing liabilities for pension andemployee benefits.
The Overall Disclosure Index
Table 4 presents the overall disclosure indices, unweighted and weighted, for2003 and 2005, for the total samples and for the subset of municipalities whichpublished an annual report. With almost two-thirds of municipalities not publish-ing an annual report, the mean overall disclosure indices, whether unweighted orweighted, were very low, close to 35 percent in 2003 and 38 percent in 2005, andthe median values were significantly lower than the mean values for both years.Of course the overall unweighted and weighted indices for municipalities whichpublished an annual report were much higher, but still quite low at less than 60percent.
212 ACCOUNTING PERSPECTIVES / PERSPECTIVES COMPTABLES
AP Vol. 10 No. 3 — PC vol. 10, no 3 (2011)
Comparison Between Weighted and Unweighted Indices
Table 4 shows that weighted and unweighted disclosure indices for each of theannual reports, financial statements and overall have very similar values, and statis-tical analyses show no significant differences. Both Pearson and Spearman rho cal-culations comparing the several unweighted and weighted indices showed significantcorrelations at the .01 level. Although the weighting methodology used here differedsomewhat from the one used by Coy and Dixon (2004), the conclusion that disclo-sure indices do not need to include a weight for each item is the same. Conse-quently, only the unweighted indices are included in Table 5 and in the statisticalresults presented below.
Statistical Analysis: Influence on the Indices of the Factors Province, PopulationSize, Type of Auditor, and Time
Table 5 shows for all the municipalities the results of statistical analyses to determinewhether the first three factors influenced the quality of the published information.
Province of Residence
Both parametric (analysis of variance) and nonparametric (Kruskal Wallis) testsshow that the means of all the indices were significantly different depending on theprovince in which the municipality resides. Tukey’s post hoc tests, conducted todetermine significant differences at the 5 percent level in the means of the indicesfor the several groups,7 reveals some interesting findings. Quality of reporting forthe annual report and overall (UAR and UDI) was significantly highest in BritishColumbia and in the other Western provinces; it was similar in Ontario andQuebec. This is not surprising, since the municipalities in Western Canada weremore likely to have published an annual report. Quebec and the Western provinceshad the highest quality of financial reporting (UFS). All indices for Ontario weresignificantly lower than the corresponding indices for British Columbia and theother Western provinces, except for 2005 UFS which was not significantly differentfrom 2005 UFS in British Columbia. Quality of reporting across all indices for themaritime provinces was significantly the lowest, except for no significant differencewith Ontario for the overall indices. These findings confirm the hypothesis thatgeographic location had an influence on the quality of the published information.
Population Size
Because of the skewed distribution of the population of the municipalities, the non-parametric Spearman’s rho test was used to determine if any correlation existedbetween the several indices and the size of the population. The results show a strongsignificant correlation between the size of the population of the municipality and
7. The test results are available from the authors.
ANNUAL REPORTING AND ACCOUNTABILITY BY MUNICIPALITIES IN CANADA 213
AP Vol. 10 No. 3 — PC vol. 10, no 3 (2011)
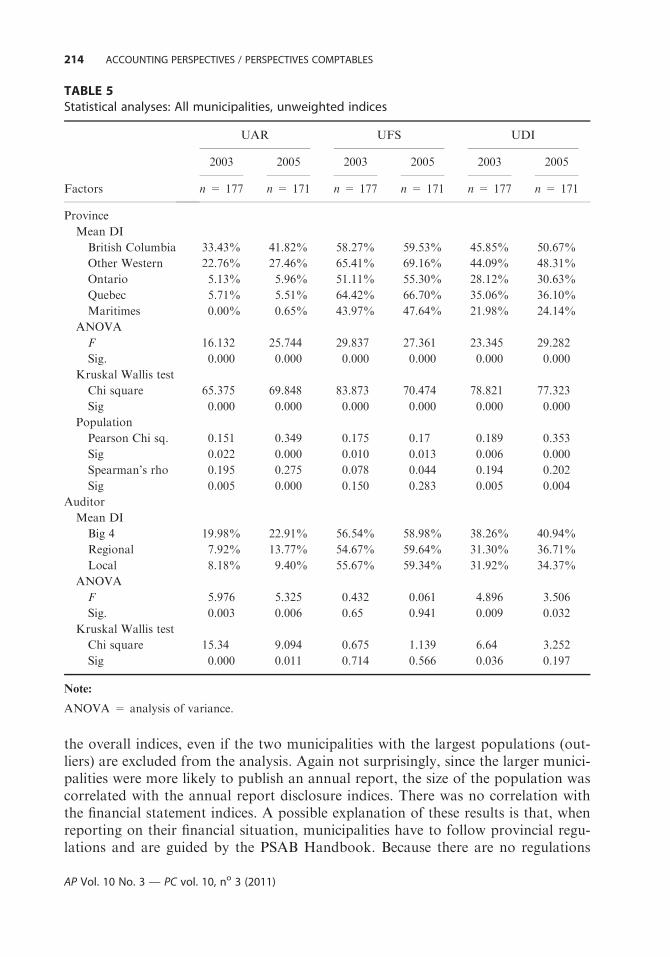
the overall indices, even if the two municipalities with the largest populations (out-liers) are excluded from the analysis. Again not surprisingly, since the larger munici-palities were more likely to publish an annual report, the size of the population wascorrelated with the annual report disclosure indices. There was no correlation withthe financial statement indices. A possible explanation of these results is that, whenreporting on their financial situation, municipalities have to follow provincial regu-lations and are guided by the PSAB Handbook. Because there are no regulations
TABLE 5Statistical analyses: All municipalities, unweighted indices
Factors
UAR UFS UDI
2003 2005 2003 2005 2003 2005
n = 177 n = 171 n = 177 n = 171 n = 177 n = 171
Province
Mean DI
British Columbia 33.43% 41.82% 58.27% 59.53% 45.85% 50.67%
Other Western 22.76% 27.46% 65.41% 69.16% 44.09% 48.31%
Ontario 5.13% 5.96% 51.11% 55.30% 28.12% 30.63%
Quebec 5.71% 5.51% 64.42% 66.70% 35.06% 36.10%
Maritimes 0.00% 0.65% 43.97% 47.64% 21.98% 24.14%
ANOVA
F 16.132 25.744 29.837 27.361 23.345 29.282
Sig. 0.000 0.000 0.000 0.000 0.000 0.000
Kruskal Wallis test
Chi square 65.375 69.848 83.873 70.474 78.821 77.323
Sig 0.000 0.000 0.000 0.000 0.000 0.000
Population
Pearson Chi sq. 0.151 0.349 0.175 0.17 0.189 0.353
Sig 0.022 0.000 0.010 0.013 0.006 0.000
Spearman’s rho 0.195 0.275 0.078 0.044 0.194 0.202
Sig 0.005 0.000 0.150 0.283 0.005 0.004
Auditor
Mean DI
Big 4 19.98% 22.91% 56.54% 58.98% 38.26% 40.94%
Regional 7.92% 13.77% 54.67% 59.64% 31.30% 36.71%
Local 8.18% 9.40% 55.67% 59.34% 31.92% 34.37%
ANOVA
F 5.976 5.325 0.432 0.061 4.896 3.506
Sig. 0.003 0.006 0.65 0.941 0.009 0.032
Kruskal Wallis test
Chi square 15.34 9.094 0.675 1.139 6.64 3.252
Sig 0.000 0.011 0.714 0.566 0.036 0.197
Note:
ANOVA = analysis of variance.
214 ACCOUNTING PERSPECTIVES / PERSPECTIVES COMPTABLES
AP Vol. 10 No. 3 — PC vol. 10, no 3 (2011)
and detailed guidance for publishing an annual report, only the larger municipali-ties have the resources and the expertise to publish annual reports. Also, perhaps,as suggested by Stanley et al. (2008), smaller municipalities have a different percep-tion of accountability and of the value of a comprehensive annual report.
Type of Auditor
Results of both parametric and nonparametric tests show that the mean annualreport disclosure indices for 2003 and 2005 and the mean overall disclosure indicesfor 2003 were significantly different for the three types of auditors. These findingsmay result from the significant correlation between the size of the population andthe type of auditors reported above.
Table 6 shows comparable tests as those reported in Table 5 for municipalities thatpublished an annual report (50 in 2003 and 58 in 2005). Results indicate that the meandisclosure indices for the financial statements were significantly different for the factorprovince of residence. Considering that municipal financial reporting is prescribed byprovincial municipal acts, this result is not surprising and it supports the hypothesisthat the regulatory and political environment influences the quality of reporting.
Time
For the 168 municipalities that provided information for both years, differences inthe means of the several indices between 2003 and 2005 were tested using theparametric t-test. The results show significant improvements in mean financialstatement and overall disclosure indices in 2005 compared to 2003 (UAR, t =1.957, p = .052; UFS, t = 6.289, p = .000; UDI, t = 4.122, p = .000). Theseresults were confirmed using the Wilcoxon signed rank test for the financial state-ment and overall disclosure indices.8 These findings confirm what others havefound of improvement in reporting and accountability over time.
In summary, the provincial location of a municipality had an influence onthe quality of information published: the mean of all the indices for the differentregions were significantly different; British Columbia and the other Westernprovinces provided higher level of disclosure and the maritime provinces pro-vided the lowest level; municipalities in Western Canada were also more likely topublish an annual report; and, for the municipalities which did publish, themean financial statement disclosure for the five groups were different. Annualreport indices were significantly different in terms of population size and type ofauditor. These differences are likely to result from the differences in the likeli-hood to publish an annual report and not from the quantity and quality of thedisclosures in the report. The significant differences found on the overall indicesin term of these two factors may also likely derive from the decision of whetheror not to publish an annual report. Thus, without legislation the majority of
8. Too many annual report indices had a value of 0 for the test to be valid.
ANNUAL REPORTING AND ACCOUNTABILITY BY MUNICIPALITIES IN CANADA 215
AP Vol. 10 No. 3 — PC vol. 10, no 3 (2011)
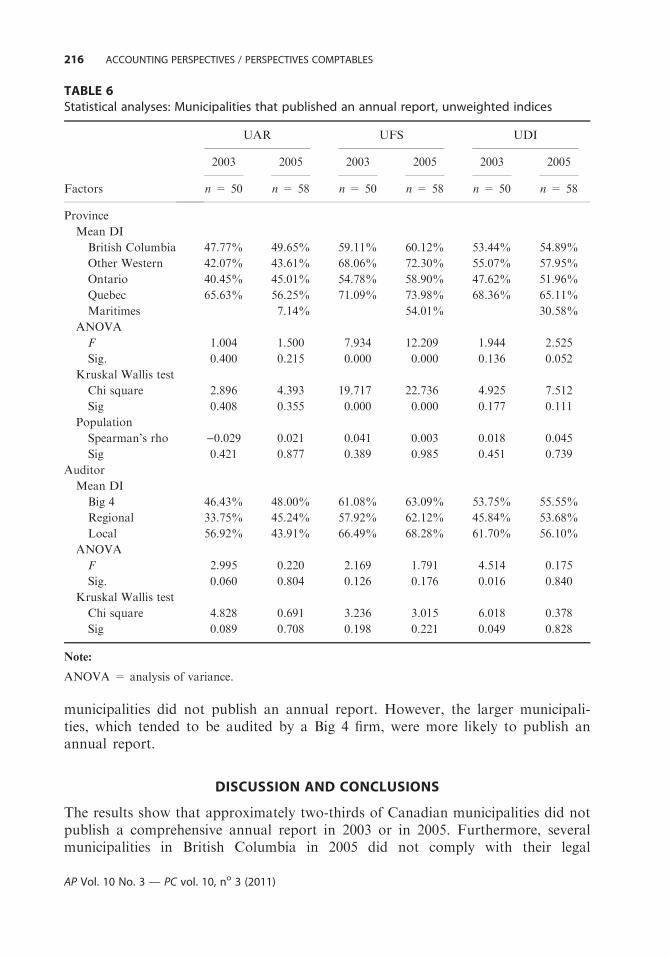
municipalities did not publish an annual report. However, the larger municipali-ties, which tended to be audited by a Big 4 firm, were more likely to publish anannual report.
DISCUSSION AND CONCLUSIONS
The results show that approximately two-thirds of Canadian municipalities did notpublish a comprehensive annual report in 2003 or in 2005. Furthermore, severalmunicipalities in British Columbia in 2005 did not comply with their legal
TABLE 6Statistical analyses: Municipalities that published an annual report, unweighted indices
Factors
UAR UFS UDI
2003 2005 2003 2005 2003 2005
n = 50 n = 58 n = 50 n = 58 n = 50 n = 58
Province
Mean DI
British Columbia 47.77% 49.65% 59.11% 60.12% 53.44% 54.89%
Other Western 42.07% 43.61% 68.06% 72.30% 55.07% 57.95%
Ontario 40.45% 45.01% 54.78% 58.90% 47.62% 51.96%
Quebec 65.63% 56.25% 71.09% 73.98% 68.36% 65.11%
Maritimes 7.14% 54.01% 30.58%
ANOVA
F 1.004 1.500 7.934 12.209 1.944 2.525
Sig. 0.400 0.215 0.000 0.000 0.136 0.052
Kruskal Wallis test
Chi square 2.896 4.393 19.717 22.736 4.925 7.512
Sig 0.408 0.355 0.000 0.000 0.177 0.111
Population
Spearman’s rho )0.029 0.021 0.041 0.003 0.018 0.045
Sig 0.421 0.877 0.389 0.985 0.451 0.739
Auditor
Mean DI
Big 4 46.43% 48.00% 61.08% 63.09% 53.75% 55.55%
Regional 33.75% 45.24% 57.92% 62.12% 45.84% 53.68%
Local 56.92% 43.91% 66.49% 68.28% 61.70% 56.10%
ANOVA
F 2.995 0.220 2.169 1.791 4.514 0.175
Sig. 0.060 0.804 0.126 0.176 0.016 0.840
Kruskal Wallis test
Chi square 4.828 0.691 3.236 3.015 6.018 0.378
Sig 0.089 0.708 0.198 0.221 0.049 0.828
Note:
ANOVA = analysis of variance.
216 ACCOUNTING PERSPECTIVES / PERSPECTIVES COMPTABLES
AP Vol. 10 No. 3 — PC vol. 10, no 3 (2011)
requirement to publish an annual report. Further studies are warranted to deter-mine whether the smaller municipalities have adequate resources to publish anannual report and to uncover the other factors that can explain why many munici-pal accountors did not (and perhaps still do not) use this form of communicationwith their accountees. Because the disclosure indices measure the existence of anitem and the quality of the information presented, mean and median overall indicesof below 40 percent for all municipalities and below 60 percent for municipalitiespublishing an annual report show that improvement in annual reporting in bothquantity and quality is needed. Considering that there is agreement in the literatureto view the annual report as an important tool to discharge accountability, it isappropriate to question how well Canadian municipalities discharged their account-ability responsibilities. Compared to municipalities which did not publish an annualreport, the ones which did, either because of legislation or by choice, also publishedhigher-quality financial statements, so perhaps they were more aware of theiraccountability responsibilities and assigned greater value to the annual report. Fur-ther research to probe the accountability perspectives and motivation of these twogroups of managers could shed light on several questions: Are municipal managerspublishing these reports to meet their accountability responsibilities or for someother objectives? What importance do they assign to a comprehensive report com-pared to the importance they assign to financial statements? How do they perceivetheir accountability to different groups of stakeholders and what form of account-ability reporting do they use? It would also be interesting to see if the increase innumber and quality of the annual reports in 2005 compared to 2003 has continued.Also, direct evaluation of published reports by potential accountee groups wouldprovide the information needed to enhance the accountability relationship andimprove the accountability cycle.
As in Italy (Steccolini, 2004), local governments in Canada for the most partcomplied with the law, and consequently most published only the audited financialstatements required by their provincial legislation. There were several examples ofnoncompliance with recommended standards, a situation that Lin, Baxter, andMurphy (1993) encountered in their study of reporting by Canada’s senior govern-ments. This noncompliance problem was also reported by Jones and Pendlebury(2004) in their 1997 ⁄1998 study of reporting by English local authorities.
Several researchers, for example Pallot (1992) and Mayston (1992) and otherssince (Christensen and Skærbæk, 2007; Stanley et al., 2008), have argued about thenecessity to develop new frameworks for accountability reporting, including amodel for annual reporting in the public sector based on a conceptual frameworkthat takes into account the fundamental characteristics of the accountees and ofgovernments (no profit motivation; objective of delivering services for societalwell-being; compulsory financing by citizens without monetary return; democraticenvironment) and that minimizes the potential conflicts of interest between theaccountor and the accountee. Considering that the mean and the median of theoverall quality of the annual information published by Canadian municipalities in2003 and 2005 is below 40 percent, it is appropriate to add the Canadian experience
ANNUAL REPORTING AND ACCOUNTABILITY BY MUNICIPALITIES IN CANADA 217
AP Vol. 10 No. 3 — PC vol. 10, no 3 (2011)
to the argument. International, comparative, and longitudinal studies are neededthat will provide the important input that is required for accountability innovation.The Statements of Recommended Practice published in Canada9 are intended toprovide the framework that guides Canadian municipalities. Perhaps the small butsignificant improvement reported in 2005 compared to 2003 can be attributed inpart to the publication of SORP1. Only further longitudinal research in Canadacan show whether SORPs 1, 2, and 4 have led to significant and sustained improve-ment in accountability reporting.
The results of this study also underline the importance of placing the frameworkfor public sector accountability reporting within the regulatory and political contextin which municipalities operate. Such a framework should not be bound in legalisticand prescriptive terms that result in documents that are costly to produce and thatare of little value to the accountees. It should also recognize the limitation inresources and expertise of the smaller municipalities, and it should promote innova-tion in reporting so that municipalities have incentives to experiment and toimprove on their communication with their stakeholders. With the Internet andmodern technology, the annual report may be one of several means at the disposalof a municipality to encourage participative government.
The Canadian environment for local reporting has seen some changes since thisstudy took place. As reported above, PSAB has now mandated full accrualaccounting for local governments and has issued three more Statements ofRecommended Practice. Innovation is also happening at the regional level. Forexample, in Ontario several municipalities have formed the Ontario MunicipalCAO’s Benchmarking Initiative, and they have published on their website an easilyaccessible annual comparative report of several performance indicators. Furtherresearch is warranted to determine whether such incremental changes will bringabout the improvement in accountability reporting that this study has identified asneeded.
The main limitation of this study lies in the subjectivity of the disclosure indexmethodology, including the content of the index, and the scoring process. To limitthis subjectivity the selection of items for the index was based on disclosure indicesused by others in previous similar studies, and on the Canadian handbooks thatcompiled all recommendations and guidelines to be used by local governments. Aswell, the scoring process included several steps to ensure reliability. However, scor-ing was done by individuals with a background in accounting who consequentlydid not represent the general citizen population and may have biased the scores. Afurther limitation in calculating a weighted index was the low response rate fromcouncilors and from auditors. Also this study is focused on the annual report as thekey accountability document and has ignored other informal documents that
9. SORP 1, Financial Statements Discussion and Analysis, published in June 2004; SORP 2, Public
Performance Reporting, published in September 2006; SORP 3, Assessment of Capital Assets,
published in November 2008; and SORP 4, Indicators of Financial Condition, published in May
2009.
218 ACCOUNTING PERSPECTIVES / PERSPECTIVES COMPTABLES
AP Vol. 10 No. 3 — PC vol. 10, no 3 (2011)
municipalities may prepare from time to time. There seems to be a need for a fur-ther study that would evaluate the usefulness of these potential documents as wellas the usefulness of the performance indicators mentioned above.
This study adds the Canadian experience to the international body of knowl-edge concerning local government reporting and accountability. The results are lar-gely consistent with previously published studies. Within the worldwide discussionsof International Financial Reporting Standards, there is an opportunity to developthe framework and the principles specific to local government accounting andreporting that research has shown are needed in order to promote a ‘‘democraticcontrol over the use of funds’’ (Pallot, 1992: 39) in the public sector.
APPENDIX
List of Items in Disclosure Index and Importance Assigned by Users
Auditor n = 25 Councilor n = 38
Weight SD Rank Weight SD Rank
Audited financial statements published 3.81 0.577 3 3.89 0.388 1
Annual Report published* (AR) 3.42 1.021 17 3.84 0.594 2
Comparing budget numbers to actual
numbers
3.44 1.000 15.5 3.61 0.547 3
Information on reserves and reserve funds 3.78 0.436 6 3.50 0.893 4
Reporting revenues by source and type 3.56 0.583 12.5 3.47 0.725 5
Discussion on key performance
drivers* (AR)
2.73 1.351 39 3.38 0.681 6
Separation between operating and capital
activities
3.33 1.030 20 3.32 1.016 7.5
Schedule of interest and principal due
on long term debt in future years
3.59 0.583 10 3.32 0.873 7.5
Information on government transfers 2.78 1.173 34.5 3.27 0.932 9
Information on receivables such as taxes,
government and other receivables
3.26 0.779 22 3.26 1.004 10.5
Information on loans receivable 3.26 0.779 22 3.26 1.004 10.5
Information on bank debts and short term
borrowing
3.81 0.500 3 3.24 1.051 13
Discussion of progress against previously
disclosed goals ⁄ targets* (AR)
2.77 1.414 37.5 3.24 0.998 13
Discussion on vision* (AR) 2.38 1.381 47 3.24 0.913 13
Reporting expenditures by function and
object
3.37 0.802 19 3.21 0.905 15
Information on changes in accounting
policy
3.74 0.458 7 3.18 1.062 16
Information on the significant accounting
policies
3.81 0.408 3 3.16 1.127 17
(The appendix is continued on the next page.)
ANNUAL REPORTING AND ACCOUNTABILITY BY MUNICIPALITIES IN CANADA 219
AP Vol. 10 No. 3 — PC vol. 10, no 3 (2011)
APPENDIX (Continued)
Auditor n = 25 Councilor n = 38
Weight SD Rank Weight SD Rank
Interest on long term debt presented
separately
3.04 1.080 31 3.08 1.124 18.5
Including borrowing as a source of revenue 1.96 1.399 52 3.08 0.997 18.5
Description of material financial
commitments in notes
3.81 0.408 3 3.05 1.012 21
Information on deferred revenues 3.11 0.759 28 3.05 0.957 21
Statement of management
responsibility* (AR)
3.15 1.154 25.5 3.05 1.038 21
Information on cash 3.15 1.013 25.5 3.03 1.127 23
Description of material financial
contingencies in notes
3.85 0.374 1 2.97 0.999 25
Indication of the primary source of the
accounting principles
3.56 0.583 12.5 2.97 1.174 25
Analysis of past results* (AR) 2.54 1.063 45 2.97 0.885 25
Information on change in estimates
and correction of errors
3.56 0.653 12.5 2.95 1.064 28
Risks that may affect achievement
of results* (AR)
2.50 1.285 46 2.95 1.089 28
Prospective analysis* (AR) 2.31 1.341 49 2.95 0.880 28
Capitalization of physical assets 2.56 1.475 43 2.89 1.034 31
Pension, benefit costs presented separately 3.06 0.970 30 2.89 1.137 31
Statistical information ⁄ 5-yearretrospective* (AR)
2.65 1.239 41 2.89 1.074 31
Information on loan guarantees 3.56 0.583 12.5 2.84 1.263 33
Allowance for uncollectible receivables 2.67 0.988 40 2.79 1.212 34
In Municipal Position, balance of the
individual funds
3.26 0.945 22 2.76 1.239 35
Investment income as a separate
classification
2.78 0.943 34.5 2.74 1.005 36
Information about solid waste landfill sites 3.22 1.041 24 2.68 1.337 37.5
Changes in cash and cash equivalents 2.78 1.145 34.5 2.68 1.068 37.5
Brief historical summary* (AR) 1.77 1.268 53 2.66 1.097 39
Information on monetary long term
investments
3.67 0.569 8.5 2.63 1.217 41
Information on long term investments 3.67 0.569 8.5 2.63 1.217 41
Information on deferred charges 2.96 0.889 32 2.63 1.148 41
Information about leased assets and
the corresponding leases
3.11 0.954 28 2.62 1.163 43
Reporting activities and changes in
financial position by funds
2.33 1.435 48 2.61 1.197 44.5
(The appendix is continued on the next page.)
220 ACCOUNTING PERSPECTIVES / PERSPECTIVES COMPTABLES
AP Vol. 10 No. 3 — PC vol. 10, no 3 (2011)
APPENDIX (Continued)
Auditor n = 25 Councilor n = 38
Weight SD Rank Weight SD Rank
Information on prepaid expenses
(materials and supplies on hand)
2.04 1.041 51 2.61 1.053 44.5
Information on temporary or portfolio
investments
3.39 0.810 18 2.60 1.277 46
Classification of cash flows by operating,
investing and financing activities
2.56 1.193 43 2.50 1.268 47
Breakdown of tangible physical assets 2.56 1.447 43 2.42 1.199 48
Information on financial instruments 2.78 1.208 34.5 2.35 1.252 49
Indication of reporting significant
non-cash items
2.77 1.083 37.5 2.27 1.347 50
Information on internally restricted entities 3.11 1.068 28 2.22 1.250 51
Description of inventories for resale 2.07 0.889 50 2.21 0.934 52
Information on externally restricted
entities
3.44 0.823 15.5 2.16 1.143 53
Notes:
* (AR) indicates items included in the disclosure indices of the annual report.
Weights are on a scale of 0, should not appear to 4, item is essential.
REFERENCES
Anessi-Pessina, E., G. Nasi, and I. Steccolini. 2008. Accounting reforms: Determinants
of local governments’ choices. Financial Accountability and Management 24 (3):
321 – 42.
Bar-Yosef, S., and T. Livnat. 1984. Auditor selection: An incentive-signaling approach.
Accounting and Business Research 14 (56): 301 – 09.
Behn, B. K., J. Choi, and T. Kang. 2008. Audit quality and properties of analyst earnings
forecasts. The Accounting Review 83 (2): 327 – 49.
Boyne, G., and J. Law. 1991. Accountability and local authority annual reports: The case
of Welsh district councils. Financial Accountability and Management 7 (3): 179 – 94.
Boyne, G., J. Gould-Williams, J. Law, and R. Walker. 2002. Plans, performance informa-
tion and accountability: The case of best value. Public Administration 80 (4): 691 – 710.
Broadbent, J., M. Dietrich, and R. Laughlin. 1996. The development of principal-agent,
contracting and accountability relationships in the public sector: Conceptual and cul-
tural problems. Critical Perspectives on Accounting 7: 259 – 84.
Brusca Alijarde, M. I. 1997. The usefulness of financial reporting in Spanish local
governments. Financial Accountability and Management 13 (1): 17 – 34.
ANNUAL REPORTING AND ACCOUNTABILITY BY MUNICIPALITIES IN CANADA 221
AP Vol. 10 No. 3 — PC vol. 10, no 3 (2011)
Brusca, I., and V. Condor. 2002. Towards the harmonization of local accounting systems in
the international context. Financial Accountability and Management 18 (2): 129 – 62.
Buzby, S. L. 1974. Selected items of information and their disclosure in annual reports. The
Accounting Review 49 (3): 423 – 35.
Canadian Institute of Chartered Accountants (CICA). PSAB handbook. Toronto: CICA.
Christensen, M., and P. Skærbæk. 2007. Framing and overflowing of public sector
accountability innovations: A comparative study of reporting practices. Accounting,
Auditing and Accountability Journal 20 (1): 101 – 32.
Collins, W., D. Keenan, and I. Lapsley. 1991. Local authority financial reporting:
Communication sophistry or obfuscation. Edinburgh: The Chartered Institute of Public
Finance and Accountancy.
Cooke, T. E. 1989. Disclosure in the corporate annual reports of Swedish companies.
Accounting and Business Research 19 (74): 113 – 24.
Copley, P. A. 1991. The association between municipal disclosure practices and audit
quality. Journal of Accounting and Public Policy 10 (4): 245 – 67.
Coy, D., and K. Dixon. 2004. The public accountability index: Crafting a parametric
disclosure index for annual reports. The British Accounting Review 36 (1): 79 – 106.
Coy, D., G. Tower, and K. Dixon. 1993. Quantifying the quality of tertiary education
annual reports. Accounting and Finance 33 (2): 121 – 29.
Coy, D., G. Tower, and K. Dixon. 1994. Public sector reform in New Zealand: The
progress of tertiary education annual reports, 1990 – 92. Financial Accountability and
Management 10 (3): 253 – 62.
Craswell, A. T., and S. L. Taylor. 1992. Discretionary disclosure of reserves by oil and gas
companies: An economic analysis. Journal of Business Finance and Accounting 19 (2):
295 – 308.
Daniels, J. D., and C. E. Daniels. 1991. Municipal financial reports: What users want.
Journal of Accounting and Public Policy 10 (1): 15 – 39.
DeAngelo, L. 1981. Auditor size and quality. Journal of Accounting and Economics 3 (3):
182 – 99.
Francis, J. R., and D. Wang. 2008. The joint effect of investor protection and Big 4 audits
on earning quality around the world. Contemporary Accounting Research 25 (1):
157 – 91.
Governmental Accounting Standards Board (GASB). 1987. Objectives of Financial Report-
ing. Concept Statement No. 1. Stamford, CT: GASB.
Hay, D., and D. Davis. 2004. The voluntary choice of an auditor of any level of quality.
Auditing: A Journal of Practice and Theory 23 (2): 37 – 53.
Hooks, J., D. Coy, and H. Davey. 2002. The information gap in annual reports.
Accounting, Auditing and Accountability Journal 15 (4): 501 – 22.
Ijiri, Y. 1983. On the accountability-based conceptual framework of accounting. Journal of
Accounting and Public Policy 2 (2): 75 – 81.
Jones, R., and M. Pendlebury. 2004. A theory of the published accounts of local authorities.
Financial Accountability and Management 20 (3): 305 – 25.
Khurana, I. K., and K. K. Raman. 2004. Litigation risk and the financial reporting credibil-
ity of Big 4 versus non –Big 4 audits: Evidence from Anglo-American countries. The
Accounting Review 79 (2): 473 – 95.
222 ACCOUNTING PERSPECTIVES / PERSPECTIVES COMPTABLES
AP Vol. 10 No. 3 — PC vol. 10, no 3 (2011)
Kitchen, H. M., and E. Slack. 2003. Special study: New finance options for municipal
governments. Canadian Tax Journal 51 (6): 2216 – 25.
Kloot, L., and J. Martin. 2001. Local government accountability: Explaining differences.
Accounting, Accountability and Performance 7 (1): 51 – 72.
Lawrence, A., M. Minutti-Meza, and P. Zhang. 2011. Can Big 4 versus nonBig 4 differences
in audit quality proxies be attributed to client characteristics? The Accounting Review 86
(1): 259 – 86.
Lightbody, J. 2003. Adventures in adequacy: Recent developments in the quest for better
management practices in Canadian municipal government. Public Performance and
Management Review 27 (1): 71 – 87.
Lin, Z. J., G. C. Baxter, and G. J. Murphy. 1993. Improving government financial reporting
in Canada: An evaluation of compliance with the PSAAC’s accounting and reporting
standards for governments. Financial Accountability and Management 9 (4): 235 – 54.
Marston, C. L., and P. J. Shrives. 1991. The use of disclosure indices in accounting
research: A review article. The British Accounting Review 23 (3): 195 – 210.
Mayston, D. 1992. Financial reporting in the public sector and the demand for information.
Financial Accountability and Management 8 (4): 317 – 24.
Nelson, M., W. Banks, and J. Fisher. 2003. Improved accountability disclosure by
Canadian universities. Canadian Accounting Perspectives 2 (1): 77 – 107.
Pablos, J. L., A. Carcaba, and A. Lopez. 2002. The annual report as a tool for financial
disclosure in local governments. International Journal of Management 19 (4): 651 – 63.
Pallot, J. 1992. Elements of a theoretical framework for public sector accounting.
Accounting, Auditing and Accountability Journal 5 (1): 38 – 59.
Robbins, W. A., and K. R. Austin. 1986. Disclosure quality in government financial
reports: An assessment of the appropriateness of a compound measure. Journal of
Accounting Research 24 (2): 412 – 21.
Roberts, J., and R. Scapens. 1985. Accounting systems and systems of accountability:
Understanding accounting practices in their organisational contexts. Accounting,
Organizations and Society 10 (4): 443 – 56.
Rowbottom, N. 2002. The application of intangible asset accounting and discretionary
policy choices in the U.K. football industry. British Accounting Review 34 (4): 335 – 55.
Rubin, M. A. 1988. Municipal audit fee determinants. The Accounting Review 63 (2): 219 – 36.
Ryan, C., K. Dunstan, and J. Brown. 2002a. The value of public sector annual reports and
annual reporting awards in organisational legitimacy. Accounting, Accountability and
Performance 8 (1): 61 – 76.
Ryan, C., T. Stanley, and M. Nelson. 2002b. Accountability disclosures by Queensland
local government councils: 1997 – 1999. Financial Accountability and Management
18 (3): 261 – 90.
Sinclair, A. 1995. The chameleon of accountability: Forms and disclosures. Accounting,
Organizations and Society 20 (2 ⁄3): 219 – 37.Skinner, R. M. 1987. Accounting standards in evolution. Toronto: Holt Rinehart and
Winston of Canada Ltd.
Stanley, T., N. Jennings, and J. Mack. 2008. An examination of the content of community
financial reports in Queensland local government authorities. Financial Accountability
and Management 24 (4): 411 – 37.
ANNUAL REPORTING AND ACCOUNTABILITY BY MUNICIPALITIES IN CANADA 223
AP Vol. 10 No. 3 — PC vol. 10, no 3 (2011)
Steccolini, I. 2004. Is the annual report an accountability medium? An empirical investiga-
tion into Italian local governments. Financial Accountability and Management 20 (3):
327 – 50.
Stewart, J. D. 1984. The role of information in public accountability. In Issues in public sec-
tor accounting, ed. A. G. Hopwood and C. R. Tomkins, 13 – 34. London: Philip Allan.
Tayib, M., H. M. Coombs, and J.R.M. Ameen. 1999. Financial reporting by Malaysian
local authorities: A study of the needs and requirements of the users of local authority
financial accounts. The International Journal of Public Sector Management 12 (2):
103 – 20.
Titman, S., and B. Trueman. 1986. Information quality and the valuation of new issues.
Journal of Accounting and Economics 8 (2): 159 – 72.
Wei, T. L., H. Davey, and D. Coy. 2008. A disclosure index to measure the quality of
annual reporting by museums in New Zealand and the U.K. Journal of Applied
Accounting Research 9 (1): 29 – 51.
Wynne, A. 2004. Public sector accounting: Democratic accountability or market rules?
Public Money and Management (January), 5 – 7.
224 ACCOUNTING PERSPECTIVES / PERSPECTIVES COMPTABLES
AP Vol. 10 No. 3 — PC vol. 10, no 3 (2011)

Copyright of Accounting Perspectives is the property of Canadian Academic Accounting Association and its
content may not be copied or emailed to multiple sites or posted to a listserv without the copyright holder's
express written permission. However, users may print, download, or email articles for individual use.
Related Documents