Judgment and Decision Making An Interdisciplinary Reader Second Edition Edited by Terry Connolly University of Arizona Hal R. Arkes Ohio University Kenneth R. Hammond University of Colorado

Welcome message from author
This document is posted to help you gain knowledge. Please leave a comment to let me know what you think about it! Share it to your friends and learn new things together.
Transcript
P1: GKW/UKS P2: GKW/UKS QC: GKW
CB209-FM July 30, 1999 5:30
Judgment and Decision MakingAn Interdisciplinary Reader
Second Edition
Edited byTerry ConnollyUniversity of Arizona
Hal R. ArkesOhio University
Kenneth R. HammondUniversity of Colorado
v

P1: GKW/UKS P2: GKW/UKS QC: GKW
CB209-FM July 30, 1999 5:30
P U B L I S H E D B Y T H E P R E S S S Y N D I C A T E O F T H E U N I V E R S I T Y O F C A M B R I D G EThe Pitt Building, Trumpington Street, Cambridge, United Kingdom
C A M B R I D G E U N I V E R S I T Y P R E S SThe Edinburgh Building, Cambridge CB2 2RU, UK http://www.cup.cam.ac.uk40 West 20th Street, New York, NY 10011-4211, USA http://www.cup.org10 Stamford Road, Oakleigh, Melbourne 3166, AustraliaRuiz de Alarcon 13, 28014 Madrid, Spain
c© Cambridge University Press 1999
This book is in copyright. Subject to statutory exceptionand to the provisions of relevant collective licensing agreements,no reproduction of any part may take place withoutthe written permission of Cambridge University Press.
First published 1999
Printed in the United States of America
Typeface Palatino 9.75/12 pt. System LATEX 2ε [TB]
A catalog record for this book is available from the British Library.
Library of Congress Cataloging-in-Publication Data
Judgment and decision making : an interdisciplinary reader / edited byTerry Connolly, Hal R. Arkes, Kenneth R. Hammond. – Rev. ed.
p. cm. – (Cambridge series on judgment and decision making)
Includes bibliographical references and index.
ISBN 0-521-62355-3 (hardcover). – ISBN 0-521-62602-1 (pbk.)
1. Decision making. 2. Judgment. I. Connolly, Terry.II. Arkes, Hal R., 1945– . III. Hammond, Kenneth R. IV. Series.BF441.J79 1999302.3 – dc21 98-51484
CIP
ISBN 0 521 62355 3 hardbackISBN 0 521 62602 1 paperback
vi
P1: GKW/UKS P2: GKW/UKS QC: GKW
CB209-FM July 30, 1999 5:30
Contents
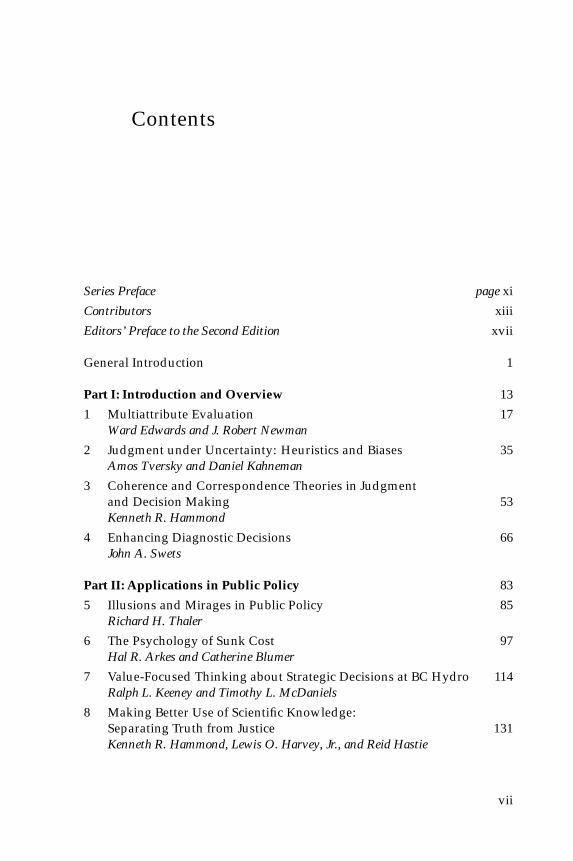
Series Preface page xi
Contributors xiii
Editors’ Preface to the Second Edition xvii
General Introduction 1
Part I: Introduction and Overview 13
1 Multiattribute Evaluation 17Ward Edwards and J. Robert Newman
2 Judgment under Uncertainty: Heuristics and Biases 35Amos Tversky and Daniel Kahneman
3 Coherence and Correspondence Theories in Judgmentand Decision Making 53Kenneth R. Hammond
4 Enhancing Diagnostic Decisions 66John A. Swets
Part II: Applications in Public Policy 83
5 Illusions and Mirages in Public Policy 85Richard H. Thaler
6 The Psychology of Sunk Cost 97Hal R. Arkes and Catherine Blumer
7 Value-Focused Thinking about Strategic Decisions at BC Hydro 114Ralph L. Keeney and Timothy L. McDaniels
8 Making Better Use of Scientific Knowledge:Separating Truth from Justice 131Kenneth R. Hammond, Lewis O. Harvey, Jr., and Reid Hastie
vii

P1: GKW/UKS P2: GKW/UKS QC: GKW
CB209-FM July 30, 1999 5:30
viii Contents
Part III: Applications in Economics 145
9 Choices, Values, and Frames 147Daniel Kahneman and Amos Tversky
10 Who Uses the Cost-Benefit Rules of Choice? Implicationsfor the Normative Status of Microeconomic Theory 166Richard P. Larrick, Richard E. Nisbett, and James N. Morgan
11 Does Studying Economics Inhibit Cooperation? 183Robert H. Frank, Thomas Gilovich, and Dennis T. Regan
Part IV: Legal Applications 197
12 Leading Questions and the Eyewitness Report 199Elizabeth F. Loftus
13 Explanation-Based Decision Making 212Reid Hastie and Nancy Pennington
14 Decision Theory, Reasonable Doubt, and the Utilityof Erroneous Acquittals 229Terry Connolly
Part V: Medical Applications 241
15 Capturing Policy in Hearing-Aid Decisions by Audiologists 245Janet Doyle and Shane A. Thomas
16 Physicians’ Use of Probabilistic Informationin a Real Clinical Setting 259Jay J. J. Christensen-Szalanski and James B. Bushyhead
17 On the Elicitation of Preferences for Alternative Therapies 272Barbara J. McNeil, Stephen G. Pauker, Harold C. Sox, Jr.,and Amos Tversky
18 Enhanced Interpretation of Diagnostic Images 281David J. Getty, Ronald M. Pickett, Carl J. D’Orsi,and John A. Swets
Part VI: Experts 301
19 Reducing the Influence of Irrelevant Informationon Experienced Decision Makers 305Gary J. Gaeth and James Shanteau
20 Expert Judgment: Some Necessary Conditions and an Example 324Hillel J. Einhorn
21 The Expert Witness in Psychology and Psychiatry 336David Faust and Jay Ziskin

P1: GKW/UKS P2: GKW/UKS QC: GKW
CB209-FM July 30, 1999 5:30
Contents ix
Part VII: Forecasting and Prediction 349
22 What Forecasts (Seem to) Mean 353Baruch Fischhoff
23 Proper and Improper Linear Models 378Robyn M. Dawes
24 Seven Components of Judgmental Forecasting Skill:Implications for Research and the Improvement of Forecasts 395Thomas R. Stewart and Cynthia M. Lusk
Part VIII: Bargaining and Negotiation 419
25 The Judgment Policies of Negotiators and the Structureof Negotiation Problems 423Jeryl L. Mumpower
26 The Effect of Agents and Mediators on Negotiation Outcomes 442Max H. Bazerman, Margaret A. Neale, Kathleen L. Valley,Edward J. Zajac, and Yong Min Kim
Part IX: Risk 461
27 Risk within Reason 465Richard J. Zeckhauser and W. Kip Viscusi
28 Risk Perception and Communication 479Baruch Fischhoff, Ann Bostrom, and Marilyn Jacobs Quadrel
29 Perceived Risk, Trust, and Democracy 500Paul Slovic
Part X: Research Methods 515
30 Value Elicitation: Is There Anything in There? 517Baruch Fischhoff
31 The Overconfidence Phenomenon as a Consequenceof Informal Experimenter-Guided Selection of Almanac Items 544Peter Juslin
32 The A Priori Case Against Graphology: Methodologicaland Conceptual Issues 556Maya Bar-Hillel and Gershon Ben-Shakhar
Part XI: Critiques and New Directions I 571
33 The Two Camps on Rationality 575Helmut Jungermann
34 On Cognitive Illusions and Their Implications 592Ward Edwards and Detlof von Winterfeldt

P1: GKW/UKS P2: GKW/UKS QC: GKW
CB209-FM July 30, 1999 5:30
x Contents
35 Reasoning the Fast and Frugal Way: Modelsof Bounded Rationality 621Gerd Gigerenzer and Daniel G. Goldstein
36 Judgment and Decision Making in Social Context:Discourse Processes and Rational Inference 651Denis J. Hilton and Ben R. Slugoski
Part XII: Critiques and New Directions II 677
37 Why We Still Use Our Heads Instead of Formulas:Toward an Integrative Approach 681Benjamin Kleinmuntz
38 Nonconsequentialist Decisions 712Jonathan Baron
39 Algebra and Process in the Modeling of Risky Choice 733Lola L. Lopes
40 The Theory of Image Theory: An Examinationof the Central Conceptual Structure 755Terry Connolly and Lee Roy Beach
Author Index 766
Subject Index 779

P1: FCD
CB209-01 June 2, 1999 8:59
Part I
Introduction and Overview
The four chapters in this section lay out some of the topics that have beenof central interest to JDM researchers and practitioners. The first, taken fromEdwards and Newman’s 1982 book, describes in some detail the evaluationprocess one might go through to select a new office location. The process isexplicitly normative in the decision tree approach described in the Introduc-tion: It aims to advise the decision maker what she should do. The problemhere is, in fact, simpler in one important sense than in the earlier example,in that no uncertainty is involved. The decision maker knows, for sure, howlarge, convenient, attractive, and so on each available site is: If she choosesOption 1, she will get a known package of features, if she chooses Option 2,she will get another known package of features, and so on. The problem is inmaking the trade-offs between the good and bad features of each. The MAUTprocedure the authors describe helps the decision maker to set up and makethe various judgments required to arrive at a “best” choice. The exampleis worth following through in detail both to understand what the MAUTtechnology offers and to better understand the sense in which “best” is usedin this approach. Von Winterfeldt and Edwards (1986) describe more com-plex applications, whereas Edwards and Barron (1994) describe importantprogress in the weight-assignment problem.
The second chapter, by Tversky and Kahneman, represents an early high-water mark of an important line of research called the “Heuristics and BiasesProgram.” This program, which stimulated an enormous body of researchand discussion in the 1970s and 1980s, turned on two fairly simple ideas.First, it is reasonably easy to devise judgment tasks in which many people be-have in ways that seem to violate relevant normative standards: They “makemistakes.” Second, Tversky and Kahneman proposed an account of manyof these errors as manifestations of a small set of cognitive “heuristics” orrules of thumb that, though generally effective enough for most situations,would lead to predictable errors in some carefully constructed tasks. The“error,” in this sense, was evidence for the existence of the “heuristic,” theexistence of which was, in turn, assumed to depend on its general (though
13
P1: FCD
CB209-01 June 2, 1999 8:59
14 Introduction and Overview
not invariable) adequacy. The “representativeness heuristic,” for example, isthe expectation that a sample of some process will look roughly like the un-derlying process. However, our intuitions about how closely samples matchprocesses are imperfect, and can sometimes trip up our judgments. Becausemany of the studies in this line turned on demonstrating deviations betweenactual behavior and a normative model, many observers interpreted the re-sults as casting a gloomy light on human cognitive abilities – as suggesting,in one memorable reading, that we are “cognitive cripples” subject to dozensof debilitating biases. Counterattacks and reinterpretations (see, for example,Chapter 35, by Gigerenzer & Goldstein; Chapter 36, by Hilton & Slugowski;and Chapter 31, Juslin, in this volume) argued that the models themselveswere not compellingly normative or that the tasks were “fixed” in variousways. Some of these counterattacks have tried to make the case that, far fromcrippled, we are cognitive heroes, tuned by evolution to superb inferentialperformance. There is, in fact, almost no evidence on which to estimate anoverall human judgmental batting average, even if one could define such anumber. A balanced view (see, for example, Jungermann, Chapter 33, thisvolume) would probably conclude that it is not close to either 0 or 1.0.
The third chapter in this section is an extract from a recent book byHammond. Hammond suggests that much of the argument over the heuris-tics and biases research can be resolved by considering the two distinct“metatheories” that have underlain JDM research for years. One, the “cor-respondence” metatheory, focuses on how well someone’s judgments anddecisions connect to the real world: Does the doctor diagnose the right dis-ease, does the bettor back the winning horse? The other dominant metatheoryfocuses on the internal “coherence” of someone’s judgments and decisions:Do they hang together rationally, are they internally consistent, are they logi-cally reasonable? Obviously, in a finished, mature science, good theories passboth tests. Newtonian physics was, for several centuries, consistent both in-ternally and with the facts of the world as they were known. JDM research, incontrast, is far less developed, and researchers have tended to emphasize oneor the other test, reaching opposite conclusions about human competence.Hammond ties the emphasis on coherence or correspondence thinking to acontinuum of different ways of thinking, running from purely analytic topurely intuitive.
Regardless of our conclusions about human competence in general, mostof us would be grateful for help when we have to make difficult, high-stakes judgments. Swets, in the fourth chapter in this section, sketches oneapproach, known (for slightly obscure reasons) as the Theory of Signal De-tection (TSD). TSD has not been widely used by JDM researchers (thoughsee Getty et al., Chapter 18, this volume, for a fascinating application in radi-ology), though it provides a powerful framework for integrating judgmentsand choices. TSD considers situations in which a decision maker must act insome way (for example, to investigate further in face of a suspicious-looking
P1: FCD
CB209-01 June 2, 1999 8:59
Introduction and Overview 15
X-ray, or to abort an airliner landing because of bad weather) on the basis ofan uncertain judgment (of the risk of cancer or of windshear). Either actionmight be mistaken, so the costs of these errors as well as the uncertainty ofthe underlying judgment must be considered in planning how to act. Note,incidentally, that Connolly (Chapter 14, this volume) takes a decision ana-lytic approach to such a situation in his discussion of reasonable doubt. Thetwo approaches yield exactly equivalent results, despite the apparently quitedifferent frameworks.
References
Edwards, W., & Barron, F. H. (1994). SMARTS and SMARTER: Improved simple methodsfor multiattribute measurement. Organizational Behavior and Human Decision Processes,60, 306–325.
Hammond, K. R. (1996). Human judgment and social policy. New York, Oxford UniversityPress.
von Winterfeldt, D., & Edwards, W. (1986). Decision analysis and behavioral research.New York: Cambridge University Press.

P1: FCD
CB209-01 June 2, 1999 8:59
16

P1: FCD
CB209-01 June 2, 1999 8:59
1 Multiattribute Evaluation
Ward Edwards and J. Robert Newman
The purpose of this chapter is to present one approach to evaluation: Multiat-tribute Utility Technology (MAUT). We have attempted to make a version ofMAUT simple and straightforward enough so that the reader can, with dili-gence and frequent reexaminations of it, conduct relatively straightforwardMAUT evaluations him- or herself. In so doing, we will frequently resort totechniques that professional decision analysts will recognize as approxima-tions and/or assumptions. The literature justifying those approximations isextensive and complex; to review it here would blow to smithereens our goalof being nontechnical.
What is MAUT, and how does it relate to other approaches to evaluation?MAUT depends on a few key ideas:
1. When possible, evaluations should be comparative.2. Programs normally serve multiple constituencies.3. Programs normally have multiple goals, not all equally important.4. Judgments are inevitably a part of any evaluation.5. Judgments of magnitude are best when made numerically.6. Evaluations typically are, or at least should be, relevant to decisions.
Some of the six points above are less innocent than they seem. If pro-grams serve multiple constituencies, evaluations of them should normallybe addressed to the interests of those constituencies; different constituenciescan be expected to have different interests. If programs have multiple goals,evaluations should attempt to assess how well they serve them; this im-plies multiple measures and comparisons. The task of dealing with multiplemeasures of effectiveness (which may well be simple subjective judgmentsin numerical form) makes less appealing the notion of social programs as
This chapter originally appeared in Edwards, W., & Newman, J. R. (1982). MultiattributeEvaluation. Beverly Hills, CA: Sage. Copyright c© 1982 by Sage Publications, Inc. Reprintedby permission.
17
P1: FCD
CB209-01 June 2, 1999 8:59
18 EDWARDS AND NEWMAN
experiments or quasi-experiments. While the tradition that programs shouldbe thought of as experiments, or at least as quasi-experiments, has wide cur-rency and wide appeal in evaluation research, its implementation becomesmore difficult as the number of measures needed for a satisfactory evalua-tion increases. When experimental or other hard data are available, they caneasily be incorporated in a MAUT evaluation.
Finally, the willingness to accept subjectivity into evaluation, combinedwith the insistence that judgments be numerical, serves several useful pur-poses. First, it partly closes the gap between the intuitive and judgmentalevaluations and the more quantitative kind; indeed, it makes coexistenceof judgment and objective measurement within the same evaluation easyand natural. Second, it opens the door to easy combination of complex con-catenations of values. For instance, evaluation researchers often distinguishbetween process evaluations and outcome evaluations. Process and outcomeare different, but if a program has goals of both kinds, its evaluation can andshould assess its performance on both. Third, use of subjective inputs can,if need be, greatly shorten the time required for an evaluation to be carriedout. A MAUT evaluation can be carried out from original definition of theevaluation problem to preparation of the evaluation report in as little as aweek of concentrated effort. The inputs to such an abbreviated evaluative ac-tivity will obviously be almost entirely subjective. But the MAUT techniqueat least produces an audit trail such that the skeptic can substitute otherjudgments for those that seem doubtful, and can then examine what theconsequences for the evaluation are. We know of no MAUT social programevaluation that took less than two months, but in some other areas of ap-plication we have participated in execution of complete MAUT evaluationsin as little as two days – and then watched them be used as the justificationfor major decisions. Moreover, we heartily approved; time constraints on thedecision made haste necessary, and we were very pleased to have the chanceto provide some orderly basis for decision in so short a time.
Steps in a MAUT Evaluation
Step 1. Identify the objects of evaluation and the function or functions thatthe evaluation is intended to perform. Normally there will be several ob-jects of evaluation, at least some of them imaginary, since evaluations arecomparative. The functions of the evaluation will often control the choiceof objects of evaluation. We have argued that evaluations should help de-cision makers to make decisions. If the nature of those decisions is known,the objects of evaluation will often be controlled by that knowledge. Step 1is outside the scope of this chapter. Some of the issues inherent in it havealready been discussed in this chapter. The next section, devoted to settingup an example that will be carried through the document, illustrates Step 1for that example.

P1: FCD
CB209-01 June 2, 1999 8:59
Multiattribute Evaluation 19
Step 2. Identify the stakeholders. . . .
Step 3. Elicit from stakeholder representatives the relevant value dimensionsor attributes, and (often) organize them into a hierarchical structure called avalue tree. . . .
Step 4. Assess for each stakeholder group the relative importance of each ofthe values identified at Step 3. Such judgments can, of course, be expected tovary from one stakeholder group to another; methods of dealing with suchvalue conflicts are important. . . .
Step 5. Ascertain how well each object of evaluation serves each value at thelowest level of the value tree. Such numbers, called single-attribute utilities orlocation measures, ideally report measurements, expert judgments, or both.If so, they should be independent of stakeholders and so of value disagree-ments among stakeholders; however, this ideal is not always met. Locationmeasures need to be on a common scale, in order for Step 4 to make sense. . . .
Step 6. Aggregate location measures with measures of importance. . . .
Step 7. Perform sensitivity analyses. The question underlying any sensitivityanalysis is whether a change in the analysis, e.g., using different numbersas inputs, will lead to different conclusions. While conclusions may haveemerged from Step 6, they deserve credence as a basis for action only aftertheir sensitivity is explored in Step 7. . . .
Steps 6 and 7 will normally produce the results of a MAUT evaluation. . . .
The Relation between Evaluation and Decision
The tools of MAUT are most useful for guiding decisions; they grow out of abroader methodological field called decision analysis. The relation of evalu-ation to decision has been a topic of debate among evaluation researchers –especially the academic evaluation researchers who wonder whether or nottheir evaluations are used, and if so, appropriately used. Some evaluatorstake the position that their responsibility is to provide the relevant facts; it isup to someone else to make the decisions. “We are not elected officials.” Thisposition is sometimes inevitable, of course; the evaluator is not the decisionmaker as a rule, and cannot compel the decision maker to attend to the resultof the evaluation, or to base decisions on it. But it is unattractive to manyevaluators; certainly to us.
We know of three devices that make evaluations more likely to be usedin decisions. The first and most important is to involve the decision makersheavily in the evaluative process; this is natural if, as is normally the case,they are among the most important stakeholders. The second is to make

P1: FCD
CB209-01 June 2, 1999 8:59
20 EDWARDS AND NEWMAN
the evaluation as directly relevant to the decision as possible, preferably bymaking sure that the options available to the decision maker are the objectsof evaluation. The third is to make the product of the evaluation useful –which primarily means making it readable and short. Exhaustive scholarlydocuments tend to turn busy decision makers off. Of course, nothing in theseobvious devices guarantees success in making the evaluation relevant to thedecision. However, nonuse of these devices comes close to guaranteeingfailure.
By “decisions” we do not necessarily mean anything apocalyptic; theprocess of fine tuning a program requires decisions too. This chapter un-abashedly assumes that either the evaluator or the person or organizationcommissioning the evaluation has the options or alternative courses of ac-tion in mind, and proposes to select among them in part on the basis of theevaluation – or else that the information is being assembled and aggregatedbecause of someone’s expectation that that will be the case later on.
An Example
We now present a fairly simple example of how to use multiattribute utilitytechnology for evaluation. The example is intended to be simple enough tobe understandable, yet complex enough to illustrate all of the technical ideasnecessary for the analysis. . . . We have invented an example that brings out allthe properties of the method, and that will, we hope, be sufficiently realisticto fit with the intuitions of those who work in a social program environment.
The Problem: How to Evaluate New Locations for a DrugCounseling Center
The Drug-Free Center is a private nonprofit contract center that givescounseling to clients sent to it by the courts of its city as a condition oftheir probation. It is a walk-in facility with no beds or other special spacerequirements; it does not use methadone. It has just lost its lease, and mustrelocate.
The director of the center has screened the available spaces to which itmight move. All spaces that are inappropriate because of zoning, excessiveneighborhood resistance to the presence of the center, or inability to satisfysuch legal requirements as access for the handicapped have been eliminated,as have spaces of the wrong size, price, or location. The city is in a period ofeconomic recession, and so even after this prescreening a substantial numberof options are available. Six sites are chosen as a result of informal screeningfor serious evaluation. The director must, of course, satisfy the sponsor, theprobation department, and the courts that the new location is appropriate,and must take the needs and wishes of both employees and clients intoaccount. But as a first cut, the director wishes simply to evaluate the sites on

P1: FCD
CB209-01 June 2, 1999 8:59
Multiattribute Evaluation 21
the basis of values and judgments of importance that make sense internallyto the center.
The Evaluation Process
The first task is to identify stakeholders. They were listed in the previousparagraph. A stakeholder is simply an individual or group with a reason tocare about the decision and with enough impact on the decision maker sothat the reason should be taken seriously. Stakeholders are sources of valueattributes. An attribute is something that the stakeholders, or some subset ofthem, care about enough so that failure to consider it in the decision wouldlead to a poor decision. . . .
In this case, to get the evaluation started, the director consulted, as stake-holders, the members of the center staff. Their initial discussion of valueselicited a list of about 50 verbal descriptors of values. A great many of thesewere obviously the same idea under a variety of different verbal labels. Thedirector, acting as leader of the discussion, was able to see these duplicationsand to persuade those who originally proposed these as values to agree ona rephrasing that captured and coalesced these overlapping or duplicatingideas. She did so both because she wanted to keep the list short and becauseshe knew that if the same idea appeared more than once in the final list, shewould be “double counting”; that is, including the same value twice. For-mally, there is nothing wrong with double counting so long as the weightsreflect it. But in practice, it is important to avoid, in part because the weightswill often not reflect it, and in part because the analysis is typically complex,and addition of extra and unnecessary attributes simply makes the complex-ity worse.
A second step in editing the list was to eliminate values that, in the viewof the stakeholders, could not be important enough to influence the decision.An example of this type of value, considered and then eliminated becauseit was unimportant, was “proximity to good lunching places.” The directorwas eager to keep the list of values fairly short, and her staff cooperated. In aless collegial situation, elimination of attributes can be much more difficult.Devices that help accomplish it are almost always worthwhile, so long asthey do not leave some significant stakeholder feeling that his or her petvalues have been summarily ignored.
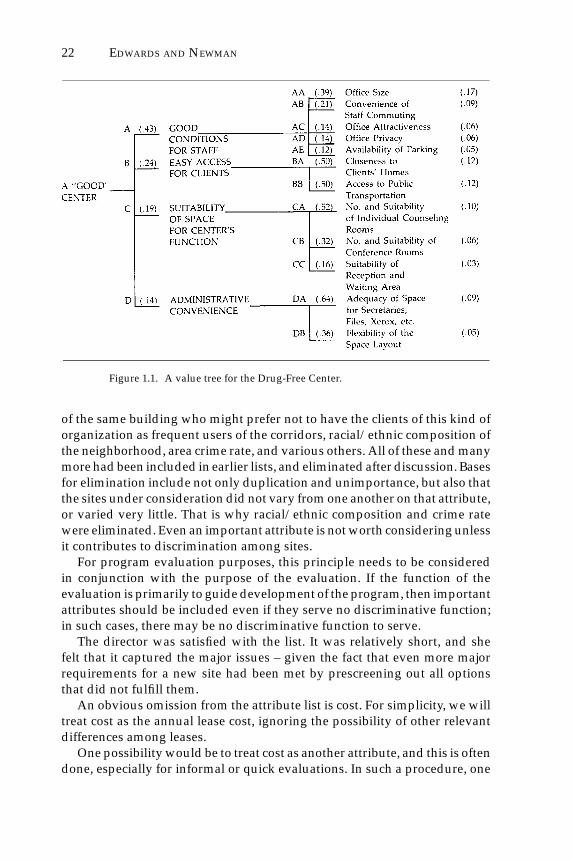
The director was also able to obtain staff assent to organizing its valuesinto four broad categories, each with subcategories. Such a structure is calleda value tree. The one that the director worked with is shown in Figure 1.1. Weexplain the numbers shortly.
Several questions need review at this stage.Have all important attributes been listed? Others had been proposed and
could obviously have been added. The list does not mention number or loca-tion of toilets, proximity to restaurants, presence or absence of other tenants
P1: FCD
CB209-01 June 2, 1999 8:59
22 EDWARDS AND NEWMAN
Figure 1.1. A value tree for the Drug-Free Center.
of the same building who might prefer not to have the clients of this kind oforganization as frequent users of the corridors, racial/ethnic composition ofthe neighborhood, area crime rate, and various others. All of these and manymore had been included in earlier lists, and eliminated after discussion. Basesfor elimination include not only duplication and unimportance, but also thatthe sites under consideration did not vary from one another on that attribute,or varied very little. That is why racial/ethnic composition and crime ratewere eliminated. Even an important attribute is not worth considering unlessit contributes to discrimination among sites.
For program evaluation purposes, this principle needs to be consideredin conjunction with the purpose of the evaluation. If the function of theevaluation is primarily to guide development of the program, then importantattributes should be included even if they serve no discriminative function;in such cases, there may be no discriminative function to serve.
The director was satisfied with the list. It was relatively short, and shefelt that it captured the major issues – given the fact that even more majorrequirements for a new site had been met by prescreening out all optionsthat did not fulfill them.
An obvious omission from the attribute list is cost. For simplicity, we willtreat cost as the annual lease cost, ignoring the possibility of other relevantdifferences among leases.
One possibility would be to treat cost as another attribute, and this is oftendone, especially for informal or quick evaluations. In such a procedure, one

P1: FCD
CB209-01 June 2, 1999 8:59
Multiattribute Evaluation 23
would specify a range of possible costs, assign a weight to that attribute,which essentially amounts to a judgment about how it trades off against otherattributes, and then include it in the analysis like any other attribute. We havechosen not to do so in this example, for two reasons. First, some evaluationsmay not involve cost in any significant way (monitoring, for example), andwe wish to illustrate procedures for cost-independent applications of MAUT.Second, we consider the kind of judgment required to trade off cost againstutility points to be the least secure and most uncomfortable to make of all thosethat go into MAUT. For that reason, we like to use procedures, illustratedlater, that permit extremely crude versions of that judgment to determinefinal evaluation.
While on the topic, we should discuss two other aspects of trading offdollars against aggregated utilities.
The first is budget constraints. If a budget constrains, in this example, theamount of rent the center can pay, then it is truly a constraint, and sites thatfail to meet it must be rejected summarily. More common, however, is thecase in which money can be used for one purpose or another. A full analysiswould require considering also the loss, in this instance, that would resultfrom spending more on rent and so having less to spend on other things.Such considerations are crucial, but we do not illustrate them here. In orderto do so, we would have to provide a scenario about what budget cuts thedirector would need to make in other categories to pay additional rent. At thetime she must choose among sites, she may not know what these are. Fairlyoften, the expansion of the analysis required to evaluate all possible waysin which a program might be changed by budget reallocations is very largeindeed – far too large to make an easy example. So we prefer to think of thisas a case in which the director’s budget is large enough so that, for the rangeof costs involved, belt-tightening can take care of the difference betweensmallest and largest. A fuller analysis would consider the programmaticimpact of fund reallocation and could explore the utility consequences ofalternative reallocations. The circumscription of the analysis in the interestof making it manageable is very common; relevant issues are and shouldbe left out of every analysis. (An equivalent statement: If it can be avoided,no MAUT analysis should include every attribute judged relevant by anystakeholder.) . . . The goal is to enlist stakeholder cooperation in keeping thelist of attributes reasonably short.
The other issue having to do with cost but not with the example of thischapter is the portfolio problem. This is the generic name for situations inwhich a decision maker must choose, not a single option, but a numberof options from a larger set. Typically, the limit on the number that can bechosen is specified by a budget constraint. The methods presented in thismanual require considerable adaptation to be used formally for portfolioproblems, because the decision maker normally wants the portfolio as awhole to have properties such as balance, diversity, or coverage (e.g., of
P1: FCD
CB209-01 June 2, 1999 8:59
24 EDWARDS AND NEWMAN
topics, regions, disciplines, problems) that are not attributes of the individualoptions themselves. Formally, each possible portfolio is an option, and avalue tree relevant to the portfolio, not to the individual options, is needed.But such formal complexity is rarely used. A much more common procedurein portfolio problems is to evaluate the individual elements using methodslike those of this chapter, choose from the best so identified, and then examinethe resulting set of choices to make sure that it meets the budget constraintand looks acceptable as a portfolio.
You will have encountered such terms as benefit-cost analysis. Such anal-yses are similar in spirit to what we are doing here, but quite different indetail. By introducing into the analysis early assumptions about how nonfi-nancial values trade off with money, both benefits and costs can be expressedin dollar terms. We see little merit in doing so for social programs, since earlytranslation of nonmonetary effects into money terms tends to lead to under-assessment of the importance of nonfinancial consequences. The methodswe present in this section . . . are formally equivalent to doing it all in money,but do not require an equation between utility and money until the very endof the analysis, if then.
Back to our example. In the initial elicitation of values from the staff,the orderly structure of Figure 1.1, the value tree, did not appear. Indeed, ittook much thought and trial and error to organize the attributes into a treestructure. Formally, only the attributes at the bottom of the tree, which arecalled twigs, are essential for evaluation. Figure 1.1 is a two-level value tree;that is, all second-level values are twigs. More often, different branches ofa value tree will vary in how many levels they have. . . . Examples with asmany as fourteen levels exist.
Tree structures are useful in MAUT in three ways. First, they presentthe attributes in an orderly structure; this helps thought about the problem.Second, the tree structure can make elicitation of importance weights fortwigs (which we discuss below) much easier than it would otherwise be, byreducing the number of judgments required. . . . Finally, value trees permitwhat we call subaggregation. Often a single number is much too compresseda summary of how attractive an option is. Tree structures permit more infor-mative and less compressed summaries. . . .
Figure 1.1 contains a notational scheme we have found useful in valuetrees. Main branches of the tree are labeled with capital letters, A, B, and soon. Subattributes under each main branch are labeled with double letters,AA, AB, . . . , BA, BB . . . , and so on. This is a two-level tree, so only doubleletters are needed.
Assignment of Importance Weights
The numbers in Figure 1.1 are importance weights for the attributes. Notethat the weights in Figure 1.1 sum to 1 at each level of the tree. That is, the
P1: FCD
CB209-01 June 2, 1999 8:59
Multiattribute Evaluation 25
weights of A, B, C, and D sum to 1. Similarly, the weights of AA through AEsum to 1, as do those of BA and BB and so on. This is a convenient convention,both for elicitation of weights and for their use. The final weights for eachattribute at each twig of the tree are easily obtained by “multiplying throughthe tree.” For example, the weight .17 for twig AA (office size) is obtained bymultiplying the normalized weight of A (.43) by the normalized weight forAA (.39) to yield .43× .39 = .17. . . .
The weights presented in Figure 1.1 emerged from a staff meeting inwhich, after an initial discussion of the idea of weighting, each individualstaff member produced a set of weights, using the ratio method. . . . Then allthe sets of weights were put on the blackboard, the inevitable individualdifferences were discussed, and afterward each individual once again usedthe ratio method to produce a set of weights. These still differed, though byless than did the first set. The final set was produced by averaging the resultsof the second weighting; the average weights were acceptable to the staff asrepresenting its value system.
The director had some reservations about what the staff had produced,but kept them to herself. She worried about whether the weights associatedwith staff comfort issues were perhaps too high and those associated withappropriateness to the function of the organization were perhaps too low.(Note that she had no serious reservations about the relative weights withineach major branch of the value tree; her concerns were about the relativeweights of the four major branches of the tree. This illustrates the usefulnessof organizing lists of twigs into a tree structure for weighting.) The directorchose to avoid argument with her staff by reserving her concerns about thoseweights for the sensitivity analysis phase of the evaluation.
Although a common staff set of weights was obtained by averaging (eachstaff member equally weighted), the individual weights were not thereafterthrown away. Instead, they were kept available for use in the later sensitivityanalysis. In general, averaging may be a useful technique if a consensus po-sition is needed, especially for screening options, but it is dangerous, exactlybecause it obliterates individual differences in weighting. When stakehold-ers disagree, it is usually a good idea to use the judgments of each separatelyin evaluation; only if these judgments lead to conflicting conclusions mustthe sometimes difficult task of reconciling the disagreements be faced. If itis faced, arithmetic is a last resort, if usable at all; discussion and achieve-ment of consensus is much preferred. Often such discussions can be helpedby a sensitivity analysis; it will often turn out that the decision is simplyinsensitive to the weights.
The Assessment of Location Measures or Utilities
With a value tree to guide the choice of measures to take and judgmentsto make, the next task was to make detailed assessments of each of the six
P1: FCD
CB209-01 June 2, 1999 8:59
26 EDWARDS AND NEWMAN
sites that had survived initial screening. Such assessments directly lead tothe utilities in multiattribute utility measurement. The word “utility” has a400-year-old history and conveys a very explicit meaning to contemporarydecision analysts. The techniques for obtaining such numbers that we presentin this manual deviate in some ways from those implicit in that word. So weprefer to call these numbers location measures, since they simply report thelocation or utility of each object of evaluation on each attribute of evaluation.
Inspect Figure 1.1 again. Two kinds of values are listed on it. Office size isan objective dimension, measurable in square feet. Office attractiveness is asubjective dimension; it must be obtained by judgment. Proximity to publictransportation might be taken in this example as measured by the distancefrom the front door of the building to the nearest bus stop, which wouldmake it completely objective. But suppose the site were in New York. Thendistance to the nearest bus stop and distance to the nearest subway stopwould both be relevant and probably the latter would be more importantthan the former. It would make sense in that case to add another level to thevalue tree, in which the value “proximity to public transportation” wouldbe further broken down into those two twigs.
As it happens, in Figure 1.1 all attributes are monotonically increasing; thatis, more is better than less. That will not always be true. For some attributes,less is better than more; if “crime rate in the area” had survived the processof elimination that led to Figure 1.1, it would have been an example. Onsome attributes, intermediate values are preferable to either extreme; suchattributes have a peak inside the range of the attribute. If “racial compositionof the neighborhood” had survived as an attribute, the staff might well havefelt that the site would score highest on that attribute if its racial/ethnic mixmatched that of its clients. If only two racial/ethnic categories were relevant,that would be expressed by a twig, such as “percentage of whites in theneighborhood” that would have a peak at the percentage of whites amongthe center’s clients and would tail off from there in both directions. If morethan two racial/ethnic categories were relevant, the value would have beenfurther broken down, with percentage of each relevant racial/ethnic categoryin the neighborhood as a twig underneath it, and for each of those twigs, thelocation measure would have a peak at some intermediate value. . . .
Figure 1.1 presented the director with a fairly easy assessment task. Shechose to make the needed judgments herself. If the problem were more com-plex and required more expertise, she might well have asked other expertsto make some or all of the necessary judgments.
Armed with a tape measure and a notebook, she visited each of the sites,made the relevant measures and counts, and made each of the requiredjudgments. Thus she obtained the raw materials for the location measures.
However, she had to do some transforming on these raw materials. It isnecessary for all location measures to be on a common scale, in order for theassessment of weights to make any sense. Although the choice of common
P1: FCD
CB209-01 June 2, 1999 8:59
Multiattribute Evaluation 27
scale is obviously arbitrary, we like one in which 0 means horrible and 100means as well as one could hope to do.
Consider the case of the office size expressed in square feet. It would makeno sense to assign the value 0 to 0 sq. ft.; no office could measure 0 sq. ft. Afterexamining her present accommodations and thinking about those of othersimilar groups, the director decided that an office 60 sq. ft. in size should havea value of 0, and one of 160 sq. ft. should have a value of 100. She also decidedthat values intermediate between those two limits should be linear in utility.This idea needs explaining. It would be possible to feel that you gain muchmore in going from 60 to 80 sq. ft. than in going from 140 to 160 sq. ft., andconsequently that the scale relating square footage to desirability should benonlinear. Indeed, traditional utility theory makes that assumption in almostevery case.
Curved functions relating physical measurements to utility are probablymore precise representations of how people feel than straight ones. But for-tunately, such curvature almost never makes any difference to the decision.If it does, the fact that the difference exists means that the options are closeenough so that it scarcely matters which is chosen. For that reason, when anappropriate physical scale exists, we advocate choosing maximum and min-imum values on it, and then fitting a straight line between those boundariesto translate those measurements into the 0 to 100 scale. . . . Formal argumentsin support of our use of linearity are far too technical for this chapter. . . .
The director did the same kind of thing to all the other attributes for whichshe had objective measures. The attribute “proximity to clients’ homes” pre-sented her with a problem. In principle, she could have chosen to measurethe linear distance from the address of each current client to each site, aver-age these measures, choose a maximum and minimum value for the average,and then scale each site using the same procedure described for office size.But that would have been much more trouble than it was worth. So insteadshe looked at a map, drew a circle on it to represent the boundaries of thearea that she believed her organization served, and then noted how closeeach site was to the center of the area. It would have been possible to useradial distance from that center as an objective measure, but she chose notto do so, since clients’ homes were not homogeneously distributed withinthe circle. Instead, she treated this as a directly judgmental attribute, simplyusing the map as an aid to judgment.
Of course, for all judgmental dimensions, the scale is from 0 to 100. Forboth judgmental and objective attributes, it is important that the scale berealistic. That is, it should be easy to imagine that some of the sites beingconsidered might realistically score 0 to 100 on each attribute.
In this example, since the six sites were known, that could have beenassured by assigning a value of 0 to the worst site on a given attribute and avalue of 100 to the best on that attribute, locating the others in between. Thiswas not done, and we recommend that it not be done in general. Suppose

P1: FCD
CB209-01 June 2, 1999 8:59
28 EDWARDS AND NEWMAN
one of the sites had been rented to someone else, or that a new one turnedup. Then if the evaluation scheme were so tightly tied to the specific optionsavailable, it would have to be revised. We prefer a procedure in which oneattempts to assess realistic boundaries on each relevant attribute with lessspecific reference to the actual options available. Such a procedure allowsthe evaluation scheme to remain the same as the option set changes. And theprocedure is obviously necessary if the option set is not known, or not fullyknown, at the time the evaluation scheme is worked out.
It can, of course, happen that a real option turns up that is more extremethan a boundary assigned to some attribute. If that happens, the evalua-tion scheme can still be used. Two possible approaches exist. Consider, forexample, the attribute “access to public transportation” operationalized asdistance to the nearest bus stop. One might assign 100 to half a block and 0to four blocks. Now, suppose two new sites turn up. For one, the bus stopis right in front of the building entrance; for the other, it is five blocks away.The director might well judge that it scarcely matters whether the stop isin front of the building entrance or half a block away, and so assign 100 toall distances of half a block or closer. However, she might also feel that fiveblocks is meaningfully worse than four. She could handle the five-block casein either of two ways. She might simply disqualify the site on the basis of thatfact. Or, if she felt that the site deserved to be evaluated in spite of this disad-vantage, she could assign a negative score (it would turn out to be −29 . . . )to that site on that attribute. While such scores outside the 0 to 100 rangeare not common, and the ranges should be chosen with enough realism toavoid them if possible, nothing in the logic or formal structure of the methodprevents their use. It is more important that the range be realistic, so that theoptions are well spread out over its length, than it is to avoid an occasionalinstance in which options fall outside it.
Table 1.1 represents the location measures of the six sites that survivedinitial screening, transformed onto the 0 to 100 scale. As the director lookedat this table, she realized an important point. No matter what the weights,
Table 1.1. Location Measures for Six Sites
Twig Label
Site Number AA AB AC AD AE BA BB CA CB CC DA DB
1 90 50 30 90 10 40 80 10 60 50 10 02 50 30 80 30 60 30 70 80 50 40 70 403 10 100 70 40 30 0 95 5 10 50 90 504 100 80 10 50 50 50 50 50 10 10 50 955 20 5 95 10 100 90 5 90 90 95 50 106 40 30 80 30 50 30 70 50 50 30 60 40
P1: FCD
CB209-01 June 2, 1999 8:59
Multiattribute Evaluation 29
site 6 would never be best in utility. The reason why is that site 2 is at least asattractive as site 6 on all location measures, and definitely better on some. Intechnical language, site 2 dominates site 6. But Table 1.1 omits one importantissue: cost. Checking cost, she found that site 6 was in fact less expensivethan site 2, so she kept it in. If it had been as expensive as site 2 or moreso, she would have been justified in summarily rejecting it, since it couldnever beat site 2. No other option dominates or is dominated by another.(Although she might have dropped site 6 if it had not been cheaper thansite 2, she would have been unwise to notify the rental office of site 6 that itwas out of contention. If for some reason site 2 were to become unavailable,perhaps because it was rented to someone else, then site 6 would once morebe a contender.)
Aggregation of Location Measures and Weights
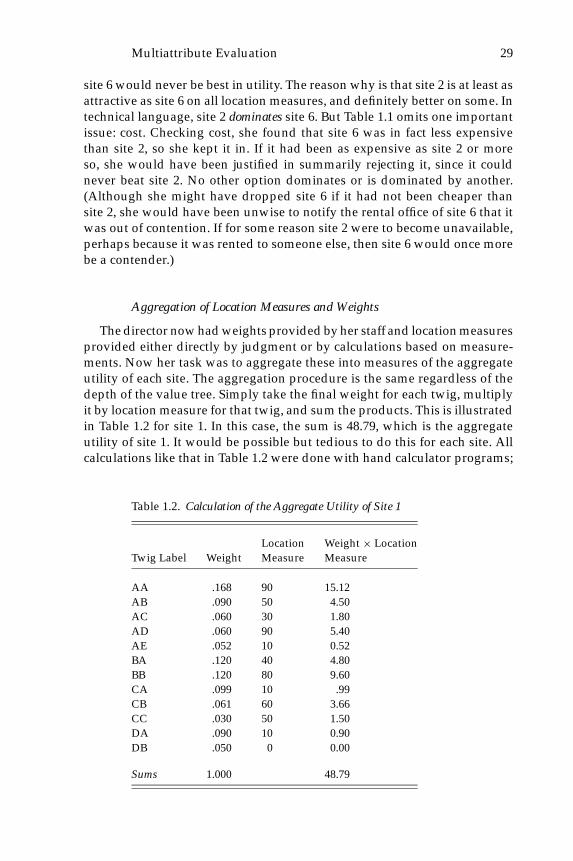
The director now had weights provided by her staff and location measuresprovided either directly by judgment or by calculations based on measure-ments. Now her task was to aggregate these into measures of the aggregateutility of each site. The aggregation procedure is the same regardless of thedepth of the value tree. Simply take the final weight for each twig, multiplyit by location measure for that twig, and sum the products. This is illustratedin Table 1.2 for site 1. In this case, the sum is 48.79, which is the aggregateutility of site 1. It would be possible but tedious to do this for each site. Allcalculations like that in Table 1.2 were done with hand calculator programs;
Table 1.2. Calculation of the Aggregate Utility of Site 1
Location Weight × LocationTwig Label Weight Measure Measure
AA .168 90 15.12AB .090 50 4.50AC .060 30 1.80AD .060 90 5.40AE .052 10 0.52BA .120 40 4.80BB .120 80 9.60CA .099 10 .99CB .061 60 3.66CC .030 50 1.50DA .090 10 0.90DB .050 0 0.00
Sums 1.000 48.79

P1: FCD
CB209-01 June 2, 1999 8:59
30 EDWARDS AND NEWMAN
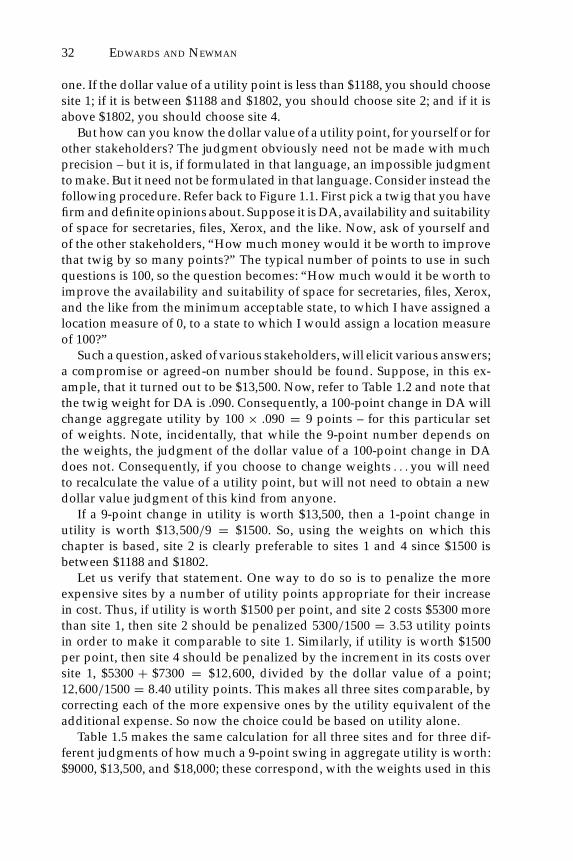
Table 1.3. Aggregate Utilities and Rents
CostSite Utility (rent per year)
1 48.80 $48,0002 53.26 53,3003 43.48 54,6004 57.31 60,6005 48.92 67,8006 46.90 53,200
the discrepancy between the 48.79 for site 1 of Table 1.2 and the 48.80 ofTable 1.3 is caused by a rounding process in the program. Table 1.3 showsthe aggregate utilities and the costs for each of the six sites. The costs aregiven as annual rents.
Now a version of the idea of dominance can be exploited again. InTable 1.3, the utility values can be considered as measures of desirabilityand the rents are costs. Obviously, you would not wish to pay more unlessyou got an increase in desirability. Consequently, options that are inferior toothers in both cost and desirability need not be considered further.
On utility, the rank ordering of the sites from best to worst is 425163. Oncost, it is 162345. Obviously sites 1 and 4 will be contenders, since 4 is bestin utility (with these weights) and 1 is best in cost. Site 5 is dominated, inthis aggregated sense, by site 4, and so is out of the race. Sites 3 and 6 aredominated by site 1, and are also out. So sites 1, 2, and 4 remain as contenders;2 is intermediate between 1 and 4 in both utility and cost. This result isgeneral. If a set of options is described by aggregated utilities and costs, anddominated options are removed, then all of the remaining options, if listed inorder of increasing utility, will turn out also to be listed in order of increasingcost. This makes the decision problem simpler; it reduces to whether eachincrement in utility gained from moving from an option lower to one higherin such a list is worth the increase in cost. Note that this property does notdepend on any numerical properties of the method that will eventually beused to aggregate utility with cost.
A special case arises if two or more options tie in utility, cost, or both.If the tie is in utility, then the one that costs least among the tied optionsdominates the others; the others should be eliminated. If they tie in cost,the one with the greatest utility dominates the others; the others should beeliminated. If they tie in both utility and cost, then only one of them need beexamined for dominance. If one is dominated, all are; if one is undominated,all are. So either all should be eliminated or all should survive to the nextstage of the analysis. Note that a tie in aggregate utility can occur in two
P1: FCD
CB209-01 June 2, 1999 8:59
Multiattribute Evaluation 31
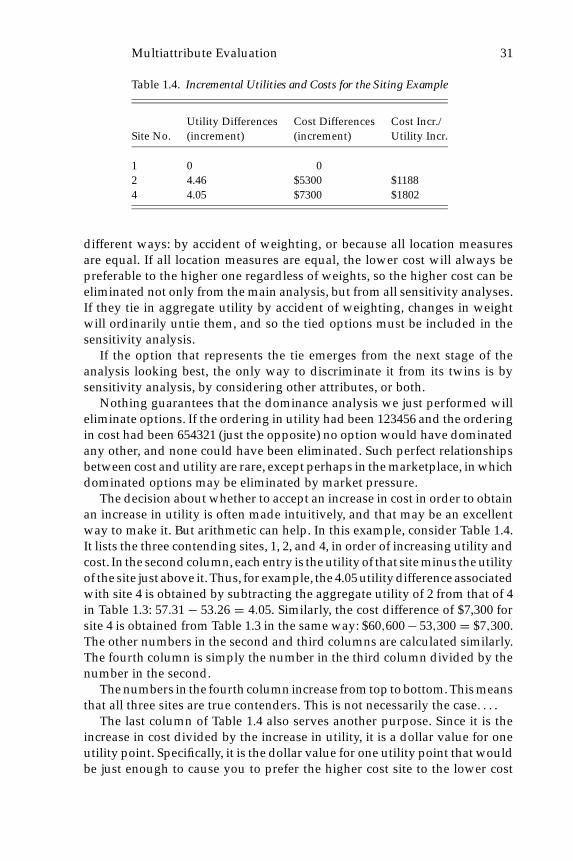
Table 1.4. Incremental Utilities and Costs for the Siting Example
Utility Differences Cost Differences Cost Incr./Site No. (increment) (increment) Utility Incr.
1 0 02 4.46 $5300 $11884 4.05 $7300 $1802
different ways: by accident of weighting, or because all location measuresare equal. If all location measures are equal, the lower cost will always bepreferable to the higher one regardless of weights, so the higher cost can beeliminated not only from the main analysis, but from all sensitivity analyses.If they tie in aggregate utility by accident of weighting, changes in weightwill ordinarily untie them, and so the tied options must be included in thesensitivity analysis.
If the option that represents the tie emerges from the next stage of theanalysis looking best, the only way to discriminate it from its twins is bysensitivity analysis, by considering other attributes, or both.
Nothing guarantees that the dominance analysis we just performed willeliminate options. If the ordering in utility had been 123456 and the orderingin cost had been 654321 (just the opposite) no option would have dominatedany other, and none could have been eliminated. Such perfect relationshipsbetween cost and utility are rare, except perhaps in the marketplace, in whichdominated options may be eliminated by market pressure.
The decision about whether to accept an increase in cost in order to obtainan increase in utility is often made intuitively, and that may be an excellentway to make it. But arithmetic can help. In this example, consider Table 1.4.It lists the three contending sites, 1, 2, and 4, in order of increasing utility andcost. In the second column, each entry is the utility of that site minus the utilityof the site just above it. Thus, for example, the 4.05 utility difference associatedwith site 4 is obtained by subtracting the aggregate utility of 2 from that of 4in Table 1.3: 57.31 − 53.26 = 4.05. Similarly, the cost difference of $7,300 forsite 4 is obtained from Table 1.3 in the same way: $60,600− 53,300 = $7,300.The other numbers in the second and third columns are calculated similarly.The fourth column is simply the number in the third column divided by thenumber in the second.
The numbers in the fourth column increase from top to bottom. This meansthat all three sites are true contenders. This is not necessarily the case. . . .
The last column of Table 1.4 also serves another purpose. Since it is theincrease in cost divided by the increase in utility, it is a dollar value for oneutility point. Specifically, it is the dollar value for one utility point that wouldbe just enough to cause you to prefer the higher cost site to the lower cost
P1: FCD
CB209-01 June 2, 1999 8:59
32 EDWARDS AND NEWMAN
one. If the dollar value of a utility point is less than $1188, you should choosesite 1; if it is between $1188 and $1802, you should choose site 2; and if it isabove $1802, you should choose site 4.
But how can you know the dollar value of a utility point, for yourself or forother stakeholders? The judgment obviously need not be made with muchprecision – but it is, if formulated in that language, an impossible judgmentto make. But it need not be formulated in that language. Consider instead thefollowing procedure. Refer back to Figure 1.1. First pick a twig that you havefirm and definite opinions about. Suppose it is DA, availability and suitabilityof space for secretaries, files, Xerox, and the like. Now, ask of yourself andof the other stakeholders, “How much money would it be worth to improvethat twig by so many points?” The typical number of points to use in suchquestions is 100, so the question becomes: “How much would it be worth toimprove the availability and suitability of space for secretaries, files, Xerox,and the like from the minimum acceptable state, to which I have assigned alocation measure of 0, to a state to which I would assign a location measureof 100?”
Such a question, asked of various stakeholders, will elicit various answers;a compromise or agreed-on number should be found. Suppose, in this ex-ample, that it turned out to be $13,500. Now, refer to Table 1.2 and note thatthe twig weight for DA is .090. Consequently, a 100-point change in DA willchange aggregate utility by 100 × .090 = 9 points – for this particular setof weights. Note, incidentally, that while the 9-point number depends onthe weights, the judgment of the dollar value of a 100-point change in DAdoes not. Consequently, if you choose to change weights . . .you will needto recalculate the value of a utility point, but will not need to obtain a newdollar value judgment of this kind from anyone.
If a 9-point change in utility is worth $13,500, then a 1-point change inutility is worth $13,500/9 = $1500. So, using the weights on which thischapter is based, site 2 is clearly preferable to sites 1 and 4 since $1500 isbetween $1188 and $1802.
Let us verify that statement. One way to do so is to penalize the moreexpensive sites by a number of utility points appropriate for their increasein cost. Thus, if utility is worth $1500 per point, and site 2 costs $5300 morethan site 1, then site 2 should be penalized 5300/1500 = 3.53 utility pointsin order to make it comparable to site 1. Similarly, if utility is worth $1500per point, then site 4 should be penalized by the increment in its costs oversite 1, $5300 + $7300 = $12,600, divided by the dollar value of a point;12,600/1500 = 8.40 utility points. This makes all three sites comparable, bycorrecting each of the more expensive ones by the utility equivalent of theadditional expense. So now the choice could be based on utility alone.
Table 1.5 makes the same calculation for all three sites and for three dif-ferent judgments of how much a 9-point swing in aggregate utility is worth:$9000, $13,500, and $18,000; these correspond, with the weights used in this
Related Documents