UNITED STATES SECURITIES AND EXCHANGE COMMISSION Washington, D.C. 20549 FORM 8-K CURRENT REPORT Pursuant to Section 13 or 15(d) of the Securities Exchange Act of 1934 Date of Report (date of earliest event reported): April 13, 2022 JPMorgan Chase & Co. (Exact name of registrant as specified in its charter) Delaware 1-5805 13-2624428 (State or other jurisdiction of incorporation or organization) (Commission File Number) (I.R.S. employer identification no.) 383 Madison Avenue, New York, New York 10179 (Address of principal executive offices) (Zip Code) Registrant’s telephone number, including area code: (212) 270-6000 Check the appropriate box below if the Form 8-K filing is intended to simultaneously satisfy the filing obligation of the registrant under any of the following provisions: ☐ Written communications pursuant to Rule 425 under the Securities Act (17 CFR 230.425) ☐ Soliciting material pursuant to Rule 14a-12 under the Exchange Act (17 CFR 240.14a-12) ☐ Pre-commencement communications pursuant to Rule 14d-2(b) under the Exchange Act (17 CFR 240.14d-2(b)) ☐ Pre-commencement communications pursuant to Rule 13e-4(c) under the Exchange Act (17 CFR 240.13e-4(c)) Securities registered pursuant to Section 12(b) of the Act: Title of each class Trading Symbol(s) Name of each exchange on which registered Common stock JPM The New York Stock Exchange Depositary Shares, each representing a one-four hundredth interest in a share of 5.75% Non-Cumulative Preferred Stock, Series DD JPM PR D The New York Stock Exchange Depositary Shares, each representing a one-four hundredth interest in a share of 6.00% Non-Cumulative Preferred Stock, Series EE JPM PR C The New York Stock Exchange Depositary Shares, each representing a one-four hundredth interest in a share of 4.75% Non-Cumulative Preferred Stock, Series GG JPM PR J The New York Stock Exchange Depositary Shares, each representing a one-four hundredth interest in a share of 4.55% Non-Cumulative Preferred Stock, Series JJ JPM PR K The New York Stock Exchange Depositary Shares, each representing a one-four hundredth interest in a share of 4.625% Non-Cumulative Preferred Stock, Series LL JPM PR L The New York Stock Exchange Depositary Shares, each representing a one-four hundredth interest in a share of 4.20% Non-Cumulative Preferred Stock, Series MM JPM PR M The New York Stock Exchange Alerian MLP Index ETNs due May 24, 2024 AMJ NYSE Arca, Inc. Guarantee of Callable Fixed Rate Notes due June 10, 2032 of JPMorgan Chase Financial Company LLC JPM/32 The New York Stock Exchange Indicate by check mark whether the registrant is an emerging growth company as defined in Rule 405 of the Securities Act of 1933 (§230.405 of this chapter) or Rule 12b-2 of the Securities Exchange Act of 1934 (§240.12b-2 of this chapter). Emerging growth company ☐ If an emerging growth company, indicate by check mark if the registrant has elected not to use the extended transition period for complying with any new or revised financial accounting standards provided pursuant to Section 13(a) of the Exchange Act. ☐

Welcome message from author
This document is posted to help you gain knowledge. Please leave a comment to let me know what you think about it! Share it to your friends and learn new things together.
Transcript
UNITED STATESSECURITIES AND EXCHANGE COMMISSION
Washington, D.C. 20549
FORM 8-K
CURRENT REPORTPursuant to Section 13 or 15(d)
of the Securities Exchange Act of 1934
Date of Report (date of earliest event reported): April 13, 2022
JPMorgan Chase & Co.(Exact name of registrant as specified in its charter)
Delaware 1-5805 13-2624428(State or other jurisdiction of
incorporation or organization)(Commission File
Number)(I.R.S. employer
identification no.)
383 Madison Avenue,New York, New York 10179
(Address of principal executive offices) (Zip Code)
Registrant’s telephone number, including area code: (212) 270-6000Check the appropriate box below if the Form 8-K filing is intended to simultaneously satisfy the filing obligation of the registrant under any of the following provisions:
☐ Written communications pursuant to Rule 425 under the Securities Act (17 CFR 230.425)
☐ Soliciting material pursuant to Rule 14a-12 under the Exchange Act (17 CFR 240.14a-12)
☐ Pre-commencement communications pursuant to Rule 14d-2(b) under the Exchange Act (17 CFR 240.14d-2(b))
☐ Pre-commencement communications pursuant to Rule 13e-4(c) under the Exchange Act (17 CFR 240.13e-4(c))
Securities registered pursuant to Section 12(b) of the Act:
Title of each class Trading Symbol(s) Name of each exchange on which registeredCommon stock JPM The New York Stock ExchangeDepositary Shares, each representing a one-four hundredth interest in a share of 5.75% Non-Cumulative Preferred Stock, Series DD JPM PR D The New York Stock ExchangeDepositary Shares, each representing a one-four hundredth interest in a share of 6.00% Non-Cumulative Preferred Stock, Series EE JPM PR C The New York Stock ExchangeDepositary Shares, each representing a one-four hundredth interest in a share of 4.75% Non-Cumulative Preferred Stock, Series GG JPM PR J The New York Stock ExchangeDepositary Shares, each representing a one-four hundredth interest in a share of 4.55% Non-Cumulative Preferred Stock, Series JJ JPM PR K The New York Stock ExchangeDepositary Shares, each representing a one-four hundredth interest in a share of 4.625% Non-Cumulative Preferred Stock, Series LL JPM PR L The New York Stock ExchangeDepositary Shares, each representing a one-four hundredth interest in a share of 4.20% Non-Cumulative Preferred Stock, Series MM JPM PR M The New York Stock ExchangeAlerian MLP Index ETNs due May 24, 2024 AMJ NYSE Arca, Inc.Guarantee of Callable Fixed Rate Notes due June 10, 2032 of JPMorgan Chase Financial Company LLC JPM/32 The New York Stock Exchange
Indicate by check mark whether the registrant is an emerging growth company as defined in Rule 405 of the Securities Act of 1933 (§230.405 of this chapter) or Rule 12b-2 of the Securities Exchange Act of 1934 (§240.12b-2 of this chapter).Emerging growth company ☐If an emerging growth company, indicate by check mark if the registrant has elected not to use the extended transition period for complying with any new or revised financial accounting standards provided pursuant to Section 13(a) of the Exchange Act. ☐
Item 2.02 Results of Operations and Financial ConditionOn April 13, 2022, JPMorgan Chase & Co. (“JPMorgan Chase” or the “Firm”) reported 2022 first quarter net income of $8.3 billion, or $2.63 per share, compared with net income of $14.3 billion, or $4.50 per share,in the first quarter of 2021. A copy of the 2022 first quarter earnings release is attached hereto as Exhibit 99.1, and a copy of the earnings release financial supplement is attached hereto as Exhibit 99.2.
Each of the Exhibits provided with this Form 8-K shall be deemed to be “filed” for purposes of the Securities Exchange Act of 1934.
This Current Report on Form 8-K (including the Exhibits hereto) contains forward-looking statements within the meaning of the Private Securities Litigation Reform Act of 1995. These statements are based on thecurrent beliefs and expectations of JPMorgan Chase’s management and are subject to significant risks and uncertainties. Actual results may differ from those set forth in the forward-looking statements. Factors thatcould cause JPMorgan Chase’s actual results to differ materially from those described in the forward-looking statements can be found in JPMorgan Chase’s Annual Report on Form 10-K for the year endedDecember 31, 2021, which has been filed with the Securities and Exchange Commission and is available on JPMorgan Chase’s website (https://jpmorganchaseco.gcs-web.com/financial-information/sec-filings) andon the Securities and Exchange Commission’s website (www.sec.gov). JPMorgan Chase does not undertake to update any forward-looking statements.
Item 9.01 Financial Statements and Exhibits
(d) Exhibits
Exhibit No. Description of Exhibit 99.1 JPMorgan Chase & Co. Earnings Release - First Quarter 2022 Results99.2 JPMorgan Chase & Co. Earnings Release Financial Supplement - First Quarter 2022101 Pursuant to Rule 406 of Regulation S-T, the cover page is formatted in Inline XBRL (Inline eXtensible Business Reporting Language).104 Cover Page Interactive Data File (embedded within the Inline XBRL document and included in Exhibit 101).
2

SIGNATURE
Pursuant to the requirements of the Securities Exchange Act of 1934, the Registrant has duly caused this report to be signed on its behalf by the undersigned hereunto duly authorized.
JPMorgan Chase & Co.(Registrant)
By: /s/ Elena KorablinaElena Korablina
Managing Director and Firmwide Controller(Principal Accounting Officer)
Dated: April 13, 2022
3
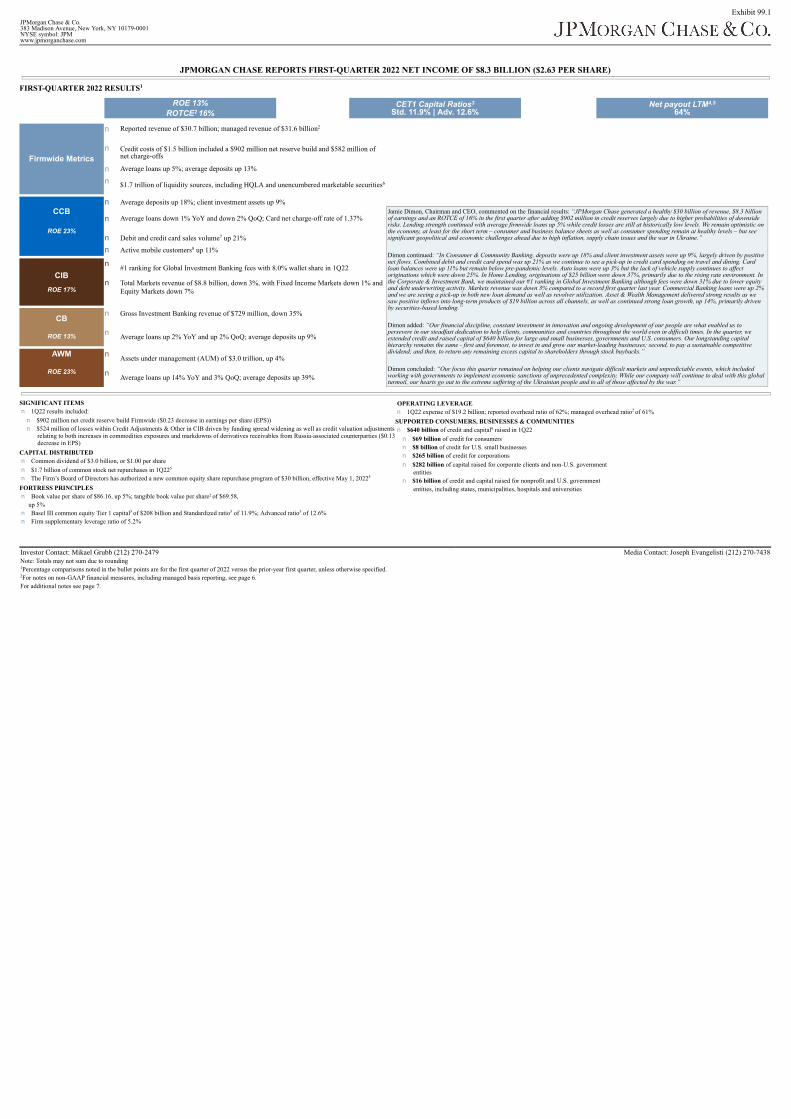
Exhibit 99.1JPMorgan Chase & Co.383 Madison Avenue, New York, NY 10179-0001NYSE symbol: JPMwww.jpmorganchase.com
JPMORGAN CHASE REPORTS FIRST-QUARTER 2022 NET INCOME OF $8.3 BILLION ($2.63 PER SHARE)
FIRST-QUARTER 2022 RESULTS
ROE 13%ROTCE 16%
CET1 Capital RatiosStd. 11.9% | Adv. 12.6%
Net payout LTM64%
Firmwide Metrics
n Reported revenue of $30.7 billion; managed revenue of $31.6 billion
n Credit costs of $1.5 billion included a $902 million net reserve build and $582 million ofnet charge-offs
n Average loans up 5%; average deposits up 13%
n $1.7 trillion of liquidity sources, including HQLA and unencumbered marketable securities
CCB
ROE 23%
n Average deposits up 18%; client investment assets up 9%
n Average loans down 1% YoY and down 2% QoQ; Card net charge-off rate of 1.37%
n Debit and credit card sales volume up 21%
n Active mobile customers up 11%
CIB
ROE 17%
n #1 ranking for Global Investment Banking fees with 8.0% wallet share in 1Q22
n Total Markets revenue of $8.8 billion, down 3%, with Fixed Income Markets down 1% andEquity Markets down 7%
CB
ROE 13%
n Gross Investment Banking revenue of $729 million, down 35%
n Average loans up 2% YoY and up 2% QoQ; average deposits up 9%
AWM
ROE 23%
n Assets under management (AUM) of $3.0 trillion, up 4%
n Average loans up 14% YoY and 3% QoQ; average deposits up 39%
Jamie Dimon, Chairman and CEO, commented on the financial results: “JPMorgan Chase generated a healthy $30 billion of revenue, $8.3 billionof earnings and an ROTCE of 16% in the first quarter after adding $902 million in credit reserves largely due to higher probabilities of downsiderisks. Lending strength continued with average firmwide loans up 5% while credit losses are still at historically low levels. We remain optimistic onthe economy, at least for the short term – consumer and business balance sheets as well as consumer spending remain at healthy levels – but seesignificant geopolitical and economic challenges ahead due to high inflation, supply chain issues and the war in Ukraine.”
Dimon continued: “In Consumer & Community Banking, deposits were up 18% and client investment assets were up 9%, largely driven by positivenet flows. Combined debit and credit card spend was up 21% as we continue to see a pick-up in credit card spending on travel and dining. Cardloan balances were up 11% but remain below pre-pandemic levels. Auto loans were up 3% but the lack of vehicle supply continues to affectoriginations which were down 25%. In Home Lending, originations of $25 billion were down 37%, primarily due to the rising rate environment. Inthe Corporate & Investment Bank, we maintained our #1 ranking in Global Investment Banking although fees were down 31% due to lower equityand debt underwriting activity. Markets revenue was down 3% compared to a record first quarter last year. Commercial Banking loans were up 2%and we are seeing a pick-up in both new loan demand as well as revolver utilization. Asset & Wealth Management delivered strong results as wesaw positive inflows into long-term products of $19 billion across all channels, as well as continued strong loan growth, up 14%, primarily drivenby securities-based lending.”
Dimon added: “Our financial discipline, constant investment in innovation and ongoing development of our people are what enabled us topersevere in our steadfast dedication to help clients, communities and countries throughout the world even in difficult times. In the quarter, weextended credit and raised capital of $640 billion for large and small businesses, governments and U.S. consumers. Our longstanding capitalhierarchy remains the same - first and foremost, to invest in and grow our market-leading businesses; second, to pay a sustainable competitivedividend; and then, to return any remaining excess capital to shareholders through stock buybacks.”
Dimon concluded: “Our focus this quarter remained on helping our clients navigate difficult markets and unpredictable events, which includedworking with governments to implement economic sanctions of unprecedented complexity. While our company will continue to deal with this globalturmoil, our hearts go out to the extreme suffering of the Ukrainian people and to all of those affected by the war.”
SIGNIFICANT ITEMSn 1Q22 results included:
n $902 million net credit reserve build Firmwide ($0.23 decrease in earnings per share (EPS))n $524 million of losses within Credit Adjustments & Other in CIB driven by funding spread widening as well as credit valuation adjustments
relating to both increases in commodities exposures and markdowns of derivatives receivables from Russia-associated counterparties ($0.13decrease in EPS)
CAPITAL DISTRIBUTEDn Common dividend of $3.0 billion, or $1.00 per sharen $1.7 billion of common stock net repurchases in 1Q22n The Firm’s Board of Directors has authorized a new common equity share repurchase program of $30 billion, effective May 1, 2022
FORTRESS PRINCIPLESn Book value per share of $86.16, up 5%; tangible book value per share of $69.58,
up 5%n Basel III common equity Tier 1 capital of $208 billion and Standardized ratio of 11.9%; Advanced ratio of 12.6%n Firm supplementary leverage ratio of 5.2%
OPERATING LEVERAGEn 1Q22 expense of $19.2 billion; reported overhead ratio of 62%; managed overhead ratio of 61%
SUPPORTED CONSUMERS, BUSINESSES & COMMUNITIESn $640 billion of credit and capital raised in 1Q22
n $69 billion of credit for consumersn $8 billion of credit for U.S. small businessesn $265 billion of credit for corporationsn $282 billion of capital raised for corporate clients and non-U.S. government
entitiesn $16 billion of credit and capital raised for nonprofit and U.S. government
entities, including states, municipalities, hospitals and universities
1
2
3 4,5
2
6
7
8
5
5
2
3 3 3
2
9
Investor Contact: Mikael Grubb (212) 270-2479Note: Totals may not sum due to roundingPercentage comparisons noted in the bullet points are for the first quarter of 2022 versus the prior-year first quarter, unless otherwise specified.For notes on non-GAAP financial measures, including managed basis reporting, see page 6.
For additional notes see page 7.
Media Contact: Joseph Evangelisti (212) 270-7438
1
2
JPMorgan Chase & Co.News Release
In the discussion below of Firmwide results of JPMorgan Chase & Co. (“JPMorgan Chase” or the “Firm”), information is presented on a managed basis, which is a non-GAAP financial measure, unless otherwise specified. Thediscussion below of the Firm’s business segments is also presented on a managed basis. For more information about managed basis, and non-GAAP financial measures used by management to evaluate the performance of each line ofbusiness, refer to page 6.
Comparisons noted in the sections below are for the first quarter of 2022 versus the prior-year first quarter, unless otherwise specified.
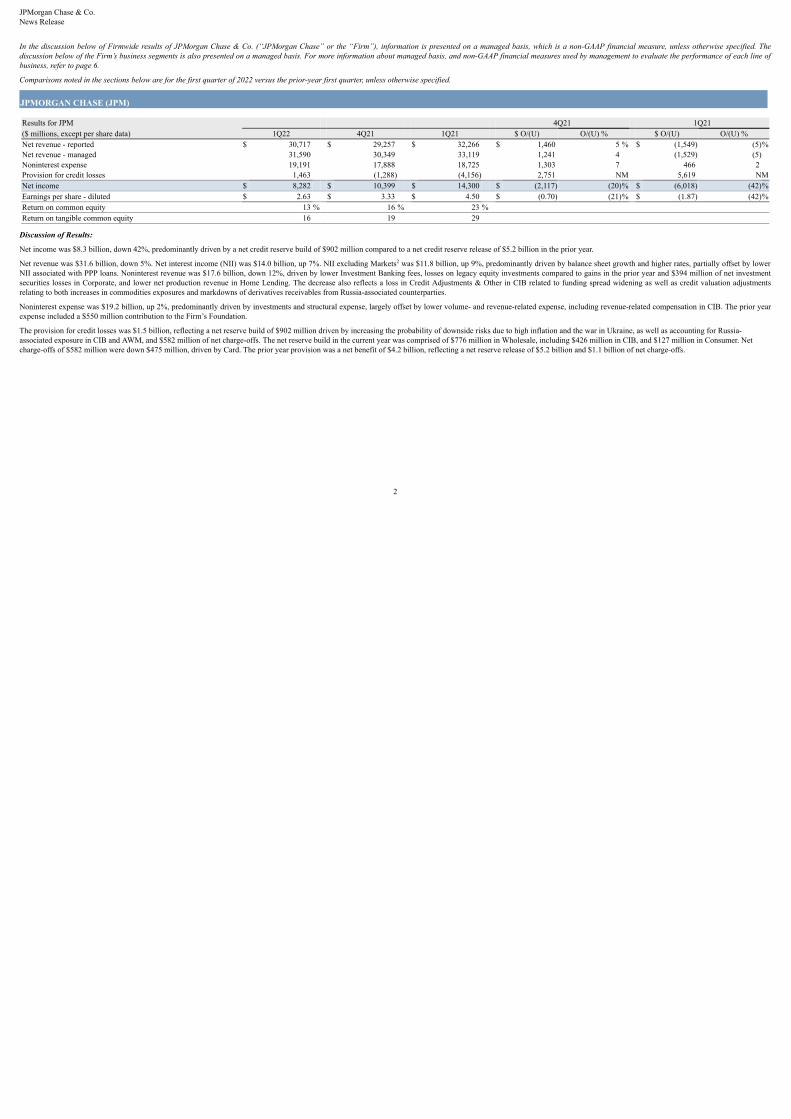
JPMORGAN CHASE (JPM)
Results for JPM 4Q21 1Q21($ millions, except per share data) 1Q22 4Q21 1Q21 $ O/(U) O/(U) % $ O/(U) O/(U) %Net revenue - reported $ 30,717 $ 29,257 $ 32,266 $ 1,460 5 % $ (1,549) (5)%Net revenue - managed 31,590 30,349 33,119 1,241 4 (1,529) (5)Noninterest expense 19,191 17,888 18,725 1,303 7 466 2 Provision for credit losses 1,463 (1,288) (4,156) 2,751 NM 5,619 NMNet income $ 8,282 $ 10,399 $ 14,300 $ (2,117) (20)% $ (6,018) (42)%Earnings per share - diluted $ 2.63 $ 3.33 $ 4.50 $ (0.70) (21)% $ (1.87) (42)%Return on common equity 13 % 16 % 23 %Return on tangible common equity 16 19 29
Discussion of Results:
Net income was $8.3 billion, down 42%, predominantly driven by a net credit reserve build of $902 million compared to a net credit reserve release of $5.2 billion in the prior year.
Net revenue was $31.6 billion, down 5%. Net interest income (NII) was $14.0 billion, up 7%. NII excluding Markets was $11.8 billion, up 9%, predominantly driven by balance sheet growth and higher rates, partially offset by lowerNII associated with PPP loans. Noninterest revenue was $17.6 billion, down 12%, driven by lower Investment Banking fees, losses on legacy equity investments compared to gains in the prior year and $394 million of net investmentsecurities losses in Corporate, and lower net production revenue in Home Lending. The decrease also reflects a loss in Credit Adjustments & Other in CIB related to funding spread widening as well as credit valuation adjustmentsrelating to both increases in commodities exposures and markdowns of derivatives receivables from Russia-associated counterparties.
Noninterest expense was $19.2 billion, up 2%, predominantly driven by investments and structural expense, largely offset by lower volume- and revenue-related expense, including revenue-related compensation in CIB. The prior yearexpense included a $550 million contribution to the Firm’s Foundation.
The provision for credit losses was $1.5 billion, reflecting a net reserve build of $902 million driven by increasing the probability of downside risks due to high inflation and the war in Ukraine, as well as accounting for Russia-associated exposure in CIB and AWM, and $582 million of net charge-offs. The net reserve build in the current year was comprised of $776 million in Wholesale, including $426 million in CIB, and $127 million in Consumer. Netcharge-offs of $582 million were down $475 million, driven by Card. The prior year provision was a net benefit of $4.2 billion, reflecting a net reserve release of $5.2 billion and $1.1 billion of net charge-offs.
2
2

JPMorgan Chase & Co.News Release
CONSUMER & COMMUNITY BANKING (CCB)
Results for CCB 4Q21 1Q21($ millions) 1Q22 4Q21 1Q21 $ O/(U) O/(U) % $ O/(U) O/(U) %Net revenue $ 12,229 $ 12,275 $ 12,517 $ (46) — % $ (288) (2)%
Consumer & Business Banking 6,062 6,172 5,635 (110) (2) 427 8 Home Lending 1,169 1,084 1,458 85 8 (289) (20)Card & Auto 4,998 5,019 5,424 (21) — (426) (8)
Noninterest expense 7,720 7,754 7,202 (34) — 518 7 Provision for credit losses 678 (1,060) (3,602) 1,738 NM 4,280 NMNet income $ 2,895 $ 4,147 $ 6,787 $ (1,252) (30)% $ (3,892) (57)%
Discussion of Results :
Net income was $2.9 billion, down 57%, reflecting the absence of the net credit reserve release recorded in the prior year. Net revenue was $12.2 billion, down 2%.
Consumer & Business Banking net revenue was $6.1 billion, up 8%, predominantly driven by growth in deposits and client investment assets, partially offset by deposit margin compression. Home Lending net revenue was $1.2 billion,down 20%, predominantly driven by lower production revenue from lower margins and volume, largely offset by higher net mortgage servicing revenue. Card & Auto net revenue was $5.0 billion, down 8%, on strong new Cardaccount originations leading to higher acquisition costs and lower Auto operating lease income, partially offset by higher Card net interest income on higher revolving balances.
Noninterest expense was $7.7 billion, up 7%, driven by higher investments and structural expense, partially offset by lower volume- and revenue-related expense, primarily auto lease depreciation.
The provision for credit losses was $678 million, reflecting net charge-offs of $553 million, down $470 million, driven by Card. The prior year provision reflected a $4.6 billion reserve release.
10
3
JPMorgan Chase & Co.News Release
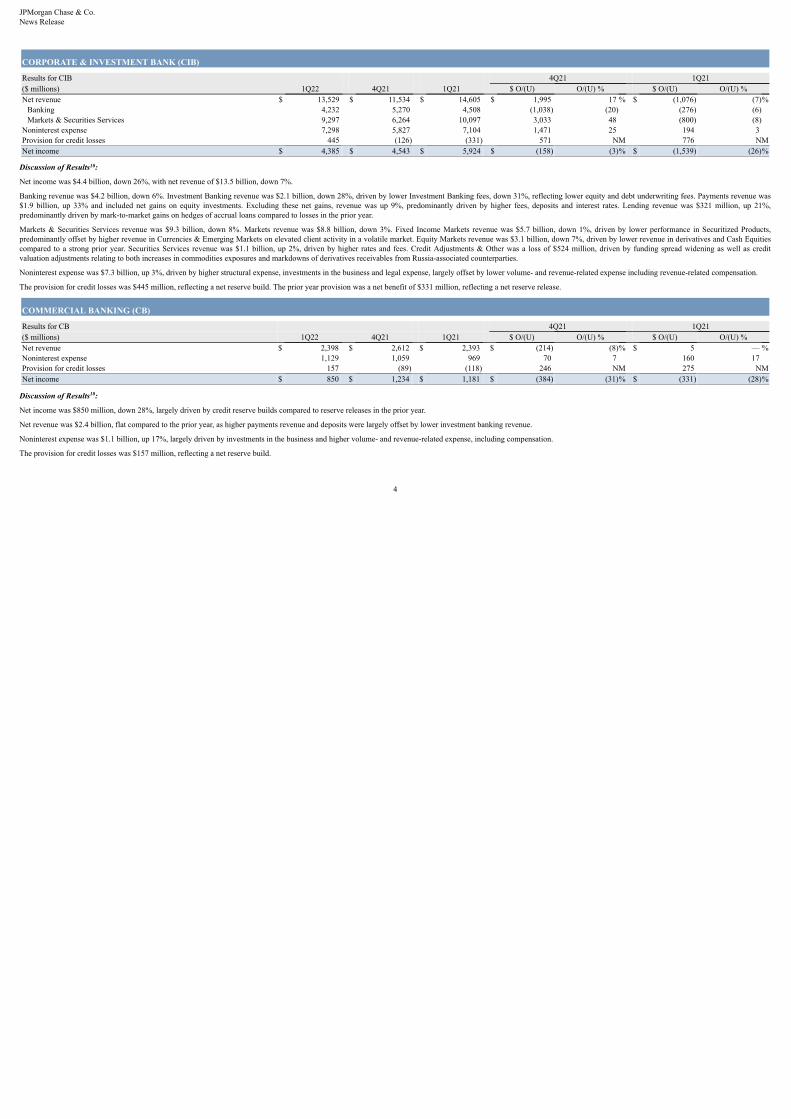
CORPORATE & INVESTMENT BANK (CIB)
Results for CIB 4Q21 1Q21($ millions) 1Q22 4Q21 1Q21 $ O/(U) O/(U) % $ O/(U) O/(U) %Net revenue $ 13,529 $ 11,534 $ 14,605 $ 1,995 17 % $ (1,076) (7)%
Banking 4,232 5,270 4,508 (1,038) (20) (276) (6)Markets & Securities Services 9,297 6,264 10,097 3,033 48 (800) (8)
Noninterest expense 7,298 5,827 7,104 1,471 25 194 3 Provision for credit losses 445 (126) (331) 571 NM 776 NMNet income $ 4,385 $ 4,543 $ 5,924 $ (158) (3)% $ (1,539) (26)%
Discussion of Results :
Net income was $4.4 billion, down 26%, with net revenue of $13.5 billion, down 7%.
Banking revenue was $4.2 billion, down 6%. Investment Banking revenue was $2.1 billion, down 28%, driven by lower Investment Banking fees, down 31%, reflecting lower equity and debt underwriting fees. Payments revenue was$1.9 billion, up 33% and included net gains on equity investments. Excluding these net gains, revenue was up 9%, predominantly driven by higher fees, deposits and interest rates. Lending revenue was $321 million, up 21%,predominantly driven by mark-to-market gains on hedges of accrual loans compared to losses in the prior year.
Markets & Securities Services revenue was $9.3 billion, down 8%. Markets revenue was $8.8 billion, down 3%. Fixed Income Markets revenue was $5.7 billion, down 1%, driven by lower performance in Securitized Products,predominantly offset by higher revenue in Currencies & Emerging Markets on elevated client activity in a volatile market. Equity Markets revenue was $3.1 billion, down 7%, driven by lower revenue in derivatives and Cash Equitiescompared to a strong prior year. Securities Services revenue was $1.1 billion, up 2%, driven by higher rates and fees. Credit Adjustments & Other was a loss of $524 million, driven by funding spread widening as well as creditvaluation adjustments relating to both increases in commodities exposures and markdowns of derivatives receivables from Russia-associated counterparties.
Noninterest expense was $7.3 billion, up 3%, driven by higher structural expense, investments in the business and legal expense, largely offset by lower volume- and revenue-related expense including revenue-related compensation.
The provision for credit losses was $445 million, reflecting a net reserve build. The prior year provision was a net benefit of $331 million, reflecting a net reserve release.
COMMERCIAL BANKING (CB)
Results for CB 4Q21 1Q21($ millions) 1Q22 4Q21 1Q21 $ O/(U) O/(U) % $ O/(U) O/(U) %Net revenue $ 2,398 $ 2,612 $ 2,393 $ (214) (8)% $ 5 — %Noninterest expense 1,129 1,059 969 70 7 160 17 Provision for credit losses 157 (89) (118) 246 NM 275 NMNet income $ 850 $ 1,234 $ 1,181 $ (384) (31)% $ (331) (28)%
Discussion of Results :
Net income was $850 million, down 28%, largely driven by credit reserve builds compared to reserve releases in the prior year.
Net revenue was $2.4 billion, flat compared to the prior year, as higher payments revenue and deposits were largely offset by lower investment banking revenue.
Noninterest expense was $1.1 billion, up 17%, largely driven by investments in the business and higher volume- and revenue-related expense, including compensation.
The provision for credit losses was $157 million, reflecting a net reserve build.
10
10
4
JPMorgan Chase & Co.News Release
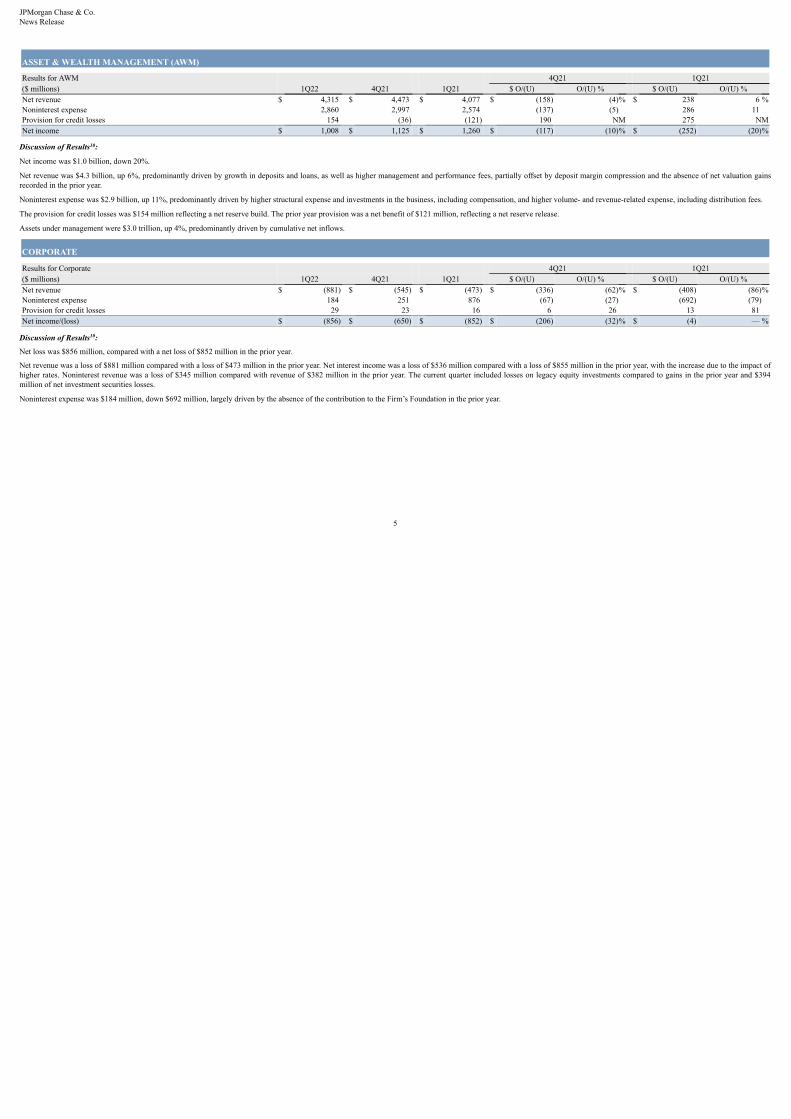
ASSET & WEALTH MANAGEMENT (AWM)
Results for AWM 4Q21 1Q21($ millions) 1Q22 4Q21 1Q21 $ O/(U) O/(U) % $ O/(U) O/(U) %Net revenue $ 4,315 $ 4,473 $ 4,077 $ (158) (4)% $ 238 6 %Noninterest expense 2,860 2,997 2,574 (137) (5) 286 11 Provision for credit losses 154 (36) (121) 190 NM 275 NMNet income $ 1,008 $ 1,125 $ 1,260 $ (117) (10)% $ (252) (20)%
Discussion of Results :
Net income was $1.0 billion, down 20%.
Net revenue was $4.3 billion, up 6%, predominantly driven by growth in deposits and loans, as well as higher management and performance fees, partially offset by deposit margin compression and the absence of net valuation gainsrecorded in the prior year.
Noninterest expense was $2.9 billion, up 11%, predominantly driven by higher structural expense and investments in the business, including compensation, and higher volume- and revenue-related expense, including distribution fees.
The provision for credit losses was $154 million reflecting a net reserve build. The prior year provision was a net benefit of $121 million, reflecting a net reserve release.
Assets under management were $3.0 trillion, up 4%, predominantly driven by cumulative net inflows.
CORPORATE
Results for Corporate 4Q21 1Q21($ millions) 1Q22 4Q21 1Q21 $ O/(U) O/(U) % $ O/(U) O/(U) %Net revenue $ (881) $ (545) $ (473) $ (336) (62)% $ (408) (86)%Noninterest expense 184 251 876 (67) (27) (692) (79)Provision for credit losses 29 23 16 6 26 13 81 Net income/(loss) $ (856) $ (650) $ (852) $ (206) (32)% $ (4) — %
Discussion of Results :
Net loss was $856 million, compared with a net loss of $852 million in the prior year.
Net revenue was a loss of $881 million compared with a loss of $473 million in the prior year. Net interest income was a loss of $536 million compared with a loss of $855 million in the prior year, with the increase due to the impact ofhigher rates. Noninterest revenue was a loss of $345 million compared with revenue of $382 million in the prior year. The current quarter included losses on legacy equity investments compared to gains in the prior year and $394million of net investment securities losses.
Noninterest expense was $184 million, down $692 million, largely driven by the absence of the contribution to the Firm’s Foundation in the prior year.
10
10
5

JPMorgan Chase & Co.News Release
2. Notes on non-GAAP financial measures:
a. The Firm prepares its Consolidated Financial Statements in accordance with accounting principles generally accepted in the U.S. (“U.S. GAAP”). That presentation, which is referred to as “reported” basis, provides the reader withan understanding of the Firm’s results that can be tracked consistently from year-to-year and enables a comparison of the Firm’s performance with the U.S. GAAP financial statements of other companies. In addition to analyzingthe Firm’s results on a reported basis, management reviews Firmwide results, including the overhead ratio, on a “managed” basis; these Firmwide managed basis results are non-GAAP financial measures. The Firm also reviews theresults of the lines of business on a managed basis. The Firm’s definition of managed basis starts, in each case, with the reported U.S. GAAP results and includes certain reclassifications to present total net revenue for the Firm andeach of the reportable business segments on a fully taxable-equivalent basis. Accordingly, revenue from investments that receive tax credits and tax-exempt securities is presented in the managed results on a basis comparable totaxable investments and securities. These financial measures allow management to assess the comparability of revenue from year-to-year arising from both taxable and tax-exempt sources. The corresponding income tax impactrelated to tax-exempt items is recorded within income tax expense. These adjustments have no impact on net income as reported by the Firm as a whole or by the lines of business. For a reconciliation of the Firm’s results from areported to managed basis, refer to page 7 of the Earnings Release Financial Supplement.
b. Tangible common equity (“TCE”), return on tangible common equity (“ROTCE”) and tangible book value per share (“TBVPS”), are each non-GAAP financial measures. TCE represents the Firm’s common stockholders’ equity(i.e., total stockholders’ equity less preferred stock) less goodwill and identifiable intangible assets (other than mortgage servicing rights), net of related deferred tax liabilities. For a reconciliation from common stockholders’ equityto TCE, refer to page 9 of the Earnings Release Financial Supplement. ROTCE measures the Firm’s net income applicable to common equity as a percentage of average TCE. TBVPS represents the Firm’s TCE at period-enddivided by common shares at period-end. Book value per share was $86.16, $88.07 and $82.31 at March 31, 2022, December 31, 2021, and March 31, 2021, respectively. TCE, ROTCE, and TBVPS are utilized by the Firm, as wellas investors and analysts, in assessing the Firm’s use of equity.
c. In addition to reviewing net interest income (“NII”) and noninterest revenue (“NIR”) on a managed basis, management also reviews these metrics excluding CIB Markets (“Markets”, which is composed of Fixed Income Marketsand Equity Markets). Markets revenue consists of principal transactions, fees, commissions and other income, as well as net interest income. These metrics, which exclude Markets, are non-GAAP financial measures. Managementreviews these metrics to assess the performance of the Firm’s lending, investing (including asset-liability management) and deposit-raising activities, apart from any volatility associated with Markets activities. In addition,management also assesses Markets business performance on a total revenue basis as offsets may occur across revenue lines. For example, securities that generate net interest income may be risk-managed by derivatives that arereflected at fair value in principal transactions revenue. Management believes these measures provide investors and analysts with alternative measures to analyze the revenue trends of the Firm. For a reconciliation of NII and NIRfrom reported to excluding Markets, refer to page 28 of the Earnings Release Financial Supplement. For additional information on Markets revenue, refer to page 70 of the Firm’s 2021 Form 10-K.
6

JPMorgan Chase & Co.News Release
Additional notes:
3. Estimated. Reflects the relief provided by the Federal Reserve Board in response to the COVID-19 pandemic, including the Current Expected Credit Losses (“CECL”) capital transition provisions which expired on December 31,2021. Effective January 1, 2022, the $2.9 billion CECL capital benefit recognized as of December 31, 2021 will be phased out at 25% per year over a three-year period. As of March 31, 2022, CET1 capital reflected the remaining75%, or $2.2 billion, benefit associated with the CECL capital transition provisions. Refer to Capital Risk Management on pages 86-96 of the Firm’s 2021 Form 10-K for additional information.
4. Last twelve months (“LTM”).
5. Includes the net impact of employee issuances. The authorization to repurchase common equity will be utilized at management’s discretion, and the timing of repurchases and the exact amount of common equity that may berepurchased under the new authorization will be subject to various considerations.
6. Estimated. High-quality liquid assets (“HQLA”) and unencumbered marketable securities, includes the Firm’s average eligible HQLA, other end-of-period HQLA-eligible securities which are included as part of the excess liquidityat JPMorgan Chase Bank, N.A. that are not transferable to non-bank affiliates and thus excluded from the Firm’s liquidity coverage ratio (“LCR”) under the LCR rule, and other end-of-period unencumbered marketable securities,such as equity and debt securities. Does not include borrowing capacity at Federal Home Loan Banks and the discount window at the Federal Reserve Bank. Refer to Liquidity Risk Management on pages 97-104 of the Firm’s 2021Form 10-K for additional information.
7. Excludes Commercial Card.
8. Users of all mobile platforms who have logged in within the past 90 days.
9. Credit provided to clients represents new and renewed credit, including loans and commitments.
10. In the first quarter of 2022, the Firm changed its methodology for allocating income taxes to the LOBs, with no impact to Firmwide net income. Prior period amounts have been revised to conform with the current presentation.
7

JPMorgan Chase & Co.News Release
JPMorgan Chase & Co. (NYSE: JPM) is a leading financial services firm based in the United States of America (“U.S.”), with operations worldwide. JPMorgan Chase had $4.0 trillion in assets and $285.9 billion in stockholders’ equityas of March 31, 2022. The Firm is a leader in investment banking, financial services for consumers and small businesses, commercial banking, financial transaction processing and asset management. Under the J.P. Morgan and Chasebrands, the Firm serves millions of customers predominantly in the U.S. and many of the world’s most prominent corporate, institutional and government clients globally. Information about JPMorgan Chase & Co. is available atwww.jpmorganchase.com.
JPMorgan Chase & Co. will host a conference call today, April 13, 2022, at 8:30 a.m. (Eastern) to present first quarter 2022 financial results. The general public can access the call by dialing (866) 659-9159 in the U.S. and Canada, or(617) 399-5172 for international participants; use passcode 26483228#. Please dial in 15 minutes prior to the start of the call. The live audio webcast and presentation slides will be available on the Firm’s website,www.jpmorganchase.com, under Investor Relations, Events & Presentations.
A replay of the conference call will be available beginning at approximately 11:00 a.m. (Eastern) on April 13, 2022, through 11:59 p.m. on April 27, 2022, by telephone at (888) 286-8010 (U.S. and Canada) or (617) 801-6888(international); use passcode 82891322#. The replay will also be available via webcast on www.jpmorganchase.com under Investor Relations, Events & Presentations. Additional detailed financial, statistical and business-relatedinformation is included in a financial supplement. The earnings release and the financial supplement are available at www.jpmorganchase.com.
This earnings release contains forward-looking statements within the meaning of the Private Securities Litigation Reform Act of 1995. These statements are based on the current beliefs and expectations of JPMorgan Chase & Co.’smanagement and are subject to significant risks and uncertainties. Actual results may differ from those set forth in the forward-looking statements. Factors that could cause JPMorgan Chase & Co.’s actual results to differ materiallyfrom those described in the forward-looking statements can be found in JPMorgan Chase & Co.’s Annual Report on Form 10-K for the year ended December 31, 2021, which has been filed with the Securities and ExchangeCommission and is available on JPMorgan Chase & Co.’s website (https://jpmorganchaseco.gcs-web.com/financial-information/sec-filings), and on the Securities and Exchange Commission’s website (www.sec.gov). JPMorgan Chase& Co. does not undertake to update any forward-looking statements.
8

Exhibit 99.2
EARNINGS RELEASE FINANCIAL SUPPLEMENTFIRST QUARTER 2022

JPMORGAN CHASE & CO.TABLE OF CONTENTS
Page(s)Consolidated ResultsConsolidated Financial Highlights 2–3Consolidated Statements of Income 4Consolidated Balance Sheets 5Condensed Average Balance Sheets and Annualized Yields 6Reconciliation from Reported to Managed Basis 7Segment Results - Managed Basis 8Capital and Other Selected Balance Sheet Items 9Earnings Per Share and Related Information 10
Business Segment ResultsConsumer & Community Banking (“CCB”) 11–14Corporate & Investment Bank (“CIB”) 15–17Commercial Banking (“CB”) 18–19Asset & Wealth Management (“AWM”) 20–22Corporate 23
Credit-Related Information 24–27
Non-GAAP Financial Measures 28Glossary of Terms and Acronyms (a)
(a) Refer to the Glossary of Terms and Acronyms on pages 305–311 of JPMorgan Chase & Co.’s (the “Firm’s”) Annual Report on Form 10-K for the year ended December 31, 2021 (the “2021 Form 10-K”).
MORGAN CHASE & CO.
ONSOLIDATED FINANCIAL HIGHLIGHTSmillions, except per share and ratio data)
QUARTERLY TRENDS1Q22 Change
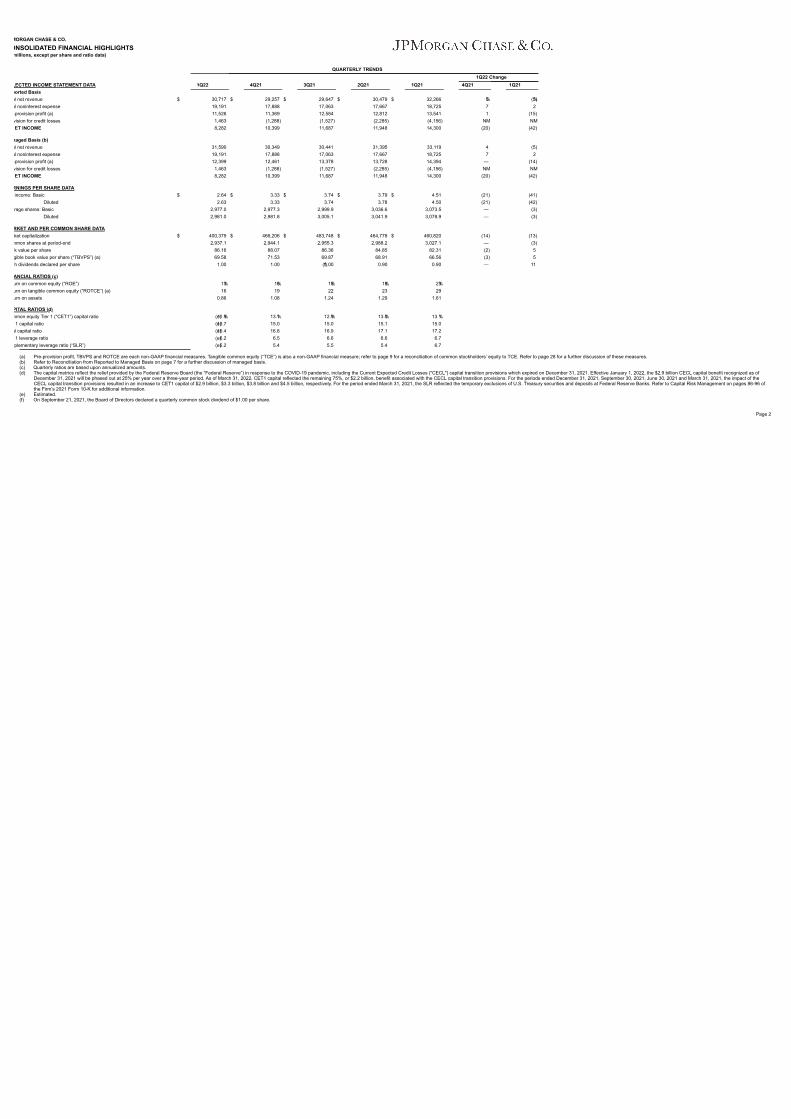
LECTED INCOME STATEMENT DATA 1Q22 4Q21 3Q21 2Q21 1Q21 4Q21 1Q21ported Basisal net revenue $ 30,717 $ 29,257 $ 29,647 $ 30,479 $ 32,266 5 % (5)%al noninterest expense 19,191 17,888 17,063 17,667 18,725 7 2 -provision profit (a) 11,526 11,369 12,584 12,812 13,541 1 (15)vision for credit losses 1,463 (1,288) (1,527) (2,285) (4,156) NM NMET INCOME 8,282 10,399 11,687 11,948 14,300 (20) (42)
naged Basis (b)al net revenue 31,590 30,349 30,441 31,395 33,119 4 (5)al noninterest expense 19,191 17,888 17,063 17,667 18,725 7 2 -provision profit (a) 12,399 12,461 13,378 13,728 14,394 — (14)vision for credit losses 1,463 (1,288) (1,527) (2,285) (4,156) NM NMET INCOME 8,282 10,399 11,687 11,948 14,300 (20) (42)
RNINGS PER SHARE DATAincome: Basic $ 2.64 $ 3.33 $ 3.74 $ 3.79 $ 4.51 (21) (41)
Diluted 2.63 3.33 3.74 3.78 4.50 (21) (42)rage shares: Basic 2,977.0 2,977.3 2,999.9 3,036.6 3,073.5 — (3)
Diluted 2,981.0 2,981.8 3,005.1 3,041.9 3,078.9 — (3)
RKET AND PER COMMON SHARE DATAket capitalization $ 400,379 $ 466,206 $ 483,748 $ 464,778 $ 460,820 (14) (13)
mmon shares at period-end 2,937.1 2,944.1 2,955.3 2,988.2 3,027.1 — (3)k value per share 86.16 88.07 86.36 84.85 82.31 (2) 5 gible book value per share (“TBVPS”) (a) 69.58 71.53 69.87 68.91 66.56 (3) 5 h dividends declared per share 1.00 1.00 1.00 (f) 0.90 0.90 — 11
ANCIAL RATIOS (c)urn on common equity (“ROE”) 13 % 16 % 18 % 18 % 23 %urn on tangible common equity (“ROTCE”) (a) 16 19 22 23 29 urn on assets 0.86 1.08 1.24 1.29 1.61
PITAL RATIOS (d)mmon equity Tier 1 (“CET1”) capital ratio 11.9 %(e) 13.1 % 12.9 % 13.0 % 13.1 %
1 capital ratio 13.7 (e) 15.0 15.0 15.1 15.0 al capital ratio 15.4 (e) 16.8 16.9 17.1 17.2
1 leverage ratio 6.2 (e) 6.5 6.6 6.6 6.7 plementary leverage ratio (“SLR”) 5.2 (e) 5.4 5.5 5.4 6.7
(a) Pre-provision profit, TBVPS and ROTCE are each non-GAAP financial measures. Tangible common equity (“TCE”) is also a non-GAAP financial measure; refer to page 9 for a reconciliation of common stockholders’ equity to TCE. Refer to page 28 for a further discussion of these measures.(b) Refer to Reconciliation from Reported to Managed Basis on page 7 for a further discussion of managed basis.(c) Quarterly ratios are based upon annualized amounts.(d) The capital metrics reflect the relief provided by the Federal Reserve Board (the “Federal Reserve”) in response to the COVID-19 pandemic, including the Current Expected Credit Losses ("CECL") capital transition provisions which expired on December 31, 2021. Effective January 1, 2022, the $2.9 billion CECL capital benefit recognized as of
December 31, 2021 will be phased out at 25% per year over a three-year period. As of March 31, 2022, CET1 capital reflected the remaining 75%, or $2.2 billion, benefit associated with the CECL capital transition provisions. For the periods ended December 31, 2021, September 30, 2021, June 30, 2021 and March 31, 2021, the impact of theCECL capital transition provisions resulted in an increase to CET1 capital of $2.9 billion, $3.3 billion, $3.8 billion and $4.5 billion, respectively. For the period ended March 31, 2021, the SLR reflected the temporary exclusions of U.S. Treasury securities and deposits at Federal Reserve Banks. Refer to Capital Risk Management on pages 86-96 ofthe Firm’s 2021 Form 10-K for additional information.
(e) Estimated.(f) On September 21, 2021, the Board of Directors declared a quarterly common stock dividend of $1.00 per share.
Page 2
JPMORGAN CHASE & CO.
CONSOLIDATED FINANCIAL HIGHLIGHTS, CONTINUED(in millions, except ratio and headcount data)
QUARTERLY TRENDS1Q22 Change
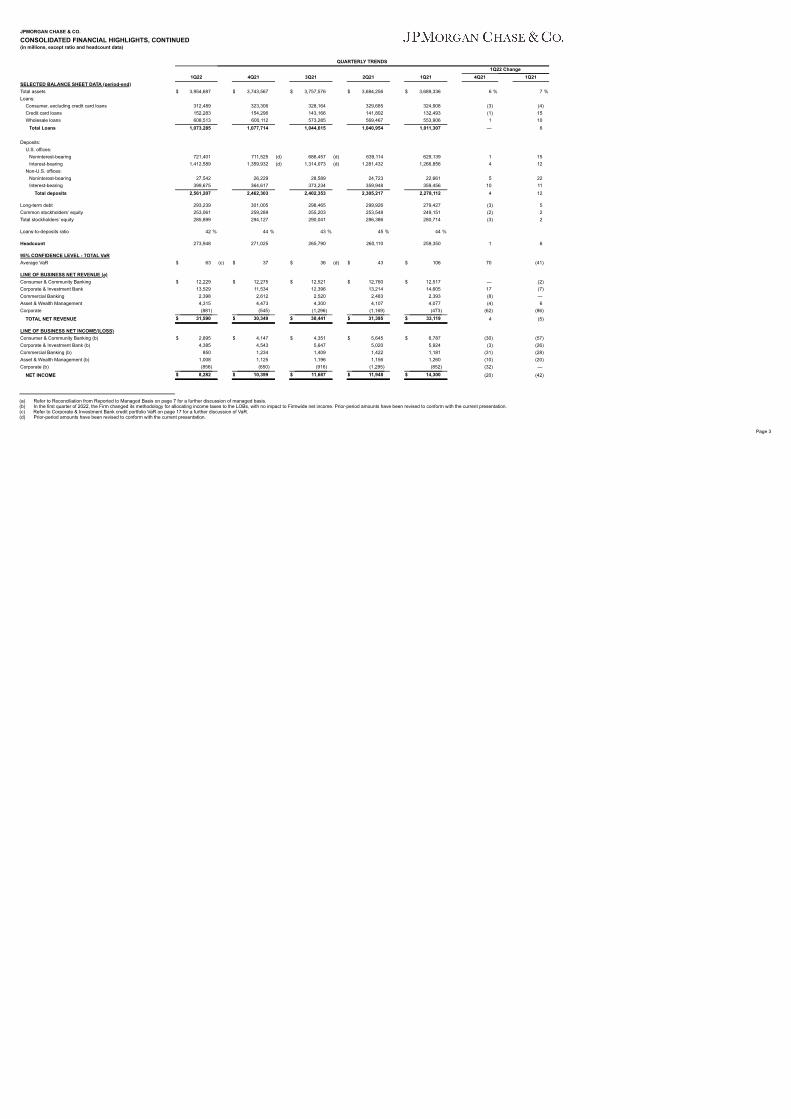
1Q22 4Q21 3Q21 2Q21 1Q21 4Q21 1Q21SELECTED BALANCE SHEET DATA (period-end)Total assets $ 3,954,687 $ 3,743,567 $ 3,757,576 $ 3,684,256 $ 3,689,336 6 % 7 %Loans:
Consumer, excluding credit card loans 312,489 323,306 328,164 329,685 324,908 (3) (4)Credit card loans 152,283 154,296 143,166 141,802 132,493 (1) 15 Wholesale loans 608,513 600,112 573,285 569,467 553,906 1 10
Total Loans 1,073,285 1,077,714 1,044,615 1,040,954 1,011,307 — 6
Deposits:U.S. offices:
Noninterest-bearing 721,401 711,525 (d) 686,457 (d) 639,114 629,139 1 15 Interest-bearing 1,412,589 1,359,932 (d) 1,314,073 (d) 1,281,432 1,266,856 4 12
Non-U.S. offices:Noninterest-bearing 27,542 26,229 28,589 24,723 22,661 5 22 Interest-bearing 399,675 364,617 373,234 359,948 359,456 10 11
Total deposits 2,561,207 2,462,303 2,402,353 2,305,217 2,278,112 4 12
Long-term debt 293,239 301,005 298,465 299,926 279,427 (3) 5 Common stockholders’ equity 253,061 259,289 255,203 253,548 249,151 (2) 2 Total stockholders’ equity 285,899 294,127 290,041 286,386 280,714 (3) 2
Loans-to-deposits ratio 42 % 44 % 43 % 45 % 44 %
Headcount 273,948 271,025 265,790 260,110 259,350 1 6
95% CONFIDENCE LEVEL - TOTAL VaRAverage VaR $ 63 (c) $ 37 $ 36 (d) $ 43 $ 106 70 (41)
LINE OF BUSINESS NET REVENUE (a)Consumer & Community Banking $ 12,229 $ 12,275 $ 12,521 $ 12,760 $ 12,517 — (2)Corporate & Investment Bank 13,529 11,534 12,396 13,214 14,605 17 (7)Commercial Banking 2,398 2,612 2,520 2,483 2,393 (8) — Asset & Wealth Management 4,315 4,473 4,300 4,107 4,077 (4) 6 Corporate (881) (545) (1,296) (1,169) (473) (62) (86)
TOTAL NET REVENUE $ 31,590 $ 30,349 $ 30,441 $ 31,395 $ 33,119 4 (5)
LINE OF BUSINESS NET INCOME/(LOSS)Consumer & Community Banking (b) $ 2,895 $ 4,147 $ 4,351 $ 5,645 $ 6,787 (30) (57)Corporate & Investment Bank (b) 4,385 4,543 5,647 5,020 5,924 (3) (26)Commercial Banking (b) 850 1,234 1,409 1,422 1,181 (31) (28)Asset & Wealth Management (b) 1,008 1,125 1,196 1,156 1,260 (10) (20)Corporate (b) (856) (650) (916) (1,295) (852) (32) —
NET INCOME $ 8,282 $ 10,399 $ 11,687 $ 11,948 $ 14,300 (20) (42)
(a) Refer to Reconciliation from Reported to Managed Basis on page 7 for a further discussion of managed basis.(b) In the first quarter of 2022, the Firm changed its methodology for allocating income taxes to the LOBs, with no impact to Firmwide net income. Prior-period amounts have been revised to conform with the current presentation.(c) Refer to Corporate & Investment Bank credit portfolio VaR on page 17 for a further discussion of VaR.(d) Prior-period amounts have been revised to conform with the current presentation.
Page 3
JPMORGAN CHASE & CO.
CONSOLIDATED STATEMENTS OF INCOME(in millions, except per share and ratio data)
QUARTERLY TRENDS1Q22 Change
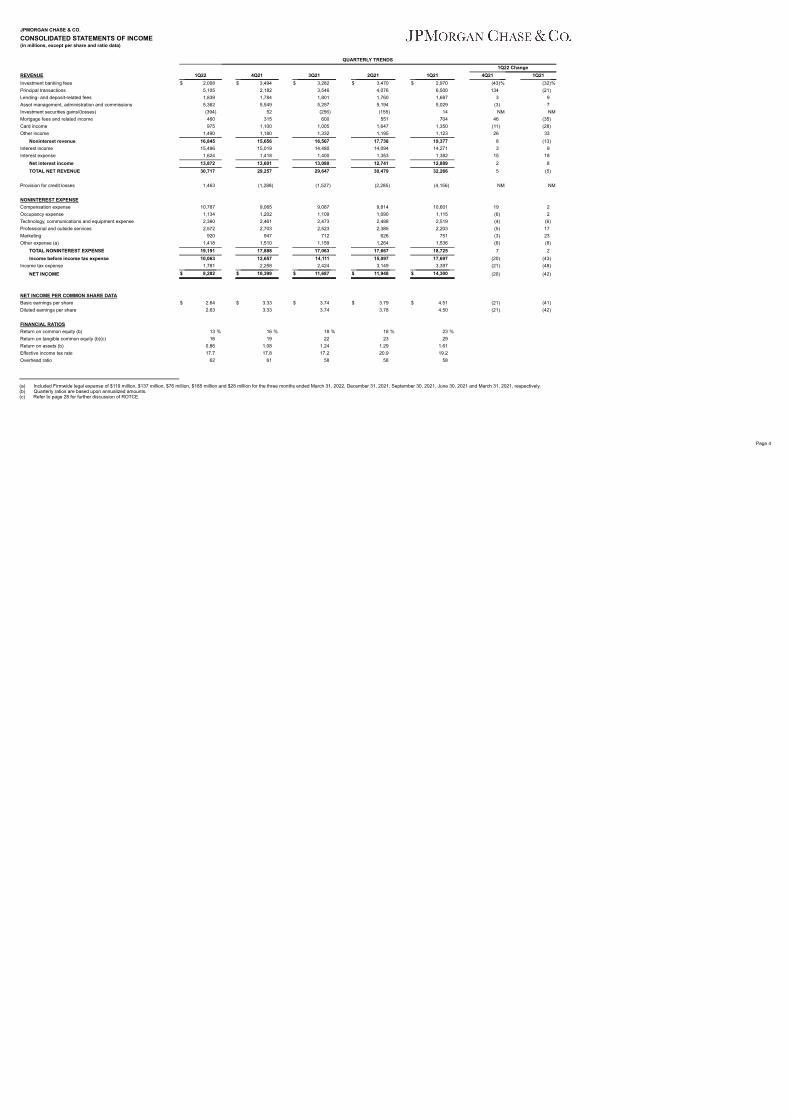
REVENUE 1Q22 4Q21 3Q21 2Q21 1Q21 4Q21 1Q21Investment banking fees $ 2,008 $ 3,494 $ 3,282 $ 3,470 $ 2,970 (43)% (32)%Principal transactions 5,105 2,182 3,546 4,076 6,500 134 (21)Lending- and deposit-related fees 1,839 1,784 1,801 1,760 1,687 3 9 Asset management, administration and commissions 5,362 5,549 5,257 5,194 5,029 (3) 7 Investment securities gains/(losses) (394) 52 (256) (155) 14 NM NMMortgage fees and related income 460 315 600 551 704 46 (35)Card income 975 1,100 1,005 1,647 1,350 (11) (28)Other income 1,490 1,180 1,332 1,195 1,123 26 33
Noninterest revenue 16,845 15,656 16,567 17,738 19,377 8 (13)Interest income 15,496 15,019 14,480 14,094 14,271 3 9 Interest expense 1,624 1,418 1,400 1,353 1,382 15 18
Net interest income 13,872 13,601 13,080 12,741 12,889 2 8 TOTAL NET REVENUE 30,717 29,257 29,647 30,479 32,266 5 (5)
Provision for credit losses 1,463 (1,288) (1,527) (2,285) (4,156) NM NM
NONINTEREST EXPENSECompensation expense 10,787 9,065 9,087 9,814 10,601 19 2 Occupancy expense 1,134 1,202 1,109 1,090 1,115 (6) 2 Technology, communications and equipment expense 2,360 2,461 2,473 2,488 2,519 (4) (6)Professional and outside services 2,572 2,703 2,523 2,385 2,203 (5) 17 Marketing 920 947 712 626 751 (3) 23 Other expense (a) 1,418 1,510 1,159 1,264 1,536 (6) (8)
TOTAL NONINTEREST EXPENSE 19,191 17,888 17,063 17,667 18,725 7 2 Income before income tax expense 10,063 12,657 14,111 15,097 17,697 (20) (43)
Income tax expense 1,781 2,258 2,424 3,149 3,397 (21) (48)
NET INCOME $ 8,282 $ 10,399 $ 11,687 $ 11,948 $ 14,300 (20) (42)
NET INCOME PER COMMON SHARE DATABasic earnings per share $ 2.64 $ 3.33 $ 3.74 $ 3.79 $ 4.51 (21) (41)Diluted earnings per share 2.63 3.33 3.74 3.78 4.50 (21) (42)
FINANCIAL RATIOSReturn on common equity (b) 13 % 16 % 18 % 18 % 23 %Return on tangible common equity (b)(c) 16 19 22 23 29 Return on assets (b) 0.86 1.08 1.24 1.29 1.61 Effective income tax rate 17.7 17.8 17.2 20.9 19.2 Overhead ratio 62 61 58 58 58
(a) Included Firmwide legal expense of $119 million, $137 million, $76 million, $185 million and $28 million for the three months ended March 31, 2022, December 31, 2021, September 30, 2021, June 30, 2021 and March 31, 2021, respectively.(b) Quarterly ratios are based upon annualized amounts.(c) Refer to page 28 for further discussion of ROTCE.
Page 4
AN CHASE & CO.
LIDATED BALANCE SHEETSs)
Mar 31, 2022Change
Mar 31, Dec 31, Sep 30, Jun 30, Mar 31, Dec 31, Mar 31,2022 2021 2021 2021 2021 2021 2021
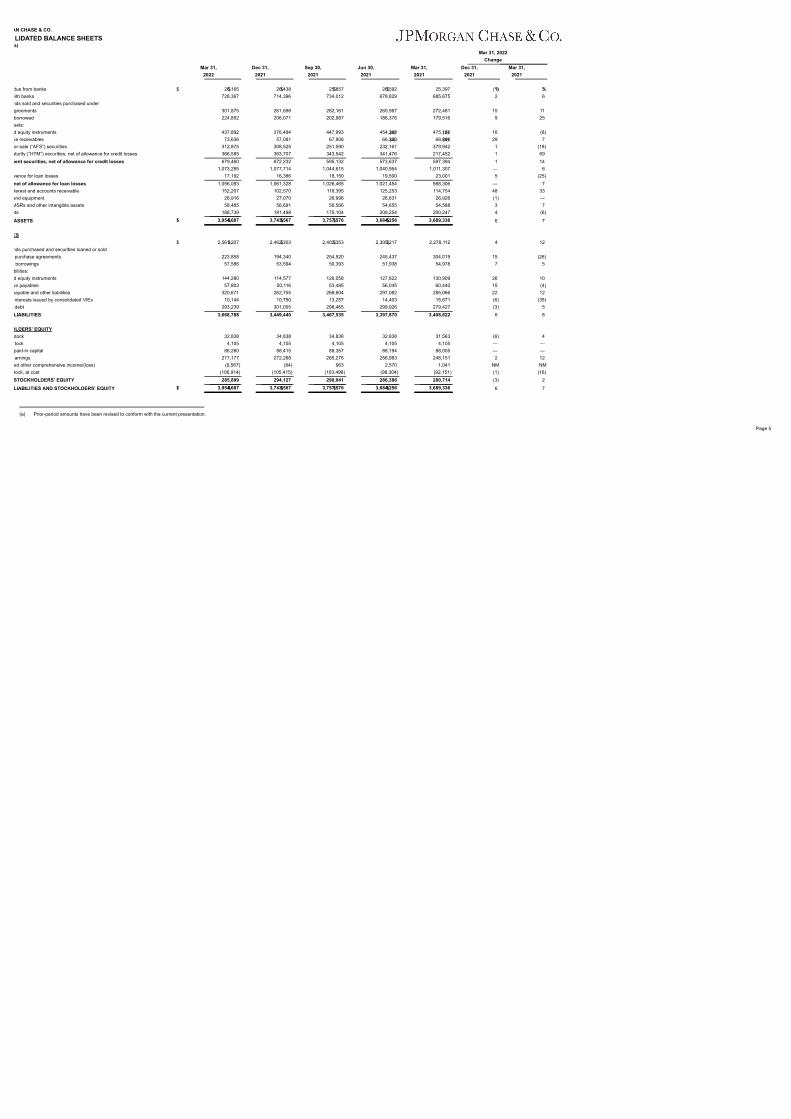
due from banks $ 26,165 $ 26,438 $ 25,857 $ 26,592 $ 25,397 (1)% 3 %with banks 728,367 714,396 734,012 678,829 685,675 2 6 nds sold and securities purchased undergreements 301,875 261,698 282,161 260,987 272,481 15 11 borrowed 224,852 206,071 202,987 186,376 179,516 9 25 sets:d equity instruments 437,892 376,494 447,993 454,268 (a) 475,156 (a) 16 (8)ve receivables 73,636 57,081 67,908 66,320 (a) 68,896 (a) 29 7 or-sale (“AFS”) securities 312,875 308,525 251,590 232,161 379,942 1 (18)aturity (”HTM”) securities, net of allowance for credit losses 366,585 363,707 343,542 341,476 217,452 1 69
ment securities, net of allowance for credit losses 679,460 672,232 595,132 573,637 597,394 1 14 1,073,285 1,077,714 1,044,615 1,040,954 1,011,307 — 6
wance for loan losses 17,192 16,386 18,150 19,500 23,001 5 (25)net of allowance for loan losses 1,056,093 1,061,328 1,026,465 1,021,454 988,306 — 7 terest and accounts receivable 152,207 102,570 116,395 125,253 114,754 48 33
and equipment 26,916 27,070 26,996 26,631 26,926 (1) — MSRs and other intangible assets 58,485 56,691 56,566 54,655 54,588 3 7 ets 188,739 181,498 175,104 209,254 200,247 4 (6)
ASSETS $ 3,954,687 $ 3,743,567 $ 3,757,576 $ 3,684,256 $ 3,689,336 6 7
ES$ 2,561,207 $ 2,462,303 $ 2,402,353 $ 2,305,217 $ 2,278,112 4 12
nds purchased and securities loaned or soldpurchase agreements 223,858 194,340 254,920 245,437 304,019 15 (26)borrowings 57,586 53,594 50,393 51,938 54,978 7 5
bilities:d equity instruments 144,280 114,577 126,058 127,822 130,909 26 10 ve payables 57,803 50,116 53,485 56,045 60,440 15 (4)payable and other liabilities 320,671 262,755 268,604 297,082 285,066 22 12 nterests issued by consolidated VIEs 10,144 10,750 13,257 14,403 15,671 (6) (35)debt 293,239 301,005 298,465 299,926 279,427 (3) 5 LIABILITIES 3,668,788 3,449,440 3,467,535 3,397,870 3,408,622 6 8
OLDERS’ EQUITYstock 32,838 34,838 34,838 32,838 31,563 (6) 4 tock 4,105 4,105 4,105 4,105 4,105 — — paid-in capital 88,260 88,415 88,357 88,194 88,005 — — arnings 277,177 272,268 265,276 256,983 248,151 2 12 ed other comprehensive income/(loss) (9,567) (84) 963 2,570 1,041 NM NMtock, at cost (106,914) (105,415) (103,498) (98,304) (92,151) (1) (16)STOCKHOLDERS’ EQUITY 285,899 294,127 290,041 286,386 280,714 (3) 2
LIABILITIES AND STOCKHOLDERS’ EQUITY $ 3,954,687 $ 3,743,567 $ 3,757,576 $ 3,684,256 $ 3,689,336 6 7
(a) Prior-period amounts have been revised to conform with the current presentation.
Page 5
JPMORGAN CHASE & CO.
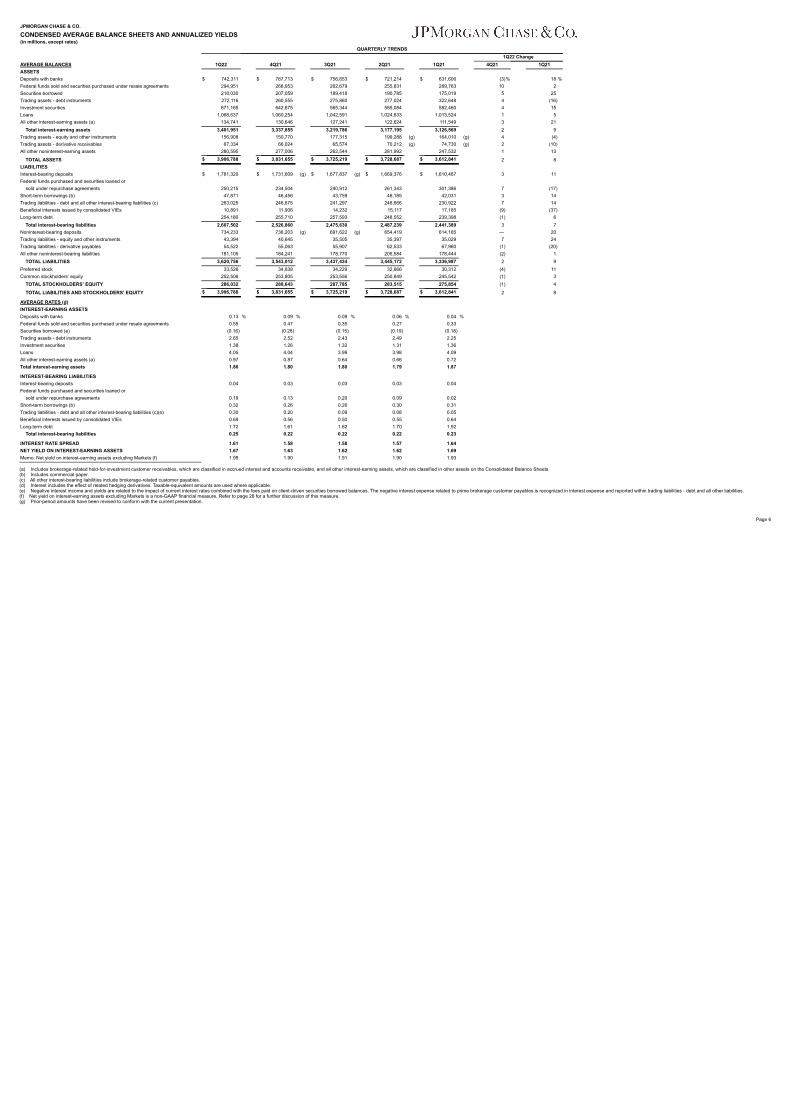
CONDENSED AVERAGE BALANCE SHEETS AND ANNUALIZED YIELDS(in millions, except rates)
QUARTERLY TRENDS1Q22 Change
AVERAGE BALANCES 1Q22 4Q21 3Q21 2Q21 1Q21 4Q21 1Q21ASSETSDeposits with banks $ 742,311 $ 767,713 $ 756,653 $ 721,214 $ 631,606 (3)% 18 %Federal funds sold and securities purchased under resale agreements 294,951 268,953 262,679 255,831 289,763 10 2 Securities borrowed 218,030 207,059 189,418 190,785 175,019 5 25 Trading assets - debt instruments 272,116 260,555 275,860 277,024 322,648 4 (16)Investment securities 671,165 642,675 565,344 585,084 582,460 4 15 Loans 1,068,637 1,060,254 1,042,591 1,024,633 1,013,524 1 5 All other interest-earning assets (a) 134,741 130,646 127,241 122,624 111,549 3 21
Total interest-earning assets 3,401,951 3,337,855 3,219,786 3,177,195 3,126,569 2 9 Trading assets - equity and other instruments 156,908 150,770 177,315 199,288 (g) 164,010 (g) 4 (4)Trading assets - derivative receivables 67,334 66,024 65,574 70,212 (g) 74,730 (g) 2 (10)All other noninterest-earning assets 280,595 277,006 262,544 281,992 247,532 1 13
TOTAL ASSETS $ 3,906,788 $ 3,831,655 $ 3,725,219 $ 3,728,687 $ 3,612,841 2 8 LIABILITIESInterest-bearing deposits $ 1,781,320 $ 1,731,609 (g) $ 1,677,837 (g) $ 1,669,376 $ 1,610,467 3 11 Federal funds purchased and securities loaned or
sold under repurchase agreements 250,215 234,504 240,912 261,343 301,386 7 (17)Short-term borrowings (b) 47,871 46,456 43,759 46,185 42,031 3 14 Trading liabilities - debt and all other interest-bearing liabilities (c) 263,025 246,675 241,297 246,666 230,922 7 14 Beneficial interests issued by consolidated VIEs 10,891 11,906 14,232 15,117 17,185 (9) (37)Long-term debt 254,180 255,710 257,593 248,552 239,398 (1) 6
Total interest-bearing liabilities 2,607,502 2,526,860 2,475,630 2,487,239 2,441,389 3 7 Noninterest-bearing deposits 734,233 736,203 (g) 691,622 (g) 654,419 614,165 — 20 Trading liabilities - equity and other instruments 43,394 40,645 35,505 35,397 35,029 7 24 Trading liabilities - derivative payables 54,522 55,063 55,907 62,533 67,960 (1) (20)All other noninterest-bearing liabilities 181,105 184,241 178,770 205,584 178,444 (2) 1
TOTAL LIABILITIES 3,620,756 3,543,012 3,437,434 3,445,172 3,336,987 2 9 Preferred stock 33,526 34,838 34,229 32,666 30,312 (4) 11 Common stockholders’ equity 252,506 253,805 253,556 250,849 245,542 (1) 3
TOTAL STOCKHOLDERS’ EQUITY 286,032 288,643 287,785 283,515 275,854 (1) 4
TOTAL LIABILITIES AND STOCKHOLDERS’ EQUITY $ 3,906,788 $ 3,831,655 $ 3,725,219 $ 3,728,687 $ 3,612,841 2 8
AVERAGE RATES (d)INTEREST-EARNING ASSETSDeposits with banks 0.13 % 0.09 % 0.09 % 0.06 % 0.04 %Federal funds sold and securities purchased under resale agreements 0.55 0.47 0.35 0.27 0.33 Securities borrowed (e) (0.16) (0.28) (0.15) (0.19) (0.18)Trading assets - debt instruments 2.65 2.52 2.43 2.49 2.25 Investment securities 1.38 1.26 1.32 1.31 1.36 Loans 4.05 4.04 3.99 3.98 4.09 All other interest-earning assets (a) 0.97 0.87 0.64 0.66 0.72 Total interest-earning assets 1.86 1.80 1.80 1.79 1.87
INTEREST-BEARING LIABILITIESInterest-bearing deposits 0.04 0.03 0.03 0.03 0.04 Federal funds purchased and securities loaned or
sold under repurchase agreements 0.19 0.13 0.20 0.09 0.02 Short-term borrowings (b) 0.32 0.26 0.26 0.30 0.31 Trading liabilities - debt and all other interest-bearing liabilities (c)(e) 0.30 0.20 0.09 0.08 0.05 Beneficial interests issued by consolidated VIEs 0.69 0.56 0.50 0.55 0.64 Long-term debt 1.72 1.61 1.62 1.70 1.92
Total interest-bearing liabilities 0.25 0.22 0.22 0.22 0.23
INTEREST RATE SPREAD 1.61 1.58 1.58 1.57 1.64 NET YIELD ON INTEREST-EARNING ASSETS 1.67 1.63 1.62 1.62 1.69 Memo: Net yield on interest-earning assets excluding Markets (f) 1.95 1.90 1.91 1.90 1.93
(a) Includes brokerage-related held-for-investment customer receivables, which are classified in accrued interest and accounts receivable, and all other interest-earning assets, which are classified in other assets on the Consolidated Balance Sheets.(b) Includes commercial paper.(c) All other interest-bearing liabilities include brokerage-related customer payables.(d) Interest includes the effect of related hedging derivatives. Taxable-equivalent amounts are used where applicable.(e) Negative interest income and yields are related to the impact of current interest rates combined with the fees paid on client-driven securities borrowed balances. The negative interest expense related to prime brokerage customer payables is recognized in interest expense and reported within trading liabilities - debt and all other liabilities.(f) Net yield on interest-earning assets excluding Markets is a non-GAAP financial measure. Refer to page 28 for a further discussion of this measure.(g) Prior-period amounts have been revised to conform with the current presentation.
Page 6
JPMORGAN CHASE & CO.
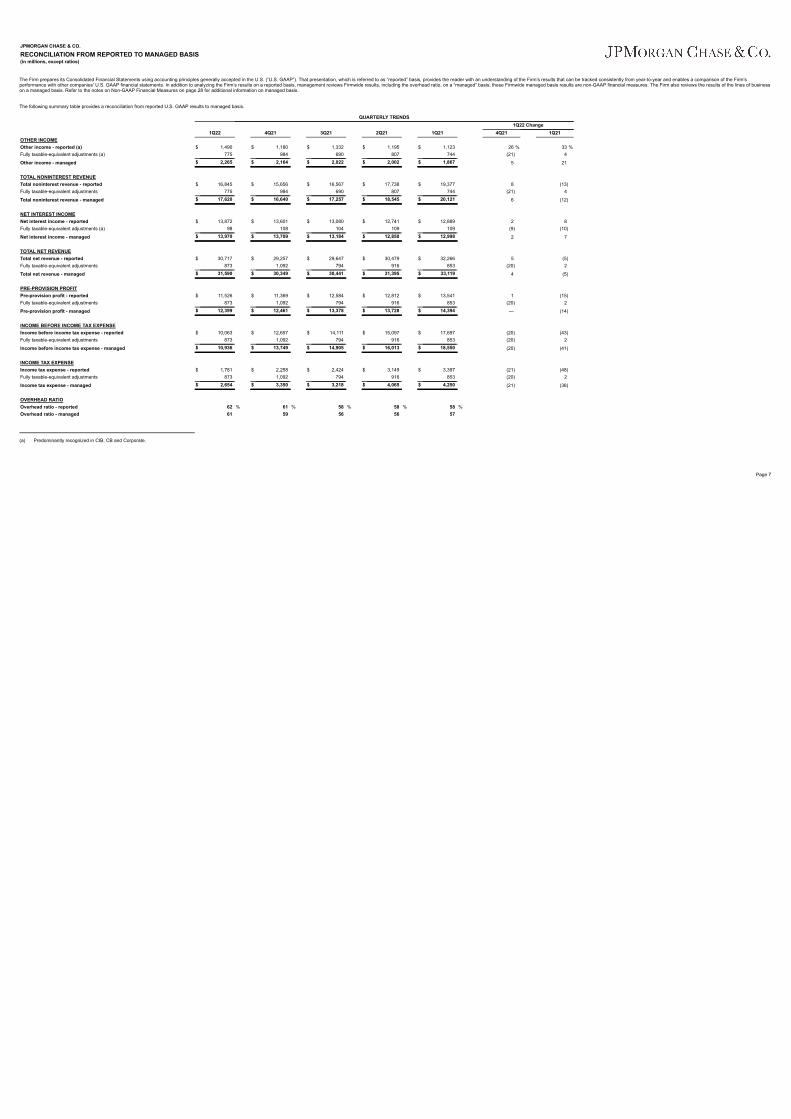
RECONCILIATION FROM REPORTED TO MANAGED BASIS(in millions, except ratios)
The Firm prepares its Consolidated Financial Statements using accounting principles generally accepted in the U.S. (“U.S. GAAP”). That presentation, which is referred to as “reported” basis, provides the reader with an understanding of the Firm’s results that can be tracked consistently from year-to-year and enables a comparison of the Firm’sperformance with other companies’ U.S. GAAP financial statements. In addition to analyzing the Firm’s results on a reported basis, management reviews Firmwide results, including the overhead ratio, on a “managed” basis; these Firmwide managed basis results are non-GAAP financial measures. The Firm also reviews the results of the lines of businesson a managed basis. Refer to the notes on Non-GAAP Financial Measures on page 28 for additional information on managed basis.
The following summary table provides a reconciliation from reported U.S. GAAP results to managed basis.
QUARTERLY TRENDS1Q22 Change
1Q22 4Q21 3Q21 2Q21 1Q21 4Q21 1Q21OTHER INCOMEOther income - reported (a) $ 1,490 $ 1,180 $ 1,332 $ 1,195 $ 1,123 26 % 33 %Fully taxable-equivalent adjustments (a) 775 984 690 807 744 (21) 4
Other income - managed $ 2,265 $ 2,164 $ 2,022 $ 2,002 $ 1,867 5 21
TOTAL NONINTEREST REVENUETotal noninterest revenue - reported $ 16,845 $ 15,656 $ 16,567 $ 17,738 $ 19,377 8 (13)Fully taxable-equivalent adjustments 775 984 690 807 744 (21) 4
Total noninterest revenue - managed $ 17,620 $ 16,640 $ 17,257 $ 18,545 $ 20,121 6 (12)
NET INTEREST INCOMENet interest income - reported $ 13,872 $ 13,601 $ 13,080 $ 12,741 $ 12,889 2 8 Fully taxable-equivalent adjustments (a) 98 108 104 109 109 (9) (10)
Net interest income - managed $ 13,970 $ 13,709 $ 13,184 $ 12,850 $ 12,998 2 7
TOTAL NET REVENUETotal net revenue - reported $ 30,717 $ 29,257 $ 29,647 $ 30,479 $ 32,266 5 (5)Fully taxable-equivalent adjustments 873 1,092 794 916 853 (20) 2
Total net revenue - managed $ 31,590 $ 30,349 $ 30,441 $ 31,395 $ 33,119 4 (5)
PRE-PROVISION PROFITPre-provision profit - reported $ 11,526 $ 11,369 $ 12,584 $ 12,812 $ 13,541 1 (15)Fully taxable-equivalent adjustments 873 1,092 794 916 853 (20) 2
Pre-provision profit - managed $ 12,399 $ 12,461 $ 13,378 $ 13,728 $ 14,394 — (14)
INCOME BEFORE INCOME TAX EXPENSEIncome before income tax expense - reported $ 10,063 $ 12,657 $ 14,111 $ 15,097 $ 17,697 (20) (43)Fully taxable-equivalent adjustments 873 1,092 794 916 853 (20) 2
Income before income tax expense - managed $ 10,936 $ 13,749 $ 14,905 $ 16,013 $ 18,550 (20) (41)
INCOME TAX EXPENSEIncome tax expense - reported $ 1,781 $ 2,258 $ 2,424 $ 3,149 $ 3,397 (21) (48)Fully taxable-equivalent adjustments 873 1,092 794 916 853 (20) 2
Income tax expense - managed $ 2,654 $ 3,350 $ 3,218 $ 4,065 $ 4,250 (21) (38)
OVERHEAD RATIOOverhead ratio - reported 62 % 61 % 58 % 58 % 58 %Overhead ratio - managed 61 59 56 56 57
(a) Predominantly recognized in CIB, CB and Corporate.
Page 7
JPMORGAN CHASE & CO.
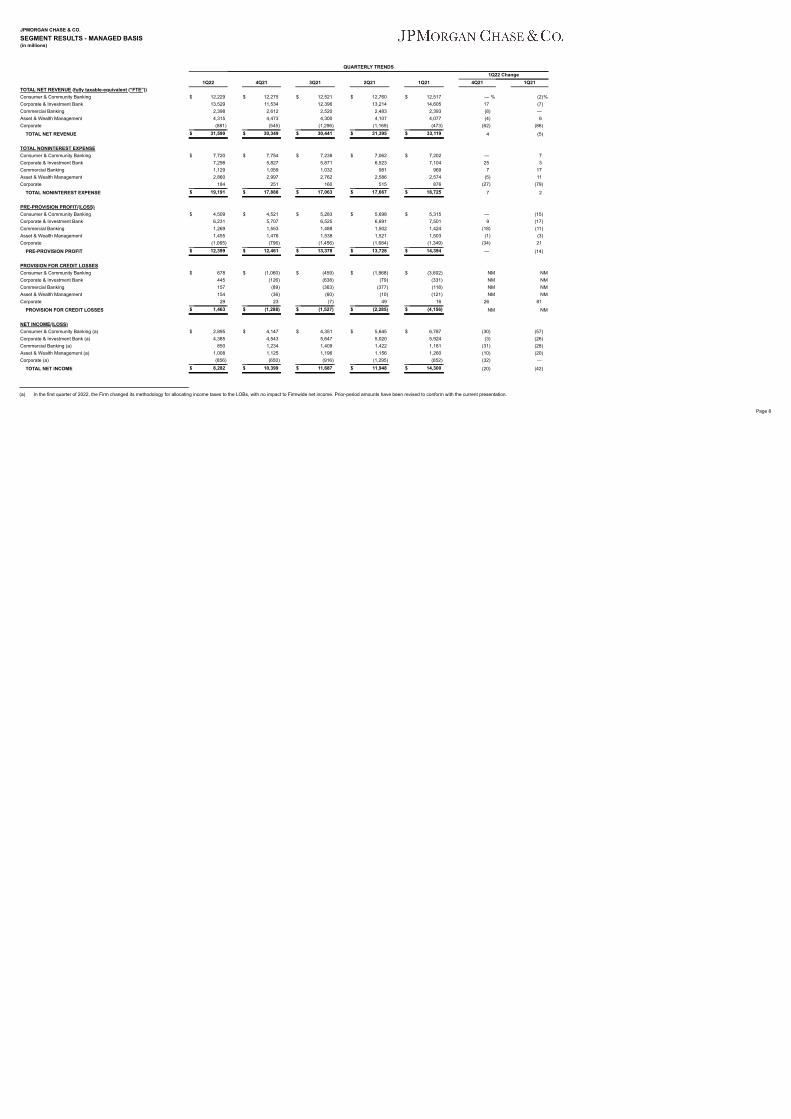
SEGMENT RESULTS - MANAGED BASIS(in millions)
QUARTERLY TRENDS1Q22 Change
1Q22 4Q21 3Q21 2Q21 1Q21 4Q21 1Q21TOTAL NET REVENUE (fully taxable-equivalent (“FTE”))Consumer & Community Banking $ 12,229 $ 12,275 $ 12,521 $ 12,760 $ 12,517 — % (2)%Corporate & Investment Bank 13,529 11,534 12,396 13,214 14,605 17 (7)Commercial Banking 2,398 2,612 2,520 2,483 2,393 (8) — Asset & Wealth Management 4,315 4,473 4,300 4,107 4,077 (4) 6 Corporate (881) (545) (1,296) (1,169) (473) (62) (86)
TOTAL NET REVENUE $ 31,590 $ 30,349 $ 30,441 $ 31,395 $ 33,119 4 (5)
TOTAL NONINTEREST EXPENSEConsumer & Community Banking $ 7,720 $ 7,754 $ 7,238 $ 7,062 $ 7,202 — 7 Corporate & Investment Bank 7,298 5,827 5,871 6,523 7,104 25 3 Commercial Banking 1,129 1,059 1,032 981 969 7 17 Asset & Wealth Management 2,860 2,997 2,762 2,586 2,574 (5) 11 Corporate 184 251 160 515 876 (27) (79)
TOTAL NONINTEREST EXPENSE $ 19,191 $ 17,888 $ 17,063 $ 17,667 $ 18,725 7 2
PRE-PROVISION PROFIT/(LOSS)Consumer & Community Banking $ 4,509 $ 4,521 $ 5,283 $ 5,698 $ 5,315 — (15)Corporate & Investment Bank 6,231 5,707 6,525 6,691 7,501 9 (17)Commercial Banking 1,269 1,553 1,488 1,502 1,424 (18) (11)Asset & Wealth Management 1,455 1,476 1,538 1,521 1,503 (1) (3)Corporate (1,065) (796) (1,456) (1,684) (1,349) (34) 21
PRE-PROVISION PROFIT $ 12,399 $ 12,461 $ 13,378 $ 13,728 $ 14,394 — (14)
PROVISION FOR CREDIT LOSSESConsumer & Community Banking $ 678 $ (1,060) $ (459) $ (1,868) $ (3,602) NM NMCorporate & Investment Bank 445 (126) (638) (79) (331) NM NMCommercial Banking 157 (89) (363) (377) (118) NM NMAsset & Wealth Management 154 (36) (60) (10) (121) NM NMCorporate 29 23 (7) 49 16 26 81
PROVISION FOR CREDIT LOSSES $ 1,463 $ (1,288) $ (1,527) $ (2,285) $ (4,156) NM NM
NET INCOME/(LOSS)Consumer & Community Banking (a) $ 2,895 $ 4,147 $ 4,351 $ 5,645 $ 6,787 (30) (57)Corporate & Investment Bank (a) 4,385 4,543 5,647 5,020 5,924 (3) (26)Commercial Banking (a) 850 1,234 1,409 1,422 1,181 (31) (28)Asset & Wealth Management (a) 1,008 1,125 1,196 1,156 1,260 (10) (20)Corporate (a) (856) (650) (916) (1,295) (852) (32) —
TOTAL NET INCOME $ 8,282 $ 10,399 $ 11,687 $ 11,948 $ 14,300 (20) (42)
(a) In the first quarter of 2022, the Firm changed its methodology for allocating income taxes to the LOBs, with no impact to Firmwide net income. Prior-period amounts have been revised to conform with the current presentation.
Page 8
JPMORGAN CHASE & CO.
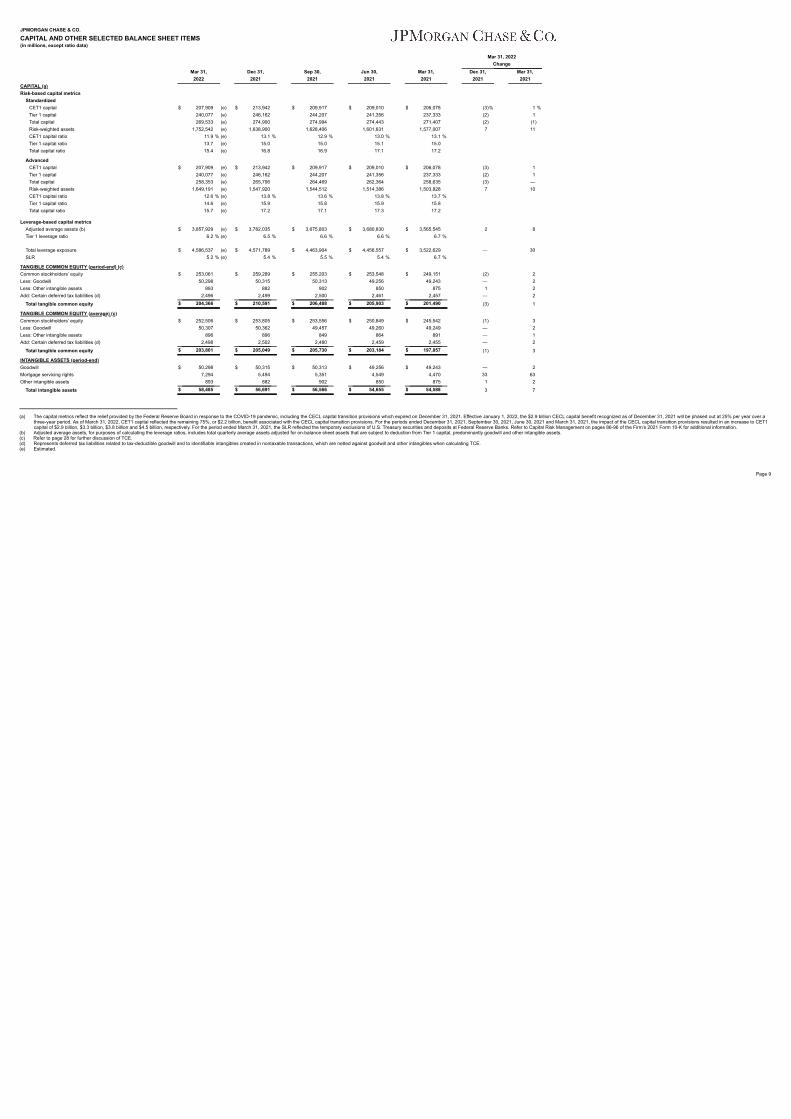
CAPITAL AND OTHER SELECTED BALANCE SHEET ITEMS(in millions, except ratio data)
Mar 31, 2022Change
Mar 31, Dec 31, Sep 30, Jun 30, Mar 31, Dec 31, Mar 31,2022 2021 2021 2021 2021 2021 2021
CAPITAL (a)Risk-based capital metrics
StandardizedCET1 capital $ 207,909 (e) $ 213,942 $ 209,917 $ 209,010 $ 206,078 (3)% 1 %Tier 1 capital 240,077 (e) 246,162 244,207 241,356 237,333 (2) 1 Total capital 269,533 (e) 274,900 274,994 274,443 271,407 (2) (1)Risk-weighted assets 1,752,542 (e) 1,638,900 1,628,406 1,601,631 1,577,007 7 11 CET1 capital ratio 11.9 % (e) 13.1 % 12.9 % 13.0 % 13.1 %Tier 1 capital ratio 13.7 (e) 15.0 15.0 15.1 15.0 Total capital ratio 15.4 (e) 16.8 16.9 17.1 17.2
AdvancedCET1 capital $ 207,909 (e) $ 213,942 $ 209,917 $ 209,010 $ 206,078 (3) 1 Tier 1 capital 240,077 (e) 246,162 244,207 241,356 237,333 (2) 1 Total capital 258,353 (e) 265,796 264,469 262,364 258,635 (3) — Risk-weighted assets 1,649,191 (e) 1,547,920 1,544,512 1,514,386 1,503,828 7 10 CET1 capital ratio 12.6 % (e) 13.8 % 13.6 % 13.8 % 13.7 %Tier 1 capital ratio 14.6 (e) 15.9 15.8 15.9 15.8 Total capital ratio 15.7 (e) 17.2 17.1 17.3 17.2
Leverage-based capital metricsAdjusted average assets (b) $ 3,857,929 (e) $ 3,782,035 $ 3,675,803 $ 3,680,830 $ 3,565,545 2 8 Tier 1 leverage ratio 6.2 % (e) 6.5 % 6.6 % 6.6 % 6.7 %
Total leverage exposure $ 4,586,537 (e) $ 4,571,789 $ 4,463,904 $ 4,456,557 $ 3,522,629 — 30 SLR 5.2 % (e) 5.4 % 5.5 % 5.4 % 6.7 %
TANGIBLE COMMON EQUITY (period-end) (c)Common stockholders’ equity $ 253,061 $ 259,289 $ 255,203 $ 253,548 $ 249,151 (2) 2 Less: Goodwill 50,298 50,315 50,313 49,256 49,243 — 2 Less: Other intangible assets 893 882 902 850 875 1 2 Add: Certain deferred tax liabilities (d) 2,496 2,499 2,500 2,461 2,457 — 2
Total tangible common equity $ 204,366 $ 210,591 $ 206,488 $ 205,903 $ 201,490 (3) 1
TANGIBLE COMMON EQUITY (average) (c)Common stockholders’ equity $ 252,506 $ 253,805 $ 253,556 $ 250,849 $ 245,542 (1) 3 Less: Goodwill 50,307 50,362 49,457 49,260 49,249 — 2 Less: Other intangible assets 896 896 849 864 891 — 1 Add: Certain deferred tax liabilities (d) 2,498 2,502 2,480 2,459 2,455 — 2
Total tangible common equity $ 203,801 $ 205,049 $ 205,730 $ 203,184 $ 197,857 (1) 3
INTANGIBLE ASSETS (period-end)Goodwill $ 50,298 $ 50,315 $ 50,313 $ 49,256 $ 49,243 — 2 Mortgage servicing rights 7,294 5,494 5,351 4,549 4,470 33 63 Other intangible assets 893 882 902 850 875 1 2
Total intangible assets $ 58,485 $ 56,691 $ 56,566 $ 54,655 $ 54,588 3 7
(a) The capital metrics reflect the relief provided by the Federal Reserve Board in response to the COVID-19 pandemic, including the CECL capital transition provisions which expired on December 31, 2021. Effective January 1, 2022, the $2.9 billion CECL capital benefit recognized as of December 31, 2021 will be phased out at 25% per year over a
three-year period. As of March 31, 2022, CET1 capital reflected the remaining 75%, or $2.2 billion, benefit associated with the CECL capital transition provisions. For the periods ended December 31, 2021, September 30, 2021, June 30, 2021 and March 31, 2021, the impact of the CECL capital transition provisions resulted in an increase to CET1capital of $2.9 billion, $3.3 billion, $3.8 billion and $4.5 billion, respectively. For the period ended March 31, 2021, the SLR reflected the temporary exclusions of U.S. Treasury securities and deposits at Federal Reserve Banks. Refer to Capital Risk Management on pages 86-96 of the Firm’s 2021 Form 10-K for additional information.
(b) Adjusted average assets, for purposes of calculating the leverage ratios, includes total quarterly average assets adjusted for on-balance sheet assets that are subject to deduction from Tier 1 capital, predominantly goodwill and other intangible assets.(c) Refer to page 28 for further discussion of TCE.(d) Represents deferred tax liabilities related to tax-deductible goodwill and to identifiable intangibles created in nontaxable transactions, which are netted against goodwill and other intangibles when calculating TCE.(e) Estimated.
Page 9
JPMORGAN CHASE & CO.
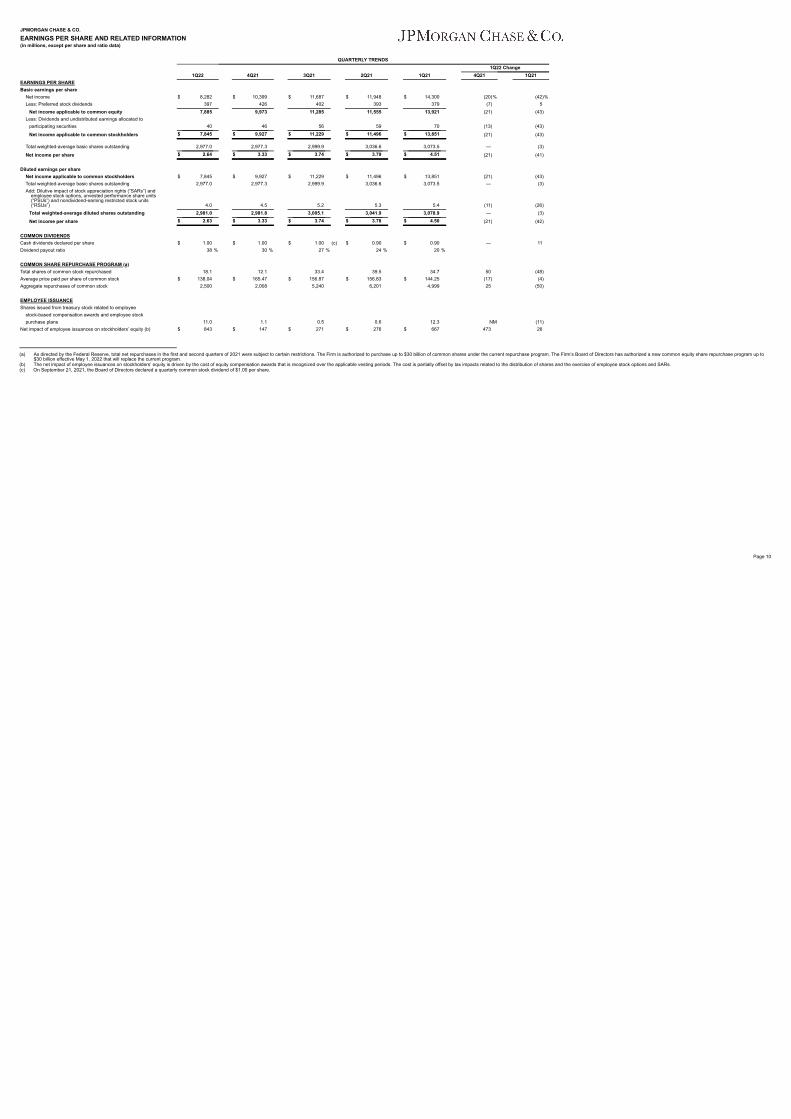
EARNINGS PER SHARE AND RELATED INFORMATION(in millions, except per share and ratio data)
QUARTERLY TRENDS1Q22 Change
1Q22 4Q21 3Q21 2Q21 1Q21 4Q21 1Q21EARNINGS PER SHAREBasic earnings per share
Net income $ 8,282 $ 10,399 $ 11,687 $ 11,948 $ 14,300 (20)% (42)%Less: Preferred stock dividends 397 426 402 393 379 (7) 5
Net income applicable to common equity 7,885 9,973 11,285 11,555 13,921 (21) (43)Less: Dividends and undistributed earnings allocated to
participating securities 40 46 56 59 70 (13) (43)
Net income applicable to common stockholders $ 7,845 $ 9,927 $ 11,229 $ 11,496 $ 13,851 (21) (43)
Total weighted-average basic shares outstanding 2,977.0 2,977.3 2,999.9 3,036.6 3,073.5 — (3)
Net income per share $ 2.64 $ 3.33 $ 3.74 $ 3.79 $ 4.51 (21) (41)
Diluted earnings per shareNet income applicable to common stockholders $ 7,845 $ 9,927 $ 11,229 $ 11,496 $ 13,851 (21) (43)Total weighted-average basic shares outstanding 2,977.0 2,977.3 2,999.9 3,036.6 3,073.5 — (3)Add: Dilutive impact of stock appreciation rights (“SARs”) and employee stock options, unvested performance share units (“PSUs”) and nondividend-earning restricted stock units (“RSUs”) 4.0 4.5 5.2 5.3 5.4 (11) (26)
Total weighted-average diluted shares outstanding 2,981.0 2,981.8 3,005.1 3,041.9 3,078.9 — (3)
Net income per share $ 2.63 $ 3.33 $ 3.74 $ 3.78 $ 4.50 (21) (42)
COMMON DIVIDENDSCash dividends declared per share $ 1.00 $ 1.00 $ 1.00 (c) $ 0.90 $ 0.90 — 11 Dividend payout ratio 38 % 30 % 27 % 24 % 20 %
COMMON SHARE REPURCHASE PROGRAM (a)Total shares of common stock repurchased 18.1 12.1 33.4 39.5 34.7 50 (48)Average price paid per share of common stock $ 138.04 $ 165.47 $ 156.87 $ 156.83 $ 144.25 (17) (4)Aggregate repurchases of common stock 2,500 2,008 5,240 6,201 4,999 25 (50)
EMPLOYEE ISSUANCEShares issued from treasury stock related to employee
stock-based compensation awards and employee stockpurchase plans 11.0 1.1 0.5 0.6 12.3 NM (11)
Net impact of employee issuances on stockholders’ equity (b) $ 843 $ 147 $ 271 $ 276 $ 667 473 26
(a) As directed by the Federal Reserve, total net repurchases in the first and second quarters of 2021 were subject to certain restrictions. The Firm is authorized to purchase up to $30 billion of common shares under the current repurchase program. The Firm’s Board of Directors has authorized a new common equity share repurchase program up to$30 billion effective May 1, 2022 that will replace the current program.
(b) The net impact of employee issuances on stockholders’ equity is driven by the cost of equity compensation awards that is recognized over the applicable vesting periods. The cost is partially offset by tax impacts related to the distribution of shares and the exercise of employee stock options and SARs.(c) On September 21, 2021, the Board of Directors declared a quarterly common stock dividend of $1.00 per share.
Page 10
JPMORGAN CHASE & CO.
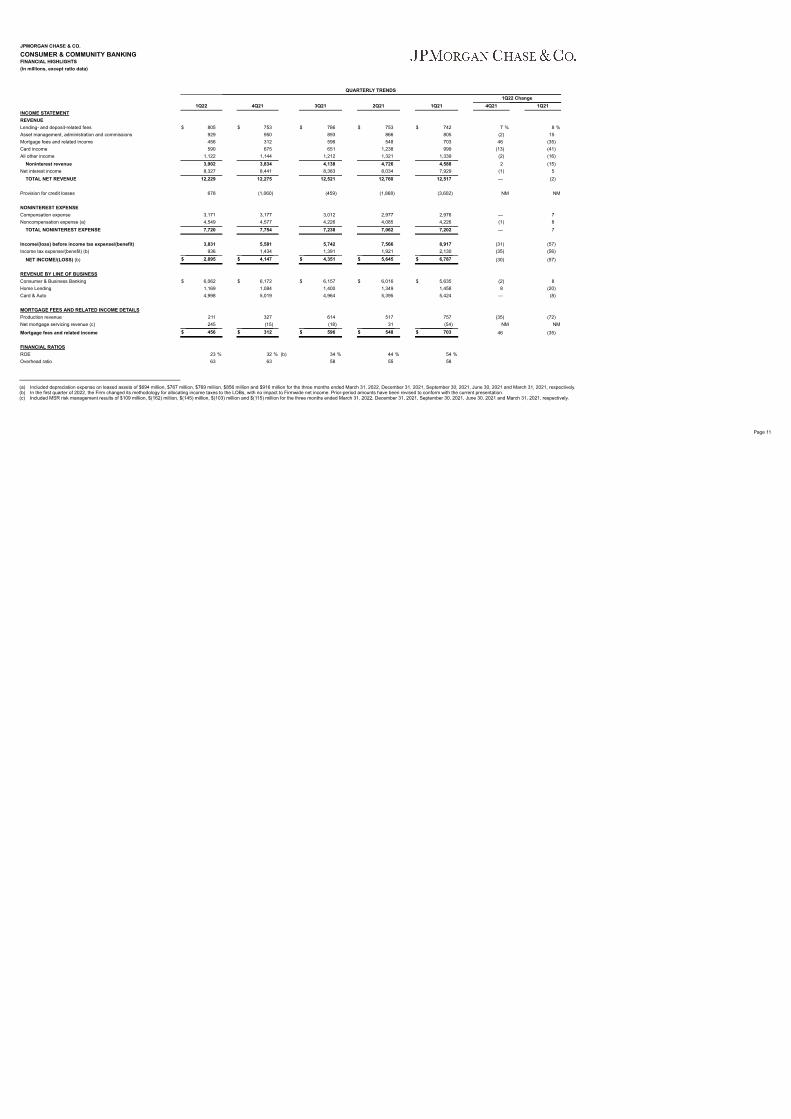
CONSUMER & COMMUNITY BANKINGFINANCIAL HIGHLIGHTS(in millions, except ratio data)
QUARTERLY TRENDS1Q22 Change
1Q22 4Q21 3Q21 2Q21 1Q21 4Q21 1Q21INCOME STATEMENTREVENUELending- and deposit-related fees $ 805 $ 753 $ 786 $ 753 $ 742 7 % 8 %Asset management, administration and commissions 929 950 893 866 805 (2) 15 Mortgage fees and related income 456 312 596 548 703 46 (35)Card income 590 675 651 1,238 999 (13) (41)All other income 1,122 1,144 1,212 1,321 1,339 (2) (16)
Noninterest revenue 3,902 3,834 4,138 4,726 4,588 2 (15)Net interest income 8,327 8,441 8,383 8,034 7,929 (1) 5
TOTAL NET REVENUE 12,229 12,275 12,521 12,760 12,517 — (2)
Provision for credit losses 678 (1,060) (459) (1,868) (3,602) NM NM
NONINTEREST EXPENSECompensation expense 3,171 3,177 3,012 2,977 2,976 — 7 Noncompensation expense (a) 4,549 4,577 4,226 4,085 4,226 (1) 8
TOTAL NONINTEREST EXPENSE 7,720 7,754 7,238 7,062 7,202 — 7
Income/(loss) before income tax expense/(benefit) 3,831 5,581 5,742 7,566 8,917 (31) (57)Income tax expense/(benefit) (b) 936 1,434 1,391 1,921 2,130 (35) (56)
NET INCOME/(LOSS) (b) $ 2,895 $ 4,147 $ 4,351 $ 5,645 $ 6,787 (30) (57)
REVENUE BY LINE OF BUSINESSConsumer & Business Banking $ 6,062 $ 6,172 $ 6,157 $ 6,016 $ 5,635 (2) 8 Home Lending 1,169 1,084 1,400 1,349 1,458 8 (20)Card & Auto 4,998 5,019 4,964 5,395 5,424 — (8)
MORTGAGE FEES AND RELATED INCOME DETAILSProduction revenue 211 327 614 517 757 (35) (72)Net mortgage servicing revenue (c) 245 (15) (18) 31 (54) NM NM
Mortgage fees and related income $ 456 $ 312 $ 596 $ 548 $ 703 46 (35)
FINANCIAL RATIOSROE 23 % 32 % (b) 34 % 44 % 54 %Overhead ratio 63 63 58 55 58
(a) Included depreciation expense on leased assets of $694 million, $767 million, $769 million, $856 million and $916 million for the three months ended March 31, 2022, December 31, 2021, September 30, 2021, June 30, 2021 and March 31, 2021, respectively.(b) In the first quarter of 2022, the Firm changed its methodology for allocating income taxes to the LOBs, with no impact to Firmwide net income. Prior-period amounts have been revised to conform with the current presentation.(c) Included MSR risk management results of $109 million, $(162) million, $(145) million, $(103) million and $(115) million for the three months ended March 31, 2022, December 31, 2021, September 30, 2021, June 30, 2021 and March 31, 2021, respectively.
Page 11
JPMORGAN CHASE & CO.
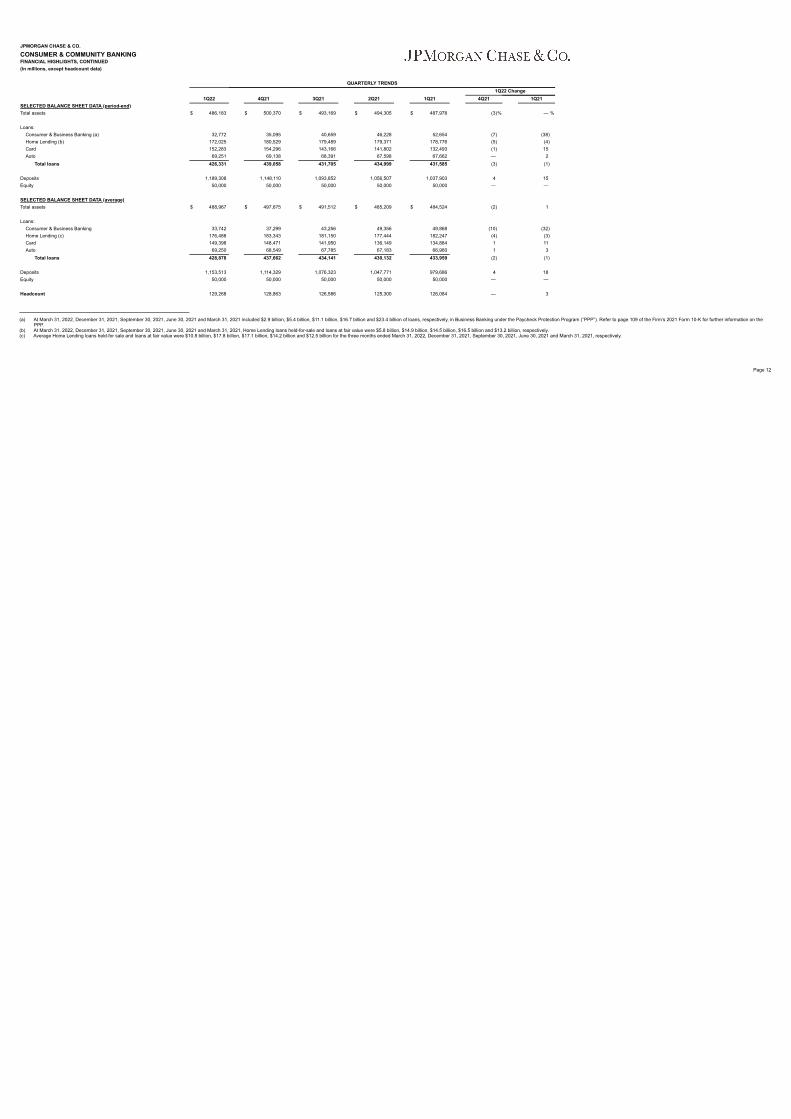
CONSUMER & COMMUNITY BANKINGFINANCIAL HIGHLIGHTS, CONTINUED(in millions, except headcount data)
QUARTERLY TRENDS1Q22 Change
1Q22 4Q21 3Q21 2Q21 1Q21 4Q21 1Q21SELECTED BALANCE SHEET DATA (period-end)Total assets $ 486,183 $ 500,370 $ 493,169 $ 494,305 $ 487,978 (3)% — %
Loans:Consumer & Business Banking (a) 32,772 35,095 40,659 46,228 52,654 (7) (38)Home Lending (b) 172,025 180,529 179,489 179,371 178,776 (5) (4)Card 152,283 154,296 143,166 141,802 132,493 (1) 15 Auto 69,251 69,138 68,391 67,598 67,662 — 2
Total loans 426,331 439,058 431,705 434,999 431,585 (3) (1)
Deposits 1,189,308 1,148,110 1,093,852 1,056,507 1,037,903 4 15 Equity 50,000 50,000 50,000 50,000 50,000 — —
SELECTED BALANCE SHEET DATA (average)Total assets $ 488,967 $ 497,675 $ 491,512 $ 485,209 $ 484,524 (2) 1
Loans:Consumer & Business Banking 33,742 37,299 43,256 49,356 49,868 (10) (32)Home Lending (c) 176,488 183,343 181,150 177,444 182,247 (4) (3)Card 149,398 148,471 141,950 136,149 134,884 1 11 Auto 69,250 68,549 67,785 67,183 66,960 1 3
Total loans 428,878 437,662 434,141 430,132 433,959 (2) (1)
Deposits 1,153,513 1,114,329 1,076,323 1,047,771 979,686 4 18 Equity 50,000 50,000 50,000 50,000 50,000 — —
Headcount 129,268 128,863 126,586 125,300 126,084 — 3
(a) At March 31, 2022, December 31, 2021, September 30, 2021, June 30, 2021 and March 31, 2021 included $2.9 billion, $5.4 billion, $11.1 billion, $16.7 billion and $23.4 billion of loans, respectively, in Business Banking under the Paycheck Protection Program (“PPP”). Refer to page 109 of the Firm’s 2021 Form 10-K for further information on thePPP.
(b) At March 31, 2022, December 31, 2021, September 30, 2021, June 30, 2021 and March 31, 2021, Home Lending loans held-for-sale and loans at fair value were $5.8 billion, $14.9 billion, $14.5 billion, $16.5 billion and $13.2 billion, respectively.(c) Average Home Lending loans held-for sale and loans at fair value were $10.8 billion, $17.8 billion, $17.1 billion, $14.2 billion and $12.5 billion for the three months ended March 31, 2022, December 31, 2021, September 30, 2021, June 30, 2021 and March 31, 2021, respectively.
Page 12
JPMORGAN CHASE & CO.
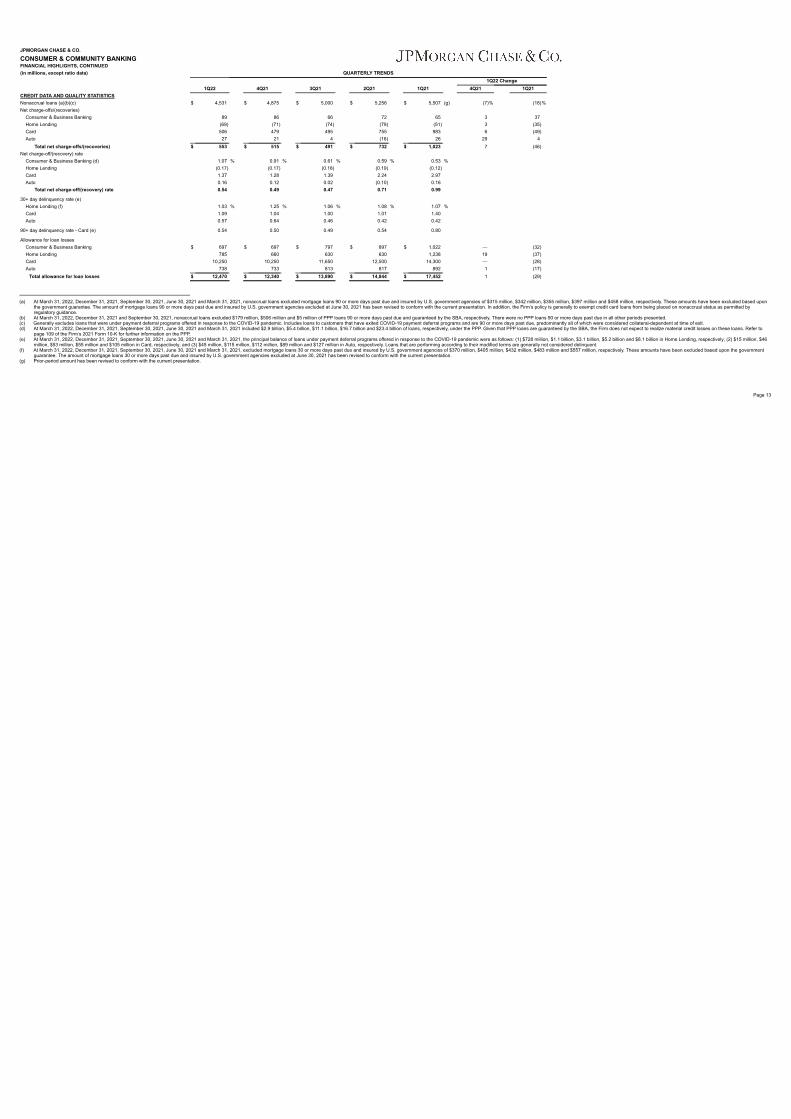
CONSUMER & COMMUNITY BANKINGFINANCIAL HIGHLIGHTS, CONTINUED(in millions, except ratio data) QUARTERLY TRENDS
1Q22 Change1Q22 4Q21 3Q21 2Q21 1Q21 4Q21 1Q21
CREDIT DATA AND QUALITY STATISTICSNonaccrual loans (a)(b)(c) $ 4,531 $ 4,875 $ 5,000 $ 5,256 $ 5,507 (g) (7)% (18)%Net charge-offs/(recoveries)
Consumer & Business Banking 89 86 66 72 65 3 37 Home Lending (69) (71) (74) (79) (51) 3 (35)Card 506 479 495 755 983 6 (49)Auto 27 21 4 (16) 26 29 4
Total net charge-offs/(recoveries) $ 553 $ 515 $ 491 $ 732 $ 1,023 7 (46)Net charge-off/(recovery) rate
Consumer & Business Banking (d) 1.07 % 0.91 % 0.61 % 0.59 % 0.53 %Home Lending (0.17) (0.17) (0.18) (0.19) (0.12)Card 1.37 1.28 1.39 2.24 2.97 Auto 0.16 0.12 0.02 (0.10) 0.16
Total net charge-off/(recovery) rate 0.54 0.49 0.47 0.71 0.99
30+ day delinquency rate (e)Home Lending (f) 1.03 % 1.25 % 1.06 % 1.08 % 1.07 %Card 1.09 1.04 1.00 1.01 1.40 Auto 0.57 0.64 0.46 0.42 0.42
90+ day delinquency rate - Card (e) 0.54 0.50 0.49 0.54 0.80
Allowance for loan lossesConsumer & Business Banking $ 697 $ 697 $ 797 $ 897 $ 1,022 — (32)Home Lending 785 660 630 630 1,238 19 (37)Card 10,250 10,250 11,650 12,500 14,300 — (28)Auto 738 733 813 817 892 1 (17)
Total allowance for loan losses $ 12,470 $ 12,340 $ 13,890 $ 14,844 $ 17,452 1 (29)
(a) At March 31, 2022, December 31, 2021, September 30, 2021, June 30, 2021 and March 31, 2021, nonaccrual loans excluded mortgage loans 90 or more days past due and insured by U.S. government agencies of $315 million, $342 million, $355 million, $397 million and $458 million, respectively. These amounts have been excluded based uponthe government guarantee. The amount of mortgage loans 90 or more days past due and insured by U.S. government agencies excluded at June 30, 2021 has been revised to conform with the current presentation. In addition, the Firm’s policy is generally to exempt credit card loans from being placed on nonaccrual status as permitted byregulatory guidance.
(b) At March 31, 2022, December 31, 2021 and September 30, 2021, nonaccrual loans excluded $179 million, $506 million and $5 million of PPP loans 90 or more days past due and guaranteed by the SBA, respectively. There were no PPP loans 90 or more days past due in all other periods presented.(c) Generally excludes loans that were under payment deferral programs offered in response to the COVID-19 pandemic. Includes loans to customers that have exited COVID-19 payment deferral programs and are 90 or more days past due, predominantly all of which were considered collateral-dependent at time of exit.(d) At March 31, 2022, December 31, 2021, September 30, 2021, June 30, 2021 and March 31, 2021 included $2.9 billion, $5.4 billion, $11.1 billion, $16.7 billion and $23.4 billion of loans, respectively, under the PPP. Given that PPP loans are guaranteed by the SBA, the Firm does not expect to realize material credit losses on these loans. Refer to
page 109 of the Firm’s 2021 Form 10-K for further information on the PPP.(e) At March 31, 2022, December 31, 2021, September 30, 2021, June 30, 2021 and March 31, 2021, the principal balance of loans under payment deferral programs offered in response to the COVID-19 pandemic were as follows: (1) $728 million, $1.1 billion, $3.1 billion, $5.2 billion and $8.1 billion in Home Lending, respectively; (2) $15 million, $46
million, $53 million, $55 million and $105 million in Card, respectively; and (3) $45 million, $115 million, $112 million, $89 million and $127 million in Auto, respectively. Loans that are performing according to their modified terms are generally not considered delinquent.(f) At March 31, 2022, December 31, 2021, September 30, 2021, June 30, 2021 and March 31, 2021, excluded mortgage loans 30 or more days past due and insured by U.S. government agencies of $370 million, $405 million, $432 million, $483 million and $557 million, respectively. These amounts have been excluded based upon the government
guarantee. The amount of mortgage loans 30 or more days past due and insured by U.S. government agencies excluded at June 30, 2021 has been revised to conform with the current presentation.(g) Prior-period amount has been revised to conform with the current presentation.
Page 13
JPMORGANCHASE & CO.
CONSUMER& COMMUNITYBANKING
FINANCIALHIGHLIGHTS, CONTINUED
(in millions,except ratio data and whereotherwise noted)
QUARTERLY TRENDS
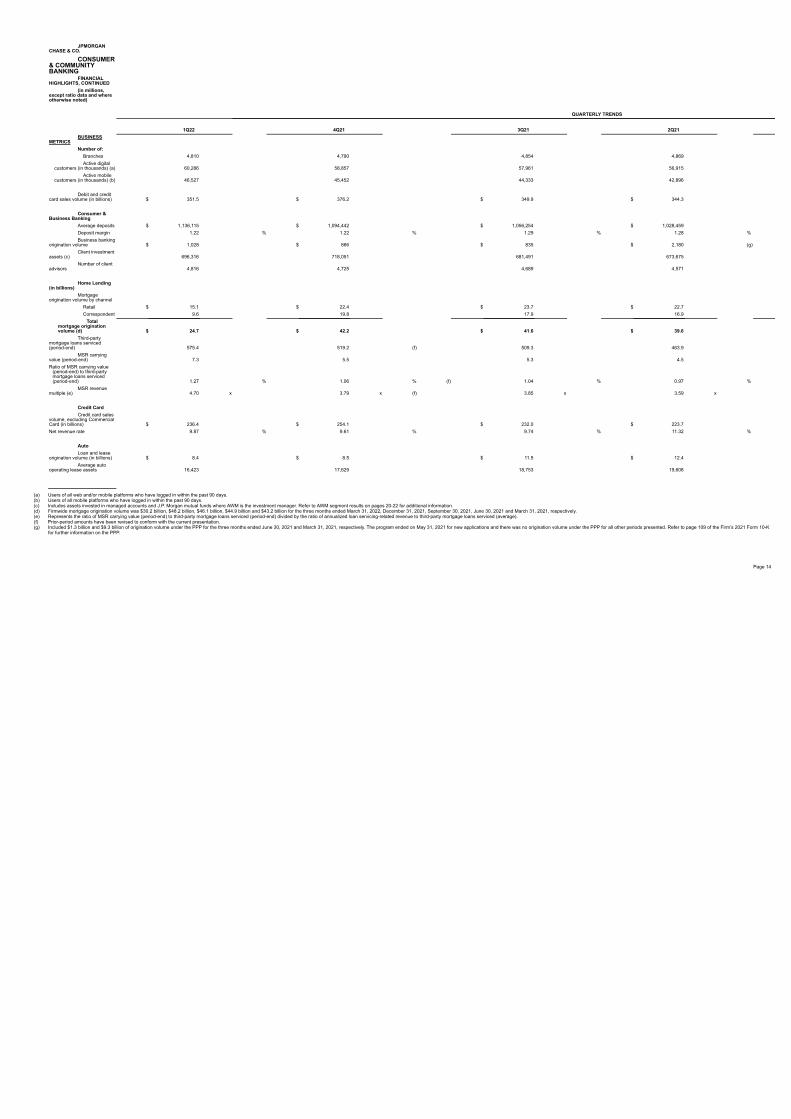
1Q22 4Q21 3Q21 2Q21BUSINESS
METRICSNumber of:
Branches 4,810 4,790 4,854 4,869 Active digital
customers (in thousands) (a) 60,286 58,857 57,961 56,915 Active mobile
customers (in thousands) (b) 46,527 45,452 44,333 42,896
Debit and creditcard sales volume (in billions) $ 351.5 $ 376.2 $ 349.9 $ 344.3
Consumer &Business Banking
Average deposits $ 1,136,115 $ 1,094,442 $ 1,056,254 $ 1,028,459 Deposit margin 1.22 % 1.22 % 1.29 % 1.28 %Business banking
origination volume $ 1,028 $ 866 $ 835 $ 2,180 (g)Client investment
assets (c) 696,316 718,051 681,491 673,675 Number of client
advisors 4,816 4,725 4,689 4,571
Home Lending(in billions)
Mortgageorigination volume by channel
Retail $ 15.1 $ 22.4 $ 23.7 $ 22.7 Correspondent 9.6 19.8 17.9 16.9
Totalmortgage originationvolume (d) $ 24.7 $ 42.2 $ 41.6 $ 39.6
Third-partymortgage loans serviced(period-end) 575.4 519.2 (f) 509.3 463.9
MSR carryingvalue (period-end) 7.3 5.5 5.3 4.5 Ratio of MSR carrying value
(period-end) to third-partymortgage loans serviced(period-end) 1.27 % 1.06 % (f) 1.04 % 0.97 %
MSR revenuemultiple (e) 4.70 x 3.79 x (f) 3.85 x 3.59 x
Credit CardCredit card sales
volume, excluding CommercialCard (in billions) $ 236.4 $ 254.1 $ 232.0 $ 223.7 Net revenue rate 9.87 % 9.61 % 9.74 % 11.32 %
AutoLoan and lease
origination volume (in billions) $ 8.4 $ 8.5 $ 11.5 $ 12.4 Average auto
operating lease assets 16,423 17,629 18,753 19,608
(a) Users of all web and/or mobile platforms who have logged in within the past 90 days.(b) Users of all mobile platforms who have logged in within the past 90 days.(c) Includes assets invested in managed accounts and J.P. Morgan mutual funds where AWM is the investment manager. Refer to AWM segment results on pages 20-22 for additional information.(d) Firmwide mortgage origination volume was $30.2 billion, $48.2 billion, $46.1 billion, $44.9 billion and $43.2 billion for the three months ended March 31, 2022, December 31, 2021, September 30, 2021, June 30, 2021 and March 31, 2021, respectively.(e) Represents the ratio of MSR carrying value (period-end) to third-party mortgage loans serviced (period-end) divided by the ratio of annualized loan servicing-related revenue to third-party mortgage loans serviced (average).(f) Prior-period amounts have been revised to conform with the current presentation.(g) Included $1.3 billion and $9.3 billion of origination volume under the PPP for the three months ended June 30, 2021 and March 31, 2021, respectively. The program ended on May 31, 2021 for new applications and there was no origination volume under the PPP for all other periods presented. Refer to page 109 of the Firm’s 2021 Form 10-K
for further information on the PPP.
Page 14
JPMORGAN CHASE & CO.
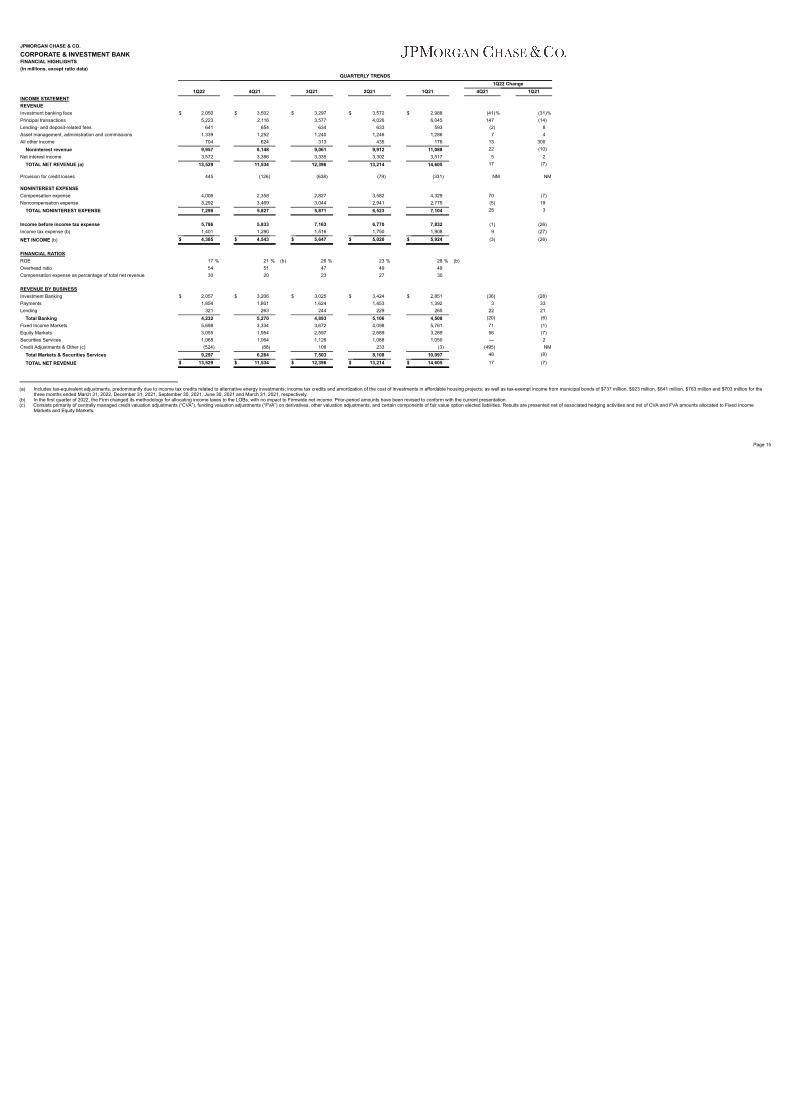
CORPORATE & INVESTMENT BANKFINANCIAL HIGHLIGHTS(in millions, except ratio data)
QUARTERLY TRENDS1Q22 Change
1Q22 4Q21 3Q21 2Q21 1Q21 4Q21 1Q21INCOME STATEMENTREVENUEInvestment banking fees $ 2,050 $ 3,502 $ 3,297 $ 3,572 $ 2,988 (41)% (31)%Principal transactions 5,223 2,116 3,577 4,026 6,045 147 (14)Lending- and deposit-related fees 641 654 634 633 593 (2) 8 Asset management, administration and commissions 1,339 1,252 1,240 1,246 1,286 7 4 All other income 704 624 313 435 176 13 300
Noninterest revenue 9,957 8,148 9,061 9,912 11,088 22 (10)Net interest income 3,572 3,386 3,335 3,302 3,517 5 2
TOTAL NET REVENUE (a) 13,529 11,534 12,396 13,214 14,605 17 (7)
Provision for credit losses 445 (126) (638) (79) (331) NM NM
NONINTEREST EXPENSECompensation expense 4,006 2,358 2,827 3,582 4,329 70 (7)Noncompensation expense 3,292 3,469 3,044 2,941 2,775 (5) 19
TOTAL NONINTEREST EXPENSE 7,298 5,827 5,871 6,523 7,104 25 3
Income before income tax expense 5,786 5,833 7,163 6,770 7,832 (1) (26)Income tax expense (b) 1,401 1,290 1,516 1,750 1,908 9 (27)
NET INCOME (b) $ 4,385 $ 4,543 $ 5,647 $ 5,020 $ 5,924 (3) (26)
FINANCIAL RATIOSROE 17 % 21 % (b) 26 % 23 % 28 % (b)Overhead ratio 54 51 47 49 49 Compensation expense as percentage of total net revenue 30 20 23 27 30
REVENUE BY BUSINESSInvestment Banking $ 2,057 $ 3,206 $ 3,025 $ 3,424 $ 2,851 (36) (28)Payments 1,854 1,801 1,624 1,453 1,392 3 33 Lending 321 263 244 229 265 22 21
Total Banking 4,232 5,270 4,893 5,106 4,508 (20) (6)Fixed Income Markets 5,698 3,334 3,672 4,098 5,761 71 (1)Equity Markets 3,055 1,954 2,597 2,689 3,289 56 (7)Securities Services 1,068 1,064 1,126 1,088 1,050 — 2 Credit Adjustments & Other (c) (524) (88) 108 233 (3) (495) NM
Total Markets & Securities Services 9,297 6,264 7,503 8,108 10,097 48 (8)
TOTAL NET REVENUE $ 13,529 $ 11,534 $ 12,396 $ 13,214 $ 14,605 17 (7)
(a) Includes tax-equivalent adjustments, predominantly due to income tax credits related to alternative energy investments; income tax credits and amortization of the cost of investments in affordable housing projects; as well as tax-exempt income from municipal bonds of $737 million, $923 million, $641 million, $763 million and $703 million for thethree months ended March 31, 2022, December 31, 2021, September 30, 2021, June 30, 2021 and March 31, 2021, respectively.
(b) In the first quarter of 2022, the Firm changed its methodology for allocating income taxes to the LOBs, with no impact to Firmwide net income. Prior-period amounts have been revised to conform with the current presentation.(c) Consists primarily of centrally managed credit valuation adjustments (“CVA”), funding valuation adjustments (“FVA”) on derivatives, other valuation adjustments, and certain components of fair value option elected liabilities. Results are presented net of associated hedging activities and net of CVA and FVA amounts allocated to Fixed Income
Markets and Equity Markets.
Page 15
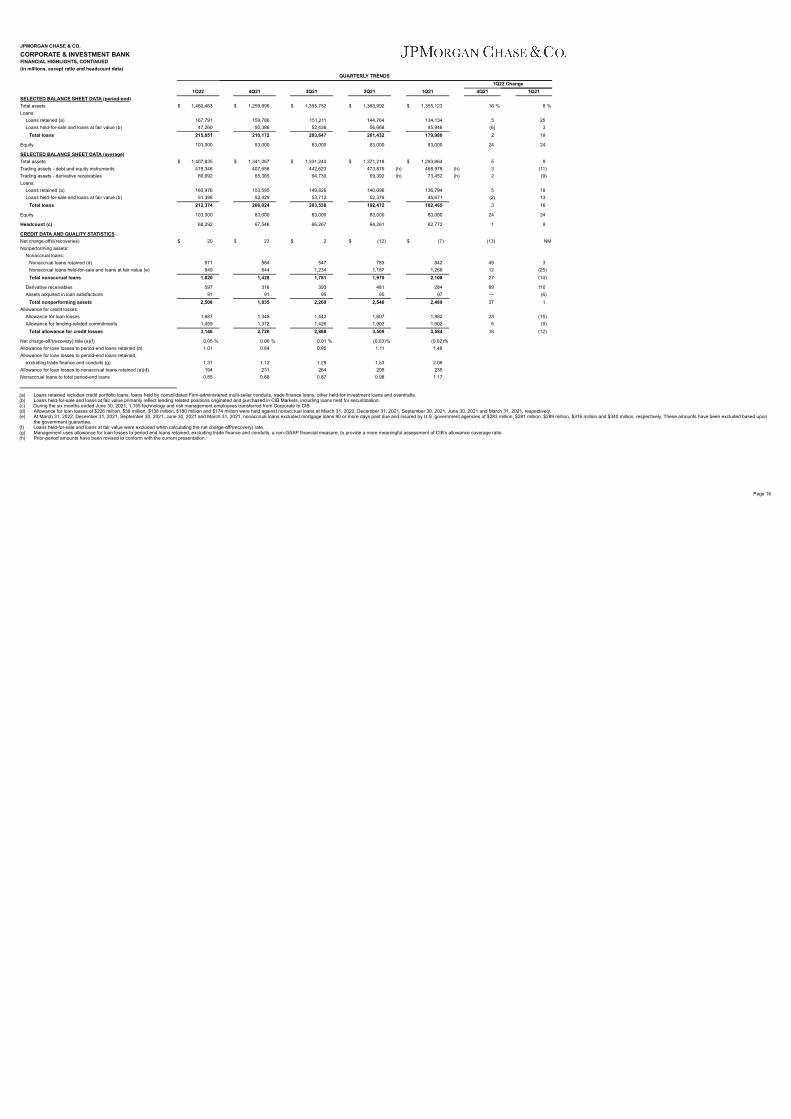
JPMORGAN CHASE & CO.
CORPORATE & INVESTMENT BANKFINANCIAL HIGHLIGHTS, CONTINUED(in millions, except ratio and headcount data)
QUARTERLY TRENDS1Q22 Change
1Q22 4Q21 3Q21 2Q21 1Q21 4Q21 1Q21SELECTED BALANCE SHEET DATA (period-end)Total assets $ 1,460,463 $ 1,259,896 $ 1,355,752 $ 1,363,992 $ 1,355,123 16 % 8 %Loans:
Loans retained (a) 167,791 159,786 151,211 144,764 134,134 5 25 Loans held-for-sale and loans at fair value (b) 47,260 50,386 52,436 56,668 45,846 (6) 3
Total loans 215,051 210,172 203,647 201,432 179,980 2 19
Equity 103,000 83,000 83,000 83,000 83,000 24 24
SELECTED BALANCE SHEET DATA (average)Total assets $ 1,407,835 $ 1,341,267 $ 1,331,240 $ 1,371,218 $ 1,293,864 5 9 Trading assets - debt and equity instruments 419,346 407,656 442,623 473,875 (h) 468,976 (h) 3 (11)Trading assets - derivative receivables 66,692 65,365 64,730 69,392 (h) 73,452 (h) 2 (9)Loans:
Loans retained (a) 160,976 153,595 149,826 140,096 136,794 5 18 Loans held-for-sale and loans at fair value (b) 51,398 52,429 53,712 52,376 45,671 (2) 13
Total loans 212,374 206,024 203,538 192,472 182,465 3 16
Equity 103,000 83,000 83,000 83,000 83,000 24 24
Headcount (c) 68,292 67,546 66,267 64,261 62,772 1 9
CREDIT DATA AND QUALITY STATISTICSNet charge-offs/(recoveries) $ 20 $ 23 $ 2 $ (12) $ (7) (13) NMNonperforming assets:
Nonaccrual loans:Nonaccrual loans retained (d) 871 584 547 783 842 49 3 Nonaccrual loans held-for-sale and loans at fair value (e) 949 844 1,234 1,187 1,266 12 (25)Total nonaccrual loans 1,820 1,428 1,781 1,970 2,108 27 (14)
Derivative receivables 597 316 393 481 284 89 110 Assets acquired in loan satisfactions 91 91 95 95 97 — (6)
Total nonperforming assets 2,508 1,835 2,269 2,546 2,489 37 1 Allowance for credit losses:
Allowance for loan losses 1,687 1,348 1,442 1,607 1,982 25 (15)Allowance for lending-related commitments 1,459 1,372 1,426 1,902 1,602 6 (9)
Total allowance for credit losses 3,146 2,720 2,868 3,509 3,584 16 (12)
Net charge-off/(recovery) rate (a)(f) 0.05 % 0.06 % 0.01 % (0.03)% (0.02)%Allowance for loan losses to period-end loans retained (a) 1.01 0.84 0.95 1.11 1.48 Allowance for loan losses to period-end loans retained,
excluding trade finance and conduits (g) 1.31 1.12 1.29 1.53 2.06 Allowance for loan losses to nonaccrual loans retained (a)(d) 194 231 264 205 235 Nonaccrual loans to total period-end loans 0.85 0.68 0.87 0.98 1.17
(a) Loans retained includes credit portfolio loans, loans held by consolidated Firm-administered multi-seller conduits, trade finance loans, other held-for-investment loans and overdrafts.(b) Loans held-for-sale and loans at fair value primarily reflect lending related positions originated and purchased in CIB Markets, including loans held for securitization.(c) During the six months ended June 30, 2021, 1,155 technology and risk management employees transferred from Corporate to CIB.(d) Allowance for loan losses of $226 million, $58 million, $138 million, $180 million and $174 million were held against nonaccrual loans at March 31, 2022, December 31, 2021, September 30, 2021, June 30, 2021 and March 31, 2021, respectively.(e) At March 31, 2022, December 31, 2021, September 30, 2021, June 30, 2021 and March 31, 2021, nonaccrual loans excluded mortgage loans 90 or more days past due and insured by U.S. government agencies of $283 million, $281 million, $289 million, $316 million and $340 million, respectively. These amounts have been excluded based upon
the government guarantee.(f) Loans held-for-sale and loans at fair value were excluded when calculating the net charge-off/(recovery) rate.(g) Management uses allowance for loan losses to period-end loans retained, excluding trade finance and conduits, a non-GAAP financial measure, to provide a more meaningful assessment of CIB’s allowance coverage ratio.(h) Prior-period amounts have been revised to conform with the current presentation.
Page 16
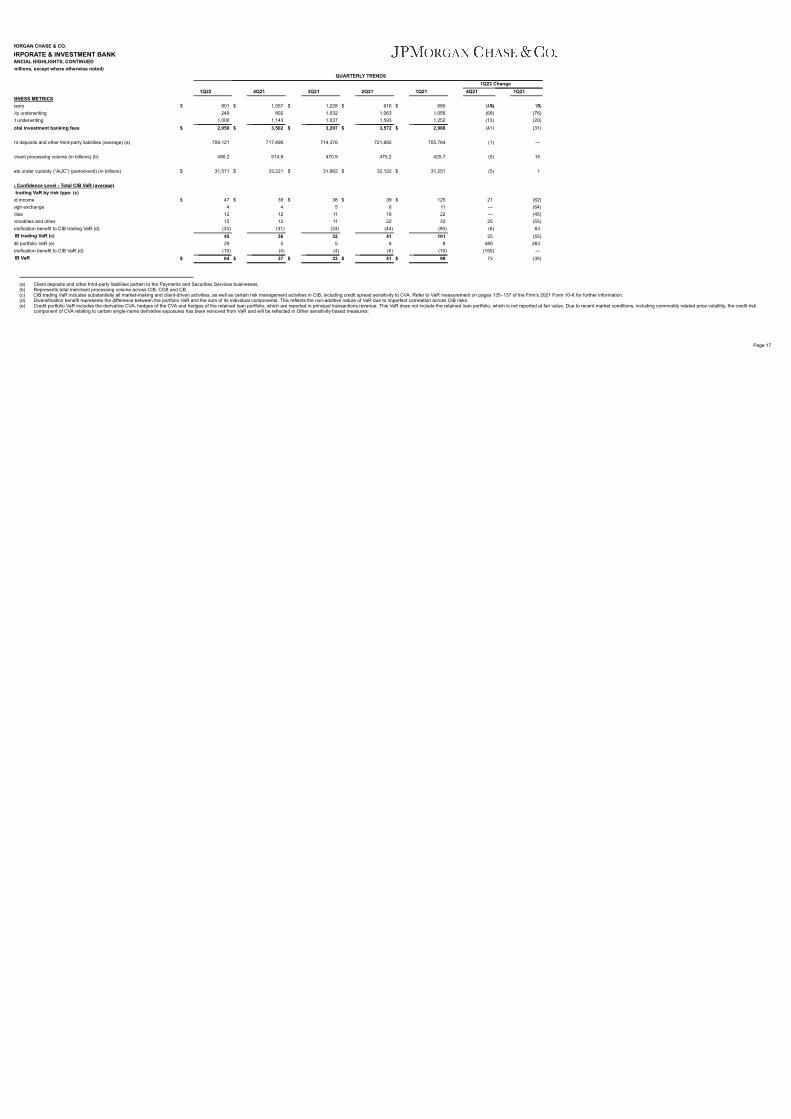
MORGAN CHASE & CO.
ORPORATE & INVESTMENT BANKANCIAL HIGHLIGHTS, CONTINUEDmillions, except where otherwise noted)
QUARTERLY TRENDS1Q22 Change
1Q22 4Q21 3Q21 2Q21 1Q21 4Q21 1Q21SINESS METRICSisory $ 801 $ 1,557 $ 1,228 $ 916 $ 680 (49)% 18 %ity underwriting 249 802 1,032 1,063 1,056 (69) (76)t underwriting 1,000 1,143 1,037 1,593 1,252 (13) (20)otal investment banking fees $ 2,050 $ 3,502 $ 3,297 $ 3,572 $ 2,988 (41) (31)
nt deposits and other third-party liabilities (average) (a) 709,121 717,496 714,376 721,882 705,764 (1) —
chant processing volume (in billions) (b) 490.2 514.9 470.9 475.2 425.7 (5) 15
ets under custody (“AUC”) (period-end) (in billions) $ 31,571 $ 33,221 $ 31,962 $ 32,122 $ 31,251 (5) 1
% Confidence Level - Total CIB VaR (average)trading VaR by risk type: (c)
ed income $ 47 $ 39 $ 38 $ 39 $ 125 21 (62)eign exchange 4 4 5 6 11 — (64)ities 12 12 11 18 22 — (45)
mmodities and other 15 12 11 22 33 25 (55)ersification benefit to CIB trading VaR (d) (33) (31) (33) (44) (90) (6) 63 IB trading VaR (c) 45 36 32 41 101 25 (55)dit portfolio VaR (e) 29 5 5 6 8 480 263 ersification benefit to CIB VaR (d) (10) (4) (4) (6) (10) (150) — IB VaR $ 64 $ 37 $ 33 $ 41 $ 99 73 (35)
(a) Client deposits and other third-party liabilities pertain to the Payments and Securities Services businesses.(b) Represents total merchant processing volume across CIB, CCB and CB.(c) CIB trading VaR includes substantially all market-making and client-driven activities, as well as certain risk management activities in CIB, including credit spread sensitivity to CVA. Refer to VaR measurement on pages 135–137 of the Firm’s 2021 Form 10-K for further information.(d) Diversification benefit represents the difference between the portfolio VaR and the sum of its individual components. This reflects the non-additive nature of VaR due to imperfect correlation across CIB risks.(e) Credit portfolio VaR includes the derivative CVA, hedges of the CVA and hedges of the retained loan portfolio, which are reported in principal transactions revenue. This VaR does not include the retained loan portfolio, which is not reported at fair value. Due to recent market conditions, including commodity related price volatility, the credit risk
component of CVA relating to certain single-name derivative exposures has been removed from VaR and will be reflected in Other sensitivity-based measures.
Page 17
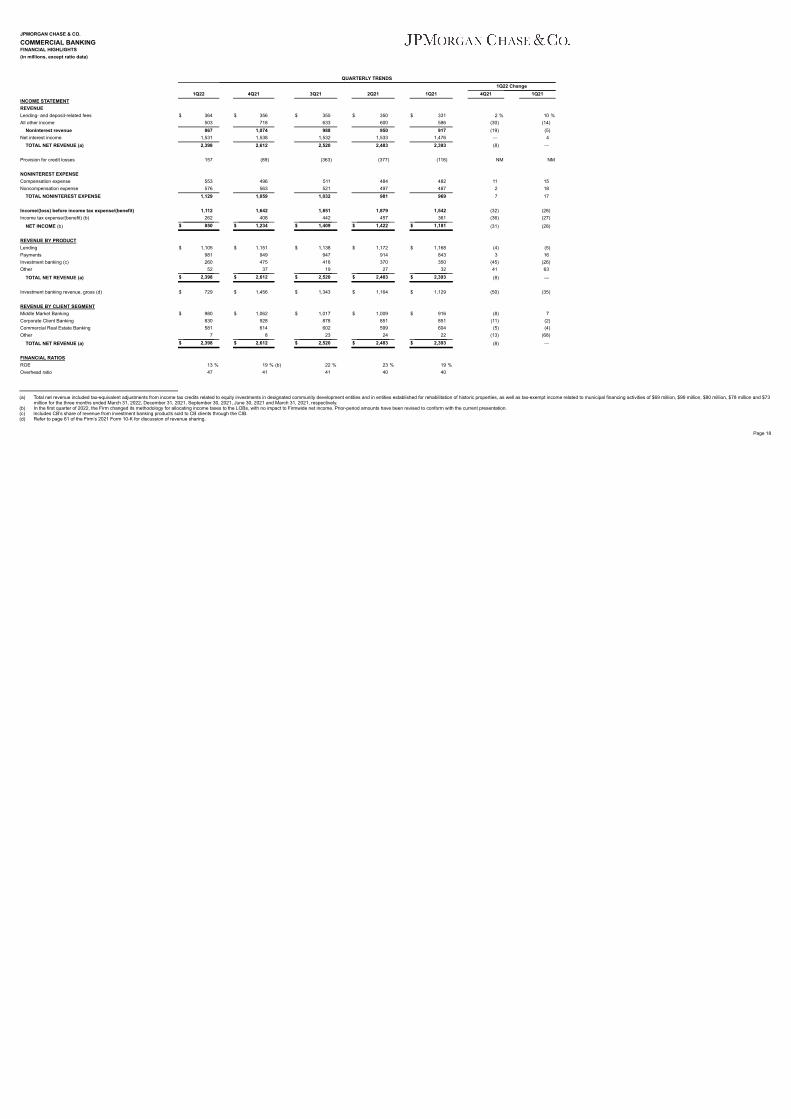
JPMORGAN CHASE & CO.
COMMERCIAL BANKINGFINANCIAL HIGHLIGHTS(in millions, except ratio data)
QUARTERLY TRENDS1Q22 Change
1Q22 4Q21 3Q21 2Q21 1Q21 4Q21 1Q21INCOME STATEMENTREVENUELending- and deposit-related fees $ 364 $ 356 $ 355 $ 350 $ 331 2 % 10 %All other income 503 718 633 600 586 (30) (14)
Noninterest revenue 867 1,074 988 950 917 (19) (5)Net interest income 1,531 1,538 1,532 1,533 1,476 — 4
TOTAL NET REVENUE (a) 2,398 2,612 2,520 2,483 2,393 (8) —
Provision for credit losses 157 (89) (363) (377) (118) NM NM
NONINTEREST EXPENSECompensation expense 553 496 511 484 482 11 15 Noncompensation expense 576 563 521 497 487 2 18
TOTAL NONINTEREST EXPENSE 1,129 1,059 1,032 981 969 7 17
Income/(loss) before income tax expense/(benefit) 1,112 1,642 1,851 1,879 1,542 (32) (28)Income tax expense/(benefit) (b) 262 408 442 457 361 (36) (27)
NET INCOME (b) $ 850 $ 1,234 $ 1,409 $ 1,422 $ 1,181 (31) (28)
REVENUE BY PRODUCTLending $ 1,105 $ 1,151 $ 1,138 $ 1,172 $ 1,168 (4) (5)Payments 981 949 947 914 843 3 16 Investment banking (c) 260 475 416 370 350 (45) (26)Other 52 37 19 27 32 41 63
TOTAL NET REVENUE (a) $ 2,398 $ 2,612 $ 2,520 $ 2,483 $ 2,393 (8) —
Investment banking revenue, gross (d) $ 729 $ 1,456 $ 1,343 $ 1,164 $ 1,129 (50) (35)
REVENUE BY CLIENT SEGMENTMiddle Market Banking $ 980 $ 1,062 $ 1,017 $ 1,009 $ 916 (8) 7 Corporate Client Banking 830 928 878 851 851 (11) (2)Commercial Real Estate Banking 581 614 602 599 604 (5) (4)Other 7 8 23 24 22 (13) (68)
TOTAL NET REVENUE (a) $ 2,398 $ 2,612 $ 2,520 $ 2,483 $ 2,393 (8) —
FINANCIAL RATIOSROE 13 % 19 % (b) 22 % 23 % 19 %Overhead ratio 47 41 41 40 40
(a) Total net revenue included tax-equivalent adjustments from income tax credits related to equity investments in designated community development entities and in entities established for rehabilitation of historic properties, as well as tax-exempt income related to municipal financing activities of $69 million, $99 million, $80 million, $78 million and $73million for the three months ended March 31, 2022, December 31, 2021, September 30, 2021, June 30, 2021 and March 31, 2021, respectively.
(b) In the first quarter of 2022, the Firm changed its methodology for allocating income taxes to the LOBs, with no impact to Firmwide net income. Prior-period amounts have been revised to conform with the current presentation.(c) Includes CB’s share of revenue from investment banking products sold to CB clients through the CIB.(d) Refer to page 61 of the Firm’s 2021 Form 10-K for discussion of revenue sharing.
Page 18
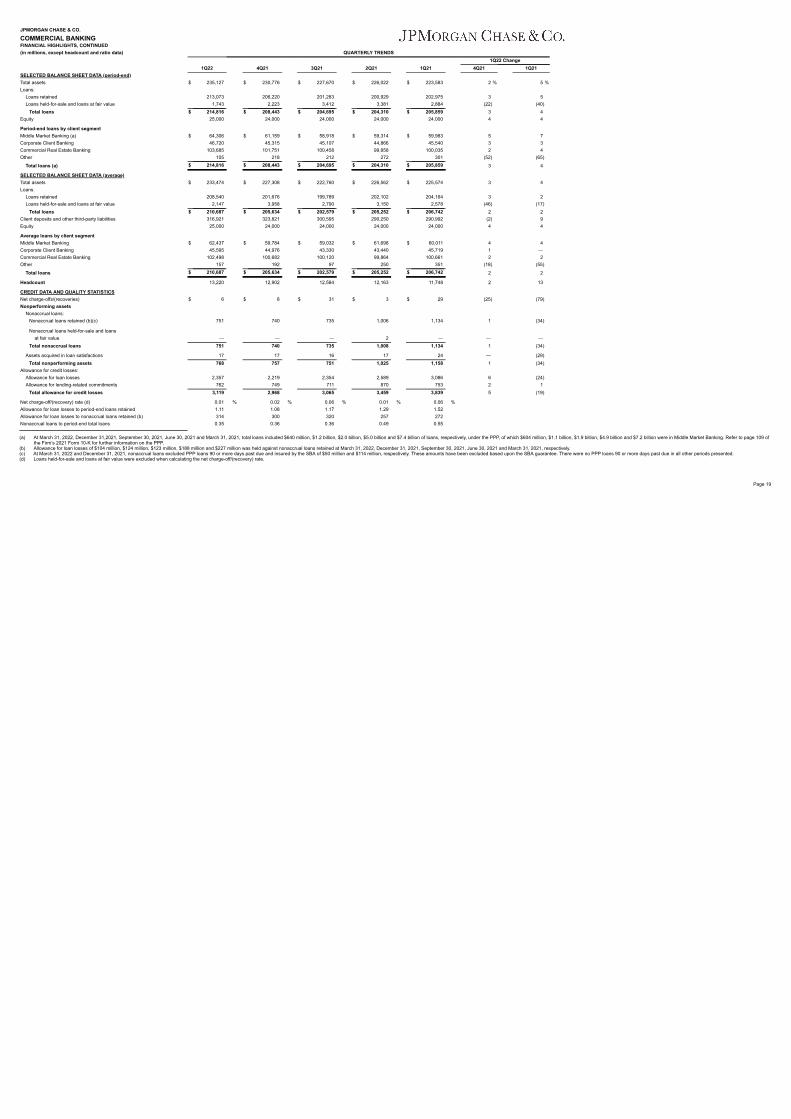
JPMORGAN CHASE & CO.
COMMERCIAL BANKINGFINANCIAL HIGHLIGHTS, CONTINUED(in millions, except headcount and ratio data) QUARTERLY TRENDS
1Q22 Change1Q22 4Q21 3Q21 2Q21 1Q21 4Q21 1Q21
SELECTED BALANCE SHEET DATA (period-end)Total assets $ 235,127 $ 230,776 $ 227,670 $ 226,022 $ 223,583 2 % 5 %Loans:
Loans retained 213,073 206,220 201,283 200,929 202,975 3 5 Loans held-for-sale and loans at fair value 1,743 2,223 3,412 3,381 2,884 (22) (40)
Total loans $ 214,816 $ 208,443 $ 204,695 $ 204,310 $ 205,859 3 4 Equity 25,000 24,000 24,000 24,000 24,000 4 4
Period-end loans by client segmentMiddle Market Banking (a) $ 64,306 $ 61,159 $ 58,918 $ 59,314 $ 59,983 5 7 Corporate Client Banking 46,720 45,315 45,107 44,866 45,540 3 3 Commercial Real Estate Banking 103,685 101,751 100,458 99,858 100,035 2 4 Other 105 218 212 272 301 (52) (65)
Total loans (a) $ 214,816 $ 208,443 $ 204,695 $ 204,310 $ 205,859 3 4
SELECTED BALANCE SHEET DATA (average)Total assets $ 233,474 $ 227,308 $ 222,760 $ 226,562 $ 225,574 3 4 Loans:
Loans retained 208,540 201,676 199,789 202,102 204,164 3 2 Loans held-for-sale and loans at fair value 2,147 3,958 2,790 3,150 2,578 (46) (17)
Total loans $ 210,687 $ 205,634 $ 202,579 $ 205,252 $ 206,742 2 2 Client deposits and other third-party liabilities 316,921 323,821 300,595 290,250 290,992 (2) 9 Equity 25,000 24,000 24,000 24,000 24,000 4 4
Average loans by client segmentMiddle Market Banking $ 62,437 $ 59,784 $ 59,032 $ 61,698 $ 60,011 4 4 Corporate Client Banking 45,595 44,976 43,330 43,440 45,719 1 — Commercial Real Estate Banking 102,498 100,682 100,120 99,864 100,661 2 2 Other 157 192 97 250 351 (18) (55)
Total loans $ 210,687 $ 205,634 $ 202,579 $ 205,252 $ 206,742 2 2
Headcount 13,220 12,902 12,584 12,163 11,748 2 13
CREDIT DATA AND QUALITY STATISTICSNet charge-offs/(recoveries) $ 6 $ 8 $ 31 $ 3 $ 29 (25) (79)Nonperforming assets
Nonaccrual loans:Nonaccrual loans retained (b)(c) 751 740 735 1,006 1,134 1 (34)
Nonaccrual loans held-for-sale and loans at fair value — — — 2 — — —
Total nonaccrual loans 751 740 735 1,008 1,134 1 (34)
Assets acquired in loan satisfactions 17 17 16 17 24 — (29)Total nonperforming assets 768 757 751 1,025 1,158 1 (34)
Allowance for credit losses:Allowance for loan losses 2,357 2,219 2,354 2,589 3,086 6 (24)Allowance for lending-related commitments 762 749 711 870 753 2 1
Total allowance for credit losses 3,119 2,968 3,065 3,459 3,839 5 (19)
Net charge-off/(recovery) rate (d) 0.01 % 0.02 % 0.06 % 0.01 % 0.06 %Allowance for loan losses to period-end loans retained 1.11 1.08 1.17 1.29 1.52 Allowance for loan losses to nonaccrual loans retained (b) 314 300 320 257 272 Nonaccrual loans to period-end total loans 0.35 0.36 0.36 0.49 0.55
(a) At March 31, 2022, December 31,2021, September 30, 2021, June 30, 2021 and March 31, 2021, total loans included $640 million, $1.2 billion, $2.0 billion, $5.0 billion and $7.4 billion of loans, respectively, under the PPP, of which $604 million, $1.1 billion, $1.9 billion, $4.9 billion and $7.2 billion were in Middle Market Banking. Refer to page 109 ofthe Firm’s 2021 Form 10-K for further information on the PPP.
(b) Allowance for loan losses of $104 million, $124 million, $123 million, $188 million and $227 million was held against nonaccrual loans retained at March 31, 2022, December 31, 2021, September 30, 2021, June 30, 2021 and March 31, 2021, respectively.(c) At March 31, 2022 and December 31, 2021, nonaccrual loans excluded PPP loans 90 or more days past due and insured by the SBA of $50 million and $114 million, respectively. These amounts have been excluded based upon the SBA guarantee. There were no PPP loans 90 or more days past due in all other periods presented.(d) Loans held-for-sale and loans at fair value were excluded when calculating the net charge-off/(recovery) rate.
Page 19
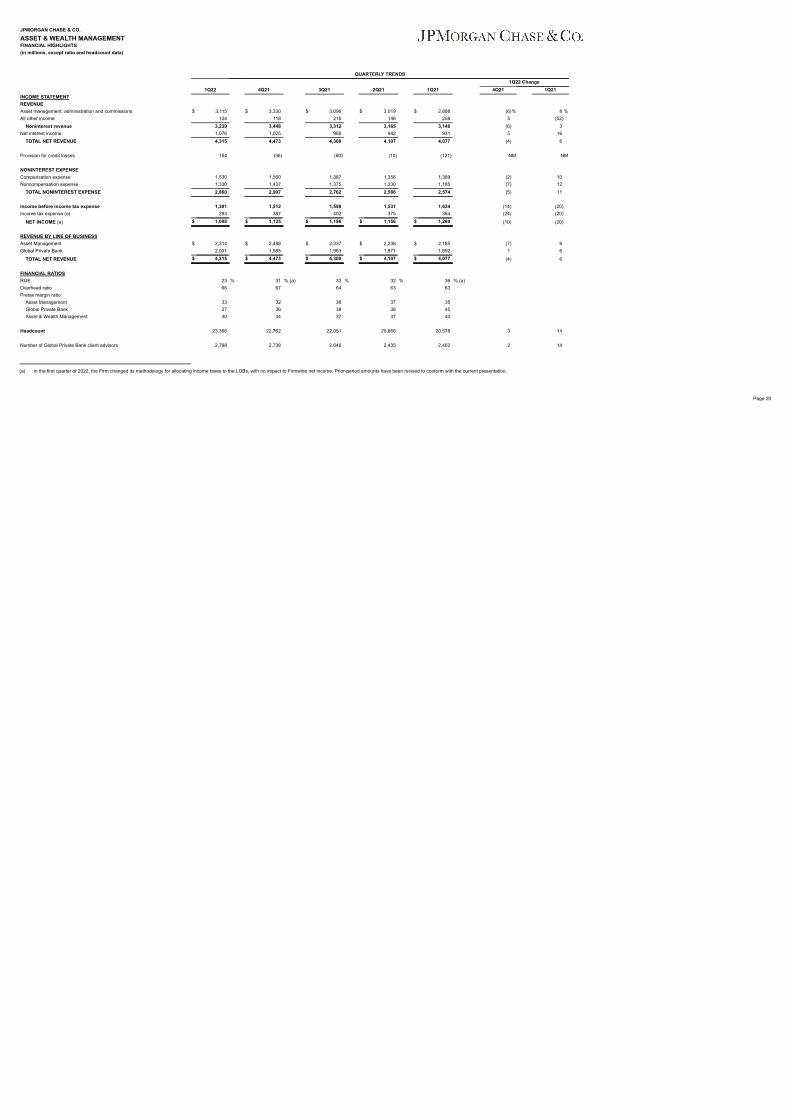
JPMORGAN CHASE & CO.
ASSET & WEALTH MANAGEMENTFINANCIAL HIGHLIGHTS(in millions, except ratio and headcount data)
QUARTERLY TRENDS1Q22 Change
1Q22 4Q21 3Q21 2Q21 1Q21 4Q21 1Q21INCOME STATEMENTREVENUEAsset management, administration and commissions $ 3,115 $ 3,330 $ 3,096 $ 3,019 $ 2,888 (6)% 8 %All other income 124 118 216 146 258 5 (52)
Noninterest revenue 3,239 3,448 3,312 3,165 3,146 (6) 3 Net interest income 1,076 1,025 988 942 931 5 16
TOTAL NET REVENUE 4,315 4,473 4,300 4,107 4,077 (4) 6
Provision for credit losses 154 (36) (60) (10) (121) NM NM
NONINTEREST EXPENSECompensation expense 1,530 1,560 1,387 1,356 1,389 (2) 10 Noncompensation expense 1,330 1,437 1,375 1,230 1,185 (7) 12
TOTAL NONINTEREST EXPENSE 2,860 2,997 2,762 2,586 2,574 (5) 11
Income before income tax expense 1,301 1,512 1,598 1,531 1,624 (14) (20)Income tax expense (a) 293 387 402 375 364 (24) (20)
NET INCOME (a) $ 1,008 $ 1,125 $ 1,196 $ 1,156 $ 1,260 (10) (20)
REVENUE BY LINE OF BUSINESSAsset Management $ 2,314 $ 2,488 $ 2,337 $ 2,236 $ 2,185 (7) 6 Global Private Bank 2,001 1,985 1,963 1,871 1,892 1 6
TOTAL NET REVENUE $ 4,315 $ 4,473 $ 4,300 $ 4,107 $ 4,077 (4) 6
FINANCIAL RATIOSROE 23 % 31 % (a) 33 % 32 % 36 % (a)Overhead ratio 66 67 64 63 63 Pretax margin ratio:
Asset Management 33 32 36 37 35 Global Private Bank 27 36 38 38 45 Asset & Wealth Management 30 34 37 37 40
Headcount 23,366 22,762 22,051 20,866 20,578 3 14
Number of Global Private Bank client advisors 2,798 2,738 2,646 2,435 2,462 2 14
(a) In the first quarter of 2022, the Firm changed its methodology for allocating income taxes to the LOBs, with no impact to Firmwide net income. Prior-period amounts have been revised to conform with the current presentation.
Page 20
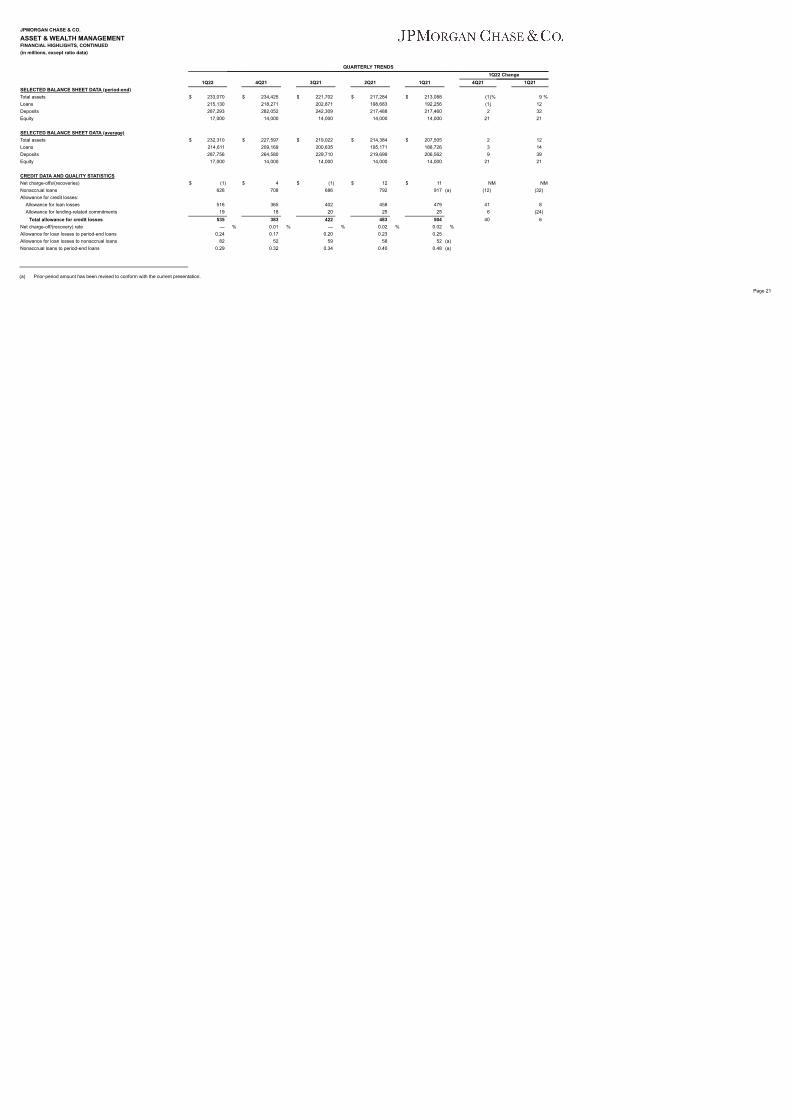
JPMORGAN CHASE & CO.
ASSET & WEALTH MANAGEMENTFINANCIAL HIGHLIGHTS, CONTINUED(in millions, except ratio data)
QUARTERLY TRENDS1Q22 Change
1Q22 4Q21 3Q21 2Q21 1Q21 4Q21 1Q21SELECTED BALANCE SHEET DATA (period-end)Total assets $ 233,070 $ 234,425 $ 221,702 $ 217,284 $ 213,088 (1)% 9 %Loans 215,130 218,271 202,871 198,683 192,256 (1) 12 Deposits 287,293 282,052 242,309 217,488 217,460 2 32 Equity 17,000 14,000 14,000 14,000 14,000 21 21
SELECTED BALANCE SHEET DATA (average)Total assets $ 232,310 $ 227,597 $ 219,022 $ 214,384 $ 207,505 2 12 Loans 214,611 209,169 200,635 195,171 188,726 3 14 Deposits 287,756 264,580 229,710 219,699 206,562 9 39 Equity 17,000 14,000 14,000 14,000 14,000 21 21
CREDIT DATA AND QUALITY STATISTICSNet charge-offs/(recoveries) $ (1) $ 4 $ (1) $ 12 $ 11 NM NMNonaccrual loans 626 708 686 792 917 (a) (12) (32)Allowance for credit losses:
Allowance for loan losses 516 365 402 458 479 41 8 Allowance for lending-related commitments 19 18 20 25 25 6 (24)
Total allowance for credit losses 535 383 422 483 504 40 6 Net charge-off/(recovery) rate — % 0.01 % — % 0.02 % 0.02 %Allowance for loan losses to period-end loans 0.24 0.17 0.20 0.23 0.25 Allowance for loan losses to nonaccrual loans 82 52 59 58 52 (a)Nonaccrual loans to period-end loans 0.29 0.32 0.34 0.40 0.48 (a)
(a) Prior-period amount has been revised to conform with the current presentation.
Page 21
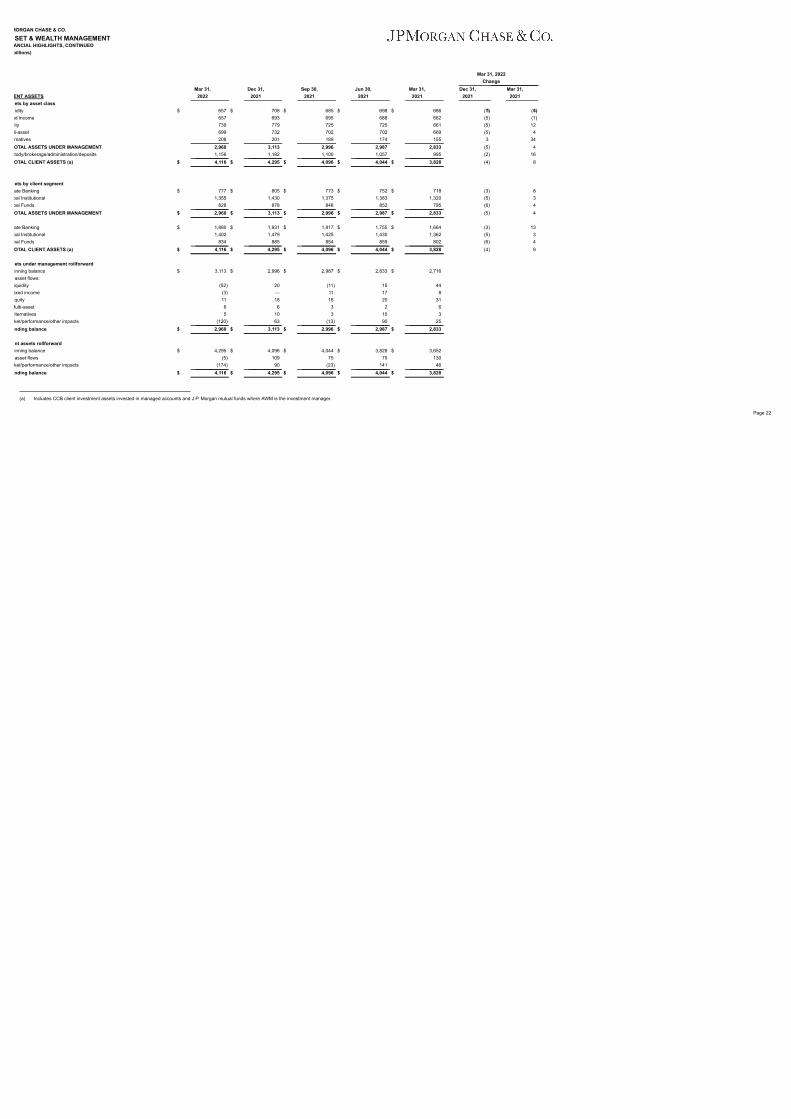
MORGAN CHASE & CO.
SET & WEALTH MANAGEMENTANCIAL HIGHLIGHTS, CONTINUEDbillions)
Mar 31, 2022Change
Mar 31, Dec 31, Sep 30, Jun 30, Mar 31, Dec 31, Mar 31,ENT ASSETS 2022 2021 2021 2021 2021 2021 2021ets by asset classidity $ 657 $ 708 $ 685 $ 698 $ 686 (7)% (4)%
ed income 657 693 695 688 662 (5) (1)ity 739 779 725 725 661 (5) 12 ti-asset 699 732 702 702 669 (5) 4 rnatives 208 201 189 174 155 3 34 OTAL ASSETS UNDER MANAGEMENT 2,960 3,113 2,996 2,987 2,833 (5) 4 tody/brokerage/administration/deposits 1,156 1,182 1,100 1,057 995 (2) 16 OTAL CLIENT ASSETS (a) $ 4,116 $ 4,295 $ 4,096 $ 4,044 $ 3,828 (4) 8
ets by client segmentate Banking $ 777 $ 805 $ 773 $ 752 $ 718 (3) 8 bal Institutional 1,355 1,430 1,375 1,383 1,320 (5) 3 bal Funds 828 878 848 852 795 (6) 4 OTAL ASSETS UNDER MANAGEMENT $ 2,960 $ 3,113 $ 2,996 $ 2,987 $ 2,833 (5) 4
ate Banking $ 1,880 $ 1,931 $ 1,817 $ 1,755 $ 1,664 (3) 13 bal Institutional 1,402 1,479 1,425 1,430 1,362 (5) 3 bal Funds 834 885 854 859 802 (6) 4 OTAL CLIENT ASSETS (a) $ 4,116 $ 4,295 $ 4,096 $ 4,044 $ 3,828 (4) 8
ets under management rollforwardinning balance $ 3,113 $ 2,996 $ 2,987 $ 2,833 $ 2,716 asset flows:iquidity (52) 20 (11) 15 44 ixed income (3) — 11 17 8 quity 11 18 16 20 31
Multi-asset 6 6 3 2 6 lternatives 5 10 3 10 3 ket/performance/other impacts (120) 63 (13) 90 25 nding balance $ 2,960 $ 3,113 $ 2,996 $ 2,987 $ 2,833
nt assets rollforwardinning balance $ 4,295 $ 4,096 $ 4,044 $ 3,828 $ 3,652 asset flows (5) 109 75 75 130 ket/performance/other impacts (174) 90 (23) 141 46 nding balance $ 4,116 $ 4,295 $ 4,096 $ 4,044 $ 3,828
(a) Includes CCB client investment assets invested in managed accounts and J.P. Morgan mutual funds where AWM is the investment manager.
Page 22
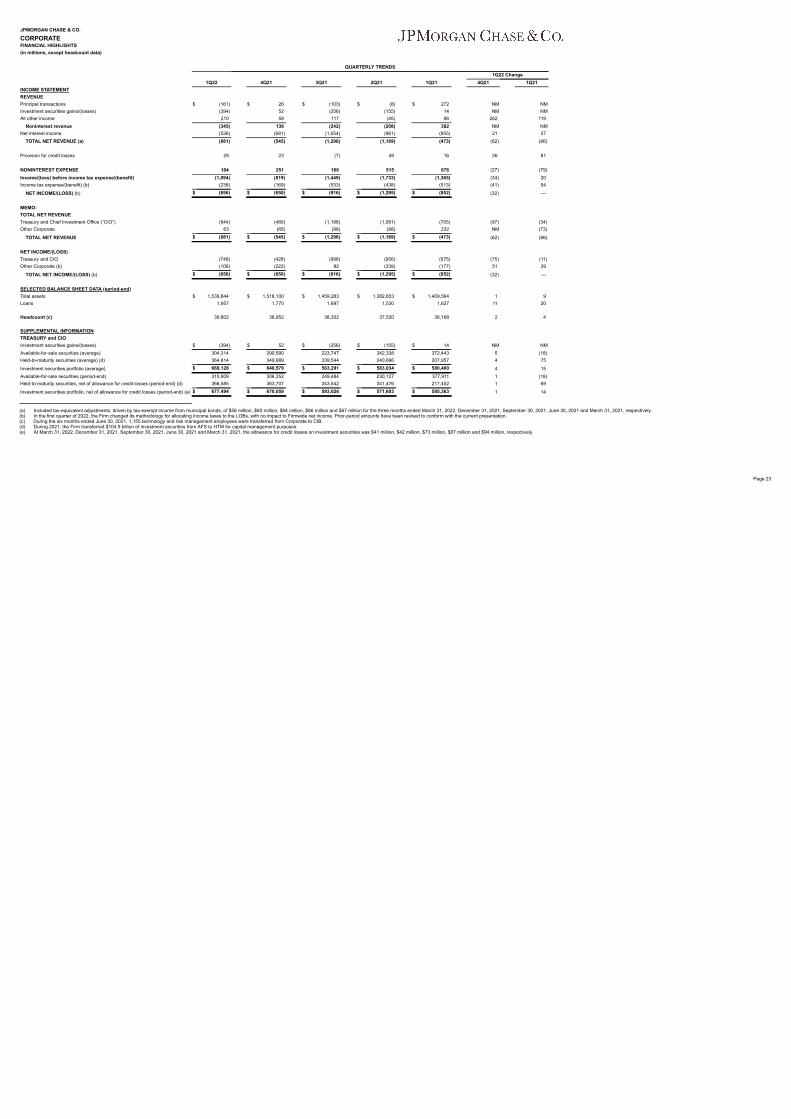
JPMORGAN CHASE & CO.
CORPORATEFINANCIAL HIGHLIGHTS(in millions, except headcount data)
QUARTERLY TRENDS1Q22 Change
1Q22 4Q21 3Q21 2Q21 1Q21 4Q21 1Q21INCOME STATEMENTREVENUEPrincipal transactions $ (161) $ 26 $ (103) $ (8) $ 272 NM NMInvestment securities gains/(losses) (394) 52 (256) (155) 14 NM NMAll other income 210 58 117 (45) 96 262 119
Noninterest revenue (345) 136 (242) (208) 382 NM NMNet interest income (536) (681) (1,054) (961) (855) 21 37
TOTAL NET REVENUE (a) (881) (545) (1,296) (1,169) (473) (62) (86)
Provision for credit losses 29 23 (7) 49 16 26 81
NONINTEREST EXPENSE 184 251 160 515 876 (27) (79)Income/(loss) before income tax expense/(benefit) (1,094) (819) (1,449) (1,733) (1,365) (34) 20 Income tax expense/(benefit) (b) (238) (169) (533) (438) (513) (41) 54
NET INCOME/(LOSS) (b) $ (856) $ (650) $ (916) $ (1,295) $ (852) (32) —
MEMO:TOTAL NET REVENUETreasury and Chief Investment Office (“CIO”) (944) (480) (1,198) (1,081) (705) (97) (34)Other Corporate 63 (65) (98) (88) 232 NM (73)
TOTAL NET REVENUE $ (881) $ (545) $ (1,296) $ (1,169) $ (473) (62) (86)
NET INCOME/(LOSS)Treasury and CIO (748) (428) (998) (956) (675) (75) (11)Other Corporate (b) (108) (222) 82 (339) (177) 51 39
TOTAL NET INCOME/(LOSS) (b) $ (856) $ (650) $ (916) $ (1,295) $ (852) (32) —
SELECTED BALANCE SHEET DATA (period-end)Total assets $ 1,539,844 $ 1,518,100 $ 1,459,283 $ 1,382,653 $ 1,409,564 1 9 Loans 1,957 1,770 1,697 1,530 1,627 11 20
Headcount (c) 39,802 38,952 38,302 37,520 38,168 2 4
SUPPLEMENTAL INFORMATIONTREASURY and CIOInvestment securities gains/(losses) $ (394) $ 52 $ (256) $ (155) $ 14 NM NMAvailable-for-sale securities (average) 304,314 290,590 223,747 342,338 372,443 5 (18)Held-to-maturity securities (average) (d) 364,814 349,989 339,544 240,696 207,957 4 75
Investment securities portfolio (average) $ 669,128 $ 640,579 $ 563,291 $ 583,034 $ 580,400 4 15 Available-for-sale securities (period-end) 310,909 306,352 249,484 230,127 377,911 1 (18)Held-to-maturity securities, net of allowance for credit losses (period-end) (d) 366,585 363,707 343,542 341,476 217,452 1 69
Investment securities portfolio, net of allowance for credit losses (period-end) (e) $ 677,494 $ 670,059 $ 593,026 $ 571,603 $ 595,363 1 14
(a) Included tax-equivalent adjustments, driven by tax-exempt income from municipal bonds, of $58 million, $60 million, $64 million, $66 million and $67 million for the three months ended March 31, 2022, December 31, 2021, September 30, 2021, June 30, 2021 and March 31, 2021, respectively.(b) In the first quarter of 2022, the Firm changed its methodology for allocating income taxes to the LOBs, with no impact to Firmwide net income. Prior-period amounts have been revised to conform with the current presentation.(c) During the six months ended June 30, 2021, 1,155 technology and risk management employees were transferred from Corporate to CIB.(d) During 2021, the Firm transferred $104.5 billion of investment securities from AFS to HTM for capital management purposes.(e) At March 31, 2022, December 31, 2021, September 30, 2021, June 30, 2021 and March 31, 2021, the allowance for credit losses on investment securities was $41 million, $42 million, $73 million, $87 million and $94 million, respectively.
Page 23
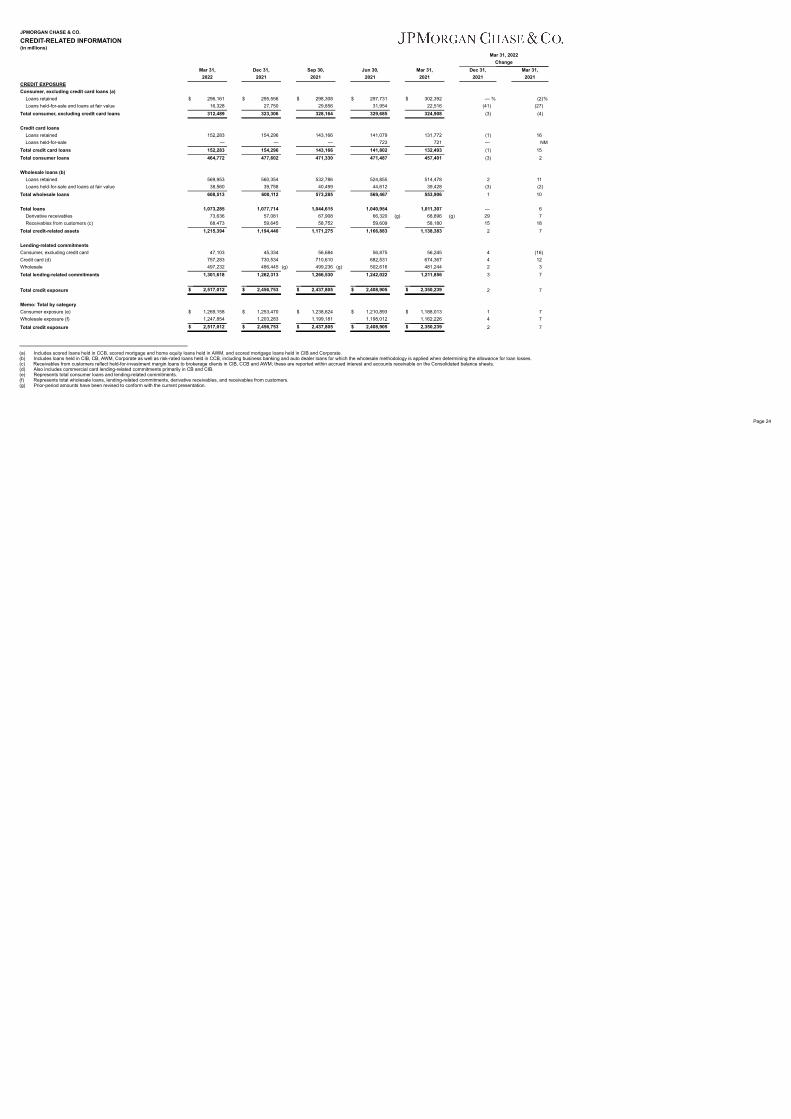
JPMORGAN CHASE & CO.
CREDIT-RELATED INFORMATION(in millions)
Mar 31, 2022Change
Mar 31, Dec 31, Sep 30, Jun 30, Mar 31, Dec 31, Mar 31,2022 2021 2021 2021 2021 2021 2021
CREDIT EXPOSUREConsumer, excluding credit card loans (a)
Loans retained $ 296,161 $ 295,556 $ 298,308 $ 297,731 $ 302,392 — % (2)%Loans held-for-sale and loans at fair value 16,328 27,750 29,856 31,954 22,516 (41) (27)
Total consumer, excluding credit card loans 312,489 323,306 328,164 329,685 324,908 (3) (4)
Credit card loansLoans retained 152,283 154,296 143,166 141,079 131,772 (1) 16 Loans held-for-sale — — — 723 721 — NM
Total credit card loans 152,283 154,296 143,166 141,802 132,493 (1) 15 Total consumer loans 464,772 477,602 471,330 471,487 457,401 (3) 2
Wholesale loans (b)Loans retained 569,953 560,354 532,786 524,855 514,478 2 11 Loans held-for-sale and loans at fair value 38,560 39,758 40,499 44,612 39,428 (3) (2)
Total wholesale loans 608,513 600,112 573,285 569,467 553,906 1 10
Total loans 1,073,285 1,077,714 1,044,615 1,040,954 1,011,307 — 6 Derivative receivables 73,636 57,081 67,908 66,320 (g) 68,896 (g) 29 7 Receivables from customers (c) 68,473 59,645 58,752 59,609 58,180 15 18
Total credit-related assets 1,215,394 1,194,440 1,171,275 1,166,883 1,138,383 2 7
Lending-related commitmentsConsumer, excluding credit card 47,103 45,334 56,684 56,875 56,245 4 (16)Credit card (d) 757,283 730,534 710,610 682,531 674,367 4 12 Wholesale 497,232 486,445 (g) 499,236 (g) 502,616 481,244 2 3 Total lending-related commitments 1,301,618 1,262,313 1,266,530 1,242,022 1,211,856 3 7
Total credit exposure $ 2,517,012 $ 2,456,753 $ 2,437,805 $ 2,408,905 $ 2,350,239 2 7
Memo: Total by categoryConsumer exposure (e) $ 1,269,158 $ 1,253,470 $ 1,238,624 $ 1,210,893 $ 1,188,013 1 7 Wholesale exposure (f) 1,247,854 1,203,283 1,199,181 1,198,012 1,162,226 4 7
Total credit exposure $ 2,517,012 $ 2,456,753 $ 2,437,805 $ 2,408,905 $ 2,350,239 2 7
(a) Includes scored loans held in CCB, scored mortgage and home equity loans held in AWM, and scored mortgage loans held in CIB and Corporate.(b) Includes loans held in CIB, CB, AWM, Corporate as well as risk-rated loans held in CCB, including business banking and auto dealer loans for which the wholesale methodology is applied when determining the allowance for loan losses.(c) Receivables from customers reflect held-for-investment margin loans to brokerage clients in CIB, CCB and AWM; these are reported within accrued interest and accounts receivable on the Consolidated balance sheets.(d) Also includes commercial card lending-related commitments primarily in CB and CIB.(e) Represents total consumer loans and lending-related commitments.(f) Represents total wholesale loans, lending-related commitments, derivative receivables, and receivables from customers.(g) Prior-period amounts have been revised to conform with the current presentation.
Page 24
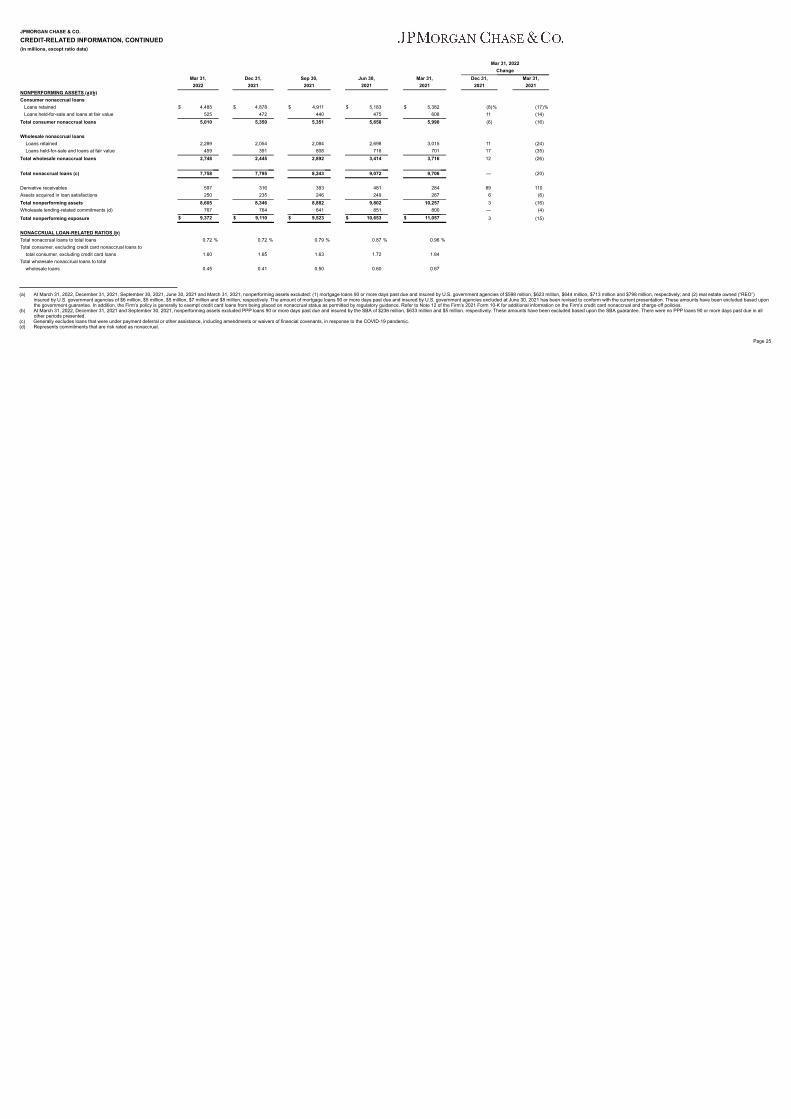
JPMORGAN CHASE & CO.
CREDIT-RELATED INFORMATION, CONTINUED(in millions, except ratio data)
Mar 31, 2022Change
Mar 31, Dec 31, Sep 30, Jun 30, Mar 31, Dec 31, Mar 31,2022 2021 2021 2021 2021 2021 2021
NONPERFORMING ASSETS (a)(b)Consumer nonaccrual loans Loans retained $ 4,485 $ 4,878 $ 4,911 $ 5,183 $ 5,382 (8)% (17)% Loans held-for-sale and loans at fair value 525 472 440 475 608 11 (14)Total consumer nonaccrual loans 5,010 5,350 5,351 5,658 5,990 (6) (16)
Wholesale nonaccrual loansLoans retained 2,289 2,054 2,084 2,698 3,015 11 (24)Loans held-for-sale and loans at fair value 459 391 808 716 701 17 (35)
Total wholesale nonaccrual loans 2,748 2,445 2,892 3,414 3,716 12 (26)
Total nonaccrual loans (c) 7,758 7,795 8,243 9,072 9,706 — (20)
Derivative receivables 597 316 393 481 284 89 110 Assets acquired in loan satisfactions 250 235 246 249 267 6 (6)Total nonperforming assets 8,605 8,346 8,882 9,802 10,257 3 (16)Wholesale lending-related commitments (d) 767 764 641 851 800 — (4)
Total nonperforming exposure $ 9,372 $ 9,110 $ 9,523 $ 10,653 $ 11,057 3 (15)
NONACCRUAL LOAN-RELATED RATIOS (b)Total nonaccrual loans to total loans 0.72 % 0.72 % 0.79 % 0.87 % 0.96 %Total consumer, excluding credit card nonaccrual loans to
total consumer, excluding credit card loans 1.60 1.65 1.63 1.72 1.84 Total wholesale nonaccrual loans to total
wholesale loans 0.45 0.41 0.50 0.60 0.67
(a) At March 31, 2022, December 31, 2021, September 30, 2021, June 30, 2021 and March 31, 2021, nonperforming assets excluded: (1) mortgage loans 90 or more days past due and insured by U.S. government agencies of $598 million, $623 million, $644 million, $713 million and $798 million, respectively; and (2) real estate owned (“REO”)insured by U.S. government agencies of $6 million, $5 million, $5 million, $7 million and $8 million, respectively. The amount of mortgage loans 90 or more days past due and insured by U.S. government agencies excluded at June 30, 2021 has been revised to conform with the current presentation. These amounts have been excluded based uponthe government guarantee. In addition, the Firm’s policy is generally to exempt credit card loans from being placed on nonaccrual status as permitted by regulatory guidance. Refer to Note 12 of the Firm’s 2021 Form 10-K for additional information on the Firm’s credit card nonaccrual and charge-off policies.
(b) At March 31, 2022, December 31, 2021 and September 30, 2021, nonperforming assets excluded PPP loans 90 or more days past due and insured by the SBA of $236 million, $633 million and $5 million. respectively. These amounts have been excluded based upon the SBA guarantee. There were no PPP loans 90 or more days past due in allother periods presented.
(c) Generally excludes loans that were under payment deferral or other assistance, including amendments or waivers of financial covenants, in response to the COVID-19 pandemic.(d) Represents commitments that are risk rated as nonaccrual.
Page 25
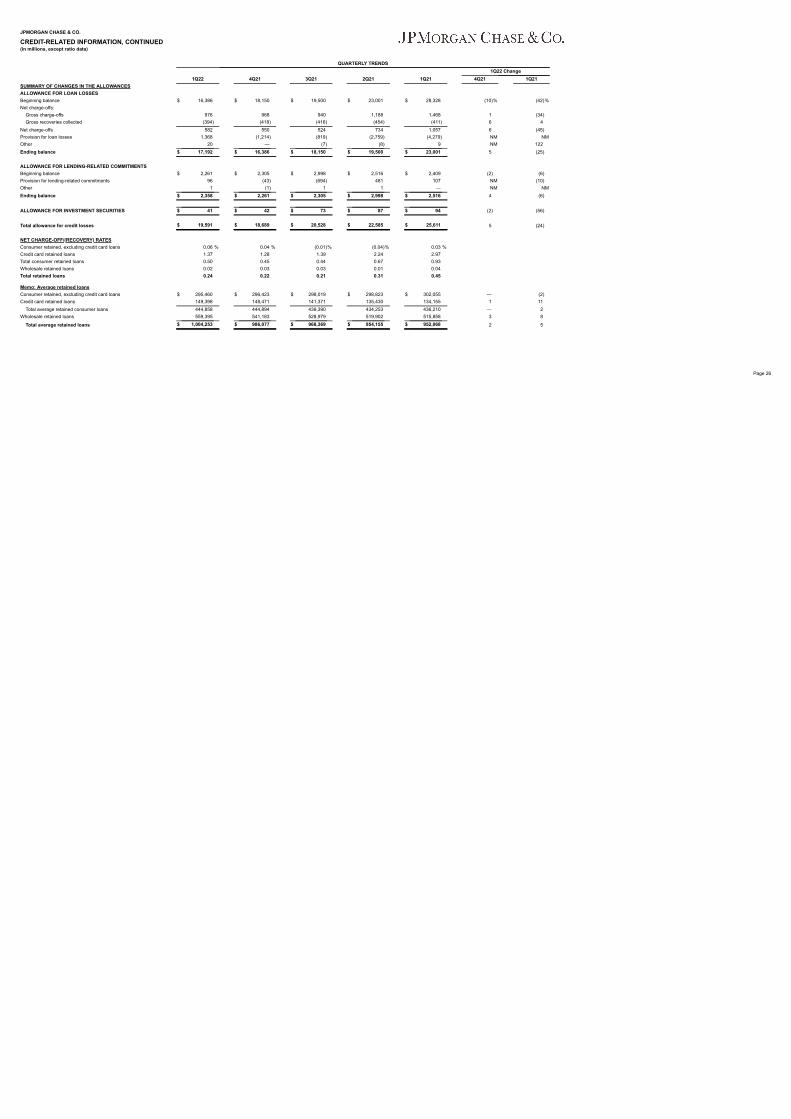
JPMORGAN CHASE & CO.
CREDIT-RELATED INFORMATION, CONTINUED(in millions, except ratio data)
QUARTERLY TRENDS1Q22 Change
1Q22 4Q21 3Q21 2Q21 1Q21 4Q21 1Q21SUMMARY OF CHANGES IN THE ALLOWANCESALLOWANCE FOR LOAN LOSSESBeginning balance $ 16,386 $ 18,150 $ 19,500 $ 23,001 $ 28,328 (10)% (42)%Net charge-offs:
Gross charge-offs 976 968 940 1,188 1,468 1 (34)Gross recoveries collected (394) (418) (416) (454) (411) 6 4
Net charge-offs 582 550 524 734 1,057 6 (45)Provision for loan losses 1,368 (1,214) (819) (2,759) (4,279) NM NMOther 20 — (7) (8) 9 NM 122 Ending balance $ 17,192 $ 16,386 $ 18,150 $ 19,500 $ 23,001 5 (25)
ALLOWANCE FOR LENDING-RELATED COMMITMENTSBeginning balance $ 2,261 $ 2,305 $ 2,998 $ 2,516 $ 2,409 (2) (6)Provision for lending-related commitments 96 (43) (694) 481 107 NM (10)Other 1 (1) 1 1 — NM NMEnding balance $ 2,358 $ 2,261 $ 2,305 $ 2,998 $ 2,516 4 (6)
ALLOWANCE FOR INVESTMENT SECURITIES $ 41 $ 42 $ 73 $ 87 $ 94 (2) (56)
Total allowance for credit losses $ 19,591 $ 18,689 $ 20,528 $ 22,585 $ 25,611 5 (24)
NET CHARGE-OFF/(RECOVERY) RATESConsumer retained, excluding credit card loans 0.06 % 0.04 % (0.01)% (0.04)% 0.03 %Credit card retained loans 1.37 1.28 1.39 2.24 2.97 Total consumer retained loans 0.50 0.45 0.44 0.67 0.93 Wholesale retained loans 0.02 0.03 0.03 0.01 0.04 Total retained loans 0.24 0.22 0.21 0.31 0.45
Memo: Average retained loansConsumer retained, excluding credit card loans $ 295,460 $ 296,423 $ 298,019 $ 298,823 $ 302,055 — (2)Credit card retained loans 149,398 148,471 141,371 135,430 134,155 1 11
Total average retained consumer loans 444,858 444,894 439,390 434,253 436,210 — 2 Wholesale retained loans 559,395 541,183 528,979 519,902 515,858 3 8
Total average retained loans $ 1,004,253 $ 986,077 $ 968,369 $ 954,155 $ 952,068 2 5
Page 26
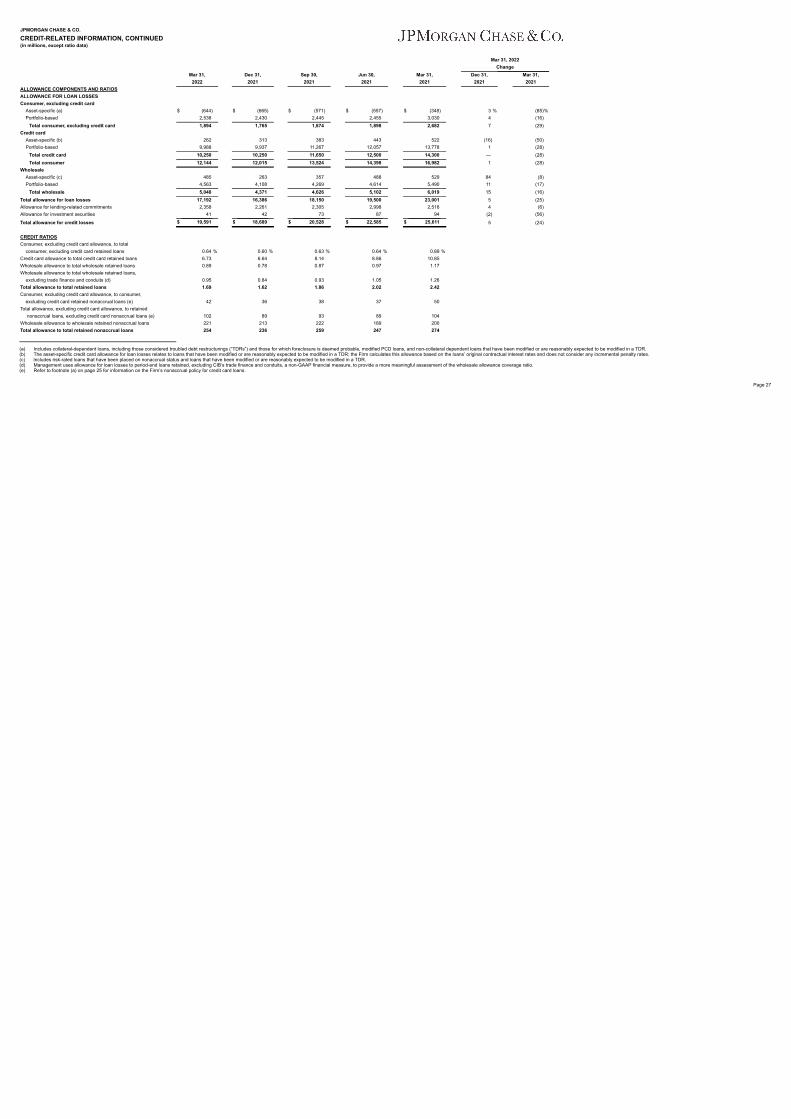
JPMORGAN CHASE & CO.
CREDIT-RELATED INFORMATION, CONTINUED(in millions, except ratio data)
Mar 31, 2022Change
Mar 31, Dec 31, Sep 30, Jun 30, Mar 31, Dec 31, Mar 31,2022 2021 2021 2021 2021 2021 2021
ALLOWANCE COMPONENTS AND RATIOSALLOWANCE FOR LOAN LOSSESConsumer, excluding credit card
Asset-specific (a) $ (644) $ (665) $ (571) $ (557) $ (348) 3 % (85)%Portfolio-based 2,538 2,430 2,445 2,455 3,030 4 (16)
Total consumer, excluding credit card 1,894 1,765 1,874 1,898 2,682 7 (29)Credit card
Asset-specific (b) 262 313 383 443 522 (16) (50)Portfolio-based 9,988 9,937 11,267 12,057 13,778 1 (28)
Total credit card 10,250 10,250 11,650 12,500 14,300 — (28)Total consumer 12,144 12,015 13,524 14,398 16,982 1 (28)
WholesaleAsset-specific (c) 485 263 357 488 529 84 (8)Portfolio-based 4,563 4,108 4,269 4,614 5,490 11 (17)
Total wholesale 5,048 4,371 4,626 5,102 6,019 15 (16)Total allowance for loan losses 17,192 16,386 18,150 19,500 23,001 5 (25)Allowance for lending-related commitments 2,358 2,261 2,305 2,998 2,516 4 (6)Allowance for investment securities 41 42 73 87 94 (2) (56)
Total allowance for credit losses $ 19,591 $ 18,689 $ 20,528 $ 22,585 $ 25,611 5 (24)
CREDIT RATIOSConsumer, excluding credit card allowance, to total
consumer, excluding credit card retained loans 0.64 % 0.60 % 0.63 % 0.64 % 0.89 %Credit card allowance to total credit card retained loans 6.73 6.64 8.14 8.86 10.85 Wholesale allowance to total wholesale retained loans 0.89 0.78 0.87 0.97 1.17 Wholesale allowance to total wholesale retained loans,
excluding trade finance and conduits (d) 0.95 0.84 0.93 1.05 1.26 Total allowance to total retained loans 1.69 1.62 1.86 2.02 2.42 Consumer, excluding credit card allowance, to consumer,
excluding credit card retained nonaccrual loans (e) 42 36 38 37 50 Total allowance, excluding credit card allowance, to retained
nonaccrual loans, excluding credit card nonaccrual loans (e) 102 89 93 89 104 Wholesale allowance to wholesale retained nonaccrual loans 221 213 222 189 200 Total allowance to total retained nonaccrual loans 254 236 259 247 274
(a) Includes collateral-dependent loans, including those considered troubled debt restructurings (“TDRs”) and those for which foreclosure is deemed probable, modified PCD loans, and non-collateral dependent loans that have been modified or are reasonably expected to be modified in a TDR.(b) The asset-specific credit card allowance for loan losses relates to loans that have been modified or are reasonably expected to be modified in a TDR; the Firm calculates this allowance based on the loans’ original contractual interest rates and does not consider any incremental penalty rates.(c) Includes risk-rated loans that have been placed on nonaccrual status and loans that have been modified or are reasonably expected to be modified in a TDR.(d) Management uses allowance for loan losses to period-end loans retained, excluding CIB’s trade finance and conduits, a non-GAAP financial measure, to provide a more meaningful assessment of the wholesale allowance coverage ratio.(e) Refer to footnote (a) on page 25 for information on the Firm’s nonaccrual policy for credit card loans.
Page 27
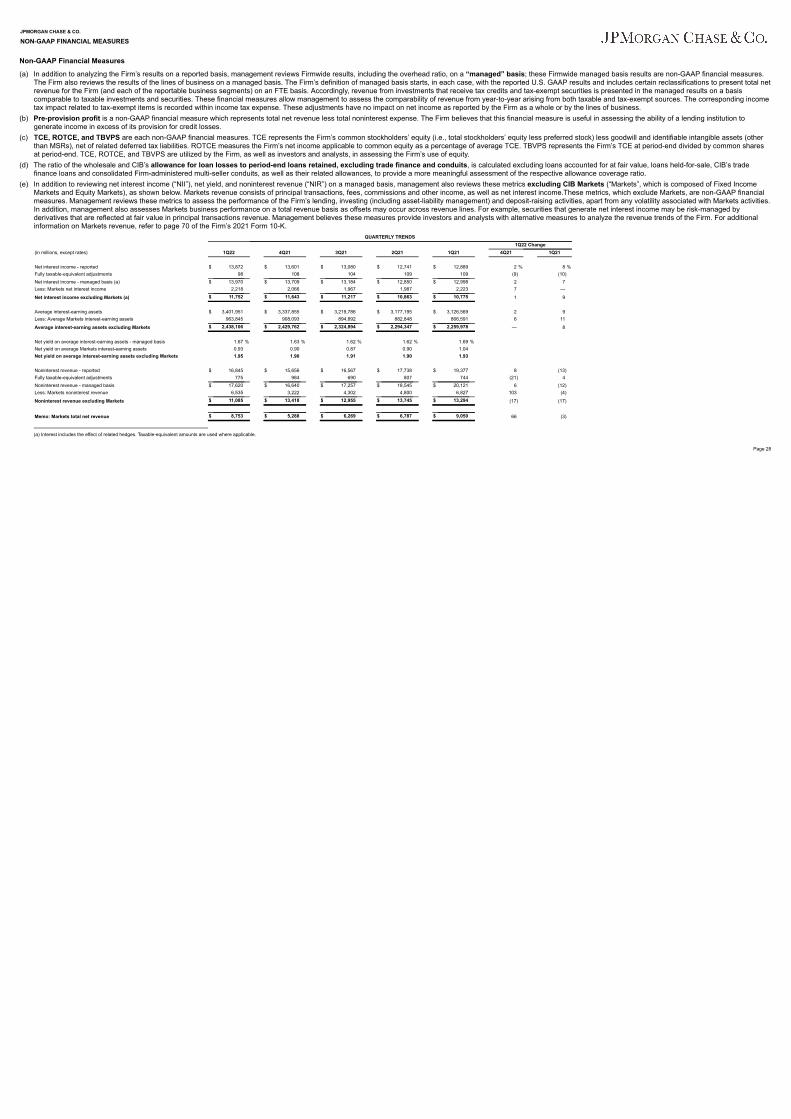
JPMORGAN CHASE & CO.
NON-GAAP FINANCIAL MEASURES
Non-GAAP Financial Measures
(a) In addition to analyzing the Firm’s results on a reported basis, management reviews Firmwide results, including the overhead ratio, on a “managed” basis; these Firmwide managed basis results are non-GAAP financial measures.The Firm also reviews the results of the lines of business on a managed basis. The Firm’s definition of managed basis starts, in each case, with the reported U.S. GAAP results and includes certain reclassifications to present total netrevenue for the Firm (and each of the reportable business segments) on an FTE basis. Accordingly, revenue from investments that receive tax credits and tax-exempt securities is presented in the managed results on a basiscomparable to taxable investments and securities. These financial measures allow management to assess the comparability of revenue from year-to-year arising from both taxable and tax-exempt sources. The corresponding incometax impact related to tax-exempt items is recorded within income tax expense. These adjustments have no impact on net income as reported by the Firm as a whole or by the lines of business.
(b) Pre-provision profit is a non-GAAP financial measure which represents total net revenue less total noninterest expense. The Firm believes that this financial measure is useful in assessing the ability of a lending institution togenerate income in excess of its provision for credit losses.
(c) TCE, ROTCE, and TBVPS are each non-GAAP financial measures. TCE represents the Firm’s common stockholders’ equity (i.e., total stockholders’ equity less preferred stock) less goodwill and identifiable intangible assets (otherthan MSRs), net of related deferred tax liabilities. ROTCE measures the Firm’s net income applicable to common equity as a percentage of average TCE. TBVPS represents the Firm’s TCE at period-end divided by common sharesat period-end. TCE, ROTCE, and TBVPS are utilized by the Firm, as well as investors and analysts, in assessing the Firm’s use of equity.
(d) The ratio of the wholesale and CIB’s allowance for loan losses to period-end loans retained, excluding trade finance and conduits, is calculated excluding loans accounted for at fair value, loans held-for-sale, CIB’s tradefinance loans and consolidated Firm-administered multi-seller conduits, as well as their related allowances, to provide a more meaningful assessment of the respective allowance coverage ratio.
(e) In addition to reviewing net interest income (“NII”), net yield, and noninterest revenue (“NIR”) on a managed basis, management also reviews these metrics excluding CIB Markets (“Markets”, which is composed of Fixed IncomeMarkets and Equity Markets), as shown below. Markets revenue consists of principal transactions, fees, commissions and other income, as well as net interest income.These metrics, which exclude Markets, are non-GAAP financialmeasures. Management reviews these metrics to assess the performance of the Firm’s lending, investing (including asset-liability management) and deposit-raising activities, apart from any volatility associated with Markets activities.In addition, management also assesses Markets business performance on a total revenue basis as offsets may occur across revenue lines. For example, securities that generate net interest income may be risk-managed byderivatives that are reflected at fair value in principal transactions revenue. Management believes these measures provide investors and analysts with alternative measures to analyze the revenue trends of the Firm. For additionalinformation on Markets revenue, refer to page 70 of the Firm’s 2021 Form 10-K.
QUARTERLY TRENDS1Q22 Change
(in millions, except rates) 1Q22 4Q21 3Q21 2Q21 1Q21 4Q21 1Q21
Net interest income - reported $ 13,872 $ 13,601 $ 13,080 $ 12,741 $ 12,889 2 % 8 %Fully taxable-equivalent adjustments 98 108 104 109 109 (9) (10)Net interest income - managed basis (a) $ 13,970 $ 13,709 $ 13,184 $ 12,850 $ 12,998 2 7 Less: Markets net interest income 2,218 2,066 1,967 1,987 2,223 7 —
Net interest income excluding Markets (a) $ 11,752 $ 11,643 $ 11,217 $ 10,863 $ 10,775 1 9
Average interest-earning assets $ 3,401,951 $ 3,337,855 $ 3,219,786 $ 3,177,195 $ 3,126,569 2 9 Less: Average Markets interest-earning assets 963,845 908,093 894,892 882,848 866,591 6 11
Average interest-earning assets excluding Markets $ 2,438,106 $ 2,429,762 $ 2,324,894 $ 2,294,347 $ 2,259,978 — 8
Net yield on average interest-earning assets - managed basis 1.67 % 1.63 % 1.62 % 1.62 % 1.69 %Net yield on average Markets interest-earning assets 0.93 0.90 0.87 0.90 1.04 Net yield on average interest-earning assets excluding Markets 1.95 1.90 1.91 1.90 1.93
Noninterest revenue - reported $ 16,845 $ 15,656 $ 16,567 $ 17,738 $ 19,377 8 (13)Fully taxable-equivalent adjustments 775 984 690 807 744 (21) 4 Noninterest revenue - managed basis $ 17,620 $ 16,640 $ 17,257 $ 18,545 $ 20,121 6 (12)Less: Markets noninterest revenue 6,535 3,222 4,302 4,800 6,827 103 (4)
Noninterest revenue excluding Markets $ 11,085 $ 13,418 $ 12,955 $ 13,745 $ 13,294 (17) (17)
Memo: Markets total net revenue $ 8,753 $ 5,288 $ 6,269 $ 6,787 $ 9,050 66 (3)
(a) Interest includes the effect of related hedges. Taxable-equivalent amounts are used where applicable.
Page 28
Related Documents