Welcome message from author
This document is posted to help you gain knowledge. Please leave a comment to let me know what you think about it! Share it to your friends and learn new things together.
Transcript

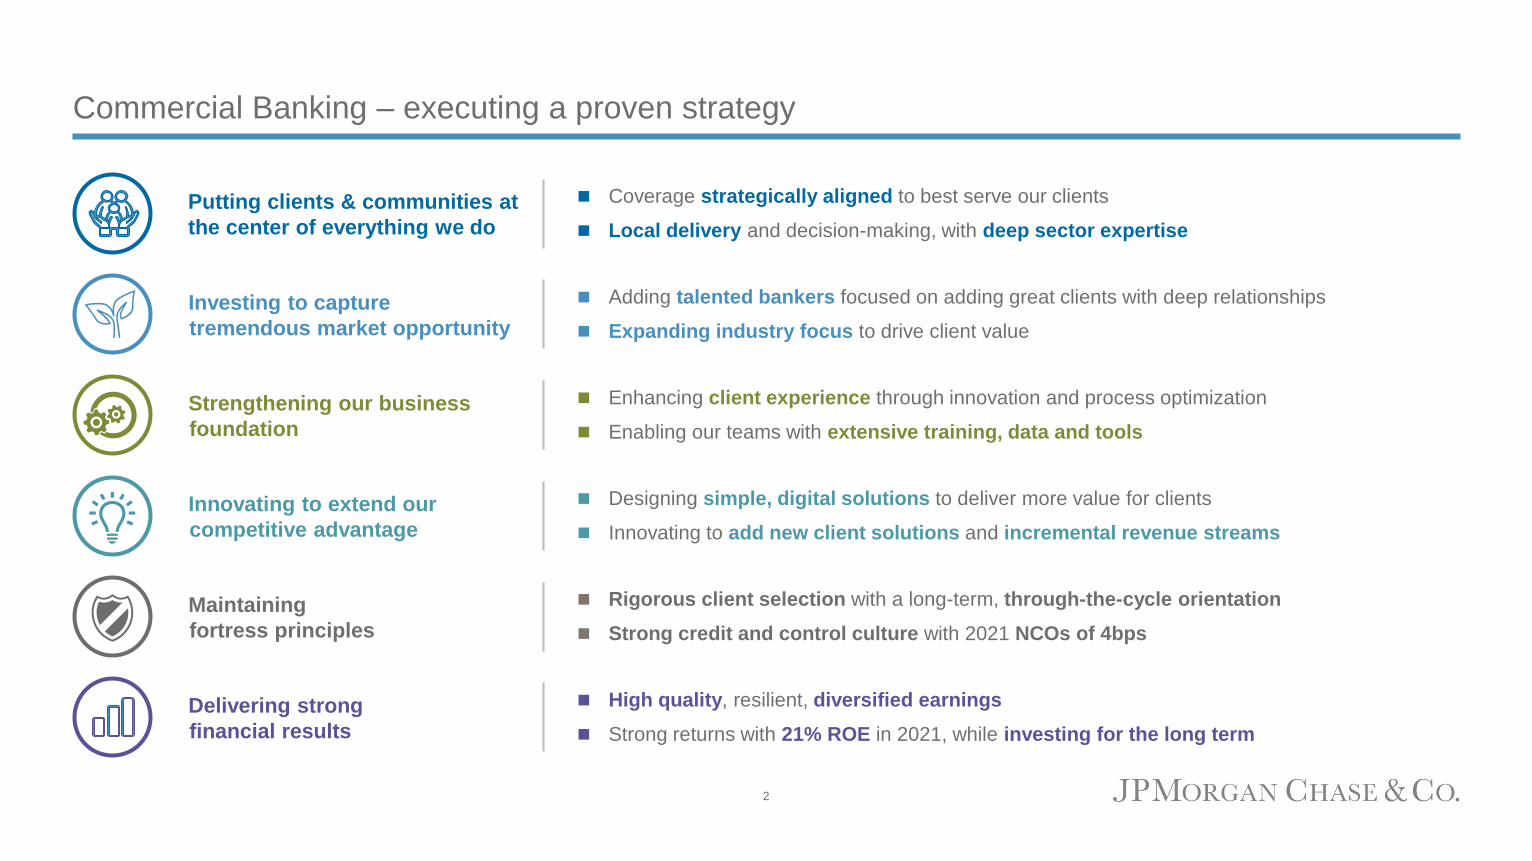
Commercial Banking – executing a proven strategy
◼ Coverage strategically aligned to best serve our clients
◼ Local delivery and decision-making, with deep sector expertise
◼ Adding talented bankers focused on adding great clients with deep relationships
◼ Expanding industry focus to drive client value
◼ Enhancing client experience through innovation and process optimization
◼ Enabling our teams with extensive training, data and tools
◼ Rigorous client selection with a long-term, through-the-cycle orientation
◼ Strong credit and control culture with 2021 NCOs of 4bps
◼ High quality, resilient, diversified earnings
◼ Strong returns with 21% ROE in 2021, while investing for the long term
◼ Designing simple, digital solutions to deliver more value for clients
◼ Innovating to add new client solutions and incremental revenue streams
Putting clients & communities at
the center of everything we do
Investing to capture
tremendous market opportunity
Strengthening our business
foundation
Maintaining
fortress principles
Delivering strong
financial results
Innovating to extend our
competitive advantage
2
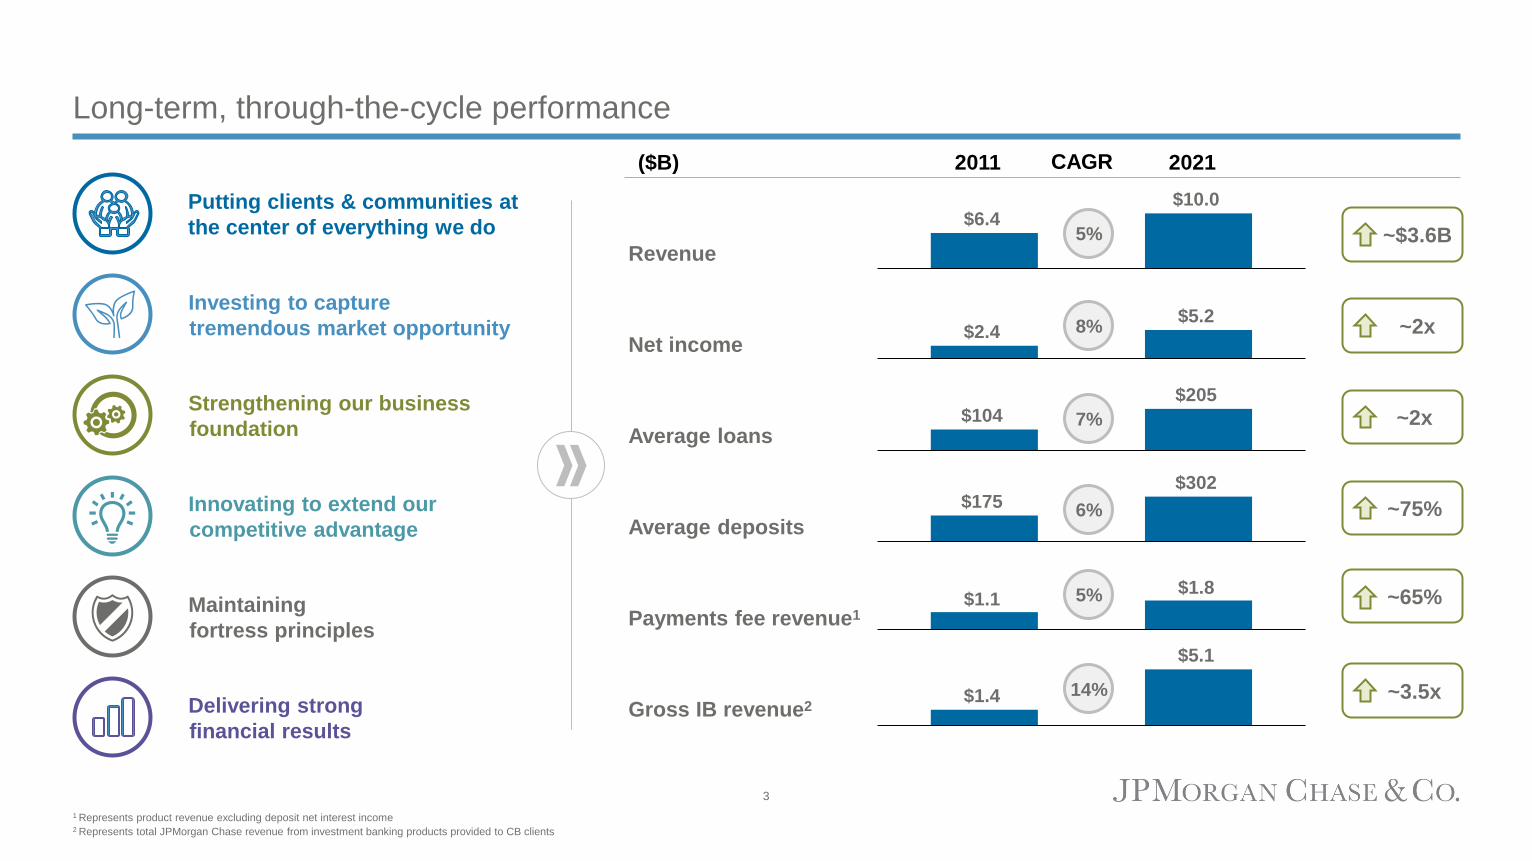
Long-term, through-the-cycle performance
($B) 2011 2021
Revenue
Net income
Average loans
Average deposits
Payments fee revenue1
Gross IB revenue2
$6.4 $10.0
$2.4 $5.2
$104 $205
$175 $302
$1.4
$5.1
~3.5x
~75%
~2x
~2x
~$3.6B
$1.1$1.8
~65%
CAGR
5%
8%
7%
6%
5%
14%
1 Represents product revenue excluding deposit net interest income2 Represents total JPMorgan Chase revenue from investment banking products provided to CB clients
Putting clients & communities at
the center of everything we do
Investing to capture
tremendous market opportunity
Strengthening our business
foundation
Maintaining
fortress principles
Delivering strong
financial results
Innovating to extend our
competitive advantage
3

JPMorgan Chase platform drives competitive advantage and unmatched value to clients
◼ Global footprint with local coverage and expertise
◼ Investment capacity to drive long-term growth and innovation
◼ Community presence and impact
◼ Strong, global brand recognition bringing the best talent
◼ Robust technology infrastructure
◼ Firmwide utilities provide significant scale and cost benefit
Scale advantage as part of JPMorgan Chase
◼ CCB: Extensive branch network and small business client base
◼ PB: CB bankers partnering locally creating powerful client impact
◼ AM: Providing pension services and liquidity solutions to CB clients
◼ CIB: The best investment bank, with $5B revenue from CB clients1
◼ Broad-based payments platform across consumer and wholesale
Firmwide partnerships deliver unmatched client value
CB
AWM
Corporate
CIB
CCB
Technology
Brand
Impact
Branch
Network
Card
Services
Business
Banking
Investment
Banking Private
Bank
Asset
Management
International
Reach
Payments
1 Represents total JPMorgan Chase revenue from investment banking products provided to CB clients
4
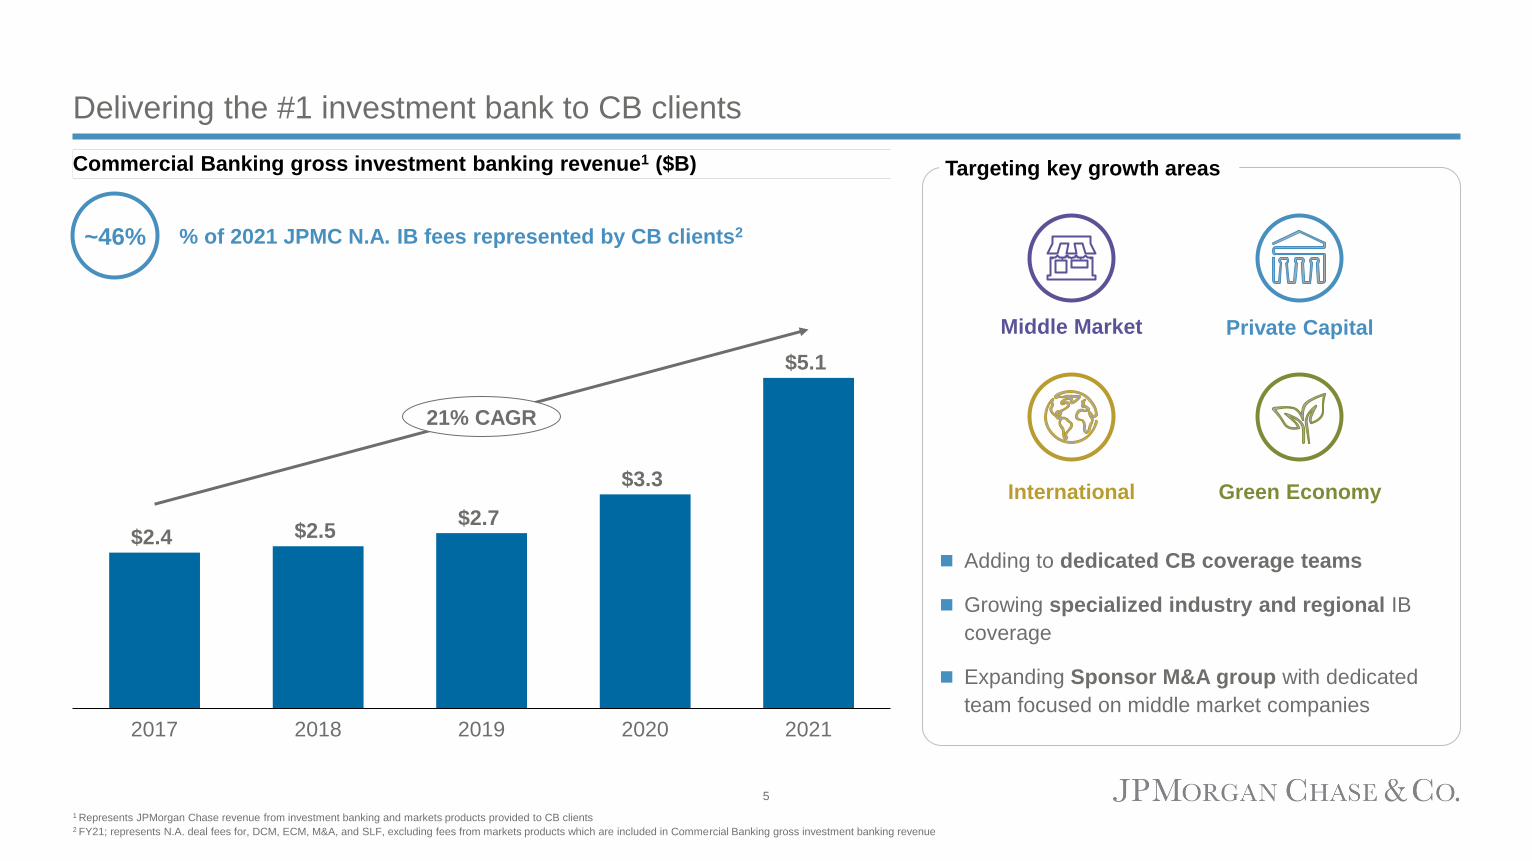
Delivering the #1 investment bank to CB clients
1 Represents JPMorgan Chase revenue from investment banking and markets products provided to CB clients2 FY21; represents N.A. deal fees for, DCM, ECM, M&A, and SLF, excluding fees from markets products which are included in Commercial Banking gross investment banking revenue
$2.4 $2.5 $2.7
$3.3
$5.1
20182017 20212019 2020
21% CAGR
~46% % of 2021 JPMC N.A. IB fees represented by CB clients2
◼ Adding to dedicated CB coverage teams
◼ Growing specialized industry and regional IB
coverage
◼ Expanding Sponsor M&A group with dedicated
team focused on middle market companies
Private Capital
International Green Economy
Middle Market
Targeting key growth areasCommercial Banking gross investment banking revenue1 ($B)
5

Comprehensive payments solutions drive deep relationships and core operating deposits
◼ Unmatched capabilities across J.P. Morgan
Payments, card, merchant and digital
◼ Integrated solutions providing simple delivery of
payment functionality
◼ Enhanced digital capabilities increasing
connectivity and improved experience
◼ Deposit growth driven by elevated market liquidity
and expansion of CB global client franchise
◼ ~5,000 new deposit clients with $23B in balances
representing 18% of deposit growth2
◼ Deposit betas managed dynamically through-the-
cycle for each LOB segment
Significant revenue upside from rising market ratesStrong momentum in 2022 –
1Q22 Payments revenue up 19% YoY
CB payments fee revenue1 ($B) Average CB deposit balances ($B)
1 Represents product revenue excluding deposit net interest income 2 Measured as new clients based on deposit balances only from FY19 to FY21; excludes CTL
2017 2018 2019 2020
$1.4 $1.5
2021
$1.8$1.4 $1.5
6% CAGR
2020 20212017 20192018
$177 $173$171
$238
$30214% CAGR
6
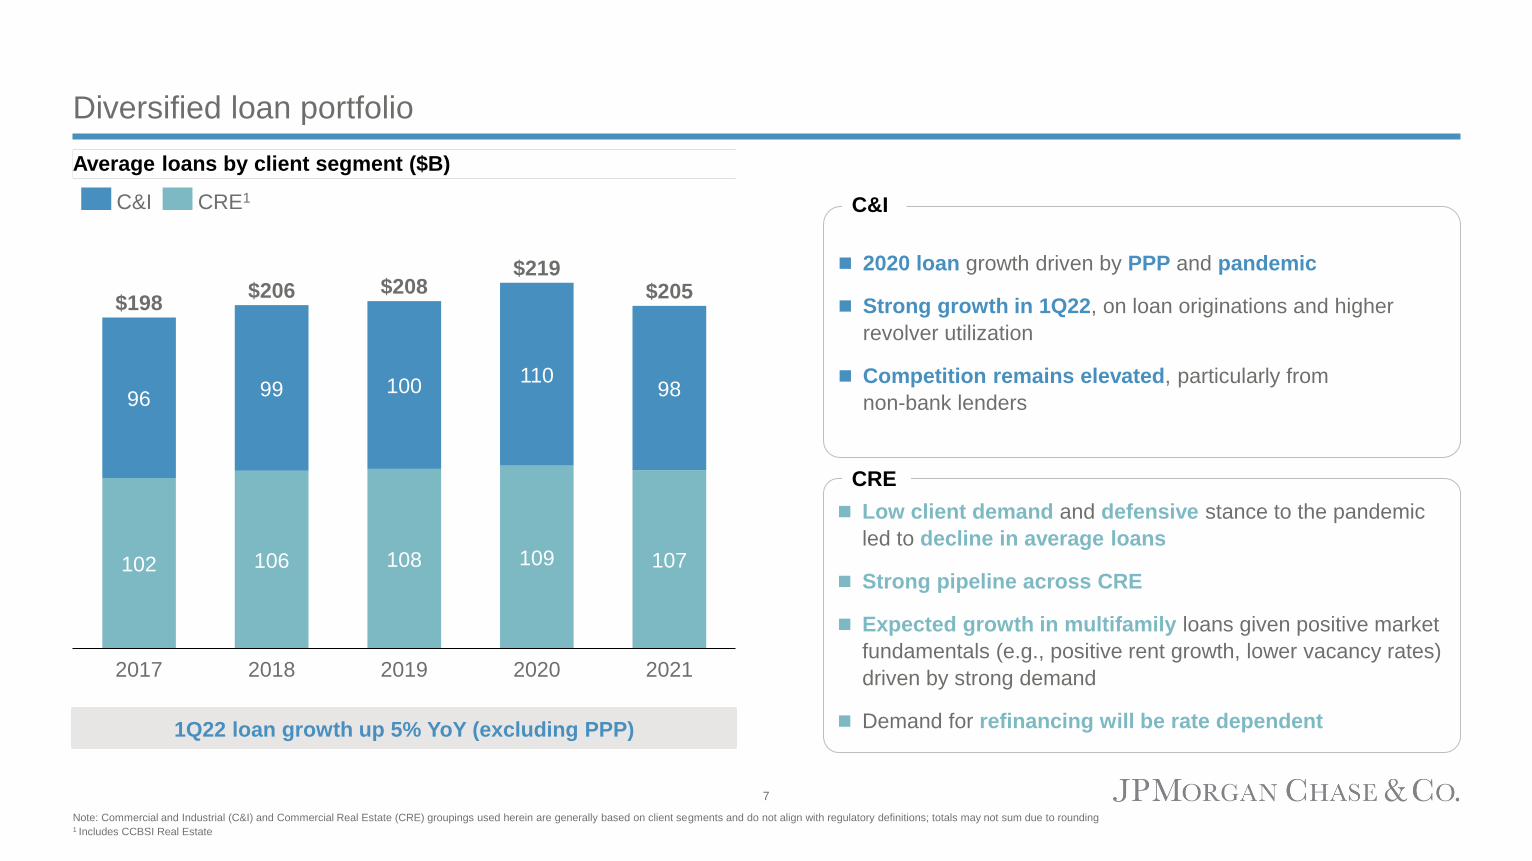
Diversified loan portfolio
108
2017
96
106102
99
2018
110100
2019
109
$206
2020
98
107
2021
$198$208
$219$205
C&I CRE1
1Q22 loan growth up 5% YoY (excluding PPP)
◼ 2020 loan growth driven by PPP and pandemic
◼ Strong growth in 1Q22, on loan originations and higher
revolver utilization
◼ Competition remains elevated, particularly from
non-bank lenders
C&I
◼ Low client demand and defensive stance to the pandemic
led to decline in average loans
◼ Strong pipeline across CRE
◼ Expected growth in multifamily loans given positive market
fundamentals (e.g., positive rent growth, lower vacancy rates)
driven by strong demand
◼ Demand for refinancing will be rate dependent
CRE
Average loans by client segment ($B)
Note: Commercial and Industrial (C&I) and Commercial Real Estate (CRE) groupings used herein are generally based on client segments and do not align with regulatory definitions; totals may not sum due to rounding1 Includes CCBSI Real Estate
7

Maintaining risk discipline – C&I
◼ Credit quality of the portfolio remains strong
◼ Diversified across industries and regions
◼ Dedicated underwriters for targeted industries
◼ 87% of non-investment grade exposure is secured1
C&I portfolio by industry2
Portfolio summary
0.0%
0.5%
1.0%
1.5%
2.0%
2.5%
20
08
20
09
20
10
201
1
201
2
201
3
201
4
201
5
201
6
201
7
201
8
201
9
202
0
202
1
Commercial Banking Peer Average
C&I net charge-off rate (%)3
28%
16%
13%10%
5%
5%
4%3%
17%
Consumer & Retail
Industrials
Healthcare
Tech, Media & Telecomm
Oil & Gas
Banks & Fin. Cos.
Utilities
Automotive
Other
◼ Monitoring impact of geopolitical tensions, inflation, supply chain,
tight labor markets and interest rates
◼ Closely watching potentially vulnerable sectors for stress
◼ Maintaining our strong risk focus and underwriting discipline while
pursuing growth across the portfolio
Market commentary
Note: Metrics in charts are as of Dec. 31, 2021, all other metrics are as of March 31, 2022 unless otherwise noted1 The Firm considers internal ratings equivalent to BB+/Ba1 or lower as non-investment grade 2 Portfolios based on sub-LOB are not regulatory definitions; totals may not sum due to rounding 3 Peer average based on CB-equivalent CRE segments or wholesale portfolios at BAC, CMA, FITB, KEY, PNC, USB, WFC, which may not fully align with CB segmentation
8

Maintaining risk discipline – CRE
CRE portfolio by asset class2 CRE net charge-offs (%)3
-1.0%
0.0%
1.0%
2.0%
3.0%
4.0%
20
08
20
09
20
10
20
11
20
12
20
13
20
14
20
15
20
16
20
17
20
18
20
19
20
20
20
21
Commercial Banking Peer Average
68%
11%
5%
7%9%
Multifamily
Office
Retail
Industrial
Other
◼ Strong credit performance, with NCOs of 2bps YTD
◼ ~72% of loans in Commercial Term Lending; avg. loan size ~$2mm
◼ New originations remain high quality
◼ LTV ratio of ~52%, DSC ratio of 1.56x1
◼ Focused on top-tier clients and lower-volatility asset classes
◼ <1% of loans in hospitality, homebuilders, condos and land
◼ Continue to limit exposure to riskier asset classes
◼ Monitoring assets in urban dense markets, particularly office and
office dependent retail
◼ Multifamily remains strong with favorable supply/demand dynamics
in our focus markets supported by housing affordability dynamics
◼ Majority of clients have fixed or hybrid rate structures which help
mitigate the impacts of a rapid rise in rates
Market commentaryPortfolio summary
Note: Metrics in charts are as of Dec. 31, 2021, all other metrics are as of March 31, 2022 unless otherwise noted1 Loan to value (LTV) and debt service coverage (DSC) are weighted average calculations of new origination in CTL YTD2 Portfolios based on sub-LOB are not regulatory definitions; totals may not sum due to rounding 3 Peer average based on CB-equivalent CRE segments or wholesale portfolios at BAC, CMA, FITB, KEY, PNC, USB, WFC, which may not fully align with CB segmentation
9
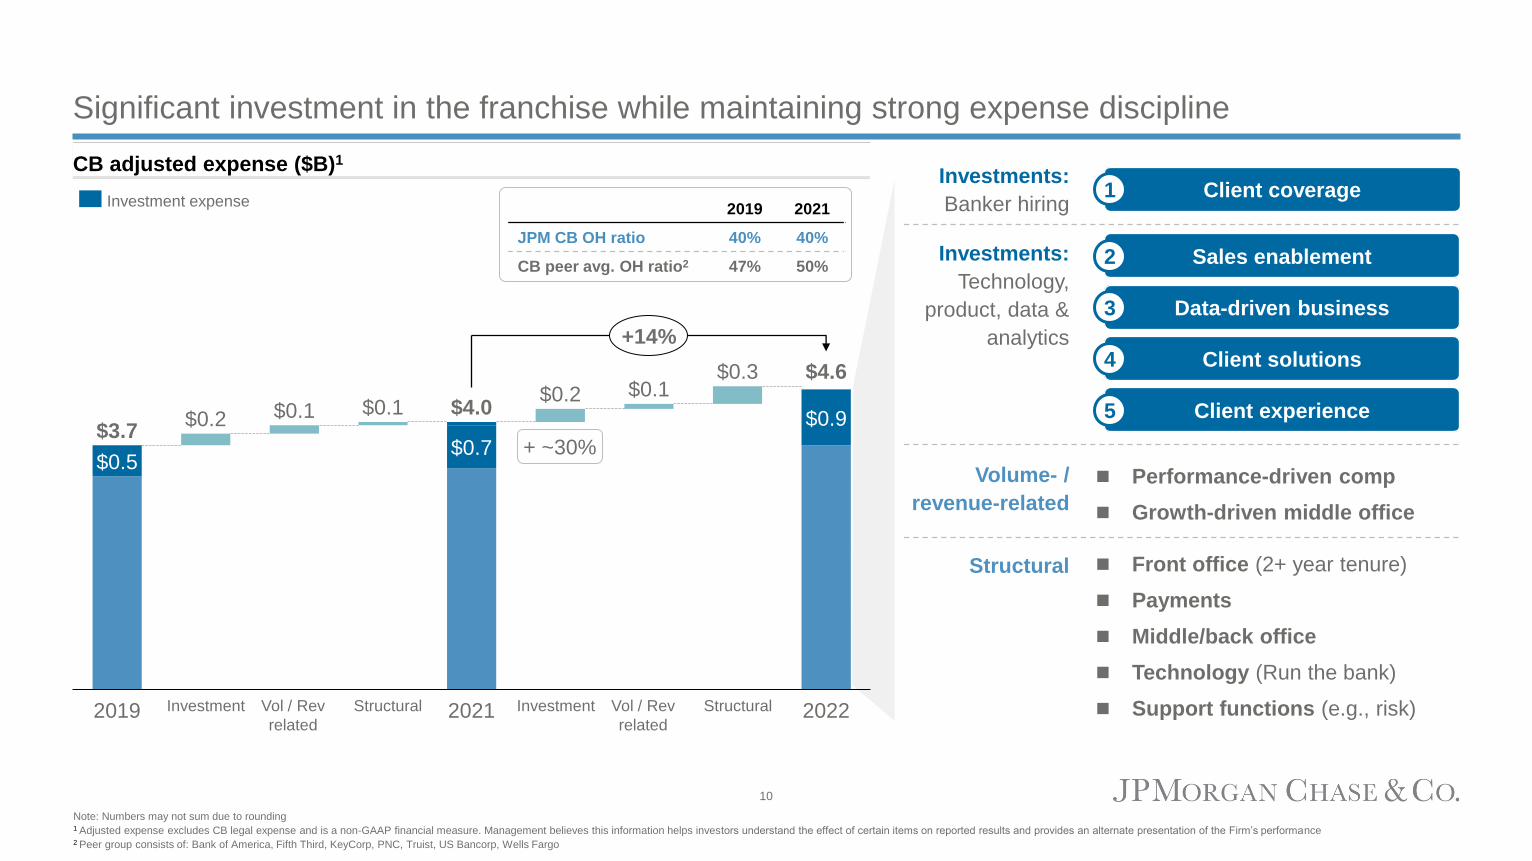
Significant investment in the franchise while maintaining strong expense discipline
Volume- /
revenue-related
Structural
◼ Performance-driven comp
◼ Growth-driven middle office
◼ Front office (2+ year tenure)
◼ Payments
◼ Middle/back office
◼ Technology (Run the bank)
◼ Support functions (e.g., risk)
Note: Numbers may not sum due to rounding1 Adjusted expense excludes CB legal expense and is a non-GAAP financial measure. Management believes this information helps investors understand the effect of certain items on reported results and provides an alternate presentation of the Firm’s performance2 Peer group consists of: Bank of America, Fifth Third, KeyCorp, PNC, Truist, US Bancorp, Wells Fargo
CB adjusted expense ($B)1
$3.7
2019
$0.9$4.0
$0.3
$0.5$0.7
2021 2022
$4.6
$0.2 $0.1 $0.1$0.2 $0.1
+14%
Investment expense
Investment Vol / Rev
related
Structural Investment Vol / Rev
related
Structural
2019 2021
JPM CB OH ratio 40% 40%
CB peer avg. OH ratio2 47% 50%
Investments:
Banker hiring
Investments:
Technology,
product, data &
analytics
Client coverage
Sales enablement
Data-driven business
Client solutions
Client experience
1
2
3
4
5
+ ~30%
10
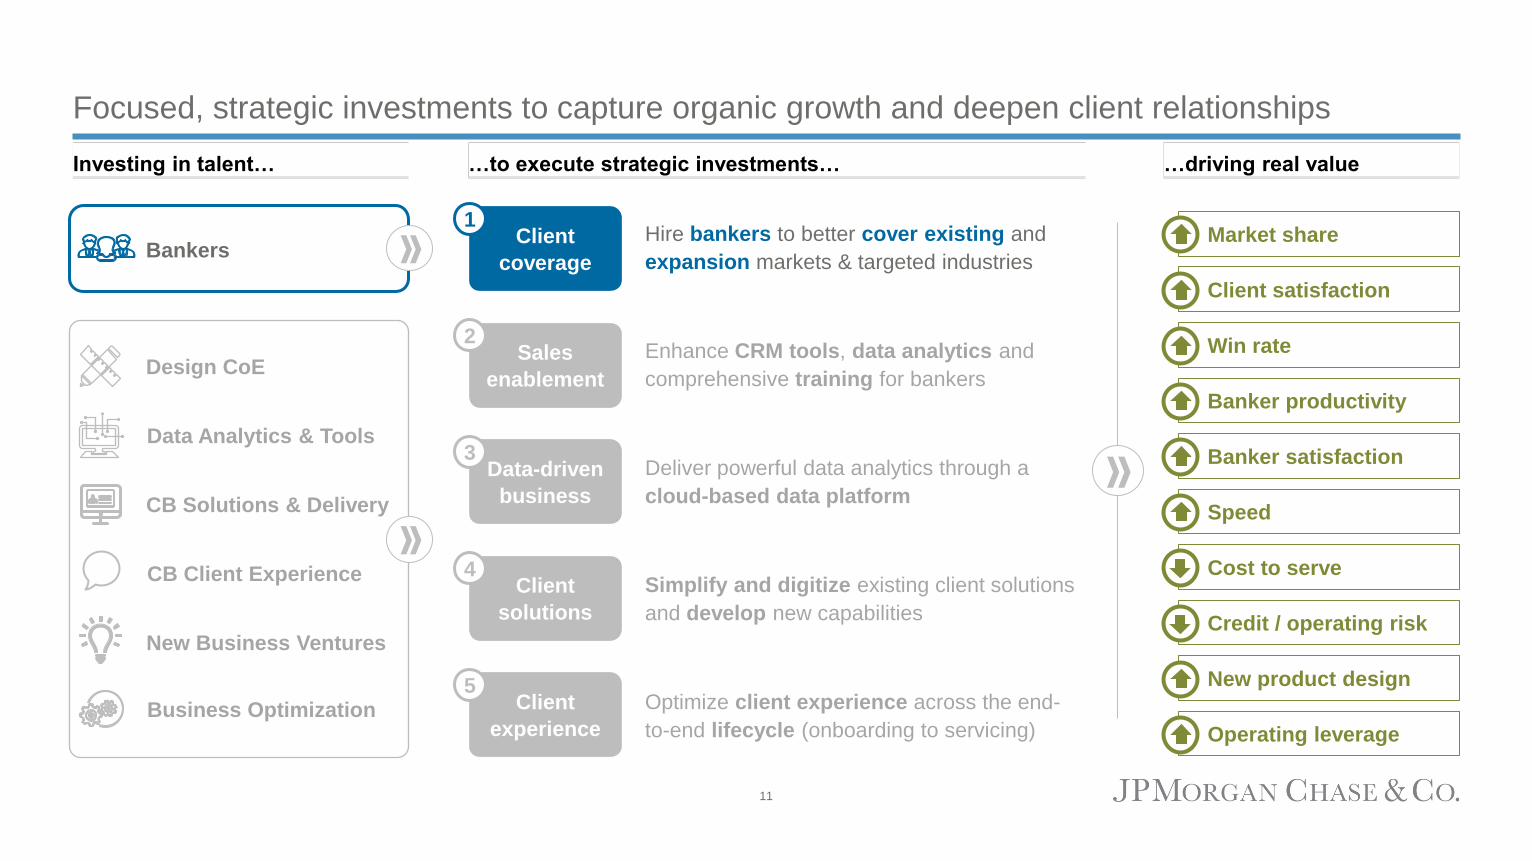
Focused, strategic investments to capture organic growth and deepen client relationships
Client
experience
Client
solutions
Sales
enablement
Data-driven
business
Client
coverage
Hire bankers to better cover existing and
expansion markets & targeted industries
Enhance CRM tools, data analytics and
comprehensive training for bankers
Deliver powerful data analytics through a
cloud-based data platform
Simplify and digitize existing client solutions
and develop new capabilities
Optimize client experience across the end-
to-end lifecycle (onboarding to servicing)Business Optimization
CB Solutions & Delivery
Design CoE
New Business Ventures
CB Client Experience
Data Analytics & Tools
BankersMarket share
Banker productivity
Banker satisfaction
Speed
Cost to serve
Credit / operating risk
New product design
Operating leverage
Client satisfaction
Win rate
Investing in talent… …to execute strategic investments… …driving real value
1
2
3
4
5
11

Organic expansion in Middle Market Banking
3xSince 2016, doubled banker
headcount while tripling revenue
Top 100 MSAs in Middle
Market footprint
Middle Market offices located
within branch network
75
~90%
$53
$234 $329
$422
$714
$912
$1,000
$1,223
$2,000
Old
Target
2010 20182012 2014 2016 2020 2021 New
Target
33% CAGR
Legacy states
New $2B expansion market target~44k Middle Market prospects3
Middle Market
clients20k
~28kProspects in
expansion markets
~6.3k Clients
National Middle Market coverage Expansion market revenue growth ($mm)1
1 Prior year revenue figures have been revised to conform to current presentation 2 Circles indicate number of prospects in a given city3 Includes Canadian presence
Expansion states
Client coverage1
Prospect density2
12

Replicating our proven strategy internationally
JPMC platform and capabilities
Well-established Private Bank and CIB
coverage in our target markets
12
Countries
~1,000
ProspectsEUROPE
59
Bankers
2
Countries
~100
ProspectsAMERICAS
12
Bankers
20
Countries
2,000+
Prospects
117
BankersGLOBAL
6
Countries
~1,000
Prospects
46
BankersAPAC
Client focus
Targeting non-U.S. headquartered, global
companies with cross-border needs
Long-term, patient and disciplined
Building for long-term franchise value,
focusing on strong client selection
Differentiated value
Comprehensive investment banking, wholesale
payments, FX, trade and liquidity capabilities
Competing from a position of strength International expansion coverage4
$5T cumulative foreign direct
investment in the U.S.1$148T annual wholesale cross-
border payments value2
$780B annual wholesale payments
revenue outside of N.A.3Market
opportunity
1 Bureau of Economic Analysis, 2021 publication data of 2020 2 EY, How new entrants are redefining cross-border payments, 2021; wholesale defined as C2B, B2C and B2B 3 The 2021 McKinsey Global Payments Report, data as of 20204 Bankers based on total revenue-producing employees as of Feb 2022
Client coverage1
13
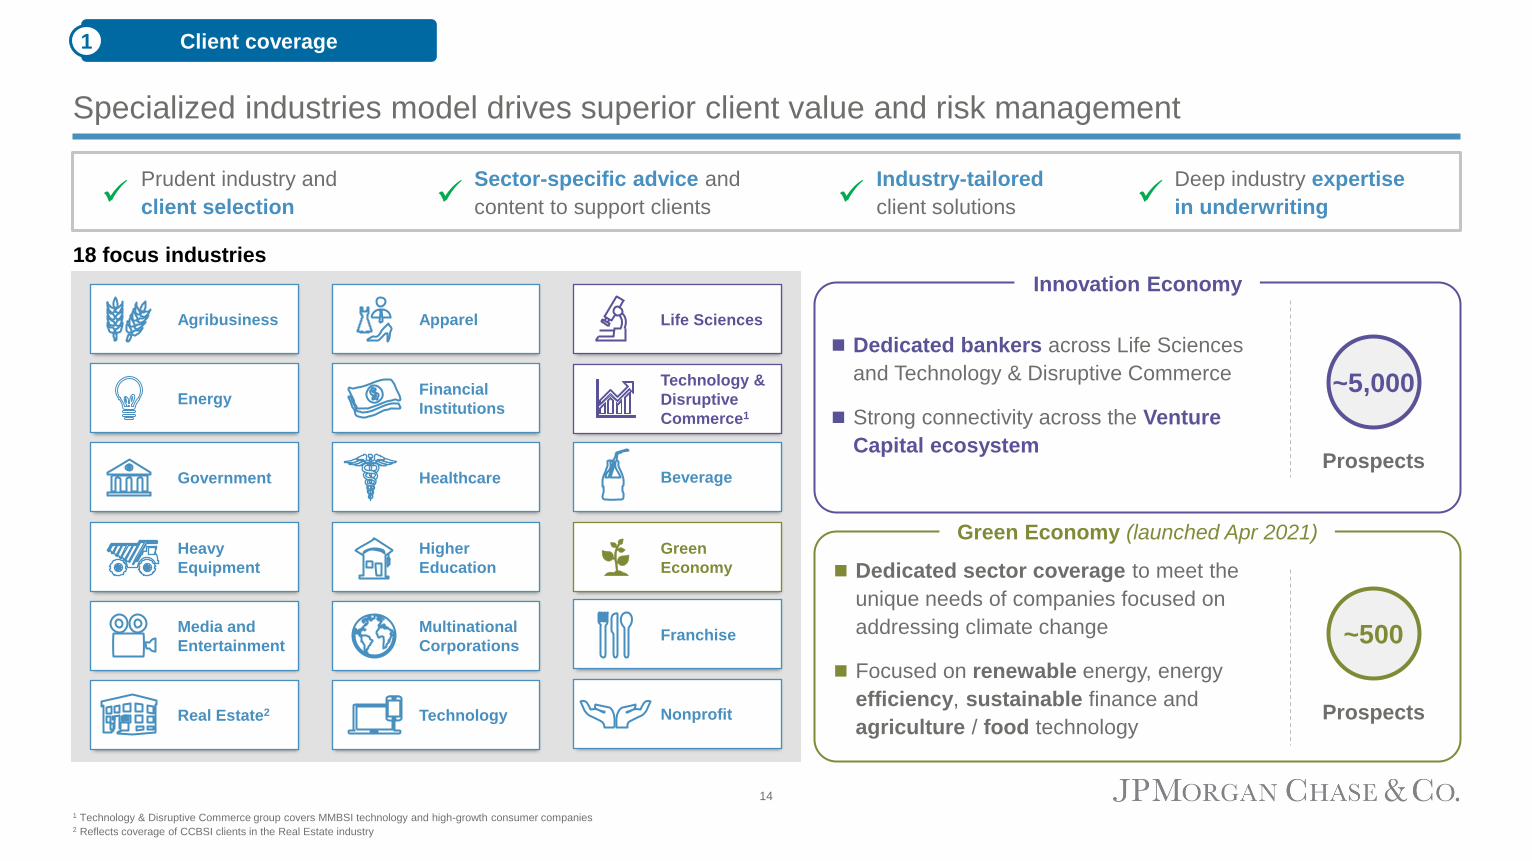
Specialized industries model drives superior client value and risk management
Higher
Education
Heavy
Equipment
Healthcare Beverage
ApparelAgribusiness
Franchise
Financial
InstitutionsEnergy
TechnologyReal Estate2
Media and
Entertainment
Government
Nonprofit
Multinational
Corporations
Innovation Economy
◼ Dedicated bankers across Life Sciences
and Technology & Disruptive Commerce
◼ Strong connectivity across the Venture
Capital ecosystem
~5,000
Prospects
Green Economy (launched Apr 2021)
◼ Dedicated sector coverage to meet the
unique needs of companies focused on
addressing climate change
◼ Focused on renewable energy, energy
efficiency, sustainable finance and
agriculture / food technology
~500
Prospects
Prudent industry and
client selection✓Sector-specific advice and
content to support clients✓Industry-tailored
client solutions✓
18 focus industries
Deep industry expertise
in underwriting✓
1 Technology & Disruptive Commerce group covers MMBSI technology and high-growth consumer companies2 Reflects coverage of CCBSI clients in the Real Estate industry
Client coverage1
Technology &
Disruptive
Commerce1
Life Sciences
Green
Economy
14

Disciplined, focused Private Equity coverage
Focused coverage team for Middle Market
financial sponsors
Regional investment banking coverage for
sponsors and portfolio companies
Established sponsor M&A group with dedicated
team on middle market sponsors
Adding banking, DCM and markets resources to
deliver unitranche credit solutions
Maintaining risk discipline through specialized
risk and structuring teams
Executing a comprehensive strategy
Private Equity industry with record
dry powder1
Tremendous potential in
Middle Market1
2017 2021
6.1k
9.0k
4.1k
20212017
2.1k
U.S. PE MM company inventory by deal year
# U.S. MM M&A deals
U.S. sponsor MM dry powder
$334B
20212017
$449B
~$1.3T
2017
~$1.1T
2021
Global PE dry powder
1 PitchBook Data, Inc.
Client coverage1
15
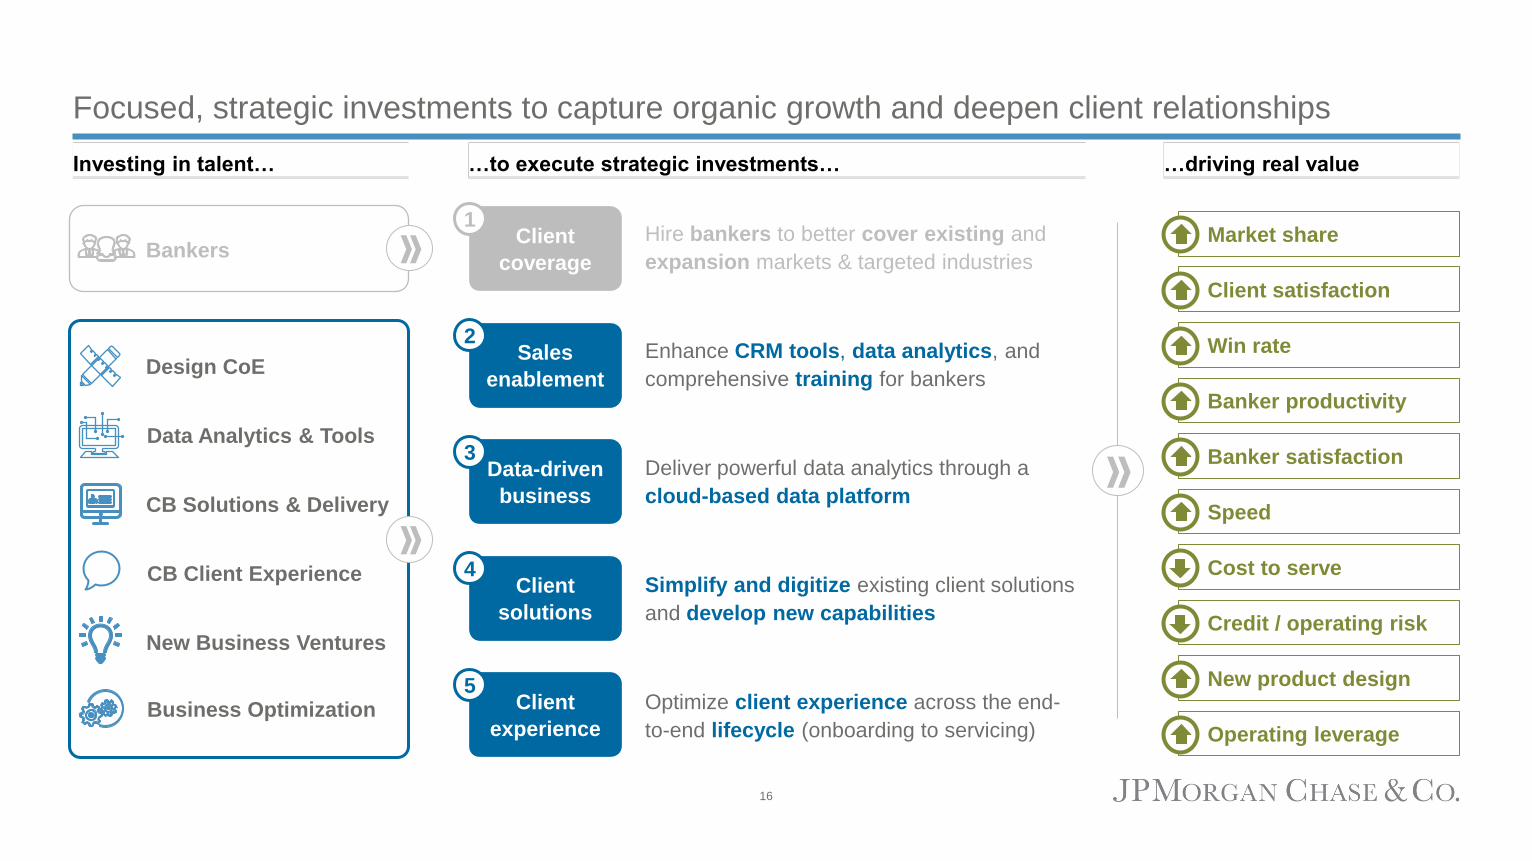
Focused, strategic investments to capture organic growth and deepen client relationships
Client
experience
Client
solutions
Sales
enablement
Data-driven
business
Client
coverage
Hire bankers to better cover existing and
expansion markets & targeted industries
Enhance CRM tools, data analytics, and
comprehensive training for bankers
Deliver powerful data analytics through a
cloud-based data platform
Simplify and digitize existing client solutions
and develop new capabilities
Optimize client experience across the end-
to-end lifecycle (onboarding to servicing)Business Optimization
CB Solutions & Delivery
Design CoE
New Business Ventures
CB Client Experience
Data Analytics & Tools
BankersMarket share
Banker productivity
Banker satisfaction
Speed
Cost to serve
Credit / operating risk
New product design
Operating leverage
Client satisfaction
Win rate
Investing in talent… …to execute strategic investments… …driving real value
1
2
3
4
5
16
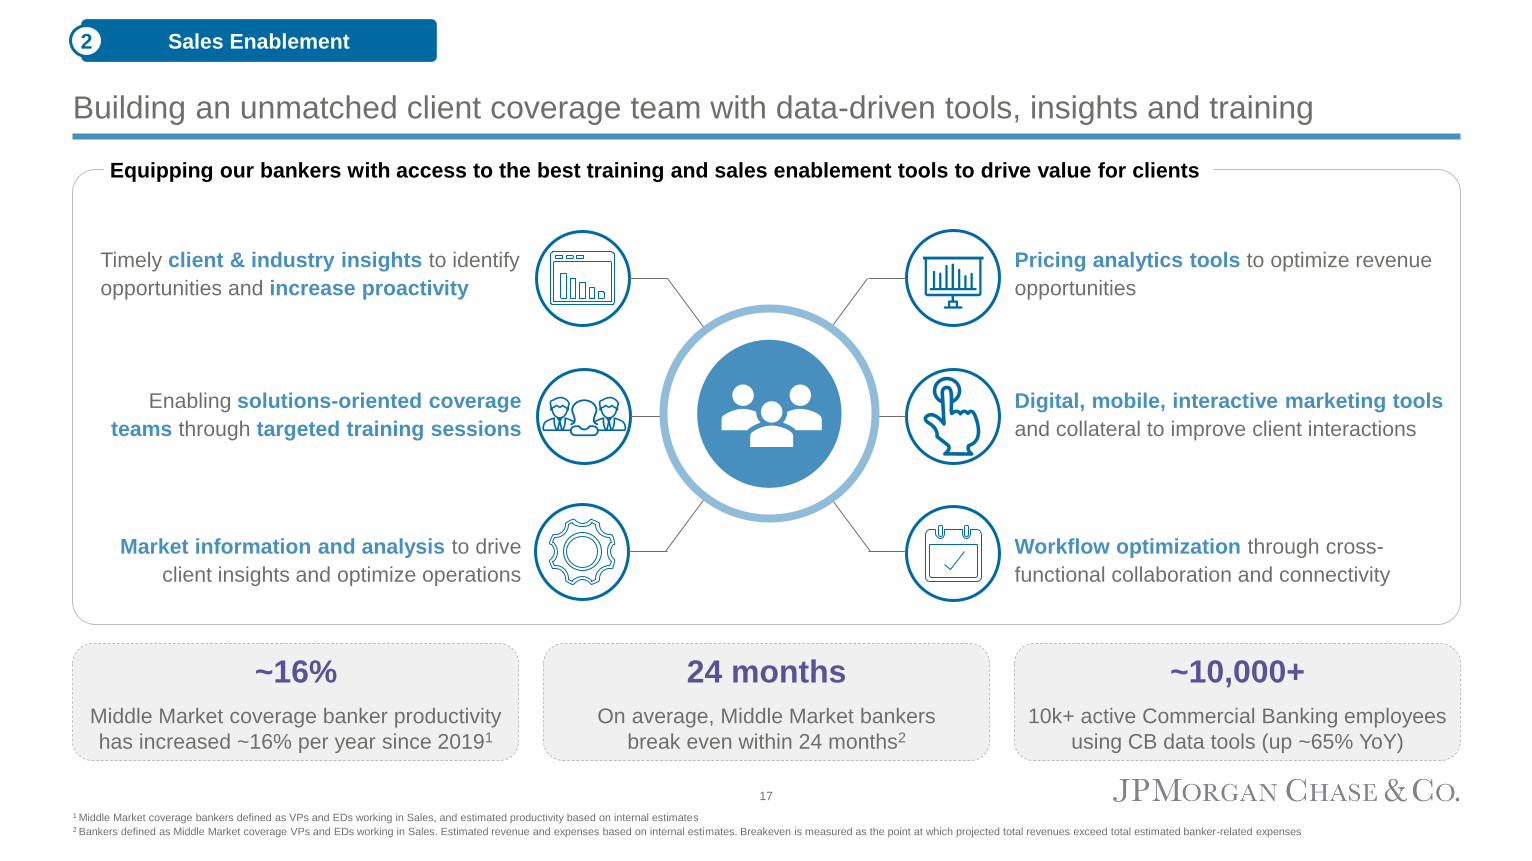
Building an unmatched client coverage team with data-driven tools, insights and training
~10,000+
10k+ active Commercial Banking employees
using CB data tools (up ~65% YoY)
Pricing analytics tools to optimize revenue
opportunities
Digital, mobile, interactive marketing tools
and collateral to improve client interactions
Workflow optimization through cross-
functional collaboration and connectivity
Timely client & industry insights to identify
opportunities and increase proactivity
Enabling solutions-oriented coverage
teams through targeted training sessions
Market information and analysis to drive
client insights and optimize operations
24 months
On average, Middle Market bankers
break even within 24 months2
~16%
Middle Market coverage banker productivity
has increased ~16% per year since 20191
Equipping our bankers with access to the best training and sales enablement tools to drive value for clients
1 Middle Market coverage bankers defined as VPs and EDs working in Sales, and estimated productivity based on internal estimates 2 Bankers defined as Middle Market coverage VPs and EDs working in Sales. Estimated revenue and expenses based on internal estimates. Breakeven is measured as the point at which projected total revenues exceed total estimated banker-related expenses
Sales Enablement2
17

Capturing tremendous value from our cloud-based, client-focused data platform
JPMC internal
data
3rd party data
Data intake
Unified cloud-based
data platform with
365TB of data
Deliver business value – use cases
Client value
◼ Business optimization
◼ Peer benchmarking
◼ Cash flow forecasting
Sales enablement
◼ New lead generation
◼ Solution recommendations
◼ Pricing analytics
Risk decisioning & portfolio mgmt.
◼ Credit pre-approvals
◼ Dynamic portfolio management
◼ Enhanced risk analytics
Operational excellence
◼ Servicing automation and analytics
◼ Fraud prevention analytics
◼ Targeted quality control
Business outcomes
20202019 2021
365
~5x
Terabytes
Client satisfaction
Product margins
Banker productivity
Speed to decision
Win rate
Revenue
Cost
Risk
Data-driven Business3
18
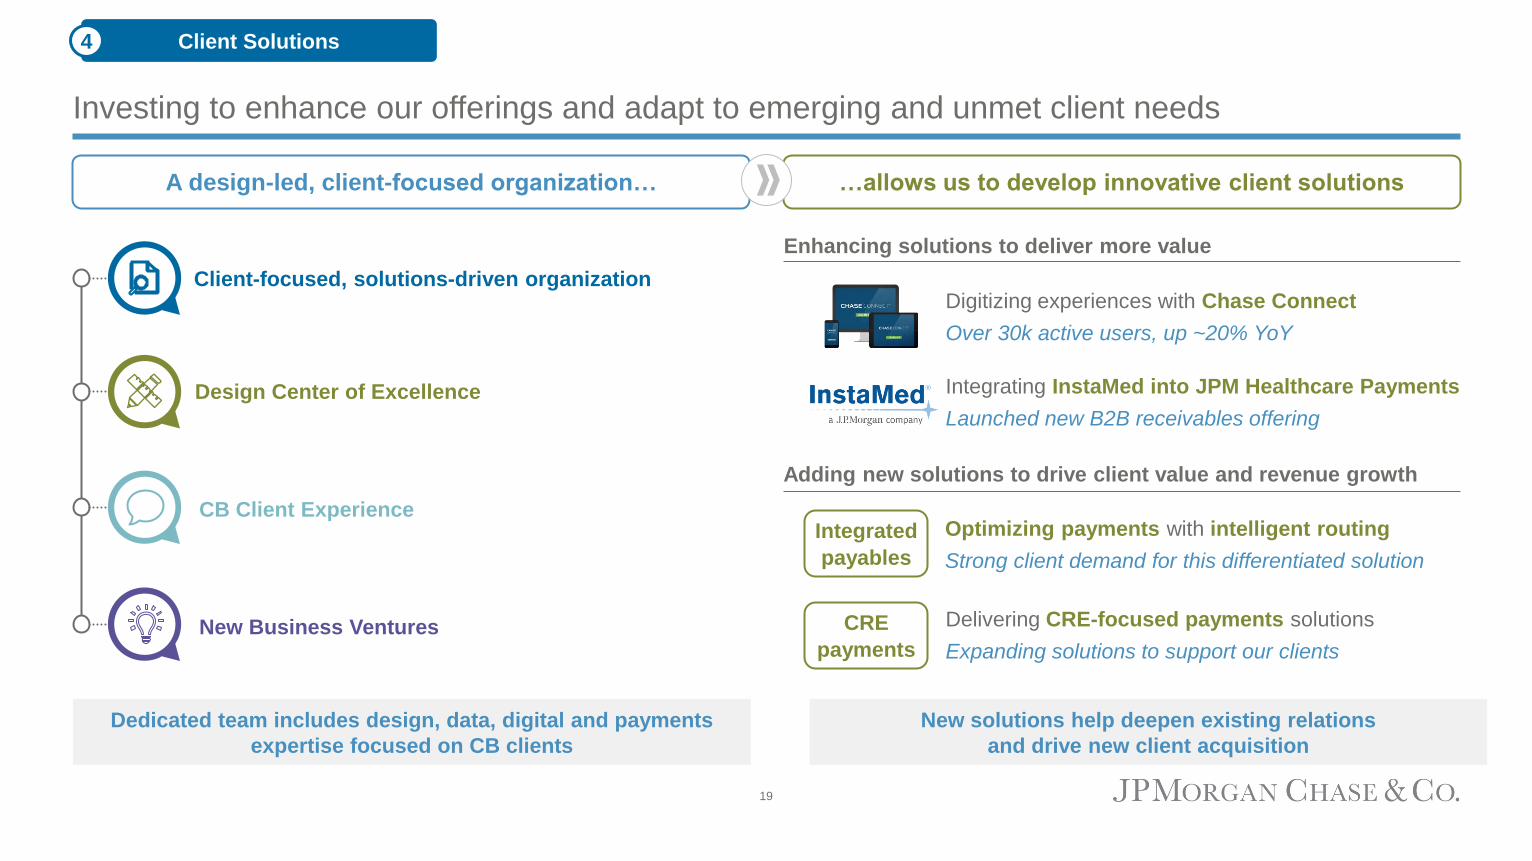
Investing to enhance our offerings and adapt to emerging and unmet client needs
…allows us to develop innovative client solutionsA design-led, client-focused organization…
Enhancing solutions to deliver more value
Adding new solutions to drive client value and revenue growth
Digitizing experiences with Chase Connect
Over 30k active users, up ~20% YoY
Integrating InstaMed into JPM Healthcare Payments
Launched new B2B receivables offering
New Business Ventures
CB Client Experience
Design Center of Excellence
Client-focused, solutions-driven organization
Dedicated team includes design, data, digital and payments
expertise focused on CB clients
New solutions help deepen existing relations
and drive new client acquisition
Optimizing payments with intelligent routing
Strong client demand for this differentiated solution
Integrated
payables
Delivering CRE-focused payments solutions
Expanding solutions to support our clients
CRE
payments
Client Solutions4
19

Investing to deliver powerful solutions to our CRE client franchise
Market-leading real estate lender
Developing comprehensive payments solutions for our real estate clients
Vendor Payments
C2B Rent Collection
Security Deposits
B2B Rent Collection
Sector-specific payments capability Building simple, digital experiences designed for CRE operators
Comprehensive features
◼ Multiple payment channels
◼ Autopay optionality
Digital functionality
◼ Real-time 24/7 online access
◼ Digital tenant notifications
Fraud protection
◼ Limited manual processes
◼ Reduced need for 3rd parties
Market knowledge
◼Access to market data
~28,000Multifamily lending clients
#1 Multifamily lender in the U.S.1
1 Based on S&P Global Market Intelligence, Dec 31, 20212 Affordable Housing Finance survey, 20213 CoStar, data as of Apr 20224 Boston Fed, Consumer Payment Choice for Bill Payments, data as of 20175 Zillow, U.S. housing rent paid in 2019
~600Affordable Housing clients
#3 Affordable Housing lender in the U.S.2
~500 Real Estate Banking clients
Apartment
properties (5+ units)3
~390k
Client Solutions4
Tremendous market opportunity
Non-digital rent
payments4
~50%
Annual rental
payments5
$500B
20

Relentless focus on client experience and operational excellence
Client satisfaction Speed Operational risk
Commercial
Banking
Client
Onboarding
◼ Reduce onboarding cycle times
◼ Streamline and digitize documentation
◼ Expand client training & enablement
1
Servicing
◼ Streamline service channels
◼ Increase self-service capabilities
◼ Improve case productivity
6
Lending
◼ Increase speed to commitment
◼ Data-driven decisioning
◼ Simplified client journey
5
KYC
◼ Minimize client impact
◼ Streamline and digitize documentation
◼ Automate existing manual processes
2
Client solutioning
◼ Proactive, analytics-driven solutioning
◼ 3rd party integrations for connectivity
◼ Client insights informing new designs
3
Content delivery
◼ Digital delivery of targeted JPMC content
◼ Data-driven analytics & insights
4
Product complexityOperating leverage Cost to serve
Client Experience5
21

Setting new targets to continue driving strong, consistent returns for shareholders
2017 2017-2021
Payments fee2
Middle Market expansion
Investment banking1
Execute growth
initiatives
(longer-term
revenue targets)
$2.4B
$1.4B
$0.6B
Overhead ratioMaintain expense
discipline40%
17%Return on equityOptimize
returns
Target
$4.0B
$3.0B
$2.0B
40%+/-
18%+/-
1 Represents JPMorgan Chase revenue from investment banking products provided to CB clients2 Represents product revenue excluding deposit net interest income 3 Denotes non-U.S. revenue from U.S. multinational clients and CCBSI expansion efforts to serve non-U.S. headquartered companies internationally
21% CAGR
6% CAGR
20% CAGR
2021
$5.1B
$1.8B
$1.2B
40%
21%
CB International3 $386mm $1.0B9% CAGR$540mm
40% avg.
17% avg.
Record
NEW
NEW
22
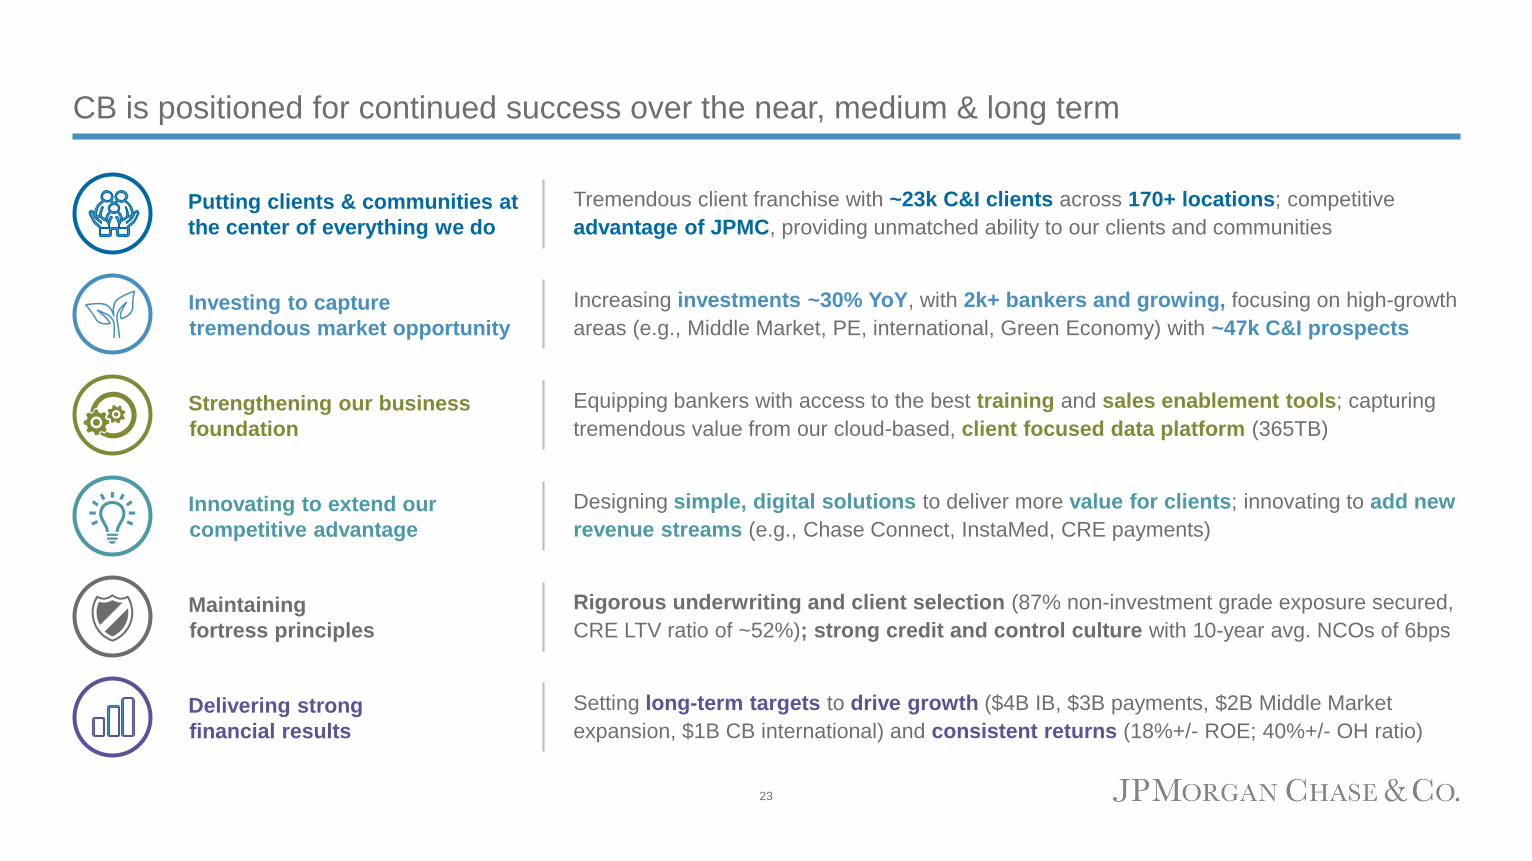
CB is positioned for continued success over the near, medium & long term
Tremendous client franchise with ~23k C&I clients across 170+ locations; competitive
advantage of JPMC, providing unmatched ability to our clients and communities
Putting clients & communities at
the center of everything we do
Investing to capture
tremendous market opportunity
Increasing investments ~30% YoY, with 2k+ bankers and growing, focusing on high-growth
areas (e.g., Middle Market, PE, international, Green Economy) with ~47k C&I prospects
Strengthening our business
foundation
Equipping bankers with access to the best training and sales enablement tools; capturing
tremendous value from our cloud-based, client focused data platform (365TB)
Maintaining
fortress principles
Rigorous underwriting and client selection (87% non-investment grade exposure secured,
CRE LTV ratio of ~52%); strong credit and control culture with 10-year avg. NCOs of 6bps
Delivering strong
financial results
Setting long-term targets to drive growth ($4B IB, $3B payments, $2B Middle Market
expansion, $1B CB international) and consistent returns (18%+/- ROE; 40%+/- OH ratio)
Innovating to extend our
competitive advantage
Designing simple, digital solutions to deliver more value for clients; innovating to add new
revenue streams (e.g., Chase Connect, InstaMed, CRE payments)
23
Related Documents