MARKET TECHNICIANS ASSOCIATION JOURNAL Volume I, Issue 1 January, 1978 PUBLISHED BY: MARKET TECHNICIANS ASSOCIATION 70 PINE STREET- XEW YORK, NEY YORK 10005 Copyright 1978 by Market Technicians Association

Journal of Technical Analysis (JOTA). Issue 01 (1978, January)
Aug 07, 2015
Welcome message from author
This document is posted to help you gain knowledge. Please leave a comment to let me know what you think about it! Share it to your friends and learn new things together.
Transcript

MARKET TECHNICIANS ASSOCIATION JOURNAL
Volume I, Issue 1
January, 1978
PUBLISHED BY: MARKET TECHNICIANS ASSOCIATION 70 PINE STREET- XEW YORK, NEY YORK 10005
Copyright 1978 by Market Technicians Association

Thanks to Market Technicians Association members for their part in the
creation of this issue are owed to:
Ralph Acampora Bernadette Bartels Philip Chew Abraham Cohen Walter Deemer David Diamond William DiIanni William Doane Robert Farrell Charles Kerdock Stanley Lipstadt John Mendelson Arthur Merrill Rosemarie Pavlick John Schultz Stanley Zaslow
YARKET TECHNICIIXS ASSOCIATION JOURNAL - JAWARY 1978
Editor's Note . . . . . . . . . . . . . . . . . . . . . . . . .
Indicator Analysis:
Indicator Accuracy by Arthur A. Merrill . . . . . . . . . . . . . . . . . . .
The Bearish Sentiment Index by Abraham W. Cohen . . . . . . . . . . . . . . . . . . .
General:
A Dow Theory Update by Ralph J. Acampora and Rosemarie I. Pavlick . . . . . .
.
Pages
4
. 5 - 13
. 15 - 18
. 19 - 24
Some Perspective on a Different Type of Upside Non-Confirmation by David L. Diamond . . . . . . . . . . . . . . . . . . . . 25 - 28
A Market Technicians Association Roundtable: . . . . . . . . . . 29 - 36
Some Stock Market Indicators that May Be Changing Due to a Changing Environment Participants: Robert Farrell, Moderator
Charles Kerdock John Mendelson John Schultz
Book Review:
Psychology and the Stock Market Reviewed by William DiIanni . . . . . . . . . . . . . . . . 37 - 38
Editor's Note
I am pleased to see the first issue of the Market Technicians
Association Journal a reality. We will all be more pleased to see this
Journal grow into a regular, increasingly meaningful publication to ad-
vance the knowledge of technical analysis and the comprehension or utiliza-
tion of the work of the market technician. That will reauire effort and
contributions from many people, and I encourage all members of the Market
Technicians Association to become involved now.
I believe the scope of this publication extends beyond
articles about technical analysis. M T A members should be exposed to
any information that will help them better accomplish their professional
and personal goals and responsibiIities. Hopefully, some of that information
will find its way into our Journal.
It is fitting that our first issue contains a Roundtable
discussion, from amongst our members, dealing with the subject of "change",
which will also be the theme of our Third Annual M T A Conference this Spring.
I encourage all readers to help change this Journal - from an unknown fledgling
to a widely sought after professional periodical. One of the first changes
is expected to be a "Letters to the Editor" column; let me know your thoughts.
Editor: Fred R. Gruber
c/o Keystone Custodian Funds, Inc. 99 High Street Boston, Massachusetts 02104
-4-
INDICATOR ACCURACY
Paper presented to Market Technicians Association
and the New York Society of Security Analysts
by
ARTHUR A. HERRILL Box 228
Chappaqua, New York 10514
October 5, 1977
INTRODUCTION:
In some of the early work on stock market cycles, the National Bureau of Economic Research found that stock market prices tend to move early in business cycles: stock prices are a leading indicator. Market analysts have been searching for leading indicators for stock prices; they are searching for a leading indicator of a leading indicator.
It isn't easy, Joseph Granville established the foundation with his book "A Strategy for Daily Stock Market Timing" in 1960; market analysts have been adding and investigating additional series every year.
Sometimes the indicators work; sometimes they give bad signals. They never com- pletely agree, and analysts must balance opinions. Too often, emphasis is placed on indicators which have been successful in the immediate past, when a broader base is desirable.
Some analysts put indicators through computer programs to obtain coefficients of correlation. Others have depended on analysis by reasoning processes based on market conditions.
This paper describes a simple empirical approach, which gives a practical easily understood answer: It reports the percent of the time -that each indicator has been useful in a test period of at least eight years.
The concept of this method is as simple as a batting average:
Batting Average = (number of hits) x 100% (number of times at bat)
THE FORXU-LA:
Percent accuracy = (number of successful forecasts) x 100% (total number of forecastsj
It isn't quite as easy to calculate as a batting average, however. The swings of an indicator must be translated into a forecast, and then this forecast must be scored, right or wrong.
- 5 -
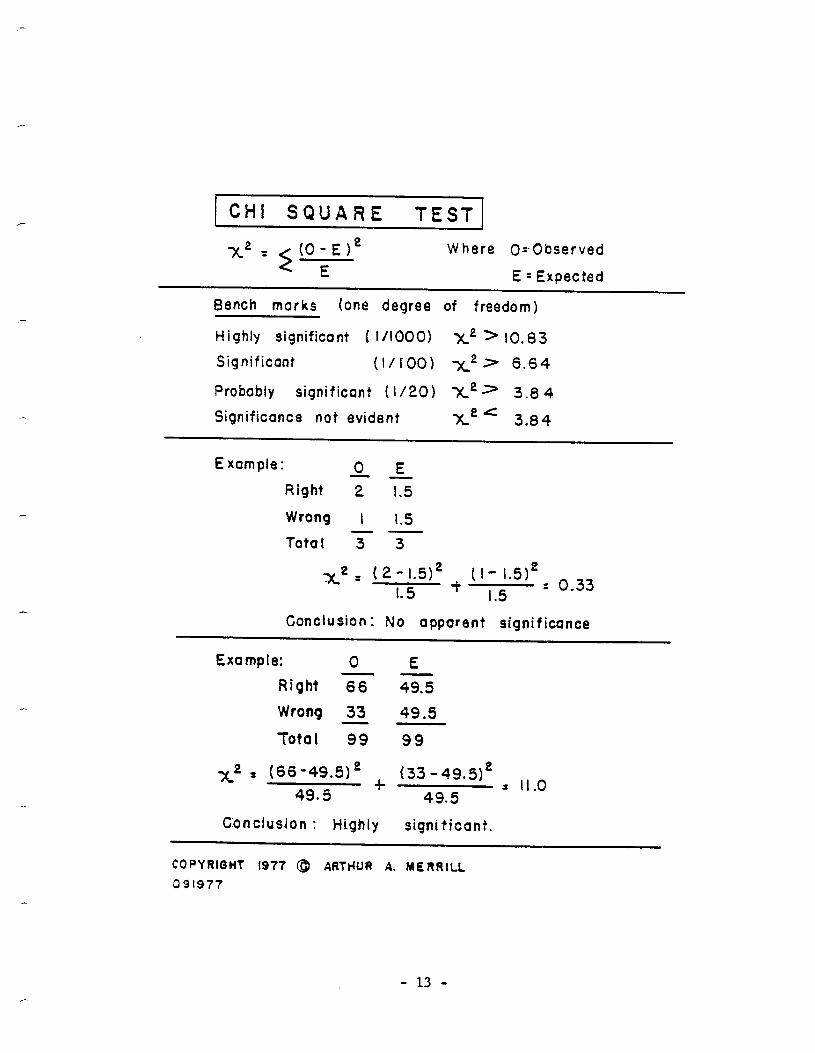
There is one more step, also. The significance of the forecast should be checked. If the percent accuracy was 66.7%, based on three forecasts, two right and one wrong, it would have no real meaning. 3ut if this percent was based on 66 right and 33 wrong, it would be significant and deserve study. We have been using the test known as "Chi Squared with one degree of freedom" (see any statistical text), with the following benchmarks:
Highly significant (l/1000) X2 = 10.83 Significant (l/100) X2 2 6.64 Probably significant (l/20) X2 7 3.84 Significance not evident X2 C 3.84
THE FORECAST:
The first step in the evaluation is to translate the swings of an indicator into a forecast. For most of the indicators in this test, the quartiles (highest and lowest 25% of the points) were used. It was assumed that the indicator was trying to say something by being high, or by being low.
The test described in this paper can be used to check out various ways of inter- preting an index. The way that has the highest accuracy can then be adopted, since it is the most useful
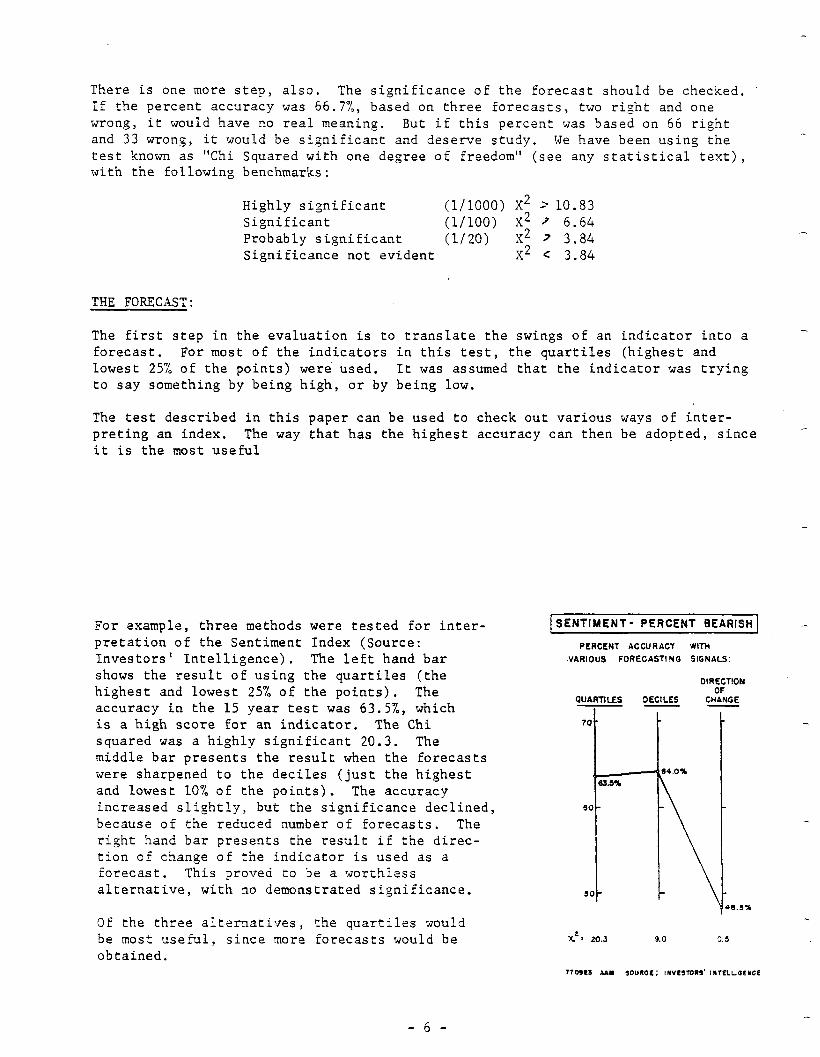
For example, three methods were tested for inter- pretation of the Sentiment Index (Source: Investors' Intelligence). The left hand bar shows the result of using the quartiles (the highest and lowest 25% of the points). The accuracy in the 15 year test was 63.5%, which is a high score for an indicator. The Chi squared was a highly significant 20.3. The middle bar presents the result when the forecasts were sharpened to the deciles (just the highest and lowest 10% of the points). The accuracy increased slightly, but the significance declined, because of the reduced number of forecasts. The right hand bar presents the result if the direc- tion of change of the indicator is used as a forecast. This proved to be a worthiess alternative, with no demonstrated significance.
SENTIMENT- PERCENT BEARISH
PERCENT ACCURACY WIYH
VARIOUS FORECASTING SIGNALS:
OIRECTION OF
alJAFmLES OECILES CHANGE - - - I I
-
4.0%
\
Of the three alternatives, the quartiles would be most useful, since more forecasts would be obtained.

SCORIYG THE FORECASTS:
,-.
The indicators were each scored in each week of the test period, to obtain a forecast: buy, sell, or no forecast. The next part of the problem is to rate each forecast as right-- or wrong, An automatic umpire has to be con- structed.
Our consensus "Balance" is aimed at usefulness in swings of the D-J Industrials which exceed 10%. To be most useful, the Balance should tell us to buy at the bottom and sell at the top of each swing, For this study we have considered the top one quarter of a swing to be a satisfactory sale area, and the lowest quarter to be a satisfactory buying area.
The middle two quarters have been scored as illustrated by the chart. On upswings, we like to let profits run, and have scored it as a satisfactory area for buying and definitely unsatisfactory for selling. On down swings, we like to get into cash, in readiness for the lower prices that follow, and have scored the middle two quarters as correct for selling and incorrect for buying.
/ FORECAST: BULLISH; BUY
r
FORECAST: BEARISH; SELL
I I.84
-.
The test can be used to check an indicator's usefulness in swings of various lengths. In ODD LOT SHORT SALES
the chart the indicator "Odd Lot Short Sales" Percmt accuracy in selecfinq buy
has been tested against swings of three dimen- and MII orrar
sions. The right hand chart presents the use- I ten rear fast wriod)
fulness in selecting buying and selling areas in shorter swings of the DJI of 5% or more. 5 Y. IO % 30%
The score, 67.0% accuracy, is the best, and the WTER FILTER FILTER
- I
Chi squared is a highly significant 31.7.
The middle bar presents the accuracy in select- ing buy and sell areas in big intermediate swings of the DJI of 10% or more. The accuracy is good, 62.4%, but not as high as the left hand bar. The chi squared is lower, but at a highly significant level of 16.6.
70 1
BZOX
62.4%
60
q
60
i 47.1%
In order to place each week of the test period in a good buying or good selling area, we used the closing prices in each week. This, then, gives us an automatic umpire, which identifies a forecast in any week as correct or incorrect.
The right hand bar presents the success in 'Locating, buy and sell areas for the full-sized bull and bear markets of 30% swings or more. The usefulness is zero, and the significance is not evident.
The conclusion is that this indicator is a short-term indicator, but that it does a good job, also, in swings of the intermediate size.
-7-
ODD LOT SHORT SALES ]
PERCENT ACCURACY
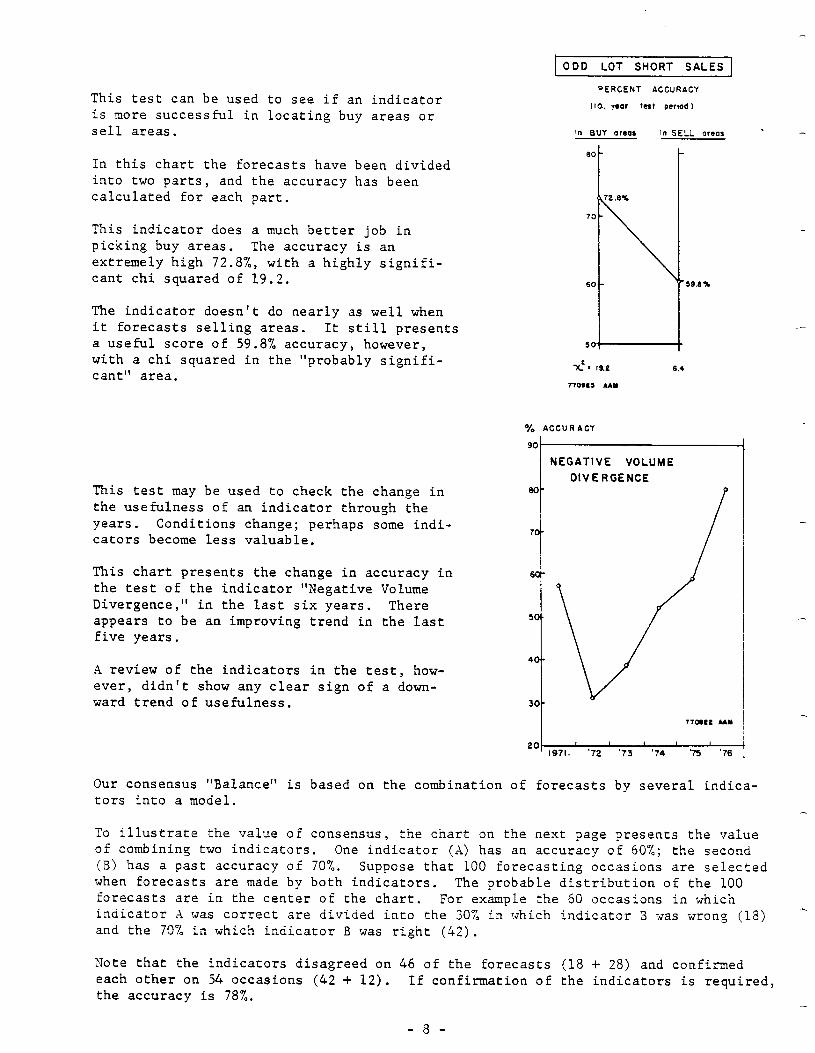
IIQ yeOr test pcrmd ) This test can be used to see if an indicator is more successful in locating buy areas or sell areas.
In this chart the forecasts have been divided into two parts, and the accuracy has been calculated for each part.
This indicator does a much better job in picking buy areas. The accuracy is an extremely high 72.8%, with a highly signifi- cant chi squared of 19.2.
The indicator doesn't do nearly as well when it forecasts selling areas. It still presents a useful score of 59.8% accuracy, however, with a chi squared in the "probably signifi- cant" area.
% ACCURACY
NEGATIVE VOLUME
This test may be used to check the change in the usefulness of an indicator through the years. Conditions change; perhaps some indi- cators become less valuable.
This chart presents the change in accuracy in the test of the indicator "Negative Volume Divergence," in the last six years. There appears to be an improving trend in the last five years.
t
DIVE RCENCE 80
7
/
4 review of the indicators in the test, how- ever, didn't show any clear sign of a down- ward trend of usefulness.
20 I I
1971. ‘72 ‘73 ‘74 Y6 ‘76
Our consensus "Balance" is based on the combination of forecasts by several indica- tors into a model.
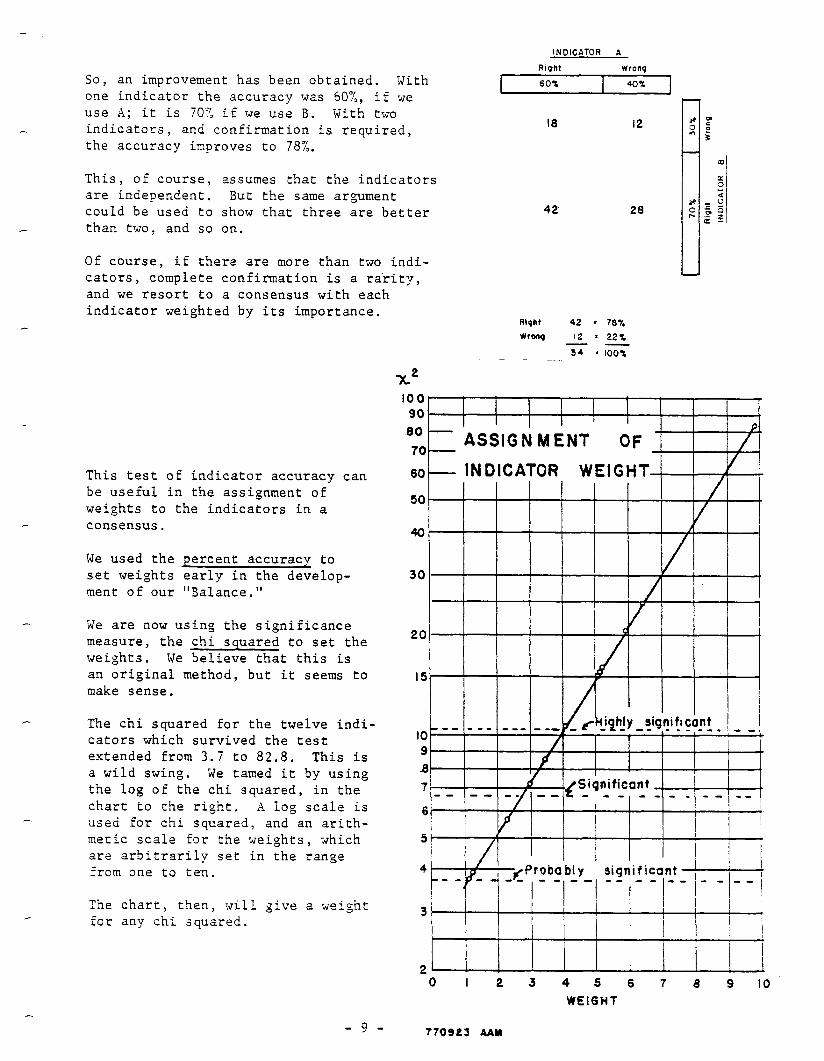
To illustrate the value of consensus, the chart on the next page presents the value of combining two indicators. One indicator (A) has an accuracy of 60%; the second (B) has a past accuracy of 70%. Suppose that 100 forecasting occasions are selected when forecasts are made by both indicators. The probable distribution of the 100 forecasts are in the center of the chart. For example the 60 occasions in which indicator h was correct are divided into the 30% in which indicator 3 uas wrong (18) - and the 70% in which indicator B was right (42).
Note that the indicators disagreed on 46 of the forecasts (18 + 28) and confirmed each other on 54 occasions (42 + 12). If confirmation of the indicators is required, the accuracy is 78%.
-8-
INDICATOR A
So, an improvement has been obtained. With one indicator the accuracy was 60%, if we use A; it is 70% if we use B. With two indicators, and confirmation is required, the accuracy improves to 78%.
This, of course, assumes that the indicators are independent. But the same argument could be used to show that three are better than two, and so on.
Of course, if there are more than two indi- cators, complete confirmation is a ra'rity, and we resort to a consensus with each indicator weighted by its importance.
This test of indicator accuracy can be useful in the assignment of weights to the indicators in a consensus.
We used the percent accuracy to set weights early in the develop- ment of our "Balance."
We are now using the significance measure, the chi squared to set the weights. We believe that this is an original method, but it seems to make sense.
The chi squared for the twelve indi- cators which survived the test extended from 3.7 to 82.8. This is a wild swing. We tamed it by using the log of the chi squared, in the chart to the right. A log scale is used for chi squared, and an arith- metic scale for the weights, which are arbitrarily set in the range from one to ten.
The chart, then, will give a weight for any chi squared.
Riqht wrong
I 60% 40%
m
18
ASSIGNMENT OF
0 I 2 3 4 5 6 7 8 9 IO
WEIGHT
- 9 - 77ose3 4AY
-
The 29 indicators in the list below were put to the test. Twelve succeeded in producing a significantly useful score. They will be listed on the following page, with definitions. If your favorite indicator isn't in the list, I will be glad to put it to the test if you will supply me with historical data for at least eight years. There will be no charge; it will have educational value for me.
INDICATORS TESTED
2A 2B 2c 2D 2E 6 13 15 17 22 26 32 34 38 47
Six month Average Direction 5% Swing Direction Prices Compared to 6-Month Average New Highs or Lows Made in 5% Swing Misc. Technical Factors; Trend Lines, etc. Transportation Arms Index Enthusiasm Volume Agreement with Price XSE Volume Percent Most Active Stocks; Price A-D Divergence Oscillator DJI Compared to S&P Investors' Confidence P/E, DJI
52 Seasonal 56 Short Interest 57 Funds' Cash Position 58 A-D Non-Cumulative 62 Sentiment; Percent Bearish 63 Short Sales, Members 66 Member Trading 67 Secondaries 69 Negative Volume Divergence 72 Odd Lot Index 74 Odd Lot Short Sales 76 Round Lot Short Sales 91 Free Reserves 94 Money Stock Change
TOTAL: 29 Indicators Tested 9/22/77 AA?4
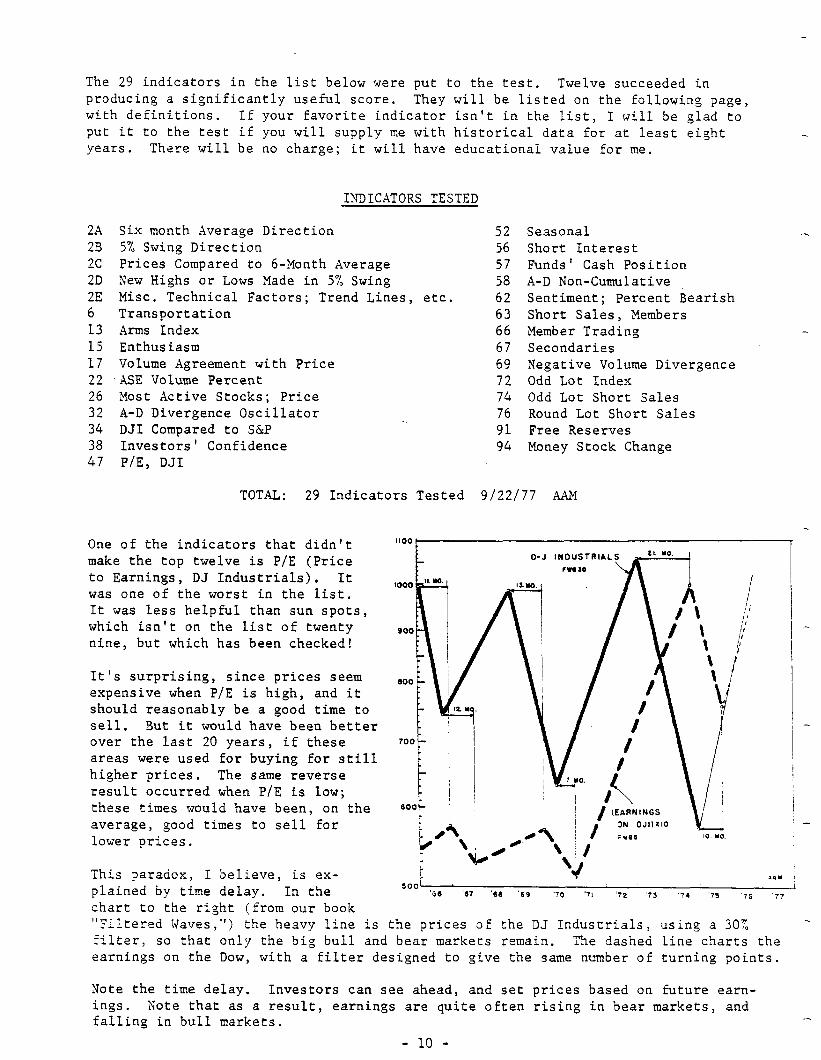
One of the indicators that didn't make the top twelve is P/E (Price to Earnings, DJ Industrials), It was one of the worst in the list. It was less helpful than sun spots, which isn't on the list of twenty nine, but which has been checked!
It's surprising, since prices seem expensive when P/E is high, and it should reasonably be a good time to sell. But it would have been better over the last 20 years, if these areas were used for buying for still higher prices. The same reverse result occurred when P/E is low; these times would have been, on the average, good times to sell for lower prices.
This paradox, I believe, is ex- plained by time delay. In the chart to the right (from our book "Filtered Waves,") the heavy line is
soor AI”
‘GO ‘67 ‘6.9 ‘69 ‘70 ‘71 ‘72 ‘73 ‘74 ‘75 ‘7G ‘77
the prices of the DJ Industrials, using a 30% filter, so that only the big bull and bear markets remain. The dashed line charts the earnings on the Dow, with a filter designed to give the same number of turning points.
Note the time delay. Investors can see ahead, and set prices based on future earn- ings. Note that as a result, earnings are quite often rising in bear markets, and falling in bull markets.
- 10 -

The twelve indicators will be listed beginning with number 12:
12.
11.
10.
9.
8.
7.
6.
5.
>EW HIGHS OR LOWS XADE BY TEE DJI 111 A 5% SWIXG
This is a trend indicator. If the DJI is in an upward swing of 5% or more, and makes new highs in any week, it is called a bullish forecast. If it is in a downward swing of 5% or more, and makes new lows in a week, it is called bearish.
Accuracy 55.7%, chi squared 3.7, weight in consensus: 1 -
A-D NON-CUXULATIVE
This is the weekly total of daily figures; declines are subtracted from advances. The total is expressed as a total of issues traded.
Quartiles used as forecasts: above + 9.6%: bullish below -13.0%: bearish
-Accuracy: 56.2%, chi squared 3.9, weight: 1
FREE RESERVES
This figure gives a clue to the intentions of the Fed. We use a five-week moving average.
Quartiles used as forecasts: above + 94 million: bullish below -943 million: bearish
Accuracy: 56.41/o, chi squared 5.7, weight: 2
FUNDS CASH POSITION:
We use cash in percent of total assets, as a measure of buying power. Quartiles used as forecasts: above 9.0%: bullish
below 5.9%: bearish Accuracy: 58.2%, chi squared 7.2, weight: 3
MZXBERS SHORT SALES
This is short sales by members of the X. Y. Stock exchange in percent of round lot volume.
Quartiles used as forecasts: above 6.0%: bullish below 4.9%: bearish
Accuracy: 60.1%, chi squared 8.5, weight: 4
SHORT INTEREST
This is the monthly total, divided by the average round lot volume per day, so that the total is expressed in days.
Quartiles used as forecasts: above 1.55 days: bullish below 1.19 days: bearish
Accuracy: 62.1%, chi squared 11.1, weight: 4 -
5% SWING DIRECTION
If the DJI has been swinging upward for more than 5%, it is called a bullish trend, if downward more than 5%, it is rated bearish.
Accuracy: 59.2%, chi squared 15.1, weight: 5 -
DJI PRICES COMPARED TO XOVING AVEIUGE
Bullish forecast if more than 1% above the 6 month moving average; bearish if more than 1% below.
Accuracy: 59.9%, chi squared 15.7, weight: 5 -
- 11 -

4. ODD LOT SHORT SALES
Weekly figures, short sales in percent of odd lot volume. Odd lot volume is taken as the average of purchases and sales.
Quartiles used for forecasts: above 1.86%: bullish below 0.81%: bearish
Accuracy: 62.4%, chi squared 16.6, weight; 5 -
3. SENTIMENT, PERCENT BEARISH (Source: Investors' Intelligence)
This is the sentiment of "leading investment services." Quartiles used as forecasts: above 40.1%: bullish
below 16.4%: bearish Accuracy: 63.5%, chi squared 20.3, weight: 6 -
2. DIVERGENCE BETWEEN DJI AND S&P
This is a measure of market leadership. The DJI are high capitalization blue chips; the S&P includes some "dogs." We compare the change in prices over a one year span. If the DJI is on top: bullish. If S&P is on top: bearish.
Accuracy: 61.7%, chi squared 24.7, weight: 7 Note that this index is second on the list. It doesn't ha= an accuracy of 92%; instead it gave wrong signals 38% of the time! Isn't this an argument for the use of a consensus?
1. MEMBER TRADING
We use a rather complicated formula, since the cumulative curve tends to drift. (The indicator is based on suggestions by Walter Heiby and Don Worden.) The index is the deviation of a cumulative (purchases-sales) from a moving average (about 6 months) of the same cumulation. We use an exponential average with multipliers of 0.92 and 0.08 instead of the moving average.
Quartiles used for forecasts: above +0.50 millions: bullish below -3.87 millions: bearish
Accuracy: 76.5%, chi squared 82.8, weight: ,lO
We put the twelve indicators into a consensus. with the numbers of the indicators on the pans.
The visual presentation is a scale, The current score: (as of 10/01/77):
BULL PAN: Short Interest Short Sales, NYSE
TOTAL ON BULL PAN
BEAR PAN: 5% Swing Direction DJI Compared to 6 No. Aver. New Lows Xade by DJI DJI Compared to S&P Member Trading
TOTAL ON BEAR PAN
BALANCE: = 8 x 100% = 22.2% 8 + 28
Aim 10/05/77
WEIGHT:
4 4
8
THE CURRENT BALANCE
- 12 -
.-
. .
CHi SUUARE TEST
x2 = s
(O-El2 Where O-Observed
E E = Expected
Bench marks (On@ degree of freedom)
Highly significant 1 I/1000) x2 ) 10.83
Significant (I/r001 x2) 6.64
Probably significant 1 l/20) X2=’ 3.8 4
Significance not evident X= c 3.84
E xample : 0 E Right 2 1.5
Wrong I I.5
Tota I 5-S
x2 = ( 2 - l.512 1 I- i.5)e = o 33 1.5 + I.5 -
Conclusion : No apparent significance
Example: 0 E
Right 66 49.5
Wrong 33 49.5
Total 99 99
x2 = (66 -49.5)’
49.5 f (33-49.512 = ,, o
49.5
C.onclusion : Highly signi ticant.
COPYRlOHf 1977 @ AATMJI? A. MERRILL OSl977
- 13 -

A PAGE FOi NOTES
-14-
THE BEARISH SENTI?iENT INDEX
A Contrary Opinion Indicator
by Abraham W. Cohen Investors Intelligence
Larchmont, New York
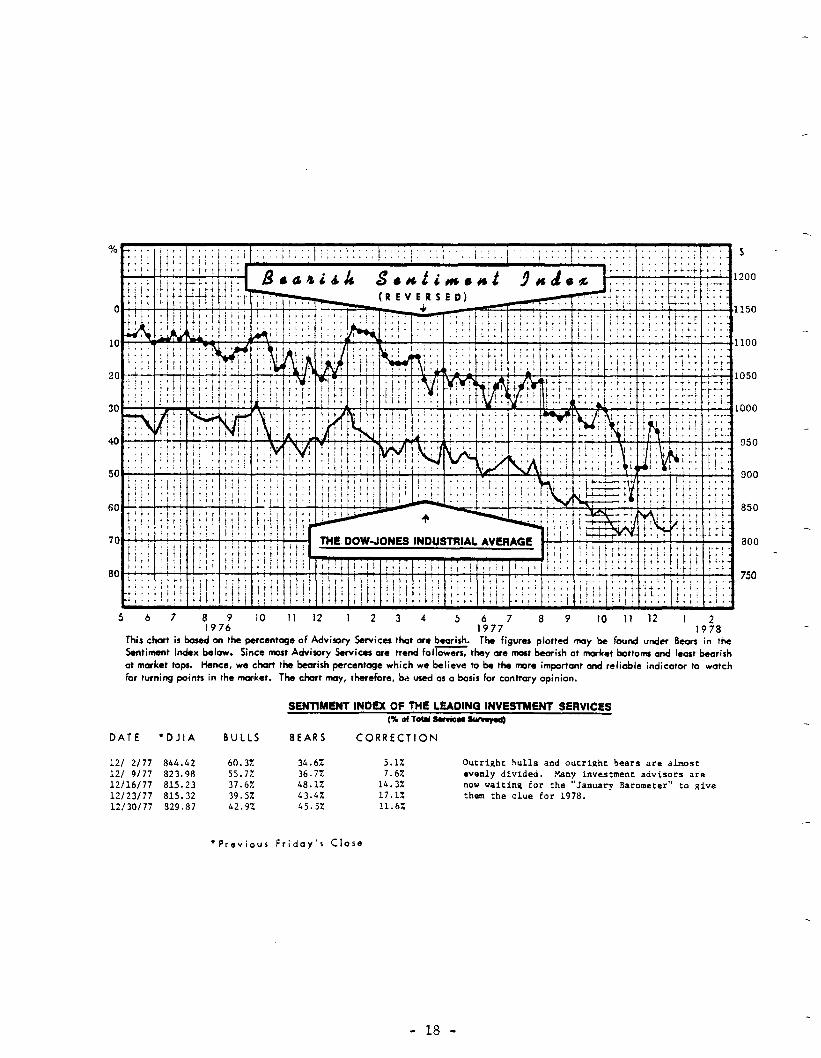
Since 1963, Investors Intelligence has been keeping a tally of the percentage of a broad sample of market writers who are outright bulls, out- right bears, or "waiting" bulls (those saying the market trend' is bullish but is undergoing a correction or consolidation). The ups and downs of the percentage of bears are charted and compared to a chart of the Dow Jones Industrial Average. This comparison has shown that investment advisory services in aggregate are least bearish at market tops and most bearish at market bottoms.
This "Bearish Sentiment Index" is not a "technical" indicator in the true sense of the term. It does not measure the inner workings of the stock market. It does not concern itself with price, volume, advances, declines, highs, lows, or who is buying or selling. It is solely based on what one class of market "professionals" thinks the market is doing or will do. It is an indicator of opinion, and at market turning points a "contrary" opinion indicator.
A question often raised about the Bearish Sentiment Index is whether it is based on objective data or subjective interpretation. In other words, can even the most practiced reader of an investment advisory service always tell whether it is bullish or bearish. Or are there times when the market letter writer's opinion is so hedged that an objective determination of his opinion is impossible? Fortunately, most investment advisors express their opinions clearly and unequivocally most of the time. A small minority will almost always hedge any opinion they express. Double talking begins to in- crease when a market letter writer becomes unsure of the trend of the market.
In those cases when the opinion of the market letter writer is not expressed clearly and unequivocally, the following criteria are used to de- termine whether he is bullish, bearish, or a "waiting" bull. (I) He is bullish if he is making buy recommendations and advising his subscribers to hold their long positions. (2) He is bearish when he is advising the sale of all long positions, and/or recommending the taking of short positions. (3) He is a "waiting" bull when he is saying hold your long positions but do not do any new buying until the present market weakness has seen its course.
With the help of these three criteria, there can be no confusion be- tween a bullish opinion and a bearish opinion. The only possible confusion, if any, is between the outright bull and the "waiting" bull. But even if this confusion occasionally takes place, it will have not effect on the accuracy of the Bearish Sentiment Index because this index is based on the outright bears relative to the total services tallied.
- 1.5 -
Some specifics as to the construction of our data may be of interest. We track about seventy-five market letters for our tally. Our interpreta- tions are based on the long-term major trend time frame, except for about ten percent of the services where there is no long-term commentary, there the intermediate trend opinion is recorded. The opinions are recorded and a percentage bearish figure is derived weekly. Where the service is published less frequently than weekly, their opinion is carried forward weekly until their next issue and then changed--if appropriate. Numerical data for the Bearish Sentiment Index is available back to its 1963 inception. We would point out that the Index percentage is plotted on a reverse scale, so that its tops and bottoms parallel those of the Dow Jones Industrial Averages.
It has already been pointed out that market letter writers, as a group, are least bearish at market tops and most bearish at market bottoms. At bull market tops, less than 10X are bearish; at bear market bottoms, more than 609. are bearish. Arthur Merrill's study of indicator accuracy, based on 10% swings in the Dow Jones Industrial Average, found that a reading below 16.4% should be interpreted as bearish and a high reading above 40.1% as bullish. He also found the Bearish Sentiment Index to be the third most accurate indicator among the 29 that he studied.
Does the use of the Bearish Sentiment Index as a contrary opinion indi- cator mean that market letter writers are wrong on market trends? Not neces- sarily. Most recognize a trend once it has been firmly established. Some recognize it earlier than others. It is also easier to recognize a change from bearish to bullish than from bullish to bearish. It has been more difficult to recognize market tops than market bottoms. This may be due to the fact that market letter writers are emotionally biased towards the bul- lish side. Also most technical indicators work the same way-they rarely anticipate market tops. The most difficult thing to do is to predict a change in trend before it occurs. The few that are successful in predicting such changes are often premature, and the timing of such advice may not be very helpful to the investor or trader.
c
In recent years the Bearish Sentiment Index has achieved a certain amount of popularity. This. popularity has been not with the general invest- ment public but with the writers of investment letters. It is probably one of the most commented upon indicators in market letters. However, it is quoted but not followed. It is generally commented upon favorably when it agrees with the bullish or bearish views of the letter writer; it is often commented upon unfavorably when it disagrees with such views. It is often said that an indicator that achieves popularity loses its validity. We don't see this happening with the Bearish Sentiment Index. A sign that this has occurred would mean the letter writers were switching from 10% bearish to 60% bearish and back, quickly and frequently. That is practically impossible.
We are refraining from a detailed move-by-move analysis of the Bearish Sentiment chart. We believe that if the reader examines it carefully, he will come to the same conclusions that we did as to general interpretation of the data.
- 16 -

4 5: : 0 :
z 0
: 0
v) 0
3 - - 0 OI 2
g 0 0 0
a, m h 3 z 2
-
- - -
- - h
-- h - m
L A -
- - -
S -
4 - -
- - 9 m
- L : I -
-
z z
-
cm m -
- - -
B - 2
C - m
- -
- - - -
- -
- - -
- - -
- - -
G - -
= - - -
- -
- -
-
- - -
-
-
- .
m .
2
-
A h w .a I *
- m
- A 4 - Q
- m * -
- - W
- -
a 197:
10 II 12 1 2 3 4 5 16977
7 8 9 IO 11 12 1 ,938
This chart is hosed on the percentage of Advivrry Sewices that are beorish. The figures plotted may be found under 8eors in the
%ntiment Index below. Since most Advisory Services are trend fol= they are most bearish at market bottoms and least brish
at market tops. Hence, we chart the bearish percentage which we believe to be the more important and relioblc indicator to watch
for turning points in the market. Tha chart may, therefore, ba used as a basis for contrary opinion.
SENTIMENT INDEX OF THE LEADING INVESTMENT SERVICES (K 0(10tatsorviwa~)
DATE l DJlA BULLS BEARS CORRECTION
121 2177 844.02 60.3X 3&.6X 121 9177 823.98 55.7X 36.72 L2/16/77 815.23 37.6% 48.12
12123177 815.32 39.5% 43.42 12/30/77 829.87 &2.9% 05.5%
5.12
7.62 14.3% 17.1% 11.6%
Outright hulls and outright bears are almosr
evenly divided. .Nany investment advisors are now wiring for the “January Rarometer” to give them the clue for 1978.
*Previous Friday’s Close
150
100
,050
.ooo
850
800
750
- 18 -
Reprinted courtesy or': Smith Fjarney Harris Up'nam & Co., Inc.
mQRbe+
Release cate:
Vol. xv, No. 31
A After many years of observations, Charles Dow concluded that the stock DOW THEORY market, like the ocean, had three movements: primary, secondary, and daily UPDATE fluctuations. The major advances and declines of the market were equated witn
the tides - a dominant force that lasted for a period of time. These long-term movements were subject to secondary reactions (waves) that lasted for a shoner period of time and might temporarily appear to contradict the primary trend. And finally, the waves themselves were broken down into ripple (daily) reactions. Sut Dow strongly felt that no means of manipulation could diven the eventual course of a major primary move. It is for this reason that he dedicated his theory to the long-term outlook for the stock market.
The discovery of the rhythmic movements of price led to the advent of the Dow Jones averages. 9eginning in 1897, the Wal/ Streer Journal published two sets of averages: the industrials and the railroads. The logic behind the specific make-up of these separat e indices is rooted in Dow’s premise that both of these sectors of the market were interdependent. For example, if the large industrial firms of the day were faring well, they depended upon the use of railroads to transport their products. Whenever the price trends showed disparate movement between these two indices, it meant that one sector was stronger or weaker than the other, and if allowed to continue, it wouid eventually result in a major reversal for the general stock market.
At this time in history, as our nation was still growing - pushing its way across the entire expanse of the North American continent - the iron horse was the only means of transporting people and produce. Thus industry and railroads prospered and suffered together. As our county matured and the transportation revolution took hold, the use of railroads diminished considerabiy. It was for this reason that the Dow Theory came under recent attack. “What about the airlines or the truckers - why are they not incorporated in this theory?” This argument was valid, so on December 22, 1969 Dow Jones & Company revised the rail average to include other means of transportation. Today, the new Dow Jones Transportation Average satisfies the original requirements of a balance between industrial firms and the transportation network.
The following is an excerpt from “The Dow Theory Explained” by Charies B. Stansbury. “We now come to a fundamental tenet of the Dow Theory and that is that any signal to be authentic must be affirmed by both the indufirial and railroad averages. While this concept may seem a little confusing at first, we have only to return to our simile of the movement of the tide to clear it a~. Instead of watching a single beach (or chart) we now must imagine ourselves standing at tile mainland end of a narrow peninsula from which we can watch two beaches: 80th are oafls of t5t same ocean (market) which is divided into two pam (industrial average and raiiroad average) by ;ze peninsuia. While both beaches are subject to the same tidal action they may snow varying wave action. The wave action on one beach may often prove highiy deceptive as to rhe course oi :?e tide unless we find the movement confirmed by similar action on the other beach.”
The February 11, Y922, Wail Street Journal srated: I‘. . . the stock market is acring not uoon ape known news of today but upon what conditions wiil be as far anead as the comornec inte!ligenco and knowiedge of Wall Street can foresee. There are plenty of bear arguments in me compiicatot

conditions in Europe, the uncertainties of taxation and the interested aberrations of Congress. All these factors are known and, if possible, overdiscussed.”
Charles Stansbury also wrote that “Over the years during which the averages have been observed and recorded this confirmation by both averages has established itself as an essential part of the theory.
_
“The confirmation which carries authority need not develop in our chart on the same day or even in the same week. It is deemed sufficient if one average follows the other into new low ground, or new high ground, before the first average retracts its half of the signal, The first average retracts if it makes a new extreme in the average”.
opposite direction before confirmation by the second _
F
Confirmation of Primary Bull and Primary Bear Markets:
In Chart I we depict the price trends of both the Industrial and Transportation Averages. Note that drop B to C does not register a new low (below A). This is the first sign of a potential positive shift in the making. At C, one or both averages holds above the low (A). A bear market bottom is confirmed at point D - the first time that the averages penetrate a previous rally of substance.
A bull market reversal occurs when there is tremendous euphoria; the “things couldn’t be better” syndrome. Some time during this period, the average (s) is unable to register a new high (G) above the previous and, -in hindsight, ultimate peak (E). It is at point H that the primary downtrend is established - a decisive break below a previous important (real) secondary low (F).
Secondary Reactions
In every primary move, whether ascending or descending, there is a time when prudent investors commence profit-taking (Chart II, point A). This normal process invariably causes the average (s) to weaken - perhaps both industrials and transportations show signs of divergent trends at this point. Significant redeployment of funds becomes evident at point D -a time when the buyers’ activity supports sagging prices and prevents a new low from occurrring below point B. Point E suggests more optimism as the minor high (C) is breached. It is not until a new high (F) is attained that the primary trend can still be considered in force. This entire pullback phase (A thru F) is known as a secondary reaction (waves within the tides).
How does one distinguish between a secondary and a major reversal? It is at this extremely critical juncture that one pay close attention to all the characteristics present during secondary reactions. To begin with, secondary declines have a multiple effect (several downward swings in price). in Chart I I I, the
- 20 --
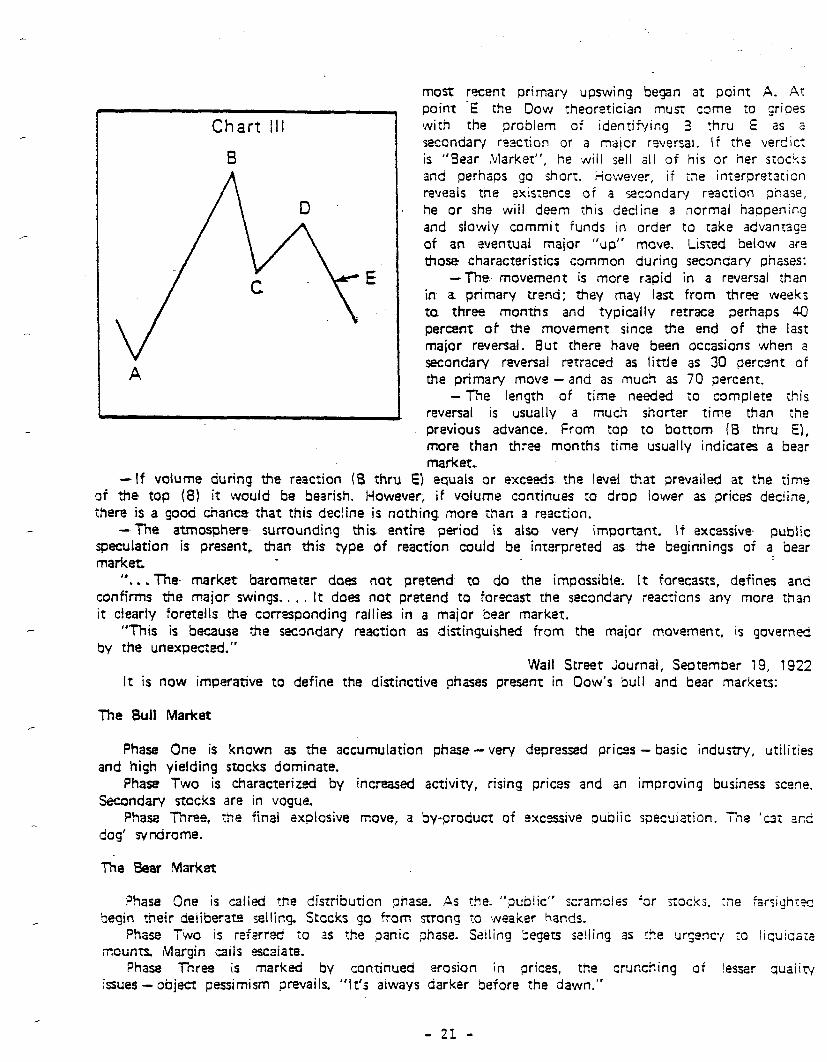
Chart III
6
-If volume during the reaction (8 thru
.
most recent primary upswing beFan at point A. At point -E ihe Dow theoretician must come to gripes with the problem of identifying 3 :hru E as a secondary reaction or a major reversai. If the verdict is “Bear Marker”, he wiil sell all of his or her stocks and perhaps go short. I’iowever, if the interpretation reveals the existence of a secondary reaction pnase, he or she will deem this decline a normal haopening and slowly commit funds in order to take advantage of an eventual maior “up” move. LiSied below are those characteristics common during secondary phases:
-The.- movement is more rapid in a reversal than in a primary trend; they may last from three weeks to three months and typically retrace perhaps $0 percent of the movement since the end of the last major reversal. 8ut there have been occasions when a secondary rwenal retraced as littie as 30 percent of the primary move - and as much as 70 percent.
- The length of time needed to complete this reversal is usually a much shorter time than the previous advance. From top to bottom (8 thru E), more than three months time usually indicates a bear market,
E) equais or exceeds. the level t!hat prevailed at the time of the top (8) it would be bearish. However, if volume continues to drop lower as prices dec!ine, there is a good chance that this decline is nothing more than a reaction.
-The atmosphere. surrounding this entire period is also very important. If excessive public speculation is present, than this type of reaction could be interpreted as the beginnings of a bear market
I. .*. The market barometer does not pretend. to do the impossible. It forecasts, defines and confirms the major swings. . , . It does not pretend to forecast the secondary reactions any more than it cfeariy foretells the corresponding railies in a major bear market.
“Tiiis is because he secondary reaction as distinguished from the maior movement, is governed by the unexpeczd.”
Wail Street Journai, September 19, 1922 It is now imperative to define the distinctive phases present in Dow’s bull and bear markets:
The 8uli Market
Phase One is known as the accumulation phase - very depressed prices - basic industry, utilities and high yielding stocks dominate.
Phase Two is characterized by increased activity, rising prices and an improving business scene. Secondary necks are in vogue.
Phase Three, the final explosive move, a by-product of excessive puoiic specuiation. The ‘cat and dog’ syndrome.
The Sear FiIarkes
Phase One is called the distribution ohase. 4s the. “oub!ic” scrambles for SOc!<j. :Se fxsi~hrx ‘begin their deliberate selling. Stocks go from strong TV weaker hands.
Phase Two is referred to as the panic phase. Sailing begets se!ling as rhe ursencj TO liquica:~ mounts. IMargin caiis escaiate.
Phase Three is marked by continued arosion in prices, the crunctiing of lesser quaiiry issues - object pessimism prevails. “It’s always darker before the dawn.”
- 21 -

THE Charles Dow specifically emphasizes the use of the closing prices for both THEORY averages, because he felt that these figures would give a true picture of the floor TODAY traders’ and specialists’ positions. Despite their long and short dealings during the day,
these professionals would invariabiy even up before the close. On page 5, are depicted graphs of both averages: we have inserted the closing figures of the key
reversal points and non-confirmation levels since September 21, 1976. This entire period is in question. Are we in a secondary reaction phase or has a Dow Theory
bear market signal been given? In determining a trend, previous high and low points are used. A succession of new highs is
positive while a series of new lows is negative. The Dow Jones Industrial Average chart on page 5 has been tracing out a progression of lower highs since September 1976 (note points A,D,E,G,H,J and K). Points B,C,F,l and L vividly portray a succession of lower lows -this combination is negative.
When viewing the Dow Transportation Average from October 1976 to May 1977, a distinct divergence is seen. Points P,S and T represent a classic series of new highs while N,Q and R are important higher reaction points - this combination is positive. The DJIA reached its high on September 21, 197’6 at 1014.79 (A) while the DJTA registered its high on May 18, 1977 at 246.64
U-l. Remember Dow’s fundamental tenet: “for any signal to be authentic, both averages must
confirm. It is deemed sufficient if one average follows the other into new low ground, or new high ground, before the first average retracts its half of the signal.
Now the question is raised -. since the TranspoRation Average has recently come under sharp selling pressure (points W and XI, does this move constitute a confirmation of the Industrial Averagds negative behavior?
To begin with; the Dow Jones Transportation Average- was confined to a tight trading range during the months of June and July 1977 (U and V). This is called a line formation. It usually lasts several weeks with price fluctuations in the magnitude- of 5%. Such movements indicate accumuiation or. distribution. Any break below this formation is distribution and implies lower prices, Needfess to say, the Transportation- Avera* has decisively penetrated the lower end of this pattern (W); in. so doing, it also weekened below its February 25 close of 221.81 (Q). It is here that the Dow theoreticians differ. Is 221.8t the critical secondary low? If so, then the DJTA has confirmed the breakdowns in the Industrial Average and has initiated a primary bear signal. A secondary low must be considered the beginning. of the recent primary upswing. We interpret the Oct. 3 low (N) of 203B5 the focal point for the primary upswing. Thus, until the Transportation Average closes below 203.85, the move down from T is still considered a secondary reaction.
The follow.ing excerpt from Richard. Russell’s ‘The Dow Theory Today” is noteworthy: “Bear market signals, however, must not be oversimplified. The great Dow Theorist Robert Rhea
wrote in 1938: ‘8eginners frequently make the mistake of basing conclusions wholly on the matter of penetration. Familiarity with the co-related factors such as duration, extent, activity, divergence, and secondary implications of primary bull markets is needed to make a correct diagnosis.’ Anyone who has studied the works of Hamilton and Rhea knows that it is only in the third and last phase of an extended bull market that a bear signal is valid. Ignorance of this fact has led to one of the most disastrous mis-readings of the Averages in modern stock market history.
“Over and over again, the great Dow theorists have warned us not to take a shallow, mechanical reading of the Averages while disregarding phases, duration and extent of the market movements. By calling a bear market on a ‘false’ second-phase signal, the majority of the financial fraternity has committed one of the most costly errors in market annals.
“Once the fact is accepted that bear inarket signals are valid only when they occur within the rhird phase of a bull market, the utmox importance must be attached to identifying the third chase. ‘This is the time,’ wrote Rhea, ‘when brokers and soothsayen prosper, and when an excited ,:ublic, lured by. the bait of advancing prices, buys stocks without regard to values, basing their action on nothing more than hopes and expectations.’ He observes that ‘this is the phase were wonhless stocks are bought for no other reason than because they look cheap, and because gamblers hope they will double in price. This condition always has prevailed in the third phase of bull markets. . . .’ ”
Let us now investigate Rhea’s co-related factors:
- 22 -

.-
4
I : I :
. .
- 23 -
Duration - The Dow Industrials has easily exceeded the three week to three month time limitation used in measuring a secondary reaction. The Transportation’s reaction began on May 18 (T), also overstaying this requirement.
Extent of the Decline - A secondary reaction typically retraces perhaps 4095 of the movement since the end of the last major reversal. On occasion, retracements of 30% or as much as 70% of the primary move have been noted. The OJIA has retraced 34% of its primary advance that began in December 1974. The DJTA has only retraced 26% from its primary low, registered in October 1974.
?hases - To date we have witnessed impressive moves in the basic industries, uultties, and high yielding stocks - the fulfillment of Phase One in a bull market. Secondary stocks have moved to the fore and dominated the scene in the past twelve months, thus satisfying Phase Two. However, the over-heated, speculative fever stage has not been witnessed; thus the paramount requirement has not been met. Tne reactions to date (A to L and T to XI have not taken place during the third and final phase of a bull market.
In conclusion, valid.”
“it is only in the third and last phase of an extended bull market that a bear signal is
Written a/19/1977 3:30 P.M. D.J.I.A. 862.27 By: Ralph J. Acampora Rosemarie L. Pavlick
203.85 This number represents the imponant secondary low registered in the Dow Jones Transportation Average on October 12, 1976. Since September 1976, divergence has
existed between the DJI A and the DJTA causing many Dow theoreticians to question the viability of the bull market that began in January of 1975. Last Monday, the Dow Jones Transportation Average closed below 203.85, giving a bear market signal. However, everyone was fully apprised of
this development - leading Wail Street publications contained articles describing this phenomenon and its ominous consequences. The nonbelieven quickly responded with either a shrug of the shoulders or the statement that this signal was “too much and too late”. Some selling came to the fore
because of the breakdown but quickly reversed into the first 5% rally in 1977. That rally nevertheless does not negate .the importance of the signal. In fact, the rally comes as no surprise -
the market had already suffered slow deterioration for several months, and at the time was in an extremely oversold condition. The reaction was anticlimactic, but don’t be fooled by the resultant rally. Mu& more is needed to reverse this negative signal.
Charles Dow compared the market’s primary trend with the ocean’s major tides. He suggested
that within the tides, waves will occur (secondary reactions) that move counter to the major flow.
These counter moves could extend from three weeks to three months and have no lasting effect on the major trend. Thus, if this bear market signal is accepted, temporan/ rallies could be viewed as a selling opportunity within. a major downward phase.
Written Ocrober 28. 1977 3:30 P.M. D.J.I.A. 821.12 By: Ralph J. Acampora Rosemarie I. Paviick
- 24 -

SO?E PERSPECTIVE ON A DIFFERENT TYPE OF UPSIDE NON-CONFIRMATION
by David L. Diamond, V.P.
The Boston Company Investment Research and Technology, Inc.
On September 21, 1976, the Dow Jones Industrial Average closed at 1014.80, its highest level since the 1975-76 bull market began. From that point the market began to sell off. The DJIA dropped through October and into mid-November, when a low was reached and a year-end rally got under- way. By December 31st the rally had carried to 1004.66, just 10 points below the DJIA's earlier high. Many analysts began talking of DJIA. 1200, and with public sentiment highly positive it seemed inevitable that 1014 would be broken. It quickly became apparent, however, that it was not to be. The DJIA declined steadily as 1977 began, and by late-October it was 200 points below its bull market peak.
On September 22, 1976, the day after the DJIA reached its high, another market index reached a high of its own. The index was the Advance Decline Index, a widely followed measure of market breadth representing a cumulation of the ratio derived from the daily fiYSE advances less declines divided by issues traded that day. Following its September peak, the A/D Index declined with the DJIA until both reached their lows on the same day in mid-November. At that point, however, a curous situation developed. Unlike the DJIA, the year-end rally soon carried the A/D Index above its September peak, and by early January 1977 it had moved considerably into new high ground. In fact, the A/D Index did not peak until July 22, 1977, and its decline since then has been relatively minor, in sharp contrast to the dramatic decline in the DJIA.
As market technicians, we are familiar with the typical divergence between the DJIA and the A/D Index which has developed prior to many bull market peaks. Referred to as an "upside non-confirmation", it occurs when the DJIA moves on to new high levels while the A/D Index is heading lower. The implications of this type of upside non-confirmation are distinctly unfavorable , inasmuch as the apparent strength in the few DJIA stocks is masking the weakness which has spread to the majority of issues, and in virtually every instance the DJIA has eventually given way to the downside as well.
The events described at the start of this article are also referred to as an “upside non-confirmationl*, the name being derived from the fact that one major average is not reaching new highs to "confirm" the highs reached by the other. However, at first glance this type of upside non-confirmation would seem to have bullish implications. bfter all, if the majority of issues continue to advance, won't this strength eventually be reflected in the major averages? Zut on the other hand, the wealcness in the averages cannot be overlooked. If the market is discounting problems that it fore- sees for the leading companies of American industry, how can we expect the smaller companies to escape problems of their own?
.- - 2s -

To be better able to understand the significance of this type of upside non-confirmation, we need to provide some historical perspective, especially since a situation similar to what we have just been through has not occurred since the mid-1950's. The purpose of this study is to identify periods in the past which were like the current period, and briefly examine the course of the market subsequent to those periods.
This study first established a set of objective criteria to define the type of upside non-confirmations just described. (Mhen we refer to "upside non-confirmations in the subsequent text, we are alwavs referring to this second type. ) The criteria established are meant only to provide a frame of reference, not to be the last word as -to what constitutes an upside non-confirmation. Other criteria might be as good or better than those selected here, but since some criteria must be chosen we have settled on those described below.
In general terms, this type of upside non-confirmation requires the occurrence of two events. First, we need to see that a high has been established for both the DJIA and the A/D Index. Then, after a certain period has elapsed, we need to see if the high for the A/D Index has been bettered.while the high for the DJIA has not.
To establish a high .for the DJXA, we looked for points which were unsurpassed within two months on either side. Obviously we would not know we were at such a point until the subsequent two month period had elapsed, but since our analysis started only after that two month period kas over, . it presented no problems for the study. To establish a high for the A/D Index to correspond to the high for the DJSA, we selected the highest reading in the A/D Index over the one year period ending at the point two months after the DJIA high.
Once this two month period had elapsed and reference points had been established for both the DJIA and A/D Index, our search for an upside non-confirmation would begin. For the following twelve month period the daily levels of both the DJIA and the A/D Index were examaned to see if either high had been broken. If the DJIA high were surpassed before or at the same time as the A/D Index high were surpassed, no upside non-confirma- tion of the type we were looking for had occurred. Yowever, if the A/D Index high were surpassed first, that day was indentified as the date of an upside non-confirmation.
Our study covered daily readings in the DJIA anti the A/D Index since January 2, 1925. Over the last 50 years, upside non-confirmations as we have defined them have occurred a total of twenty times (see Table I). The earl iest dates back to April 10, 1934, at what was an intermediate peak in an extended bull market lasting from mid-1932 into early-1937. The majority of upside non-confirmations ocourred in the 1940'3, a ;eriid in
which the average stock was far stronger than the DJIA.
tipside non-confirnations have occurred ;;rior to shar;, market moves in either direction. Less than two months after the upside non-confirmation on January 15, 1937, the aarket reached a peak from which it would fall by almost 501 in the year which followed. On September 23, 1942, an upside '
- 26 -
non-confirmation occurred which was followed by a 35°F rally within the next nine months . On average, however, over the three to twelve months subse- quent to an upside non-confirmation, the market has tended to be from 0 to 31 higher. Mile slightly positive, this implies no better than the average annual gain of 3.751 which the DJIA has compounded over this 50 year period .
When do upside non-confirmations tend to occur? As one would expect, the majority occur during ongoing bull markets. Of the twenty occurrences, eleven were during bull markets, six were at intermediate or cyclical market peaks, while only three occurred during ongoing bear markets.
Based on the overall results, it would appear that upside non-confir- mations are more an indication of a build-up in technical strength than of weakness. Eowever , the results suggest the subsequent performance may in fact be’ no better than average, and the six occurrences at market peaks and three during bear markets make the entire argument far from conclusive.
At this stage we began to look at each upside non-confirmation, to see if any commonality existed between those leading to significant market movements and those which did not. Quickly, one feature stood out. In each of the upside non-confirmations occurring during a bear market and three of the six occurring at intermediate of cyclical market peaks, the peak in the DJIA was not surpassed for at least three months following the new high in the Advance/Decline Index.
Of the twenty cases we have to examine, eleven saw the DJIA peak surpassed within three months of the new A/D peak, in many instances uithin a matter of days. . But in the nine other instances, the DJIA did not reach a new high within this period, and these provide a much different perspective on the future market outlook.
Of the nine cases in which the DJIA peak was not surpassed within 3- months, only two occurred during ongoing bull markets (see Table II). The average twelve month change of the eight showed a decline of 2dp (thus well below the average for the period) , and the average six month change showed a decline of 7%. Furthermore, the average time from the date of the upside non-confirmation until the DJIA high was finally surpassed was over twenty-four months.
‘&at conclusions can be drawn from this analysis? Host importantly, it seems that when an upside non-confirmation occurs and the DJIA does not surpass its peak over a subsequent three month period, we have likely witnessed a fairly significant market peak. However ; this study is doviously just a beginning in the analysis of this seemingly new type of upside non-confirmation. The number of cases we have had to examine are relatively few, and many have clustered around short periods of market history. The perspective it does provide will hopefully be refined when this recent pattern is seen again.
- 27 -

TABLE 1:Upside Non-Confirmations -- 1926 through 1976
Upside Non-Confirnations Subsequent $ Chanse Teak Il!onths to Date DJIA >Iarket 7 Month 6 Month 12 Month DJIA New Pea!<
4/10/34 l/14/36 l/15/37 6/w/39 g/05/40 l/09/41 g/23/42 9/18/43
12/30/43 3/03/44 5/17/44 9125144 4/03/46 a/10/49 8/15/50 7/01/52 3/11/53
II/29155 12/06/76
105.05 Bull-IP 146.32 Bull 184.53 3ull-CP 138.71 Bear 134.10 Bear 133.39 Bear 108.27 Bull 140.94 Bull 136.20 Bull 136.59 Bull 138.99 Bull 146.77 Bull 203.12 Bull-CP 180.60 Bull 215.31 Bull 275.46 Bull 288.02 Bull-CP 482.60 Bull-CP 961.76 Bull-CP
-7s 9
-;
1;
7 -5
3 2
5 3
-1 6 r
-; -8
1 -1
-15% 7
-6 7
-10 -9 20
-3
2 5
10
-15 10 16
4 -11
-"6
0% 113.74 12 24 148.44 0
-33 184.90 0 6 158.41 t3
-5 155.92 53 -12 138.12 27 .25 108.91 0
4 145.82 8 7 141.75 5 *
14 138.65 0 12 141.00 0 11 150.50 2
-14 206.97 0
13 190.19 2 18 22a.38 1 -2 276.37 0
3 293.79 10 2 487.45 0
-16 1014.80 12+
TABLE II: Upside Non-Confirmations -- 1926 through 1976
No New Dow Peak Within 3 Months
Upside Non-Confirmations Subsequent $ Change Peak E?onths to Date DJIA Market 7 Month 6 Month 12 Honth DJIA New Peak
4/10/34 105.05 Bull-IP 6/07/39 138.71 Bear g/05/40 134.10 Bear l/09/41 133.39 Bear g/13/43 140.94 Bull .
12/30/43 136.20 Bull 3/11/53 288.02 Bull-CP
12/06/76 961.76 Bull-CP
-7% -5
1;
-5 3
-8 -1
-15% 7
-10
1;
-4 -11
-6
0% 110.74 12 6 158.41 6i3
-5 155.92 53 -12 138.12 27
4 145.82 a 7 141.75 5 3 293.79 10
-16 1014.80 12+
,,I w 4-q 4+
?lote: Market types are as follows -
3ull - During an ongoing bull market 3ull-IP - In the vicinity of an intermediate peak in a bull market Bull-CP - In the vicinity of a cyclical peak in a bull market Bear - During an ongoing bear market
- 28 -

A MARKET TECHNICIANS ASSOCIATION ROUNDTABLE
SOME STOCK MARKET INDICATORS THAT MAX BE CHANGING DUE TO A CHANGING ENVIRONMENT
Participants: E - Robert Farrell, Moderator Merrill Lynch, Pierce, Fenner & Smith, Inc.
CK - Charles Kerdock - DeCordava, Cooper and Co.
JM - John Mendelson White, Weld & Co., Inc.
Js - John Schultz Brean, Murray and Co., Inc.
Recorded: October 10, 1977 Edited by: Fred Gruber, Keystone Custodian Funds, Inc.
RF: We have all noted for some time that certain technical indicators have been getting less responsive to changes in trend of the market. We might first discuss some sentiment indicators. John Mendelson, what in your opinion is going wrong with the specialist and member shorts figure, if anything? For the past year they appear to have been poles apart with.specialist reading bullish most of the time and member readings on the bearish side.
J-M: It appears to me that member and specialist shorting started K split apart around November 1976. For years there have been aberrations, but never this extreme and the debate now is which is wrong. Many suspect that member numbers are wrong, being heavily influenced by the advent of options in block trading. I have asked friends who run block desks whether something happened in their operations last year causing the greater use of options. All responded that there was no real difference. Their use of more options has been evolutionary, nothing dramatic especially relative to November 1976. I personally have been staying with the member numbers and not using the specialist shorts. I think the specialist's share of market has been dropping, meaning they are participating in trades less often, down from approximately 25% of the trades to the high teens. I don't know why they are participating less, it may be their discomfort with the stock marketor fear of Rule 390 changes.If specialists are participating less, their shorting would decrease. For the last twelve months we've had seven- teen buy signals as I count them using the specialist numbers moving under 40% as a buy signal. The market has not responded to these buy signals and that evidence supports my feelings that the specialist figures have been distorted and one should use the member firm figures. It remains to be proven when we get a market low whether members do cover or decrease their shorts significantly near the lows. I have discussed the parameters of mem- ber shorting signals with other technicians and most of us agree we are not sure of the significant levels anymore versus the classic 85-65
- 29 -

interpretation. I look for a drop in the numbers, but I am not sure where to look for a signal; however, it's not in the high 70's, low 80's readings we've been getting.
g: Does anyone else have comments about the member shorts?
CK: I believe John is right that we do have to change parameters. One of the effects of listed option trading has been the creation of syn- thetic puts whereastock is shorted and calls are bought against that short. I observe that block desks will shop for a plus tick and, therefore, the order flow that would normally go to the specialist is already pre-arranged upstairs. Block desks will do this and immediately go to the options market and buy calls. So the normal order flow is interrupted and the block posi- tioning house will put on a print on a plus tick without the specialist par- ticipating. So that's one factor in shifting to member shorts from specialist shorts. On the floor itself, I can'speak for our stocks where the book is out front. Any major option stock will have brokers intercepting order flow before it gets to the book in order to do certain things such as getting a plus tick toward synthetic puts. The put paper that is created can be carried and inventoried by a member firm at no cost with the short protected by the long call. The public or customer for the put paper pays a net price and the short is carried in member firm inventory, therefore appearing in member firm short sales. I don't know how widespread this is, but I believe it has grown considerably.
JS: If the synthetic put has the effect of inflating reported mem- ber shorts, and if you take into account that these shorts are protected by calls, one really ought to factor them out from any sentiment indicator. This probably means your speculative member shorts are lower than shown, and readjusted they might again get in line with specialist shorts.
CK: this.
It's a different problem because only a few member firms do The synthetic put has distorted all three short figures -- specialist,
member and public, and the short interest also. So we have to really guess at what parameters to use unless we can purify the shifted numbers.
JS: - As long as you can't, you might as well take the present para- meters at face value but lean them some.
And basically watch the changes.
JS: Well, if you assume that the synthetic puts are a fairly steady proportion, then your rate of change of weekly member shorts will just include that fraud, but the bottom layer should show a full speculative layer.
RF: I think the member and specialist shorts are distorted back Zen further than earlier mentioned, possibly back into early 1976, based on evidence from our studies of block volume transactions and the monitoring of spreads between upticks and downticks on block trades. Years ago as the mar- ket declined and became less liquid, the spreads on downtick blocks would grow when measured as the percentage of the spread versus the prior trade; this was due to fewer bidders each progressively less willing to bid in de- clining markets. We study the average spread on all downticks. The curious
- 30 -

thing is that since early 1976, market declines seem to have little effect on the spread on downticks. The sensitivity of that percentage spread statistic became less, which would support the idea that block houses were using some offset through the option market, The member firm ability to use options while the specialist cannot has probably distorted the total. Regardless, attempts to make adjustments may be academic if we get Rule 390 changes which obsolesce these sentiment measures by a change in market structure.
I think the SEC has said we'll get some type of statistic, Et s call it dealer shorting I . if we go into a dealer market. However, I feel the mistakes that will bi made by the upstairs firms in the early months of the new market structure will foul up the numbers so much that most of us will simply have to drop them for awhile. It's obvious that the learning curve for a dealer is rather short, and those that are around for six months will have learned the trading procedures and will develop upstairs the in- stincts of the specialist. There are going to be so many errors of judgment in the early months that our readings will be distorted there too, and we'll have to learn new parameters.
RF: Our discussion of general indicators in the sentiment area should also consider what measures of public activity show. Because of the declining percentage of volume represented by the public, we run into pro- blems also. We‘re still trying to measure a state of psychology by tradition- al standards on public short ratios, odd lot short ratios or even the short interest ratio. Charlie, with your background in odd lot activities, would you comment on odd lot shorts as to whether their traditional parameters are changing?
CK: The odd lot figures have become a complex problem with the fragmentation of the market. Most of the odd lot figures are still transacted on the Big Board, but the Third Market, Merrill Lynch, other firms and other exchanges have taken away their portions of the daily sample. In .July, 1977 only 61% of the odd lots reported in the statistical bulletin were from the daily action in NYSE odd lots. I, like others, am confused as to relating odd lot short sales. Most odd lot shorts still go to the NYSE because the Third Market and Merrill Lynch do not, I believe, have the means of shorting stock in their system. In that respect the short ratios that we see now may be biased on the upside because some of the divisor, some public sales, have been diverted from the NYSE. If that's the case, then we are running the low- est odd lot short sale ratio, adjusted, in history. I rationalize this as an offshoot of some public speculation via the options market.
3s : The option curtain has come down on us and we can't look behind the numbers.
CK: I know from watching odd lot shorts daily during my years with z odd lot house, and being able to see who did what, that odd lot shorts were used as a vehicle in professional shorting in order to avoid waiting for a plus tick on the book. Anyone now who wants to short an optionable stock may
be able to sell uncovered deep-in-the-money calls without a plus tick, or can short a round lot and hedge it with a long call. So the swings we normally saw in odd lot shorts are no longer there.
- 31 -
x3 : Y I get the same question at Merrill Lynch where we keep track or our own internal short figures so that we see all the trades that are done on the short side both on a round lot and an odd lot basis. We develop our own proprietary measures from these on a daily and weekly basis. There hasn't been much divergence, but there are fewer odd lot trades, probably due to option substitutes. We've tried to look at whether there is a pickup in put buying as a substitute for shorting, or whether there is coincidental activity. Without a breakdown on naked calls, it's hard to confirm any sus- picions. In the decline from July of this year, shorting has been relatively low with only a gradual increase in round and odd lot shorts, yet there has not been a great increase in the demand for puts throughout our system. We cannot'surmise that the action has shifted into the options market.
Js: I observe increasingly that the smaller or middle sized public speculator is just not in the market. Semi-professional, non-institutional investors are in the market, with hedge funds doing the bulk of the short selling and their bulk growing relative to the total. Their shorting doesn't show up in the odd lot figures, and their degree of option usage is obscured. Odd lot shorts have become smaller statistical samples.
c’r=: Also, similar things have occurred with the buy/sell balance. We don't get the swings we used to from the long side that used to create the signals. But the ratio of purchases to sales indicates that the cash odd lot public is still a net seller on balance. The question is, is that an accurate figure with their percentage of round lot volume being only 3%.
Js: odd lot sales sentiment, it rallies and I
Odd lots have been running a net balance of 120,000-130,000 a day. That's not a negligible figure. But as a measure of isn‘t much good these days. The ratio keeps rising quickly on get-the impression that may be a swing factor in killing rallies.
I've thought about that too. One of the things we track is the a-- . -
round lot cash account. The behavior pattern there over the years has been very much like the odd lotter, our round lotters tend to buy as the market declines and sell as it rises. Back at 1973-74 we got very big buy balances. That can reflect as much the absence of selling as it might reflect enthus- iastic buying. Nevertheless, our weekly and monthly figures show record buy balances at the 1974 lows. So we should expect buying at any good bottom next time around. So far there has been very big selling on any rallies and in 1977 we've seen cash account round lot individuals sell and liquidate whether the market declined or rallied. Up to now we haven't had a monthly buy balance except for January, 1977, and that probably has a seasonal bias to it. I went back and studied odd lots on a monthly basis looking at major declines bhere there had been big buying at the bottom. One example
was 1920-1921, and even in 1931-32 there was a big buying bulge although it lessened at the bottom in 19~32. Then I looked at market behavior on the rallies after those lows, and the next significant reactions after those rallies. In 1923 there were two reactions that amounted to over 20%, in 1933 and 1934 there were t-Jo reactions that were around 25-30%. Those were sizeable reactions but not necessarily what would be classified as new bear markets, they didn't last long enough. In both of those periods the amount of buying by the public during the reaction phase was fairly brief and much less than at the major bottom washed-out low. The public became a big seller when the market came out of those corrections and into a new bull market in
- 32 -
1924 or 1935. Ultimately they switched around to the buy side. The conclu- sion I came to relative to today's market is that we might have a condition- ing process here that is keeping the public from going to the buy side to the degree they have in the recent past, however the historic examples sug- gest they will come back to the buy side, but we don't know by what amount.
JS: Factor in shrinking public participation, so at the next low we'll get a less extreme number than when the public was more active in the market. With public activity declining, we just don't know where the para- meters are going to be.
g: I'll give you the data on the monthly balance index for the last few major market lows. In June 1962 it was 81.6, that's eight shares sold for every ten bought. The 1966 low was 72.2. The 1970 low was 76.7. In 1974 the low was 100.8, odd lotters never swung to the buy side in any month. So we can see in the last two bear markets the parameters shifted upwards. We have to assume now that odd lot figures are statistically accurate, they are now less than a 3 percent sample of NYSE volume, whereas they were 10 to 15 percent in prior bear markets.
RF: - We have the problem not only of deciding if this is still worth measuring, but also deciphering what part of the change is environmental and sort of permanent and what is a normal reaction to changeable historical events.
CK: tirement,
I believe the institutionalization of public goals, namely re- has taken a great deal away from the odd lot figures. Whereas in
earlier years the individual would have a portfolio of perhaps a small number of shares of various companies, his institutional benefactor now often does that for him. The absence of this individual reflects in the odd lot buy bal- ance, and we're not likely to get the same extremes. So I believe the only way we can analyze odd lot figures is to watch their trends, not look for parameters. So far in this market we haven't had the trend toward the buy side that nor- mally accompanies a declining market. I really can't say what it means.
Js: You have the opposite, and by the old standards you could feel encouraged because the trend of the odd lot ratio has been up while the Dow has declined.
CK: - I disagree with the old concept.
Js: Bear in mind that you really have two markets today. If you plot the odd lot ratio against spread you get a different correlation and that's where I think it belongs.
g: I can't argue with it.
RF: It's probably true in many things we look at that they have been influenced by a split in the market between the institutional activity and the broad range non-institutional activity, making it very hard to generalize.
JS: As far as New York statistics go, this divergence between breadth and the averages.
I can find no precedent for
- 33 -

$Zld War II I think it happened twice, during the 1930's and just around
.
JS: Not to this extent. There have been periods where breadth out- ran a strong Dow in the 30's and 40's. But this time breadth has risen for nine months, with the DJIA flat to down. We've had divergence like this for brief periods historically, but not this extended.
RF: This has some probable effects on the figures we're looking at.
Js: For example, why isn't there a selling climax?
CK: The public is not there to create one.
Js: The public isn't suffering in the divergence.
JM: I don't think we need see a selling climax again.
CK: tional climax.
The last one we had was in August 1974, and it was an institu-
JS: If we get the unweighted averages or the daily or weekly advance/ decline line into an intermediate downtrend there might be a selling climax of breadth.
RF: We planned to discuss institutional sentiment, and we might do that before dealing further with breadth,or price and volume measures. We've traditionally found most sentiment data available on both professional and public sectors. Today we have a different public since the institutions account for the majority of trades. We have a problem measuring when the in- stitutional investor is overbought or when he has gone to the other overly bearish extreme. We've used the mutual fund figures on cash as a percentage of assets since those were readily available. In the last few years with heavy net redemptions in funds its been more difficult to analyze those figures, particularly when the best combination that occurred in the past was when there was a rising cash figure in absolute and relative terms generated by net sales of common stocks. We had that at 1970 and some prior lows, but we have a dif- ferent situation now. Mutual funds have been net sellers for a long while this time. So we are faced with the question, are there alternatives for measuring the degree of bearishness, or of liquid buying power that institutions build up, outside of data such as SEC or flow of funds statistics which are reported with quite a time lag? Do you have any thoughts, other than talking to every institutional money manager you know?
Js: Read the Monday column in the Wall Street Journal.
JM: tions.
Bob, I don't place any stock at all in estimating cash posi- Not to be overly cynical, but its been my experience that the prime
determination of the number you get is what happened the week before the per- son was asked the question, and the cash level response varies inversely with the latest move in the market. In measuring sentiment I take the viewpoint that the institution is the market, and I extensively study volume and its rate of change or acceleration, that is how fast they want to get out. It has
- 34 -

nothing to do with total volume, just the rate of momentum in total volume. I doubt if we'll ever see another selling climax, defined as thirty million shares or more. You just cannot manufacture the buyer--the public won't do it, and I believe the block houses won't either. I don't believe we had a selling climax in 1974 in the old classic definition of a 'nigh volume de- cline. I just try to pick up the acceleration or deceleration of volume trends.
R& How do you deal with the problem of the growing amount of volume accounted for by arbitrage transactions, either from the options mar- ket or connected with takeovers?
J-M: It's a problem. You mention arbitrage, one of our topics is the short interest and the short interest ratio, which I don't use at all for the very reason that short interest is so involved with arbitrageurs and it's very hard to figure out where they are locked in.
Js: I personally can't add much here, I'm trying to use few indi- cators simply because I don't know what to rely on these days. That's our whole discussion subject. Perhaps the remedy is in getting away from numbers and trying to recognize if there is a different structure to the market. In this transitional market, where we are still wallowing in the aftermath of the worst bear market in 40 years,we say end preversing previous concepts instead of dropping them. We may have a transition from an institutionally led market to a bull market lead by something else; we may get the public back if we get tax reform to their advantage.
g: A change in the tax structure may hasten the growth in confidence In stocks as an alternative investment. Other transition may come from a re- structuring of the marketplace to dealer markets which will also affect our in- dicators.
Js: We started talking about institutional liquidity. To me cash numbers are completely meaningless because there is an enormous reservoir of liquidity in institutional bond portfolios. A small shift in the bond percent- age could throw enormous amounts of money into stocks; again, it's a sentiment situation. I think if dividends become practically the only tax shelter left, then institutions will probably recognize that they've got to buy the stocks the public will buy, and sell bonds before the public sells them.
JM: Another thing that I find misleading about cash is that I sense there is an awful lot of institutional money parked in utilities where there is a better yield than Treasury bills. Intellectually that may be a cash equivalent, but how does one measure it?
g: We do a cash survey. The value in that is to look for change. There is some indication of trend that develops from quarter to quarter in what institutions say they are doing in dividing their assets between equity and debt, but there are not likely to be any finite parameters we can deal with as to cash levels. This is another case where rate of cnange becomes the important factor.
Js: When you ask for cash percentages, is that percent of the total portfolio or on the equity alone?
- 35 -
RI!?:
assets, It's on the equity portion. Regarding parking of reserve
we also suspect it's the motive behind some long term Treasury bond positions and wonder how long it will be there. Another aspect, on rate of change studies in volume, I would consider the block figures and a widen- ing in spreads on downtick blocks an important sign of institutions more urgently seeking higher cash levels. That can only be measured in terms of a sense of change rather than some definite level or parameters. I think that's where we run into the problem with so many of the indicators today. We tend to look for a formula model to interpret turning points. I do not believe this is a period where models can be relied on, if they were ever reliable.
JS: We keep getting back to my basic theme. breadth analysis.
Take for example, It worked like a charm for decades as long as you were in
a primarily p,ublic market. Once the market shifted towards institutions the parameters tended to change. Now that the speculative public is not active, it looks different still. Basically, I think you make a mistake if you underestimate the stake the public has in the stock market. I think statis- tically the non-institutional investor owns the greater percentage of stocks. Right now I can‘t see the kind of panic in public sentiment we used to look for because the public stocks are not being bartered.
RF: Gentlemen, I think we can certainly conclude from all we’ve discussed that we can't take a mechanical interpretation from our indicators; they should be used to measure the changing flows of supply and demand in the market. Some are being distorted by new ingredients. We don't have hard and fast numbers, but we can try to get better insights into the changing environment we're in through more statistical information. Thank you all.
- 36 -

PSYCHOLOGY AND THE STOCK MARKET
by David Dreman
Published by: AMACON
Reviewed by William DiIanni, V.P. Wellington Management Co.
Every once in a while a book comes along that examines the investment problems of the day against the kaleidoscopic backdrop of the past with astonishing flair and clarity. In attempting to analyze the perennial dif- ficulties of the investment process, Mr. David Dreman draws liberally from the annals of history in the true Santayanian form. In some respects this is a book about many books but with one central idea.
Throughout this historical trek one becomes reacquainted with such periods as the South Sea Bubble, Tulipmania, and 1929. "Each wave of specu- lation has its own new concepts or images," as Gustave Le Bon or Charles Mackay would put it. Dreman's scholarly comparisons with recent modern manias leave nothing to the imagination.
Expanding on the symptons of psychological crowds, the author brilliantly discusses the evolution of "GROUPTHINK" and the disastrous consequences this phenomenon produced in the marketplace. "The abandonment of past standards and excessive risk taking are forms of temporary derangement, which may also often affect groups of decision-making executives."
Marshall McLuhan's Global Village, where almost nothing of any importance occurs without everyone very quickly being apprised of it (Efficient Market Hypothesis), and the poisonous pressures of the competitive institutional environment are some of the things that produced the new "image" and the fabled two-tier market. "When the bubble bursts ..*an almost inevitable reaction sets in, and the crowd becomes as extreme in its panic as it has been in its euphoria." The unfortunate performance results of various periods are well-tabulated...almost ad nauseum and certainly to embarrassment.
Many theories and methodologies such as Random Walk, Efficient Market, Technical Analysis, Fundamental Analysis, and so on are taken to task. As the title suggests, the author focuses on the psychological variables in the investment formula. "To be of value to the investor, a practical stock market approach must factor into the formula the behavioral and interpretational obstacles we have discussed." In that sentence is the message of the book.
The formula suggested is D = f (VIP) where: "The price of a security (D) is a function (f) of actual value (V), the interpretation of information (1) 3 and the investor's current psychological state (P)." The interacting variables I and P can very often be the "dominant influence on price."
- 37 -.

Market technicians will take heart. They havemalways (1) suggested that "value" is the last sale in a continuum, (2) believed that psychology has an enormous impact on a variety of investment vehicles and various market trends, and (3) devised principles and indicators in an attempt to measure these sometimes very profitable extremes in psychological oscillations. The higher the extremes of optimism, the more likely the extremes of pessimism...a familiar pendulum.
Further the author states: "In determining a value by intrinsic formu- las, the investor may be heavily influenced by subjective factors that creep into the assumptions without his being aware of them. He can thus very often mislead himself into believing that his decision is reached on the basis of 'the facts,' when in reality his choice of assumptions has predetermined what the facts will be."
Further he avers: "Because neither professionals nor academics usually place much emphasis on the I and P variables, I believe there is a far greater opportunity to outperform the market than is generally acknowledged. To understand this more clearly, we must look carefully at what occurs when a 'factual' estimate proves incorrect."
But isn't this basically what every professional market analyst has been saying all along? Isn't it another case of: "The more things change, the more they remain the same" and all that? Fortunately, human nature does not change. At least some things are constant in an ever changing world. Oscil- lations between fear and greed have occurred since the beginning of man with all its attendant rationalizatioas and built-in destructive forces. It was Bernard Baruch who said: "The market is people in action, acting like peo- ple." And _the examples and historical parallels in this book amply demon- strate this dictum.
Later the author finally concedes some pluses for market timing when he says: "Market timing, the attempt to forecast market movements in order to buy or sell stocks more advantageously, is appealing to many investors. If successfully implemented, it can greatly enhance investment results, but it is difficult to practice and introduces a much higher element of risk." Critics are strangely reluctant to admit that technical studies can enhance results. Certainly, some subjective interpretation and expertise are needed, as in any endeavor. And are risks really higher? Obviously, better results are always desirable, even if one does have to work at it. The need for astute. and accurate interpretation refuses to relegate rational man to that non-psychological black-box. And as for risk, it has always commanded a higher premium; at least that is what some theories from academia stipulate.
'ðer a contrarian, a technically-minded investor, a serious market student, or citizen of the world, this book is recommended reading. It embodies a great deal of information gleaned from the recorded pages of history, valuable statistics, and interesting methods of operations which enhance the role of technical analysis. What can better detect the potential violent shifts of crowd psychology than the study of supply-demand ratios emanating from the action of the market itself?
In sum, the book states what most of us know and, too often, forget.
- 38 -
Related Documents


