Professionals Managing Market Risk • Incorporated in 1973 ® TECHNICAL JOURNAL ANALYSIS of of 2006 • ISSUE 64

Journal of Technical Analysis (JOTA). Issue 64 (2006)
Aug 08, 2015
Welcome message from author
This document is posted to help you gain knowledge. Please leave a comment to let me know what you think about it! Share it to your friends and learn new things together.
Transcript

74 Main Street • Woodbridge, NJ 07095 • 732/596-9399 • www.mta.org Professionals Managing Market Risk • Incorporated in 1973
®Professionals Managing Market Risk • Incorporated in 1973
®
TECHNICALJOURNAL
ANALYSISofof
2006 • ISSUE 64

1JOURNAL of Technical Analysis • 2006, Issue 64
JOURNAL of Technical Analysis 2006 Issue 64
Table of Contents
Journal Editor & Reviewers 3
Volatility Bands With Predictive Validity 7Dimitris N. Politis, Ph.D
Global Squawk Box - 12Evaluating Internet Financial Message Board Traffi c as a Technical Indicator
Manuel Amunategui, CMT
Scientifi c Frontiers and Technical Analysis 20Kevin P. Hanley, CMT
Window of Opportunity? 33Evidence for the existence of a predictable and exploitable infl uence uponchart patterns arising from disparities in capital gain taxation
Jerome F. Hartl, CMT
Exploring the Boundary of Trading and Investing: 36Application of P&F Patterns to Mutual Fund Time Series Data
Gabor Varga, CMT
The Organization of the Market Technicians Association, Inc. 44
12
3
4
5

JOURNAL of Technical Analysis • 2006, Issue 642

3JOURNAL of Technical Analysis • 2006, Issue 64
EditorCharles D. Kirkpatrick II, CMT
Kirkpatrick & Company, Inc.Bayfi eld, Colorado
Associate EditorMichael Carr, CMTCheyenne, Wyoming
JOURNAL of Technical Analysis is published by the Market Technicians Association, Inc., (MTA) 74 Main Street, 3rd Floor, Woodbridge, NJ 07095. Its purpose is to promote the investigation and analysis of the price and volume activities of the world’s fi nancial markets. JOURNAL of Technical Analysis is distributed to individuals (both academic and practitioner) and libraries in the United States, Canada and several other countries in Europe and Asia. JOURNAL of Technical Analysis is copyrighted by the Market Technicians Association and registered with the Library of Congress. All rights are reserved.
Production Coordinator
Timothy LicitraMarketing Services Coordinator
Market Technicians Association, Inc.
Publisher
Market Technicians Association, Inc.74 Main Street, 3rd Floor
Woodbridge, New Jersey 07095
Journal Editor & Reviewers
Connie Brown, CMTAerodynamic Investments Inc.
Pawley’s Island, South Carolina
Julie Dahlquist, Ph.D.University of TexasSan Antonio, Texas
J. Ronald Davis, CMTGolum Investors, Inc.
Portland, Oregon
Cynthia Kase, CMTKase and Company
Albuquerque, New Mexico
Philip J. McDonnellSammamish, Washington
Michael J. Moody, CMTDorsey, Wright & Associates
Pasadena, California
Kenneth G. Tower, CMTCyberTrader, Inc.
Princeton, New Jersey
Manuscript Reviewers

JOURNAL of Technical Analysis • 2006, Issue 644
1. All submitted manuscripts must be original work that is not under submission at another journal or under consideration for publication in another form, such as a monograph or chapter of a book. Authors of submitted papers are obligated not to submit their paper for publication elsewhere until the Journal of Technical Analysis renders an editorial decision on their submission. Further, authors of accepted papers are prohibited from publishing the results in other publications that appear before the paper is published in the Journal of Technical Analysis, unless they receive approval for doing so from the editor. Upon acceptance of the paper for publication, we maintain the right to make minor revisions or to return the manuscript to the author for major revisions.
2. Authors must submit papers electronically in Word (*.doc) format with figures (charts) in *.jpg or *.bmp format to the editor, Charles D. Kirkpatrick, ([email protected]). Manuscripts must be clearly typed with double spacing. The pitch must not exceed 12 characters per inch, and the character height must be at least 10 points.
3. The cover page shall contain the title of the paper and an abstract of not more than 100 words. The title page should not include the names of the authors, their affiliations, or any other identifying information. That information plus a short biography including educational background, professional background, special designations such as Ph.D., CMT, CFA, etc., and present position and title must be submitted on a separate page.
4. An acknowledgement footnote should not be included on the paper but should also be submitted on a separate page.
5. The introductory section must have no heading or number. Subsequent headings should be given Roman numerals. Subsection headings should be lettered A, B, C, etc.
6. The article should end with a non-technical summary statement of the main conclusions. Lengthy mathematical proofs and very extensive detailed tables or charts should be placed in an appendix or omitted entirely. The author should make every effort to explain the meaning of mathematical proofs.
7. Footnotes: Footnotes in the text must be number consecutively and typed on a separate page, double-spaced, following the reference section. Footnotes to tables must also be double-spaced and typed on the bottom of the page with the table.
8. Tables: Tables must be numbered with Roman numerals. Please check that your text contains a reference to each table. Indicate with a notation inserted in the text appropriately where each table should be placed. Type each table on a separate page at the end of the paper. Tables must be self-contained, in the sense that the reader must be able to understand them without going back to the text of the paper. Each table must have a title followed by a descriptive legend. Authors must check tables to be sure that the title, column headings, captions, etc. are clear and to the point.
9. Figures: Figures must be numbered with Arabic numerals. All figure captions must be typed in double space on a separate sheet following the footnotes. A fi gure’s title should be part of the caption. Figures must
Submission and Style Instructions
be self-contained. Each fi gure must have a title followed by a descriptive legend. Final fi gures for accepted papers must be submitted as either *.jpg or *.bmp fi les.
10. Equations: All but very short mathematical expressions should be displayed on a separate line and centered. Equations must be numbered consecutively on the right margin, using Arabic numerals in parentheses. Use Greek letters only when necessary. Do not use a dot over a variable to denote time derivative; only D operator notations are acceptable.
11. References: References to publications in the text should appear as follows: “Jensen and Meckling (1976) report that ….” References must be typed on a separate page, double-spaced, in alphabetical order by the leading author’s last name. At the end of the manuscript (before tables and fi gures), the complete list of references should be listed in the formats that follow:
For monographs or books: Fama, Eugene F., and Merton H. Miller, 1972, The Theory of Finance (Dryden Press, Hindsdale, IL)
For contributions to major works: Grossman, Sanford J., and Oliver D. Hart, 1982, Corporate fi nancial structure and managerial incentives, in John J. McCall, ed.: The Economics of Information and Uncertainty (University of Chicago Press, Chicago, IL).
For Periodicals: Jensen, Michael C., and William H. Meckling, 1976, Theory of the fi rm: Managerial behavior, agency costs and ownership structure, Journal of Financial Economics 3, 305-360.
Please note where words are CAPITALIZED, italics are used, (parentheses) are used, order of wording, and the position of names and their order.

5JOURNAL of Technical Analysis • 2006, Issue 64
Letter from the Editor
In the past month or so, the MTA Board, after considerable harassment from yours truly, reinstated the research paper as a way of passing the CMT III requirement in place of taking the CMT III exam. The rules are a little different but no more diffi cult than before. In the past, the reviewing and correcting of papers had been somewhat disorganized, causing many delays and many light assessments of papers. This, of course, translated into less enthusiasm on the part of CMT III candidates wishing to write a paper. The quantity of papers declined. This should change. Journal Manuscript Reviewers will now do the review of papers, and incentives have been built into the process to encourage timely and substantive reviews. I hope that the new procedure will encourage many CMT III candidates to perform and report on their technical analysis research.
Another source of potential papers for the Journal in the coming year is the Dow Award, which now has a monetary award of $2,000 for the winner. This cash prize and some wider promotion should attract some high level research. The Journal Committee certainly looks forward to this potentially new source of technical research. Details of the competition are described below.
The current issue contains a number of excellent CMT III papers approved over the past year. Manuel Amunatequi, CMT, discusses the frequency of message board postings as a sentiment indicator; Kevin Hanley, CMT, writes a comprehensive discussion of the philosophy behind technical analysis; Jerome Hartl, CMT, introduces a novel concept of using long-term tax dates as an infl uence on certain chart patterns; A. J. Monte, CMT, uses option open interest fi gures to establish trading price objectives; Gabor Varga, CMT, combines point-and-fi gure charting with mutual fund data; and Professor Dimitris Politis advances a new method of calculating Bollinger Bands.
Charles D. Kirkpatrick II, CMT, Editor
2007 CHARLES H. DOW AWARD
Since 1994 the Market Technicians Association, Inc. has sponsored the Charles H. Dow Award for excellence and creativity in technical analysis. All persons with an interest in technical analysis are invited to submit a paper for the 2007 Dow Award not later than February 28, 2007.
Robust research of a substantive topic and superior writing leading to useful conclusions are sought.
The winning author will receive a cash prize of $2,000.00 and will be invited to discuss the paper at a national Association seminar or at a monthly meeting of a regional chapter.
The Guidelines are available at www.mta.org under Activities.
®

JOURNAL of Technical Analysis • 2006, Issue 646

7JOURNAL of Technical Analysis • 2006, Issue 64
AbstractThe issue of volatility bands is re-visited. It is shown how the rolling geo-
metric mean of a price series can serve as the centerline of a novel set of bands that enjoy a number of favorable properties including predictive validity.
IntroductionConsider fi nancial time series data P1, . . . , Pn corresponding to recordings
of a stock index, stock price, foreign exchange rate, etc.; the recordings may be daily, weekly, or calculated at different (discrete) intervals. Also consider the associated percentage returns X1, . . . , Xn. As is well known, we have:
the approximation being due to a Taylor expansion under the assumption that Xt is small; here log denotes the natural logarithm.
Eq. (1) shows how/why the logarithm of a price series, i.e., the series Lt := log Pt, enters as a quantity of interest. Bachelier’s (1900) original implication was that the series Lt is a Gaussian random walk, i.e., Brownian motion. Under his simplifi ed setting, the returns {Xt} are (approximately) independent and identically distributed (i.i.d.) random variables with Gaus-sian N(0, σ2) distribution.
Of course, a lot of water has fl owed under the bridge since Bachelier’s pioneering work. The independence of returns was challenged fi rst by Man-delbrot (1963) who pointed out the phenomenon of ‘volatility clustering’. Then, the Gaussian hypothesis was challenged in the 1960s by Fama (1963) who noticed that the distribution of returns seemed to have fatter tails than the normal. Engle’s (1982) ARCH models attempt to capture both of the above two phenomena; see Bollerslev et al. (1992) and Shephard (1996) for a review of ARCH/GARCH models and their application. More recently, Politis (2003, 2004, 2006) has developed a model-free alternative to ARCH/GARCH models based on the notion of normalizing transformations that we will fi nd useful in this paper.
On top of an ARCH-like structure, the working assumption for many fi nancial analysts at the moment is that the returns {Xt} are locally stationary, i.e., approximately stationary when only a small time-window is considered, and approximately uncorrelated. As far as the fi rst two moments are concerned, this local stationarity can be summarized as:1
Here E and Var denote expectation and variance respectively. Letting Cov denote covariance, the approximate uncorrelatedness can be described by:
Note, that since Xt = Lt − Lt−1, the condition EXt 0 of eq. (2)is equivalent to
Thus, the mean of Lt and the variance of Xt can be thought to be approxi-mately constant within the extent of a small time-window.
A simple way to deal with the slowly changing mean μt is the popular Mov-ing Average employed in fi nancial analysis to capture trends. Furthermore, the notion of volatility bands (Bollinger bands) has been found useful in applied work. It is important to note, though, that the usual volatility bands do not have predictive validity; see e.g. Bollinger (2001). Similarly, no claim can be made that a desired percentage of points fall within the Bollinger bands.
Nevertheless, it is not diffi cult to construct volatility bands that do have predictive validity, i.e., prescribe a range of values that—with high prob-ability—will ‘cover’ the future price value Pn+1. We construct such predictive bands in the paper at hand; see eq. (22) in what follows. To do this, the notion of a geometric mean moving average will turn out very useful.
Before proceeding, however, let us briefl y discuss the notion of predic-tive intervals. The issue is to predict the future price Pn+1 on the basis of the observed data P1, . . . , Pn. Denote by P̂n+1 our predictor; this is a ‘point’ predictor in the sense that it is a point on the real line. Nevertheless, with data on a continuous scale, it is a mathematical certainty that this point predic-tor—however constructed—will result in some error.
So we may defi ne the prediction error wn+1 = Pn+1 − P̂n+1 and study its statistical properties. For example, a good predictor will result into Ewn+1 = 0 and Var(wn+1) that is small. The statistical quantifi cation of the prediction error may allow the practitioner to put a ‘margin-of-error’ around the point predictor, i.e., to construct a ‘predictive interval’ with a desired coverage level.
The notion of ‘predictive interval’ is analogous to the notion of ‘confi dence interval’ in parameter estimation. The defi nition goes as follows: a predictive interval for Pn+1 is an interval of the type [A,B] where A,B are functions of the data P1, . . . , Pn. The probability that the future price Pn+1 is actually found to lie in the predictive interval [A,B] is called the interval’s coverage level.
The coverage level is usually denoted by (1 − α)100% where α is chosen by the practitioner; choosing α = 0.05 results into the popular 95% coverage level. The limits A,B must be carefully selected so that a prescribed coverage level, e.g. 95%, is indeed achieved (at least approximately) in practice; see e.g. Geisser (1993) for more details on predictive distributions and intervals.
I. Smoothing and PredictionUnder eq. (2)–(4) and given our data L1, . . . , Ln, a simple nonparametric
estimator of μn+1 is given by a general Moving Average2 in the log-pricedo-main, i.e., by
where q is the length of the Moving Average window, and θk some weights
Volatility Bands With Predictive Validity
Dimitris N. Politis, Ph.D 1
1The approximate constancy of the (unconditional) variance in eq. (2) does not contradict the possible presence of the conditional heteroscedasticity (ARCH) phenomenon and volatility clustering.
2Here, and throughout the paper, all Moving Averages will be predictive in nature, i.e., only use present and past data.
(1)
(2)
(3)
(4)
(5)
JOURNAL of Technical Analysis • 2006, Issue 648
that sum to one, i.e., The simplest choice is letting θk = 1/q for all k, i.e., equal weights, but other weights are also possible e.g. exponential smoothing weights. Choosing q is of course a diffi cult problem and involves the usual tug-of-war: q should be small so that local stationarity holds for Ln−q+1, . . . , Ln but q should be large as well so that the averaging effect is successful.
To get a prediction interval for the next observation Ln+1, an expression for the variance of the prediction error: Ln+1 − MALn,θ,q is required. It is easy to calculate that:
where
For any given chosen set of weights θk, k = 0, 1, . . . , q − 1, equations (6), (7), (8) and (9) give an expression for the desired quantity σ2
pred,q. The n’s cancel out in the fi nal expression so the starting point of the series is immaterial. To simplify this expression, let us now—and for the remainder of the paper—focus on the simple Moving Average with equal weights θk = 1/q, i.e.,
In this case, eq. (8) and (9) give:
Putting it all together, we have the following formula for the prediction error variance:
Note that σ2 is unknown in the above and must be estimated from data; to this end, we propose using the sample variance of the last Q returns, i.e., let
Estimating σ2pred,q
we are led to the approximately standardized3 ratio
Recall that Bachelier (1900) postulated that Lt is Gaussian. As mentioned in the beginning of the paper, this belief does not hold any more. However, with Q properly chosen, it has recently been shown by Politis (2003, 2006) that the ratio of eq. (16) has an approximately standard normal distribution.
II. Geometric vs. Arithmetic meanLet z(α) denote the α–quantile of the standard normal distribution, i.e., z(α)
is such that the region ±z(α/2) captures probability equal to 1 − α. Then, the standard normal approximation for the ratio of eq. (16) implies that
is an (approximate) (1−α)100% prediction interval for the unobserved value Ln+1. A typical value for α is 0.05, i.e., 95% prediction intervals, with corresponding quantile z(α/2) = z(0.025) = 1.96.
Let A = z(α/2)σ̂pred,q as a short-hand. The above prediction interval has the interpretation that the event
occurs with probability 1 − α. Exponentiating both sides of eq. (18) the inequalities are preserved; it follows that the event
occurs with probability 1−α, i.e., a (1−α)100% prediction interval for the unobserved (un-logged) price Pn+1. Finally, note that
which is nothing other than the geometric mean of the values Pn−q+1, . . . , Pn.Let us denote the geometric mean by
Then, our proposed (1 − α)100% prediction interval for Pn+1 is given by
i.e., it is an interval centered around the geometric mean GMPn,q; the latter also serves as the point predictor of Pn+1 given our data. Note that this is an asymmetric interval due to the nonlinearity of the exponential function, and also because the upper and lower bounds are given in a multiplicative way in connection with the center value.
We conclude this section with a step-by-step algorithm for the construction of the predictive interval.
ALGORITHM FOR THE CONSTRUCTION OF PREDICTIVE INTERVAL (22):1. Decide on the desired coverage level, i.e., choose α; a typical choice
is α = 0.05.2. Look up z(α/2) from a table on the standard normal distribution; for
example, α = 0.05 yields z(α/2) = 1.96.3. Choose values for q and Q; see Section IV for a discussion on this issue.4. Compute σ̂2 from eq. (14), and σ̂2 pred,q from eq. (15).5. Compute the geometric mean GMPn,q from eq. (21).6. Compute the left and right limits of the (1−α)100% predictive interval
as GMPn,q · exp(−z(α/2) σ̂pred,q) and GMPn,q · exp(z(α/2) σ̂pred,q) respectively.
(6)
(7)
(8)
(9)
(10)
3A random variable W is called ‘standardized’ if it has mean zero and variance one.
(11)
(12)
(13)
(14)
(15)
(16)
(17)
(18)
(19)
(20)
(21)
(22)
9JOURNAL of Technical Analysis • 2006, Issue 64
III. An IllustrationThe predictive interval (22) can be computed for n as small as the max(q,Q)
and as large as N (the end of our data set), thus providing a set of volatility bands that can be used in the same way that Bollinger bands are used. By contrast to Bollinger bands, however, the predictive bands will contain approximately(1 − α)100% of the data points. Furthermore, letting n = N, is apparent that the predictive bands (22) extend to the future of our data set, yielding a predictive interval for the value that is one-step-ahead, i.e., PN+1.
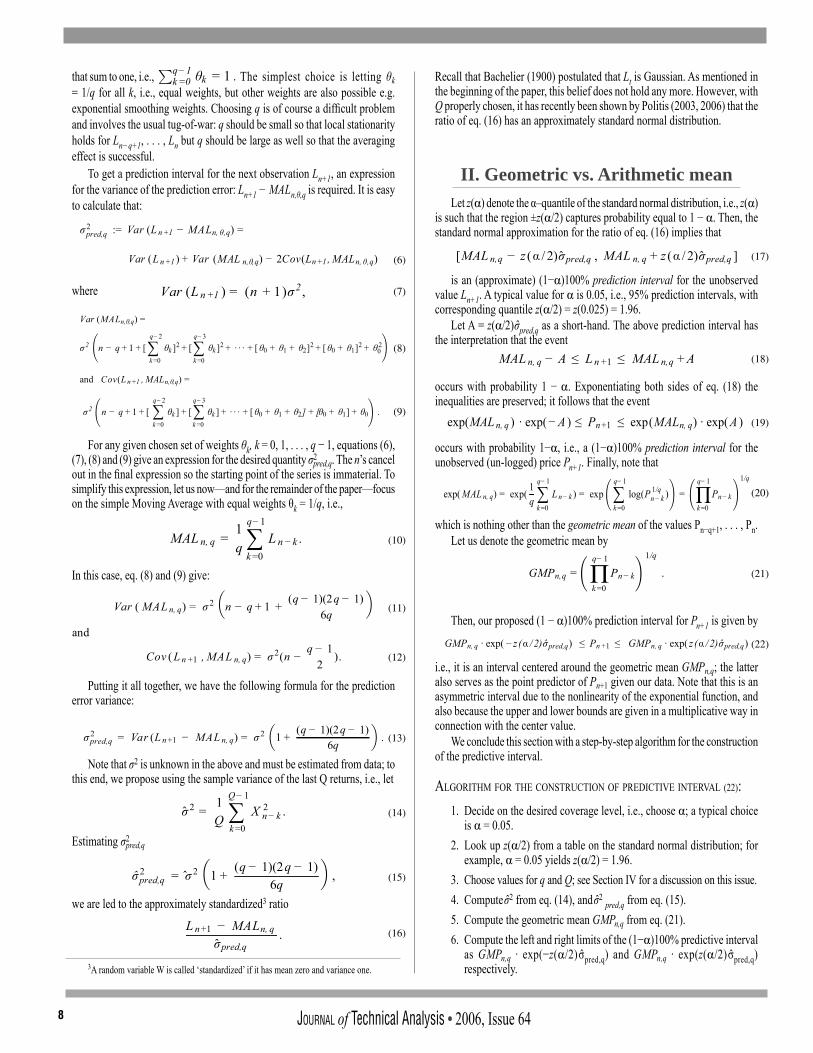
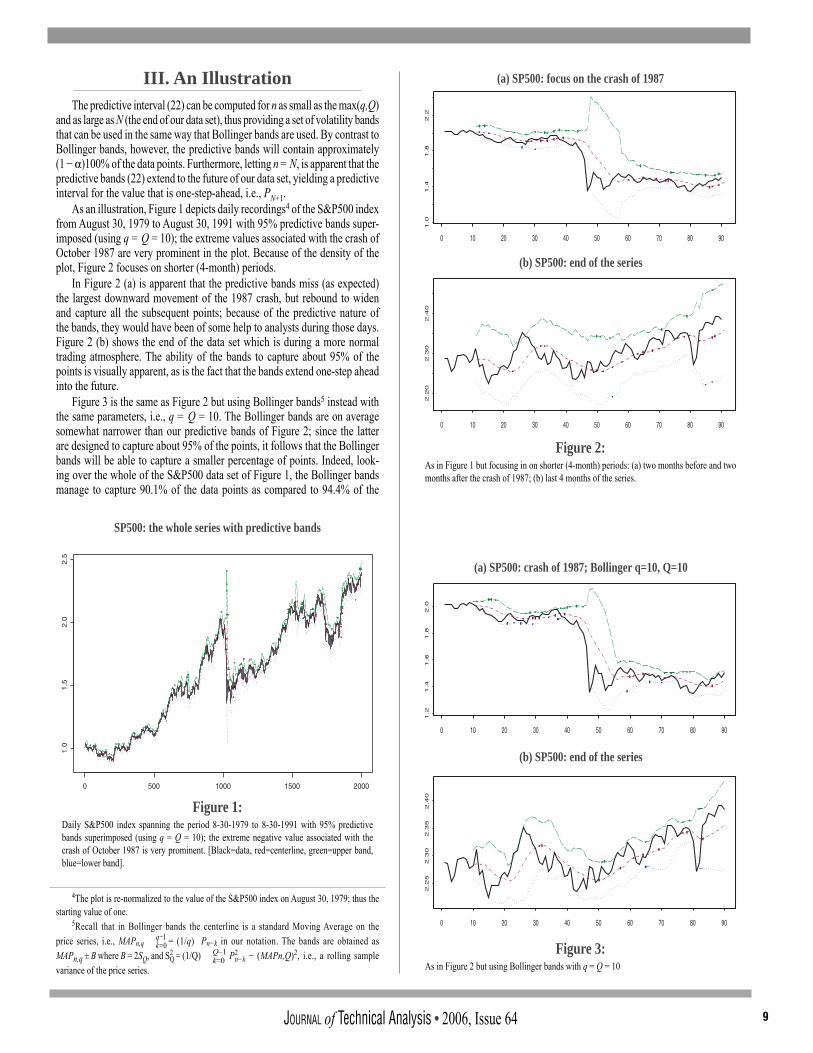
As an illustration, Figure 1 depicts daily recordings4 of the S&P500 index from August 30, 1979 to August 30, 1991 with 95% predictive bands super-imposed (using q = Q = 10); the extreme values associated with the crash of October 1987 are very prominent in the plot. Because of the density of the plot, Figure 2 focuses on shorter (4-month) periods.
In Figure 2 (a) is apparent that the predictive bands miss (as expected) the largest downward movement of the 1987 crash, but rebound to widen and capture all the subsequent points; because of the predictive nature of the bands, they would have been of some help to analysts during those days. Figure 2 (b) shows the end of the data set which is during a more normal trading atmosphere. The ability of the bands to capture about 95% of the points is visually apparent, as is the fact that the bands extend one-step ahead into the future.
Figure 3 is the same as Figure 2 but using Bollinger bands5 instead with the same parameters, i.e., q = Q = 10. The Bollinger bands are on average somewhat narrower than our predictive bands of Figure 2; since the latter are designed to capture about 95% of the points, it follows that the Bollinger bands will be able to capture a smaller percentage of points. Indeed, look-ing over the whole of the S&P500 data set of Figure 1, the Bollinger bands manage to capture 90.1% of the data points as compared to 94.4% of the
4The plot is re-normalized to the value of the S&P500 index on August 30, 1979; thus the starting value of one.
5Recall that in Bollinger bands the centerline is a standard Moving Average on the price series, i.e., MAPn,q = (1/q) Pn−k in our notation. The bands are obtained asMAPn,q ± B where B = 2SQ, and S2
Q = (1/Q) P2n−k − (MAPn,Q)2, i.e., a rolling sample
variance of the price series.
Q–1k=0
Figure 1:Daily S&P500 index spanning the period 8-30-1979 to 8-30-1991 with 95% predictive bands superimposed (using q = Q = 10); the extreme negative value associated with the crash of October 1987 is very prominent. [Black=data, red=centerline, green=upper band, blue=lower band].
SP500: the whole series with predictive bands
(a) SP500: focus on the crash of 1987
(b) SP500: end of the series
Figure 2:As in Figure 1 but focusing in on shorter (4-month) periods: (a) two months before and two months after the crash of 1987; (b) last 4 months of the series.
(a) SP500: crash of 1987; Bollinger q=10, Q=10
Figure 3:As in Figure 2 but using Bollinger bands with q = Q = 10
(b) SP500: end of the series
JOURNAL of Technical Analysis • 2006, Issue 6410
predictive bands.Note that bands that are narrower than they should be may lead to incor-
rect decision-making. Furthermore, is it apparent that the geometric mean (centerline of Figure 2) tracks (actually: predicts) the data much better than the arithmetic mean (centerline of Figure 3). In addition, the width of Bol-linger bands appears to vary with no cause in sight; for example, the Bollinger bands start shrinking just before the crash of 1987 which must have been quite misleading at the time. Lastly, note that Bollinger bands are not predictive in nature, i.e., do not give a prediction interval for the one-step-ahead observation as our predictive bands do.
Similar comments apply to Bollinger bands using q = Q = 20 as Bollinger (2001) recommends; see Figure 4 for an illustration. The q = Q = 20 Bol-linger bands manage to capture only 87% of the points of the S&P500 data set; in general, as either q or Q increases, the coverage of Bollinger bands decreases/deteriorates.
IV. Remarks on Usage and PerformanceTo implement the predictive bands, the parameters q and Q must be
chosen, i.e., the window size of the Moving Average for the centerline, and the window size for the rolling estimate of variance. As mentioned before, choosing q involves a diffi cult trade-off of bias and variance, and is best left to the practitioner; for details on optimally choice of a smoothing parameter see Wand and Jones (1994), Hart (1997), or Fan and Yao (2005) and the references therein. Note though that on top of the usual bias-variance trade-off in obtaining a good point predictor, some consideration on the width of the prediction interval is also in order. The interval’s width increases in length as q increases. To see this, note that σ̂2
pred,q is an increasing function of q; as a matter of fact, σ̂2
pred,q is asymptotic to a linear function of q, i.e.,σ̂2
pred,q σ̂2(1/2 + q/3) for large q.Tables I and II show the practical effect of choice of the parameters q
and Q on the properties, i.e., width and empirical coverage level, of our 95% predictive bands. In particular, Table I shows the empirically found widths of the 95% predictive bands with different combinations of q and Q from the S&P500 data set of Figure 1. The increase of the width as q increases is very prominent, and should dissuade the practitioner from using large qs; interest-ingly, there is also a slight increase in the width as Q increases.
We now focus attention on the choice of Q supposing that q has already been chosen. Recall that for 95% predictive bands, approximately 95% of the data points should be covered by the bands. This is theoretical though, and in practice some deviations are expected. It is of interest to see the ef-fect of the choice of q and Q on the actual coverage of the bands. Table II shows the actual non–coverage of our 95% predictive bands with different combinations of q and Q.
Ideally, all the entries of Table II should be close to 0.05. Inspecting the table, one can try to fi nd the entry closest to 0.05 in each row; this may give an indication on how to choose Q in relation to the already chosen q to calibrate the bands for better coverage accuracy. From Table II the simple relationQ 7 + 0.3q is suggested that can be used in connection with the S&P500 data set. However, a different data set may (and most probably will) require a different relation of Q to q for proper calibration.
To summarize, choosing q is diffi cult trade-off problem that requires expertise on the part of the practitioner; from the point of view of predictive bands, we simply warn against unnecessarily large values of q since they result into bands that are too wide. Choosing Q, however, seems less critical and can be related to the (previously chosen) value of q via the proposed notion of coverage level calibration.
(a) SP500: crash of 1987; Bollinger q=20, Q=20
Figure 4:As in Figure 2 but using Bollinger bands with q = Q = 20
(b) SP500: end of the series
Table I:Empirically found widths of the 95% predictive bands with different combinations of q and Q for the S&P500 data set of Figure 1.
Table II:Empirically found non–coverages of 95% predictive bands with different combinations of q and Q for the S&P500 data set of Figure 1.

11JOURNAL of Technical Analysis • 2006, Issue 64
SummaryA method is given to construct volatility bands that are at the same time
predictive bands having a pre-specifi ed level of predictive coverage. The bands are easy to construct with basic spread-sheet calculations, and can be used where-ever Bollinger bands are used; notably, the latter lack any predictive validity. Finally, a discussion is given on choosing the band parameters q and Q, i.e., the window sizes for the Geometric Moving Average and the rolling estimate of variance.
References[1] Bachelier, L. (1900). Theory of Speculation. Reprinted in The Random
Character of Stock Market Prices, P.H. Cootner (Ed.), Cambridge, Mass.: MIT Press, pp. 17-78, 1964.
[2] Bollerslev, T., Chou, R. and Kroner, K. (1992). ARCH modelling in fi nance: a review of theory and empirical evidence, J. Econometrics, 52, 5-60.
[3] Bollinger, J. (2001). Bollinger on Bollinger Bands, McGraw-Hill, New York.
[4] Engle, R. (1982). Autoregressive conditional heteroscedasticity with estimates of the variance of UK infl ation, Econometrica, 50, 987-1008.
[5] Fama, E.F. (1965). The behaviour of stock market prices, J. Business, 38, 34-105.
[6] Fan, J. and Yao, Q. (2005). Nonlinear Time Series: Nonparametric and Parametric Methods, (2nd Ed.), Springer, New York.
[7] Hart, J.D. (1997). Nonparametric Smoothing and Lack-Of-Fit Tests, Springer, New York.
[8] Mandelbrot, B. (1963). The variation of certain speculative prices, J. Business, 36, 394-419.
[9] Politis, D.N. (2003), A normalizing and variance-stabilizing transformation for fi nancial time series, in Recent Advances and Trends in Nonparametric Statistics, (M.G. Akritas and D.N. Politis, Eds.), Elsevier (North Holland), pp. 335-347.
[10] Politis, D. N. (2004). A heavy-tailed distribution for ARCH residuals with application to volatility prediction, Annals Econ. Finance, vol. 5, pp. 283-298.
[11] Politis, D.N. (2006), Can the stock market be linearized? Preprint available from http://repositories.cdlib.org/ucsdecon/2006-03.
[12] Shephard, N. (1996). Statistical aspects of ARCH and stochastic volatility. in Time Series Models in Econometrics, Finance and Other Fields, D.R. Cox, David V. Hinkley and Ole E. Barndorff-Nielsen (eds.), London: Chapman & Hall, pp. 1-67.
[13] Wand, M.P., and Jones, M.C. (1994). Kernel Smoothing, Chapman and Hall, New York.
AcknowledgementsMany thanks are due to A. Venetoulias of Quadrant Management for
introducing me to Bollinger bands, to K. Thompson of Granite Portfolios for the incitement to revisit this issue, and to two reviewers for their helpful comments.
About the AuthorProfessor Dimitris N. Politis is a Professor of Mathematics at the
University of California, San Diego. He holds several MS degrees in sta-tistics, mathematics, and computer and systems engineering, and a PhD
in Statistics from Stamford University. He is an accomplished researcher in statistics, Associate Editor of a number of academic journals, has been awarded numerous grants and awards, and is the author of 75 technical pa-pers and 2 books. His complete curriculum vitae is available at his website:www.math.ucsd.edu/~politis.

JOURNAL of Technical Analysis • 2006, Issue 6412
Abstract“Nothing should be ignored. Mining unusual data often uncovers interesting and profi table discoveries. It is often the case that the more esoteric or arcane the data, and the more diffi cult it is to obtain, the greater its value!”1
Jeffrey Owen Katz & Donna L. McCormick
In the spirit of prospecting for new sources of fi nancial indicators, this study attempts to tackle the mass of fi nancial message board postings on the Internet and turn it into a simple and profi table technical indicator. The Global Squawk Box Indicator tries to offer a similar source of emotional measurement that fl oor traders have enjoyed for decades by simply watching and listening to surrounding trading pits2. The study also aims at introducing the process and value of seeking alternative data.
IntroductionBehind each trade, behind each unequivocal and almost instantaneous
transaction, lays a long, far-reaching and interrelated series of events. This is just one extremely minute aspect of the ominous fi nancial organism3. With the exception of price and volume data, most details from this chain of events are hidden, proprietary, and the symbiosis of far too many factors. Beyond brokerages and clearinghouses, few have the means or access to study such real-time data in order to derive new technical indicators. The advent of the Internet and its ever-growing acceptance and reliance from the fi nancial com-munity has fi nally brought some of that information, once reserved to a few, to all those with a computer and a modem4.
The Internet provides a great platform for professionals and amateurs to exchange fi nancial information and ideas. Anything from profi les, news, thoughts, editorials, and complaints are only a few clicks away and most of them free. With a modicum of computer skills, almost anything on the Internet can be programmatically extracted, also referred to as ‘screen scraping’5, for analysis. By marrying Internet harvesting software and fi nancial newsgroups, we can collect vast amounts of data and search for potential correlations within the stock market.
The scope of this study is not to predict whether the market is bullish or bearish by tallying the thumbs up versus thumbs down (although another interesting study) but to measure its intensity by simply counting traffi c and comparing averages. It is about taking a few steps backwards, observing the crowd with perspective, and measuring the noise it makes as an entity. The ultimate goal of the Global Squawk Box Indicator is to alert the trader when-ever something out-of-the-norm is happening. How these alerts are applied depends on one’s trading style, but they should offer an insightful addition to a trader’s arsenal of technical indicators.
In a nutshell, the making of the Global Squawk Box Indicator (referred as GSB from this point onwards) entails counting message board postings on the Internet for, say Microsoft Corporation, over the past years and comparing it, in real-time, with today’s numbers in an attempt to decipher the market’s pulse. If the data is drastically up or down, does it mean something? Or more accurately, can we profi t from this variance?
SetupTrading with alternative or non-conventional data requires more work than
simply subscribing to a data provider; you not only have to hunt for the data, you also have to do everything the data provider does: harvesting, cleaning, and translating it into a format that your trading systems can understand6.
Harvesting InformationAlmost anything that can be viewed on the Internet can be harvested,
and anything that can be harvested can be analyzed with statistical tools. We should soon see more non-conventional fi nancial data used in conventional trading systems as technical skills and Internet-related technology improve. In the meantime, for those looking for an edge over the market, the old-fashioned ‘screen scraping’ approach is willing and able, and easier than most may think.
Some Background FirstThough there are many Internet sites for fi nancial data, the study uses only
Yahoo’s Financial Message Boards; it enjoys a large and active following and therefore gives a fair representation of the English-speaking fi nancial community.
From a programmatic level, Yahoo’s Financial Message Boards are easily accessed with common programming tools. Briefl y touching on the subject of programming tools, Microsoft Visual Studio 2003 and VB.net were used to write both the Internet data-extracting program and the data-scrubbing program. Visual Studio 2003 is extremely Internet-centric and offers all the bells and whistles imaginable to access most types of web pages. It also of-fers innumerable ways of parsing and manipulating data, and a wide array of formats to store data7. I used Microsoft programming tools because that is what I am most familiar with but competing languages, such as Delphi, Perl, PHP or Java, can perform the same tasks with similar ease. Yahoo also exposes the entire history of its fi nancial message boards; this means that the fi rst post for a particular message board all the way to the most recent mes-sage is available for retrieval. This is quite a boon for back testing theories as it not only helps measure the value of the data but also builds the needed confi dence to use it in live trading.
As most of my trading experience since the late 1990s revolved around trading an exclusive selection of about 550 high volume and volatile NAS-DAQ stocks, I decided to stick with it for this study (the basket is named ‘NASDAQ Big Volume’ and is listed in Appendix 1). This certainly does not mean that the GSB indicator cannot work with another exchange or another type of fi nancially traded product; the only requisites are that it be associated with an active message board and that the alerts be somehow correlated to the product.
To restrain the scope of this study, only end-of-day (EOD) data was used but the GSB concept should be applicable to any type of data, whether tick, seconds, minutes, etc.
Global Squawk Box -Evaluating Internet Financial Message Board Traffi c as a Technical Indicator
Manuel Amunategui, CMT 2

13JOURNAL of Technical Analysis • 2006, Issue 64
The Scraper Writing the Internet data-extracting program was the fi rst step to acquiring
the GSB data. Its sole purpose was to extract all the data from the message board associated with each stock in the ‘NASDAQ Big Volume’ basket. This was a time consuming and tedious process that took well over two months to complete. The slowness was due to the size of each message board as some contained well over a million posts going back to the early 1990s.
The extraction process works as follows: the program fi rst visits the mes-sage board on the web and copies the content of each message into its memory. The program will then parse the retrieved data for what it needs and stores it appropriately. For the GSB data, the program searches for the index number and the date of each message post. It discards all other content from its memory. At the end of the process, a text fi le is created containing the date of every posted message and the index of each post in the following format:
07/25/98 02:06 am 107/28/98 09:26 am 207/28/98 01:01 pm 307/28/98 05:42 pm 4…
The fi le is subsequently named using the stock’s symbol and saved locally. That is all the data needed to create the GSB indicator.
When harvesting data off the Internet, there are few alternatives for the software than to physically access each individual page to collect content. Therefore, if a message board has over a million posts, the program has to visit and scrape over a million pages. Try timing yourself as you browse through a dozen web pages and you will quickly understand the problem. Even the most streamlined of programs will take time to complete these tasks as its instruc-tions and the retrieved data need to travel great distances on infrastructures beyond its control and contend with latency, congested Internet connections, and equipment failures. The best way to minimize this issue is to scrape the minimum information needed and run the software on multiple computers with fast Internet connections.
Prepping the DataAnother source of surprise was the quality of the data harvested. Big
fi nancial and trading fi rms get the best data they can afford as trading on faulty information can get painfully expensive. You do not really appreciate the work these providers offer until you gather your own raw data. They have large amounts of software, hardware, and staff dedicated to checking and fi xing data feeds so that the data you buy matches exactly what happened in the market.
There were gaping holes in supposedly consecutive message indexes, holes in message dates (in some instances, a whole year would be missing), duplicate posting numbers with differing messages, duplicate messages with differing message indexes, etc. Several methods were used to clean up the data, starting with displaying it on a chart and visually pinpointing anomalies to writing programs that look for excessive and erratic jumps in data fl ow8; but whenever in doubt the suspicious data was discarded.
The end results were stored in text fi les, one for each stock in a format compatible with both Microsoft Excel and Wealth-Lab Developer9 (the program used to develop and back-test the trading strategies in this study).
It was necessary to lay some ground rules in order to package the data objectively and effi ciently, and offer a predictive edge. For the scope of this study, only message board data posted before or after regular market hours were used, everything else was discarded. In order to offer a predictive window to the trading day in this end-of-day study, equal sections of GSB data for each coming trading day was tallied according to the following formula:
GSB for today’s trading session = sum of messages from 4:01 PM EST of the prior day to 9:29 AM EST of the current day.
This means that a day’s worth of GSB data is the sum of all postings from the previous day right after market close (4:31 PM EST) to just before market open (9:29 AM EST) of the current trading day. This enables the data to offer a predictive window into the upcoming trading session. In one week, the GSB data contains fi ve data blocks of equal periodicity:
GSB for Monday’s trading session = sum of messages from Sunday 4:01 PM EST to Monday 9:29 AM EST.
GSB for Tuesday’s trading session = sum of messages from Monday 4:01 PM EST to Tuesday 9:29 AM EST.
GSB for Wednesday’s trading session = sum of messages from Tuesday 4:01 PM EST to Wednesday 9:29 AM EST.
GSB for Thursday’s trading session = sum of messages from Wednesday 4:01 PM EST to Thursday 9:29 AM EST.
GSB for Friday’s trading session = sum of messages from Thursday 4:01 PM EST to Friday 9:29 AM EST.
The idea is simple, the program gathers approximately 17.5 hours of message board data during non-trading hours to get a feel for the subsequent 6.5 hours during the offi cial NASDAQ trading period. For Monday, the 17.5 hours of data begins on Sunday and does not include any messages from the previous Saturday. ‘Pre-Market’ and ‘After Hours’ trading data are not taken into consideration and would undoubtedly offer an interesting complement to this study. Cutting up the message count in equal chunks also facilitates the programming and avoids having to weigh the data differently for different days of the week to account for special periods such as weekends and holidays.
The program knows it needs to count 17.5 hours of message postings prior to the current trading day. The program should ideally start running around 9:29 AM to collect all the latest counts of message postings to calculate the new GSB. If one is monitoring a large basket of stocks and wants to get all the data tallied before market open then the program will need to be started earlier.
The GSB AlertPreliminary Analysis
The fi rst exercise with the newly minted data was to decide how to use it. A basic correlation study on the GSB data for a particular stock versus the price and volume data for that stock was calculated. The correlation is based on Pearson’s Correlation Coeffi cient that returns a value between -1.0 and +1.0, one meaning positively correlated, minus one meaning negatively correlated and zero meaning not correlated at all. The correlation results with price or volume were not overly promising:
Average Correlation Coeffi cient of Message Count and Traded Price on all stocks in the NASDAQ Big Volume basket = 0.2
Average Correlation Coeffi cient of Message Count and Traded Volume on all stocks in the NASDAQ Big Volume basket = 0.45
According to Cohen10, the Message Count to Price result represented a small correlation and the Message Count to Volume result represented a me-dium correlation. This did not surprise me as I did not expect a perfect correla-tion, nor is a correlation necessary when dealing with an alerting mechanism based on data spikes or abrupt drops. On the other hand, it did indicate that
JOURNAL of Technical Analysis • 2006, Issue 6414
the data related more closely to volume data rather than price data. Here are some examples of individual Message Count to Volume correla-
tion from the NASDAQ Big Volume basket:
AAPL Correlation Coeffi cient of Message Count and Traded Volume = 0.73
GOOG Correlation Coeffi cient of Message Count and Traded Volume = 0.5
CSCO Correlation Coeffi cient of Message Count and Traded Volume = 0.14
Deconstructing the GSB IndicatorThere probably is not a better way to understand the GSB Indicator than
by observing it in action. A script was created using Wealth-Lab Developer to fi nd the biggest GSB upswings in the NASDAQ Big Volume basket.
A large GSB upward swing is an unusually large quantity of message board postings for a single period. To make the search more realistic, a condition was added to only consider swings where a minimum of 100,000 shares were traded on the day to ensure tradability and as an additional safeguard against erroneous data.
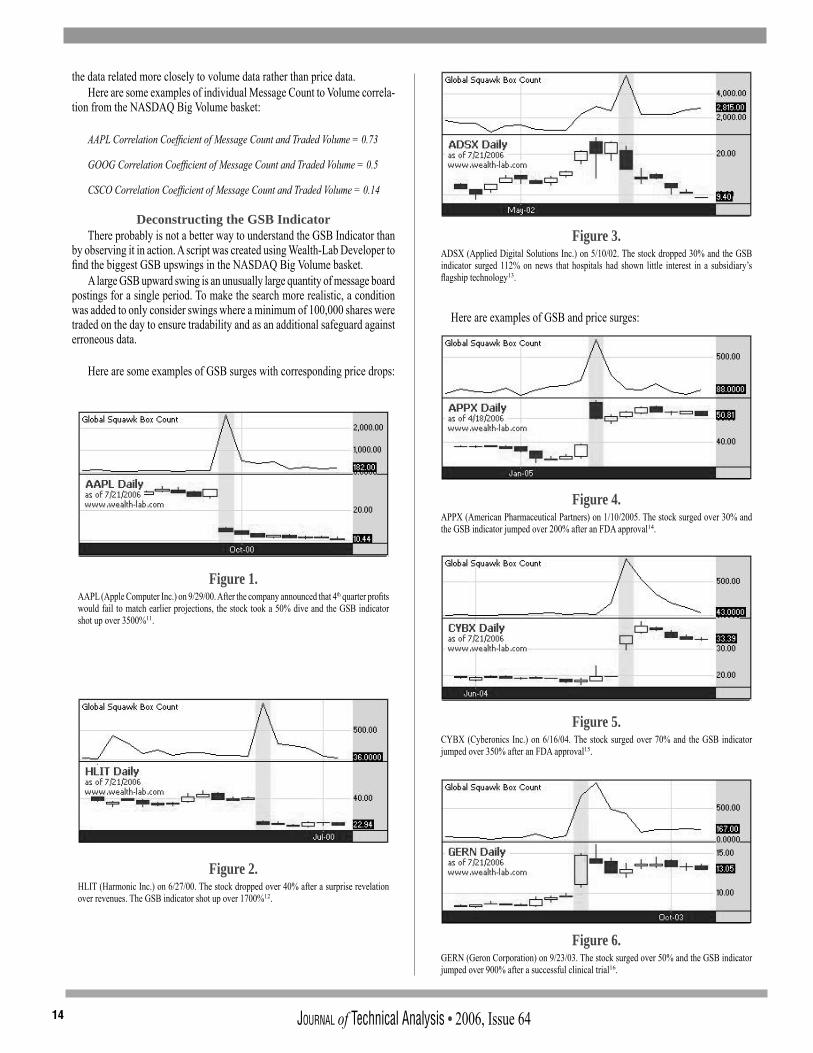
Here are some examples of GSB surges with corresponding price drops:
Here are examples of GSB and price surges:
Figure 1.AAPL (Apple Computer Inc.) on 9/29/00. After the company announced that 4th quarter profi ts would fail to match earlier projections, the stock took a 50% dive and the GSB indicator shot up over 3500%11.
Figure 2.HLIT (Harmonic Inc.) on 6/27/00. The stock dropped over 40% after a surprise revelation over revenues. The GSB indicator shot up over 1700%12.
Figure 3.ADSX (Applied Digital Solutions Inc.) on 5/10/02. The stock dropped 30% and the GSB indicator surged 112% on news that hospitals had shown little interest in a subsidiary’s fl agship technology13.
Figure 4.APPX (American Pharmaceutical Partners) on 1/10/2005. The stock surged over 30% and the GSB indicator jumped over 200% after an FDA approval14.
Figure 5.CYBX (Cyberonics Inc.) on 6/16/04. The stock surged over 70% and the GSB indicator jumped over 350% after an FDA approval15.
Figure 6.GERN (Geron Corporation) on 9/23/03. The stock surged over 50% and the GSB indicator jumped over 900% after a successful clinical trial16.

15JOURNAL of Technical Analysis • 2006, Issue 64
According to Kaufman, “Price shocks are large changes in price caused by unexpected, unpredictable events... unfortunately not enough thought is given to how these moves affect test results and future performance.”17 It seems that GSB data might be a great trading alert for potential price shocks and, in the context of back-testing trading strategies, a great indicator to pinpoint unrealistic profi ts from unexpected and unpredictable events.
It is apparent that the GSB does correlate to price swings but, in most of the above examples, the news was already factored into the market upon the opening of the trading session. To remedy this, an extra condition was added to the script to only look for the widest GSB swing where the opening price was within a percent up and a percent down from the close of the previous day. This condition was added in hopes of fi nding a predictive edge between the message board and the stock’s behavior.
Here are examples of GSB surges with subsequent price drops:
Here are examples of GSB surges with subsequent price surges:
Though these alerts retained a predictive edge prior to the opening of the market, not all spikes translated into a large price movement (as seen in the other GSB spikes of Figure 10). It would seem safer to use the GSB alert as an indicator to avoid the market or, if already in the market, as a signal to close a position. If it is to be used as an entry signal, it is clear that the GSB alert should be used in conjunction with other entry indicators.
GSB In ActionTo test the impact of the GSB Indicator on a trading system, two simple
trading strategies were scripted and back tested with and without GSB data. As a disclaimer, the following trading systems are only simple examples
to measure the GSB Indicator in action. They use overly simplistic ‘on-market-open’ entry (a market order placed right as the market opens) and ‘at-market-close’ exit (a market order fi red a few minutes before the market
Figure 7.ARIA (Ariad Pharmaceutical, Inc.) on 2/8/00. The GSB surged over 350% before the market opened and the stock subsequently lost almost 30% of its value.
Figure 8.MSTR (MicroStrategy Inc.) on 8/22/00. The GSB surged over 1600% before the market opened and the stock subsequently lost almost 19% of its value.
Figure 9.TALK (Talk America Holdings Inc.) on 2/23/99. The GSB surged over 950% before the market opened and the stock subsequently lost almost 15% of its value.
Figure 10. PACT (Pacifi cnet Inc.) on 11/23/04. The GSB surged over 540% before the market opened and the stock subsequently surged almost 40%.
Figure 11. ONXX (Onyx Pharmaceuticals Inc.) on 8/8/00. The GSB surged almost 100% before the market opened and the stock subsequently surged over 20%.
Figure 12.SKIL (SkillSoft Corp.) on 11/20/02. The GSB surged almost 2000% before the market opened and the stock subsequently surged almost 20%.

JOURNAL of Technical Analysis • 2006, Issue 6416
closes) rules and don’t take into account slippage, freak problems and trading costs all crucial to any robust trading system18.
In addition, in designing trading systems with historical data, it is crucial not to peek into the future in order to make a trading decision. You can easily design an EOD system that sends a buy order whenever the moving average of that day moves upward. The problem in that case is that the moving average is not calculated until the end of the trading day. A realistic trading system would only be able to send a buy order the following day. Obviously, such mistakes make a trading strategy worthless. The scripts used in this study are not guilty of making these mistakes, but back testing against a basket of high-tech movers during the great bull move of the 1990’s somewhat falls into this ‘peeking into the future’ category. There are no guarantees that past successes of a basket of stocks will continue into the future and keep providing similar results.
Each test contains a fi rst phase (Part 1) without GSB conditions and a second phase (Part 2) with GSB conditions.
Another point worth mentioning is the varying trading periods from stock to stock used in testing both with and without GSB conditions. Testing on large amounts of data will always result in tests that are more accurate by exposing trading strategies to wider market conditions19. Though the following tests were performed on all the GSB data available (Apple Computer Inc. goes all the way back to the early 1990s), some stocks in the basket did not have much GSB data to go on. The fi rst part of each test, those excluding GSB conditions, had to be limited to the same period of the subsequent GSB-enhanced part; this was the only way to ensure that both parts traded the same fi nancial data.
Trading the Trend The fi rst trading strategy is a trend-following crossover system. It uses
two weighted moving averages (WMA)20, a 6-day WMA and a 12-day WMA (refer to Appendix 2 for the complete script).
Part 1 of this system buys on-market-open when the fast WMA is above the slow one and both averages have turned up in the past two days. It will close the position as soon as the fast WMA dips under the slow one with an at-market-close order.
Part 2, the GSB-enhanced system, adds an extra condition to only enter the market if the GSB count is decreasing (current GSB for the trading day has to be less than the previous one). The assumption behind this added condition is that a trend-following system does best, as it names implies, when conditions are stable, which is confi rmed by a constant or decreasing GSB.
This trading system is only used to illustrate the impact of GSB data and is not meant to be used in live trading.
A cursory glance may trump one into choosing the original system (part 1) and pocketing half a million dollars, but that would be a mistake. The
original system traded three times more and only made twice the profi t. It made an average profi t of $52.52 per trade while the GSB-enhanced system (part 2) made $73.36 per trade. It could be argued that one would only need to double the trade size of the GSB-enhanced system to attain the profi t level of the original system with less capital exposure.
The bottom line is that this trend-following system was improved by avoiding market days when the GSB indicator was rising.
Overnight BouncePart 1 of the Overnight Bounce system is a simple, yet surprisingly
profi table, overnight bottom-picking trading strategy. After four consecutive down days (where each close is lower than its previous close), it buys on-market-open and sells at-market-close the next day (Refer to Appendix 3 for the complete script).
Part 2, the GSB-enhanced system, uses the opposite approach than the trend-following system: it looks for a rising GSB indicator instead of a falling one. If the stock has been falling for four days and the current GSB is at least twice the size of the previous one, it enters the market. The idea behind this system is that the stock, after falling for a few days coupled with an aggressively rising GSB, might have the needed attention for a reversal of direction or, at the very least, a temporary bounce.
While at risk of sounding repetitious, this trading system is only used to illustrate the impact of GSB data and is not meant to be used in live trading.
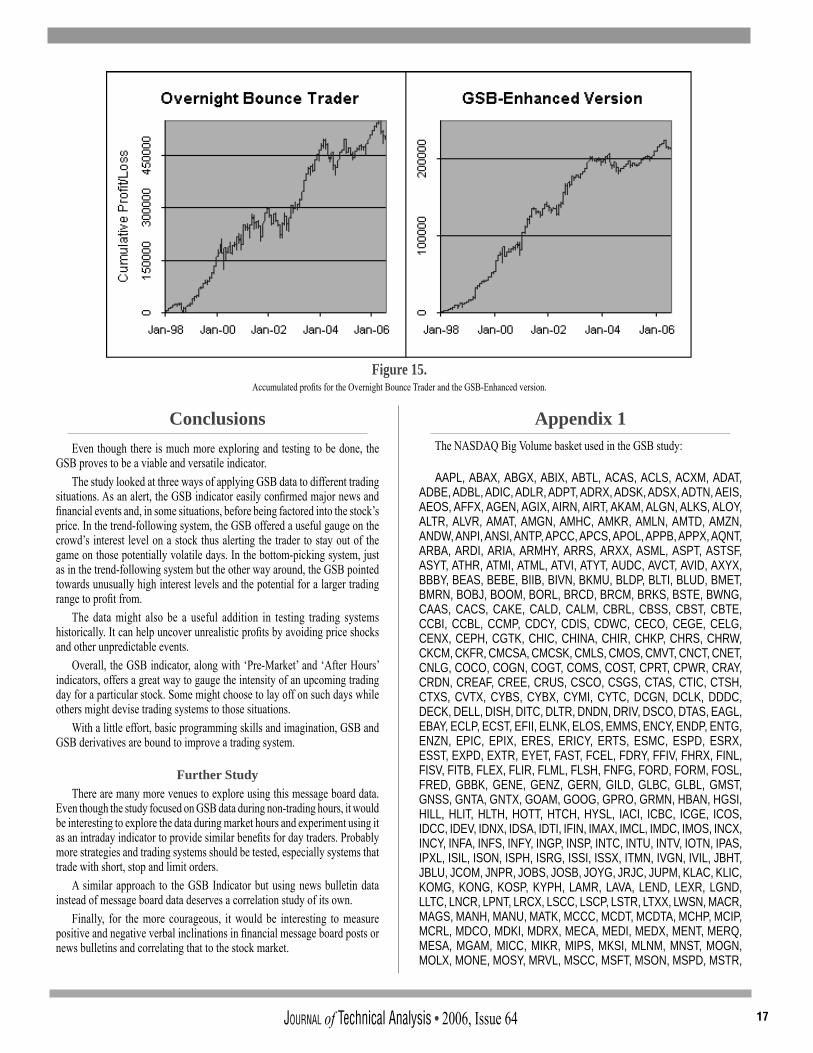
Adding the GSB condition into this trading system drastically improved it on many levels; the average profi t per trade not only doubled but the system picked higher quality trades. By dramatically reducing the number of trades, we not only decreased trading costs but also decreased the probability for errors and exposure to price shocks21.
The above graphs show another advantage with the GSB-enhanced version: a smoother rate of accumulated profi ts. The P&L of the original system has wide and erratic vicissitudes. Trading systems with extremely volatile P&L are hard to sustain emotionally, even if they are profi table in the end22. Adding the GSB indicator clearly shows that the system selected better trades and retained profi ts with less drawdowns and whipsaws.
It would be interesting to analyze the content of this rising GSB right before the bounce. On one hand, posters could be predicting that the stock’s luck is about to turn while praising their market practical understanding and encouraging others to jump on the bandwagon, or, taking a contrarian’s view, the crowd could be seeing red and throwing in the towel while the professionals are preparing to amass the undervalued stock. However, that will have to wait for another study.
Figure 13.Results from the Crossover WMA Trend Trader System without and with the GSB indicator over a period of 10 years or less depending on available data.
Figure 14. Results from the Overnight Bounce Trader System without and with the GSB indicator over a period of 10 years or less depending on available data.
17JOURNAL of Technical Analysis • 2006, Issue 64
ConclusionsEven though there is much more exploring and testing to be done, the
GSB proves to be a viable and versatile indicator. The study looked at three ways of applying GSB data to different trading
situations. As an alert, the GSB indicator easily confi rmed major news and fi nancial events and, in some situations, before being factored into the stock’s price. In the trend-following system, the GSB offered a useful gauge on the crowd’s interest level on a stock thus alerting the trader to stay out of the game on those potentially volatile days. In the bottom-picking system, just as in the trend-following system but the other way around, the GSB pointed towards unusually high interest levels and the potential for a larger trading range to profi t from.
The data might also be a useful addition in testing trading systems historically. It can help uncover unrealistic profi ts by avoiding price shocks and other unpredictable events.
Overall, the GSB indicator, along with ‘Pre-Market’ and ‘After Hours’ indicators, offers a great way to gauge the intensity of an upcoming trading day for a particular stock. Some might choose to lay off on such days while others might devise trading systems to those situations.
With a little effort, basic programming skills and imagination, GSB and GSB derivatives are bound to improve a trading system.
Further StudyThere are many more venues to explore using this message board data.
Even though the study focused on GSB data during non-trading hours, it would be interesting to explore the data during market hours and experiment using it as an intraday indicator to provide similar benefi ts for day traders. Probably more strategies and trading systems should be tested, especially systems that trade with short, stop and limit orders.
A similar approach to the GSB Indicator but using news bulletin data instead of message board data deserves a correlation study of its own.
Finally, for the more courageous, it would be interesting to measure positive and negative verbal inclinations in fi nancial message board posts or news bulletins and correlating that to the stock market.
Appendix 1The NASDAQ Big Volume basket used in the GSB study:
AAPL, ABAX, ABGX, ABIX, ABTL, ACAS, ACLS, ACXM, ADAT, ADBE, ADBL, ADIC, ADLR, ADPT, ADRX, ADSK, ADSX, ADTN, AEIS, AEOS, AFFX, AGEN, AGIX, AIRN, AIRT, AKAM, ALGN, ALKS, ALOY, ALTR, ALVR, AMAT, AMGN, AMHC, AMKR, AMLN, AMTD, AMZN, ANDW, ANPI, ANSI, ANTP, APCC, APCS, APOL, APPB, APPX, AQNT, ARBA, ARDI, ARIA, ARMHY, ARRS, ARXX, ASML, ASPT, ASTSF, ASYT, ATHR, ATMI, ATML, ATVI, ATYT, AUDC, AVCT, AVID, AXYX, BBBY, BEAS, BEBE, BIIB, BIVN, BKMU, BLDP, BLTI, BLUD, BMET, BMRN, BOBJ, BOOM, BORL, BRCD, BRCM, BRKS, BSTE, BWNG, CAAS, CACS, CAKE, CALD, CALM, CBRL, CBSS, CBST, CBTE, CCBI, CCBL, CCMP, CDCY, CDIS, CDWC, CECO, CEGE, CELG, CENX, CEPH, CGTK, CHIC, CHINA, CHIR, CHKP, CHRS, CHRW, CKCM, CKFR, CMCSA, CMCSK, CMLS, CMOS, CMVT, CNCT, CNET, CNLG, COCO, COGN, COGT, COMS, COST, CPRT, CPWR, CRAY, CRDN, CREAF, CREE, CRUS, CSCO, CSGS, CTAS, CTIC, CTSH, CTXS, CVTX, CYBS, CYBX, CYMI, CYTC, DCGN, DCLK, DDDC, DECK, DELL, DISH, DITC, DLTR, DNDN, DRIV, DSCO, DTAS, EAGL, EBAY, ECLP, ECST, EFII, ELNK, ELOS, EMMS, ENCY, ENDP, ENTG, ENZN, EPIC, EPIX, ERES, ERICY, ERTS, ESMC, ESPD, ESRX, ESST, EXPD, EXTR, EYET, FAST, FCEL, FDRY, FFIV, FHRX, FINL, FISV, FITB, FLEX, FLIR, FLML, FLSH, FNFG, FORD, FORM, FOSL, FRED, GBBK, GENE, GENZ, GERN, GILD, GLBC, GLBL, GMST, GNSS, GNTA, GNTX, GOAM, GOOG, GPRO, GRMN, HBAN, HGSI, HILL, HLIT, HLTH, HOTT, HTCH, HYSL, IACI, ICBC, ICGE, ICOS, IDCC, IDEV, IDNX, IDSA, IDTI, IFIN, IMAX, IMCL, IMDC, IMOS, INCX, INCY, INFA, INFS, INFY, INGP, INSP, INTC, INTU, INTV, IOTN, IPAS, IPXL, ISIL, ISON, ISPH, ISRG, ISSI, ISSX, ITMN, IVGN, IVIL, JBHT, JBLU, JCOM, JNPR, JOBS, JOSB, JOYG, JRJC, JUPM, KLAC, KLIC, KOMG, KONG, KOSP, KYPH, LAMR, LAVA, LEND, LEXR, LGND, LLTC, LNCR, LPNT, LRCX, LSCC, LSCP, LSTR, LTXX, LWSN, MACR, MAGS, MANH, MANU, MATK, MCCC, MCDT, MCDTA, MCHP, MCIP, MCRL, MDCO, MDKI, MDRX, MECA, MEDI, MEDX, MENT, MERQ, MESA, MGAM, MICC, MIKR, MIPS, MKSI, MLNM, MNST, MOGN, MOLX, MONE, MOSY, MRVL, MSCC, MSFT, MSON, MSPD, MSTR,
Figure 15.Accumulated profi ts for the Overnight Bounce Trader and the GSB-Enhanced version.

JOURNAL of Technical Analysis • 2006, Issue 6418
MTLM, MTSN, MTSX, MUSE, MVSN, MXIM, MYGN, NABI, NANO, NANX, NAPS, NAVR, NBIX, NFLD, NFLX, NGEN, NGPS, NIHD, NINE, NITE, NKTR, NMSS, NOVL, NOVN, NPSP, NSIT, NTAP, NTES, NTGR, NTIQ, NTLI, NTMD, NTRS, NVDA, NVEC, NVLS, NVTL, NXTP, ODSY, OMCL, ONXX, OPSW, OPWV, ORCL, OSIP, OSTK, OSUR, OTEX, OVTI, PAAS, PACT, PAYX, PCAR, PCLN, PDCO, PDLI, PENN, PETM, PFCB, PHCC, PHRM, PHTN, PIXR, PKTR, PLAB, PLAY, PLCE, PLCM, PLUG, PMCS, PMTC, PNRA, POWI, PRFT, PRGO, PRTL, PSRC, PSSI, PSUN, PTEK, PTEN, PWAV, PWER, PXLW, QCOM, QDEL, QLGC, QLTI, QSFT, QTWW, RBAK, RCII, RECN, REDF, REMC, RFMD, RHAT, RIMM, RMBS, RNWK, ROIAK, ROST, RSAS, RSTO, RYAAY, SAFC, SANM, SAPE, SBAC, SBGI, SBSA, SBUX, SCHN, SCSS, SCUR, SEAC, SEBL, SEIC, SEPR, SERO, SFNT, SGMS, SGTL, SHFL, SHPGY, SHRP, SIFY, SIMG, SINA, SIRF, SIRI, SKIL, SLAB, SMSI, SMTC, SNDA, SNDK, SNIC, SNPS, SNTO, SNWL, SOHU, SOSA, SPLS, SPRT, SRCL, SRNA, SSCC, SSRI, SSTI, STKL, STLD, STSI, SUPG, SWFT, SWIR, SWKS, SYMC, SYMM, SYNA, TALK, TASR, TECD, TELK, TEVA, TFSM, THOR, THQI, TIBX, TINY, TIVO, TIWI, TKLC, TLAB, TLCV, TOPT, TQNT, TRID, TROW, TSCO, TSRA, TTMI, TTWO, TZOO, UAPH, UNTD, UPCS, URBN, USIH, UTEK, UTHR, UTSI, VASC, VCLK, VDSI, VECO, VIAC, VION, VISG, VRSN, VRTX, VSEA, WBSN, WEBM, WEBX, WERN, WFII, WFMI, WGRD, WIND, WITS, WLDA, WOOF, WSTL, WTSLA, WYNN, XLNX, XMSR, XXIA, YELL, YHOO, ZBRA, ZICA, ZION, ZIXI, ZRAN
Appendix 2
Trend Trader script for Wealth-Lab Developer:
//***********************************************// Weighted Moving Average Trend Trader//***********************************************
//***********************************************// Global Squawk Box Count InitializationVar GSBCountSeries, GSBCountPane: integer;// Extract GSB data for particular stockGSBCountSeries := GetExternalSeries(GetSymbol + ‘_TotalCount’,
#Close);// Create graphics pane and plot GSBGSBCountPane := CreatePane(80, true, true);PlotSeriesLabel(GSBCountSeries, GSBCountPane, #Blue, #Thick,
‘Global Squawk Box Count’);//***********************************************
//***********************************************// Weighted Moving Average InitializationVar WMASlow, WMAFast: integer;// Create moving averagesWMASlow := WMASeries(#Close, 12);WMAFast := WMASeries(#Close, 6);// Plot moving averages on main price chartPlotSeriesLabel(WMAFast, 0, #Red, #Thin, ‘WMAFast’);PlotSeriesLabel(WMASlow, 0, #Blue, #Thin, ‘WMASlow’);//***********************************************
//***********************************************
// Weighted Moving Average Trading SystemVar Bar, Position: integer;For Bar := 2 To BarCount - 2 DoBegin // Conditions to assume a recent and liquid upmarket If (@WMAFast[Bar] > @WMASlow[Bar]) And (@WMAFast[Bar-1] < @WMAFast[Bar]) And (@WMASlow[Bar-1] < @WMASlow[Bar]) And (@WMAFast[Bar-2] > @WMAFast[Bar-1]) And (@WMASlow[Bar-2] > @WMASlow[Bar-1]) And (Volume(Bar) > 100000) Then Begin // Uncomment below line to include GSB condition // If (@GSBCountSeries[Bar] < @GSBCountSeries[Bar + 1]) Then If ActivePositionCount < 1 Then BuyAtMarket(Bar+1, ‘’); End; // Close positions when the fast WMA falls under the slow one For Position := 0 To PositionCount - 1 Do Begin If PositionActive(Position) Then If Bar - PositionEntryBar(Position) > 0 Then Begin If (GetSeriesValue(Bar, WMAFast) < GetSeriesValue(Bar, WMASlow))Then SellAtClose(Bar, Position, ‘’); End; End;End;//***********************************************
Appendix 3
Overnight Bounce Trader script for Wealth-Lab Developer:
//***********************************************// Overnight Bounce Trader//***********************************************
//***********************************************// Global Squawk Box Count InitializationVar GSBCountSeries, GSBCountPane: integer;// Extract GSB data for particular stockGSBCountSeries := GetExternalSeries(GetSymbol + ‘_TotalCount’,
#Close);// Create graphics pane and plot GSBGSBCountPane := CreatePane(80, true, true);PlotSeriesLabel(GSBCountSeries, GSBCountPane, #Blue, #Thick,
‘Global Squawk Box Count’);//***********************************************
//***********************************************// Overnight Bounce Trading SystemVar BAR, P: Integer;

19JOURNAL of Technical Analysis • 2006, Issue 64
For Bar := 4 To BarCount - 2 DoBegin // Check that there is suffi cient liquidity to enter // on market open and close orders If (Volume(Bar) > 500000)) Then
// Uncomment below line to include GSB condition //If ((@GSBCountSeries[Bar] * 2 ) < (@GSBCountSeries[Bar + 1]))
Then // Make sure there is GSB data If (Getseriesvalue(Bar+1,GSBCountSeries) > 1) And (Getseriesvalue(Bar,GSBCountSeries) > 1) Then Begin // Look for a declining close over a 4 day period If (Priceclose(Bar-3) > PriceClose(Bar-2)) And (Priceclose(Bar-2) > PriceClose(Bar-1)) And (PriceClose(Bar-1) > PriceClose(Bar)) Then BuyAtMarket(Bar+1,’’); End;
// Sell all open positions one day after entry at market close For P := 0 to PositionCount - 1 do If PositionActive( P ) Then If Bar - PositionEntryBar(P) = 0 Then SellAtClose( Bar+1, P, ‘’);
End;//***********************************************
Notes (Endnotes)
1 Jeffrey Owen Katz, Donna L. McCormick: The Encyclopedia of TradingStrategies. McGraw-Hill 2000; 1: 4.
2 Joshua D. Coval, Tyler Shumway. Is Sound Just Noise? University ofMichigan Business School 2000; 13-18.
3 Rod Davis. What You Need to Know Before You Invest. Barron’s EducationalSeries 2003; 1:1-3.
4 Robert D. Edwards, John Magee, W.H.C. Bassetti: Technical Analysis ofStock Trends, 8th Edition. Amacom 2001; 17.1:307.
5 Wikipedia, the free encyclopedia (2006). Screen scraping. Retrieved August2006 from http://en.wikipedia.org/wiki/Screen_scraping
6 Perry J. Kaufman: Trading Systems and Methods. Wiley 1998; 22: 556.7 Microsoft Developer Network (MSDN): .NET Framework Class Library
- System.Net Namespace. http://msdn2.microsoft.com/en-us/library/system.net.aspx
8 Perry J. Kaufman: Trading Systems and Methods. Wiley 1998; 22: 556.9 Wealth-Lab Developer 3.0. http://www.wealth-lab.com/10 Jacob Cohen. Statistical Power Analysis for the Behavioral Sciences.
Lawrence Erlbaum Associates, Inc 1988;11 Staff and wire report (2000). CNN Money. Markets & Stocks. Apple bruises
tech sector. Retrieved August 2006 from http://money.cnn.com/2000/09/29/markets/techwrap/
12 Brian Graney (2000). The Motley Fool. Fool Plate Special. An Investment Opinion. Cognitive Dissonance at Harmonic. Retrieved August 2006 from http://www.fool.com/news/foolplate/2000/foolplate000627.htm
13 Weiss & Lurie (2002). Closed Cases. Applied Digital Solutions. Retrieved
August 2006 from http://www.wyca.com/summary/adsx-inf.htm14 BioSpace (2005). Biospace Beat. Retrieved August 2006 from http://www.
biospace.com/news_archive.aspx?StoryDate=05011015 Zack Lynch (2004). Corante. Brain Waves. Cyberonics’ Neuroelectronics
Device to Relieve Depression. Retrieved August 2006 from http://www.corante.com/brainwaves/archives/2004/06/
16 David Nierengarten (2003). The Motley Fool. Biotech Rebirth? Retrieved August 2006 from http://www.fool.com/news/commentary/2003/commentary030930dmn.htm
17 Perry J. Kaufman: Trading Systems and Methods. Wiley 1998; 22: 546.18 Marcel Link: High Probability Trading. McGraw-Hill 2003; 13: 268-271.19 Perry J. Kaufman: Trading Systems and Methods. Wiley 1998; 21:517-
518.20 Wikipedia, the free encyclopedia (2006). Moving average (technical analysis).
Weighted moving average. Retrieved August 2006 from http://en.wikipedia.org/wiki/Weighted_moving_average#Weighted_moving_average
21 Perry J. Kaufman: Trading Systems and Methods. Wiley 1998; 21: 510.22 Marcel Link: High Probability Trading. McGraw-Hill 2003; 13: 276.
About The Author
After fi nishing an MS in Management, I started my career as a software designer at Microsoft Corporation over 10 years ago and gradually drifted both eastward and into the fi nancial world. Since 2000 I have been designing and running automated trading systems and recently teamed up with a group of traders and programmers to automate the market making process at Group One Trading, one of the largest proprietary option trading fi rms in the country.
JOURNAL of Technical Analysis • 2006, Issue 6420
Abstract
Are there scientifi c foundations to Technical Analysis (TA) or is it a pseudo-science? Academia, embracing the Random Walk Theory, the Effi cient Market Hypothesis (EMH) and Modern Portfolio Theory (MPT) has argued the latter for some 20 years or more. In fact, according to current orthodoxy, both TA and Fundamental Analysis are fruitless distractions and cannot add value. The advent of Behavioral Science has illuminated some of the fl aws in the standard model. Andrew W. Lo’s Adaptive Markets Hypothesis reconciles effi cient markets with human behavior by taking an evolutionary perspective. According to Lo, markets are driven by competition, adaptation, and natural selection. What is missing is a more accurate and comprehensive model of the market itself. Chaos and Complex system theories provide a more comprehensive understanding of market behavior. The markets can be seen as chaotic, complex, self-organizing, evolving and adaptive, driven by human behavior and psychology. Patterns in the market are emergent properties. Identifying these patterns has predictive value, but certainties must be left behind; only probabilities remain. TA, shown to be the inductive science of fi nancial markets, is an essential tool for identifying these emergent properties and analyzing their probabilities. Lastly, so that the science of TA may advance, the fi eld must distinguish between scientifi c, empirically based, market analysis theory and the categories of interpretation and practical trading strategies.
I. Art, Science, and FallaciesWe see only what we know.
Johann Wolfgang von Goethe
Universities are the vanguard of emerging scientifi c thought. Yet, in the academic community, we fi nd that TA does not fare well. TA is largely ignored, denigrated, or simply dismissed. In their well-respected paper, The Predictive Power of Price Patterns (1998), Dr. Gunduz Caginalp and Henry F. Laurent, wrote, “The gulf between academicians and practitioners could hardly be wider on the issue of the utility of technical analysis.” John Nofsinger, Assistant Professor of Finance, Washington State University, recently confi rmed this perception, reiterating that there is “one of the greatest gulfs between academic fi nance and industry practice (Peter Kendall, co-editor of the Elliott Wave Financial Forecast in Technically Speaking, 2003, April).”
Burton G. Malkiel, Professor of Economics, Princeton University, is one of the most prominent economists in the world. He authored the very infl uential fi nancial classic, A Random Walk Down Wall Street and is a leading proponent of the EMH. With ties to the Vanguard Group, he is a vocal advocate of indexing. In his book, Malkiel sets the tone for what has become a prevailing attitude among academics: “Obviously, I’m biased against the chartist. This is not only a personal predilection but a professional one as well. TA is anathema to the academic world.” “Anathema” means formally set apart, banished, exiled, excommunicated, or denounced. These scathing
comments from the head of the economics department are unlikely to attract much undergraduate or graduate study to say the least. Ironically, “Anathema” is a Greek word originally meaning “something lifted up as an offering to the gods” and “something sacred.” Worthy of note, Malkiel took aim at investment management professionals in general and not only technicians. He is best known for writing that a “blindfolded monkey throwing darts” could pick better stocks than most money managers could.
What is it about TA that warrants such disdain? John J. Murphy (1999) defi nes TA as “the study of market action, primarily through the use of charts, for the purpose of forecasting future price trends.” Murphy notes that TA has three key premises; namely, that market action discounts everything, price moves in trends and history repeats. Martin J. Pring adds that TA “deals in probabilities, never certainties” and has “three essential areas: sentiment, fl ow of funds, and market structure indicators.”
Although defi ned as an empirical science, leaders in the fi eld shy away from its scientifi c foundations stressing the art of the practice. Murphy (1999) says, “Chart reading is an art.” Pring (2003) also concludes that TA is an art. Accomplished TA researcher, Professor Henry O. Pruden makes the subtle yet signifi cant distinction that the interpretation of technical patterns is an “art form” (“Chart Analysis as Sequential Art,” Journal of Technical Analysis, 2004, #62). Aaron Task, in Technically Speaking, (2003, May), wrote, “Looking forward, I think the best thing MTA members can do is to stress the ‘art’ of chart reading over the science,” in response to Peter Kendall’s eloquent advocacy for the scientifi c aspects of TA. The “art advocates” do not want to defend TA scientifi cally.
Most of the art vs. science debate arises out of confusion. In any fi eld, it is easy to confuse the practice or practitioners with the knowledge base. An art is an applied knowledge or applied science. Recently, John R. Kirby seeking to clear-up the art vs. science debate, quoted highly regarded Technical Analyst Ralph Acampora: “‘Art’ means a skill acquired by experience, study, or observation. ‘Science’ is a body of knowledge with its own axioms, rules, and language (Technically Speaking, 2005, January).”
From a scientifi c perspective, personality should not cloud empirical evidence. However, the aura of a powerful personality can have a huge impact on a fi eld and some technicians have received substantial publicity for making sensational predictions rather than measured projections. When these predictions have failed to materialize it has brought discredit to the fi eld. The academic community takes predictions very seriously and when a model fails to predict accurately, the underlying hypothesis is rejected.
Looking past the sins of a few, the most common criticism of TA is that it is a self-fulfi lling prophecy. Typically, the argument goes like this: 1) Market patterns appear randomly; 2) Some investors use TA; 3) These investors respond to the same market patterns; 4) The investor response causes the markets to behave as the investors had anticipated; 5) The market response reinforces the believe that there is predictive value in TA; 6) It is investor behavior based on false beliefs that generates the anticipated market action.
The most obvious fl aw in the argument is that you cannot isolate the behavior of technicians from other investors in any accurate, empirical manner. Even if it were possible, it is illogical to think that the behavior of one group
Scientifi c Frontiers and Technical Analysis
Kevin P. Hanley, CMT
3
21JOURNAL of Technical Analysis • 2006, Issue 64
should be isolated from the behavior of all investors. The market, by defi nition, is a function of all of its participants. Even if we were to assume all participants were technicians, it does not follow that all would act in unison. Aside from this obvious error, the argument has other logical fl aws.
Robert K. Merton formalized the structure and consequences of social behavior in his book, Social Theory and Social Structure (1968). Merton fi rst taught at Harvard then became Chairman of the Department of Sociology at Tulane University, and eventually joined Columbia University in 1941. He coined the term “self-fulfi lling behavior,” as well as other popular terms such as “role model” and “unintended consequences.” According to Merton, “The self-fulfi lling prophecy is, in the beginning, a false defi nition of the situation evoking a new behaviour which makes the original false conception come true.” Therefore it can be concluded from Merton’s defi nition that embedded in the “self-fulfi lling prophecy” argument is the assumption that TA is based on false beliefs. We can see the argument is circular: TA is based on false beliefs; therefore, it is false. Moreover, it is illogical to apply truth functions to investor beliefs. Markets are a function of investor opinions and beliefs, regardless of the validity of those opinions or beliefs.
Effi cient market proponents insist that the current price of a security is the best estimate of its true value. Effi cient markets imply that self-fulfi lling prophecies as traditionally understood are impossible. Therefore, any mainstream economists espousing the self-fulfi lling prophecy argument are contradicting themselves. It follows, then, that self-fulfi lling prophecy critics, if they are to remain consistent, must assume ineffi cient markets—something to keep in mind.
Does “self-fulfi lling” behavior occur in the markets? If we are to assume that it does, then how is “non-self-fulfi lling” behavior defi ned? Obviously, it is nonsense and not a useful construct for analysis. The term ‘self-fulfi lling’ is not empirical but metaphysical and, as demonstrated, burdened with preconceptions. Taken together, one must conclude that the self-fulfi lling prophecy argument is a canard.
There are more useful concepts to describe investor behavior such as “self-reinforcing behavior” as developed in Complexity Theory (Arthur, 1988). The phenomenon people are calling “self-fulfi lling” is really self-reinforcing behavior. Self-reinforcing behavior among investors is most likely rooted in their expectations, but is not dependent upon the validity of their beliefs. Whether the underlying beliefs are true or false is not relevant.
Robert J. Shiller (2001), Professor of Economics at Yale University, takes a more sophisticated angle on the self-fulfi lling prophecy critique of TA. He argues that TA plays a contributing role in market movements because technical reports are issued daily and therefore market participants are following and using TA. Shiller does not try to explain why or how TA is used. Instead, he sees TA as adding a broad underlying behavioral structure to the market that reinforces technical principles “solely because people are using them.” Shiller uses the term “self-fulfi lling prophecy” in Irrational Exuberance idiosyncratically to defi ne his specialized version of “feedback loop theory.” The feedback loop theory, according to Shiller, is “a scientist’s term for what might popularly be called a vicious circle, a self-fulfi lling prophecy, a bandwagon effect” and is synonymous with “the phrase speculative bubble.” He considers TA a contributing factor in this phenomenon. Yet, his characterization of TA is consistent with Merton’s defi nition of a self-fulfi lling prophecy; therefore, he assumes TA is based on false beliefs. In addition, as noted before, Shiller has no way to determine what particular market action is based on technical opinions and what is not; thus his criticism is sheer speculation. Most importantly, Shiller did not do any research to determine how technical reports corresponded with the internet bubble. Anecdotally, there were many technicians warning that a bubble was underway months before the eventual reversal. In fact, prima facie evidence points to several top fundamental analysts as reinforcing the bubble, not technicians.
Shiller fails to consider that TA was developed and effective before
there were daily technical reports. Moreover, it would follow from Shiller’s argument that TA would be signifi cantly more effective and infl uential today in the so called “Information Age” than it was 50 or 100 years ago, and that there should be, but is not, a progressive pattern of growing infl uence over time. Germane to Shiller’s thesis, history shows boom and bust cycles with wild speculative market peaks and sudden crashes, but they occurred long before a price chart was ever drawn. Shiller references Charles Mackay’s classic, Memoirs of Extraordinary Popular Delusions and the Madness of Crowds, written in 1841, he should have taken this into account.
Shiller is right when he says TA plays a contributing role in market movements, but he should have limited his argument to this point. It is accurate to say that TA may be a self-reinforcing force in the market and contribute to investor expectations whether rational, nonrational, or irrational. However, it is illogical for Shiller to claim that technical principles are reinforced “solely because people are using them” because that view cannot be empirically supported.
The other most common critique against TA is that it is “too subjective.” Among experienced technicians, there is often disagreement about the interpretation of a particular chart pattern. The fl aw is this argument is that there is a distinction between interpretation and a factual chart pattern. There is rarely, if ever, a disagreement over the facts of a chart or any other data set to be analyzed. The disagreement is about the interpretation of those facts. Do we criticize medicine as being too subjective because two doctors have different interpretations of a set of symptoms? No, we simply conclude, based on outcomes, that perhaps one doctor is a better diagnostician than the other is.
Murphy (1999) has pointed out that the “too subjective” and “self-fulfi lling prophecy” criticisms are contradictory and cancel each other out. Either TA accurately refl ects real market events or it does not. Critics want to use the subjective argument against TA when technicians fail to deliver and the self-fulfi lling prophecy argument when they do. It is incumbent on critics to prove that TA does not refl ect real market events. As noted above, this is virtually impossible, since there is rarely disagreement over market facts, only the interpretation of those facts.
At the core, these criticisms confuse the knowledge base with the practice. The science of TA does not have any infl uence on markets themselves, while the practice does. Most academics dismiss the science of TA out of hand and few want to acknowledge any success by practitioners, despite the Federal Reserve Bank of NY, Olser & Chang, writing over 10 years ago that, “Technical analysis, the prediction of price movements based on past movements, has been shown to generate statistically signifi cant profi ts despite its incompatibility with most economists’ notions of ‘effi cient markets’.”
II. Modern Financeand Anomaly ProjectionWhen you’re average, you’re just as close to
the bottom as you are to the top.Alfred North Whitehead
John Bollinger recently wrote, “Fundamental, technical, quantitative and behavioral analysts face the same common adversary, the markets and the Effi cient Market Hypothesis.” EMH, CAPM, and MPT are the foundations of contemporary Finance. They are well-defi ned, compatible, and self-reinforcing concepts. The defi nitions are mathematically based, cogent and standardized. The formulations are irresistibly compelling, and valuable insights can be derived from the models’ mathematical relationships developed by top economists over several decades. Harry Markowitz, William Sharpe, and
JOURNAL of Technical Analysis • 2006, Issue 6422
Merton Miller received the Nobel Prize in 1990 for their development of MPT. Built on Markowitz’s algorithm for constructing optimal portfolios, MPT uses Sharpe’s Capital Asset Pricing Model (CAPM) and other statistical techniques to derive optimal tradeoffs between risk and return based on various historical assumptions. Their model presumptively explains how an asset’s return compensates the investor for bearing risk. If accepted, these models dismiss the possibility of any productive result from applied analysis. How well does the model map onto the real world? As we shall fi nd, MPT is based on the ideal, not the real.
Andrew W. Lo, Professor at the MIT Sloan School of Management and Director and the MIT Laboratory for Financial Engineering, argues that, “Unlike the law of gravity and the theory of special relativity, there are no immutable laws of nature from which the EMH has been derived.” Certainly, effi ciencies are observed in fi nancial markets, but as we shall see, the assumptions of the EMH standardize the concept of effi ciency to an untenable level.
EMH proponents simply ignore many forces critical to markets when those forces are diffi cult or currently beyond our ability to model mathematically. In MPT, variables are held constant, except for the few permissible, in a linear equation. Tautological arguments support the framework of MPT and conclusions are deduced, not observed. Contemporary fi nance is linear reductionism based on the EMH and its corollaries. However, matters of observational science– including economics–must be inferred by induction, not deduction from a priori assumptions, to accurately correspond with reality.
Observation shows that markets have different levels of effi ciency, varying over time and circumstances. Levels of effi ciency between major currency markets and micro-cap stocks are substantial, for instance. Liquidity is critical to market effi ciency and liquidity factors are always changing. During market shocks, for example, liquidity can all but disappear in even the most effi cient markets.
The EMH assumes each price change is independent from the last. The “Random Walk” of the market dictates that the previous change in the value of a variable, such as price, is unrelated to future or past change. Statistical data collection implicitly defi nes each data point as independent. Based on such contextual assumptions, the data can appear random when the data points are treated as discrete events. Consequently, Shiller argues that effi cient market theorists make the mistake of assuming that no changes can be predicted, just because “it is diffi cult to predict day to day changes (2001).” It is true that prices do not have memories, but it seems that many modern economists have forgotten that people do. As the behavioral scientists have documented and as an obvious tenet of TA, price points are not random. People take action based on their perception of a particular price, the history of prices and their expectations of future prices.
When confronted with empirically observed inconsistencies in their assumptions, Fama (2005) and other modern mainstream economists refer to them as “anomalies.” However, the facts line-up differently. In recent years, especially with the advent of Behavioral Science, the fl aws in the standard model are fi nally being addressed in academic circles. The documented examples of inconsistencies have grown so large that it is now obvious the market described by the EMH is itself the anomaly (Sloan 1996, Bodie-Kane-Marcus 2003, Jaffe 2006, MacKinlay 2006). Well-established academic proponents of the EMH have stated that the EMH needs to be reworked, most notably, Kenneth J. Arrow of Stanford University. Arrow, who won the Nobel Price in Economics in 1972 for his mathematical work on General Equilibrium Theory in support of the EMH, has acknowledged that the hypothesis is empirically false (Paul Ormerod, 2005).
Current orthodoxy has attempted to treat markets as if they are amenable to modern physics. The axiom of equilibrium in the markets is a primary example. Equilibrium is appealing to the mathematician since it implies an equation with equivalent sums on each side of the equal sign. However, “equilibrium”
is a poor model for the economies and markets. Stuart Kauffman, an expert on Complexity Theory argues that, “all free-living systems are non-equilibrium systems (1995).” Homeostasis is a more accurate model for markets. ‘Homeostasis’, a biological term, when applied to Finance, illuminates the biological basis of markets. Notably, homeostasis is multi-variable and nonlinear in nature and cannot be reduced to a simple equation.
III. The Behavior Finance Critiqueof the Standard Model
We think in generalities, but we live in detail.Alfred North Whitehead
Behavioral Science points out the obvious: humans are animals, subject to biological constraints. Humans are prone to a multiplicity of errors and studies demonstrate that these errors are especially prevalent in complex systems like fi nancial markets or when making fi nancial decisions, in particular. Humans routinely exhibit irrational and nonrational behavior. In fact, rational behavior may be the exception to the rule. As the famous playwright Oscar Wilde observed, “Man is a rational animal who always loses his temper when he is called upon to act in accordance with the dictates of reason.” How rational are investors? If investors are shown to be relatively irrational, then is it logical to assume the markets are rational? If the markets are not as rational as assumed by MPT, what are the implications for effectively modeling markets.
Richard Thaler, Professor of Behavioral Science and Economics at the Graduate School of Business at the University of Chicago and 2002 Nobel Price winner Daniel Kahneman, Professor of Psychology at Princeton University are the founders and leading proponents of Behavioral Finance. Some of their ideas have been in scholarly development for over 30 years, but had been largely dismissed until the internet bubble shattered the neoclassical grip on economic thought. Their core premise is that humans make errors, especially with respect to investing. Some of their most popular observations include the “Hindsight bias,” commonly referred to as “Monday morning quarterbacking” and the “Overconfi dence bias” or the many ways people fail to assess risk properly (Kahneman and Tversky: 1972, 1973, Barber and Odean: 2000, 2001). Today, there are literally hundreds of studies showing “bias” in fi nancial markets.
Bodie, Kane and Marcus wrote that, “Behavioral Science fully demonstrates that individual behavior is not well approximated by standard utility analysis of economic theory (2003).” Even Fama, the leading proponent of the EMH, has had to modify his views. In 2005, Fama acknowledged in a broadly attended conference of his peers that because of poorly informed investors, markets could become “somewhat irrational.” Thaler, a leading proponent of Behavioral Finance, mocked Fama with whom he has had a longstanding intellectual feud by replying, “I guess we’re all behaviorists now (WSJ, 2005).” Behavioral evidence has forced Fama to adjust his concept of effi ciency. His defi nition of effi ciency now incorporates the belief that the market is effi cient in refl ecting mass states of consciousness and rational states are just one of many states and not likely a dominant one. Fama does not explain how the dominant nonrational states can be mathematically modeled.
Kendall, in a 2003 issue of Technically Speaking issued a strong endorsement of Behavioral Finance as supporting TA because behavioral observations coincide with technical themes. Pruden refers to TA as “applied behavioral fi nance.” TA documents the observations of Behavioral Finance. The study of market behavior shows that there are common tendencies that are played out repeatedly. One tendency is for investors, and people in general, to extrapolate the past into the future. This tendency causes trends to persist, something well documented in the TA body of knowledge.
23JOURNAL of Technical Analysis • 2006, Issue 64
Pruden argues that markets refl ect the thoughts, emotions, and actions of real people as opposed to the idealized economic investor that underlies the EMH (Journal of Technical Analysis, W-S 2003). Behavioral Finance considers these elements unlike neoclassical economics. In the fi nal analysis, markets are epiphenomenal manifestations of biological activity. Behavioral Science illustrates the fact that humans are animals subject to the infl uences and constraints of our biology and our environment. While neoclassical economics has the Platonic appeal of perfect ideas, the application to markets is limited because there is no incorporation of human behavior and its biological origin.
IV. Biology, Evolutionand Financial Markets
Every man takes the limits of his own fi eld of vision for the limits of the world.
Arthur Schopenhauer Human experience and behavior is ultimately rooted in the brain. The
human brain is a unique structure in the animal world. Its size and complexity sets us apart. One of the traits directly related to our evolved brain is an advanced ability for memory and data processing.
Howard Fields MD/PhD and Professor of Neuroscience at UC San Francisco, asserts that memory is about collecting important data and “from a biological or evolutionary perspective, memory is about the future (Fields 2005).” Vital experiences related to survival and reproduction “are immediately apparent, and memories of them are socked away permanently,” according to Fields. Heightened states of attention, stress, and novelty stimulate memory consolidation. Fear and greed are biochemical states that reinforce memory retention (LeDoux, New York University 2005). Memories are consolidated for survival, not necessarily accuracy. Each night the brain sorts through fresh memories, integrating them with other memories and biochemically isolating them in various brain regions for permanent storage, while many short-term memories are simply discarded. Individual brain chemistry determines how well memories are retained or integrated (Fields 2005). Memories are the foundation of our personal database. Even under ideal circumstances, people typically do not possess all the information needed to make accurate decisions (Dunning, Heath, Suls 2005). Some level of misinformation corrupts all of our memories. The memories about oneself may be our most corrupted pool of information. Individuals consistently make false self-assessments. “Mispredictions,” usually overoptimistic ones, arise because people do not have all the information they need to make accurate forecasts (Dunning, Heath, Suls, 2005). Important details of the future are missing in almost any decision. People fail to adjust to the reality that many or future facts are unknown, unknowable or unpredictable.
David A. Dunning, Professor of Psychology at Cornell University and Professor of the Graduate School of Business at Stanford University and Jerry Suls, Professor of Psychology at the University of Iowa have completed many studies on what they refer to as the problem of “fl awed self-assessment.” In the absence of “complete feedback, people harbor infl ated views about the wisdom of their decisions.” In many environments, success is hard to defi ne, and as a result, people regularly assess themselves as “above average” in competency (Dunning, Meyerowitz, Holzberg, Cornell, 1989). People misjudge their skills in relation to others by ignoring crucial information. Comparative judgments “paradoxically involve very little actual comparison,” due to egocentrism (Dunning, Heath, Suls 2005). People have tendencies to create arbitrary standards of measurement in order to compare themselves. Though arbitrary, these standards consistently permit individuals to present
themselves in a favorable light. Errors rise with increasing “incompetency” as well. Incompetent
individuals “suffer a double curse: their defi cits cause them to make errors and also prevent them for recognizing what makes their decisions erroneous and the choices of others superior” (Dunning, Heath, Suls, 2005). Incompetency rises with stress levels. Stress can be caused by information overload, new or unusual circumstances, competition, sleep deprivation, environmental stresses such as cold or heat, dietary stresses, workloads, fi nancial pressures, impaired health conditions of all kinds, and especially those related to “transduction.” Transduction is the process of processing stimuli into facts about the world.
Additionally, people have diffi culty predicting their emotional responses and the decisions they will make in relation to those emotions. Fear and greed or decisions surrounding money come readily to mind, as well as hunger, sleepiness, and other visceral states. When people are in a logical state of mind, their decisions “mispredict” their reactions in “hot” or emotional/visceral states (Dunning, Heath, Suls, 2005). Memory, access to memories, and the embedded information related to memories are state dependent. Dunning, Heath, and Suls conclude that, “In sum, a wealth of evidence suggests that people may err substantially when they evaluate their abilities, attributes, and future behavior (2005).”
The research from neuroscience and psychology provides a solid foundation for the theories of Behavioral Finance. Many contemporary economists have had to integrate Behavioral Finance into their models. Based on observations, rather than refl ecting anomalies, Behavioral Finance exposes market participants for what they are—human beings. Aristotle, defi ning humans as “rational animals” 2300 years ago, set the course for Western philosophy. Yet, rational consciousness is fragile and easily overshadowed by the slightest biochemical alteration. Operating under the infl uence of human biological and behavioral peculiarities, less than ideal circumstances predominate in fi nancial markets.
V. The Adaptive Market HypothesisBoth competition and cooperation are observed in nature.
Natural selection is neither egotistic or altruistic. It is rather, opportunistic.
Theodosius Dobzhansky
Dr. Andrew W. Lo is the fi rst to “reconcile” human behavior, the theory of evolution and neoclassical models. He calls his reconciliation “the Adaptive Market Hypothesis.” Lo’s new framework has traditional models of modern economics coexisting with behavioral models in a logically consistent manner, representing essentially, “two sides of the same coin (2004).” Rather than the neoclassical assumption that individuals are rationally maximizing “expected utility,” his evolutionary model argues that individuals through generations of natural selection seek to maximize the survival of their genetic material. Human behavior evolves by natural selection and is dependent on the surrounding ever-changing environment.
According to Lo, individuals act in their self-interest and in doing so they will often make mistakes and from these mistakes, individuals learn and adapt. Competition drives individuals to innovate. Natural selection shapes market ecology and evolution determines market dynamics. Lo argues that natural selection operates not only upon genetic material, but also on biological activity, social behavior, and culture. In societies, it becomes “survival of the richest.” Individuals develop heuristic steps to tackle economic challenges that “eventually will adapt to yield approximately optimal solutions (2005).”
Lo addresses the more glaring fl aws in the EMH. Evolving systems, he says, do not converge on an ideal state, and “equilibria” may never occur as
JOURNAL of Technical Analysis • 2006, Issue 6424
described in the EMH. “Aggregate risk preferences” are not fi xed, as assumed by the EMH, but are constantly being shaped by the forces of natural selection. In the EMH, history is a “trendless fl uctuation,” but according to Lo, and intrinsic to evolution through the process of natural section, history matters. Each event has an impact on future outcomes.
The particular path that market prices have taken over the recent past, infl uences current aggregate risk preferences, according to Lo. Successful behavior reinforces itself over time, while unsuccessful behavior is self-limiting. Adaptability and innovation are the primary drivers of survival. Flexibility and open-mindedness to change can mean the difference between survival and extinction in the fi nancial markets. Rather than only the trend toward higher effi ciencies dictated by the EMH, the AMH implies and incorporates more complex market dynamics. Trends, cycles, bubbles, panics, manias and other phenomena are common in “natural market ecologies,” according to Lo.
In the EMH, skill is qualitative and provides no value over time. In the AMH, ‘skill’ is equivalent to knowledge or discernment. With the AMH in mind, TA can be seen as an adaptable tool and fl exible system for rapidly changing fi nancial markets. At the core, TA is a technology. A very common phrase among technicians is that “it works.” Even among the newest practitioners, it is widely accepted that advantages fl ow to the user. The level of utility is so high there is usually little concern as to why it works.
The AMH reinforces the important role of history as perceived by technicians. TA is focused on the signifi cance of history in shaping events and outcomes. Yet, TA is inherently innovative and novelty-sensitive. Like evolution itself, TA is dynamic, not static. Practitioners are conditioned to be in constant feedback loop with the markets to assess change, process it, and adapt accordingly.
VI. Interdisciplinary ModelsFor Financial Markets
Chance favors the prepared mind.Louis Pasteur
Lo’s thought-provoking introduction of evolution into market theory is a
daring risk for a well-established professor at a top university. It takes courage to challenge the current orthodoxy, but with increasing frequency, respected members of the academic community are speaking-up. It is likely that ignored market theories will get a credible evaluation in coming years as the critical mass builds for a new paradigm. Through the years, theorists from various disciplines have modeled the markets to increase general understanding and investor success. Many of these models have not been thoroughly studied.
Chaos Theory is the study of unstable, aperiodic behavior in deterministic nonlinear dynamical systems. Translated into nonmathematical language, Chaos Theory attempts to explain phenomena in nature that starts from an orderly state and evolves into a non-repeating or disorderly state. The mathematical formulas that characterize chaotic systems depend on the details of initial conditions. Relatively simple formulas can generate complexity, disorder, and even unpredictable order with repetitive qualities. A chaotic system is deterministic, in that, it can be defi ned initially with a relatively simple formula. However, the data generated from the system rapidly becomes insoluble. The application of Chaos Theory to fi nancial markets is irresistible, since markets often appear chaotic. Market openings can be treated like “initial conditions” and although there is an order, no two days are alike. Markets have patterns that appear repetitive but are not the same. The nonlinearity and the multivariable nature of markets offer the most compelling allure for using Chaos Theory to model markets.
Benoit B. Mandelbrot, Professor of Mathematical Sciences at Yale University is recognized as the founder of fractal geometry in 1975 and, later, popularized Chaos Theory. His work originated out of his interest in fi nancial markets. Other interests took him away from fi nancial markets for many years as he pursued a quantitative model for “roughness.” Roughness is used to describe the actual nature of physical phenomena. Clouds are not spheres, mountains are not triangles, and coastlines are not straight lines. Mandelbrot has shown that fractals are useful models for many natural phenomena including Brownian motion. Brownian motion, of course, was the inspiration for Malkiel’s “Random Walk Theory” central to the EMH.
Mandelbrot has recently turned his attention back to the financial markets with renewed vigor. “Like the weather, markets are turbulent,” he states, associating fi nance with Chaos Theory. Turbulence is one of the well-established applications of Chaos Theory (2004). According to Mandelbrot, markets are much more risky than assumed. His penetrating critique of the standard model is that it focuses on asset allocation as opposed to actual market behavior, noting the unpredictably wild price swings of the markets. Mandelbrot takes a fractal view of the fi nancial markets, rather than a behavioral perspective. The cause of the volatility is not human behavior in Mandelbort’s mind, but the structure of the market itself. Because he misses core behavioral infl uences, he believes markets can be reduced to mechanics and the principles of physics—an obvious dead-end in my opinion. Nevertheless, his observations are fascinating and worthy of note since his keen insights expose the weaknesses of MPT.
He argues that history, or what he prefers to call “memory,” matters in the markets. Mandelbrot relies on the mathematically defi ned concepts of “permanence” and “dependence” developed by other mathematicians. These equations are designed to describe “long-term memory” in the markets. These mathematicians attempt to draw a mechanistic relationship between prices defi ned as memory or “statistical dependence,” without any reference to human brains associated with this memory or dependence.
Mandelbrot develops the idea of “market trading time,” and its corollary, the fact that market-timing matters. Volatility and “titanic events” underscore the role of timing, he argues. The unfolding of events in the markets has a “multifractal nature,” because there is an unlimited potential for scaling, as there are “no intrinsic time scales.”
Prices often “leap” and there are constant exceptions to the “Principle of Continuity,” according to Mandelbrot. The Principle of Continuity, otherwise known as “cause and effect” is one of the core assumptions of empirical science and applied mathematics, including calculus. For Mandelbrot, markets are “discontinuous” and operate in “psychological time.” Mandelbrot does not seem to notice that psychological time implies a human component. “Markets are deceptive,” he adds, and it is diffi cult to discern meaningful patterns from “noise” or “chance,” unlike EMH proponents who think it is impossible.
Mandelbrot argues that any model of the market must be probabilistic. However, the data does not conform to the standard Bell Curve as assumed under MPT. On the contrary, price changes are statistically dependent and not normally distributed. “The data overwhelmingly show that the magnitude of price changes depends on those of the past, and the bell curve is nonsense. Speaking mathematically, markets can exhibit dependence without correlation (2004).” Mandelbrot’s observations are in direct opposition to the EMH and highly supportive of TA.
One may assume that Mandelbrot would embrace TA based on his view of markets. Instead, Mandelbrot is a harsh critic of TA, casting it pejoratively as “fi nancial astrology.” Mandelbrot slanders technicians further, calling TA a “confi dence trick.” A con is no more than a swindle and implies the intention of purposefully misleading unsuspecting investors for fi nancial gain. This is a reckless claim that cannot be substantiated.
He believes that “chartists can at times be correct,” but it is because of self-fulfi lling prophecy. He declares, “Everybody knows what everybody
25JOURNAL of Technical Analysis • 2006, Issue 64
else knows about the support points, so they place their bets accordingly (2004).” I have already shown the self-fulfi lling prophecy critique to be a specious argument. In addition, as noted earlier, TA was developed, applied, and considered benefi cial before “everybody” knew about support points. Moreover, newly developed and, often, proprietary methods back-test successfully, without “everybody” knowing about them and are commonly held in secret if proven successful.
Although condemning TA, incredibly he edges to the precipice of embracing the discipline. Mandelbrot acknowledges, “Price charts have meaning” and do not “all vary by the whim of luck.” In Mandelbrot’s spellbinding book, The (Mis)behavior of Markets: A Fractal View of Risk, Ruin and Reward (2004), his investigations provide the most devastating critique of the standard model to date, while inadvertently supporting TA. However, he explicitly parts company with technicians and proceeds to contradict himself.
His misguided ‘coup de grace’ against TA is worth exploring since it exposes specious arguments often used by critics. Mandelbrot notes that by running fractal formulas on his computer he can create two and three dimensional mountain graphs “randomly.” “Chance alone can produce deceptively convincing patterns,” he proffers. Mandelbrot explains that observers cannot tell the difference between real and arbitrary patterns. Rhetorically, he asks the reader to identify the “real chart” from the manufactured ones. Since it is impossible to distinguish the real chart, he reasons, real charts must be inherently random also. He concludes that people simply project a pattern onto random data. We are inclined to see “spurious patterns” where none exists because it is the nature of our minds to do so, according to Mandelbrot. The argument is alluring since psychologists have shown for years that people will manipulate, often capriciously, complex and seemingly random information into meaningful patterns. Neuroscientists have demonstrated that our brains are wired to organize a mass of sense data into orderly patterns.
Nevertheless, it is only necessary to point out Mandelbrot’s contradiction to dismantle his argument. Namely, on one page of his book he writes that charts have meaning and then on another he writes that they are random creations of chance. He wants it both ways to suit his argument. It was Aristotle who pointed out that if one permits the introduction of a contradiction into an argument then anything could be proven. Yet, it is interesting to address his argument in a vacuum, as if it stood alone, since many modern economists would agree with Mandelbort’s argument and not contradict themselves about TA as Mandelbrot does.
All told, Mandelbrot’s argument is based on a “category mistake”. The philosopher Gilbert Ryle defi ned a category mistake as a semantic or ontological error when a property is ascribed to something that could not possibly have that property. In this case, it is an error to attribute randomness to an actual, context-dependent, fundamentally rich chart of the Dow Jones index, for example. In practice, a seasoned technician could identify an actual chart of various periods given a modicum of contextual clues. Similarly, one can imagine a seasoned geographer being able to pick out an actual local mountain range from a collection of Mandelbrot’s three-dimensional creations. If Mandelbrot were lost in the Santa Monica Mountains, he would want his rescuer to know the terrain, not a randomly selected volunteer. We can only hope he takes the same precaution with his portfolio manager.
Similarly, Random Walk Theorists make the same mistake with a deceptive coin tossing exercise repeated in economics courses across the country. Students are asked to fl ip coins, assigning a plus to “heads” and a minus to “tails.” The students then plot their results onto a Cartesian coordinate system. When the points are connected forming a graph, classic technical patterns are observed. The Random Walkers declare speciously that this proves that technical analysis is nonsense, since the chart patterns can be generated “randomly.” The inference is that the actual market patterns noted by technicians are randomly generated as well. As in Mandelbrot’s argument,
randomness is assumed an ontological or innate characteristic of the data. Yet, it is not. Market data is content and context-dependent. Therefore, it is erroneous to prescribe randomness to data that is not random. How many investors fl ip a coin before buying or selling securities? Price data is not generated by a random process like a coin toss, but by human intentionality. Moreover, any data set plotted graphically will have similar patterns. I could plot the daily high temperature in my community, for instance. Does it follow that the pattern generated is random like that from coin tosses? Of course not. It is a ridiculous inference.
J. Doyne Farmer and John J. Sidorowich provide yet another reason why the random coin toss argument is specious, by noting that if “we made precise measurements of the motion of the coin as it left our hand, we could predict the fi nal outcome. People who are skilled in fl ipping a coin properly can do this (1998).” One can imagine someone getting the feel for fl ipping “heads” by developing a methodology. Like shooting free throws, it is easy to imagine someone on a hot streak, intentionally fl ipping “head” after “head.” Farmer and Sidorowich highlight the illogic of applying mechanistic principles to human behavior and complex systems in general. They argue, “Randomness occurs to the extent that something cannot be predicted.” However, as they note, identifying randomness is an empirical process. “With a better understanding of the underlying dynamics, better measurements, or the computational power to process a suffi cient amount of information,” they argue, “behavior that was previously believed random might become predictable.” Supporting my view of “apparent randomness,” they argue that the leading cause of unpredictability is “ignorance (1998).”
A friend of mine, returning from his fi rst trek through the Amazon jungle, told me that, “everything was green.” After several years of intense botanical study, he returned to the jungle and said he had a completely different experience. Now, he was able to detect many different shades of green, identify variations of leaf shapes and discern layers of order like the dynamics of competition among plants, for instance. The myriad of describable patterns were obvious to him while before he saw only a monochromatic blur.
Another similar example is my experience with the ocean. Having lived near the ocean my whole life, I have been active in and on the water since I was young child. When with less experienced ocean-going friends, I occasionally make an off-hand comment about the obvious trends I see developing in the swells, tides or wind and inevitably my “predictions” unfold. With incredulous astonishment my friends would ask, “How did you know that would happen?”
Both the Amazon jungle and ocean examples are effective allegoric characterizations of how one’s knowledge base affects perception. To the inexperienced and unknowledgeable, the market can seem chaotic and random, but to the experienced and informed, the pulse of intensity seen in volume numbers and other measures, the variation in price movements, the underlying structure and cyclic patterns are all very familiar and may offer a predictive advantage over other uninformed investors.
Randomness, on which Mandelbrot bases his argument, is problematic. He and many of his colleagues may be conferring more potency to the term than it is entitled. Scientists have a very diffi cult time defi ning or generating true randomness. Brian Hayes, Computer Scientist and author said that, “After 40 years of development, one might think that the making of random numbers would be a mature and trouble-free technology, but it seems the creation of unpredictability is ever unpredictable.” Hayes made that comment 12 years ago, and a quick review of current thinking on the topic indicates any ostensible model of randomness has proven ephemeral.
Philosophically, true randomness may be possible only if one forgoes “cause and effect,” something most scientists do not wish to entertain. The defi nition of randomness, “the apparent lack of purpose, cause, or order” is noteworthy for my emphasis on the word “apparent.” What may be random to most observers may not be so to an informed party. Evidently, “randomness,”

JOURNAL of Technical Analysis • 2006, Issue 6426
as used by some economists, appears to describe their experience rather than the object of the data itself. Mathematically, randomness is the lack of bias or correlation. Mandelbrot ascribes a lack of correlation to the markets in general. Perhaps, like the Random Walkers, in the end his argument is circular: the markets are random because they are random.
Ultimately, Mandelbrot is too wedded to the modern mainstream view adjusted for his special brand of “fractally wild randomness” and has not assimilated behavioral science into his work. Extreme market volatility is explained better by psychology, than chance. In addition, Mandelbrot has not resolved the inconsistency that his mathematical insights are incompatible with the mathematical assumptions of the standard model. He misses the fundamental contradiction of defining the markets as nonlinear, while subscribing to the linear calculations of MPT. To the neoclassicists he is undoubtedly a heretic, but he insists on their mantle.
Jeremy J. Siegel, Professor of Finance at Wharton, like Mandelbrot, writes about “noise” in the markets. Recently, in the Wall Street Journal (June 2006), Siegel proposed the “Noisy Market” Hypothesis. In a direct attack on the EMH, Siegel says that the “prices of securities are not always the best estimate of the true underlying value of the fi rm.” According to his “new paradigm,” because of “temporary shocks,” and what he calls “noise,” prices are obscured from “their true value.” Examples of noise would include the activities of speculators, momentum traders, insiders and institutions, “that often buy and sell stocks for reasons unrelated to fundamental value, such as for diversifi cation, liquidity, and taxes.” Mandelbrot uses the term ‘noise’ often, and in a similar way, in his recent book. Mandelbrot equates ‘noise’ with randomness or chance, while Siegel implies that it represents causal price distortions, as described in Complexity Theory. Siegel could have included other reasons to explain market noise; like performance driven behavior, management changes, investment objective changes, the list goes on. When you add it all up, the question comes to mind: “What’s left?” Again, ‘noise’ does not appear to be useful construct.
Siegel is on the right track when he says, “…we’re at the brink of a huge paradigm shift. The chinks in the armor of the effi cient market hypothesis have grown too large to be ignored.” He concludes, “The noisy market hypothesis, which makes the simple yet convincing claim that the prices of securities often change in ways that are unrelated to fundamentals, is a much better description of reality…”
Given the advent of Behavioral Finance, it is noteworthy that Mandelbrot and Siegel, like many prominent economists, do not even mention the contributions of the fi eld. Why the bias against acknowledging behavioral infl uences? Behavioral factors are diffi cult to measure and virtually impossible to formalize. Consequently, modern portfolio theorists are inclined to circumvent them. Circumvention is a common methodology in applied mathematics, but it is always used explicitly as a strategy to solve otherwise insoluble problems. Yet, many economists cavalierly ignore the human element altogether. Irrational and nonrational factors are only quantifi able in nonlinear terms and impossible to model in traditional equations. Most academics would rather risk being incomplete than jettison the mathematical framework developed over the last 50 years. If one excludes TA, as the academic community is so wont to do, there is no way for them to include human behavior and remain consistent. TA assesses behavioral infl uences and attempts to measure nonlinear data.
Robert A. Haugen, in The New Finance: Overreaction, Complexity and Uniqueness (2004), is critical of the EMH, what he calls the “standard rational model.” He is also critical of pure behavioral models. Haugen says current models “are fundamentally fl awed because they fail to account for the complexity and the uniqueness of behavioral interactions on ultimate outcomes.” Most rational and behavioral models assume an orderly environment, but “markets are complex, ranging between order and chaos,” a key theme throughout his work. Haugen, in an earlier book reference, was
obviously infl uenced by The Economy as an Evolving Complex System: Santa Fe Institute Studies in the Sciences of Complexity Proceedings (1988). Interestingly, the Forward is by none other than Nobel Laureate Kenneth J. Arrow, the reformed neoclassical economist. Arrow also co-edited the book, and signifi cantly, one of the chapters is by Stuart Kauffman.
According to Haugen, current economic sophistication cannot come close to mapping complexity because of the sheer quantity of variables, what he calls “the myriad of unique interactions in the market place.” Mathematically, the problem is “intractable,” he asserts. Because each individual interaction is unique, simple economic models are rendered “meaningless.” Haugen calls his model “The New Finance,” where investors “view, understand, and then predict the behavior of the macro environment, rather than attempting to go from assumptions about micro to predictions about macro.” He adds, “The market is in such a constant state of complex interaction that no individual behavior, rational or irrational, can be aggregated, modeled, or generalized under an assumption of a fi xed set of external conditions.”
Haugen started out his academic career as an effi cient market theorist and believed in a “rational market.” In 1996, Haugen and a colleague published what Barron’s described in 2006 as a “ground-breaking study,” abandoning the notion that markets are effi cient. I should mention that all of Haugen’s writings are fascinating works, written with zeal, wit, and humor.
Haugen writes that he has developed proprietary “state-of-the-art expected return statistical models” to get “very high rates of return in the fi nancial markets.” He indicates his model takes advantage of extreme levels of volatility when they occur in the markets. Based on the evidence presented in his book, Beast on Wall Street: How Stock Volatility Devours Our Wealth (1999), Haugen describes three types of volatility: “event driven,” “error driven” and “price driven.” Event driven volatility is consistent with price changes described by the EMH, essentially, instantaneous price changes in response to real economic events. Error driven volatility is consistent with the under and over-reactions of investor behavior described by Behavioral Finance. Price driven volatility is the most prevalent form by a signifi cant degree and is caused by traders responding to the actions of other traders. Price driven volatility is “the overwhelming driving force” in the markets and somewhat arbitrarily tied to fundamental values where “prices react to price changes.” From the perspective of initiating investments, it can be inferred from Haugen’s arguments that as volatility measures get extreme, the potential for successful outcomes soar, reminding me of Baron von Rothschild’s axiom: “Buy when there is blood in the streets.” Haugen defi nes “bias” as the “aspect of ineffi cient market pricing whereby the market tends to underestimate the power of competitive entry and exit…”
In his book, The Ineffi cient Stock Market: What Pays Off and Why (2002), Haugen includes TA as part of his formula for identifying the best stocks to own. He coins the phrase “Technical Payoff” which is the “component of return that can be statistically related to some aspect of the previous history of a stock’s performance.”
To his credit, Haugen attacks the bias against observational science in economics head-on. Haugen argues that induction is the only effective way to observe “macro behavior.” Sounding like a technician, he says, “An inductive effort, such as this, attempts to peer through the fog of interactive, price driven volatility, searching for patterns and tendencies (2004).” The process of inductive reasoning is the foundation of observational science. Conclusions drawn from the scientifi c method are made by induction. In science, laws are formulated from limited observations of recurring phenomenal patterns. Scientists induce the universal from the particular.
Similarly, applying the rules of induction, Shiller wrote, “It is important to collect information directly on the popular models that people have with regard to speculative markets, and the associated investor behavior.” “Direct evidence” can be collected “by using experimental methods or by observing investors in the actual investing environment (2001).”

27JOURNAL of Technical Analysis • 2006, Issue 64
when formulas will not work, predictive certainty fails, probabilities remain, and outcomes must be observed. This insight, when applied to the market, reinforces the observational strengths of TA.
Kauffman’s work shows that self-organization merges with natural selection to yield unanticipated and increasingly complex results. Out of self-organization comes the spontaneous formation of patterns. Rather than a “random walk,” Kaufman sees an “adaptive walk.” The adaptive walk leads to “improvement steps” towards optimization. History matters in complex systems or as Nobel Laureate Ilya Prigogine wrote, history is a “time irreversible process” and implies “an evolutionary pattern (1996).”
With respect to economics, Kauffman writes that “agents” are constantly reworking their applications to maximize success, thus creating a “persistently changing pattern of action.” Kauffman, harmonious with Lo’s AMH, notes that, “Economics has its roots in agency and the emergence of advantages of trade among autonomous agents.” Agents optimally develop a map of their neighbors to predict their behavior. The economy, like all complex systems, is context-dependent. All variables are interrelated.
One of the core principles of Complexity theory is that agents learn and adapt and this can be observed in the markets. Any model that incorporates adaptive behavior leads to a signifi cant increase in the complexity of the dynamics (Bayraktar, Horst, Sircar: July 2003, revised March 2004). As mentioned earlier in Lo’s AMH, adaptive success can be seen as a self-organizing property in the markets. Success creates a “positive feedback loop” and is an example of “self-reinforcing behavior” (Arthur, 1988). We may recall that Shiller drew upon the concepts of feedback loops and self-reinforcing behavior to explain market volatility. It seems obvious that these forces drive market effi ciencies too.
Complexity theory integrates the concepts of self-organization, selection, evolution, and chance. It also incorporates cooperation, a concept missing from most models but certainly very apparent in the markets and human behavior, in general. Friedrich Hayek, 1974 Nobel Prize winning economist, while infl uenced by the Austrian School, coined the term “catallaxy” as a “self-organizing system of voluntary co-operation,” while defending capitalism. Ahead of his time, he saw the markets as coming out of “spontaneous order” and being “the result of human action, but not of human design,” predating the concepts of self-organization and emergent properties. Incidentally, in a salute to Hayek, Adam Smith’s “invisible hand,” can be seen as an emergent property of evolving market participants competing and cooperating for successful outcomes.
Emergence is a central concept in complex systems. Researchers are still developing a scientifi c consensus on the various forms. One defi nition of emergence is the process of complex pattern formation from simple rules as developed by Stephen Wolfram and further by Kauffman. Emergent properties are features of a system that arise unexpectedly from interactions among the related components. As Kauffman states, “the whole is greater than the sum of its parts,” so emergent properties must be considered relative to the system’s component interactions in aggregate and not simply by the study of the property itself. Interactions of each component to its immediate surroundings cause a complex process that leads to order.
Most technicians operate with these principles in mind when evaluating securities and markets. The agents or investors, in this case, acting on their own behalf, operate within the regulatory rules of the various markets. Through these individual interactions, the complexity of the market emerges. Technicians seek to identify and measure emergent structures and the spontaneous order appearing in the market at many different levels of analysis.
Perry J. Kaufman is one of the earliest traders to combine TA with Complexity Theory. He is one of the fi rst to create multivariable computer models for making adaptive market decisions. The focus of his work over the last 30 years has been to understand the “interactions of complex market structures using technical and quantitative tools.”
Although this makes perfect sense to technicians, Haugen’s and Shiller’s scientifi c approach to markets is virtually unheard of among leading academics. It is interesting and somewhat revealing to note that the Austrian School, the early founders of classical economics in the early 1900s, rejected the use of observation, believing humans were too complex. Austrian economists rejected extrapolating from historical data and made the behavioral assumption that humans were logical rather than reactive. Out of these views, they developed the concept of “utility” or satisfaction, that all human act logically to remove primary dissatisfactions. Obviously, these core assumptions still hold sway in academia today.
Haugen’s focus on complex interactions, chaos and uniqueness are important concepts in Complexity Theory. Complexity Theory appears to be at the core of Haugen’s views, yet he does not refer to it directly. Instead, like Shiller, he writes as if Complexity Theory is a given.
According to Stuart Kauffman, the most complex and coordinated behavior occurs in networks at the edge of chaos (1993). For Kauffman, a complex system has many independent agents interacting with each other in many ways, undergoing spontaneous self-organizational behavior that is intrinsically adaptive. He sees chaos as a phenomenon in complex systems, but while Chaos Theory recognizes and chronicles order in nonlinear systems, he feels the theory fails to account for it. Instead, Complexity Theory focuses on “cycles,” “webs,” and “patterns” (Pines, 1988). The insight of self-organization is the critical missing piece, according to Kauffman. Self-organization occurs on many scales and may be a fundamental law of nature. Complexity Theory and self-organization can explain Mandelbrot’s concepts of fractal geometry, self-similarity, and discontinuity. Kauffman sees self-organization as at least as important as natural selection in describing natural phenomena.
Stuart A. Kauffman, physician, biologist, complex systems researcher and former Professor of Biochemistry and Biophysics at the University of Pennsylvania, started the BIOS Group, a company using complex systems methodology to solve business-related problems. Kauffman rose to prominence as a researcher at the Santa Fe Institute, a non-profi t research center dedicated to the study of complex systems. He is the author of several “must read” books on Complexity Theory and its application to evolution and fi nancial markets. As we shall see, Complexity Theory provides additional deep insights into market behavior.
VII. Complexity Theory andFinancial MarketsSeek simplicity but distrust it.
Alfred North Whitehead
As Stuart Kauffman writes, self-organization is the “root source of order” and leads to the “laws of complexity” and natural selection acts upon or within this context of inherent order. “Life and its evolution have always depended on the mutual embrace of spontaneous order and selection’s crafting of that order (1995).” Self-organization and the emergent properties resulting from the laws of complexity are observed at all levels “from ecosystems to economic systems undergoing technological evolution.” Kauffman states, “Complex adapting systems” from single cells to economies “evolve to a natural state between order and chaos.” He sees the small, best choices of agents triggering signifi cant and substantial co-evolutionary change as they compete and cooperate to survive. “Self-organization may be the precondition of evolvability itself. Only those systems that are able to organize themselves spontaneously may be able to evolve further (1995).”
The work of Kauffman and others, highlights that simple rules lead to complex, often fractal patterns. These simple rules generate patterns that cannot be reduced to a linear equation. Complexity Theorists argue that
JOURNAL of Technical Analysis • 2006, Issue 6428
VIII. Market Patternsas Emergent Properties
The hypotheses we accept ought to explain phenomena which we have observed. But they ought to do more than this: our hypotheses ought to
fortell phenomena which have not yet been observed.William Whewall
The work of contemporary economists, such as Shiller, Siegel, John Y. Campbell, Karl E. Case, Sanford J. Grossman, shows that market volatility is related to “patterns of human behavior” and these patterns are refl ected in price action. Price trends are caused by both economic fundamentals and changes in opinion or psychology.
While technical patterns, such as ascending triangles, falling wedges and the like, are criticized for being hard to identify, they provide a technology for working with the complexity of the markets (Caginalp and Balenovich JTA W-S 2003). To the uninformed, TA can appear arbitrary and unscientifi c, but complex systems require fl exible, adaptive models that can change as fast as the data appears and patterns materialize.
Emergent properties appear when a number of agents operate in an environment, like the markets, forming more complex behavior as a group. There are intricate, causal, feedback relationships across different scales. The emergent properties are often unpredictable and unprecedented (novelty) and may represent a new dimension to a system’s evolution. The systems components interact to produce patterns. Patterns are emergent properties of the system.
When applied to the markets, TA seeks to identify emerging properties as they surface. TA’s role is to fi lter out extraneous information that necessarily exists in a complex system (Kauffman 2000). TA may be the only effective method to quantify and measure the nonlinear data emerging out of a complex system like the market. TA is the key discipline that classifi es market patterns and other market phenomena.
In a complex system like the market, TA utilizes analytic geometry to make sense of the nonlinear data that is mapped onto a Cartesian coordinate system. The nonlinear data has patterns that refl ect the emerging properties of the market. Technicians draw on the body of knowledge of TA to analyze and make sense of the emerging patterns. Drawing from Complexity theory, TA seeks to identify formations that result from interactions between local and global information in the market. Global feedback can have local impact, infl uencing local activity, and vice versa, local activity can have a global impact. Charts and other technical tools are epiphenomenal representations of local and global market information. Complexity Theory defi nes local information as inherently incomplete, and even global information is incomplete. Since markets are complex systems, information is incomplete and, therefore, it follows that markets cannot be effi cient. Ineffi ciencies imply that the recognition of emergent properties or market patterns is not only possible, but provides an adaptive advantage.
Market formations are emergent properties of underlying market information. The formation of price trends is just one emergent property. Virtually all modern economists admit to the formation and duration of trends, as the evidence is incontrovertible. Cycles are another example, although somewhat more controversial. Technicians, of course, identify and measure trends and cycles on many different levels of the market.
Complexity Theory uses the term “criticality” or critical point phenomena to describe what has popularly become known as a “tipping point,” and somewhat similar to the antiquated cliché, “the straw that broke the camel’s back.” These terms refer to a system when at some critical moment after a period of incremental change, there is a sudden and dramatic change. One
common example is the sand pile, where new sand grains are added slowly until at some critical moment, there is an avalanche. As the sand pile gets larger, the phenomenon repeats itself, just on a larger scale, and the cycle continues repeatedly. Although the phenomenon repeats itself, each occurrence is unique and while unpredictable on an absolute scale, an experienced observer can learn to anticipate when the critical moment will occur. Technicians routinely observe this can kind of behavior in the markets, and seek to measure and anticipate patterns of criticality.
Complexity Theory also uses the term “cascade” to describe criticality or tipping point phenomena where there is an extended chain of causal impact, and one criticality immediately triggers another, generating an extended series of dramatic chain reactions. Cascades are also known as “multiplicative processes” and are observed throughout nature and on many different time scales, from microseconds to millions of years. Cascades are observed in fi nancial markets when external events can trigger chain reactions across many separate but interrelated markets. The term ‘contagion’ is often used for this phenomenon as well as ‘herd behavior’, having become a cliché for investor behavior. Without referencing Complexity Theory, Shiller introduces the concept of cascades into his theory of volatility. Shiller talks about a “sequence of public attentions (2001).” According to Shiller “well known facts or images” that were previously “ignored or judged inconsequential” can attain “newfound prominence in the wake of breaking news.” He continues, “These sequences of attention may be called “cascades,” as one focus of attention leads to attention to another, and then another (2001).”
Catastrophe Theory is another offshoot of these ideas that has been applied to Finance, typically to describe “market crashes.” Small changes in parameters can cause a previously stable system suddenly and massively to shift at “bifurcation points.” Mathematic equations have been developed that have well-defi ned geometric structures. These traits and the obvious link to tipping points, cascades, contagions, and herd behavior have intrigued some market theorists.
Richard Dawkins, evolutionary biologist at Oxford popularized the concept of “meme”. According to Dawkins, a meme is a “unit of cultural information” transmitted verbally or by demonstration from one person to the other. Memes are self-propagating and have an evolutionary infl uence on human knowledge and behavior. Memes are said to evolve via natural selection undergoing replication, mutation, survival, and competition. Some memes become extinct; others survive, replicate, and mutate, and the cycle of infl uence can be observed and monitored.
The concept of a meme is a useful way of understanding how Information Theory applies to human behavior. Information Theory is a discipline in applied mathematics, developed to understand how data is quantified, coded, processed and stored on a medium or communicated over a channel. Information Theory seeks to explain how communication can be accurately reproduced and then transmitted successfully. Because Information Theory typically translates human information into a mathematical code, it is very rigorous and well defi ned. These principles are imbedded in the concept of a meme. Memes refl ect this kind of coding as it refers to ideas, not mathematically, but as a description of how it is possible for ideas to infl uence human behavior and cultural evolution on a local and global scale. Unlike a mathematical code, memes are more like genes in that they are considered environmentally interactive and mutable. Memes can be seen as emerging patterns—cohesive thought-forms—rising out of local information, having a global impact and, then globally infl uencing local behavior, in a constant feedback loop. Fiat currency is one of the most compelling examples and it does not take much imagination to see how memes can be applied to virtually any unit of value.
Kate Distin, in The Selfish Meme, refers to memes as “meta-representations” or representations about representations. Memes have representational content that infl uences human behavior. Memes preserve
29JOURNAL of Technical Analysis • 2006, Issue 64
information and this information is active. Innovation according to Meme Theory is due to recombination and mutation. Memes compete for “survival” and people, institutions, and societies invest in the survival and propagation of particular memes.
The market can be defi ned as a representational system made-up of memes. The memes of the market compete for attention, acceptance, power, and infl uence. The survival of particular memes can mean fi nancial success to those invested in that meme. One way of understanding market patterns is that they are emerging memes. As infl uential memes work their way through society they stimulate investor behavior, generating patterns in the market. TA recognizes existing memes in the market, identifi es new memes as they emerge and notes the peak and eventual dissolution of previously infl uential memes. The comparative analysis of market memes is unique to TA.
IX. Market Analysis, Interpretation,and Intuition
Truth in science can be defi ned as the working hypothesis best suited to open the way to the next better one.
Konrad Lorenz
Technicians have the scientifi c fi repower to challenge the current academic orthodoxy. The empirical evidence is on the side of TA. Phil Roth, President of the Market Technicians Association, has argued very effectively that TA is quantitative, rather than qualitative. When we look at the data, all analysis is technical in origin or includes technical components. TA is the most empirically based science of the markets. Technical data is objective data about the markets. Yet, it is imperative that we distinguish between technical data and interpretation.
The universal bridge between data and interpretation is mathematics. The “quants” want precision, but as we have seen, temporary estimates of probabilities may only be possible in a complex system. Markets and securities prices are not objects subject to the laws of physics. Mathematical models in a complex system must be seen as provisional and heuristic, rather than static. TA, an ideal tool, by its very nature can incorporate and integrate all mathematical models as they are mapped onto a complex system.
Complexity Theory shows the dichotomy between “qualitative” and “quantitative” may be an artifi cial distinction. Like trying to separate energy from matter or time from space, there are qualitative elements in every quantitative analysis and quantitative elements in every qualitative analysis in a biologically based system. As we move forward, we may wish to forgo the dichotomy. It comes down to interpretation of information, hypothesis formation, and testing. Of course, the ultimate test is risking capital.
In the process of distinguishing between the science of TA and the practice, it is important to understand the role of interpretation. Interpretation of data can occur in a scientifi c context and in the context of application. In the context of application, interpretation is a function of skill. True of every fi eld and avocation, skill is a key factor in the application of information. Whether based on knowledge, experience, profi ciency, or invention, skill matters. Even though MPT provides little room for the concept of skill, common sense indicates that skill matters in all areas of life. It is almost laughable to have to defend the argument that skill matters. Again, just because the current academic orthodoxy has diffi culty defi ning, quantifying, and incorporating skill, does not mean it is an unimportant component in the markets.
As we have seen with Lo’s AMH, a skill-based advantage will lead to evolutionary effects and survival benefi ts, most namely, success. Substantial rewards fl ow to the successful. It is to be expected that top performers will
be very protective of their applications, systems, and insights. Secrecy and the proprietary nature surrounding any new technology are to be expected in order to maximize the competitive advantage of that technology.
Over time, some of these technologies have and will come to light for a variety of reasons. The body of knowledge of TA has grown and continues to grow as applications that are more technical are published and discussed. It is incumbent upon the leaders of the fi eld to distinguish between the scientifi c aspects of these new revelations, the interpretation of these discoveries and insights, and their application. Not an easy task, because most come to TA for the technology, rather than the scientifi c underpinnings. Most seek an investment advantage over other market participants. The focus tends to zero in on application, results, and measures of success.
The scientifi c foundations of TA will become increasingly important as the fi eld grows. As we have seen, cutting-edge scientifi c models support TA. Historically, modern economics, with limited results, has attempted to defi ne value around random price fl uctuations. More recently, Behavioral Finance has shed light on how emotion, cognitive processes, and human biology may infl uence markets. TA is the organizing principle that derives nonlinear solutions to the various probabilities of future price action around a locus of fundamental value and behavioral infl uences. By defi nition, TA incorporates all available information, models, systems, and disciplines. The key advantage of TA is that it is inherently model-independent (adaptable) while at the same time content and context-dependent (empirical). TA increases competency and success by making sense out of disparate and complex data, however modeled. TA is about gleaning and distilling as much market information as possible from available sources. This process of describing data is the science of TA.
TA is inherently heuristic, providing practitioners with a broad spectrum of tools to maximize intuitive interpretation. Intuition is the most condemned method of human cognition by the academic community. However, much scientifi c advancement is based on intuitive insights. Ultimately, the practice of TA is about accessing the intuition. In any complex system, analysis will often fail as the observer is easily overwhelmed by the mass of information. TA provides the experienced practitioner with clues about the unfolding present and its future implications, so that intuitive forecasts can be made. Intuition is what the “art advocates” have in mind, when they stress the art of TA. It is the intuitive skill set, developed over years of application, that the technician implements as an art form. The art of TA describes this experience.
John Bollinger wrote in July of 2004 about the need to integrate fundamental, technical, quantitative and behavioral science into what he calls “Rational Analysis.” My preference is the term ‘Market Analysis’ as it is consistent with the term ‘Technical Analysis’ and the term comfortably accommodates all disciplines. The goal of the Market Analyst is to defi ne core principles, develop possible market theories, delineate applications, and establish standards for performance measurement. With the use of computers and sophisticated modeling techniques, emerging market formations can correspond with a particular probability reading as to the direction and magnitude of price action within a given period. Caginalp and Balenovich suggested similar strategies offering predictive value with the use of algorithmic defi ned patterns from statistical computer testing (JTA W-S 2003). I look for continued advancement in the fi eld with the creation of probabilistic forecasting programs.

JOURNAL of Technical Analysis • 2006, Issue 6430
References:
Acampora, R., 2000, The Fourth Mega-Market: Now Through 2011, How Three Earlier Bull Markets Explain the Present and Predict the Future (Hyperion).
Aczel, A., 2005, Descartes’ Secret Notebook: A True Tale of Mathematics, Mysticism, and the Quest to Understand the Universe (Broadway Books).
Anderson, P., K. Arrow, & D. Pines, 1988, The Economy as an Evolving Complex System (Addison-Wesley Publishing Company).
Baets, W., B. Paranque, & H. Pruden, 2003, Behavioral fi nance and technical analysis: interpreting data from an experiment on irrational exuberance, part b: refl ections from three different angles, Journal of Technical Analysis 59.
Barabási, A., 2002, Linked: How Everything Is Connected to Everything Else and What IT Means for Business, Science, and Everyday Life, (Penguin Group).
Barabási, A. & E. Bonabeau, 2003, Scale-free networks, Scientifi c American (March)
Bauke, H. & S. Mertens, 2004, Pseudo Random Coins Show More Heads Than Tails (Institute for Theoretical Physics, Magdeburg, Germany)
Bayraktar, E., U. Horst, & R. Sircar, 2003, A Limit Theorem for Financial Markets with Inert Investors (preprint, Princeton University).
Bel, G. & E. Barkai, 2006, Random walk to a nonergodic equilibrium concept, The American Physical Society
Belsky, G. & T. Belsky, 1999, Why Smart People Make Big Money Mistakes—and How to Correct Them (Simon & Schuster).
Blackmore, S., 1999, The Meme Machine (Oxford University Press).Blume, L & S. Durlauf, 2006, The Economy as an Evolving Complex System III:
Current Perspectives and Future Directions (Oxford University Press).Brodie, R., 1995, Virus of the Mind: The New Science of the Meme (Integral
Press).Buchanan, M., 2002, Nexus: Small Worlds and the Groundbreaking Science of
Networks (W.W. Norton & Company, Inc.) Caginalp, G. & H. Laurent, 1998, The predictive power of price patterns, Journal
of Applied Mathematics 5 (September)Caginalp, G., 2003, A theoretical foundation for technical analysis, Journal of
Technical Analysis 59. Camazine et al., 2001, Self-Organization in Biological Systems (Princeton
University Press). Cohen, M. & N. Watson, 2000, The Bond Bible (Prentice-Hall Press). Conners, L. et al., 2004, How Markets Really Work: A Quantitative Guide to
Stock Market Behavior, (TradingMarkets Publishing Group).Davidson, Paul, 1998, A technical defi nition of uncertainty and the long-run non-
neutrality of money, Cambridge Journal of Economics.Dawkins, R., 1990, The Selfi sh Gene (Oxford University Press).Dennett, D., 1995, Darwin’s Dangerous Idea: Evolution and the Meanings of
Life. Dent, H. ,Jr., 1999, The Roaring 2000s Investor: Building the Wealth and Lifestyles
Your Desire in the Greatest Boom in History (Touchstone). --------, 1999, The Roaring 2000’s Investor: Strategies for the Life You Want
(Touchstone). Distin, K., 2005, The Selfi sh Meme: A Critical Reassessment (Cambridge
University Press).Dorsey, W., 2003, Behavioral Trading: Methods for Measuring Investor
Confi dence, Expectations, and Market Trends (Texere). Dunning, D., C. Heath, & J. Suls, 2006, Picture imperfect, Scientifi c American
Mind (February 6)
Fama, E. & K. French, 1992, The cross-section of expected stock returns, Journal of Finance 47, 427-466.
Fields, R., 2006, Erasing memories, Scientifi c American Mind (February 6)Flake, G., 1998, The Computational Beauty of Nature: Computer Explorations of
Fractals, Chaos, Complex Systems, and Adaptation (The MIT Press).Fog, A., 1999, Cultural Selection (Kluwer, Dordrecht).Frost, A. & R. Prechter, 1998, Elliot Wave Principle: Key to Market Behavior
(New Classics Library). Gardner, D. & T. Gardner, 1996, The Motley Fool Investment Guide: How
the Fool Beats Wall Street’s Wise Men and How You Can Too (Simon and Schuster).
Gilovich, T., 1991), How We Know What Isn’t So: The Fallibility if Human Reason in Everyday Life (The Free Press).
Gladwell, M., 2005, Blink: The Power of Thinking Without Thinking (Little, Brown and Company).
Gneiting, T. & M. Schlather, 2004, Stochastic models that separate fractal dimension and Hurst effect, SIREV 46(2), 269-282.
Goodwin, B., 1994, How the Leopard Changed Its Spots: The Evolution of Complexity (Princeton University Press).
Gross, B., 2005, Investment Outlook: Secrets, Pimco (December).Hagenbuch, R. & R. Capalbo, 2002, Investment Survival: How to Use Investment
Research to Create Winning Portfolio for the Coming Bull Market (Sinclair Printing Company).
Harris, J., 1988, The British Iron Industry, 1700—1850 (MacMillan Education, Ltd.)
Haugen, Robert A., 1986, Modern Investment Theory (Prentice-Hall)--------, 1995, The New Finance—The Case Against Effi cient Markets (Prentice
Hall).--------, 1996, The effects of intrigue, liquidity, imprecision, and bias on the cross-
section of expected stock returns, Journal of Portfolio Management--------, 1999, The Beast on Wall Street: How Stock Volatility Devours Our
Wealth (Prentice-Hall)--------, 1999, 2002, The Ineffi cient Stock Market: What Pays Off and Why
(Prentice-Hall)Homer, S., 1963, A History of Interest Rates (Rutgers University Press)Holland, J., 1998, Emergence: From Chaos to Order (Basic Books)--------, 1995, Hidden Order: How Adaptation Builds Complexity (Basic
Books)Horst, Ulrich & Wenzelburger, 2005, Non-ergodic behavior in a fi nancial market
with interacting investors, Discussion Paper #544 (January), Bielefeld University, GermanyHulbert, M., 2006, What took the Dow so long? Retrieved January 10, 2006, from
http://www.marketwatch.com.Hunt, L., 1976, Dynamics of Forecasting Financial Cycles: Theory, Technique
and Implementation (JAI Press)Hunter, G., 1973, Metalogic: An Introduction to the Metatheory of Standard First
Order Logic (University of California Press).Journal of Memetics, Evolutionary models of information transmission.
www.cpm.mmu.ac.uk/jom-emit/overview.html.Kahneman, D. & A. Tversky, (Eds.), 2000, Choices, Values, and Frames
(Cambridge University Press)Kahneman, D., P. Slovic, & A. Tversky, (Eds.), 1982, Judgment under uncertainty:
Heuristics and biases (Cambridge University Press) Kauffman, P., 1998, Trading Systems and Methods (John Wiley & Sons, Inc.) Kauffman, S., 1995, At Home In The Universe: The Search for Laws of Self-
Organization and Complexity (Oxford University Press)

31JOURNAL of Technical Analysis • 2006, Issue 64
--------, 1995, Investigations (Oxford University Press) --------, 1995, The Origins Of Order: Self-Organization and Selection in Evolution
(Oxford University Press)--------, 1991, Antichaos and adaptation, Scientifi c American (August)Livio, M., 2002, The Golden Ratio: The Story of Phi, the World’s Most Astonishing
Number (Broadway Books) Lo, A. & A. MacKinlay, 1999, A Non-Random Walk Down Wall Street (Princeton
University Press) Lo, A., 2005, Reconciling effi cient markets with behavioral fi nance: the adaptive
markets hypothesis, The Journal of Investment Consulting 7(2). Lo, A., 1991, Long-term memory in stock market prices, Econometrica 59(5),
1279-1313.Mackay, C., 1841, Memoirs of Extraordinary Popular Delusions and the Madness
of Crowds (Bentley, London)Malkiel, B., 1999, A Random Walk Down Wall Street: Including a Life-Cycle
Guide to Personal Investing (W.W. Norton & Company) Mandelbrot, B., 1982, The Fractal Geometry of Nature (W. H. Freeman)--------, 1997, Fractals and Scaling in Finance: Discontinuity, Concentration, Risk
(Springer-Verlag, New York)Mandelbrot, B. & R. Hudson, 2004, The (Mis)Behavior of Markets: A Fractal
View of Risk, Ruin, and Reward (Basic Books) Manhart, K., 2005, Lust for danger, Scientifi c American (September). Manneville, P., 2004, Instabilities, Chaos and Turbulence: An Introduction to
Nonlinear Dynamics and Complex Systems (Imperial College Press)McCauley, J., 2004, Dynamics of Markets: Econophysics and Finance (Cambridge
University Press) Merton, R., 1968, Social Theory and Social Structure (Free Press)Murphy, J., 1999, Technical Analysis of the Financial Markets: A Comprehensive
Guide to Trading Methods and Applications (New York Institute of Finance).
Nison, S., 2001, Japanese Candlestick Charting Techniques: A Contemporary Guide to the Ancient Investment Techniques of the Far East, 2nd Edition (New York Institute of Finance)
Nocera, J., 2005, $100 billion in the hands of a computer, New York Times (November 19)
Ormerod, P., 2005, Why Most Things Fail: Evolution, Extinction and Economics (Pantheon Books)
Peters, E., 1991, Chaos And Order In The Capital Markets: A New View of Cycles, Prices, and Market Volatility (John Wiley & Sons, Inc.)
--------, 1994, Fractal Market Analysis (John Wiley & Sons, Inc.)--------, 1996, Chaos And Order In The Capital Markets: A New View of Cycles,
Prices, and Market Volatility, 2nd Edition (John Wiley & Sons, Inc.) Pikovskty, A., M. Rosenblum, & J. Kurths, 2001, Synchronization: A universal
concept of nonlinear sciences (Cambridge University Press) Plous, S., 1993, The Psychology of Judgment and Decision Making (McGraw-
Hill, Inc.) Prigogine, I., 1996, The End of Certainty: Time, Chaos, and the New Laws of
Nature (The Free Press) Pring, M., 1993, Investment Psychology Explained: Classic Strategies to Beat
the Markets (John Wiley & Sons, Inc.) --------, 1993, Martin Pring on Market Momentum (Sheridan Books, Inc.) --------, 2002, Technical Analysis Explained: The Successful Investor’s
Guide to Spotting Investment Trends and Turning Points, 4th Edition(McGraw-Hill, Inc.)
Pruden, H., 2003,Life cycle model of crowd behavior, Journal of Technical Analysis 59.
Rennie, J. et al. (Eds.), 2003, SA perspectives: total information overload, Scientifi c American Mind 12 (March)
Rheingold, H., 2002, Smart Mobs: The Next Social Revolution (Basic Books) Roener, B., 2002, Patterns Of Speculation: A Study in Observational Econophysics
(Cambridge University Press) Ryle, G., 1949, The Concept of the Mind (University of Chicago Press)Schwager, J., 1992, The New Market Wizards: Conversations with America’s
Top Traders (HarperBusiness) Sharpe, W., 1964, Capital Asset Prices: A Theory of Market Equilibrium Under
Conditions of Risk, Journal of Finance 19, 425-442.Shefrin, H., 2002, Beyond Greed and Fear: Understanding Behavioral Finance
and the Psychology of Investing (Oxford University Press) Shermer, M., 2004, None So Blind, Scientifi c American 42 (March)Shiller, R., 1989, Market Volatility (The MIT Press) --------, 2000, Irrational Exuberance (Princeton University Press)Shleifer, A., 2000, Ineffi cient Markets: An Introduction to Behavioral Finance
(Oxford University Press)Shore, M., 2004, Mental Notes: Introductory Article, Technically Speaking
32(3), 1. Siegel, J., 1998, Stocks for the Long Run (McGraw-Hill)--------, 2005, The Future for Investors: Why the Tried and the True Triumph Over
the Bold and the New (Crown Business) Siegel, M., 2006, Can we cure fear?, Scientifi c American Mind (February 6)Situngkir, H., Culture as Complex Adaptive System. Formal Interplays
between memetics and cultural analysis, http://cogprints.ecs.soton.ac.uk/archive/00003471/
‘Smith, Adam,’ 1976, The Money Game (Vintage Books, Random House)Sornette, D., 2003, Why Stock Markets Crash: Critical Events in Complex
Financial Systems (Princeton University Press) Soros, G., 1987, The Alchemy of Finance: Reading the Mind of the Market
(Simon and Schuster)Stewart, I. & M. Golubitsky, 1992, Fearful Symmetry: Is God a Geometer?
(Penguin Books) Strogatz, S., 2003, Sync: The Emerging Science of Spontaneous Order
(Hyperion) Taleb, N., 2001, Fooled By Randomness: The Hidden Role of Chance in the
Markets and in Life (Texere) Tarnas, R., 1991, The Passion of the Western Mind: Understanding the Ideas That
Have Shaped Our World View (Ballantine Books) Thaler, R., 1993, Advances in Behavioral Finance (Russell Sage Foundation) --------, 1991, Quasi Rational Economics (Russell Sage Foundation)--------, 1992, The Winner’s Curse: Paradoxes and Anomalies of Economic Life
(Princeton University Press)Tversky, A. & D. Kahneman, 1974, Judgement under Uncertainty: Heurististics
and Biases, Science 185.Trivedi, G., 2003, Bounded by infallibility: the persistence of illusion, Technically
Speaking (July) Urbach, R., 2000, Footprints of Chaos in the Markets: Analyzing non-linear time
series in fi nancial markets and other real systems (Prentice-Hall) Vaga, T., 1990, The Coherent Market Hypothesis, Financial Analysts Journal
46(6), 36-49.--------, 1994, Profi ting From Chaos (McGraw Hill)Waldrop, M., 1992, Complexity (Simon & Schuster Paperbacks) Wanniski, J., 1983, The Way the World Works (Simon & Schuster)Watts, D., 2003, Six Degrees: The Science of a Connected Age (W.W. Norton
& Company)

JOURNAL of Technical Analysis • 2006, Issue 6432
Watts, D., 1999, Small Worlds: The Dynamics of Networks between Order and Randomness (Princeton University Press)
Wilkinson, C. (Ed.), 1997, Technically Speaking (Traders Press, Inc.) Wolfram, S., 2002, A New Kind Of Science (Wolfram Media, Inc.)
About the AuthorKevin Hanley is a Certifi ed Investment Management Analyst (CIMA®),
earning this designation from The Wharton School of Business at the University of Pennsylvania and has successfully completed the Chartered Market Technician (CMT®) Program. He manages high net-worth client portfolios within the Personal Investment Advisory Program. He joined Merrill Lynch in 1983, after graduating from UCSD. He was named a Vice President for the U.S. Private Client Group in 1990.
33JOURNAL of Technical Analysis • 2006, Issue 64
Historical and Legislative BackgroundBeginning in 1997, long and short-term capital gains (assets held for more
than one year, and less than one year, respectively), in the United States have been taxed at separate rates. Since that time, long-term capital gains have been afforded preferential treatment as compared to short-term rates.
Prior to passage of the 1997 Taxpayer Relief Act, U.S. tax laws made little distinction between long and short-term capital gains. Assets held longer than one year were taxed at 28%, thus only offering advantageous treatment to persons in tax brackets above that level. When the 1997 act became effective on May 7 of that year, a preferential 20% rate on long-term capital gains became available to all individual investors (with persons in the 15% bracket receiving an even lower 10% rate).1
In 2003, under the Jobs and Growth Tax Relief Reconciliation Act, this disparity widened, as the maximum long-term capital gains rate was reduced to 15% (with lower tax brackets afforded even lower rates).2 Under both acts, short-term capital gains continued to be taxed as ordinary income.
Anecdotal ExperiencesIn my experience as a Registered Representative and Registered
Investment Advisor, I have witnessed the profound effect of this legislation upon the behavior of clients for many years. Most notably, it has been my experience that investors tend to delay the sale of highly appreciated assets until such positions, “go long-term,” thereby garnering preferential tax treatment. This has been especially true for investors in the upper income brackets, who have the most to gain from long-term taxation, and who happen to own the majority of securities traded in U.S. markets (either directly or through intermediaries seeking to serve their interests). The fact that long-term capital gains are taxed at 15% even under the Alternative Minimum Tax (AMT), which affects many upper income taxpayers, provides even greater incentive to wait for long-term status.
Indeed, investors and their advisors whom I have worked with over the years are acutely aware of the long or short-term nature of unrealized capital gains within portfolios, and will often wait to capture long-term gains until just after those positions have been held for 366 days. This phenomenon led me to inquire whether such behavior might be so common as to make itself known in technical chart patterns.
Role of Psychology in theFormation of Technical Patterns
At this point, one might ask, “Is such a phenomenon technical or fundamental in nature?” It is my contention that although taxation of capital gains is an element of market fundamentals, the effect of such legislation upon the trading of securities can be discerned in technical chart patterns, thus allowing the technician to observe and potentially exploit a recurring technical pattern.
Indeed, the difference between fundamental and technical study is not as great as it often seems. Both, after all, arise from the same human reactions to circumstances. To wit, John J. Murphy, in his foundational work, “Technical Analysis of the Financial Markets,” stated the following:
“It is useful once in a while to pause and refl ect on why the price patterns used by chartists, and concepts like support and resistance, actually do work. It’s not because of some magic produced by the charts or some lines drawn on those charts. These patterns work because they provide pictures of what the markets participants are actually doing and enable us to determine their reactions to market events. Chart analysis is actually a study of human psychology and the reactions of traders to changing market conditions. Unfortunately, because we live in the fast-paced world of fi nancial markets, we tend to rely heavily on chart terminology and shortcut expressions that overlook the underlying forces that created the pictures on the charts in the fi rst place. There are sound psychological reasons why support and resistance levels can be identifi ed on price charts and why they can be used to help predict market movements”3
If it is then possible to observe and document a recurring technical pattern that arises from fundamental disparities within the U.S. tax code, a new and possibly powerful technical tool could be placed in the hands of traders and investors alike.
“Initial Events”and “Anniversary Windows” / The Search for “Ae”
Although it is said that technical analysis is both science and art, I believe it is helpful to follow an experimental, scientifi c methodology when attempting to break new ground. Accordingly, in beginning my research in this area, I fi rst sought to defi ne the circumstances under which this tax-infl uenced phenomenon might be most readily discernable, and to do so in the form of a hypothesis and experimental study, as follows:
Hypothesis: In theory (and in my personal experience), investors seeking the preferential tax treatment currently afforded to long-term capital gains (realized gains from assets held over one year) are likely to delay sales of appreciated assets until the one year “anniversary” of their purchase.
Therefore, a sharp, downward, high volume trading day and subsequent recovery, should be followed one year later (the “Anniversary Window” or “AW” of the initial sell-off) by a corresponding period of underperformance as investors who formed their cost basis during the initial sell-off close their long positions, now that they are entitled to preferential capital gain treatment.
This effect, referred to as the “Anniversary Effect” or “AE,” should be discernable from the average trading statistics of that asset.
Experiment: In order to test the AE hypothesis, I examined trading data of the Russell 2000 index components from the 2004-2005 period (note: the small-cap Russell 2000 index was chosen in order to lessen the chance of data distortion by futures-driven trading often associated with large-cap indexes.)
Window of Opportunity?Evidence for the existence of a predictable and exploitable infl uence upon
chart patterns arising from disparities in capital gain taxation
Jerome F. Hartl, CMT 4

JOURNAL of Technical Analysis • 2006, Issue 6434
Utilizing charts and data provided by Thompson Financial, I identifi ed 100 stocks that displayed high-volume price declines and subsequent recoveries. This was accomplished through a visual examination of the chart of every Russell 2000 component. Stocks exhibiting steep declines and accompanying volume spikes were fl agged for further examination. Stocks previously chosen for the control group (see below) were excluded from the experimental group.
This initial group was then re-examined to fi lter out stocks that either did not subsequently recover (thus having no embedded gain during the beginning of the AW), or were trading below $10.00 per share at the 366-day mark. The resulting list of 100 stocks (the “experimental group”) constitutes a 5% sample of the Russell 2000. The date of the high volume price drop in the experimental group was labeled as the “Initial Event” or “IE.”
I then examined the corresponding trading in those stocks one year later. The ten trading day period after 365 days had passed from the IE was classifi ed as the “Anniversary Window” or “AW” (See Figure 1.0 below).
As a “control group,” randomly chosen IE’s from 100 randomly selected Russell 2000 stocks (and their corresponding AW’s) were also examined. Control group stocks were selected by utilizing a random number generator available online at: http://www.randomizer.org/form.htm. Numbers generated from the website were then applied to an alphabetical list of Russell 2000 stocks (as of June 24, 2005). If a particular stock was no longer trading, the next stock on the list was used in its place.
Control group IE’s were selected by utilizing a random date generator available online at: http://www.lrs.org/interactive/randomdate.asp. Random dates (Monday through Friday) from 2004 were selected, and if a stock was not trading on that particular day, the next active trading day was selected as the IE.
Both percentage price change and 14-day RSI were utilized as comparative metrics with which to measure evidence of AE. As a measurement of a rolling time, RSI offered greater fl exibility in regards to time, vs. the somewhat rigid, 10-day window utilized in the percentage performance analysis.
In theory, if the AE hypothesis is correct, the experimental group should tend to under-perform vs. the control group during the AW in both metrics.
Possible utilization of AE:If the existence of the AE pattern can be demonstrated, technical trading
and/or investing decisions could be enhanced by awareness of an impending AW.
For instance, if a trade or investment was beginning to look attractive according to one’s own particular technical and/or fundamental methodology, one might then take the extra step of examining the prior year’s daily trading in search of a high volume sell-off occurring just under one year ago. If the security in question had also appreciated substantially since that sell-off, the
timing of the trade in question might be benefi cially adjusted to account for the increased likelihood of weakness during the upcoming AW.
In addition, it might also be possible to develop new trading techniques that seek to capitalize on the chronological predictability of AE, perhaps by utilizing short sales, option volatility spreads, etc.
Comparative Analysis of ResultsComparison of the control and experimental group data produced
interesting results, which are strongly suggestive of the existence of AE (See Table 1.0 below).
Control Group:
• Of the 100 randomly selected stocks of the control group, 60% exhibited positive price performance during the 10 trading day AW, and 40% declined.
• The average price-performance percentage of the control group during the AW was plus 2.0954%. Median percentage performance was plus 0.8738%.
• The average RSI performance of the control group during the AW was plus 2.74. Median RSI performance was plus 2.60.
Experimental Group:
• Within the 100 stocks of the experimental group, 22% exhibited positive price performance during the 10-trading day AW, and 78% declined.
• The average price-performance percentage of the experimental group during the AW was minus 4.2516%. Median percentage performance was minus 3.4862%.
• The average RSI performance of the experimental group during the AW was minus 7.89. Median RSI performance was minus 6.37.
Clearly, the differential between the control and experimental groups is sizable, and beyond what might be expected from random noise. In addition, the chronological nature of the AE phenomenon lends itself well to technical trading decisions.
As with other technical trading tools, it is not infallible and will only be applicable in situations fi tting the required preconditions of a prior IE and recovery. Nonetheless, the approach of an impending AW would appear to give the technician a mild, but very real, statistical advantage when making a trade or investment decision. I believe this new tool is best used in conjunction with one’s own preferred set of dependable technical indicators, rather than as a stand-alone measurement.
Possible Alternative ExplantionsGiven the sizable disparity between the control and experimental data, it
appears likely that the AE phenomenon is both real and potentially exploitable by technical traders and/or investors. However, while the data obtained through
Figure 1.0 Daily bar chart of Salix Pharmaceuticals Ltd. (NASDAQ: SLXP) from 1/1/04 through 1/31/06 including volume and 14-day RSI (source “Thompson Financial”)
Table 1.0

35JOURNAL of Technical Analysis • 2006, Issue 64
this comparative experiment appear strongly suggestive of the AE theory, it is prudent to examine other possible explanations for these results.
One such alternative view relates to quarterly earnings reporting. Since the companies of the Russell 2000 all release earnings reports on a quarterly basis in compliance with U.S. law, technical weakness that recurs on an annual basis could be related to such reports.
For instance, if the “Widget Corporation” had a history of inconsistent or disappointing earnings reports, a chart analysis of “Widget Corp.” might well display repeated instances of weakness around these earnings release dates.
However, it should be noted that in such a case, the technical patterns observed and statistically examined in this study would be just as valid and exploitable, even if arising from a different phenomenon (again, see quote by John J. Murphy on page 2).
Suggestions For Further StudyThe author, in keeping with the tradition of peer review, welcomes
additional investigations into the AE theory. Examination of other indices, asset classes, and timeframes would likely shed further light on the subject.
Endnotes1 Marguerite R. Hutton, The Taxpayer Relief Act of 1997: 1997 Changes
Affecting Capital Gains and Sale of a Residence, http://www.bap.org/newslet/fall97/tra97.htm / (January 3, 2000)
2 National Association of Tax Professionals website, http://www.natptax.com/taxact2003.pdf (undated)
3 John J. Murphy, Technical Analysis of the Financial Markets (Paramus, NJ: New York Institute of Finance, 1999), 61.
About the AuthorJerome F. Hartl, CMT is a member of “The Hartl Group of Stifel Nicolaus”
in Traverse City, Michigan, along with his father, John L. Hartl, Jr., and sister-in-law, Heather M. Hartl. Together they oversee approximately $65 million in client assets, with an emphasis on value-based, collaborative portfolio management. Jerome has worked in fi nancial services for over 10 years. Prior to that, he served as a senior staffer in the U.S. House of Representatives, working on issues related to foreign affairs and international fi nancial institutions. He also served briefl y within the CIA’s Directorate of Operations. He holds a BA from Western Michigan University (1993).
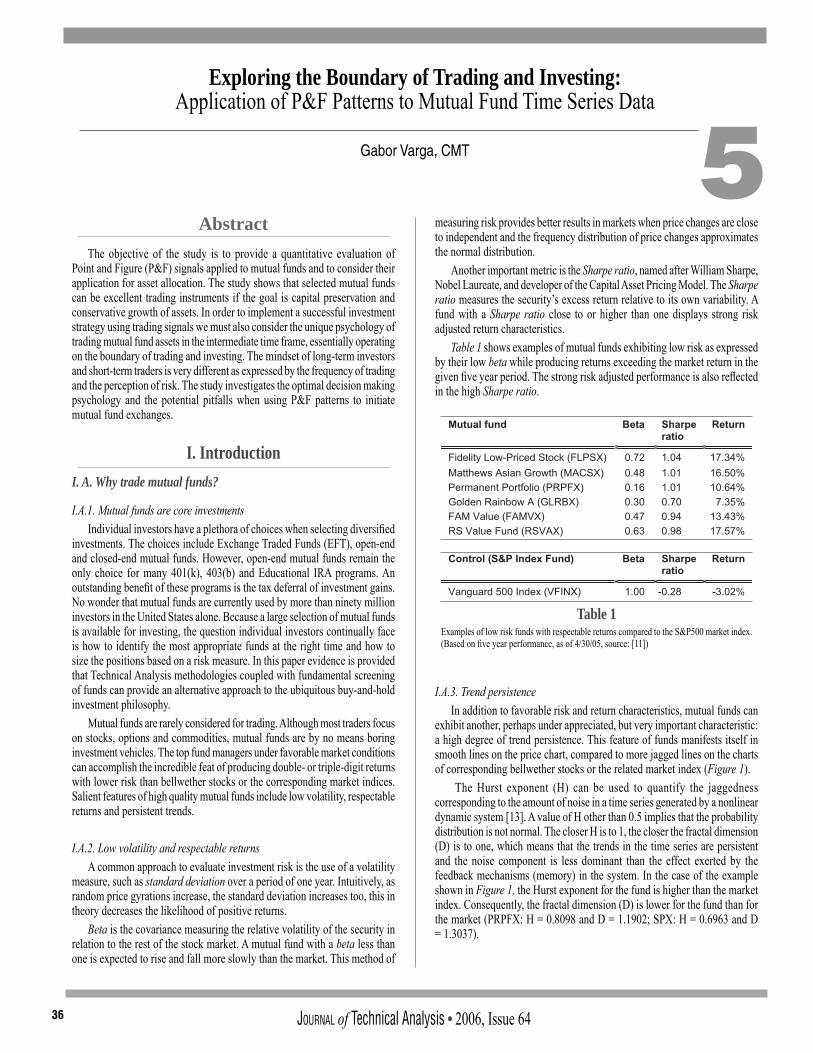
JOURNAL of Technical Analysis • 2006, Issue 6436
Exploring the Boundary of Trading and Investing:Application of P&F Patterns to Mutual Fund Time Series Data
Gabor Varga, CMT 5Abstract
The objective of the study is to provide a quantitative evaluation of Point and Figure (P&F) signals applied to mutual funds and to consider their application for asset allocation. The study shows that selected mutual funds can be excellent trading instruments if the goal is capital preservation and conservative growth of assets. In order to implement a successful investment strategy using trading signals we must also consider the unique psychology of trading mutual fund assets in the intermediate time frame, essentially operating on the boundary of trading and investing. The mindset of long-term investors and short-term traders is very different as expressed by the frequency of trading and the perception of risk. The study investigates the optimal decision making psychology and the potential pitfalls when using P&F patterns to initiate mutual fund exchanges.
I. IntroductionI. A. Why trade mutual funds?
I.A.1. Mutual funds are core investments Individual investors have a plethora of choices when selecting diversifi ed
investments. The choices include Exchange Traded Funds (EFT), open-end and closed-end mutual funds. However, open-end mutual funds remain the only choice for many 401(k), 403(b) and Educational IRA programs. An outstanding benefi t of these programs is the tax deferral of investment gains. No wonder that mutual funds are currently used by more than ninety million investors in the United States alone. Because a large selection of mutual funds is available for investing, the question individual investors continually face is how to identify the most appropriate funds at the right time and how to size the positions based on a risk measure. In this paper evidence is provided that Technical Analysis methodologies coupled with fundamental screening of funds can provide an alternative approach to the ubiquitous buy-and-hold investment philosophy.
Mutual funds are rarely considered for trading. Although most traders focus on stocks, options and commodities, mutual funds are by no means boring investment vehicles. The top fund managers under favorable market conditions can accomplish the incredible feat of producing double- or triple-digit returns with lower risk than bellwether stocks or the corresponding market indices. Salient features of high quality mutual funds include low volatility, respectable returns and persistent trends.
I.A.2. Low volatility and respectable returnsA common approach to evaluate investment risk is the use of a volatility
measure, such as standard deviation over a period of one year. Intuitively, as random price gyrations increase, the standard deviation increases too, this in theory decreases the likelihood of positive returns.
Beta is the covariance measuring the relative volatility of the security in relation to the rest of the stock market. A mutual fund with a beta less than one is expected to rise and fall more slowly than the market. This method of
measuring risk provides better results in markets when price changes are close to independent and the frequency distribution of price changes approximates the normal distribution.
Another important metric is the Sharpe ratio, named after William Sharpe, Nobel Laureate, and developer of the Capital Asset Pricing Model. The Sharpe ratio measures the security’s excess return relative to its own variability. A fund with a Sharpe ratio close to or higher than one displays strong risk adjusted return characteristics.
Table 1 shows examples of mutual funds exhibiting low risk as expressed by their low beta while producing returns exceeding the market return in the given fi ve year period. The strong risk adjusted performance is also refl ected in the high Sharpe ratio.
I.A.3. Trend persistenceIn addition to favorable risk and return characteristics, mutual funds can
exhibit another, perhaps under appreciated, but very important characteristic: a high degree of trend persistence. This feature of funds manifests itself in smooth lines on the price chart, compared to more jagged lines on the charts of corresponding bellwether stocks or the related market index (Figure 1).
The Hurst exponent (H) can be used to quantify the jaggedness corresponding to the amount of noise in a time series generated by a nonlinear dynamic system [13]. A value of H other than 0.5 implies that the probability distribution is not normal. The closer H is to 1, the closer the fractal dimension (D) is to one, which means that the trends in the time series are persistent and the noise component is less dominant than the effect exerted by the feedback mechanisms (memory) in the system. In the case of the example shown in Figure 1, the Hurst exponent for the fund is higher than the market index. Consequently, the fractal dimension (D) is lower for the fund than for the market (PRPFX: H = 0.8098 and D = 1.1902; SPX: H = 0.6963 and D = 1.3037).
Table 1Examples of low risk funds with respectable returns compared to the S&P500 market index. (Based on fi ve year performance, as of 4/30/05, source: [11])

37JOURNAL of Technical Analysis • 2006, Issue 64
The Hurst exponent quantitatively shows that the degree of trend persistence for the mutual fund is higher than the market index in the given time period.
In summary, investing in mutual funds can offer exciting opportunities for capital gains and enables low risk investing. Let us now consider mutual funds in the context of asset allocation strategies.
I.B. The need for fl exible asset allocation strategies
I.B.1. Passive investing ignores risk controlThe majority of mutual fund investors practice the buy-and-hold strategy.
After participating in the last fi ve years of stock market volatility (Figure 2) many investors are now realizing that the buy-and-hold approach is not the panacea it was thought to be during the secular bull market lasting from 1982 to 1999. The root cause of this dilemma is that the buy-and-hold strategy presumes a prevailing bullish bias to the stock market. This assumption often leads to sub-par returns or losses in trading range or declining markets.
I.B.1. Passive investing ignores risk controlAn increasing number of investors are searching for alternative asset
allocation strategies. This need is further exacerbated by demographic trends, most notably the baby-boomer generation approaching retirement age and preparing to shift stock market assets to more conservative investment choices, consequently raising the risk of reduced demand for stocks. A savvy approach to investing seeks to conserve capital in declining markets, while participating in markets with strong bullish bias. Quantitative approaches based on sound Technical Analysis principles are well suited for the identifi cation of patterns that signal the existence of bullish and bearish trends. This information can be used to adapt the portfolio allocation mix for the prevailing market condition and to manage risks at the same time.
Is there a reason to believe that the buy-and-hold strategy would be more profi table than trading an adaptive system? Yes, it turns out that in a very strong bull market, such as the Internet bubble of 1999, buy-and-hold tends to outperform a mutual fund-based (non-leveraged) system. This is due to the inherent lag of reallocating a mutual fund portfolio. However, the buy-and-hold strategy does not offer any protection against market risk. As the market inevitably enters a corrective or declining phase, the adaptive system can easily catch up and surpass the passive approach while putting less capital at risk.
I.C. Technical Analysis applied to mutual fund timing
I.C.1. Relative strength rankingMany of the Technical Analysis techniques can be applied to mutual fund
time series data [19]. One of the popular approaches of applying Technical Analysis to mutual fund timing involves the ranking of funds. Investment letters offering tracking information have been evaluated based on both up and down market performance [4]. The ranking approach is based on the observation that funds with the highest relative strength tend to continue to outperform the market in the near future. Although the method can work well under many market conditions, it is still diffi cult to avoid the following problem: in declining markets funds with good relative strength can still decline, albeit to a lesser extent than the market averages.
The approach outlined in this paper seeks to raise cash reserves in declining markets and scales into positions with good relative strength during advancing market periods. This philosophy is similar to John Murphy’s inter-market analysis [14] in regards to adapting to market conditions and not striving to stay invested all the time.
I.C.2. Charting techniquesPattern recognition techniques, such as Point and Figure (P&F) charting
have been applied to both stocks and sectors [1]. An alternative approach is to provide Point and Figure analysis as an adjunct to a more mainstream stock analysis service [2].
The approach presented in this paper builds on the above applications of P&F patterns but focuses only on mutual funds. This has profound consequences in regards to the time horizon and the type of patterns utilized. Moreover, trading patterns are quantifi ed, which allows the automated screening of a large group of securities.
I.D. The P&F method applied to mutual fund time series data
I.D.1. A time tested methodThe P&F method is the oldest known form of charting technique in the
United States. Its predecessor, the “trend register” method was used as far back as 1881 [9, 10]. One of the unique features of this method is the fl exible treatment of the time on the ordinate axis. As the patterns form on the P&F chart, the focus is directed onto the extent of price moves, not onto the time it takes to complete a move.
From the algorithmic point of view the P&F method transforms the time-series data in such a way that it removes some of the local variance due to random noise, essentially acting as a noise fi lter. This feature, coupled with the trend persistence feature of carefully chosen mutual funds can offer a clear view of the market action.
Figure 1Example of a mutual fund (Permanent Portfolio fund, PRPFX) displaying more persistent and smoother trends than the corresponding index (SPX, normalized to the same scale), while providing comparable returns. This can be quantifi ed by the Hurst exponent (H) which is larger for the fund (H = 0. 8098) than the index (H = 0.6963) for the given period.
Figure 2The volatility of the S&P 500 returns in the fi ve years ending in January 2005 underlines the fact that bullish bias to future stock market returns cannot be guaranteed.
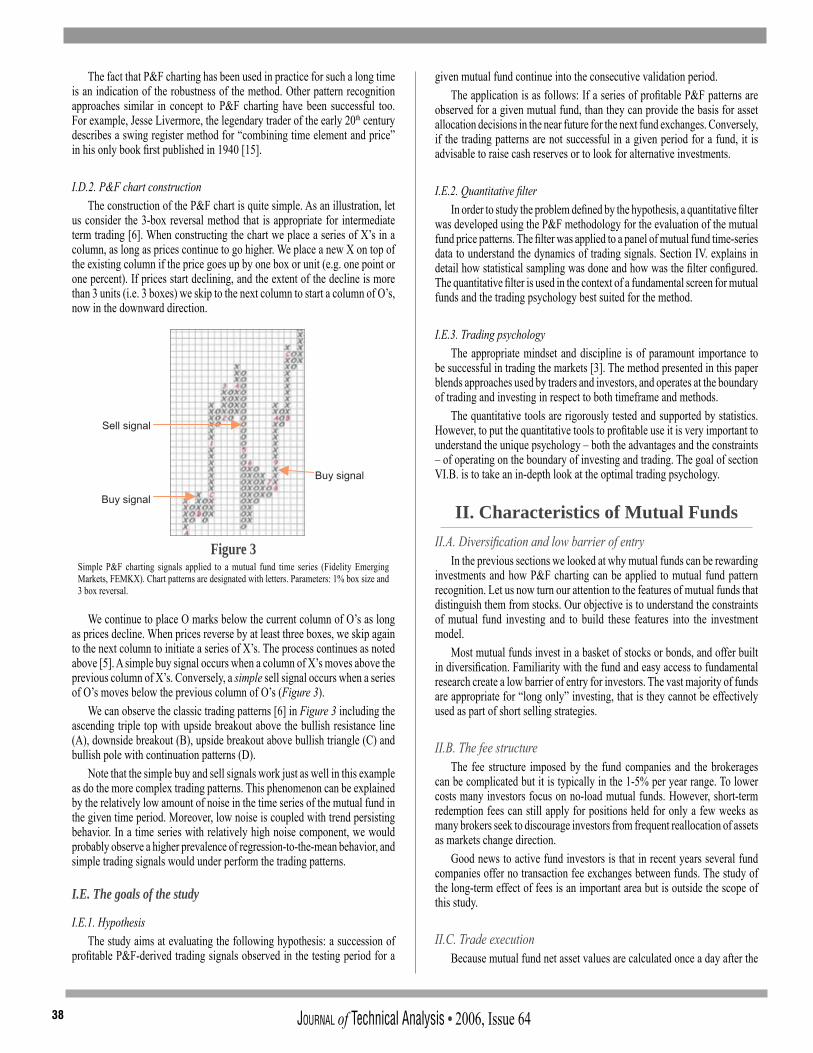
JOURNAL of Technical Analysis • 2006, Issue 6438
The fact that P&F charting has been used in practice for such a long time is an indication of the robustness of the method. Other pattern recognition approaches similar in concept to P&F charting have been successful too. For example, Jesse Livermore, the legendary trader of the early 20th century describes a swing register method for “combining time element and price” in his only book fi rst published in 1940 [15].
I.D.2. P&F chart constructionThe construction of the P&F chart is quite simple. As an illustration, let
us consider the 3-box reversal method that is appropriate for intermediate term trading [6]. When constructing the chart we place a series of X’s in a column, as long as prices continue to go higher. We place a new X on top of the existing column if the price goes up by one box or unit (e.g. one point or one percent). If prices start declining, and the extent of the decline is more than 3 units (i.e. 3 boxes) we skip to the next column to start a column of O’s, now in the downward direction.
We continue to place O marks below the current column of O’s as long as prices decline. When prices reverse by at least three boxes, we skip again to the next column to initiate a series of X’s. The process continues as noted above [5]. A simple buy signal occurs when a column of X’s moves above the previous column of X’s. Conversely, a simple sell signal occurs when a series of O’s moves below the previous column of O’s (Figure 3).
We can observe the classic trading patterns [6] in Figure 3 including the ascending triple top with upside breakout above the bullish resistance line (A), downside breakout (B), upside breakout above bullish triangle (C) and bullish pole with continuation patterns (D).
Note that the simple buy and sell signals work just as well in this example as do the more complex trading patterns. This phenomenon can be explained by the relatively low amount of noise in the time series of the mutual fund in the given time period. Moreover, low noise is coupled with trend persisting behavior. In a time series with relatively high noise component, we would probably observe a higher prevalence of regression-to-the-mean behavior, and simple trading signals would under perform the trading patterns.
I.E. The goals of the study
I.E.1. HypothesisThe study aims at evaluating the following hypothesis: a succession of
profi table P&F-derived trading signals observed in the testing period for a
given mutual fund continue into the consecutive validation period. The application is as follows: If a series of profi table P&F patterns are
observed for a given mutual fund, than they can provide the basis for asset allocation decisions in the near future for the next fund exchanges. Conversely, if the trading patterns are not successful in a given period for a fund, it is advisable to raise cash reserves or to look for alternative investments.
I.E.2. Quantitative fi lter
In order to study the problem defi ned by the hypothesis, a quantitative fi lter was developed using the P&F methodology for the evaluation of the mutual fund price patterns. The fi lter was applied to a panel of mutual fund time-series data to understand the dynamics of trading signals. Section IV. explains in detail how statistical sampling was done and how was the fi lter confi gured. The quantitative fi lter is used in the context of a fundamental screen for mutual funds and the trading psychology best suited for the method.
I.E.3. Trading psychologyThe appropriate mindset and discipline is of paramount importance to
be successful in trading the markets [3]. The method presented in this paper blends approaches used by traders and investors, and operates at the boundary of trading and investing in respect to both timeframe and methods.
The quantitative tools are rigorously tested and supported by statistics. However, to put the quantitative tools to profi table use it is very important to understand the unique psychology – both the advantages and the constraints – of operating on the boundary of investing and trading. The goal of section VI.B. is to take an in-depth look at the optimal trading psychology.
II. Characteristics of Mutual FundsII.A. Diversifi cation and low barrier of entry
In the previous sections we looked at why mutual funds can be rewarding investments and how P&F charting can be applied to mutual fund pattern recognition. Let us now turn our attention to the features of mutual funds that distinguish them from stocks. Our objective is to understand the constraints of mutual fund investing and to build these features into the investment model.
Most mutual funds invest in a basket of stocks or bonds, and offer built in diversifi cation. Familiarity with the fund and easy access to fundamental research create a low barrier of entry for investors. The vast majority of funds are appropriate for “long only” investing, that is they cannot be effectively used as part of short selling strategies.
II.B. The fee structureThe fee structure imposed by the fund companies and the brokerages
can be complicated but it is typically in the 1-5% per year range. To lower costs many investors focus on no-load mutual funds. However, short-term redemption fees can still apply for positions held for only a few weeks as many brokers seek to discourage investors from frequent reallocation of assets as markets change direction.
Good news to active fund investors is that in recent years several fund companies offer no transaction fee exchanges between funds. The study of the long-term effect of fees is an important area but is outside the scope of this study.
II.C. Trade executionBecause mutual fund net asset values are calculated once a day after the
Figure 3Simple P&F charting signals applied to a mutual fund time series (Fidelity Emerging Markets, FEMKX). Chart patterns are designated with letters. Parameters: 1% box size and 3 box reversal.
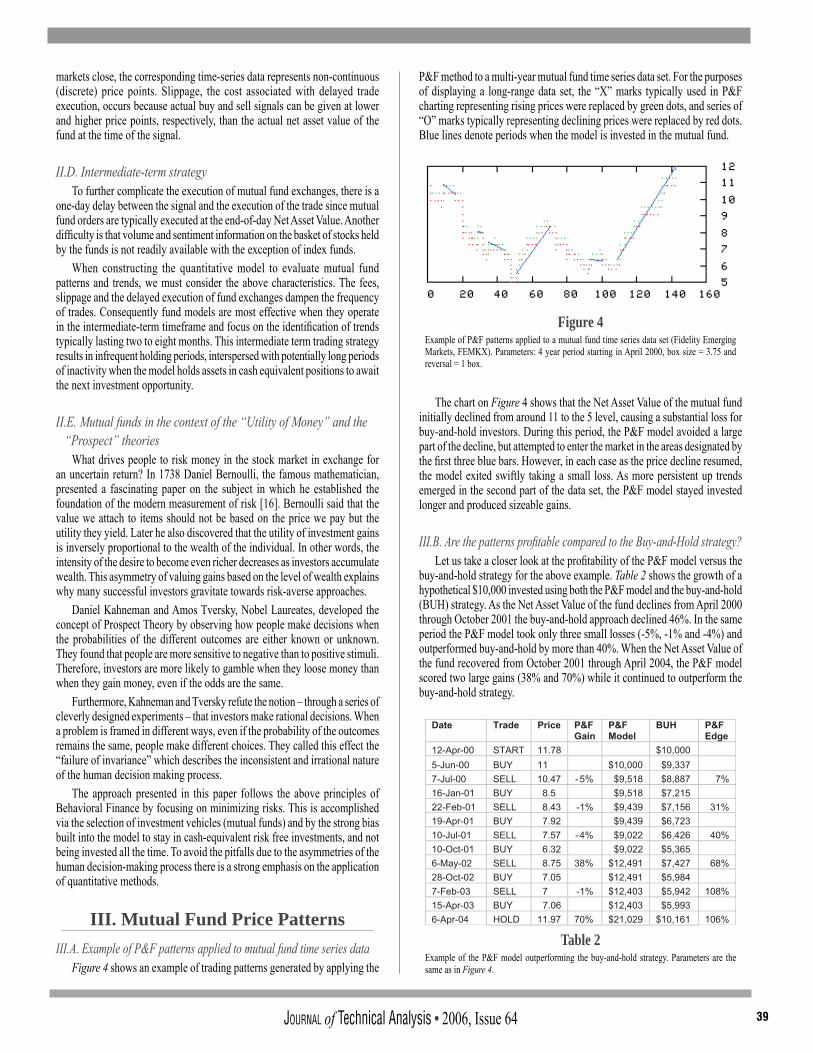
39JOURNAL of Technical Analysis • 2006, Issue 64
markets close, the corresponding time-series data represents non-continuous (discrete) price points. Slippage, the cost associated with delayed trade execution, occurs because actual buy and sell signals can be given at lower and higher price points, respectively, than the actual net asset value of the fund at the time of the signal.
II.D. Intermediate-term strategyTo further complicate the execution of mutual fund exchanges, there is a
one-day delay between the signal and the execution of the trade since mutual fund orders are typically executed at the end-of-day Net Asset Value. Another diffi culty is that volume and sentiment information on the basket of stocks held by the funds is not readily available with the exception of index funds.
When constructing the quantitative model to evaluate mutual fund patterns and trends, we must consider the above characteristics. The fees, slippage and the delayed execution of fund exchanges dampen the frequency of trades. Consequently fund models are most effective when they operate in the intermediate-term timeframe and focus on the identifi cation of trends typically lasting two to eight months. This intermediate term trading strategy results in infrequent holding periods, interspersed with potentially long periods of inactivity when the model holds assets in cash equivalent positions to await the next investment opportunity.
II.E. Mutual funds in the context of the “Utility of Money” and the “Prospect” theories
What drives people to risk money in the stock market in exchange for an uncertain return? In 1738 Daniel Bernoulli, the famous mathematician, presented a fascinating paper on the subject in which he established the foundation of the modern measurement of risk [16]. Bernoulli said that the value we attach to items should not be based on the price we pay but the utility they yield. Later he also discovered that the utility of investment gains is inversely proportional to the wealth of the individual. In other words, the intensity of the desire to become even richer decreases as investors accumulate wealth. This asymmetry of valuing gains based on the level of wealth explains why many successful investors gravitate towards risk-averse approaches.
Daniel Kahneman and Amos Tversky, Nobel Laureates, developed the concept of Prospect Theory by observing how people make decisions when the probabilities of the different outcomes are either known or unknown. They found that people are more sensitive to negative than to positive stimuli. Therefore, investors are more likely to gamble when they loose money than when they gain money, even if the odds are the same.
Furthermore, Kahneman and Tversky refute the notion – through a series of cleverly designed experiments – that investors make rational decisions. When a problem is framed in different ways, even if the probability of the outcomes remains the same, people make different choices. They called this effect the “failure of invariance” which describes the inconsistent and irrational nature of the human decision making process.
The approach presented in this paper follows the above principles of Behavioral Finance by focusing on minimizing risks. This is accomplished via the selection of investment vehicles (mutual funds) and by the strong bias built into the model to stay in cash-equivalent risk free investments, and not being invested all the time. To avoid the pitfalls due to the asymmetries of the human decision-making process there is a strong emphasis on the application of quantitative methods.
III. Mutual Fund Price PatternsIII.A. Example of P&F patterns applied to mutual fund time series data
Figure 4 shows an example of trading patterns generated by applying the
P&F method to a multi-year mutual fund time series data set. For the purposes of displaying a long-range data set, the “X” marks typically used in P&F charting representing rising prices were replaced by green dots, and series of “O” marks typically representing declining prices were replaced by red dots. Blue lines denote periods when the model is invested in the mutual fund.
The chart on Figure 4 shows that the Net Asset Value of the mutual fund initially declined from around 11 to the 5 level, causing a substantial loss for buy-and-hold investors. During this period, the P&F model avoided a large part of the decline, but attempted to enter the market in the areas designated by the fi rst three blue bars. However, in each case as the price decline resumed, the model exited swiftly taking a small loss. As more persistent up trends emerged in the second part of the data set, the P&F model stayed invested longer and produced sizeable gains.
III.B. Are the patterns profi table compared to the Buy-and-Hold strategy?Let us take a closer look at the profi tability of the P&F model versus the
buy-and-hold strategy for the above example. Table 2 shows the growth of a hypothetical $10,000 invested using both the P&F model and the buy-and-hold (BUH) strategy. As the Net Asset Value of the fund declines from April 2000 through October 2001 the buy-and-hold approach declined 46%. In the same period the P&F model took only three small losses (-5%, -1% and -4%) and outperformed buy-and-hold by more than 40%. When the Net Asset Value of the fund recovered from October 2001 through April 2004, the P&F model scored two large gains (38% and 70%) while it continued to outperform the buy-and-hold strategy.
Figure 4Example of P&F patterns applied to a mutual fund time series data set (Fidelity Emerging Markets, FEMKX). Parameters: 4 year period starting in April 2000, box size = 3.75 and reversal = 1 box.
Table 2Example of the P&F model outperforming the buy-and-hold strategy. Parameters are the same as in Figure 4.
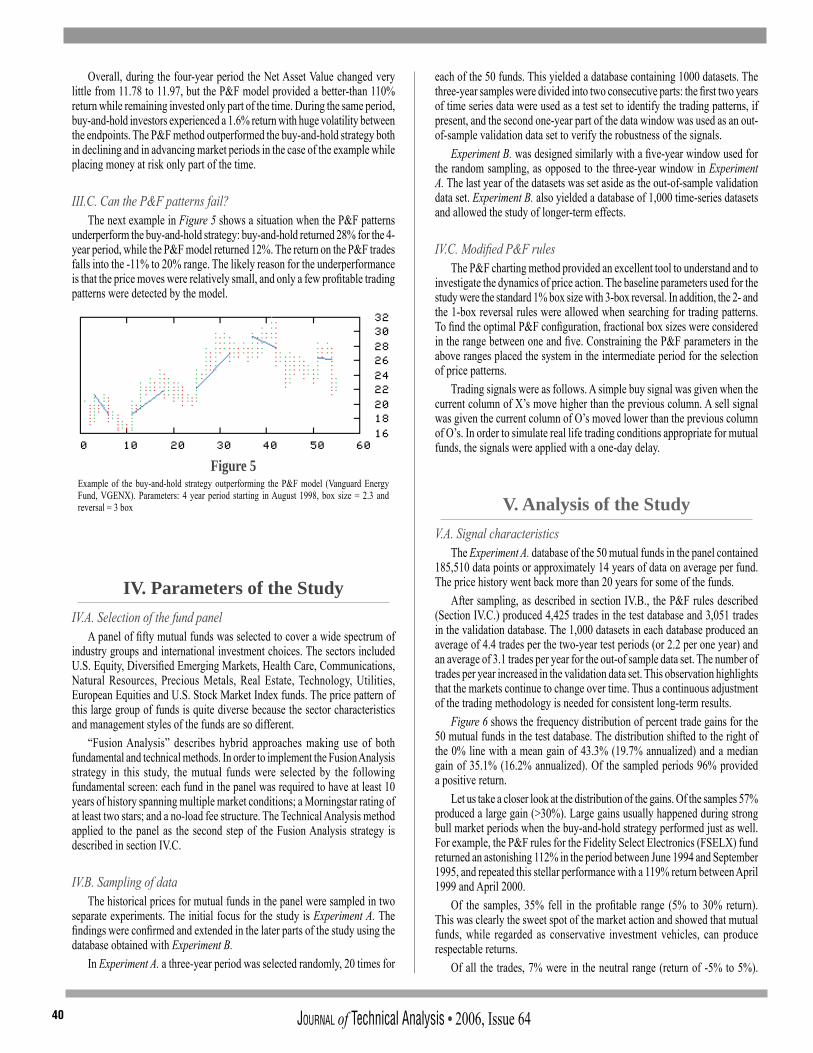
JOURNAL of Technical Analysis • 2006, Issue 6440
Overall, during the four-year period the Net Asset Value changed very little from 11.78 to 11.97, but the P&F model provided a better-than 110% return while remaining invested only part of the time. During the same period, buy-and-hold investors experienced a 1.6% return with huge volatility between the endpoints. The P&F method outperformed the buy-and-hold strategy both in declining and in advancing market periods in the case of the example while placing money at risk only part of the time.
III.C. Can the P&F patterns fail?The next example in Figure 5 shows a situation when the P&F patterns
underperform the buy-and-hold strategy: buy-and-hold returned 28% for the 4-year period, while the P&F model returned 12%. The return on the P&F trades falls into the -11% to 20% range. The likely reason for the underperformance is that the price moves were relatively small, and only a few profi table trading patterns were detected by the model.
IV. Parameters of the StudyIV.A. Selection of the fund panel
A panel of fi fty mutual funds was selected to cover a wide spectrum of industry groups and international investment choices. The sectors included U.S. Equity, Diversifi ed Emerging Markets, Health Care, Communications, Natural Resources, Precious Metals, Real Estate, Technology, Utilities, European Equities and U.S. Stock Market Index funds. The price pattern of this large group of funds is quite diverse because the sector characteristics and management styles of the funds are so different.
“Fusion Analysis” describes hybrid approaches making use of both fundamental and technical methods. In order to implement the Fusion Analysis strategy in this study, the mutual funds were selected by the following fundamental screen: each fund in the panel was required to have at least 10 years of history spanning multiple market conditions; a Morningstar rating of at least two stars; and a no-load fee structure. The Technical Analysis method applied to the panel as the second step of the Fusion Analysis strategy is described in section IV.C.
IV.B. Sampling of data The historical prices for mutual funds in the panel were sampled in two
separate experiments. The initial focus for the study is Experiment A. The fi ndings were confi rmed and extended in the later parts of the study using the database obtained with Experiment B.
In Experiment A. a three-year period was selected randomly, 20 times for
each of the 50 funds. This yielded a database containing 1000 datasets. The three-year samples were divided into two consecutive parts: the fi rst two years of time series data were used as a test set to identify the trading patterns, if present, and the second one-year part of the data window was used as an out-of-sample validation data set to verify the robustness of the signals.
Experiment B. was designed similarly with a fi ve-year window used for the random sampling, as opposed to the three-year window in Experiment A. The last year of the datasets was set aside as the out-of-sample validation data set. Experiment B. also yielded a database of 1,000 time-series datasets and allowed the study of longer-term effects.
IV.C. Modifi ed P&F rulesThe P&F charting method provided an excellent tool to understand and to
investigate the dynamics of price action. The baseline parameters used for the study were the standard 1% box size with 3-box reversal. In addition, the 2- and the 1-box reversal rules were allowed when searching for trading patterns. To fi nd the optimal P&F confi guration, fractional box sizes were considered in the range between one and fi ve. Constraining the P&F parameters in the above ranges placed the system in the intermediate period for the selection of price patterns.
Trading signals were as follows. A simple buy signal was given when the current column of X’s move higher than the previous column. A sell signal was given the current column of O’s moved lower than the previous column of O’s. In order to simulate real life trading conditions appropriate for mutual funds, the signals were applied with a one-day delay.
V. Analysis of the StudyV.A. Signal characteristics
The Experiment A. database of the 50 mutual funds in the panel contained 185,510 data points or approximately 14 years of data on average per fund. The price history went back more than 20 years for some of the funds.
After sampling, as described in section IV.B., the P&F rules described (Section IV.C.) produced 4,425 trades in the test database and 3,051 trades in the validation database. The 1,000 datasets in each database produced an average of 4.4 trades per the two-year test periods (or 2.2 per one year) and an average of 3.1 trades per year for the out-of sample data set. The number of trades per year increased in the validation data set. This observation highlights that the markets continue to change over time. Thus a continuous adjustment of the trading methodology is needed for consistent long-term results.
Figure 6 shows the frequency distribution of percent trade gains for the 50 mutual funds in the test database. The distribution shifted to the right of the 0% line with a mean gain of 43.3% (19.7% annualized) and a median gain of 35.1% (16.2% annualized). Of the sampled periods 96% provided a positive return.
Let us take a closer look at the distribution of the gains. Of the samples 57% produced a large gain (>30%). Large gains usually happened during strong bull market periods when the buy-and-hold strategy performed just as well. For example, the P&F rules for the Fidelity Select Electronics (FSELX) fund returned an astonishing 112% in the period between June 1994 and September 1995, and repeated this stellar performance with a 119% return between April 1999 and April 2000.
Of the samples, 35% fell in the profi table range (5% to 30% return). This was clearly the sweet spot of the market action and showed that mutual funds, while regarded as conservative investment vehicles, can produce respectable returns.
Of all the trades, 7% were in the neutral range (return of -5% to 5%).
Figure 5Example of the buy-and-hold strategy outperforming the P&F model (Vanguard Energy Fund, VGENX). Parameters: 4 year period starting in August 1998, box size = 2.3 and reversal = 3 box

41JOURNAL of Technical Analysis • 2006, Issue 64
This was the twilight zone for fund trading where predictive methods had diffi culty in discriminating between potential small gains and small losses. However, the positive and the negative trades balanced each other over time. The principal implication was that in trendless markets, the P&F signals could produce a series of neutral trades. The trading psychology was again of central importance: investors must continue to follow the markets with discipline because the “boring” trading range conditions can switch unexpectedly into a fast moving bullish or bearish market conditions.
Of the samples, 1% out of the 4,425 trades sampled randomly from the test database represented increased risk with loss of more than 5%. Figure 6 shows the left fl ank of the frequency distribution curve fl attened rapidly. The worst trade produced a 31% loss.
Avoiding large losses and minimizing small losses was where the P&F signals outperform the buy-and-hold investment strategy. For example, the above-mentioned Fidelity Select Electronics (FSELX) fund declined 39% in the period between May 2002 and August 2002. When the markets had a strong rally in the spring of 2002, the P&F method gave a false buy signal in May that resulted in a sell signal at a lower price in June, resulting in a 13% loss. However, this loss was substantially less than the 39% overall decline in the fund’s Net Asset Value experienced by buy-and-hold investors. This behavior of the P&F signals was observed frequently. During the brief rallies of strongly declining markets, the P&F method entered into a trade, then typically took a small gain or loss, and moved into a cash equivalent defensive position.
V.B. Comparison of test and out-of-sample performanceFigure 7 compares the results for the out-of-sample validation data set
versus the test data set in Experiment A. The performance in the out-of-sample data set remained in the profi table range, albeit lower than the performance of the P&F method in the test data set. The mean gain in the out-of-sample data set was 7.95%. Because the P&F method implemented a conservative investment strategy and remained in cash equivalent positions typically 40-60% of the time, this represented a favorable performance. The majority of the sampled datasets were profi table with 64% of them producing a positive return.
The largest gains (80% or larger) in the test datasets are highlighted with dark green in Figure 7 for both the test (B) and the consecutive out-of-sample (A) periods. Did this stellar performance continue into the out-of-sample periods? Unfortunately not, as shown by the frequency data in Figure 7. A possible explanation is as follows: when unusually large gains were observed in the two-year test periods, the subsequent markets tended to quiet down or even reverse, thus producing uninspiring results with returns centered around neutral trades in the out-of-sample sets.
VI. ConclusionsVI.A. Application of results in asset allocation
VI.A.1. Critical factors of performanceAs expected, not all market periods could have been traded profi tably using
a long only method making use of mutual funds only. In addition, different subsets of sectors and funds were optimal in different market environments. In order to consider the use of the P&F model in assess allocation decisions, fi rst let us assess the danger factors which precede sub par performance. The goal is to avoid these turbulent investment environments and bias investment decisions towards staying in cash equivalent fi nancial instruments to implement the risk-averse strategy outlined in section II.E.
The contour plot in Figure 8 shows how the out-of-sample P&F model performance was affected by the performance in the preceding test periods for Experiment A. On the ordinate axis the P&F model performance was measured, and on the abscissa the buy-and-hold (which was taken as a proxy for the market sector performance) results were plotted. We can observe islands of red (representing sub par performance) on the plot surrounded by yellow regions (results in the neutral range). Green regions denote profi table performance in the out-of-sample validation set. Insight can be gained by the careful examination of the contour plot. For example, the red region marked with “A” on Figure 8 shows that when markets decline strongly for two years the model tended to under perform the cash equivalent investment in the subsequent year, even if the P&F signals produced only small losses in the test set.
Neural Network analysis was performed to extrapolate the performance characteristics observed in the database (Figure 9). The surface area above the white mesh denotes conditions when the P&F model was predicted to be profi table.
Figure 6Frequency distribution of percent gains for the mutual funds in the test panel during the two-year test periods.
Figure 7Frequency distribution of percent gains for the mutual funds in the test panel during the two-year test periods.
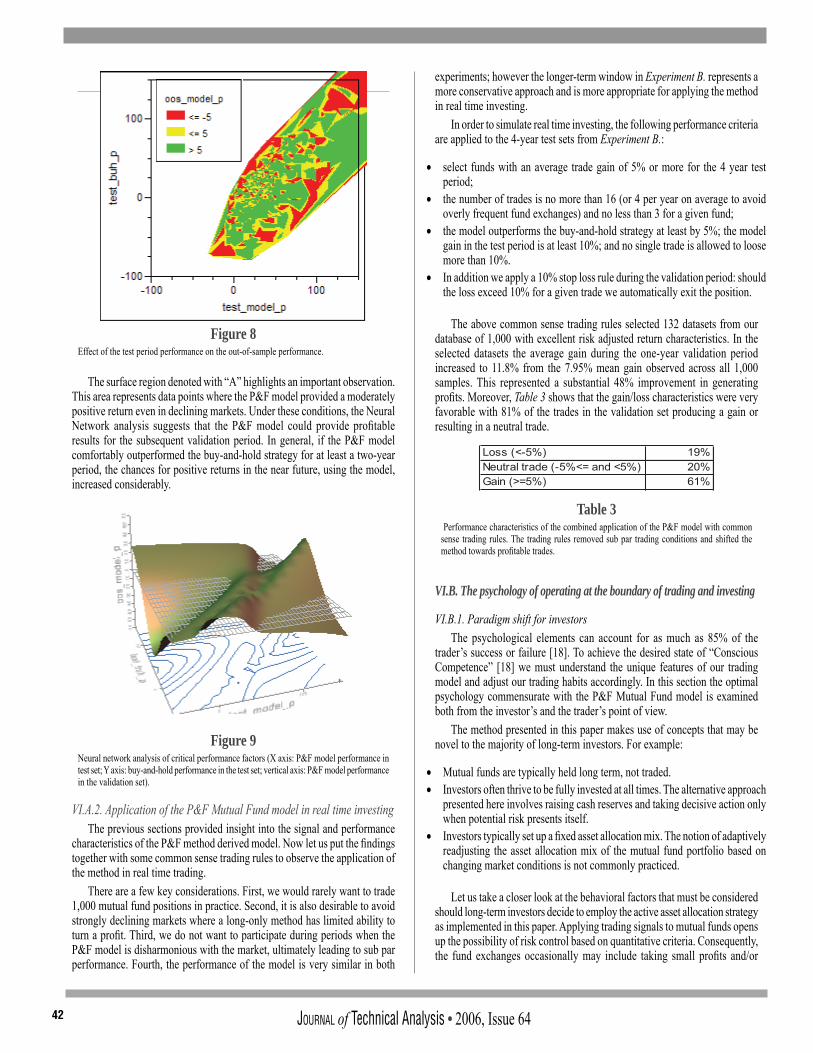
JOURNAL of Technical Analysis • 2006, Issue 6442
The surface region denoted with “A” highlights an important observation. This area represents data points where the P&F model provided a moderately positive return even in declining markets. Under these conditions, the Neural Network analysis suggests that the P&F model could provide profi table results for the subsequent validation period. In general, if the P&F model comfortably outperformed the buy-and-hold strategy for at least a two-year period, the chances for positive returns in the near future, using the model, increased considerably.
VI.A.2. Application of the P&F Mutual Fund model in real time investingThe previous sections provided insight into the signal and performance
characteristics of the P&F method derived model. Now let us put the fi ndings together with some common sense trading rules to observe the application of the method in real time trading.
There are a few key considerations. First, we would rarely want to trade 1,000 mutual fund positions in practice. Second, it is also desirable to avoid strongly declining markets where a long-only method has limited ability to turn a profi t. Third, we do not want to participate during periods when the P&F model is disharmonious with the market, ultimately leading to sub par performance. Fourth, the performance of the model is very similar in both
experiments; however the longer-term window in Experiment B. represents a more conservative approach and is more appropriate for applying the method in real time investing.
In order to simulate real time investing, the following performance criteria are applied to the 4-year test sets from Experiment B.:
• select funds with an average trade gain of 5% or more for the 4 year test period;
• the number of trades is no more than 16 (or 4 per year on average to avoid overly frequent fund exchanges) and no less than 3 for a given fund;
• the model outperforms the buy-and-hold strategy at least by 5%; the model gain in the test period is at least 10%; and no single trade is allowed to loose more than 10%.
• In addition we apply a 10% stop loss rule during the validation period: should the loss exceed 10% for a given trade we automatically exit the position.
The above common sense trading rules selected 132 datasets from our database of 1,000 with excellent risk adjusted return characteristics. In the selected datasets the average gain during the one-year validation period increased to 11.8% from the 7.95% mean gain observed across all 1,000 samples. This represented a substantial 48% improvement in generating profi ts. Moreover, Table 3 shows that the gain/loss characteristics were very favorable with 81% of the trades in the validation set producing a gain or resulting in a neutral trade.
VI.B. The psychology of operating at the boundary of trading and investing
VI.B.1. Paradigm shift for investorsThe psychological elements can account for as much as 85% of the
trader’s success or failure [18]. To achieve the desired state of “Conscious Competence” [18] we must understand the unique features of our trading model and adjust our trading habits accordingly. In this section the optimal psychology commensurate with the P&F Mutual Fund model is examined both from the investor’s and the trader’s point of view.
The method presented in this paper makes use of concepts that may be novel to the majority of long-term investors. For example:
• Mutual funds are typically held long term, not traded. • Investors often thrive to be fully invested at all times. The alternative approach
presented here involves raising cash reserves and taking decisive action only when potential risk presents itself.
• Investors typically set up a fi xed asset allocation mix. The notion of adaptively readjusting the asset allocation mix of the mutual fund portfolio based on changing market conditions is not commonly practiced.
Let us take a closer look at the behavioral factors that must be considered should long-term investors decide to employ the active asset allocation strategy as implemented in this paper. Applying trading signals to mutual funds opens up the possibility of risk control based on quantitative criteria. Consequently, the fund exchanges occasionally may include taking small profi ts and/or
Figure 8Effect of the test period performance on the out-of-sample performance.
Figure 9Neural network analysis of critical performance factors (X axis: P&F model performance in test set; Y axis: buy-and-hold performance in the test set; vertical axis: P&F model performance in the validation set).
Table 3 Performance characteristics of the combined application of the P&F model with common sense trading rules. The trading rules removed sub par trading conditions and shifted the method towards profi table trades.

43JOURNAL of Technical Analysis • 2006, Issue 64
losses (neutral trades). This can happen in trading range markets and/or in markets when stocks “roll over” before entering a downtrending period. When investors put money at risk in the markets, they hope for a respectable return proportionate with the risk they take, and by intuition, they would like to hold their investments until the gains are realized. Consequently, taking a small gain or loss seems counterintuitive in this context but is clearly required under certain circumstances for risk control and capital preservation.
When bullish trends emerge, the reallocation of funds must occur in a relatively short time (within days) to make full use of the opportunity. This requires the daily or weekly tracking of investments versus the more customary once-per-quarter checking. In addition, investors are not accustomed to the precise execution (acting within a one to two day window of opportunity) of fund exchanges based on signals.
In summary, because the more convenient buy-and-hold strategy is not guaranteed to profi t in the future, applying Technical Analysis approaches to mutual funds will require a paradigm shift for investors. In order to be successful, investors must closely track fund assets and execute fund exchanges with discipline as market conditions change.
VI.B.2. Traders or investors?Can mutual fund trading be attractive for traders? Two factors – continuous
market action and the timeframe – are critical in considering the potential pitfalls of traders trading mutual funds:
• Active traders often trade continuously, and the notion of infrequent holding periods interspersed with long periods of inactivity may not be intuitive for them.
• Traders trade usually in the short timeframe (hours, days or weeks) and may not focus on intermediate or longer term market action;
Infrequent fund exchanges present an unusual trading situation for stock and options traders who are more accustomed to watching the price ticks and making frequent trades. Because funds are best traded in the medium-term timeframe and because of the “long only” nature of fund investments, trading decisions tend to be infrequent but very decisive in terms of the percent of capital moved. This means that traders must “sit on their hands” potentially for several months but need to be prepared for fast action as markets change due to unexpected breaking news. In addition, limit and stop orders are not available for mutual funds making trade exchanges more cumbersome.
What makes the real-time application of P&F pattern-based signals to mutual fund asset allocation a quite challenging task? It is the unique psychology required to blend the fast and decisive trading action of traders with the passive “do nothing” philosophy of the long-term investor. However, the rewards are readily apparent: buy-and-hold investors can avoid long loosing streaks and stock traders can increase their tax-deferred savings in accounts where mutual funds are the only investment choices.
VI.C. Summary The study demonstrates that mutual funds can provide low risk investment
vehicles with good trend persistence and respectable returns as part of an adaptive investment strategy. To investigate the optimal approach, a Fusion Analysis method was applied that consisted of fundamental fi ltering followed by quantitative fi ltering using Technical Analysis principles.
The quantitative fi lter was constructed using a P&F signal-based method and applied to a database of randomly sampled mutual fund time series data. The results showed that the P&F signals were robust and could form the basis of profi table trading. When the method was used as part of an asset allocation strategy, the performance was further improved by screening out turbulent market conditions using common sense investment rules.
The quantitative results were placed in the context of the investment psychology both in regards to the calibration of the time frame and the risk characteristics of mutual funds. This gave us insight into the optimal decision making psychology of operating on the boundary of trading and investing.
VII. AcknowledgementSpecial thanks to my mentor and good friend, Robert Gadski for his
encouragement and support to explore, experiment and to put to practical use the ideas described in this paper.
VIII. References1. Investors Intelligence, Chartcraft Stock Analysis at “www.investorsintelligence.
com”2. Dorsey Wright & Associates, Point and Figure Charting3. Alexander Elder, 2002, Come into My Trading Room, (John Wiley & Sons,
Inc.)4. Mark Hulbert, The FORBES/Hulbert Investment Letter Survey, FORBES,
January 28, 19985. Perry J. Kauffman, 1998, Trading Systems and Methods (John Wiley & Sons,
Inc.)6. John J. Murphy, 1999, Technical Analysis of the Financial Markets (New York
Institute of Finance)7. Martin J. Pring, 1993, Investment Psychology Explained (John Wiley & Sons,
Inc.)8. Art Ruszkowski, Mechanical Trading Systems vs. the S&P 100 Index, MTA
Journal, Summer-Fall 20009. Susan I. Stern, Point and Figure Analysis, The Classic Versus The Newer
Method, MTA Journal, Winter – Spring 199910. Ken Tower, Point and Figure Charting, CyberTrader Review, Volume 3 Issue 611. fi nance.yahoo.com12. John Downes and Jordan Elliot Goodman, Barron’s Finance and Investment
Handbook13. Edgar E. Peters, 1996, Chaos and Order in the Capital Markets (John Wiley
& Sons, Inc.) 199614. John Murphy’s Market Message at StockCharts.com15. Jesse L. Livermore, 1991, How to Trade in Stocks, (Traders Press), originally
published in 194016. Peter L. Bernstein, 1998, Against the Gods, The Remarkable Story of Risk
(John Wiley and Sons, Inc.)17. John Palicka, Fusion Analysis at the NYIF, Technically Speaking, March 2005
and FT Knowledge at “www.ftknowledge.com/courses/tech_3002.html“ 18. Eric Davidson, The Competency Model, Technically Speaking, March 2005 19. Gabor Varga, Lecture 6 – Momentum Indicators, MTA Educational Foundation
course, February 2005; References: Philip Roth and Mike Epstein
About the AuthorGabor Varga is the President and CEO of Axiomix, Inc., a research
fi rm focused on risk quantifi cation and trend analysis of equity markets, intermarket analysis, and market psychology. Gabor’s background is in the development and application of predictive models. Prior to founding Axiomix, he successfully applied models in the pharmaceutical industry as evidenced by several patents, awards and scientifi c publications. Gabor completed the CMT Program in 2006 and contributes to the MTA Educational Foundation.

JOURNAL of Technical Analysis • 2006, Issue 6444
The Organization of the
Market Technicians Association, Inc.
Member and Affi liate Information
Members and Affi liates have access to the Placement Committee (career placement) can register for the CMT Program may attend regional and national meetings with featured speakers receive a reduced rate for the annual seminar receive the monthly newsletter, Technically Speaking
receive the Journal of Technical Analysis, bi-annually have access to the MTA website and their own personal page have access to the MTA lending library become a Colleague of the International Federation of Technical Analysts
(IFTA)
MTA MemberMember category is available to those “whose professional efforts are spent
practicing fi nancial technical analysis that is either made available to the investing public or becomes a primary input into an active portfolio management process or for whom technical analysis is a primary basis of their investment decision-making process.” Applicants for Membership must be engaged in the above capacity for fi ve years and must be sponsored by three MTA Members familiar with the applicant’s work.
MTA Affi liateMTA Affi liate status is available to individuals who are interested in technical
analysis and the benefi ts of the MTA listed below. Most importantly, Affi liates are included in the vast network of MTA Members and Affi liates across the nation and the world providing you with common ground among fellow technicians.
DuesDues for Members and Affi liates are $300 per year and are payable when
joining the MTA and annually on July 1st. College students may join at a reduced rate of $50 with the endorsement of a professor. Applicants for Member status will be charged a one-time application fee of $25.

74 Main Street • Woodbridge, NJ 07095 • 732/596-9399 • www.mta.org Professionals Managing Market Risk • Incorporated in 1973
®Professionals Managing Market Risk • Incorporated in 1973
®
TECHNICALJOURNAL
ANALYSISofof
2006 • ISSUE 64
Related Documents