ARTICLE IN PRESS http://jopr.mpob.gov.my/category/article-in-press/ REVIEW ARTICLE Breeding Virescens Oil Palm Vol. 33 (4) December 2021

Welcome message from author
This document is posted to help you gain knowledge. Please leave a comment to let me know what you think about it! Share it to your friends and learn new things together.
Transcript

ARTICLE IN PRESS
http://j
opr.mpob.gov.m
y/category/article-in
-press/
REVIEW ARTICLEBreeding Virescens Oil Palm
Vol. 33 (4) December 2021

JOURNAL OF OIL PALM RESEARCH (formerly known as ELAEIS)
RM30 per issue for Malaysians. USD15 per issue for international subscribers. Allow 14 days for delivery after receipt of order.
JOURNAL OF OIL PALM RESEARCH, an international refereed journal, carries full-length original research papers, short communications and scientific review papers on various aspects of oil palm and palm oil and other palms. JOURNAL OF OIL PALM RESEARCH is published four times per year, i.e. March, June, September and December.
© Malaysian Palm Oil Board, 2021
All rights reserved. No part of this publication may be reproduced in any form or by any means without the written permission of the Malaysian Palm Oil Board.
Impact Factor:2.057
data from 2020 Journal Citation Report® Science Edition– A Clarivate Analytics product.
For more information on advertisement for the JOURNAL OF OIL PALM RESEARCH, please write to:
Editor-in-Chief Journal of Oil Palm Research Malaysian Palm Oil Board 6 Persiaran Institusi, Bandar Baru Bangi 43000 Kajang, Selangor, Malaysia
Tel: 603-8769 4400 E-mail: [email protected] Website: jopr.mpob.gov.my
DISCLAIMERViews of writers expressed in this publication are not necessarily endorsed
by or represent the views of the Malaysian Palm Oil Board.
Published by the Malaysian Palm Oil Board

Breeding Virescens Oil PalmVengeta Rao and Chang, K C
Genetic Transformation of Oil Palm-based on Selection with Hygromycin Bahariah, B; Rasid, O A; Rahmah, A R S; Ghulam Kadir Ahmad Parveez and Masani, M Y A
A Comparative Study of Bacterial Communities Determined by Culture-dependent and-Independent Approaches in Oil Palm Planted on Tropical PeatlandAyob, Zahidah and Kusai, Nor Azizah
Evaluation of Mitochondrial DNA Isolation Methods for Oil Palm (Elaeis guineensis) LeafAzimi Nuraziyan; Siew-Eng Ooi and Meilina Ong-Abdullah
Bird Species Richness, Abundance and Their Feeding Guild across Oil Palms Development through Mist-netting Method in Betong, SarawakAmit, B; Tuen, A A and Kho, L K
Mapping the Nitrogen Status on Immature Oil Palm Area in Malaysian Oil Palm Plantation with Autopilot Tractor-mounted Active Light SensorRohaida Mohammad; Darius El Pebrian; Mohammad Anas Azmi and Ezrin Mohd Husin
Effect of Operating Temperature on Physicochemical Properties of Empty Fruit Bunch Cellulose-derived Biochar Stasha Eleanor Rosland Abel; Soh Kheang Loh; Noorshamsiana Abdul Wahab; Ondrej Masek; Musa Idris Tanimu and Robert Thomas Bachmann
The Effect of Saturated and Unsaturated Fatty Acid Composition in Bio-based Lubricant to the Tribological Performances using Four-ball TribotesterZulhanafi, P; Syahrullail, S; Abdul Hamid, M K and Chong, W W F
Optimisation of Alkali Extraction of Palm Kernel Cake ProteinFatah Yah Abd Manaf and Noor Lida Habi Mat Dian
The Effect of Microwave Treatment and Delayed Harvesting on Oil Palm Fruitlets (Elaeis guineensis) Oil QualityNu’man Abdul Hadi; Ng Mei Han; Rusnani Abd Majid and Che Rahmat Che Mat
Characteristics of Retail Refrigerated and Non-refrigerated Margarines/Fat Spreads Sold in Malaysia Sivaruby Kanagaratnam; Teng Kim Tiu; Nur Haqim Ismail; Norazura Aila Mohd Hassim; Wan Rosnani Awg Isa and Noor Lida Habi Mat Dian
Red Palm Oil in Laying Ducks Diets: Effects on Productive Performance, Egg Quality, Concentrations of Yolk CarotenoidsYifei Lu; Shunan Dong; Haiteng Zhou; Ligang Yang; Zhaodan Wang; Da Pan; Xian Yang; Hui Xia; Guiju Sun and Shaokang Wang
Does Palm Mid Fraction Affect Adult Satiety?Voon, P T; Toh, S W H; Ng, T K W; Lee, V K M; Yong, X S; Yap, S Y and Nesaretnam, K
Stability and Performance of Palm-based Transparent Soap with Oil Palm Leaves ExtractNorashikin Ahmad; Zafarizal Aldrin Azizul Hasan and Siti Hajar Bilal
Is There A Sustainable Future for Wildlife in Oil Palm Plantations in Malaysia?Jayasilan Mohd-Azlan and Lisa Lok
SHORT COMMUNICATION
JOURNAL OF OIL PALM RESEARCHVol. 33 (4) December 2021
C O N T E N T S
REVIEW ARTICLE
565RESEARCH ARTICLES
Cover picture: Ripening virescens bunch showing fruits of intermediate colours and green parthenocarpic fruits.
577588607617629643
653668678689703
713724
732

PUBLICATION COMMITTEE
Datuk Dr. Ahmad Parveez Ghulam KadirMalaysia (Editor-in-Chief)
Dr. Gee Ping TouMalaysia
Dr. Trevor Anthony JacksonNew Zealand
Dr. Carl TraeholtMalaysia
Prof. Dr. Tom SandersUnited Kingdom
Prof. Dr. Matthias FinkbenierGermany
Mr. Roch Desmier de ChenonAustralia
Prof. Dr. Stanislav MiertusSlovakia
Dr. Julie FloodUnited Kingdom
Prof. Douglas G HayesUSA
Prof. Dr. Dahlan IsmailMalaysia
Prof. Dr. Zarinah HamidMalaysia
Prof. Dr. Dirk PruferGermany
EDITORIAL BOARD(1 January 2021 – 31 December 2021)
CHAIRPERSONDatuk Dr. Ahmad Parveez Ghulam Kadir
SECRETARYAnita Taib
COMMITTEE MEMBERSDr. Zainab IdrisDr. Ramle MoslimRosidah RadzianDr. Astimar Abdul AzizDr. Mohamad Arif Abd ManafDr. Idris Abu SemanDr. Yeong Shoot KianDr. Aki @ Zaki AmanRuba’ah MasriFauziah ArshadMohd Saufi AwangIptisam Abdul Wahab

565
ARTICLE IN
PRESS
ARTICLE IN
PRESS
Journal of Oil Palm Research Vol. 33 (4) December 2021 p. 565-576DOI: https://doi.org/10.21894/jopr.2020.0098
BREEDING Virescens OIL PALM
VENGETA RAO1* and CHANG, K C2
ABSTRACTRecent discoveries of five independent but closely related nucleotide mutations that result in the virescens fruit type in oil palm, and their diagnostic markers, have renewed interest to breed for the trait. In virescens palms, the immature fruits are green, ripening to a bright orange, whereas in the common nigrescens palms, the immature fruits are a deep purple, almost black, and ripen to red with purple tinges. Ripe virescens bunches are more easily spotted, especially at distance and through the lower fronds and epiphytes on the trunk, thus, having fewer missed in harvesting. Correspondingly, unripe and under-ripe virescens fruit bunches would be apparent, compared to their nigrescens counterparts, during fruit milling. While diagnostic markers will improve the breeding efficiency and save on time and costs, starting with the right virescens palms will ensure that the trait is not gained at the expense of yield.
Keywords: breeding, milling, nigrescens, oil palm, ripening, virescens.
Received: 6 January 2020; Accepted: 11 July 2020; Published online: 12 November 2021.
1 Lot 6729, Jalan Batu Satu, 43800 Dengkil, Selangor, Malaysia.
2 111, Jalan 12/14, 46200 Petaling Jaya, Selangor, Malaysia.
* Corresponding author e-mail: [email protected]
INTRODUCTION
There are two fruit colour types in the African oil palm (Elaeis guineensis) – the usual nigrescens and the much rarer virescens. In nigrescens (Latin for black), the unripe fruits are a deep-violet, seeming black, ripening to red with some residual violet in the apical and cheek regions. In virescens (Latin for green), the fully green young fruits ripen to a bright orange with just a little green on the apex (Figure 1). Virescens just lack the epicarp anthocyanins and other flavonoids (hence, the absence of dark colours) and have no other known differences with nigrescens, for example, higher/lower yield or oil quality. While the ripening skin colour change in nigrescens results from the degradation of anthocyanins and other flavanoids (Hazir et al., 2012) and chlorophyll (Ikemefuna and Adamson, 1984) (the underlying red coming through these diminishing masking colours), it is largely the degradation of chlorophyll in virescens and the underlying orange coming through, especially with
the accumulation of carotenoids in the mesocarp (Hortensteiner and Krautler, 2011). As the colour change is gradual, bunches of intermediate colours may be found on the same palm. Though less obvious, intermediate colours may also be discerned in the fruits of the same bunch, reflecting their differences in development from a common pollination time, for example, green parthenocarpic fruits in an otherwise bright orange ripe virescens bunch (Figure 2).
The evolutionary implication(s) for the colour difference is unknown as both types seem equally attractive to dispersal agents, such as birds and small mammals, nor have any advantage/disadvantage from biotic or abiotic pressures. Logically, virescens should occur more, perhaps even exceed nigrescens in some locations. This is because it is genetically dominant over nigrescens and, while virescens mutations are rare (see next section), over an evolutionary period of 6-51 Mya (Ergo, 1997; Singh et al., 2013) and with clear human preference for it, it would have, arguably, overtaken nigrescens, at least in some locations. So, its continued rarity suggests some unknown factor(s) culling it, possibly anthocyanins affording nigrescens some protection. But this is entirely speculative as also the suggestion that the mutations may be all very recent (Rao, 1987).
REVIEW ARTICLE

566
JOURNAL OF OIL PALM RESEARCH 33 (4) DECEMBER 2021
ARTICLE IN
PRESS
ARTICLE IN
PRESS
ARTICLE IN
PRESS
ARTICLE IN
PRESS
Virescens TRAIT
Rao (1998) observed fruit and bunch ripening in virescens palms. The bunches are green until about two to three weeks before the onset of fruit abscission. Then the colour rapidly changes to brass/bronze-green, then to brass/bronze-orange, to increasingly orange and, finally to a bright reddish-orange. In a palm, bunches of all the above colours may be seen, reflecting their different ages. To a smaller extent, the colour gradation also occurs in the individual fruits of a bunch reflecting the small differences in development despite their near-simultaneous pollination.
Oil accumulation occurs with the colour change but the rapid increase in the final weeks is when the fruit is already largely orange. The accumulation is complete just before or at first fruit abscission. Hence, while bunches that are mostly orange may already have much oil, the maximum is only reached at incipient fruit abscission. In other words, for maximal oil the indicator for when to harvest ripe bunches can still be the normal nigrescens standard of counting loose fruits. This detracts somewhat from the appeal of virescens, but the trait is nevertheless still useful as the harvester is more likely to miss darker bunches in the darker recesses of the palms at height. It will be even more important when the loose fruit standard cannot be followed, for example, when harvesting labour is short or during the monsoon floods. Also, virescens will avoid the harvesting conundrum from ‘physiological ripening’ where young bunches with little oil drop fruits from softened, watery ends, the causes of which are still unknown.
In the virescens fruit, the colour change is acropetal (from base to top). In the bunch, the colour change is also acropetal, with fruits in the bottom spikelets leading the way, following the also acropetal flower anthesis. However, in many bunches, this acropetal pattern is obviated by other influences and no pattern is obvious. As abscission of the ripe fruits commences when most of them are still brass/bronze (not yet orange), the development of more-uniform ripening palms is key. This trait is more readily scored in virescens than nigrescens, and can be done in the bunch analysis laboratory.
Like in nigrescens, unexposed (to light) fruits or parts of them in virescens are a lighter hue - pale cream when young, with an orange tinge on ripening. Parthenocarpic fruits are less bright and their change in colour slower. This is also influenced by the extent of parthenocarpy in the spikelet/bunch – the more parthenocarpy, the slower the development and colour change. This slower colour change is, in fact, a good visual indicator of the pollination. If the harvested bunch is largely orange but with many interspersed green fruits, then the pollination is poor. Where there is an extensive pollination problem, in young or some clonal fields, for example, the overall bunch colour may be arbiter of whether to send it for milling or discard.
Rao (1998) also observed that harvested under-ripe bunches continue their colour change, and this may be temptation to ‘age’ them to ‘full’ ripeness, but the oil will not increase.
Genetics
Early work in Congo and Nigeria suggested that a single dominant gene causes virescens. In Congo, a virescens palm gave 75% virescens in its selfs while out-crossing to nigrescens gave 50% each of virescens
Figure 1. Ripe virescens bunch showing orange fruits with halos of green at the apex, pale yellow where less exposed to the sun.
Figure 2. Ripening virescens bunch showing fruits of intermediate colours and green parthenocarpic fruits.

567
BREEDING Virescens OIL PALM
ARTICLE IN
PRESS
ARTICLE IN
PRESS
and nigrescens (Beirnaert and Vanderweyen, 1941). Hartley (1988) reported that in Nigeria an open-pollinated virescens bunch gave 46% virescens (and 54% nigrescens) and nine virescens x nigrescens crosses gave 54% virescens and 46% nigrescens, that is, about 50:50. He also made the interesting observation that in virescens the absence of anthocyanins (of which there are several types) is not absolute, with traces of one/some which may be distinct from those in nigrescens.
Singh et al. (2014) discovered that mutations of the (Vir) gene render it dysfunctional for anthocyanin biosynthesis, that is, they cause virescens. Three single nucleotide mutations, a deletion and a nucleotide rearrangement, collectively accounted for 99% of the virescens phenotypes, but the 1% discordance suggests that there may be yet other mutations or mechanisms. The small discordance is, however, academic for practical virescens breeding which can now be much more efficient. Furthermore, as mutations of the Vir and Shell gene are independent, virescens can occur in duras, teneras and pisiferas. Hence, good virescens DxP can be produced from an elite homozygous Vir pisifera through conventional breeding aided by the genotyping tools.
The mutations occur very rarely, as evidenced by the low frequency of virescens found – 0%-3% in Ivory Coast (Meunier, 1969), 0.5% and 0.7% in Nigeria and Angola, respectively (Hartley, 1988), and 6% and 0.7% in Cameroons and Zaire (now known as the Democratic Republic of Congo), respectively (Rajanaidu, 1986). Similarly, amongst the millions of cultivated oil palm in Southeast Asia, only an occasional virescens is seen, presumably not from the sources of planting materials. The low frequency also implies that most of the mutations are in the heterozygous state.
The frequencies are higher with human interference, for example, the 6% in Cameroons above is an average from about 2000 wild palms in 11 sites, spiked by two more cared - for sites with 18% and 36%. In many parts of Africa, the ‘red palm fruit’, or Akwu Ojukwu, is revered, its oil and kernel believed to cure ailments and ward off evil (Eziokwu Chineke Gadi, 2017), valued as an anti-poison and miracle oil in Igboland traditional medicine (Ogbuanu et al., 2015) and a general treatment for illness in rural Benin (Akpo et al., 2012), etc. Perhaps, as in humans, redheads are preferable to blackheads, even without any lore of the occult, simply because they are more exotic.
Usefulness of Virescens Trait
The most cited use for the trait is as a cue for bunch ripeness, to tell when to harvest it. The colour change with ripening is more distinct in virescens than in nigrescens, making ripe bunches easier to spot, particularly in tall palms, through
the maze of lower fronds and axillary epiphytes on the trunk. Similarly, ripeness needs to be gauged in the fresh fruit bunches (FFB) landed at the palm oil mill to decide on which to process/discard. With ripeness being the most important determinant of oil extraction rates, the economic implication of accurately determining it is substantial. The traditional method is to sight a specified number of abscissed, or ‘loose’, fruits fallen from the ripening bunch. But, interest in mechanised harvesting with increasing worker shortage, is veering it to more automated assessment, particularly vision- or image-based.
Real-time automated assessments, from which mechanical segregation can be effected, may be even more feasible in the palm oil mill. Some exploratory work on automated assessments can be found in Abdullah et al. (2001); Alfatni et al. (2008; 2014); Bensaeed et al. (2014); Cherie et al. (2015); Hazir et al. (2012); Junkwon et al. (2009); Roseleena et al. (2011); Saeed et al. (2012); Tan et al. (2010) and Utom et al. (2018).
The discovery of non-abscinding/non-oil palm (Donough et al., 1995) offered hope for needing less of the laborious and costly manual loose fruit picking off the ground. But the counting of dropped/loose fruits from ripening bunches is now the criterion for harvesting them, so how to tell bunch ripeness in such palms? By incorporating the virescens gene into them! Crosses between non-shedding teneras, and a selected virescens tenera and dura, both ex-Lobe, Cameroon, were planted in 1999 in Pamol (Rao et al., 2001). Meanwhile, the pioneering work on oil palm fruit abscission by Henderson and Osborne (1990; 1994) has continued with further insights into related anatomical and biochemical changes (Henderson et al., 2001; Roongsattham et al., 2016); Tranbarger, 2012 and their genetical control (Fooyontphanich et al., 2016; Roongsattham et al., 2012; Tranbarger et al., 2019).
Ogbuanu et al. (2015) reported that while both nigrescens and virescens oils have similar physical properties, the latter, with an iodine value of 83.8 is closer to olive oil and likewise too its density. The peroxide value of virescens oil is also markedly higher than in nigrescens oil, as would be expected if it is less saturated. The more than double phospholipids and presence of cystine (an amino acid) are suggested to confer the medicinal and anti-poison properties of virescens oil. However, there has been little corroboration of Ogbuanu et al. (2015) results, which may, therefore, be spurious. Other studies have shown the iodine values of both oils to be similar. For example, in their attempt to produce high iodine value material, the Malaysian Palm Oil Board (MPOB) screened ~2400 palms from the Malaysian Agricultural Research and Development Institute (MARDI)-Nigerian Institute for Oil palm Research (NIFOR) prospection of 1973, including

568
JOURNAL OF OIL PALM RESEARCH 33 (4) DECEMBER 2021
ARTICLE IN
PRESS
ARTICLE IN
PRESS
ARTICLE IN
PRESS
ARTICLE IN
PRESS
several virescens palms. The maximum iodine value from a nigrescens palm was only 69.75 (Arasu et al., 1988), while virescens Palm T128, distributed to the industry for its high iodine value, had 63.4 (Kushairi et al., 1999), not very different.
The breakdown of chlorophyll is good for palm oil as it adversely affects the oil oxidative stability, bleachability and hydrogenation. Ikemefuna and Adamson (1984), in Table 1 and Tan et al. (1997) showed that chlorophyll in palm oil decreases with ripening although never completely. As chlorophyll is removed in refining crude palm oil (CPO) for consumption, less of it in the initial oil is better. The question begged is how similar the chlorophyll breakdown processes are in both virescens and nigrescens oils, and their levels ex-palm, if virescens is to become commercial planting material.
Virescens FOUNDER PALMS AND POPULATIONS - HISTORIC
Due to their rarity and no perceived commercial advantage, at least until recently, there has been little interest in virescens breeding. However, the progenies of individual virescens palms, selected for their other traits, have been exchanged, the fruit colour but incidental. The below listing of the main virescens palms exchanged and the diaspora of their descendants is a history of the passing interest in the trait. There was some love for them but not quite the ardour of Romeo and Juliet (Shakespeare, 1597).
NIFOR Virescens via Department of Agriculture of Malaya (DOAM)
This is the most distributed virescens internationally and over the longest period. The palms, together with the early NIFOR [formerly known as the West African Institute for Oil Palm Research (WAIFOR)] breeding materials, were from 4.45 ha (11 ac) plot of about 800 palms in Calabar, Eastern Nigeria, planted in 1912-1916 from a small number of open pollinated bunches of various types and forms, including mantled and virescens. Each type and form was represented by seeds from a single parent. Hence, the occurrence of both tenera and dura virescens in a particular progeny suggests that the parent was a tenera virescens. Yield and bunch data were collected from 1922-1928, and among the nine duras selected for performance, two were virescens – CA551.341 and CA551.375. Broekmans (1957) provided data on all nine, reproduced in Table 2 with the two virescens highlighted. Hartley (1988) mentioned that, besides the two virescens duras, some tenera virescens were also selected (as seed parents). Specific information on the virescens teneras is, unfortunately, not available, but the mean performance of all the 10
selected teneras (from 43 teneras - 36 nigrescens and seven virescens) gives an idea of the quality of the NIFOR virescens teneras (last row in Table 2). In other words, as the selection was based on performance per se, the virescens teneras were unlikely to be very different from the overall mean.
The NIFOR virescens arrived in Malaya in the early 20th century, at a time of increasing interest in oil palm. The first virescens in Malaya was probably from the 1926-1927 introduction by DOAM - 28 palms from “… no less than 40 different lots of seeds from the various palm oil producing countries in West Africa.” - established in a ha (1 ac) plot at the Central (later Federal) Experiment Station, Serdang (Bunting et al., 1927; 1934). They recorded that among the more distinct types was E. guineensis var. rapanda Chev. with fruits that were a “… vivid cypress-green in the early stages of development changing when ripe to a deep orange.” This plot, Field 19, included the fertile pisiferas - 29/36 and 36/21 - used by DOAM to produce its early DxP planting materials. Given that Malaya and the then British West African countries were fellow British colonies, most oil palm materials came to Malaya through this channel. Thus, early Malayan virescens were highly likely to be of NIFOR origin.
The analysis of 100 ripe rapanda fruits, presumably from the same bunch, in comparison to the then average Malayan fruit, which was Deli dura, are given in Table 3 (Bunting et al., 1934). The constituents, in percentage, suggest that the rapanda, or virescens fruits were tenera, not atypical of the ‘wild’ teneras in Africa. They had a fresh mesocarp content of ~68%. The % shell and % kernel were high compared to modern teneras, but lower than in dura then and now.
From this African/NIFOR introduction, a selected virescens tenera was crossed to fertile pisifera 29.36 from the previously-mentioned Field 19, and twice to a selected virescens tenera from the nearby Highlands Estate (HE). These three virescens families, together with another seven miscellaneous TxT families, were planted in Trial 0.126 at the Federal Experiment Station (FES) Serdang in 1969. We have no record of the HE virescens palm but, given that most of the early materials at HE were from FES Serdang, it may have been a descendant of the Field 19 virescens. A cross of the HE virescens with Serdang fertile pisifera 29.36 was provided to Federal Land Development Authority (Felda), later transferred to Felda Global Ventures (FGV), when they started their breeding programme, the cross coded as progeny ‘RM’. The only other early virescens in the country then, from records we have sighted, was an Ulu Remis virescens which is described in the next section. Gray and Bevan (1966) mentioned that virescens was quite rare in Malaya and that there was no commercial interest in it.

569
BREEDING Virescens OIL PALM
ARTICLE IN
PRESS
ARTICLE IN
PRESS
The third generation (with the original virescens in Africa as the first) virescens comprised selected palms from Trial 0.126, sib-mated and planted in Trial 0.261 at Bukit Lawiang, Johor, Malaysia in 1990. This was undertaken by MPOB which, since its inception in 1979 as the Palm Oil Research Institute of Malaysia (PORIM), managed the oil palm trials at FES Serdang while founding new oil palm research stations. Some of
the MPOB crosses were also provided to Eastern Plantation Agency (EPA), which had then just started oil palm breeding (Rao and Musa, 1995), and planted in Trial 9105.09 at Ladang Tereh Selatan (LTS) estate. The MPOB crosses may still be extant but the EPA trials have probably been replanted. Figure 3 shows the descent, from 1920s-1990s, of the first virescens that entered Malaya/Malaysia.
TABLE 1. REDUCTION IN CHLOROPHYLL CONTENT (mg kg–1) IN OIL OF RIPENING Nigrescens FRUIT*
Pigment
Fruit type Tenera Dura
Ripeness Green Mature Ripe Green Mature Ripe
Age (months) 1-2 3-4 5-6 1-2 3-4 5-6
Chlorophyll a 28.9 20.7 4.3 26.5 22.7 2.4
Chlorophyll b 18.6 15.3 7.3 19 11.8 4.6
Source: * Ikemefuna and Adamson (1984).
TABLE 3. COMPARISON OF AVERAGE MALAYAN OIL PALM FRUIT (Deli Dura) AND RAPANDA TYPE (Virescens) Tenera* IN 1930s
ConstituentAverage
Malayan fruitRapanda type
Palm oil 29.0 32.0
Palm kernel 6.0 9.0
Shell 30.0 23.0
Moisture and residue 35.0 36.0
Note: *Bunting et al. (1934). All figures are % of fresh fruit weight.
TABLE 2. QUALITY OF NIFOR Duras SELECTED FOR PERFORMANCE, INCLUDING TWO Virescens, AND OF Teneras INCLUDING SOME Virescens
Parent palm FFB(kg yr–1)
FB(%)
MF(%)
LOSS(%)
SF(%)
KF(%)
FWT(%)
Dura
551.141 64.9 78.3 46.2 3.4 32.9 17.5 11.3
551.222 75.7 70.8 52.4 3.4 32.1 11.9 8.2
551.224 77.1 67.9 43.9 3.1 39.1 13.9 8.6
551.233 90.7 58.7 48.2 2.9 34.8 14.1 4.5
551.256 114.3 64.7 52.5 2.7 30.4 14.4 9.1
551.341 82.6 67.8 49.3 4.4 32.7 13.6 12.2
551.375 139.3 63.4 44.2 4.7 38.7 12.4 6.4
551.703 112.5 72.8 43.8 3.4 40.0 12.8 10.9
551.261 61.2 68.6 62.6 2.1 22.2 13.0 11.3
Tenera (including virescens)
Average 67.0 56.0 64.0 - 18.0 10.0 -
Note: FFB - fresh fruit bunch yield in kg palm–1 yr–1; FB - % fruit in bunch; MF - % mesocarp in fruit; LOSS - % material loss during analysis; SF - % shell in fruit; KF - % kernel in fruit; all % on fresh weights; FWT - mean fruit weight.
Source: Broekmans (1957).

570
JOURNAL OF OIL PALM RESEARCH 33 (4) DECEMBER 2021
ARTICLE IN
PRESS
ARTICLE IN
PRESS
ARTICLE IN
PRESS
ARTICLE IN
PRESS
Via IRHO/CIRAD
As mentioned above, Felda/FGV received NIFOR virescens through DOAM in the late 1960s. Some five years later, more NIFOR virescens were received from the Institut de Recherches pour les Huiles et Oleagineux (IRHO) [now Centre de Coopération Internationale en Recherche Agronomique pour le Développment (CIRAD)] from their stations in Pobe, Benin and La Me in Ivory Coast. There were eight crosses, two between virescens palms and the rest nigrescens x virescens.
United Plantations Berhad (UPB) planted two virescens progenies in 1977. The first (TT69) was an early Deli dura (ex-Marihat Baris) crossed to a Yocoboue selection from IRHO with the virescens probably the latter. The other progeny (TT80) was derived from an ex-NIFOR virescens tenera with IRHO code WA10. Teneras and pisiferas from TT69 and TT80 are prominent in UPB’s subsequent crosses but virescens individuals rare. A selected palm (virescens) from TT69 was crossed to a selected palm from TT1 (L239TxL432T) and the progeny (TT132) planted in 1992.
Ulu Remis Virescens
The second batch of virescens distributed was among the first oil palms planted at Ulu Remis Estate, Johor. They were open-pollinated seeds from Sumatra, believed to be from Marihat Baris Estate (Rosenquist, 1999). While the Marihat breeding
programme then focussed on breeding only the Deli dura type (all nigrescens), imported African seeds were also planted around 1920 (Janssen, 1959). Hence, while it is possible that the Ulu Remis seeds came from yield-recorded Deli palms, the fact that they were open-pollinated suggests the virescens to be Nigrescens Deli x Virescens African. Nevertheless, the possibility of it being a Deli dura mutation from nigrescens to virescens cannot be dismissed. The virescens was among 175 selected, with FFB>200 kg yr–1, as parents for commercial seed production and further breeding. The palms were labelled ‘PP’ and the virescens was PP201.
A self of PP201 was planted in Trial GB4B in 1940 (and as supplies in Trial GB1A). The self was UR258 and, 20 years later, two virescens palms (UR258/1 and UR258/2) were selected from this family to create virescens UR672 and 673, the first a sib cross and the second an outcross to a nigrescens (UR120/2). Besides planting in Ulu Remis (Trial GB19B), UR672 was provided to UPB and Société Financière des Caoutchoucs (SOCFIN) (coded SOC2739). The cross was planted in 1959/1960 at these three locations but no resulting virescens palms seemed to have been selected for further use.
Virescens FOUNDER PALMS AND POPULATIONS - RECENT
All the recent virescens palms in Malaysia came from germplasm collected in the 1970s and 1980s. Virescens was encountered in most of the countries prospected, and collected if ripe bunches were available. From these open pollinated collections, heterozygous for the trait, a few individuals were selected for breeding, although not for their virescens. The unselected virescens have since been discarded.
Palm 0.151/128T and Discovery of the Virescens Gene
The most disseminated and tested recent virescens palms are all from the MARDI–NIFOR prospections in 1973. The 1973 prospection in Nigeria was not only the most systematic search but its provenances also the best reconnoitred. The germplasm was planted at the MARDI station in Kluang, Johor, Malaysia between 1975-1976 and handed over to MPOB in 1979. Crosses from three virescens palms, from that germplasm, have been distributed to the industry but, again, not for their virescens. Of them, 0.151/128T is the most disseminated and tested.
Oil (un)saturation was the rage in the 1980s, for the now debunked coronary health reasons, and for a more liquid palm oil. The existing germplasm was obviously the best place to search. Trial 0.151 at MPOB Kluang, with palms from the 1973 Nigerian prospection, was a good starting point. Of the ~2400 palms screened, 13 had iodine value >61 compared
Note: NIFOR - Nigerian Institute for Oil Palm Research. HE - Highlands Estate.
Figure 3. Lineage of ex-NIFOR Serdang virescens, 1920-1990.
HEvirescens 126/4263 126/4252
126/4367 126/4370 9105.09/1061
0.261/ECP93
NIFOR (Tvir) NIFOR (Tnig)
Field19/virescens Field19/29.36

571
BREEDING Virescens OIL PALM
ARTICLE IN
PRESS
ARTICLE IN
PRESS
to ~55 of commercial materials. Of them, only 151/128T was tenera (the rest duras as the prospection had focussed on dura), and it was also high yielding and virescens. Table 4 shows some of its performance data as well as those of the population from which it came. Table 5 shows the fatty acid composition of its oil, the primary reason for its selection. The palm was an open pollinated offspring from a dura virescens bunch from Ufuma, Nigeria. Like much of the prospected materials, the fruits were small, a mere 5 g, with 46% mesocarp (field notes from 1973 MARDI-NIFOR prospection in Nigeria).
Selfs of the palm and its pollen were provided to several companies interested in breeding for a less saturated oil, besides being planted in MPOB itself. It was this combined large population of 0.151/T128T offspring, segregating for nigrescens and virescens, that helped in the discovery of the virescens gene.
UPB was upfront in the breeding for less saturated oil, hence, their interest in 0.151/128T, not for its virescens. The other high iodine value selections acquired by UPB from MPOB were all duras and nigrescens. Besides the selfing of
0.151/128T, it was also crossed to 10 UPB high iodine value teneras, three pisiferas from high iodine value families, an oleifera and oleifera-guineensis hybrid. Sharma (1999; 2003) presented their performance (including iodine value), followed by an update by Musa and Gurmit (2008) for the E. guineensis crosses (Table 6). The selfs retained the high iodine value of their parent and the small fruits and bunches, but the oil yields were low. Outcrossing with UPB high iodine value selections improved the fruit and bunch size but with still low oil yields and some diminution in the iodine value. The values for the crosses with the Oleifera-guineensis hybrid and an Oleifera-guineensis x guineensis backcross were typical for such crosses with no additional value conferred by the high iodine value 0.151/128T. Nevertheless, a few individuals with oil yield comparable to that of commercial DxP were identified for cloning.
Like most, if not all virescens, 0.151/128T was heterozygous for the trait and its selfs and outcrosses segregated into nigrescens and virescens. Three palms from the selfs and one from an outcross were selected for further crossing and their descendants shown in
TABLE 4. PERFORMANCE OF PALM 0.151/128T AND ITS BACKGROUND POPULATION
Pop or palm FFB BN BW FW FB MF OM OB KB
Pop 14 (T) 174.4 16.6 11.4 6.8 69.4 80.8 50.9 26.5 5.5
Pop 14 (D) 166.3 15.4 12.3 9.6 64.6 49.6 48.4 15.6 7.6
Palm 0.151/128T 217.2 22.3 10.3 7.2 67.5 80.8 50.0 27.2 4.9
Note: FFB - fresh fruit bunch yield in kg palm–1 yr–1; BN and BW - average number of bunches produced/year over the period of recording and their average weight (kg); FW - mean fruit weight (g); FB - % fruit in bunch; MF - % mesocarp in fruit; OM - % oil in mesocarp; OB and KB - oil and kernel content (%) of fruit bunches; all % on fresh weights.
TABLE 5. FATTY ACID COMPOSITION (in %) OF PALM OIL FROM Virescens PALMS 0.151/128T AND 0.151/618D
Palm C14:0 C16:0 C18:0 C18:1 C18:2 IV
0.151/128T 0.6 35.3 5.3 42.1 15.8 63.4
0.151/618D 0.6 33.7 6.7 44.2 13.5 61.2
Note: IV - iodine value.
TABLE 6. PERFORMANCE OF MPOB Virescens 0.151/128T CROSSES AT UNITED PLANTATIONS BERHAD*
Cross FFB BN BW FW MF SF OB KB HI
0.151/128T self 196.0 28.8 5.4 6.7 78.5 13.7 21.5 4.5 0.56
TT29/64x0.151/128T 240.0 26.6 9.0 10.5 82.9 9.0 25.9 6.4 0.49
TP6/328x0.151/128T 241.3 27.9 8.6 6.7 80.3 11.1 23.5 6.0 0.53
TT10/843x0.151/128T 237.5 27.0 8.8 7.2 76.8 12.1 22.9 4.9 0.46
TT10/867x0.151/128T 209.0 30.5 6.9 7.7 76.3 13.8 21.5 4.9 0.45
Standard DP cross 246.5 21.6 14.8 12.9 82.4 8.8 26.8 5.4 0.61
Note: FFB - fresh fruit bunch yield in kg palm–1 yr–1; BN and BW - average number of bunches produced/year over the period of recording and their average weight (kg); FW - mean fruit weight (g); MF - % mesocarp in fruit; SF - % shell in fruit; OB and KB - oil and kernel content (%) of fruit bunches; all % on fresh weights; HI - height increment in cm yr–1.
Source: *Musa and Gurmit (2008).
572
JOURNAL OF OIL PALM RESEARCH 33 (4) DECEMBER 2021
ARTICLE IN
PRESS
ARTICLE IN
PRESS
ARTICLE IN
PRESS
ARTICLE IN
PRESS
Figure 4. We are not aware if any of the selections were virescens and, hence, whether the virescens trait was continued. Note that if the WA10 origin (a NIFOR virescens) provided to UPB by IRHO, and its descendant, TT80/45T, as well as TT113/320T from the self of 151/128T, are both virescens, then the cross (TT209) would have had both homozygous and heterozygous virescens palms. Also, the virescens trait in the case would have come from both ancestors, and if the ancestral virescens were from different mutations, then the ‘homozygosity’ would be due to two different Vir alleles and not 2x the same one. While probably of no practical importance, this ‘different homozygosity’ is godsend for studying the trait genotype-phenotype relationship. A caveat, however, is that Singh et al. (2014) found all five virescens from the Nigerian germplasm to have the same mutation and the above ancestral virescens are from West Africa/Nigeria.
Felda/FGV took the selfs of 0.151/128T and its pollen and used the latter to cross with two Yangambi and one Yangambi-La Me selected teneras. The pollen was also used in progeny test combinations with a range of Deli duras. An outstanding tenera (B36/35T) from a Yangambi cross was extensively progeny tested and used to create new materials with Felda’s/FGV’s other tenera/pisifera populations. A sib dura (B36/36D) was progeny tested with Yangambi and AVROS pisiferas, the crossings illustrated in Figure 4. Besides the above extensive work, Felda/FGV also collected a self of another virescens from the MPOB Nigerian collection, high iodine value virescens dura 0.151/618D (Table 5), as well as a self of a virescens dura (0.221/1362D) from the MPOB Congo collection. These origins, however, were not exploited further.
During this time of active virescens breeding several virescens teneras, of NIFOR and 0.151/128T origins, were cloned and planted in trials, but not released for commercial planting.
Following their initial, albeit incidental, collection of virescens and subsequent extensive work with the Nigerian Prospected Material (NPM) virescens, as well as crossings with their advanced Yangambi families, Felda registered two virescens ‘varieties’ in 2009 – Felda Tenera Yangambi Virescence and Felda Dura Yangambi Virescence - for protection. Despite Felda/FGV having produced pure virescens DxP, there has been no commercial release possibly because their performance is only comparable to that of commercial nigrescens DxP. The industry would need more incentive, for example, much higher yields, to depart from their tried and trusted nigrescens.
Applied Agricultural Resources (AAR) included 151/128T in their NPM testing with their advanced dura and tenera/pisifera parents (Soh et al., 1999). The palm had good combining ability for high bunch number, high oil/bunch, low height and low frond dry weight. The high iodine value was reflected by high C18:1. However, the work has been discontinued.
The third virescens NPM designated for the next generation is 0.150/501T. This is a tenera from Population 12, high yielding and very short, and hence with a high bunch index as well as having oil with high vitamin E (Kushairi et al., 1999). Selfs were provided to an industry member besides planting in MPOB. The selfs segregated in the expected ratios for a heterozygous virescens and were dwarf, but otherwise poor in yield and bunch characters (Kalaimugilan, 2020).
Figure 4. Origins of some high iodine value crosses at the United Plantations Bhd. (UPB) including virescens MPOB 0.151/128T and NIFOR/CIRAD WA10.
Jendarata La Me Eziama Ufuma AVROS NIFOR
32/92T20/75T 32/28T Y10T 0.150/128T 0.79/592 BM4/23P WA10
TT69/183T TT1130.150/1931T TP19 TT80/45T TT65/431T
TP64TT108/1761T TP65 TT209 TT211 TT210
TP63
0.150/19.05

573
BREEDING Virescens OIL PALM
ARTICLE IN
PRESS
ARTICLE IN
PRESS
Angola Virescens
The most recent germplasm collection is the 2010 joint prospection by Indonesia, Malaysia and Instituto Nacional do Café de Angola (INCA) in Angola. This was on top of a 1991 limited prospection by MPOB/INCA in the same country. The Angola palms have large fruits and thick mesocarp, in clear contrast to the small poor-quality fruits of other collections, the main stumbling block to their wider use in breeding (Table 7).
Adon et al. (1998) showed the successful introgression of the Angola germplasm in the IRHO/CIRAD breeding programme. The work offers hope out of the Deli dura genetic bottle-neck, the raison d’etre for prospection for oil palm diversity in the centres of origin. Furthermore, their (Angola germplasm) tolerance to vascular wilt suggests possible tolerance also to Ganoderma, the scourge of oil palm in Southeast Asia.
Following evaluation of its prospected materials, MPOB have disseminated progenies of the best palms to all the major breeding programmes in the country. The average performance of the dura and tenera palms from the prospections and a selected virescens palm provided to the industry is shown in Table 8.
In Indonesia, seedlings from the 2010 prospection have been shared with the sponsors of the expedition - the major oil palm breeding organisations - and the materials, which include
good numbers of virescens progenies, are being field trialled.
Interestingly, unlike in the Nigerian germplasm, virescens Angola palms could be due to one of three mutant alleles, two point mutations and a deletion (Singh et al., 2014). The difference could be studied for further insight into the trait genotype-phenotype relationship.
CONCLUSION
The common oil palm is the nigrescens type which immature fruit is dark violet, ripening to red with violet tinges, following the degradation of anthocyanins, other flavonoids and chlorophyll in the epicarp as carotene accumulates in the mesocarp. The rarer virescens lacks anthocyanins and flavonoids, but chlorophyll gives the immature fruit a bright green colour. On ripening, the chlorophyll degrades, and carotenes also accumulate in the mesocarp, making the fruit a bright orange. Virescens is due to rare mutations of the Vir gene, which make it possible to breed for. The trait is a more obvious cue of fruit ripeness to harvest than nigrescens, especially for tall palms, and for grading FFB for milling. It is a vital trait to introgress into non fruit-abscinding oil palm to ascertain when to harvest the ripe bunches which do not shed fruits. Besides employing the newly-discovered genotyping tools for breeding efficiency
TABLE 7. CHARACTERISTICS OF OIL PALM BUNCHES COLLECTED FROM ANGOLA AND OTHER WEST AFRICAN COUNTRIES (all on fresh basis)*
Country Bunch wt(kg)
Single fruit wt (g)
Mesocarp(%)
Bunch wt(kg)
Single fruit wt(g)
Mesocarp(%)
Ivory Coast 10.9 6.9 41.8 9.8 5.8 61.2
Nigeria 11.8 9.0 47.3 10.9 6.5 70.9
Cameroons 16.8 10.3 39.7 17.3 8.6 62.4
Zaire 17.6 14.2 43.9 17.4 12.6 64.1
Angola 21.4 14.2 48.9 16.0 11.7 70.9
Note: wt - weight. Source: *Rajanaidu et al. (1991).
TABLE 8. MEAN PERFORMANCE OF Duras AND Teneras IN MPOB’S 1991 ANGOLA PROSPECTIONS AND OF A SELECTED Virescens PALM (P0.312/1263T)*
FFB BN BW FB FW MF SF ODM OB KB HI
0.312/Dura 144.4 14.0 10.7 65.0 12.5 49.9 38.7 77.0 15.0 7.4 0.4
0.312/Tenera 158.6 14.3 11.4 63.1 11.0 74.3 14.2 77.4 21.9 7.3 0.5
0.312/1263Tvir 227.9 16.4 14.1 68.2 13.7 72.3 13.9 79.5 23.9 9.4 0.8
Note: FFB - fresh fruit bunch yield in kg palm–1 yr–1; BN and BW - average number of bunches produced/year over the period of recording and their average weight (kg); FB - % fruit in bunch; FW - mean fruit weight (g); MF - % mesocarp in fruit; SF - % shell in fruit;
ODM - % oil in dry mesocarp; OB and KB - oil and kernel content (%) of fruit bunches; all % on fresh weights; HI - height increment in cm yr–1.
Source: *Kushairi et al. (2004).

574
JOURNAL OF OIL PALM RESEARCH 33 (4) DECEMBER 2021
ARTICLE IN
PRESS
ARTICLE IN
PRESS
ARTICLE IN
PRESS
ARTICLE IN
PRESS
gain, starting with the right genetic stocks will shorten the process of achievement. The virescens palms from recent germplasm collections in Angola are a promising start. Discovery of the virescens gene plus the now widespread trialling of new virescens palms, in both Indonesia and Malaysia, may be key to staving off the threats to oil palm – laborious harvesting and fruit collection in the increasingly worker-short industry.
ACKNOWLEDGEMENT
The authors would like to thank Kysnadyana for inspiring the write-up and completion of this review article.
REFERENCES
Abdullah, M Z; Guan, L C; Mohd-Azemi, B M N (2001). Stepwise discriminate analysis for colour grading of oil palm using machine vision system. Food Bioprod. Proc., 79: 223-231.
Adon, B; Baudouin, L; Durrand Gasselin, T and Kouame, B (1998). Utilisation de material non ameliore pour la selection du palmier a huile: l’origine Angola. Plantations, Recherche, Development, (Mei-Jun): 201-205.
Akpo, E; Vissoh, P V; Tossou, R C; Crane, T; Kossou, D K; Richards, P; Stomph, T J and Struik, P C (2012). A participatory diagnostic study of the oil palm (Elaeis guineensis) seed system in Benin. NJAS-Wagen. J. Life Sci., (60-63): 15-27.
Alfatni, M S M; Shariff, A R M; Abdullah, M Z; Marhaban, M H; Shafie, S B; Amiruddin, M D and Saaed, O M B (2014). Oil palm fresh fruit bunch ripeness classification based on rule-based expert system of ROI image processing technique results. IOP Conf. Ser: Earth Environ. Sci., 20: 012018.
Alfatni, M S M; Shariff, A R M; Shafri, H Z M; Saaed,
O M B and Eshanta, O M (2008). Oil palm fruit bunch system using red, green and blue digital number. J. Appl. Sci., 8(8): 1444-1452.
Arasu, N T; Lawrence, M J and Rajanaidu, N (1988). Prospects for the alteration of fatty acid composition in the oil palm through breeding. Proc. of the 1987 Int. O.P./P.O. Conf. – Agriculture. PORIM, Bangi. p. 86-93.
Beirnaert, A and Vanderweyen, R (1941). Contribution à l’étude génétique et biométrique des variétés d’Elaeis guineensis Jacquin. Publications de l’Institut National pour l’Étude Agronomique, Série Scientifique 27. Belgian Congo.
Bensaeed, O M; Shariff, A M; Mahmud, A B; Shafri,
H and Alfatni, M (2014). Oil palm fruit grading using a hyperspectral device and machine learning algorithm. IOP Conf. Ser: Earth Environ. Sci., 20: 012017.
Broekmans, A F M (1957). The production of improved oil palm seed in Nigeria. J. West Afr. Inst. Oil Palm Res., 2: 116-132.
Bunting, B; Eaton, B J and Georgi, C D V (1927). The oil palm in Malaya. Department of Agriculture Bulletin No. 39. Kuala Lumpur.
Bunting, B; Georgi, C D V and Milsum, J N (1934). The oil palm in Malaya. Department of Agriculture Malayan Planting Manual No. 1.
Cherie, D; Herodian, S; Ahmad, U; Mandang, T and Makky, M (2015). Optical characteristics of oil palm fresh fruits bunch (FFB) under three spectrum regions. Influence for Harvest Decision, 5(3): 255.
Donough, C R; Corley, R H V and Law, I H (1995). ‘Non-shedding’ variants of the oil palm. ISOPB Newsletter, 11(2): 10-11.
Ergo, A B (1997). Nouvelle evidence de l’origine Africaine de l’Elaeis guineensis Jacq. Par la découverte de graines fossils en Uganda. Annales de Gembloux, 102: 191-201.
Eziokwu Chineke Gadi (2017). Eziokwu Chineke Gadi Traditional Outreach. https://web.facebook.com/120520055335816/posts/about-akw%E1%BB%A5-%E1%BB%8Djukwu-red-palm-fruitthis-palm-fruit-is-called-akw%E1%BB%A5-ojukwu-in-my-dial/124834908237664/?_rdc=1&_rdr, accessed on 8 January 2019.
Fooyontphanich, K; Morcillo, F; Amblard, P; Collin, M; Jantasuriyarat, C; Verdeil J-L; Tangphatsornruang, S and Tranbarger, T J (2016). A phenotypic test for delay of abscission and non-abscission oil palm fruit and validation by abscission marker gene expression analysis. Acta Horticulturae, 1119: 97-104. DOI: 10.17660/ActaHortic.2016.1119.13.
Gray, B S and Bevan, J W L (1966). Chapter 2: Varieties in the oil palm in Malaya. Ministry of Agriculture and Cooperatives. 23 pp.
Hartley, C (1988). The Oil Palm. Third edition. Harlow, Essex, United Kingdom. p. 47-94.
Hazir, M H M; Shariff, A R M and Amiruddin, M D (2012). Determination of oil palm fresh fruit bunch ripeness-based on flavonoids and anthocyanin content. Ind. Crops Prod., 36(1): 466-475.

575
BREEDING Virescens OIL PALM
ARTICLE IN
PRESS
ARTICLE IN
PRESS
Henderson, J and Osborne, D J (1990). Cell separation and anatomy of abscission in the oil palm Elaeis guineensis Jacq. J. Exp. Bot., 41: 203-210.
Henderson, J and Osborne, D J (1994). Intertissue signalling during the two-phase abscission in oil palm fruit. J. Exp. Bot., 45: 943-951.
Henderson, J; Davies, H A; Heyes, S J and Osborne, D J (2001). The study of a monocotyledon abscission zone using microscopic, chemical, enzymatic and solid-state C-13 CP/MAS NMR analyses. Phytochemistry, 56: 131-139.
Hortensteiner, S and Krautler, B (2011). Chlorophyll breakdown in higher plants. Biochim. Biophys. Acta, 1807: 977-988.
Ikemefuna, J and Adamson, I (1984). Chlorophyll and carotenoid changes in ripening oil palm fruit, Elaeis guineensis. Phytochemistry, 23(7): 1413-1415.
Janssen, A W B (1959). Miscellaneous notes on estate agriculture in Sumatra No. 7 oil palm productivity and genetics. Chemara Research Station, Layang Layang, Johor.
Junkwon, P; Takigawa, T; Okamoto, H; Hasegawa, H; Koike, M; Sakai, K; Siruntawineti, J; Chaeychomsri, W; Vanavichit, A; Tittinuchanon, P and Bahalayaodhin, B (2009). Hyperspectral imaging for non-destructive determination of internal qualities for oil palm (Elaeis guineensis Jacq. Var. tenera). JSAI Agric. Info. Res., 18(3): 130-141.
Kalaimugilan, B (2020). Personal communication. Kuala Lumpur.
Kushairi, A; Rajanaidu, N and Jalani, B S (1999). PORIM Series 2. PORIM Information Series No. 16. 2 pp.
Kushairi, A; Rajanaidu, N; Mohd Din, A; Isa, Z A; Noh, A and Junaidah, J (2004). Performance of Angola genetic materials. Proc. of the Seminar on Progress of PS1 and PS2 Planting Materials and Release of Elite Germplasm to the Industry. MPOB, Bangi. p. 75-90.
Meunier, J (1969). Etude des populations naturelles d’Elaeis guineensis Jacq. en Côte d’Ivoire. Oléagineux, 24: 195-201.
Musa, B and Gurmit, S (2008). Utilization of MPOB germplasm at United Plantations. Proc. of the 3rd Seminar on Performance of MPOB PS1 and PS2 Materials and Elite Germplasm. p. 43.
Ogbuanu, C C; Chime, C C and Nwagu, L N (2015). Physiochemical and fatty acid analysis of virescens (Ojukwu) oil and nigrescens (ordinary) palm oil of Elaeis guineensis. Afr. J. Food Sci., 9(7): 400-405.
Rajanaidu, N (1986). The oil palm (Elaeis guineensis) collections in Africa. Proc. of the Int. Workshop on Oil Palm Germplasm and Utilisation. PORIM, Bangi. p. 59-83.
Rajanaidu, N; Jalani, B S and Manual Domingos (1991). Collection of oil palm (Elaeis guineensis) germplasm in Angola. ISOPB Newsletter, 8(2): 2.
Rao, V (1987). Genetic Variation in Populations of Oil Palms (Elaeis guineensis) from Nigeria. Ph.D thesis. University of Birmingham. 272 pp.
Rao, V (1998). Ripening in the virescens oil palm. Proc. of International Conference on Oil and Kernel Production in Oil Palm - A Global Perspective (Rajanaidu, N; Henson, I E and Jalani, B S eds.). PORIM, Bangi. p. 226.
Rao, V and Musa, B (1995). The EPA oil palm breeding programme. ISOPB Newsletter, 11(2): 1-9.
Rao, V; Chua, C C; Ching, L C; Wah, T K and Wagiman, N (2001). Pamol Plantations Sdn. Bhd. Research Review 2001. Internal Report.
Roongsattham, P; Morcillo, F; Fooyontphanich, K; Jantasuriyarat, C: Somvong, T; Amblard, P; Collin, M; Mouille, G; Verdeil, J-L and Tranbarger, T J (2016). Cellular and pectin dynamics during abscission zone development and ripe fruit abscission of the monocot oil palm. Front. Plant Sci., 7: 540. DOI: 10.3389/fpls.2016.00540.
Roongsattham, P; Morcillo, F; Jantasuriyarat, C: Pizot, M; Moussu, S: Jayaweera, D; Collin, M: González-Carranza, Z H; Amblard, P; Tregear, J W; Tranbarger, T J; Tragoonrung, S; Verdeil, J and Tranbarger, T J (2012). Temporal and spatial expression of polygalacturonase gene family members reveals divergent regulation during fleshy fruit ripening and abscission in the monocot species oil palm. BMC Plant Biol., 12: 150. DOI: 10.1186/1471-2229-12-150.
Roseleena, J; Nursuriati, J; Ahmed, J and Low, C Y (2011). Assessment of palm oil fresh fruit bunches using photogrammetric grading system. Int. Food Res. J., 18(3): 999-1005.
Rosenquist, E A (1999). Some ancestral palms and their descendants. Proc. of the Seminar Science of Oil Palm Breeding. PORIM, Bangi. p. 8-36.

576
JOURNAL OF OIL PALM RESEARCH 33 (4) DECEMBER 2021
ARTICLE IN
PRESS
ARTICLE IN
PRESS
Saeed, O M B; Sankaran, S; Shariff, A R M; Shafri, H Z M; Ehsani, R; Alfatni, M S and Hazir, M H M (2012). Classification of oil palm fruit bunches based on their maturity using portable four-band sensor system. Comput. Electron. in Agric., 82: 55-60.
Shakespeare, W (1597). Romeo and Juliet. Romantic tragedy. Quarto version.
Sharma, M (1999). Utilization of Nigerian PS1 and PS2 selections in oil palm breeding programmes at UP Bhd. Proc. of the Seminar on PS1 and PS2 Oil Palm Planting Materials. PORIM, Bangi. p. 18-29.
Sharma, M (2003). Utilization of PS1 and PS2 breeding materials at UP Bhd. Proc. of the Seminar on Progress of PS1 and PS2 Oil Palm Planting Materials and Release of Elite Germplasm to the Industry. MPOB, Bangi. p. 27-47.
Singh, R; Low, E T L; Ooi, L C; Ong-Abdullah, M; Nookiah, R; Ting, N C; Marjuni, M; Chan, P L; Ithnin, M; Manaf, M A A; Nagappan, J; Chan, K L; Rosli, R; Halim, M A; Azizi, N; Budiman, M A; Lakey, N; Bacher, B; Brunt, A V; Wang, C; Hogan, M; He, D; Macdonald, J D; Smith, S W; Ordway, J M; Martienssen, R A and Sambanthamurthi, R (2014). The oil palm virescens gene controls fruit colour and encodes a R2R3-MYB. Nat. Commun., 5: 4106. DOI: 10.1038/ncoms5106.
Singh, R; Ong-Abdullah, M; Low, E T L; Manaf, M A A; Rosli, R; Nookiah, R; Ooi L C; Ooi, S E; Chan, K L; Halim, M A; Azizi, N; Nagappan, J; Bacher, B; Lakey, N; Smith, S W; He, D; Hogan, M; Budiman, M A; Lee, E K; DeSalle, R; Kudrna, D; Goicoechea, J L; Wing, R A; Wilson, R K; Fulton R S; Ordway, J M; Martienssen, R A and Sambanthamurthi, R (2013). Oil
palm genome sequence reveals divergence of interfertile species in Old and New Worlds. Nature, 500: 335-339. DOI: 10.1038/nature12309.
Soh, A C; Rajanaidu, N; Hor, T Y and Gan, H H (1999). Combining abilities of selected parents of PORIM’s Nigerian oil palm prospection in introgressed progenies with AAR’s advanced breeding parents. Proc. of the Seminar on PS1 and PS2 Oil Palm Planting Materials. PORIM, Bangi. p. 30-53.
Tan, Y A; Chong, C L and Low, K S (1997). Crude palm oil characteristics and chlorophyll content. J. Sci. Food Agric., 75: 281-288.
Tan, Y A; Low, K W; Lee, C K and Low, K S (2010). Imaging technique for quantification of oil palm fruit ripeness and oil content. Euro. J. Lipid Sci. Technol., 112(8): 838-843.
Tranbarger, T J (2012). Temporal and spatial expression of polygalacturonase gene family members reveals divergent regulation during fleshy fruit ripening and abscission in the monocot species oil palm. BMC Plant Biology, 12: 150. DOI: 10.1186/1471-2229-12-150.
Tranbarger, T J; Domonhédo, H; Cazemajor, M; Dubreuil, C; Fischer, U and Morcillo, F (2019). The PIP peptide of inflorescence deficient in abscission enhances Populus leaf and Elaeis guineensis fruit abscission. Plants, 8(6): 143.
Utom, S L; Mohamad, E J; Ameran, H L M; Kadir, H A; Muji, S Z M; Rahim, R A and Pusppanathan, J (2018). Non-destructive oil palm fresh fruit bunch (FFB) grading technique using optical sensor. Int. J. Integr. Eng., 10(1): 35-39.

577
ARTICLE IN
PRESS
ARTICLE IN
PRESS
Journal of Oil Palm Research Vol. 33 (4) December 2021 p. 577-587DOI: https://doi.org/10.21894/jopr.2020.0111
GENETIC TRANSFORMATION OF OIL PALM-BASED ON SELECTION WITH
HYGROMYCIN
BAHARIAH, B1*; RASID, O A1; RAHMAH, A R S1; GHULAM KADIR AHMAD PARVEEZ1 and MASANI, M Y A1
ABSTRACTThe bar gene conferring resistance to the herbicide Basta was used as a selectable marker in oil palm transformation system. However, the inefficiency in the selection system was believed to generate transgene escape and high rate of chimerism in oil palm. To overcome this limitation, an effective selectable marker for oil palm is required. The aim of this work is to evaluate the use of the hygromycin phosphotransferase (hpt) gene as the selectable marker for generation of stable oil palm transformation via biolistic method and subsequently improve the oil palm transformation efficiency. In this selection approach, the embryogenic calli were bombarded with the vectors carrying the hpt and a green fluorescent protein (gfp) reporter genes, which were driven by the 2X35S promoter assembled in pBINPLUS and pCAMBIA0380 (pPZP) backbones. Visualisation of GFP spots was observed using Fluorescence Microscope for confirmation of successful deoxyribonucleic acid (DNA) delivery. The calli were then cultured on regeneration medium added with hygromycin at 10 mg litre–1 and consequently reduced to 5 mg litre–1. The presence of transgenes in the bombarded tissue was confirmed by polymerase chain reaction (PCR) amplification of hpt and gfp genes. These results demonstrate the potential of hygromycin as an alternative selection agent for oil palm transformation.
Keywords: biolistic, hygromycin, selectable marker.
Received: 29 July 2020; Accepted: 23 October 2020; Published online: 9 December 2020.
1 Malaysian Palm Oil Board, 6 Persiaran Institusi, Bandar Baru Bangi, 43000 Kajang, Selangor, Malaysia.
* Corresponding author e-mail: [email protected]
INTRODUCTION
Genetic transformation of oil palm has progressed substantially in the last few decades (Parveez et al., 2015). However, the transformation efficiency is low at 1.5% by using biolistic (Parveez, 2000), 0.7% by using Agrobacterium (Masli et al., 2009) and relatively higher at 14% using oil palm protoplasts by microinjection (Masani et al., 2014) methods, which needs to be further increased. Oil palm is a complicated plant with a long generation cycle, approximately 20-25 years of the economic lifespan (Zulkifli et al., 2018). In producing transgenic material, it has become an important limitation which will require a long term strategy in executing sensitivity, consistency and repeatability
tests of the oil palm tissue. Apart from this factor, the development of the effective transformation system, particularly efficient selectable markers for the selection of transformants is being carried out. Initially, the use of herbicide selectable marker, the bar gene, has become an established practice in oil palm genetic transformation. It was first reported as the most efficient selectable marker in oil palm transformation (Parveez et al., 2000; 2007). The bar gene isolated from Streptomyces hygroscopicus (Thompson et al., 1987) was originally used to obtain tolerance to the antibiotic bialaphos and herbicide resistance in plants (De Block et al., 1987). Resistance is conferred by encoding the enzyme phosphinothricin acetyltransferase, which is responsible for detoxifying phosphinothricin (PPT) by acetylation (Murakami et al., 1986). Unfortunately, molecular analysis of the regenerated transgenic oil palm plants using bar selectable marker gene has suggested the presence of chimeric, causing them to survive under selection pressure (escape
RESEARCH ARTICLES

578
JOURNAL OF OIL PALM RESEARCH 33 (4) DECEMBER 2021
ARTICLE IN
PRESS
ARTICLE IN
PRESS
ARTICLE IN
PRESS
ARTICLE IN
PRESS
phenomenon) in majority of the analysed samples. This may be due to the non-optimal and appropriate selection system during the regeneration process of transgenic plants (Masura et al., 2017; Nurfahisza et al., 2014).
Effort has been made to establish an efficient transformation selection system for oil palm by using an alternative selectable marker gene, antibiotic hygromycin phosphotransferase (hpt). The hpt gene which was originally derived from E. coli confers resistance to hygromycin B (Gritz and Davies, 1983) that can interfere with translation process and disturb the protein synthesis (Gonzalez et al., 1978). This can be more toxic and kills sensitive cells faster. As a result, it has been widely used as a resistance gene for plant transformation in different species, such as for cassava (Zhang and Puonti-Kaerlas, 2000), castor (Sujatha and Sailaja, 2005), dendrobium (Suwanaketchanatit et al., 2007), grape (Fan et al., 2008), rapeseed (Liu et al., 2011) and spinach (Milojević et al., 2012). The hygromycin antibiotic has also been successfully used as a selection agent in oil palm transformation, but no study has been reported describing the production of stable transformation plants. For instance, Abdullah et al. (2005); Bhore and Shah (2012); Fakhrana et al. (2019); Kalawong and Te-chato (2012); Kanchanapoom et al. (2008) and Parveez et al. (1996; 2007) showed that the antibiotic, hygromycin is one of the most sensitive selection agents for oil palm. Previous minimal inhibition studies demonstrated that the optimal concentrations of hpt gene varied with developmental stages of tissues. The antibiotic completely inhibited the growth of immature embryos, seedling, mature embryos and embryogenic calli at 8-6, 10, 20, 30 and 50 mg litre–1, respectively (Table 1).
In this work, we aimed to evaluate the use of antibiotic hpt selectable marker gene to produce stably transformed transgenic oil palm. Thus, as part of the ongoing efforts to develop an oil palm transformation system using the antibiotic hygromycin resistance gene, two expression vectors carrying the hpt selectable marker gene
and green fluorescent protein (gfp) reporter gene driven by 2XCaMV35S promoter in different vector backbones were evaluated in this study. The pBIHA1 vector in pBINPLUS backbone (Belknap et al., 2008) which was previously reported (Bahariah et al., 2017) and a newly constructed vector, pBIHA-X in pCAMBIA backbone (Hajdukiewicz et al., 1994) were examined for their ability to increase the transgene expression level and develop an efficient oil palm transformation system by using hygromycin selection.
MATERIALS AND METHODS
Vector Construction
The plasmids used for construction of pBIHA-X are listed in Table 2. The vector pBIHA-X is based on pCAMBIA0380, a pPZP family (Hajdukiewicz et al., 1994), was constructed by using two intermediate vectors created in a previous study (Bahariah et al., 2017). Plasmid pUC19 (Norrander et al., 1983) served as a vector for cloning deoxyribonucleic acid (DNA) fragments. The p2X35STEVGFP-GII (5.2 kb) and p2X35STEVHPT-GII (5.5 kb) contain gfp gene from pAMCFDV-GFP and hpt gene from pCAMBIA1303, respectively. The genes were controlled by a 0.9 kb 2X35S promoter derived from the binary vector pTF101.1 (Paz et al., 2004) and cloned in a pGreenII0000 cloning vector. In order to construct p2X35SHPTGFP-0380 (pBIHA-X) vector, two DNA fragments of 2X35S-TEVHPT-35ST and 2X35S-TEVGFP-35ST were ligated to the HindIII and Spe1 sites of pCAMBIA0380 to create 10 810 bp of p2X35STEVHPT-0380 (pBIHA-X).
Plant Materials and Culture Conditions
The oil palm cultures used in this study were provided by Clonal Propagation Group, MPOB, Malaysia. Young leaflets of P164 ortet sample with a width of approximately 2-3 mm were cultured
TABLE 1. THE HYGROMYCIN USED AS A SELECTION AGENT IN PREVIOUS OIL PALM TRANSFORMATION STUDIES
Oil palm tissues General working concentration References
Immature embryos 20-50 mg litre–1 Parveez et al. (1996)
Immature embryos 20-50 mg litre–1 Abdullah et al. (2005)
Immature embryos 20 mg litre–1 Parveez et al. (2007)
SeedlingMature embryosEmbryogenic calli
50 mg litre–1 Kanchanapoom et al. (2008)
Immature embryos 8-6 mg litre–1 Bhore and Shah (2012)
Embryogenic calli 30 mg litre–1 Kalawong and Te-chato (2012)
Embryogenic calli 10 mg litre–1 Fakhrana et al. (2019)
Embryogenic calli 5 mg litre–1 In this study

579
GENETIC TRANSFORMATION OF OIL PALM-BASED ON SELECTION WITH HYGROMYCIN
ARTICLE IN
PRESS
ARTICLE IN
PRESS
on a modified Murashige and Skoog medium, supplemented with 8-10 mg litre–1 NAA for callus induction and proliferation (Murashige and Skoog, 1962). They were maintained in the dark with a temperature of 28 ± 1oC. Friable calli derived from the primary embryoid initiation were then isolated and inoculated in the liquid medium treated with 1 mg litre–1 2,4-D and 0.1 mg litre–1 NAA for culture maintenance (L-1). The embryogenic calli developed from eight months suspension calli were subsequently cultivated on L-1 solidified medium. Approximately 0.5 g of embryogenic calli with sizes, which ranged from 0.5 to 1.0 mm per plate, was incubated in the dark at 28oC, 24 hr prior to the bombardment. After bombardment, the embryogenic calli were cultured in L-1 medium with no selection for callus proliferation for four weeks in the dark at 28oC. The cultures were then
transferred onto the selection medium, hormone-free maturation medium (MSB) supplemented with 10 mg litre–1 of hygromycin selective agent at 28oC in dark condition, then transferred to medium regeneration (EC) under 16/8 hr light conditions until shoots developed. The culture medium was changed and subcultured repeatedly every four weeks. After a period of six months, the regenerated shoots were placed on shoot inducing (SI) medium and finally in the rooting medium (Table 3).
Bombardment of Calli with hpt Gene Constructs
A total of 20 μg of the plasmid DNA having hpt gene was precipitated onto 0.6 μg gold particles. The DNA coated gold particles were used to bombard oil palm embryogenic callus cultures using the PDS-1000/He Particle Delivery System (Bio-Rad,
TABLE 2. PLASMIDS USED IN THIS STUDY
Plasmids Description Reference source
pBluescriptSK(-) Cloning vector Stratagene
PCRII TOPO Cloning vector Invitrogen
pUC19 Cloning vector Norrander et al. (1983)
pGreenII0000 Intermediate cloning vector John Innes Centre
pCAMBIA0380 Binary Ti vector for Agrobacterium-mediated plants transformation Hajdukiewicz et al. (1994)
pAMCFDV-GFP Contain mGFP reporter gene and 35ST sequences Masani et al. (2014)
pTF101.1 Contain 2XCaMV35STEV promoter sequence Paz et al. (2004)
pCAMBIA1303 Contain hygromycin (hptII) gene Hajdukiewicz et al. (1994)
p2X35STEVGFP-GII Intermediate cloning vector Bahariah et al. (2017)
p2X35STEVHPT-GII Intermediate cloning vector Bahariah et al. (2017)
TABLE 3. MEDIA COMPOSITION FOR SELECTION AND REGENERATION OF TRANSGENIC OIL PALM
ComponentMedium
L-1 MSB EC SI Rooting
M+S Macro (ml litre–1) 50 50 50 50 50
M+S Micro (ml litre–1) 10 10 10 10 10
Y3 Vits (ml litre–1) 1 1 1 1 1
NaFeEDTA (g litre–1) 0.0375 0.0375 0.0375 0.0375 0.0375
Myo-inositol (g litre–1) 0.1 0.1 0.1 0.1 0.1
L-Glutamine (g litre–1) 0.1 0.1 0.1 0.1 0.3
L-Arginine (g litre–1) - 0.1 0.1 0.1 -
L-Asparagine (g litre–1) - 0.1 0.1 0.1 -
NAA (μM) 0.1 - 0.5 0.1 9.0
2,4-D (μM) 1.0 - - - -
Activated charcoal (%) - - - - 0.25
Plant agar (g litre–1) 8 8 8 8 -
Sucrose (g litre–1) 30 30 30 30 60
pH 5.7 5.7 5.7 5.7 5.7-6.0
Antibiotic hygromycin (mg litre–1) - - 10 5 5
Note: L-1 - proliferation medium; MSB - maturation medium; EC - regeneration medium: callus to shoot; SI - regeneration medium: shoots elongation; NAA - α-napthaleneacetic acid.

580
JOURNAL OF OIL PALM RESEARCH 33 (4) DECEMBER 2021
ARTICLE IN
PRESS
ARTICLE IN
PRESS
ARTICLE IN
PRESS
ARTICLE IN
PRESS
Hercules, CA USA). Bombardment was carried out at the following conditions; 1100 psi rupture disc pressure, 6 mm rupture disc to macrocarrier distance, 11 mm macrocarrier to stopping plate distance, 75 mm stopping plate to target tissue distance and 67.5 mm Hg vacuum pressure (Parveez, 2000). Thirty to 40 replications were carried out. The experiment was repeated seven times with several modifications. After bombardment, the calli were observed for GFP expression at 24 hr and two weeks after bombardment, using Nikon AZ100 fluorescence microscope multizoom microscope equipped with specific GFP filter. The GFP signals provided an internal reference for the identification of successfully transformed tissues. The cultures were then incubated at 28oC under 16/8 hr light conditions. The culture medium was changed at every four weeks interval.
Polymerase Chain Reaction (PCR) Analysis
Transformed embryoids that survived on hygromycin selection media were assessed and compared with wild type by PCR analysis. PCR amplification was carried out in a 25 μl reaction mixture, containing 100 ng of DNA template, 10 μM of each primer (reverse and forward primers flanking
the hpt gene), 12.5 µl of 2XGoTaq® Green Master Mix (Promega) and nuclease-free water to a final volume of 25 μl. The PCR amplifications carried out were as follows: initial denaturation (98oC for 1 min), denaturation (98oC for 5 s), annealing (67oC for 5 s), extension (72oC for 1 min) and elongation (72oC for 1 min). The putative transformed samples were further analysed by PCR for detection of gfp transgene using mGFP1 F/R primers. The sequences of reverse and forward primers of hpt and gfp genes are listed in Table 4. The PCR products were electrophoresed in a 1.0% agarose gel at 110V for 80 min.
RESULTS AND DISCUSSION
In order to investigate the potential use of hpt gene for selection of hygromycin resistant transgenic plants, two vectors namely pBIHA-X (10 810 bp) in pCAMBIA0380 backbone, which was successfully constructed in this study and pBIHA1 (14 194 bp) in pBINPLUS backbone which was previously reported (Bahariah et al., 2017) were evaluated in this study (Figure 1).
The pBIHA-X (p2X35SHPTGFP-0380) plasmid was constructed to contain the hpt selectable marker and gfp reporter genes driven by
TABLE 4. PRIMER SEQUENCES FOR POLYMERASE CHAIN REACTION (PCR) ANALYSIS
Primer name Primer sequence
mGFP1 Forward: 5’-CCGGCCATGGGTAAAGGAGAAGAACTTTTCAC-3’Reverse: 5’-CCGGTCTAGATTATTTGTATAGTTCATCCATGCC-3’
Hpt 1 Forward: 5’-GGTCATGAAAAAGCCTGACACCGCG-3’Reverse: 5’-GGCCTCTAGACTATTTCTTTGCCCTCGGACG-3’
Figure 1. Schematic diagram of pBIHA1 and pBIHA-X carrying the hpt and gfp genes driven by 2XCaMV35S assembled in (a) pBINPLUS, and (b) pCAMBIA backbones used for biolistic transformation.
Note: The arrow indicates the orientation of each DNA fragments assembled. LB - left border of T-DNA; 2X35S - double cauliflower mosaic virus 35S promoter; hpt - gene for hygromycin phosphotransferase; mgfp - modified green fluorescent protein; 35ST - 35S terminator gene; RB - right border of T-DNA.
Source: Bahariah et al. (2017).
(b) Spe1 (10 799)EcoR1 (10 775)
35ST RB
2X35Smgfp
HindIII (8908)
2X35S
35STEcoR1 (6798)
STA
LB
hpt
aadAbom site
Rep Ori pBR322
pVS1-REP
pBIHA-X10 810 bp
(a) oriV
ColE1
nptIII
trfA
LBHindIII (7221)2X35S
hpt35ST
SpeI (9445)EcoRI (9469)
35ST
2X35Smgfp
HindIII (11 996)KpnI (11 976)
EcoRI (11 984)
RB
pBIHA114 194 bp

581
GENETIC TRANSFORMATION OF OIL PALM-BASED ON SELECTION WITH HYGROMYCIN
ARTICLE IN
PRESS
ARTICLE IN
PRESS
2XCaMV35S in pCAMBIA0380 backbone (10.8 kb). The construction was carried out by employing two intermediate plasmids, p2X35STEVHPT-GII (5.5 kb) and p2X35STEVGFP-GII (5.2 kb), created in the earlier study (Bahariah et al., 2017). The p2X35STEVHPT-GII fragment was ligated to the HindIII and EcoRI sites of pCAMBIA0380 to form 8.9 kb of p2X35STEVHPT-0380. Then, the
2X35STEVHPT fragment of p2X35STEVHPT-0380 was inserted into p2X35STEVGFP-0380 by digestion with HindIII and Spe1 to produce a vector p2X35STEVHPTGFP-0380, designated as pBIHA-X (Figure 2a). In order to confirm gene insertions into cloning vectors, the vector was analysed by double restriction endonuclease assay using HindIII and EcoR1 (Figure 2b).
Figure 2. Construction of pBIHA-X (p2X35SHPTGFP-0380). (a) The gfp reporter gene was released from pAMCFDV-GFP using the HindIII and NcoI digestion, and ligated into the HindIII and NcoI site of 2X35STEV-PCRIITOPO to create p2X35STEVGFP. This was then recombined with hpt gene fragment amplified from pCAMBIA1303 to construct p2X35STEVHPT. Then, the fragments were digested with HindIII, EcoR1, and cloned into the HindIII and EcoR1 site of pGreenII0000 to generate the p2X35STEVHPT-GII and p2X35STEVGFP-GII. These plasmids were finally ligated to the HindIII and EcoRI sites of pCAMBIA0380 to create p2X35STEVHPT-0380 and with HindIII and Spe1 to form a vector of p2X35STEVHPTGFP-0380 (pBIHA-X). (b) Restriction endonuclease analysis of pBIHA-X vector. An equal amount of DNA of each plasmid was digested with HindIII and EcoR1. Lane M: 1 kb plus DNA ladder, lanes 1-5: Positive clones for p2X35STEVHPT-0380. Arrows indicate the size of 2.1 kb inserted DNA fragment of 2X35S-mGFP-Nos and 8.9 kb of p2X35STEVHPT-0380.
(a)
(b)
8.9 kb
2.1 kb

582
JOURNAL OF OIL PALM RESEARCH 33 (4) DECEMBER 2021
ARTICLE IN
PRESS
ARTICLE IN
PRESS
ARTICLE IN
PRESS
ARTICLE IN
PRESS
The viability of pBIHA-X and pBIHA1 vectors was evaluated by transforming oil palm embryogenic calli using biolistic mediated transformation as described previously (Parveez et al., 2000). After 24 hr post bombardment, the gfp reporter gene expression was visually observed in oil palm calli using AZ100 microscope. The GFP signals were clearly visible in embryogenic calli and reached a peak of more than 30 spots per tissue clump, indicating the gfp gene in both constructed vectors was integrated and expressed in the transformed cells (Figure 3). However, two weeks after bombardment, the number of visible spots expressing gfp declined considerably to less than two spots per clump of tissues with gfp spots grew bigger for some samples. Similar observations were reported in previous studies by Majid and Parveez (2007; 2016). The reduction in the number of GFP spots in oil palm embryogenic calli suggested that GFP degradation and only a few events were stably integrated and expressed. It could also be due to the incidence of transgene silencing mechanisms
(Chee et al., 2018; Schubert et al., 2004). There has been no direct comparison between different vector backbones (pCAMBIA and pBINPLUS) that carry the selectable marker genes. No difference in the GFP expressing cells was observed, suggesting the more prevalent role of the promoter driving the gene as compared to the plasmid backbone (Parveez and Majid, 2008).
Transformed calli were selected in selection medium containing 10 mg litre–1 hygromycin after rested for four weeks. The concentration was chosen based on a previous study on minimal inhibitory concentration (MIC) of hygromycin selection agent for oil palm embryogenic calli (Fakhrana et al., 2019). The study showed that a higher concentration of hygromycin was needed to inhibit the proliferation of embryogenic calli. Therefore, in this study, the embryogenic calli were subcultured every four weeks onto fresh media containing 10 mg litre–1 concentration of hygromycin. Early observation found that the development of embryoid and shoots was normal during regeneration of half-
Figure 3. The green fluorescent protein (GFP) expression in transformed oil palm calli at 24 hr and two weeks after bombardment. Transformed tissues expressing GFP and non-bombarded tissues as control are on the right side. Successful transformation of calli bombarded with pBIHA1 plasmid carrying hpt and gfp genes in pBINPLUS backbone; calli bombarded with pBIHA-X plasmid in pCAMBIA backbone. Yellow arrows indicate GFP spots and scale bar equals 10 mm (24 hr) and 20 mm (two weeks).
Plasmid 24 hr after bombardment Two weeks after bombardment
pBIHA1
pBIHA-X
Control(Non-bombarded embryogenic calli)

583
GENETIC TRANSFORMATION OF OIL PALM-BASED ON SELECTION WITH HYGROMYCIN
ARTICLE IN
PRESS
ARTICLE IN
PRESS
year period. However, after six months of culture, the proliferation was completely stunted and the cultures became necrotic. The embryoid and shoots turned brown and some failed to survive after eight months (Figure 4). The results showed that hygromycin dramatically delayed the inhibition and the growth of oil palm cells at 10 mg litre–1 selection concentration. This observation suggested that oil palm embryogenic calli are highly sensitive to the hygromycin. This finding is consistent with previous studies that showed the presence of antibiotic selection pressures at exceeding maximum levels could inhibit the growth of the transformed plants and kill the nontransformed cells, thus, leading to delay in regeneration (Wilmink and Dons 1993). Subsequently, we then utilised stepwise decreasing concentration of hygromycin from 10 to 5 mg litre–1 at nine months. The hygromycin concentration at 5 mg litre–1 was used as in agreement of an earlier study by Fakhrana et al. (2019). The study showed the concentration of hygromycin needs to gradually decrease throughout the callus maturation process to allow the transformed cells to regenerate to normal plants (Fakhrana et al., 2019). Similar
observations were reported in Setaria viritis (Van Eck et al., 2017) and wheat (Gils, 2017).
To investigate the presence of the hpt gene in transformed oil palm tissue, genomic DNA from regenerated embryoid was used for PCR analysis using a specific hpt primers (Table 4). The result of the PCR analysis is shown in Figure 5. Seven plants out of 33 samples tested, were positive for hpt gene (21%). From the results obtained, 27% of the samples bombarded with pBIHA1 vector and 18% of the samples bombarded with pBIHA-X were hpt positive. The results showed that a 1000 bp fragment of hpt gene was successfully amplified. These positive DNA samples were later subjected to PCR amplification using primers specific for gfp gene. A total of five out of seven hpt positive samples tested were able to amplify the 450 bp gfp gene fragment (Figure 6). The results indicated that only five lines were confirmed to carry both transgenes, gfp and hpt, while the other 26 lines did not show any PCR product. These results could further support the presence of gene escapes due to the chimeric nature of these lines or incomplete insertion of the target genes into the plant genome.
Figure 4. The bombarded calli with pBIHA-X plasmid grown on media containing hygromycin selection agent. (a) Oil palm calli were selected on 10 mg litre–1 hygromycin media for eight months (b) at three months after decreasing to 5 mg litre–1 hygromycin, (c) non-bombarded calli in selection medium and (d) non-bombarded calli on medium without selection. Yellowish and greenish were observed for the transformant (a, b), while for the untransformed cells turn black (c). Scale bar: a (bar 1 cm), b (bar 4 mm), c (bar 1 cm) and d (bar 2 cm).
(a) (b)
(c) (d)

584
JOURNAL OF OIL PALM RESEARCH 33 (4) DECEMBER 2021
ARTICLE IN
PRESS
ARTICLE IN
PRESS
ARTICLE IN
PRESS
ARTICLE IN
PRESS
Overall, the study demonstrated the suitability of the hpt gene in both vectors, pBIHA-X and pBIHA1 for biolistic transformation of oil palm. Both vectors were driven by the same promoter, the double enhanced CaMV35S promoter, which was amplified from pCAMBIA1303. Previously, the CaMV35S
promoter was found to be the most effective promoter for driving gfp gene in oil palm tissues (Parveez and Majid, 2008). The vectors transformed to express the gfp gene and stable integration of both gfp and hpt transgenes into oil palm embryogenic calli was detected by PCR and transient expression assay. A low concentration of selection agent may be required for callus regeneration. The concentration of 10 mg litre–1 is probably too high for selection. This will not only kill the nontransformed cells but also result in toxicity that might inhibit the growth of transformed cells. Some species are very sensitive to hygromycin and only a low concentration was used for their transformant selection, such as 3.0 mg litre-1 for rapeseed leaf petiole cells (Liu et al., 2011) and 7.5 mg litre–1 for Centaurea montana leaf explants (Abou-Alaiwi et al., 2012). The sensitivity of plant tissues to the selective agent depends on many factors, including the tissue types, size of explants, developmental stage, chemical properties and concentration of the selective agents (Bowen, 1993). This could lead to variation in the optimal concentration for selection between plant species. For example, the hygromycin concentration at 25 mg litre–1 for S. viridis (Van Eck, 2018), 50 mg litre–1 for banana (Barlett et al., 2008), 20 mg litre–1 for cotton (Meng et al., 2007) and 30 mg litre–1 for rice (Kumar et al., 2005) were determined to be the optimal concentration of this selective agent. In addition, the selection system to differentiate transformed and nontransformed cells are requisite to regenerate the truly genetically transformed cell.
CONCLUSION
The production of transgenic oil palm is difficult and time-consuming. An alternative approach to tighten the selection system for stable transformation of oil palm was evaluated using an antibiotic hygromycin selectable marker gene, which might be useful and efficient to address these challenges. Oil palm embryogenic calli were bombarded with plasmids carrying hpt selectable marker and gfp reporter genes and selected on medium containing hygromycin. The GFP expression was detected on the transformed tissues that survived the selection, indicating successful transformation. Successful regeneration of the bombarded tissues was achieved through the application of stepwise decreasing concentration of hygromycin selection from 10 to 5 mg litre–1. The non-bombarded embryogenic calli were completely stunted and became necrotic. The regenerated transgenic plants were confirmed through PCR. The rate of hpt positive plants was at 21%. The majority of these hpt positive plants were also shown to carry gfp transgene. Expression studies of the hpt and gfp genes in transgenic oil palm will be carried out to assess the expression level of the transgenes. In
Figure 5. Polymerase chain reaction (PCR) analysis of the putative transgenic embryoid bombarded with plasmids, pBIHA1 (a) and pBIHA-X (b, c) to detect the presence of hpt gene. Lane M: 1 kb plus marker ladder; lane W: water as negative control; lane U: untransformed plants; lane P: positive control (pBIHA-X); lanes 1-33: transformed plants and lanes 6, 7, 9, 19, 20, 22, 30 were positive amplified a 1 kb DNA fragment using primers corresponding to a hpt gene.
Figure 6. Polymerase chain reaction (PCR) analysis of genomic DNA from putative green fluorescent protein (GFP) transformed oil palm calli to detect the presence of gfp gene. PCR amplified a 450 bp fragment using mGFP1F/R primers. Lane M: 1 kb plus marker ladder; P: positive control (pBIHA-X); U: untransformed plants, W: water as negative control; 1-7: transformed plants.
Journal of Oil Palm Research DOI: https://doi.org/10.21894/jopr.2020.0000
6
1 2 3
4 5 Figure 6. Polymerase chain reaction (PCR) analysis of genomic DNA from putative green 6 fluorescent protein (GFP) transformed oil palm calli to detect the presence of gfp gene. PCR 7 amplified a 450 bp fragment using mGFP1F/R primers. Lanes: M 1 kb plus marker ladder; P 8 positive control (pBIHA-X); U untransformed plants, W water as negative control; 1-7 9 transformed plants. 10 11 12
~450 bp
M W U 1 2 3 4 5 6 7 P
Journal of Oil Palm Research DOI: https://doi.org/10.21894/jopr.2020.0000
5
1 2 Figure 5. Polymerase chain reaction (PCR) analysis of the putative transgenic embryoid 3 bombarded with plasmids, pBIHA1 (a) and pBIHA-X (b, c) to detect the presence of hpt gene. Lane 4 M: 1 kb plus marker ladder; lane W: water as negative control; lane U: untransformed plants; 5 lane P: positive control (pBIHA-X); lanes 1-33: transformed plants and lane 6, 7, 9, 19, 20, 22, 6 30 were positive amplified a 1 kb DNA fragment using primers corresponding to a hpt gene. 7
8
9
10 11 12 13 14 15 16 17 18 19 20
(a)
Journal of Oil Palm Research DOI: https://doi.org/10.21894/jopr.2020.0000
5
1 2 Figure 5. Polymerase chain reaction (PCR) analysis of the putative transgenic embryoid 3 bombarded with plasmids, pBIHA1 (a) and pBIHA-X (b, c) to detect the presence of hpt gene. Lane 4 M: 1 kb plus marker ladder; lane W: water as negative control; lane U: untransformed plants; 5 lane P: positive control (pBIHA-X); lanes 1-33: transformed plants and lane 6, 7, 9, 19, 20, 22, 6 30 were positive amplified a 1 kb DNA fragment using primers corresponding to a hpt gene. 7
8
9
10 11 12 13 14 15 16 17 18 19 20
(b)
Journal of Oil Palm Research DOI: https://doi.org/10.21894/jopr.2020.0000
5
1 2 Figure 5. Polymerase chain reaction (PCR) analysis of the putative transgenic embryoid 3 bombarded with plasmids, pBIHA1 (a) and pBIHA-X (b, c) to detect the presence of hpt gene. Lane 4 M: 1 kb plus marker ladder; lane W: water as negative control; lane U: untransformed plants; 5 lane P: positive control (pBIHA-X); lanes 1-33: transformed plants and lane 6, 7, 9, 19, 20, 22, 6 30 were positive amplified a 1 kb DNA fragment using primers corresponding to a hpt gene. 7
8
9
10 11 12 13 14 15 16 17 18 19 20
(c)
(a)

585
GENETIC TRANSFORMATION OF OIL PALM-BASED ON SELECTION WITH HYGROMYCIN
ARTICLE IN
PRESS
ARTICLE IN
PRESS
addition, the integration of the transgenes will also be verified to further confirm their integration and copy number in the regenerated plants.
ACKNOWLEDGEMENT
The authors would like to thank the MPOB for permission to publish this article. We also would like to acknowledge Ms. Nurul Huda Ideris and all members of the Transgenic Technology Laboratory of MPOB for their assistance.
REFERENCES
Abdullah, R; Zainal, A; Heng, W Y; Li, L C; Beng, Y C; Phing, L M; Sirajuddin, S A; Ping, W Y S and Joseph, J L (2005). Immature embryo: A useful tool for oil palm (Elaeis guineensis Jacq.) genetic transformation studies. Electron. J. Biotechnol., 18: 24-34.
Abou-Alaiwi, W A; Potlakayala, S D; Goldman, S L; Josekutty, P C; Karelia, D N and Rudrabhatla, S V (2012). Agrobacterium-mediated transformation of the medicinal plant Centaurea montana. Plant Cell Tiss. Organ Cult., 109: 1-8 DOI:10.1007/s11240-011-0067-8.
Bahariah, B; Masani, M Y A; Parveez, G K A and Rasid, O A (2017). Construction of a vector containing hygromycin (HPT) gene driven by double 35S (2XCAMV35S) promoter for oil palm transformation. J. Oil Palm Res., 29(2): 180-188.
Barlett, J G; Alves, S C; Smedley, M; Snape, J W and Harwood, W A (2008). High-throughput Agrobacterium-mediated barley transformation. Plant Methods, 4(1): 22 pp.
Belknap, W R; Rockhold, D R and McCue, K F (2008). pBINPLUS/ARS: An improved plant transformation vector based on pBINPLUS. BioTechniques, 44: 753-756.
Bhore, S J and Shah, F H (2012). Genetic transformation of the American oil palm (Elaeis oleifera) immature zygotic embryos with antisense palmitoyl-acyl carrier protein thioesterase (PATE) gene. World Appl. Sci. J., 16: 362-369.
Bowen, B A (1993). Markers for plant gene transfer. Transgenic Plants (Kung, S and Wu, R eds.). Academic Press Inc., San Diego, USA. p. 89-123.
Chee, M J Y; Lycett, G W and Chin, C F (2018). Development of a direct transformation method by GFP screening and in vitro whole plant regeneration
of Capsicum frutescens L. Electron. J. Biotechnol., 34: 51-58.
De Block, M; Botterman, J; Vandewiele, M; Dockx, J; Thoen, C; Gossele, V; Movva, R; Thompson, C; Van Montagu, M and Leemans, J (1987). Engineering herbicide resistance in plants by expression of a detoxifying enzyme. EMBO J., 6: 2513-2518.
Fan, C; Pu, N; Wang, X; Wang, Y; Fang, L; Xu, W and Zhang, J (2008). Agrobacterium-mediated genetic transformation of grapevine (Vitis vinifera L.) with a novel stilbene synthase gene from Chinese wild Vitis pseudoreticulata. Plant Cell Tiss. Organ Cult., 92: 197-206.
Fakhrana, I N; Nurfahisza, A R; Rasid, O A and Parveez, G K A (2019). Minimal inhibitory concentration of hygromycin for selecting transformed oil palm embryogenic calli. J. Oil Palm Res., 31(1): 14-27.
Gils, M (2017). A recessive pollination control system for wheat based on intein-mediated protein splicing. Split Inteins: Methods and Protocols, Methods in Molecular Biology (Mootz, H D ed.). Humana Press, New York, USA. p. 173-195.
Gonzalez, A; Jimenez, A; Vazquez, D; Davies, J E and Schindler, D (1978). Studies on the mode of action of hygromycin B, an inhibitor of translocation in eukaryotes. Biochim. Biophys. Acta. 521: 459-469.
Gritz, L and Davies, J (1983). Plasmid-encoded hygromycin B resistance: The sequence of hygromycin B phosphotransferase gene and its expression in Escherichia coli and Saccharomyces cerevisiae. Gene, 25(2-3): 179-188.
Hajdukiewicz, P; Svab, Z and Maliga, P (1994). The small, versatile pPZP family of Agrobacterium binary vectors for plant transformation. Plant Mol. Biol., 25: 989-994.
Kalawong, S and Te-chato, S (2012). Factors affecting gene transformation in embryogenic callus of oil palm by bombardment technique. J. Agric. Technol., 8(7): 2373-2384.
Kanchanapoom, K; Nakkaew, A; Kanchanapoom, K and Phongdara, A (2008). Determination of the most efficient target tissue and helium pressure for biolistic transformation of oil palm (Elaeis guineensis Jacq.). Songklanakarin J. Sci. Technol., 30(2): 151-157.
Kumar, K; Maruthasalam, S; Loganathan, M; Sudhakar, D and Balasubramanian, P (2005). An

586
JOURNAL OF OIL PALM RESEARCH 33 (4) DECEMBER 2021
ARTICLE IN
PRESS
ARTICLE IN
PRESS
ARTICLE IN
PRESS
ARTICLE IN
PRESS
improved Agrobacterium-mediated transformation protocol for recalcitrant elite indica rice cultivars. Plant Mol. Biol. Rep., 23: 67-73.
Liu, H; Guo, X; Naeem, M S; Liu, D; Xu, L; Zhang, W; Tang, G and Zhou, W (2011). Transgenic Brassica napus L. lines carrying a two gene construct demonstrate enhanced resistance against Plutella xylostella and Sclerotinia sclerotiorum. Plant Cell Tiss. Organ Cult., 106: 143-151.
Masani, M Y A; Noll, G A; Parveez, G K A; Sambanthamurthi, R and Prüfer, D (2014). Efficient transformation of oil palm protoplasts by PEG-mediated transfection and DNA microinjection. PLoS ONE, 9(5): e96831.
Masli, D I A; Parveez, G K A and Yunus, A M M (2009). Transformation of oil palm using Agrobacterium tumefaciens. J. Oil Palm Res., 21: 643-652.
Masura, S S; Tahir, N I; Rasid, O A; Ramli, U S; Othman, A; Masani, M Y A; Parveez, G K A and Kushairi, A (2017). Post-genomic technologies for the advancement of oil palm research. J. Oil Palm Res., 29(4): 469-486.
Majid, N A and Parveez, G K A (2016). Regeneration of transgenic oil palm carrying gfp gene used as a visual selectable marker. J. Oil Palm Res., 28(4): 415-430.
Majid, N A and Parveez, G K A (2007). Evaluation of green fluorescent protein (GFP) as a selectable marker for oil palm transformation via transient expression. Asia Pac. J. Mol. Biol. Biotechnol., 15(1): 1-8.
Meng, Z H; Liang, A H and Yang, W C (2007). Effects of hygromycin on cotton cultures and its application in Agrobacterium-mediated cotton transformation. In Vitro Cell Dev. Biol. Plant., 43: 111-118.
Milojević, J; Tubić, L; Nolić, V; Mitić, N; Calić-Dragosavac, D; Vinterhalter, B and Zdravkovic´-Korac, S (2012). Hygromycin promotes somatic embryogenesis in spinach. Plant Cell Tiss. Organ Cult., 109: 573-579.
Murakami, T; Anzai, H; Imai, S; Satoh, A; Nagaoka, K and Thompson, C J (1986). The bialaphos biosynthetic genes of Streptomyces hygroscopicus: Molecular cloning and characterisation of the gene cluster. Molec. Gen. Genet., 205: 42-53.
Murashige, T and Skoog, F (1962). A revised medium for rapid growth and bioassays with tobacco tissue cultures. Physiol. Plant., 15: 473-497.
Norrander, J; Kempe, T and Messing, J (1983). Construction of improved M13 vectors using oligodeoxynucleotide-directed mutagenesis. J. Gene., 26(1): 101-106.
Nurfahisza, A R; Rafiqah, M A; Masani, M Y A; Nor Hanin, A A; Rasid, O A; Parveez, G K A and Ismanizan, I (2014). Molecular analysis of transgenic oil palm to detect the presence of transgenes. J. Oil Palm Res., 26: 73-80.
Parveez, G K A (2000). Production of transgenic oil palm (Elaeis guineensis Jacq.) using biolistic techniques. Molecular Biology of Woody Plants (Jain, S M and Minocha, S C eds.). Kluwer Academic Publishers. Dordrecht, 2: 327-350.
Parveez, G K A and Majid, N A (2008). Factors affecting green fluorescence protein (GFP) gene expression in oil palm after microprojectile bombardment mediated transformation. J. Oil Palm Res., 20: 495-507.
Parveez, G K A; Rasid, O A; Masani, M Y A and Sambanthamurthi, R (2015). Biotechnology of oil palm: Strategies towards manipulation of lipid content and composition. Plant Cell Rep., 34: 533-543.
Parveez, G K A; Majid, N A; Zainal, A and Rasid, O (2007). Determination of minimal inhibitory concentration of selection agents for selecting transformed immature embryos of oil palm. Asia Pac. J. Mol. Biol. Biotechnol., 15(3): 133-146.
Parveez, G K A; Masri, M M; Zainal, A; Majid, N A; Yunus, A M M; Fadilah, H H; Rasid, O and Cheah, S C (2000). Transgenic oil palm: Production and projection. Biochem. Soc. T., 28(6): 969-972.
Parveez, G K A; Chowdhury, M K U and Saleh, N M (1996). Determination of minimal inhibitory concentration of selection agents for oil palm (Elaeis guineensis Jacq.) transformation. Asia Pac. J. Mol. Biol. Biotechnol., 4: 219-228.
Paz, M M; Shou, H X; Guo, Z B; Zhang, Z Y; Banerjee, A K and Wang, K (2004). Assessment of conditions affecting Agrobacterium-mediated soybean transformation using the cotyledonary node explant. Euphytica, 136(2): 167-179.
Schubert, D; Lechtenberg, B; Forsbach, A; Gils, M; Bahadur, S and Schmidt, R (2004). Silencing in Arabidopsis T-DNA transformants: The predominant role of a gene-specific RNA sensing mechanism versus position effects. Plant Cell, 16(10): 2561-2572.

587
GENETIC TRANSFORMATION OF OIL PALM-BASED ON SELECTION WITH HYGROMYCIN
ARTICLE IN
PRESS
ARTICLE IN
PRESS
Sujatha, M and Sailaja, M (2005). Stable genetic transformation of castor (Ricinus communis L.) via Agrobacterium tumefaciens-mediated gene transfer using embryo axes from mature seeds. Plant Cell Rep., 23: 803-810.
Suwanaketchanatit, C; Piluek, J; Peyachoknagu, S and Huehne, P S (2007). High efficiency of stable genetic transformation in Dendrobium via microprojectile bombardment. Biol. Plant., 51: 720-727.
Thompson, C J; Rao Movva, N; Tizard, R; Crameri, R; Davies, J E; Lauwereys, M and Botterman, J (1987). Characterisation of the herbicide resistance gene bar from Streptomyces hygroscopicus. EMBO J., 6: 2519-2523.
Van Eck, J (2018). The status of Setaria viridis transformation: Agrobacterium-mediated to floral dip. Front. Plant Sci., 9: 652 pp.
Van Eck, J; Swartwood, K; Pidgeon, K and Maxson-Stein, K (2017). Agrobacterium tumefaciens-mediated transformation of Setaria viridis. Genetics and Genomics of Setaria (Doust, A and Diao, X eds.). Cham, Springer. p. 343-356.
Wilmink, A and Dons, J J M (1993). Selective agents and marker genes for use in transformation of monocotyledonous plant. Plant Mol. Biol. Rep., 11: 165-185.
Zhang, P and Puonti-Kaerlas, J (2000). PIG-mediated cassava transformation using positive and negative selection. Plant Cell Rep., 19: 1041-1048.
Zulkifli, Y; Norziha, A; Naqiuddin, M H; Fadila, A M; Nor Azwani, A B; Suzana, M; Samsul, K R; Ong-Abdullah, M; Singh, R; Parveez, G K A and Kushairi, A (2018). Designing the oil palm of the future. J. Oil Palm Res., 29: 440-445.

588
ARTICLE IN
PRESS
ARTICLE IN
PRESS
ARTICLE IN
PRESS
ARTICLE IN
PRESS
Journal of Oil Palm Research Vol. 33 (4) December 2021 p. 588-606DOI: https://doi.org/10.21894/jopr.2021.0008
A COMPARATIVE STUDY OF BACTERIAL COMMUNITIES DETERMINED BY CULTURE-
DEPENDENT AND-INDEPENDENT APPROACHES IN OIL PALM PLANTED ON
TROPICAL PEATLAND
AYOB, ZAHIDAH1* and KUSAI, NOR AZIZAH1
ABSTRACTA combination of deoxyribonucleic acid (DNA)-based method and sequencing technologies have initiated a new era of soil microbial ecology to examine the patterns of bacterial communities in tropical peatland. The aims of the study are to verify and compare the bacterial communities in a 12-year-old oil palm plantation on peat of Sibu, Sarawak, Malaysia using culture-dependent and culture-independent approaches. The bacterial diversity identified from both approaches were amplified using 16S ribosomal deoxyribonucleic acid (rDNA) (341/907) primer, sequenced and analysed. This resulted in recovering a total of 227 bacterial isolates belonging to four major phyla accumulated from 22 genera. Meanwhile, about 216 denaturing gradient gel electrophoresis (DGGE) bands were excised, which corresponded to 195 different bacterial species from 20 different phyla by culture-independent method. Although both approaches detected a total of four predominant bacterial phyla (Proteobacteria, Firmicutes, Actinobacteria and Bacteroidetes), in general, different taxonomic sequences were targeted by each method. In comparison to culture-dependent, polymerase chain reaction (PCR)-DGGE method identified a higher rate of bacterial diversity and richness and also detected non-culturable bacteria. Thus, this suggests that culture-independent method was showed to be more efficient on the bacterial diversity identification that will lead towards unravelling the hidden bacterial species associated with agricultural practices carried out in Southeast Asia peatland.
Keywords: culture-dependent, oil palm plantation, polymerase chain reaction-denaturing gradient gel electrophoresis (PCR-DGGE), tropical peatland, 16S rDNA.
Received: 28 September 2020; Accepted: 3 January 2021; Published online: 26 February 2021.
INTRODUCTION
Prokaryotes are the most abundant group of soil microorganisms, which include bacteria and archaea and play fundamental ecological roles in the decomposition, biogeochemical cycling and maintenance of soil structure, soil quality, and fertility of tropical peatland (Nurulita et al.,
2016; Schneider et al., 2015). Previous studies have reported that many factors, including land-use change such as peat swamp forest conversion to oil palm plantation, plant species, and soil properties drive changes in the pH, temperature, water content, organic carbon content, nutrient content and soil texture, which influence the diversity of soil microbial communities (Kerfahi et al., 2014; Nurulita et al., 2016; Schneider et al., 2015; Wu et al., 2015). Furthermore, understanding the diversity of soil microbial communities is vital for knowing their function in ecosystems and the impact of oil palm management practices and plant communities
1 Malaysian Palm Oil Board, 6 Persiaran Institusi, Bandar Baru Bangi, 43000 Kajang, Selangor, Malaysia.
* Corresponding author e-mail: [email protected]

589
A COMPARATIVE STUDY OF BACTERIAL COMMUNITIES DETERMINED BY CULTURE-DEPENDENT AND-INDEPENDENT APPROACHES IN OIL PALM PLANTED ON TROPICAL PEATLAND
ARTICLE IN
PRESS
ARTICLE IN
PRESS
(Kerfahi et al., 2014). Thus, the identification of bacterial communities in deep peat cultivated with oil palm using culture-dependent and culture-independent approaches would postulate the impact of these communities on environmental changes in the tropical peatland.
The 16S ribosomal deoxyribonucleic acid (16S rDNA) gene is used as a universal molecular marker in microbial diversity studies because it has highly conserved regions that display considerable sequence variations, even within closely related taxa (Singh et al., 2011). The diversity of bacterial communities from peat ecosystems can be determined using various approaches, most commonly culture-dependent methods such as spread-plate (Kusai and Ayob, 2020; Roslan et al., 2015) and culture-independent methods, namely denaturing gradient gel electrophoresis (DGGE) (Arai et al., 2014; Jackson et al., 2009; Maidin et al., 2016; Nurulita et al., 2016), terminal restriction fragment length polymorphism (T-RFLP) (Situmorang et al., 2016), 454-pyrosequencing (Kanokratana et al., 2011; Liu et al., 2020), and next-generation sequencing (Tripathi et al., 2016; Too et al., 2018). Among these approaches, DGGE is one of the most well-established and is used to explain microbial diversity studies by comparing the composition, richness and structure of the microbial communities in soil, other environments (Ellis et al., 2003; Maidin et al., 2016; Nagendran et al., 2014; Nurulita et al., 2016; Piterina and Pembroke, 2013; Singh et al., 2012; Teo and Wong, 2014) and food samples (Chen et al., 2008; Jianzhong et al., 2009; Kesmen and Kacmaz, 2011; Miguel et al., 2010). This novel method was introduced into microbial ecology in 1993 by Muyzer et al.
Traditionally, culture-based methods provide limited information on microbial communities because the majority of bacteria are difficult to culture in a laboratory since they require specific growth media and, as a result, a large proportion of microbial communities remain unexplored. Previous studies have reported that culture-dependent methods present copiotrophs and high guanine-cytosine (GC) gram-positive bacteria because these bacterial groups are capable of growing on selective media (Edenborn and Sexstone, 2007; Smit et al., 2001), whereas culture-independent methods may detect bacteria that are difficult to culture, such as those from the phyla Acidobacteria and Verrucomicrobia (Edenborn and Sexstone, 2007; Lipson and Schmidt, 2004). Advancements in culture-independent methods have facilitated microbial diversity studies by comparing the composition and richness of the bacterial communities in soil (Qaisrani et al., 2019). In addition, culture-independent methods such as DGGE has the capacity to process multiple samples rapidly by analysing bands that migrate separately
on DGGE gels, and enables the detection of diverse members of soil microbial organisms, including unculturable microbes that are unable to proliferate in culture media (Chaudhary et al., 2019; Green et al., 2010; Watanabe et al., 2004). Nevertheless, the culture-dependent method is still essential for isolating and defining the taxonomic and metabolites of pure strains, and also understanding how their functions influence bacterial diversity patterns in tropical peatland (Chaudhary et al., 2019; González-Rocha et al., 2017).
Very few studies have reported on the diversity of bacterial communities in Southeast Asia peatland. Previously, analysis of the bacterial community composition of tropical peatland was based separately on culturable or culture-independent methods and compared different ecosystems (Dhandapani et al., 2019; Kusai and Ayob, 2020; Liu et al., 2020; Maidin et al., 2016; Nurulita et al., 2016; Too et al., 2018; Tripathi et al., 2016). No data is available and this study intends to highlight the comparison between the bacterial community composition of culture-dependent and culture-independent approaches of bacterial communities from a 12-year-old oil palm plantation on tropical peatland. Therefore, in this article, we investigate the application of these approaches to verify and compare bacterial communities in isolation on growth media, followed by 16S rRNA-based identification of isolates, whereas the culture-independent method involved extracting DNA directly from the soil for polymerase chain reaction (PCR) amplification of the 16S rRNA gene followed by DGGE analysis and sequencing.
MATERIALS AND METHODS
Peat Sampling
Peat was sampled in an oil palm (Elaeis guineensis Jacq.) plantation located in the vicinity of Sibu, Sarawak, Malaysia. Muriate of potash (MOP) (0.75 kg palm–1), urea [CO(NH2)2] (0.25 kg palm–1) and rock phosphate (RP) (0.2 kg palm–1) have been supplemented to the 12-year-old oil palms. The studied site was classified as undecomposed sapric organic materials based on Malaysian Unified Classification of Organic Soils (MUCOS) by Paramananthan (2016). This type of soil consists of sapric material of 1/3 fibre content and no wood up to 100 cm depth (Veloo et al., 2015). The average annual rainfall over the area was estimated at 2624.38 mm yr–1 during year 2013. Sampling was carried out during dry season with less than 100 mm precipitation on August 2013. Peat samples were collected at 10 sampling points (N1-N10) with depth between 0-30 cm, using peat auger. The sampling points were at least 10 m apart from each other with

590
JOURNAL OF OIL PALM RESEARCH 33 (4) DECEMBER 2021
ARTICLE IN
PRESS
ARTICLE IN
PRESS
ARTICLE IN
PRESS
ARTICLE IN
PRESS
the central point at 2°09’ 47.065” N, 111°55’ 22.387” E (Kusai et al., 2018). Peat samples were chilled in the ice box during transportation from the field to the laboratory and stored at 4°C until further analysis. The inorganic elements including macronutrients, micronutrient and heavy metal contents were analysed using Perkin Elmer ELAN DRC-e ICP-Mass Spectrometry (Perkin Elmer Sdn. Bhd., Petaling Jaya, Selangor, Malaysia). The moisture content and pH of peat samples were also analysed (Ayob et al., 2018).
Culture-Dependent Method
Isolation of bacteria. Approximately, 1 g of peat was suspended in 9 ml of sterile deionised water and homogenised by orbital shaker at 150 rpm for 2 hr. An aliquot of 100 μl of 10–8 and 10–9 dilutions of each sample was spread on seven culture media: Nutrient agar (NA) (Davis et al., 2005), soil enrichment medium (EM) (Germida and de Freitas, 2007), actinomycetes medium (ACT) (Porter et al., 1960), anaerobic medium (AN) (Holland, 1987), nitrogen-deficient medium (N) (Rennie, 1981), pikovskaya medium (P) (Vazquez et al., 2000) and aleksandrov medium (K) (Hu et al., 2006). Triplicates of spread plates were incubated at 30°C for three days. The total number of colony forming units (CFU) plates were calculated and expressed as the concentration of CFU per 1 g of peat sample. Different colonies were selected based on colony morphology (shape, structure, colour, pattern, size) (Nath et al., 2018) and sub-cultured on the respective media for seven days to obtain pure cultures. After that, the selected colonies from pure cultures were picked and dipped into 100 μl of sterile deionised water, heat-shocked for 45 s, and centrifuged for 2 min at 10 000 × g (Dashti et al., 2009). The bacterial supernatant was kept at −20°C prior to PCR amplification. Then, the pure cultures were maintained in glycerol stock at −80°C.
DNA amplification. Pure isolated DNA was subjected to amplification of the target V3 to V5 regions located in the 16S rRNA gene by PCR using the barcoding primers; 341-F 5’-CCTACGGGAGGCAGCAG-3’ and 907-R 5’-CCCCGTCAATTCATTTGAGTTT-3’ (Muyzer et al., 1993; 1995). The PCR reaction mixture using GoTaq® DNA polymerase (Promega Corporation, Washington, USA) with the final 25 μl volume containing 1.25 units of PCR buffer, 2.5 mM magnesium chloride (MgCl2), 0.3% bovine serum albumin (BSA), 0.5 mM of each deoxynucleotide triphosphate (dNTP), 0.4 μM of each primer, 1.25 units of Taq polymerase, 5 μl of bacterial supernatant was used as a template for PCR amplification. The PCR amplification was performed with an Eppendorf Mastercycler® nexus (Medigene Sdn.
Bhd., Puchong, Selangor, Malaysia). The following thermal cycling scheme was used for amplification of 16S rDNA: initial hot start incubation at 94°C for 2 min, 35 cycles of denaturation at 94°C for 30 s, annealing for 30 s at 52°C, extension at 72°C for 30 s, followed by a final extension period at 72°C for 2 min. Deionised water was used as template for negative control. The PCR products were analysed by electrophoresis in 1% (w/v) agarose gels. Gels were stained with 0.1% (v/v) SYBR® Safe DNA gel stain and visualised with an Alpha Imager HP system (Alpha Innotech, San Leandro, CA, USA).
Culture-Independent Method
DNA extraction. Peat DNA was extracted using GeneMATRIX Soil DNA Purification Kit (EURx Ltd, Gdansk, Poland) according to the manufacturer’s instructions. The concentration and quality of the extracted DNA was determined using a NanoPhotometer® P360 (Implen GmbH, Schatzbogen, Germany). The DNA was stored at –20°C prior to PCR amplification.
PCR-DGGE analysis. The 16S rRNA gene was amplified by PCR with the target V3 to V5 regions for DGGE analysis using the 341-F 5’-CGCCCGCCGCGCGCGGCGGGCGGGGCGG GGGCACGGGGGGCCTACGGGAGGCAGCAG-3’ primer which added 40-bp GC-rich sequence (GC-clamp) in the 5’ primer to obtain a stable melting point of the DNA fragments in the DGGE and 907-R 5’-CCCCGTCAATTCATTTGAGTTT-3’ (Muyzer et al., 1993; 1995). A 25 μl PCR reaction mixture contained 250 ng of extracted peat DNA as a template and the PCR amplification conditions were performed following the same protocol as described earlier in the ‘DNA amplification’ subsection.
DGGE was performed using the Dcode™ universal mutation detection system (Bio-Rad, USA) according to the manufacturer’s instructions. A 20 μl PCR products mixed with 6 μl green loading dye (Promega, Madison, Wisconsin, USA) were loaded onto polyacrylamide gels in 1 × TAE (Tris-Acetate-EDTA) running buffer. Polyacrylamide gels were made with a denaturing gradient where 100% of denaturant contained 7 M urea (Sigma-Aldrich, St. Louis, Missouri, USA) and 40% (v/v) deionised formamide (Amresco®, Solon, Ohio, USA). The polyacrylamide gels (37.5:1, acrylamide: Bis-acrylamide) in a gradient used was 40%-70% and running for 17 hr at 60°C and 70 V (Maidin et al., 2016). After electrophoresis, the gels were stained for 1 hr in 1 × TAE with 0.1% (v/v) SYBR® Safe DNA gel stain and visualised with ultraviolet (UV) transilluminator using under Alpha Imager HP system (Alpha Innotech, San Leandro, CA, USA). DGGE bands with high intensity and dominant were excised, resuspended in 50 μl TE buffer and

591
A COMPARATIVE STUDY OF BACTERIAL COMMUNITIES DETERMINED BY CULTURE-DEPENDENT AND-INDEPENDENT APPROACHES IN OIL PALM PLANTED ON TROPICAL PEATLAND
ARTICLE IN
PRESS
ARTICLE IN
PRESS
incubated overnight at 4°C. Eluted DNA was used as a template for re-amplification of 16S rDNA gene using universal primers, 341F (with no GC-clamp) and 907R (Muyzer et al., 1993) according to protocol as described in the ‘DNA amplification’ subsection.
DGGE banding patterns analysis. DGGE banding patterns were analysed using CLIQS 1D Pro software (TotalLab Ltd, Newcastle, United Kingdom). Dendrogram of bacterial diversity was constructed using the unweighted pair group with arithmetic mean (UPGMA) and the similarities among DGGE bands were measured using Dice coefficient index. The Shannon-Wiener index (Hʹ) was calculated to determine species diversity in a community (Shannon and Weaver, 1949) species richness was used to measure of the relative abundance of different bacterial species (Hill, 1973).
DNA purification and sequencing. The positive gel- 550 bp band size of the PCR products from bacterial supernatant and eluted DNA from excised DGGE gels were purified using the EasyPure® Quick Gel Extraction Kit (TransGen Biotech, Beijing, China) and sent for Sanger sequencing using services provided by First BASE Laboratories Sdn. Bhd. (Seri Kembangan, Selangor, Malaysia). The 16S rDNA gene sequences obtained were analysed by using basic local alignment search tool (BLAST) (www.ncbi.nlm.nih.gov/Blast) to identify the nearest relative of bacterial sequenced in the National Centre for Biotechnology Information (NCBI) GenBank database.
Statistical Analysis
The analyses of physico-chemical characteristics of the peat samples and total counts were conducted in triplicate and the data obtained were analysed using SPSS for Windows software (SPSS 16.0 for Windows Evaluation Version software, SPSS Inc., USA). The normality of the data was analysed using the Shapiro-Wilk test. The data were analysed using One-way analysis of variance (ANOVA) with post-hoc multiple comparisons, i.e., Duncan test for normal data and Kruskal-Wallis test for non-normal data. Differences were considered to be significant if the probability p<0.05 (Pallant, 2007).
RESULTS AND DISCUSSION
Physico-chemical Peat Characteristics
The physico-chemical properties and element concentrations of oil palm-cultivated peatland are shown in Tables 1 and 2. The soil moisture proportion was high and this was in agreement with peat swamp conditions under water-logged conditions
and with oxygen deficiency (Page and Baird, 2016; Tripathi et al., 2016). Overall, the peat pH was highly acidic; it was suggested that the cause of this lower pH value was fertiliser leaching during a high monthly rainfall on the site studied (Nurulita et al., 2016). In addition, a low pH would affect root development and availability of nutrients such as macronutrients (N and K) and micronutrients (Cu, Zn and B) on the oil palm plantation (Parish et al., 2012). Research by Fierer and Jackson (2006) reported that soil pH was a better predictor of both bacterial richness and diversity, with the lowest levels in acidic soils. This is in contrast to a previous study by Tripathi et al. (2016), which stated that Acidobacteria was higher in peat swamp forest and negatively correlated with the soil low pH. The average peat temperature was low (24°C), possibly due to the canopy cover from vegetation fronds, which hinder the sun from heating the soil surface. This was contradictory to previous studies where the peat temperature exceeded 28°C (Posa et al., 2011). In fact, oil palm can adapt to acidic and humid conditions ranging from 24°C-30°C in tropical ecosystems with appropriate management practices (Sheil et al., 2009). In this study, high carbon (C) and low nitrogen (N) in the oil palm plantation indicated low decomposition and mineralisation rates, which was consistent with Ayob et al. (2018) and Kusai et al. (2018), who found low decomposition rates in oil palm plantations but at different study sites in Sarawak, Malaysia. Despite nutrient deficiency in peat soil, large quantities of nutrients are required by oil palm to support their vegetative growth and fruit production. Peatland is nutrient-poor and has a high water-holding capacity; therefore, oil palm has to maintain or increase their nutrient storage capacity in order to provide nutrients for palm growth (Bah and Rahman, 2004). Among the elements in peat, iron (Fe) content was the highest compared to others and this was in accordance with the findings of Schneider et al. (2015). Meanwhile, calcium (Ca) was the second-highest element; this might be due to supplementation of urea in the oil palm plantation, a finding which is supported by Bah and Rahman (2004). Moreover, the deficiency of potassium (K), copper (Cu), zinc (Zn), and boron (B) in peatland cultivated with oil palm might be influenced by peat type and water availability (Melling, 2016). This was also supported by Fierer and Jackson (2006), who mentioned that vegetation type, carbon availability, nutrient availability and soil moisture may contribute to variations in the microbial community composition across ecosystems. Therefore, proper management practices in oil palm plantations, such as fertiliser application during the rainy season, are important for optimising fertiliser efficiency for oil palm growth on peat (Parish et al., 2012).

592
JOURNAL OF OIL PALM RESEARCH 33 (4) DECEMBER 2021
ARTICLE IN
PRESS
ARTICLE IN
PRESS
ARTICLE IN
PRESS
ARTICLE IN
PRESS
TABLE 1. PHYSICO-CHEMICAL PEAT CHARACTERISTICS IN THE 12-YEAR-OLD OIL PALM PLANTATION
Ecosystem Moisture proportion (%)
pH Temperature Total C (%) Total N (%) C/N quotient
12 YOP 72 ± 0.7 3.9 ± 0.05 24.1 ± 0.2 59 ± 0.3 2.0 ± 0.02 29 ± 0.2
Note: Data are presented as mean ± standard error of mean (SEM). YOP - years old palm; C - carbon; N - nitrogen.
TABLE 2. ELEMENT CONCENTRATIONS (mg kg–1) OF PEAT SOIL IN THE 12-YEAR-OLD OIL PALM PLANTATION
Element(mg kg–1)
Mg Fe B Ca P Cr Mn Ni Cu Zn Mo Cd Pb K
12 YOP 200 ± 9 1 000 ± 100 5 ± 0.3 800 ± 40 300 ± 20 4 ± 0.2 8 ± 0.6 2 ± 0.1 20 ± 3 20 ± 1 0.1 0.5 1 400 ± 30
Note: Data are presented as mean ± standard error of mean (SEM). ‘0’ digits in italics are not significant but indicate the position of decimal point. YOP - years old palm; Mg - magnesium; Fe - iron; B - boron; Ca - calcium; P - phosphorus; Cr - chromium; Mn - manganese; Ni - nickel; Cu - copper; Zn - zinc; Mo - molybdenum; Cd - cadmium; Pb - lead; K - potassium.
Enumeration of the Bacterial Abundance
The presence of microorganisms in the environmental samples, mainly in soil, could be estimated using the plate count method, an efficient method which approximates the number of cells present in the sample (Sutton, 2011). One gram of soil contains approximately 105-108 bacteria (Abedon, 2011). The data in Figure 1 shows that a higher abundance of bacteria was detected in the AN with (4.6 ± 1.2) × 109 CFU g–1 and a lower prevalence was accumulated in the ACT with (3.3 ± 1.05) × 107 CFU g–1. The bacterial counts in AN were significantly different (P<0.05) among other media and this was attributed to the dominant copiotrophic bacteria, whose distinctive feature is their ability to grow in high nutrient concentrations (Fuhrman et al., 2015; Olsen and Bakken, 1987). In
the present study, a lower abundance of bacteria was detected in the ACT medium probably due to the slow growth rate of actinomycetes and this may mean specific media, incubation time and temperature and growth conditions are required (El Karkouri et al., 2019). This concurs with Ghazali et al. (2016) who reported that a higher number of actinomycetes isolates was found in a combination of culture media containing M1 medium, peat agar and oatmeal agar, and also in pre-heat treatment of peat soils. Meanwhile, the Pikovskaya (P) medium showed a high abundance of bacterial counts among nitrogen, phosphorus and potassium (NPK) media. This suggests that phosphate-solubilising bacteria was abundant in the peat soil and these bacteria solubilise phosphate in the form of fertiliser, making it available for crop growth (Ruangsanka, 2014).
Note: ACT - actinomycetes medium; NA - nutrient agar; EM - enrichment medium; AN - anaerobic medium; N - nitrogen-deficient medium; P - pikovskaya medium; K - aleksandrov medium.
Figure 1. Total bacterial count of colony forming units (CFU) in seven culture media.
Tota
l bac
teria
cou
nt (c
fu g
–1) x
1010
Culture medium
ACT
6
5
4
3
2
1
0NA EM AN N P K

593
A COMPARATIVE STUDY OF BACTERIAL COMMUNITIES DETERMINED BY CULTURE-DEPENDENT AND-INDEPENDENT APPROACHES IN OIL PALM PLANTED ON TROPICAL PEATLAND
ARTICLE IN
PRESS
ARTICLE IN
PRESS
Comparison of Bacterial Diversity Identified by Culture-Dependent and Culture-Independent Approaches
Soil prokaryotic communities are highly heterogeneous and important to the functioning of the terrestrial ecosystem, mainly in tropical peat swamp ecosystems (Tripathi et al., 2016). The present study on bacterial diversity using both culture-dependent and culture-independent approaches frequently observed bacterial phyla in peat soil ecosystems, including Acidobacteria, Actinobacteria, Bacteroidetes, Firmicutes and Proteobacteria. The combination of classical bacterial enumeration in various culture media and molecular approaches led to the identification of 227 isolated bacterial strains, resulting in a total of 55 different species (Table 3). The most predominant class among the bacterial isolates was Betaproteobacteria (104%, 45%), followed by Bacilli (90%, 40%). The remaining prevalent classes were Gammaproteobacteria (13%, 5%), Flavobacteria (8%, 4%), Actinobacteria (6%, 3%), and Alphaproteobacteria (6%, 3%) (Figure 2). Nonetheless, the PCR-DGGE approach with a direct amplification of the 16S rDNA gene detected 216 bands and 195 different bacterial species in the studied site (Table 4). The PCR-DGGE analysis permitted the identification of 20 phyla, 30 classes, and 95 genera of bacteria. Unclassified bacteria (73%) was the most dominant group in the studied site, followed by the predominant phyla Proteobacteria (11%), Acidobacteria (9%), Firmicutes (4%), Bacteroidetes (1%), Actinobacteria (1%) and Synergistetes (1%), as shown in Figure 3. The Shannon-Wiener biodiversity index for each approach was significantly different (P<0.05) with culture-independent recording more diversity at 7.83 ± 0.11 (Table 4) while culture-dependent saw less diversity at 5.31 ± 0.07 (Table 3).
A dendrogram constructed using CLIQS 1D Pro software was used to examine the similarity of the bacterial communities based on the presence or absence of bands with the Dice coefficient index (Figure 4). An unweighted pair group method with arithmetic mean (UPGMA) analysis revealed four clusters. N9 and N2 had the highest similarity (83%), where both were clustered together. N4 and N3 (82%) and N6 and N1 (80%) were clustered together. N5 and N8 were closely clustered together between N3 and N4, and N9 and N2, respectively. The remaining samples from N10 and N7 were relatively different from others with less than 60% similarity. The bacterial profiles in the oil palm plantation seem to be related in all samples and this is in agreement with previous research by Teo and Wong (2014), who suggested that samples sequence with a higher similarity and which are clustered together might have a relatively higher chance of sharing the same bacterial taxa.
The overall findings showed a discrepancy between the bacterial diversity detected using the culture-dependent and culture-independent approaches. A large proportion of the bacterial groups of unclassified bacteria was detected using the culture-independent approach. Previous studies have suggested that they are novel or unique microorganisms in tropical peat soils that have not been well characterised microbiologically (Bottos et al., 2014; Stewart, 2012; Vincent, 2000). According to Miguel et al. (2010), this could happen due to multiple banding patterns attributed to sequence heterogeneity between multiple copies of 16S rDNA strains. In addition, the phyla Acidobacteria was detected in peat soil using the culture-independent method but not with the culture-dependent method (Figure 3). Acidobacteria was dominant in Boreal and Sphagnum peat (Pankratov et al., 2008; Tsitko et al., 2014). Our finding was consistent with previous studies which reported that Acidobacteria was underrepresented in isolation cultures and indicates richness in the acidic conditions (Fierer et al., 2007; Shade et al., 2012; Sun et al., 2014). There were also similar patterns for phyla Candidatus Cloacimonetes, Chlorobi, Chloroflexi, Crenarchaeota, Cyanobacteria, Deinococcus-Thermus, Dictyoglomi, Euryarchaeota, Fibrobacteres, Fusibacteria, Plantomycetes, Spirochaetes, Synergistetes, Tenericutes and Thermotogae, which could not be assessed by the culture-dependent method in the present study (Table 4). Meanwhile, the isolation of soil bacteria represented four phyla (Actinobacteria, Bacteroidetes, Firmicutes and Proteobacteria) and three Proteobacteria classes consisting of Alpha-, Beta- and Gammaproteobacteria (Figure 2), findings similar to the studies by Fierer et al. (2007); Kusai and Ayob (2020); Too et al. (2018).
The results suggested that the soil bacterial phyla associated with copiotrophs were favourable for the culture-dependent method. These findings were supported by previous studies which reported that copiotrophic bacteria had higher growth rates, greater variability in population size and lower substrates affinities and were abundant in nutrient-rich soils compared to oligotrophic bacteria (Fierer et al., 2007; Shade et al., 2012; Tripathi et al., 2016). For instance, C mineralisation rate was a strong predictor of abundance in three groups in the ecosystem which were Acidobacteria, Proteobacteria and Bacteroidetes (Fierer et al., 2007). Previous studies also reported that bacteria belonging to the phylum Acidobacteria were present under oligotrophic conditions with very low resource availability (low C mineralisation rates) and were frequently associated with peat soils that are low labile C (Shade et al., 2012; Sun et al., 2014; Troxler et al., 2012). The findings were in accordance with those reported by Ding et al. (2013), which revealed a

594
JOURNAL OF OIL PALM RESEARCH 33 (4) DECEMBER 2021
ARTICLE IN
PRESS
ARTICLE IN
PRESS
ARTICLE IN
PRESS
ARTICLE IN
PRESS
TABLE 3. LIST OF BACTERIAL ISOLATES IDENTIFIED FROM 12-YEAR-OLD OIL PALM PLANTATION AND AMPLIFIED USING CULTURE-DEPENDENT APPROACH, IN EACH CASE SHOWING THE SPECIES AND NCBI ACCESSION NUMBER OF THE CLOSEST MATCH IN THE GENBANK DATABASE
Phylum class Species Accession no. No. of isolates (% of isolates)
Actinobacteria Micrococcus sp. KP301109 1 (0.4)Mycobacterium abscessus KP736045 1 (0.4)Sinomonas atrocyanea LN890256 2 (0.9)Sinomonas flava KR262446 2 (0.9)
Bacteroidetes Elizabethkingia miricola EU375848 6 (2.6)Flavobacteriaceae bacterium KF619446 2 (0.9)
FirmicutesBacilli Bacillus methylotrophicus KT228265 2 (0.9)
Bacillus mycoides KY029076 2 (0.9)Bacillus pumilus KX453891 3 (1.3)Bacillus safensis HG424435 1 (0.4)Bacillus sp. JX155391 1 (0.4)Bacillus subtilis KX453903 23 (10.0)Bacillus tequilensis KF157960 1 (0.4)Bacillus thuringiensis KT783488 4 (1.7)Bacillus velezensis KU752876 4 (1.7)Exiguobacterium acetylicum KX458037 1 (0.4)Staphylococcus cohnii KU550180 1 (0.4)Staphylococcus devriesei KT907081 1 (0.4)Staphylococcus haemolyticus KM603641 2 (0.9)Staphylococcus hominis KP780178 1 (0.4)Staphylococcus sp. KP003995 1 (0.4)
ProteobacteriaAlphaproteobacteria Ochrobactrum ciceri KX185944 3 (1.3)
Ochrobactrum intermedium KX832724 2 (0.9)Rhodospirillum rubrum JQ045832 1 (0.4)
Betaproteobacteria Achromobacter denitrificans KU180430 2 (0.9)Achromobacter insolitus KJ620851 1 (0.4)Achromobacter sp. KU534306 1 (0.4)Achromobacter xylosoxidans KT429636 21 (9.1)Burkholderia cenocepacia HM042678 2 (0.9)Burkholderia diazotrophica KT390896 1 (0.4)Burkholderia gladioli JF431410 1 (0.4)Burkholderia lata KX397363 12 (5.2)Burkholderia seminalis KX066828 1 (0.4)Massilia sp. JQ660175 2 (0.9)Ralstonia insidiosa KT720194 41 (17.8)Ralstonia solanacearum KX146476 14 (6.1)Ralstonia sp. KF264453 4 (1.7)Thermothrix thiopara U61284 1 (0.4)
Gammaproteobacteria Acinetobacter calcoaceticus KX781153 3 (1.3)Acinetobacter radioresistens HE588005 1 (0.4)Dyella sp. JQ864383 1 (0.4)Enterobacter hormaechei KM878729 1 (0.4)Erwinia sp. KM021124 1 (0.4)Pantoea calida LC192167 3 (1.3)Pseudomonas stutzeri KU921576 1 (0.4)Rahnella aquatilis AM268331 1 (0.4)Stenotrophomonas maltophilia AF390080 1 (0.4)Total isolates 227 (100)Species richness 51Shannon-wiener Index (Hʹ) 5.31 ± 0.07
Note: NCBI - National Centre for Biotechnology Information.

595
A COMPARATIVE STUDY OF BACTERIAL COMMUNITIES DETERMINED BY CULTURE-DEPENDENT AND-INDEPENDENT APPROACHES IN OIL PALM PLANTED ON TROPICAL PEATLAND
ARTICLE IN
PRESS
ARTICLE IN
PRESS
Figure 4. Dendrogram constructed by Dice coefficient index and clustering using unweighted pair group method with arithmetic mean (UPGMA) of bacterial communities based on 16S ribosomal deoxyribonucleic acid (rDNA) denaturing gradient gel electrophoresis (DGGE) profiles of 12-year-old oil palm plantation using CLIQS 1D Pro software.
N7
N6
N1
N10
N5
N4
N3
N8
N9
N2
0.7 0.6 0.5 0.4 0.3 0.2 0.1 0.0
82
82
87
100
70
97
100
100
85
Figure 3. Composition of bacterial phyla in the 12-year-old oil palm plantation identified by culture-independent approach.
73%
3.2%
4%
3.5%11%
1%1%1%
4%
9%
0.3%
Bacteroidetes Synergistetes
Unclassified bacteria
Delta
Firmicutes
Proteobacteria
Alpha
Acidobacteria
Actinobacteria
Beta
Gamma
Figure 2. Composition of bacterial phyla in the 12-year-old oil palm plantation identified by culture-dependent approach.
45%
3%
5%
40%
4%3%
Proteobacteria53%
Bacteroidetes AlphaFirmicutesActinobacteria BetaGamma

596
JOURNAL OF OIL PALM RESEARCH 33 (4) DECEMBER 2021
ARTICLE IN
PRESS
ARTICLE IN
PRESS
ARTICLE IN
PRESS
ARTICLE IN
PRESS
TABLE 4. LIST OF BACTERIAL SPECIES IDENTIFIED FROM 12-YEAR- OLD OIL PALM PLANTATION AND AMPLIFIED USING PCR-DGGE METHOD, IN EACH CASE SHOWING THE SPECIES AND NCBI ACCESSION NUMBER OF THE CLOSEST MATCH IN THE GENBANK DATABASE
Phylum class Species Accession no. No. of species (% of sp.)
AcidobacteriaAcidobacteriia U. Acidobacterium sp. DQ991279 2 (0.06)
U. Candidatus Koribacter sp. KF225992 4 (0.13)U. Edaphobacter sp. KR853545 2 (0.6)Granulicella tundricola CP002480 1 (0.03)Occallatibacter savannae HQ995661 1 (0.03)U. Acidobacteriaceae bacterium FJ475538 5 (0.16)U. Acidobacteriales bacterium AY395324 5 (0.16)
Solibacteres U. Solibacter sp. JQ177609 1 (0.03)Acidobacteria bacterium KC485312 1 (0.03)U. Acidobacteria bacterium FJ568777 252 (8.19)
ActinobacteriaActinobacteria Arthrobacter sp. JX627624 1 (0.03)
Mycobacterium tuberculosis CP010968 1 (0.03)Mycobacterium vanbaalenii CP000511 1 (0.03)Mycobacterium sp. AJ783967 1 (0.03)Rhodococcus erythropolis CP003761 1 (0.03)Rhodococcus sp. CP012749 1 (0.03)U. Sporichthya sp. GU000261 1 (0.03)Streptomyces albulus CP006871 1 (0.03)Streptomyces sp. CP013142 1 (0.03)U. Streptomyces sp. GU000289 1 (0.03)Thermobifida fusca CP000088 1 (0.03)U. actinomycete JQ177968 3 (0.09)U. actinobacterium JF947533 12 (0.4)
BacteroidetesBacteroidia Bacteroides ovatus CP012938 2 (0.06)Cytophagia Cyclobacterium amurskyense CP012040 1 (0.03)Flavobacteriia Chryseobacterium sp. CP015199 1 (0.03)
Maribacter sp. CP002157 1 (0.03)Candidatus Cloacimonetes
Candidatus Cloacamonas acidaminovorans CU466930 1 (0.03)Chlorobi
U. Chlorobi bacterium FR733768 1 (0.03)ChloroflexiArdenticatenia Ardenticatena sp. LN890655 1 (0.03)ChloroflexiChloroflexia U. Chloroflexales bacterium AY694645 1 (0.03)Crenarchaeota
Ignisphaera aggregans CP002098 1 (0.03)Cyanobacteria
Anabaena sp. CP011456 1 (0.03)Arthrospira sp. FO818640 1 (0.03)Calothrix sp. CP011382 1 (0.03)Cyanothece sp. CP002198 1 (0.03)Rivularia sp. CP003549 1 (0.03)
Deinococcus-ThermusThermoprotei U. Thermus/ Deinococcus group bacterium KC602722 1 (0.03)DictyoglomiDictyoglomia Dictyoglomus turgidum CP001251 1 (0.03)

597
A COMPARATIVE STUDY OF BACTERIAL COMMUNITIES DETERMINED BY CULTURE-DEPENDENT AND-INDEPENDENT APPROACHES IN OIL PALM PLANTED ON TROPICAL PEATLAND
ARTICLE IN
PRESS
ARTICLE IN
PRESS
TABLE 4. LIST OF BACTERIAL SPECIES IDENTIFIED FROM 12-YEAR- OLD OIL PALM PLANTATION AND AMPLIFIED USING PCR-DGGE METHOD, IN EACH CASE SHOWING THE SPECIES AND NCBI ACCESSION NUMBER OF THE CLOSEST MATCH IN THE GENBANK DATABASE (continued)
Phylum class Species Accession no. No. of species (% of sp.)
EuryarchaeotaHalobacteria U. Halobacteriales archaeon LN796011 1 (0.03)Methanobacteria Methanosphaera stadtmanae CP000102 1 (0.03)
Methanobrevibacter olleyae CP014265 1 (0.03)Thermococci Thermococcus nautili CP007264 1 (0.03)FibrobacteresChitinivibrionia U. Chitinivibrionia bacterium AB255984 2 (0.06)
U. Fibrobacteres bacterium KX368223 3 (0.09)FirmicutesBacilli Bacillus megaterium CP010586 1 (0.03)
Bacillus cereus biovar anthracis CP001746 1 (0.03)Bacillus sp. AB012934 1 (0.03)Bacillus cereus LN559100 1 (0.03)Bacillus pumilus KC831584 1 (0.03)Lactobacillus reuteri CP000705 8 (0.26)U. Psychrobacillus sp. LC050330 1 (0.03)Sporosarcina globispora JX627616 1 (0.03)Sporosarcina psychrophila CP014616 1 (0.03)Staphylococcus simulans CP014016 1 (0.03)Staphylococcus warneri HG799952 1 (0.03)Staphylococcus agnetis CP009623 7 (0.23)Staphylococcus saprophyticus subsp.
saprophyticusHG799960 1 (0.03)
Streptococcus intermedius CP012718 1 (0.03)Streptococcus suis CP002465 1 (0.03)
Clostridia Clostridioides difficile AM180355 15 (0.5)Clostridium saccharobutylicum CP006721 1 (0.03)Clostridium beijerinckii CP006777 3 (0.09)Clostridium botulinum CP006908 4 (0.13)Clostridium pasteurianum CP009268 2 (0.06)Clostridium perfringens CP010993 1 (0.03)Desulfotomaculum kuznetsovii CP002770 1 (0.03)Halobacteroides halobius CP003359 1 (0.03)Ruminiclostridium sp. CP015400 1 (0.03)Thermoanaerobacter wiegelii CP002991 1 (0.03)Thermoanaerobacterium saccharolyticum CP003184 1 (0.03)Clostridium propionicum CP014223 1 (0.03)
Tissierellia Anaerococcus prevotii CP001708 1 (0.03)U. Firmicutes bacterium EU043585 56 (1.82)
FusobacteriaFusobacteriia Fusobacterium hwasookii CP013331 3 (0.09)
Leptotrichia sp. CP014231 1 (0.03)PlanctomycetesPlanctomycetia U. Planctomycetales bacterium JQ919020 8 (0.26)ProteobacteriaAlphaproteobacteria Bartonella bacilliformis CP000524 2 (0.06)
Beijerinckia doebereinerae NR116304 1 (0.03)Beijerinckia sp. AB119205 1 (0.03)Bradyrhizobium canariense KT880606 1 (0.03)Bradyrhizobium sp. KP768784 2 (0.06)Jhaorihella thermophila NR122093 1 (0.03)Methylobacterium aminovorans HF570079 1 (0.03)Methylobacterium sp. DQ341423 1 (0.03)

598
JOURNAL OF OIL PALM RESEARCH 33 (4) DECEMBER 2021
ARTICLE IN
PRESS
ARTICLE IN
PRESS
ARTICLE IN
PRESS
ARTICLE IN
PRESS
TABLE 4. LIST OF BACTERIAL SPECIES IDENTIFIED FROM 12-YEAR- OLD OIL PALM PLANTATION AND AMPLIFIED USING PCR-DGGE METHOD, IN EACH CASE SHOWING THE SPECIES AND NCBI ACCESSION NUMBER OF THE CLOSEST MATCH IN THE GENBANK DATABASE (continued)
Phylum class Species Accession no. No. of species (% of sp.)
Methylocapsa acidiphila FN870340 1 (0.03)Methylocapsa palsarum KP715289 1 (0.03)U. Methylocapsa sp. KF581259 1 (0.03)Methylocystis sp. FM252035 1 (0.03)Methylovirgula ligni HG314007 2 (0.06)Ochrobactrum intermedium CP013068 1 (0.03)Pannonibacter phragmitetus LT625512 1 (0.03)U. Prosthecomicrobium sp. FJ712836 1 (0.03)U. Rhizobium sp. FM252035 1 (0.03)Rhizobium sp. KF261556 4 (0.13)U. Rhodoplanes sp. KP901801 1 (0.03)Rhodopseudomonas palustris CP000301 1 (0.03)Shinella granuli LN556390 6 (0.19)Shinella sp. KJ676718 11 (0.36)Shinella zoogloeoides KP979556 14 (0.45)U. Shinella sp. KF115201 3 (0.09)U. Sphingomonas sp. KC502959 1 (0.03)Rhizobiaceae bacterium KM187074 1 (0.03)U. Alpha proteobacterium LC017515 15 (0.49)U. Alphaproteobacteria bacterium CU926981 12 (0.39)U. Beijerinckiaceae bacterium KJ191883 1 (0.03)U. Hyphomicrobiaceae bacterium EF663087 1 (0.03)U. Ensifer sp. KF115604 1 (0.03)U. Methylocystaceae bacterium KX366564 2 (0.06)U. Rhizobiales bacterium JF814960 4 (0.13)U. type II methanotroph KU234423 7 (0.23)
Betaproteobacteria Alcaligenes faecalis KP717562 1 (0.03)U. Burkholderia sp. KP717562 8 (0.26)Burkholderia cepacia HQ220017 2 (0.06)Burkholderia contaminans KT719949 1 (0.03)Burkholderia mallei CP009588 3 (0.09)Burkholderia pseudomallei CP009271 9 (0.29)Burkholderia sp. JQ994005 10 (0.32)Burkholderia thailandensis CP004117 1 (0.03)Burkholderia vietnamiensis HQ220010 1 (0.03)Candidatus Glomeribacter gigasporarum AM889132 1 (0.03)Candidatus Zinderia insecticola CP002161 1 (0.03)U. Collimonas sp. JN590471 1 (0.03)Comamonas testosteroni CP001220 5 (0.16)Janthinobacterium sp. EU637885 1 (0.03)U. Janthinobacterium sp. FN813705 1 (0.03)U. Neisseria sp. EU629385 1 (0.03)U. Nitrosovibrio sp. AM773618 1 (0.03)Pandoraea pulmonicola CP010310 1 (0.03)Burkholderia caledonica JN869243 1 (0.03)Burkholderia fungorum GU182117 2 (0.06)Burkholderia tropica AB568321 1 (0.03)Ralstonia insidiosa LN890145 2 (0.06)Ralstonia solanacearum FP885895 4 (0.13)Ralstonia sp. KT949385 3 (0.09)U. Ralstonia sp. EU705192 27 (0.88)U. Burkholderiales bacterium CP015403 1 (0.03)U. beta proteobacterium HF564040 28 (0.91)

599
A COMPARATIVE STUDY OF BACTERIAL COMMUNITIES DETERMINED BY CULTURE-DEPENDENT AND-INDEPENDENT APPROACHES IN OIL PALM PLANTED ON TROPICAL PEATLAND
ARTICLE IN
PRESS
ARTICLE IN
PRESS
TABLE 4. LIST OF BACTERIAL SPECIES IDENTIFIED FROM 12-YEAR- OLD OIL PALM PLANTATION AND AMPLIFIED USING PCR-DGGE METHOD, IN EACH CASE SHOWING THE SPECIES AND NCBI ACCESSION NUMBER OF THE CLOSEST MATCH IN THE GENBANK DATABASE (continued)
Phylum class Species Accession no. No. of species (% of sp.)
U. Burkholderiaceae bacterium EF562131 1 (0.03)U. Gallionellaceae bacterium JQ177980 1 (0.03)U. Neisseriaceae bacterium FM211965 1 (0.03)U. Rhodocyclaceae bacterium HQ003476 1 (0.03)
Deltaproteobacteria U. Desulfuromonas sp. FN813680 1 (0.03)Bacteriovorax marinus FQ312005 1 (0.03)U. delta proteobacterium HE858114 2 (0.06)Ud. eubacterium Y12374 2 (0.06)
Epsilonproteobacteria Campylobacter concisus CP000792 1 (0.03)Campylobacter lari CP007775 1 (0.03)Campylobacter hominis CP000776 1 (0.03)Helicobacter pylori EU019082 2 (0.06)
Gammaproteobacteria U. Acinetobacter sp. AM749861 1 (0.03)Candidatus Carsonella ruddii CP003542 1 (0.03)Candidatus Portiera aleyrodidarum LN649255 2 (0.06)Citrobacter koseri CP000822 2 (0.06)Enterobacter hormaechei subsp. oharae CP010384 2 (0.06)Enterobacter xiangfangensis CP017183 1 (0.03)Escherichia albertii AP014856 3 (0.09)Escherichia coli LM997040 63 (2.05)Francisella cf. novicida CP002558 1 (0.03)Haemophilus parasuis CP009237 3 (0.09)Proteus sp. JX105434 1 (0.03)U. Proteus sp. JQ624310 1 (0.03)Pseudomonas fluorescens CP003150 1 (0.03)Shigella sonnei CP000038 3 (0.09)Pseudomonas hibiscicola LC002978 1 (0.03)Tatlockia micdadei LN614830 1 (0.03)U. proteobacterium EF662552 14 (0.45)Xanthomonas campestris pv. campestris EU089730 1 (0.03)
Spirochaetes Spirochaetia Brachyspira murdochii CP001959 1 (0.03)
Brachyspira pilosicoli CP003490 1 (0.03)Spirochaeta thermophila CP001698 1 (0.03)
SynergistetesSynergistia U. Cloacibacillus sp. KT124624 5 (0.16)
Cloacibacillus porcorum LT223650 2 (0.06)Synergistes sp. KU159767 2 (0.06)U. Synergistes sp. KU355598 4 (0.12)U. Synergistaceae bacterium KX672527 8 (0.25)U. Synergistetes bacterium CU925037 6 (0.19)
TenericutesMollicutes Mycoplasma arginini AP014657 1 (0.03)
Mycoplasma mycoides subsp. capri KU870646 1 (0.03)Mycoplasma ovipneumoniae KJ433280 3 (0.09)Spiroplasma turonicum CP013860 1 (0.03)
ThermotogaeThermotogae Marinitoga piezophila CP003257 1 (0.03)Unclassified Archaea U. archaeon JQ792422 6 (0.19)Unclassified Bacteria
Bacterium enrichment culture JX574952 6 (0.19)U. bacterium AB672264 2 103 (68.35)U. endolithic bacterium AB374374 1 (0.03)
600
JOURNAL OF OIL PALM RESEARCH 33 (4) DECEMBER 2021
ARTICLE IN
PRESS
ARTICLE IN
PRESS
ARTICLE IN
PRESS
ARTICLE IN
PRESS
TABLE 4. LIST OF BACTERIAL SPECIES IDENTIFIED FROM 12-YEAR- OLD OIL PALM PLANTATION AND AMPLIFIED USING PCR-DGGE METHOD, IN EACH CASE SHOWING THE SPECIES AND NCBI ACCESSION NUMBER OF THE CLOSEST MATCH IN THE GENBANK DATABASE (continued)
Phylum class Species Accession no. No. of species (% of sp.)
U. forest soil bacterium AY913265 6 (0.19)U. marine bacterium FR685231 5 (0.16)U. methanotrophic bacterium FN813709 1 (0.03)U. microorganism KX925247 3 (0.09)U. prokaryote KT043033 54 (1.75)U. rumen bacterium LN612857 1 (0.03)U. soil bacterium GQ918677 57 (1.85)Ud. marine bacterioplankton KC002524 2 (0.06)Bacterial species (N) 3 077 (100)Species richness 195Shannon-wiener Index (Hʹ) 7.83 ± 0.11
Note: U - uncultured; Ud - unidentified; NCBI - National Centre for Biotechnology Information; PCR-DDGE - polymerase chain reaction-denaturing gradient gel electrophoresis.
higher relative abundance in several soils and these bacteria are often difficult to cultivate.
Bacterial domains for phyla Actinobacteria, Bacteroidetes, Proteobacteria and Firmicutes were detected in both the culture-dependent and culture-independent approaches, similar to previous studies which identified these bacterial groups using both approaches (Al-Awadhi et al., 2013; Chapman et al., 2017; González-Rocha et al., 2017). The present findings showed that these bacterial groups were in low abundances when detected using the culture-independent method but corresponded to the most abundant recovered phyla with the culture-dependent method. Even though these bacterial groups were detected in both methods, their compositions among the sampling sites varied which might be due to the specific matrix from the collected peat samples and different identification approaches (Al-Awadhi et al., 2013; González-Rocha et al., 2017). For instance, the majority of genera retrieved using the culture-independent method were unrecovered by the culture-dependent method, but interestingly 44% of those genera identified with the culturing method were not retrieved by the culture-independent method, illustrating that each approach has its own restrictions, intrinsic advantages and limitations in identifying bacterial taxonomy (González-Rocha et al., 2017). Meanwhile, 66% of genera were found in both methods. Similar to the present study, members of Actinobacteria, Bacteroidetes, Proteobacteria and Firmicutes were also identified with the culture-dependent methodology by Kusai and Ayob (2020).
The most abundant bacterial phylum, Proteobacteria, comprises of five classes, Alpha-, Beta- Delta-, Epsilon- and Gammaproteobacteria. According to the research of Gu et al. (2018), Alpha-, Beta- and Deltaproteobacteria were the highest in swamp soil compared to meadow and
sandy soils, whilst Gammaproteobacteria was the highest in sandy soil. Within the Proteobacteria phylum, Betaproteobacteria was the abundant class that was identified using both approaches in the oil palm plantation ecosystems compared to other classes. In the present study, the genus Ralstonia (class Betaproteobacteria) was detected in both approaches and consisted of three species: R. insidiosa, R. solanacearum and Ralstonia sp. These findings were concordant with previous studies, which reported that these species were abundant and isolated from water, soil, and clinical samples (Lim and Lee, 2017; Patton et al., 2009; Ryan et al., 2006). Ralstonia possesses both chemoautotrophic and photoautotrophic properties and also plays a role in nitrogen fixation by oxidising ammonium to produce nitrite, making it available for various types of plants and benefitting the ecosystem (Lim and Lee, 2017).
Burkholderia (class Betaproteobacteria) was the second most abundant genus and was detected using both approaches. This genus is a nitrogen-fixing, efficient mineral-weathering bacteria and also a decomposer in peat soils (Sun et al., 2014). In addition, Burkholderia sp. was previously reported as a molybdenum-reducing bacterium (Khayat et al., 2016) and glyphosate utilising bacteria (Manogaran et al., 2017) from contaminated soil. In the study by Nacke et al. (2014), Burkholderia and Bradyrhizobium, which are involved in lignin degradation and contain ligninolytic genes such as protocatechuate 3,4-dioxygenase and protocatechuate 4,5-dioxygenase homologues, were identified in forest and grassland soils by a pyrosequencing-based analysis of complementary DNA (cDNA). This suggests that these identified bacterial genera are involved in lignin degradation in peat swamp ecosystems and play a significant contribution to lignin breakdown (Nacke et al., 2014).

601
A COMPARATIVE STUDY OF BACTERIAL COMMUNITIES DETERMINED BY CULTURE-DEPENDENT AND-INDEPENDENT APPROACHES IN OIL PALM PLANTED ON TROPICAL PEATLAND
ARTICLE IN
PRESS
ARTICLE IN
PRESS
Another major phylum in the oil palm plantation was Firmicutes (class Bacilli, Clostridia, Tissierella) which ranked among the 15 genera. Class Bacilli was detected predominantly using both approaches; this class has been reported to be abundant in tropical peat soils. These findings were in agreement with previous studies by Sun et al. (2014) and Tripathi et al. (2016), where the class was involved in the anaerobic degradation of soil organic carbon (Tripathi et al., 2018) and was suggested to be capable of withstanding high salinities and utilise uric acid under anaerobic conditions (Bottos et al., 2014). In addition, Firmicutes and Actinobacteria, which were enriched in the oil palm plantation soils, were associated with disease suppression (Wang et al., 2016). Actinobacteria has been shown to be copiotrophic and positively responds to carbon-rich environments (Shange et al., 2013). In addition, Actinobacteria is mainly linked to carbon cycling, is responsible for the breakdown of organic matter (Shange et al., 2013), and decomposes some recalcitrant carbon sources including cellulose and chitin (Li et al., 2012). On the other hand, Acidobacteria was the second prevalent phylum detected using the culture-independent method and accounted for 9%; six genera from this phylum were found in the total bacterial population of the oil palm plantation ecosystem. A previous study has reported that Acidobacteria plays important roles in peatland, such as in the degradation of cellulose and dead plant biomass, and also contributes to major nitrogen cycling in soils with their ability to reduce nitrate and nitrite (Tsitko et al., 2014). Besides that, the phylum Synergistetes accounted for 1% of the total population detected using the culture-independent method. These bacteria possess the ability to degrade amino acids and are known as amino-acid degrading bacteria, and have been previously studied by Honda et al. (2013) in Japanese rice soil fields.
Among the members of Bacteroidetes, the genera Flavobacterium and Chryseobacterium were less abundant in the oil palm plantation and have been reported to play a role in promoting plant growth (Nishioka et al., 2016; Soltani et al., 2010) and cellulose decomposition in topsoil (Mendes et al., 2015; Sun et al., 2014). In addition, the genus Flavobacterium is responsible for heterotrophic denitrification (Wang et al., 2016). The fact that oil palm soils have less exposure to sunlight due to oil palm frond cover is reflected in the lower relative abundances of photosynthesis-related bacterial phyla such as Cyanobacteria, Chloroflexi and Chlorobi (Tripathi et al., 2018). In addition, the results were in agreement with previous observations that the phylum Chloroflexi was found in the oil palm and rubber plantations, and forest soils (Grodnitskaya et al., 2018; Kerfahi et al., 2016; Mendes et al., 2015; Tripathi et al., 2016). Chloroflexi has also been reported to prevail
in nutrient-poor soils, confirming their oligotrophic characteristics (Ding et al., 2013).
On the other hand, the least abundant domain in the present study, Archaea, was affiliated to the Crenarchaeota, Euryarchaeota and unclassified Archaea, and was found in samples taken from the peat surface down to 30 cm. It was consistent with Jackson et al. (2009), who stated that the incidence of archaea communities was higher with increasing depth, which might be because the anoxic conditions in deeper peat facilitated the growth of methanogenic Euryarchaeota. The present study showed that oil palm plantations or agricultural use impacted several bacterial phyla in peat soils, even though less abundance was recorded by the culture-independent method, i.e., Candidatus Cloacimonetes, Deinococcus-Thermus, Dictyoglomi, Spirochaetes, Tenericutes and Thermotogae. These bacterial groups were detected using the culture-independent method, but none was detected by the culture-dependent method. Deinococcus-Thermus was identified by the culture-independent method using PCR-DGGE analysis; however, it was contradictory to a previous study by Ellis et al. (2003), who identified these species with the culture-dependent method using a fatty acid methyl ester (FAME) analysis. This result was in accordance with a previously published study, which reported phylum Deinococcus-Thermus had a positive association with the Cu, Zn and nickel (Ni) present in the mine environments samples (Pereira et al., 2014).
CONCLUSION
These results showed that the culture-independent approach could reveal higher richness and diversity compared to culture-dependent method. It could be concluded that PCR-DGGE method was more efficient to identify the low-abundance and difficult-to-culture prokaryotic taxa including Acidobacteria, Archaea and Unclassified Bacteria, which were not detected by culture-dependent method and more novel bacterial communities in the peat soil still have not been reported by other researchers. Taken together, these observations suggest further investigation, i.e., using next-generation sequencing in elucidating the community functions and their impact on agriculture land management practices, specifically on bacterial communities in Southeast Asia peatlands.
ACKNOWLEDGEMENT
The authors would like to thank the Director-General of MPOB for the permission to publish this article. This work was supported by MPOB Research Board under Grant R009711000.

602
JOURNAL OF OIL PALM RESEARCH 33 (4) DECEMBER 2021
ARTICLE IN
PRESS
ARTICLE IN
PRESS
ARTICLE IN
PRESS
ARTICLE IN
PRESS
REFERENCES
Abedon, S T (2011). Communication among phages, bacteria, and soil environments. Biocommunication in Soil Microorganisms (Witzany, G ed.). Springer, Berlin, Heidelberg. p. 37-65.
Al-Awadhi, H; Dashti, N; Khanafer, M; Al-Mailem, D; Ali, N and Radwan, S (2013). Bias problems in culture-independent analysis of environmental bacterial communities: A representative study on hydrocarbonoclastic bacteria. SpringerPlus, 2(1): 1-11.
Arai, H; Hadi, A; Darung, U; Limin, S H; Hatano, R and Inubushi, K (2014). A methanotrophic community in a tropical peatland is unaffected by drainage and forest fires in a tropical peat soil. Soil Sci. Plant Nutr., 60(4): 577-585.
Ayob, Z; Kusai, N A and Ali, S R A (2018). Sequence-based identification and characterisation of cultivated filamentous fungi in the Alan Bunga peat ecosystems of Sarawak, Malaysia. Mires Peat, 21(16): 1-19.
Bah, A R and Rahman, Z A (2004). Evaluating urea fertilizer formulations for oil palm seedlings using the 15N isotope dilution technique. J. Oil Palm Res., 16(1): 72-77.
Bottos, E M; Scarrow, J W; Archer, S D J; Mcdonald, I R and Cary, S C (2014). Bacterial community structures of Antarctic soils. Antarctic Terrestrial Microbiology (Cowan, D A ed.). Springer, Berlin, Heidelberg. p. 9-33.
Chapman, E J; Cadillo-Quiroz, H; Childers, D L; Turetsky, M R and Waldrop, M P (2017). Soil microbial community composition is correlated to soil carbon processing along a boreal wetland formation gradient. Eur. J. Soil Biol., 82: 17-26.
Chen, H-C; Wang, S-Y and Chen, M-J (2008). Microbiological study of lactic acid bacteria in kefir grains by culture-dependent and culture-independent methods. Food Microbiol., 25(3): 492-501.
Chaudhary, D K; Khulan, A and Kim, J (2019). Development of a novel cultivation technique for uncultured soil bacteria. Sci. Rep., 9(1): 1-11.
Dashti, A A; Jadaon, M M; Abdulsamad, A M and Dashti, H M (2009). Heat treatment of bacteria: A simple method of DNA extraction for molecular techniques. Kuwait Med. J., 41(2): 117-122.
Davis, K E R; Joseph, S J and Janssen, P H (2005). Effects of growth medium, inoculum size, and
incubation time on culturability and isolation of soil bacteria. Appl. Environ. Microbiol., 71(2): 826-834.
Dhandapani, S; Ritz, K; Evers, S and Sjögersten, S (2019). Environmental impacts as affected by different oil palm cropping systems in tropical peatlands. Agric. Ecosyst. Environ., 276: 8-20.
Ding, G-C; Piceno, Y M; Heuer, H; Weinert, N; Dohrmann, A B; Carrillo, A; Andersen, G L; Castellanos, T; Tebbe, C C and Smalla, K (2013). Changes of soil bacterial diversity as a consequence of agricultural land use in a semi-arid ecosystem. PLoS ONE, 8(3): e59497.
Edenborn, S L and Sexstone, A J (2007). DGGE fingerprinting of culturable soil bacterial communities complements culture-independent analyses. Soil Biol. Biochem., 39(7): 1570-1579.
El Karkouri, A; Assou, S A and El Hassouni, M (2019). Isolation and screening of actinomycetes producing antimicrobial substances from an extreme Moroccan biotope. Pan. Afri. Med. J., 33: 1-9.
Ellis, R J; Morgan, P; Weightman, A J and Fry, J C (2003). Cultivation-dependent and-independent approaches for determining bacterial diversity in heavy-metal-contaminated soil. Appl. Environ. Microbiol., 69(6): 3223-3230.
Fierer, N; Bradford, M A and Jackson, R B B (2007). Toward an ecological classification of soil bacteria. Ecology, 88(6): 1354-1364.
Fierer, N and Jackson, R B (2006). The diversity and biogeography of soil bacterial communities. Proc. Natl. Acad. Sci., 103(3): 626-631.
Fuhrman, J A; Cram, J A and Needham, D M (2015). Marine microbial community dynamics and their ecological interpretation. Nat. Rev. Microbiol., 13(3): 133-146.
Germida, J J and de Freitas, J R (2007). Cultural methods for soil and root-associated microorganisms. Soil Sampling and Methods of Analysis, Second Edition (Cater, M R and Gregorich, E G eds.). CRC Press, Boca Raton. p. 371-383.
Ghazali, N N; Adilah, M M M K; Abidin, Z A Z and Omar, S M (2016). Comparison of various culture media effectiveness in the isolation of bacteria from Pekan peat swamp forest soil. Malays. J. Microbiol., 12(6): 450-454.
González-Rocha, G; Muñoz-Cartes, G; Canales-Aguirre, C B; Lima, C A; Domínguez-Yévenes,

603
A COMPARATIVE STUDY OF BACTERIAL COMMUNITIES DETERMINED BY CULTURE-DEPENDENT AND-INDEPENDENT APPROACHES IN OIL PALM PLANTED ON TROPICAL PEATLAND
ARTICLE IN
PRESS
ARTICLE IN
PRESS
M; Bello-Toledo, H and Hernández, C E (2017). Diversity structure of culturable bacteria isolated from the Fildes Peninsula (King George Island, Antarctica): A phylogenetic analysis perspective. PLoS ONE, 12(6): 1-18.
Green, S J; Leigh, M B and Neufeld, J D (2010). Denaturing gradient gel electrophoresis (DGGE) for microbial community analysis. Handbook of Hydrocarbon and Lipid Microbiology (Timmis, K N ed.). Springer-Verlag, Berlin, Heidelberg. p. 4137-4158.
Grodnitskaya, I D; Trusova, M Y; Syrtsov, S N and Koroban, N V (2018). Structure of microbial communities of peat soils in two bogs in Siberian tundra and forest zones. Microbiology, 87(1): 89-102.
Gu, Y; Bai, Y; Xiang, Q; Yu, X; Zhao, K; Zhang, X; Li, C; Liu, S and Chen, Q (2018). Degradation shaped bacterial and archaeal communities with predictable taxa and their association patterns in Zoige wetland at Tibet plateau. Sci. Rep., 8(1): 1-11.
Hill, M O (1973). Diversity and evenness: A unifying notation and its consequences. Ecology, 54(2): 427-432.
Holland, K T (1987). Anaerobic Bacteria. Springer, USA.
Honda, T; Fujita, T and Tonouchi, A (2013). Aminivibrio pyruvatiphilus gen. nov., sp. nov., an anaerobic, amino-acid-degrading bacterium from soil of a Japanese rice field. Int. J. Syst. Evol. Microbiol., 63(Pt 10): 3679-3686.
Hu, X; Chen, J and Guo, J (2006). Two phosphate- and potassium-solubilizing bacteria isolated from Tianmu Mountain, Zhejiang, China. World J. Microbiol. Biotechnol., 22(9): 983-990.
Jackson, C R; Liew, K C and Yule, C M (2009). Structural and functional changes with depth in microbial communities in a tropical Malaysian peat swamp forest. Microbial. Ecol., 57(3): 402-412.
Jianzhong, Z; Xiaoli, L; Hanhu, J and Mingsheng, D (2009). Analysis of the microflora in Tibetan kefir grains using denaturing gradient gel electrophoresis. Food Microbiol., 26(8): 770-775.
Kanokratana, P; Uengwetwanit, T; Rattanachomsri, U; Bunterngsook, B; Nimchua, T; Tangphatsornruang, S; Plengvidhya, V; Champreda, V and Eurwilaichitr, L (2011). Insights into the phylogeny and metabolic potential of a primary tropical peat swamp forest microbial community by metagenomic analysis. Micro. Ecol., 61(3): 518-528.
Kerfahi, D; Tripathi, B M; Dong, K; Go, R and Adams, J M (2016). Rainforest conversion to rubber plantation may not result in lower soil diversity of bacteria, fungi, and nematodes. Microb. Ecol., 72(2): 359-371.
Kerfahi, D; Tripathi, B M; Lee, J; Edwards, D P and Adams, J M (2014). The impact of selective-logging and forest clearance for oil palm on fungal communities in Borneo. PLoS ONE, 9(11): 1-8.
Kesmen, Z and Kacmaz, N (2011). Determination of lactic microflora of kefir grains and kefir beverage by using culture-dependent and culture-independent methods. J. Food Sci., 76(5): 276-283.
Khayat, M E; Abd Rahman, M F; Shukor, M S; Ahmad, S A; Shamaan, N A and Shukor, M Y (2016). Characterization of a molybdenum-reducing Bacillus sp. strain khayat with the ability to grow on SDS and diesel. Rend. Fis. Acc. Lincei, 27(3): 547-556.
Kusai, N A and Ayob, Z (2020). Bacterial diversity in peat soils of forest ecosystems and oil palm plantation. Eurasian Soil Sci., 53(4): 485-493.
Kusai, N A; Ayob, Z; Maidin, M S T; Safari, S and Ali, S R A (2018). Characterization of fungi from different ecosystems of tropical peat in Sarawak, Malaysia. Rend. Fis. Acc. Lincei, 29(2): 469-482.
Li, R; Khafipour, E; Krause, D O; Entz, M H; de Kievit, T R and Fernando, W G D (2012). Pyrosequencing reveals the influence of organic and conventional farming systems on bacterial communities. PLoS ONE, 7(12): 1-12.
Lim, C T S and Lee, S E (2017). A rare case of Ralstonia mannitolilytica infection in an end stage renal patient on maintenance dialysis during municipal water contamination. Pak. J. Med. Sci., 33(4): 1047-1049.
Lipson, D A and Schmidt, S K (2004). Seasonal changes in an alpine soil bacterial community in the Colorado Rocky Mountains. Appl. Environ. Microbiol., 70(5): 2867-2879.
Liu, B; Talukder, M J H; Terhonen, E; Lampela, M; Vasander, H; Sun, H and Asiegbu, F (2020). The microbial diversity and structure in peatland forest in Indonesia. Soil Use and Manag., 36(1): 123-138.
Maidin, M S T; Safari, S; Ghani, N A; Ibrahim, S A S; Bakeri, S A; Masri, M M M and Ali, S R A (2016). Differences in prokaryotic species between primary and logged-over deep Peat forest in Sarawak, Malaysia. J. Oil Palm Res., 28(3): 281-295.

604
JOURNAL OF OIL PALM RESEARCH 33 (4) DECEMBER 2021
ARTICLE IN
PRESS
ARTICLE IN
PRESS
ARTICLE IN
PRESS
ARTICLE IN
PRESS
Manogaran, M; Shukor, M Y; Yasid, N A; Wan Johari, W L and Ahmad, S A (2017). Isolation and characterisation of glyphosate-degrading bacteria isolated from local soils in Malaysia. Rend. Fis. Acc. Lincei, 28(3): 471-479.
Melling, L (2016). Peatland in Malaysia. Tropical Peatland Ecosystems (Osaki, M and Tsuji, N eds.). Springer, Tokyo. p. 59-73.
Mendes, L W; Tsai, S M; Navarrete, A A; De Hollander, M; Van Veen, J A and Kuramae, E E (2015). Soil-borne microbiome: Linking diversity to function. Microb. Ecol., 70(1): 255-265.
Miguel, M G da C P; Cardoso, P G; Lago, L de A and Schwan, R F (2010). Diversity of bacteria present in milk kefir grains using culture-dependent and culture-independent methods. Food Res. Int., 43(5): 1523-1528.
Muyzer, G; Teske, A; Wirsen, C O and Jannasch, H W (1995). Phylogenetic relationships of Thiomicrospira species and their identification in deep-sea hydrothermal vent samples by denaturing gradient gel-electrophoresis of 16S rDNA fragments. Arch. Microbiol, 164(3): 165-172.
Muyzer, G; De Waal, E C and Uitterlinden, A G (1993). Profiling of complex microbial populations by denaturing gradient gel electrophoresis analysis of polymerase chain reaction-amplified genes coding for 16S rRNA. Appl. Environ. Microbiol., 59(3): 695-700.
Nacke, H; Fischer, C; Thürmer, A; Meinicke, P and Daniel, R (2014). Land use type significantly affects microbial gene transcription in soil. Microb. Ecol., 67(4): 919-930.
Nagendran, A N; Deivendran, S and Prabavathi, S (2014). Diversity of soil microbes under different ecosystem landuse patterns. J. Appl. Environ.Microbiol., 2(4): 90-96.
Nath, S; Deb, B and Sharma, I (2018). Isolation of toxic metal-tolerant bacteria from soil and examination of their bioaugmentation potentiality by pot studies in cadmium- and lead-contaminated soil. Int. Microbiol., 21(1-2): 35-45.
Nishioka, T; Elsharkawy, M M; Suga, H; Kageyama, K; Hyakumachi, M and Shimizu, M (2016). Development of culture medium for the isolation of Flavobacterium and Chryseobacterium from rhizosphere soil. Microbes Environ., 31(2): 104-110.
Nurulita, Y; Adetutu, E M; Kadali, K K; Shahsavari, E; Zul, D; Taha, M and Ball, A S (2016). Assessment
of the influence of oil palm and rubber plantations in tropical peat swamp soils using microbial diversity and activity analysis. J. Agric. Chem. Environ., 5: 53-65.
Olsen, R A and Bakken, L R (1987). Viability of soil bacteria: Optimization of plate-counting technique and comparison between total counts and plate counts within different size groups. Microb. Ecol., 13(1): 59-74.
Page, S E and Baird, A J (2016). Peatlands and global change: Response and resilience. Annu. Rev. Environ. Resour., 41(1): 35-57.
Pallant, J (2007). SPSS Survival Manual. McGraw Hill Open University Press, New York, USA.
Pankratov, T A; Serkebaeva, Y M; Kulichevskaya, I S; Liesack, W and Dedysh, S N (2008). Substrate-induced growth and isolation of Acidobacteria from acidic Sphagnum peat. ISME J., 2(5): 551-560.
Paramananthan, S (2016). Organic Soils of Malaysia: Their Characteristics, Mapping, Classification and Management for Oil Palm Cultivation. Malaysian Palm Oil Council, Selangor, Malaysia.
Parish, F; Lim, S S; Perumal, B and Giesen, W (2012). RSPO Manual on best management practices (BMPs) for management and rehabilitation of natural vegetation associated with oil palm cultivation on peat. Roundtable on Sustainable Palm Oil (RSPO), Kuala Lumpur.
Patton, T G; Scupham, A J; Bearson, S M D and Carlson, S A (2009). Characterization of fecal microbiota from a Salmonella endemic cattle herd as determined by oligonucleotide fingerprinting of rDNA genes. Vet. Microbiol., 136(3-4): 285-292.
Pereira, L B; Vicentini, R and Ottoboni, L M M (2014). Changes in the bacterial community of soil from a neutral mine drainage channel. PLoS ONE, 9(5): 1-10.
Piterina, A V and Pembroke, J T (2013). Use of PCR-DGGE based molecular methods to analyse microbial community diversity and stability during the thermophilic stages of an ATAD wastewater sludge treatment process as an aid to performance monitoring. Int. Sch. Res. Notices, 2013: 1-13.
Porter, J N; Wilhelm, J J and Tresner, H D (1960). Method for the preferential isolation of Actinomycetes from soils. Appl. Microbiol., 8: 174-178.
Posa, M R C; Wijedasa, L S and Corlett, R T (2011). Biodiversity and conservation of tropical peat swamp forests. BioScience, 61(1): 49-57.

605
A COMPARATIVE STUDY OF BACTERIAL COMMUNITIES DETERMINED BY CULTURE-DEPENDENT AND-INDEPENDENT APPROACHES IN OIL PALM PLANTED ON TROPICAL PEATLAND
ARTICLE IN
PRESS
ARTICLE IN
PRESS
Qaisrani, M M; Zaheer, A; Mirza, M S; Naqqash, T; Qaisrani, T B; Hanif, M K; Rasool, G; Malik, K A; Ullah, S; Jamal, M S; Mirza, Z; Karim, S and Rasool, M (2019). A comparative study of bacterial diversity based on culturable and culture-independent techniques in the rhizosphere of maize (Zea mays L.). Saudi J. Biol. Sci., 26(7): 1344-1351.
Rennie, R J (1981). A single medium for the isolation of acetylene-reducing (dinitrogen-fixing) bacteria from soils. Can. J. Microbiol., 27(1): 8-14.
Roslan, M A M; Amirudin, N A; Abidin, Z A Z and Omar, S M (2015). Isolation of bacteria from the acidic peat swamp forest soil and their lignin degradation potential. Jurnal Teknologi, 77(24): 77-81.
Ruangsanka, S (2014). Identification of phosphate-solubilizing bacteria from the bamboo rhizosphere. ScienceAsia, 40(3): 204-211.
Ryan, M P; Pembroke, J T and Adley, C C (2006). Ralstonia pickettii: A persistent Gram-negative nosocomial infectious organism. J. Hosp Infect., 62(3): 278-284.
Schneider, D; Engelhaupt, M; Allen, K; Kurniawan, S; Krashevska, V; Heinemann, M; Nacke, H; Wijayanti, M; Meryandini, A; Corre, M D; Scheu, S and Daniel, R (2015). Impact of lowland rainforest transformation on diversity and composition of soil prokaryotic communities in Sumatra (Indonesia). Front. Microbiol., 6: 1-12.
Shade, A; Hogan, C S; Klimowicz, A K; Linske, M; Mcmanus, P S and Handelsman, J (2012). Culturing captures members of the soil rare biosphere. Environ. Microbiol., 14(9): 2247-2252.
Shange, R; Haugabrooks, E; Ankumah, R; Ibekwe, A M; Smith, R C and Dowd, S (2013). Assessing the diversity and composition of bacterial communities across a wetland, transition, upland gradient in Macon County Alabama. Diversity, 5(3): 461-478.
Shannon, C E and Weaver, W (1949). The Mathematical Theory of Communication. University of Illinois Press, Urbana, Illinois.
Sheil, D; Casson, A; Meijaard, E; van Noordwjik, M; Gaskel, J; Sunderland-Groves, J; Wertz, K and Kanninen, M (2009). The impacts and opportunities of oil palm in Southeast Asia: What do we know and what do we need to know? Centre for International Forestry Research (CIFOR). Bogor, Indonesia. 67 pp.
Singh, P; Raghukumar, C; Verma, P and Shouche, Y (2012). Assessment of fungal diversity in deep-sea
sediments by multiple primer approach. World J. Microbiol Biotechnol., 28(2): 659-667.
Singh, S S; Schloter, M; Tiwari, S C and Dkhar, M S (2011). Diversity of community soil DNA and bacteria in degraded and undegraded tropical forest soils of North-eastern India as measured by ERIC–PCR fingerprints and 16S rDNA-DGGE profiles. J. Biol. Environ. Sci., 5(15): 183-194.
Situmorang, E C; Nugroho, Y A; Prameswara, A; Andarini, E; Hartono, Setyobudi, R H; Toruan-Mathius, N and Liwang, T (2016). The bacterial diversity investigation in oil palm plantation using terminal restriction length polymorphism. AIP Conf. Proc., 1744: 020017-1–020017-9.
Smit, E; Leeflang, P; Gommans, S; Van Den Broek, J; Van Mil, S and Wernars, K (2001). Diversity and seasonal fluctuations of the dominant members of the bacterial soil community in a wheat field as determined by cultivation and molecular methods. Appl. Environ. Microbiol., 67(5): 2284-2291.
Soltani, A-A; Khavazi, K; Asadi-Rahmani, H; Omidvari, M; Dahaji, P A and Mirhoseyni, H (2010). Plant growth promoting characteristics in some Flavobacterium spp. isolated from soils of Iran. J. Agric. Sci., 2(4): 106-115.
Stewart, E J (2012). Growing unculturable bacteria. J. Bacteriol., 194(16): 4151-4160.
Sun, H; Terhonen, E; Koskinen, K; Paulin, L; Kasanen, R and Asiegbu, F O (2014). Bacterial diversity and community structure along different peat soils in boreal forest. Appl. Soil Ecol., 74: 37-45.
Sutton, S (2011). Accuracy of plate counts. J. Valid. Technol., 17(3): 42-46.
Teo, J K C and Wong, C M V L (2014). Analyses of soil bacterial diversity of the Schirmacher Oasis, Antarctica. Polar Biol., 37(5): 631-640.
Too, C C; Keller, A; Sickel, W; Lee, S M and Yule, C M (2018). Microbial community structure in a Malaysian tropical peat swamp forest: The influence of tree species and depth. Front Microbiol., 9: 1-13.
Tripathi, B M; Kim, M; Kim, Y; Byun, E; Yang, J-W; Ahn, J and Lee, Y K (2018). Variations in bacterial and archaeal communities along depth profiles of Alaskan soil cores. Sci. Rep., 8(1): 1-11.
Tripathi, B M; Song, W; Slik, J W F; Sukri, R S; Jaafar, S; Dong, K and Adams, J M (2016). Distinctive tropical forest variants have unique soil microbial

606
JOURNAL OF OIL PALM RESEARCH 33 (4) DECEMBER 2021
ARTICLE IN
PRESS
ARTICLE IN
PRESS
communities, but not always low microbial diversity. Front Microbiol., 7: 1-11.
Troxler, T G; Ikenaga, M; Scinto, L; Boyer, J N; Condit, R; Perez, R; Gann, G D and Childers, D L (2012). Patterns of soil bacteria and canopy community structure related to tropical peatland development. Wetlands, 32(4): 769-782.
Tsitko, I; Lusa, M; Lehto, J; Parviainen, L; Ikonen, A T K; Lahdenperä, A-M and Malin, B (2014). The variation of microbial communities in a depth profile of an acidic, nutrient-poor boreal bog in Southwestern Finland. Open J. Ecol., 4(13): 832-859.
Vazquez, P; Holguin, G; Puente, M E; Lopez-Cortes, A and Bashan, Y (2000). Phosphate-solubilizing microorganisms associated with the rhizosphere of mangroves in a semiarid coastal lagoon. Biology and Fertility of Soils, 30(5-6): 460-468.
Veloo, R; Ranst, E van and Selliah, P (2015). Peat characteristics and its impact on oil palm yield. NJAS Wagen J. Life Sc., 72-73: 33-40.
Vincent, W F (2000). Evolutionary origins of Antarctic microbiota: Invasion, selection and endemism Antarct. Sci., 12(3): 374-385.
Wang, W; Wang, H; Feng, Y; Wang, L; Xiao, X; Xi, Y; Luo, X; Sun, R; Ye, X; Huang, Y; Zhang, Z and Cui, Z (2016). Consistent responses of the microbial community structure to organic farming along the middle and lower reaches of the Yangtze River. Sci. Rep., 6: 1-11.
Watanabe, T; Asakawa, S; Nakamura, A; Nagaoka, K and Kimura, M (2004). DGGE method for analyzing 16S rDNA of methanogenic archaeal community in paddy field soil. FEMS Microbiol. Lett., 232(2): 153-163.
Wu, Z; Lin, W; Li, B; Wu, L; Fang, C and Zhang, Z (2015). Terminal restriction fragment length polymorphism analysis of soil bacterial communities under different vegetation types in subtropical area. PLoS ONE, 10(6): 1-10.

607
ARTICLE IN
PRESS
ARTICLE IN
PRESS
Journal of Oil Palm Research Vol. 33 (4) December 2021 p. 607-616DOI: https://doi.org/10.21894/jopr.2021.0009
EVALUATION OF MITOCHONDRIAL DNA ISOLATION METHODS FOR OIL PALM
(Elaeis guineensis) LEAF
AZIMI NURAZIYAN1; SIEW-ENG OOI1 and MEILINA ONG-ABDULLAH1*
ABSTRACTAn efficient preparation of pure and intact mitochondrial deoxyribonucleic acid (mtDNA) that is free from nuclear DNA contamination is a prerequisite to study the molecular complexities of the organellar genome and gene structure in oil palm. Different extraction methods have been reported for mtDNA isolation from different plants. Using oil palm leaf tissues that are present in abundance, three methods were tested and modified to isolate mtDNA. The methods used vary primarily at the purification steps, either by using phenol/chloroform or density gradient centrifugation. High ionic alkaline buffer coupled with differential centrifugation were employed in Method I. While Methods II and III utilised the discontinuous sucrose and Percoll gradient centrifugation for mitochondria isolation, respectively. Method III provided good quality mtDNA from green leaves, yielding ~6.3 µg g–1 tissue. Restriction digest and polymerase chain reaction (PCR) for regions specific to mitochondrial, nuclear and chloroplast DNA further verified the quality of the mtDNA from Method III, which had the least plastid DNA contamination. Method III that incorporated Percoll density gradient centrifugation was the most efficient and provided good quality mtDNA without nuclear DNA contamination for sequencing applications and studies requiring pure mtDNA.
Keywords: chloroplast DNA, mtDNA, Percoll density gradient centrifugation, sucrose gradient.
Received: 17 November 2020; Accepted: 11 January 2021; Published online: 16 March 2021.
INTRODUCTION
Mitochondria in plants, as in other eukaryotes, are the major producers of adenosine triphosphate (ATP) via oxidative phosphorylation. Many important secondary functions such as synthesis of nucleotides, amino acids, lipids and vitamins are performed by this organelle. Mitochondria also play an essential role in plant cell death and react to cellular signals such as oxidative stress (Eubel et al., 2007). The wide range of complexities in mitochondrial genomes, its involvement in cytoplasmic male sterility and abiotic stress tolerance had triggered research interest on mitochondria of higher plants.
The membrane-bound organelles in the plant cell, nucleus, mitochondria and chloroplast, produce a mix of nucleic acids through total cellular extraction. However, enriched nucleic acid from highly purified mitochondrial fractions is crucial for detailed mitochondrial deoxyribonucleic acid (mtDNA) analysis in genomic, proteomic and metabolic function studies (Binder, 1995; Sweetlove et al., 2007).
In maize, Arabidopsis, sugarcane and rapeseed, a phenol/chloroform extraction method is adequate to obtain mtDNA pure enough for restriction endonuclease digestion (Hu et al., 2012; Klein et al., 1998; Mackenzie 1994; Virupakshi and Naik, 2007). For other plants, a combination of differential centrifugation and sucrose, polyvinylpyrrolidone (PVP) and/or Percoll as well as cesium chloride (CsCl) gradients was required to purify mtDNA (Day et al., 1985; Douce et al., 1977; Hausmann et al., 2003; Moore et al., 1993; Neuburger et al., 1982;
1 Malaysian Palm Oil Board, 6 Persiaran Institusi, Bandar Baru Bangi, 43000 Kajang, Selangor, Malaysia.
* Corresponding author e-mail: [email protected]

608
JOURNAL OF OIL PALM RESEARCH 33 (4) DECEMBER 2021
ARTICLE IN
PRESS
ARTICLE IN
PRESS
ARTICLE IN
PRESS
ARTICLE IN
PRESS
Rahman and Huber, 1996; Skubatz and Bendich, 1990). These approaches were implemented in mtDNA extraction from photosynthetic shoots or leaves from Arabidopsis (Klein et al., 1998), soybean (Hrubec et al., 1985) and rapeseed (Hu et al., 2012), but no method has been reported for oil palm to date. Therefore, several methods were explored, optimised and compared towards establishing an efficient extraction method for mtDNA from oil palm green leaves that is suitable for downstream applications requiring pure mtDNA.
MATERIALS AND METHODS
Plant Materials
Elaeis guineensis leaf sample (100 g) was stored in a 4°C cold room for at least 72 hr to reduce polysaccharide or starch content. The leaves were then cut into small pieces (~1 cm × 1 cm) prior to extraction with each method detailed below. Total cellular DNA of oil palm (gDNA), which was used as a control, was isolated using a hexadecyltrimethylammonium bromide (CTAB)-based method (Doyle and Doyle, 1990).
MtDNA Extraction Methods
Three extraction methods were tested and optimised to select the best method providing pure and high quality mtDNA. The first extraction method was adopted from Virupakshi and Naik (2007), the second from Hanson et al. (1986) and the third method was based on Binder and Grohmann (1995); Binder (1995) and Mourad (1998); the methods are designated as Methods I, II and III, respectively. All mtDNA extraction steps were carried out at 4°C unless stated otherwise.
Method I
Leaf samples (100 g) were homogenised in a Waring blender (2-speed, Model 7011S) with 1500 ml of ice-cold MTEN buffer (400 mM mannitol, 50 mM Tris-HCl pH 7.8, 1.5 M sodium chloride (NaCl), 25 mM EDTA-Na2 pH 8.0). One percent bovine serum albumin (BSA), 0.1% cysteine and 5% PVP were added immediately prior to 5 s strokes at high speed for three cycles. The resulting homogenate was filtered through two layers of muslin cloth, followed by two layers of miracloth (Calbiochem) and the filtrate was centrifuged at 1300 × g for 10 min. The supernatant was transferred to a new tube and recentrifuged at 3800 × g for 20 min. To sediment the mitochondria, the supernatant was again transferred to a new tube and centrifuged for 30 min at a much higher speed of 29 800 × g. The mtDNA pellet was then washed thrice with 25 ml TENC buffer (100 mM
Tris-HCl pH 7.8, 100 mM NaCl, 50 mM EDTA-Na2 pH 8.0. 0.1% cysteine, 0.1% BSA and 1% PVP were added immediately before use) at 29 800 × g for 10 min. The pellet was gently resuspended in 5 ml MT buffer (400 mM mannitol, 50 mM Tris-HCl pH 8.0) using a soft paintbrush. Magnesium sulphate (MgSO4) and deoxyribonuclease (DNase) were added to a final concentration of 20 mM and 5 mg ml–1, respectively and incubated at 37°C for 1 hr. DNAse activity was halted by washing with 3 volumes of NEDF buffer (50 mM Tris-HCl pH 8.0, 1 M NaCl, 50 mM EDTA-Na2 pH 8.0, 2% DEPC and 50 mM sodium fluoride) at 29 800 × g for 10 min. The pellet was resuspended in TE buffer (10 mM Tris-HCl pH 8.0, 1 mM EDTA-Na2 pH 8.0) before protein lysis at 37°C for 1 hr with a final concentration of 1% sodium dodecyl sulphate (SDS) and 10 μg ml–1 proteinase K. An equal volume of TE-saturated phenol was then added to the mixture and centrifuged at 21 900 × g for 10 min. Subsequently, an equal volume of chloroform/isoamyl alcohol (24:1, v/v) was added to the upper layer, mixed and centrifuged at 15 200 × g for 10 min. The mtDNA was precipitated in 0.1 volume of 3 M sodium acetate (pH 4.8) and 2 volumes of chilled absolute ethanol. The mtDNA pellet was then washed with 70% (v/v) ethanol, air-dried and resuspended in 200 μl of TE buffer. Three microliters of ribonuclease (20 mg ml–1) were added and the mixture was incubated at 37°C for 1 hr. An equal volume of chloroform/isoamyl alcohol (24:1, v/v) was added followed by centrifugation at 15 200 × g for 10 min. The mtDNA was precipitated in 0.1 volume of 3 M sodium acetate (pH 4.8) and 2 volumes of chilled absolute ethanol. Finally, the mtDNA was washed with 70% (v/v) ethanol, air-dried, resuspended in TE buffer and stored at -20°C until further use.
Method II
Leaves (100 g) were mixed into 1 litre of tissue grinding buffer (0.3 M mannitol, 50 mM Tris-HCl pH 8.0, 3 mM EDTA pH 8.0, 0.1% BSA, 1% PVP and 9 mM β-mercaptoethanol) and homogenised using a Waring blender for 5 s at high speed in three cycles. The resulting homogenate was filtered through four layers of muslin cloth, followed by two layers of miracloth. The filtrate was centrifuged at 2000 × g for 10 min to separate the bulk of nuclei, plastids and cellular debris. The supernatant was then centrifuged for 30 min at 10 000 × g to sediment the mitochondria. The resulting pellet was carefully resuspended in 25 ml of DNase digestion buffer (0.3 M mannitol, 50 mM Tris-HCl pH 8.0, 10 mM ethylene glycol-bis(2-aminoethylether)-N,N,N′,N′-tetraacetic acid (EGTA), 5 mM EDTA pH 8.0, 0.2% BSA, 50 mM MgCl2). After that, 500 μl of DNase (10 mg ml–1) was added to the suspension and incubated for 30 min on ice. One milliliter of 0.5 M EDTA was added to stop the reaction and the sample was diluted with 150 ml of
609
EVALUATION OF MITOCHONDRIAL DNA ISOLATION METHODS FOR OIL PALM (Elaeis guineensis) LEAF
ARTICLE IN
PRESS
ARTICLE IN
PRESS
gradient buffer (0.3 M sucrose, 50 mM Tris-HCl pH 8.0, 20 mM EDTA pH 8.0, 0.1% BSA). Mitochondria were harvested by centrifuging the sample for 15 min at 16 000 × g. The pellet was then resuspended in 6 ml gradient buffer using a paintbrush. The mitochondria suspension was carefully layered over the discontinuous sucrose gradient consisting of 1 ml 2 M sucrose, 3 ml each of 1.6 M and 1.2 M sucrose, and 2 ml 0.6 M sucrose in 50 mM Tris-HCl pH 8.0, 10 mM EDTA pH 8.0, 0.2% BSA, and 10 mM tricine pH 7.2. The gradients were then spun in a Beckman ultracentrifuge with SW41 swinging-bucket rotor at 25 000 rpm for 1 hr. The mitochondria fraction was removed from the 2 M to 1.6 M interphase with a pipette and slowly diluted with 3 volumes of gradient buffer over a 15 min period to minimise disruption by osmotic shock. Mitochondria were then harvested by centrifugation at 15 000 × g for 10 min. Subsequently, the mitochondria pellet was resuspended in 7 ml of HTE buffer (50 mM Tris-HCl pH 8.0, 20 mM EDTA pH 8.0) prior to lysis with 350 μl of 10% sarcosyl (w/v) and 10 μl of proteinase K (20 mg ml–1) for 30 min on ice. The mitochondria lysate was mixed with 8.05 g of CsCl and 220 μl of ethidium bromide (10 mg ml–1), transferred to a Beckman Quick-Seal tube (NVT100) and subjected to isopycnic centrifugation on CsCl gradient at 65 000 rpm for 10 hr at 20°C. Subsequently, the mtDNA band was collected using a syringe under UV light. Ethidium bromide (EtBr) was then removed from the mitochondria using isopropanol equilibrated with CsCl-saturated TE buffer. MtDNA was dialysed against 4 litres of TEN buffer (10 mM Tris-HCl pH 8.0, 5 mM EDTA, 50 mM NaCl) for 4 hr. Finally, the mtDNA was precipitated in 0.1 volume of 3 M sodium acetate (pH 7.0) and 2.5 volumes of absolute ethanol, washed with 70% (v/v) ethanol, air dried and dissolved in TE buffer.
Method III
Leaves (100 g) were homogenised in a Waring blender with 1500 ml of grinding buffer (400 mM mannitol, 25 mM 3-Morpholinopropane-1-sulphonic acid (MOPS) pH 7.8, 1 mM EGTA pH 8.0) for 5 s at high speed for three times, with a 30 s pause in between. Prior to homogenisation, a final concentration of 0.1% BSA and 40 mM β-mercaptoethanol were immediately added. The homogenate was then strained through four layers of muslin cloth pre-wetted with isolation medium, followed by two layers of miracloth. The filtered extract was further purified via differential centrifugation at 3500 × g for 5 min and the supernatant was centrifuged for 30 min at 18 000 × g. The resultant organelle pellet was gently resuspended in 5 ml of DNase I buffer (300 mM mannitol, 50 mM Tris-HCl pH 7.5, 5 mM MgCl2, 10 mM KH2PO4 and 4 mM β-mercaptoethanol)
using a paintbrush. The volume was adjusted to 25 ml with DNase I buffer. Then 7 mg of DNase was added to the suspension and incubated on ice for 1 hr to remove the remaining nuclear and chloroplast-derived DNA. After that, 5 ml of 0.5 M EDTA was added to the suspension to deactivate the DNase. The suspension was then adjusted to a final volume of 250 ml with DNase I buffer before centrifugation at 18 000 × g for 30 min. The supernatant was discarded and the pellet was washed three times with DNase I buffer containing 5 mM EDTA. Following that, the pellet was resuspended in 6 ml of wash medium buffer (400 mM mannitol, 5 mM MOPS pH 7.5, 1 mM EGTA pH 8.0, freshly added 0.1% BSA) and carefully homogenised by two strokes in the Ultra Turrax® T25 before transferring onto a freshly prepared Percoll step gradient. The Percoll gradient composed of 1.8 ml 45% Percoll, 3.6 ml 28% Percoll and 3.6 ml of 14% Percoll (bottom to the top layer). Each Percoll solution contained 400 mM mannitol, 20 mM Tricine pH 7.2 and 1 mM EGTA. The gradients were then centrifuged for 48 min at 19 700 rpm in an ultracentrifuge (SW41Ti rotor, Beckman Coulter, USA). The mitochondria band that appeared at the interphase between 28% and 45% Percoll layers was gently removed with a pipette and diluted with 3 volumes of wash medium buffer prior to centrifugation at 18 000 × g for 30 min. Dilution and centrifugation was repeated thrice to get rid of Percoll before resuspending the mitochondria in HTE buffer (50 mM Tris pH 8, 25 mM EDTA pH 8) and stored at -80°C until further use.
Mitochondria were lysed for an hour at 37°C in lysis buffer (5% sodium sarcosinate, 50 mM Tris-HCl pH 8, 25 mM EDTA) containing 7 mg proteinase K. Final purification of mtDNA was performed by isopycnic centrifugation on CsCl density gradients. Solid CsCl at a ratio of 1 g ml–1 of final suspension and 10 mg ml–1 EtBr were added, mixed and ultracentrifuged (SW41Ti, Beckmen Coulter, USA) at 41 000 rpm for 24 hr at 19°C. After that, the mtDNA band was visualised via a ultraviolet (UV) hand-held lamp and the respective band was collected from the centrifuge tubes using a syringe needle. EtBr was then extracted four times using isopropanol equilibrated with NaCl-saturated water. Dialysis was then carried out using 2 litres of LTE buffer (10 mM Tris pH 8, 0.1 mM EDTA pH 8) with two changes of fresh buffer over a period of 48 hr. The mtDNA was then precipitated in 0.1 volume of 3 M sodium acetate (pH 5.0) and 2 volumes of absolute ethanol. Finally, the mtDNA was washed with 70% (v/v) ethanol, air-dried, dissolved in LTE buffer and stored at -20°C.
Evaluation of mtDNA
The purity and quantity of mtDNA isolated by each method was assessed using Nanodrop and

610
JOURNAL OF OIL PALM RESEARCH 33 (4) DECEMBER 2021
ARTICLE IN
PRESS
ARTICLE IN
PRESS
ARTICLE IN
PRESS
ARTICLE IN
PRESS
Qubit® 2.0 fluorometer analysis, respectively. The integrity of DNA was assessed by gel electrophoresis. Approximately 1 μg of mtDNA was electrophoresed on a 1% agarose gel, stained with EtBr and visualised with the G: BOX Chemi XX9 (Syngene).
The purity of each sample was evaluated further through restriction enzyme analysis. Approximately 1.0-1.5 μg of DNA was digested with EcoRV (New England Biolabs-NEB, USA) according to the manufacturer’s instructions. Finally, the restriction digested product was visualised through 1% agarose gel electrophoresis under UV illumination.
Assessing Chloroplast and Nuclear DNA Contamination using PCR
The cytochrome c oxidase subunit III, coxIII (Duminil et al., 2002), actin (Accession No. XM_029261651) and non-coding regions of trnL (UAA) intron of chloroplast DNA (cpDNA) (Taberlet et al., 1991) genes were selected for evaluation of the isolated mtDNA (Table 1). PCR was conducted in the Mastercycler® Pro (Eppendorf, Germany) in a final volume of 25 μl containing 50 ng DNA template, 5X Buffer, 0.2 mM dNTP, 10 mM of each primer and 2.5 units of Taq polymerase (NEB, USA). PCR conditions were as follow: 95°C for 7 min, followed by 30 cycles at 95°C for 1 min, 55°C (coxIII, trnL) or 60°C (actin) for 90 s; 72°C for 2 min, and a final extension step of 72°C for 5 min. Total cellular DNA isolated from oil palm leaf was used as a positive control and a no template negative control was included. The amplified products were resolved by electrophoresis on a 1% agarose gel, stained with EtBr and visualised under UV illumination.
RESULTS AND DISCUSSION
Comparison of mtDNA Extraction Methods
The isolation of mitochondria from plants is particularly challenging as plant tissues tend to contain polysaccharides, phenolic compounds and oxidation products that co-purify with organellar
DNA. Mitochondria are also fragile and can be contaminated with broken chloroplasts and thylakoid membranes, which has a similar density to mitochondria (Hanson et al., 1986; Lang and Burger, 2007; Sweetlove et al., 2007). Different mtDNA isolation approaches were conducted to assess the suitability of each extraction method for oil palm green leaves.
As approximately only 1% of the plant total cellular content is mtDNA (Day, 1997), its abundance in the tissue sample would be important to ensure sufficient quantities of mitochondria can be obtained. Although etiolated and non-green tissues often give better mtDNA yields than green tissues (Hanson et al., 1986), the use of non-green tissues is usually hampered by the limitation of samples, as in the case for the oil palm. Therefore, green tissues are usually used as the starting material even though it contains higher concentrations of phenolics and other potentially damaging compounds to the mitochondria during the isolation process.
A few important factors were considered to minimise the degradation of mitochondria. Firstly, mitochondria were isolated using a buffer comprising EDTA or EGTA, BSA and a sulphydryl reagent such as 2-mercaptoethanol. These components help to overcome acidity, the presence of phenolic compounds and oxidation products in the tissue extract that can lead to rapid inactivation of the mitochondria (Hu et al., 2012). Secondly, to obtain maximum recovery of intact mitochondria, minimal grinding is encouraged using a Waring blender while working in the cold. Moreover, optimisation of the tissue amount to grinding buffer ratio was conducted to minimise the effects from vacuoles, particularly from the release of vacuolar contents (inorganic and organic molecules) that may damage plant mitochondria. The ratio of grinding buffer to grams fresh weight could be increased up to 40 for lipid-rich or phenol containing tissues (Skubatz and Bendich, 1990).
Several isolation methods for organellar DNA from plants using differential centrifugation technique were tested (Hu et al., 2012; Scotti et al., 2001; Triboush et al., 1998; Virupakshi and Naik,
TABLE 1. LIST OF PRIMERS USED FOR THE AMPLIFICATION OF SPECIFIC GENES FROM MITOCHONDRIAL, NUCLEAR AND CHLOROPLAST GENOMES
Organelle Target region (gene) Primer sequence Amplicon size (bp)
Mitochondrion coxIII F: 5’-CCGTAGGAGGTGTGATGT-3’ 680
R: 5’-CTCCCCACCAATAGATAGAG-3’
Nucleus Actin F: 5’-GAGAGAGCGTGCTACTCATC-3’ 230
R: 5’-CGGAAGTGCTTCTGAGATCC-3’
Chloroplast trnL (UAA) F: 5’-CGAAATCGGTAGACGCTACG-3’ 590
intron R: 5’-GGGGATAGAGGGACTTGAAC-3’

611
EVALUATION OF MITOCHONDRIAL DNA ISOLATION METHODS FOR OIL PALM (Elaeis guineensis) LEAF
ARTICLE IN
PRESS
ARTICLE IN
PRESS
2007). The method by Virupakshi and Naik (2007), with modifications (Method I), was the simplest and easiest. This method employs low speed centrifugation that removed cell wall fragments, starch grains, nuclei and intact plastids followed by a higher centrifugation speed which sedimented the intact mitochondria. In addition, elimination of nuclear DNA contamination was achieved by DNase treatment with a standard phenol/chloroform step to purify the mtDNA. Generally, mitochondria are enriched through differential centrifugation, followed by removal of nuclear DNA adhering to the external side of the organelle by using DNase treatment. This differential centrifugation technique using oil palm young leaf tissue provided adequately good quality mtDNA for restriction enzyme analysis (data not shown). MtDNA yield from young leaf tissue was 25-50 μg g–1 of tissue. A similar approach was reported by Hu et al. (2012) and Klein et al. (1998) whereby tender green leaf tissues were used for mtDNA isolation. Approximately 2-10 μg g–1 tissue of mtDNA from rapeseed leaves and 10-50 μg g–1 tissue of mtDNA from Arabidopsis leaves were isolated, respectively. Although this method was technically less laborious compared to the other two, it was not suitable for oil palm green leaf tissues as the quality of the isolated mtDNA was not up to par.
This led to the testing of density gradient centrifugation-based approaches using either sucrose (Method II) or Percoll (Method III). Despite their tediousness, these approaches were proven to efficiently isolate mitochondria from other plants (Hausmann et al., 2003). Sucrose, which is more cost effective and most commonly used for density centrifugation was utilised in Method II (Hanson et al., 1986). Purification of mitochondria and mtDNA was achieved using discontinuous sucrose gradient centrifugation and CsCl density gradient respectively. Isolation of organelles using discontinuous sucrose gradient showed that the upper 1.2/1.6 M interphase band tends to be more contaminated with thylakoid membranes, indicated as a predominantly dark green band (Figure 1). The light green band between the 1.6 M and 2 M range contained most of the mitochondria but could be contaminated by some thylakoid membranes. The sucrose gradient, however, may not be suitable as a separation media for plants with high starch content, which would result in poor phase separation of the mitochondria (Hrubec et al., 1985). Hence, sucrose gradient centrifugation was deemed not appropriate for mitochondria isolation from oil palm leaves since this approach could not separate the thylakoid membranes from mitochondria efficiently.
With this in mind, a better separation media was tested and this was incorporated in the third isolation procedure. Percoll has been used in mitochondria purification from green and non-green tissues via
continuous or discontinuous Percoll gradients (Eubel et al., 2007). The usage of Percoll allowed the separation of mitochondria and thylakoid membranes from green tissues (Lang and Burger, 2007; Mühlenhoff, 2010), and reduced chlorophyll contamination by 88.5% (Jackson et al., 1979). Mitochondria isolated from soybean leaves purified on a discontinuous Percoll gradient contained only 4% chlorophyll contamination (Hrubec et al., 1985). In addition, studies on intracellular protein transport between mitochondria and chloroplast in spinach leaves and proteome studies in tobacco and Arabidopsis leaves were also conducted using discontinuous Percoll gradients (Chen et al., 2010; Glaser et al., 1995; Michalecka et al., 2004).
After testing several methods including one that uses a continuous Percoll gradient (Keech et al., 2005), we found that the most suitable method to isolate mitochondria from oil palm green leaves is one that incorporates a discontinuous Percoll step gradient. Percoll step gradients are often used to aid the focusing of mitochondria fractions to an interface between Percoll concentrations (Eubel et al., 2007). This method, comprising four basic steps, was modified from Binder and Grohmann (1995), Binder (1995) and Mourad (1998). Firstly, mitochondria were separated from cellular debris, plastids and nuclei by differential centrifugation, followed by DNase treatment. The effectiveness of the DNase treatment requires penetration of the DNase enzyme into non-intact contaminated plastids and nuclear debris. Sufficient mitochondrial integrity is also important to prevent the enzyme from entering the organelles.
Figure 1. Purification of plant mitochondria by discontinuous sucrose gradient centrifugation (Method II). Distribution of different fractions and the relative position of oil palm mitochondria are shown. Sucrose step gradients (0.6 to 2.0 M) are indicated on the left.
0.6 M
1.2 M
1.6 M
Thylakoid
Mitochondria2.0 M

612
JOURNAL OF OIL PALM RESEARCH 33 (4) DECEMBER 2021
ARTICLE IN
PRESS
ARTICLE IN
PRESS
ARTICLE IN
PRESS
ARTICLE IN
PRESS
Disruption or homogenisation of the crude lysate before layering onto the three Percoll gradient layers is also crucial. This step eventually results in the focusing of a yellowish mitochondrial band between the 28% and 45% gradient. No interphase would be observed if the sample was not properly disrupted or excessive disruption had taken place during homogenisation (data not shown). The greenish band observed between the 14% and 28% interface corresponded to the thylakoid membrane layer (Figure 2). Finally, mtDNA was further
purified on CsCl density gradients. A single band was observed on agarose gel for mtDNA isolated using sucrose and Percoll gradients. The advantages and disadvantages of each isolation method are summarised in Table 2.
Method III Provided Good Quality mtDNA with Minimal Chloroplast DNA Contamination
UV absorbance and Qubit fluorometer analysis was used to determine the purity and concentration of the mtDNA (Table 3). The ideal A260/A280 and A260/A230 ratios are considered to be within 1.8-1.9 and 2.0-2.2, respectively (Sambrook et al., 1989). According to the A260/A280 values obtained, Methods II and III provided higher mtDNA purity, indicating low protein contamination. MtDNA isolated using Method I also contained RNA (Figure 3a).
All extraction methods provided mtDNA with A260/A230 ranging from 0.56 ± 0.28 to 1.35 ± 0.08. However, mtDNA isolated using Method III showed the highest value while Method I produced mtDNA with the lowest purity, suggesting contamination by polysaccharides, salts or organic solvents (Table 3). These contaminants may inhibit downstream applications (Healey et al., 2014). Therefore, Method I did not consistently provide good quality mtDNA, and could not be digested with restriction enzymes as well (data not shown). Impurities in DNA can lead to inaccurate measurement of DNA concentrations particularly through absorbance measurement. Therefore, Qubit fluorescence measurement indicated that mtDNA
Figure 2. Purification of plant mitochondria by Percoll gradient centrifugation. Position of the three-step Percoll gradient, 45%, 28% and 14% Percoll solution, are shown on the left. Plastids (a) are concentrated at the 14%-28% interphase and mitochondria (m) at the 28%-45% interphase.
14%
28%
45%
a
m
TABLE 2. COMPARISON OF mtDNA EXTRACTION METHODS FOR OIL PALM LEAF TISSUES
Comparisonfeatures
Methods
I II III
Isolation and purification of mitochondrial deoxyribonucleic acid (mtDNA)
MtDNA was extracted using high ionic alkaline buffer
Purification of mtDNA using phenol/chloroform and chloroform-isoamyl alcohol extraction
Discontinuous sucrose gradient was used to isolate mitochondria from other cell components
Require careful dilution of mitochondrial fraction in isosmotic conditions
Cesium chloride (CsCl) gradient required for further purification from impurities
Discontinuous Percoll step gradient was used to isolate mitochondria from other cell components
Allow rapid separation under isosmotic and low viscosity conditions
CsCl gradient required for further purification
Protocol time Two days Seven days Seven days
Simplicity of procedure Less laborious Tedious Tedious
Cost Low Low Medium
Others - Effective separation of bacteria from mitochondria
Inadequate separation for plants with high starch content
Effective separation of mitochondria from thylakoid membrane

613
EVALUATION OF MITOCHONDRIAL DNA ISOLATION METHODS FOR OIL PALM (Elaeis guineensis) LEAF
ARTICLE IN
PRESS
ARTICLE IN
PRESS
TABLE 3. QUALITY AND YIELD OF mtDNA EXTRACTED USING THE THREE METHODS
Parameters Methods
I II III
A260/A280 ratio 2.04 ± 0.04 1.87 ± 0.17 1.82 ± 0.08
A260/A230 ratio 0.56 ± 0.28 1.09 ± 0.16 1.35 ± 0.08
Yield (μg mtDNA/g tissue) - Qubit
2.03 ± 0.43 5.23 ± 0.57 6.30 ± 0.51
Note: Data is presented as mean ± SD of three biological replicates.
yield using Method III was the highest though absorbance readings indicated otherwise (Table 3).
The integrity of mtDNA and preliminary validation of mtDNA purity was analysed using gel electrophoresis and restriction enzyme digestion respectively. The restriction digest patterns of purified mtDNA can be validated by comparing with that of total plant DNA (Klein et al., 1998). MtDNA isolated using Methods I and III was intact and several well-defined bands were obtained after EcoRV digestion (Figures 3a and 3c). Well-separated bands with a total size of more than 100 kbp can be obtained when restriction analysis was performed on most organellar DNA (Lang and Burger, 2007). On the other hand, mtDNA isolated with Method II was slightly degraded and its restriction digest profiles also produced a background smear, suggesting partial mtDNA degradation and nuclear DNA contamination (Figure 3b). The total cellular DNA positive control showed an intact band and produced a continuous smear when digested with EcoRV (Figure 3d).
Further evaluation of mtDNA purity was conducted using PCR. Total cellular DNA was used as a positive control as it contains nuclear,
(a) M U M D (b) M U M D (c) M U D (d) M U D
10 000 bp
3 000 bp
1 000 bp
RNA
chloroplast and mtDNA (Lutz et al., 2011). The chloroplast specific universal primers for the trnL (UAA) intron evaluated cpDNA extract from oil palm leaves (Ho et al., 2015). PCR amplification for the cytochrome c oxidase subunit III (coxIII) of mtDNA, actin from nuclear DNA and chloroplast non-coding trnL (UAA) gene from the isolated mtDNA was successful (Figure 4). The coxIII PCR product was amplified from mtDNA isolated with all extraction methods, verifying that mtDNA was successfully isolated (Figure 4a). Low amounts of chloroplast co-sedimenting with mitochondria will hinder the purification of mtDNA from green tissues (Hrubec et al., 1985; Klein et al., 1998; Møller and Rasmusson, 2015). Some cpDNA was detected in the isolated mtDNA from all methods (Figure 4b). However, intensity of the PCR product for the chloroplast trnL (UAA) from mtDNA of Method III was fainter comparatively, suggesting a lower cpDNA contamination. MtDNA from Methods I and III did not generate the actin PCR product, demonstrating that the mtDNA was free from nuclear DNA contamination. However, mtDNA of Method II may contain nuclear DNA contamination, as shown by the amplified actin PCR product (Figure 4).
CONCLUSION
The three-step discontinuous Percoll gradient used in Method III reproducibly provided the best quality mtDNA from oil palm green leaves, whereby the quality was verified through successful restriction enzyme digestion. Our results strongly demonstrated that this method yielded mtDNA with the least plastid DNA contamination while providing good yields and purity. This enriched
Figure 3. Evaluation of leaf mitochondrial deoxyribonucleic acid (mtDNA) isolated using all three methods via gel electrophoresis and restriction digestion analysis. MtDNA isolated using (a) Method I, (b) Method II, (c) Method III, and (d) with total cellular DNA of oil palm as positive control. Lanes U: 1 µg of mtDNA, D: 1 µg mtDNA digested with EcoRV, M: 1 kb DNA ladder (promega).

614
JOURNAL OF OIL PALM RESEARCH 33 (4) DECEMBER 2021
ARTICLE IN
PRESS
ARTICLE IN
PRESS
ARTICLE IN
PRESS
ARTICLE IN
PRESSmtDNA can be used to generate mitochondrial genome information for further studies on nuclear-mitochondrial genetic interactions.
ACKNOWLEDGEMENT
The authors would like to thank the Director-General of MPOB for permission to publish this article. Our deepest appreciation goes to Azizah Mokri and Shamshulbahri Abd Manap of the Breeding and Tissue Culture Unit, MPOB, Mohd Mustakim Mohamad of MPOB Bagan Datuk, Perak and Rahimah Abdul Rahman of Genomics Unit, MPOB for their invaluable technical support and advice throughout this study. This study was funded by MPOB.
REFERENCES
Binder, S (1995). Mitochondrial nucleic acid purification and analysis. Plant Gene Transfer and Expression Protocols (Jones, H ed.). Humana Press, New Jersey. p. 383-390.
Binder, S and Grohmann, L (1995). Isolation of Mitochondria. Plant Gene Transfer and Expression Protocols (Jones, H ed.). Humana Press, New Jersey. p. 377-382.
Chen, R H; Liu, W; Zhang, G S and Ye, J X (2010). Mitochondrial proteomic analysis of cytoplasmic male sterility line and its maintainer in wheat (Triticum aestivum L.). Agric. Sci. China, 9: 771-782. DOI: 10.1016/S1671-2927(09)60154-1.
Day, D A; Neuburger, M and Douce, R (1985). Biochemical characterization of chlorophyll-free mitochondria from pea leaves. Funct. Plant Biol. DOI: 10.1071/pp9850219.
Day, J (1997). Isolation of nuclear, chloroplast and mitochondrial DNA from plants. Biochem. Educ., 25: 41-43. DOI: 10.1016/S0307-4412(96)00144-6.
Douce, R; Moore, A L and Neuburger, M (1977). Isolation and oxidative properties of intact mitochondria isolated from spinach leaves. Plant Physiol., 60: 625-628. DOI: 10.1104/pp.60.4.625.
Doyle, J J and Doyle, J L (1990). Isolation of plant DNA from fresh tissue. Focus, 12: 13-15.
Duminil, J M; Pemonge, H and Petit, R J (2002). A set of 35 consensus primer pairs amplifying genes and introns of plant mitochondrial DNA. Mol. Ecol. Notes, 2: 428-430. DOI: 10.1046/j.1471-8278.
Eubel, H; Heazlewood, J L and Millar, A H (2007). Isolation and subfractionation of plant mitochondria for proteomic analysis. Methods Mol. Biol., 355: 49-62. DOI: 10.1385/1-59745-227-0:49.
Glaser, E; Knorpp, C; Hugosson, M and von Stedingk, E (1995). Macromolecular movement into mitochondria. Methods Cell Biol. (Galbraith, D W; Bourque, D P and Bohnert, H J eds.). Academic Press Inc., California. p. 269-281.
Hanson, M R; Boeshore, M L; McClean, P E; O’Connell, M A and Nivison, H T (1986). The isolation of mitochondria and mitochondrial
(a) (b) (c)
680 bp
M 1 2 3 4 5 M 1 2 3 4 5 M 1 2 3 4 5
590 bp
230 bp
1 000 bp
700 bp
500 bp
300 bp
200 bp
100 bp
Figure 4. The polymerase chain reaction (PCR) amplification of mitochondrial deoxyribonucleic acid (mtDNA) isolated using the three methods. (a) coxIII product amplified from mtDNA; (b) trnL product amplified from chloroplast DNA (cpDNA); (c) actin product amplified from nuclear DNA. DNA templates used in PCR for Lane 1: positive control of total cellular DNA of oil palm (gDNA), 2: mtDNA from Method I, 3: mtDNA from Method II, 4: mtDNA from Method III, 5: no template negative control, M: 100 bp ladder (promega).

615
EVALUATION OF MITOCHONDRIAL DNA ISOLATION METHODS FOR OIL PALM (Elaeis guineensis) LEAF
ARTICLE IN
PRESS
ARTICLE IN
PRESS
DNA. Methods in Enzymology (Weissbach, A and Weissbach, H eds.). Academic Press, New York. p. 437-453.
Hausmann, N; Werhahn, W; Huchzermeyer, B; Braun, H P and Papenbrock, J (2003). How to document the purity of mitochondria prepared from green tissue of pea, tobacco and Arabidopsis thaliana. Phyt - Ann. Rei. Bot., 43: 215-229.
Healey, A; Furtado, A; Cooper, T and Henry, R J (2014). Protocol: A simple method for extracting next-generation sequencing quality genomic DNA from recalcitrant plant species. Plant Methods, 10: 21. DOI: 10.1186/1746-4811-10-21.
Ho, C M; Ooi, L C L; Tan, S G; Ho, C L and Singh, R (2015). A chloroplast DNA (cpDNA) extraction protocol for diversity analysis of oil palm (Elaeis spp.). J. Oil Palm Res., 27: 306-314.
Hrubec, T C; Robinson, J M and Donaldson, R P (1985). Isolation of mitochondria from soybean leaves on discontinuous percoll gradients. Plant Physiol., 77: 1010-1012. DOI: 10.1104/pp.77.4.1010.
Hu, Z; Zhan, G; Wang, H and Hua, W (2012). A simple method for isolating chloroplast DNA and mitochondria DNA from the same rapeseed green leaf tissue. J. Integr. Agric., 11: 1212-1215. DOI: 10.1016/S2095-3119(12)60117-8.
Jackson, C; Dench, J E; Hall, D O and Moore, A L (1979). Separation of mitochondria from contaminating subcellular structures utilizing silica sol gradient centrifugation. Plant Physiol., 64: 150-153. DOI: 10.1104/pp.64.1.150.
Keech, O; Dizengremel, P and Gardeström, P (2005). Preparation of leaf mitochondria from Arabidopsis thaliana. Physiol. Plant., 124: 403-409. DOI: 10.1111/j.1399-3054.2005.00521.x.
Klein, M; Hiesel, R; Andre, C and Brennicke, A (1998). Purification of mitochondrial DNA from green tissues of Arabidopsis. Arabidopsis Protocols (Martinez-Zapater, J M and Salinas, J eds.). Humana Press, New Jersey. p. 79-84.
Lang, B F and Burger, G (2007). Purification of mitochondrial and plastid DNA. Nat. Protoc., 2: 652-660. DOI: 10.1038/nprot.2007.58.
Lutz, K A; Wang, W; Zdepski, A and Michael, T P (2011). Isolation and analysis of high quality nuclear DNA with reduced organellar DNA for plant genome sequencing and resequencing. BMC Biotechnol., 11: 54. DOI: 10.1186/1472-6750-11-54.
Mackenzie, S A (1994). Isolation of plant mitochondria and mitochondrial nucleic acids. Plant Mol. Biol. Man., (Gelvin, S B and Schilperoort, R A eds.). Springer, Dordrecht. p. 203-214.
Michalecka, A M; Agius, S C; Møller, I M and Rasmusson, A G (2004). Identification of a mitochondrial external NADPH dehydrogenase by overexpression in transgenic Nicotiana sylvestris. Plant J., 37: 415-425. DOI: 10.1046/j.1365-313X.2003.01970.x.
Moore, A L; Fricaud, A C; Walters, A J and Whitehouse, D G (1993). Isolation and purification of functionally intact mitochondria from plant cells. Methods Mol. Biol., 19: 133-139. DOI: 10.1385/0-89603-236-1:133.
Møller, I M and Rasmusson, A G (2015). Isolation of mitochondria. Plant Physiology and Development, Sixth edition. Companion Website (Taiz, L; Zeiger, E; Møller, I M and Murphy, A eds.). Sinauer Associates, USA. http://6e.plantphys.net/topic12.01.html, accessed on 16 November 2017.
Mourad, G S (1998). Chloroplast DNA isolation. Methods in Molecular Biology (Martinez-Zapater, J M and Salinas, J eds.). Humana Press, Madrid. p. 71-77.
Mühlenhoff, U (2010). Mitochondria: Methods for preparation. Encycl. Life Sci.: 1-11. DOI: 10.1002/9780470015902.a0002601.pub2.
Neuburger, M; Journet, E P; Bligny, R; Carde, J P and Douce, R (1982). Purification of plant mitochondria by isopycnic centrifugation in density gradients of Percoll. Arch. Biochem. Biophys., 217: 312-323. DOI: 10.1016/0003-9861(82)90507-0.
Rahman, A S and Huber, D J (1996). Isolation and physiological properties of intact mitochondria from bell pepper (Capsicum annum) fruit. J. Plant Physiol., 149: 677-682. DOI: 10.1016/S0176-1617(96)80091-5.
Sambrook, J; Fritsch, E F and Maniatis, T (1989). Molecular Cloning: A Laboratory Manual. Second edition. Vol. 1, 2 and 3. Cold Spring Harbour, New York.
Scotti, N; Cardi, T and Marechaldrouard, L (2001). Mitochondrial DNA and RNA isolation from small amounts of potato tissue. Plant Mol. Biol. Rep., 19: 67. DOI: 10.1007/BF02824080.
Skubatz, H and Bendich, A J (1990). Isolation of mitochondria and mtDNA. Plant Molecular Biology Manual (Gelvin, S; Schilperoort, R and Verma, D eds.). Springer Netherlands, Dordrecht. p. 1-7.

616
JOURNAL OF OIL PALM RESEARCH 33 (4) DECEMBER 2021
ARTICLE IN
PRESS
ARTICLE IN
PRESS
Sweetlove, L J; Taylor, N L and Leaver, C J (2007). Isolation of intact, functional mitochondria from the model plant Arabidopsis thaliana. Methods Mol. Biol., 372: 125-136. DOI: 10.1007/978-1-59745-365-3_9.
Taberlet, P; Gielly, L; Pautou, G and Bouvet, J (1991). Universal primers for amplification of three non-coding regions of chloroplast DNA. Plant Mol. Biol., 17: 1105-1109. DOI: 10.1007/Bf00037152.
Triboush, S O; Danilenko, N G and Davydenko, O G (1998). A method for isolation of chloroplast DNA and mitochondrial DNA from sunflower. Plant Mol. Biol. Report., 16: 183. DOI: 10.1023/A:1007487806583.
Virupakshi, S and Naik, G R (2007). Purification of DNA from chloroplast and mitochondria of sugarcane. Curr. Sci., 92: 1613-1619.

617
ARTICLE IN
PRESS
ARTICLE IN
PRESS
Journal of Oil Palm Research Vol. 33 (4) December 2021 p. 617-628DOI: https://doi.org/10.21894/jopr.2021.0017
BIRD SPECIES RICHNESS, ABUNDANCE AND THEIR FEEDING GUILD ACROSS OIL PALMS DEVELOPMENT THROUGH MIST-NETTING
METHOD IN BETONG, SARAWAK
AMIT, B1*; TUEN, A A2 and KHO, L K1
ABSTRACTThere are a lot of studies comparing birds in oil palm plantation with forests and other crop ecosystems but less on bird across drained peat swamp forest (DPSF) converted to oil palm plantation. This study assessed the bird species richness, abundance and their feeding guild change throughout the oil palm development phases including DPSF, cleared land (CL), one-year-old palm (1YOP), two-year-old palm (2YOP), three-year-old palm (3YOP), four-year-old palm (4YOP) and five-year-old palm (5YOP). Sixty-seven species of bird were recorded across the development phases through mist-netting method, of which 35.8% were only recorded in DPSF, 19.4% of the DPSF bird species continued to be recorded after the forest conversion to oil palm plantation, and 44.8% of bird species were additional species from DPSF species, appearing following the planting of oil palm. Species richness of bird was significantly higher in DPSF than CL but similar level to those in oil palm plantation. Even though level of species richness in oil palm plantation was similar level to those in DPSF, Non-metric Multidimensional Scaling revealed that bird compositions were different according to the three grouping habitats; DPSF, CL and oil palm plantation. Species richness of insectivorous guild was ranked higher along the oil palm development phases. Species abundance of insectivorous was ranked higher at the early stage of development then omnivorous guild recorded abundant once the Yellow-vented Bulbul started to dominate oil palm of more than 2YOP. Good understanding on bird’s distribution change across the conversion of forest to oil palm development gives a better idea on how to minimise land disturbance during plantation operations.
Keywords: oil palm, omnivorous, peat swamp forest, species richness.
Received: 1 October 2020; Accepted: 2 February 2021; Published online: 27 April 2021.
1 Malaysian Palm Oil Board, 6 Persiaran Institusi, Bandar Baru Bangi, 43000 Kajang, Selangor, Malaysia.
2 Universiti Malaysia Sarawak, Institute of Biodiversity and Environmental Conservation, 94300 Kota Samarahan, Sarawak, Malaysia.
* Corresponding author e-mail: [email protected]
INTRODUCTION
Being one of the mega biodiversity countries, Malaysia is committed to the pledge at the Earth Summit in 1992, to keep at least 50% of its land
as forest cover and the protection of Malaysia’s forestland cannot be compromised (Parveez et al., 2019). Oil palm is an important commodity crop to Malaysia and with approximately 5.9 million hectares of cultivation, the industry is committed in addressing issues related to sustainability and its safety put forward by global concern (Parveez et al., 2020).
Across a range of agricultural systems, there is a general pattern of biodiversity change when natural habitats are converted to agricultural areas, and further change of biodiversity as such systems are intensified (Donald, 2004). The conversion of
618
JOURNAL OF OIL PALM RESEARCH 33 (4) DECEMBER 2021
ARTICLE IN
PRESS
ARTICLE IN
PRESS
ARTICLE IN
PRESS
ARTICLE IN
PRESS
forest into oil palm plantation systems has resulted in reduced biodiversity as compared to the native forest (Gibson et al., 2011; Hawa et al., 2016; Pimm et al., 2014; Savilaakso et al., 2014). To minimise the disruption on the pattern of biodiversity, various studies have been conducted to enhance biodiversity level within an oil palm plantation, including retaining forest remnants (Laurance et al., 2018), promoting greater landscape heterogeneity (Azhar et al., 2011), and increasing riparian reserves width to 40 m for each river (Mitchell et al., 2018).
Birds are good indicators to examine the degree of habitat disturbance (Barlow and Peres 2004), fragmentation effects of the conservation value of tropical rainforest (Campbell and Reece, 2002; Mohd-Azlan et al., 2019), landscape-scale processes (Pearman, 2002), florististic composition and availability of food resources (Barlow and Peres, 2004). This is mainly because they respond quickly to changes in vegetation structures and compositions. According to Stouffer and Bierregaad (1995), birds are specialists in their foraging techniques and habitat preference. For example, they use specific habitats and microhabitats and require large territories for their survival. Monitoring birds can show early warning of environmental changes (Gregory et al., 2003) and as well as important agents for seed dispersal and pollination (Padoa-Schioppa et al., 2006), pest control in agricultural environment (Koh, 2008a), and habitat quality and changes (Mohd-Azlan et al., 2019). The species composition (richness and abundance) of birds at each habitat is likely to be influenced by various processes associated with habitat structure, food availability, microclimate changes and spatial variations (Sodhi and Smith, 2007; Yap et al., 2007).
There have been several studies of bird in the literature reporting peat swamp forest is more diverse than that in oil palm plantation, and these results are likely attributed to peat swamp forest having complex habitat structure, better habitat, greater plant diversity and food resources (Azhar et al., 2011; Posa, 2011; Yule, 2010). Habitat structure change along the oil palm development phases is expected to be primary determinant of bird diversity over the development, yet few researchers have documented it. In the recent decades, there has been increasing interest in suggesting best management practices to promote bird diversity in oil palm landscape. There are several best practices in oil palm production as suggested by Azhar et al. (2013) which imply the occurrence of bird diversity according to feeding guild. For example, maintaining ground layer vegetation cover, pruning of oil palm canopy to permit light penetration to ground layer, re-vegetation of parts of oil palm landscapes with native trees and retention of natural and/or secondary forest patches within the boundaries of the plantation.
Most of the literatures on the bird species richness were focused on the comparison between oil palm plantation with forests and other agriculture activities (Jambari et al., 2012; Koh, 2008b; 2008c) which were located at different locations. There were research studies focusing on bird species richness that compared logged peat swamp forest with oil palm plantation with different ages and management (Azhar et al., 2011; Azman et al., 2011; Hawa et al., 2016). In addition to these primary data, investigation on bird starting from drained peat swamp forest to oil palm plantation are still needed for a better understanding of their species richness, abundance and feed guild change overtime. Drainage system is common in oil palm plantation on peatland for water management (Hasnol et al., 2010) and flood control (Azhar et al., 2013). Establishment of road and drainage system were carried out in the early operating procedure before clearing logged peat swamp forest for oil palm development (Harun et al., 2011). Hence, the aim of this article is to study the bird changes in species richness and abundance, and their feeding guild following the conversion of DPSF to planting with oil palm and until the palm reached five years old.
MATERIALS AND METHODS
Study Site
The study was conducted in an oil palm plantation located on peatlands and covered an area of 3100 ha in Betong Division, Sarawak, Malaysia (Figure 1). Bird surveys were conducted between July 2013 and November 2019. During this period, the study site was developed as oil palm plantation over several phases from the DPSF to cleared land (CL) and planted with oil palm from one-year-old (1YOP) to five-year-old palms (5YOP). DPSF is defined as logged peat swamp forest that has been drained for establishment of main road and drainage system according to plantation blocking before clearing phase for construction of field drains, planting rows and harvesting paths. CL phase is defined as the area that has been cleared for planting oil palm. Four sampling sessions (4320 net/hr) were carried out for each of the oil palm development phases except for CL phase (3240 net/hr). For each sampling session, two replicate sites that have undergone similar development were selected (Site A and Site B), and sampling was conducted repeatedly from both sites to monitor changes of bird population over time. We only completed three sampling sessions in CL phase due to the site being planted immediately after clearing. The surrounding area consisted of peat swamp forest and oil palm plantation belonging to other company. The distance between both sites was 1 km apart and the nearest forest

619
BIRD SPECIES RICHNESS, ABUNDANCE AND THEIR FEEDING GUILD ACROSS OIL PALMS DEVELOPMENT THROUGH MIST-NETTING METHOD IN BETONG, SARAWAK
ARTICLE IN
PRESS
ARTICLE IN
PRESSclose to Site A and Site B was 1 km apart. After the CL was planted with oil palms, the natural vegetation such as Nephrolepis biserrata, Melastoma sp., and Stenochlaena palustris grow naturally on the ground until the palm reached two years and nine months. Spraying activities started before the palms reached three-years-old and this operation only focused at palms circle and harvesting path. Harvesting activities started once the palms reached three years.
Bird Sampling
In this study, a total of 15 mist-nets [12 m (long) x 2.6 m (height) x 30 mm (mesh-size)] were set up at each site (two sampling sites) to capture birds (Hawa et al., 2016). This method restricted our samples to bird flying within the height range between 0.5-3.0 m above the ground. In the newly planted oil palm sites, the nets were set up at the harvesting path in the plantation. The nets were laid out for three days from 0600-1800 hr with regular inspections every 2 hr interval. Captured birds were gently disentangled from the net and were placed separately in the cloth bags. The captured birds were identified to the species level at the camp site and ringed before being released immediately at the site of capture to reduce stress. Ring was used to avoid double counting for similar individual at the same sampling period (Sutherland et al., 2004). Species identification was based on Myers (2009) and Phillipps and Phillipps (2014). The feeding guild of the bird species were grouped into five classes according to the bird species and food resources at the study sites (Phillipps and Phillipps, 2014). Classes of feeding guild involved in this study were namely; insectivorous (feeds
on insect and small invertebrate), carnivorous (feeds on vertebrates), omnivorous (feeds on insect, vertebrates and plant parts), granivorous (feeds on grains or seeds) and frugivorous (feeds on fruits).
Data Analyses
R statistical software version 4.00 (R Core Team, 2020) was used to estimate analyses as mentioned below using package ‘vegan’ by Oksanen et al. (2007). Shannon index, H’ was used in this study to calculate the species diversity of birds at different oil palm development phases. Species diversity can be measured if we have the number of species and the number of individuals in a given area or in a given sample (Spellerberg and Fedor, 2003). Pielou’s evenness (J) was used to measure how homogeneous or even a community or ecosystem is in terms of the abundances of its species. A community in which all species are equally common is considered even and has a high degree of evenness. J compares the actual diversity value (such as the Shannon Index, H′) to the maximum possible diversity value (when all species are equally common, Hmax=lnS where S is the total number of species). J is constrained between 0 and 1.0, and the more variation in abundances between different taxa within the community, the lower the J. One-way analysis of variance (ANOVA) was used to compare species richness and abundance among development phases. Once the p-value was less than 0.05, Tukey honestly significant difference (HSD) tests were used to test for significant differences in terms of species richness and abundance between phases. To determine the similarities of the bird community in seven development phases we
Figure 1. Study site location in Betong, Sarawak, Malaysia.
Oil Palm PlantationOil Palm
Plantation
Peat Swamp Forest
Peat Swamp Forest
Site A
Site B

620
JOURNAL OF OIL PALM RESEARCH 33 (4) DECEMBER 2021
ARTICLE IN
PRESS
ARTICLE IN
PRESS
ARTICLE IN
PRESS
ARTICLE IN
PRESS
performed an ordination of sites, based on the number of individuals of bird of each species at each site, using Non-metric Multidimensional Scaling (NMDS). To determine whether the bird composition was significantly different among sites we implemented Analysis of Similarity (ANOSIM).
RESULTS
Species Richness and Abundance
Across the seven development phases, we captured 715 individual birds representing 67 species, of 32 families (Table 1), including 10 migratory species and two Bornean endemics (Bornean Brown Barbet, Calorhamphus fuliginosus and Dusky Munia, Lonchura fuscans). We recorded 37, 3, 14, 21, 19, 20 and 19 bird species in DPSF, CL, 1YOP, 2YOP, 3YOP, 4YOP and 5YOP, respectively. The calculation in this data suggests that species richness of bird was reduced 43.34%-62.16% from the total number of species recorded in DPSF. Only one species was recorded in all development phases, Oriental Magpie Robin (Copsychus saularis). Our species accumulation curves approached an asymptote for all sites and confirming that we had sampled the avifauna well enough to assess differences in richness between sites except for 4YOP which was still rising and has not shown any sign of levelling off to reach asymptote suggesting more species to be recorded through longer and more intensive sampling (Figure 2). Species of conservation concern comprised 15% of all species recorded across the development phase. Interestingly, oil palm plantation recorded
one globally threatened and two near-threatened species, Hook-billed Bulbul (Setornis criniger) and Black-throated Babbler (Stachyris nigricollis), with Grey-chested Jungle Flycatcher (Cyornis umbratilis). Unexpectedly, we captured peat swamp forest specialist species, Hook-billed Bulbul at 3YOP.
Of the 67 species of birds recorded in this study, 35.82% were recorded only in the DPSF, 46.27% were recorded only in the plantations and 17.91% were recorded both in the plantations and forest. Out of 37 species of birds recorded in DPSF, 3%-22% bird species continued to be recorded after forest conversion to oil palm plantation (< 5YOP) and 9, 15, 13, 12 and 13 additional species from the species recorded in DPSF species were recorded in 1YOP, 2YOP, 3YOP, 4YOP and 5YOP, respectively (Figure 3). In this study, Yellow-vented Bulbul, (Pycnonotus goiavier), C. saularis and Plaintive Cuckoo (Cacomantis merulinus) were birds recorded relatively abundance in oil palm phases as compared to DPSF (Table 1).
Our results indicated a significant difference in species richness (p<0.05) between DPSF (mean=13.25 species per sampling) and the CL (mean=1.67 species per sampling) but similar to those in palms in the ages of less than 5YOP (Figure 4). There was no significant difference in bird abundance (p>0.05) caught between different phases. Bird Shannon diversity index was greater in DPSF than CL and young palm. Species abundances were more evenly partitioned at the 1YOP and DPSF than CL and 2YOP until 5YOP. NMDS showed that the bird community (ANOSIM: the number of permutations = 999; Global R: 0.5378; p=0.001) showed three clear habitat groupings; DPSF, CL and oil palm plantations (Figure 5).
Note: DPSF - drained peat swamp forest; CL - cleared land; 1YOP - one-year-old palm; 2YOP - two-year-old palm; 3YOP - three-year-old palm; 4YOP - four-year-old palm.
Figure 2. Cumulative number of bird species vs. cumulative days for each development phases.
Note: DPSF - drained peat swamp forest; CL - cleared land; 1YOP - one-year-old palm; 2YOP - two-year-old palm; 3YOP - three-year-old palm; 4YOP - four-year-old palm; 5YOP - five-year-old palm.
Figure 3. Cumulative species and additional species of drained peat swamp forest (DPSF) bird recorded at different oil palm development phases.
Cum
ulat
ive
num
ber o
f spe
cies
40
35
30
25
20
15
10
5
01 2 3 4 5 6 7 8 9 10 11 12
Days
DPSFCL1YOP2YOP3YOP4YOP
Num
ber o
f spe
cies
80
70
60
50
40
30
20
10
0DPSF CL 1YOP 2YOP 3YOP 4YOP 5YOP
Development phases
2
915 13 12 13
Additional species DPSF species Cumulative species

621
BIRD SPECIES RICHNESS, ABUNDANCE AND THEIR FEEDING GUILD ACROSS OIL PALMS DEVELOPMENT THROUGH MIST-NETTING METHOD IN BETONG, SARAWAK
ARTICLE IN
PRESS
ARTICLE IN
PRESS
Note: DPSF - drained peat swamp forest; CL - cleared land; 1YOP - one-year-old palm; 2YOP - two-year-old palm; 3YOP - three-year-old palm; 4YOP - four-year-old palm; 5YOP - five-year-old palm.
Figure 4. Boxplots demonstrating species richness, abundance, Shannon index and Pielou’s evenness in relation to habitat changes across the forest conversion to oil palm plantation (one to five-year-old palms).
Note: DPSF - drained peat swamp forest; CL - cleared land; 1YOP - one-year-old palm; 2YOP - two-year-old palm; 3YOP - three-year-old palm; 4YOP - four-year-old palm; 5YOP - five-year-old palm.
Figure 5. Non-metric multidimensional scaling (NMDS) ordinations of bird community structure across conversion of drained peat swamp forest (DPSF), cleared land (CL) to oil palm plantation.
Spe
cies
rich
ness
5 10
15
20
25
DPSF CL 1YOP 2YOP 3YOP 4YOP 5YOP
Spe
cies
abu
ndan
ce
DPSF CL 1YOP 2YOP 3YOP 4YOP 5YOP
0 20
40
60
80
Sha
nnon
inde
x (H
)
DPSF CL 1YOP 2YOP 3YOP 4YOP 5YOP
Development phases
0.0
0.5
1.0
1.5
2.0
2.5
3.0
Pie
lou’
s ev
enne
ss (J
)
DPSF CL 1YOP 2YOP 3YOP 4YOP 5YOP
Development phases
0.5
0.6
0.7
0.8
0.9
1.0
1.1
1.2
-1.0
-0
.5
0.0
0.5
NM
DA
2
-1.0 -0.5 0.0 0.5 1.0 1.5NMDS1

622
JOURNAL OF OIL PALM RESEARCH 33 (4) DECEMBER 2021
ARTICLE IN
PRESS
ARTICLE IN
PRESS
ARTICLE IN
PRESS
ARTICLE IN
PRESS
TABL
E 1.
BIR
D S
PEC
IES
CO
MPO
SITI
ON
WIT
H R
ELA
TIV
E A
BUN
DA
NC
E C
APT
UR
ED IN
DR
AIN
ED P
EAT
SWA
MP
FOR
EST
(DPS
F) T
HA
T U
ND
ERW
ENT
OIL
PA
LM D
EVEL
OPM
ENT
PRO
CES
SES,
SU
CH
AS
CLE
AR
ING
(CLE
AR
ED L
AN
D) A
ND
PLA
NTE
D W
ITH
OIL
PA
LM O
NE-
YEA
R-O
LD P
ALM
(1YO
P), T
WO
-YEA
R-O
LD P
ALM
(2YO
P), T
HR
EE-Y
EAR
-OLD
PA
LM
(3YO
P), F
OU
R-Y
EAR
-OLD
PA
LM (4
YOP)
AN
D F
IVE-
YEA
R-O
LD P
ALM
(5YO
P)
Fam
ilyLo
cal n
ame
DPS
FC
LPa
lm a
geC
onse
rvat
ion
stat
usFe
edin
g gu
ild1
23
45
Pycn
onot
idae
Oliv
e-w
inge
d Bu
lbul
18.7
6.45
0.01
8.21
6.04
LCO
mni
voro
usYe
llow
-ven
ted
Bulb
ul7.
4614
.542
.42
55.4
638
.81
47.6
5LC
Om
nivo
rous
Red-
eyed
Bul
bul
4.48
1.61
LCO
mni
voro
usH
ook-
bille
d Bu
lbul
0.75
1.68
VU
LO
mni
voro
usC
ream
-ven
ted
Bulb
ul0.
752.
02LC
Om
nivo
rous
Blac
k H
eade
d Bu
lbul
0.75
LCFr
ugiv
orou
sTi
mal
iidae
Bold
-str
iped
Tit
Babb
ler
8.96
3.36
6.72
10.0
7LC
Inse
ctiv
orou
sFl
uffy-
back
ed T
it Ba
bble
r0.
75N
TIn
sect
ivor
ous
Blac
k-th
roat
ed B
abbl
er4.
480.
67N
TIn
sect
ivor
ous
Shor
t-tai
led
Babb
ler
0.75
NT
Inse
ctiv
orou
sC
ucul
idae
Plai
ntiv
e C
ucko
o2.
2411
.30
10.1
5.88
5.22
6.04
LCIn
sect
ivor
ous
Band
ed C
ucko
o0.
75LC
Inse
ctiv
orou
sG
reat
er C
ouca
l2.
240.
67LC
Car
nivo
rous
Che
stnu
t-win
ged
Cuc
koo*
0.67
LCC
arni
voro
usN
ecta
riida
eRu
by-c
heec
ked
Sunb
ird2.
291.
49LC
Om
nivo
rous
Crim
son
Sunb
ird0.
75LC
Om
nivo
rous
Brow
n-th
roat
ed S
unbi
rd0.
751.
34LC
Om
nivo
rous
Pici
dae
Gre
y-an
d-Bu
ff W
oodp
ecke
r0.
75LC
Inse
ctiv
orou
sBu
ff-ru
mpe
d W
oodp
ecke
r8.
21LC
Inse
ctiv
orou
sRu
fous
Pic
ulet
0.75
0.75
LCIn
sect
ivor
ous
Buff-
neck
ed W
oodp
ecke
r0.
75LC
Inse
ctiv
orou
sG
rey-
capp
ed P
ygm
y W
oodp
ecke
r1.
49N
TIn
sect
ivor
ous
Alc
edin
idae
Blue
-ear
ed K
ingfi
sher
3.73
LCC
arni
voro
usSt
ork-
bille
d K
ingfi
sher
1.49
LCC
arni
voro
usC
omm
on K
ingfi
sher
*1.
61LC
Car
nivo
rous
Rufo
us-b
acke
d K
ingfi
sher
1.68
LCC
arni
voro
usM
egal
aim
idae
Brow
n Ba
rbet
4.48
LCO
mni
voro
usRe
d-cr
owne
d Ba
rbet
3.72
NT
Om
nivo
rous
Blue
-ear
ed B
arbe
t1.
49LC
Om
nivo
rous
Col
umbi
dae
Cin
nam
on-h
eade
d G
reen
Pig
eon
0.75
NT
Frug
ivor
ous
Pink
-nec
ked
Pige
on1.
010.
75LC
Frug
ivor
ous
Spot
ted
Dov
e2.
020.
75LC
Frug
ivor
ous
Dic
rurid
aeG
reat
er R
acke
t-tai
led
Dro
ngo
2.24
LCIn
sect
ivor
ous
Apo
dida
eSi
lver
-rum
ped
Nee
dlet
ail
1.49
1.01
LCIn
sect
ivor
ous
Edib
le-n
est S
wift
let
5.56
8.06
4.04
LCIn
sect
ivor
ous
Blac
k-ne
st S
wifl
et1.
680.
75LC
Inse
ctiv
orou
s

623
BIRD SPECIES RICHNESS, ABUNDANCE AND THEIR FEEDING GUILD ACROSS OIL PALMS DEVELOPMENT THROUGH MIST-NETTING METHOD IN BETONG, SARAWAK
ARTICLE IN
PRESS
ARTICLE IN
PRESS
TABL
E 1.
BIR
D S
PEC
IES
CO
MPO
SITI
ON
WIT
H R
ELA
TIV
E A
BUN
DA
NC
E C
APT
UR
ED IN
DR
AIN
ED P
EAT
SWA
MP
FOR
EST
(DPS
F) T
HA
T U
ND
ERW
ENT
OIL
PA
LM D
EVEL
OPM
ENT
PRO
CES
SES,
SU
CH
AS
CLE
AR
ING
(CLE
AR
ED L
AN
D) A
ND
PLA
NTE
D W
ITH
OIL
PA
LM O
NE-
YEA
R-O
LD P
ALM
(1YO
P), T
WO
-YEA
R-O
LD P
ALM
(2YO
P), T
HR
EE-Y
EAR
-OLD
PA
LM
(3YO
P), F
OU
R-Y
EAR
-OLD
PA
LM (4
YOP)
AN
D F
IVE-
YEA
R-O
LD P
ALM
(5YO
P) (c
ontin
ued)
Fam
ilyLo
cal n
ame
DPS
FC
LPa
lm a
geC
onse
rvat
ion
stat
usFe
edin
g gu
ild1
23
45
Sitti
dae
Velv
et-fr
onte
d N
utha
tch
0.75
LCIn
sect
ivor
ous
Orio
lidae
Dar
k-th
roat
ed O
riole
0.75
NT
Om
nivo
rous
Vang
idae
Blac
k-w
inge
d Fl
ycat
cher
-shr
ike
2.99
LCIn
sect
ivor
ous
Cam
peph
agid
aePi
ed T
hrill
er0.
75LC
Inse
ctiv
orou
sFa
lcon
idae
Blac
k-th
ighe
d Fa
lcon
et2.
99LC
Car
nivo
rous
Mus
cica
pida
eO
rient
al M
agpi
e Ro
bin
2.99
5.56
12.9
016
.26
5.04
10.4
56.
04LC
Inse
ctiv
orou
sG
rey-
ches
ted
Jung
le F
lyca
tche
r0.
750.
84N
TIn
sect
ivor
ous
Asi
an B
row
n Fl
ycat
cher
*0.
84LC
Inse
ctiv
orou
sEu
ryla
imid
aeBl
ack
and
Yello
w B
road
bill
2.99
NT
Inse
ctiv
orou
sSc
olop
acid
aeG
reen
San
dpip
er*
0.75
LCC
arni
voro
usW
ood
Sand
pipe
r*1.
01LC
Car
nivo
rous
Com
mon
San
dpip
er1.
01LC
Car
nivo
rous
Mot
acill
idae
Red-
thro
ated
Pip
it*1.
01LC
Inse
ctiv
orou
sPs
ittac
idae
Blue
-cro
wne
d H
angi
ng P
arro
t1.
49LC
Frug
ivor
ous
Estr
ildid
aeD
usky
Mun
ia3.
23LC
Gra
nivo
rous
Che
stnu
t Mun
ia1.
612.
020.
84LC
Gra
nivo
rous
Cis
ticol
idae
Rufo
us-ta
iled
Tailo
rbird
1.01
5.04
2.24
6.04
LCIn
sect
ivor
ous
Ash
y Ta
ilorb
ird1.
011.
34LC
Inse
ctiv
orou
sYe
llow
-bel
lied
Prin
ia3.
232.
020.
840.
67LC
Inse
ctiv
orou
sBr
ight
-hea
ded
Cis
ticol
a0.
75LC
Inse
ctiv
orou
sH
irund
inid
aePa
cific
Sw
allo
w1.
610.
84LC
Inse
ctiv
orou
sRa
llida
eW
hite
-bre
aste
d W
ater
hen
1.61
2.02
4.20
1.49
6.29
LCIn
sect
ivor
ous
Ard
eida
eC
inna
mon
Bitt
ern
1.61
3.03
3.36
2.99
LCC
arni
voro
usYe
llow
Bitt
ern
1.01
0.75
LCC
arni
voro
usLa
niid
aeLo
ng-ta
iled
Shrik
e*3.
030.
842.
962.
69LC
Car
nivo
rous
Rhip
idur
idae
Pied
Fan
tail
1.68
0.67
LCIn
sect
ivor
ous
Phyl
losc
opid
aeA
rctic
War
bler
*1.
68LC
Inse
ctiv
orou
sA
croc
epha
lidae
Orie
ntal
Ree
d W
arbl
er*
0.84
0.67
LCIn
sect
ivor
ous
Locu
stel
lidae
Rust
y-ru
mpe
d W
arbl
er*
88.8
930
.60
2.02
3.36
8.96
0.67
LCIn
sect
ivor
ous
Stur
nida
eA
sian
Glo
ssy
Star
ling
2.99
4.03
LCO
mni
voro
usA
ccip
itrid
aeJa
pane
se S
parr
owha
wk
1.34
LCC
arni
voro
us
Not
e: *
Mig
rato
ry b
ird; C
onse
rvat
ion
stat
us -
Inte
rnat
iona
l Uni
on fo
r Con
serv
atio
n of
Nat
ure
(IUC
N):
LC -
leas
t con
cern
; NT
- nea
r-th
reat
ened
; VU
- vu
lner
able
.

624
JOURNAL OF OIL PALM RESEARCH 33 (4) DECEMBER 2021
ARTICLE IN
PRESS
ARTICLE IN
PRESS
ARTICLE IN
PRESS
ARTICLE IN
PRESS
Feeding Guild
Based on the results, out of 67 species recorded in this study, 49.25%, 20.90%, 19.40%, 7.46% and 2.99% were insectivorous, carnivorous, omnivorous, frugivorous and granivorous birds, respectively. Our results show that, the insectivorous guild recorded highest in species richness in all development phases but recorded only second in terms of species abundance starting 2YOP until 5YOP after omnivorous guild. There was no significant difference in insectivorous species richness and abundance between sites (p>0.05). During CL phase, there was no other guild recorded except for insectivorous. It was found that frugivorous guild was only recorded in the DPSF, 3YOP and 4YOP phases while granivorous guild was only recorded at the early stage of oil palm development (1YOP, 2YOP and 3YOP).
Based on the results from Table 2, insectivorous (mean=6.8 species and 15.5 individuals per sampling) in DPSF was the most diverse and abundance guild followed by omnivorous (mean=5.0 species and 13.5 individuals per sampling), carnivorous (mean=1.0 species and 2.8 individuals per sampling) and frugivorous (mean=0.5 species and 0.75 individuals per sampling). None of the granivorous guild has been recorded in DPSF. Diverse insectivorous guild in DPSF was contributed by a good representation of bird species from woodpeckers (Family Picidea) and bulbuls (Family Pycnonotidae) with five species each. The Olive-winged Bulbul, Pycnonotus plumosus from omnivorous guild was the most dominant species recorded in DPSF with 25 individuals, followed by Bold-striped Tit Babbler, Macronus bornensis with 12 individuals, and Buff-necked Woodpecker, Meiglyptes tukki with 11 individuals. Macronus bornensis and M. tukki were species categorised as insectivorous guild. Carnivorous guild in DPSF was well represented from family Alcedinidae (kingfisher). Frugivorous birds recorded in the DPSF were pigeons, barbets and parrots which mostly fed on fruits.
Meanwhile, in our survey of CL, 100% (three species) were insectivorous birds. During land clearance, one species each from Locustellidae, Apodidae, and Muscicapidae family were recorded. A total of 88.89% of the individual birds recorded in the CL were Rusty-rumped Warbler, Locustella certhiola. In this study, this species was recorded until the palm reached 5YOP.
After planting with oil palm, our results indicated that young palm (<5 years) could potentially comprise of 40%-70% more diverse insectivorous guild than other feeding guilds (omnivorous: 10%-25%, carnivorous: 14%-29%, frugivorous: 0%-15% and granivorous: 0%-14%) with most of the insectivorous guild coming from Cisticolidae family (tailorbirds, prinias). Insectivorous bird, L. certhiola was still dominant in the first year of planting oil palm, however, omnivorous bird namely Yellow-vented Bulbul drastically increased in number and became dominant starting from 2YOP until 5YOP with more than 45% from the total individuals recorded in each palm age. Omnivorous guild recorded in the plantation was contributed by the presence of Pycnonotidae family (bulbuls). The carnivorous guild in oil palm plantation were represented by wetland bird and small bird predators. In turn, these birds were preyed upon by small predators, such as Long-tailed Shrike (Lanius schach) and Greater Coucal (Centropus sinensis) which occurred abundantly in the early stage of oil palm plantation. Frugivorous guild recorded in the plantation block were mostly seed and fruit eaters, such as spotted dove. This species was not recorded in the DPSF but was captured at 2YOP and 5YOP. Furthermore, this species was spotted feeding on loose fruits on the roads. Granivorous birds were only recorded at the early stage of oil palm development (1YOP, 2YOP and 3YOP) and these species, L. fuscans and Chestnut Munia (Lonchura atricapilla) were grass seeds eaters on the plantation blocks.
TABLE 2. DISTRIBUTION OF MEAN SPECIES AND INDIVIDUALS IN FEEDING GUILDS IDENTIFIED IN DRAINED PEAT SWAMP FOREST (DPSF), CLEARED LAND (CL), ONE-YEAR-OLD PALM (1YOP), TWO-YEAR-OLD PALM (2YOP), THREE-
YEAR-OLD PALM (3YOP), FOUR-YEAR-OLD PALM (4YOP) AND FIVE-YEAR-OLD PALM (5YOP) THROUGH MIST-NETTING METHOD IN BETONG, SARAWAK, MALAYSIA
Feeding guildMean number of species per sampling Mean number of individuals per sampling
DPSF CL 1YOP 2YOP 3YOP 4YOP 5YOP DPSF CL 1YOP 2YOP 3YOP 4YOP 5YOP
Overall 37 3 14 21 20 20 19 134 18 62 99 119 134 149
Insectivorous 6.80 1.80 4.00 4.75 6.50 4.75 5.50 15.50 6.0 10.75 10.00 10.75 12.25 13.00
Omnivorous 5.00 - 2.00 1.50 1.25 2.50 3.00 13.50 - 3.50 11.30 17.00 17.00 22.00
Carnivorous 1.00 - 0.50 2.00 1.50 1.75 1.00 2.80 - 0.50 2.00 1.75 3.00 2.00
Frugivorous 0.50 - - 0.75 - 0.50 0.25 0.75 - - 0.75 - 0.50 0.25
Granivorous - - 0.50 0.50 0.25 - - - - 2.25 0.50 0.25 - -

625
BIRD SPECIES RICHNESS, ABUNDANCE AND THEIR FEEDING GUILD ACROSS OIL PALMS DEVELOPMENT THROUGH MIST-NETTING METHOD IN BETONG, SARAWAK
ARTICLE IN
PRESS
ARTICLE IN
PRESS
DISCUSSION
The findings highlight that the logged peat swamp forest that has been drained for oil palm plantation supported higher bird species richness than CL. DPSF supported comparable levels of bird species richness to young palms at the age of less than five years old, and eight times higher than CL. Higher species richness in DPSF than CL has been attributed to the availability of complex habitat structure, better food resources and better habitat shelter in the forests (Azhar et al., 2011; Hawa et al., 2016; Posa, 2011). There was no significant difference in species richness among different ages of young palms and this result is similar to the findings by Azhar et al. (2011) and Aratrakorn et al. (2006). This study reveals that converting DPSF to oil palm plantation may potentially reduce 43%-62% of the bird species. This is consistent with the findings by Azhar et al. (2013) whereby converting forests to oil palm plantation possibly remove 48%-60% of bird species. The research study by Aratrakorn et al. (2006) also found that conversion of forest to plantations results in a reduction of species richness of at least 60%. While there were many additional species appearing after converting DPSF to oil palm plantation such as tailors, prinias, bitterns, swiflets, munias, swallows, waterhen, warblers, shrike and sparrowhawk. This result indicates that new species compositions were formed after transition from DPSF to oil palm plantation and this finding was supported though our NMDS ordination plot showing three clear grouping habitat along the development phases. Aynalem and Bakele (2008) suggested that distribution and abundance of bird are determined by the composition of the vegetation and surrounding landscape that forms a major component of their habitat. We had a surprising results, we managed to capture large-sized bird species such as Chestnut-winged Cuckoo and Japanese Sparrowhawk in oil palm plantation and this finding is similar to the study conducted by Hawa et al. (2016).
Of the 10 Globally Threatened and Near-Threatened species (IUCN, 2020) recorded in this study, three species were recorded in oil palm plantation and the others were restricted to DPSF. Out of these three species, one species was known as specialist species to peat swamp forest by Sheldon (1987) namely, S. criniger and two individuals from this species were recorded at 3YOP. The abundance of this species in peat swamp forest is due to ecological release from competitor (Sheldon et al., 2014). The presence of this species, possibly for foraging activities in the oil palm plantation, was due to the adjacent peat swamp forest located 1 km from the sampling site.
Insectivorous birds from the families Picidae (woodpeckers) and Pycnonotidae (bulbuls) were
recorded to be diverse in the DPSF. The finding is consistent with previous studies at peat swamp forest (Azhar et al., 2013; Hashim and Ramli, 2013; Peh et al., 2006; Sheldon et al., 2010). Good representation of woodpeckers in peat swamp forest is due to the existing remnants of dead standing trees found in the peat swamp forest which would attract bark-gleaning and hole-nesting birds for foraging and nesting activities (Styring and Zakaria, 2004). Interestingly, in CL abundance of insectivorous migratory bird, L. certhiola showed that this species was attracted to the newly opened peat swamp land which was consistent with the findings of Phillipps and Phillipps (2014) who stated that the presence of this species is due to their preference for open wetland area for their foraging activity. Our findings suggest that insectivorous guild recorded highest in species richness in oil palm plantation than other guilds and this guild was well-represented by the family Cisticolidae (tailorbirds, prinias). The primary contributor was the presence of ground layer of natural vegetation which attracted a high number of arthropods (Azhar et al., 2013; Hood et al., 2020; Jambari et al., 2012; Turner and Foster, 2009) hence providing food resources for this guild.
Diverse species of bulbuls in DPSF indicated that these coloniser species are common species recorded in disturbed areas such as regenerating forest from previous logging activities (Hashim and Ramli, 2013; Sodhi and Smith, 2007; Zakaria et al., 2002). Abundance of omnivorous bird, P. plumosus in DPSF indicates that this habitat was common in disturbed forest areas. Uneven species abundance in oil palm plantation was contributed by the presence of omnivorous bird P. goivaier as a dominant species starting from 2YOP, 3YOP, 4YOP and 5YOP. This result is in line with earlier literature by Hawa et al. (2016) and Amit et al. (2015) who found that P. goivaier has successfully dominated oil palm plantation due to their preference for diet with diverse range of food from plant materials to arthropods. Plantation practice by maintaining ground-layer vegetation growing naturally provide food resources for this omnivorous bird (Azhar et al., 2013; Hood et al., 2020; Turner and Foster 2009).
Carnivorous guild in DPSF was represented by the family Alcedinidae (kingfisher) while in early oil palm plantation revealed that carnivorous guild was well represented by wetland bird such as Amaurornis phoenicurus, Ixobrychus cinnamomeus and Ixobrychus sinensis and small bird predators such as L. schach and C. sinensis. Construction of drainage systems to control the ground water level in oil palm plantation on peat create habitat for aquatic life hence was more attractive for wetland carnivorous birds due to foraging opportunities (Azhar et al., 2013; Jambari et al., 2012). Diverse birds from family Cisticolidae (tailorbirds, prinias) in oil palm plantation provide food resources for small predators that feed on small

626
JOURNAL OF OIL PALM RESEARCH 33 (4) DECEMBER 2021
ARTICLE IN
PRESS
ARTICLE IN
PRESS
ARTICLE IN
PRESS
ARTICLE IN
PRESS
birds. This finding was observed during sampling period where C. sinensis was seen feeding on tailorbirds and prinias captured on the nets.
CONCLUSION
It is important to understand the changes of bird species richness, abundance and their feeding guild throughout the oil palm development processes so that the effects of land conversion especially on peatland can be reduced and managed. Our study demonstrates that DPSF supported higher bird species richness than CL but similar level to those in early stage of oil palm plantation. This study has shown that species abundance is similar among sites. Good representation of insectivorous guild in terms of species richness in all development phases. Oil palm plantation recorded abundance of omnivorous guild starting at 2YOP until 5YOP. Through letting ground layer vegetation grow naturally and maintaining water quality of the drainage system in the early stage of oil palm development by the plantation management attract birds that prefer to this habitat hence provides food resources for their survival.
ACKNOWLEDGEMENT
The authors thank the Director-General of the MPOB for permission to publish this article. We also thank the management of the oil palm plantation for their assistance throughout the study. We would also like to acknowledge members of MPOB Peat Ecosystem and Biodiversity Unit for their technical assistance.
REFERENCES
Amit, B; Tuen, A A; Haron, K; Harun, M H and Kamarudin, N (2015). The diet of Yellow-vented Bulbul (Pycnonotus goiavier) in oil palm agroecosystems. J. Oil Palm Res., 27(4): 417-424.
Aratrakorn, S; Thunhikorn, S and Donald, P F (2006). Changes in bird communities following conversion of lowland forest to oil palm and rubber plantations in Southern Thailand. Bird Conserv. Int., 16: 71-82.
Aynalem, S and Bekele, A (2008). Species composition, relative abundance and distribution of bird fauna of riverine and wetland habitats of Infranz and Yiganda at Southern tip of Lake Tana, Ethiopia. Trop. Ecol., 49: 199.
Azhar, B; Lindenmayer, D B; Wood, J; Fischer, J; Manning, A; MCelhinny, C and Zakaria, M (2011).
The conservation value of oil palm plantation estates, smallholdings and logged peat swamp forest for birds. For. Ecol. Manag., 262(12): 2306-2315.
Azhar, B; Lindenmayer, D B; Wood, J; Fischer, J; Manning, A; MCelhinny, C and Zakaria, M (2013). The influence of agricultural system, stand structural, complexity and landscape context on foraging birds in oil palm landscapes. Ibis, 155(2): 297-312.
Azman, N M; Abdul, L N S; Mohd, S S A; Md Akil, M A M; Shafie, N J and Khairuddin, N L (2011). Avian diversity and feeding guilds in a secondary forest, an oil palm plantation and paddy field in riparian areas of the Kerian River Basin, Perak, Malaysia. Trop. Life Sci. Res., 22(2): 45-64.
Barlow, J and Peres, C A (2004). Avifaunal responses to single and recurrent wildfires in Amazonian forests. Ecol. Appl., 14: 1358-1373.
Campbell, N A and Reece, J B (2002). Biology. Sixth edition. Benjamin Cummings, San Francisco, USA. 187 pp.
Donald, P F (2004). Biodiversity impacts of some agricultural commodity production systems. Conservation Biology, 18: 17-38.
Gibson, L; Lee, T M; Koh, L P; Brook, B W; Gardner, T A; Barlow, J; Peres, C A; Bradshaw, C J; Laurance, W F; Lovejoy, T E and Sodhi, N S (2011). Primary forests are irreplaceable for sustaining tropical biodiversity. Nature, 478: 378-381.
Gregory, R D; Noble, D; Field, R; Marchant, J; Raven, M and Gibbons, D W (2003). Using birds as indicators of biodiversity. Ornis Hungarica, 12(13): 11-24.
Harun, M H; Kushairi, A; Mohammed, A T; Omar, W; Othman, H; Darus, F and Jantan, N M (2011). Guidelines for the Development of a Standard Operating Procedure for Oil Palm Cultivation on Peat. MPOB, Bangi. 9 pp.
Hashim, E N and Ramli, R (2013). Comparative study of understorey birds diversity inhabiting lowland rainforest virgin jungle reserve and regenerated forest. Sci. World J., 2013(1): 676507.
Hasnol, O; Tarmizi, A M; Haniff, M H; Darus, F M and Mos, H (2010). Best management practices for oil palm planting on peat: Optimum groundwater table. MPOB Information Series No. 472.
Hawa, A; Azhar, B; Top, M M and Zubaid, A (2016). Depauperate Avifauna in tropical peat swamp

627
BIRD SPECIES RICHNESS, ABUNDANCE AND THEIR FEEDING GUILD ACROSS OIL PALMS DEVELOPMENT THROUGH MIST-NETTING METHOD IN BETONG, SARAWAK
ARTICLE IN
PRESS
ARTICLE IN
PRESS
forests following logging and conversion to oil palm agriculture: Evidence from mist-netting data. Wetlands, 36(5): 899-908.
Hood, A S C; Advento, A D; Stone, J; Fayle, T M; Fairnie, A L M; Waters, H S; Foster, W A; Snaddon, J L; Caliman, J-PP; Naim, M and Turner, E C (2020). Removing understory vegetation in oil palm agroforestry reduces ground-foraging ant abundance but not species richness. Basic Appl. Ecol., 48: 26-36.
IUCN (2020). The IUCN Red List of Threatened Species. International Union for Conservation of Nature. http://www.iucnredlist.org/ accessed on 26 April 2020.
Jambari, A; Azhar, B; Ibrahim, N L; Jamian, S; Hussin; Puan, C L and Zakaria, M (2012). Avian biodiversity and conservation in Malaysian oil palm production areas. J. Oil Palm Res., 24: 1277-1286.
Koh, L P (2008a). Birds defend oil palms from herbivorous insects. Eco. Appl., 18: 821-825.
Koh, L P (2008b). Can oil palm plantations be made more hospitable for forest butterflies and birds? J. Appl. Ecol., 45: 1002-1009.
Koh, L P (2008c). Is oil palm agriculture really destroying tropical biodiversity? Conserv. Lett., 1: 60-64.
Laurance, W F; Carmargo, J L C; Fearnside, P M; Lovejoy, T E; Williamson, B G; Mesquita, R C G and Laurance, S G W (2018). An Amazonian rainforest and its fragments as a laboratory of global change. Biological Reviews, 93: 223-247.
Mitchell, S L; Edwards, D P; Bernard, H; Coomes, D; Jucker, T; Davies, Z D and Struebig, M J (2018). Riparian reserves help protect forest bird communities in oil palm dominated landscapes. J. Appl. Ecol., 55(6): 1-12.
Mohd-Azlan, J; Fang, V A M; Kaicheen, S S; Lok, L and Lawes, M J (2019). The diversity of understorey birds in forest fragments and oil palm plantation, Sarawak, Borneo. J. Oil Palm Res., 31(3): 437-447.
Myers, S (2009). A Field Guide to the Birds of Borneo. New Holland Publishers Ltd. 272 pp.
Oksanen, J; Kindt, R; Legendre, P; O’Hara, B; Simpson, G L; Solymos, P; Stevens, M H H and Wagner, H (2007). Vegan: Community Ecology Package. R Package Version 1.17-8.
Padoa-Schioppa, E M; Baietto, R; Massa and Bottoni, L (2006). Bird communities as bioindicators: The focal species concept in agricultural landscapes. Ecol. Indic., 6: 83-93.
Parveez, G K A; Khoon, K L; Hill, T C; Arn, T Y and Kushairi, A (2019). Sustainable oil palm cultivation in Malaysia – Are peatlands a suitable choice? J. Oil Palm Environment and Health, 10: 13-18.
Parveez, G K A; Hishamuddin, E; Loh, S K; Ong-Abdullah, M; Salleh, K M; Bidin, M N I Z; Sundram, S; Hasan, Z A A and Idris, Z (2020). Oil palm economic performance in Malaysia and R&D progress in 2019. J. Oil Palm Res., 32(2): 159-190.
Pearman, P B (2002). The scale of community structure: Habitat variation and avian guilds in tropical forest understorey. Ecol. Monogr., 72(1): 19-30.
Peh, K S H; Sodhi, N S; de Jong, J; Sekercioglu, C H; Yap, C A M and Lim, S L H (2006). Conservation value of degraded habitats for forest birds in Southern Peninsular Malaysia. Divers. Distrib., 12(5): 572-581.
Phillipps, Q and Phillipps, K (2014). Phillipps’ field guide to the birds of Borneo Sabah, Sarawak, Brunei and Kalimantan. Third edition. Princeton University Press, New Jersey.
Pimm, S L; Jenkins C N; Abell, R; Brooks, T M; Gittleman, J L and Joppa, L N (2014). The biodiversity of species and their rates of extinction, distribution and protection. Science, 344(6187): 1246752.
Posa, M R C (2011). Peat swamp forest avifauna of Central Kalimantan, Indonesia: Effects of habitat loss and degration. Biol. Conserv., 144: 2548-2556.
R Core Team (2020). R: A language and environment for statistical computing. R Foundation for Statistical Computing, Vienna, Austria. https://www.R-project.org/, assessed on 29 April 2020.
Razak, S; Saadun, N; Azhar, B and Lindenmayer, D B (2020). Smallholdings with high oil palm yield also support high bird species richness and diverse feeding guilds. Environ. Res. Lett., 15(9): 094031.
RSPO (2020). About. Roundtable on Sustainable Palm Oil (RSPO). https://rspo.org/about, accessed on 6 August 2020.

628
JOURNAL OF OIL PALM RESEARCH 33 (4) DECEMBER 2021
ARTICLE IN
PRESS
ARTICLE IN
PRESS
Savilaakso, S; Garcia, C; Garcia-Ulloa, J; Ghazoul, J; Groom, M; Guariguata, M R; Laumonier, Y; Nasi, R; Petrokofsky, G; Snaddon, J and Zrust, M (2014). Systematic review of effects on biodiversity from oil palm production. Environ. Evid., 3(1): 4.
Sheldon, F H; Davison, G; Wong, A and Moyle, R G (2014). Birds in Peatswamp at Klias Forest Reserve and Environs, Sabah, Malaysian Borneo. Occasional Papers of the Museum of Natural Science. Louisiana State University, Baton Rouge, Louisiana. No. 83.
Sheldon, F H (1987). Habitat preferences of the Hook-billed Bulbul (Stornis criniger) and the White-throated Babbler (Malacopteron albogulare) in Borneo. Forktail, 3: 17-25.
Sheldon, F H; Styring, A and Hosner, P A (2010). Bird species richness in a Borneon exotic tree plantation: A long-term perspective. Biol. Conserv., 143: 399-407.
Sodhi, N S and Smith, K G (2007). Conservation of tropical birds: Mission possible? J. Ornithol., 148(2): 305-309.
Spellerberg, I F and Fedor, P J (2003). A tribute to Claude Shannon (1916-2001) and a plea for more rigorous use of species richness, species diversity and the ‘Shannon-Wiener’ index. Global Ecol.Biogeogr., 12: 177-179.
Stouffer, P C and Bierregaard, R O (1995). Use of Amazonian forest fragments by understory insectivorous birds. Ecology, 76: 2429-2445.
Styring, A R and Zakaria, H M (2004). Foraging ecology of woodpeckers in lowland Malaysian rain forests. J. Trop. Ecol., 20: 487-494.
Sutherland, W J; Newton, I and Green, R (2004). Bird Ecology and Conservation: A Handbook of Techniques. Oxford University Press, London. 405 pp.
Turner, E C and Foster, W A (2009). The impact of forest conversion to oil palm on arthropod abundance and biomass in Sabah, Malaysia. J. Trop. Ecol., 25: 23-30.
Yap, C A M; Sodhi, N S and Peh, K S H (2007). Phenology of tropical birds in Peninsular Malaysia: Effects of selective logging and food resources. Auk., 124: 945-961.
Yule, C M (2010). Loss of biodiversity and ecosystem functioning in Indo-Malayan peat swamp forests. Biodivers. Conserv., 19: 393-409.
Zakaria, M; Amri, K and Nasir, J (2002). Comparison of understorey bird species composition in a primary and logged hill dipterocarp forest in Peninsular Malaysia. Malay. Nat. J., 56: 153-167.

629
ARTICLE IN
PRESS
ARTICLE IN
PRESS
Journal of Oil Palm Research Vol. 33 (4) December 2021 p. 629-642DOI: https://doi.org/10.21894/jopr.2021.0012
MAPPING THE NITROGEN STATUS ON IMMATURE OIL PALM AREA IN MALAYSIAN OIL PALM PLANTATION WITH AUTOPILOT
TRACTOR-MOUNTED ACTIVE LIGHT SENSOR
ROHAIDA MOHAMMAD1; DARIUS EL PEBRIAN1*; MOHAMMAD ANAS AZMI1 and EZRIN MOHD HUSIN2
ABSTRACTThis study was conducted to identify and visualise spatially the Nitrogen (N) status on immature oil palm area with an autopilot tractor-mounted active light sensor (ALS) in a Malaysian oil palm plantation. All the measurements taken by the ALS were assessed ‘on-the-go’ at every second while the tractor was moving on the field with autopilot steering mode. The N status was analysed based on 46% of the N content in urea and 40 kg ha–1 N application rate for a standard fertiliser requirement for immature oil palm. The ordinary kriging method was used to produce the interpolated maps of the N status by means of the ArcGIS 10.3 software. It was found that mean N-as applied rate per hectare read by the sensor was 1.62% lower than the recommended one. By showing such very small difference in mean rates, generally, the system showed its effectiveness in monitoring N status on immature oil palm. The interpolated maps also successfully displayed spatial variability of the N status on immature oil palm area, which are useable for reference in applying variable rate application (VRA) to economise the use of fertiliser on the said crop.
Keywords: active light sensor (ALS), autopilot tractor, N fertiliser.
Received: 22 June 2020; Accepted: 26 January 2021; Published online: 7 April 2021.
1 Faculty of Plantation and Agrotechnology, Universiti Teknologi MARA Melaka, 77300 Jasin Campus, Merlimau, Melaka, Malaysia.
2 Smart Farming Technology Research Center, Universiti Putra Malaysia, 43400 UPM Serdang, Selangor, Malaysia.
* Corresponding author e-mail: [email protected]
INTRODUCTION
Since its early introduction, agricultural mechanisation has been proving its role in helping the farmers to improve the productivity of operations in farmland. The Food and Agriculture Organization (FAO, 2014) stated that agricultural mechanisation has changed power source in agriculture from human to tractor. The change has enabled expanding the areas and capacity of operation to maximise productivity. Through its significant role since the past centuries, Bello
(2012) added that agriculture mechanisation was recognised as one of the greatest engineering achievements of the 20th century.
Through the years, the agricultural mechanisation technology is being continuously enriched. The advancement of today’s modern technology has allowed tractor to be equipped with the autopilot system. This automatic-auto guidance steering in driving the tractor gives various benefits to the farmers. The use of automatic-auto guidance steering can improve performance such as tillage, planting operation and soil compaction. This technology also has been claimed to be capable of reducing overlaps of tractor passes in the field, increasing the tractor speed during operation and extending workdays by giving the greatest flexibility in working hours and hiring labour. It also gives more appropriate placement inputs in crop production (Bechar and Vigneault, 2016; 2017; Lipinski et al., 2016). A study on cotton planting

630
JOURNAL OF OIL PALM RESEARCH 33 (4) DECEMBER 2021
ARTICLE IN
PRESS
ARTICLE IN
PRESS
ARTICLE IN
PRESS
ARTICLE IN
PRESS
conducted by Bergtold et al. (2013) showed that the distance between the plants rows and tillage passes were accurately maintained, and the number of planted cotton seeds were also reduced by as much as 24%-52% and the net revenues from cotton yields were increased by as much as 38%-83% as well. They also added that an economic analysis of on-farm adoption showed that the auto-guidance systems with an accuracy of less than 2.5 cm may be the most profitable for larger farms, while systems with less than 10 cm accuracy may provide a better economic alternative for smaller farms.
The Nitrogen (N)-sensor made by Yara International (2015) is a common active light sensor (ALS) system mounted on tractor roof. The sensor was developed to determine the crop N status and to enable variable-rate fertilisation ‘on-the-go’. The determination was made by measuring the light reflectance properties that were reflected from crop canopies. The N-sensor technology also could estimate biomass and N demand of a crop from different wavelength levels of the reflected light. N is an integral part of chlorophyll, hence, the N supplies must be adequate for favourable crop growth conditions. N is a key element for photosynthesis, respiration, and transpiration since it is included amino acid, proteins, and nucleic acid. The losses of N due to leaching, surface run-off, denitrification, volatilisation and ammonium fixation by clay minerals will strongly affect the crop nutrient uptake. Thus, it may also delay crop production for up to 36 months (Goh and Harter 2003). While, Amirruddin and Diyana (2017) mentioned that chlorophyll contents of crop leaves were strongly affected by N status. Therefore, reviewing the above-mentioned literatures, it is highly recommended to apply fertiliser at the right rate because it is not only able to reduce the production costs, but also to sustain maximum yield.
Laboratory analysis methods such as Kjeldahl digestion and Dumas combustion (Muñoz-Huerta et al., 2013) had been commonly used for N analyses. However, these analyses are destructive to the sample and need sample pre-processing. Besides that, such analyses can cause N loss because of deficient burning. Today’s modern technology, which has embedded the farm tractor with remote sensing (RS), has created the opportunities to implement ‘on-the-go’ ALS technology for assessing foliar nutrients. This technology can overcome the limitation of the said previous methods. By adopting this technology, according to Mulla (2013), the Yara-N sensor installed on the roof of tractor has successfully determined the N status on crop based on the normalised difference vegetative index (NDVI). In fact, Samborski et al. (2009) mentioned that the use of such sensor also has overcome the limitation of the chlorophyll meter in directly estimating the crop N status.
The tractor-mounted N-sensor has been widely used to determine the real-time N status on crops since it was introduced in Germany as its country of origin, in the last two decades. Singh et al. (2015) used tractor-mounted N-sensor to develop an algorithm for N application on locally recommended wheat crop in India. Molin and Port (2010) mapped the variability of N uptake and biomass production on sugarcane planted in Brazil by using tractor-mounted N-sensor. Also, in Brazil, Bragagnolo et al. (2013) evaluated the efficiency of an optical crop sensor to assess the nutritional status of corn. Tremblay et al. (2008) investigated the performances of two commercial N-sensors to assess the status of N in spring wheat and maize cultivation in Canada. Elsayed et al. (2015) compared the performance of active and passive reflectance sensors that were mounted on a frame in front of a tractor to assess the normalised relative canopy temperature and grain yield of drought-stressed barley cultivars in South-Western Germany.
The above-mentioned past studies mostly focused on the use of this technology on cereal crops and annual crops. This is in line with the main intended use of the sensor by the manufacturer from its country of origin, which focused on winter wheat, oilseed rape, maize and barley during early growth stages (Yara International, 2015). This might be also because most of the canopy height of annual crops or cereal crops are shorter than the sensor height that is mounted on the tractor roof. As reported by Sharma et al. (2012) and Singh et al. (2015), the tractor-mounted ALS N-sensor height ranged from 1.60-2.74 m from the ground. Majority of annual crops or cereal crops height are below the range. Thus, assessment of N-status on annual crops and cereal crops in the fields are more easily performed rather than on perennial tree crops, which are usually as tall plants. In Malaysia, Husin (2017) reported that the use of this technology has been initiated to monitor N status in paddy field through a research platform. It was successfully operated by means of a tractor driven by manual steering.
Despite this technology has been claimed to have potential for use on cereal crops and annual crops, nonetheless, as far as we know no one has studied its use on perennial tree crop such as oil palm. Thus, evaluation of this technology for use on oil palm has become a prime interest. It is a fact that oil palm characteristics and its cropping system is very much different from that of the winter wheat, oilseed rape, maize and barley, which the sensor has been applied on. Thus, its new potential for use on oil palm can be explored in an effort to enhance the field operations in Malaysian plantations to be always integrated with the updated technology. As one of the industrial crops that has been planted on more than 5.7 million hectares land in Malaysia in 2016 (Kushairi et al., 2017), oil palm always

631
MAPPING THE NITROGEN STATUS ON IMMATURE OIL PALM AREA IN MALAYSIAN OIL PALM PLANTATION WITH AUTOPILOT TRACTOR-MOUNTED ACTIVE LIGHT SENSOR
ARTICLE IN
PRESS
ARTICLE IN
PRESS
needs a constant driving of the latest technology in order to remain sustainable and competitive. This is also in line with Malaysia’s aspiration to become a self-sufficient industrialised nation with a strong agricultural-based industry. Apart from that, elements of technology are important to reduce the strenuous tasks, minimise the harsh field environment, and create a better working condition in oil palm plantation as stated by Pebrian et al. (2014). Therefore, all changes and technological innovations that are relevant to oil palm should be applied to this plantation industry, particularly to suit this industry with the Industrial Revolution (IR) 4.0 era.
Thus, the study aimed to identify and visualise spatially the N status on immature oil palm area using an autopilot tractor-mounted N-ALS sensor. This study is possible to be carried out because during the early growth stages (immature palms), the palm height is reachable by the sensor that is mounted on the tractor roof. The outcomes of this study would be able to contribute towards strengthening the integration of technology elements in fertiliser application, especially in variable rate application (VRA) to economise the use of fertiliser on oil palm. Besides that, it also promotes the utilisation of precision agriculture technology through the use of autopilot tractor and real-time sensor to the oil palm industry.
MATERIALS AND METHOD
Experimental Area and Equipment
The data was comprehensively collected through a field experiment in an oil palm plantation at Kempas estate, Jasin, Melaka, Malaysia. The estate is operated under the management of Sime Darby Plantation Berhad. The sensed object was the immature oil palm (Elaies guineensis) planted on 4.5 ha land of Bungor soil series. The experimental area is on the coordinates of N 02⁰15.414” and E 102⁰27.718”. The immature oil palm was purposely chosen as the sensed object because of such comprehensive field experiment has never been conducted directly in any oil palm plantation in Malaysia. Another reason was that the immature oil palm height was accessible by 2.74 m maximum height of the tractor-mounted ALS N-sensor as previously reported. The sensor, however, is not appropriate for assessing N status on the mature palms with height varying from 10-20 m. Aside from that, early identification of N status during immature stage in oil palm growth is the best approach for fertilisation management practice.
In the study area, the palms were comprised of dura x pisifera (DxP) variety at 24 months old and planted in the field in a triangular spacing at
9 m × 9 m × 9 m in accordance with common standard of planting arrangement. Soil texture on most of the experimental plots were identified as clayey texture. Such texture is categorised under low organic matter content. This was in agreement with Gasim et al. (2011), who stated that clayey texture was characterised by low organic matter. Hence, the soils had also low pH and low electrical conductivity (EC). The slope ranging from flat to undulating with an average slope of 9°. The study was carried out in the dry season in November 2019 under an average of 32°C daily ambient temperature. The weather was hot and cloudy with haze as forest fires occurring in a neighbouring country due to regional and seasonal severe weather phenomena at the time.
A TD5.75 New Holland tractor at 75 horsepower engine size that was equipped with an autopilot system consisting of Trimble® EZ-Pilot® Steering System and Trimble® FmX®2050 Plus Application were used as the main components of the system. The Yara N-sensor was integrated into the system to examine the N status. The specifications of the tractor and the autopilot-automated steering system are shown in Tables 1 and 2. Whilst, the description of Yara N-sensor is presented in Table 3.
Experimental Procedure
The field experiment was carried out on 300 m × 150 m plot size. The plot was divided into three sub-plots to repeat the field experiment for three replications (Figure 1). Each replication had eight tractor passes; hence, the whole experimental plots had 24 tractor passes. At the start of the experiment, the palm trees were just transplanted to the field from the nursery. Being newly transplanted, the palms in the field have not received any fertiliser. Therefore, the N content on the crops originally came from the nursery treatment and the natural sources.
The Yara ALS was attached on the roof of the tractor and operated to determine N status on the crop in the study area (Figure 2). The determination of N status on immature palms started at the first pass and ended at the 24th pass. Throughout the operation, the tractor was driven with autopilot steering mode, and the engine speed was set at 2000 rpm. Before commencing the field experiment, an agronomic calibration was done manually on the onboard sensor display. In this calibration, the values of 40 kg ha–1 N for a standard application rate on immature oil palm and 46% N content in urea fertiliser as recommended by Ng (1979) were entered into data processing unit of the onboard computer. These values were assigned to be reference rate for the sensor since the reference rate for N application on oil palm is not listed in the sensor library. Actually, the sensor has been calibrated by its manufacturer, but for the N

632
JOURNAL OF OIL PALM RESEARCH 33 (4) DECEMBER 2021
ARTICLE IN
PRESS
ARTICLE IN
PRESS
ARTICLE IN
PRESS
ARTICLE IN
PRESS
application rates on selective crops only (i.e. wheat, oilseed rape, barley, maize). Therefore, only these crops are available in the sensor library. Whereas, calibration for N application rates on other crops, which are not listed in the sensor library has be to carried out manually. By putting the values of 40 kg ha–1 N application rate for immature oil palm and 46% N-content in urea fertiliser into the computer,
the ranges of application rates can be set as the maximum (69-75 kg ha–1) and minimum (9.3-10.1 kg ha–1). During mapping of the N status, the terrain elevations were also measured simultaneously by using the Global Navigation Satellite System (GNSS) embedded to the tractor. Figure 3 shows the schematic of sensing operation in the field by the N-sensor.
TABLE 1. SPECIFICATION OF TRACTOR
Section of tractor Component Numbers or specification
Engine Number of cylinder/aspiration/valves Emission level Capacity Rated horsepower-ISO TR 14396 – ECER120Rated engine speedMaximum torque – ISO TR14396Fuel tank capacityService intervals
4/T1/2Tier 33 908 cm3 56/752 300 rpm298 @ 1 400110 litres300 hr
Hydraulic Main pump flowMega flow pump flowSteering and services pump flow (mechanical/hydraulic shuttle)
36 litres min–1
48 litres min–1
29 litres min–1
Remote valves Type Maximum number rear valve Maximum number midpoint mount valves
Deluxe 32
Linkage Maximum lift capacity of ball endMaximum lift capacity through the range(610 mm behind ball ends)
3 565 kg2 700 kg
TABLE 2. SPECIFICATIONS OF AUTOPILOT MECHANISM
An aspect of the autopilot mechanism Component Specification
Brand Trimble Steering system and plus integration
Steering Steering motor
Connector
SAM – 200 steering motorIMD – 600 to SAM 200 CANPower cable
System DC power Processor Storage
Supplied by TW-200, 27 volts, 35 amps1 GHz quad corePrimary embedded memory – 32 GB
Mechanical Dimension Weight Mount
312 × 214 × 45 mm (plus connector)2.5 kg 4 MP screws on 75 mm centres
Housing Material Environmental rating
Magnesium IP55
Connections USB (1 sider facing, 1 rear facing)Ethernet (vis TM-200) CAN (source 5VDC)Port Expender (optional)HDMI output
USB 2.0RJ45 connector RJ11 connector1 port for CAN Bus, I/O and serialDVI connector
Temperature Operation Storage
0oC-65oC- 40oC-85oC
LCD Display SizeTouchscreen Resolution Brightness (adjustable)
307 mmProtection capacitive touch1 280 × 8001 000 candela m–3
Front facing camera Type Resolution
Low light level, colour1.3 megapixel
Note: CAN - controller area network; CAN Bus - controller area network bus; I/O - input/output; DVI - digital visual interface.Source: Trimble (2014a; 2014b).

633
MAPPING THE NITROGEN STATUS ON IMMATURE OIL PALM AREA IN MALAYSIAN OIL PALM PLANTATION WITH AUTOPILOT TRACTOR-MOUNTED ACTIVE LIGHT SENSOR
ARTICLE IN
PRESS
ARTICLE IN
PRESS
TABLE 3. DESCRIPTION OF N-ACTIVE LIGHT SENSOR
Yara active light sensor aspect Description
N-sensor and mounting N-sensor was mounted on the top of a multi-utility vehicle, has a conditioner cabin, providing the adequate working temperature to the operator
Consist Fibre optics and a microprocessor in a hard shell, placed on the roof tractor, two diode spectrometers – one spectrometer analysed crop reflectance received by four lenses with an oblique view on to the crop spectrometer and the second spectrometer was used to measure irradiance of ambient light for permanent correction of the reflectance signal to ensure stable measurement (two on each side of the vehicle)
Scanned Both sides of the vehicle during its movement in the crop, the measurements were taken on the crop from four different angles
Connected Global positioning system (GPS) – Signal to allow location, sensor and application information to be plotted enabling the production of biomass and Nitrogen application map for field
Spectrometer collects reflectivity Its spectrometers analysed crop light reflectance received and another one was used in estimated the irradiance conditions. The whole process of determining the crop’s Nitrogen requirement and apply at the correct fertiliser rate happened instantaneously with no time delay
Source: Sharma et al. (2012) and Singh et al. (2015).
Figure 1. Field experimental layout of operation of autopilot tractor-mounted N-sensor.
Figure 2. Autopilot tractor-mounted N-sensor is assessing N status on the immature palms in the study area.
Replication 3(1.5 ha)
Replication 1(1.5 ha)
Replication 2(1.5 ha)
150 m
300 mPoint A
Point B
Source: Yara International (2015).
Figure 3. The schematic of sensing operation in the field by the N-sensor.
Data Processing
The data obtained from the sensor were transferred online to the Sensor Office website (www.sensoroffice.com) for generating spatial variability maps sensor. In the Sensor Office, the biomass index and N-application were processed to generate the intended parameters, which
consisted of N recommended, N as-applied and biomass index. Data processing in the Sensor Office website began with the extraction of collected data by its software. The collected data points were converted into raster maps of selected parameters (N recommended, N as-applied, biomass). The N recommended map indicates the rate of N that has been recommended for the crop in an area. Usually
sensed area
sensed area
N-sensor

634
JOURNAL OF OIL PALM RESEARCH 33 (4) DECEMBER 2021
ARTICLE IN
PRESS
ARTICLE IN
PRESS
ARTICLE IN
PRESS
ARTICLE IN
PRESS
the plantation managers have already known the recommended rate for fertiliser application on his crop. While, the N as-applied map shows the actual rate of N as- applied or N as-placed on the crop either by means of manual or mechanical systems. Normally, the result of fertilising operation is expressed as the rate as-applied. The biomass map shows the matter derived from oil palm. Biomass can indicate the availability of N, thus, the more the biomass, the high is the availability of N, or vice versa.
The CardWriter in the software was used to convert (.log) file format to (.csv)/ excel file format. Having these files, the raw data can be viewed in excel format. The fertiliser and biomass were expressed in kg per hectare. Sensor Office software actually also provided raster maps to be used for spatially variable information or prescription maps. These prescription maps can be used optionally to control the application rate. The sequent command menu for creating raster maps in Sensor Office software are as follows: (1) Sensor Office, (2) Services, choose file (.log file), (3) Start Demo, (4) Tick/untick Parameters, (5) Point data preview creates a raster map with square raster cells, (6) Next and (7) Report.
Figure 4 shows the sequences of data processing in the Sensor Office software.
All the data of N recommended, N as-applied, biomass index and elevation were used for further analysis and visualisation of N status. The ArcGIS 10.3 software was then used to generate raster maps by converting (.log) file format to (.csv) file. The identified spatial variability maps were generated by using the interpolation method with a spherical model in an ordinary kriging method. The Kriging Model classes define the kriging method and its parameters that will be used in a kriging interpolation. Ordinary kriging is most commonly used among the kriging methods and is the default. It assumes that the constant mean is unknown because the advanced parameters for lag size and the variogram parameters for major range, partial sill and nugget are not determined. The default parameter values are determined by the wizard in the software, unless there is a scientific reason to reject the mean.
In the data processing, the data input (.xls and .csv files) from the Global Positioning System (GPS) receiver on the New Holland TD 5.75 tractor was run in Toolbox of ArcMap interface. Its data
Figure 4. Sequence of generating maps through Sensor Office software.
Journal of Oil Palm Research DOI: https://doi.org/10.21894/jopr.2021.0000
3
Step 1. From the web: www.sensoroffice.com choose “Start Demo”.
Step 2. Select log-files. Tick/Untick at the parameters before proceeding “Next”.
Step 3. Point Data Preview. The raster map with square raster cells, then clicking the
“Next” button.
Journal of Oil Palm Research DOI: https://doi.org/10.21894/jopr.2021.0000
4
Step 4. Clicking “Report”. The layout can be edit before saving as PDF format.
Figure 4. Sequence of generating maps through Sensor Offices Software. 20 21
22
Step 1. From the web: www.sensoroffice.com choose “Start Demo”.
Step 2. Select log-files. Tick/untick at the parameters before proceeding “Next”.
Step 3. Point data preview. The raster map with square raster cells, then clicking the “Next” button.
Step 4. Clicking “Report”. The layout can be edited before saving as PDF format.

635
MAPPING THE NITROGEN STATUS ON IMMATURE OIL PALM AREA IN MALAYSIAN OIL PALM PLANTATION WITH AUTOPILOT TRACTOR-MOUNTED ACTIVE LIGHT SENSOR
ARTICLE IN
PRESS
ARTICLE IN
PRESS
consisted of latitude and longitude (X-axis and Y-axis) coordinates. The raster maps with World Geographical System (WGS) 1984 coordinates were transformed into Kertau Zone 48N of Universal Transverse Mercator (UTM) in XY-plane of Cartesian coordinates for converting into the specific current coordinates system in Malaysia. In simple steps, development of spatial variability maps with ordinary kriging method was made by clicking the sequent menu as follows: (1) Projected Coordinate System, (2) UTM, (3) Kertau UTM Zone 48N, (4) Data Display in meter unit, (5) ArcCatalog, (6) Shapefile, (7) Start Editing, (8) Add New Field to the table attributes, (9) Calculate Geometry. For the ArcToolbox, (10) Spatial Analysist Tools, (11) Interpolation, (12) Kriging, (13) Properties at Symbology, (14) Map display in label view, (15) Layout view to edit, (16) Insert legend items, (17) Complete map can be saved in .jpeg format by export map.
Through the parameters selected, the N-sensor produced three types of raster maps namely N recommendation map, N as-applied map and biomass map. Then, the interpolated maps of N-and biomass status can be grouped in table classes by means of classification command in ArcGIS software. The classification in ArcGIS 10.3 was generated by clicking the sequent menu: (1) Layer properties, (2) Symbology (3) Classification (4) Method (5) Classes (6) Break value. Generally, the table was classed as very low, low, moderate, high and very high ranges. Lastly, the raster maps can be printed out or saved as a PDF file. This file is required to support the vector and raster graphics in a single compacted file. On top of that, PDF file provides a document that can be printed or viewed on-screen. Also, PDF file allows the users to interact with the map content and monitor the field work by using smartphone or tablet.
Elevation was automatically collected by the instrument that was embedded on the tractor with autopilot-automated steering system. Therefore, while moving in the field for assessing the N, at the same time the tractor also recorded data points of elevations by using the optical sensor embedded on the navigation system of autopilot tractor and connected to a GNSS. This recorded georeferenced data was then imported to Geographic Information System (GIS). The ArcGIS 10.3 software was used to track the saved data during the operation. In ArcGIS 10.3 software, the elevation data was expressed in meter unit, and its map can be presented either in the 2D or 3D maps with contour lines made according to the class value of elevation as displayed in the interpolated map. In the study area, the elevations ranged from 20-36 m with 3 m contour interval on the interpolated map. Figure 5 shows flowchart of method used in data collection and analysis in the study.
RESULTS AND DISCUSSION
Spatial Variability of N Status and Biomass Index
The tractor-mounted N-sensor (Yara ALS) had successfully mapped the N and biomass status on the immature oil palms area. The spatial variability of N status on the maps were classed by using the raster data set colour maps function in the ArcGIS 10.3 software. Three types of maps along with their class ranges were developed by using the classification command in ArcGIS. As previously described, the N and biomass index status were mapped into N recommended map, N as-applied map and biomass map.
Determination of N rate for oil palm under the planting density of 136-148 trees per hectare can be grouped into minimum and maximum rates. The minimum rate ranged between 9.3-10.1 kg ha–1 of N and given at first year of field planting. The maximum rate, at 69-75 kg ha–1 and 77-87 kg ha–1 were given at the second year and third year, respectively. Ng (1977) mentioned that the reference N rate for oil palm in age (0-3 years) is 40 kg ha–1. In this study, the immature oil palms were at the second years of growth stages (Table 4 ).
TABLE 4. ESTIMATION OF NITROGEN UPTAKE AND BIOMASS INDEX FOR OIL PALM IN MALAYSIA
Year of planting Nitrogen(kg palm–1)
Biomass(kg palm–1)
First 0.068 6.85Second 0.509 57.3Third 0.586 70.4
Source: Ng (1979).
Figure 5. Flowchart of the method used in the study.
Establish experimental design
Calibrate sensor
Collect data with calibrated sensor
Create maps based on the collected data by using Sensor Office software
Convert the .log file to csv/excel file with CardWriter
Develop geostatistical interpolation maps with the Kriging method by using ArcGIS 10.3

636
JOURNAL OF OIL PALM RESEARCH 33 (4) DECEMBER 2021
ARTICLE IN
PRESS
ARTICLE IN
PRESS
ARTICLE IN
PRESS
ARTICLE IN
PRESS
The summary outputs of sensor maps in N recommended map and N as-applied map are presented in Figures 6 and 7, respectively. Generally, the N status in this study area was sufficient based on the reference rate. The map showed that the areas receiving the minimum application rates (40 kg ha–1 and below) of N was only 1.80 ha or 39.9% of total assigned areas, while the rest obtained the maximum rates. Therefore, the area receiving minimum application rates need more N fertiliser supply because the content of N was below the recommended values.
The nutrient uptake for immature oil palms especially during the first three years after planting in the field is very important to be recorded. This is because the nutrient requirements for oil palm growth vary at different ages. Ng (1979) stressed that the estimation of annual biomass production and N uptake by the oil palm in Malaysia can be recommended per palm basis in kg palm–1. His study concluded that the immature oil palms needs the fertiliser ranging from 10-90 kg N ha–1. He also added that urea fertiliser with 46% of N content is normally used for fertilising oil palm.
The output also showed that the mean N recommended rate per hectare was 43.1 kg ha–1,
and the mean total N recommended rate for the whole areas was 193.9 kg (Table 5). While, the mean N as-applied rate per hectare was 42.4 kg ha–1 and the total applied rate was 190.8 kg (Table 6). The difference between the mean recommended rate and the mean as-applied rate per hectare was very small. The mean as-applied rate was found to be 0.7 kg ha–1 (1.62%) lower than the mean recommended one. The same phenomena also happened with the mean total as-applied rate for the whole area. The total as-applied rate for the whole area was 3.1 kg (1.60%) lower than the recommended one. Generally, the differences between N-recommended and N-as applied rates were very small and considered as not significant. These results proved that the N-sensor was able to work effectively in identifying and visualising the N status on the immature palms at the study area. N fertiliser stimulates vegetative growth for well-developed fruits formation, flowering and assimilation of the crop (Gianquinto et al., 2013). Consequently, the lack of N fertiliser can cause a decrease in plant productivity and yields (Jifon and Whaley, 2005) and the crops will become chlorotic as shown by yellowing leaves colour and stunted appearance.
Figure 7. Nitrogen as-applied map.
Figure 6. Nitrogen recommended map.
Journal of Oil Palm Research DOI: https://doi.org/10.21894/jopr.2021.0000
6
Figure 6. Nitrogen recommended map. 37
38
39
40
Figure 7. Nitrogen as-applied map. 41
42
Replication 3Replication 1 Replication 2
<20 (8.1%)
20-30 (12.0%)
30-40 (19.8%)
40-50 (24.2%)
50-60 (25.0%)
>60 (10.9%)
Journal of Oil Palm Research DOI: https://doi.org/10.21894/jopr.2021.0000
6
Figure 6. Nitrogen recommended map. 37
38
39
40
Figure 7. Nitrogen as-applied map. 41
42
kg N ha–1
Journal of Oil Palm Research DOI: https://doi.org/10.21894/jopr.2021.0000
6
Figure 6. Nitrogen recommended map. 37
38
39
40
Figure 7. Nitrogen as-applied map. 41
42
Replication 3Replication 1 Replication 2
Journal of Oil Palm Research DOI: https://doi.org/10.21894/jopr.2021.0000
6
Figure 6. Nitrogen recommended map. 37
38
39
40
Figure 7. Nitrogen as-applied map. 41
42
kg N ha–1
<20 (7.4%)
20-25 (4.1%)
25-30 (7.5%)
30-35 (9.3%)
35-40 (11.5%)
40-45 (11.3%)
45-50 (13.4%)
50-55 (16.1%)
55-60 (9.6%)
>60 (9.7%)

637
MAPPING THE NITROGEN STATUS ON IMMATURE OIL PALM AREA IN MALAYSIAN OIL PALM PLANTATION WITH AUTOPILOT TRACTOR-MOUNTED ACTIVE LIGHT SENSOR
ARTICLE IN
PRESS
ARTICLE IN
PRESS
TABLE 5. SUMMARY OF NITROGEN RECOMMENDED MAP
Date of application 18 November 2019
Area 4.5 ha
Growth stage Immature oil palm
Mean application rate 43.1 kg ha–1
Total application rate 193.9 kg
TABLE 6. SUMMARY OF NITROGEN AS-APPLIED MAP
Date of application 18 November 2019
Area 4.5 ha
Growth stage Immature oil palm
Mean application rate 42.4 kg ha–1
Total application rate 190.8 kg
This sensor also identified the mean biomass index (Figure 8). The recorded mean biomass was 10.6 kg ha–1, while the total for whole area was 48.1 kg (Table 7). The portion of areas with minimum and maximum biomass were 8.3% and 6.4%, respectively. The recorded biomass in the study area was confirmed to be considerably lower when compared to the average ground biomass in the more mature palms with a mean of 65.9 ± 8.7 mg ha−1 11 years after planting and 56.04 ± 12.0 mg ha−1 after 12 years after planting as studied by Lewis et al. (2020) in deep peat soil oil palm plantation in Sarawak, Malaysia. The differences in size and height of the immature and the mature oil palms have caused their average amount of ground biomass to be also different. Lewis et al. (2020) reported, the palm trunk makes the largest contribution (33%-46%) to the total palm dry weight particularly in the young mature palms (8 years after planting) and mature palms (12 years after planting), followed by frond base which contributes 13%-32% of the overall biomass. This is agreeing with Poorter et al. (2015), who stated that biomass relates to the total size of the plant. This statement is also supported by Yang et al. (2017). They mentioned that there is a good relationship between plant height and biomass by showing biomass increases as plant height increases.
TABLE 7. SUMMARY OF BIOMASS INDEX
Date of application 18 November 2019
Area 4.5 ha
Growth stage Immature oil palm
Mean biomass 10.6 kg ha–1
Total biomass 47.7 kg
Relationship of N Status and Elevation
Table 8 summarises the N recommended, N as-applied and biomass status on immature oil palms using the classification statistics command
in ArcGIS 10.3 software shown in Figures 9, 10 and 11. A total of 5126 points were taken for determining the recommended N fertiliser. Based on the points, it was found that the recommended minimum and maximum values were 11.33 kg ha–1 and 86.75 kg ha–1, respectively. Table 9 shows the recommended ranged of N rate starting from very low (11.3-20.0 kg ha–1) to very high (80.1-90.0 kg ha–1). A total of 5467 points were analysed for determining the N as-applied. Table 10 describes that the very low range of the N as-applied was 11.0-20.0 kg ha–1 and while very high ranged in between 80.1-90.0 kg ha–1. The biomass index was recorded at 5040 points. Table 11 shows biomass accounted to 5.0-10.0 kg ha–1 was categorised as very low range, whereas very high range was in between 40.01-63.0 kg ha–1.
TABLE 8. SUMMARY OF NITROGEN RECOMMENDED, NITROGEN AS-APPLIED, BIOMASS INDEX AND
ELEVATION BY USING A CLASSIFICATION STATISTICS
Nitrogen recommended
(kg ha–1)
Nitrogen as-applied(kg ha–1)
Biomass index
(kg ha–1)
Elevation (m)
Minimum 11.33 11.94 5.04 20.40Maximum 86.75 86.75 62.73 36.20Mean 46.66 46.76 9.97 29.95Standard deviation 12.55 12.56 3.98 3.21
Coefficient of variance (%) 26.90 26.86 39.89 10.72
TABLE 9. CLASSIFICATION OF NITROGEN RECOMMENDED
Class Recommended rate (kg ha–1)Very high 80.1 - 90.0High 60.1 - 80.0Moderate 40.1 - 60.0Low 20.1 - 40.0Very low 11.3 - 20.0
TABLE 10. CLASSIFICATION OF NITROGEN AS-APPLIED
Class As-applied rate (kg ha–1)Very high 80.1 - 90.0High 60.1 - 80.0Moderate 40.1 - 60.0Low 20.1 - 40.0Very low 11.9 - 20.0
TABLE 11. CLASSIFICATION OF BIOMASS INDEX
Class Biomass index (kg ha–1)Very high 40.01 – 63.0High 30.1 – 40.0Moderate 20.1 – 30.0Low 10.1 – 20.0Very low 5.0 – 10.0

638
JOURNAL OF OIL PALM RESEARCH 33 (4) DECEMBER 2021
ARTICLE IN
PRESS
ARTICLE IN
PRESS
ARTICLE IN
PRESS
ARTICLE IN
PRESS
Journal of Oil Palm Research DOI: https://doi.org/10.21894/jopr.2021.0000
7
43
Figure 8. Biomass map. 44
45
46
47
48 Figure 9. Spatial distribution of available Nitrogen on immature oil palms. 49
50
Replication 3Replication 1 Replication 2
Biomass<6.5 (8.3%)6.5-7.0 (6.0%)7.0-7.5 (6.9%)6.5-8.0 (6.8%)8.0-8.5 (7.0%)8.5-9.0 (7.6%)9.0-9.5 (8.2%)9.5-10.0 (7.8%)10.0-10.5 (6.9%)10.5-11.0 (5.6%)11.0-11.5 (4.7%)11.5-12.0 (3.8%)12.0-12.5 (2.4%)12.5-13.0 (2.1%)13.0-13.5 (1.6%)13.5-14.0 (1.2%)14.0-14.5 (1.2%)14.5-15.0 (0.9%)15.0-15.5 (0.8%)15.5-16.0 (0.8%)16.0-16.5 (0.5%)16.5-17.0 (0.6%)17.0-17.5 (0.6%)17.5-18.0 (0.4%)18.0-18.5 (0.5%)18.5-19.0 (0.6%)>19.0 (6.4%)
Journal of Oil Palm Research DOI: https://doi.org/10.21894/jopr.2021.0000
7
43
Figure 8. Biomass map. 44
45
46
47
48 Figure 9. Spatial distribution of available Nitrogen on immature oil palms. 49
50
Figure 9. Spatial distribution of Nitrogen recommended on immature oil palms.
Figure 10. Spatial distribution of Nitrogen as-applied on immature oil palms.
Figure 8. Biomass map.
As-applied kg ha–1
Kringing_AUTO_AS_REDO<VALUE>
Journal of Oil Palm Research DOI: https://doi.org/10.21894/jopr.2021.0000
8
51
Figure 10. Spatial distribution of as-applied Nitrogen on immature oil palms. 52
53
54
55 Figure 11. Spatial distribution of available biomass index on immature oil palms. 56
57
11.9-20.020.1-40.040.1-60.060.1-80.080.1-90.0
Journal of Oil Palm Research DOI: https://doi.org/10.21894/jopr.2021.0000
8
51
Figure 10. Spatial distribution of as-applied Nitrogen on immature oil palms. 52
53
54
55 Figure 11. Spatial distribution of available biomass index on immature oil palms. 56
57
50 25 0 50 m
Nitrogen kg ha–1
Kringing_AUTO_N_REDO<VALUE>
Journal of Oil Palm Research DOI: https://doi.org/10.21894/jopr.2021.0000
7
43
Figure 8. Biomass map. 44
45
46
47
48 Figure 9. Spatial distribution of available Nitrogen on immature oil palms. 49
50
11.3-20.020.1-40.040.1-60.060.1-80.080.1-90.0
Journal of Oil Palm Research DOI: https://doi.org/10.21894/jopr.2021.0000
7
43
Figure 8. Biomass map. 44
45
46
47
48 Figure 9. Spatial distribution of available Nitrogen on immature oil palms. 49
50
50 25 0 50 m
TABLE 12. CLASSIFICATION OF ELEVATION FROM GNSS ATTACHED TO THE TRACTOR
Class Elevation range (m)Very high 33.0 - 36.0High 29.0 - 33.0Moderate 26.0 - 29.0Low 23.0 - 26.0Very low 20.0 - 23.0
Note: GNSS - Global Navigation Satellite System.
Table 12 displays the measured elevation by GNSS attached on the tractor. The marked 3237 points gave the elevations which ranged from very low to very high. The minimum and maximum elevations in the study area were 20.40 m and 36.20 m above sea levels, respectively and the mean elevation was 29.95 m. The coefficient of variance (CV) for N-recommended, N as-applied, biomass index and the elevation were 26.90%, 26.86%, 39.89% and 10.72%, respectively.

639
MAPPING THE NITROGEN STATUS ON IMMATURE OIL PALM AREA IN MALAYSIAN OIL PALM PLANTATION WITH AUTOPILOT TRACTOR-MOUNTED ACTIVE LIGHT SENSOR
ARTICLE IN
PRESS
ARTICLE IN
PRESS
A relationship between the N status and the terrains elevations was discovered based on the spatiality maps. Figure 12 and Table 9 indicate that the amount of N content ranged from very low to very high. Very low N content was found at rows 1, 20 and 23 (in the range of 11.3-20.0 kg ha–1). This situation was related to the differences in elevations of these rows. As shown in Figure 12 and Table 9, the second replication and third replication; which started at the 10th row, onwards, the highest ranges of elevation were 33-36 m, followed by 26-29 m and 29-33 m above sea levels. Such areas experienced low N spatial distribution 20.1-40.0 kg ha–1 as the areas were located at higher elevations than the others. Thus, the areas situated on higher elevation may cause higher losses of N fertiliser. This condition happened due to leaching, surface run-off, denitrification, volatilisation and ammonium
fixation that strongly affect nutrient uptake. This is agreeing with Zhang et al. (2011), who stated that N mineralisation and nitrification rates decreased with increasing altitude. Previous studies in forest soils also showed the N mineralisation or nitrification rates were reduced by increasing altitude (Hart and Perry, 1999; Kitanyanma et al., 1998; Marrs et al., 1988). It needs a specialised treatment and better management of N fertiliser application. This can be done by applying the right management practice at the right place and the right time.
CONCLUSION
Early identification of N status is the best solution for fertilisation management practices and it can be
Biomass Index (kg ha–1)Kringing_AUTO_BI_REDO<VALUE>
Journal of Oil Palm Research DOI: https://doi.org/10.21894/jopr.2021.0000
8
51
Figure 10. Spatial distribution of as-applied Nitrogen on immature oil palms. 52
53
54
55 Figure 11. Spatial distribution of available biomass index on immature oil palms. 56
57
5.0-10.010.1-20.020.1-30.030.1-40.040.1-63.0
Journal of Oil Palm Research DOI: https://doi.org/10.21894/jopr.2021.0000
8
51
Figure 10. Spatial distribution of as-applied Nitrogen on immature oil palms. 52
53
54
55 Figure 11. Spatial distribution of available biomass index on immature oil palms. 56
57
50 25 0 50 m
Figure 11. Spatial distribution of available biomass index on immature oil palms.
Figure 12. Spatial distribution of elevations on immature oil palms areas.
Journal of Oil Palm Research DOI: https://doi.org/10.21894/jopr.2021.0000
9
58
59
60
61 Figure 12. Spatial distribution of elevations on immature oil palms areas. 62
63
64
65
66
67
68
69
70
71
72
73
Replication 1
Replication 2
Elevation
33-36 29-33 26-29 23-26 20-23
N
Replication 3

640
JOURNAL OF OIL PALM RESEARCH 33 (4) DECEMBER 2021
ARTICLE IN
PRESS
ARTICLE IN
PRESS
ARTICLE IN
PRESS
ARTICLE IN
PRESS
done by using tractor-mounted N-sensor. Mapping N status on immature oil palm in Malaysian plantation using an autopilot tractor-mounted N-ALS had been successfully conducted in this study. The system has successfully mapped the spatial variability of N status on the said crop. The maps can be a reference for the oil palm plantation management to adapt the concept of VRA as one of the methods to economise the fertiliser usage in oil palm plantation. The study found that the variability of N ranged from low to high rates in the study area. These ranges occurred due to various levels of elevation of the area. Such diversity in elevations created a possibility of N leaching from the palms in the areas having higher elevations to the lower ones. Thus, application rates of N at certain areas (i.e. low and high elevation levels) must refer to N recommended map to meet the right dosage. The distribution of biomass index levels ranged from 5.0-63.00 kg ha–1, which indicated that the planted crops on the study areas having a low and moderate of N status. A difference of 0.7 kg ha–1 or 1.62% was found between mean N- as-applied and mean N-recommended rates. The same phenomena also happened with the mean total N as-applied rate for the whole areas. The total N-as applied rate for the whole areas was 3.1 kg (1.60%) lower than the recommended one. The findings also concluded that this mapping system can assist plantations in saving 0.7 kg ha–1 N fertiliser.
Generally, the study also proved that this technology is suitable to be used to monitor N status on a wide range of crops, including tree crops such as oil palm. However, its application on oil palm is only suitable during immature stage. Other than that, tractor with autopilot-automated steering can be an alternative prime mover to operate the sensor in the oil palm plantation terrain. It was observed that with hands-free driving, the autopilot tractor is able to give various assistances to the operator, especially operator comfort during driving. It is recommended to carry out further study on mapping the N status on immature oil palm with autopilot tractor-mounted N-sensor while moving on various slopes in oil palm plantations. In addition, evaluation of the sensor operated by various driving systems of tractor is also advocated.
ACKNOWLEDGEMENT
The authors are very grateful to the Sime Darby Plantation Berhad, especially to the management of Sime Darby Plantation at Kempas Estate in Jasin, Melaka, Malaysia for its continuous support as well as giving the access toward knowledge either directly or indirectly throughout the research period.
REFERENCES
Amirruddin, A and Diyana, A (2017). Nitrogen effects on growth and spectral characteristics of immature and mature oil palms. Asian J. Plant Sci., 16(4): 200-210.
Bechar, A and Vigneault, C (2016). Agricultural robots for field operations: Concepts and components. Biosyst. Eng., 149: 94-111.
Bechar, A and Vigneault, C (2017). Agricultural robots for field operations. Part 2: Operations and systems. Biosyst. Eng., 153: 110-128.
Bello, R S (2012). Agricultural Machinery and Mechanization. CreateSpace 7290 B. Inv. Drive Charl US. https://www.createspace.com/3497673, accessed on 15 January 2020.
Bergtold, J S; Raper, J S and Schwab, E B (2013). The economic benefit of improving the proximity of tillage and planting operations in cotton production with automatic steering. Appl. Eng. Agric., 25(2): 133-143.
Bragagnolo, J; Amado, T J C; Nicoloso, R S; Jasper, J; Kunz, J and Teixeira, T G (2013). Optical crop sensor for variable-rate nitrogen fertilization in corn: I - Plant nutrition and dry matter production. Rev. Bras, Ciênc., 37: 1288-1298.
Elsayed, S; Rischbeck, P and Schmidhalter, U (2015). Comparing the performance of active and passive reflectance sensors to assess the normalized relative canopy temperature and grain yield of drought-stressed barley cultivars. Field Crops Res., 177: 148-160.
FAO (2014). A Regional Strategy for Sustainable Agricultural Mechanization: Sustainable Mechanization Across Agri-Food Chains in Asia and the Pacific Region. RAP Publication 2014/24. Food and Agriculture Organization (FAO). p. 74-78.
Gasim, M B; Ismail, B S; Mir, S I; Rahim, S A and Toriman, M E (2011). The physico-chemical properties of four soil series in Tasik Chini, Pahang, Malaysia. Asian J. Earth Sci., 4(2): 75-84.
Goh, K J and Harter, D (2003). General Oil Palm Nutrition: Oil Palm: Management for Large and Sustainable Yields. Potash and Phosphate Institute, Singapore. p. 191-230.
Gianquinto, G; Munoz, G; Pardossi, G; Ramazzoti, G and Savvas, D (2013). Good Agricultural Practices for Greenhouse Vegetable Crops: Principles for Mediterranean Climate Areas. Food and Agriculture Organization (FAO). p. 205-262.

641
MAPPING THE NITROGEN STATUS ON IMMATURE OIL PALM AREA IN MALAYSIAN OIL PALM PLANTATION WITH AUTOPILOT TRACTOR-MOUNTED ACTIVE LIGHT SENSOR
ARTICLE IN
PRESS
ARTICLE IN
PRESS
Hart, S C and Perry, D A (1999). Transferring soils from high-to low elevation forests increases nitrogen cycling rates: Climate change implications. Global Change Biol., 5: 23-32.
Husin, M E (2017). Rapid nutrition mapping system for paddy field in Malaysia. Proc. of the Seminar on Data Driven Agriculture. http://itfnet.org/Download/DataDrivenAgriculture/5.pdf, accessed on 20 June 2020.
Jifon, J L; Syvertse, J P and Whaley, E (2005). Growth environment and leaf anatomy affect nondestructive estimates of chlorophyll and nitrogen in Citrus sp. leaves. J. Amer. Soc. Hort. Sci., 130(2): 152-158.
Kitanyanma, K; Aiba, S I; Lee, N M and Ohsawa, M (1998). Soil nitrogen mineralization rates of rainforests in a matrix of elevations and geological substrates on Mount Kinabalu, Borneo. Ecol. Res., 13: 301-312.
Kushairi, A; Singh, R and Ong-Abdullah, M (2017). The oil palm industry in Malaysia: Thriving with transformative technologies. J. Oil Palm Res., 29(4): 431-439.
Lipinski, A J; Markowski, P; Lipinski, S and Pyra, P (2016). Precision of tractor operations with soil cultivation implements using manual and automatic steering modes. Biosyst Eng, 145: 22-28.
Lewis, K; Rumpang, E; Kho, L K; McCalmont, J; Teh, Y A; Gallego-Sala, A and Hill, T C (2020). An assessment of oil palm plantation aboveground biomass stocks on tropical peat using destructive and non-destructive methods. Sci. Rep., 10: 2230.
Marrs, R H; Proctor, J; Heaney, A and Mountford, M D (1988). Changes in soil nitrogen-mineralization and nitrification along an altitudinal transect in tropical rain forest in Costa Rica. J. Ecol., 76: 466-482.
Molin, J P and Port, G (2010). Using an active crop sensor to detect variability of nitrogen supply on sugar cane fields. The LAP. https://www.agriculturadeprecisao.org.br/wp-content/uploads/2020/01/cgr_2010-03.pdf, accessed on 22 September 2020.
Muñoz-Huerta, R F; Guevara-Gonzalez, R G; Contreras-Medina, L M; Torres-Pacheco, I; Prado-Olivarez, J and Ocampo-Velazquez, R V (2013). A review of methods for sensing the nitrogen status in plants: Advantages, disadvantages and recent advances. Sensors, 13(8): 10823-10843.
Mulla, D J (2013). Twenty-five years of remote sensing in precision agriculture key advances and
remaining knowledge gaps. Biosyst. Engin., 114(4): 358-371.
Ng, S K (1979). Greater productivity of the oil palm (Elaies guineensis Jacq.) with efficient fertilizer practices. Proc. of the International Potash and Phosphate Institute. p. 357-376.
Ng, S K (1977). Review of oil palm nutrition and manuring. Scope for greater economy in fertilizer usage. Oleaginueux, 32: 197-209.
Pebrian, D E; Yahya, A and Siang, T C (2014) Workers’ workload and productivity in oil palm cultivation in Malaysia. J. Agric. Saf. Health, 20(4): 235-254.
Poorter, H; Jagodzinski, A M; Ruiz-Peinado, R; Kuyah, S; Luo, Y; Oleksyn, J; Usoltsev, V A; Buckley, T N; Reich, P B and Sack, L (2015). How does biomass distribution change with size and differ among species? An analysis for 1200 plant species from five continents. New Phytol., 208(3): 736-749.
Samborski, S; Marek, S; Tremblay, N and Fallon, E (2009). Strategies to make use of plant sensors-based diagnostic information for nitrogen recommendations. Agron. J., 101(4): 800-816.
Sharma, A; Singh, M and Jasper, J (2012). Investigation on tractor mounted n-sensor for wheat crop in India. Proc. of Agro-Informatics and Precision Agriculture 2012. p. 137-141.
Singh, M; Kumar, R; Sharma, A; Singh, B and Thind, S K (2015). Calibration and algorithm development for estimation of Nitrogen in wheat crop using tractor mounted N-sensor. Sci. World J., 2015(163968): 1-12.
Trimble (2014a). Trimble® EZ-Pilot® Steering System: International Harvester 86 and 88 Series Tractors. Version 5.0. Revision A. Trimble Agriculture Division. Westminster. Colorado, USA. p. 20-31.
Trimble (2014b). Trimble® TMX-2050™ Display. Version 1.075. Revision D. Trimble Navigation Limited. Sunnyvale. California, USA. p. 13-16.
Tremblay, N; Wang, Z; Ma, B; Belec, C and Vigneault, P (2008). A comparison of crop data measured by two commercial sensors for variable-rate nitrogen application. Precis. Agric., 10(2): 145-161.
Yang, G; Liu, J; Zhao, C; Li, Z; Huang, Y; Yu, H; Xu, B; Yang, X; Zhu, D; Zhang, X; Zhang, R; Feng, H; Zhao, X; Li, Z; Li, H and Yang, H (2017). Unmanned aerial vehicle remote sensing for field-based crop

642
JOURNAL OF OIL PALM RESEARCH 33 (4) DECEMBER 2021
ARTICLE IN
PRESS
ARTICLE IN
PRESS
phenotyping: Current status and perspectives. Front. Plant Sci., 8 (1111): 1-26.
Yara International (2015). Introducing the Yara N-Sensor. Complete Solution to Precision Farming. www.yara.co.uk., accessed on 15 January 2020.
Zhang, S; Chen, D; Sun, D; Wang, X; Smith, J L and Du, G (2011). Impacts of altitude and position on the rates of soil nitrogen mineralization and nitrification in alpine meadows on the eastern Qinghai–Tibetan Plateau, China. Biol. Fertil. Soils, 48: 393-400.

643
ARTICLE IN
PRESS
ARTICLE IN
PRESS
Journal of Oil Palm Research Vol. 33 (4) December 2021 p. 643-652DOI: https://doi.org/10.21894/jopr.2021.0007
EFFECT OF OPERATING TEMPERATURE ON PHYSICOCHEMICAL PROPERTIES OF EMPTY
FRUIT BUNCH CELLULOSE-DERIVED BIOCHAR
STASHA ELEANOR ROSLAND ABEL1*,3; SOH KHEANG LOH1; NOORSHAMSIANA ABDUL WAHAB1; ONDREJ MASEK2; MUSA IDRIS TANIMU3 and ROBERT THOMAS BACHMANN3
ABSTRACTThe oil palm lignocellulosic biomass is mass-produced which leads to management and disposal issue. Hence, converting it into carbonaceous material such as biochar is advantageous. One such by-products namely empty fruit bunch (EFB), comprises of 44.4 wt% cellulose, rendering it a prominent feedstock for biochar production. The study focuses on assessing the effect of pyrolysis temperatures on cellulose biochar properties and yields. The cellulose was extracted via standard method and carbonised using thermogravimetric analyser. The proximate and ultimate analyses and Fourier-transform infrared spectroscopy (FTIR) were performed to determine the biochar characteristics. Lower biochar yield, volatile matter (VM) and hydrogen contents were generated at higher temperature, whereas an opposite trend was observed for moisture, fixed carbon and ash contents. The FTIR spectra verified the presence of carboxyl, aromatic and hydroxyl groups at 250°C and 400°C; however, the bands diminished at 750°C. This work has identified that biochar produced at 250°C possesses excellent properties including higher biochar yield (32.51% ± 0.48), carbon content (57.98 wt%) and VM (38.68 wt%). High level of VM is beneficial for microbial rejuvenation, which is ideal for soil amendment. This study provides a key basis in establishing the suitable biochar properties and pyrolysis parameter for soil amendment as well as other applications.
Keywords: biochar, cellulose, empty fruit bunch, pyrolysis, thermal degradation.
Received: 15 September 2020; Accepted: 30 November 2020; Published online: 23 February 2021.
INTRODUCTION
Nowadays, heavy dependency on non-renewable fuels such as petroleum as main energy source has resulted in a severe energy calamity and degradation of the environment. As such, there has been a shift of interest in utilising biomass waste as a fossil fuel
substitute, as it emits less greenhouse gas (GHG) when combusted due to its carbon-rich characteristics comprising of cellulose, hemicellulose and lignin and thus, greatly reduces reliance on fossil fuel.
With contribution of 47% to the world’s palm oil supply, Malaysia is the second largest country to produce and export palm oil (Kushairi et al., 2019). Processing of 1 t fresh fruit bunches (FFB) generates 20%-22% crude palm oil (CPO) along with other oil palm biomass by-products including 23%-25% empty fruit bunches (EFB), 13%-15% mesocarp fibre (MF) and 5%-6% palm kernel shell (PKS). In palm oil mills, EFB is normally utilised as fuel in boilers for steam and electricity generation or incinerated for fertiliser production. However, a vast amount is still available and unutilised, hence means of disposing them cost-effectively is important (Lahijani and Zainal, 2011). Disposal of oil palm biomass solid
1 Malaysian Palm Oil Board, 6 Persiaran Institusi, Bandar Baru Bangi, 43000 Kajang, Selangor, Malaysia.
2 UK Biochar Research Centre, School of Geosciences, University of Edinburgh, Edinburgh, EH9 3FF,
United Kingdom.
3 Section of Environmental and Polymer Engineering Technology, Universiti Kuala Lumpur MICET, Lot 1988,
Taboh Naning, 78000 Alor Gajah, Melaka, Malaysia.
* Corresponding author e-mail: [email protected]

644
JOURNAL OF OIL PALM RESEARCH 33 (4) DECEMBER 2021
ARTICLE IN
PRESS
ARTICLE IN
PRESS
ARTICLE IN
PRESS
ARTICLE IN
PRESS
by-products, i.e. EFB poses challenges since they are poorly utilised which might cause several issues for instance inadequate disposal areas, unpleasant odour and gas emitted due to biomass degradation (Novianti et al., 2014). In comparison to incineration and other disposal methods, EFB can be pyrolysed and converted into a valuable product such as biochar. This provides an opportunity to utilise them cost-effectively for many different applications including soil fertility enhancement. EFB is a lignocellulosic biomass comprising of 44.4% cellulose fraction and 14%-31% lignin, in total ~60%, rendering it a great feedstock for the production of bioenergy. Among these biomass components in EFB, cellulose is frequently used to represent lignocellulosic biomass because it is a primary structural component, which makes up 40-60 wt% besides hemicellulose and lignin (Heinze et al., 2018). This cellulosic material offers enormous potential to be employed as a renewable feedstock, i.e. for biochar production due to abundant availability and low-cost.
Biochar can be used as an alternative to pure charcoal which possesses some negative impacts to the environment including GHG emissions, ozone depletion and ultimately, changing the world climate. According to Sohi et al. (2009), biochar is a stable solid form of carbon, which is capable of reducing GHG emissions and performing carbon dioxide sequestration at billion-tonne scale within 30 years. Besides, biochar can exert beneficial properties on soils such as increased cation exchange capacity (CEC), soil pH and moisture (Shafie et al. 2012), phosphorus ions and total nitrogen, promotes development of root (Chan et al. (2008), diminishes soil erosion and nutrient leaching in drought season (Lorenz, 2007). In 2015, Domene et al. conducted a 28-day soil incubation experiment by using biochar produced at different temperatures and observed that biochar-amended soil basal respiration was significantly stimulated but decreased with increasing pyrolysis temperature and increased with a higher volatile matter (VM) content. These findings suggest that a labile carbon pool exists in the biochar that is biodegradable under aerobic conditions and correlated to the VM content. The labile carbon pool is the fraction of total soil organic carbon (SOC) with the most rapid turnover rates and consists of living microbes besides soil organic matter. It fuels the soil food web and therefore greatly influences nutrient cycling for maintaining soil quality and its productivity.
Generally, the quality and biochar yield are critically impacted by several factors, namely pyrolysis temperature, biomass type, process heating rate, residence time and others. Of these, pyrolysis temperature is the most influential showing notable modification on the physical and chemical characteristics of biochar. Many studies
have been reported on converting lignocellulosic biomass, i.e., raw EFB into biochar (Aziz et al., 2015; Idris et al., 2014) but limited reports on utilising individual biomass component such as cellulose, lignin and hemicelluloses. Cellulose is the most dominant material in EFB and exhibits immense potential as a renewable feedstock, i.e. for biochar production attributable to inexpensive cost and abundant availability. Hence, the study on cellulose pyrolysis would be particularly beneficial for achieving better understanding of the biomass pyrolytic mechanism and facilitating its direct application in terms of bio-materials, chemicals, etc. To our knowledge, no recent study has utilised cellulose derived from EFB as a feedstock material to produce biochar. Hence, this study focuses to extract cellulose from raw EFB fibre and to perform pyrolysis experiments on EFBC at varied temperatures (250ºC, 400ºC and 750ºC) to evaluate the influence of operating temperature on EFBC-derived biochar properties. Besides, the biochars produced will be characterised to identify which biochar exhibits higher VM content contributing to higher labile carbon pool which is beneficial as a soil amendment to improve soil quality.
MATERIALS AND METHODS
Materials
Raw EFB fibres were sourced from a palm oil mill located at Kota Tinggi, Johor, Malaysia. All chemicals used were of analytical grade purchased from Merck, Germany. Commercial microcrystalline cellulose (Sigma Corporation, USA) was used as a control sample.
Method
Sample preparation. The EFB was washed with distilled water to eliminate contaminant prior to drying in an oven for 24 hr at temperature of 105°C. The dried EFB was then cut into small pieces and ground using fibre grinders (Retsch, model AS200, USA) and screened to a range of particle sizes between 180-250 μm.
Cellulose extraction. Extraction of cellulose from EFB was carried out according to ASTM standard method D1103-60. About 12 g of EFB was placed in a 1-litre beaker containing 480 ml distilled water, 1.5 ml acetic acid and 4.5 g sodium chlorite. The mixture was stirred on a hot plate with temperature set at 75°C. Acetic acid, 1.5 ml and 4.5 g sodium chlorite were added into the reaction mixture after 1 hr and the same amount repeated after 2 hr. The volume of water was maintained during the chlorination duration. After cooling the reaction

645
EFFECT OF OPERATING TEMPERATURE ON PHYSICOCHEMICAL PROPERTIES OF EMPTY FRUIT BUNCH CELLULOSE-DERIVED BIOCHAR
ARTICLE IN
PRESS
ARTICLE IN
PRESS
mixture to <10°C, the slurry was filtered using a 50-μm sieve filter for liquid and solid separation. The solid was then put in the petri dish and dried overnight to obtain holocellulose. Approximately 2 g of holocellulose was poured into a glass beaker together with 20 ml of cold sodium hydroxide (NaOH) (17.5% w/v) solution and stirred continuously for 5 min. Another 10 ml of NaOH (17.5% w/v) solution was added after 5 and 10 min repetitively and the mixture was allowed to stand for 30 min at 20°C. Then, 67 ml 20°C cold distilled water was put in the mixture and stirred thoroughly for 45 min with temperature maintained at 20°C before filtering. The α-cellulose extracted was washed with 50 ml of cold NaOH (8.3% w/v) twice and distilled water. Lastly, the α-cellulose was immersed in 25 ml acetic acid (10% v/v) and rinsed with distilled water prior to oven-drying at 105°C overnight to obtain a constant weight.
Biochar production. The experiment of biochar production was established by carbonising the EFBC via a thermogravimetric analyser (TGA 701 LECO, USA) at three different thermo-chemical conditions: 250°C, 400°C and 750°C. The EFBC was placed into a ceramic cubicle and heated from 30°C-105°C at 10°C min–1 heating rate under a nitrogen gas flow rate of 30 ml min–1. The temperature was kept constant for 10 min at 105°C and then increased to the defined temperatures. The biochar produced at varied temperatures of 250°C, 400°C and 750°C were collected for further analysis.
Characterisation. The raw EFB fibre, commercial cellulose, EFBC and EFBC-derived biochar were characterised as follows:
i) Fourier-transform Infrared Spectroscopy (FTIR)
The chemical bond and functional groups
of the samples were elucidated using FTIR (Perkin-Elmer Frontier, USA) at 4 cm–1 resolution and eight scans. Potassium bromide was mixed with the oven-dried samples and then pressed using a mortar to form a disk. Spectra of the analysed samples were recorded over a wavelength from 4000 cm–1 to 650 cm–1.
ii) Morphology Analysis
The surface morphology and elemental analysis of the samples were conducted via scanning electron microscopy (SEM) (Hitachi Model S-3400N, Japan) at 30 kV accelerating voltage. The sample surfaces were placed on the aluminum stubs and sputter-coated thinly by palladium to prevent electrostatic charging during analysis.
iii) Proximate and Ultimate Analyses
The proximate analysis of the samples was employed to determine the fixed carbon, moisture, VM and ash content via a thermogravimetric analyser (Perkin Elmer TGA-Pyris 6, USA) in accordance with the standard method American Society for Testing and Materials (ASTM) D1103-60, USA (Mayoral et al., 2001). The ultimate analysis for chemical compositions of the samples was determined using a CHNS Determinator (LECO CHNS M628, USA) according to ASTM D5373.
RESULTS AND DISCUSSION
FTIR Analysis
The effects of different temperatures on raw EFB fibre, commercial cellulose, EFBC and EFBC-derived biochars functional groups were evaluated via FTIR spectroscopy. The FTIR spectra (Figure 1) showed two main regions i.e. fingerprint region (1450 to 400 cm–1) and functional group region (4000-1450 cm–1) (Lani et al., 2014). The absorption peaks at 3406 cm–1 are assigned to polymeric hydroxide (-OH) intramolecular stretching, whereas those of 2850 cm–1 are attributed to methylene (CH2) asymmetric stretching vibration (Khalil et al., 2001; Lv et al., 2015). As depicted in Figure 1, the peaks at ~3406 cm–1 found in all spectra correspond to the stretching of hydrogen-bonded hydroxyl groups, indicating the presence of phenols and alcohols (Cantrell et al., 2012). However, the absence of vibration peak between 1750 cm–1 attributable to a waxy C=O acetyl group (hemicellulose) and ester carbonyl groups (p-coumaric lignin) in all the feedstocks except for raw EFB fibre was indicative of successful removal of hemicelluloses and lignin components during EFBC extraction. Although the extracted cellulose was quite pure, there was residual lignin remained as indicated by absorption peak at ~1630 cm–1 (Table 1). These findings also complement those of SEM results, showing smoother and wrinkled surface of EFBC thus, confirming that lignin and hemicellulose components have been completely removed. Besides, absorption peaks at around 3300, 2890, 1638, 1426, 1365, 1310, 1210, 1028 and 895 cm–1 were observed in both the commercial cellulose and EFBC, which indicated typical absorption characteristics for cellulose (Figures 1b and 1c) (Lv et al., 2015). The peaks at 1400 cm–1, 760-800 cm–1 and 710 cm–1 (Figures 1e and 1f) appearing in the EFBC-derived biochars at higher temperature imply that some aromatic carbon structures are present due to condensation and aromatisation of biochar from decomposed cellulose.

646
JOURNAL OF OIL PALM RESEARCH 33 (4) DECEMBER 2021
ARTICLE IN
PRESS
ARTICLE IN
PRESS
ARTICLE IN
PRESS
ARTICLE IN
PRESS
Based on the findings (Table 1), the bonds of ≡C-H bending (1424 cm–1) and CH2 wagging in cellulose (1315 cm–1) started to diminish when the temperature escalated from 250ºC-750ºC, suggesting depolymerisation and degradation of cellulose. Similar pattern was observed for peaks appearing around 1214 cm–1 attributable to phenolic and ester C-O (hemicellulose) stretching. Meanwhile, the band within the saturated region of 2893-2852 cm–1 visible earlier in the raw EFB fibre (Figure 1a), commercial cellulose (Figure 1b), EFBC (Figure 1c) and EFBC-derived biochar at 250ºC (Figure 1d) had slowly diminished (Figures 1e and 1f) with increasing pyrolysis temperature. High loss of mass throughout the thermal decomposition could be the reason. According to Claoston et al. (2014), decomposition in the biomass accelerates a decline in the polar functional groups when pyrolysis temperature increases. Overall, the FTIR spectra demonstrated that EFBC was successfully extracted from the raw EFB fibre, as confirmed by similar functional groups exhibited between EFBC and commercial cellulose (Figures 1b and 1c). Besides, the pyrolysis temperature employed was able to affect the existence of functional groups in the feedstock, where disappearance of functional groups became more distinct in the EFBC-derived biochars at higher pyrolysis temperature (Figures 1e and 1f).
Morphology Analysis
Figure 2 depicts the physical appearance of feedstocks (raw EFB fibre and EFBC) and EFBC-derived biochar produced at different temperatures. It showed that EFBC had been completely carbonised, turning from yellowish to
black at temperatures of 250°C, 400°C and 750°C (Figures 2d-f). The employed temperature ranges had successfully removed the surface and bound water resulted in great reduction of moisture content which then facilitated carbonisation of EFBC. These findings were consistent with a study previously reported by Uemura et al. (2011a). The morphological structures of raw EFB fibre, commercial cellulose, EFBC and EFBC-derived biochar were assessed via SEM at different magnification. These micrographs show gradual changes of the effect of different temperature on the surface textures. The SEM micrograph of raw EFB fibre in Figure 3a indicated a lignocellulosic composite with compact fibrillar packing and the external surface suggested an irregular heavy deposition of wax, hemicelluloses and lignin. On the other hand, the commercial cellulose and EFBC (Figures 3b and 3c) exhibited an isolated fibril which was separated from each other suggesting non-cellulosic components and impurities such as cuticle. The wax layer was removed from fibre surface during the extraction process which contributed to a more wrinkled and clearer surface (Draman et al., 2013; Nazir et al., 2013; Suriya et al., 2017). As illustrated in Figure 3d, the surface of biochar produced at 250°C appeared to be smoother with rough texture unlike those biochars generated at higher temperature (400°C and 750°C), the external surface seemed to have been cracked with greater shrinkages. When temperature increased to 750°C (Figure 3f), the outer surface of the biochar produced began to collapse and fracture. Claoston et al. (2014) also reported similar findings as evidenced by the inability of the produced biochar to endure high temperature as the thin wall structure was fragile and easily diminished.
0
50
100
150
200
250
300
6501 1501 6502 1502 6503 1503 650
Tran
smitt
ance
(%)
Wavelength (cm–1)
d
2 850 1 750 1 640 1 160 1 030 875 799
a
c
e
f
3 406 1 400
b
Figure 1. Fourier-transform infrared spectroscopy (FTIR) of (a) raw empty fruit bunch fibre, (b) commercial cellulose, (c) empty fruit bunch cellulose; empty fruit bunch cellulose-derived biochar produced at, (d) 250°C, (e) 400°C, and (f) 750°C. The peaks for wax, hemicellulose and lignin exhibited by raw empty fruit bunch fibre were found absent in both the extracted and commercial cellulose showing evidence of non-cellulosic components loss. The bands of carboxyl, aromatic and other aromatic groups were clearly developed at 250°C but diminished as the temperature further increased.

647
EFFECT OF OPERATING TEMPERATURE ON PHYSICOCHEMICAL PROPERTIES OF EMPTY FRUIT BUNCH CELLULOSE-DERIVED BIOCHAR
ARTICLE IN
PRESS
ARTICLE IN
PRESS
TABLE 1. FUNCTIONAL GROUPS OBSERVED IN THE FTIR SPECTRA OF RAW EMPTY FRUIT BUNCH (EFB) FIBRE, COMMERCIAL CELLULOSE, EFB CELLULOSE (EFBC) AND EFBC-DERIVED BIOCHARS PRODUCED AT
DIFFERENT TEMPERATURES
Wavenumbers (cm–1)
Functional groups and bonds
Raw EFB fibre
Commercial cellulose
EFBC EFBC-derived biochars References
250ºC 400ºC 750ºC
3 406 Polymeric -OH intramolecular stretching
(cellulose)
3 333(s) 3 333(s) 3 334(s) 3 346(m) 3 410(w) 3 414(w) Lv et al. (2015); Wan et al. (2011)
2 850 S-H stretching, O=C-H, CH2 asymmetric
stretching
2 852(w) 2 896(s) 2 893(s) 2 893(m) / / Lv et al. (2015); Owi et al. (2016)
1 750 C=O ketone and aldehyde (hemicellulose)
1 737(m) / / / / / Shanmugarajah et al.(2015); Nurul et al. (2017)
1 640 C=C and C=O aromatic lignin ring
/ 1 638(m) 1 634(m) 1 614(m) / / Lv et al. (2015); Shanmugarajah et al. (2015)
1 424 ≡C-H bending, =C-H2 scissoring
1 419(w) 1 426(w) 1 424(w) / / / Lv et al. (2015); Zaini et al. (2013)
1 400 -CH2, -CH3,CH bending
1 373(w) 1 363(w) 1 364(w) / 1 408(s) 1 396(s) Lv et al. (2015); Zaini et al. (2013)
1 315 CH2 wagging in cellulose
1 315(w) 1 315(w) / / / Lv et al. (2015)
1 214 Phenolic and ester C-O stretching
1 240(m) 1 202(w) 1 200(w) / / / Kong et al. (2019); Nurul et al. (2017); Shanmugarajah et al. (2015)
1 160 Asymmetric vibration of C-O-C
1 158(w) 1 160(m) 1 158(m) 1 156(w) / / Huang et al. (2020)
1 030 Tertiary alcohol C-O stretch
1 031(s) 1 030(s) 1 025(s) 1 025(s) 1 059(s) / Lv et al. (2015); Shanmugarajah et al. (2015)
875 Aromatic C-H bending / 897(m) 895(m) 876(s) 872(s) Kong et al. (2019)
799 Aromatic CH out-of-plane
/ 710(w) 713(w) 767(w) 713(m) 712(m) Lv et al. (2015); Keiluweit et al. (2010)
670 C-C stretching 663 (m) 664(m) 667(m) 670(m) / / Owi et al. (2016)
Note: s-strong; m-moderate; w-weak; / means no visible peak.FTIR - Fourier-transform infrared spectroscopy.
Figure 2. The physical image of (a) raw empty fruit bunch fibre in brown colour, (b) commercial cellulose as a fine white powder, (c) empty fruit bunch cellulose in whitish colour with rough texture; empty fruit bunch cellulose-derived biochar produced at (d) 250°C, (e) 400°C, and (f) 750°C - all of which had turned from whitish into blackish due to carbonisation process.
(a) (b) (c)
(d) (e) (f)

648
JOURNAL OF OIL PALM RESEARCH 33 (4) DECEMBER 2021
ARTICLE IN
PRESS
ARTICLE IN
PRESS
ARTICLE IN
PRESS
ARTICLE IN
PRESSProximate and Ultimate Analyses
The properties of raw EFB fibre, commercial cellulose, EFBC and EFBC-derived biochar are summarised in Table 2. It can be observed that raw EFB fibre contains large percentage of VM (72.46 wt%), followed by fixed carbon (16.71 wt%), moisture (8.03 wt%) and ash (2.80 wt%), respectively. Meanwhile, the extracted cellulose, i.e. EFBC comprises of slightly higher VM content than the feedstock by 1.35% but lower fixed carbon (15.42 wt%) and moisture content (7.89 wt%) and the properties of EFBC were comparable with the commercial cellulose. In this study, the moisture content of the biochar was reduced from the feedstock through losses of water as steam due to the elevated temperatures employed. However, the moisture levels in the generated biochars increased as the temperature increased, i.e. 7.14 wt% (250°C), 15.59 wt% (400°C) and 17.75 wt% (750°C), due to the hydroscopic effect exerted by their higher surface areas (Askeland et al., 2019). Meanwhile, opposite trend was observed for VM; the values decreased from 38.68 wt% (250°C) to 8.90 wt% (750°C) which were consistent with other studies (Tag et al., 2016; Zhao et al., 2017) due to losses through outgassing. Furthermore, high temperature might have resulted in the dehydration of hydroxyl groups and thermal degradation of cellulose. The EFBC-derived biochars have lower percentage of VM as compared to raw EFB fibre because VM was released during the pyrolysis process. This study revealed that the percentages of fixed carbons in biochars (50.85-63.69 wt%) were higher than those of the raw EFB fibre and EFBC. Fixed carbon was found to be higher in biochar produced at 750°C.
Generally, higher values of fixed carbon would be indicative of a longer residence time of biochar in soil. These findings were in agreement with other studies by Shariff et al. (2014) and Domingues et al. (2017). Meanwhile, the ash fractions increased at higher temperature: from 0.74 wt% to 5.40 wt% and this was expected because an increased devolatilisation during pyrolysis could reduce the oxygen content of biochar and thus, the ash content increased (Domingues et al., 2017). According to Tsai et al. (2012), increase in ash content in the biochar is due to the progressive concentration of minerals and destruction of lignocellulosic matters.
The ultimate analysis revealed that pyrolysis temperature affected the elemental compositions of the generated biochars (Table 2). The carbon content of EFBC (38.8 wt%) increased with increasing temperature and reached 65.26 wt% at temperature of 400°C but slightly decreased (42.27 wt%) with further increase of temperature until 750°C. The decline was attributed to the reduction rate of carbonisation. Meanwhile, hydrogen (H2) content decreased at higher pyrolysis temperature as methane (CH4) and hydrogen formed and released during the pyrolysis process. This phenomenon is indicative of disappearance of some functional groups such as hydroxyl (OH) and carbonyl (COOH) through volatilisation (Bridgeman et al., 2008; Uemura et al., 2011b). The carbon and nitrogen contents in the EFBC-derived biochar increased while the oxygen and hydrogen contents decreased with increasing temperature compared to the initial feedstock (empty fruit bunch cellulose). However, this trend was invalid at pyrolysis temperature of 750°C as the carbon and oxygen contents fluctuated. The carbon
Figure 3. The scanning electron microscope (SEM) micrograph of (a) compact fibrillar packing surface of raw empty fruit bunch fibre; (b) an isolated fibril fibre fragments of commercial cellulose (c) a rod-shaped and individualise fibrous structure of empty fruit bunch cellulose; empty fruit bunch cellulose-derived biochar produced at (d) 250°C with rough surface structure (e) 400°C with uneven surface, and (f) 750°C with crack outer surface owing to higher temperature intolerance.
(a) (b) (c)
(d) (e) (f)

649
EFFECT OF OPERATING TEMPERATURE ON PHYSICOCHEMICAL PROPERTIES OF EMPTY FRUIT BUNCH CELLULOSE-DERIVED BIOCHAR
ARTICLE IN
PRESS
ARTICLE IN
PRESScontent of biochar is an important indicator to identify its potential carbon sequestration during soil application (Duku et al., 2011; Galinato et al., 2011). According to Imam and Capareda (2012), the fluctuation might be caused by the breaking of weak bonding in the biochar structure although high carbonaceous materials are produced with increasing temperature.
Figure 4 shows that the EFBC-derived biochar production decreased markedly from 32.51% ± 0.48 to 9.02% ± 0.13 as the pyrolysis temperature escalated from 250°C-400°C. At this point, most of the lignocellulosic materials were more likely to decompose as reported by Intani et al. (2016). Nevertheless, the production of EFBC-derived biochar merely decreased further by 5% at 750°C, which indicated extensive decomposition of most of the volatile fractions (Lua et al., 2004). At higher temperatures, organic compounds with higher molecular weight in the biomass could devolatilise into lower molecular weight compounds along with some light gases as well (Thangalazhy et al., 2010). Dehydration and elimination would proceed faster at higher temperatures, which leads to a
decreased biochar yield. Demirbas (2004) reported that biochar production relies on the adverse reaction of cellulose and biochars polymerisation process. The biochar product yield is an important factor for realising economic benefit in biomass waste reutilisation. From the finding, higher pyrolysis temperatures caused greater losses of VM, oxygen, hydrogen as well as biochar yield due to depolymerisation of lignocelluloses and carbonisation to a more recalcitrant form through decarboxylation, dehydration, condensation and aromatisation reactions (Das and Sarmah, 2015; Heitkotter and Marschner, 2015). Future study will focus on pyrolytic mechanism and the associated kinetics to understand wholly the biomass-to-biochar conversion process.
CONCLUSION
The present work concludes that cellulose was successfully extracted from the raw EFB fibre and the extracted cellulose exhibited similar properties as the commercially available
Figure 4. Biochar yield at different pyrolysis temperatures. The highest yield, 32.51% was achieved at 250°C and significantly decreased as the temperature increased. The carbonisation rate of biochar was enhanced with increasing temperature due to the thermal degradation of organic and inorganic materials that were released in the form of volatile components.
TABLE 2. ULTIMATE AND PROXIMATE ANALYSIS OF RAW EMPTY FRUIT BUNCH (EFB) FIBRE, COMMERCIAL CELLULOSE, EFB CELLULOSE (EFBC) AND EFBC-DERIVED BIOCHAR
Parameter(wt.% d.b.)
C H N Oa Moisture content
Volatile matter
Fixed carbon
Ash content
Raw EFB fibre 44.08 7.54 0.15 48.21 8.03 72.46 16.71 2.80
Commercial cellulose 41.02 7.37 <0.01 51.58 6.40 83.49 10.17 <0.01
EFBC 38.80 6.96 0.18 54.06 7.89 73.81 15.42 <0.01
EFBC-derived biochar (250°C) 57.98 2.38 <0.01 39.64 7.14 38.68 50.85 0.74
EFBC-derived biochar (400°C) 65.26 <0.01 0.41 34.33 15.59 20.32 58.29 0.89
EFBC-derived biochar (750°C) 42.27 <0.01 <0.01 57.73 17.75 8.90 63.69 5.40
Note: aEstimated by difference: %O = 100% - [% carbon (C) + % hydrogen (H) + % nitrogen (N)].
32.51
9.02
3.75
0
5
10
15
20
25
30
35
250 400 750
Bio
char
yie
ld (%
)
Temperature (°C)

650
JOURNAL OF OIL PALM RESEARCH 33 (4) DECEMBER 2021
ARTICLE IN
PRESS
ARTICLE IN
PRESS
ARTICLE IN
PRESS
ARTICLE IN
PRESS
cellulose. The findings highlighted that different pyrolysis temperature had greatly influenced the physicochemical properties of the EFBC-derived biochars. The morphology and structure of the produced biochars were distinctively different in shape and form with increasing temperature. The biochar yield and total elemental content (oxygen, hydrogen and nitrogen) reduced while the carbon and ash content increased with increasing temperature. The highest achievable biochar yield was 32.51% at 250ºC. The FTIR spectra revealed some variations and similarities in functional groups between the feedstocks and the EFBC-derived biochars. The biochars produced at lower temperature (250°C) exhibited characteristics favourable as a soil enhancer in improving soil fertility and quality such as high VM (38.68 wt%) and carbon (57.98 wt%) contents. Furthermore, other potential biochar applications can be considered including as an energy source (biofuel) and pollution remediation. Findings from this study provide insights into relationships between pyrolysis conditions, biochar properties and biochar processing which are crucial in optimising biochar production for soil application.
ACKNOWLEDGEMENT
The authors would like to thank the Director-General of MPOB for the permission to publish this article. This work was partially supported by the Fundamental Research Grant Scheme (FRGS) (FRGS/1/2018/STG05/UNIKL/02/2) of Ministry of Higher Education, Malaysia.
REFERENCES
Askeland, M; Clarke, B and Paz-Ferreiro, J (2019). Comparative characterization of biochars produced at three selected pyrolysis temperatures from common woody and herbaceous waste streams. PeerJ, 7: e6784.
Aziz, N; Mohd, N; Mohd, A; Manaf, S and Hamzah, F (2015). Suitability of biochar produced from biomass waste as soil amendment. Procedia Soc. Behav. Sci., 195: 2457-2465.
Bridgeman, T G; Jones, J M; Shield, I and Williams, P T (2008). Torrefaction of reed canary grass, wheat straw and willow to enhance solid fuel qualities and combustion properties. Fuel, 87: 844-856.
Cantrell, K B; Hunt, P G; Uchimiya, M; Norak, J M and Rao, K S (2012). Impact of pyrolysis temperature and manure source on physiochemical characteristics of biochar. Bioresour. Technol., 107: 419-428.
Chan, K Y; Zwieten, L V; Meszaros, I; Downie, A and Joseph, S (2008). Using poultry litter biochars as soil amendments. Aust. J. Soil Res., 46: 437-444.
Claoston, N; Samsuri, A W; Ahmad Husni, M H and Mohd Amran, M S (2014). Effects of pyrolysis temperature on the pysiochemical properties of empty fruit bunch and rice husk biochars. Waste Manag. Res., 32(4): 331-339.
Das, O and Sarmah, A K (2015). The love-hate relationship of pyrolysis biochar and water: A perspective. Sci. Total Environ., 512-513: 682-685.
Demirbas, A (2004). Effects of temperature and particle size on biochar yield from pyrolysis of agricultural waste. J. Anal. Appl. Pyrolysis, 72: 243-248.
Domene, X; Enders, A; Hanley, K and Lehmann, J (2015). Ecotoxicological characterization of biochars: Role of feedstock and pyrolysis temperature. Sci. Total Environ., 512-513: 552-561.
Domingues, R R; Trugilho, P F; Silva, C A; de Melo, I C N A; Melo, L C A; Magriotis, Z M and Sa'nchez-Monedero, M A (2017). Properties of biochar derived from wood and high-nutrient biomasses with the aim of agronomic and environmental benefits. PLoS ONE, 12: e0176884.
Draman, S F S; Daik, R; Latif, F A and El-Sheikh, S M (2013). Characterization and thermal decomposition kinetics of kapok (Ceiba pentandra L.)-based cellulose. BioResources, 9(1): 8-23.
Duku, M H; Gu, S and Hagan, E (2011). Biochar production potential in Ghana - A review. Renew.Sust. Energ. Rev., 15(8): 3539-3551.
Galinato, S P; Yoder, J K and Granatstein, D (2011). The economic value of biochar in crop production and carbon sequestration. Energy Policy, 39(10): 6344-6350.
Heinze, T; El Seoud, O A and Koschella, A (2018). Cellulose Derivatives; Springer Series on Polymer and Composite Materials. Springer International Publishing, Cham, Switzerland.
Heitkotter, J and Marschner, B (2015). Interactive effects of biochar ageing in soils related to feedstock, pyrolysis temperature and historic charcoal production. Geoderma, 245-246: 56-64.
Huang, S; Tao, R; Ismail, A and Wang, Y (2020). Cellulose nanocrystals derived from textile waste through acid hydrolysis and oxidation as reinforcing agent of soy protein film. Polymers, 12: 958.

651
EFFECT OF OPERATING TEMPERATURE ON PHYSICOCHEMICAL PROPERTIES OF EMPTY FRUIT BUNCH CELLULOSE-DERIVED BIOCHAR
ARTICLE IN
PRESS
ARTICLE IN
PRESS
Idris, J; Shirai, Y; Ando, Y; Amiruddin, A; Ali, M; Othman, M; Ibrahim, I and Hassan, M A (2014). Production of biochar with high mineral content from oil palm biomass. Malays. J. Anal. Sci., 18: 700-704.
Imam, T and Capareda, S (2012). Characterization of bio-oil, syn-gas and biochar from switchgrass pyrolysis at various temperatures. J. Anal. Appl.Pyrolysis, 93: 170-177.
Intani, K; Latif, S; Kabir, A K M R and Muller, J (2016). Effect of self-purging pyrolysis on yield of biochar from maize cobs, husks and leaves. Bioresour.Technol., 218: 541-551.
Keiluweit, M; Nico, P S; Johnson, M G and Kleber, M (2010). Dynamic molecular structure of plant biomass-derived black carbon (biochar). Environ. Sci. Technol., 44: 1247-1253.
Khalil, H P S A; Ismail, H; Rozman, H D and Ahmad, M N (2001). The effect of acetylation on interfacial shear strength between plant fibres and various metrices. Eur. Polym. J., 37(5): 1037-1045.
Kong, S H; Loh, S K; Bachmann, R T; Haryati, Z and Cheong, K Y (2019). Palm kernel shell biochar production, characteristrics and carbon sequestration potential. J. Oil Palm Res., 31(3): 508-520.
Kushairi, A; Meilina, O A; Balu, N; Elina, H; Zanal, B M N I; Razmah, G; Vijaya, S; Shamala, S and Parveez, G K A (2019). Oil palm economic performance in Malaysia and R&D progress in 2018. J. Oil Palm Res., 31(2): 165-194.
Lahijani, P and Zainal, Z A (2011). Gasification of palm empty fruit bunch in a bubbling fluidised bed: A performance and agglomeration study. Bioresour.Technol., 102: 2068-2076.
Lani, N S; Ngadi, N; Johari, A and Jusoh, M (2014). Isolation, characterization, and application of nanocellulose from oil palm empty fruit bunch fiber as nanocomposites. J. Nanomater., 3: 1-9.
Lorenz, K (2007). Strengthening the soil organic carbon pool by increasing contributions from recalcitrant aliphatic bio (macro) molecules. Geoderma, 142: 1-10.
Lua, A C; Yang, T and Guo, J (2004). Effects of pyrolysis conditions on the properties of activated carbons prepared from pistachio-nut shells. J. Anal. Appl. Pyrolysis, 72: 279-287.
Lv, Pin; Almeida, G and Perre, P (2015). TGA-FTIR of torrecfaction of lignocellulosic components
(cellulose, xylan, lignin) in isothermal conditions over a wide range of time durations. Bioresources, 10(3): 4239-4251.
Mayoral, M C; Izquierdo, M T; Andre, J M and Rubio, B (2001). Different approaches to proximate analysis by thermogravimetry analysis. Thermochim. Acta, 370: 91-97.
Nazir, M S; Wahjoedi, B A; Yussof, A W and Abdullah, M A (2013). Eco-friendly extraction and characterization of cellulose from oil palm empty fruit bunches. Bioresources, 8(2): 2161-2172.
Novianti, S; Biddinika, M K; Prawisudha, P and Yoshikawa, K (2014). Upgrading of palm oil empty fruit bunch employing hydrothermal treatment in lab-scale and pilot scale. Procedia Environ. Sci., 20: 46-54.
Nurul, S R; Shuhaida, H; Jamaliah, J and Rizafizah, O (2017). Chemical and physical characterization of oil palm empty fruit bunch. Malays. J. Anal. Sci., 21(1): 188-196.
Owi, W T; Lin, O H; Sam, S T; Chin, C H; Zakaria, S, Mohaiyiddin, M S; Villagracia, A R; Santos, G N and Akil, H M (2016). Comparative study of microcelluloses isolated from two different biomasses with commercial cellulose. Bioresources, 11(2): 3453-3465.
Shafie, S T; Mohd, S M A; Hang, L L; Rahman, M M and Wan, A K G W A (2012). Effect of pyrolysis temperature on the biochar nutrient and water retention capacity. J. Purity, Utility Reaction Environ., 1(6): 323-337.
Shanmugarajah, B; Kiew, P L; Chew, I M; Choong, T S and Tan, K W (2015). Isolation of nanocrystalline cellulose (NCC) from palm oil empty fruit bunch (EFB): Preliminary result on FTIR and DLS analysis. Chem. Eng. Trans., 45: 1705-1710.
Shariff, A; Aziz, N S M and Abdullah, N (2014). Slow pyrolysis of oil palm empty fruit bunches for biochar production and characterization. J. Phy. Sci., 25(2): 97-112.
Sohi, S; Lopez, C E; Krul, E and Boll, R (2009). Biochar, climate change and soil: A review to guide future research. CSIRO Land and Water Science Report Series, 2008.
Suriya, P; Pongsathorn, D; Wanna, C; Yusuf, C and Poonsuk, P (2017). Cellulose and hemicellulose recovery from oil palm empty fruit bunch (EFB) fibers and production of sugars from the fibers. Carbohydr. Polym., 155: 491-497.

652
JOURNAL OF OIL PALM RESEARCH 33 (4) DECEMBER 2021
ARTICLE IN
PRESS
ARTICLE IN
PRESS
Tag, A T; Duman, G; Ucar, S and Yanik, J (2016). Effects of feedstock type and pyrolysis temperature on potential applications of biochar. J. Anal. Appl.Pyrolysis, 120: 200-206.
Thangalazhy, G S; Adhikari, S; Ravindran, H; Gupta, R B; Fasina, O; Tu, M and Fernando, S D (2010). Physiochemical properties of bio-oil produced at various temperatures from pine wood using an auger reactor. Bioresour. Technol., 101: 8389-8395.
Tsai, W T; Liu, S C; Chen, H R; Chang, Y M and Tsai, Y L (2012). Textural and chemical properties of swine-manure-derived biochar pertinent to its potential use as a soil amendment. Chemosphere, 89: 198-203.
Uemura, Y; Omar, W N; Othman, N A; Yusup, S and Tsuisui, T (2011a). Effect of atmosphere on torrefaction of oil palm wastes. World Renewable Energy Congress Sweden, 69: 516-523.
Uemura, Y; Omar, W N; Tsutsui, T and Yusup, S (2011b). Torrefaction of oil palm wastes. Fuel, 90: 2585-2591.
Wan, R W D; Rohaizu, R and Ghazali, A (2011). Synthesis and characterization of cellulose phosphate from oil palm empty fruit bunches. Carbohy. Polym., 84: 262-267.
Zaini, L H; Jonoobi, M; Tahir, P M and Karimi, S (2013). Isolation and characterization of cellulose whiskers from kenaf (Hibiscus cannabinus L.) bast fibers. Cellulose, 17(5): 977-985.
Zhao, S X; Na, T and Wang, X D (2017). Effect of temperature on the structural and physicochemical properties of biochar with apple tree branches as feedstock material. Energies, 10(9): 1293.

653
Journal of Oil Palm Research Vol. 33 (4) December 2021 p. 653-667DOI: https://doi.org/10.21894/jopr.2021.0010
THE EFFECT OF SATURATED AND UNSATURATED FATTY ACID COMPOSITION
IN BIO-BASED LUBRICANT TO THE TRIBOLOGICAL PERFORMANCES USING
FOUR-BALL TRIBOTESTER
ZULHANAFI, P1*; SYAHRULLAIL, S1; ABDUL HAMID, M K1 and CHONG, W W F1
ABSTRACTThe performances of bio-based lubricants were influenced by the strength of its molecular interaction between the fatty acid chain and iron molecules on metal surfaces. In this study, the fatty acid compositions of refined, bleached and deodourised palm oil (RBDPO), double fractionated palm olein (SPL) and palm mid olein (PMO) were determined by using gas-liquid chromatography (GLC). Four-ball tribotester was used to evaluate the performance of the lubricants in terms of friction coefficient, wear scar diameter (WSD) and surface roughness (Ra). It was found that PMO with high saturated fatty acid content exhibited excellent tribological characteristics subjected to various temperatures and rotational speeds. However, there was no significant impact observed at extreme pressure (EP) conditions. The physical wear condition was also discussed and analysed.
Keywords: bio-lubricant, saturated fatty acid, tribology, unsaturated fatty acid.
Received: 19 May 2020; Accepted: 29 January 2021; Published online: 16 March 2021.
INTRODUCTION
The global attention to green technology has driven researchers to channel their interest in environmental friendly resources. Mineral-based resources have been dominating technology development since the last century especially in most of the engineering applications including transportation, exploration, manufacturing industry, construction and many more. Mineral-based oil exhibited magnificent performance as it generally had long-life durability, high operating efficiency, less operating and maintenance cost and good adaptability to evolution. However, the main concern is the ability of the mineral oil to degrade to the environment naturally. Even
mineral-based oil offers excellent performances during the operation, but the waste oil has a high level of toxicity and non-biodegradable, thus, making it very difficult to be disposed off naturally (Syahrullail et al., 2013a; 2013b). There were some suggestions to turn the waste oil into other stable and eco-friendly compounds by chemical modification but it requires huge operating costs and not economically viable. As technology has to be continually developed, the remaining stock of mineral-based oil is also being questioned. In the third quarter of 2017 itself, people are consuming around 98 million barrels per day and predicted to keep increasing up to 110 million barrels per day in 2025 (Button, 2017). This should be the concern as it will take about a million years to recover the stock naturally. Synthetic-based oil might be one of the alternatives for further research. It possesses excellent viscosity properties, less evaporative loss, provides high torque and horsepower, able to extend the engine life, and possess good fluidity
1 School of Mechanical Engineering, Faculty of Engineering, Universiti Teknologi Malaysia, 81310 UTM Skudai, Johor, Malaysia.
* Corresponding author e-mail: [email protected]
ARTICLE IN
PRESS
ARTICLE IN
PRESS

654
JOURNAL OF OIL PALM RESEARCH 33 (4) DECEMBER 2021
in both high and low temperature. However, in terms of production, it requires a higher cost when compared to mineral-based oil. Another plant-based vegetable oil resource which is highly degradable and possible to counter the environmental issues is the mineral oil-based lubricant.
Palm Oil-based Lubricant
Palm oil is currently dominating the food industry as cooking oil. Besides, it is also becoming more prominent in food dressing, pharmaceuticals, and toiletry products including detergents, soap bar production and many more. There is a lot of studies conducted to evaluate the performance of palm oil-based lubricants for engineering applications (Amiril et al., 2018; Hassan et al., 2016; Jabal et al., 2014; Noorawzi and Samion, 2016; Razak et al., 2015; Syahrullail et al., 2013c). Researchers are attracted to palm oil-based lubricants because of its properties. It has very stable thermo-viscosity properties indicated by the high viscosity index (VI). The viscosity of the oil does not vary much over temperature change. This would facilitate the operational control of the mechanism. Other than that, palm oil-based lubricants demonstrate high flash point, low volatility and good thermal stability. However, it also shows some instability when dealing with high-temperature applications because they are prone to oxidation. Some of the palm oil-based lubricants also have a high slip melting point and appeared as solid and semi-solid forms in ambient temperatures. This definitely would affect the fluidity of the lubricant. Several studies have been conducted to overcome these problems and found that some additives might be useful in showing significant improvement (Zulhanafi and Syahrullail, 2019).
The molecule structure of palm oil consists of hydrocarbon bonding between glycerol and fatty acid molecules. The combination of these molecular structures forms glycerides which creates several unique chains called di-glycerides and tri-glycerides for two and three fatty acid chain respectively. Normally, palm oil has a balanced saturated and unsaturated fatty acids in its molecular structure. Saturated fatty acid is usually dominated by palmitic acid C16 while unsaturated is presented by oleic acid C18:1. The unsaturated fatty acid chain is very unstable and actively reacts to other substrates especially oxygen which resulted in the formation of primary and secondary oxidation compound which affected the viscosity behaviour of the palm oil. Palm oil has a long polar fatty acid chain up to 24 chains and capable to provide strong intermolecular interaction with metal surfaces. The molecular bonding of fatty acid and steel structure is basically initiated by the fatty acid molecules
itself. The formation of the thin monolayer is self-assembled when attached to metal surfaces. The strength of intermolecular bonding between fatty acid molecules and metal (oxide) surfaces were determined by the adsorption of saturated and unsaturated fatty acid molecules in both physical and chemical pathways. Lots of studies have been conducted to evaluate the factors that give impact to the fatty acid adsorption on the metal surfaces. This led to the characterisation of its frictional behaviour on metal contacts. Sahoo and Biswas (2009) investigated the frictional behaviours of saturated stearic acid and unsaturated linoleic acid on steel surfaces. They found that the unsaturated linoleic fatty acid yielded lower friction than saturated stearic acid. When a higher load is applied, the high charge double bond present on the backbone had encouraged the molecule’s coupling with the steel substrate. Another effort was carried out by Crespo et al. (2018) in determining the impact of unsaturated fatty acid on the adsorption on the fatty acid layer. They discovered that the self-assembled thin monolayer fatty acid film formed weak interactions with the metal. The adsorption kinetics and coverage rate depend on the molecular architecture itself. Doig et al. (2014) investigated the performance of stearic and oleic acids as surfactants in squalane lubricant on iron-oxide surfaces. They revealed that the double bond present in oleic acid molecules resulted in less penetration into surfactant film while stearic acid allows more lubricant penetration. However, as the surface coverage decreased, the friction coefficient is increased. The fatty acid adsorption on the metal surface is also influenced by the presence of moisture. Lundgren et al. (2011) studied the influence of moisture on the adsorption amount of unsaturated fatty acid. They found that 5.65% mole of water increased the adsorption amount of linolenic acid but does not affect the friction and wear behaviours.
In this present study, the fatty acid composition of three types of palm oil was determined by using gas-liquid chromatography (GLC). This study was carried out based on the hypothesis that higher saturated fatty acid content (dominated by C16 and C18; palmitic and stearic acid) leads to having better tribological characteristics by providing stronger molecular interaction between alkyl chain and steel surfaces. The tribological performances of all three types of palm oil-based lubricants were evaluated in terms of friction coefficient, wear scar diameter (WSD), surface roughness (Ra) as well as physical wear characteristics. The tests were subjected to various temperatures, rotational speed, and extreme pressure (EP) conditions. The impact of saturated and unsaturated fatty acid content on tribological properties are analysed and discussed.
ARTICLE IN
PRESS
ARTICLE IN
PRESS
ARTICLE IN
PRESS
ARTICLE IN
PRESS

655
THE EFFECT OF SATURATED AND UNSATURATED FATTY ACID COMPOSITION IN BIO-BASED LUBRICANT TO THE TRIBOLOGICAL PERFORMANCES USING FOUR-BALL TRIBOTESTER
EXPERIMENTAL PROCEDURES
The four-ball tribotester was used in this experiment as illustrated in Figure 1. This machine was developed to carry out the tribological tests for lubricant oil and greases at various temperatures, rotating speed and applied load. This machine consists of an oil test rig where the steel balls were placed and immersed in the lubricant oil. Thermocouple used to heat up and control the lubricant oil into the desired testing temperatures. The oil test rig was also attached to the friction torque sensors while the load is applied through the lever arm connected to the anti-friction disc. This machine was connected to the data logger in which all experimental data were recorded accordingly. Serious attention is needed during placing the test rig on the anti-friction disc to ensure the lubricant oil did not spill over.
Apparatus
The steel ball is made of chrome alloy steel with a 12.7 mm diameter following AISI E-52100 standard, extra polished (EP Grade 25), and hardened to 64-66 HRc (Rockwell C Hardness).
Three types of palm oil-based lubricants were tested in this study including refined, bleached and deodourised palm oil (RBDPO), double fractionated palm olein (SPL) and palm mid olein (PMO). All these oils were supplied by Keck Seng Sdn. Bhd. located in Pasir Gudang, Johor, Malaysia. The mineral-based lubricant oil Shell Omala (VG68) was used as benchmark in this study. The physical properties of all lubricant oils are tabulated in Table 1.
Figure 1. (a) Four-ball tribotester and (b) oil test rig.
Torque sensor
Thermocouple
Holder
Steel ball
Shaft spindle
Lubricant
Anti-frictiondisc
TABLE 1. PHYSICAL PROPERTIES OF ALL TESTED LUBRICANTS
Properties RBDPO SPL PMO VG68
Density at 40°C (kg m–3) 0.8800 0.9000 0.8950 0.8870
Kinematic viscosity (mm² s–1)
@40°C 48.4 33.8 50.6 67.8
@100°C 11.5 12 13.2 8.7
Viscosity index (VI) 242 371 273 99
Colour lovibond (5.5 inch cell R/Y) 2.4R 24Y 3.3R 33Y 2.8R 28Y -
Free fatty acid (FFA %) 0.05 0.08 0.10 -
Peroxide value (PV) 0.85 1.88 4.6 -
Flash point (°C) 314 324 324 236
Iodine value (IV) 52.5 65.57 48.23 -
Slip melting point (°C) 33.8 15.8 24.5 -
Cloud point (°C) n/a 4.5 18.5 -
Note: RBDPO - refined, bleached and deodourised palm oil; SPL - double fractionated palm olein; PMO - palm mid olein; VG68 - mineral-based oil.
(a) (b)
ARTICLE IN
PRESS
ARTICLE IN
PRESS

656
JOURNAL OF OIL PALM RESEARCH 33 (4) DECEMBER 2021
Methodology
The inner section of the oil test rig was first checked and cleaned from any dirt and dust coming from the surrounding. The same goes for all four steel balls in which the pre-cleaning process was carried out by using industrial wipe before being flushed by dimethyl ketone (acetone). This step is crucial to ensure there were no unwanted particles that can ruin the friction measurement during the experiment. All three steel balls were then placed inside the oil test rig and left to self-arrange when the holder is tightened at approximately 68 Nm. The other steel ball was fixed inside the chuck and fitted into a shaft spindle which is driven by an electric motor. Then, approximately 10 ml of lubricant oil was placed into the oil test rig. This amount was sufficient enough to ensure that all three steel balls are fully immersed and all contact surfaces are covered by the lubricant oil. The lubricant oil and steel ball can each only be used once. Each testing parameter will start with a new steel ball and fresh lubricant oil.
After completion, the oil test rig was placed on the anti-friction disc. This anti-friction disc is freely rotating and synchronised with the plunger movement. Then, the load was applied to the anti-friction disc trough the plunger and the movement provided a relative load at a ratio of 1:15. The thermocouple was then fitted to the oil test rig to control the desired temperature. The experiment duration was set at the electrical panel before starting the experiment. The real-time reading for temperature, loads and friction torque was recorded on the computer accordingly.
Experimental Condition
The experimental condition for this study is tabulated in Table 2. The coefficient of friction value was computed using the following Equation.
Coefficient of friction, μ = T 6
3Wr
where T is the friction torque in kg mm–1. W presents the load applied in kg, and r is the length between the centres of the contact surface on the lower balls to the rotation axis (3.67 mm).
RESULTS AND DISCUSSION
Analysis on the Fatty Acid Composition using GLC
The fatty acid composition of all palm oil-based lubricants was determined by using GLC. GLC analysis provided results of high precision and accuracy. Results with high sensitivity used less amount of sample, short analysis time, and capable to run both qualitative and quantitative analysis. In principle, GLC analysis is carried out by passing the sample (in a gaseous state) through the stationary liquid or solid phase and gaseous mobile phase. The sample was extracted into their individual component based on their affinity to the liquid and mobile phases. In another explanation, the sample is fractionated into their individual component between the mobile gas and stationary liquid phases. Generally, the inert gas such as nitrogen or helium was used as the carrier gas while non-volatile liquid comprises the stationary phase. For the mobile phase (carrier gas), the inlet column pressure was set to about 10-50 psi (above atmospheric pressure) with a controlled flow rate of about 25-50 ml min–1. The sample is injected into the flowing stream of the hot mobile phase by using a syringe. The mobile phase temperature is controlled at 50°C above the sample’s boiling point to ensure vaporisation. The sample is then passed through the detectors whereby the electrical signal is generated based on the solute concentrations or mass flow rate. The separation of individual components is based on the differential migration between the mobile and stationary phases. The result is presented in a series of peaks whereby each peak represent the individual component passing through the detector. The retention time was used to identify the identity of the component while the total area under the peak represented the amount of component passing through the detector which is automatically calculated by the computer.
The fatty acid composition of all tested lubricants was tabulated as shown in Table 3. Saturated fatty acids were represented by lauric acid, myristic acid, palmitic acid, stearic acid and arachidic acid while unsaturated fatty acids were represented by oleic acid, linoleic acid, and linolenic acid respectively. Generally, the crude palm oil has a balanced saturated and unsaturated fatty acid content, and the amount was literally changed by means of refining and
TABLE 2. EXPERIMENTAL CONDITIONS
Variable parameters Fixed parameters Standard
Temperature varies from 55, 65, 75, 85 and 95°C Rotating speed at 1 200 rpm and fixed load of 392 N ASTM D4172 B
Rotating speed varies from 1 200, 1 600 rpm, 2 000 and 2 400 rpm
Temperature controlled at 75°C and fixed load of 392 N ASTM D4172 B
Extreme pressure (EP) test starting at load of 589 N. Additional 198 N was added until meet the failure point
Rotating speed controlled at 1 760 ± 40 rpm and temperature maintained at 75°C. Duration at about 10 s
ASTM D2783 (ASTM International, 2019)
ARTICLE IN
PRESS
ARTICLE IN
PRESS
ARTICLE IN
PRESS
ARTICLE IN
PRESS

657
THE EFFECT OF SATURATED AND UNSATURATED FATTY ACID COMPOSITION IN BIO-BASED LUBRICANT TO THE TRIBOLOGICAL PERFORMANCES USING FOUR-BALL TRIBOTESTER
fractionation process. SPL was produced through a double fractionation process whereby the palmitic acid was nucleated, crystallised and separated through filtration process, thereby improving its fluidity. A higher degree of fractionation process resulted in lower saturated fatty acid content in liquid (olein) fraction. Unlike PMO, even it was produced through a third degree fractionation process; it exhibited the highest saturated fatty acid content because it was derived from the solid (stearin) fraction which is palm mid fraction (PMF). Meanwhile, RBDPO was produced from the direct single refining process. It can be simplified that PMO as having higher saturated fatty acid content, followed by RBDPO and SPL respectively.
Viscosity Behaviour Corresponding to Fatty Acid Content
Figure 2 shows the viscosity behaviour of all tested lubricants over the increasing temperature. It was found that RBDPO showed identical viscosity trend with PMO, while SPL demonstrated better viscosity properties with respect to temperature rise. Meanwhile, VG68 showed higher viscosity at temperature of 40°C compared to RBDPO, PMO and SPL, however it exhibited no significant different at temperature of 50°C onwards. RBDPO experienced slightly high variance of its viscosity behaviour over the temperature rise, therefore leading to lower VI compared to SPL and PMO. It was attributed to the crystal structure on its molecules which can only be reduced by fractionation process. A higher degree of fractionation process leads to fewer crystal structures and reduce the slip melting point temperature. PMO was showing slightly lower VI compared to SPL. Both PMO and SPL are produced by a third-degree fractionation process. The higher VI indicated that the oil was more stable and the properties was not affected so much with temperature variations. Higher VI was advantageous especially during the boundary lubrication regime, in which the starting operating temperature was very low. The thermo-viscosity performance also affected the fluidity properties of the lubricants. SPL possessed better fluidity as it had the highest VI. The fluidity characteristics allowed the fatty acid molecules to freely move and facilitate the adsorption into the contacted surface. The very high viscosity readings showed that a huge amount of force was required to move the molecules to surround the ball (Habibullah et al., 2014). A very low viscosity lubricant was
Note: RBDPO - refined, bleached and deodourised palm oil; SPL - double fractionated palm olein; PMO - palm mid olein; VG68 - mineral- based oil.
Figure 2. Kinematic viscosity of tested lubricants.
TABLE 3. FATTY ACID COMPOSITION
Fatty acid composition (%) RBDPO SPL PMO
Lauric acid C12 0.3 0.3 0.5
Myristic acid C14 1.3 1.0 1.1
Palmitic acid C16 43.5 34.3 45.0
Stearic acid C18 4.7 3.6 6.4
Oleic acid C18:1 39.4 47.5 37.3
Linoleic acid C18:2 10.3 12.5 8.8
Linolenic acid C18:3 0.3 0.4 0.2
Arachidic acid C20 0.2 0.2 0.7
Total saturated fatty acid 49.8 39.4 53.7
Total unsaturated fatty acid 50.2 60.6 46.3
Note: RBDPO - refined, bleached and deodourised palm oil; SPL - double fractionated palm olein; PMO - palm mid olein.
0
10
20
30
40
50
60
70
80
6040 50 70 80 90 100
Kin
emai
c vi
scos
ity (m
m2
s–1)
Temperature (°C)
RBDPO
SPL
PMO
VG68
ARTICLE IN
PRESS
ARTICLE IN
PRESS

658
JOURNAL OF OIL PALM RESEARCH 33 (4) DECEMBER 2021
not recommended to be used as it will be easily cleared off with even a slight force, hence providing less surface protection. This would increase the coefficient of friction which is opposing the function of a lubricant.
In this case study, the correlation between fatty acid composition and viscosity behaviour was not significant. SPL with the highest unsaturated fatty acid content shows the highest VI. Meanwhile, the trend was found contradictory for both RBDPO and PMO. PMO with less unsaturated fatty acid content, has shown higher VI than RBDPO. Even RBDPO, with the most balanced saturated and unsaturated fatty acid content, could not guarantee a better thermal-viscosity behaviour.
Analysis on Friction Behaviour at Different Temperature
The coefficient of friction trend at various temperatures was plotted as presented in Figure 3. Generally, there were no such common behaviours shown by all tested lubricants. On average, PMO had demonstrated the lowest coefficient of friction among the palm oil-based lubricants tested. In comparison to the mineral-based oil, VG68 exhibited the lowest coefficient of friction at low temperature of 55°C and was slightly higher compared to RBDPO and PMO at 65°C onwards. At low temperatures, RBDPO exhibited a higher coefficient of friction; attributed to its viscosity behaviour. RBDPO showed high viscosity that was affected by its fluidity. The fatty acid molecule
was hardly moving around and therefore form an improper close-packed monolayer soap film, which resulted in a high coefficient of friction. On the other hand, low viscosity oil had allowed fatty acid molecules to provide stickiness and affinity on the metal surfaces which reduced its movement on peripheral areas to reduce friction (Sapawe et al., 2016). As the temperature increased, RBDPO and PMO showed a decreasing trend and only slightly increased towards the end of the experiment. Meanwhile, SPL showed increasing trend of coefficient of friction with increasing temperature. SPL has higher unsaturated fatty acid content compared to other lubricants. An unsaturated fatty acid chain possessed a double bond that is unstable and actively reacting to other substrates. At a temperature of 75°C, the presence of oxygen had caused the oxidation process to take place. Higher unsaturated fatty acid content led to higher oxidation reaction. The oxidation process would cause the breakage of the thin soap film which is supposed to protect the mating surfaces. The main oxidation and subsequent reaction with other lipid molecules produced peroxyl radicals and hydroperoxides that affect the viscosity of the lubricant (Aluyor and Ori-Jesu, 2008). Even palm oil-based lubricants which have natural anti-oxidants like tocotrienols and carotenoids, was still unable to counter and protect the double bond from being attacked by oxygen molecules. High unsaturated fatty acid molecule content had led to a high oxidation reaction which resulted in a higher coefficient of friction.
Note: RBDPO - refined, bleached and deodourised palm oil; SPL - double fractionated palm olein; PMO - palm mid olein; VG68 - mineral- based oil.
Figure 3. Coefficient of friction at various temperatures and speed of 1200 rpm.
0.065
0.070
0.075
0.080
0.085
55 65 75 85 95
Coe
ffici
ent o
f fric
tion
Temperature (°C)
RBDPO
SPL
PMO
VG68
ARTICLE IN
PRESS
ARTICLE IN
PRESS
ARTICLE IN
PRESS
ARTICLE IN
PRESS

659
THE EFFECT OF SATURATED AND UNSATURATED FATTY ACID COMPOSITION IN BIO-BASED LUBRICANT TO THE TRIBOLOGICAL PERFORMANCES USING FOUR-BALL TRIBOTESTER
Note: RBDPO - refined, bleached and deodourised palm oil; SPL - double fractionated palm olein; PMO - palm mid olein; VG68 - mineral- based oil.
Figure 4. Coefficient of friction at various speeds and temperature of 75°C.
Analysis on Friction Behaviour at Different Speeds
Figure 4 demonstrates the coefficient of friction behaviour against various rotational speeds. It was found that PMO consistently provided a lower coefficient of friction compared to RBDPO and SPL at all testing speeds. As the speed increased, PMO showed a drastic reduction in coefficient of friction and only slightly increased at the speed of 1600 rpm and 2400 rpm. Apparently, RBDPO and SPL showed a decreasing trend of the coefficient of friction at increasing speed. It was also observed that VG68 showed higher coefficient of friction compared to all palm oil-based lubricants at all speeds tested. This is because the palm oil has a long polar fatty acid chain that provided surface protection by the formation of thin layer soap film. These long polar fatty acid chains in the molecule structures have a natural physical affinity that provides strong interaction with metal surfaces. This strong interaction has the capability to reduce the tangential forces carried by the asperities and support the entire load to maintain the existence of the thin layer soap film thus, minimising the surface contact. The increasing rotational speed definitely would lead to an increase in temperature by the heat generated, thus, resulting in a natural oxidation reaction. This was actively accelerated and disrupted the thin layer soap film formed by the fatty acid chain molecules. SPL which possessed higher unsaturated fatty acid content was highly exposed to the oxidation reaction. Meanwhile, PMO which has less unsaturated fatty acid content showed minimum effects of oxidation and maintained a low coefficient of friction at all speeds. The thin layer soap film was generally fixed to the metal surfaces through physisorption
and chemisorption binding mechanism. During the formation of these thin layers of soap film, the unsaturated fatty acid was highly attracted to the metal surfaces through long-range interaction. When it touched the metal surfaces, the polar head will penetrate into the metal surface and the Van der Waals forces in the molecules will self-aligned, parallel to each other to form the close-packed monolayer. The first thin layer soap film has stronger binding energy through a chemisorbed mechanism while the upcoming layer (physisorbed) formed by saturated fatty acid was less durable and easily be rubbed away with a sliding motion. A higher degree of unsaturated fatty acid indicated a higher amount of physisorbed layers, which are less protective to the metal surfaces as shown by SPL. The continuous sliding motion weakens the intermolecular bindings which eliminates the thin layer soap film thus, increased friction.
Analysis on Friction Behaviour under Extreme Pressure (EP)
Under EP conditions, the load was applied starting from 393 N, adding 196 N until it reaches the failure point. The characteristic of the coefficient of friction towards EP condition was plotted as illustrated in Figure 5. It was observed that all tested lubricants were exhibiting low coefficient of friction at a load of 393 N and 589 N which is less than 0.10. At a load of 786 N, there was a small increment shown by all tested lubricants with RBDPO, which exhibited higher friction while SPL demonstrated the lowest. As the load increased to 981 N, SPL showed a drastic increment while RBDPO and PMO maintained an increasing trend. There were
0.055
0.065
0.075
0.085
0.095
1 200 1 600 2 000 2 400
Coe
ffici
ent o
f fric
tion
Speed (rpm)
RBDPO
SPL
PMO
VG68
ARTICLE IN
PRESS
ARTICLE IN
PRESS

660
JOURNAL OF OIL PALM RESEARCH 33 (4) DECEMBER 2021
no significant differences at load of 1179 N in which all tested lubricants showed a high coefficient of friction. It was also observed that the steel ball was found welded and considered meeting the failure point at a load of 1179 N. Apparently, it was found that VG68 maintained the low coefficient of friction even at a maximum testing load of 1179 N. Owing to its oil formulation, it did not deteriorate even when operating at harsh condition. The capability of the fatty acid chain to support the load is determined by the closely packed alkyl chain that reacts with a cumulative short range of Van der Waals forces between neighbouring methyl groups (Crespo et al., 2018). Higher closely packed density provided better affinity on the metal surface. The unsaturated fatty acid has a double bond on its ninth and tenth carbon chain. This double bond caused the oleic acid (unsaturated) to form a cis-configuration which bends the molecules and hence difficult to form a linear molecule configuration. Therefore, the unsaturated fatty acid is favourably less effective in forming a closely-packed monolayer soap film. A less closely packed density would lead to less affinity of the fatty acid chain molecules to the metal surfaces. Unlike the saturated fatty acid which is consisted of palmitic and stearic acids, the trans-isomer configuration of the molecules is able to pack efficiently on the metal surfaces. PMO with high saturated fatty acid content therefore demonstrated good molecule packing ability thus, protecting the metal surface with lower coefficient of friction. However, at such a higher load of 1179 N, PMO, with higher saturated fatty acid was still unable to protect the contact surfaces. Natural oxidation and continuous sliding motion have therefore broke the thin layer soap film which caused the failure.
Analysis on the WSD at Various Temperatures
The WSD was measured by using a high-resolution microscope equipped with I-Lite software. All three steel balls were measured and the average WSD was plotted as shown in Figure 6. It was observed that the increase in temperature had increased the WSD for all tested lubricants. VG68 exhibited lower WSD compared to others lubricant, which previously showed higher coefficient of friction. It is because VG68 was well formulated with antiwear additive which does not cause oxidation reaction. At a low temperature of 55°C, SPL demonstrated a lower WSD compared to PMO and RBDPO. Even SPL was having a higher content of unsaturated fatty acids; hence it does not affect the development of wear scar. However, starting at a temperature of 65°C, SPL had shown a significant drastic increment of WSD compared to other lubricants. Apparently, the trend kept increasing as the temperature increased to 95°C. The increase in WSD was mainly attributed to the breakage of thin layer soap film through an oxidation process. Similar to the analysis of friction at various temperatures, the increase in temperature had caused the oxygen molecules to become more aggressive and actively react to the double bonds available in the unsaturated fatty acids, which include oleic acid, linoleic acid and linolenic acid. The oxidation reaction also caused the formation of primary and secondary oxidation products including acetic acid, formic acid, propionic acid and caproic acid (Haseeb et al., 2010). The formation of these acids created an active reaction with iron molecules on the metal surfaces and caused the metal surfaces to become more brittle which later crumbled, therefore enlarging the wear scar formation (Mannekote and Kailas,
Note: RBDPO - refined, bleached and deodourised palm oil; SPL - double fractionated palm olein; PMO - palm mid olein; VG68 - mineral- based oil.
Figure 5. Coefficient of friction under extreme pressure condition.
0.00
0.020
0.040
0.060
0.080
393 786 981589 1 179
Coe
ffici
ent o
f fric
tion
Load (N)
RBDPO
SPL
PMO
VG68
ARTICLE IN
PRESS
ARTICLE IN
PRESS
ARTICLE IN
PRESS
ARTICLE IN
PRESS

661
THE EFFECT OF SATURATED AND UNSATURATED FATTY ACID COMPOSITION IN BIO-BASED LUBRICANT TO THE TRIBOLOGICAL PERFORMANCES USING FOUR-BALL TRIBOTESTER
2012). The primary and secondary products which were produced during the oxidation process will also contaminate with the lubricant oil and increase the viscosity. The increase in viscosity leads to an increase in friction and simultaneously increases the WSD. PMO, with less unsaturated fatty acid content, should promote consistent WSD development due to less impact on the oxidation process.
Analysis on the WSD at Different Speeds
The WSD behaviour at various rotational speeds was plotted as shown in Figure 7. In general, the results revealed that the WSD is increased proportionally with the increase in rotational
speed for all tested lubricants. Apparently, the results contradicted with the coefficient of friction analysis at different speeds. It was observed that the coefficient of friction had decreased while WSD had increased with increasing speed. A similar phenomenon was found by Fazal et al. (2013) in characterising the wear and friction behaviour of bio-based lubricants. Similarly, to WSD trend in various temperatures analysis, VG68 exhibited lower WSD compared to others lubricant. It was also observed that SPL which experienced a higher coefficient of friction at all tested speed exhibited higher WSD compared to other lubricants. SPL with a higher content of unsaturated fatty acid, had formed less packed molecules of the thin layer
Note: RBDPO - refined, bleached and deodourised palm oil; SPL - double fractionated palm olein; PMO - palm mid olein; VG68 - mineral- based oil.
Figure 6. Wear scar diameter at various temperatures and speed of 1200 rpm.
Note: RBDPO - refined, bleached and deodourised palm oil; SPL - double fractionated palm olein; PMO - palm mid olein; VG68 - mineral- based oil.
Figure 7. Wear scar treatment at various speeds and temperature of 75°C.
400
350
450
500
550
600
55 75 8565 95
Wea
r sca
r dia
met
er (μ
m)
Temperature (°C)
RBDPO
SPL
PMO
VG68
400
500
600
700
800
1 200 2 000 2 4001 600
Wea
r sca
r dia
met
er (μ
m)
Speed (rpm)
RBDPO
SPL
PMO
VG68
ARTICLE IN
PRESS
ARTICLE IN
PRESS

662
JOURNAL OF OIL PALM RESEARCH 33 (4) DECEMBER 2021
0
1 000
3 000
2 000
4 000
5 000
6 000
393 786 981 1 179589
Wea
r sca
r dia
met
er (μ
m)
Load (N)
RBDPO
SPL
PMO
VG68
soap film on the metal surfaces. The less packed molecules formed by unsaturated fatty acid was mainly due to the increase of entanglement between the molecules in opposing layers (Lundgren et al., 2008). Unsaturated fatty acid, mainly dominated by oleic acid, also has ‘shorter’ and ‘thinner’ molecules compared to saturated acid (stearic acid) due to the presence of C9=C10 cis double bond. The response of oleic acid to the molecular elongation under shear stress was less sensitive to surface coverage. It was because oleic acid has intrinsic molecular rigidity, which will lead to less efficient packing density and contributed to less affinity to the metal surfaces. Unlike PMO which has a higher content of stearic acid, the magnitude of elongation molecules was mainly attributed to the crowding effects of neighbouring absorbed molecules (Doig et al., 2014). In addition, stearic acid which has ‘slimmer’ molecules; no branching and no cyclic components, had exhibited more packed and closed monolayer soap film molecules. This kind of monolayer provided a stronger soap film with higher lateral cohesive forces between fatty acid molecules and metal surfaces. RBDPO showed slightly lower WSD compared to PMO at speed of 1200 rpm. However, at higher speeds of 2000 rpm and 2400 rpm, RBDPO exhibited 3% lower WSD compared to SPL. Basically, RBDPO has quite a balanced saturated and unsaturated fatty acids, which also experienced oxidation reaction but the impact was always in between PMO and SPL. It can be seen clearly that PMO with higher saturated fatty acid content had promoted fewer impacts of high sliding motion to the metal surfaces which led to lower WSD formation compared to other lubricants.
Analysis on the WSD under EP
Figure 8 presented the WSD behaviour under EP conditions. There were no significant differences observed at a load of 393 N and 589 N for all tested lubricants. WSD was consistent even when an additional 198 N load has been added. At a load of 786 N, PMO and RBDPO exhibited a slightly higher increment of WSD compared to SPL. At a higher load of 981 N, PMO showed less WSD increment while RBDPO and SPL exhibited higher increments respectively. At a maximum load of 1179 N, it was found that the steel balls lubricated by all tested lubricants were found to be welded and considered reaching the failure point. The experiment was stopped at this point and no additional load was added as the WSD recorded had exceeded 4 mm. According to ASTMD2783 standards, the experiment was considered meeting its failure point if WSD recorded had exceeded 4 mm (Totten et al., 2003). Apparently, VG68 was able to maintain WSD less than 4 mm at maximum testing load of 1179 N. The failure point of VG68 was not defined in this study. The wear scar formation was mainly linked to the failure of lubricant to protect the metal surface from harsh contact. The thin monolayer soap film is responsible to counter the tangential pressure given by the load thus, minimise the asperities contact and hence reduced WSD. At EP condition, the continuous sliding motion with such high load definitely will generate heat which accelerated the oxidation reaction. The increase in WSD indicated that the thin monolayer soap film had totally broken down and no longer protect the metal surfaces. The breakage of these soap films was mainly caused by the oxidation process due to the loosely-packed
Note: RBDPO - refined, bleached and deodourised palm oil; SPL - double fractionated palm olein; PMO - palm mid olein; VG68 - mineral- based oil.
Figure 8. Wear scar diameter under extreme pressure condition.
ARTICLE IN
PRESS
ARTICLE IN
PRESS
ARTICLE IN
PRESS
ARTICLE IN
PRESS

663
THE EFFECT OF SATURATED AND UNSATURATED FATTY ACID COMPOSITION IN BIO-BASED LUBRICANT TO THE TRIBOLOGICAL PERFORMANCES USING FOUR-BALL TRIBOTESTER
0
4
2
6
8
10
786 981 1 179589
Sur
face
roug
hnes
s (μ
m)
Load (N)
RBDPO
SPL
PMO
VG68
molecules of the unsaturated fatty acid. Sharma et al. (2009) suggested that at such a higher load, the thin layer soap film had slipped away from the metal surface while absorbing the ester ends of the fatty acid chain. In another explanation, the formation of thin monolayer soap film on the metal surface had contributed to good friction reduction, however, the intermediate coverage of unsaturated fatty acid might have increased the wear formation. This is due to the reduced wettability of the bulk oil on the metal surface. Therefore, the unsaturated fatty acid had exhibited a detrimental effect on the contact surfaces (Kondo, 1997). In this analysis, the impact of saturated and unsaturated fatty acid on WSD at EP condition was not significant. PMO with a higher content of saturated fatty acid was also unable to retain the formation of closely-packed monolayer soap film at EP condition thus, had increased the WSD.
Analysis of Surface Roughness (Ra) under EP
The Ra of the wear scar was measured and determined by using a surface profilometer equipped with Surftest software. The needle pin from the machine is located perpendicular on the wear scar surface which travel along the WSD. In this analysis, the average Ra at different extreme load pressure was plotted as illustrated in Figure 9. Higher Ra value indicated that the wear scar has coarser surfaces. Generally, the roughness of the metal surfaces is attributed to the asperities contact between two mating surfaces. The wear surfaces that have huge differences in peak and valley depth resulted in higher Ra. It was found that there was no significant difference observed by all tested
lubricants at a load of 589 N and 786 N respectively. The wear formed has a smooth surface even when there is slight increase in WSD at a load of 786 N. At a higher load of 981 N, SPL demonstrated a higher increment of Ra compared to RBDPO and PMO. Meanwhile, VG68 exhibited smoother surface compared to other lubricants at higher loads of 981 N and 1179 N. As discussed in WSD analysis at different temperatures, the increase in load leads to an increase in temperature and definitely initiated the oxidation process. SPL which has a higher content of unsaturated fatty acid experienced a high impact of the oxidation process. The reaction between the oxidation products and iron molecules caused brittleness which weaken the metal surfaces (Farhanah and Syahrullail, 2016; Quinchia et al., 2014). This will allow more asperities contact which lead to a coarser surface. RBDPO and PMO with a higher content of saturated fatty acids, were able to form a more packed thin layer soap film and therefore minimised the asperities contact, thus, promoting a smoother surface. At a higher load of Ra compared to RBDPO and SPL. At this point, the Ra analysis will be based on the physical wear appearances.
Physical Wear Appearances at Different Temperatures and Speeds
The physical wear conditions at high temperatures are as shown in Figure 10. The images were taken by using a high resolution microscope with anti-reflection and equipped with I- Solution software. The analyses were done with regards to the major affected area of physical wear surfaces. At a temperature of 85°C, there were a few darker lines
Note: RBDPO - refined, bleached and deodourised palm oil; SPL - double fractionated palm olein; PMO - palm mid olein; VG68 - mineral- based oil.
Figure 9. Surface roughness under extreme pressure condition.
ARTICLE IN
PRESS
ARTICLE IN
PRESS

664
JOURNAL OF OIL PALM RESEARCH 33 (4) DECEMBER 2021
observed on the wear surface lubricated by RBDPO. Darker lines indicated deeper scratches, caused by heavy asperities contact. For SPL and PMO, only light scratches were observed with no major defect on the wear surfaces. At a higher temperature of 95°C, the steel ball lubricated by SPL had exhibited a darker surface area compared to RBDPO and PMO. This was caused by the oxidation effect experienced by SPL which has a high content of unsaturated fatty acid. It was also observed that no major scratches were found on the surfaces. It can be suggested that there was no significant impact of saturated and unsaturated fatty acid content on the physical wear at high temperatures as on average, all lubricants had demonstrated similar appearances of wear
surface. All dark light scratches were categorised as abrasive and no adhesive was spotted on the wear surfaces (Fazal et al., 2013).
Meanwhile, the physical wear appearances of surfaces at high rotational speed are as illustrated in Figure 11. It was observed that at a speed of 2000 rpm, RBDPO and PMO exhibited light and dark scratches on the wear surfaces. There was also no major defect which was considered as abrasive wear. Unlike SPL, there was one dark spot area and minor defect detected on its wear surface as highlighted in boxes. The upper box indicated that the area experienced localised heating and might be caused by the high rotational speed. The lower box indicated minor adhesive wear in which a small amount of the metal
Note: RBDPO - refined, bleached and deodourised palm oil; SPL - double fractionated palm olein; PMO - palm mid olein.
Figure 10. Physical wear appearances at high temperatures and speed of 1200 rpm.
Note: RBDPO - refined, bleached and deodourised palm oil; SPL - double fractionated palm olein; PMO - palm mid olein.
Figure 11. Physical wear appearances at high speeds and temperatures of 75°C.
RBDPO – 85°C
RBDPO – 2000 rpm
RBDPO – 2400 rpm
RBDPO – 95°C
SPL – 85°C
SPL – 2000 rpm
SPL – 2400 rpm
PMO – 2000 rpm
PMO – 2400 rpm
Deep scrathes
SPL – 95°C
PMO – 85°C
PMO – 95°C
20 μm
20 μm
20 μm
20 μm
20 μm
20 μm
20 μm
20 μm
20 μm
20 μm
20 μm
20 μm
ARTICLE IN
PRESS
ARTICLE IN
PRESS
ARTICLE IN
PRESS
ARTICLE IN
PRESS

665
THE EFFECT OF SATURATED AND UNSATURATED FATTY ACID COMPOSITION IN BIO-BASED LUBRICANT TO THE TRIBOLOGICAL PERFORMANCES USING FOUR-BALL TRIBOTESTER
surface has slightly slipped out from its original position. At a higher speed of 2400 rpm, RBDPO and PMO demonstrated average wear scar condition of which a mild dark area was found on almost all the wear surfaces. There is no major defect or deep scratches found which was considered as abrasive wear. Apparently, SPL experienced a deep impact as three dark lines were spotted on the wear surfaces which indicated deep scratches. As explained in the previous analysis, SPL have a high content of unsaturated fatty acid, and high rotational speed had increased the temperature, thus, initiated the oxidation process (Mobarak et al., 2014; Zulkifli et al., 2013). The reaction between the oxidation products and iron metal has thus, weakened them and allow more asperities to go deeper into the metal surface.
Physical Wear Characterisation under EP Condition
Figure 12 presented the physical wear appearances under EP conditions. Figures 12a, d and e were taken by using a high resolution microscope while the rest were captured by using a low-resolution microscope. It was observed that at a load of 786 N, RBDPO and SPL showed a round shaped wear scar while PMO demonstrated bigger WSD. There was a dark area spotted on the wear
surfaces of both RBDPO and PMO as highlighted in Figures 12a and g. This was attributed to the oxidation process whereby the oxygen molecules were attacking double bonds in unsaturated fatty acid chain molecules. Dark spots indicated that the area was badly affected by the oxidation reaction and polymerised (Sapawe et al., 2016). Meanwhile, SPL presented a fair wear scar formation with light abrasive wear and no adhesive wear observed. It was totally agreed with a previous analysis in which SPL showed the lowest coefficient of friction and the smallest WSD at 786 N load compared to other lubricants. At a higher load of 981 N, all wear scars were still formed as a round shape but the edges were found ragged and serrated. The larger dark area was spotted as highlighted in Figure 12e which indicated that the thin monolayer soap film had broken down and unable to protect the contact surface at a higher load. Dark light scratches were classified as abrasive wear while some fused metal at the edge of the wear scar was considered as adhesive wear (Fazal et al., 2013).
At a load of 1179 N, it was the point that the steel ball was found welded to each other, meaning that the lubricant was totally not functioning, leading to severe damage on the contact surface. It can be seen clearly that almost all metal surfaces were heaped
Note: RBDPO - refined, bleached and deodourised palm oil; SPL - double fractionated palm olein; PMO - palm mid olein.
Figure 12. Physical wear under extreme pressure condition (a-c) RBDPO, (d-f) SPL, and (g-i) PMO.
786 N
981 N
1179 N 1179 N 1179 N
981 N 981 N
786 N 786 N
1 mm
1 mm
1 mm
1 mm
1 mm
1 mm
1 mm
1 mm
1 mm
(a)
(b)
(c) (f)
(e)
(d) (g)
(h)
(i)ARTICLE IN
PRESS
ARTICLE IN
PRESS

666
JOURNAL OF OIL PALM RESEARCH 33 (4) DECEMBER 2021
and fused together by the welding effect. Some of it had slipped away from its original position and removed out of the contact circle. The molecular interaction either by saturated and unsaturated fatty acid with the metal surface was unable to retain the formation of thin layer soap film (Kalam et al., 2012). It was also observed that the fatty acid content does not give a significant impact on EP condition. It can be stated that palm oil-based lubricants could only withstand a maximum load of 981 N. Additional relevant additives might help in improving the capability of palm oil-based lubricants.
CONCLUSION
The fatty acid composition of palm oil-based lubricants was examined and evaluated. The tribological performances of each tested lubricant were also investigated and discussed thoroughly. It can be concluded that in various temperatures condition, PMO showed 8.9% and 4.9% lower coefficient of friction compared to SPL and RBDPO. On average, PMO also has 3.4% and 3.8% lower WSD compared to SPL and RBDPO. Meanwhile in various speeds analysis, PMO demonstrated 7.9% and 13.4% lower coefficient of friction than SPL and RBDPO. Furthermore, PMO showed 11.8% and 5.1% lower WSD compared to SPL and RBDPO respectively. SPL which has high saturated fatty acid content managed to reduce the coefficient of friction at various temperatures and rotational speeds. However, it was not giving any significant impact at a load of more than 981 N in EP conditions.
Stronger molecular interaction between saturated fatty acid molecules and the metal surface provided optimum protection against asperities contact, thus, promoted smoother Ra. In physical wear analysis, SPL which has a high unsaturated fatty acid content had experienced higher oxidation effects and hence resulted in severe damage on the contact surface at high temperatures and rotational speeds. However, the fatty acid content does not show any significant impact to the wear appearances at EP load of 981 N and 1179 N. All palm oil-based lubricants were considered to meet the failure point at 1179 N.
ACKNOWLEDGEMENT
The authors would like to express their thanks to the Ministry of Higher Education of Malaysia for the FRGS Grant (FRGS/1/2018/TK03/UTM/02/14), Universiti Teknologi Malaysia (UTM) for the Research University Grant (21H50), TDR Grant (05G23) and FRGS Grant (5F074, 5F173).
REFERENCES
Aluyor, E O and Ori-Jesu, M (2008). The use of antioxidants in vegetable oils - A review. Afr. J. Biotechnol., 7(25): 4836-4842.
Amiril, S A S; Rahim, E A; Embong, Z and Syahrullail, S (2018). Tribological investigations on the application of oil-miscible ionic liquids additives in modified Jatropha-based metalworking fluid. Tribol. Int., 120: 520-534.
ASTM International (2019). ASTM D2783-19, Standard test method for measurement of extreme pressure properties of lubricating fluids (four-ball method). West Conshohocken, PA.
Button, A (2017). US EIA raises forecast to world oil demand in 2016 and 2017. World liquid fuels production and consumption balance. https://www.nasdaq.com/article/us-eia-raises-forecast-to-world-oil-demand-in-2016-and-2017-cm619107, accessed on 31 January 2019.
Crespo, A; Morgado, N; Mazuyer, D and Cayer-Barrioz, J (2018). Effect of unsaturation on the adsorption and the mechanical behaviour of fatty acid layers. Langmuir, 34(15): 4560-4567.
Doig, M; Warrens, C P and Camp, P J (2014). Structure and friction of stearic acid and oleic acid films adsorbed on iron oxide surfaces in squalane. Langmuir, 30(1): 186-195.
Fazal, M A; Haseeb, A S M A and Masjuki, H H (2013). Investigation of friction and wear characteristics of palm biodiesel. Energy Conver. Manag., 67: 251-256.
Farhanah, A N and Syahrullail, S (2016). Evaluation of lubrication performance of RBD palm stearin and its formulation under different applied loads. J. Tribol., 10: 1-15.
Habibullah, M; Masjuki, H H; Kalam, M A; Ashraful, A M; Habib, M A and Mobarak, H M (2014). Effect of bio-lubricant on tribological characteristics of steel. Procedia Eng., 90: 740-745.
Haseeb, A S M A; Sia, S Y; Fazal, M A and Masjuki, H H (2010). Effect of temperature on tribological properties of palm biodiesel. Energy, 35(3): 1460-1464.
Hassan, M; Ani, F N and Syahrullail, S (2016). Tribological performance of refined, bleached and deodourised palm olein blends bio-lubricants. J. Oil Palm Res., 28(4): 510-519.
Jabal, M H; Ani, F N and Syahrullail, S (2014). The tribological characteristic of the blends of RBD palm
ARTICLE IN
PRESS
ARTICLE IN
PRESS
ARTICLE IN
PRESS
ARTICLE IN
PRESS

667
THE EFFECT OF SATURATED AND UNSATURATED FATTY ACID COMPOSITION IN BIO-BASED LUBRICANT TO THE TRIBOLOGICAL PERFORMANCES USING FOUR-BALL TRIBOTESTER
olein with mineral oil using four-ball tribotester. Jurnal Teknologi, 69(6): 11-14.
Kalam, M A; Masjuki, H H; Shahabuddin, M and Mofijur, M (2012). Tribological characteristics of amine phosphate and octylated/butylated diphenylamine additives infused bio-lubricant. Energy Educ. Sci. Technol. Part A: Energy Sci. Res., 30(1): 123-136.
Kondo, H (1997). Effect of double bonds on friction in the boundary lubrication of magnetic thin film media. Wear, 202(2): 149-153.
Lundgren, S M; Ruths, M; Danerlöv, K and Persson, K (2008). Effects of unsaturation on film structure and friction of fatty acids in a model base oil. J. Colloid Interface Sci., 326(2): 530-536.
Lundgren, S M; Persson, K; Clarke, J; Nordstierna, L and Claesson, P M (2011). The influence of water on the adsorption and the tribological properties of unsaturated fatty acids in alkane solution. Proc. Inst. of Mech. Eng., Part J: J. Eng. Tribol., 225(10): 1048-1055.
Mannekote, J K and Kailas, S V (2012). The effect of oxidation on the tribological performance of few vegetable oils. J. Mater. Res. Technol., 1(2): 91-95.
Mobarak, H M; Masjuki, H H; Mohamad, E N; Rahman, S A; Al Mahmud, K A H; Habibullah, M and Salauddin, S (2014). Effect of DLC coating on tribological behaviour of cylinder liner-piston ring material combination when lubricated with Jatropha oil. Procedia Eng., 90: 733-739.
Noorawzi, N and Samion, S (2016). Tribological effects of vegetable oil as alternative lubricant: A pin-on-disk tribometer and wear study. Tribol. Trans., 59(5): 831-837.
Quinchia, L A; Delgado, M A; Reddyhoff, T; Gallegos, C and Spikes, H A (2014). Tribological studies of potential vegetable oil-based lubricants containing environmentally friendly viscosity modifiers. Tribol. Int., 69: 110-117.
Razak, D M; Syahrullail, S; Sapawe, N; Azli, Y and Nuraliza, N (2015). A new approach using palm
olein, palm kernel oil, and palm fatty acid distillate as alternative biolubricants: Improving tribology in metal-on-metal contact. Tribol. Trans., 58(3): 511-517.
Sahoo, R R and Biswas, S K (2009). Frictional response of fatty acids on steel. J. Colloid Interface Sci., 333(2): 707-718.
Sapawe, N; Samion, S; Zulhanafi, P; Nor Azwadi, C S and Hanafi, M F (2016). Effect of addition of tertiary-butyl hydroquinone into palm oil to reduce wear and friction using four-ball tribotester. Tribol. Trans., 59(5): 883-888.
Sharma, B K; Adhvaryu, A and Erhan, S Z (2009). Friction and wear behaviour of thioether hydroxy vegetable oil. Tribol. Int., 42(2): 353-358.
Syahrullail, S; Kamitani, S and Shakirin, A J P E (2013a). Performance of vegetable oil as lubricant in extreme pressure condition. Procedia Eng., 68(0): 172-177.
Syahrullail, S; Wira, J Y; Wan Nik, W B and Fawwaz, W N (2013b). Friction characteristics of RBD palm olein using four-ball tribotester. Applied Mechanics and Materials (Vol. 315). Trans Tech Publications Ltd. p. 936-940.
Syahrullail, S; Hariz, M A M; Hamid, M A and Bakar, A A (2013c). Friction characteristic of mineral oil containing palm fatty acid distillate using four ball tribo-tester. Procedia Eng., 68: 166-171.
Totten, G E; Westbrook, S R and Shah, R J (2003). Fuels and Lubricants Handbook: Technology. Properties, Performance and Testing. ASTM International. 1086 pp.
Zulhanafi, P and Syahrullail, S (2019). The tribological performances of super olein as fluid lubricant using four-ball tribotester. Tribol. Int., 130: 85-93.
Zulkifli, N W M; Kalam, M A; Masjuki, H H; Shahabuddin, M and Yunus, R (2013). Wear prevention characteristics of a palm oil-based TMP (trimethylolpropane) ester as an engine lubricant. Energy, 54: 167-173.ARTIC
LE IN PRESS
ARTICLE IN
PRESS

668
Journal of Oil Palm Research Vol. 33 (4) December 2021 p. 668-677DOI: https://doi.org/10.21894/jopr.2021.0011
OPTIMISATION OF ALKALI EXTRACTION OF PALM KERNEL CAKE PROTEIN
FATAH YAH ABD MANAF1* and NOOR LIDA HABI MAT DIAN1
ABSTRACTPalm kernel cake (PKC) is commonly used in animal feed, particularly as ruminant feed to supply protein and energy. There is little information on the properties of protein concentrate produced from the PKC which constitute 14%-17% of the meal. Protein concentrates can be produced from PKC using alkali extraction, where PKC is extracted with an alkali solution and followed by precipitation at the isoelectric point. Thus, this study examined the effects of extraction using several extractants at different conditions; meal ratio of 0.5:50-3.0:50 g ml–1, concentration of 0.1-1.0 M, pH 1-12, temperature of 30°C-80°C and time duration of 30-180 min. Sodium hydroxide (NaOH) was found to be the most suitable alkali for protein extraction. Optimum conditions for protein extraction were obtained at 1.0 M NaOH concentration, 50°C temperature, meal to solvent ratio of 2:50 (g ml–1), pH 12 and 120 min. The extracted protein was isolated by isoelectric precipitation at pH 3.5 using 1.0 M hydrochloric acid (HCI). The percentage of protein recovery was 80%-86%. Protein content in the recovery ranged from 45%-50%. Analysis by high performance liquid chromatography (HPLC) showed that arginine, glutamic acid, phenylalanine and leucine were the most abundant amino acids in the concentrates.
Keywords: alkali extraction, isoelectric precipitation, palm kernel cake, protein concentrate.
Received: 24 June 2020; Accepted: 29 January 2021; Published online: 1 April 2021.
* Malaysian Palm Oil Board, 6 Persiaran Institusi, Bandar Baru Bangi, 43000 Kajang, Selangor, Malaysia.
* Corresponding author e-mail: [email protected]
INTRODUCTION
Malaysia produced about 4.86 million tonnes of palm kernels in 2018 of which 2.59 million tonnes of meal, also known as palm kernel cake (PKC) was produced as a by-product (Kushairi et al., 2019). Of this, 2.29 million tonnes of PKC were exported and nearly most of them were sent to European countries mostly The Netherland and Germany for use as ingredient in animal feed. Thus, PKC is one of the most important by-products in the palm oil industry that generates substantial export earnings for Malaysia at approximately RM1016 million.
PKC is produced from kernel by extracting the oil through screw press or by solvent extraction. Extraction with solvent leaves lesser residual oil in the meal than that of the expeller extraction. PKC
is light to dark brown colour, where the expeller-extracted PKC is darker than those extracted by solvent. Most of the PKC are from mechanical extraction using screw press because solvent extraction is expensive. PKC has high oil content, 2%-9% on average and protein content in the range of 14%-17% (Table 1). Besides oil and protein, PKC also has high fibre content (Alimon, 2004) and high phosphorous to calcium ratio (Tang, 2001). It is suitable for use in animal feed, particularly as ruminant feed to supply protein and energy. Table 2 shows the amino acid profile of PKC. Glutamic acid and arginine are the most abundant amino acids in PKC.
The extraction of protein from oilseeds such as soybean, canola and peanut has been the subject of research over the last five decades. Soya protein, in particular, has gained many applications in food, fibre and paper products industries. The suitability of PKC protein for both food and non-food applications is not yet known. A large number of researchers are concerned with the use of meal
ARTICLE IN
PRESS
ARTICLE IN
PRESS
ARTICLE IN
PRESS
ARTICLE IN
PRESS

669
OPTIMISATION OF ALKALI EXTRACTION OF PALM KERNEL CAKE PROTEIN
as animal feed sold at a low price to Europe. Over 2 million tonnes of PKC are produced annually in Malaysia. Assuming that the PKC has protein content of 17% and 55%-60% of these proteins can be extracted, this will ultimately produce almost 200 000 t of protein from the PKC and generate more value-added palm oil products.
There are several methods that can be used to extract protein, such as isoelectric precipitation, ultrafiltration and membrane technology. Ultrafiltration can be used to recover low molecular weight protein. The ultrafiltration and membrane technology have been successfully used to produce protein isolates and concentrates from jojoba meal (Abbott et al., 1991; Nabetani et al., 1995), Crambe abyssinica (Massoura et al., 1998), Rosa rubiginosa seeds (Moure et al., 2001), canola (Ghodsvali et al., 2005), oilseed flour (Lawhon et al., 2006) and soybean (De Moura et al., 2010).
Furthermore, separation of protein from alkali solution by isoelectric precipitation is very common. To date, this method has been successfully applied to flaxseed, soybean, canola, Lupinus campestris, peanuts, sunflowers and many others (Abbasy et al., 1981; Alu’datt et al., 2013; Franzen and Kinsella 1976; Gherzova et al., 2015; Ghodsvali et al., 2005; Rodríguez-Ambriz et al., 2005; Taha et al., 1981; Tzeng et al., 1990). In addition, this method is comparatively cheaper and straight forward, and has also been successfully used for extraction of protein from rapeseed (El-Nockrashy et al., 1977) and almond (Sze-Tsao and Sathe, 2000). The isoelectric precipitation method consists of protein extraction from the cake using alkali solution, and followed by precipitation at isoelectric point. Isoelectric precipitation occurs when there is a change in pH in the solution.
The extraction of protein by alkali extraction is affected by many factors, such as meal to solvent ratio, protein solubility, temperature and time. It is then followed by precipitation of significant protein fractions at isoelectric point, which ranges from pH 3.0 to 5.0. Donna et al. (1997) developed the alkaline extraction technique to obtain the optimum protein extraction from canola meal. The extraction was carried out using sodium hydroxide (NaOH) (0.4%) and the sample to solvent ratio was 1 to 20. The
extraction was carried out at room temperature for 60 min. The protein obtained using the precipitation method at isoelectronic point (pH 4) was relatively high at 87.5%. A study by Liadakis et al. (1998) found that the yield of protein extract from tomato increased at a temperature between 30°C-50°C. Kwon et al. (1996) found that temperature of up to 60°C gave higher protein yield from coconut meal but the protein produced was denatured.
All oilseed meals have different isoelectric points. Generally, protein concentrates or isolates are precipitated at isoelectric point between pH 3.0-5.0. The pH adjustment of the extract supernatant is normally carried out using dilute acidic solutions. Previous studies have reported the adjustment of pH to 3.5 using acetic acid (Klockeman et al., 1997) or hydrochloric acid (Tzeng et al., 1990). The isoelectric points for soybeans (Franzen and Kinsella, 1976), canola (Klockeman et al., 1997) and sunflower (Taha et al., 1981) meals are at pH 4, 3.5 and 3.4, respectively. A similar study by Xu and Diosady (2003) found that the highest protein yield (50%) for rapeseed meals was obtained between pH 4.5 to 5.0. The isoelectric point for PKC is not yet known but based on the reference to oilseeds such as soybean and canola, it is deemed to be at pH 3.5. Thus, this article highlights on the optimisation of various parameters, such as pH, temperature, time, extractant and meal to solvent ratio on alkali extraction of PKC to produce high protein concentrate.
TABLE 1. PROXIMATE ANALYSIS OF PALM KERNEL CAKE
Extractant (%) Mechanical extraction
Solventextraction
Protein 14.8 17.0
Shell 3.9 4.2
Moisture 7.0 9.4
Oil content 8.9 2.0
Source: Siew (1989).
TABLE 2. AMINO ACID CONTENTS OF PALM KERNEL CAKE (g/16 g N)
Amino acid %
Alanine 3.83
Arginine 11.56
Aspartic acid 3.63
Cystine 1.13
Glycine 4.17
Glutamic acid 16.80
Histidine 1.91
Isoleucine 3.22
Leucine 6.07
Lysine 2.68
Methionine 1.75
Phenyalanine 3.96
Proline 3.31
Serine 4.11
Threonine 2.75
Tryptophan 1.06
Tyrosine 2.60
Valine 5.05
Source: Alimon (2004).
ARTICLE IN
PRESS
ARTICLE IN
PRESS

670
JOURNAL OF OIL PALM RESEARCH 33 (4) DECEMBER 2021
MATERIALS AND METHODS
Materials
Mechanical-extracted PKC was provided by a mill in Klang, Selangor, Malaysia. The cake was ground to pass through 80 mess screen. AccQ Tag Chemistry packages for amino acid analysis consisting of 6-aminoquinolyl-N-hydroxysuccinimidyyl carbamate (AccQ) fluor reagent, AccQ Tag eluent and amino acid standard were obtained from Waters, USA. The internal standard, α amino butyric acid (AABA), was purchased from Sigma-Aldrich, USA. Hydrochloric acid and acetonitrile of high performance liquid chromatography (HPLC) grade were purchased from Merck, Germany. High purity water was supplied by Milli-Q purification system.
Proximate Analysis
Ash, moisture and oil contents were determined according to Association of Official Analytical Chemists (AOAC) method (1990).
Total Protein Content
Crude protein in PKC was determined by conventional acid hydrolysis and Kjeldahl digestion using selenium catalyst according to the method described in AOAC (1995). Ammonia was distilled and collected in boric acid solution, which was then titrated using 0.1 N hydrochloric acid (HCI). Digestion and distillation were carried out using Kjeltec apparatus (Model 2200 Auto Distillation, Foss Tecator, Denmark).
Determination of Optimisation of Alkali Extraction
Protein concentrates were prepared from PKC by alkaline extraction using the method described by Oomah et al. (1994) as shown in Figure 1. The extraction was performed with several extractants at different conditions; NaOH concentration of 0.1-1.0 M; meal to solvent ratio of 0.5:50, 1:50, 1.5:50, 2.0:50, 3.0:50 v/w; pH 1-12; temperature of 30°C-70°C; and duration of 30-180 min. The slurry was then centrifuged at 10 000 g (Sorval RC-5C Plus, USA) for 10 min at 10°C and followed by filtration through Whatman No. 41 filter paper. The protein extracted was then precipitated by adjusting the pH to the isoelectric point and centrifuged at 5000 g for 10 min. The precipitated curd was then washed with distilled water and dried.
Protein Solubility
Protein solubility was measured as a function of pH (1-12.0). Twelve sets of 1 g sample each were dispersed in 50 ml of 1.0 M NaOH and each solution was adjusted to pH between 1 to 12 by adding either NaOH or HCl. The dispersion was agitated for 2 hr at 50°C and then centrifuged at 10 000 g for 15 min, followed by filtration through Whatman No. 1 filter paper. Nitrogen (N) content in the supernatant was determined by Kjeldhal method. The percentage of soluble protein was calculated as follows:
Protein solubility
(%)=
amount of N in the supernatant
amount of N in the PKC× 100
Figure 1. Process flow of alkali precipitation for palm kernel cake protein extraction.
Supernatant
Proteins precipitate at isoelectric point
Washing and centrifugation (3x)
Drying
Palm kernel cake protein concentrate
Solid residue
Palm kernel cake
Protein extraction
Centrifugation
Filtration
ARTICLE IN
PRESS
ARTICLE IN
PRESS
ARTICLE IN
PRESS
ARTICLE IN
PRESS

671
OPTIMISATION OF ALKALI EXTRACTION OF PALM KERNEL CAKE PROTEIN
Determination of Isoelectric Point
Four sets of PKC extracted with NaOH (100 ml each) were placed in 250 ml flasks. The extracts were tested at different pH of 3.0, 3.5, 4.0 and 4.5. The protein curd formed was then separated by centrifugation for 15 min at 5000 g. The percentage of protein yield was plotted against pH to determine the isoelectric point. Isoelectric point was indicated by maximum PKC protein yield.
Amino Acid Determination
A reverse-phase HPLC method using AccQ Tag RP-18 column (3.9x150 mm) was used for the determination of amino acids in PKC and its protein concentrate. The method was conducted based on Waters AccQ Tag method that is capable of analysing 21 amino acids in 40 min (Cohen and Michaud, 1993). The detection was carried out by Waters 2475 Multi-Fluorescence Detector with excitation at 250 nm and emission at 395 nm (Waters Breeze HPLC System, USA).
RESULTS AND DISCUSSION
Proximate Analysis
Analysis showed that the mechanical-extracted PKC contained 14.35% protein, 13.67% oil, 13.26% shell, 4.28% ash and 8.75% moisture. The amount of protein obtained in this study was almost similar to that reported by Alimon (2004) and Nuzul Amri (2013), while other components varied depending on the sources and efficiency of the oil extraction operation.
Protein Solubility
Figure 2 shows the solubility of PKC protein in the pH range of 1 to 12. Protein solubility was the
highest (49.45%) at pH 12. At pH 1, solubility of PKC protein was 10.54%, while minimum solubility occurred at pH 2 to pH 9 (less than 3%). The results suggested that there was some portion of the protein not affected by NaOH solution. This finding is in agreement with that of Osman (2002) who reported on protein entrapped in a hard cell structure in the PKC as the protein of PKC was fully protected by tough cell walls. With an increase in pH, the trapped protein would be freed and unattached, thus, increasing protein concentrate yield.
Isoelectric Point
Figure 3 shows the isoelectric point for PKC. The samples were tested at different pH of 3.0, 3.5, 4.0 and 4.5. The highest protein yield (81%) was obtained at pH 3.5. The results showed that the PKC has its isoelectric point at pH 3.5. Oilseed meals have isoelectric points at pH 4 for soybean (Franzen and Kinsella, 1976) and pH 4.5 for canola (Klockeman et al., 1997). The isoelectric point ascertains the level of minimum solubility of protein owing to protein-protein interactions being favoured over protein-water interactions (Luft et al., 2011). Solubility refers to the amount of protein in a sample that dissolves into solution (Zayas, 1997). This means that protein in PKC is soluble in solution with pH of 3.5.
Effect of Different Extractants on PKC Protein Extraction
NaOH is the most efficient solvent for the extraction of protein from PKC with the highest N extractability (83%). This is also true for other oilseed meals. Wolf (1970) and Donna (1997) found that NaOH extracted the highest yield of protein from soybean and canola meal. Terry et al. (1992) found that 76.8% protein could be extracted from Nigeria seed using 0.1 M NaOH. Alkali solution is effective in solubilising rice bran proteins because NaOH can break hydrogen, amide, and disulphide
Figure 2. The solubility of palm kernel cake protein as a function of pH.
0
60
50
40
30
20
10
1 2 3 4 5 6 7 8 9 10 11 12
Pro
tein
sol
ubili
ty (%
)
pH
ARTICLE IN
PRESS
ARTICLE IN
PRESS

672
JOURNAL OF OIL PALM RESEARCH 33 (4) DECEMBER 2021
bonds in proteins (Hamada, 1997). Results showed that natrium chloride (NaCl) solution was less effective for PKC protein extraction. According to Cui et al. (2017), presence of hydrophobic groups and disulphide bonds between protein molecules hinders the solubility of protein in water. Thus, this prompts for the use of aqueous solution such as salt, acid and alkali solution, which is beneficial to extract protein due to its large solubility and protein stability. This explains the efficiency of NaOH in extracting the highest protein from PKC among other extractants. Table 3 shows the effect of different extractants on the extraction of protein from PKC.
TABLE 3. EFFECT OF DIFFERENT EXTRACTANTS ON PALM KERNEL CAKE PROTEIN EXTRACTION
Extractant Protein extracted (%)
1.0 M potassium hydroxide (KOH) 71.35 ± 1.36
1.0 M sodium hydroxide (NaOH) 83.66 ± 1.80
1.0 M natrium chloride (NaCl) 50.88 ± 0.21
Water (H20) 1.46 ± 0.15
Note: Temperature - 50°C; extraction time - 2 hr; meal to solvent ratio - 1:50 (w/v).
Effect of Different NaOH Concentrations on PKC Protein Extraction
Increasing the concentration of NaOH resulted in high protein yield (Table 4). The protein yield was low (1.20%-6.36%) for 0.01-0.5 M NaOH. Increasing the molarity of NaOH to 1.0 M increased the protein yield to 41.16%. Donna et al. (1997) used 0.04 M NaOH to obtain optimum protein extraction of 90% from canola meal. While protein extracted using 0.5 M NaOH resulted in less than 10% yield. Results showed that protein extraction from PKC needed high NaOH concentration. However, high alkaline concentration facilitates the breakdown of hydrogen bonds and dissociates hydrogen (Cui et al., 2017).
Figure 3. Protein yield of palm kernel cake at different pH.
Effect of Meal to Solvent Ratio on PKC Protein Extraction
Table 5 shows the protein yield extracted at various ratios of meal to solvent. Other process parameters were fixed at 50°C, 1 hr extraction and 50 ml of NaOH (1.0 M). Results showed that low meal to solvent ratio resulted in high protein yield. This study is in agreement with Taha et al. (1987) who successfully extracted 91.4% protein from sesame seed using 0.4 M NaOH to sample ratio of 1:25. Increasing the meal to solvent ratio resulted in decrease in N extractability at any NaOH concentration. Meal to solvent ratio of 0.5:50 and 1.0:50 (w/v) did not have significant effect on protein yield. Thus, meal to solvent ratio of 1:50 (w/v) was found to be the satisfactory condition for PKC extraction.
Effect of Time on PKC Protein Extraction
Extraction time is one of the factors that also influences protein yield. However, time factor has less significance on the extraction yield. Results showed that the longer the extractability duration,
TABLE 4. EFFECT OF SODIUM HYDROXIDE (NaOH) CONCENTRATIONS ON PALM KERNEL CAKE PROTEIN EXTRACTION
Molarity of NaOH (M) Protein extracted (%)
0.01 1.20 ± 0.28
0.05 1.90 ± 0.21
0.10 2.94 ± 0.45
0.25 3.13 ± 0.33
0.50 6.36 ± 1.05
1.00 43.71 ± 1.22
Note: Temperature - 50°C; extraction time - 1 hr; extraction - NaOH; meal to solvent ratio - 1:50 (w/v).
50
85
80
75
70
65
60
55
2.9 3.4 3.9 4.4
Pro
tein
yie
ld (%
)
pH
ARTICLE IN
PRESS
ARTICLE IN
PRESS
ARTICLE IN
PRESS
ARTICLE IN
PRESS

673
OPTIMISATION OF ALKALI EXTRACTION OF PALM KERNEL CAKE PROTEIN
the higher the protein yield until it reached a plateau at 120 min (Table 6). Cui et al. (2017) also revealed that long extraction time improved protein extracted from tea. Thus, the optimum extraction time that can produce the highest protein yield from PKC was 120 min.
Effect of Temperature on PKC Protein Extraction
Study on the effect of temperature on protein yield was carried out at 30°C, 40°C, 50°C, 60°C and 70°C, and the process parameters were fixed at 2 hr extraction time and meal to NaOH (1.0 M) ratio of 1:50 (w/v) as shown in Table 7. Protein extraction was the lowest (61.19%) at 30°C. Increasing the temperature resulted in protein yield increment. High temperature stress may trigger changes in plant tissue affecting physiological processes (Lurie, 2006). Zhang et al. (2009) emphasised that increasing temperature could induce mass transfer and solubility, reduce viscosity of the solution and thus, increase the extraction rate. However, the extraction should not be performed at high temperatures due to the possibility of protein denaturation. According
TABLE 5. EFFECT OF MEAL TO SOLVENT RATIO ON PALM KERNEL CAKE PROTEIN EXTRACTION
Sample (g) Protein extracted (%)
0.5 87.53 ± 2.43a
1.0 87.87 ± 2.97a
1.5 85.16 ± 1.64b
2.0 74.92 ± 3.23c
2.5 69.84 ± 1.86d
3.0 64.91 ± 4.19e
Note: Temperature - 50°C; extraction time - 2 hr; extractant - 1.0 M sodium hydroxide (NaOH); volume of NaOH - 50 ml.
Means with the same letters are not significant different (p>0.05).
TABLE 6. EFFECT OF TIME ON PALM KERNEL CAKE PROTEIN EXTRACTION
Time (min) Protein extracted (%)
30 61.38 ± 3.20c
60 76.47 ± 2.63b
90 80.72 ± 3.11a,b
120 82.19 ± 1.57a,b
150 82.75 ± 2.72a
180 83.15 ± 5.11a
Note: Temperature - 50°C; meal to solvent ratio - 1:50 (w/v); extractant - 1.0 M sodium hydroxide (NaOH).
Means with the same letters are not significant different (p>0.05).
TABLE 7. EFFECT OF TEMPERATURE ON PALM KERNEL CAKE PROTEIN EXTRACTION
Temperature (°C) Protein extracted (%)
30 68.19 ± 2.09c
40 75.00 ± 1.78b
50 86.45 ± 2.52a
60 86.58 ± 1.41a
70 85.21 ± 2.37a
Note: Extraction time - 2 hr; meal to solvent ratio - 1:50 (w/v); extractant - 1.0 M sodium hydroxide (NaOH).
Means with the same letters are not significant different (p>0.05).
to Lee et al. (2003) who examined the impact of temperature on protein yield in soybean, soy protein meal denatured at 60°C. Thus, 50°C was found to be the satisfactory temperature for PKC protein extraction.
Protein Extraction at Optimum Condition
After the optimum conditions were established, the protein concentrates extracted from PKC was carried out at 50°C and stirred continuously at 200 rpm for 2 hr using meal to NaOH (1.0 M) ratio of 1:50 (w/v). The suspension was then centrifuged at 10 000 g for 10 min at 10°C, followed by filtration through Whatman No. 41 filter paper. Extracted protein in the supernatant was precipitated by adjusting the pH to isoelectric point at pH 3.5 with 1.0 M HCl and then separated by centrifugation at 5000 g for 10 min. The precipitated curds were then washed with distilled water and dried. The protein recovery was 80% to 86%. Optimisation of protein extraction will enhance its nutritive values for animal feed application. Protein deficiency may reduce body protein deposition and animal performance, where part of the essential amino acids diverts to non-essential amino acids synthesis due to lack of non-specific nitrogen for this process (Dean et al., 2006).
Amino Acid Composition
Amino acid is an important measure of protein quality (Bryden and Li, 2010). Amino acid for feed is crucial in improving the efficiency of utilising protein in animal feed (Toride, 2000). Seventeen amino acids were separated and detected in PKC and its protein concentrate, namely glutamic acid, aspartic acid, alanine, arginine, cysteine, glycine, histidine, isoleucine, leucine, lysine, methionine, phenylalanine, proline, serine, threonine, tyrosine and valine. Tryptophan was destroyed by acid hydrolysis; this is not shown in the chromatogram. There was also loss of cysteine and methionine in very low analytical values.
ARTICLE IN
PRESS
ARTICLE IN
PRESS

674
JOURNAL OF OIL PALM RESEARCH 33 (4) DECEMBER 2021
The amino acid compositions and HPLC chromatogram of PKC and its protein concentrate are presented in Figures 4, 5 and Table 8, respectively. Acid composition in PKC is similar as reported by Alimon (2004). Glutamic acid was the most abundant amino acid, while lysine was the least amino acid in PKC. PKC protein concentrate was found to be rich in arginine, glutamic acid and phenylalanine.
CONCLUSION
NaOH was found to be the most suitable solvent for protein extraction. The optimum condition for protein extraction was 1.0 M NaOH, 50°C, meal
to solvent ratio of 1:50 (w/v), pH 12 and 120 min time reaction. The extracted protein was isolated by isoelectric precipitate at pH 3.5 using 1.0 M HCI acid. The percentage of protein recovery was 80%-86%. Total recovered protein content was between 45%-50%. Analysis by HPLC showed that arginine, glutamic acid, phenylalanine and leucine were the most amino acids present in PKC protein concentrates.
ACKNOWLEDGEMENT
The authors would like to thank the Director-General of MPOB for permission to publish this article.
Figure 4. Amino acid chromatogram of palm kernel cake.
Figure 5. Amino acid chromatogram of palm kernel cake protein concentrates.
900
800
700
600
500
400
12.2
6112
.783
13.9
21
17.6
21
asp
- 14.
550
ser -
15.
999
glu
- 16.
633
gly
- 17.
968 nh
3 - 2
0.13
7
arg
- 21.
817
ala
- 23.
380
pro
- 25.
675
aaba
- 27
.292
cys3
- 28
.523
tyr -
29.
614
met
- 31
.255
val -
30.
709
his
- 18.
615300
200
100
0 5 10 15 20 25 30 35 40 45 50Minutes
mV
isu
- 34.
872
lie -
34.3
93ph
e - 3
5.86
6
lye
- 33.
946
1 000
800
600
400
200
0
0 5 10 15 20 25 30 35 40 45 50
mV
Minutes
ARTICLE IN
PRESS
ARTICLE IN
PRESS
ARTICLE IN
PRESS
ARTICLE IN
PRESS

675
OPTIMISATION OF ALKALI EXTRACTION OF PALM KERNEL CAKE PROTEIN
REFERENCES
Abbasy, M; Taha, F S and Hamouda, A A (1981). A protein isolate by countercurrent and isoelectric precipitation of peanuts. Grasas-y-Aceite, 32: 171-175.
Abbott, T P; Nakamura, L K; Buchholz, G; Wolf, W J; Palmer, D M; Gasdorf, H J; Nelsen, T C and Kleiman, R (1991). Process for making animal feed and protein isolates from jojoba meal. J. Agric. Food Chem., 39: 1488-1493.
Alimon, A R (2004). The nutritive value of palm kernel cake for animal feed. Palm Oil Developments, 40: 12-16.
Alu’datt, M H; Rababah, T; Ereifej, K; Brewer, S and Alli, I (2013). Phenolic-protein interactions in oilseed protein isolates. Food Res. Int., 52(1): 178-184.
AOAC (1995). Official Methods of Analysis. 16th edition. Arlington, VA. Association of Official Analytical Chemists (AOAC).
AOAC (1990). Official Methods of Analysis. 15th edition. Washington, USA. Association of Official Analytical Chemists (AOAC).
Bryden, W L and Li, X (2010). Amino acid digestibility and poultry feed formulation: Expression, limitations and application. R. Bras. Zootec., 39: 279-287.
Cohen, S A and Michaud, D P (1993). Synthesis of a fluorescent derivatizing reagent for 6-amino quinolyl-N-hydroxysuccinimidyl carbamate and its application for the analysis of hydrolysate amino acids via high-performance liquid chromatography. Anal. Biochem., 211: 279-887.
Cui, Q; Ni, X; Zeng, L; Zheng, T; Li, J; Sun, K; Chen, X and Li, X (2017). Optimization of protein extraction and decoloration conditions for tea residues. Hortic. Plant J., 3(4): 172-176.
De Moura, J M L N; Campbell, K; de Almeida, N M; Glatz, C E and Johnson, L A (2010). Protein extraction and membrane recovery in enzyme-assisted aqueous extraction processing of soybeans. J. Amer. Oil Chem. Soc. DOI: 10.1007/s11746-010-1737-0.
Dean, D W; Bidner, T D and Southern, L L (2006). Glycine supplementation to low protein, amino acid supplemented diets supports optimal performance of broiler chicks. Poult. Sci., 85(2): 288-296.
Donna, M K; Romeo, T and Kevin, A S (1997). Isolation and characterization of defatted canola meal protein. J. Agric. Food Chem., 45: 3867-3870.
El-Nockrashy, A S; Mukherjee, K D and Manguld, H K (1977). Rapeseed protein isolate by countercurrent extraction and isoelectric precipitation. J. Agric. Food Chem., 25: 193-197.
Franzen, K L and Kinsella, J E (1976). Functional properties of succinylated and acetylated soy protein. J. Agric. Food Chem., 24: 788-795.
Gerzhova, A; Mondor, M; Benali, M and Aider, M (2015). A comparative study between the electro-activation technique and conventional extraction method on the extractability, composition and physicochemical properties of canola protein concentrates and isolates. Food Biosci., 11: 56-71.
Ghodsvali, A; Haddad Khodaparast, M H; Vosoughi, M and Diosady, L L (2005). Preparation of canola protein materials using membrane etechnology and evaluation of meals functional properties. Food Res. Int., 38(2): 223-231.
Kwon, K S; Bae, D; Park, K H and Rhee, K C (1996). Aqueous extraction and membrane techniques improve coconut protein concentrate functionality. J. Food. Sci., 61: 753-756.
TABLE 8. AMINO ACID COMPOSITIONS IN PALM KERNEL CAKE (PKC) AND ITS PROTEIN CONCENTRATE
Amino acid PKC (g/16 g N)
Protein concentrate (g/100 g protein)
Alanine 0.92 1.19
Arginine 2.18 4.75
Aspartic acid 1.55 3.71
Cystine 0.20 0.25
Glutamic acid 3.01 6.96
Glycine 0.83 1.14
Histidine 0.29 2.49
Isoleucine 0.62 1.99
Leucine 1.11 3.45
Lysine 0.59 1.46
Methionine 0.30 1.87
Phenylalanine 0.73 6.46
Proline 0.63 1.32
Serine 0.69 0.89
Theorinne 0.55 2.41
Tyrosine 0.38 1.87
Valine 0.90 2.40
Total 14.35 44.61
ARTICLE IN
PRESS
ARTICLE IN
PRESS

676
JOURNAL OF OIL PALM RESEARCH 33 (4) DECEMBER 2021
Klockeman, D M; Toledo, R and Sims, K A (1997). Isolation and characterization of defatted canola meal protein. J. Agric. Food Chem., 45: 3867-3870.
Kushairi, A; Meilina, O-A; Balu, N; Elina, H; Zanal Bidin, M N R; Razmah, G; Vijaya, S; Shamala, S and Ahmad Parveez, G K (2019). Oil palm economic performance in Malaysia and R&D progress in 2018. J. Oil Palm Res., 31: 165-194.
Lawhon, J T; Mulsow, D; Cater, C M and Mattil, K F (2006). Production of protein isolates and concentrates from oilseed flour extracts using industrial ultrafiltration and reverse osmosis systems. J. Food Sci., 42(2): 389-394.
Lee, K H; Ryu, H S and Rhee, K C (2003). Protein solubility characteristics of commercial soy protein products. J. Amer. Oil Chem. Soc., 80: 85-90.
Liadakis, G N; Tzia, C; Oreopoulou, V and Thomopoulos, C D (1998). Isolation of tomato seed meal proteins with salt solutions. J. Food Sci., 63: 450-453.
Luft, J R; Wolfley, J R and Snell, E H (2011). What’s in a drop? Correlating observations and outcomes to guide macromolecular crystallization experiments. Cryst. Growth Des., 11(3): 651-663.
Lurie, S (2006). The effect of high temperature treatment on quality of fruits and vegetables. Acta Hortic., 712: 165-174.
Hamada, J S (1997). Characterization of protein fractions of rice bran to devise effective methods of protein solubilization. Cereal Chem., 74: 662-668.
Massoura, E; Vereijken, J M; Kolster, P and Derksen, J T P (1998). Protein from Crambe Abyssinia oilseed. 1. Isolation procedure. J. Amer. Oil Chem. Soc., 75: 324-327.
Moure, A; Sineiro, J and Dominguez, H (2001). Extraction and functionality of membrane-concentrated protein from defatted Rosa rubiginosa seeds. Food Chem., 74(3): 327-339.
Nabetani, H; Abbott, T P and Kleiman, R (1995). Ultrafiltration and Microfiltration Handbook. Ind. Engr. Chem. Res., 34: 1779.
Nuzul Amri, I (2013). Characteristics of Malaysian palm kernel and its products. J. Oil Palm Res., 25(2): 245-252.
Oomah, B D; Mazza, G and Cui, W (1994). Optimization of protein extraction from flaxseed meal. Food Res. Int., 27(4): 355-361.
Osman, A (2002). Preliminary study of protein solubility of palm kernel cake in NaOH. Proc. of the National Seminar on Palm Oil Milling, Refining, Technology, Quality and Environment (POMREQ) 2002. MPOB, Bangi.
Rodríguez-Ambriz, S L; Martínez-Ayala, A L; Millán, F and Davila-Ortiz, G (2005). Composition and functional properties of Lupinus campestris protein isolates. Plant Foods Hum. Nutr., 60(3): 99-107.
Siew, W L (1989). Characteristics and uses of Malaysian palm kernel cake. PORIM Technol., 14: 2-3.
Sze-Tao, K W C and Sathe, S K (2000). Functional properties and in vitro digestibility of almond (Prunus dulcis L.) protein isolate. Food Chem., 69: 153-160.
Taha, F S; Fahmy, M and Sadek, M A (1987). Low-phytate protein concentrate and isolate from sesame seed. J. Agric. Food Chem., 35(3): 289- 292.
Taha, F S; Abbasy, M; El-Nockrashy, A S and Shoeb, Z E (1981). Countercurrent extraction-isoelectric precipitation of sunflower seed protein isolates. J. Sci. Food Agric., 32: 166-174.
Tang, T S (2001). Quality and characteristics of Malaysian palm kernel cakes/ expellers. Palm Oil Developments, 34: 1-3.
Terry, D E; Agbaji, A S and Agbaji, E B (1992). Proximate composition of the seed Acasia nilotica Var adansonii (Bagaruwa) and extraction of its protein. Trop. Sci., 32: 263-268.
Toride, Y (2000). Lysine and other amino acids for feed: Production and contribution to protein utilization in animal feeding. http://www.fao.org/3/y5019e/y5019e0a.htm, accessed on 2 January 2019.
Tzeng, Y M; Diosady, L L and Rubin, L J (1990). Production of canola protein materials by alkaline extraction, precipitation and membrane processing. J. Food Sci., 55: 1147-1156.
Wolf, W J (1970). Soybean proteins: Their functional, chemical and physical properties. J. Agric. Food Chem., 18: 969-976.
Xu, L and Diosady, L L (2003). Removal of phenolic compounds in the production of high-quality protein isolates. Food Res. Int., 35: 23-30.
ARTICLE IN
PRESS
ARTICLE IN
PRESS
ARTICLE IN
PRESS
ARTICLE IN
PRESS

677
OPTIMISATION OF ALKALI EXTRACTION OF PALM KERNEL CAKE PROTEIN
Zayas, J F (1997). Solubility of proteins. In Functionality of Proteins in Food. Springer, Berlin, Heidelberg.
Zhang, B; Cui, Y; Yin, G; Li, X and Zhou, X (2009). Alkaline extraction method of cottonseed protein isolate. Modern Appl. Sci., 3(3): 77-82.
Journal of Oil Palm Research
CiteScore SJR
Scientific Journal Rank 0.498 (2020)
CiteScore Metrics 3.0 (2020)
http://jopr.mpob.gov.my
Contact Us Malaysian Palm Oil Board (MPOB)
6 Persiaran Institusi, Bandar Baru Bangi, 43000 Kajang, Selangor, Malaysia.
Tel: +603-8925 6332 Fax: +603-89259446 Email : [email protected]
2.057 Impact Factor
(2020)
Scan this code
ARTICLE IN
PRESS
ARTICLE IN
PRESS

678
Journal of Oil Palm Research Vol. 33 (4) December 2021 p. 678-688DOI: https://doi.org/10.21894/jopr.2021.0015
THE EFFECT OF MICROWAVE TREATMENT AND DELAYED HARVESTING ON OIL PALM FRUITLETS (Elaeis guineensis) OIL QUALITY
NU’MAN ABDUL HADI1*; NG MEI HAN1; RUSNANI ABD MAJID1 and CHE RAHMAT CHE MAT1
ABSTRACTConventional palm oil mill practice not only processes unwanted empty bunches in sterilisation stage but also produces large amount of wastewater. The oil extraction rate (OER) of the mill is affected by the quality of the oil palm fresh fruit bunches (FFB), which may consist of unripe fruit with less oil content, and uneven distribution of steam throughout the bunches during sterilisation. Besides the FFB, oil palm mills also process loose fruits either collected from the plantations or detached during FFB transportation to the mills. As these loose fruitlets are void of the stalk and core of the bunch, processing them in the same way as FFB is not cost effective. The objective of this study was to carry out processing of fruitlets using microwave, followed by solvent extraction. Loose fruitlets detached in plantations usually come from the outer layer of bunch which contains more oil compared to the inner layer. The following methodology was adopted in this study: 1) optimisation of load per batch for microwave processing of fruitlets, 2) optimisation of microwave heating parameters, and 3) processing of fruitlets detached from the same bunch over 21 days. Fruitlets were sterilised via microwave (2.4 GHz, 900 W, medium power) and its oil is extracted by n-hexane. Optimum load of 170-220 g fruitlets per batch with 3 min heating left the fruitlets to be well conditioned, i.e., softened mesocarp and unburned kernel. The fruitlets get heated rapidly by microwave due to instantaneous dielectric heating effect of moisturised materials. Quality of oil extracted from fruits detached from the same bunch collected over 21 days was investigated. Free fatty acids (FFA), deterioration of bleachability index (DOBI), and oxidative stability of the oil was found to have reduced from 1.3%, 4.32 and 15.18 hr to 6.5%, 0.86 and 5.28 hr, respectively.
Keywords: crude palm oil quality, detached palm fruits, microwave, n-hexane extraction.
Received: 17 November 2020; Accepted: 29 January 2021; Published online: 20 April 2021.
1 Malaysian Palm Oil Board, 6 Persiaran Institusi, Bandar Baru Bangi, 43000 Kajang, Selangor, Malaysia.
* Corresponding author e-mail: [email protected]
INTRODUCTION
Palm (Elaeis guineensis) oil is currently the world’s largest vegetable oil consumed for food, followed by soybean and rapeseed oil (Kushairi et al., 2018; Statista, 2019). The production of crude palm oil (CPO) has increased tremendously since early 1950s following the increase in world population, hence
the increasing demand (Ahmad Borhan et al., 2004; Ramli, 2011). The key contribution for producing large amount of CPO relies mainly on high oil content of palm fruits and effective processing of the palm fresh fruit bunch (FFB) in the milling process. In order to adapt to demand and land availability, development of a technology in harvesting and milling operation is growing fast. Oil extraction rate (OER) is one of the performance parameters for milling process (Parveez, et al., 2020). To date, development of new technologies to achieve higher OER focuses on faster ways to harvest and collect FFB, low cost FFB transportation system, and high
ARTICLE IN
PRESS
ARTICLE IN
PRESS
ARTICLE IN
PRESS
ARTICLE IN
PRESS

679
THE EFFECT OF MICROWAVE TREATMENT AND DELAYED HARVESTING ON OIL PALM FRUITLETS (Elaeis guineensis) OIL QUALITY
efficiency milling process (Kushairi and Abd Rahim, 2017). By transporting only the fruitlets, leaving the empty fruit bunches (EFB) in the plantation, might benefit the palm oil industry in many ways; 1) reduce FFB transportation cost from the plantation to the mill, 2) increase in OER as processing is carried out on only fruitlets, emitting the stalk, and 3) reduce transportation cost in sending back the EFB to the plantation, as illustrated in Figure 1. However, as fruitlets from the same bunch do not ripen and detach at the same time, there is a risk of deterioration due to delayed processing. Therefore, one of the objectives of this study was to determine the rate of deterioration in oil quality when harvesting of FFB is delayed up to 21 days after the first fruitlets dropped. A typical FFB harvesting interval (HI) is 7-10 days, with FFB yield starting to decline if the HI is extended beyond 20 days (Corley and Tinker, 2015).
Steam production for FFB sterilisation consumes huge amount of water. Almost half of the steam used is exhausted during sterilisation cycle and the remainder ends up as steriliser condensate, which forms part of the palm oil mill effluent (POME) (Ahmed et al., 2015). Adoption of microwave heating technology for the processing of palm oil may reduce, if not eliminate, the use of water. Microwave heating is also known as dielectric heating as the heating depended on dielectric properties of the materials. Microwave works by the principle of resonation of electrons at high frequency created by magnetron, a device consisting of a permanent magnet responsible for creating a magnetic field. The microwave generated is distributed and absorbed by the component (e.g. food) leading to rise in temperature. The capability to absorb microwave energy is governed by the material’s dielectric properties where water is the major absorber of microwave energy (Sosa-Morales et al., 2010). Consequently, the higher the moisture content, the better the heating. Dielectric materials convert electric energy at microwave frequency into heat, where temperature rise of a material can be calculated as in the Equation (1):
ρCp
dTdt = 55.63 × 10‒12 fE2ε’’ (1)
where Cp is the specific heat of the material in J kg–1
°C–1, ρ is the density of the material in kg m–3, E is the root mean square of electric field intensity in V m–1, f is the frequency in Hz, dT⁄dt is the time rate of the temperature increase in °C s–1 and ε is the loss factor of the material (Komarov et al., 2005). As palm fruitlet contains about 20% moisture, it gets heated quickly and gave rise to temperature. However, because of the rapid heating, the moisture within is vapourised rapidly as well, leaving the fruits dried, which may obstruct depericarping of the fruitlets. Effect of prolonged microwave heating on palm fruitlets conditions was investigated in this study.
Several studies on sterilisation of oil palm fruit using microwave were reported in the past (Chow and Ma, 2007; Cheng and Chuah, 2011; Sarah, 2018; Sukaribin and Khalid, 2009; Umudee et al., 2013). Sterilisation of whole palm fruit bunch using microwave shortens the sterilisation duration to less than 10 min as compared to conventional steam sterilisation which takes 60-90 min (Chow and Ma, 2007; Kandiah et al., 2006). However, microwave heating worked only on the outer layer of the FFB due to limitation of microwave to penetrate inner layer of the bunch (Chow and Ma, 2007; Sukaribin and Khalid, 2009). Without the stalk and core of the FFB, microwave sterilisation would be much more efficient and effective.
When FFB are sent to the mills, some of the fruitlets tend to detach themselves from the bunch during transportation. Besides this, loose fruits that fall on the ground are also collected during FFB harvesting. These loose fruitlets present the opportunity for revamping the palm oil milling process by changing how sterilisation is carried out. As such, one of the objectives of this study was to study the effect of microwave heating or sterilisation on the oil palm fruitlets and the quality of oil obtained from them.
Figure 1. Illustration on (a) conventional practice for the processing of fresh fruit bunch (FFB) to produce crude palm oil and (b) new proposed practice to process only the ripe detached fruits using microwave and solvent extraction.
Steam and hot water(3 500 kg)
Palm oil mill effluent(7 000 kg)
Fresh fruit bunches(10 000 kg)
Empty fruit bunches(2 300 kg)
Crude palm oil(2 200 kg)Palm kernel(500 kg)Palm shell(600 kg)Palm fibre(1 500 kg)
Organis solvent(recycle)
Moisture(2 100 kg)
Ripe loose fruits(7 700 kg)
Crude palm oil(3 000 kg)Palm kernel(500 kg)Palm shell(600 kg)Palm fibre(1 500 kg)
(a) (b)
ARTICLE IN
PRESS
ARTICLE IN
PRESS

680
JOURNAL OF OIL PALM RESEARCH 33 (4) DECEMBER 2021
Microwave heating of the whole FFB was not feasible due to uneven heat distribution and inefficient bunch stripping, where a series of heating is required to achieve 100% stripping efficiency (Sukaribin and Khalid, 2009). Heating of only loose fruitlets is deemed to be a better approach. However, the loose fruits collected in the plantations during FFB harvesting and those detached during FFB transportation to the mills accounted to only 8%-10% of the total fruits processed by the mill daily (Corley and Tinker, 2015). To make microwave heating feasible, larger amount of fruitlets to be processed is needed. This can be done by removing the stalk and core of the bunch prior to sterilisation. A different set of machineries is needed for this. A more natural approach was tested in this study whereby the FFB is not harvested, but rather, the fruitlets were let to ripen, detached and fall on the ground naturally. The fruitlets were then collected from the ground daily for up to 21 days and sent to the mill for processing while the nearly empty bunch was cut from the tree on the 21st day.
In conventional milling practice, the oil is squeezed out of the digested fruits mash via mechanical screw press after sterilisation. The digested mash undergoes progressive pressure when it passes through the scroll of the screw having diminished pinch, leaving behind 7%-8% residual oil in the press cake (George, 2011). In comparison, solvent extraction with n-hexane will recover almost all, leaving about 0.5% residual oil, ensuring high OER for palm oil mills (George, 2011). It is relatively efficient and reliable, which is one of the reasons why solvent extraction is the primary means of separating large tonnages of oil from low oil-bearing seeds such as soybean, rapeseed, canola and sunflower.
Microwave heating, followed by extraction of oil by way of solvent extraction is deemed to be an excellent processing combination to increase the OER of the mill. However, the quality of the oil obtained from this manner has not been thoroughly studied. Oil obtained through solvent extraction may have completely different profile and properties than those obtained via screw pressing. As such, the third objective of this study was to determine the quality of oil obtained via microwave heating and solvent extraction.
MATERIALS AND METHODS
Materials
Palm fruits were obtained from a palm oil mill and oil palm plantation in Negeri Sembilan, Malaysia. Two fruits collection methods were carried out: 1) collection of loose fruits at oil palm
FFB receiving ramp in the mill for microwave treatment optimisation study and 2) daily collection of detached palm fruitlets in plantation for 21 days to study the changes in oil quality.
Solvents and chemicals were obtained as follows: n-hexane (99%), tetrahydrofuran (99%), 2-propanol (99%) for analyses were purchased from Merck (Darmstadt, Germany), sodium hydroxide, ethyl-alcohol (95%), n-hexane (95%) for extraction were purchased from R&M (Essex, United Kingdom), phosphoric acid (85%) was purchased from Friendemann Schmidt (Perth, Australia), potassium hydrogen phthalate was purchased from Systerm (Selangor, Malaysia) and phenolphthalein was purchased from LabChem (Australia).
Microwave Treatment and Oil Extraction
Approximately 200 g of palm fruitlets were heated in a domestic microwave oven (Panasonic, Model NN-CD9975, 42 litres, 900 W, 2.4 GHz) at medium power intensity. Duration of heating varied from 1-5 min. After microwave heating, the palm fruitlets were then peeled and the nuts within were separated from the mesocarp. The oil in mesocarp was extracted by n-hexane using Soxhlet apparatus for 4 hr. The solvent-to-fruit ratio (1.5:1, v/w) was kept constant for all extraction processes.
Analyses of Palm Oil
Free fatty acid (FFA) content, deterioration of bleachability index (DOBI), carotene content and phosphorus content were determined following the MPOB Standard Test Method (Ainie et al., 2005). A Thermo Fisher Scientific (Model Helios Zeta) UV-Vis spectrophotometer was used for the determination of DOBI and carotenes content.
Vitamin E content was determined by high performance liquid chromatography (Waters 600) equipped with a photodiode array detector (Waters 996) with a silica column (150 mm x 4.6 mm). Mobile phase was hexane, tetrahydrofuran, isopropanol (95:4:1, v/v/v) with flowrate of 1.5 ml min–1.
Oxidative stability of oil was determined using a 743 Rancimat (Metrohm, Herisau, Switzerland). 2.5 g oil (warmed at 60°C) was weighed and placed at the bottom of the reaction tube. The heating block temperature and air flow were set at 120°C and 20 litres hr–1, respectively.
Bleachability test was carried out in nitrogen blanket as follows: 100 g oil was pre-heated at 90°C in a round bottom flask, then 0.1 wt% phosphoric acid (1 ml of solution drawn from 1 g of phosphoric acid dissolved in 10 ml distilled water) was added and the mixture was heated to 90°C for 10 min. 1 g bleaching earth was then added to the mixture, followed by increase in temperature to 105°C and
ARTICLE IN
PRESS
ARTICLE IN
PRESS
ARTICLE IN
PRESS
ARTICLE IN
PRESS

681
THE EFFECT OF MICROWAVE TREATMENT AND DELAYED HARVESTING ON OIL PALM FRUITLETS (Elaeis guineensis) OIL QUALITY
maintained for 15 min. Thereafter, the mixture was immediately filtered under vacuum. About 90 g of the mixture was then transferred to a pre-heated apparatus and further refined at 260°C for 30 min under vacuum. The refined oil was cooled to 60°C and vacuum was released. The sample was then kept for further analysis.
RESULTS AND DISCUSSION
Microwave Treatment of Oil Palm Fruitlets
In microwave heating, the rise in temperature is proportional to the electric field intensity and heating duration, while inversely proportional to the density of the material (Equation 1). Therefore, heating effect may vary subjected to heating duration, power intensity and weight of sample. The optimum heating duration of the oil palm fruitlets was determined to be 3 min. Lower heating effect was expected with the increased in number of fruitlets heated per batch. Batch with 14 to 18 (170-220 g) fruitlets was well cooked as shown in Table 1. Mesocarp became dry and kernel was burnt due to overheating when less than 170 g fruitlets were heated. Vice versa, heating more than 220 g fruitlets led to insufficient conditioning of the palm fruitlets and is not desired.
Table 2 and Figure 2 depict the condition and visual of the oil palm fruits upon heating by microwave at various heating durations. In conventional practice, steam is used as medium to distribute heat into inner layers of the FFB. Microwave heating in dry conditions exposed the oil palm fruits to potential burning. Therefore, microwave heating duration played a crucial role in ensuring the heated fruits remain in good condition for subsequent oil extraction.
Heat penetration is the key factor in palm fruitlets sterilisation via microwave heating. Notably, oil yield increased with increasing heating duration. Table 3 shows the yield and quality of the oil obtained through solvent extraction of the microwave heated oil palm fruit. In order to maximise oil extraction from the mesocarp and preserving the nuts for subsequent process, an optimum heating duration that does not affect the kernel is needed. Besides the purpose to maximise oil extraction, hardened mesocarp as a result of prolonged microwave heating make depericarping operation difficult. Results showed that the increase of heating duration of up to 5 min increased the oil yield. Moderate heating duration of 2-3 min was optimum to loosen the nut from its mesocarp, while keeping the kernel in good condition for further processing. After 4-5 min heating, the mesocarp became dried due to excessive loss of moisture (vapourised), but otherwise still in good condition, making oil extraction easier. Extraction using n-hexane is enhanced through better interaction of the solvent with the oil. On the other hand, presence of moisture increased the polarity of the fruits, thus, oil extraction is hindered.
Comparisons on oil quality were made with CPO obtained from palm oil mill (Table 4). MCPO refers to mesocarp oil obtained from palm fruitlets that were subjected to 3 min microwave heating and solvent extraction. FFA and DOBI of the MCPO passed the trading specifications limit set by the Palm Oil Refiners Association of Malaysia (PORAM), and were superior compared to CPO. However, the superior quality could be due to more prudent handling as MCPO was obtained through laboratory-scale experiment compared to CPO which was produced in commercial scale. Commercial production of CPO took hours, from gate to storage tank, therefore gave room for quality deterioration along the process.
Bleachability of Solvent-extracted Palm Oil
DOBI measurement was recommended by Swoboda (1982) in 1980s as rapid assessment on the
TABLE 1. CONDITION OF FRUITLETS BASED ON VARIOUS HEATING LOADS
Number of fruitlets Weight (g)
Condition of the heated fruits
Mesocarp Kernel
2 24.8 Dry, stiff Brown
4 49.9 Dry, stiff Brown
6 75.1 Dry, stiff Brown
8 97.5 Partially dry Brown
10 120.5 Partially dry Slightly brown
12 149.6 Oily, soft Slightly brown
14 171.0 Oily, soft White
16 200.2 Oily, soft White
18 221.5 Oily, soft White
20 246.0 No changes White
Note: 3 min microwave heating, medium power intensity.
TABLE 2. CONDITION OF THE OIL PALM FRUITS AFTER MICROWAVE HEATING
Heating duration
(min)
Other parameters
Condition of the heated fruits
Mesocarp Kernel
1 Weight of fruits:
200 ± 10 g
Power intensity: Medium
No changes White
2 Oily and soft White
3 Oily and soft White
4 Partially dry Slightly brown
5 Dry and stiff Completely brown
Note: 3 min microwave heating, medium power intensity.
ARTICLE IN
PRESS
ARTICLE IN
PRESS

682
JOURNAL OF OIL PALM RESEARCH 33 (4) DECEMBER 2021
ease of refining for CPO. The DOBI measurement, which was defined as ratio of spectrophotometric measurements of a CPO solution at 446 nm and 269 nm was widely used for mechanically pressed CPO in Malaysian palm oil industry for quality control (Lin and Gee, 2001). The process of refining removes gums (in the form of phosphorus), impurities, colour pigments, traces of metals, and FFA through the use of phosphoric acid (PA) and bleaching earth (BE) at high temperatures (220°C-260°C). Bleachability
Figure 2. Visual of the oil palm fruits after heated in microwave.
test in laboratory is carried out following the Seed Crushers and Oil Processors Association (SCOPA) test method which is regarded as the most suitable test for predicting the refinability of CPO (Lin and Gee, 2001).
Prior to bleachability test, the phosphorus content of the solvent extracted mesocarp oil was determined and compared with oil that was mechanically extracted in laboratory. Table 5 shows the phosphorus content of mesocarp oil that were obtained via solvent extraction and mechanical pressing. The phosphorus content in solvent extracted mesocarp oil (91 mg kg–1) was four times higher compared to mesocarp oil that was mechanically pressed (22 mg kg–1). This indicates role of n-hexane in extracting phosphorus along with the oil extraction. CPO obtained from mill has less phosphorus (ca. 11 mg kg–1) due to the possibility that water used in milling process might have washed away the phosphorus. Wastewater generated from milling process contains considerably high phosphorus content, about 109-136 mg kg–1 (Loh et al., 2017).
Bleachability tests were carried out on solvent extracted oil using 1 and 3 wt% BE and 0.1-0.5 wt% PA. Due to high cost of material, palm oil refinery
TABLE 3. EFFECT OF MICROWAVE HEATING DURATION ON OIL YIELD AND QUALITY
Heating duration (min)
Other parameters Oil yield(wt %)
Free fatty acid(%)
DOBI Oxidative stability (hr)
1Weight of fruits:
200 ± 10 g
Power intensity: Medium
16.8 1.69 3.77 17.67
2 25.0 1.61 3.97 19.07
3 32.3 0.87 4.48 18.94
4 32.5 0.86 4.75 17.78
5 36.6 0.68 4.07 18.09
Note: DOBI - deterioration of bleachability index.
TABLE 4. COMPARISONS OF OIL QUALITY
Parameter CPO MCPO Limit
FFA (%) 3.44 1.14 5.0 (max.)
DOBI (unitless) 2.9 4.2 2.3 (min.)
Oxidative stability (hr) 15.92 18.31 -
Carotene (mg kg–1) 589 624 500-700 (range)
Vitamin E (mg kg–1) 802 1 347 600-1 000 (range)
Note: DOBI - deterioration of bleachability index; FFA - free fatty acid; CPO - crude palm oil; MCPO - mesocarp oil obtained from microwave heated (3 min, medium power) palm fruits.
1 min 2 min
4 min 5 min
3 min
ARTICLE IN
PRESS
ARTICLE IN
PRESS
ARTICLE IN
PRESS
ARTICLE IN
PRESS

683
THE EFFECT OF MICROWAVE TREATMENT AND DELAYED HARVESTING ON OIL PALM FRUITLETS (Elaeis guineensis) OIL QUALITY
usually use at most, 0.1 wt% PA and 2 wt% BE for CPO refining (Nu’man and Che Rahmat, 2016). Higher dosages were anticipated for this study due to high phosphorus content in the solvent-extracted oil. Figure 3 shows the phosphorus content in refined solvent extracted oil when 1 and 3 wt% BE with 0.1-0.5 wt% PA were used. Phosphorus content was reduced from 91 to 75 mg kg–1. It was further reduced to 47 mg kg–1 when 0.5 wt% PA was used. Increasing BE dosage to 3 wt% resulted in the reduction of phosphorus content from 33 to 18 mg kg–1 when 0.1 and 0.5 wt% PA were used, respectively. BE and PA dosage used in this study (3 wt% and 0.5 wt%, respectively) were higher than for commercial CPO (11 mg kg–1). This could be one of the drawbacks of using n-hexane for palm oil extraction. These results reflected that the measurement of DOBI may not represent the ease of oil refining and thus, may not be applicable to solvent-extracted oil.
Minor Components
Table 6 shows the composition of vitamin E in oil that were solvent extracted immediately after microwave heating. γ-tocotrienol was found to be the major tocol present with concentration ranged from 442-546 mg kg–1 (34%-37%), followed by α-tocopherol (27%-30%), α-tocotrienol (26%-29%), δ-tocotrienol (4%-9%) and γ-tocopherol (2%-3%), for
TABLE 5. PHOSPHORUS CONTENT IN SOLVENT AND MECHANICAL-PRESSED OIL
Treatment process Phosphorus content (mg kg–1)
Microwave followed by Soxhlet (n-hexane) extraction
91
Microwave followed by manual squeezing
22
Steam sterilisation followed by mechanical press
11
all heating durations. Total vitamin E concentrations ranged from 1182-1524 mg kg–1.
In a different scenario where oil extraction was carried out on fruits that were left standing for two days after microwave heating, the vitamin E compositions in the oil are as shown in Table 7. Slight degradations of vitamin E were observed in oil extracted from fruits that were left standing at ambient (c.a. 27°C) for two days upon microwave heating as opposed to immediate extraction as shown in Table 6 (1347 mg kg–1) and Table 7 (1093 mg kg–1). This is in agreement with the findings by Ng and Choo (2012) who reported that degradation of vitamin E occurred in standard α-tocopherol solutions that were stored at -5°C. Nhan and Hoa (2013) also reported significant vitamin E degradations in pharmaceutical products when exposed to sunlight.
In the oil extracted from fruits that were left standing for two days upon microwave heating, γ-tocotrienol remained the major tocol, ranging from 305-519 mg kg–1 (30%-39%), followed by α-tocopherol and α-tocotrienol (24%-31%), δ-tocotrienol (4%-12%) and γ-tocopherol (2%-3%). The total vitamin E concentration were less (1182-1153 mg kg–1), which was 2.5% less for 1 min heating, 35.9% (2 min), 5.2% (3 min), 13.5% (4 min) and 32.9% (5 min), compared to when there was no delay in oil extraction.
Regardless of the time of oil extraction, γ-tocotrienol was the major tocol (30%-39%) in the solvent extracted oil compared to other vitamin E homologues (Tables 6 and 7). The total vitamin E concentrations in solvent extraction oil were 911-1524 mg kg–1, which was higher compared to commercial CPO (600-800 mg kg–1). In current milling practice, palm fruits are exposed to high pressure steam for 60-90 min during sterilisation. It is possible that degradation of vitamin E occurred during this process. The relatively shorter heating duration in microwave sterilisation is able to retain the vitamin E in palm oil. Another possibility is
Figure 3. Phosphorus content after refining. Initial phosphorus was 91 mg kg–1.
0.010.0
20.0
30.040.0
50.0
60.0
70.080.0
0.1 0.2 0.3 0.4 0.5
33
75
6456
50 47
25 24 20 18
Pho
spho
rus
(mg
kg–1
)
Phosphoric acid (wt %)
1% Bleaching earth
3% Bleaching earth
Phosphoric acid (wt%)
ARTICLE IN
PRESS
ARTICLE IN
PRESS

684
JOURNAL OF OIL PALM RESEARCH 33 (4) DECEMBER 2021
TABLE 6. VITAMIN E CONTENT IN OIL EXTRACTED IMMEDIATELY UPON MICROWAVE HEATING OF PALM FRUITS
Heating time (min)Vitamin E composition (mg kg–1)
α-t α-t3 γ-t γ-t3 δ-t3 Total
1 326 309 22 442 83 1 182
2 379 410 35 485 110 1 418
3 426 411 34 486 58 1 415
4 338 341 18 431 68 1 196
5 415 393 39 546 130 1 524
Mean value ± SD 377 ± 45 373 ± 46 30 ± 9 478 ± 45 90 ± 30 1 347 ± 151
Range value 326-426 309-411 18-39 431-546 58-130 1 182-1 524
Note: t - tocopherol; t3 - tocotrienol; SD - standard deviation.
TABLE 7. VITAMIN E CONTENT IN OIL EXTRACTED AFTER TWO DAYS STANDING UPON MICROWAVE HEATING OF PALM FRUITS
Heating time (min)Vitamin E composition (mg kg–1)
α-t α-t3 γ-t γ-t3 δ-t3 Total
1 301 277 20 453 103 1 153
2 246 280 20 332 35 911
3 324 398 29 519 71 1 341
4 316 270 17 362 69 1 035
5 297 276 26 305 120 1 023
Mean value ± SD 297 ± 30 300 ± 55 22 ± 5 394 ± 89 80 ± 33 1 093 ± 163
Range value 246-316 270-398 17-29 305-519 69-120 911-1 153
Note: t - tocopherol; t3 - tocotrienol; SD - standard deviation.
TABLE 8. CAROTENES CONTENT IN MICROWAVE HEATED PALM FRUITS
Heating time (min)
Carotenes (mg kg–1)Degradation
(%)Extraction
immediatelyafter heating
Extraction two days
after heating
1 635 548 14
2 626 539 14
3 610 587 4
4 652 612 6
5 619 556 10
Mean value ± SD
628 ± 16 568 ± 30 10
Range value 610-652 539-612 4-14
Note: SD - standard deviation.
that microwave sterilisation, coupled with solvent extraction, enabled higher vitamin E extraction efficiency.
Microwave exposure of the palm fruits might cause degradation in minor constituents in palm oil to a certain degree. Malheiro et al. (2011) reported that the degradation pattern of vegetable oils under microwave heating was similar to conventional heating. Tocopherols in soybean oil for example, degraded by 60% after being heated under microwave for 18 min (Hassanein et al., 2003). However, sterilisation of palm fruits via microwave does not require long heating duration as a moderate heating duration is adequate to condition the fruits. This would have minimised the degradation effect of the microwave.
Table 8 shows the carotene content in mesocarp oil extracted from fruitlets heated at various durations from freshly heated and two days standing fruitlets. Degradations in carotene by 4%-14% were observed when the fruits were left standing for two days after heating. As carotenes are prone to oxidation when exposed to air, leaving it for two days could have led to its degradation. Nevertheless, microwave heating for 1-5 min is still able to retain the carotenes at acceptable level with overall range between 539-652 mg kg–1. Carotenes,
as well as vitamin E, are among micronutrients in vegetable oils that prevent quality deterioration of oil due to their antioxidative property and thus, play an important role during food transformation and storage.
Visual observation on the colour of CPO and oil extracted from microwave heated fruits showed quite similar orangey colour (Figure 4). The orangey
ARTICLE IN
PRESS
ARTICLE IN
PRESS
ARTICLE IN
PRESS
ARTICLE IN
PRESS

685
THE EFFECT OF MICROWAVE TREATMENT AND DELAYED HARVESTING ON OIL PALM FRUITLETS (Elaeis guineensis) OIL QUALITY
colour of oil indicates the presence of carotenes. Deeper oil colour resembles higher carotene concentrations (Rusnani et al., 2012). In this study, carotenes content in oil extracted from microwave heated palm fruits (539-652 mg kg–1) is comparable to the carotenes content in CPO (500-700 mg kg–1). This explains the similarity in the colour as shown in Figure 4. In a study by Rusnani et al. (2012), higher carotene concentrations (1716-2083 mg kg–1) was found in palm pressed fibre oil (PFO) which corresponded to deep red colour. In normal practice, carotenes are degraded and removed in CPO physical refining process, where the colour of oil changed from orangey to pale yellow (Szydłowska-Czerniak et al., 2011), although the original intention of refining was to remove pigments and impurities. Removal of pigments and impurities occurred at extreme conditions (240°C-260°C) with the aid of chemicals and bleaching agents. Therefore, it is concluded that heating at shorter duration or at common sterilisation temperature of 130°C does not fully degrade the carotenes.
Harvesting of Detached Fruitlets
The yield and quality of mesocarp oil extracted from microwave heated detached fruits that were collected over 21 days since the first fruit ripened and detached from the bunch were investigated. The FFA content in oil from fruits collected in the first week was below 3%, and gradually increased to above 5% after day 12 (Figure 5a). It was also observed that after a few days, some of the fruits deteriorated on its bunch, as they were detached, but did not fall to the ground due to resistance from spikes and the position of the fruits at inner bunch.
The oil yield varied from 23.8%-50.4% (Figure 5b). However, the results may not represent the actual oil content of the FFB as the fruits from outer layer generally have thicker mesocarp, thus, contain more oil, than those from the inner FFB layer. On average,
there was an increasing trend in oil yield from 31.7% when the first fruit dropped to 50.4% on the 21st day. The oil yield, together with FFA profile, showed that while overripe fruits yield more oil, development of FFA was also rapid (7.0%, maximum) (Figure 5a).
DOBI values in oil extracted from microwaved detached fruits decreased gradually from 4-5 to 1-2 after 20 days (Figure 5c). The DOBI was badly affected after day 19 which saw it fell to below 2.3, which is the minimum level set by PORAM. However, the DOBI in this study is not as badly affected compared to deterioration of FFA as low DOBI is usually caused by prolonged fruits sterilisation, over heating of oil during storage and high percentage of unripe fruits (Jusoh et al., 2013).
Palm mesocarp oil consists of mainly triglycerides, which can be hydrolysed by lipase enzyme to form undesired FFA. The formation of FFA starts when the fruit ripened and higher FFA content can be found in overripe fruits compared to ripe and underripe fruits (Junaidah et al., 2015). The same trend is observed in this study where oil from detached fruits collected in subsequent days after the first fruit ripened and detached from the bunch had higher FFA content compared to the oil from fruits collected on the first day.
While FFA content reflects the quality of oil, DOBI, on the other hand, shows deterioration of the oil by oxidation, and determines the difficulty level of subsequent refining process (Lin and Gee, 2001). Oxidative stability determines the stability of the oil when exposed to certain condition, e.g. high temperature and air. Oxidation level can be determined using various measurements such as peroxide value and para-anisidine value. Stability is important for vegetable oils as they are commonly used for cooking and deep frying. Figure 5d shows the induction time of the oil extracted from detached fruitlets for oxidative stability test. Palm oil (olein) usually has longer induction time when subjected to Rancimat oxidative stability test for about 28 hr compared to other vegetable oils (Azmil Haizam et al., 2016). CPO’s induction time is about 15-20 hr at 120°C. It was found that the induction time for the oil obtained from microwaved detached fruitlets decreased from 15.18 hr for the detached fruits on the first day to 5.28 hr for fruits detached on the 21st
day. This finding is in parallel with the deterioration trend of antioxidants in the oil, namely vitamin E and carotenes.
Vitamin E and carotenes content in the oil extracted from daily collection of detached fruitlets are shown in Figures 5e and 5f. There is a continuous and significant decrement of vitamin E and carotenes content over the days. Vitamin E and carotenes content decreased from 771 to 206 mg kg–1 and 678 to 185 mg kg–1, respectively. This could also reflect the deterioration in the mesocarp oil as vitamin E is a fat-soluble compound with distinctive antioxidative
Figure 4. Colour difference of (a) palm fibre oil, (b) crude palm oil, and (c) mesocarp oil extracted from microwave heated palm fruits.
ARTICLE IN
PRESS
ARTICLE IN
PRESS

686
JOURNAL OF OIL PALM RESEARCH 33 (4) DECEMBER 2021
0.0
2.0
4.0
6.0
8.0
Maximum limit (5%)
0 1 2 3 4 5 6 7 8 9 10 11 12 13 14 15 16 17 18 19 20 21
Free
fatty
aci
ds (%
)
Day
0.00
2.00
3.00
4.00
5.00
6.00
1.00
Minimum limit (2.30)
0 1 2 3 4 5 6 7 8 9 10 11 12 13 14 15 16 17 18 19 20 21
DO
BI (
unit-
less
)
Day
0
10
20
30
40
50
60
0 1 2 3 4 5 6 7 8 9 10 11 12 13 14 15 16 17 18 19 20 21
Oil
yiel
ds (%
)
Day
0
200
400
600
800
1 2 3 4 5 6 7 8 9 10 11 12 13 14 15 16 17 18 19 20 21
Car
oten
e (m
g kg
–1)
Day
1 2 3 4 5 6 7 8 9 10 11 12 13 14 15 16 17 18 19 20 21
Vita
min
E (m
g kg
–1)
Day
0
5
10
15
20
25
3035
1 2 3 4 5 6 7 8 9 10 11 12 13 14 15 16 17 18 19 20 21
Indu
ctio
n tim
e (h
)Day
Common rangeCommon range
0
200
400
600
800
1 000
property that protects the oil. Decreased level of vitamin E means that the oil is less protected against oxidation. Oxidation stability of the oil conducted using Rancimat method in this study showed significant decrement of induction time from 15.18 to 5.28 hr (Figure 5d). This makes sense as the deterioration of antioxidant in the oil, namely vitamin E, reduces the oxidation stability of the oil.
Taking into consideration the quality of oil extracted from the detached fruitlets over 21 days, harvesting of only fruitlets while leaving the EFB at plantations is not a practical approach at the moment, but holds great benefits if it can be realised. Processing only the detached fruits that fell on the ground while leaving the bunch at the tree may result in higher oil recovery, but with risk of oil quality deterioration. Moreover, collecting detached fruitlets at the plantations requires additional mobile machineries and may not be feasible due to vast planting areas and variable land topographies, as well as bulky structure of the FFB.
A mechanism to separate fruitlets from the bunch may have to be developed in the future to make microwave sterilisation for palm oil processing more effective and feasible. The other way is to separate processing of oil palm fruitlets and bunches; the former sterilised using microwave and the latter using steam. Since FFB consignment consists of 8%-10% loose fruits, only a small size of microwave equipment would be required to cater for loose fruits processing. This practice could potentially reduce mill’s oil loss due to absorption of oil from mesocarp to stalk and bunch in conventional steam sterilisation.
CONCLUSION
Microwave heating of palm fruitlets had comparable effect as steam sterilisation, except that current steam sterilisation cooks the whole bunch instead of only fruitlets in microwave heating. The mesocarp
Figure 5. (a) Free fatty acid, (b) oil yield, (c) deterioration of bleachability index (DOBI), (d) Rancimat oxidative stability, (e) vitamin E, and (f) carotene content of the mesocarp oil over days.
(e)
(c)
(a)
(f)
(d)
(b)
ARTICLE IN
PRESS
ARTICLE IN
PRESS
ARTICLE IN
PRESS
ARTICLE IN
PRESS

687
THE EFFECT OF MICROWAVE TREATMENT AND DELAYED HARVESTING ON OIL PALM FRUITLETS (Elaeis guineensis) OIL QUALITY
oil extracted using n-hexane had comparable, if not, better quality than CPO with average FFA, DOBI, oxidative stability, carotenes and vitamin E content of 1.14%, 4.2% and 18.31 hr, 624 mg kg–1 and 1347 mg kg–1, respectively. Extraction of oil using solvent resulted in phosphorus being extracted as well with higher phosphorus content about 91 mg kg–1 recorded compared to 22 mg kg–1 phosphorus in oil extracted by press. High BE (3 wt%) and PA (0.5 wt%) dosages are needed to reduce the phosphorus content from 91 to 17.9 mg kg–1 which also reflects difficulty in oil refining. While its DOBI value – a rapid assessment for the ease of refining – was good, bleachability test showed otherwise. As DOBI value was widely used for mechanically pressed CPO, similar method may not be applicable to solvent-extracted oil. This is one of the key results that could be of future reference for other researchers.
Daily collection of detached fruits from the plantation may increase the capacity and thus, feasibility of microwave sterilisation. Oil production can be maximised as well due to only ripe, detached fruits are processed. However, quality of the oil obtained from such fruitlets deteriorated significantly over days due to the delayed harvesting approach. FFA, DOBI, oxidative stability, vitamin E and carotene content deteriorated from 1.3%, 4.32, 15.18 hr, 771 mg kg–1 and 678 mg kg–1 to 6.5%, 0.86, 5.28 hr, 206 mg kg–1 and 185 mg kg–1 respectively.
ACKNOWLEDGEMENT
The authors thank the Director-General of MPOB for financial support and for the approval to publish this article. We also thanked the staff of Milling Unit, MPOB for their assistance throughout the study.
REFERENCES
Ahmad Borhan, A N; Mohd Arif, S; Mohd Nasir, A; Chan, K W and Burhanuddin, A S (2004). Economic feasibility of organic palm oil production in Malaysia. Oil Palm Industry Economic J., 4: 29-38.
Ahmed, Y; Yaakob, Z; Akhtar, P and Sopian, K (2015). Production of biogas and performance evaluation of existing treatment processes in palm oil mill effluent (POME). Renew. Sust. Energ. Rev., 42: 1260-1278.
Ainie, K; Siew, W L; Tan, Y A; Nor Aini, I; Mohtar, Y; Tang, T S and Nuzul Amri, I (2005). MPOB Test Methods. MPOB, Bangi.
Azmil Haizam, A T; Karimah, A; Miskandar, M S and Choo, Y M (2016). Rancimat test for measuring the oxidative stability of cooking oils upon prolonged frying. J. Oil Palm Res., 28: 531-535.
Cheng, S F and Chuah, C H (2011). Microwave pretreatment: A clean and dry method for palm oil production. Ind. Crops Prod., 34: 967-971.
Chow, M C and Ma, A N (2007). Processing of fresh palm fruits using microwaves. J. Microw. Power Electromagn. Energy, 40: 165-173.
Corley, R H V and Tinker, P B H (2015). Care and maintenance of oil palms. The Oil Palm. Wiley Blackwell, United Kingdom. p. 290-328.
George, E A (2011). Solvent extraction: Edible oil processing. AOCS Lipid Library. https://lipidlibrary.aocs.org/edible-oil-processing, accessed on 1 January 2020. Hassanein, M M; El-Shami, S M and Hassan El-Mallah, M (2003). Changes occurring in vegetable oils composition due to microwave heating. Grasas Aceites, 54: 343-349.
Junaidah, M J; Norizzah, A R; Zaliha, O and Mohamad, S (2015). Optimisation of sterilisation process for oil palm fresh fruit bunch at different ripeness. Int. Food Res. J., 22: 275-282.
Jusoh, J M; Rashid, N A and Omar, Z (2013). Effect of sterilisation process on deterioration of bleachability index of crude palm oil extracted from different degree of oil palm ripeness. Int. J. Biosci. Biochem. Bioinforma., 3: 322-327.
Kandiah, S; Basiron, Y; Suki, A; Taha, R M; Hwa, T Y and Sulong, M (2006). Continuous sterilization: The new paradigm for modernising palm oil milling. J. Oil Palm Res., Special Issue: 144-152.
Komarov, V; Wang, S and Tang, J (2005). Permittivity and measurements. Encyclopedia of RF and microwave engineering. John Wiley and Sons, New York. p. 3693-3709.
Kushairi, A and Abd Rahim, S (2017). Innovations in oil palm mechanisation. Planter, 93: 119-130.
Kushairi, A; Loh, S K; Azman, I; Elina, H; Meilina, O A; Zainal Bidin, M N I; Razmah, G; Shamala, S and Parveez, G K A (2018). Oil palm economic performance in Malaysia and R&D progress in 2017. J. Oil Palm Res., 30: 163-195.
Lin, S W and Gee, P T (2001). Deterioration of bleachability index. Inform. AOCS, 12: 1183-1187.
Loh, S K; Nasrin, A B; Mohamad Azri, S; Nurul Adela, B; Muzzammil, N; Daryl Jay, T; Stasha Eleanor, R A; Lim, W S; Choo, Y M and Kaltschmitt, M (2017). First report on Malaysia’s experiences
ARTICLE IN
PRESS
ARTICLE IN
PRESS

688
JOURNAL OF OIL PALM RESEARCH 33 (4) DECEMBER 2021
and development in biogas capture and utilization from palm oil mill effluent under the economic transformation programme: Current and future perspectives. Renew. Sust. Energ. Rev., 74: 1257-1274.
Malheiro, R; Casal, S; Ramalhosa, E and Pereira, J A, (2011). Microwave heating: A time saving technology or a way to induce vegetable oils oxidation? Advances in induction and microwave heating of mineral and organic materials. IntechOpen, London. p. 597-614.
Ng, M H and Choo, Y M (2012). Chromatographic analyses of tocopherols and tocotrienols in palm oil. J. Chromatogr. Sci., 50: 283-286.
Nhan, P P and Hoa, N K (2013). Effect of light and storage time on vitamin E in pharmaceutical products. Br. J. Pharmacol., 4: 176-180.
Nu’man, A H and Che Rahmat, C M (2016). Prediction model based on artificial neural network for industrial bleaching and degumming process for crude palm oil. Int. J. Eng. Innov. Technol., 6: 32-38.
Parveez, G K A; Hishamuddin, E; Loh, S K; Ong-Abdullah, M; Salleh, K M; Bidin, M N I Z; Sundram, S; Hasan, Z A A and Idris, Z (2020). Oil palm economic performance in Malaysia and R&D progress in 2019. J. Oil Palm Res., 32: 159-190.
Ramli, A (2011). World palm oil supply, demand, price and prospects - Focus on Malaysian and Indonesian palm oil industries. Oil Palm Industry Economic J., 11: 13-25.
Rusnani, A M; Abdul Wahab, M and Choo, Y M (2012). Properties of residual palm pressed fibre. J. Oil Palm Res., 24: 1310-1317.
Sarah, M (2018). Carotenoids preservation during sterilization of palm fruit using microwave irradiation. ARPN J. Eng. Appl. Sci., 13: 1009-1014.
Sosa-Morales, M E; Valerio-Junco, L; López-Malo, A and García, H S (2010). Dielectric properties of foods: Reported data in the 21st century and their potential applications. LWT, 43: 1169-1179.
Statista (2019). Vegetable oils: Global consumption by oil type. https://www.statista.com/statistics/263937/vegetable-oils-global-consumption/, accessed on 1 November 2019.
Sukaribin, N and Khalid, K (2009). Effectiveness of sterilisation of oil palm bunch using microwave technology. Ind. Crops Prod., 30: 179-183.
Swoboda, P A T (1982). Bleachability and the DOBI (determination of bleachability index in palm oil). Oil Palm Bulletin, 5: 28-38.
Szydłowska-Czerniak, A; Trokowski, K; Karlovits, G and Szłyk, E (2011). Effect of refining processes on antioxidant capacity, total contents of phenolics and carotenoids in palm oils. Food Chem., 129: 1187-1192.
Umudee, I; Chongcheawchamnan, M; Kiatweerasakul, M and Tongurai, C (2013). Sterilization of oil palm fresh fruit using microwave technique. Int. J. Chem. Eng. Appl., 4: 111-113.
ARTICLE IN
PRESS
ARTICLE IN
PRESS

689
ARTICLE IN
PRESS
ARTICLE IN
PRESS
Journal of Oil Palm Research Vol. 33 (4) December 2021 p. 689-702DOI: https://doi.org/10.21894/jopr.2021.0006
CHARACTERISTICS OF RETAIL REFRIGERATED AND NON-REFRIGERATED MARGARINES/ FAT
SPREADS SOLD IN MALAYSIA
SIVARUBY KANAGARATNAM1*; TENG KIM TIU1; NUR HAQIM ISMAIL1; NORAZURA AILA MOHD HASSIM1; WAN ROSNANI AWG ISA1 and NOOR LIDA HABI MAT DIAN1
ABSTRACTMargarines/fat spreads are commonly consumed by Malaysians, however, these products lack documented quality characteristic information. This evaluation was aimed to determine the quality characteristics of retail refrigerated and non-refrigerated margarines/fat spreads sold in Malaysia. This evaluation was done via two approaches. The first approach was compilation and evaluation of information from the label of the product. The details evaluated were country of origin, type of packaging, weight of products, type of oils used, percentage of trans fatty acid (TFA) and type of fortification. The second approach was the analysis of the margarines/fat spreads which covered slip melting point (SMP), fatty acid composition (FAC), solid fat content (SFC) and texture. The labels showed that six out of the nine refrigerated margarines/fat spreads were imported and all non-refrigerated margarines/fat spreads were produced locally. The ingredient list showed that 16 out of 18 margarines/fat spreads from both segments declared the use of palm oil-based fats and most of the products were fortified with vitamins. The analysis showed that the SMP of refrigerated and non-refrigerated margarines/fat spreads ranged from 30.8°C-36.9°C and 37.1°C-40.2°C, respectively. The TFA level in the refrigerated and non-refrigerated margarines/fat spreads ranged from 0.25%-0.30% (excluding one product from Australia with 4.25%) and from 0.16%-0.43%, respectively. The SFC of refrigerated products at 5°C ranged from 11.6% and 26.4%, while non-refrigerated products at 30°C ranged from 7.7% and 13.7%. The evaluation showed that the several characteristics of the refrigerated and non-refrigerated margarines/fat spreads were substantially different despite their similar function in food applications, which were influenced by the storage temperature as the application temperatures were similar. Periodic and more extensive compilation of quality characteristic information should be carried out to provide the latest details on these products.
Keywords: fat spreads, margarines, palm oil, palm solid fats, trans fatty acids.
Received: 21 July 2020; Accepted: 26 November 2020; Published online: 23 February 2021.
INTRODUCTION
Margarines/fat spreads are commonly consumed by Malaysian, however, these products lacked the documentation of their quality characteristic
information. Margarines/fat spreads are principally a substitute for dairy-based butter and are one of the fundamental ingredients of daily diets (Yılmaz, and Ogutcu, 2015). Margarine is defined as water in oil emulsion with a minimum of 80% fat content by Food and Drug Administration (FDA), Department of Health and Human Services, USA under regulation 21CFR166.110 (FDA, 2019). The common composition of margarine is minimum of 80% fat, water is kept at a maximum of 16% and remaining 4%
1 Malaysian Palm Oil Board, 6 Persiaran Institusi, Bandar Baru Bangi, 43000 Kajang, Selangor, Malaysia.
* Corresponding author e-mail: [email protected]

690
JOURNAL OF OIL PALM RESEARCH 33 (4) DECEMBER 2021
ARTICLE IN
PRESS
ARTICLE IN
PRESS
ARTICLE IN
PRESS
ARTICLE IN
PRESS
may consist of proteins, emulsifiers, salts, flavours, colours and vitamins. Whereas, the definition of fat spreads is quite ambiguous as it may contain from 25%-70% of fats, a concept of promoting low-fat products (Young and Wassell, 2019).
Retail margarines/fat spreads are essentially packed for household use, which functions primarily as a table spread. These products are mainly used by consumers as spreads on breads, buns and pastries. These products are also a key ingredient in the preparation and baking of biscuits, cakes, cookies, doughnuts, muffins, pastries and waffles. Margarine/fat spread functioned as aeration agent and lubricant to provide the required texture and taste (Noor et al., 2017). This versatile product is also preferred and favoured as stir-frying fat, especially for preparation of fried rice, chicken rice, fried eggs, stir-fried vegetables, fried noodles and dishes, mainly for the buttery flavour, taste and mouth-feel. Margarines/fat spreads are produced using various types of plant- and animal-based oils and fats. The plant-based oils widely used in margarines/fat spreads are palm oil and its fractions, palm kernel oil and its fractions, coconut oil and liquid oils, namely soybean oil, sunflower oil, canola oil, olive oil, corn (maize) oil, groundnut oil and cottonseed oil (Adhikari et al., 2010a; Lakum and Sonwai, 2018; Lumor et al., 2010; Noor et al., 2017; Oliveira et al., 2017; Ornla-ied et al., 2016; Shin et al., 2010). Animal fats that are commonly used in margarines/fat spreads are beef tallow, mutton tallow, fish oil and lard (Rodriguez et al., 2001; Seriburi and Akoh, 1998; Silva et al., 2009).
Refrigerated margarines/fat spreads are stored in refrigerated condition to maintain their solid structure and texture. These products are spreadable straight out of the refrigerator (Lai et al., 2000). These margarines/fat spreads should not soften and resist oiling out when left at 21°C for a short period (Nor et al., 1996). Melting temperature of refrigerated margarines/fat spreads should be below body temperature and should not leave a waxy after taste in the mouth (D’Souza et al., 1992). Dropping points which indicates the melting points of the commercial refrigerated margarines/fat spreads formulated with soybean oil and canola oil from the United States (Ohio) and Canada (Ontario) were reported to range from 27.3°C-34.2°C. Solid fat content (SFC) of refrigerated margarines ranged from 10.9%-19.7% at 5°C, 8.5%-17.6% at 10°C and 9%-4.3% at 30°C (Noor and Ali, 1998; De Man et al., 1991).
Non-refrigerated margarines/fat spreads were designed to be used in tropical climate. These products are solid and spreadable at ambient temperatures which ranged from 26°C-32°C in Malaysia. The slip melting point (SMP) of commercial, non-refrigerated margarines/fat spread ranged from 38.5°C-40.1°C (Lai et al., 2000). Lai et al. (1999) stated that interesterified blends
with SMP of 35°C-37°C were suitable for non-refrigerated margarines. The SFC of these non-refrigerated margarines/fat spreads at 30°C is approximately 10% (Miskandar and Nor Aini, 2010). Reports on the characteristics of non-refrigerated margarines/fat spreads are scarce as most studies were focused on refrigerated margarines/fat spreads.
The main selection criteria of margarines/fat spreads by consumers are health benefits, taste and convenience of use. Dietary oils and fats are a major source of energy for the human body. They are important for the maintenance of general health in adults as well as growth and development in children. Oils and fats contribute to the taste, texture, and energy content of food. In the body, lipids have many roles including a source of readily available and stored energy, a structural and functional component of all cell membranes, component of cell signalling molecules and main component in the absorption of fat-soluble vitamin.
A health concern commonly associated with margarines/fat spreads are the levels of trans fatty acids (TFA), which are formed when oils and fats are partially hydrogenated to develop hard stock fat for the manufacturing of these products (Bhardwaj et al., 2011). The World Health Organisation (WHO) calls for the elimination of industrially-produced (artificial) TFA from the global food supply by 2023. In May 2018, WHO launched a program for the progressive and effective elimination of TFA called REPLACE (which comprises the crucial stages of review, promote, legislate, assess, create and enforce). An action program which provides strategic guidance for all countries to take action toward this goal of eliminating TFA (WHO, 2019; 2020). The amount of TFA reported in refined palm oil and products ranged from 0.0%-0.6% (Khatoon and Reddy, 2005; Makeri et al., 2019; Tang, 2002). Palm oil, palm kernel oil, and its fractions have positioned themselves as the best commercially available solution to successfully eliminate TFA from the food chain by 2023 (Noor et al., 2017).
Refrigerated margarines/fat spreads are well documented by researchers worldwide such as Garsetti, et al. (2013) on margarines sold in USA, Vucic et al. (2015) on margarines sold in Serbia, Bentayeb et al. (2018) on margarines sold in Algeria, Abramovic et al. (2018) on margarines sold in Slovenia and Thais et al. (2020) on margarines sold in Brazil. Non-refrigerated margarines/fat spreads are widely used and unique to Malaysian consumers, however this segment of margarines/fat spreads is not well documented. Although margarines/fat spreads are widely consumed product in Malaysia, few or no focused studies have been conducted to determine their characteristics. Hence, this evaluation was aimed to determine their quality characteristics of retail refrigerated and

691
CHARACTERISTICS OF RETAIL REFRIGERATED AND NON-REFRIGERATED MARGARINES/ FAT SPREADS SOLD IN MALAYSIA
ARTICLE IN
PRESS
ARTICLE IN
PRESS
non-refrigerated margarines/fat spreads sold in Malaysia.
This evaluation was done via two approaches. The first approach was compilation and evaluation of information from the label of the retail refrigerated and non-refrigerated margarines/fat spreads. The details such as country of origin, type of packaging, weight of products, type of oils used, percentage of saturated, monounsaturated, polyunsaturated TFA and type of fortification. The second approach was to determine physical and chemical characteristics such as the SMP, SFC, texture and fatty acid composition (FAC) of the retail refrigerated and non-refrigerated margarines/fat spreads by carrying out the respective analysis.
MATERIALS AND METHODS
Materials
Refrigerated and non-refrigerated retail margarines/fat spreads were purchased from retail outlets such as hypermarkets, supermarkets, convenience shops and grocery shops in the vicinity of Kajang, Bangi and Putrajaya, Selangor, Malaysia. These samples represent the major brands of refrigerated and non-refrigerated margarine/fats spreads sold in Malaysia. The products were limited to plant oil and fats based margarines and fat spreads, with exclusion of products based on butter, butter blends and animal fats. The refrigerated margarines/fat spreads were stored in cooler boxes during transportation. The expiration date of all margarines was at least three months after the date of analysis. The margarines/fat spreads were analysed within two months from the date of purchase. Three samples were bought for each brand of margarines/fat spreads. The retail refrigerated margarines/ fat spreads sample were labelled as RRM and retail non-refrigerated margarines/fat spreads sample were labelled as RNRM.
Product Assessment
The products’ packaging label assessment was carried out by tabulating and evaluating details such as country of origin, type of packaging, weight of products, type of oils and fats used, percentage of fat component, TFA level and type of fortification.
Slip Melting Point (SMP)
SMP was determined by Malaysian Palm Oil Board (MPOB) Test Method p4.2: 2004. Three capillary tubes were filled with 10 mm column of fat. The fat columns in the capillary tubes were chilled by rolling the ends of the tubes on a piece of ice until the column of oil solidifies. These
capillary tubes were placed in a test tube and held in a beaker of water set at 10 ± 1°C. The beaker was then transferred to a water bath and held for 16 hr at 10 ± 1ºC. These capillary tubes were later removed from the test tube and attached to a thermometer with a rubber band, in a manner that the lower ends of the tubes were at the same level of the mercury bulb of the thermometer. Subsequently, the thermometer was suspended in a beaker containing 400 ml of boiled distilled water with the lower end of the thermometer immersed in the water to a depth of 30 mm. The initial temperature of the bath was adjusted from 8°C-10°C below the expected SMP of the fats. The water was agitated with a magnetic stirrer and heat was applied to increase the temperature at a rate of 1ºC min–1, slowing down to 0.5ºC min–1 as the slip point was reached. The heating was continued until the fat column was raised. The temperature at which the fat column rose was reported as the SMP (Kuntom et al., 2005).
Fatty Acid Composition (FAC)
FAC was determined as fatty acid methyl esters (FAME). The samples (0.05 g) were weighed and dissolved in 1 ml hexane. The mixture was then added with sodium methoxide (NaOCH3) solution, 0.2 ml of NaOCH3 (2M), in anhydrous methanol and then mixed for 1 min with a vortex mixer. After sedimentation of sodium glycerolate, 1 μm of clear supernatant was injected into Rtx 2330 fused silica capillary column (60 m × 0.25 mm × 0.25 μm) (Restex Corporation, USA) and analysed using a Burker Gas Chromatography System Model 430-GC (Burker Daltonics, USA) equipped with a flame ionisation detector (FID) and Galaxie Chromatography Data System. Injection and detection temperatures were set at 240°C. The oven temperature was set at 190ºC. The column temperature was isothermal at 185°C. The carrier gas was helium with a flow rate of 1 ml min–1. The peaks were identified by comparing retention times with FAME standards and quantified using peak area normalisation methods (Kuntom et al., 2005). The fatty acid standards were from Sigma (Steinheim, Germany) and NaOCH3 solution was from Merck, Darmstadt, Germany.
Solid Fat Content (SFC)
SFC denotes the amount of solid present at a specific temperature. Determination of SFC was performed according to the MPOB Test Method p4.8: 2004 (Kuntom et al., 2005). The SFC was measured with Bruker Minispec PC 120 Pulse-Nuclear Magnetic Resonance (p-NMR) (Karlsruhe, Germany). Samples were totally melted at 80°C to erase crystal memory. The totally melted samples were homogenised and filled into tubes (10 mm o.d × 75 mm length) up to 3 cm in height. The samples

692
JOURNAL OF OIL PALM RESEARCH 33 (4) DECEMBER 2021
ARTICLE IN
PRESS
ARTICLE IN
PRESS
ARTICLE IN
PRESS
ARTICLE IN
PRESS
were tempered at 70°C in a water bath for 30 min, before chilling at 0°C for 90 min. These tubes were conditioned in pre-equilibrated thermostat baths for 30 min prior to the measurement at the selected temperatures of 0, 5, 10, 15, 20, 25, 30, 35, 40 and 45°C. This temperature range comprises of the SFC profile range of refrigerated (5°C-25°C) and non-refrigerated margarines/fat spreads (25°C-35°C). The direct method was employed for the measurements.
Texture
Texture analyser model TA.XT.plus (Stable Microsystems, United Kingdom) was used to determine the hardness and compression values of the refrigerated and non-refrigerated margarines/fat spreads. The puncture test was performed using a 5-mm-diameter cylindrical probe (probe P/5) with a 5 kg maximum load cell. A penetration distance of 12 mm at a pre-test speed of 1.0 mm s–1 and a post-test speed of 1.0 mm s–1 was selected and applied. The force applied was 100 g and the mode of testing was by compression. The texture measurements were carried out at 5°C for refrigerated product and 30°C for non-refrigerated product. The maximum force used during compression was recorded as hardness. The texture analysis graphs resulting from the penetration, plots a positive force area which provides the compression force value (Lumor et al., 2010; Vithanage et al., 2009).
RESULTS AND DISCUSSION
Product Assessment Based on Label
Selected details such as country of origin, type of packaging, weight of products (packing size), type of oils and fats used, percentage of fat component, percentage of TFA and type of fortifications are tabulated in Tables 1 and 2.
The country of origin of the refrigerated margarines/fat spreads as shown in Table 1 indicated that five out of nine products were imported from Australia (RRM 01 to 05), one from the United Kingdom (RRM 06) and three were produced in Malaysia (RRM 07 to 09). The trend denotes that this segment was mainly dominated by imported products. These refrigerated margarines/fat spreads were packed in tubs of various sizes (240, 250, 480 and 500 g). Seven out of the nine products were fat spreads (RRM 01 to RRM 07) and two products were margarines (RRM 08 to RRM 09). The percentage of fat component ranged from 60.0%-69.0% in the Australian products, 75.0% in the United Kingdom product and 79.6%-82.3% for the Malaysian products, denoting that imported products had lesser fat than Malaysian products.
Seven out of nine refrigerated margarines/fat spreads stated the inclusion of palm oil and/or palm kernel oil-based fats as their ingredient.
Palm oil and palm kernel oil-based fats are preferred as margarine fat as they are natural solid fat, TFA free hardstock with high oxidative stability, making it an excellent alternative to hydrogenated fats. These fats are able to provide structural character with the capability to impart the required level of plasticity and body to the margarines/fat spreads (Fomuso and Akoh, 2001; Ghosh and Bhattacharyya, 1997; Inna and Roman, 2020; Ming et al., 1999; Müller et al., 1998; Patel et al., 2016). Furthermore, the ability of palm oil to crystallise as beta prime polymorph has made it an even more appealing choice for the production of margarine fat (Saadi et al., 2010).
The TFA are of major concern in margarines/fat spreads as studies showed that TFA have adverse health effects especially on coronary heart disease (Mensink and Katan, 1990; Willett et al., 1993). The percentage of TFA stated on the labels ranged from 0.2%-1.5%. This range excludes RRM 02 from Australia and RRM 06 from the United Kingdom as the percentage of TFA were not declared on their labels, as shown in Table 1. Most of the margarines/fat spreads were fortified with vitamins, except RRM 06 from the United Kingdom, which did not declare any type of fortification on its label. The fortification was mostly with vitamin A and D, except RRM 02 from Australia, which was fortified with only vitamin D. Fortification of Omega 3 was stated in four out of these nine products, which were two from Australia (RRM 01 and 03) and two from Malaysia (RRM 07 and 09). It is notable that RRM 08 from Malaysia was fortified with nine vitamins namely, vitamin A, B1, B2, B6, B12, D, E, folic acid and niacin.
Table 2 shows that all nine non-refrigerated margarines/fat spreads marketed in Malaysia were produced locally (RNRM 01 to 09), denoting that this segment is totally dominated by Malaysian products. The packaging and size of non-refrigerated margarines/fat spreads varied extensively. These non-refrigerated margarines/fat spreads were packed in tubs, tins, pails and pouch bags of various sizes/weight. The percentage of fat component varied from 78%-83%. All the nine non-refrigerated margarines/fat spreads stated the inclusion of palm oil-based oils and fats in their formulation. Five margarines/fat spreads (RNRM 01, 02, 03, 04 and 07) have listed palm kernel oil-based fats as one of their fat components. Palm and palm kernel-based fats are able to provide the structural requirement of fats blends in margarines/fat spreads (Nor and Miskandar, 2007; Patel et al., 2016). The percentage of TFA stated on the labels ranged from 0.0%-0.4%. RNRM 06 and 08, which were packed in pouch bags, did not declare

693
CHARACTERISTICS OF RETAIL REFRIGERATED AND NON-REFRIGERATED MARGARINES/ FAT SPREADS SOLD IN MALAYSIA
ARTICLE IN
PRESS
ARTICLE IN
PRESS
TABLE 1. DETAILS OF REFRIGERATED MARGARINES/FAT SPREADS FROM THE PACKAGING LABEL
Margarine code
Country of
origin
Type of packaging
Weight of
product
Type of oil Percentage of fat
(per 100 g)
Trans fatty acid
(per 100 g)
Type of fortification
RRM 01 Australia Tub 500 g Vegetable oils(49% canola oil and fully hydrogenated palm oil)
63.0 0.2 g Vitamin A, D and Omega 3
(ALA: alpha linolenic acid)
RRM 02 Australia Tub 250 g and
500 g
Vegetable oils(may contain soybean oil and
partially hydrogenated)
60.0 Not stated Vitamin D
RRM 03 Australia Tub 500 g Sunflower, palm, rapeseed and linseed oils
69.0 1.0 g Vitamin A, D, Omega 3 and Omega 6
RRM 04 Australia Tub 500 g Vegetable oils(minimum 20% olive oil and fully
hydrogenated palm oil)
63.0 0.2 g Vitamin A and D
RRM 05 Australia Tub 500 g Vegetable oils(19% olive oil)
65.0 0.3 g Vitamin A and D
RRM 06 UnitedKingdom
Tub 500 g Vegetable oils (29% sunflower, rapeseed and palm oil)
75.0 Not stated None
RRM 07 Malaysia Tub 250 g and
500 g
Rapeseed oil, palm fractions, sunflower oil and palm kernel oil
79.6 1.5 g Vitamin A, D, EDocosahexaenoic
acid (DHA), Omega 3 and Omega 6
RRM 08 Malaysia Tub 240 g and
480 g
Rapeseed oil, palm fraction, soybean oil and palm kernel oil
82.0 0.7 g Vitamin A, B1,B2, B6, B12, D, E, folic acid
and niacin
RRM 09 Malaysia Tub 500 g Vegetable oils (canola and palm oil)
82.3 < 0.5 g Vitamin A, D, E and Omega 3
Note: RRM - retail refrigerated margarines/fat spreads.
TABLE 2. DETAILS OF NON-REFRIGERATED MARGARINES/FAT SPREADS FROM THE PACKAGING LABEL
Margarine code
Country of
origin
Type of packaging
Weight of product
Type of oil Percentage of fat
(per 100 g)
Trans fatty acid
(per 100 g)
Type of fortification
RRM 01 Malaysia Tub and tin
240 g tub 480 g tub
1.0 kg tin can2.5 kg tin can
4.8 kg pail
Vegetable oils (palm oil, palm kernel oil and fully
hydrogenated palm stearin)
82.0 0.0 g Vitamin A, D, E, B1, B2, B3, B6, B12, and
folic acid
RRM 02 Malaysia Tub 240 g tub 480 g tub
1.0 kg tin can2.5 kg tin can
Palm oil, palm kernel oil, palm fractions and partially hydrogenated palm fraction
81.4 0.4 g Vitamin A, D, E, B1, B2, B6, B12, niacin
and folic acid
RRM 03 Malaysia Pail 1.0 kg pail4.8 kg pail
Palm oil and palm kernel oil 78.0 0.0 g Vitamin A, D, E, B1, B2, B6, B12 and niacin
RRM 04 Malaysia Tub 240 g tub 480 g tub
2.5 kg pail
Palm oil and palm kernel oil 83.0 0.0 g Vitamin A, D, E, B1, B2, B6, B12, niacin
and folic acid
RRM 05 Malaysia Tub 250 g tub Vegetable oils and fats (palm and soybean)
81.4 0.0 g Vitamin A, D and E
RRM 06 Malaysia Pouch bag
1.0 kg pouch bag
Oils and fats (palm) 81.5 Not stated None
RRM 07 Malaysia Pouch bag
1.0 kg pouch bag
Palm oil, palm stearin and palm kernel oil
83.0 0.0 g Vitamin E
RRM 08 Malaysia Pouch bag
1.0 kg pouch bag
Palm oil and palm fraction 82.0 Not stated None
RRM 09 Malaysia Pouch bag
1.0 kg pouch bag
Vegetable oils and fats (palm) 81.7 0.2 g None
Note: RNRM - retail non-refrigerated margarines/fat spreads.

694
JOURNAL OF OIL PALM RESEARCH 33 (4) DECEMBER 2021
ARTICLE IN
PRESS
ARTICLE IN
PRESS
ARTICLE IN
PRESS
ARTICLE IN
PRESS
the content of TFA on their labels. Six products were fortified with vitamins and three products which were RNRM 06, 07 and 09, packed in pouch bags, did not state any type of fortification. It is notable that RNRM 01, 02, 03 and 04 were fortified with eight to nine vitamins namely vitamin A, B1, B2, B6, B12, D, E, folic acid and niacin.
Slip Melting Point (SMP)
SMP is defined as the temperature at which the fats and oils have 4% solid fat (Karabulut et al., 2004). The SMP of refrigerated margarines/fat spreads ranged from 30.8°C-36.9°C (Table 3). These products are stored in the refrigerator and are spreadable straight from the refrigerator, nevertheless, these products are required to remain stable at ambient temperatures (26°C-30°C) for a short period of time. Hence, the high SMP over 30°C will assist the products to remain stable as well as resist structural deformation for this short period of time, when the product is exposed to ambient temperature upon usage (Nor et al., 1996).
The SMP of non-refrigerated margarines/fat spreads ranged from 37.1°C-40.2°C (Table 3). The higher SMP of the non-refrigerated products were essential for the products to remain stable and solid at ambient temperatures during storage and usage. In Malaysia, the ambient temperature ranges from 26°C-30°C throughout the year, hence, it is crucial that the SMP of these products were 5°C-12°C above ambient temperatures to provide structural stability (Roseli and Akhir, 2019; Sivaruby et al., 2013; Tang, 2019).
Fatty Acid Composition (FAC)
FAC of refrigerated margarines/fat spreads are shown in Table 4. The percentage of monounsaturated fatty acids (MUFA) was high,
ranged from 41.86%-57.81%. Polyunsaturated fatty acids (PUFA) percentage ranged from 15.62%-30.11%. Hence, the total amount of unsaturated fatty acids (USAFA) were in the range of 62.26%-75.55%. The high amount of unsaturated fatty acids assist in lowering the amount of solid fats at the storage temperature of 5°C, which in turn facilitate ease of spreading. The saturated fatty acid (SAFA) percentage detected ranged from 20.28%-35.44%. SAFA provides the structure and functionality properties of the margarines/fat spreads (Patel et al., 2020). This range was similar to values reported by other researchers. Vucic et al. (2015) report that soft margarine from Serbia had SAFA ranging from 22.76%-41.09%, Abramovic et al. (2018) reported the SAFA values of 29 out of 43 margarine evaluated from Solvenia ranged from 22.6%-39.3%, Bentayeb et al. (2018) reported that SAFA of Algerian tub margarine ranged from 25.42%-43.55% and Thais et al. (2020) reported SAFA values ranging from 21.94%-31.84% in margarines/fats spreads sold in Brazil. Refrigerated margarines/fat spreads require less SAFA to acquire its spreadable texture as it is produced, transported and stored at refrigerated temperature of approximately 5°C. The TFA of these refrigerated margarines/fat spreads ranged from 0.13%-0.30%. However, 4.25% of TFA was detected in RRM 02, denoting that partially hydrogenated fats were used in the fat composition of this product. Abramovic et al. (2018), who evaluated TFA in margarines in Slovenia reported similar TFA values which ranged from 0.1%-0.8% in 41 out of 43 margarine products analysed and conversely, two margarine products had 3.1% and 6.4% of TFA. Thais et al. (2020) also reported TFA values ranging from 0.91%-1.62% in 11 out of 13 margarines/fats spreads sold in Brazil. The two other margarines/fats spreads had TFA values of 6.22% and 9.14%, respectively. SAFA and TFA in the hardstock provide structure to margarines/fat spreads (Alonso
TABLE 3. SLIP MELTING POINT OF REFRIGERATED AND NON-REFRIGERATED MARGARINES/FAT SPREADS
Refrigerated margarines/fat spreads Non-refrigerated margarines/fat spreads
Code Slip melting point (°C) Code Slip melting point (°C)
RRM 01 32.1 ± 0.8 RNRM 01 38.3 ± 1.0
RRM 02 31.2 ± 0.2 RNRM 02 37.6 ± 0.9
RRM 03 32.3 ± 0.0 RNRM 03 43.9 ± 0.1
RRM 04 31.7 ± 0.2 RNRM 04 37.1 ± 0.4
RRM 05 32.4 ± 0.6 RNRM 05 37.2 ± 0.8
RRM 06 35.6 ± 0.1 RNRM 06 39.1 ± 0.9
RRM 07 36.9 ± 0.2 RNRM 07 39.8 ± 0.5
RRM 08 36.9 ± 0.2 RNRM 08 40.2 ± 0.5
RRM 09 30.8 ± 0.1 RNRM 09 39.1 ± 0.2
Note: RRM - retail refrigerated margarines/fat spreads; RNRM - retail non-refrigerated margarines/fat spreads; RRM 01-05 - Australia; RRM 06 - United Kingdom; RRM 07-09 - Malaysia; RNRM 01-09 - Malaysia.

695
CHARACTERISTICS OF RETAIL REFRIGERATED AND NON-REFRIGERATED MARGARINES/ FAT SPREADS SOLD IN MALAYSIA
ARTICLE IN
PRESS
ARTICLE IN
PRESS
TABLE 4. FATTY ACID COMPOSITION OF RETAIL REFRIGERATED MARGARINES/FAT SPREADS
RRM 01 RRM 02 RRM 03 RRM 04 RRM 05 RRM 06 RRM 07 RRM 08 RRM 09
C 8:0 0.26 ± 0.00 0.2 ± 0.00 0.23 ± 0.00 0.23 ± 0.00 0.14 ± 0.01 0.11 ± 0.00 0.00 ± 0.00 0.14 ± 0.00 0.00 ± 0.00
C10:0 0.39 ± 0.00 0.17 ± 0.00 0.28 ± 0.00 0.27 ± 0.00 0.22 ± 0.00 0.16 ± 0.00 0.00 ± 0.00 0.00 ± 0.00 0.00 ± 0.00
C12:0 5.75 ± 0.02 1.56 ± 0.01 4.09 ± 0.10 4.07 ± 0.08 4.47 ± 0.24 2.41 ± 0.17 0.09 ± 0.00 4.88 ± 0.27 0.04 ± 0.00
C14:0 2.05 ± 0.01 0.80 ± 0.00 1.55 ± 0.07 1.50 ± 0.04 1.72 ± 0.11 1.04 ± 0.18 0.31 ± 0.01 1.73 ± 0.03 0.31 ± 0.00
C16:0 11.30 ± 0.11 10.47 ± 0.21 9.77 ± 0.24 10.93 ± 0.01 11.52 ± 0.29 15.45 ± 0.31 14.58 ± 0.26 20.47 ± 0.25 16.2 ± 0.21
C18:0 7.69 ± 0.16 6.35 ± 0.11 6.82 ± 0.20 6.66 ± 0.17 6.59 ± 0.33 3.03 ± 0.11 4.07 ± 0.09 3.50 ± 0.26 2.77 ± 0.28
C 20:0 4.15 ± 0.03 0.51 ± 0.02 2.03 ± 0.09 1.43 ± 0.02 3.19 ± 0.14 2.94 ± 0.11 4.53 ± 0.18 4.44 ± 0.12 6.44 ± 0.24
C 22:0 0.27 ± 0.00 0.21 ± 0.00 0.49 ± 0.01 0.38 ± 0.01 0.33 ± 0.01 0.44 ± 0.01 0.38 ± 0.02 0.19 ± 0.00 0.23 ± 0.00
C 24:0 0.13 ± 0.00 0.00 ± 0.00 0.18 ± 0.00 0.13 ± 0.01 0.13 ± 0.01 0.14 ± 0.00 0.15 ± 0.00 0.09 ± 0.00 0.11 ± 0.00
SAFA 31.98 ± 0.21 20.28 ± 0.17 25.45 ± 0.27 25.62 ± 0.18 28.30 ± 0.29 25.72 ± 0.21 24.11 ± 0.27 35.44 ± 0.33 26.1 ± 0.29
C 16:1n9 0.19 ± 0.00 0.16 ± 0.00 0.11 ± 0.00 0.35 ± 0.01 0.26 ± 0.00 0.13 ± 0.00 0.18 ± 0.00 0.15 ± 0.00 0.19 ± 0.01
C 18:1n9 40.75 ± 0.29 51.12 ± 0.31 33.69 ± 0.23 51.13 ± 0.23 45.88 ± 0.31 42.15 ± 0.23 42.06 ± 0.32 43.71 ± 0.34 56.81 ± 0.37
C 20:1n9 0.92 ± 0.01 0.65 ± 0.00 0.35 ± 0.00 0.32 ± 0.00 0.40 ± 0.00 0.62 ± 0.00 0.83 ± 0.00 0.47 ± 0.00 0.81 ± 0.00
MUFA 41.87 ± 0.31 51.93 ± 0.31 34.15 ± 0.24 51.80 ± 0.24 46.54 ± 0.31 42.9 ± 0.23 43.10 ± 0.33 44.34 ± 0.34 57.81 ± 0.38
C 18:2n6 19.82 ± 0.11 17.71 ± 0.01 39.28 ± 0.33 21.67 ± 0.21 23.75 ± 0.22 29.84 ± 0.32 29.58 ± 0.23 18.32 ± 0.24 15.07 ± 0.33
C 18:3n3 0.58 ± 0.00 5.91 ± 0.08 0.33 ± 0.00 0.38 ± 0.00 0.41 ± 0.01 0.27 ± 0.00 0.52 ± 0.00 0.42 ± 0.03 0.55 ± 0.01
PUFA 20.40 ± 0.11 23.62 ± 0.09 39.61 ± 0.33 22.04 ± 0.23 24.16 ± 0.23 30.13 ± 0.33 30.12 ± 0.24 18.75 ± 0.27 15.62 ± 0.36
C 18:1n9t 0.12 ± 0.00 3.87 ± 0.24 0.14 ± 0.00 0.17 ± 0.01 0.15 ± 0.01 0.05 ± 0.00 0.00 ± 0.00 0.05 ± 0.00 0.05 ± 0.00
C 18:2n6t 0.06 ± 0.00 0.38 ± 0.00 0.07 ± 0.00 0.08 ± 0.00 0.04 ± 0.00 0.13 ± 0.00 0.30 ± 0.02 0.19 ± 0.01 0.08 ± 0.00
TFA 0.18 ± 0.01 4.25 ± 0.24 0.21 ± 0.02 0.25 ± 0.01 0.19 ± 0.01 0.18 ± 0.01 0.30 ± 0.02 0.24 ± 0.01 0.13 ± 0.01
Note: RRM - retail refrigerated margarines/fat spreads; SAFA - saturated fatty acids; MUFA - monounsaturated fatty acids; PUFA - polyunsaturated fatty acids; TFA - trans fatty acid; RRM 01-05 - Australia; RRM 06 - United Kingdom; RRM 07-09 - Malaysia.
et al., 2000; Tekin et al., 2002). RRM 01 to RRM 09 (excluding RRM 02), had SAFA ranging from 25.24%-35.44% with TFA ranging from 0.13%-0.30%. Hence, principally SAFA played a dominant part as the structure provider in these margarines/fat spreads. On the other hand, in the case of RRM 02, the combination of SAFA and TFA of 20.28% and 4.25%, respectively, provided the required structure to the fat spread.
High amounts of SAFA, ranging from 50.43%-59.39% were detected in non-refrigerated margarines/fat spreads (Table 5). Non-refrigerated margarines/fat spreads require higher amounts of SAFA to form and retain its solid and spreadable texture at ambient storage temperature of 26°C-30°C. Bentayeb et al. (2018) reported that SAFA of Algerian stick margarine ranged from 46.70%-54.287% and Abramovic et al. (2018) reported the SAFA values of 14 out of 43 margarine evaluated from Solvenia ranged 45.0%-55.7%. The percentage of MUFA and PUFA in these non-refrigerated margarines/fat spreads ranged from 29.50%-39.73% and 7.73%-12.52%, respectively. Thus, the total amount of USAFA ranged from 39.90%-49.50%. Meanwhile, the percentage of TFA ranged from 0.16%-0.43%, indicating that partially hydrogenated fats were not used in the non-refrigerated margarines/fat spreads, which were produced in Malaysia.
Solid Fat Content (SFC)
SFC values are commonly used as indicators to characterise the physical properties of oils and fats, and their blends. Physical properties of margarines/fat spreads such as general appearance, ease of spreading (hardness), organoleptic properties (mouthfeel) and oil exudation to a great extent, is influenced by SFC (Adhikari et al., 2010a; 2010b; Jeung et al., 2008; Noor and Ali, 1998). The SFC indicates the solid to liquid ratio or amount of fat crystals present in a fat blend at a specific temperature (Marangoni and Rousseau, 1995). Hence, SFC profile of the fat determines its usage in a particular temperature range.
The characteristic of refrigerated margarines/fat spreads which are solid (solid paste) and spreadable straight from the refrigerator (5°C), is facilitated by the low percentage of SFC at 5°C. The SFC of the refrigerated margarines/fat spreads at 5°C ranged from 11.6%-26.4% as shown in Figure 1. The SFC below 30% at 5°C facilitated ease of spreading of these products straight out of refrigeration. The other crucial requirement is that these margarines/fat spreads should neither deform nor oil out at temperatures of 26°C-30°C, which are the common usage temperatures of these products. The SFC at 25°C and 30°C ranged from 4.2%-6.6% and from

696
JOURNAL OF OIL PALM RESEARCH 33 (4) DECEMBER 2021
ARTICLE IN
PRESS
ARTICLE IN
PRESS
ARTICLE IN
PRESS
ARTICLE IN
PRESS
2.17%-4.93%, respectively. These SFC values provide the sufficient amount of SFC in order to retain their structure and texture. These values are in line with findings reported by Nor et al. (1996) which were 3.4 to 7.2 at 30°C. The SFC profiles of these refrigerated margarines/fat spreads enable these products to be spreadable at refrigeration temperatures as well as retaining its structure without any deformities when exposed to ambient temperatures for a short period during usage (Cheong et al. 2009). Karabulut et al. (2004) stated that the waxy aftertaste in the mouth could be avoided if the margarine had SFC below 3.5% at 33.3°C and melting completely at body temperature. Tekin et al. (2002) reported SFC of 1.8 to 3.1 at 33.3°C of retail margarine and Karabulut and Turan (2006) reported SFC values of 0.0 to 3.6 at 35°C for retail tub margarine. Figure 1 showed that the SFC of all nine refrigerated margarines/fat spreads were below 2.5% at 35°C, hence enabling elimination of waxy aftertaste in the mouth.
Non-refrigerated margarines/fat spreads had a higher SFC profile than refrigerated margarines/fat spreads, as these type of products are used and stored at ambient temperature of between 25°C-30°C (Roseli and Akhir, 2019; Tang, 2019). The SFC of RNRM as shown in Figure 2. The SFC of RNRM at 25°C and 30°C ranged from 11.4%-19.7% and from 7.71%-13.66%, respectively. The SFC of
non-refrigerated margarines/fat spreads below 20% enables it to be spreadable at 25°C. The SFC at 40°C ranged from 2.89%-6.7%, of which this high SFC values assisted non-refrigerated margarines/fat spreads to retain its structure and texture at this temperature.
Texture
Texture is defined as sensorial and functional characteristic of the structural, mechanical, and surface properties of foods that can be identified by senses of sight (visual texture), sound (auditory texture), touch (tactile texture) and kinesthetics (Szczesniak, 2002). Margarines/fat spreads are served to consumers with solid paste texture. This texture is an important property of margarines/fat spreads as it facilitates their spreading ability which strongly influences the perceived quality of these food products (Yılmaz and Ogutcu, 2015). The sensory attributes such as spreadability, mouthfeel and texture of the food containing significant amount of fats are dependent on the microstructural properties of the fat system (Campos et al., 2002; Narine and Marangoni, 1999a; 1999b; 1999c) and processing parameters (Lefebure et al., 2013; Soronja-Simovic et al., 2017). Spreadability, which is the crucial rheological
TABLE 5. FATTY ACID COMPOSITION OF RETAIL NON-REFRIGERATED MARGARINES/FAT SPREADS
RRM 01 RRM 02 RRM 03 RRM 04 RRM 05 RRM 06 RRM 07 RRM 08 RRM 09
C 8:0 0.77 0.74 ± 0.04 0.43 ± 0.04 0.51 ± 0.02 0.83 ± 0.03 0.75 ± 0.02 0.30 ± 0.00 0.00 ± 0.00 0.21 ± 0.00
C10:0 0.87 0.75 ± 0.00 0.66 ± 0.00 0.60 ± 0.00 1.03 ± 0.10 0.59 ± 0.00 0.42 ± 0.00 0.00 ± 0.00 0.29 ± 0.00
C12:0 13.47 12.37 ± 0.11 10.12 ± 0.19 9.73 ± 0.20 15.70 ± 0.25 2.05 ± 0.16 6.33 ± 0.08 0.23 ± 0.00 4.28 ± 0.10
C14:0 5.27 4.86 ± 0.04 4.29 ± 0.06 4.00 ± 0.06 5.76 ± 0.09 1.30 ± 0.13 2.98 ± 0.05 1.04 ± 0.02 2.30 ± 0.07
C16:0 33.81 33.71 ± 0.30 38.31 ± 0.16 37.19 ± 0.30 27.09 ± 0.28 42.99 ± 0.28 41.75 ± 0.27 44.42 ± 0.22 42.40 ± 0.26
C18:0 4.99 4.13 ± 0.07 4.15 ± 0.09 4.21 ± 0.15 5.67 ± 0.16 4.31 ± 0.17 4.34 ± 0.10 4.44 ± 0.07 4.76 ± 0.15
C 20:0 0.11 0.12 ± 0.00 0.16 ± 0.00 0.25 ± 0.00 1.27 ± 0.05 0.34 ± 0.01 0.16 ± 0.00 0.18 ± 0.00 0.16 ± 0.00
C 22:0 0.06 0.08 ± 0.00 0.06 ± 0.00 0.06 ± 0.00 0.11 ± 0.00 0.07 ± 0.00 0.06 ± 0.00 0.07 ± 0.00 0.06 ± 0.00
C 24:0 0.07 0.06 ± 0.00 0.06 ± 0.00 0.06 ± 0.00 0.07 ± 0.00 0.07 ± 0.00 0.05 ± 0.00 0.07 ± 0.00 0.06 ± 0.00
SAFA 59.39 56.79 ± 0.22 58.22 ± 0.21 56.58 ± 0.28 57.51 ± 0.26 52.46 ± 0.27 56.39 ± 0.23 50.43 ± 0.23 54.50 ± 0.00
C 16:1n9 0.12 0.13 ± 0.00 0.14 ± 0.00 0.14 ± 0.00 0.11 ± 0.00 0.17 ± 0.00 0.14 ± 0.00 0.16 ± 0.00 0.15 ± 0.00
C 18:1n9 31.92 31.20 ± 0.19 33.30 ± 0.32 34.24 ± 0.19 29.20 ± 0.22 37.43 ± 0.26 34.69 ± 0.25 39.43 ± 0.31 36.10 ± 0.22
C 20:1n9 0.13 0.13 ± 0.00 0.13 ± 0.00 0.14 ± 0.00 0.19 ± 0.00 0.14 ± 0.00 0.13 ± 0.00 0.14 ± 0.00 0.13 ± 0.00
MUFA 32.17 31.45 ± 0.22 33.57 ± 0.33 34.53 ± 0.20 29.90 ± 0.24 37.83 ± 0.28 34.98 ± 0.27 39.73 ± 0.32 36.38 ± 0.23
C 18:2n6 7.42 9.17 ± 0.11 7.35 ± 0.09 7.78 ± 0.16 12.21 ± 0.22 9.56 ± 0.19 7.90 ± 0.10 9.40 ± 0.21 8.27 ± 0.18
C 18:3n3 0.31 0.29 ± 0.00 0.31 ± 0.00 0.34 ± 0.00 0.31 ± 0.00 0.34 ± 0.01 0.32 ± 0.00 0.37 ± 0.01 0.33 ± 0.00
PUFA 7.73 9.46 ± 0.09 7.66 ± 0.10 8.12 ± 0.17 12.52 ± 0.23 9.90 ± 0.20 8.22 ± 0.11 9.77 ± 0.20 8.60 ± 0.20
C 18:1n9t 0.08 0.25 ± 0.00 0.07 ± 0.00 0.00 ± 0.00 0.35 ± 0.01 0.08 ± 0.00 0.05 ± 0.00 0.07± 0.00 0.07 ± 0.00
C 18:2n6t 0.18 0.13 ± 0.00 0.09 ± 0.00 0.09 ± 0.00 0.08 ± 0.00 0.14 ± 0.00 0.11 ± 0.00 0.11 ± 0.00 0.10 ± 0.00
TFA 0.26 0.37 ± 0.01 0.16 ± 0.01 0.09 ± 0.00 0.43 ± 0.02 0.21 ± 0.00 0.16 ± 0.00 0.18± 0.00 0.17 ± 0.01
Note: RRM - retail refrigerated margarines/fat spreads; SAFA - saturated fatty acids; MUFA - monounsaturated fatty acids; PUFA - polyunsaturated fatty acids; TFA - trans fatty acid; RRM 01-05 - Australia; RRM 06 - United Kingdom; RRM 07-09 - Malaysia.

697
CHARACTERISTICS OF RETAIL REFRIGERATED AND NON-REFRIGERATED MARGARINES/ FAT SPREADS SOLD IN MALAYSIA
ARTICLE IN
PRESS
ARTICLE IN
PRESS
property of these products, is mainly dependent on the composition of fat blends that is influenced by SFC and morphology of the fat crystal network and dictated by the processing parameter applied (Campos et al., 2002; DeMan et al., 1991; Tang and Marangoni, 2007). Hence, spreadability of these products is significantly influenced by the hardness and compression values of the margarines/fat spreads at a specific temperature. The increase in hardness and compression values relates to the difficulty in spreading (Davey and Jones, 1985). The compression or cohesiveness (consistency) is a measure of intermolecular strength, indicating the
strength of internal bonds making up the body of the food and the degree to which it can be deformed (Rodriguez et al., 2001).
Tables 6 and 7 show the hardness and compression values of refrigerated and non-margarines/fat spreads from texture analysis carried out at 5°C and 30°C, accordingly. The hardness and compression values (reflect consistency) of refrigerated margarines/fat spreads at 5°C ranged from 61.41 ± 1.29 g to 366.98 ± 9.63 g and from 617.64 ± 13.81 g s–1 to 3016.64 ± 654.38 g s–1. It was observed that these ranges of hardness and compression values facilitated spreading of refrigerated margarines/fat
0.00
5.00
10.00
15.00
20.00
25.00
30.00
35.00
0 10 20 30 40 50
Sol
id fa
t con
tent
(%)
Temperature (°C)
RRM 01
RRM 02
RRM 03
RRM 04
RRM 05
RRM 06
RRM 07
RRM 08
RRM 09
Note: RRM 01-05 - Australia; RRM 06 - United Kingdom; RRM 07-09 - Malaysia; RRM - retail refrigerated margarines/fat spreads.
Figure 1. Solid fat content profile of retail refrigerated margarines/fat spreads.
Note: RNRM - retail non-refrigerated margarines/fat spreads; RRM 01-09 - Malaysia.
Figure 2. Solid fat content profile of retail non-refrigerated margarines/fat spreads.
Temperature (°C)
0
10
20
30
40
50
60
70
80
0 10 20 30 40 50
Sol
id fa
t con
tent
(%)
RNRM 01
RNRM 02
RNRM 03
RNRM 04
RNRM 05
RNRM 06
RNRM 07
RNRM 08
RNRM 09

698
JOURNAL OF OIL PALM RESEARCH 33 (4) DECEMBER 2021
ARTICLE IN
PRESS
ARTICLE IN
PRESS
ARTICLE IN
PRESS
ARTICLE IN
PRESS
spreads straight from the refrigeration temperature of 5°C. On the other hand, the hardness and compression values of non-refrigerated margarines/fat spreads at 30°C (stored and used temperature) ranged from 38.06 ± 0.45 g to 273.97 ± 3.42 g and from 328.01 ± 2.31 g to 2051 ± 141.83 g, respectively. The hardness and compression values of non-refrigerated margarines/fat spreads at 30°C were lower than the values of refrigerated margarines/fat spreads at 5°C, indicating softer product at application temperature.
It was observed that the products packed in tins, tubs and pails were softer than those packed in pouch bags. Non-refrigerated margarines/fat spreads filled in tubs, tins and pails had hardness and compression values ranging from 38.06 ± 0.45 g to 135.71 ± 0.76 g and from 367.26 ± 5.94 g s–1 to 1353.86 ± 41.57 g s–1, respectively and non-refrigerated margarines/fat spreads packed in pouch bags had hardness and compression values
ranged from 155.52 ± 3.26 g to 273.97 ± 3.42 g and from 1557.09 ± 39.30 g s–1 to 2051.99 ± 141 g s–1, respectively. This is due to the fact that margarines/fat spreads in the pouch bags need to withstand pressure during transportation and storage without deformation as the packaging material was merely a thin film of plastic (low density polyethylene, LDPE) as compared to tins, tubs and pails, which were able to provide better protection to the products.
Hardness and compression values of the refrigerated and non-refrigerated margarines/fat spreads did not show direct association with the SMP, SFC and FAC of these products. Braipson and Deroanne (2004) also found no linear relationship between hardness and SFC. Variation in hardness and compression value must be due to the variation in the processing conditions, which determines the crystal structure and network that establishes the strength of the texture (DeMan et al., 1991; Di Bari et al., 2014; Young and Wassell, 2019).
CONCLUSION
The characteristics of refrigerated and non-refrigerated margarines/fat spreads sold in Malaysia varied substantially, as the products were influenced by the temperature at which these products were stored. In this evaluation, two approaches were carried out to determine the variation between refrigerated and non-refrigerated margarines/fat spreads sold in Malaysia. The first approach was the evaluation of the information on the labels of the products. Details from the labels denote that the refrigerated margarines/fat spreads were dominated by imported products while all the non-refrigerated margarines/fat spreads were produced locally. Palm oil- and palm kernel-based oils were used as fat components in seven out of nine refrigerated and all nine non-refrigerated margarines/fat spreads. Hence, palm oil-based fats are the preferred fat in this product. Palm oil-based fats are able to deliver the functionality of partially hydrogenated fats in margarines/fat spreads, hence drastically reducing TFA. Most of the refrigerated and non-refrigerated margarines/fat spreads were fortified with vitamins. Refrigerated margarines/fat spreads were packed in tubs while the non-refrigerated margarines/fat spreads were packed in tubs, tins, pails, and pouch bags of various sizes/weight. The variation in packing size denoted that non-refrigerated margarines/fat spreads had a wider consumer base which included small food and catering business.
The second approach was the analyses of refrigerated and non-refrigerated margarines/fat spreads. The refrigerated margarines/fat spreads had lower SMP than the non-refrigerated products. The SMP values reflected lower SAFA and higher
TABLE 6. TEXTURE PROPERTIES OF HARDNESS AND COMPRESSION OF REFRIGERATED MARGARINES/FAT SPREADS AT 5°C
Code Hardness(g)
Compression(g s–1 )
RRM 01 90.15 ± 3.25 79.794 ± 44.11
RRM 02 102.98 ± 2.44 978.89 ± 32.24
RRM 03 143.77 ± 1.72 1387.48 ± 44.30
RRM 04 254.22 ± 0.66 1305.78 ± 130.79
RRM 05 220.78 ± 2.75 1847.15 ± 70.25
RRM 06 239.40 ± 4.61 2037.01 ± 214.69
RRM 07 61.41 ± 1.29 617.64 ± 13.81
RRM 08 366.98 ± 9.63 3016.64 ± 654.38
RRM 09 257.52 ± 17.70 2158.76 ± 255.14
Note: RRM - retail refrigerated margarines/fat spreads; RRM 01-05 - Australia; RRM 06 - United Kingdom; RRM 07-09 - Malaysia.
TABLE 7. TEXTURE PROPERTIES OF HARDNESS AND COMPRESSION OF NON-REFRIGERATED MARGARINES/FAT SPREADS AT 30°C
Code Hardness(g)
Compression(g s–1 )
RNRM 01 38.06 ± 0.45 328.011 ± 2.31
RNRM 02 68.64 ± 2.49 665.39 ± 17.91
RNRM 03 135.71 ± 0.76 1353.86 ± 41.57
RNRM 04 88.87 ± 2.21 871.72 ± 107.24
RNRM 05 39.71 ± 0.34 367.26 ± 5.94
RNRM 06 164.81 ± 4.85 1578.93 ± 21.56
RNRM 07 155.52 ± 3.26 1557.09 ± 39.30
RNRM 08 273.97 ± 3.42 1929.41 ± 140.65
RNRM 09 269.64 ± 5.42 2051.99 ± 141.83
Note: RNRM - retail non-refrigerated margarines/fat spreads; RNRM 01-09 - Malaysia.

699
CHARACTERISTICS OF RETAIL REFRIGERATED AND NON-REFRIGERATED MARGARINES/ FAT SPREADS SOLD IN MALAYSIA
ARTICLE IN
PRESS
ARTICLE IN
PRESS
USAFA contents in refrigerated margarines/fat spreads compared to non-refrigerated products. Both refrigerated and non-refrigerated margarines/fat spreads contained very low level of TFA having value of less than 0.43% (exception to refrigerated margarine from Australia, RRM 02 with 4.25% of TFA) as most of products which declared the use of palm oil- and palm kernel-based oils had low TFA levels. The refrigerated margarines/fat spreads were spreadable with SFC of 11.6% to 26.4% and hardness values of 61.41 g to 366.98 g at 5°C, while the non-refrigerated margarines/fat spreads were spreadable with SFC of 7.71%-13.66% and hardness values of 38.06 g to 273.97 g at 30°C. This evaluation shows that the variation in SMP, SFC, hardness, and compression values of refrigerated and non-refrigerated margarines/fat spreads were important attributes providing the required structure at the storage and usage temperature. This evaluation was able to provide information on the segment of non-refrigerated margarines/fat spreads which were produced and sold in Malaysia. Periodic compilation on quality characteristics information should be carried out in order to have the latest details on these products.
ACKNOWLEDGEMENT
The authors would like to thank the management of MPOB for permission to execute and publish this work. The authors would also like to thank the staff of Food Technology Group, Che’ Maimon Che Ha, Ramlah Ahmad, Abd. Nasoikheiddinah and Rosnani Osman for their support.
REFERENCES
Abramovic, H; Vidrih, R; Zlatic, E; Kokalj, D; Schreiner, M; Zmitek, K and Pravst, I (2018). Trans fatty acids in margarines and shortenings in the food supply in Slovenia. J. Food Compos. Anal., 74: 53-63.
Adhikari, P; Shin, J A; Lee, J H; Hu, J N; Zhu, X M; Akoh, C C and Lee, K T (2010a). Production of trans-free margarine stock by enzymatic interesterification of rice bran oil, palm stearin and coconut oil. J. Sci. Food Agric., 90: 703-711.
Adhikari, P; Zhu, X M; Gautam, A; Shin, J A; Hu, J N; Lee, J H; Akoh, C C and Lee, K T (2010b). Scaled-up production of zero-trans margarine fat using pine nut oil and palm stearin. Food Chem., 119: 1332-1338.
Alonso, L; Fraga, M J and Juarez, M (2000). Determination of trans fatty acids and fatty acid
profiles in margarines marketed in Spain. J. Amer. Oil Chem. Soc., 77: 131-136.
Bentayeb, A L S; Mekimene, L; Mazi, D; Hamidchi, T; Hadjal, S; Boualit, S and Benalia, M (2018). Nutritional quality and safety of Algerian margarines: Fatty acid composition, oxidative stability and physicochemical properties. Med. J. Nutrition Metab., 11: 331-342.
Bhardwaj, S; Passi, S J and Misra, A (2011). Overview of trans fatty acids: Biochemistry and health effects. Diabetes Metab. Syndr.: Clin. Res. Rev., 5: 161-164.
Braipson, D S and Deroanne, C (2004). Influence of SFC, microstructure and polymorphism on texture (hardness) of binary blends of fats involved in the preparation of industrial shortenings. Food Res. Int., 37: 941-948.
Campos, R; Narine, S S and Marangoni, A G (2002). Effect of cooling rate on the structure and mechanical properties of milk fat and lard. Food Res. Int., 35: 971-981.
Cheong, L Z; Tan, C P; Long, K; Suria, A Y M and Lai, O M (2009). Physicochemical, textural and viscoelastic properties of palm diacylglycerol bakery margarine during storage. J. Amer. Oil Chem. Soc., 86: 723-731.
Davey, K R and Jones, P N (1985). Evaluation of a sliding pin consistometer for measurement of the hardness and spreadability of butter and margarine. J. Texture Studies, 16: 75-84.
DeMan, L; Shen, C F and DeMan, J M (1991). Composition, physical and textural characteristics of soft (tub) margarines. J. Amer. Oil Chem. Soc., 68: 70-73.
Di Bari, V; Norton, J E and Norton, I T (2014). Effect of processing on the microstructural properties of water-in-cocoa butter emulsions. J. Food Eng. 122: 8-14.
D’Souza, V; DeMan, J M and DeMan, L (1992). Chemical and physical properties of the solid fats in commercial soft margarines. J. Amer. Oil Chem. Soc., 69: 1198-1205. Davey, K R and Jones, P N (1985). Evaluation of a sliding pin consistometer for measurement of the hardness and spreadability of butter and margarine. J. Texture Studies, 16: 75-84.
FDA (2019). Food and Drugs Administration the United States of America, 21 Code of Federal

700
JOURNAL OF OIL PALM RESEARCH 33 (4) DECEMBER 2021
ARTICLE IN
PRESS
ARTICLE IN
PRESS
ARTICLE IN
PRESS
ARTICLE IN
PRESS
Regulation, Part 166 Margarine (revised 1 April 2019). FDA 21CFR166.110.
Fomuso, L B and Akoh, C C (2001). Enzymatic modification of high-laurate canola to produce margarine fat. J. Agric. Food Chem., 49: 4482-4487.
Garsetti, M; Balentine, D A; Zock, P L; Blom, W A M and Wanders, A J (2013). Fat composition of vegetable oil spreads and margarines in the USA in 2013: A national market place analysis. Int. J. Food Sci. Nutr., 67: 372-382.
Ghosh, S and Bhattacharyya, D K (1997). Utilization of high-melting palm stearin in lipase-catalyzed interesterification with liquid oils. J. Amer. Oil Chem. Soc., 74: 589-592.
Inna, S and Roman, P (2020). Imports and use of palm oil as a way to increase safety of food fats. Handbook of Research on Globalized Agricultural Trade and New Challenges for Food Security. IGI Global. Hershey, PA, USA. p. 277-295.
Jeung, H L; Akoh, C C; Himmelsbach, D S and Lee, K T (2008). Preparation of interesterified plastic fats from fats and oils free of trans fatty acid. J. Agric. Food Chem., 56: 4039-4046.
Karabulut, I and Turan, S (2006). Some properties of margarines and shortenings marketed in Turkey. J. Food Compos. Anal., 19: 55-58.
Karabulut, I; Turan, S and Ergin, G (2004). Effects of chemical interesterification on solid fat content and slip melting point of fat/oil blends. Eur. Food Res. Technol., 218: 224-229.
Khatoon, S and Reddy, S R Y (2005). Plastic fats with zero trans fatty acids by interesterification of mango, mahua and palm oils. European J. Lipid Sci. Technol., 107: 786-791.
Kuntom, A; Siew, W L; Tan, Y A; Nor, A I and Ibrahim, N A (2005). MPOB Test Methods. MPOB, Bangi. p. 366-374.
Lai, O M; Ghazali, H M; Cho, F and Chong, C L (2000). Physical and textural properties of an experimental table margarine prepared from lipase-catalysed transesterified palm stearin: Palm kernel olein mixture during storage. Food Chem., 71: 173-179.
Lai, O M; Ghazali, H M and Chiew Let, C (1999). Use of enzymatic transesterified palm stearin-sunflower oil blends in the preparation of table margarine formulation. Food Chem., 64: 83-88.
Lakum, R and Sonwai, S (2018). Production of trans-free margarine fat by enzymatic interesterification of soy bean oil, palm stearin and coconut stearin blend. Int. J. Food Sci. Technol., 53: 2761-2769.
Lefebure, E; Ronkart, S; Brostaux, Y; Bera, F; Blecker, C and Danthine, S (2013). Investigation of the influence of processing parameters on physicochemical properties of puff pastry margarines using surface response methodology. LWT - Food Sci. Technol., 51: 225-232.
Lumor, S E; Pina-Rodriguez, A M; Shewfelt, R L and Akoh, C C (2010). Physical and sensory attributes of a trans-free spread formulated with a blend containing a structured lipid, palm mid-fraction and cottonseed oil. J. Amer. Oil Chem. Soc., 87: 69-74.
Makeri, M; Sahri, M M; Ghazali, H M; Ahmad, K and Muhammad, K (2019). Polymorphism, textural and crystallization properties of winged bean (Psophocarpus tetragonolobus, D C) oil-based trans-fatty acids free ternary margarine blends. LWT - Food Sci. Technol., 100: 158-166.
Marangoni, A G and Rousseau, D R (1995). Engineering triacylglycerols: The role of interesterification. Trends Food Sci. Technol., 6: 329-335.
Mensink, R P and Katan, M B (1990). Effect of dietary trans fatty acids on high-density and low-density lipoprotein cholesterol levels in healthy subjects. New England J. Medicine, 323: 439-445.
Miskandar, M S and Nor, A I (2010). Palm stearin as low trans hard stock for margarine. Sains Malays., 39: 821-827.
Narine, S S and Marangoni, A G (1999a). Microscopic and rheological studies of fat crystal networks. J. Crystal Growth, 198/199: 1315-1319.
Narine, S S and Marangoni, A G (1999b). Relating structure of fat crystal networks to mechanical properties: A review. Food Res. Int., 32: 227-248.
Narine, S S and Marangoni, A G (1999c). Factors affecting the texture of plastic fats. Int. News on Fats, Oils and Related Mater., 10: 565-570.
Noor, L M D; Rafidah, A H; Sivaruby, K; Wan, R I A; Norazura, A M H; Nur, H I; Zaliha, O and Miskandar, M S (2017). Palm oil and palm kernel oil: Versatile ingredient for food applications. J. Oil Palm Res., 29(4): 487-511.
Noor Lida, H M D and Ali, A R M (1998). Physico-chemical characteristics of palm-based oil blends for

701
CHARACTERISTICS OF RETAIL REFRIGERATED AND NON-REFRIGERATED MARGARINES/ FAT SPREADS SOLD IN MALAYSIA
ARTICLE IN
PRESS
ARTICLE IN
PRESS
the production of reduced fat spreads. J. Amer. Oil Chem. Soc., 75: 1625-1631.
Nor, A I; DeMan, L; Tang, T S and Chong, C L (1996). Chemical composition and physical properties of soft (tub) margarines sold in Malaysia. J. Amer. Oil Chem. Soc., 73: 995-1001.
Nor, A I and Miskandar, M S (2007). Utilization of palm oil and palm products in shortenings and margarines. Eur. J. Lipid Sci. Technol., 109: 422-432.
Oliveira, P D; Rodrigues, A M C; Bezerra, C V and Silva, L H M (2017). Chemical interesterification of blends with palm stearin and patawa oil. Food Chem., 215: 369-376.
Ornla-Ied, P; Sonwai, S and Lertthirasuntorn, S (2016). Trans-free margarine fat produced using enzymatic interesterification of rice bran oil and hard palm stearin. Food Sci. Biotechnol., 25: 673-680.
Patel, A R; Lecerf, J M; Schenker, S and Dewettinck, K (2016). The contribution of modern margarine and fat spreads to dietary fat intake. Compr. Rev. Food Sci. Food Safety, 15: 633-645.
Patel, A R; Nicholson, R A and Marangoni, A G (2020). Applications of fat mimetics for the replacement of saturated and hydrogenated fat in food products. Curr. Opin. Food Sci., 33: 63-68. Rodriguez, A; Castro, E; Salinas, M C; López, R and Miranda, M (2001). Interesterification of tallow and sunflower oil. J. Amer. Oil Chem. Soc., 78: 431-436.
Roseli, N H and Akhir, M F (2019). Temperature variability caused by internal tides in the coastal waters of east coast of Peninsular Malaysia. Acta Oceanologica Sinica, 38: 22-31.
Saadi, S; Ariffin, A A; Ghazali, H M; Miskandar, M S; Abdulkarim, S M and Boo, H C (2010). Effect of blending and emulsification on thermal behaviour, solid fat content, and microstructure properties of palm oil-based margarine fats. J. Food Sci., 76: C21-C30.
Seriburi, V and Akoh, C C (1998). Enzymatic interesterification of lard and high-oleic sunflower oil with Candida antarctica lipase to produce plastic fats. J. Amer. Oil Chem. Soc., 75: 1339-1345.
Shin, J A; Akoh, C C and Lee, K T (2010). Enzymatic interesterification of anhydrous butterfat with flaxseed oil and palm stearin to produce low-trans spreadable fat. Food Chem., 120: 1-9.
Silva, R C; Cotting, L N; Poltronieri, T P; Balcão, V M; De Almeida, D B; Goncalves, L A G; Grimaldi, R and Gioielli, L A (2009). The effects of enzymatic interesterification on the physical-chemical properties of blends of lard and soybean oil. LWT - Food Sci. Technol., 42: 1275-1282.
Sivaruby, K; Enamul, H M; Miskandar, M S and Spowage, A (2013). Investigating the effect of deforming temperature on the oil-binding capacity of palm oil based shortening. J. Food Eng., 118: 90-99.
Szczesniak, A S (2002). Texture is sensory property. Food Qual. Prefer, 13: 215-225.
Soronja-Simovic, D; Seres Z; Nikolic, I; Simurina, O; Djordjevic, M and Maravic, N (2017). Challenges related to the application of high and low trans margarine in puff pastry production. J. Food Process. Preserv., 41: e13265.
Tang, H D K (2019). Climate change in Malaysia: Trends, contributors, impacts, mitigation and adaptations. Sci. Total Environ., 650: 1858-1871.
Tang, T S (2002). Fatty acid composition of edible oils in the Malaysian market with special reference to trans-fatty acids. J. Oil Palm Res., 14: 1-8.
Tang, D and Marangoni, A G (2007). Modeling the rheological properties and structure of colloidal fat crystal networks. Trends Food Sci. Technol., 18: 47483.
Tekin, A; Cizmeci, M; Karabacak, H and Kayahan, M (2002). Trans FA and solid fat contents of margarines marketed in Turkey. J. Amer. Oil Chem. Soc., 79: 443-445.
Thais, S; Daniel, A and Ana, P B R (2020). Physicochemical profile of commercial margarines marketed in Brazil and the impact of trans fatty acid elimination. Authorea. DOI: 10.22541au.158880314.48849522.
Vithanage, C R; Grimson, M J and Smith, B G (2009). The effect of temperature on the rheology of butter, a spreadable blend and spreads. J. Texture Studies, 40: 346-369.
Vucic, V; Arsic, A; Petrovic, S; Milanovic, S; Gurinovic, M and Glibetic, M (2015). Trans fatty acid content in Serbian margarines: Urgent need for legislative changes and consumer information. Food Chem., 185: 437-440.
Willett, W C; Stampfer, M J; Manson, J E; Colditz, G A; Speizer, F E; Rosner, B A; Hennekens, C H; Hennekens, C H; Willett, W C; Stampfer, M

702
JOURNAL OF OIL PALM RESEARCH 33 (4) DECEMBER 2021
ARTICLE IN
PRESS
ARTICLE IN
PRESS
J; Colditz, G A; Willett, W C; Sampson, L A and Rosner, B A (1993). Intake of trans fatty acids and risk of coronary heart disease among women. The Lancet, 341: 581-585.
WHO (2019). Countdown to 2023: WHO report on global trans fat elimination 2019. World Health Organisation (WHO). https://apps.who.int/iris/handle/10665/331300.
WHO (2020). REPLACE: Trans fat-free by 2023. World Health Organisation (WHO). https://www.
who.int/nutrition/topics/replace-transfat, accessed on 22 April 2020.
Yılmaz, E and Ogutcu, M (2015). Oleogels as spreadable fat and butter alternatives: Sensory description and consumer perception. RSC Adv., 5: 50259-50267.
Young, N W G and Wassell, P (2019). Margarines and spreads. Food Emulsifiers and Their Applications (Hasenhuettl, G L and Hartel, R W eds.). Springer International Publishing. p. 379-405.
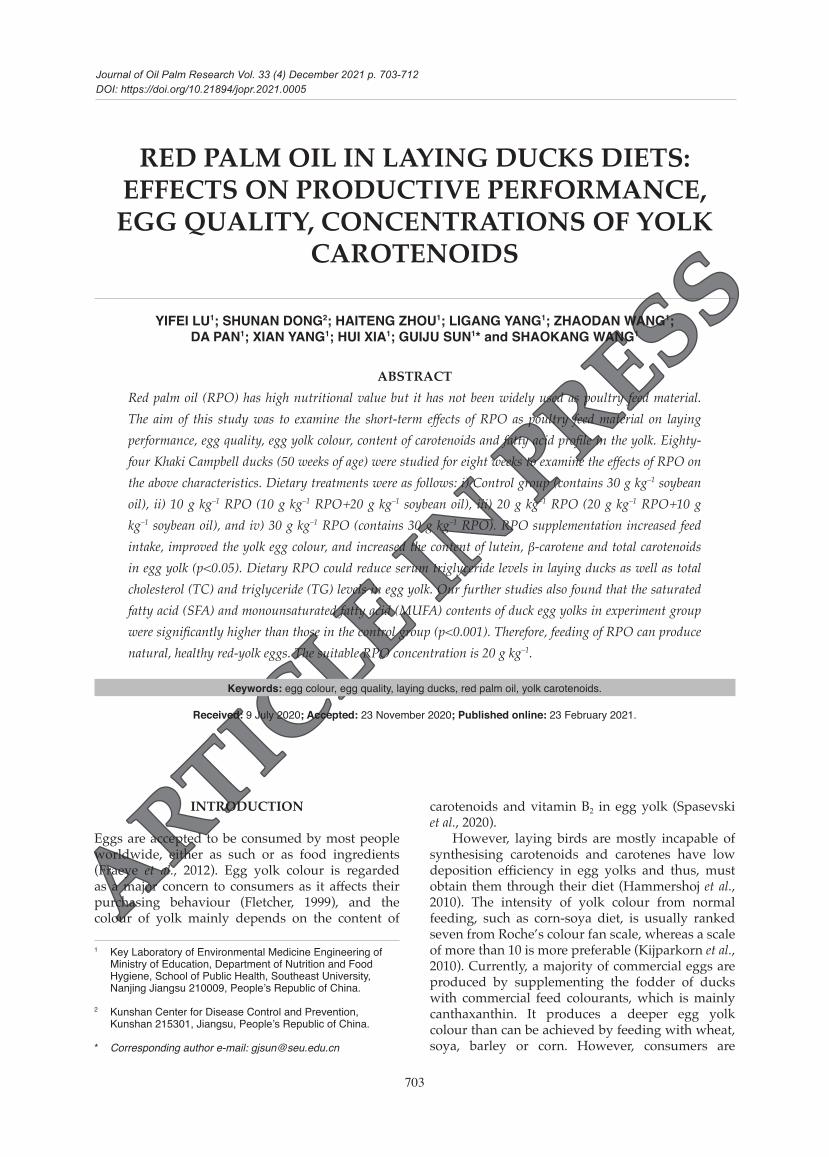
703
ARTICLE IN
PRESS
ARTICLE IN
PRESS
Journal of Oil Palm Research Vol. 33 (4) December 2021 p. 703-712DOI: https://doi.org/10.21894/jopr.2021.0005
RED PALM OIL IN LAYING DUCKS DIETS: EFFECTS ON PRODUCTIVE PERFORMANCE, EGG QUALITY, CONCENTRATIONS OF YOLK
CAROTENOIDS
YIFEI LU1; SHUNAN DONG2; HAITENG ZHOU1; LIGANG YANG1; ZHAODAN WANG1; DA PAN1; XIAN YANG1; HUI XIA1; GUIJU SUN1* and SHAOKANG WANG1
ABSTRACTRed palm oil (RPO) has high nutritional value but it has not been widely used as poultry feed material. The aim of this study was to examine the short-term effects of RPO as poultry feed material on laying performance, egg quality, egg yolk colour, content of carotenoids and fatty acid profile in the yolk. Eighty-four Khaki Campbell ducks (50 weeks of age) were studied for eight weeks to examine the effects of RPO on the above characteristics. Dietary treatments were as follows: i) Control group (contains 30 g kg–1 soybean oil), ii) 10 g kg–1 RPO (10 g kg–1 RPO+20 g kg–1 soybean oil), iii) 20 g kg–1 RPO (20 g kg–1 RPO+10 g kg–1 soybean oil), and iv) 30 g kg–1 RPO (contains 30 g kg–1 RPO). RPO supplementation increased feed intake, improved the yolk egg colour, and increased the content of lutein, β-carotene and total carotenoids in egg yolk (p<0.05). Dietary RPO could reduce serum triglyceride levels in laying ducks as well as total cholesterol (TC) and triglyceride (TG) levels in egg yolk. Our further studies also found that the saturated fatty acid (SFA) and monounsaturated fatty acid (MUFA) contents of duck egg yolks in experiment group were significantly higher than those in the control group (p<0.001). Therefore, feeding of RPO can produce natural, healthy red-yolk eggs. The suitable RPO concentration is 20 g kg–1.
Keywords: egg colour, egg quality, laying ducks, red palm oil, yolk carotenoids.
Received: 9 July 2020; Accepted: 23 November 2020; Published online: 23 February 2021.
INTRODUCTION
Eggs are accepted to be consumed by most people worldwide, either as such or as food ingredients (Fraeye et al., 2012). Egg yolk colour is regarded as a major concern to consumers as it affects their purchasing behaviour (Fletcher, 1999), and the colour of yolk mainly depends on the content of
carotenoids and vitamin B2 in egg yolk (Spasevski et al., 2020).
However, laying birds are mostly incapable of synthesising carotenoids and carotenes have low deposition efficiency in egg yolks and thus, must obtain them through their diet (Hammershoj et al., 2010). The intensity of yolk colour from normal feeding, such as corn-soya diet, is usually ranked seven from Roche’s colour fan scale, whereas a scale of more than 10 is more preferable (Kijparkorn et al., 2010). Currently, a majority of commercial eggs are produced by supplementing the fodder of ducks with commercial feed colourants, which is mainly canthaxanthin. It produces a deeper egg yolk colour than can be achieved by feeding with wheat, soya, barley or corn. However, consumers are
1 Key Laboratory of Environmental Medicine Engineering of Ministry of Education, Department of Nutrition and Food Hygiene, School of Public Health, Southeast University, Nanjing Jiangsu 210009, People’s Republic of China.
2 Kunshan Center for Disease Control and Prevention, Kunshan 215301, Jiangsu, People’s Republic of China.
* Corresponding author e-mail: [email protected]

704
JOURNAL OF OIL PALM RESEARCH 33 (4) DECEMBER 2021
ARTICLE IN
PRESS
ARTICLE IN
PRESS
ARTICLE IN
PRESS
ARTICLE IN
PRESS
always worried about the safety of the commercial feed colourants. According to European Food Safety Authority, because of the absence of data, canthaxanthin has been considered as an irritant to the skin and eyes, as a skin sensitiser and is hazardous when inhaled (FEEDAP, 2014). Besides, these products are banned in organic production, which rely mainly on yellow plant sources (Abiodun et al., 2014).
Crude palm oil (CPO) comes from oil palms. After using a modified physical refining process (Go et al., 2015; Keat et al., 1991; Ooi et al., 1993), a refined palm oil is produced. This refined palm oil retains most of the carotenoids and the vitamin E originally present in CPO, and is named red palm oil (RPO) (Keat et al., 1991; Rauchova et al., 2018). RPO gets its colour because it contains high concentrations of carotenoids, especially beta-carotene and alpha-carotene (Sundram et al., 2003). RPO contains approximately 500 ppm carotene, 90% presence of α- and β-carotene. The vitamin E content is about 800 ppm, 70% of which is in the form of tocotrienols (mainly as α-, β- and δ-tocotrienols) (Andreu-Sevilla et al., 2009; Rice and Burns, 2010). Other valuable minor components present in this oil are ubiquinones and phytosterols (Nagendran et al., 2000).
RPO has 50% saturated fatty acid (SFA) (palmitic acid, C16:0), 40% monounsaturated fatty acid (MUFA) (oleic acid, C18:1) and 10% polyunsaturated fatty acid (PUFA) (linoleic acid, C18:2) (Ma, 2015). Excessive saturated fats increase the risk of cardiovascular diseases (CVD), while unsaturated fats are considered less harmful. Since RPO/palm oil (PO) has similar fatty acid profile and content, which contains approximately 50% of SFA, it has been reported that dietary PO induces platelet aggregation, which leads to an increase in venous thrombosis and increases serum triglyceride levels in rats (Mizurini et al., 2011).
As hyperlipidemia is usually caused by a high-fat diet, palm oil, being partially saturated, has been suspected to be the cause of hyperlipidemia and CVD. However, studies have also shown that dietary RPO/PO does not increase subcutaneous fat and total fat in mice (Gouk et al., 2013), therefore does not cause hyperlipidemia and increase the risk of CVD (Go et al., 2015). Instead, it has a tendency to lower cholesterol and even has antithrombotic effects (Hornstra, 1987). Wilson et al. (2005) found that in comparison to other dietary oils rich in SFA 16:0, RPO/PO has been shown to reduce plasma cholesterol levels (Wilson et al., 2005), explained by the sn-2 theory. The positions of fatty acid attachment on the glycerol backbone are referred to by stereospecific numbers, (sn) -1, -2 and -3. The attachment of a particular fatty acid to a particular position has an important effect on the fat/oil properties.
In PO, oleic acid is predominantly situated at the sn-2 position, while long-chain SFA is predominantly situated at the sn-1,3 position. The subcutaneous, visceral as well as total fat deposition in mice all had correlated negatively with the total SFA content at the sn-1, 3 positions, while no relationships were found for MUFA and PUFA. The present results show that the positional distribution of long-chain SFA exerts a more profound effect on body fat accretion than the total SFA content (Wilson et al., 2005). RPO has been known as an excellent source of pro-vitamin A carotenoids for decades. However, the usage of RPO as poultry feed to increase egg yolk colour remains rarely researched. Most studies have focused on the effect of PO/RPO on lipid metabolism in poultry and on the oxidative stability of poultry eggs (Nawab et al., 2019; Nyquist et al., 2013).
Nyquist et al. (2013) replaced animal fat with PO and RPO had no negative effects on chicken muscle nutritional value with regard to fatty acid composition and RPO decreased plasma total cholesterol (TC), confirming the TC reducing effect of this dietary oil. A study showed that RPO could be used effectively to reduce egg lipid and cholesterol content and also to increase the linoleic acid content without altering their acceptability of the eggs from hens (Punita and Chaturvedi, 2000). Another experiment showed that yolk colour and oxidative stability of chicken eggs from Institute of Selection Animals (ISA) brown hens had markedly improved (P<0.05) with corresponding increase of CPO in the diets (Akter et al., 2014). Cherian et al. (1996) drew similar conclusion that PO (oils at 3.5%) resulted in a significant (P<0.05) reduction in 2-thiobarbituric acid values in eggs compared with menhaden oil and flax oil (P<0.05), and it may suggest that dietary PO reduced lipid oxidation in egg yolk, which may be related to the rich carotenoid and/or vitamin E in CPO/PO (Cherian et al., 1996).
RPO is a commercially available feedstuff, highly rich in carotenoids and vitamin E. Carotenoids and vitamin E have strong antioxidant properties and effects. Previous studies have suggested that natural red-yolk egg could be produced naturally by feeding poultry with carotenoid-rich fodder such as Lucerne (Karadas et al., 2006), sano flower (Kijparkorn et al., 2010). Supplying egg-laying ducks with RPO may affect the colour of its egg yolk. However, research on the usage of RPO as poultry feed to increase egg yolk colour is still lacking. Therefore, the objectives of this study were to determine the effectiveness of layer diet supplementation with RPO on: 1) productive performance and egg traits during eight-week period from ducks aged 50-58 weeks, 2) the change of the yolk colour after eight-week intervention, and 3) the change of egg yolk carotenoids concentrations after eight-week intervention.

705
RED PALM OIL IN LAYING DUCKS DIETS: EFFECTS ON PRODUCTIVE PERFORMANCE, EGG QUALITY, CONCENTRATIONS OF YOLK CAROTENOIDS
ARTICLE IN
PRESS
ARTICLE IN
PRESS
MATERIALS AND METHODS
Chemicals
Petroleum ether, acetone and dichloromethane were of analytical grade, provided by Sinopharm; Methanol, acetonitrile (Merck, USA) and methyl tert-butyl ether (Sigma, USA) was chromatographic pure; β-carotene, lutein and zeaxanthin were obtained from Sigma. RPO used for the study was supplied by Malaysian Palm Oil Board (MPOB).
Animal Management and Treatments
The methods were carried out in accordance with the relevant guidelines and regulations concerning the use of animals in research. This study was conducted in accordance with the Declaration of Helsinki, and the protocol was approved by the Animal Experimental Ethical Inspection Form of Southeast University (20160501007) on 1 May 2016 (Nanjing, China).
A total of 84 Khaki Campbell ducks, aged 50 weeks and with similar body weights (2.41 ± 0.35 kg) were used for this study. Ducks were put at random into four treatment groups (three replicates and seven ducks per replicate). The experimental ducks were fed different diets for eight weeks. The ducks were fed four experimental diets: i) contains 30 g kg–1 soybean oil (control group), ii) 10 g kg–1 RPO + 20 g kg–1 soybean oil (10 g kg–1 RPO group), iii) 20 g kg–1 RPO + 10 g kg–1 soybean oil (20 g kg–1 RPO group), and iv) contains 30 g kg–1 RPO (30 g kg–1 RPO group). The diets (Table 1) were isocaloric and isonitrogenous containing 177.3 g kg–1 crude protein (CP) and 12.2 MJ of metabolisable energy (ME) kg–1
of diet. The diets were supplemented with a commercial feed premix (Huamu Technology Company Ltd., Wuhan, China). All diets were formed into pellets to reduce differences in feed physical form, to ensure the same quality and to prevent feed selection by ducks (Buchanan and Moritz, 2009). Water was provided ad libitum until the end. Food was offered twice daily, approximately at 7.00 am and 15.00 pm. The excrements were cleared every evening, with light hours maintained at 16 hr day–1 . It was ensured that natural ventilation and hygiene was maintained throughout the study. Vaccines and medication are provided under the supervision of a veterinarian.
Performance and Egg Quality Parameters
All eggs were collected and egg production was calculated daily until the end of the experimental period. The weight, Haugh Unit and the yolk colour of each egg (10 per group) was measured weekly by EMT-5200 multi-function egg analyser (Robotmation, Japan). The albumen and egg
yolk were then separated and each egg yolk was stored at -20°C before further analysis. Each yolk was extracted and analysed in triplicates for each method. Feed consumption was registered weekly per group and feed conversion ratio was calculated as grams of feed per grams of egg. Duck mortality was recorded as it occurred. Data recording began seven days prior to the experimental period.
Extraction and Analysis of Diet and Yolk Total Carotenoids and Individual Carotenoids
Carotenoids from the extracted egg yolk and carotenoids standards were analysed by using a high performance liquid chromatography (HPLC) system. Commercial standards of relevant carotenoids were used for quantification by dissolving them in dichloromethane to the following concentrations (μg litre−1): β-carotene 2.16, 3.24, 5.4, 10.8, 21.6, 32.4, 54 and 108 mg litre−1, lutein 1, 3, 4, 6, 10, 20 and 30 mg litre−1 and zeaxanthin 1, 2, 3, 4, 5, 10, 15, 20 and 50 μg ml−1. The solutions described above were filtered through a 0.45 μm polytetrafluoroethylene (PTFE) membrane into HPLC vials and subjected to HPLC analysis to draw standard curves.
TABLE 1. INGREDIENT AND CHEMICAL COMPOSITION OF THE CONTROL GROUP’S DIET (g kg–1)
Ingredient g kg–1
Corn 610
Soybean meal 240
Wheat bran 40
Limestone power 50
Soybean oil 30
Fish meal 20
5% premix* 10
Nutrient**
Crude protein 177.3
Lys 9.1
Met 3
Crude fat 58.9
Calcium 20.2
Total P 4.1
Metabolisable energy, MJ kg–1 of diet 12.2
Note: * The premix provided the following per kg of diets, retinol ≥60 KIU kg–1, cholecalciferol ≥48 KIU kg–1, tocopherol ≥320IU, menadione ≥40 mg kg–1, thiamin ≥ 11 KIU kg–1, riboflavin ≥52 KIU mg kg–1, vitamin B6 ≥65 mg kg–1, cobal-amin ≥0.3 mg kg–1, niacin ≥560 mg kg–1, pantothenic acid ≥160 mg kg–1, folic acid ≥16 mg kg–1, biotin ≥1.4 mg kg–1, choline chloride ≥9000 mg kg–1, 20-500 mg kg–1 of Cu, 700-10 000 mg kg–1 of Fe, 800-2800 mg kg–1 of Zn, 900-2900 mg kg–1 of Mn, 27 mg kg–1 of I, 2-9.6 mg kg–1 of Se.
** Values were calculated from data provided by Feed Database in China (2013).

706
JOURNAL OF OIL PALM RESEARCH 33 (4) DECEMBER 2021
ARTICLE IN
PRESS
ARTICLE IN
PRESS
ARTICLE IN
PRESS
ARTICLE IN
PRESS
Mixed 100 mg litre−1 lutein 1 ml, 100 mg litre−1
zeaxanthin 1 ml and 600 mg litre−1 β-carotene 1 ml in volumetric flask and dichloromethane was added in the volumetric flask to 10 ml. The solution was then filtered through a 0.45 μm PTFE membrane into HPLC vials and subjected to HPLC analysis.
Egg yolk carotenoids concentration (μg g−1 yolk) was analysed by HPLC. Yolk samples were analysed within six months after egg collection (Hargitai et al., 2016), hence we did not expect a considerable reduction in carotenoids levels.
According to the Association of Official Analytical Chemists (AOAC) method, the spectroscopic determination of total carotenoids is equal to the spectroscopic determination of β-carotene (Islam and Schweigert, 2015). 1.08 mg of β-carotene standard was dissolved in dichloromethane (Concentrations 2.16, 3.24, 5.4, 10.8, 21.6, 32.4, 54 and 108 mg litre−1) with optical density (OD) value at 450 nm. A standard curve line of best fit was then constructed to derive the relationship between OD value and carotenoid concentration.
Total carotenoid extractions were carried out using the methodology described by Paredes-Molina et al. (2016), with some slight modifications. The carotenoids composition of the test diets (Table 2) and the egg yolks were determined using HPLC analysis (Agilent Technologies Co. Ltd., China). Accordingly, 3 g of egg yolks (five per group)/ poultry feed was extracted in 15 ml of petroleum ether/acetone (2:1 v/v) in a Pyrex glass vial. Pyrex glass vials were sonicated using an ultrasonic bath (Kunshan Ultrasonic Instruments Co. Ltd., model KQ5200, China) for 5 min and then extracted for 60 min at room temperature (25°C). The supernatants were transferred to new vials and the extraction procedure was repeated three more times. The volume of supernatant was set to 50 ml, its absorbance was determined at 450 nm using an ultraviolet spectrophotometer (INESA Analytical Instrument Co. Ltd., model 752N, China). The total carotenoid content was calculated based on the standard curve line derived above.
The sample extracts described above were filtered through a 0.45 μm PTFE membrane into HPLC vials and subjected to HPLC analysis. The contents of individual carotenoids in egg yolks were quantified on the basis of the corresponding retention times and standard curves.
An Agilent Technologies HPLC system with a variable wavelength detector (VWD) at 450 nm was used for analysis of carotenoids. A precolumn with inner dimensions of 10 mm × 4 mm was included before the column and held at room temperature. A column (YMC Europe GmbH, Dinslaken, Germany) with 5 μm C30 reverse phase material with inner dimensions of 250 mm × 4.6 mm was used for separation. Mobile phases A methanol: acetonitrile = 25:75; mobile phases B: MTBE; mobile phases C: H2O. Gradient elution was performed with 0~15 min: ~A 98%~70%, B 0~28%, C 2%; 15~20 min: A 70%~18%, B 28%~80%, C 2%; 20~22 min: A 18%, B 80%, C 2%; 22~23 min: A 18%~0, B 80%~100%, C 2%~0; 23~25 min: A 0~98%, B 100%~0, C 0~2%. Column temperature was at room temperature and flow rate was 1 ml min−1. An 20 μl sample extracts and standard solutions were injected.
Extraction and Analysis of Yolk and Diet Fatty Acids
The fatty acid composition of the test diets (Table 3) and the egg yolks were determined using standard gas chromatography (Agilent Technologies Co. Ltd., America) techniques of the fatty acid methyl esters (AOAC, 1990), using C17:1 fatty acid (Nu-Chek Prep Inc., Elysian, Minnesota) as an internal standard. Fatty acids were extracted from the egg yolk according to the methods of Folch et al. (1957). The diet subsamples were also stored at −20°C before the fatty acids analysis (Couch et al., 1970).
Determination of Total Cholesterol (TC) and Triglyceride (TG) in Egg Yolk and Serum
Blood samples of all ducks were drawn from the wing vein, at the beginning and the end of the experimental period. The content of TC and TG in the egg yolk and serum was detected with a kit (Nanjing Jiancheng Bioengineering Institute, China), and the absorbance was measured using a microplate reader (Bio Tek, USA), and the content was calculated according to the formula.
STATISTICAL ANALYSES
All data were analysed using one-way ANOVA using SPSS 17 .0 statistics software (SPSS, Chicago, Illinois, USA).
TABLE 2. THE CONTENT OF CAROTENOIDS OF LAYING DUCK‘S DIETS (g kg–1 forage)
Item Control group
1%RPO group
2%RPO group
3%RPO group
Lutein 6 120 6 690 6 570 6 600
Zeaxanthin 470 510 960 750
β-carotene 9 810 13 450 17 750 24 850
Unknown 14 660 20 680 25 660 33 590
Total carotenoids 18 890 50 640 60 070 74 990
Note: RPO - red palm oil.

707
RED PALM OIL IN LAYING DUCKS DIETS: EFFECTS ON PRODUCTIVE PERFORMANCE, EGG QUALITY, CONCENTRATIONS OF YOLK CAROTENOIDS
ARTICLE IN
PRESS
ARTICLE IN
PRESS
TABLE 3. FATTY ACID PROFILE OF LAYING DUCK‘S DIETS
Fatty acids Control group
1%RPO group
2%RPO group
3%RPO group
C16:0 (%1) 11.80 18.07 18.02 24.08
C18:0 (%) 3.21 3.27 3.36 3.45
C18:1 (%) 24.68 26.71 27.07 29.48
C18:2 n-6 (%) 52.95 49.69 44.81 36.95
C20:1 (%) 5.29 0.79 4.10 2.96
C22:0 (%) 0.47 0.03 0.32 0.32
C20:5 n-3 (%) 0.17 0.08 0.17 0.17
Others (%) 1.44 1.48 2.15 2.59
SFA (%) 16.26 22.46 23.07 29.85
MUFA (%) 30.11 27.65 31.45 32.64
PUFA (%) 53.63 49.88 45.48 37.51
n-3 PUFA (%) 0.19 0.20 0.20 0.20
n-6 PUFA (%) 53.34 49.65 45.21 37.19
Total (g/100 g feed2)
5.9302 5.7350 5.6758 5.6197
Note: 1 the percentage of individual fatty acids in total fatty acids;2 the mass of fatty acids contained in 100 g of feed; RPO - red palm oil; SFA - saturated fatty acid; MUFA - monounsaturated fatty acid; PUFA - polymonounsaturatedfatty acid.
RESULTS
Carotenoids and Fatty Acid Profile of the Diets
The individual carotenoids levels in each diet are as shown in Table 2. The total carotenoids in the control group diet was lower than that in the RPO group diets. The carotenoids in the RPO were mainly β-carotene, with small amounts of lutein. Therefore, the concentration of carotenoids was increased with the increase of RPO content in the experimental diets. The total carotenoids content in the 30 g kg−1
RPO group was about 3.97 times than that of the control group.
The fatty acid profile in the control and experimental diet are as shown in Table 3. The total fatty acid content of the feeds in each group was
similar (5.62 to 5.93 g/100 g feed). Adding RPO to the feed can significantly increase the content of SFA and MUFA such as palmitic acid, stearic acid and oleic acid in the feed, while the content of PUFA such as linoleic acid is significantly reduced, and the content of n-3 PUFA in each group is similar. The content of n-6 PUFA decreases with the increase of RPO content.
Effects of RPO on the Productive Performance
As shown in Table 4, the average daily feed intake and laying rate of feed treatment groups of 10 g kg−1 and 20 g kg−1 were significantly higher than the control group (P<0.05). Furthermore, the laying rate of group with RPO at 30 g kg−1 was significantly lower than the groups with RPO at 10 g kg−1 and 20 g kg−1 (P<0.05). However, there was no significant difference observed for the feed conversion rate in the RPO groups compared with the control group (P>0.05) (Table 4).
Effects of RPO on Egg Quality of Ducks
All levels of RPO meal used in this study had no effect on average egg weight, albumen height and Haugh unit (P>0.05) (Table 5). However, there was a significant difference in egg yolk colour of RPO groups compared with the control group (P<0.05). There was a dose-response relationship between egg yolk colour and RPO concentration in the feed. Yolk colour changed significantly (P<0.001) with the RPO concentration (P<0.05), and the eggs of RPO at 30 g kg−1 group had the highest colour concentration of egg yolk.
Carotenoids Levels in Egg Yolk
Lutein, β-carotene and total carotenoids in the egg yolk changed significantly (P<0.05) after feeding RPO (Table 6). After eight weeks of RPO intervention, the content of lutein and total carotenoids in the group with RPO at 30 g kg−1 was significantly higher than those in the control group and groups with RPO at 10 g kg−1 and 20 g kg−1 (P<0.05). After eight weeks of intervention, the content of β-carotene in
TABLE 4. EFFECTS OF RPO SUPPLEMENTATION TO LAYING DUCKS ON WEIGHT AND PRODUCTIVE PERFORMANCE (mean ± SD)
Control group
1% RPO group
2% RPO group
3% RPO group F P
Average daily feed intake (g/bird/day) 164.90 ± 18.33a 264.75 ± 15.16b 255.82 ± 1.86b 244.85 ± 32.15b 15.738 0.001
Laying rate (%) 71.11 ± 6.94ab 80.70 ± 3.04b 80.70 ± 3.04b 63.49 ± 7.27a 6.981 0.013
Feed conversion rate (g feed/g egg) 3.76 ± 0.97 4.26 ± 0.32 4.14 ± 0.71 5.04 ± 0.49 1.931 0.203
Note: a,b In the same row, values with the different symbol superscripts mean significant differences (P<0.05), while with the same or no symbol superscripts mean no significant differences (P>0.05); RPO - red palm oil; F - statistical value; P - intragroup comparison for changes in the parameters.

708
JOURNAL OF OIL PALM RESEARCH 33 (4) DECEMBER 2021
ARTICLE IN
PRESS
ARTICLE IN
PRESS
ARTICLE IN
PRESS
ARTICLE IN
PRESS
the yolk had gradually increased with the increase of RPO content in the diet (P<0.05). The content of β-carotene in the groups with RPO at 20 g kg−1
and 30 g kg−1 was significantly higher than that in the control group. In the RPO group (P<0.05), the content of β-carotene in yolk was highest in the group with RPO at 30 g kg−1.
TC and TG Content of Serum and Eggs
RPO had a significant effect on serum TG, yolk TC and yolk TG contents in duck eggs (P<0.05). The serum TG, yolk TC and yolk TG contents in RPO groups were significantly lower than those in the control group, but there was no significant difference among the three RPO groups. The effect of RPO on serum TC in laying ducks was not significant (P>0.05) (Table 7).
Fatty Acids Levels in Egg Yolk
Main fatty acids of egg yolk in the control group are linoleic acid and palmitic acid, while the main
fatty acids in egg yolk of the RPO groups, are oleic acid and palmitic acid. After eight weeks of RPO feeding, the contents of SFA and MUFA in the RPO groups were higher than those in the control group (P<0.001), and the content of MUFA in the egg yolk had also gradually increased with the increase of RPO content in the feed. The content of PUFA in the egg yolk of each group had decreased with the increase of RPO content in the feed (P<0.001). The total fatty acid content of yolk in each RPO group was slightly lower than that in the control group but the difference was not statistically significant (P>0.05) (Table 8).
DISCUSSION
Effects of RPO on the Productive Performance and Egg Quality of Ducks
This study found that the feed intake of RPO groups were higher than that of the control group (P<0.05). The egg laying rate of each RPO groups had no significant difference compared with the
TABLE 5. EFFECTS OF RPO ON EGG QUALITY OF LAYING DUCKS AFTER FEEDING EIGHT WEEKS (mean ± SD) (n=10)
Item Control group
1% RPO group
2% RPO group
3% RPO group F P
Baseline
Average egg weight /g 77.28 ± 4.82 80.14 ± 6.22 78.97 ± 6.76 79.08 ± 5.82 0.395 0.757
Albumen height /mm 7.46 ± 1.12 7.26 ± 0.84 7.06 ± 1.57 6.76 ± 1.72 0.484 0.695
Yolk colour score 9.09 ± 1.21 9.08 ± 0.69 8.95 ± 0.84 9.34 ± 0.55 0.359 0.783
Haugh unit 81.22 ± 7.55 79.26 ± 6.13 77.25 ± 11.40 79.31 ± 6.47 0.391 0.761
Eight weeks
Average egg weight /g 71.20 ± 8.75 72.57 ± 5.29 72.44 ± 4.21 74.90 ± 5.55 0.623 0.605
Albumen height /mm 7.49 ± 0.61 8.15 ± 1.29 7.11 ± 0.88 8.38 ± 1.56 2.627 0.065
Yolk colour score 9.02 ± 0.68a 9.83 ± 0.48b 10.22 ± 0.77b,c 10.60 ± 0.24c 12.803 <0.001
Haugh unit 83.54 ± 3.92 86.52 ± 6.65 80.38 ± 6.73 85.06 ± 7.86 1.669 0.191
Note: a,b In the same row, values with the different symbol superscripts mean significant differences (P<0.05), while with the same or no symbol superscripts mean no significant differences (P>0.05); RPO - red palm oil; F - statistical value; P - intragroup comparison for changes in the parameters.
TABLE 6. EFFECTS OF RPO SUPPLEMENTATION TO LAYING DUCKS ON CAROTENOIDS LEVELS IN EGG YOLK (mean ± SD) (n=5)
Carotenoids Control group
1% RPO group
2% RPO group
3% RPO group F P
Baseline
Lutein (μg g–1 yolk) 12.69 ± 0.28 12.35 ± 0.74 12.47 ± 0.54 12.33 ± 0.90 0.267 0.848
Zeaxanthin (μg g–1 yolk) 9.01 ± 1.09 9.17 ± 2.00 8.49 ± 1.05 9.03 ± 1.25 0.225 0.878
β-carotene (μg g–1 yolk) 8.02 ± 0.09 7.97 ± 0.07 8.00 ± 0.11 8.03 ± 0.08 0.481 0.700
Total carotenoids (μg g–1 yolk) 34.70 ± 1.85 34.90 ± 4.01 37.32 ± 2.24 37.60 ± 0.92 1.884 0.173
After eight weeks
Lutein (μg g–1 yolk) 12.98 ± 0.47a 12.25 ± 0.92a 13.16 ± 0.95a 28.09 ± 6.71b 23.515 <0.001
Zeaxanthin (μg g–1 yolk) 9.79 ± 1.26 9.62 ± 1.92 10.43 ± 1.22 10.09 ± 2.11 0.224 0.878
β-carotene (μg g–1 yolk) 7.94 ± 0.07a 8.13 ± 0.17a 8.86 ± 0.24b 9.97 ± 0.93c 18.609 <0.001
Total carotenoids (μg g–1 yolk) 36.61 ± 2.90a 40.46 ± 9.44a 41.53 ± 1.75a 58.22 ± 9.02b 9.051 0.001
Note: a,b,c In the same row, values with the different symbol superscripts mean significant differences (P<0.05), while with the same or no symbol superscripts mean no significant differences (P>0.05); RPO - red palm oil; F - statistical value; P - intragroup comparison for changes in the parameters.

709
RED PALM OIL IN LAYING DUCKS DIETS: EFFECTS ON PRODUCTIVE PERFORMANCE, EGG QUALITY, CONCENTRATIONS OF YOLK CAROTENOIDS
ARTICLE IN
PRESS
ARTICLE IN
PRESS
control group (P>0.05) but the egg laying rate of the group with RPO at 30 g kg−1 was significantly lower than that in the groups with RPO at 10 g kg−1 and 20 g kg−1 (P<0.05). It is suggested that short-term RPO and soybean oil intake had no effect on egg laying
rate of the ducks (P>0.05) but rather the intervention of high-dose (30 g kg−1) RPO may reduce egg laying rate (P<0.05). This suggests that there is a limit to using RPO, which should be paid attention in practicality to derive the maximum quality of the
TABLE 7. EFFECTS OF RED PALM OIL SUPPLEMENTATION TO LAYING DUCKS ON SERUM AND EGG YOLK LIPID INDICES (mean ± SD) (n=12)
Item Control group
1% RPO group
2% RPO group
3% RPO group F P
Baseline
Serum TC/ (mmol litre–1) 4.63 ± 1.78 4.43 ± 1.90 3.96 ± 1.17 4.10 ± 1.07 0.456 0.714
Serum TG/(mmol litre–1) 19.81 ± 5.56 18.78 ± 4.24 17.13 ± 3.35 18.78 ± 4.48 0.688 0.564
Yolk TC/ (mmol g–1 yolk) 6.75 ± 3.31 6.78 ± 3.12 7.84 ± 2.50 7.69 ± 3.21 0.359 0.783
Yolk TG/ (mmol g–1 yolk) 41.65 ± 10.14 41.71 ± 8.70 44.74 ± 8.95 42.29 ± 7.99 0.264 0.851
After eight weeks
Serum TC/ (mmol litre–1) 4.61 ± 1.85 6.02 ± 1.78 5.46 ± 2.00 3.86 ± 2.03 2.800 0.052
Serum TG/ (mmol litre–1) 17.07 ± 5.82a 9.86 ± 8.31b 7.14 ± 5.87b 6.45 ± 4.48b 6.378 0.001
Yolk TC/ (mmol g–1 yolk) 7.78 ± 2.54a 4.74 ± 2.67b 4.76 ± 1.62b 5.36 ± 0.85b 4.952 0.006
Yolk TG/ (mmol g–1 yolk) 44.10 ± 9.69a 32.76 ± 7.17b 28.78 ± 7.95b 31.50 ± 6.73b 7.016 0.001
Note: a,b In the same row, values with the different symbol superscripts mean significant differences (P<0.05), while with the same or no symbol superscripts mean no significant differences (P>0.05); RPO - red palm oil; TC - total cholesterol; TG - triglyceride; F - statistical value; P - intragroup comparison for changes in the parameters.
TABLE 8. EFFECT OF DIETARY OIL ON THE FATTY ACID IN EGG YOLK AFTER FEEDING RPO (percentage of total fatty acids)
Fatty acids Control group 1% RPO group 2% RPO group 3% RPO group F P
C16:0 21.55 ± 0.35a 23.94 ± 0.94b,c 23.14 ± 0.23b 24.61 ± 0.24c 27.830 <0.001
C16:1 1.94 ± 0.21a 2.19 ± 0.43a,b 2.27 ± 0.06a,b 2.51 ± 0.20b 3.519 0.043
C18:0 0.66 ± 0.14a 1.47 ± 0.10b 1.25 ± 0.71b 1.32 ± 0.15b 7.070 0.004
C18:1 5.97 ± 0.48a 51.25 ± 1.59b 53.09 ± 2.17b,c 54.01 ± 0.95c 1 533.562 <0.001
C18:2 n-6 60.64 ± 0.58a 11.58 ± 0.38b 12.17 ± 2.93b 9.38 ± 0.79c 1 939.649 <0.001
C18:3 n-6 0.22 ± 0.04a 0.23 ± 0.02a 0.18 ± 0.01b 0.17 ± 0.01b 6.449 0.006
C18:3 n-3 1.05 ± 0.05 0.53 ± 0.35 0.66 ± 0.56 0.42 ± 0.34 3.275 0.053
C20:2 0.34 ± 0.04a 0.24 ± 0.02b 0.21 ± 0.05b 0.22 ± 0.02b 16.573 <0.001
C20:3 n-6 0.43 ± 0.05a 0.35 ± 0.04a,b 0.29 ± 0.11b 0.38 ± 0.02a,b 4.693 0.018
C20:4 n-6 4.71 ± 0.14 5.13 ± 0.41 3.97 ± 1.28 4.35 ± 0.46 2.819 0.077
C24:1 0.51 ± 0.11 0.59 ± 0.08 0.46 ± 0.04 0.45 ± 0.03 3.164 0.058
C22:6 n-3 1.00 ± 0.16a 0.94 ± 0.15a 1.00 ± 0.32a 0.61 ± 0.07b 5.611 0.010
SFA 23.05 ± 0.23a 26.30 ± 1.06c 25.16 ± 0.71b 26.88 ± 0.36c 32.201 <0.001
MUFA 8.58 ± 0.35a 54.63 ± 1.02b 56.90 ± 2.38c 57.51 ± 0.68c 2 162.841 <0.001
PUFA 68.38 ± 0.54a 19.07 ± 0.59b 17.94 ± 1.87b 15.61 ± 0.66c 3 895.144 <0.001
n-3 PUFA 2.26 ± 0.12a 1.76 ± 0.46b 1.85 ± 0.75b 1.24 ± 0.33b 4.943 0.015
n-6 PUFA 66.00 ± 0.63a 17.30 ± 0.19b 16.63 ± 1.64b 14.31 ± 0.62c 4 889.944 <0.001
Others 0.69 ± 0.04a 1.21 ± 0.64a,b 1.68 ± 0.04b 1.16 ± 0.49a,b 3.427 0.047
Total 45.70 ± 1.01 34.84 ± 8.09 35.95 ± 6.26 44.34 ± 3.24 4.538 0.059
Note: a,b,c In the same row, values with the different symbol superscripts mean significant differences (P<0.05), while with the same or no symbol superscripts mean no significant differences (P>0.05); RPO - red palm oil; SFA - saturated fatty acid, MUFA – monounsaturated fatty acid; PUFA - polymonounsaturated fatty acid; F - statistical value; P - intragroup comparison for changes in the parameters.

710
JOURNAL OF OIL PALM RESEARCH 33 (4) DECEMBER 2021
ARTICLE IN
PRESS
ARTICLE IN
PRESS
ARTICLE IN
PRESS
ARTICLE IN
PRESS
product and reap economic benefits. This is likely because RPO in itself has a special odour and colour which did not change drastically when a low dose is added to the feed. However, the content of nutrients such as carotenoids and vitamin E in the feed could be increased, thereby increasing the yield. When the ratio of addition is increased, the feed odour and colour can also change drastically, thereby affecting the feed intake, digestion and utilisation of laying ducks. However, studies have shown that feeding Cambrian duck with soybean oil (2%) or PO (2%) did not affect the growth and development of ducks (weight) (P>0.1), nor does it affect the feed intake of the ducks (P>0.1) (Zosangpuii et al., 2015).
All levels of RPO meal used in this study had no effect on the average egg weight, albumen height and Haugh unit (P>0.05). It is suggested that short-term RPO intake had no effect on egg quality of laying ducks compared with soybean oil (P>0.05).
Effects of RPO on the Egg Yolk Colour and Carotenoids Levels
After eight weeks of RPO intervention, there was a significant difference in egg yolk colour of RPO groups compared with the control group (P<0.05). There was a dose-response relationship between egg yolk colour and RPO concentration in the feed. Yolk colour had changed significantly (P<0.001) with the RPO concentration (P<0.05), and the eggs of the group with RPO at 30 g kg−1 had the highest colour of egg yolk. The results of this study suggest that adding RPO to feed can significantly improve the colour of egg yolk, and the level of yolk colour showed a significant upward trend with the increase of RPO in the diet. Further research found that RPO can increase the content of lutein, β-carotene and total carotenoids in egg yolk, with varying degrees (P<0.05), and the level of lutein, β-carotene and total carotenoids had increased with the increase of RPO in the diet. Since there was no zeaxanthin in RPO, there was no significant difference in yolk zeaxanthin content between the groups. This is consistent with the composition and content of carotenoids in RPO.
The traditional raw materials used in poultry feed usually do not provide sufficient carotenoids to achieve the yolk pigmentation demanded by consumers, so colour additives are included commonly in the form of carotenoid-rich dried plant extracts. Many studies focus on how to improve the colour of eggs to reap higher benefits. For example, Moreno et al. (2020) used carotenoid-enriched maize, while Titcomb et al. (2019) used carrot leaves and marigold fortification. RPO is rich in carotenoids, and the carotenoids content in the diet of each RPO group is also significantly higher than that of the control group. From this study, the carotenoids in RPO can be effectively absorbed and
converted into egg yolk by ducks and effectively improve the colour of egg yolk.
Effect of RPO on Serum Lipid Level and Egg Yolk Lipid Content
Research has shown that the lipid composition and fatty acid profile of an egg can be influenced by dietary manipulation (Ouyang et al., 2004). After eight weeks of RPO intervention, serum TG, yolk TC and yolk TG level in each RPO groups were significantly lower than those in control group, which may be related to the sn-2 hypothesis, and may also be related to the rich tocotrienols and carotenoids in RPO. Studies have shown that tocotrienols can reduce the activity of HMG Co-A reductase (a rate-limiting enzyme in the synthesis of cholesterol in liver cells) and act as oxysterols to lower cholesterol level (Pearce et al., 1992). Tocotrienol in PO is more efficient to transfer to the egg yolk than other oils (barley oil) (Walde et al., 2014).
Further research found that because RPO contains approximately 44.13% SFA (mainly palmitic acid, 36.82%) and 43.36% MUFA (mainly oleic acid, 43.08%), the content of SFA (palmitic acid) and MUFA (oleic acid) in the egg yolk increased significantly with the increase of RPO in diets. Due to RPO has a low contain of PUFA, approximately 12.49%, dietary RPO had decreased the content of PUFA in egg yolk (P<0.05).
CONCLUSION
Eggs are regarded as one of the nature's most wholesome foods because they contain high-quality protein and lipids as well as essential and non-essential minerals and vitamins. Studies have shown that the bioavailability of lutein in eggs is high, which may be related to the fat contained in the egg yolk. Adding appropriate amount of RPO (10 g kg−1 and 20 g kg−1 in this article) may have the potential to increase the laying rate, bring the possibility of increasing production and increase people's income. The results of this study showed that dietary RPO can significantly increase egg yolk colour, increase carotenoids content in egg yolk and reduce certain lipid indicators, which could be more attractive to customers. In summary, RPO as a green and safe feed colourant deserves further development and promotion.
ACKNOWLEDGEMENT
We thank the support from Postgraduate Research and Practice Innovation Program of Jiangsu Province (KYCX20_0154) and thank all those who have contributed to this article.

711
RED PALM OIL IN LAYING DUCKS DIETS: EFFECTS ON PRODUCTIVE PERFORMANCE, EGG QUALITY, CONCENTRATIONS OF YOLK CAROTENOIDS
ARTICLE IN
PRESS
ARTICLE IN
PRESS
REFERENCES
Abiodun, B S; Adedeji, A S and Abiodun, E (2014). Lesser known indigenous vegetables as potential natural egg colourant in laying chickens. J. Anim. Sci. Technol., 56: 18.
Akter, Y; Kasim, A; Omar, H and Sazili, A Q (2014). Effect of dietary crude palm oil on quality and oxidative stability of chicken eggs. J. Food Agric. Environ., 12: 172-181.
Andreu-Sevill, A J; Hartmann, A; Burlo, F; Poquet, N and Carbonell-Barrachina, A A (2009). Health benefits of using red palm oil in deep-frying potatoes: Low acrolein emissions and high intake of carotenoids. Food Sci. Technol. Int., 15: 15-22.
Buchanan, N P and Moritz, J S (2009). Main effects and interactions of varying formulation protein, fiber and moisture on feed manufacture and pellet quality. J. Appl. Poult. Res., 18: 274-283.
Cherian, G; Wolfe, F W and Sim, J S (1996). Dietary oils with added tocopherols: Effects on egg or tissue tocopherols, fatty acids, and oxidative stability. Poult. Sci., 75: 423-431.
Couch, J R; Cornett, B M; Ferguson, T M and Creger, C R (1970). Effect of dietary fat on the fatty acid composition of turkey egg yolks. Nutr. Repts. Int., 1: 83-93.
FEEDAP (2014). Scientific opinion on the safety and efficacy of canthaxanthin as a feed additive for poultry and for ornamental birds and ornamental fish. EFSA Journal, 12, 3527-n/a. Panel on Additives and Products or Substances Used in Animal Feed (FEEDAP).
Fletcher, D L (1999). Broiler breast meat colour variation, pH and texture. Poult. Sci., 78: 1323-7.
Fraeye, I; Bruneel, C; Lemahieu, C; Buyse, J; Muylaert, K and Foubert, I (2012). Dietary enrichment of eggs with omega-3 fatty acids: A review. Food Res. Int., 48: 961-969.
Go, R E; Hwang, K A; Kim, Y S; Kim, S H; Nam, K H and Choi, K C (2015). Effects of palm and sunflower oils on serum cholesterol and fatty liver in rats. J. Med. Food, 18: 363-369.
Gouk, S W; Cheng, S F; Mok, J S; Ong, A S and Chuah, C H (2013). Long-chain SFA at the sn-1, 3 positions of TAG reduce body fat deposition in C57BL/6 mice. Br. J. Nutr., 110: 1987-95.
Hammershoj, M; Kidmose, U and Steenfeldt, S (2010). Deposition of carotenoids in egg yolk by short-term supplement of coloured carrot (Daucus carota) varieties as forage material for egg-laying hens. J. Sci. Food Agric., 90: 1163-1171.
Hargitai, R; Boross, N; Nyiri, Z and Eke, Z (2016). Biliverdin-and protoporphyrin-based eggshell pigmentation in relation to antioxidant supplementation, female characteristics and egg traits in the canary (Serinus canaria). Behav. Ecol.Sociobiol., 70: 2093-2110.
Hornstra, G (1987). Effect of dietary palm oil on arterial thrombus formation and prostanoid production in rats. Agents and Actions, 22: 377-378.
Islam, K M and Schweiger, F J (2015). Comparison of three spectrophotometric methods for analysis of egg yolk carotenoids. Food Chem., 172: 233-237.
Karadas, F; Grammenidis, E; Surai, P F; Acamovic, T and Sparks, N H (2006). Effects of carotenoids from lucerne, marigold and tomato on egg yolk pigmentation and carotenoid composition. Br. Poult. Sci., 47: 561-566.
Keat, O C; May, C Y and Hock, A O (1991). Recovery of carotenoids. Google Patents.
Kijparkorn, S; Plaimast, H and Wangsoonoen, S (2010). Sano (Sesbania javanica Miq.) flower as a pigment source in egg yolk of laying hens. Thai J. Vet. Med., 40: 281-287.
Ma, S (2015). Meta-analysis of the relationship between palm oil and human blood lipid and dietary intervention experiment. MSc. thesis, Yangzhou University.
Mizurini, D D; Maia, I D; Sardinha, F L D; Monteiro, R D; Ortiz-Costa, S and Do Carmo, M D T (2011). Venous thrombosis risk: Effects of palm oil and hydrogenated fat diet in rats. Nutrition, 27: 233-238.
Moreno, J A; Diaz-gomez, J; Fuentes-Font, L; Angulo, E; Gosalvez, L F; Sandmann, G; Portero-otin, M; Capell, T; Zhu, C; Christou, P and Nogareda, C (2020). Poultry diets containing (keto)carotenoid-enriched maize improve egg yolk colour and maintain quality. Anim. Feed Sci. Technol., 260. DOI: 10.1016/j.anifeedsci.2019.114334.
Nagendran, B; Unnithan, U; Choo, Y and Sundram, K (2000). Characteristics of red palm oil, a carotene-and vitamin E-rich refined oil for food uses. Food Nutr. Bull., 21: 189-194.

712
JOURNAL OF OIL PALM RESEARCH 33 (4) DECEMBER 2021
ARTICLE IN
PRESS
ARTICLE IN
PRESS
Nawab, A; Li, G; Liu, W; Lan, R; Wu, J; Zhao, Y; Kang, K; Kieser, B; Sun, C; Tang, S; Xiao, M and An, L (2019). Effect of dietary curcumin on the antioxidant status of laying hens under high-temperature condition. J. Therm. Biol., 86: 102449.
Nyquist, N F R; Rodbotten, R; Thomassen, M and Haug, A (2013). Chicken meat nutritional value when feeding red palm oil, palm oil or rendered animal fat in combinations with linseed oil, rapeseed oil and two levels of selenium. Lipids Health Dis., 12(69). DOI: 10.1186/1476-511X-12-69.
Ooi, C; Choo, Y and Ong, A (1993). Refining of edible oil. Malaysian Patent MY-104059A.
Ouyang, K; Wang, W J; Xu, M S; Jiang, Y and Shangguan, X C (2004). Effects of different oils on the production performances and polyunsaturated fatty acids and cholesterol level of yolk in hens. Asian-Australas. J. Anim. Sci., 17: 843-847.
Paredes-Molina, F J; Cubillos, V M; Montory, J A and Andrade-Villagr, N P A (2016). Are embryonic developing modes determinant in the acquisition and levels of photoprotective compounds in slipper limpets of the Crepipatella genus? J. Photochem.Photobiol. B, 162: 511-518.
Pearce, B C; Parker, R A; Deason, M E; Qureshi, A A and Wright, J J K (1992). Hypocholesterolemic activity of synthetic and natural tocotrienols. J. Med. Chem., 35: 3595-3606.
Punita, A and Chaturvedi, A (2000). Effect of feeding crude red palm oil (Elaeis guineensis) and grain amaranth (Amaranthus paniculatus) to hens on total lipids, cholesterol, PUFA levels and acceptability of eggs. Plant Foods Hum. Nutr., 55: 147-157.
Rauchova, H; Vokurkov, M; Pavelka, S; Vaneckova, I; Tribulova, N and Soukup, T (2018). Red palm oil supplementation does not increase blood glucose
or serum lipids levels in Wistar rats with different thyroid status. Physiol. Res., 67: 307-315.
Rice, A L and Burns, J B (2010). Moving from efficacy to effectiveness: Red palm oil's role in preventing vitamin A Deficiency. J. Am. Coll. Nutr., 29: 302-313.
Spasevski, N; Peulic, T; Banjac, V; Colovic, R; Pezo, L; Rakita, S; Puvaca, N; Kokic, B; Duragic, O and Basic, Z (2020). Influence of extruded camelina seed and natural colourants addition laying hens diet on eggs yolk colour and fatty acid composition. J. Anim. Plant Sci., 30: 1347-1356.
Sundram, K; Sambanthamurthi, R and Tan, Y A (2003). Palm fruit chemistry and nutrition. Asia Pac. J. Clin. Nutr., 12: 355.
Titcomb, T J; Kaeppler, M S; Cook, M E; Simon, P W and Tanumihardjo, S A (2019). Carrot leaves improve color and xanthophyll content of egg yolk in laying hens but are not as effective as commercially available marigold fortificant. Poult.Sci., 98: 5208-5213.
Walde, C M; Drotleff, A M and Ternes, W (2014). Comparison of dietary tocotrienols from barley and palm oils in hen's egg yolk: Transfer efficiency, influence of emulsification and effect on egg cholesterol. J. Sci. Food Agric., 94: 810-818.
Wilson, T A; Nicolosi, R J; Kotyla, T; Sundram, K and Kritchevsky, D (2005). Different palm oil preparations reduce plasma cholesterol concentrations and aortic cholesterol accumulation compared to coconut oil in hypercholesterolemic hamsters. J. Nutr. Biochem., 16: 633-640.
Zosangpuii; Patra, A K and Samanta, G (2015). Inclusion of an emulsifier to the diets containing different sources of fats on performances of Khaki Campbell ducks. Iran. J. Vet. Res., 16: 156-160.

713
ARTICLE IN
PRESS
ARTICLE IN
PRESS
Journal of Oil Palm Research Vol. 33 (4) December 2021 p. 713-723DOI: https://doi.org/10.21894/jopr.2021.0020
DOES PALM MID FRACTION AFFECT ADULT SATIETY?
VOON, P T1*; TOH, S W H2; NG, T K W3; LEE, V K M2; YONG, X S2; YAP, S Y1 and NESARETNAM, K4
ABSTRACTDietary fats with different melting characteristics, fatty acids chain length and positional distribution may affect postprandial gut hormones and satiety response. We investigated the effects of palm mid fraction (PMF) (POP-rich), shea stearin (SS) (SOS-rich) and high oleic sunflower oil (HOSF) (OOO-rich) with either palmitic, stearic or oleic acid predominance at the sn-1 and sn-3 positions on gut hormone concentrations and satiety. A randomised, double-blind crossover (3 × 3 arms) orthogonal Latin-square study was conducted on 36 healthy adults (18 males, 18 females; average aged 23 years). Each subject received ~50 g of test fat incorporated in a muffin in random order, two weeks apart, over a six-week period. Blood samples were collected for a 3-hr period. We found that PMF- and HOSF-rich diets with either palmitic or oleic acid at the sn-1 and sn-3 positions exerted significantly higher (P<0.05) postprandial glucose dependent insulinotropic polypeptide (GIP) compared to SS-rich diet. However, plasma glucagon like-peptide 1 (GLP-1), peptide YY (PYY), ghrelin and visual analogue scale (VAS) (P>0.05) were not affected. These results suggested that PMF- and HOSF-rich diets increased the secretion of GIP that may promote satiety response in human adults.
Keywords: ghrelin, glucagon like-peptide 1, glucose dependent insulinotropic polypeptide, gut hormone, palmitic acid.
Received: 28 September 2020; Accepted: 2 February 2021; Published online: 4 May 2021.
1 Malaysian Palm Oil Board, 6 Persiaran Institusi, Bandar Baru Bangi, 43000 Kajang, Selangor, Malaysia.
2 International Medical University (IMU), 126, Jalan Jalil Perkasa 19, Bukit Jalil, 57000 Kuala Lumpur, Malaysia.
3 Department of Allied Health Sciences, Faculty of Science, Universiti Tunku Abdul Rahman, 31900 Kampar, Perak, Malaysia.
4 Jalan Kelab Golf 13, 40100 Shah Alam, Selangor, Malaysia.
* Corresponding author e-mail: [email protected]
INTRODUCTION
Obesity is one of the greatest public health challenges of the 21st century. In 2016, the World Health Organization reported that 1.9 billion adults globally (age ≥18 years) were overweight and at
least 650 million adults were obese. In addition, the prevalence of obesity and severe obesity are forecasted to have an increment of 33% and 130%, respectively in the next two decades (Finkelstein et al., 2012). One of the reasons that causes obesity to develop and perpetuate rapidly is gut hormone dysregulation (Lean and Malkova, 2016). Gut hormone is vital in regulating the haemostasis of food intake, energy and glucose.
Fat in the gastrointestinal tract reduces hunger and curbs food intake by eliciting satiety signals. These signals are evoked by entry of dietary triacylglycerol (TAG) or fatty acids into the small intestine (Maljaars et al., 2009). Gut hormones are satiety signals that are released from the gastrointestinal tract which modulate the activity of appetite centres within the brain. Examples of gut hormones include glucose dependent insulinotropic polypeptide (GIP), glucagon like-peptide 1 (GLP-1), peptide YY (PYY), cholecystokinin and ghrelin.

714
JOURNAL OF OIL PALM RESEARCH 33 (4) DECEMBER 2021
ARTICLE IN
PRESS
ARTICLE IN
PRESS
ARTICLE IN
PRESS
ARTICLE IN
PRESS
GIP and GLP-1 are incretin hormones secreted from the intestine, they stimulate the release of insulin from pancreatic β-cells upon ingestion of glucose (Yabe and Seino, 2011). PYY is synthesised and released in response to food intake primarily from the endocrine L-cells, especially ileum, colon and rectum (Ueno et al., 2008). PYY is first isolated as a 36-amino acid peptide from porcine upper small intestine (Suzuki et al., 2010). Ghrelin is an oxiregenic gut hormone of 28-amino acid gastrointestinal peptide which is secreted by endocrine cells in the gastrointestinal tract, primarily the fundus of the stomach (Mittelman et al., 2010). Ghrelin circulates in both acylated (active) and de-acylated forms in which the former appears to be responsible for signalling hunger (Hosoda et al., 2004).
These signals play a fundamental role in regulating food intake and satiety as well as in energy balance. Gut hormones release has been shown to play a role in the prevalence of obesity through food intake reduction and appetite satisfaction (Little et al., 2007). Release of gut hormones could be regulated by the consumption of dietary fats which give a greater postprandial satiety (act of fullness) which in turn can facilitate weight loss or curb weight gain. In addition, GIP and GLP-1 have been implicated in the treatment of patients with diabetes (Yabe and Seino, 2011).
Postprandial studies involving the effects of dietary fats on gut hormone have been extensively studied over the recent years. De Silva et al. (2011) demonstrated that a combined administration of PYY3-36 and GLP-17-36 amide to fasting human subjects lead to reductions in food intake and subsequently energy intake and this was supported by a meta-analysis which was carried out by Verdich et al. (2001). Furthermore, a study conducted by Thomsen et al. (1999) had shown that postprandial GLP-1 and GIP responses were higher after a meal of monounsaturated fat (olive oil) as compared to a saturated fat (butter). The finding indicated that postprandial GIP and GLP-1 secretion were stimulated by monounsaturated fat intake. Meanwhile, Poppitt et al. (2006) found that high-fat meals had no significant effects on postprandial ghrelin levels in a group of healthy men.
It was clearly seen that the concentration of gut hormone released and circulated in the body were correlated with the types of dietary fat intake (Sun et al., 2019). Differences in chain length, degree of saturation, emulsification as well as emulsion stability may also influence the efficiency of satiety (Bosscher and Viberg, 2009). The induction of physiological satiety signals may well depend on the composition of fatty acids in the particular fats used (Lawton et al., 2000). Every type of dietary fat has its own unique TAG composition with different positional distribution of fatty acids.
The positional distribution of fatty acids in TAG marked its importance when the food industries are seeking for cocoa butter equivalent (CBE) as alternative to cocoa butter that is expensive and low in production. Palm oil, illipe and shea were listed in the European Chocolate Directive 2000/36EEC (EC, 2000) as CBE. Besides, vegetable oils such as palm mid fraction (PMF), kokum, mahua, mango fats, olive oil and teaseed oil have also been used for CBE preparation.
Cocoa butter is composed of three main TAG: 1, 3-dipalmitoyl-2- oleoylglycerol (POP); 1(3)-palmitoyl-3(1)-stearoyl-2- oleoylglycerol (POS) and 1,3 distearoyl-2-oleoylglycerol (SOS), with oleic acid in the sn-2 positions (Ong and Goh, 2002). The stearic to palmitic acid ratio in cocoa butter is 1.3: 1.0. It is therefore imperative that a vegetable oil which has TAG with oleic acid in the 2-position, can be used for CBE preparation. The availability of palm oil and its fractions with a similar chemical composition (predominantly POP) to cocoa butter (Dian et al., 2017; Edem, 2002) has made these palm-based oils suitable for CBE production (Zaliha and Norizzah, 2012).
To date, the effects of different types of fatty acids at the sn-1 and sn-3 positions of the TAG molecule, especially with the CBE type of fats on postprandial gut hormone concentrations have not been explored extensively. Therefore, this study was conducted to investigate the effects of CBE type of fats, namely PMF and shea stearin (SS) with either palmitic- or stearic acid that is predominantly present at the sn-1 and sn-3 positions of the TAG backbone, on gut hormone concentrations and satiety response compared to HOSF (oleic acid rich fat) that served as a control.
METHODS
Subjects
This study was approved by Research and Ethics Committee, International Medical University, Kuala Lumpur, Malaysia and was registered at ClinicalTrials.gov (a world database of privately and publicly funded clinical studies) as NCT01428960 (https://clinicaltrials.gov/ct2/show/NCT01428960). A total of 36 healthy adult males (n=18) and females (n=18), aged 25-50 years old (Table 1) were recruited to participate in this study. A health screening was conducted and the following data were collected: a) physical examination [height, weight, body mass index (BMI) and blood pressure]; b) fasting serum lipid profile; c) plasma glucose determination; d) liver function tests (serum glutamic-oxaloacetic transaminase and serum glutamic-pyruvic transaminase); and e) kidney function tests (serum creatinine). Only volunteers with BMI 18.5-25.0 kg

715
DOES PALM MID FRACTION AFFECT ADULT SATIETY?
ARTICLE IN
PRESS
ARTICLE IN
PRESS
m–2, normotensive (systolic blood pressure <140 mmHg and diastolic blood pressure <90 mmHg, normolipidemic [total cholesterol <6.2 mM litre–1 (<240 mg dL–1), fasting TAG <1.70 mmol litre–1 (<150 mg dL–1)], Non-diabetic: fasting glucose 4.0 mmol litre–1 to 7.0 mmol litre–1 were recruited into the study. The exclusion criteria were subjects who smoke, taking cholesterol or blood glucose medication, consume alcohol, with a history of blood-clotting problem, non-availability during the intervention; and for women who were pregnant or lactating.
Study Design
A randomised, double-blind crossover (3 × 3 arms) orthogonal latin-square design was used. Each subject received three experimental test meals in a random order, two weeks apart, over a six-week period. Each set of test meal contains a muffin and a milkshake that provided 875.6 kcal energy, 16 g protein, 83 g carbohydrate and 53 g test fat. Milkshake was prepared to aid the test muffin intake as part of the standard test meal set. For each postprandial sampling, blood collections were conducted at zero min and at every 30 min intervals for 3 hr.
Test Fats
Test fat, high oleic sunflower oil (HOSF) was obtained from Intercontinental Specialty Fats Sdn. Bhd.; whereas PMF (iodine value=34.9) and SS (iodine value=34.1) were obtained from Wilmar PGEO Edible Oils Sdn. Bhd. The latter two test fats were blended with a small amount of sunflower oil (Mazola, Switzerland) to standardise the content of
linoleic acid across the diets to 7%. These test fats were incorporated into muffins, labelled with a code and stored frozen until being consumed within six weeks.
Sample Size Calculation
The sample size was calculated (n=36, 90% power) to detect a 0.5 standard deviation (SD) unit change in the area under the curve for plasma GIP concentrations with P<0.01. The secondary outcomes of the study were changes in GLP-1, PYY, ghrelin and visual analogue scale (VAS).
Samples Collection
The subjects were stratified randomly to one of six treatment sequences (ABC, BCA, CAB, ACB, CBA, or BAC; where A is PMF, B is SS, and C is HOSF). All subjects were requested to avoid high fat foods and strenuous exercise 24 hr before intervention day and fast overnight starting at 2200 hr. In order to avoid an over consumption of fat and energy intake, a standardised low-fat meal (containing 500-700 kcal and, 10 g fat) were provided as the evening meal to be consumed before 2200 hr and no food or drinks were allowed thereafter, except water. The participants attended the scheduled blood sampling the next morning between 0800 and 1000 hr at the Nutrition Clinic MPOB. To facilitate blood collection, a 22G” Vasofix® Brannule (Cat No. 426 8091B, B. Braun, Germany) was inserted into the antecubital vein of the forearm and held in place with a Connecta (Cat No. 394601, Becton – Dickinson, Sweden). Blood collection was perfomed using antiseptic venepuncture technique by registered staff nurses
TABLE 1. CHARACTERISTICS OF THE PARTICIPANTS
VariablesParticipants
Women (n=18) Men (n=18) Total (n=36)
Age (yr) 23.0 ± 1.1 23.0 ± 1.9 23.3 ± 1.5
Weight (kg) 52.0 ± 5.6 63.1 ± 7.6 57.5 ± 8.7
Height (cm) 160.0 ± 4.2 172.0 ± 5.7 166.0 ± 8.0
BMI (kg m litre–2) 20.3 ± 1.6 21.3 ± 2.0 20.8 ± 1.8
Systolic BP (mmHg) 111.0 ± 6.1 122.0 ± 10.0 116.0 ± 9.9
Diastolic BP (mmHg) 73.0 ± 5 75.0 ± 7.6 74.0 ± 6.4
Total cholesterol (mmol litre–1) 4.9 ± 0.7 4.4 ± 0.8 4.7 ± 0.8
HDL-c (mmol litre–1) 1.7 ± 0.3 1.4 ± 0.3 1.5 ± 0.3
LDL-c (mmol litre–1) 2.9 ± 0.6 2.7 ± 0.7 2.8 ± 0.6
TAG (mmol litre–1) 0.7 ± 0.3 0.7 ± 0.4 0.7 ± 0.3
Fasting glucose (mmol litre–1) 4.6 ± 0.6 4.7 ± 0.3 4.6 ± 0.3
Note: BMI - body mass index; BP - blood pressure; HDL-c - high-density lipoprotein cholesterol; LDL-c - low-density lipoprotein cholesterol; TAG - triacylglycerol. All values are means ± standard deviation.

716
JOURNAL OF OIL PALM RESEARCH 33 (4) DECEMBER 2021
ARTICLE IN
PRESS
ARTICLE IN
PRESS
ARTICLE IN
PRESS
ARTICLE IN
PRESS
supervised by medical officer. A total of 15 ml of fasting blood was withdrawn into blood collection tubes.
Each subject then consumed the test meal within 10 min. Each subject was given drinking water (± 250 ml) on the study day. During the intervention day, the subjects were permitted to communicate with each other, however, the conversation involving food, appetite or related issues were restricted. VAS ratings of hunger and appetite and their ability to predict subsequent food intake and ad-libitum lunch postprandially has been demonstrated in a number of studies (Poppitt et al., 2010; Strik et al., 2010). In this study, satiety feelings (hunger) were measured using VAS (100 mm) modified from Parker et al. (2004) in which the scales were anchored with ‘not hungry at all’ at one end and ‘extremely hungry’ at the other end. Subjects were required to mark on the scale provided that reflected their satiety feelings at that moment. Measurements were taken prior to the test meal and every 30 min with a total of seven times, up until the end of postprandial. Blood samples were collected immediately prior to the VAS measurements.
At the end of intervention day, each subject was served an ad-libitum lunch and a glass of drink until comfortably satisfied. The amount of food intake was measured using a weighing scale.
Analytical Methods
Plasma GIP, GLP-1, PYY and ghrelin were analysed using a sandwich-based enzyme-linked immunosorbent assay and non-radioactive kits (Millipore, USA). For the collection of blood samples for GIP, GLP-1 and PYY, 10 µl of dipeptidyl peptidase IV per 1 ml of blood was added into ethylenediaminetetraacetic acid (EDTA) tubes prior to the study conducted. On the days of the study, 65 µl of aprotinin was added into 2 ml EDTA tube for the collection of blood samples for ghrelin and PYY. Finally, plasma samples for ghrelin were acidified with 0.1 N of hydrochloric acid. Plasma samples were collected using an EDTA vacutainer on ice and processed within 15 min of blood collection via centrifugation at 3500 rpm, 20 min at 4°C. The cryovials containing the samples were stored at -80°C until prior to analyses.
The fatty acid composition of test fats was measured using gas-liquid chromatography on an SP-2560 column (100 m × 0.23 mm × 0.2 mm; Agilent Technologies) with a flame ionisation detector on an autosystem (Perkin Elmer) (Voon et al., 2011). The helium carrier gas pressure and injector temperature were set to 40 psi and 250°C, respectively. The oven temperature was set isothermal at 240°C for 42 min. Hydrogen and compressed air were used for ignition. A fatty acid methyl esters mixture (Sigma-Aldrich, Australia) was used as the external standard.
TAG composition of the test fats was determined by reversed-phase high performance liquid chromatography system. The method of analysis was modified from American Oil Chemists’ Society (AOCS) Official Method Ce 5c–93 (AOCS Official Method, 1997). Slip-melting point was determined according to AOCS Cc3b-92 (AOCS Official Method, 2017).
Statistical Analyses
Data were analysed using a repeated measure analysis of variance (ANOVA), followed by a Bonferroni post-hoc analysis performed with GraphPad Prism Version 5 (GraphPad Software, La Jolla, CA 9203, USA) and PASW Statistics 18 to assess the significant differences between diets. The normal distribution of data was access using Shapiro-Wilk’s normality test. All data were logarithmically transformed as they were not normally distributed. All data are expressed as mean with 95% confidence interval (CI). Different superscripts attached to values in the same row demonstrate that the values show differences significantly among the corresponding column (P<0.05, Bonferroni multiple comparison test).
RESULTS
The fatty acid composition of the test fats is shown in Table 2. PMF and SS contained similar proportions of saturated fatty acids (SFA) (62.7%, 62.6%) and oleic acid (33.7%, 33.0%) but PMF contained much higher palmitic acid than SS (57.1% vs. 1.8%) and less stearic acid than SS (5.0% vs. 60.8%). PMF consists of POP (67.6%) while SS consists mainly of SOS (74.2%) with oleic acid in the sn-2 positions. The main molecular TAG species of HOSF is triolein (OOO) (66.5%).
TABLE 2. FATTY ACID COMPOSITION OF THE TEST FATS
Fatty acidsMol %
PMF SS HOSFC14:0 0.7 ± 0.1 ND NDC16:0 57.1 ± 0.2 1.8 ± 0.0 4.5 ± 0.0C18:0 5.0 ± 0.0 60.8 ± 0.6 2.8 ± 0.5SFA 62.7 ± 0.1 62.6 ± 0.6 7.2 ± 0.3
C18:1 33.7 ± 0.1 33.0 ± 0.5 85.3 ± 0.4MUFA 33.7 ± 0.1 33.0 ± 0.5 85.3 ± 0.4C18:2 3.0 ± 0.0 2.0 ± 0.0 7.5 ± 0.1PUFA 3.0 ± 0.0 2.0 ± 0.0 7.5 ± 0.1Others 0.6 ± 0.0 1.4 ± 0.0 ND
Note: PMF - palm mid fraction; SS - shea stearin; HOSF - high-oleic sunflower oil; C18:2 - linoleic acid; C14:0 - myristic acid; C18:1 - oleic acid; C16:0 - palmitic acid; C18:0 - stearic acid; SFA - saturated fatty acids; MUFA - monounsaturated fatty acids; PUFA - polyunsaturated fatty acids; ND - not detected.

717
DOES PALM MID FRACTION AFFECT ADULT SATIETY?
ARTICLE IN
PRESS
ARTICLE IN
PRESS
The three experimental fats contain high amounts of oleic acid at the sn-2 position (PMF=72%, SS=80%, HOSF=88%). PMF has a melting point at ~ 31.3°C, whereas SS shows a higher melting point at ~ 38.0°C. HOSF shows a melting point at <1°C.
Table 3 shows the changes in the incretin hormone- GIP concentrations after consumption of the three experimental fats. The GIP concentrations are consistently lower (P<0.05) in the SS-meal group compared with the PMF- and HOSF-meal groups.
GIP responses did not differ significantly (P>0.05) between HOSF- and PMF- meals during the 3 hr postprandial study. However, there were significant differences (P<0.05) in plasma GIP levels between the test meal of SS with PMF- and HOSF- meal respectively from 60 min time points onwards. Furthermore, postprandial changes in GIP comparing HOSF and SS showed a meal × time
interaction with P=0.0003 at 30 min; the difference was 75.59 pg ml–1 (95% CI, 3.18, 148.0).
The differences between HOSF- and PMF-meal with the SS-meal in the change of GIP at 60 min were 185.7 pg ml–1 (95% CI, 101.2, 270.2) and -155.4 pg ml–1 (95% CI, -239.9, -70.94) respectively; at 90 min 187.5 pg ml–1 (95% CI, 103.3, 271.7) and -176.0 pg ml–1 (95% CI, -260.2, -91.85); and at 120 min 152.6 pg ml–1 (95% CI, 67.06, 238.2) and -138.0 pg ml–1 (95% CI, -223.6, -52.41). Meanwhile, at 150 min, the differences between HOSF and PMF with SS were 186.5 pg ml–1 (95% CI, 115.8, 257.2) and -158.0 pg ml–1 (95% CI, -228.7, -87.27), while at 180 min 160.7 pg ml–1 (95% CI, 74.43, 246.9) and -124.6 pg ml–1 (95% CI, -210.8, -38.33), respectively. All test meals did not show a significant meal × time interactions in plasma GLP-1 (Table 4) (P=0.23), PYY (Table 5) (P=0.47) and ghrelin (Table 6) (P=0.48) levels as well as in VAS scores (Figure 1) (P=0.11).
TABLE 3. POSTPRANDIAL GLUCOSE DEPENDENT INSULINOTROPIC POLYPEPTIDE CONCENTRATIONS IN THE THREE EXPERIMENTAL GROUPS
Time(min)
GIP (pg ml–1)
PMF SS HOSF
Fasting 65.15 (49.62, 80.67) 59.60 (46.38, 72.83) 60.24 (51.29, 69.20)
30 339.51 (284.27, 394.75)a 275.33 (225.06, 325.60)b 350.92 (303.79, 398.05)a
60 498.00 (434.56, 561.45)a 342.58 (294.51, 390.64)b 528.30 (467.69, 588.90)a
90 561.79 (492.62, 630.96)a 385.74 (338.97, 432.52)b 573.24 (513.00, 633.48)a
120 569.97 (498.80, 641.14)a 431.98 (379.90, 484.06)b 584.62 (521.86, 647.39)a
150 585.12 (523.33, 646.91)a 427.15 (376.51, 477.78)b 613.61 (548.06, 679.15)a
180 593.83 (518.44, 669.22)a 469.25 (405.75, 532.76)b 629.93 (558.09, 701.77)a
Note: GIP - glucose dependent insulinotropic polypeptide; PMF - palm mid fraction; SS - shea stearin; HOSF - high-oleic sunflower oil. Different superscript letters in the same row showed significant differences (P<0.05, Bonferroni multiple comparison test) between corresponding columns. Values are geometric means; 95% confidence interval (CI) in parentheses. n=36 for all test diets. Data were log-transformed, performed by repeated-measures ANOVA and showed a diet × time interaction (P=0.000).
TABLE 4. POSTPRANDIAL GLUCAGON LIKE-PEPTIDE 1 CONCENTRATIONS IN THE THREE EXPERIMENTAL GROUPS
Time(min)
GLP-1 (pM)
PMF SS HOSF
Fasting 3.69 (1.56, 5.83) 3.00 (1.87, 4.13) 2.61 (2.25, 2.97)
30 8.10 (5.19, 11.00) 8.16 (5.41, 10.91) 8.03 (6.37, 9.69)
60 6.40 (4.72, 8.08) 5.59 (4.31, 6.87) 6.40 (4.78, 8.02)
90 7.78 (5.55, 10.01) 6.27 (4.98, 7.57) 8.05 (6.68, 9.43)
120 7.86 (6.26, 9.47) 5.94 (4.74, 7.13) 7.57 (6.03. 9.11)
150 7.33 (6.09, 8.57) 6.05 (4.90, 7.20) 7.62 (6.30, 8.93)
180 7.44 (5.95, 8.94) 6.36 (5.09, 7.64) 7.77 (6.34, 9.20)
Note: GLP-1 - glucagon like-peptide 1; PMF - palm mid fraction; SS - shea stearin; HOSF - high-oleic sunflower oil. Values are geometric means; 95% confidence interval (CI) in parentheses. n=36 for all test diets. Data were log-transformed, performed by repeated-measures ANOVA and showed a diet × time interaction (P=0.227).

718
JOURNAL OF OIL PALM RESEARCH 33 (4) DECEMBER 2021
ARTICLE IN
PRESS
ARTICLE IN
PRESS
ARTICLE IN
PRESS
ARTICLE IN
PRESS
DISCUSSION
PMF and SS are widely used as CBE due to their excellent mouth-feel effects arising from their respective melting point of 31.3°C and 38.0°C. PMF displayed a steep melting profile, which displays a narrow melting interval around 35.0°C that make them useful to produce confectionary fats, being the source of palmitic acid-rich disaturated TAG in the formulation of CBE (Salas et al., 2009).
GIP is a 42-amino-acid hormone secreted from K cells of the upper small intestine while GLP-1 is a 31-amino-acid hormone produced from L cells of the lower intestine and colon (Karhunen et al., 2008). Both of these hormones are incretin hormones that stimulate insulin secretion from pancreatic β cells. GIP and GLP-1 exert their effects by binding to their specific receptors, GIP receptor and GLP-1 receptor which belong to the G-protein coupled receptor family. Through the receptor binding activation, it activates and increases the level of intracellular cyclic adenosine-3,5-monophosphate in pancreatic β cells and hence stimulates insulin secretion glucose-dependently (Yabe and Seino, 2011).
In this study, palmitic acid at sn-1 and sn-3 positions of PMF exerted similar postprandial GIP and GLP-1 profile as compared to HOSF (oleic acid at the sn-1 and sn-3 positions). Our results suggest that relative absorption of palmitic acid in PMF was similar to that of oleic acid in HOSF. In other words, different types of fatty acid that are situated at the sn-1 and sn-3 positions have similar effects in terms of metabolic absorption. Our study is in line with Filippou et al. (2014) that showed that TAG containing a high amount of oleic acid (palm olein and HOSF) situated at the sn-2 position had raised GIP secretion in a group of healthy individuals.
Entry of dietary fat into the small intestine induces the release of gut hormones and thus, evokes satiety in the gastrointestinal tract (Karhunen et al., 2008; Suzuki et al., 2010). The marked difference of GIP release between HOSF- (OOO) and PMF- (POP) with SS-meal (SOS) could be due to different degree of saturation of fatty acids (Diakogiannaki et al., 2012; Thomsen et al., 1999). The relative difference in the release of GIP between the three test meals could be due to difference in fat absorption of postprandial TAG response
TABLE 5. POSTPRANDIAL PEPTIDE YY CONCENTRATIONS IN THE THREE EXPERIMENTAL GROUPS
Time(min)
PYY (pg ml–1)
PMF SS HOSF
Fasting 72.39 (62.06, 82.71) 73.37 (66.50, 84.01) 76.63 (62.72, 86.75)30 124.83 (108.78, 140.88) 120.77 (108.17, 137.94) 127.05 (103.60, 145.93)60 134.85 (117.83, 151.88) 122.57 (109.76, 137.90) 128.58 (107.24, 147.39)90 136.44 (120.18, 152.70) 125.99 (115.44, 140.00) 133.31(111.98, 151.18)120 139.86 (122.53, 157.19) 130.30 (119.41, 143.84) 137.49 (116.77, 155.57)150 140.11 (123.12, 157.12) 131.81 (118.23, 148.42) 135.67 (115.21, 153.10)180 138.20 (121.23, 155.18) 133.96 (119.59, 149.06) 135.46 (118.87, 151.33)
Note: PYY - peptide YY; PMF - palm mid fraction; SS - shea stearin; HOSF - high-oleic sunflower oil. Values are geometric means; 95% confidence interval (CI) in parentheses. n=36 for all test diets. Data were log-transformed, performed by repeated-measures ANOVA and showed a diet × time interaction (P=0.472).
TABLE 6. POSTPRANDIAL GHRELIN CONCENTRATIONS IN THE THREE EXPERIMENTAL GROUPS
Time(min)
Ghrelin (ng ml–1)
PMF SS HOSF
Fasting 1185.10 (940.71, 1399.47) 1158.76 (920.98, 1396.54) 1170.09 (943.74, 1426.45)30 1117.15 (847.88, 1297.60) 1095.31 (854.51, 1336.11) 1072.74 (887.06, 1347.24)60 918.07 (606.02, 1049.63) 934.10 (705.37, 1162.83) 827.82 (678.18, 1157.96)90 927.25 (640.75, 1068.48) 924.21 (688.45, 1159.97) 854.62 (696.46, 1158.03)
120 871.49 (588.39, 1038.16) 777.07 (565.22, 988.92) 813.28 (633.00, 1109.98)150 879.15 (535.05, 975.10) 894.24 (666.23, 1122.24) 755.0 (637.62, 1120.68)180 860.09 (577.94, 1043.13) 899.45 (664.98, 1133.92) 810.54 (605.58, 1114.59)
Note: PMF - palm mid fraction; SS - shea stearin; HOSF - high-oleic sunflower oil. Values are geometric means; 95% confidence interval (CI) in parentheses. n=36 for all test diets. Data were log-transformed, performed by repeated-measures ANOVA and showed a diet × time interaction (P=0.477).

719
DOES PALM MID FRACTION AFFECT ADULT SATIETY?
ARTICLE IN
PRESS
ARTICLE IN
PRESS(Filippou et al., 2014) as SS-meal showed a lower postprandial level of lipaemia (Sanders and Berry, 2005).
It is probable that differences in the physical characteristics of fats and changes in TAG structure may influence its metabolism (Berry, 2009) by pancreatic lipase into free fatty acids and 2-monoglyceride (Maljaars et al., 2009). The liberation of free fatty acids and 2-monoglycerides are a key event preceding secretion of GIP as they act as ligands for G-protein coupled receptors and these receptors might be modulators of incretin hormone release (Diakogiannaki et al., 2012). Hydrolysis is necessary to induce the effects of fat on gastrointestinal function, hormone release and satiety (Feinle-Bisset et al., 2005) and these could explain the difference in GIP release between PMF- SS- and HOSF-rich test diets in this current study.
A study by Thomsen et al. (1999) found that GIP and GLP-1 responses were higher after an olive oil meal than after a butter meal in healthy subjects. Their findings suggested that monounsaturated-rich fat stimulated the postprandial GIP and this was also observed in the current study where the HOSF- and PMF-rich test fats exerted comparable postprandial GIP levels which were significantly higher (P<0.05) than corresponding levels obtained in the SS-rich test fat. This marked difference in GIP levels could be due to the relation between fatty acid composition and TAG metabolism in the postprandial state (Thomsen et al., 1999). As in the current study, there was no significant difference (P>0.05) of postprandial GLP-1 responses between three test meals. Furthermore, we also found out that plasma level of GIP secretion by fat was still elevated after 3 hr postprandial challenge in the current study. The concentration of GIP peaks at 30-
60 min postprandially (Vilsboll et al., 2003; Vollmer et al., 2008) and it could stay elevated until the fifth hour (Carr et al., 2008).
Blood PYY concentrations were found to rise after approximately 15 min, peaked at 1-2 hr and remained elevated for few hours thereafter (Moran and Dailey, 2009). Meanwhile, circulating ghrelin levels typically rise just before and decrease shortly and rapidly after food intake (Karhunen et al., 2008; Marzullo et al., 2006). Both observations of PYY and ghrelin levels were illustrated in current study (Tables 5 and 6). The present study shows no significant differences (P>0.05) in postprandial plasma ghrelin and PYY levels after ingestion of the three high-fat meals.
Effects of dietary fats on ghrelin release were inconsistent and contradictory as ghrelin concentrations have been shown to increase (Otto et al., 2006) or decrease (Monteleone et al., 2003) after an ingestion of high-fat meal. Meanwhile, a study conducted by Erdmann et al. (2003) revealed that a significant reduction in plasma ghrelin levels initially at 30 min postprandially in 10 healthy subjects, reaching its lowest at 180 min after the subjects were given a fatty meal (85% SFA, 6% carbohydrate, 9% protein).
Other than GIP levels, the current study found no significant differences (P>0.05) in the plasma levels of the other gut hormones measured. These findings agree with that of Poppitt et al. (2006) who reported that high (70:30) or low (55:45) SFA: unsaturated fatty acid ratios did not affect plasma ghrelin levels in healthy subjects. However, the latter study was not designed to investigate the difference between PMF-, SS- and HOSF-rich type of fats. The lack of significant difference between the three test meals in the current study may due to an increase in the suppression of ghrelin as a result of an increase
Figure 1. Postprandial concentrations of visual analogue scale (VAS ) (n=36) following three test meals containing 53 g test fat from high-oleic sunflower oil (HOSF) ( ), shea stearin (SS) ( ) and palm mid fraction (PMF) ( ). Deviations from postprandial values were performed by repeated measures ANOVA; meal × time interaction P=0.11, followed by a Bonferroni multiple-comparison test. VAS, visual analogue scores.
JournalofOilPalmResearchDOI:https://doi.org/10.21894/jopr.2021.0000
1
1
2
0
10
20
30
40
50
60
70
0 30 60 90 120 150 180 210 240
VAS
scal
e (m
m)
Time (min)

720
JOURNAL OF OIL PALM RESEARCH 33 (4) DECEMBER 2021
ARTICLE IN
PRESS
ARTICLE IN
PRESS
ARTICLE IN
PRESS
ARTICLE IN
PRESS
in caloric intake (~883 kcal) of a postprandial meal (Little et al., 2007).
Moreover, ghrelin concentrations decrease after the consumption of PMF-, SS- and HOSF-rich test diets and the reduced ghrelin concentrations may be due to an increased fat-induced inhibition of ghrelin (Little et al., 2007). The reduction in plasma ghrelin may indicate a response to the higher calorie intake that associated with high-fat diet consumption and thus, reducing the signal for additional intake of food (Hameed et al., 2009; Monteleone et al., 2003). It was further hypothesised that the effect of fat on ghrelin reduction was controlled by factors such as postprandial TAG levels, fat absorption and gastric emptying (Helou et al., 2008).
There were no significant differences (P>0.05) detected in plasma PYY levels in the current study which is in agreement with the findings of Maljaars et al. (2009) as PYY levels were not affected or modified by the consumed test meals of different degree of fat saturation. However, specific types of fat have been hypothesised to exert different effect on plasma PYY levels (Serrano et al., 1997). In another study, fasting PYY was significantly more elevated in olive oil group relative to sunflower oil group and remained so at all time points of blood sampling (30, 60, 120, 180 min) (Serrano et al., 1997).
A trend of higher PYY levels was observed in the PMF-rich meal study arm as compared to SS- and HOSF-rich meal at all times where it peaked at 30 min time point followed by a plateau phase for several hours (Adrian et al., 1985) as observed in the current study. The peak level of plasma PYY is released postprandially and influenced by the number of calories consumed and the composition of the food (Adrian et al., 1985) with fat being the most potent macronutrient followed by carbohydrates and proteins (Onaga et al., 2002). Human studies conducted by Batterham et al. (2003) and Batterham and Bloom (2003) had shown that higher PYY levels increase satiety and decrease food intake and these findings underscore the suggestion that dietary fat is the most effective stimulator of PYY release.
This delayed response to SOS- and OOO- as compared to POP-rich test meal may reflect the release of PYY from the L cells in the ileal and colonic mucosa after a direct stimulation of fat (Adrian et al., 1985). Moreover, the magnitude of the PYY response after the ingestion of different standardised meals depends on their size (Adrian et al., 1985). This could explain the non-significant differences in plasma PYY levels after subjects were given three different types of postprandial test meals in the current study. The size, the physical properties, the administration rate of the meal, and the digestive and absorptive processes along the tube may have resulted in a delayed entry of nutrients to the distal segments of intestine and to a
small amount of stimuli in contact with the mucosa at these points (Adrian et al., 1985).
The lack of a significant difference in PYY or ghrelin postprandial levels after the consumption of the three test meals help to explain the similar satiety levels of VAS ratings that were found in the present study. PYY that was released postprandially will reduce appetite and inhibit food intake when administered to humans (De Silva et al., 2011). Meanwhile, ghrelin secretion was shown to enhance appetite and food intake (Wren et al., 2001). The effects of dietary fats on satiety and food intake were reported to rely on whether the dietary fatty acids are oxidised or stored (Flint et al., 2003; Stubbs et al., 1995). Friedman (1997) reported that the higher rate of oxidation of a fatty acid resulted in a greater suppression of hunger, and hence, a greater storage of fatty acids. On top of that, oleic acid was shown to be more rapidly absorbed and oxidised compared to the long-chain SFA (DeLany et al., 2000). However, no significant differences (P>0.05) were detected in the VAS scores across the three test meals in the present study. The mean satiety VAS scores were found increased over time. SS showed a higher mean value of sensations of hunger over a period of 4 hr challenge as compared to PMF and HOSF.
The current findings are in agreement with the studies of Strik et al. (2010) and Casas-Agustench et al. (2009) that found no significant differences in satiety measures using VAS between polyunsaturated fatty acids (PUFA), monounsaturated fatty acids (MUFA) and SFA rich test meals in healthy subjects. However, a study carried out by Lawton et al. (2000) reported that 20 healthy men and women fed with 80 g of PUFA type of fat was found more effective in decreasing appetite and increasing satiety when compared to a SFA-rich meal. In contrast to our findings, Maljaars et al. (2009) found that both oleic acid rich- canola and safflower oil reduced hunger and increased fullness as compared to shea oil, however, the subjects received the experimental fat through infusion in the ileum, and not through a postprandial test meal. It is important to emphasise that these earlier studies mentioned (Casas-Agustench et al., 2009; Lawton et al., 2000; Maljaars et al., 2009; Strik et al., 2010) were not designed to study the effects of PMF-, SS- and HOSF-rich type of fats with regards to the predominance of either palmitic acid or stearic acid at the sn-1 and sn-3 positions of the TAG backbone on satiety that measured by VAS scores.
CONCLUSION
In conclusion, both CBE fats (PMF and SS) performed differently in terms of satiety hormone secretion, hunger curbing and their potential in

721
DOES PALM MID FRACTION AFFECT ADULT SATIETY?
ARTICLE IN
PRESS
ARTICLE IN
PRESS
weight management. PMF (POP-) and HOSF (OOO- rich) with palmitic- or oleic acid predominantly situated at the sn-1 and sn-3 positions raise postprandial GIP concentrations that indicating a tendency to stimulate a greater postprandial satiety compared to SS (SOS-type of fat).
ACKNOWLEDGEMENT
We thank all the participants in the study, the medical team which played a key role in blood sample collection and Wilmar PGEO Edible Oils Sdn. Bhd. and Intercontinental Specialty Fats Sdn. Bhd. for providing the test fats used. We also thank the Director-General of MPOB for permission to publish the data.
REFERENCES
Adrian, T E; Ferri, G L; Bacarese-Hamilton, A J; Fuessl, H S; Polak, J M and Bloom, S R (1985). Human distribution and release of a putative new gut hormone, peptide YY. Gastroenterology, 89: 1070-1077.
AOCS (1997). Individual triglycerides in oils and fats by HPLC. Sampling and Analysis of Commercial Fats and Oils. AOCS Official Method Ce 5c-93.
AOCS (2017). Slip melting point. ISO standard. Sampling and Analysis of Commercial Fats and Oils. AOCS Official Method Cc 3b-92.
Batterham, R L and Bloom, S R (2003). The gut hormone peptide YY regulates appetite. Ann. N. Y. Acad. Sci., 994: 162-168.
Batterham, R L; Ellis, S M; Withers, D J and Ghatei, M A (2003). Inhibition of food intake in obese subjects by peptide YY 3-36. N. Engl. J. Med., 349: 941-948.
Berry, S E E (2009). Triacylglycerol structure and interesterification of palmitic and stearic acid-rich fats: An overview and implications for cardiovascular disease. Nutr. Res. Rev., 22: 3-17.
Bosscher, D and Viberg, A (2009). The role of functional lipids in appetite regulation and weight management. Anti-Aging Med., 6: 102-108.
Carr, R D; Larsen, M O; Winzell, M S; Jelic, K; Lindgren, O; Deacon, C F and Ahren, B (2008). Incretin and islet hormonal responses to fat and protein ingestion in healthy men. Am. J. Physiol. Endocrinol. Metab., 295: E779-784.
Casas-Agustench, P; Lopez-Uriarte, P; Bullo, M; Ros, E; Gomez-Flores, A and Salas-Salvado, J (2009). Acute effects of three high-fat meals with different fat saturations on energy expenditure, substrate oxidation and satiety. Clin. Nutr., 28: 39-45.
De Silva, A; Salem, V; Long, C J; Makwana, A; Newbould, R D; Rabiner, E A; Ghatei, M A; Bloom, S R; Matthews, P M; Beaver, J D and Dhillo, W S (2011). The gut hormones PYY 3-36 and GLP-1 7-36 amide reduce food intake and modulate brain activity in appetite centers in humans. Cell Metab., 14: 700-706.
DeLany, J P; Windhauser, M M; Champagne, C M and Bray, G A (2000). Differential oxidation of individual dietary fatty acids in humans. Am. J. Clin. Nutr., 72: 905-911.
Diakogiannaki, E; Gribble, F M and Reimann, F (2012). Nutrient detection by incretin hormone secreting cells. Physiol. Behav., 106: 387-393.
Dian, N L H M; Hamid, R A; Kanagaratnam, S; Isa, W R A; Hassim, N A M; Ismail, N H; Zaliha, O and Sahri, M M (2017). Palm oil and palm kernel oil: Versatile ingredients for food applications. J. Oil Palm Res., 29: 487-511.
Edem, D O (2002). Palm oil: Biochemical, physiological, nutritional, hematological, and toxicological aspects: A review. Plant Foods Hum. Nutr., 57: 319-341.
Erdmann, J; Lippl, F and Schusdziarra, V (2003). Differential effect of protein and fat on plasma ghrelin levels in man. Regul. Pept., 116: 101-107.
European Commission (2000). Directive 2000/36/EC of the European Parliament and of the Council. Off. J. Eur. Communities, L197: 19.
Feinle-Bisset, C; Patterson, M; Ghatei, M A; Bloom, S R and Horowitz, M (2005). Fat digestion is required for suppression of ghrelin and stimulation of peptide YY and pancreatic polypeptide secretion by intraduodenal lipid. Am. J. Physiol. Endocrinol. Metab., 289: E948-953.
Filippou, A; Berry, S E; Baumgartner, S; Mensink, R P and Sanders, T A B (2014). Palmitic acid in the sn-2 position decreases glucose-dependent insulinotropic polypeptide secretion in healthy adults. Eur. J. Clin. Nutr., 68: 549.
Finkelstein, E A; Khavjou, O A; Thompson, H; Trogdon, J G; Pan, L; Sherry, B and Dietz, W (2012). Obesity and severe obesity forecasts through 2030. Am. J. Prev. Med., 42: 563-570.

722
JOURNAL OF OIL PALM RESEARCH 33 (4) DECEMBER 2021
ARTICLE IN
PRESS
ARTICLE IN
PRESS
ARTICLE IN
PRESS
ARTICLE IN
PRESS
Flint, A; Helt, B; Raben, A; Toubro, S and Astrup, A (2003). Effects of different dietary fat types on postprandial appetite and energy expenditure. Obes. Res., 11: 1449-1455.
Friedman, M I (1997). An energy sensor for control of energy intake. Proc. Nutr. Soc., 56: 41-50.
Hameed, S; Dhillo, W S and Bloom, S R (2009). Gut hormones and appetite control. Oral Dis., 15: 18-26.
Helou, N; Obeid, O; Azar, S T and Hwalla, N (2008). Variation of postprandial PYY3–36 response following ingestion of differing macronutrient meals in obese females. Ann. Nutr. Metab., 52: 188-195.
Hosoda, H; Doi, K; Nagaya, N; Okumura, H; Nakagawa, E; Enomoto, M; Ono, F and Kangawa, K (2004). Optimum collection and storage conditions for ghrelin measurements: Octanoyl modification of ghrelin is rapidly hydrolyzed to desacyl ghrelin in blood samples. Clin. Chem., 50: 1077-1080.
Karhunen, L J; Juvonen, K R; Huotari, A; Purhonen, A K and Herzig, K H (2008). Effect of protein, fat, carbohydrate and fibre on gastrointestinal peptide release in humans. Regul. Pept., 149: 70-78.
Lawton, C L; Delargy, H J; Brockman, J; Smith, F C and Blundell, J E (2000). The degree of saturation of fatty acids influences post-ingestive satiety. Br. J. Nutr., 83: 473-482.
Lean, M E and Malkova, D (2016). Altered gut and adipose tissue hormones in overweight and obese individuals: Cause or consequence? Int. J. Obes (Lond), 40: 622-632.
Little, T J; Horowitz, M and Feinle-Bisset, C (2007). Modulation by high-fat diets of gastrointestinal function and hormones associated with the regulation of energy intake: Implications for the pathophysiology of obesity. Am. J. Clin. Nutr., 86: 531-541.
Maljaars, J; Romeyn, E A; Haddeman, E; Peters, H P and Masclee, A A (2009). Effect of fat saturation on satiety, hormone release and food intake. Am. J. Clin. Nutr., 89: 1019-1024.
Marzullo, P; Caumo, A; Savia, G; Verti, B; Walker, G E; Maestrini, S; Tagliaferri, A; Di Blasio, A M and Liuzzi, A (2006). Predictors of postabsorptive ghrelin secretion after intake of different macronutrients. J. Clin. Endocrinol. Metab., 91: 4124-4130.
Mittelman, S D; Klier, K; Braun, S; Azen, C; Geffner, M E and Buchanan, T A (2010). Obese adolescents show impaired meal responses of the appetite-
regulating hormones ghrelin and PYY. Obesity, 18: 918-925.
Monteleone, P; Bencivenga, R; Longobardi, N; Serritella, C and Maj, M (2003). Differential responses of circulating ghrelin to high-fat or high-carbohydrate meal in healthy women. J. Clin. Endocrinol. Metab., 88: 5510-5514.
Moran, T H and Dailey, M J (2009). Minireview: Gut peptides: Targets for antiobesity drug development? Endocrinol., 150: 2526-2530.
Onaga, T; Zabielski, R and Kato, S (2002). Multiple regulation of peptide YY secretion in the digestive tract. Peptides, 23: 279-290.
Ong, A S and Goh, S H (2002). Palm oil: A healthful and cost-effective dietary component. Food Nutr. Bull., 23: 11-22.
Otto, B; Heldwein, W; Otto, C; Huptas, S and Parhofer, K G (2006). Effect of a high-fat meal on the postprandial ghrelin response. Am. J. Clin. Nutr., 84: 664-665.
Parker, B A; Sturm, K; MacIntosh, C G; Feinle, C; Horowitz, M and Chapman, I M (2004). Relation between food intake and visual analogue scale ratings of appetite and other sensations in healthy older and young subjects. Eur. J. Clin. Nutr., 58: 212-218.
Poppitt, S D; Leahy, F E; Keogh, G F; Wang, Y; Mulvey, T B; Stojkovic, M; Chan, Y K; Choong, Y S; Mcardle, B H and Cooper, G J (2006). Effect of high-fat meals and fatty acid saturation on postprandial levels of the hormones ghrelin and leptin in healthy men. Eur. J. Clin. Nutr., 60: 77-84.
Poppitt, S D; Strik, C M; Macgibbon, A K; Mcardle, B H; Budgett, S C and Mcgill, A T (2010). Fatty acid chain length, postprandial satiety and food intake in lean men. Physiol. Behav., 101: 161-167.
Salas, J J; Bootello, M A; Martinez-Force, E and Garces, R (2009). Tropical vegetable fats and butters: Properties and new alternatives. OCL - Oilseeds and Fats, Crops Lipids, 16: 254-258.
Sanders, T A and Berry, S E (2005). Influence of stearic acid on postprandial lipemia and hemostatic function. Lipids, 40: 1221-1227.
Serrano, P; Yago, M; Mañas, M; Calpena, R; Mataix, J and Martínez-Victoria, E (1997). Influence of type of dietary fat (olive and sunflower oil) upon gastric acid secretion and release of gastrin, somatostatin, and peptide YY in man. Dig. Dis. Sci., 42: 626-633.

723
DOES PALM MID FRACTION AFFECT ADULT SATIETY?
ARTICLE IN
PRESS
ARTICLE IN
PRESS
Strik, C M; Lithander, F E; Mcgill, A T; Macgibbon, A K; Mcardle, B H and Poppitt, S D (2010). No evidence of differential effects of SFA, MUFA or PUFA on post-ingestive satiety and energy intake: A randomised trial of fatty acid saturation. Nutr. J., 9: 24.
Stubbs, R J; Harbron, C G; Murgatroyd, P R and Prentice, A M (1995). Covert manipulation of dietary fat and energy density: Effect on substrate flux and food intake in men eating ad-libitum. Am. J. Clin. Nutr., 62: 316-329.
Sun, L; Goh, H J; Govindharajulu, P; Khee-Shing Leow, M and Henry, C J (2019). Differential effects of monounsaturated and polyunsaturated fats on satiety and gut hormone responses in healthy subjects. Foods, 8: 634.
Suzuki, K; Simpson, K A; Minnion, J S; Shillito, J C and Bloom, S R (2010). The role of gut hormones and the hypothalamus in appetite regulation. Endocr. J., 57: 359-372.
Thomsen, C; Rasmussen, O; Lousen, T; Holst, J J; Fenselau, S; Schrezenmeir, J and Hermansen, K (1999). Differential effects of saturated and monounsaturated fatty acids on postprandial lipemia and incretin responses in healthy subjects. Am. J. Clin. Nutr., 69: 1135-1143.
Ueno, H; Yamaguchi, H; Mizuta, M and Nakazato, M (2008). The role of PYY in feeding regulation. Regul. Pept., 145: 12-16.
Verdich, C; Flint, A; Gutzwiller, J P; Naslund, E; Beglinger, C; Hellstrom, P M; Long, S J; Morgan, L M; Holst, J J and Astrup, A (2001). A meta-analysis
of the effect of glucagon-like peptide-1 (7-36) amide on ad-libitum energy intake in humans. J. Clin. Endocrinol. Metab., 86: 4382-4389.
Vilsboll, T; Krarup, T; Sonne, J; Madsbad, S; Volund, A; Juul, A G and Holst, J J (2003). Incretin secretion in relation to meal size and body weight in healthy subjects and people with type 1 and type 2 diabetes mellitus. J. Clin. Endocrinol. Metab., 88: 2706-2713.
Vollmer, K; Holst, J J; Baller, B; Ellrichmann, M; Nauck, M A; Schmidt, W E and Meier, J J (2008). Predictors of incretin concentrations in subjects with normal, impaired and diabetic glucose tolerance. Diabetes, 57: 678-687.
Voon, P T; Ng, T K; Lee, V K and Nesaretnam, K (2011). Diets high in palmitic acid (16:0), lauric and myristic acids (12:0 + 14:0), or oleic acid (18:1) do not alter postprandial or fasting plasma homocysteine and inflammatory markers in healthy Malaysian adults. Am. J. Clin. Nutr., 94: 1451-1457.
Wren, A M; Seal, L J; Cohen, M A; Brynes, A E; Frost, G S; Murphy, K G; Dhillo, W S; Ghatei, M A and Bloom, S R (2001). Ghrelin enhances appetite and increases food intake in humans. J. Clin. Endocrinol. Metab., 86: 5992.
Yabe, D and Seino, Y (2011). Two incretin hormones GLP-1 and GIP: Comparison of their actions in insulin secretion and beta cell preservation. Prog. Biophys. Mol. Biol., 107: 248-256.
Zaliha, O and Norizzah, A R (2012). Physico-chemical properties and compatibility study on palm oil products with cocoa butter. J. Oil Palm Res., 24: 1349-1352.

724
ARTICLE IN
PRESS
ARTICLE IN
PRESS
ARTICLE IN
PRESS
ARTICLE IN
PRESS
Journal of Oil Palm Research Vol. 33 (4) December 2021 p. 724-731DOI: https://doi.org/10.21894/jopr.2021.0024
STABILITY AND PERFORMANCE OF PALM-BASED TRANSPARENT SOAP WITH OIL PALM
LEAVES EXTRACT
NORASHIKIN AHMAD1*; ZAFARIZAL ALDRIN AZIZUL HASAN1 and SITI HAJAR BILAL1
ABSTRACTOil palm leaves (OPAL) is one of the oil palm waste components that can be extracted for natural phenolics. The OPAL extracts have been successfully extracted via four different extraction procedures; extraction with ethanol (OPAL M1), deoiled and followed by extraction with ethanol (OPAL M2), deoiled and extraction with ethanolic hydrochloric acid (OPAL M3) and aqueous extraction (OPAL M4). In this study, pH, moisture content, hardness, foaming power and stability, antioxidant activity and colour stability of transparent soaps with OPAL extracts were carried out. The results indicated that all transparent soaps with OPAL extracts had similar pH in the range of 9.88 to 9.98. However, there was a significant reduction of moisture content (14.6%-16.7%) compared to transparent soap control (18.3%) due to the evaporation of water during the melting and mixing. The hardness of transparent soaps with OPAL M3 and OPAL M4 was found to be softer than transparent soaps with OPAL M1 and OPAL M2. By adding OPAL extracts, the foaming ability and stability were not affected. Transparent soap formulated with OPAL M1 extract exhibited the highest percentage of antioxidant activity (3.7%). The use of OPAL extracts is recommended in transparent soap as it provides natural colourant.
Keywords: foaming, OPAL extracts, transparent soap.
Received: 17 November 2020; Accepted: 1 March 2021; Published online: 19 May 2021.
1 Malaysian Palm Oil Board, 6 Persiaran Institusi, Bandar Baru Bangi, 43000 Kajang, Selangor, Malaysia.
* Corresponding author e-mail: [email protected]
INTRODUCTION
Malaysia and Indonesia contribute 80% of world palm oil production and dominate international trade. Sustainability and environmental issues demand the oil palm industry to look for the latest technologies, beneficial nutritional aspects, and producing value-added products for niche and new markets (Parveez et al., 2020). Thus, oil palm leaves (OPAL) are a by-product of the oil palm industry, which can be exploited for the extraction of phenolics. Several studies reported that OPAL extract is rich in antioxidant activity (Ng and Choo, 2010), shows anti-microbial activities towards
gram-positive bacteria with good UVA and UVB protection for topical applications (Yusof et al., 2016).
Soap is the first skin cleansing agent, discovered by Babylonians as early as 2800 BC. They made soap from boiled animal fats with wood ashes. Then, around 1500 BC, Egyptians used vegetable or animal oil and alkaline salts to produce soap with a high pH value for bathing, washing, and treatment of skin diseases. Generally, soap can be produced from three different routes, i.e., saponification of oils, neutralisation of fatty acids and saponification of fatty methyl ester. Soap is the ultimate environmentally friendly surfactant because of its simple and cheap production, excellent biodegradability, low toxicity and has excellent surfactant properties (Wolfrum et al., 2016). Solid soaps are available in the form of opaque, translucent and transparent soap. However, transparent soap is

725
STABILITY AND PERFORMANCE OF PALM-BASED TRANSPARENT SOAP WITH OIL PALM LEAVES EXTRACT
ARTICLE IN
PRESS
ARTICLE IN
PRESS
preferred due to luxurious appearance and sold at the upper-middle market segment as beauty soap (Hasibuan et al., 2014). Besides, transparent soap contains a high amount of glycerin which functions as a humectant to counter the drying effects of soap towards the skin.
Soap is commonly used to reduce water surface tension and to lift dirt and oils off from our skin surface so that it can be easily rinsed away. In order to add value to the traditional soap, active ingredients from plant extract were introduced to promote healthy skin. Nowadays, cosmetic products with plant bioactive are receiving higher market demand (Emerald et al., 2016). The inclusion of plant extracts in topical formulations as a source of vitamins, antioxidants and antimicrobials have been shown to improve skin tone, texture and appearance of human skin (Ribeiro et al., 2015). It is well known that plant extracts are a valuable source of active compounds such as phenolics, which function as antioxidants. Many studies have been reported on the effectiveness of plant extracts, especially leaf extract in soap formulation. Pomegranate (Punica granatum) leaves extract was formulated in liquid and bar soaps and displayed antibacterial and antioxidant activities, whereas the solid soap only displayed antioxidant activity (Wijetunge and Perera, 2016). A combination of leaf and bark extracts of Cassia fistula, Ficus religiosa and Millettia pinnata in transparent soap were reported to have good antimicrobial effect (Afsar and Khanam, 2016). Anggraini et al. (2015) studied the characteristics and antioxidant activity of green tea leaf extract in transparent soap, and they found that 2% of green tea extract has higher antioxidant activity [15.21% 2,2-diphenyl-1-picrylhydrazyl (DPPH) scavenging activity] compared to transparent soap without green tea extract (0.83% DPPH scavenging activity). The antioxidant was used in soap formulation to prevent the oxidation of unsaturated fatty acids and enhance soap shelf life (Adigun et al., 2019). Another common antioxidant used in soap products is butyl hydroxy toluene (BHT). However, this synthetic antioxidant was not popular in topical applications because it may induce allergic reactions to the skin (Yamaki et al., 2007).
OPAL extract is also a potential new source of antioxidants for food and cosmetic applications. In 2011, Jaffri et al. analysed the composition of OPAL extract using high-performance liquid chromatography and found that the main phenolic compounds were epigallocatechin (0.08%), catechin (0.30%), epicatechin (0.01%), epigallocatechin gallate (0.28%) and epicatechin gallate (0.05%). In 2018, Ahmad et al. studied the effect of OPAL extract on the colour of transparent soap. The results showed that 0.1% OPAL extracts gave a better and acceptable colour compared to 0.5% OPAL extracts. However, the researchers did not investigate the stability and
performance of the transparent soap with OPAL extracts. It is important to ensure that the formulated soap with OPAL extracts has good stability and functionality. In this study, 0.1% of OPAL extracts prepared from four different extraction methods were used in transparent soap formulation. The purpose of this study was to investigate the effects of OPAL extracts on the quality of transparent soap such as pH, hardness, moisture content, foaming ability, anti-oxidant and colour stability compared to control and soap with synthetic antioxidant.
MATERIALS AND METHODS
Chemical and Apparatus
OPAL powder was obtained from Fyllo (M) Sdn. Bhd. Hexane was purchased from Fisher Scientific, USA. Ethanol with 99.9% purity, was obtained from ACI Labscan, Thailand. Sodium hydroxide (NaOH) with 99% purity was obtained from Merck, Germany. BHT with 99% purity was obtained from Sigma-Aldrich, Germany. Commercial green tea extract with known composition (water, propylene glycol, 25% of green tea extract, phenonip and EDTA) was purchased from Active Concepts, USA. DPPH radical was supplied from Sigma-Aldrich, USA. Fatty acids were purchased from Emery Oleochemicals (M) Sdn. Bhd. Glycerin was purchased from Croda, Singapore. Ethylenediaminetetraacetic acid disodium salt (EDTA) was purchased from Ajax Finechem Pty Ltd, Australia. Sodium laureth sulfate (SLES) was purchased from BASF, Germany and lactic acid was obtained from Purac Biochem, United Kingdom. Deionised water was used in this study. The spectrophotometric determination was performed on a UV-Visible Spectrophotometer, model UV-1800 from Shimadzu Corporation, Japan. Chroma Meter CR300, Konica Minolta, Inc. Japan was used to measure the colour luminosity of transparent soap. Texture analyser TA.XT plus from Micro Stable Systems, United Kingdom was used to measure the hardness of soap. While the pH of the soap solution was measured using pH meter by Mettler Toledo AG, Switzerland. Moisture analyser (XM50 from Precisa Gravimetrics AG, Switzerland) was used to measure the moisture content of transparent soap.
Preparation of Transparent Soap Base
The transparent soap base was prepared according to the method described by Ahmad et al. (2018). Briefly, 29% (w/v) NaOH solution was added into the melted fatty acids to form soap. Then, a premixed solution containing glycerin, EDTA, water, and SLES was added into the vessel. The mixture was heated and stirred to obtain a homogeneous

726
JOURNAL OF OIL PALM RESEARCH 33 (4) DECEMBER 2021
ARTICLE IN
PRESS
ARTICLE IN
PRESS
ARTICLE IN
PRESS
ARTICLE IN
PRESS
solution. Lactic acid was used to adjust the pH of the mixture to pH 9-10. Lastly, the mixture was poured into a mould and cooled down to room temperature (RT). The solid transparent soap base was wrapped with plastic to avoid sweating.
OPAL Extracts
In this study, four extraction methods of OPAL, as described by Ahmad et al. (2018), were adopted without any modification. OPAL M1 was prepared by extracting 20 g OPAL powder in 200 ml ethanol at 78oC for 2 hr. OPAL M2 was prepared by soaking 20 g OPAL in 200 ml hexane at RT overnight to remove fatty materials. Then, the phenolics were extracted in 200 ml ethanol at 78oC for 2 hr. The phenolic extraction method for OPAL M3 was similar to the OPAL M2, but 5 ml of 6 M HCl was introduced during the extraction of phenolic. Lastly, OPAL M4 was prepared by mixing 20 g OPAL powder with 200 ml deionised water at 100oC for 2 hr. All the crude OPAL extracts obtained were stored in the dark at RT.
Preparation of Transparent Soaps with OPAL Extract, BHT and Commercial Green Tea Extracts
Six transparent soaps were prepared namely base soap without active (control), blend of transparent soap base with 0.1 g of OPAL extracts (OPAL M1, OPAL M2, OPAL M3, and OPAL M4), soap base with 0.1 g of BHT and soap base with commercial green tea extract. About 100 g of transparent soap base was melted at temperature 60oC-70oC. Then, the active was added into the melted soap. The homogeneous mixture was poured into a mould and cooled to RT. The soap was wrapped with plastic after the soap had hardened and stored in a box at RT for analysis. Table 1 shows the soap samples prepared for this study.
TABLE 1. TRANSPARENT SOAP SAMPLES
Transparent soap Description
Control Soap base (without active)
S1 Soap base with 0.1 g of OPAL M1
S2 Soap base with 0.1 g of OPAL M2
S3 Soap base with 0.1 g of OPAL M3
S4 Soap base with 0.1 g of OPAL M4
S5 Soap base with 0.1 g of BHT
S6 Soap base with 0.1 g of commercial green tea extract
pH
The pH of soap solution was determined using a pH meter (Mettler Toledo AG, Switzerland). Buffer solutions pH 4 and 7 were used to calibrate
the pH meter. Electrode InLab® Routine Pro was washed with distilled water and dried. The soap solution was prepared by diluting 1.0 g of soap sample in 10 ml of distilled water. The pH meter electrode was dipped into the soap solution, and the pH was recorded after constant reading was achieved.
Hardness
The hardness of transparent soap without OPAL extracts, with OPAL extracts, BHT and commercial green tea extract were evaluated by penetration method using a texture analyser TA.XT plus (Micro Stable Systems, UK). A stainless-steel needle (P/2N) with a diameter of 2 mm was used for the measurement. The needle was dipped 7 mm into a soap sample with a moving rate of 2 mm s–1. The test was carried out at RT. This method was adapted from ASTM standard method D1321-95. The maximum force was defined as hardness. The data were expressed in Newton (N).
Moisture Content
The moisture content of transparent soap, with and without OPAL extracts and soap with BHT and commercial green tea extract was determined by using a moisture analyser (XM50 from Precisa Gravimetrics AG, Switzerland) with a halogen heater. Two g of soap sample was accurately weighed with a precision of 1.0 mg and placed in aluminium dishes in the moisture analyser. The temperature of heating was 105°C. The weight of the soap sample was measured once it has reached constant weight (g). The result is represented in % of moisture content and reported in average value.
Foaming Power and Stability
The foaming power and stability of soap solutions were assessed using a method developed by Benn et al. (2017) with slight modification. Foaming power is a measure of foam height taken immediately after 200 ml of the test solution was stroked for 30 times at a constant rate using a perforated base rod. The test solution was prepared by dissolving 0.5 g of product with 200 ml of water in a 500 ml measuring cylinder. The foam was let to rest for 5 min before the foam height was measured, which indicated foam stability. The analysis was performed in triplicate and data reported the average value. The foaming power and foam stability of the transparent soaps with OPAL extracts were tested in deionised water and 50 ppm water hardness (water with calcium carbonate, CaCO3).

727
STABILITY AND PERFORMANCE OF PALM-BASED TRANSPARENT SOAP WITH OIL PALM LEAVES EXTRACT
ARTICLE IN
PRESS
ARTICLE IN
PRESS
Antioxidant Activity
The method for antioxidant activity, as described by Enujiugha et al. (2012) was adopted with few modifications. An ethanolic solution of DPPH (18.18% v/v) was prepared and stored at 10oC in the dark. Soap samples were prepared in ethanol solution with a concentration of 2 mg ml–1. About 0.15 ml of the sample solution was then added to a 2.85 ml ethanolic DPPH solution. The mixture was shaken and left to stand at RT for 1 hr in the dark. The colour changes from deep violet to light yellow were measured spectrophotometrically at 515 nm. The absorbance of DPPH solution without soap sample (control), soap without OPAL extracts, soap with BHT and soap with commercial green tea extract were also measured. All measurements were performed in three replicates and the average was counted. The percentage of inhibition of the DPPH was calculated according to the formula as followed:
DPPH inhibition, % = [A(control) – A(sample)
A(control)] x 100
where A(control) is the absorbance of the control, and A(sample) is the absorbance of the sample.
Colour Stability
Colour stability of the soap was evaluated at day 7 and monthly for 3 months. The measurement was carried out using a Chroma Meter CR300 (Minolta, Japan). The Chroma Meter measures the sample surface of 8 mm in diameter at wavelengths (400-700 nm) of transmitted light, standard observer (0°), under illuminant D65 and white plate calibration. The soap was placed on a white tile and measurement was taken from the top of the soap. The readings of the soap samples were recorded in the CIELAB system in the form of L* and b* values. The system measures L* which refers to luminosity black (0) to white (100) and b* positive which refers to yellow colour. A total of ten readings were taken and a mean value was calculated. Yellowness Index (YI) which indicates the degree of yellowness was determined using Equation 1 (Rhim et al., 1999).
YI = 142.86 b*/L* (1)
where b* is the yellow colour scale, and L* is the luminosity scale.
Statistical Analysis
The data obtained from the above studies were analysed statistically using Microsoft Excel version 2013 for analysis of variance (ANOVA) single factor
and Student t-Test. The differences were considered significant if the probability, p<0.05.
RESULTS AND DISCUSSION
pH and Moisture Content of Transparent Soap
The pH and moisture content of transparent soap samples were determined after one week of storage at RT. The results obtained from analyses of pH and moisture content of transparent soaps are presented in Table 2. The pH of all transparent soaps analysed in this study fall within the range between 9.88 and 10.02. It was observed that the addition of 0.1% OPAL extracts, BHT and commercial green tea extract in the transparent soap have significantly reduced the pH of soap samples compared to control. In the preliminary screening of five different commercial transparent soaps which were sourced locally, the pH of the soaps was determined in the range of 9.19-9.60. Kulthanan et al. (2014) reported that the pH for bar soaps marketed in Thailand was in the range of 9.8 to 11.3. In addition, Dlova et al. (2017) reported that commercial bar soaps obtained in South Africa had pH values ranging from 9.36 to 10.75. Thus, the pH of the formulated transparent soaps in this study is in agreement with the commercial bar soaps. Several studies have shown that the use of alkaline soaps increases skin pH. Korting et al. in 1990 and 1996 reported the impact of long-term and short-term effects of alkaline (pH 8.5), acidic (pH 5.5), and neutral (pH 7.0) cleansers on skin pH. It was reported that skin pH increased significantly after washing with alkaline cleanser. However, a slight increase was also found after the usage of an acidic product as well as after washing the skin with a neutral cleanser. Another study carried out by Takagi et al. (2015) found that continuous application of soap at pH 10.3 for 6 hr did not adversely affect the skin pH. After 6 hr, the skin pH returns to normal acidic conditions. Thus, the alkaline pH of soap does not significantly affect healthy skin.
TABLE 2. MEAN pH AND MOISTURE CONTENT OF TRANSPARENT SOAPS
Transparent soap
Mean pH ± SDMean moisture
content (%) ± SDControl 10.02 ± 0.01a 18.36 ± 0.27 a
S1 9.88 ± 0.03b 14.64 ± 0.09b
S2 9.90 ± 0.02b 15.70 ± 0.10c
S3 9.93 ± 0.03b,c,d,e 15.72 ± 0.23c
S4 9.96 ± 0.01c 16.73 ± 0.12d
S5 9.98 ± 0.01d 16.68 ± 0.10d
S6 9.92 ± 0.01e 18.31 ± 0.35a
Note: Values with the same superscript letter are not statistically significant at the 5% level; SD – standard deviation.

728
JOURNAL OF OIL PALM RESEARCH 33 (4) DECEMBER 2021
ARTICLE IN
PRESS
ARTICLE IN
PRESS
ARTICLE IN
PRESS
ARTICLE IN
PRESS
Table 2 shows that the mean moisture content of transparent soap S1 – S5 reduced significantly compared to control and transparent soap S6. These variations may be due to the evaporation of water during melting of the soap base and mixing of active. It was observed that the transparent soap S1 had the lowest moisture content. According to Ahmad et al. (2018), the OPAL M1 was waxy, and thus incorporation of this active into transparent soap needs prolonged heating, which resulted in low moisture content. However, commercial green tea extract was easy to mix with the soap base. Thus, less evaporation of water was observed for transparent soap S6. The transparent soaps moisture content falls within the range reported by Kuntom et al. (1996), which was 8%-14%. It was reported that the appearance of active, either waxy or not, also affected the moisture content of transparent soap. The moisture content values of all transparent soap samples in this study are within the ranges obtained by Vivian et al. (2014) i.e. 10.91%-22.69% moisture for the commercial soap sold in Kenya, Osuji et al. (2013) i.e. 18.3%-22.5% moisture for soap with palm oil sludge, tallow and palm kernel oil as well as Kuntom and Kifli (1998) i.e. 10%-18% moisture for the soap blends with palm stearin and palm kernel fatty acids.
Physical Properties of Soap
The results from the analyses of hardness for palm-based transparent soap with 0.1% of OPAL extracts, 0.1% commercial green tea, BHT and control are depicted in Figure 1. A reduction in penetration force indicates that the soap is softer, as less force is used to penetrate a fixed distance. It was observed that the addition of OPAL extracts, BHT and commercial green tea extract into the transparent soap base significantly reduced the hardness of bar
soap compared to control at seven days of storage. In accordance with the present results, a previous study by Anggraini et al. (2015) has demonstrated that the addition of green tea extract in transparent soap reduced the soap hardness. A possible explanation for this result is that the addition of an active ingredient in the form of liquid may cause a reduction in soap hardness. In addition, the results of this study showed that the hardness of palm-based transparent soap remained stable during the six months storage and within the average hardness for commercial transparent soaps in Malaysia which is 3.80-6.96 ± 0.01 N.
Besides hardness, palm-based transparent soaps with 0.1% of OPAL extracts, 0.1% commercial green tea extract, BHT and control were also assessed for their foaming ability and foam stability in deionised water vs. 50 ppm water hardness (Figure 2). The water hardness will prevent the lathering of soap (Srinivasan et al., 2013). Thus, the study was carried out to determine whether hard water would adversely affect the lathering of palm-based transparent soap. The water hardness concentration of 50 ppm of CaCO3 was chosen in this study based on a survey carried out by Ong et al. (2007), which reported that the hardness of tap water in Klang Valley, Malaysia was in the range of 48-92 ppm of CaCO3. Based on this study, there was a statistically significant difference in foam performance of palm-based transparent soap in deionised and hard water, where the presence of 50 ppm CaCO3 decreased the foaming power and foam stability of palm-based transparent soap samples. Based on analysis of variant, there is no significant difference in foaming ability and foam stability for the palm-based transparent soap with OPAL extracts (S1 - S4) and control. Thus, indicating that the addition of OPAL extracts did not affect foaming power and foam stability.
Figure 1. The hardness of palm-based transparent soap with 0.1% of OPAL extracts, 0.1% commercial green tea, BHT and control. Lower hardness value indicates the softness of soap. Values with the same superscript letter are not statistically significant at the 5% confidence level.
Journal of Oil Palm Research DOI: https://doi.org/10.21894/jopr.2021.0000
11
significantly reduced the hardness of bar soap compared to control at 7 days of
storage. In accordance with the present results, a previous study by Anoggraini et al.
(2015) has demonstrated that the addition of green tea extract in transparent soap
reduced the soap hardness. A possible explanation for this result is that the addition
of an active ingredient in the form of liquid may cause a reduction in soap hardness.
In addition, the results of this study showed that the hardness of palm-based
transparent soap remained stable during the 6 months storage and within the average
hardness for commercial transparent soaps in Malaysia which is 3.80-6.96 ± 0.01 N.
Figure 1. The hardness of palm-based transparent soap with 0.1% of OPAL extracts, 0.1% commercial
green tea, BHT and control. Lower hardness value indicates the softness of soap. Values with the same
superscript letter are not statistically significant at the 5% confidence level.
Besides hardness, palm-based transparent soaps with 0.1% of OPAL extracts,
0.1% commercial green tea extract, BHT and control were also assessed for their
foaming ability and foam stability in deionised water versus 50 ppm water hardness
(Figure 2). The water hardness will prevent the lathering of soap (Srinivasan et al.,
2013). Thus, the study was carried out to determine whether hard water would
adversely affect the lathering of palm-based transparent soap. The water hardness
5.00
4.00
3.00
2.00
1.00
0.00
Har
dnes
s (N
)
Day 7 Month 1 Month 3 Month 6
Storage time
Control S1 S2 S3 S4 S5 S6

729
STABILITY AND PERFORMANCE OF PALM-BASED TRANSPARENT SOAP WITH OIL PALM LEAVES EXTRACT
ARTICLE IN
PRESS
ARTICLE IN
PRESSAntioxidant Activity
The addition of OPAL extracts in transparent soap was determined for their capacity to inhibit DPPH radicals and transparent soaps with BHT and green tea extract were selected as the benchmarks. BHT is a synthetic antioxidant, extensively used in many cosmetic and food products due to its chemical stability and inexpensive (Ghosh et al., 2020; Yamaki et al., 2007). While commercial green tea extract was chosen due to the known composition of the ingredient and commercially available extract. Based on these results, it was found that the addition of OPAL extracts into transparent soap significantly helped to increase the antioxidant activity (Table 3). In addition, S1 soap formulated with OPAL M1 extract exhibited the highest DPPH inhibition compared to other soaps with OPAL extracts and transparent soap with green tea extract. Irine et al. (2003) ascribed that OPAL extract has 8% higher content of phenolic compounds than green tea. Fadda et al. (2014) studied the reaction time and kinetic behaviour of plant extracts (green tea, pomegranate and lemon) with DPPH radical. They reported that the antioxidant activity was strongly influenced by DPPH concentration and reaction time. They also presented plant extracts that will perform either fast or slow kinetic behaviour. Thus, the antioxidant activity of transparent soap with green tea probably has slow kinetic behaviour, which may need more than 1 hr to react with DPPH radical. In addition, the commercial green tea extract contains 25% active material. Due to the low content of the active ingredient, it has caused low antioxidant activity. Since the purpose of this work is to investigate the antioxidant activity of transparent soap with OPAL
extracts, so we have not investigated a proper reaction time for transparent soap with green tea. However, the antioxidant activity of soap with OPAL extracts was still lower than soap formulated using synthetic antioxidant, BHT. Fatiha and Abdelkader (2019) reported that BHT would react rapidly with DPPH and gave the highest DPPH inhibition compared to other compounds, which may require longer reaction times and higher concentrations.
TABLE 3. ANTIOXIDANT ACTIVITY OF TRANSPARENT SOAPS
Transparent soap DPPH inhibition (%) ± SD
Control 0.182 ± 0.000a
S1 3.703 ± 0.105b
S2 2.004 ± 0.105c
S3 1.639 ± 0.000d
S4 1.822 ± 0.000e
S5 34.244 ± 0.182f
S6 0.182 ± 0.000a
Note: Values with the same superscript letter are not statistically significant at the 5% level; SD - standard deviation.
Colour Stability
The addition of OPAL extracts resulted in an increase in YI of palm-based transparent soap with 0.1% of OPAL extracts compared to transparent soaps with BHT, green tea extract and control (Figure 3). Besides OPAL extracts, green tea extract was also reported to enhance the colour of transparent soap at 0.5% concentration (Anggraini et al., 2015). Palm-based transparent soap S2 (soap with OPAL M2) gave the highest YI compared to
Figure 2. Foaming power and stability of palm-based transparent soap with 0.1% of OPAL extracts, 0.1% commercial green tea extract, BHT and control in deionised water vs. 50 ppm water hardness. * statistically significant at the 5% confidence level.
Foaming power in deionised water Foaming power in 50 ppm water hardness Foam stability in deionised water Foam stability in 50 ppm water hardness
Journal of Oil Palm Research DOI: https://doi.org/10.21894/jopr.2021.0000
12
concentration of 50 ppm of CaCO3 was chosen in this study based on a survey carried
out by Ong et al. (2007), which reported that the hardness of tap water in Klang Valley,
Malaysia was in the range of 48-92 ppm of CaCO3. Based on this study, there was a
statistically significant difference in foam performance of palm-based transparent soap
in deionised and hard water, where the presence of 50 ppm CaCO3 decreased the
foaming power and foam stability of palm-based transparent soap samples. Based on
analysis of variant, there is no significant difference in foaming ability and foam stability
for the palm-based transparent soap with OPAL extracts (S1 - S4) and control. Thus,
indicating that the addition of OPAL extracts did not affect foaming power and foam
stability.
Figure 2. Foaming power and stability of palm-based transparent soap with 0.1% of OPAL extracts,
0.1% commercial green tea extract, BHT and control in deionised water versus 50 ppm water hardness.
* statistically significant at the 5% confidence level.
Antioxidant Activity
The addition of OPAL extracts in transparent soap was determined for their
capacity to inhibit DPPH radicals and transparent soaps with BHT and green tea
extract were selected as the benchmarks. BHT is a synthetic antioxidant, extensively
used in many cosmetic and food products due to its chemical stability and inexpensive
(Yamaki et al., 2007; Ghosh et al., 2020). While commercial green tea extract was
chosen due to the known composition of the ingredient and commercially available
300
250
200
150
100
50
0
Foam
hei
ght (
mm
)
Control S1 S2 S3 S4 S5 S6Samples

730
JOURNAL OF OIL PALM RESEARCH 33 (4) DECEMBER 2021
ARTICLE IN
PRESS
ARTICLE IN
PRESS
ARTICLE IN
PRESS
ARTICLE IN
PRESSother transparent soaps. Furthermore, the yellow colour of palm-based transparent soap, S1 – S5 remains stable during storage from day 30 to day 90. Therefore, OPAL extract can be used as natural yellow colour and the presence of antioxidants in OPAL extract may help in terms of colour stability.
CONCLUSION
The addition of OPAL extract in transparent soap formulations did not affect foaming power and foam stability. However, transparent soap with OPAL M1 extract showed the highest antioxidant activity than transparent soap with other OPAL extracts and commercial green tea extract. In addition, all OPAL extracts showed stable hardness throughout the study and provided natural yellow colour to the transparent soaps within 90 days of storage.
ACKNOWLEDGEMENT
The authors are thankful to the Director-General of MPOB for giving the opportunity to publish this article. Special thanks to Mohd Nor Mamat @ Jusoh and Zulkiffli Razali for their assistance.
REFERENCES
Adigun, O; Manful, C; Prieto Vidal, N; Mumtaz, A; Pham, T H; Stewart, P; Nadeem, M; Keough, D and Thomas, R (2019). Use of natural antioxidants from Newfoundland wild berries to improve the shelf life of natural herbal soaps. Antioxidants, 8(11): 536 (1-19).
Ahmad, N; Azizul Hasan, Z A; Muhamad, H; Bilal, S H; Yusof, N Z and Idris, Z (2018). Determination of total phenol, flavonoid, antioxidant activity of oil palm leaves extracts and their application in transparent soap. J. Oil Palm Res., 30(2): 315-325.
Anggraini, T; Ismanto, S D and Dahlia (2015). The making of transparent soap from green tea extract. Int. J. Adv. Sci. Eng. Inf. Technol., 4: 349-356.
Afsar, Z and Khanam, S (2016). Formulation and evaluation of poly herbal soap and hand sanitizer. Int. Res. J. Pharm., 7(8): 54-57.
Benn, S; Jönsson, M and Willers, T (2017). Benchmarking the foaming properties of a new, mild surfactant formulation according to ASTM D 1173-07. KRÜSS Application Report 283.
Dlova, N C; Naicker, T and Naidoo, P (2017). Soaps and cleansers for atopic eczema, friends or foes? What every South African paediatrician should know about their pH. S. Afr. J. Child Health, 11(3): 146-148.
Emerald, M; Emerald, A; Emerald, L and Kumar, V (2016). Perspective of natural products in skincare. Pharm. Pharmacol. Int. J., 4(3): 339-341.
Enujiugha, V N; Talabi, J Y; Malomo, S A and Olagunju, A I (2012). DPPH radical scavenging capacity of phenolic extracts from African yam bean (Sphenostylis stenocarpa). Food Nutr. Sci., 3: 7-13.
Fadda, A; Serra, M; Molinu, M G; Azara, E; Barberis; A and Sanna, D (2014). Reaction time and DPPH concentration influence antioxidant activity and kinetic parameters of bioactive molecules and plant
Figure 3. Yellowness index of palm-based transparent soap with 0.1% of OPAL extracts, BHT and control.
Journal of Oil Palm Research DOI: https://doi.org/10.21894/jopr.2021.0000
14
Colour Stability The addition of OPAL extracts resulted in an increase in YI of palm-based
transparent soap with 0.1% of OPAL extracts compared to transparent soaps with
BHT, green tea extract and control (Figure 3). Besides OPAL extracts, green tea
extract was also reported to enhance the colour of transparent soap at 0.5%
concentration (Anggraini et al., 2015). Palm-based transparent soap S2 (soap with
OPAL M2) gave the highest YI compared to other transparent soaps. Furthermore, the
yellow colour of palm-based transparent soap, S1 – S5 remains stable during storage
from day 30 to day 90. Therefore, OPAL extract can be used as natural yellow colour
and the presence of antioxidants in OPAL extract may help in terms of colour stability.
Figure 3. Yellowness index of palm-based transparent soap with 0.1% of OPAL extracts, BHT and
control.
CONCLUSION
The addition of OPAL extract in transparent soap formulations did not affect foaming
power and foam stability. However, transparent soap with OPAL M1 extract showed
the highest antioxidant activity than transparent soap with other OPAL extracts and
commercial green tea extract. In addition, all OPAL extracts showed stable hardness
0.00
20.00
40.00
60.00
80.00
100.00
Day 7 Day 30 Day 60 Day 90
Yel
low
ness
inde
x (Y
I)
Storage duration (day)
Control
S1
S2
S3
S4
S5
S6
100
80
60
40
20
0
Yello
wne
ss in
dex
(YI)
Day 7 Day 30 Day 60 Day 90
Storage duration (day)
Control S1 S2 S3 S4 S5 S6

731
STABILITY AND PERFORMANCE OF PALM-BASED TRANSPARENT SOAP WITH OIL PALM LEAVES EXTRACT
ARTICLE IN
PRESS
ARTICLE IN
PRESS
extracts in the reaction with the DPPH radical. J. Food Compos. Anal., 35(2): 112-119.
Fatiha, M and Abdelkader, T (2019). Study of antioxidant activity of pyrimidinium betaines by DPPH radical scavenging method. J. Anal. Pharm. Res., 8(2): 33-36.
Ghosh, C; Singh, V; Grandy, J and Pawliszyn, J (2020). Development and validation of a headspace needle-trap method for rapid quantitative estimation of butylated hydroxytoluene from cosmetics by hand-portable GC-MS. RSC Adv., 10: 6671-6677.
Hasibuan, S; Sahirman and Ma’ruf, A (2014). The quality of transparent soap from farmer’s crude calophyllum seed oil. Int. J. Adv. Sci. Eng. Inf. Technol., 4(5): 47-51.
Irine, R; Nordin, M M; Radzali, M; Azizah, H; Hapizah, N; Mahinda, Y A and Suhaila, M (2003). Antioxidant and hypocholesterolemic effects of Elaeis guineensis frond extract on hypercholesterolemic rabbits. ASEAN Food J., 12: 137-147.
Jaffri, J M; Mohamed, S; Rohimi, N; Ahmad, I N and Noordin, M M (2011). Antihypertensive and cardiovascular effects of catechin-rich oil palm (Elaeis guineensis) leaf extract in nitric oxide-deficient rats. J. Med. Food, 14: 775-783.
Korting, H C and Braun-Falco, O (1996). The effect of detergents on skin pH and its consequences. Clin. Dermatol., 14: 23-27.
Korting, H C; Hübner, K; Greiner, K; Hamm, G and Braun-Falco, O (1990). Differences in the skin surface pH and bacterial microflora due to the long-term application of synthetic detergent preparations of pH 5.5 and pH 7.0. Results of a crossover trial in healthy volunteers. Acta Derm-Venereol., 70(5): 429-431.
Kulthanan, K; Maneeprasopchoke, P; Varothai, S and Nuchkull, P (2014). The pH of antiseptic cleansers. Asia Pac. Allergy, 4(1): 32-36.
Kuntom, A and Kifli, H (1998). Properties of soaps derived from distilled palm stearin and palm kernel fatty acids. J. Surfactants Deterg., 1(3): 329-334.
Kuntom, A; Kifli, H and Lim, P K (1996). Chemical and physical characteristics of soap made from distilled fatty acids of palm oil and palm kernel oil. J. Am. Oil Chem. Soc., 73(1): 105-107.
Ng, M H and Choo, Y M (2010). Determination of antioxidants in oil palm leaves (Elaeis guineensis). Am. J. Appl. Sci., 7(9): 1243-1247.
Ong, C; Ibrahim, S and Gupta, B S (2007). A survey of tap water quality in Kuala Lumpur. Urban Water J., 4(1): 1-13.
Osuji, C N; Akunna, T O and Ahaotu, E O (2013). Use of palm oil sludge in toilet soap production. Inter. J. Appl. Sci. Engr., 1(2): 73-78.
Parveez, G K A; Hishamuddin, E; Loh, S K; Ong-Abdullah, M; Salleh, K M; Zanal Bidin, M N I; Sundram, S; Hasan, Z A A and Idris, Z (2020). Oil palm economic performance in Malaysia and R&D progress in 2019. J. Oil Palm Res., 32(2): 159-190.
Rhim, J W; Wu, Y; Weller, C L and Schnepf, M (1999). Physical characteristics of a composite film of soy protein isolate and propylene glycol alginate. J. Food Sci., 64(1): 149-152.
Ribeiro, A S; Estanqueiro, M; Oliveira, M B and Lobo, J M S (2015). Main benefits and applicability of plant extracts in skincare products. Cosmetics, 2: 48-65.
Srinivasan, G; Srinivas, C R; Mathew, A C and Duraiswami, D (2013). Effects of hard water on hair. Int. J. Thricol., 5(3): 137-139.
Takagi, Y; Kaneda, K; Miyaki, M; Matsuo, K; Kawada, H and Hosokawa, H (2015). The long-term use of soap does not affect the pH-maintenance mechanism of human skin. Skin Res. Technol., 21(2): 144-148.
Vivian, O P; Nathan, O; Osano, A; Mesopirr, L and Omwoyo, W N (2014). Assessment of the physicochemical properties of selected commercial soaps manufactured and sold in Kenya. Open J. Appl. Sci., 4(8): 433-440.
Wijetunge, W M A N K and Perera, B G K (2016). Preparation of medicinal soap products using the leaf extracts of Punica granatum (pomegranate). Int. J. Pharm. Biol. Sci., 6(2): 7-16.
Wolfrum, S; Marcus, J; Touraud, D and Kunz, W (2016). A renaissance of soap? – How to make clear and stable solutions at neutral pH and room temperature. Adv. Colloid Interface Sci., 236: 28-42.
Yamaki, K; Taneda, S; Yanagisawa, R; Inoue, K; Takano, H and Yoshino, S (2007). Enhancement of allergic responses in vivo and in vitro by butylated hydroxytoluene. Toxicol. Appl. Pharmacol., 223(2): 164-172.
Yusof, N Z; Abd Gani, S S; Siddiqui, Y; Mohd Mokhtar, N F and Azizul Hasan, Z A (2016). Potential uses of oil palm (Elaeis guineensis) leaf extract in topical application. J. Oil Palm Res., 28(4): 520-530.

732
ARTICLE IN
PRESS
ARTICLE IN
PRESS
ARTICLE IN
PRESS
ARTICLE IN
PRESS
Journal of Oil Palm Research Vol. 33 (4) December 2021 p. 732-738DOI: https://doi.org/10.21894/jopr.2020.0104
IS THERE A SUSTAINABLE FUTURE FOR WILDLIFE IN OIL PALM PLANTATIONS IN
MALAYSIA?
JAYASILAN MOHD-AZLAN1* and LISA LOK1
ABSTRACTThe oil palm scene is often highly debated and has been at the centre of controversy in the past decade. Dubbed the ‘cash crop’, many Third World tropical countries have seized the opportunity to mobilise oil palm at landscape levels to fuel the economy. However, many of these tropical countries are also rich in biodiversity and are home to many endemics and species of conservation importance. While it tackles economic issues like poverty alleviation, it comes at the cost of environmental destruction. Here we take a look at the potential values of forest fragments and wildlife-friendly practices in oil palm landscapes and their roles in conservation in Malaysia. As the demand for oil palm and its products are most likely to continue to grow, there is a need to look at how the relevant stakeholders will sustainably manage the increasing demand while improving biodiversity management.
Keywords: biodiversity, conservation, oil palm, policy, wildlife.
Received: 1 April 2020; Accepted: 19 September 2020; Published online: 23 November 2020.
1 Institute of Biodiversity and Environmental Conservation, Universiti Malaysia Sarawak, 94300 Kota Samarahan, Sarawak, Malaysia.
* Corresponding author e-mail: [email protected]
INTRODUCTION
Malaysia is the second largest exporter of palm oil globally and the planted areas cover approximately 5.8 million hectares; approximately 17.57% of the total land area in Malaysia (FAO, 2011; MPOB, 2018). Agricultural landscapes are often lacking in biodiversity due to scarcity of resources (e.g., food and shelter) that would usually occur in natural environments (Chazdon et al., 2009). Therefore, not many native species, especially forest specialists, are able to thrive within the monoculture (Edwards et al., 2010; Maddox, 2007; Yap et al., 2010). As such, many recent publications comparing forest species and remnant species in monocultures only provide the extent of species and ecosystem function deficits due to this conversion.
The European Union’s introduction of a palm oil biofuel ban, while designed to protect the future of biodiversity and aimed to thwart deforestation of rainforests in the tropics, may instead have dire
implications. The ban’s effectiveness has also been questioned by the International Union for the Conservation of Nature (IUCN, 2018), as the move will only increase production of other land-inefficient oil crops to compensate for the loss of market share and maintain existing oil palm plantations, which acts as a displacement rather than a prevention of global biodiversity losses resulting from oil palm. Palm oil-producing countries will find alternative markets and even compensate profit loss by increasing sales to importers such as China, India, and other countries which are not as committed as the European Union to sustainable sourcing. This, in turn, may weaken the implementation of palm oil sustainability certification programmes.
On the 10 June 2019, the Delegated Act was passed by the European Union Parliament to ban and restrict palm oil biofuel imports by 2030 (Ching, 2019). The passing of the Delegated Act disregards the commitments of certification schemes such as the Roundtable for Sustainable Palm Oil (RSPO) and the Malaysian Sustainable Palm Oil (MSPO) and hampers efforts to ensure that the production of oil palm is as environmentally sustainable as possible. The key issue for biodiversity loss is deforestation, which has now been addressed
SHORT COMMUNICATION

733
IS THERE A SUSTAINABLE FUTURE FOR WILDLIFE IN OIL PALM PLANTATIONS IN MALAYSIA?
ARTICLE IN
PRESS
ARTICLE IN
PRESS
within the certification scheme of RSPO (zero-deforestation pledge), while MSPO prohibits planting on highly biodiverse lands. The RSPO certification programme also lists the protection of forest fragments within oil palm plantations as part of its principles and criteria (RSPO, 2018). However, the effectiveness of these forest remnants in terms of biodiversity conservation has been given little evaluation (Bernard et al., 2014; Edwards et al., 2010).
MSPO was first launched in 2015 by the Malaysian government as a national standard in its commitment to fulfilling sustainability requirements. MSPO is strongly aligned with the existing national legal and regulatory requirements which proved the general principles for the establishment, implementation and improvement of sustainable practices in Malaysia (McInnes, 2017). MSPO is mandatory requirement for all Malaysian oil palm industry by 31 December 2019 (Sivanandam, 2017) providing traceability up to the plantation level.
Checks and balances in the form of strict regulation, auditing and ambiguity need to be addressed. The Malaysian government has recently given the extent for RSPO to publish maps of palm oil concessions, promoting better accountability and transparency within the supply chain and help curb deforestation and forest fires (Reuters, 2019).
ASSOCIATED BIODIVERSITY PATTERNS INSIDE OIL PALM PLANTATIONS
There is a great ecological disparity between natural forests compared to the oil palm monoculture as plantations are typically simplistic in structure; lower canopy height, little to no undergrowth, typically uniform in oil palm age composition, more prone to climatic fluctuations and have greater human disturbances (Corley and Tinker, 2008; Turner and Foster, 2006). Various studies have proven the monoculture landscape to be a poor habitat for most species (Fayle et al., 2010; Maddox, 2007; Mandal and Raman, 2016; Srinivas and Koh, 2016; Tscharntke et al., 2005). However, depending on the plantation’s structural attributes (e.g. understory vegetation, epiphyte prevalence and presence of other crops), it may support local wildlife by providing additional resources such as food or shelter (Aratrakorn et al., 2006; Azhar et al., 2014; 2015a; Jambari et al., 2012; Nájera and Simonetti, 2010; Yahya et al., 2017). Proximity to forest patches have also been found to influence species richness within the oil palm landscape (Azhar et al., 2011; Edwards et al., 2010; Knowlton et al., 2019; Koh, 2008a; Lucey et al., 2014; Pardo et al., 2019).
The Potential Values of Forest Fragments in the Oil Palm Landscape
Forest fragments within the oil palm landscape are the last bastions of refuge for biodiversity within the oil palm landscape and should not be regarded as ‘low value’ for conservation (Mohd-Azlan et al., 2019a) (Figure 1). Studies on forest fragments within oil palm plantations have shown that fragments support subsets of species richness from contiguous forest and are to a certain extent comparable to some fragmented and isolated protected areas, e.g. Mohd-Azlan et al. (2019a, 2019b) recorded 42 species of birds, 15 species of bats and 10 species of small mammals in a high conservation value (HCV) forest patch (116 ha) in an oil palm plantation in Miri, Sarawak, Malaysia compared to 62 species of birds recorded by Arif and Mohd-Azlan (2014) in Gunung Gading National Park (4100 ha), 15 species of bats in Similajau National Park (8996 ha) (Kumaran et al., 2011), 17 species of small mammals in Lambir Hills National Park (6952 ha), 29 in Mulu National Park (52 864 ha) and 19 in Niah National Park (3140 ha) (Shazali et al., 2016). A study by Struebig et al. (2008) in the Krau landscape, Peninsular Malaysia found that forest fragments of >300 ha supported a considerable amount of bat diversity and that species assemblages in larger fragments resemble those in contiguous forests despite being surrounded by agriculture. Studies in Sabah, Malaysia by Benedick et al. (2006); Brühl et al. (2003); Edwards et al. (2010) and Lucey et al. (2014), also highlighted the importance of forest fragments in their ability to support substantial amount of forest species and should not be neglected. Arthropods (Denan et al., 2019), birds (Koh, 2008b; Maas et al., 2013), bats (Maas et al., 2013; Phommexay et al., 2011; Williams-Guillén et al., 2008) and mammals (Chua et al., 2016; Holzner et al., 2019) have demonstrated functional roles as biological control agents that may benefit plantation managements. Thus, protecting forest patches within and surrounding plantations can contribute to both biological conservation and plantation sustainability.
Restricted access to oil palm plantation from extrusion and excision may benefit some of the heavily hunted species. Forest fragments have also been shown to support or facilitate movement of megafauna species such as the Malayan Tiger, Asiatic Tapir and Malayan Sun Bear (Azhar et al., 2013; Bernard et al., 2014; Guharajan et al., 2018) which are also transient in nature to the oil palm matrix.
Studies on biodiversity reconcilement remain divided between land sharing (Fitzherbert et al., 2008; Koh, 2008a; Mohd-Azlan et al., 2019a; 2019b; Pardo et al., 2019; Tawatao et al., 2014) and land sparing (Bernard et al., 2014; Edwards et al., 2010;

734
JOURNAL OF OIL PALM RESEARCH 33 (4) DECEMBER 2021
ARTICLE IN
PRESS
ARTICLE IN
PRESS
ARTICLE IN
PRESS
ARTICLE IN
PRESS
Phalan et al., 2011; Wearn et al., 2017; Yue et al., 2015) approaches. However, these should not be mutually exclusive, and a combination may allow a balance to be achieved between the multifunctionality of monoculture landscape and management needs (Fischer et al., 2006; Grass et al., 2019; Matson and Vitousek, 2006). This, in turn may reduce production area which many small-scale plantations may not see this as a favourable option.
All types of forest fragments harbour some level of biological value (Figure 2), but the proportions depend on factors such as isolation, the encompassed vegetation matrix and patch size (Edwards et al., 2011), which in turn may influence the edge effect and species spill over. Existing oil palm plantations can never be restored to their original forested state once their rich biodiversity has already been
lost. Stakeholders need to constantly embrace new environmental challenges and advances and continue to provide resources to support and facilitate the rehabilitation and enhancements of forest fragments within their care. Mitigation initiatives during replanting, such as leaving some old oil palm patches embedded with reforestation programmes, could create wilderness areas over time. This, in turn, can create wildlife corridors between existing forest patches to enable wildlife migration that may encourage gene flow between populations (Falcy and Estades, 2007; Koh, 2008a). The oil palm industry must be ready to contribute some of these production areas to reforestation, especially those that are close to forest patches or that provide critical connectivity among forest patches.
Figure 1. In silhouette against the evening sky, a forest fragment in an oil palm matrix that should not be regarded as low value for conservation.
Figure 2. High conservation values forest (HCVF) (background) adjacent to the oil palm landscape may harbour some of the remnant species.

735
IS THERE A SUSTAINABLE FUTURE FOR WILDLIFE IN OIL PALM PLANTATIONS IN MALAYSIA?
ARTICLE IN
PRESS
ARTICLE IN
PRESS
There is also great potential in considering some HCV in oil palm plantation as Other Effective-based Conservation Measures (OECM) as part of the general conservation not only within the oil palm landscapes but externally as well. Potential OECM should be identified and reported by the relevant stakeholders as they can contribute to achieving the Aichi Biodiversity target (Target 11):
“By 2020, at least 17% of terrestrial and inland waters and 10% of coastal and marine areas, especially areas of particular importance for biodiversity and ecosystem services, are conserved through effectively and equitably managed, ecologically representative and well connected systems of protected areas and other effective area-based conservation measures, and integrated into the wider landscapes and seascapes” (Convention of Biological Diversity, 2018) and the national target (Target 6) (Ministry of Natural Resources and Environment, 2016), as their recognition can provide additional incentives for the stakeholders to provide and enact better protective measures for conservation.
These OECM are advantageous and recognised for promoting biodiversity conservation to the oil palm industry in a way as they can be potential corridors between protected areas wherever relevant, maintain and secure ecosystem services and support the recovery of threatened species (IUCN-WCPA Task Force on OECM, 2019).
CONCLUSION
By 2050, oil palm demand is expected to reach 120-156 million tonnes (RSPO, 2015). Malaysia direly needs to achieve a balance between economic growth and environmental sustainability. With non-exhaustive literature suggesting the negative impact of monoculture, government policies should ensure that no more forested land, including degraded secondary forest to be converted to supply the demand. Expansions can consider replacing of other non-economically viable agriculture. Future oil palm replantings need to be carefully and strategically designed to provide buffers around forests to facilitate connectivity (Scriven et al., 2019) as these areas are critical for biodiversity and ecosystem services. Additionally, to complement forested areas, the oil palm areas can be enhanced and made to be more hospitable to biodiversity by applying landscape management practices such as replacing chemical herbicides with integrating livestock (e.g. cattle) for undergrowth management (Tohiran et al., 2017; 2019), improve landscape heterogeneity and habitat complexity by implementing polyculture (Ashraf et al., 2018; Atiqah et al., 2019; Azhar et al., 2014; Ghazali et al., 2016) and reconfiguring patches of oil palm stands of different ages (Azhar et al., 2015b).
Therefore, instead of launching a ban, what we need the most right now is solidarity and collaboration at the global scale to tackle challenges together. A culture of sharing pioneering knowledge between researchers and industrial players is critical for formulating best practices across the industry for the sustainable management of oil palm plantation in our biodiversity-rich nation. By understanding the biological carrying capacity of forest fragments in oil palm plantations, we can suggest to managers different types of adaptive strategies that cater to improve the general biodiversity or species-specific actions to allow for a friendlier environment to biodiversity and subsequently support oil palm plantations to be more ecologically sustainable.
ACKNOWLEDGEMENT
The authors acknowledge the supports received from Wilmar International-PBB Oil Palms Berhad, Forest Department Sarawak, Sarawak Forestry Corporation, students and staff from the Institute of Biodiversity and Environmental Conservation, Universiti Malaysia Sarawak and Faculty of Resource Science and Technology, Universiti Malaysia Sarawak. We also appreciate the critical reviews made by the anonymous reviewers which improved the clarity and quality of this short communication.
REFERENCES
Aratrakorn, S; Thunhikorn, S and Donald, P F (2006). Changes in bird communities following conversion of lowland forest to oil palm and rubber plantations in southern Thailand. Bird Conserv. Int., 16(1): 71-82.
Arif, N A and Mohd-Azlan, J (2014). Diversity of birds captured by mist-netting in the understorey of Gunung Gading National Park, Sarawak, Borneo. Kukila, 17(2): 122-130.
Ashraf, M; Zulkifli, R; Sanusi, R; Tohiran, K A; Terhem, R; Moslim, R; Norhisham, A R; Ashton-Butt, A and Azhar, B (2018). Alley-cropping system can boost arthropod biodiversity and ecosystem functions in oil palm plantations. Agric. Ecosyst. Environ., 260: 19-26.
Atiqah, N; Yahya, M S; Aisyah, S; Ashton-Butt, A and Azhar, B (2019). Birds associated with different tree species and structures in oil palm agroforestry landscapes in Malaysia. Emu-Austral. Ornithology, 119(4): 397-401.
Azhar, B; Lindenmayer, D B; Wood, J; Fischer, J; Manning, A; McElhinny, C and Zakaria, M (2011). The conservation value of oil palm plantation

736
JOURNAL OF OIL PALM RESEARCH 33 (4) DECEMBER 2021
ARTICLE IN
PRESS
ARTICLE IN
PRESS
ARTICLE IN
PRESS
ARTICLE IN
PRESS
estates, smallholdings and logged peat swamp forest for birds. For. Ecol. Manag., 262(12): 2306-2315.
Azhar, B; Lindenmayer, D; Wood, J; Fischer, J; Manning, A; McElhinny, C and Zakaria, M (2013). Contribution of illegal hunting, culling of pest species, road accidents and feral dogs to biodiversity loss in established oil-palm landscapes. Wildlife Res., 40(1): 1-9.
Azhar, B; Puan, C L; Aziz, N; Sainuddin, M; Adila, N; Samsuddin, S; Asmah, S; Syafiq, M; Razak, S A; Hafizuddin, A and Hawa, A (2015a). Effects of in situ habitat quality and landscape characteristics in the oil palm agricultural matrix on tropical understorey birds, fruit bats and butterflies. Biodivers. Conserv., 24(12): 3125-3144.
Azhar, B; Puan, C L; Zakaria, M; Hassan, N and Arif, M (2014). Effects of monoculture and polyculture practices in oil palm smallholdings on tropical farmland birds. Basic Appl. Ecol., 15(4): 336-346.
Azhar, B; Saadun, N; Puan, C L; Kamarudin, N; Aziz, N; Nurhidayu, S and Fischer, J (2015b). Promoting landscape heterogeneity to improve the biodiversity benefits of certified palm oil production: Evidence from Peninsular Malaysia. Glob. Ecol. Conserv., 3(2015): 553-561.
Benedick, S; Hill, J K; Mustaffa, N; Chey, V K; Maryati, M; Searle, J B; Schilthuizen, M and Hamer, K C (2006). Impacts of rain forest fragmentation on butterflies in northern Borneo: Species richness, turnover and the value of small fragments. J. Appl. Ecol., 43(5): 967-977.
Bernard, H; Baking, E L; Giordano, A J; Wearn, O R and Ahmad, A H (2014). Terrestrial mammal species richness and composition in three small forest patches within an oil palm landscape in Sabah, Malaysian Borneo. Mamm. Study, 39(3): 141-155.
Brühl, C A; Eltz, T and Linsenmair, K E (2003). Size does matter – Effects of tropical rainforest fragmentation on the leaf litter ant community in Sabah, Malaysia. Biodivers. Conserv., 12(7): 1371-1389.
Chazdon, R L; Harvey, C A; Komar, O; Griffith, D M; Ferguson, B G; Martínez-Ramos, M; Morales, H; Nigh, R; Soto-pinto, L; Van Breugel, M and Philpott, S M (2009). Beyond reserves: A research agenda for conserving biodiversity in human-modified tropical landscapes. Biotropica, 41(2): 142-153.
Ching, J Y L; Yaman, I C; Khoon, K; Hong, C K and Melayong, G (2019). A case study into the sustainability journey and biodiversity conservation projects in Sarawak by Sarawak Oil Palms Berhad. J. Oil Palm Res., 31(3): 489-495.
Chua, M A; Sivasothi, N and Meier, R (2016). Population density, spatiotemporal use and diet of the leopard cat (Prionailurus bengalensis) in a human-modified succession forest landscape of Singapore. Mamm. Res., 61(2): 99-108.
Corley, R H V and Tinker, P B (2008). The Oil Palm. Fourth edition. John Wiley & Sons. 592 pp.
Denan, N; Wan Zaki, W M; Norhisham, A R; Sanusi, R; Nasir, D M; Nobilly, F; Ashton-Butt, A; Lechner, A M and Azhar, B (2019). Predation of potential insect pests in oil palm plantations, rubber tree plantations, and fruit orchards. Ecol. Evol., 10(2): 654-661.
Edwards, D P; Hodgson, J A; Hamer, K C; Mitchell, S L; Ahmad, A H; Cornell, S J and Wilcove, D S (2010). Wildlife-friendly oil palm plantations fail to protect biodiversity effectively. Conserv. Lett., 3(4): 236-242.
Edwards, D P; Larsen, T H; Docherty, T D; Ansell, F A; Hsu, W W; Derhé, M A; Hamer, K C and Wilcove, D S (2011). Degraded lands worth protecting: The biological importance of Southeast Asia’s repeatedly logged forests. Proc. of the Royal Soc. B., 278(1702): 82-90.
Falcy, M R and Estades, C F (2007). Effectiveness of corridors relative to enlargement of habitat patches. Conserv. Biol., 21(5): 1341-1346.
FAO (2011). Country profile – Malaysia. http://www.fao.org/3/ca0216en/CA0216EN.pdf, accessed on 8 January 2020. 4 pp.
Fayle, T M; Turner, E C; Snaddon, L; Chey, V K; Chung, A Y; Eggleton, P and Foster, W A (2010). Oil palm expansion into rain forest greatly reduces ant biodiversity in canopy, epiphytes and leaf-litter. Basic Appl. Ecol., 11(4): 337-345.
Fischer, J; Lindenmayer, D B and Manning, A D (2006). Biodiversity, ecosystem function, and resilience: Ten guiding principles for commodity production landscapes. Front. Ecol. Environ., 4(2): 80-86.
Fitzherbert, E B; Struebig, M J; Morel, A; Danielsen, F; Brühl, C A; Donald, P F and Phalan, B (2008). How will oil palm expansion affect biodiversity? Trends Ecol. Evol., 23(10): 538-545.

737
IS THERE A SUSTAINABLE FUTURE FOR WILDLIFE IN OIL PALM PLANTATIONS IN MALAYSIA?
ARTICLE IN
PRESS
ARTICLE IN
PRESS
Ghazali, A; Asmah, S; Syafiq, M; Yahya, M S; Aziz, N; Tan, L P; Norhisham, A R; Puan, C L; Turner, E C and Azhar, B (2016). Effects of monoculture and polyculture farming in oil palm smallholdings on terrestrial arthropod diversity. J. Asia-Pac. Entomol., 19(2): 415-421.
Grass, I; Loos, J; Baensch, S; Batáry, P; Librán-Embid, F; Ficiciyan, A; Klaus, F; Riechers, M; Rosa, J; Tiede, J and Udy, K (2019). Land-sharing/sparing connectivity landscapes for ecosystem services and biodiversity conservation. People Nat., 1(2): 262-272.
Guharajan, R; Arnold, T W; Bolongon, G; Dibden, G H; Abram, N K; Teoh, S W; Magguna, M A; Goossens, B; Te Wong, S; Nathan, S K and Garshelis, D L (2018). Survival strategies of a frugivore, the sun bear, in a forest-oil palm landscape. Biodiverse. Conserv., 27(14): 3657-3677.
Holzner, A; Ruppert, N; Swat, F; Schmidt, M; Weiß, B M; Villa, G; Mansor, A; Sah, S A M; Engelhardt, A; Kühl, H and Widdig, A (2019). Macaques can contribute to greener practices in oil palm plantations when used as biological pest control. Curr. Biol., 29(20): 1066-1067.
IUCN (2018). Saying ‘no’ to palm oil would likely displace, not halt biodiversity loss – IUCN report. https://www.iucn.org /news/secretariat/201806/saying-no-palm-oil-would-likely-displace-not-halt-biodiversity-loss---iucn-report, accessed on 30 October 2019. 3 pp.
IUCN-WCPA Task Force on OECMs (2019). Recognising and Reporting Other Effective Area-based Conservation Measures. IUCN, Gland, Switzerland. 36 pp.
Jambari, A; Azhar, B; Ibrahim, N L; Jamian, S; Hussin, A; Puan, C L; Noor, H M; Yusof, E and Zakaria, M (2012). Avian biodiversity and conservation in Malaysian oil palm production areas. J. Oil Palm Res., 24: 1277-1286.
Knowlton, J L; Mata-Zayas, E E; Ripley, A; Valenzuela-Cordova, B and Collado-Torres, R (2019). Mammal diversity in oil palm plantations and forest fragments in a highly modified landscape in southern Mexico. Front. for Glob. Change, 2: 67.
Koh, L P (2008a). Can oil palm plantations be made more hospitable for forest butterflies and birds? J. App. Ecol., 45(4): 1002-1009.
Koh, L P (2008b). Birds defend oil palms from herbivorous insects. Ecol. Appl., 18(4): 821-825.
Koh, L P; Levang, P and Ghazoul, J (2009). Designer landscapes for sustainable biofuels. Trends Ecol. Evol., 24(8): 431-438.
Kumaran, J V; Ketol, B; Marni, W; Sait, I; Mortada, M J; Khan, F A A; Har F P; Hall, L S and Abdullah, M T (2011). Comparative distribution and diversity of bats from selected localities in Sarawak. Borneo J. Resource Science and Technology, 1(1): 1-13.
Lucey, J M; Tawatao, N; Senior, M J; Chey, V K; Benedick, S; Hamer, K C; Woodcock, P; Newton, R J; Bottrell, S H and Hill, J K (2014). Tropical forest fragments contribute to species richness in adjacent oil palm plantations. Biol. Conserv., 169: 268-276.
Maas, B; Clough, Y and Tscharntke, T (2013). Bats and birds increase crop yield in tropical agroforestry landscapes. Ecol. Lett., 16(12): 1480-1487.
Maddox, T (2007). The Conservation of Tigers and Other Wildlife in Oil Palm Plantations: Jambi Province, Sumatra, Indonesia (October 2007). Zoological Society of London. 62 pp.
Mandal, J and Shankar Raman, T R (2016). Shifting agriculture supports more tropical forest birds than oil palm or teak plantations in Mizoram, northeast India. Condor., 118(2): 345-359.
Matson, P A and Vitousek, P M (2006). Agricultural intensification: Will land spared from farming be land spared for nature? Conserv. Biol., 20(3): 709-710.
McInnes, A (2017). A Comparison of Leading Palm Oil Certification Standards. http://www. forestpeoples. org/sites/default/files/documents /Palm% 20Oil% 20Certification% 20Standards_lowres_spre ads. pdf, accessed on 18 October 2018. 45 pp.
Ministry of Natural Resources and Environment (2016). National Policy on Biological Diversity 2016-2025. http://www.kats.gov.my/ms-my/PustakaMedia/Penerbitan/National%20Policy%20on%20Biological%20Diversity%202016-2025.pdf., accessed on 12 January 2020. 116 pp.
Mohd-Azlan, J; Fang, V A M; Kaicheen, S S; Lok, L; and Lawes, M J (2019a). The diversity of understorey birds in forest fragments and oil palm plantation, Sarawak, Borneo. J. Oil Palm Res., 31(3): 437-447.
Mohd-Azlan, J; Kaicheen, S S; Lok, L and Lawes, M J (2019b). The role of forest fragments in small mammal conservation in an oil palm plantation in northern Sarawak, Borneo. J. Oil Palm Res., 31(3): 422-436.

738
JOURNAL OF OIL PALM RESEARCH 33 (4) DECEMBER 2021
ARTICLE IN
PRESS
ARTICLE IN
PRESS
MPOB (2018). Overview of the Malaysian oil palm industry. http://bepi.mpob.gov.my/images/overview/ overview_of_industry _2018.pdf, accessed on 16 October 2018.
Nájera, A and Simonetti, J A (2010). Can oil palm plantations become bird friendly? Agrofor. Syst., 80(2): 203-209.
Pardo, L E; Campbell, M J; Cove, M V; Edwards, W; Clements, G R and Laurance, W F (2019). Land management strategies can increase oil palm plantation use by some terrestrial mammals in Colombia. Sci. Rep., 9(1): 1-12.
Phalan, B; Onial, M; Balmford, A and Green, R E (2011). Reconciling food production and biodiversity conservation: Land sharing and land sparing compared. Science, 333(6047): 1289-1291.
Phommexay, P; Satasook, C; Bates, P; Pearch, M and Bumrungsri, S (2011). The impact of rubber plantations on the diversity and activity of understorey insectivorous bats in southern Thailand. Biodivers. Conserv., 20(7): 1441-1456.
Reuters (2019). Indonesia urged to follow ’game-changer’ Malaysia on palm oil maps. https://www.nst.com.my/news/nation/2019/12 /54 7702/indonesia-urged-follow-game-changer-malaysia-palm-oil-maps, accessed in November 2019.
RSPO (2015). A Shared Vision 100% Sustainable Palm Oil in Europe: A Snapshot of National Initiatives. RSPO, Kuala Lumpur, Malaysia. 16 pp.
RSPO (2018). Principles and Criteria for Sustainable Palm Oil 2018. https://rspo.org/resources/certification/rspo-principles-criteria-certification, accessed in October 2019.
Scriven, S A; Carlson, K M; Hodgson, J A; McClean, C J; Heilmayr, R; Lucey, J M and Hill, J K (2019). Testing the benefits of conservation set-asides for improved habitat connectivity in tropical agricultural landscapes. J. Appl. Ecol., 56(10): 2274-2285.
Shazali, N; Khalik, M Z; Rahman, S H; Azhar, I; Khan, F A A; Tahir, N A; Murni, R; McArthur, E; Latip, N A; Rahman, M R A and Naharuddin, N (2016). Small mammals from Miri, north-eastern region of Sarawak, Malaysian Borneo: Note on new locality records. Check List, 12: 1.
Sivanandam, H (2017). MSPO certification mandatory by 2019. https://www.thestar.com.my/news/nation/2017/02/25/mspo-certification-mandatory-by-2019-govt-aims-for-sustainable-oil-palm-industry, accessed on 18 December 2019.
Srinivas, A and Koh, L P (2016). Oil palm expansion drives avifaunal decline in the Pucallpa region of Peruvian Amazonia. Glob. Ecol. Conserv., 7: 183-200.
Struebig, M J; Kingston, T; Zubaid, A; Mohd-Adnan, A and Rossiter, S J (2008). Conservation value of forest fragments to Palaeotropical bats. Biol. Conserv., 141(8): 2112-2126.
Tawatao, N; Lucey, J M; Senior; Benedick, S; Khen, C V; Hill, J K and Hamer, K C (2014). Biodiversity of leaf-litter ants in fragmented tropical rainforests of Borneo: The value of publically and privately managed forest fragments. Biodiverse. Conserv., 23(12): 3113-3126.
Tohiran, K A; Nobilly, F; Zulkifli, R; Ashton-Butt, A and Azhar, B (2019). Cattle-grazing in oil palm plantations sustainably controls understory vegetation. Agric. Ecosyst. Environ., 278: 54-60.
Tohiran, K A; Nobilly, F; Zulkifli, R; Maxwell, T; Moslim, R and Azhar, B (2017). Targeted cattle grazing as an alternative to herbicides for controlling weeds in bird-friendly oil palm plantations. Agron. Sustain. Dev., 37(6): 62.
Tscharntke, T; Klein, A M; Kruess, A; Steffan-Dewenter, I and Thies, C (2005). Landscape perspectives on agricultural intensification and biodiversity-ecosystem service management. Ecol. Lett., 8(8): 857-874.
Turner, E and Foster, W A (2006). Assessing the influence of bird’s nest ferns (Asplenium spp.) on the local microclimate across a range of habitat disturbances in Sabah, Malaysia. Selbyana, 27(2): 195-200.
Wearn, O R; Rowcliffe, J M; Carbone, C; Pfeifer, M; Bernard, H and Ewers, R M (2017). Mammalian species abundance across a gradient of tropical land-use intensity: A hierarchical multi-species modeling approach. Biol. Conserv., 212: 162-171.
Williams-Guillén, K; Perfecto, I and Vandermeer, J (2008). Bats limit insects in a neotropical agroforestry system. Science, 320(5872): 70-70.
Yahya, M S; Syafiq, M; Ashton-Butt, A; Ghazali, A; Asmah, S and Azhar, B (2017). Switching from monoculture to polyculture farming benefits birds in oil palm production landscapes: Evidence from mist netting data. Ecol. Evol., 7(16): 6314-6325.
Yue, S; Brodie, J F; Zipkin, E F and Bernard, H (2015). Oil palm plantations fail to support mammal diversity. Ecol. Appl., 25(8): 2285-2292.

JOURNAL OF OIL PALM RESEARCHGUIDE FOR AUTHORS
(for more details, kindly surf http://jopr.mpob.gov.my)
Type of Articles
1. Regular ArticleFull-length original empirical investigations, consisting of introduction, materials and methods, results and discussion, conclusions. Original work must provide references and an explanation on research findings that contain new and significant findings. Conclusion should be brief and focus on the research output, should not be in point form. These papers should not exceed 6000 words of text (including tables, figures and references) and generally not more than a total of 10 figures and tables. After peer-review, the article word count limit can be extended to a maximum of 8000 words to better address the reviewers’ and editors’ comments. Any additional figures or tables can be included in the supplementary data. Please note that papers submitted to JOPR will be sent back to authors because of poor figure resolution or exceeding the number of figures permitted.
2. Short CommunicationSignificant new information to readers of the Journal in a short but complete form. Preferably not exceeding 3000 words (including tables, figures and references), and is intended for rapid publication. They are not intended for publishing preliminary results or to be a reduced version of regular article.
3. Review ArticleCritical evaluation of materials about current research that have already been published by organising, integrating, and evaluating previously published materials. Re-analyses as meta-analysis and systemic reviews are encouraged. Review articles provide systemic overview, evaluation and interpretation of research in a given field. They should not exceed 12 000 words (excluding references only) and should contain no more than a total of 20 figures and tables. Any additional figures or tables can be included in the supplementary data. Please note that papers submitted to JOPR will be sent back to authors because of poor figure resolution or exceeding the number of figures permitted. The same information should not be repeated in a figure and a table.
Language Please write your text in good English (only British English is accepted). We do not accept American English or a mixture of these.
JOPR’s TemplateJOPR’s template, which is a standard format that facilitates the manuscript writing and copyediting process. This template is created to provide a detail and clear house style of JOPR. The template is drafted according to JOPR’s house style, but in standard word version format. When writing a paper, authors need to format their papers to fit into the journal’s house style. To make this easier, Word templates are available for many of other established journals, ready for them to download and apply to their research paper format. It is crucial for author to write a research paper while considering formatting. Each journal has its own guidelines for formatting; hence, the template defines how an article will look when it is published online or in print.
JOPR’s Aims & ScopeThis is established to provide a detail and clear aims and scope for author reference. Authors should declare in the cover letter how the research fits the aims and scope of JOPR.
JOPR’s House StyleA detail listing of JOPR’s house style for authors and a checklist to facilitate the copyediting process and standardise the copyediting process. The JOPR’s house style remains the same and is drafted into a detail version for author’s reference.
Manuscript Submission• Manuscripts should be submitted via:
https://mc04.manuscriptcentral.com/jopres• JOPR does not permit dual submission,
publication and/or any archive platform (preprint) in violation of journal ethical practices.
For more details and to download the JOPR’s House Style and Template, kindly surf http://jopr.mpob.gov.my

• Omics Platform Technologies for Discovery and Understanding the Systems Biology of Oil PalmUmi Salamah Ramli; Abrizah Othman; Benjamin Lau Yii Chung; Noor Idayu Mhd Tahir; Syahanim Shahwan; Zain Nurazah; Nurul Liyana Rozali; Hasliza Hassan; Nur ‘Ain Mohd Ishak; Shahirah Balqis Dzulkafli; Rajinder Singh; Omar Abd Rasid; Ravigadevi Sambanthamurthi; Mohamad Arif Abd Manaf and Ghulam Kadir Ahmad Parveez
• Histone Modification Marks Improve Identification of Oil Palm Transcription Start SitesSarpan, N; Tatarinova, T V; Low, E-T L; Ong-Abdullah, M; Sapian, I S and Ooi, S-E
• Effect of Biofuel on Light-duty Vehicles Engine Performance and Lube Oil DegradationM Ropandi; Z Nahrul Hayawin; A A Astimar; A W Noorshamsiana; R Ridzuan and I Zawawi
• Assessment of Trans Fatty Acid Levels in Refined Palm-based Oils and Commercial Vegetable Oils in the Malaysian Market Hishamuddin, E; Abd Razak, R A; Yeoh, C B and Ahmad Tarmizi, A H
• Inhibition of Cholinesterases by Water-Soluble Palm Fruit Extract Soon-Sen Leow; Syed Fairus and Ravigadevi Sambanthamurthi
• Synthesis and Physicochemical Properties of New Estolide Esters as Potential Biolubricant Base Oil Seng Soi Hoong; Mohd Zan Arniza; Nek Mat Din Nik Siti Mariam; Abu Hassan Noor Armylisas; Sook Wah Tang; Tuan Noor Maznee Tuan Ismail and Shoot Kian Yeong
• Sensory Evaluation of Fillets from Tilapia (Oreochromis niloticus) Fed Diets Containing Oil Palm LipidsWan Nooraida, W M; Abidah, M N; Nur Atikah, I; Mookiah, S; Muhammad Amirul, F and Rafidah, A H
Contents of the Coming Issue Journal of Oil Palm Research
Vol. 34 (1) March 2022*
Note: * Subject to change.
Related Documents