Multimodal bioimaging using a rare earth doped Gd 2 O 2 S:Yb/Er phosphor with upconversion luminescence and magnetic resonance properties† G. Ajithkumar, * a Benjamin Yoo, b Dara E. Goral, b Peter J. Hornsby, b Ai-Ling Lin, c Uma Ladiwala, d Vinayak P. Dravid e and Dhiraj K. Sardar a While infrared upconversion imaging using halide nanoparticles is very common, the search for very efficient halide free upconverting phosphors is still lacking. In this article we report Gd 2 O 2 S:Yb/Er, YbHo, YbTm systems as very efficient alternative phosphors that show upconversion efficiency comparable to or even higher than those of existing halide phosphors. While the majority of rare earth dopants provide the necessary features for optical imaging, the paramagnetic Gd ion also contributes to the magnetic imaging, thereby resulting in a system with bimodal imaging features. Results from imaging of the nanoparticles together with aggregates of cultured cells have suggested that imaging of the particles in living animals may be possible. In vitro tests revealed no significant toxicity because no cell death was observed when the nanoparticles were in the presence of growing cells in culture. Measurement of the magnetization of the phosphor shows that the particles are strongly magnetic, thus making them suitable as an MRI agent. 1 Introduction With the tremendous developments in nanotechnology in recent years, uorescence bioimaging has become an extremely demanding area in biophotonics. In all light based imaging and therapy, light is delivered to the target either directly or indirectly through carriers which are biocompatible drugs. In the case of direct light based imaging and therapy with high energy photons from X-rays, gamma rays, etc. there are many harmful effects. However, the indirect method based on infrared (IR) light offers several advantages such as low energy IR excitation, high penetration depth, local delivery, and low tissue damage. One of the most common imaging technologies widely used now is based on organic uorophores and quantum dots (QDs). Short-lived radioactive isotope labeling is also used in research, in human diagnostics and treatment. However, there are signicant shortcomings with these current imaging agents: viz. photobleaching and lumi- nescence blinking in organic dyes and quantum dots, toxicity in quantum dots and radioactive materials, autouorescence with UV exciting dyes and quantum dots, low information density, and overall the high technology cost. Essentially, all of these limitations can be eliminated with IR based trivalent rare earth (RE) ion-doped upconversion phosphor (UCP) 1 technology. Advantages of UCPs are: (1) high signal to noise ratio: because of the biological transparent window in the 800–1200 nm region, tissues do not show uorescence, thereby making the upconversion technology an excellent tool for background-free images with high signal to noise ratio, (2) high penetration depth: because of the higher penetration depth of near-IR radiation to tissues, in vivo imaging is possible, (3) high resolution and information density: the sharp level continuously tunable emission spectral features enable high information density and resolution as low as 10 nm, (4) low toxicity-compared to QDs: many of the UCPs are less toxic as revealed from their toxicity studies. The LD 50 for RE oxides is on the order of 1000 mg kg 1 , while the LD 50 values for many selenium oxide QDs are on the order of 1 mg kg 1 , 2 (5) dual mode imaging: since many RE doped phos- phors 3–5 shows downconversion under NIR excitation, NIR to IR imaging is also possible, (6) low cost technology: in UCPs since the color tunability is achieved by the dopant composi- tions size tunability is not needed as in QDs which makes this a Department of Physics and Astronomy, University of Texas at San Antonio, San Antonio, TX 78249, USA. E-mail: [email protected]; Fax: +1 2104584919 b Department of Physiology and Barshop Institute, University of Texas Health Science Center at San Antonio, San Antonio, TX 78245, USA c Research Imaging Institute, Barshop Institute and Department of Cellular & Structural Biology, University of Texas Health Science Center, 7703 Floyd Curl Drive, San Antonio, TX 78229, USA d UM-DAE Centre for Excellence in Basic Sciences, Health Centre Bldg, University of Mumbai, Kalina Campus, Mumbai 400098, India e Department of Materials Science and Engineering, Northwestern University, 2220 Campus Drive, Evanston, IL 60208-3108, USA † Electronic supplementary information (ESI) available. See DOI: 10.1039/c3tb00551h Cite this: J. Mater. Chem. B, 2013, 1, 1561 Received 16th October 2012 Accepted 8th January 2013 DOI: 10.1039/c3tb00551h www.rsc.org/MaterialsB This journal is ª The Royal Society of Chemistry 2013 J. Mater. Chem. B, 2013, 1, 1561–1572 | 1561 Journal of Materials Chemistry B PAPER Downloaded by UTSA Libraries on 15/05/2013 16:38:14. Published on 10 January 2013 on http://pubs.rsc.org | doi:10.1039/C3TB00551H View Article Online View Journal | View Issue

Welcome message from author
This document is posted to help you gain knowledge. Please leave a comment to let me know what you think about it! Share it to your friends and learn new things together.
Transcript

Journal ofMaterials Chemistry B
PAPER
Dow
nloa
ded
by U
TSA
Lib
rari
es o
n 15
/05/
2013
16:
38:1
4.
Publ
ishe
d on
10
Janu
ary
2013
on
http
://pu
bs.r
sc.o
rg |
doi:1
0.10
39/C
3TB
0055
1H
View Article OnlineView Journal | View Issue
aDepartment of Physics and Astronomy, U
Antonio, TX 78249, USA. E-mail: akgsh@yabDepartment of Physiology and Barshop Ins
Center at San Antonio, San Antonio, TX 782cResearch Imaging Institute, Barshop Institut
Biology, University of Texas Health Scien
Antonio, TX 78229, USAdUM-DAE Centre for Excellence in Basic Sc
Mumbai, Kalina Campus, Mumbai 400098,eDepartment of Materials Science and Eng
Campus Drive, Evanston, IL 60208-3108, US
† Electronic supplementary informa10.1039/c3tb00551h
Cite this: J. Mater. Chem. B, 2013, 1,1561
Received 16th October 2012Accepted 8th January 2013
DOI: 10.1039/c3tb00551h
www.rsc.org/MaterialsB
This journal is ª The Royal Society of
Multimodal bioimaging using a rare earth dopedGd2O2S:Yb/Er phosphor with upconversionluminescence and magnetic resonance properties†
G. Ajithkumar,*a Benjamin Yoo,b Dara E. Goral,b Peter J. Hornsby,b Ai-Ling Lin,c
Uma Ladiwala,d Vinayak P. Dravide and Dhiraj K. Sardara
While infrared upconversion imaging using halide nanoparticles is very common, the search for very
efficient halide free upconverting phosphors is still lacking. In this article we report Gd2O2S:Yb/Er, YbHo,
YbTm systems as very efficient alternative phosphors that show upconversion efficiency comparable to
or even higher than those of existing halide phosphors. While the majority of rare earth dopants
provide the necessary features for optical imaging, the paramagnetic Gd ion also contributes to the
magnetic imaging, thereby resulting in a system with bimodal imaging features. Results from imaging
of the nanoparticles together with aggregates of cultured cells have suggested that imaging of the
particles in living animals may be possible. In vitro tests revealed no significant toxicity because no cell
death was observed when the nanoparticles were in the presence of growing cells in culture.
Measurement of the magnetization of the phosphor shows that the particles are strongly magnetic,
thus making them suitable as an MRI agent.
1 Introduction
With the tremendous developments in nanotechnology inrecent years, uorescence bioimaging has become anextremely demanding area in biophotonics. In all light basedimaging and therapy, light is delivered to the target eitherdirectly or indirectly through carriers which are biocompatibledrugs. In the case of direct light based imaging and therapywith high energy photons from X-rays, gamma rays, etc. thereare many harmful effects. However, the indirect method basedon infrared (IR) light offers several advantages such as lowenergy IR excitation, high penetration depth, local delivery,and low tissue damage. One of the most common imagingtechnologies widely used now is based on organic uorophoresand quantum dots (QDs). Short-lived radioactive isotope
niversity of Texas at San Antonio, San
hoo.com; Fax: +1 2104584919
titute, University of Texas Health Science
45, USA
e and Department of Cellular & Structural
ce Center, 7703 Floyd Curl Drive, San
iences, Health Centre Bldg, University of
India
ineering, Northwestern University, 2220
A
tion (ESI) available. See DOI:
Chemistry 2013
labeling is also used in research, in human diagnostics andtreatment. However, there are signicant shortcomings withthese current imaging agents: viz. photobleaching and lumi-nescence blinking in organic dyes and quantum dots, toxicityin quantum dots and radioactive materials, autouorescencewith UV exciting dyes and quantum dots, low informationdensity, and overall the high technology cost.
Essentially, all of these limitations can be eliminated withIR based trivalent rare earth (RE) ion-doped upconversionphosphor (UCP)1 technology. Advantages of UCPs are: (1) highsignal to noise ratio: because of the biological transparentwindow in the 800–1200 nm region, tissues do not showuorescence, thereby making the upconversion technology anexcellent tool for background-free images with high signal tonoise ratio, (2) high penetration depth: because of the higherpenetration depth of near-IR radiation to tissues, in vivoimaging is possible, (3) high resolution and informationdensity: the sharp level continuously tunable emission spectralfeatures enable high information density and resolution as lowas 10 nm, (4) low toxicity-compared to QDs: many of the UCPsare less toxic as revealed from their toxicity studies. The LD50
for RE oxides is on the order of 1000 mg kg�1, while the LD50
values for many selenium oxide QDs are on the order of 1 mgkg�1,2 (5) dual mode imaging: since many RE doped phos-phors3–5 shows downconversion under NIR excitation, NIR toIR imaging is also possible, (6) low cost technology: in UCPssince the color tunability is achieved by the dopant composi-tions size tunability is not needed as in QDs which makes this
J. Mater. Chem. B, 2013, 1, 1561–1572 | 1561

Journal of Materials Chemistry B Paper
Dow
nloa
ded
by U
TSA
Lib
rari
es o
n 15
/05/
2013
16:
38:1
4.
Publ
ishe
d on
10
Janu
ary
2013
on
http
://pu
bs.r
sc.o
rg |
doi:1
0.10
39/C
3TB
0055
1HView Article Online
technology cheaper, and (7) UCPs can also be imaged inscanning electron microscopy (SEM) due to their cath-odoluminescence so that it is possible to do both 2- and3-photon imaging of nanophosphors in organisms and doultra-high spatial resolution imaging using SEM.6 The otheradvantage is the extremely low power excitation needed for theupconversion processes in RE doped phosphors. For example,recently we invented a phosphor where the green upconversioncould be seen by the naked eye even with 15 mW excitation.7 InUCPs the excitation intensities needed are 107 times less thanthe intensities needed for 2-photon excitation of typicalorganic dyes and are easily achievable using very low cost IRCW diode lasers. Another obvious advantage of UCPs is theirphotostability under external conditions. Unlike organic uo-rophores, UCPs do not photobleach and their emissionintensities remain stable for years making them favorable forlong term use.
Recently, there has been much interest in both academiaand industry on the IR activated upconversion phosphor tech-nology (UPT) for several biophotonics applications such asadvanced imaging, therapy and drug delivery.8–10 Though thistechnology has already been proposed for several biophotonicsapplications, it is still immature mainly due to the lack of aproper phosphor that satises several requirements, viz. highefficiency, non-toxicity, small size, low cost of production,biocompatibility with several functional groups, etc.
Optical imaging allows very sensitive localization of a verysmall number of cells, even single cells, and allows clear visu-alization of the cells in relation to their surrounding tissues. Inparticular, because cells are able to internalize UCPs, in vivotracking would even be possible. On the other hand, non-opticalimaging, such as magnetic resonance imaging,11 can be used toa depth of tissue that is not currently possible with opticalimaging. It too can be used down to the single cell level.Therefore, the ideal type of phosphor is one that can be used forboth forms of imaging in the same experiment. Recently, Euand Yb,Er doped GdVO4 luminomagnetic nanoparticles werestudied as candidates for biomedical imaging under UV exci-tation.12,13 Rare earth doped NaGdF4 has been suggested as apotential bimodal imaging phosphor by several researchers.14–21
Zhang et al.22 proposed the idea of Fe3O4/SiO2/a-NaYF:Yb,Ermesoporous core–shell nanorattles as a possible material.However the inherent toxicity of vanadium23 and all halidebased nanoparticles make this an unsafe material for long termbiological use.
This paper discusses the studies of the use of IR activatedGd2O2S:Yb/Er, YbHo, YbTm upconversion phosphors inbimodal imaging by utilizing the magnetic as well as the opticalproperties of the phosphor. The bimodal imaging features ofthe phosphor are achieved by the upconversion properties ofthe rare earth dopants as well as the magnetic properties of theGd ion thus making this phosphor a bimodal luminomagneticphosphor. To the best of our knowledge, this is the rst studyreporting the use of rare earth doped Gd2O2S upconversionphosphors for in vitro infrared bioimaging. In vitro studies wereperformed using mouse neural progenitor cells and the MDA-MB-231 human breast cancer cell line.
1562 | J. Mater. Chem. B, 2013, 1, 1561–1572
2 Experimental section2.1 Synthesis
A high temperature solid state ux fusion method7 was used forthe phosphor synthesis. The starting materials were Gd2O3,Yb2O3, Er2O3, Ho2O3 (Sigma Aldrich, all 99.999%), S and uxNa2CO3, K3PO4 (Sigma Aldrich, 99.99%). Both S and Na2CO3
were 30 to 50 wt% and K3PO4 was 20 wt% of the total weight.The starting chemicals were thoroughly mixed using an agatemortar and then heated in a muffle furnace at 1150 �C for 60min. When the furnace was cooled down the samples weretaken out and washed with distilled water 6 times and nallywith mild hydrochloric acid. The washed powder was subse-quently dried and sieved.
2.2 Characterization
X-ray powder diffraction was performed at 40 kV and 30 mA inthe parallel beam method using a RIGAKU Altima IV X-raydiffractometer with Cu Ka radiation. The morphology andparticle size distribution of the samples were observed using aHitachi S5500 eld emission scanning transmission electronmicroscope (FE-STEM) operated at 30 kV in secondary electronmode. Elemental compositions were estimated using the energydispersive X-ray analysis (EDAX) equipped with the FE-STEM.The UV-VIS-NIR absorption spectra of the powder samples weremeasured with a spectrophotometer (Cary, Model 14R). Theupconversion spectra were recorded by a 1.25 m (SPEX) spec-trometer using a TiS laser (Spectra Physics, 3900S) as the exci-tation source. For comparison all samples were equally weighedand packed in a sample holder and excited with a power densityof �0.5 W cm�2. Quantum efficiencies of the green emissionbands were measured by using a 15 cm diameter integratingsphere (Oriel 20451) coupled with a uorescence spectrometer(Photon Technology International, NJ). For emission lifetimestudies, the 980 nm output of a pulsed (5 ns) Nd:YAG pumpedMOPO SL optical parametric oscillator (Spectra-Physics,Mountain View, CA) was employed as the pump source and a0.5 m spectrometer (Acton Research spectrometer) equippedwith a 500 nm grating and a PMT detector (Hamamatsu PMTmodel – R5108) were used to collect the signal. The decaytransients were averaged and recorded using a TDS 220 digitaloscilloscope (Tektronix, Beaverton, OR) with 50 Ohm imped-ance. Magnetic properties were measured using a super-conducting quantum interference device (SQUID) in the Magnetand Low Temperature Facility, MRC, at Northwestern Univer-sity. The hysteresis loop of magnetization at room temperaturewith the magnetic eld sweeping from �5 to 5 Tesla wasrecorded. The sample used for the measurement was 50 mg.
2.3 Animal experiments
Penetration depth experiments were conducted at the bio-photonics lab of UTSA using pork muscle tissue. A 980 nm penlaser of maximum 100 mW (excitation power density �0.17 Wcm�2) was used for all experiments. Emission spectra werecollected with an Ocean optics (USB 4000) ber optics spec-trometer and the images were photographed with a digital
This journal is ª The Royal Society of Chemistry 2013

Paper Journal of Materials Chemistry B
Dow
nloa
ded
by U
TSA
Lib
rari
es o
n 15
/05/
2013
16:
38:1
4.
Publ
ishe
d on
10
Janu
ary
2013
on
http
://pu
bs.r
sc.o
rg |
doi:1
0.10
39/C
3TB
0055
1HView Article Online
camera. The 800 nm emission from Gd2O2S:Yb/Tm was imagedwith a Leica microscope (Nikon SMZ-U) equipped with a NIRCCD camera (Hamamatzu C3077-79) and the images werecollected and processed with HC image soware.
2.4 Cell culture studies
To understand the nontoxicity and biocompatibility, cytotox-icity tests were conducted using three cell lines: mouse neuralprogenitor cells (NPCs), MDA-MB-231 and the human neuro-blastoma SK-N-SH.24 NPCs were derived from mouse cells usingthe stromal cell derived factor method.25 NPCs were grown in N2medium.26 SK-N-SH cell lines were maintained in DMEM with10% fetal calf serum (FCS). Cells were maintained in an incu-bator at a temperature of 37 �C regulated with 5% CO2, 95% airand saturated humidity.
Cytotoxicity testing at high concentrations of UCPs(Gd2O2S:Yb/Er, Gd2O2S:YbHo, and NaYF4:Yb/Er) was performedas follows. UCPs were suspended in medium and incubatedwith cells at 100 mgml�1 and 1000 mgml�1 for 24 hours or for upto 72 hours. Images were obtained using an Axiovert 200 MInverted Fluorescence Microscope.
Cell viability in the presence or absence of UCPs wasassessed by the MTT (3-[4,5-dimethylthiazol-2-yl]-2,5-diphe-nyltetrazolium bromide) colorimetric assay, based on thecellular reduction of tetrazolium salt MTT (Sigma, USA) by themitochondrial dehydrogenase of viable cells which results inthe formation of a blue formazan product. In brief, SK-N-SHcells were plated in a 96-well tissue culture plate (Falcon, USA) ata concentration of 20 000 cells per well in DMEM–10% FCS.Next day the medium was removed, and phosphors suspendedin DMEM–10% FCS at different concentrations: 50 mg ml�1, 100mg ml�1 and 200 mg ml�1, were added in triplicate wells of theSK-N-SH cells in the plate. Control wells had only mediumwithout phosphor particles. Aer incubation for 48 hours, themedium from all wells was removed and replaced with 10 mlMTT dissolved in PBS (concentration 5 mg ml�1) + 100 mlmedium, and the plate incubated for 4 hours at 37 �C. The blueformazan product formed was dissolved by the addition ofequal volumes of 10% SDS:0.01 N HCl solution per well over-night with gentle rocking. Optical density was measured usingan ELISA plate reader at wavelength 570 nm. Statistical analysiswas done using a one-way ANOVA, followed by Dunnett'smultiple comparisons test. The level of signicance was set atp>0.05. All statistical analyses were done using the Instatsoware.
Imaging of cell aggregates with UCPs: MDA-Mb-231 cells wereincubated with UCPs (Gd2O2S:Yb/Er, Gd2O2S:YbHo, and NaY-F4:Yb/Er) in medium containing UCP at 200, 200, and 60 mgml�1, respectively, for 24 hours. Trypsinized cells together withUCPs were then incubated in medium in dishes coated withPluronic F68 which prevents cell attachment.27 Aer 24 hours,aggregates of cells and UCPs had formed and were used forsubsequent imaging. For imaging, aggregates were placed in aglass capillary in medium and photographed under illumina-tion with a 980 nm 40 mW diode laser. Photographs wereobtained using a digital camera.
This journal is ª The Royal Society of Chemistry 2013
All animal and cell experiments were performed followingthe standard protocols with permission obtained from therelevant national or local authorities.
2.5 Magnetic resonance experiments
Experiments were performed on a 7T Pharmscan MR scanner(Bruker, Billerica, MA, USA). A quadrature volume coil (61 mmin diameter) was used for both RF transmission and reception.Diluted Gd2O2S:Yb/Er (0.0038, 0.0076, 0.015, 0.03, 0.038 mgml�1) in deionized water was placed in 5 ml tubes for imaging.T1-weighted images were obtained with a FALSH sequence.Imaging parameters were as follows: eld-of-view (FOV) ¼ 5 � 5cm, matrix size ¼ 128 � 128, slice thickness ¼ 1.5 mm, repe-tition time (TR) ¼ 400 ms, echo time (TE) ¼ 4 ms.
Relaxivity (T1 value) was measured using a RAREVTRsequence.EightTRs (150, 300, 400, 500, 700, 1000, 2000, and5000ms) were used and TE¼ 8.3ms. Other parameters were identicalto theT1-weighted imaging. Thedatawere collected andanalysedusing Bruker ParaVision 5.1 soware. The MR signal intensity ofthe samples was ascertained by the average intensity in thedened regions of interest (ROIs). The T1 value of each samplewas calculated byttingM(t)¼M0[1�Cexp(�TR/T1)], whereM(t)is the signal intensity at a particular TR, M0 is the equilibriumsignal and C is a factor to account for incomplete inversion. ThedeterminedT1 valueswere plotted asR1 (1/T1) vs. concentrationofGd2O2S:Yb/Er.
3 Results and discussion3.1 Phase and morphology
A typical XRD pattern obtained for Gd2O2S:Yb/Er is shown inFig. 1 in comparison with the standard powder peak positionsof the Gd2O2S hexagonal phase (JCPDS card no. 26-1422). TheXRD results reveal that the well-crystallized Gd2O2S:Yb, Ersample is in a hexagonal Gd2O2S structure with cell parametersa ¼ b ¼ 0.3852 nm, c ¼ 0.6567 nm. The crystal structure ofGd2O2S is shown in the inset of Fig. 1. The symmetry is trigonaland the space group is P3 �m1. There is one formula unit per unitcell. The structure is very closely related to the A-type rare-earthoxide structure, the difference being that one of the threeoxygen sites is occupied by a sulfur atom. Atom positions inGd2O2S using lattice vector units are �(1/3, 2/3, u) for two metalatoms with u� 0.28,�(1/3, 2/3, v) for two oxygen atoms with v�0.63, and (0, 0, 0) for a sulfur atom. Eachmetal atom seems to bebonded to four oxygen atoms and three sulfur atoms to form aseven coordinated geometry with the oxygen and the metal inthe same plane.
A typical SEM micrograph of the sample is shown in Fig. 2.SEM micrographs obtained from different locations show thatthe material mostly crystallized in hexagonal form with a meanparticle size of 4 mm obtained from the size distribution shownin Fig. S1 of ESI.† Analysis of the elemental composition by EDS(Fig. S2, ESI†) shows the wt% of various elements inside thecomposition of Gd2O2S:Yb(2),Er(1) as Gd ¼ 42.5%, Yb ¼ 2.53%,Er ¼ 1.05% and S ¼ 7.46% which is in good agreement with thestarting composition: Gd ¼ 42.2%, Yb ¼ 2.3% and Er ¼ 0.74%.
J. Mater. Chem. B, 2013, 1, 1561–1572 | 1563

Fig. 1 XRD pattern of the Gd2O2S:Yb/Er sample. Vertical lines show the standard peak positions of Gd2O2S (JCPD file no. 26-1422). The inset shows the crystalstructure of Gd2O2S indicating the locations of Gd (pink), O (red) and S (yellow) atoms.
Fig. 2 SEM micrograph of the Gd2O2S:Yb/Er phosphor powder prepared by theflux fusion method.
Fig. 3 UV-VIS-NIR absorption spectrum of Gd2O2S:Yb(8)Er(1) with all observedspectral transitions.
Journal of Materials Chemistry B Paper
Dow
nloa
ded
by U
TSA
Lib
rari
es o
n 15
/05/
2013
16:
38:1
4.
Publ
ishe
d on
10
Janu
ary
2013
on
http
://pu
bs.r
sc.o
rg |
doi:1
0.10
39/C
3TB
0055
1HView Article Online
The S content in the nal composition is found to be less thanthe starting composition of 22.62% and is due to the excessoxidation rate of elemental sulfur during the ring process.
3.2 Spectroscopy
The room temperature UV-VIS-NIR absorption spectrum of thesample given in Fig. 3 consists of several well resolved absorp-tion bands with their spectral width and band positionscomparable with standard Yb3+/Er3+ spectra. The absorptionbands of Er3+ ion correspond to transitions from the 4I15/2ground state to the various excited levels as shown in thespectrum. Fig. 4 shows a 980 nm excited upconversion inG2O2S:Yb(8),Er(1). The emission spectrum in the 500–700 nmrange is characterized by an intense green band followed by aweaker red band. The green emission band which is due to the
1564 | J. Mater. Chem. B, 2013, 1, 1561–1572
transition shows several Stark components at 524, 527, 533, 548and 554 nm with the most intense being the 548 nm emissionwhich arises from the 4S3/2/
4I15/2 transition. The red emissionwhich is due to the 4F9/2 /
4I15/2 transition shows Stark levels at655, 661, 663 and 669 nm. As usual, all samples show stronggreen and comparatively weak red emissions. The uorescencebranching ratios of the green and red upconversion bands are60% and 37.3%, respectively. Since the intensity of the greenemission is nearly 2.4 times higher than that of the red emis-sion, the samples glow with intense green emission. Theupconversion in these samples is so intense that even with<15 mWexcitation the emission can be seen with the naked eyes.Furthermore, the emission could be recorded with 700 mW ofexcitation power. Because of the extreme brightness of the
This journal is ª The Royal Society of Chemistry 2013

Fig. 4 Upconversion emission spectrum of Gd2O2S:Yb(8),Er(1) phosphor under980 nm laser excitation. Inset shows the green emission at 980 nm excitation with20 mW power and the corresponding CIE color coordinate diagram representingthe emission color indicated by the white arrow.
Fig. 5 (a) Photograph of the upconversion emission in oxysulphide phosphors(top) and their colloids in deionized water (bottom) at a concentration of 1 mg/3 ml. From left to right: Gd2O2S:Yb(8),Er(1), La2O2S:Yb(3),Er(7) observed througha red filter, Gd2O2S:Yb(2),Tm(1), La2O2S:Yb(9),Er(1). (b) Normalized upconversionemission spectra of YbTm, YbHo, Yb/Er and YbTm in Gd2O2S. The 980 nmabsorption peak of Yb3+ is shown on the extreme right.
Paper Journal of Materials Chemistry B
Dow
nloa
ded
by U
TSA
Lib
rari
es o
n 15
/05/
2013
16:
38:1
4.
Publ
ishe
d on
10
Janu
ary
2013
on
http
://pu
bs.r
sc.o
rg |
doi:1
0.10
39/C
3TB
0055
1HView Article Online
emission, excitation power of approximately 20 mWwas used inall emission experiments. The inset of Fig. 4 shows a photo-graph of the green upconversion emission at 980 nm excitationwith 20 mW power. The upper inset shows the CIE color mapwhere the emission color coordinates obtained (0.362,0.544) aremarked by an arrow.
In Fig. 5a, a photograph of the multicolor emission phos-phors from various dopant compositions is shown along withthe corresponding emission in a transparent suspension madewith deionized water at a concentration of 1 mg/3 ml. By suit-ably selecting the dopant scheme as well as the compositionsand the host it is possible to tune the color over a wide range asobserved in the cases of other halide based upconvertingphosphors.28–36 Further, as shown in the ESI S3,† the emissionintensity is independent of the pH of the medium over a widerange. A normalized emission spectrum of the selected phos-phor compositions is shown in Fig. 5b along with the Yb3+
absorption band in the oxysulphide phosphor. Another inter-esting feature of the oxysulphide phosphor is the powerdependent color tuning features which are explained in moredetail in our previous publications37 [Fig. S4 ESI†].
The upconversion process in the Yb/Er system is wellunderstood in several materials38,39 and a more detailed expla-nation of the processes based on multiphoton absorption andenergy transfer was reported in our previous publications7,37
(see Fig. S5 of ESI for the relevant energy levels indicating theexcitation and de-excitation process, Fig. S6 of ESI for the two-photon absorption process†). The fact that the material showsintense upconversion under low power excitation shows thatthe efficiency of upconversion in this material is very high.Further, under high power excitation the material shows almostlinear or saturation intensity which is probably due to theexcitation population saturation at high excitation power.
To understand the functional dependence of the red andgreen emission intensity on the Yb concentrations, two sets of
This journal is ª The Royal Society of Chemistry 2013
samples were prepared. In the rst set, the Yb:Er concentrationwas kept xed at 10 mol% by proportionally changing the Yband Er concentrations. In the second set, the Yb concentrationwas varied from 0 to 9 mol% by keeping the Er concentrationconstant at 1 mol%. Based on the results of observations(Fig. S7 ESI†), in the case of samples with constant Er concen-tration, both green and red emissions show that the intensitytends to increase up to a concentration of 8 mol% of Yb.However, for varying Er concentration, both red and greenemissions peaked at 5 mol% of Yb and Er. Irrespective of thecompositions, in all samples the green emission is muchstronger than the red emission. The intensity of green emissionis 2.4 times higher than that of the red emission in samples with8 mol% of Yb and 1 mol% Er and this composition was used forfurther imaging experiments.
In order to quantify the green emission in Gd2O2S, wemeasured the quantum efficiency of the green emission in theGd2O2S phosphor following the standard integrating sphere
J. Mater. Chem. B, 2013, 1, 1561–1572 | 1565
Journal of Materials Chemistry B Paper
Dow
nloa
ded
by U
TSA
Lib
rari
es o
n 15
/05/
2013
16:
38:1
4.
Publ
ishe
d on
10
Janu
ary
2013
on
http
://pu
bs.r
sc.o
rg |
doi:1
0.10
39/C
3TB
0055
1HView Article Online
procedure40 [see experimental setup in Fig. S8 and S9 of ESI†] incomparison with the well known green upconversion phosphorNaYF4:Yb(20),Er(2). Fig. S10 of ESI† shows the emission inten-sity comparison under identical measurements conditions.Using the proposed procedure we measured the green upcon-version efficiency to be 0.25% in Gd2O2S:Yb(9),Er(1) and 0.054%in NaYF4:Yb(20),Er(2) which shows that the present phosphor is5 times more efficient than NaYF4:Yb/Er which is considered tobe the brightest upconversion phosphor thus far.41,42
The uorescence decay times of the green and red emissionbands were obtained from the time resolved emission spec-troscopy measurements and the decay curves obtained for the550 and 670 nm emission bands in Gd2O2S:Yb (8) Er (1) areshown in Fig. S12 of ESI.† The decay curve was tted with amultiexponential function:
IðtÞ ¼ A1exp
�� t
s1
�þ A2 exp
�� t
s2
�;
where A1 and A2 are the tting parameters and s1 and s2 are theuorescence decay times. With the tting parameters of A1 ¼0.61, A2 ¼ 0.37 and decay times of s1 ¼ 15.36 ms and s2 ¼ 55.12ms, an average decay time of 42.6 ms was obtained for the greenemission. Similarly the tting parameters for the red band wereA1 ¼ 0.53, A2 ¼ 0.53 and decay times of s1 ¼ 11.8 ms and s2 ¼118.5 ms and an average decay time of108.8 ms. The decay timeof the green and red emission bands depends on the concen-trations of Yb and Er in the phosphor and a more detailedanalysis is under way. In time-gated uorescence based bio-maging,43 longer decay time is a favorable factor to discriminatethe noise arising from scattered light and autouorescence.
3.3 Magnetic properties
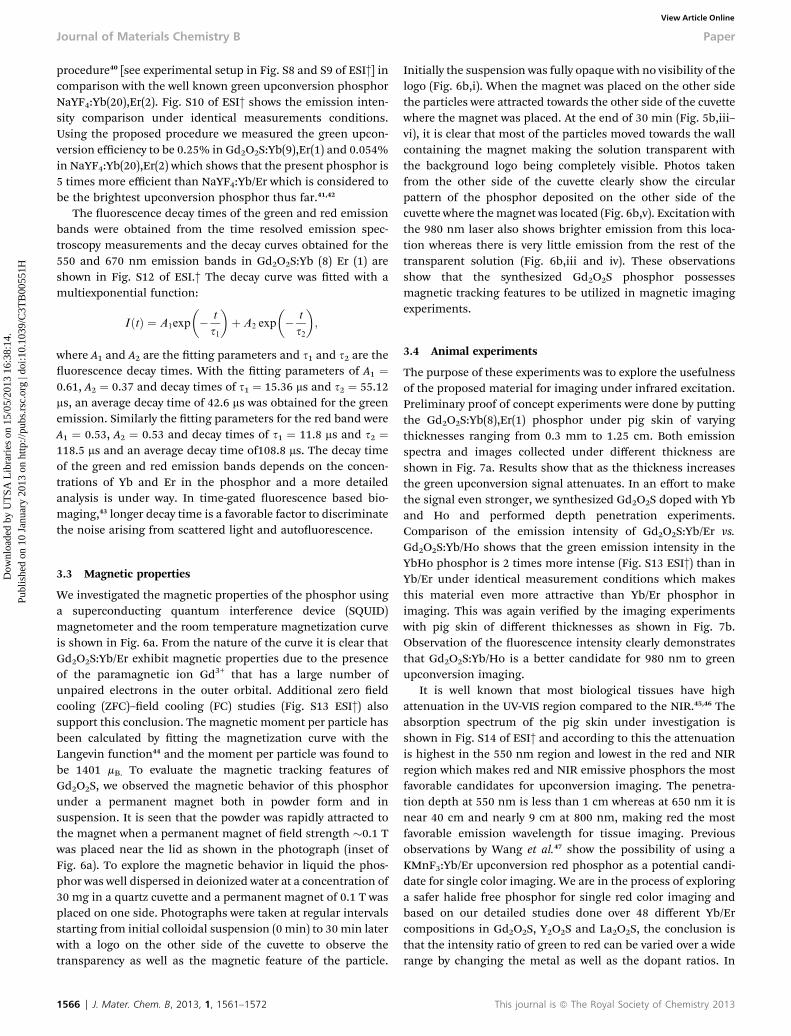
We investigated the magnetic properties of the phosphor usinga superconducting quantum interference device (SQUID)magnetometer and the room temperature magnetization curveis shown in Fig. 6a. From the nature of the curve it is clear thatGd2O2S:Yb/Er exhibit magnetic properties due to the presenceof the paramagnetic ion Gd3+ that has a large number ofunpaired electrons in the outer orbital. Additional zero eldcooling (ZFC)–eld cooling (FC) studies (Fig. S13 ESI†) alsosupport this conclusion. The magnetic moment per particle hasbeen calculated by tting the magnetization curve with theLangevin function44 and the moment per particle was found tobe 1401 mB. To evaluate the magnetic tracking features ofGd2O2S, we observed the magnetic behavior of this phosphorunder a permanent magnet both in powder form and insuspension. It is seen that the powder was rapidly attracted tothe magnet when a permanent magnet of eld strength �0.1 Twas placed near the lid as shown in the photograph (inset ofFig. 6a). To explore the magnetic behavior in liquid the phos-phor was well dispersed in deionized water at a concentration of30 mg in a quartz cuvette and a permanent magnet of 0.1 T wasplaced on one side. Photographs were taken at regular intervalsstarting from initial colloidal suspension (0 min) to 30 min laterwith a logo on the other side of the cuvette to observe thetransparency as well as the magnetic feature of the particle.
1566 | J. Mater. Chem. B, 2013, 1, 1561–1572
Initially the suspension was fully opaque with no visibility of thelogo (Fig. 6b,i). When the magnet was placed on the other sidethe particles were attracted towards the other side of the cuvettewhere the magnet was placed. At the end of 30 min (Fig. 5b,iii–vi), it is clear that most of the particles moved towards the wallcontaining the magnet making the solution transparent withthe background logo being completely visible. Photos takenfrom the other side of the cuvette clearly show the circularpattern of the phosphor deposited on the other side of thecuvette where themagnet was located (Fig. 6b,v). Excitation withthe 980 nm laser also shows brighter emission from this loca-tion whereas there is very little emission from the rest of thetransparent solution (Fig. 6b,iii and iv). These observationsshow that the synthesized Gd2O2S phosphor possessesmagnetic tracking features to be utilized in magnetic imagingexperiments.
3.4 Animal experiments
The purpose of these experiments was to explore the usefulnessof the proposed material for imaging under infrared excitation.Preliminary proof of concept experiments were done by puttingthe Gd2O2S:Yb(8),Er(1) phosphor under pig skin of varyingthicknesses ranging from 0.3 mm to 1.25 cm. Both emissionspectra and images collected under different thickness areshown in Fig. 7a. Results show that as the thickness increasesthe green upconversion signal attenuates. In an effort to makethe signal even stronger, we synthesized Gd2O2S doped with Yband Ho and performed depth penetration experiments.Comparison of the emission intensity of Gd2O2S:Yb/Er vs.Gd2O2S:Yb/Ho shows that the green emission intensity in theYbHo phosphor is 2 times more intense (Fig. S13 ESI†) than inYb/Er under identical measurement conditions which makesthis material even more attractive than Yb/Er phosphor inimaging. This was again veried by the imaging experimentswith pig skin of different thicknesses as shown in Fig. 7b.Observation of the uorescence intensity clearly demonstratesthat Gd2O2S:Yb/Ho is a better candidate for 980 nm to greenupconversion imaging.
It is well known that most biological tissues have highattenuation in the UV-VIS region compared to the NIR.45,46 Theabsorption spectrum of the pig skin under investigation isshown in Fig. S14 of ESI† and according to this the attenuationis highest in the 550 nm region and lowest in the red and NIRregion which makes red and NIR emissive phosphors the mostfavorable candidates for upconversion imaging. The penetra-tion depth at 550 nm is less than 1 cm whereas at 650 nm it isnear 40 cm and nearly 9 cm at 800 nm, making red the mostfavorable emission wavelength for tissue imaging. Previousobservations by Wang et al.47 show the possibility of using aKMnF3:Yb/Er upconversion red phosphor as a potential candi-date for single color imaging. We are in the process of exploringa safer halide free phosphor for single red color imaging andbased on our detailed studies done over 48 different Yb/Ercompositions in Gd2O2S, Y2O2S and La2O2S, the conclusion isthat the intensity ratio of green to red can be varied over a widerange by changing the metal as well as the dopant ratios. In
This journal is ª The Royal Society of Chemistry 2013

Fig. 6 (a) Magnetization curve of Gd2O2S:Yb/Er upconversion phosphor. The straight line shows the Langevin fit. Inset shows the phosphor powder attracted to thetip of the magnet. (b) Magnetic properties of the Gd2O2S:Yb/Er phosphor in deionized water: (i) original colloidal suspension with no transparency, (ii) suspension withmagnet (0.2 T) on one side 10 min later, (iii) suspension after 30 min. The circled part shows very faint green emission under 980 nm excitation indicating very fewparticles at the upper end, (iv) 980 nm laser hitting the phosphor layer near the magnet indicating stronger green emission, (v) front view of the back side of the cuvetteafter all phosphors have been attracted by the magnet, (vi) logo seen through the upper transparent part of the suspension.
Paper Journal of Materials Chemistry B
Dow
nloa
ded
by U
TSA
Lib
rari
es o
n 15
/05/
2013
16:
38:1
4.
Publ
ishe
d on
10
Janu
ary
2013
on
http
://pu
bs.r
sc.o
rg |
doi:1
0.10
39/C
3TB
0055
1HView Article Online
La2O2S:Yb(3),Er(7) (Fig. 7c) the red emission intensity is higherthan green and the resulting emission color is yellow. Imagingdone with a red color lter shows intense red emission withgreatest color contrast and intensity (Fig. 7d). We did somepreliminary observations with Gd2O2S:Yb/Tm, a potentialemitter at the 800 nm region, and the results of penetrationdepth experiments are summarized in Fig. 7c along with aphotograph of the NIR images collected with an NIR CCDcamera. Comparison of these experimental results shows thatthough Gd2O2S:Yb/Ho can be utilized in bimodal imaging thehigh attenuation of the green emission suppress imagecontrast. On the other hand, La2O2S:Yb/Er is a more favorablecandidate for high contrast red imaging. By fractionallyreplacing La with Gd ion it would be possible to enable thisphosphor for magnetic imaging also.
3.5 Cell culture studies
Previous experiments on the cytotoxicity of different phosphorswith similar dopants were performed with maximum concen-trations of 800 mg ml�1,48 while phosphors with differentdopants were tested with maximum concentrations of 6 mgml�1.12 In these studies, to ensure that any adverse reaction tothe UCP would be observed, a maximum concentration of1000 mg ml�1 was used. Even at the very high concentration of
This journal is ª The Royal Society of Chemistry 2013
1000 mg ml�1, no cell death occurred (Fig. 8). Cells interactingwith UCP were grown to conuence with no obvious cell death(Fig. 9). Cell viability results by the MTT assay obtained for48 h (Fig. 10) of exposure to upconversion phosphors onSK-N-SH cells show 94.3% viability with a sample loading of200 mg ml�1.
Future applications of UCPs are widely expected to includethe use of these particles in imaging of stem cells or otherimplanted cells in animal studies.49 As a preliminary investi-gation of the suitability of these UCPs for such applications, thepossibility of imaging the UCPs was examined in aggregates of ahuman breast cancer cell line, MDA-MB-231. Identical concen-trations of Gd2O2S:Yb/Er at 200 mg ml�1, and Gd2O2S:Yb/Ho at200 mg ml�1 were used to interact with cells for 24 hours.Following this, aggregates of cells and UCP were formed andused for imaging. Fig. 11 shows the aggregates of MDA-MB-231with UCP, and uorescence results from 980 nm excitation.Control cells without UCP showed no uorescence. SamplesGd2O2S:Yb/Er and Gd2O2S:Yb/Ho were imaged with an exposuretime of 20 seconds.
3.6 Magnetic resonance imaging
Because of their paramagnetic nature Gd2O2S:Yb/Er upconver-sion phosphors show potential as MRI contrast agents due to
J. Mater. Chem. B, 2013, 1, 1561–1572 | 1567

Fig. 7 Penetration depth experiments done with different upconversion phosphors on pork muscle tissue. (a) Gd2O2S:Yb(8),Er(1), (b) Gd2O2S:Yb(5),Ho(0.5), (c)La2O2S:Yb(3),Er(7) without red filter, (d) La2O2S:Yb(3),Er(7) with red filter, (e) Gd2O2S:Yb(2),Tm(2). The inset of each emission spectrum shows the digital images of theemission for the corresponding thicknesses. In (e) the monochrome digital images were collected with a NIR CCD camera.
1568 | J. Mater. Chem. B, 2013, 1, 1561–1572 This journal is ª The Royal Society of Chemistry 2013
Journal of Materials Chemistry B Paper
Dow
nloa
ded
by U
TSA
Lib
rari
es o
n 15
/05/
2013
16:
38:1
4.
Publ
ishe
d on
10
Janu
ary
2013
on
http
://pu
bs.r
sc.o
rg |
doi:1
0.10
39/C
3TB
0055
1HView Article Online

Fig. 8 (a) Image of NPCs after incubating with 200 mg ml�1 of Gd2O2S:Yb/Er for24 hours. (b) Image of NPCs after incubating with 200 mg ml�1 of Gd2O2S:Yb/Hofor 24 hours.
Fig. 10 In vitro cell viability of SK-N-SH cells incubated with Gd2O2S:Yb/Er atdifferent concentrations for a period of 48 h.
Paper Journal of Materials Chemistry B
Dow
nloa
ded
by U
TSA
Lib
rari
es o
n 15
/05/
2013
16:
38:1
4.
Publ
ishe
d on
10
Janu
ary
2013
on
http
://pu
bs.r
sc.o
rg |
doi:1
0.10
39/C
3TB
0055
1HView Article Online
their positive signal-enhancement ability. Fig. 12(a) demon-strates the gray-scaled and color-mapped T1-weighted images ofGd2O2S:Yb/Er with different concentrations that range from0.01–0.1 mmol in deionized water. The signal intensity
Fig. 9 (a1, a2 and a3) Images of MDA-MB-231 incubated with 200 mg ml�1 of Gincubated with 200 mg ml�1 of Gd2O2S:Yb/Ho for 24, 48, and 72 hours.
This journal is ª The Royal Society of Chemistry 2013
increased as the concentration of Gd2O2S increased, resultingin the brighter images shown in gray scale. These concentra-tion-dependent differences in signal intensity were more pivotalin the color-mapped images.
The relationship between T1�1 relaxation rate (R1) and Gd3+
ion concentration of Gd2O2S phosphor was evaluated as shownin Fig. 12(b). It can be seen that the R1 value of water protonswas enhanced as the Gd-based concentration increased.Relaxivity measurements also showed that the Gd2O2S phos-phors have a concentration-dependent proton longitudinalrelaxivity (r1) of 0.21 mM�1 s�1 on the 7 T scanner, suggestingthe possibility of using the Gd2O2S:Yb/Er phosphor as a T1 MRIcontrast agent.
d2O2S:Yb/Er for 24, 48, and 72 hours. (b1, b2 and b3) Images of MDA-MB-231
J. Mater. Chem. B, 2013, 1, 1561–1572 | 1569

Fig. 11 Imaging of aggregates of cells with an exposure time of 20 seconds. (a1, a2) control with cells only. (b1) with Gd2O2S:Yb/Er, (b2) with Gd2O2S:Yb/Ho.
Journal of Materials Chemistry B Paper
Dow
nloa
ded
by U
TSA
Lib
rari
es o
n 15
/05/
2013
16:
38:1
4.
Publ
ishe
d on
10
Janu
ary
2013
on
http
://pu
bs.r
sc.o
rg |
doi:1
0.10
39/C
3TB
0055
1HView Article Online
4 Conclusions
The preliminary results presented here indicate the usefulnessof Gd2O2S:Yb/Er as a potential candidate to replace the existinghalide based upconverting phosphors for infrared based
Fig. 12 (a) T1-weighted gray-scaled and color-mapped MR images of Gd2O2S:Yb/
1570 | J. Mater. Chem. B, 2013, 1, 1561–1572
biomedical imaging. The proposed phosphor not only enablesnear-IR imaging features but at the same time could be used asa contrast agent in MRI imaging, thus making it an effectivebimodal imaging phosphor. These UCPs showed no toxicity.The phosphor compositions being fully inorganic show very
Er. (b) Relaxation rate R1 (1/T1) as a function of concentration of Gd2O2S:Yb/Er.
This journal is ª The Royal Society of Chemistry 2013
Paper Journal of Materials Chemistry B
Dow
nloa
ded
by U
TSA
Lib
rari
es o
n 15
/05/
2013
16:
38:1
4.
Publ
ishe
d on
10
Janu
ary
2013
on
http
://pu
bs.r
sc.o
rg |
doi:1
0.10
39/C
3TB
0055
1HView Article Online
stable pH independent emission properties as conrmed byspectroscopic and cell culture imaging. Penetration depthstudies indicate that red and NIR emissions preferably 650 nmand 800 nm are the best for deep cell imaging and upconversionphosphors emitting in those emission wavelengths would beideal candidates for cell imaging. Though the preliminarystudies showed the potential of the UCPs for future in vivoimaging, more detailed studies are needed on the physicalproperties of these phosphors in nanoparticle forms withdifferent surface functional groups for targeted imagingapplications.
Acknowledgements
This work was fully supported by the National Science Foun-dation Partnerships for Research and Education in Materials(NSF-PREM) grant no. DMR-0934218. The authors would alsolike to acknowledge the support from NIH-RCMI Grant no.5G12RR013646-12. We are thankful to UTSA graduate studentsMadhab Pokhrel, Chris Mimun, Chris Dennis, Brian Yust andDr Lucas Fernandez for technical help with microscopyimaging, cell experiments and other spectroscopy measure-ments and analysis. Technical help for additional spectroscopymeasurements from Prof. Uwe Hommerich and Dr Ei Brown isgreatly appreciated (through NSF grant HRD 1137747). MsJiaqing, a graduate student from NU, is acknowledged for thehelp with magnetic measurements. Bhushan Thakur and Sid-hesh Nair are acknowledged for technical assistance with themaintenance of neuroblastoma cell lines and the MTT assay.
References
1 F. Auzel, Chem. Rev., 2004, 104, 139–174.2 S. Ammar, A. Helfen, N. Jouini, N. Fievet, I. Rosenman,F. Villain, P. Molinie and M. Danot, J. Mater. Chem., 2001,11, 186–192.
3 M. C. Tan, G. A. Kumar and R. E. Riman, J. Appl. Phys., 2009,106, 063118.
4 G. A. Kumar, C. W. Chen and R. E. Riman, Chem. Mater.,2007, 19, 1523–1528.
5 G. A. Kumar, in Doped nanomaterials and nanodevices, ed. W.Chen, American Scientic Publishers, California, 2010, pp.147–204.
6 S. F. Lim, R. Riehn, W. S. Ryu, N. Khanarian, C. K. Tung,D. Tank and R. H. Austin, Nano Lett., 2006, 6, 169–174.
7 G. A. Kumar, M. Pokhrel and D. K. Sardar, J. Alloys Compd.,2012, 513, 559–565.
8 K. Van de Rijke, H. Zijlmans, S. V. Tli, A. K. Raap,R. S. Niedbala and H. J. Tanke, Nat. Biotechnol., 2001, 19, 273.
9 M. Zuiderwijk, H. J. Tanke, R. S. Niedbala and P. Corstjens,Clin. Biochem., 2003, 36, 401–403.
10 L. Cheng, K. Yang, Y. Li, J. Chen, C. Wang, M. Shao, S. T. Leeand Z. Liu, Angew. Chem., 2011, 123, 7523–7528.
11 E. M. Haacke, R. F. Brown, M. Thompson and R. Venkatesan,in Magnetic resonance imaging: physical principles andsequence design, J. Wiley & Sons, New York, 1999, pp. 1–13.
This journal is ª The Royal Society of Chemistry 2013
12 B. K. Gupta, V. Rathee, T. N. Narayanan, P. Thanikaivelan,A. Saha, Govind, S. P. Singh, V. Shankar, A. A. Matri andP. M. Ajayan, Small, 2011, 7(13), 1767–1773.
13 W. Yin, L. Zhou, Z. Gu, G. Tian, S. Jin, L. Yan, X. Liu, G. Xing,W. Ren, F. Liu, Z. Pane and Y. Zhao, J. Mater. Chem., 2012, 22,6974–6981.
14 M. He, P. Huang, C. Zhang, H. Hu, C. Bao, G. Gao, R. He andD. Cui, Adv. Funct. Mater., 2011, 21, 4470–4477.
15 Y. Park and T. Hyeon, Adv. Mater., 2009, 21, 4467–4471.16 J. Zhou, Y. Sun, X. Du, L. Xiong, H. Hua and F. Li,
Biomaterials, 2010, 31, 3287–3295.17 J. Liu, W. Bu, S. Zhang, F. Chen, H. Xing, L. Pan, L. Zhou,
W. Peng and J. Shi, Chem.–Eur. J., 2012, 18, 2335–2341.18 R. Kumar, M. Nyk, T. Y. Ohulchanskyy, C. A. Flask and
P. N. Prasad, Adv. Funct. Mater., 2009, 19, 853–859.19 H. Xing, W. Bu, S. Zhang, X. Zheng, M. Li, F. Chen, Q. He,
L. Zhou, W. Peng, Y. Hua and J. Shi, Biomaterials, 2012, 33,1079–1089.
20 Z. Li, Y. Zhang, B. Shuter and N. M. Idris, Langmuir, 2009, 25,12015–12018.
21 L. Cheg, K. Yang, Y. Li, J. Chen, C. Wang, M. Shao, S. T. Leeand Z. Liu, Angew. Chem., 2011, 123, 7523–7528.
22 F. Zhang, G. B. Braun, A. Pallaoro, Y. Zhang, Y. Shi, D. Cui,M. Moskovits, D. Zhao and G. D. Stucky, Nano Lett., 2012,12, 61–67.
23 J. M. Worle-Knirsch, K. Kern, C. Schleh, C. Adelhelm,C. Feldmann and H. F. Krug, Environ. Sci. Technol., 2007,41, 331–336.
24 R. Cailleau, R. Young and W. J. Reeves, J. Natl. Cancer Inst.,1974, 61, 661–674.
25 H. Kawasaki, K. Mizuseki, S. Nishikawa, S. Kaneko,Y. Kuwana, S. Nakanishi, S. I. Nishikawa and Y. Sasai,Neuron, 2000, 28, 31–40.
26 P. J. Price and G. J. Brewer, in Protocols for Neural CellCulture, Humana Press Inc., NJ, 3rd edn, 2001, pp. 173–198.
27 M. H. Wu, Surf. Interface Anal., 2009, 41, 11–16.28 H. S. Mader, P. Kele, S. M. Saleh and O. S. Woleis, Curr.
Opin. Chem. Biol., 2010, 14, 582–596.29 Y. Wei, F. Lu, X. Zhang and D. Chen, J. Alloys Compd., 2007,
427, 333–340.30 Z. Q. Li and Y. Zhang, Nanotechnology, 2008, 9, 345606.31 F. Wang and X. G. Liu, J. Am. Chem. Soc., 2008, 130, 5642–
5643.32 L. W. Yang, H. L. Han, Y. Y. Zhang and J. X. Zhong, J. Phys.
Chem. C, 2009, 113, 18995–18999.33 Z. Chao, S. Lingdog, Z. Yawen and Y. Chunhua, J. Rare
Earths, 2010, 28, 807–819.34 X. Ye, J. E. Collins, Y. Kang, J. Chen, D. T. N. Chen, A. G. Yodh
and C. B. Murray, Proc. Natl. Acad. Sci. U. S. A., 2010, 107,22430–22435.
35 A. D. Ostrowski, E. M. Chan, D. J. Gargas, E. M. Katz, G. Han,P. J. Schuck, D. J. Milliron and B. E. Cohen, ACS Nano, 2012,6, 2686–2692.
36 M. Mo, Y. Liwen, R. Guozhong, X. Changfu, L. Jianguo andY. Qibin, J. Lumin., 2011, 131, 1482–1486.
37 G. A. Kumar, M. Pokrel, D. K. Sardar, P. Samuel, K. I. Ueda,T. Yanagitani and H. Yagi, Sci. Adv. Mater., 2012, 4, 617–622.
J. Mater. Chem. B, 2013, 1, 1561–1572 | 1571

Journal of Materials Chemistry B Paper
Dow
nloa
ded
by U
TSA
Lib
rari
es o
n 15
/05/
2013
16:
38:1
4.
Publ
ishe
d on
10
Janu
ary
2013
on
http
://pu
bs.r
sc.o
rg |
doi:1
0.10
39/C
3TB
0055
1HView Article Online
38 P. C. Becker, N. A. Olsson and J. R. Simpson, in Erbium DopedFiber Ampliers – Fundamentals and Technology, AcademicPress, New York, 1999, pp. 1–36.
39 M. J. F. Digonnet, in Rare Earth Doped Fiber Lasers andAmpliers, Marcel Dekker Inc., NY, 1993, pp. 100–150.
40 J. C. De Mello, H. F. Wittmann and R. H. Friend, Adv. Mater.,1997, 9, 230–232.
41 J. C. Boyer and F. C. J. M. van Veggel, Nanoscale, 2010, 2,1417–1419.
42 R. H. Page, K. I. Shaffers, P. A. Waide, J. B. Tassano,S. A. Payne and W. F. Krupke, J. Opt. Soc. Am. B, 1998, 15,996–1008.
1572 | J. Mater. Chem. B, 2013, 1, 1561–1572
43 Q. Ju, Y. Liu, D. Tu, H. Zhu, R. Li and X. Chen, Chem.–Eur. J.,2011, 17, 8549–8554.
44 D. Mendoza, F. Morales and J. Walter, J. Phys.: Condens.Matter, 1999, 11, L317–L322.
45 S. Stolik, J. A. Delgado, A. Perez and L. Anasagasti,J. Photochem. Photobiol., B, 2000, 57, 90–93.
46 J. V. Frangioni, Curr. Opin. Chem. Biol., 2003, 7, 626–634.47 J. Wang, F. Wang, C. Wang, Z. Liu and X. Liu, Angew. Chem.,
Int. Ed., 2011, 50, 10369–10372.48 T. Cao, Y. Yang, Y. Gao, J. Zhou, Z. Li and F. Li, Biomaterials,
2011, 59, 2959–2968.49 L. Cheng, C. Wang, X. Ma, Q. Wang, Y. Cheng, H. Wang, Y. Li
and Z. Liu, Adv. Funct. Mater., 2013, 23, 272.
This journal is ª The Royal Society of Chemistry 2013
Related Documents


![Farley Laserlab Presentation201403 [兼容模式]f02.s.alicdn.com/kf/HLB15EohHFXXXXc3XpXX.PRXFXXXf.pdf · 2019. 7. 30. · FARLEY LASERLAB INTRODUCTION nA member of HGTech (000988),](https://static.cupdf.com/doc/110x72/5fdf1a048f54322e1b02ea9b/farley-laserlab-presentation201403-f02s-2019-7-30-farley-laserlab.jpg)